Woonasquatucket River Fecal Coliform Bacteria and Dissolved Metals Total Maximum Daily Loads _______________________________ Rhode Island Department of Environmental Management Office of Water Resources Providence, Rhode Island 02906 April 2007 Woonasquatucket River at Waterplace Park, Downtown Providence, RI Photo courtesy of Woonasquatucket River Watershed Council 2006 303(d) listings addressed in this study: Woonasquatucket River (RI0002007R-10A): Zinc (Zn) Woonasquatucket River (RI0002007R-10B): Pathogens Woonasquatucket River (RI0002007R-10C): Pathogens, Zinc (Zn) Woonasquatucket River (RI0002007R-10D): Copper (Cu), Lead (Pb), Zinc (Zn) Assapumpsett Brook (RI0002007R-01): Pathogens

Welcome message from author
This document is posted to help you gain knowledge. Please leave a comment to let me know what you think about it! Share it to your friends and learn new things together.
Transcript

Woonasquatucket River Fecal Coliform Bacteria and Dissolved Metals
Total Maximum Daily Loads _______________________________
Rhode Island Department of Environmental Management Office of Water Resources
Providence, Rhode Island 02906
April 2007
Woonasquatucket River at Waterplace Park, Downtown Providence, RI
Photo courtesy of Woonasquatucket River Watershed Council
2006 303(d) listings addressed in this study:
Woonasquatucket River (RI0002007R-10A): Zinc (Zn) Woonasquatucket River (RI0002007R-10B): Pathogens
Woonasquatucket River (RI0002007R-10C): Pathogens, Zinc (Zn) Woonasquatucket River (RI0002007R-10D): Copper (Cu), Lead (Pb), Zinc (Zn)
Assapumpsett Brook (RI0002007R-01): Pathogens

2
Table of Contents
Table of Contents .......................................................................................................................................................2 List of Tables..............................................................................................................................................................4 List of Figures ............................................................................................................................................................5 List of Acronyms and Terms......................................................................................................................................6 Executive Summary....................................................................................................................................................9 1.0 Introduction .................................................................................................................................................11
1.1 Study Area .....................................................................................................................................................11 1.2 Pollutants of Concern.....................................................................................................................................11 1.3 Priority Ranking.............................................................................................................................................13 1.4 Applicable Water Quality Standards..............................................................................................................13
2.0 Background .................................................................................................................................................16 2.1 Geographic Setting.........................................................................................................................................16 2.2 Basin Characteristics......................................................................................................................................16 2.3 Historic Water Quality ...................................................................................................................................20
3.0 Present Condition of the Waterbody ...........................................................................................................23 3.1 Applicable Studies .........................................................................................................................................23 3.2 Water Quality Summary and Resource Impairments.....................................................................................27
4.0 Pollution Sources.........................................................................................................................................39 4.1 Stormwater Runoff.........................................................................................................................................40 4.2 Combined Sewer Overflows (CSOs) .............................................................................................................42 4.3 Miscellaneous Outfalls...................................................................................................................................44 4.4 Smithfield Wastewater Treatment Facility ....................................................................................................45 4.5 Metals Recycling LLC. ..................................................................................................................................45 4.6 Minor Permitted Discharges ..........................................................................................................................46 4.7 Groundwater and Sediment Contamination ...................................................................................................47 4.8 Failing septic systems ....................................................................................................................................47 4.9 Domestic animal and vermin waste ...............................................................................................................48 4.10 Wildlife and Waterfowl ...............................................................................................................................49 4.11 Urban litter ...................................................................................................................................................49 4.12 Background Levels of Pollutants .................................................................................................................50 4.13 Illegal Sources..............................................................................................................................................50
5.0 Pathogen TMDL Development ...................................................................................................................51 5.1 Applicable Water Quality Criteria .................................................................................................................51 5.2 Water Quality and Resource Impairments .....................................................................................................51 5.3 Critical Conditions and Seasonal Variation ...................................................................................................51 5.4 Margin of Safety ............................................................................................................................................51 5.5 Technical Analysis.........................................................................................................................................52 5.6 Loading Capacity ...........................................................................................................................................52 5.7 Average Daily TMDL Reductions .................................................................................................................53 5.8 Load and Wasteload Allocations ...................................................................................................................53 5.9 Strengths and Weaknesses in the Technical Approach..................................................................................55
6.0 Dissolved Metals TMDL Development ......................................................................................................56 6.1 Applicable Water Quality Criteria .................................................................................................................56 6.2 Water Quality and Resource Impairments .....................................................................................................57 6.3 Critical Conditions and Seasonal Variation ...................................................................................................57

3
6.4 Margin of Safety ............................................................................................................................................57 6.5 Technical Analysis.........................................................................................................................................58 6.6 Final Reductions ............................................................................................................................................63 6.7 TMDLs, Wasteload and Load Allocations.....................................................................................................63 6.8 Wasteload Allocations by Segment ...............................................................................................................63 6.9 Strengths and Weaknesses in the Technical Approach..................................................................................65
7.0 Implementation............................................................................................................................................66 7.1 NBC’s CSO Abatement Program ..................................................................................................................67 7.2 Smithfield WWTF..........................................................................................................................................69 7.3 Stormwater Management ...............................................................................................................................70 7.4 MS4-Specific Requirements ..........................................................................................................................74 7.5 Other Implementation Measures ....................................................................................................................83 7.6 Implementation Measures Summary..............................................................................................................84
8.0 Public Participation .....................................................................................................................................85 9.0 Future Monitoring .......................................................................................................................................87 10.0 References ...................................................................................................................................................88 Appendix A. .............................................................................................................................................................90 Appendix B.............................................................................................................................................................105 Appendix C. Final Public Meeting Summary ........................................................................................................119 Woonasquatucket River TMDL public meeting notes ...........................................................................................120

4
List of Tables Table 1.1 Waterbody Segments in the Woonasquatucket River and Assapumpsett Brook. ....................................11 Table 1.2 Applicable Freshwater Criteria Equations and Base e Exponential Values. ............................................14 Table 1.3 Water Quality Criteria for Dissolved Metals1. .........................................................................................15 Table 2.1 Pollutant Summary for W6 and W23 outfalls. .........................................................................................21 Table 3.1 Summary of routine pathogen data collected by NBC from 1998 to 2004. .............................................26 Table 3.2 Fecal coliform statistics for the Woonasquatucket River1,2......................................................................29 Table 3.3 Dry weather dissolved metals summary within and outside of the CSO reach........................................30 Table 3.4 Fecal coliform bacteria summary in selected reaches of the Woonasquatucket River.............................38 Table 3.5 Wet weather dissolved metals summary within and outside of the CSO reach. ......................................38 Table 4.1 Actual and potential sources of pollution to the Woonasquatucket River................................................40 Table 4.2 Wet weather stormwater outfall sampling locations and data summary. .................................................41 Table 4.3 Anthropogenic constituents in urban runoff (from USEPA 1993)...........................................................42 Table 4.4 Typical pollutant concentrations from CSOs and urban stormwater........................................................43 Table 4.5 Reported dry weather combined sewer overflow events in the Woonasquatucket River. .......................44 Table 4.6 Current1 Permit Limitations for the Smithfield Wastewater Treatment Facility......................................45 Table 4.7 Effluent Summary for Smithfield Wastewater Treatment Facility (1999-2005)......................................45 Table 4.8 Pollutant Summary for the S4 outfall, located off Mancini Drive in Providence. ...................................46 Table 4.9 Minor Permitted Discharges to the Woonasquatucket River. ..................................................................46 Table 5.1 Fecal coliform TMDL expressed as percent reductions to meet concentration targets............................53 Table 5.2. RIPDES Permit Limits for fecal coliform at the Smithfield WWTF. .....................................................54 Table 6.1 Summary of mean hardness values in the Woonasquatucket River. ........................................................56 Table 6.2 Dissolved metals numeric concentration targets for acute and chronic conditions..................................56 Table 6.3 Daily mean flow and precipitation during dry weather and pre-storm surveys........................................59 Table 6.4 Low Flow Allowable and Existing Concentrations in the Woonasquatucket River. ...............................60 Table 6.5 Low Flow Condition Percent Zinc Reductions in the Woonasquatucket.................................................60 Table 6.6 Wet weather allowable concentrations in the Woonasquatucket River....................................................62 Table 6.7 Existing Wet Weather Conditions in the Woonasquatucket River...........................................................62 Table 6.8 High Flow/ Wet Weather Percent Reductions in the Woonasquatucket. .................................................63 Table 6.9 Metals TMDLs expressed as percent reductions to meet concentration targets.......................................63 Table 6.10 Proposed Limits for dissolved Cd, Cu, Pb, and Zn- Smithfield WWTF. ...............................................64 Table 7.1 TMDL Implementation Actions Summary...............................................................................................84

5
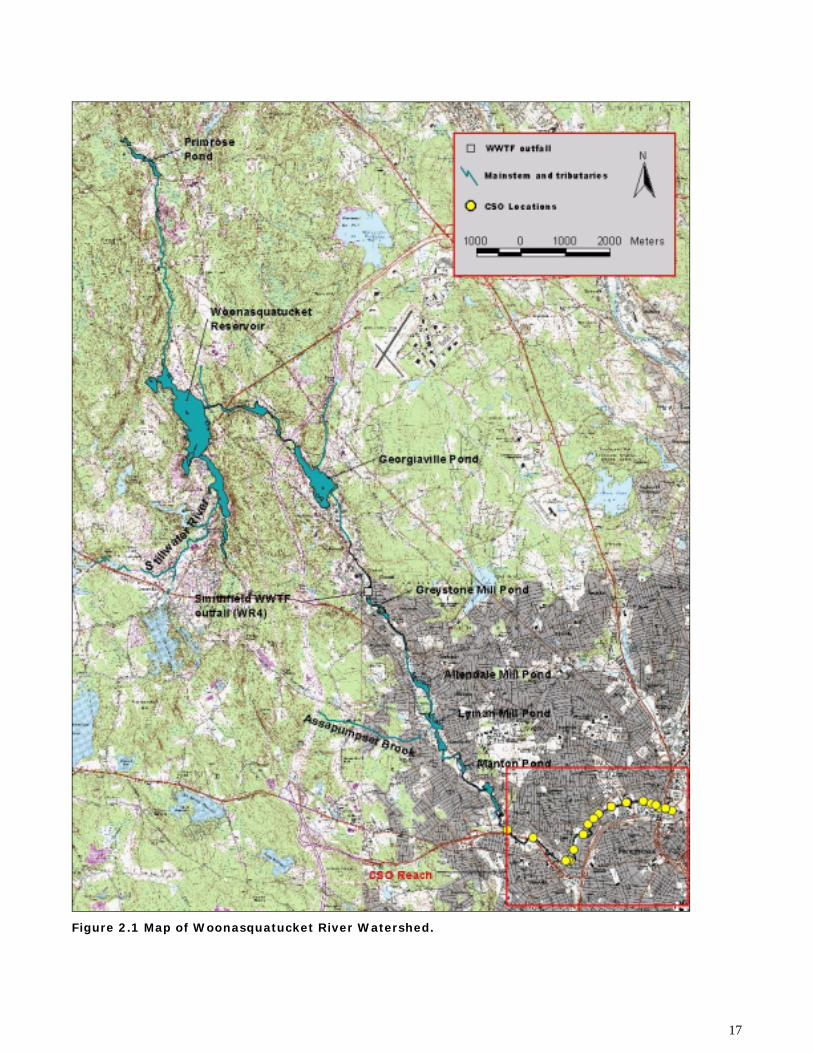
List of Figures Figure 1.1. Applicable waterbody segments in the Woonasquatucket River. .........................................................12 Figure 2.1 Map of Woonasquatucket River Watershed............................................................................................17 Figure 2.2 Historical discharge at USGS gage 01114500 on the Woonasquatucket River......................................18 Figure 2.3. Land Use within the Woonasquatucket River watershed......................................................................19 Figure 3.1 Schematic of the Woonasquatucket River showing water quality station locations, stormwater sampling
sites, WWTF outfall site, and CSO reach. ........................................................................................................24 Figure 3.2 Dry weather fecal coliform summary in mainstem Woonasquatucket River..........................................27 Figure 3.3 Wet weather fecal coliform summary in mainstem Woonasquatucket River. ........................................28 Figure 3.4 Dry weather dissolved Cd concentrations in the Woonasquatucket River. ............................................30 Figure 3.5 Average dry weather dissolved Cu concentrations in the Woonasquatucket River................................31 Figure 3.6. Average dry weather dissolved Pb concentrations in the Woonasquatucket River. ..............................32 Figure 3.7 Average dry weather dissolved Zn concentrations in the Woonasquatucket River. ...............................33 Figure 3.8 Wet weather dissolved Cd concentrations in the Woonasquatucket River. ............................................34 Figure 3.9 Wet weather dissolved Cu concentrations in the Woonasquatucket River. ............................................35 Figure 3.10 Wet weather dissolved Pb concentrations in the Woonasquatucket River. ..........................................36 Figure 3.11 Wet weather dissolved Zn concentrations in the Woonasquatucket River. ..........................................37 Figure 4.1 Documented ISDS Failures in the Woonasquatucket River Watershed (2000)......................................48

6
List of Acronyms and Terms
Best Management Practices (BMP) means schedules of activities, prohibitions of practices, maintenance procedures, and other management practices to prevent or reduce the pollution of and impacts upon waters of the State. BMPs also include treatment requirements, operating procedures, and practices to control site runoff, spillage or leaks, sludge or waste disposal, or drainage from raw material storage. Cadmium (Cd) is a natural, usually minor constituent of surface and groundwater. Cd may enter aquatic systems through weathering and erosion of soils and bedrock, atmospheric deposition direct discharge from industrial operations, leakage from landfalls and contaminated sites, and the dispersive use of sludge and fertilizers in agriculture. Much of the Cd entering fresh waters from industrial sources may be rapidly adsorbed by particulate matter, and thus sediment may be a significant sink for Cd emitted to the aquatic environment (WHO 1992). Cd reaches water bodies either through urban runoff or discharges such as sewage treatment plants and industrial plants. In polluted waters complexing with organic materials is the most important factor in determining the aquatic fate and transport of Cd. Sorption processes account for removal of dissolved Cd to bed sediments and are increasingly effective as pH increases. In natural freshwaters, Cd often occurs at extremely low concentrations (less than 0.01 ug/l) (USEPA 1980), however in environments impacted by man, Cd concentrations can be several micrograms per liter or greater. CFR is the Code of Federal Regulations. CMS is a measure of flow in cubic meters per second. One cms equals 35.3 cubic feet per second. Clean Water Act (CWA) refers to the Federal Water Pollution Control Act (33 U.S.C. § 1251) et seq. and all amendments thereto. Combined Sewer Overflow (CSO) means flow from a combined sewer that is discharged into receiving waters without going to a treatment works. A CSO is distinguished from bypasses, which are diversions of waste streams from any portion of a treatment works. Copper (Cu) is ubiquitous in the rocks and minerals of the earths crust. In nature, Cu occurs usually as sulfides and oxides and occasionally as metallic Cu. Weathering and solution of these natural Cu minerals results in background levels of Cu in natural surface waters at concentrations generally well below 20 ug/l (USEPA 1980). Higher concentrations of Cu are usually from anthropogenic sources such as WWTF, industrial facilities, and urban runoff. These sources include corrosion of brass and Cu pipes by acidic waters, industrial effluents and fallout, sewage treatment plant effluents, and the use of Cu compounds as aquatic plant controls. The levels of Cu able to remain in solution are directly dependant on water chemistry. Generally, Cu is more soluble in low pH, acidic waters and less soluble in high pH, alkaline waters. Concentrations of 1 to 10 ug/l are usually reported for unpolluted surface waters however concentrations in the vicinity of municipal and industrial outfalls, particularly from refining, smelting, or metal plating industries may be much higher (USEPA 1980). DEM or RIDEM refers to the Rhode Island Department of Environmental Management. Designated uses are those uses specified in water quality standards for each waterbody or segment whether or not they are being attained. In no case shall assimilation or transport of pollutants be considered a designated use. DOT or RIDOT refers to the Rhode Island Department of Transportation. EPA refers to the United States Environmental Protection Agency.

7
Fecal coliform are a specific subgroup of the total coliform bacteria. These organisms may be separated from the total coliform group by their ability to grow at elevated temperatures and are associated only with the fecal material of warm-blooded animals. The presence of fecal coliform bacteria in aquatic environments indicates that the water has been contaminated with the fecal material of man or other animals. At the time this occurred, the source water may have been contaminated by pathogens or disease producing bacteria or viruses, which can also exist in fecal material. The presence of fecal contamination is an indicator that a potential health risk exists for individuals exposed to this water. Fecal coliform bacteria may occur in ambient water as a result of the overflow of domestic sewage or nonpoint sources of human and animal waste. Lead (Pb) reaches the aquatic environment through precipitation, fallout of Pb dust, street runoff, and both industrial and municipal wastewater discharges (USEPA 1980). Pb is used in electroplating, metallurgy, and the manufacture of construction material, plastics, and electronics equipment. Pb compounds have very low solubility and are not commonly found in natural, unimpacted waters. Where present, Pb compounds are often adsorbed to suspended solids and are transported through aquatic systems this way. Pb compounds have been used for batteries, additives in gasoline, pigments and paint, and other metal products. Mining, smelting and other industrial emissions and combustion sources and solid waste incinerators are now the primary sources of Pb in the environment. Pb reaches water bodies either through urban runoff or discharges such as sewage treatment plants and industrial plants. It also may be transferred from the air to surface water through precipitation (rain or snow). Pb's toxicity depends on its solubility, which is dependent on pH and other available ions. Load allocation is the portion of a receiving water's loading capacity that is attributed either to one of its nonpoint sources of pollution or to natural background sources. Loading Capacity means the maximum amount of loading that a surface water can receive without violating water quality standards. MS4 is a municipal separate storm sewer system. Cities of Providence and North Providence, and the Towns of Smithfield and Johnston, and RIDOT are operators of MS4s. MOS refers to the Margin of safety. Most Probable Number (MPN) is an estimate of microbial abundance per unit volume of water sample, based on probability theory. NBC is the Narragansett Bay Commission. Natural background conditions are all prevailing dynamic environmental conditions in a waterbody or segment thereof, other than those human-made or human-induced. Nonpoint Source (NPS) means any discharge of pollutants that does not meet the definition of Point Source in section 502.(14). of the Clean Water Act and these regulations. Such sources are diffuse, and often associated with land-use practices, and carry pollutants to the waters of the State, including but not limited to, non-channelized land runoff, drainage, or snowmelt; atmospheric deposition; precipitation; and seepage. Point source means any discernible, confined, and discrete conveyance, including but not limited to any pipe, ditch, channel, tunnel, conduit, well, discrete fissure, container, rolling stock, concentrated animal feeding operation or vessel, or other floating craft, from which pollutants are or may be discharged. This term does not include return flows from irrigated agriculture. Primary Contact Recreational Activities means any recreational activities in which there is prolonged and intimate contact by the human body with the water, involving considerable risk of ingesting water, such as swimming, diving, water skiing, and surfing.

8
Rhode Island Pollutant Discharge Elimination System (RIPDES) is the Rhode Island system for issuing, modifying, revoking and reissuing, terminating, monitoring and enforcing point source discharge permits and imposing and enforcing pretreatment requirements pursuant to Title 46, Chapter 12 of the General Laws of Rhode and the Clean Water Act. Runoff means water that drains from an area as surface flow. SWMPP is a storm water management project plan. Secondary Contact Recreational Activities are those activities in which there is minimal contact by the human body with the water, and the probability of ingestion of the water is minimal, such as boating and fishing. Storm water is that portion of precipitation that does not naturally percolate into the ground or evaporate, but flows via overland flow, interflow, pipes and other features of a stormwater drainage system into a defined surface waterbody, or a constructed infiltration facility. Stormwater can also refer to rainwater that hits the ground, does not infiltrate at that location and travels to local surface waters without entering a stormwater conveyance system, and 2) rainwater that is collected in stormwater collection systems (pipes or ditches) and is then conveyed to local surface waters. Total Maximum Daily Load (TMDL) means the amount of a pollutant that may be discharged into a waterbody and still maintain water quality standards. The TMDL is the sum of the individual wasteload allocations for point sources and the load allocations for nonpoint sources and natural background taking into account a margin of safety. Wasteload allocation is the portion of a receiving water's loading capacity that is allocated to point sources of pollution, including stormwater discharges regulated under the NPDES. Water quality criteria means elements of the State water quality standards, expressed as constituent concentrations, levels, or narrative statements, representing a quality of water that supports a particular use. Water quality standard means provisions of State or Federal law, which consist of designated use(s) and water quality criteria for the waters of the State. Water Quality Standards also consist of an antidegradation policy. WRWC The Woonasquatucket River Watershed Council. Zinc (Zn) is found naturally in many rock-forming minerals. Because of its use in the vulcanization of rubber, it is generally found at higher levels near highways. It also may be present in industrial discharges. It is used to galvanize steel, and is found in batteries, plastics, wood preservatives, antiseptics and in rat and mouse poison (Zn phosphide). Zn reaches water bodies either through urban runoff or discharges such as sewage treatment plants and industrial plants. Most of the Zn introduced into the aquatic environment is partitioned into the sediments by sorption onto hydrous iron and manganese oxides, clay minerals, and organic minerals. Variables affecting the mobility of Zn include the concentration and composition of suspended and bed sediments, dissolved and particulate iron and manganese concentrations, pH, salinity, concentration of complexing ligands, and the concentration of Zn.

9
Executive Summary The Woonasquatucket River watershed, located entirely within the state of Rhode Island, covers nearly 52 mi2 (135 km2) and includes all or portions of the towns of Smithfield, North Smithfield, Glocester, Johnston, North Providence, and Providence. The river, classified as B, B1, and B1a, is a tributary to the Providence River, located in the Narragansett Bay watershed. In total, three segments of the Woonasquatucket River are currently on Group 1 of the state’s 2006 303(d) list of impaired waters for fecal coliform bacteria and dissolved Copper (Cu), Lead (Pb), and Zinc (Zn). Cadmium (Cd) was placed on the 2002 and 2004 303(d) Lists and was analyzed during TMDL development, however it was removed from the 2006 303(d) List. All combined sewer overflows (CSOs) in the Woonasquatucket River are sited within the lower portion of the mainstem between Glenbridge Avenue and Pleasant Valley Parkway, and are identified by a waterbody ID number of RI0002007R-10D. This segment of the river is listed for pathogens on Group 5 of the 2004 303(d) List. Group 5 listings include those impairments where “A TMDL or a control action functionally equivalent to a TMDL has been developed for these waters. Implementation is underway which will result in attainment of the standards. However, the standards will not be met within the next two years”. The control action that is functionally equivalent to a TMDL for this segment refers to the NBC CSO Facilities Control Plan. TMDL targets for dissolved metals are assigned to this reach since CSO discharges are only one of the several significant pollution sources to this segment identified by this TMDL study. The largest and most persistent wet weather pollution sources include stormwater runoff and CSO discharges. Fecal coliform bacteria concentrations in the mainstem increase markedly during rainfall events, particularly in the lower portion of the river within the CSO reach. Both fecal coliform and dissolved metals impairments occur during dry weather conditions and are likely the result of dry weather CSO discharges, other miscellaneous discharges, and contributions from waterfowl and wildlife. The Smithfield WWTF is a source of dissolved Cu and Zn. Additional sources of metals may include groundwater and sediments. EPA guidance requires that load allocations be assigned to either point (wasteload) or nonpoint (load) sources. As is the case for most bacteria impairments, insufficient data exist to accurately differentiate between point and nonpoint sources of bacteria. Therefore, as recommended by EPA Region 1, all bacteria source reductions for this TMDL are combined into the wasteload allocation. A Wasteload Allocation (WLA) of zero is set for failing septic systems that flow (via groundwater seeps and/or overland flow) into storm drains, illegal connections to storm drains, and dry weather CSO discharges. The WLA for the Smithfield WWTF is set at the water quality standards (WQS) as described in RIPDES permit number RI0100251. All MS4 and other NPDES-regulated stormwater discharges are addressed by the WLA portion of the TMDL. However, in implementing this TMDL, both point and nonpoint controls will be necessary to meet the TMDL plan’s water quality targets. Wet weather CSO discharges will receive a WLA which is addressed through the NBC CSO Facilities Control Plan and described further in the Implementation section of this report. Recommended implementation activities focus on stormwater and CSO management. Achieving water quality standards will require that both the volume of storm water and the bacteria and dissolved metals concentrations in the stormwater reaching the Woonasquatucket are reduced. The City of Providence, the Towns of North Providence, Johnston and Smithfield, and the RIDOT operate Municipal Separate Storm Sewer Systems (MS4s) that discharge to the Woonasquatucket River and its tributaries. Stormwater runoff from pervious and impervious surfaces in these areas contributes to the violation of water

10
quality standards for fecal coliform and dissolved metals in the river and its tributaries. These entities have applied for and received coverage under the RIPDES Phase II general permit and have developed Stormwater Management Project Plans (SWMPP). The SWMPP’s describe BMPs for the six minimum measures and include measurable goals and schedules for each measure. Part IV.D of the General Permit states that the operator must address the TMDL provisions in the SWMPP if a TMDL has been approved for any waterbody into which storm water discharges from the MS4 contribute directly or indirectly the pollutant(s) of concern (Part II.C.3). Accordingly, upon approval of this TMDL, The RIPDES Regulations will require that the City of Providence and the Towns of North Providence, Johnston, and Smithfield submit SWMPP amendments addressing the TMDL provisions within one hundred and eighty (180) days of the date of written notice from the RIPDES Program (Rule 31 (f)(8)(iii). Entities should refer to Part IV.D. of the General Permit, as well as Section 7.3 of this TMDL for requirements for the SWMPP amendments. More specifically, the RIPDES General Permit requires that the town submit a scope of work, which should include a schedule for activities within the entire watershed, including the high priority areas. Stormwater discharges from facilities that discharge “stormwater associated with industrial activity” are regulated under the statewide general RIPDES permit prescribed in Chapter 46-12, 42-17.1 and 42-35 of the General Laws of the State of Rhode Island.In accordance with Part I.B.3.j of the RIPDES Multi-Sector General Permit, prior to authorization to discharge stormwater associated with industrial activity, the applicant is required to demonstrate that the stormwater discharge is consistent with the requirements of the TMDL. With completion of this TMDL, consistent with Part I.C. of the general permit, facilities currently authorized to discharge under the permit must either demonstrate that the existing Storm Water Pollution Prevention Plan (SWPPP) is consistent with the TMDL or amend their plan demonstrating consistency with the TMDL. In addition to SWMPP amendments, a targeted approach to construction of stormwater retrofit best management practices (BMPs) at state and locally owned stormwater outfalls is recommended. Priority areas for BMP construction are the stormwater outfalls located at Mancini Drive in Providence, outfalls located at the Route 44 bridge and Riverside Drive, both located in Johnston, the Woonasquatucket Avenue outfalls located in North Providence, and all Rhode Island Department of Transportation (RIDOT) outfalls draining to the Woonasquatucket. This TMDL also recommends pollution prevention efforts aimed at discouraging residents from feeding waterfowl, encouraging residents to pick up after pets and deposit litter in proper receptacles. This is a phased TMDL and, as such, additional monitoring is required to ensure that water quality objectives are met as remedial actions are accomplished. Monitoring by two organizations, the Woonasquatucket River Watershed Council (WRWC) and the Narragansett Bay Commission will be the principle method of obtaining the data necessary to track bacteriological water quality conditions in the watershed. Periodic dissolved metals sampling will be carried out at specific locations jointly by the Town of Smithfield and RIDEM, as specified in the permit.

11
1.0 Introduction Under the Clean Water Act, each state establishes water quality standards designed to protect, restore, and preserve water quality. Water quality standards consist of designated uses, such as swimming and aquatic life support, and class specific criteria, usually numeric values, to achieve those uses. When a waterbody fails to meet water quality standards after application of required technology-based controls, the Clean Water Act requires the state to place the waterbody on a list of “impaired” waterbodies, referred to as the 303(d) list, and to develop an analysis called a Total Maximum Daily Load (TMDL). A TMDL includes a written, quantitative assessment of both water quality impairments and sources of the impairments. The TMDL determines the loading capacity, which is the amount of a given pollutant that can be discharged to the waterbody and still meet standards, and the load and wasteload allocated among various sources. If the pollutant comes from a discrete source (referred to as a point source) such as a wastewater treatment plant discharge or stormwater outfall, that share of the loading capacity is called a wasteload allocation. If it comes from a diffuse source (referred to as a nonpoint source) such as agricultural activities, that share is called a load allocation. The TMDL must also consider seasonal variations and include a margin of safety that takes into account any lack of knowledge regarding the causes of the water quality impairment or a waterbodies loading capacity. The sum of the load and wasteload allocations and the margin of safety must be equal to or less than the loading capacity of the system.
1.1 Study Area The Woonasquatucket River is an urban river in northern Rhode Island, most notably known for its famed “Waterplace Park” located in downtown Providence. The study area consists of the Woonasquatucket River mainstem from the headwaters at the outlet of Primrose Pond in North Smithfield to the confluence with the Moshassuck River in Providence, and including Assapumpsett Brook. Table 1.1 presents the applicable waterbody segments, as described in Appendix A of the Water Quality Regulations, in the Woonasquatucket River. These segments are also shown in Figure 1.1. Table 1.1 Waterbody Segments in the Woonasquatucket River and Assapumpsett Brook.
Waterbody ID Waterbody Name/ Description Waterbody Size
RI0002007R-10A Woonasquatucket River headwaters to Georgiaville Pond, excluding reservoirs and ponds and including tributaries.
6.53 miles (10.5 km)
RI0002007R-10B Woonasquatucket River from the Georgiaville Pond outlet to the Smithfield WWTF discharge point at Esmond Mill Drive.
1.73 miles (2.78 km)
RI0002007R-10C Woonasquatucket River from the Smithfield WWTF discharge point at Esmond Mill Drive to the CSO outfall at Glenbridge Avenue in Providence.
4.20 miles (6.76 km)
RI0002007R-10D Woonasquatucket River from the CSO outfall at Glenbridge Avenue to the confluence with the Moshassuck River.
3.48 miles (5.60 km)
RI0002007R-01 Assapumpsett Brook and tributaries 5.90 miles (9.50 km)
1.2 Pollutants of Concern Recent water quality monitoring conducted by DEM, the Narragansett Bay Commission (NBC), and the Louis Berger Group (LBG, Inc) indicates that the Woonasquatucket River is impaired for fecal coliform bacteria, and dissolved Cu, Pb, and Zn.

12
Figure 1.1. Applicable waterbody segments in the Woonasquatucket River.

13
Fecal coliform bacteria are used by the State of Rhode Island as indicators of pathogens associated with fecal contamination. Other indicators, such as E. coli and enterococci, have been evaluated as alternative or additional surrogates for pathogens however, at the time of this study, fecal coliform bacteria remain the designated indicator and pollutant of concern. Metals occur as particulate-bound or dissolved; total metals concentration represents a sum of both the dissolved and particulate phases. The dissolved phase of a metal is biologically available and thus more detrimental to ecosystem health than the particulate-bound fraction which is stable and therefore less toxic (Engstrom 2004). Consistent with this finding, state water quality regulations were revised in 1997 changing the ambient water quality and aquatic life criteria for metals from the total to the dissolved fraction1. The available data, including results from this TMDL study, indicate that concentrations of dissolved Cd in the Woonasquatucket River do not exceed acute or chronic water quality criteria and in fact, are well below the applicable standards for Cd in the mainstem of the Woonasquatucket River. Based on this evidence, removal of the impairment for all segments of the Woonasquatucket River from the 303(d) List of Impaired Waters is recommended by RIDEM. In addition, concentrations of dissolved Copper and Lead in segments 10B and 10C do not exceed acute or chronic water quality criteria. Based on this evidence, removal of these impairments for segments 10B and 10C of the Woonasquatucket River from the 303(d) List of Impaired Waters is recommended by RIDEM. Several stations in the mainstem Woonasquatucket exhibited levels of dissolved Zinc (Zn) that exceeded water quality standards. Accordingly, the TMDL recommends adding four (4) segments of the Woonasquatucket River to the 2006 303(d) List of Impaired Waters for dissolved zinc.
1.3 Priority Ranking With the exception of pathogen impairment in the most downstream segment of the Woonasquatucket River affected by CSO discharges, the three segments listed for pathogens, Cd, Cu, and Pb impairments are in Group 1 of the state’s 2004 303(d) List of Impaired Waters.
1.4 Applicable Water Quality Standards
Water Quality Classifications and Designated Uses
Designated uses and water quality standards vary depending on the water quality classification of a waterbody. The Woonasquatucket River is composed of three different water quality classifications, listed below. Assapumpsett Brook is a Class B waterbody. Class B from the headwaters (including Stillwater River, Stillwater Reservoir, Waterman Reservoir, Sprague and Lower Sprague, Slack Reservoir, Mountaindale Reservoir, and Georgiaville Pond to Esmond Hill Drive. Class B waters are suitable for fish and wildlife habitat; primary and secondary contact recreation; and are compatible for industrial processes, cooling, hydropower, aquaculture, agriculture, irrigation and navigation. In addition, Class B waters have good aesthetic value. Class B1 from Esmond Hill Drive in Smithfield to CSO 055 located at the Glenbridge Avenue bridge in Providence. Class B1 waters have the same designated uses as Class B waters. However, the primary contact recreation may be impacted by pathogens from approved wastewater facilities (i.e., Smithfield WWTF).
1 Because of the potential for the particulate fraction of the metals to become dissolved, RIPDES discharge permit limits continue to be expressed as total metals.

14
Class B1{a} from the Glenbridge Avenue bridge, and downstream of CSO 055, to its confluence with the Moshassuck River. Class B1{a} waters have the same designated uses as Class B1 waters. However, these waters have a partial use designation due to impacts from combined sewer overflows (CSOs). The partial use designation for CSOs (rule 19.E.1 of RIDEM Water Quality Regulations -2006) states: "These waters will likely be impacted by combined sewer overflows in accordance with approved CSO Facilities Plans and in compliance with rule 19.E.1 of these regulations and the Rhode Island CSO Policy. Therefore, primary contact recreational activities, shellfishing uses and wildlife habitat will likely be restricted." Water Quality Criteria Criteria for fecal coliform bacteria are taken from Table 1 of DEM’s Water Quality Regulations (DEM 2006). These criteria apply to all four segments in the Woonasquatucket River as well as Assapumpsett Brook. For class B, B1, and B1a waters fecal coliform bacteria concentrations are not to exceed a geometric mean value of 200 and not more than 10% of the samples shall exceed a value of 400. This is the primary contact recreational/swimming criteria for freshwater. The water quality standards for toxics, including dissolved metals, set forth in Appendix B of the state of Rhode Island Department of Environmental Management Water Quality Regulations (DEM 2006) state that “to protect aquatic life, the one-hour average concentration of a pollutant should not exceed the acute criteria more than once every three years on the average. The four-day average concentration of a pollutant should not exceed the chronic criteria more than once every three years on the average. These aquatic life criteria shall be achieved in all waters, except mixing zones, regardless of the waters’ classification. In addition, the acute and chronic aquatic life criteria for freshwaters shall not be exceeded at or above the lowest average 7 consecutive day low flow with an average recurrence frequency of once in 10 years (7Q10)”. The chronic and acute criteria of these metals apply to the dissolved form and are calculated using water hardness (in mg/l as CaCO3) based on equations in Table 2-Appendix B of Rhode Island’s Water Quality Regulations and shown below in Table 1.2. Table 1.2 Applicable Freshwater Criteria Equations and Base e Exponential Values.
Parameter ACUTE (ug/l) CF x e (ma [ln Hardness] + b
a)
CHRONIC (ug/l) CF x e (mc [ln Hardness] + b
c)
CF = ma = ba = CF = mc = bc = Cadmium @ 1.0166 -3.924 @ 0.7409 -4.719 Copper 0.96 0.9422 -1.700 0.96 0.8545 -1.702 Lead # 1.273 -1.46 # 1.273 -4.705 Zinc 0.978 0.8473 0.884 0.986 0.8473 0.884
@ = Cadmium Conversion Factors: acute CF= 1.136672 – [(ln H) x 0.041838] chronic CF= 1.101672 – [(ln H) x 0.041838]
# = Lead Conversion Factors: acute and chronic CF= 1.46203 – [(ln H) x 0.145712]
Both chronic and acute aquatic life criteria are a function of hardness. Hardness is a measure of the concentration of cations in solution (Minton 2002), with hardness usually measured as calcium carbonate (CaCO3) equivalents in mg/l. An increase in hardness decreases the toxicity of metals, because calcium and magnesium cations compete with the metal ions for complexing sites, allowing fewer metal complexes to form and therefore resulting in a lower level of toxicity (Minton 2002). In order to determine the applicable numeric water quality criteria for dissolved Cd, Cu, Pb, and Zn the freshwater criteria equations were solved using ambient hardness derived from available water quality data collected by the Narragansett Bay Commission (NBC) and RIDEM in 1998 and 2001. The selection of appropriate hardness values is discussed below.

15
DEM evaluated existing water quality data available throughout the mainstem of the Woonasquatucket River to determine appropriate hardness levels to use in calculating water quality criteria and establishing water quality goals for the TMDL. The analysis resulted in several observations. First, no correlation could be seen between hardness values and flow, which generally show an inverse correlation. Second, hardness values were observed to generally increase in a downstream direction under both baseflow (dry weather) and stormflow (wet weather) conditions. Third, only slight differences existed between mean dry and wet weather hardness values, particularly in segments 10A through 10C. Based on the data review, and in order to be highly conservative, DEM used the lowest of either the wet or dry weather mean hardness value for each of four segments of the Woonasquatucket River and tributary Assapumpsett Brook (Table 1.3). Since little difference is seen between dry and wet weather mean hardness values, the choice of an “mean” hardness value was felt to be representative of conditions in each river segment under dry weather baseflow conditions when dilution is limited. The use of the lowest mean hardness value to set TMDL targets results in adequately protective metals concentrations and is reflective of actual data collected in the waterbody during a range of flows. Antidegradation Policy
Rhode Island’s antidegradation policy requires that, at a minimum, the water quality necessary to support existing uses be maintained (see Rule 18, Tier 1 in the State of Rhode Island’s Water Quality Regulations). If water quality for a particular parameter is of a higher level than necessary to support an existing use (i.e. bacterial levels are significantly below Class B standards), that improved level of quality should be maintained and protected (see Rule 18, Tier 2 in the State of Rhode Island’s Water Quality Regulations). Tier 2 does not apply to the Woonasquatucket River because fecal coliform bacteria and dissolved metals concentrations are greater than the water quality standards. Numeric Water Quality Targets This TMDL sets numeric concentration targets for fecal coliform bacteria of 200 fc/100ml and 400 fc/100ml. These targets are equivalent to the state’s water quality standards. Similarly, the numeric concentration targets for dissolved Cd, Cu, Pb, and Zn are equivalent to the water quality criteria presented in Table 1.3. The comparison of segment specific criteria to available data are explained in Section 6.5. Table 1.3 Water Quality Criteria for Dissolved Metals1.
1See Table 1.1 for waterbody segment description.
ACUTE CRITERIA (calucated using lowest of dry or wet weather mean hardness value for each segment)Paramter RI0002007R-10A RI0002007R-10B RI0002007R-10C RI0002007R-10D RI0002007R-01Hardness (mg/CaCO3) 21.8 24.3 30.0 37.4 44.9Cd (ug/l) 0.46 0.51 0.62 0.77 0.92Cu (ug/l) 3.2 3.54 4.32 5.32 6.32Pb (ug/l) 11.9 13.45 17.04 21.81 26.74Zn (ug/l) 32.24 35.34 42.25 50.93 59.46
CHRONIC CRITERIA (calucated using lowest of dry or wet weather mean hardness value for each segment)Paramter RI0002007R-10A RI0002007R-10B RI0002007R-10C RI0002007R-10D RI0002007R-01Hardness (mg/CaCO3) 21.8 24.3 30.0 37.4 44.9Cd (ug/l) 0.09 0.09 0.11 0.12 0.14Cu (ug/l) 2.44 2.67 3.2 3.86 4.52Pb (ug/l) 0.46 0.52 0.66 0.85 1.04Zn (ug/l) 32.5 35.63 42.59 51.34 59.94
WATERBODY ID NUMBER
WATERBODY ID NUMBER

16
2.0 Background
2.1 Geographic Setting The Woonasquatucket River watershed (Figure 2.1) is located in the north-central part of the State of Rhode Island. The basin encompasses most of the Town of Smithfield, part of the Towns of North Smithfield, Glocester, part of the Cities of North Providence and Johnston, and approximately one third of the City of Providence. The river drains an area of approximately 52 square miles (135 km2) and is approximately 16 miles (26 km) long, dropping over 200 feet (61m) along its length. The river is a tributary to the Providence River, located in the Narragansett Bay watershed. The Woonasquatucket River begins at the outlet of Primrose Pond in North Smithfield and flows generally south-southeast through several reservoirs and old mill ponds in Smithfield, North Providence, and Providence. At its confluence, the river combines with the Moshassuck River in downtown Providence, forming the Providence River. The Woonasquatucket River is tidally influenced up to the Rising Sun Dam, located in Olneyville near Eagle Street.
2.2 Basin Characteristics Climate in the basin follows patterns typical of the New England ecoregions, with warm, moist summers and cold, snowy winters. Climatological data were obtained for T.F. Green Airport in Warwick, from the Northeast Regional Climate Center. Mean annual average precipitation in the watershed is 46 in/yr (117 cm/yr). The U.S. Geological Survey (USGS) maintains a stream gauge on the Woonasquatucket River at Centerdale just downstream of the Route 44 Bridge. The period of record is July 1941 to the present. Historical discharge, as daily mean streamflow, is presented in Figure 2.2. Based on the period of record, the annual mean streamflow is 73.4 cfs (2.1 cms) and the lowest 7-day average flow occurring on average once every 10 years (7Q10) is 7.14 cfs (0.20 cms). The watershed contains several ponds, lakes, reservoirs, and impoundments and includes approximately 3492 acres (1413 ha) of wetlands drained by perennial streams. The principal tributaries to the Woonasquatucket River are the Nipsachuck Swamp, Stillwater River, Nine Foot Brook, Latham Brook, Shinscot Brook, Assapumpsett Brook, and Reaper Brook. Several of the tributaries that drain into the Stillwater Reservoir also contain reservoirs: Waterman Reservoir, Sprague Upper Reservoir, Sprague Lower Reservoir, Mountaindale Reservoir, and Slack Reservoir. Some tributaries in the more urbanized areas have been culverted and incorporated into drainage systems. Historically, surface water within the Woonasquatucket River has been impounded by dams for drinking water supply to local communities, for recreational purposes, and for water supply to the mills for industrial uses. There are currently 40 impoundments within the watershed identified by the RIDEM/RIGIS database. According to a 1961 USGS Water Supply Paper (Halberg et al., 1961), the Woonasquatucket Reservoir Co., an association of the mills on the river, operated Mountaindale Pond, Waterman Reservoir, Slack Reservoir, and the Stillwater Reservoirs to store water during high flows for release when needed by the mills downstream. The Stillwater Reservoir is no longer in use as a water source for industrial uses however, downstream industrial users of water from the Woonasquatucket River still exist. The upper reservoirs are currently used mainly for recreational purposes such as boating, bathing, and fishing.
17
Figure 2.1 Map of Woonasquatucket River Watershed.

18
Figure 2.2 Historical discharge at USGS gage 01114500 on the Woonasquatucket River. The Woonasquatucket River was heavily used during the 19th century and has been profoundly altered by its industrial heritage. The streams feeding the Woonasquatucket River in Smithfield were dammed to create water supplies for industrial uses. Although the mills no longer operate, the reservoirs remain functioning primarily for multiple recreational uses. Industrial activities have historically been the largest source of toxic pollutant discharges to the Woonasquatucket River. However, federal, state, local and industry initiatives undertaken pursuant to the federal Clean Water Act have resulted in significant reductions in industrial pollutant loadings since the 1970s. As a result, non-industrial sources such as commercial and household toxic and hazardous wastes, motor vehicle emissions and leaks, and urban and highway runoff are increasingly significant sources of contamination throughout the Woonasquatucket River watershed. The upper reaches of the watershed remain rural and are characterized by low-density development while the lower reaches are characterized by high-density urban development with industrial and commercial uses adjacent to the river. Current land use for both the upper and lower portion of the watershed is shown in Figure 2.3. The lower basin, once a tidal estuary, is now impounded with extensive channelization. Major permitted discharges to the river include the Smithfield WWTF and Metals Recycling L.L.C. Inc. Minor permitted discharges are listed in Table 4.9. There are currently 14 CSO’s discharging to the Woonasquatucket River, located between Glenbridge Avenue and downstream to the confluence with the Moshassuck River. The lower section of river is littered with trash, tires, appliances, plastics, shopping carts, and other large debris that contributes to the overall environmental degradation of the basin. The watershed also contains numerous RIDEM State Hazardous Waste Sites (SHWS), Leaking Underground Storage Tank (LUST) sites, and USEPA Comprehensive Environmental Response, Compensation and Liability Act (CERCLA) sites.

19
Figure 2.3. Land Use within the Woonasquatucket River watershed.

20
Approximately 40% of the Town of Johnston lies within the Woonasquatucket River watershed. Most of the development in Johnston has occurred in its eastern section along the main stem of the river. A majority of the area is sewered with connection to either the NBC sewer system or the system of the City of Cranston. The Town of Smithfield is located entirely within the Woonasquatucket watershed with concentrations of development and population in the Villages of Georgiaville, Esmond, and Greenville. Small sections of Esmond and Georgiaville are sewered along with the old mill complexes. The remainder of the town is serviced by on-site sewage disposal systems. The Woonasquatucket River was designated an American Heritage River on July 30, 1998. The river was chosen in part because of the significant role it played in the Industrial Revolution. The Woonasquatucket was one of the first rivers in the country to be dammed by mill-owners to insure a steady supply of water year-round for their mills. In past years the river has gone from a valued asset to a neglected natural resource. In urban areas the river itself and its banks have become a dumping ground for chemicals and large solid debris. In rural areas the river is threatened by development pressures and suburban and commercial sprawl. Numerous groups have taken an interest in revitalizing the river and its watershed. The largest, The Woonasquatucket River Watershed Council (WRWC), formed shortly after the American Heritage River designation. The Council is composed of residents, representatives of local and state government, and local non-profits, who all work to improve the environment and economy within the watershed. The Council works with RIDEM and other state and federal agencies to design and implement various restoration projects in the watershed.
2.3 Historic Water Quality Numerous organizations have collected water quality, streamflow, sediment, biological, and other data within the Woonasquatucket River watershed. In 2000 RIDEM contracted with the Louis Berger Group of Providence, RI to collect and summarize this data. A detailed synthesis of existing data from over 16 studies is provided in the report Water Quality Characterization for the Woonasquatucket River Basin (Louis Berger Group, Inc. 2001). The complete document is available for review at the DEM Water Resources offices in Providence. The following sections contain brief reviews of applicable studies by the University of Rhode Island, NBC, River Rescue, and Camp, Dresser, and McKee, Inc. A recent study by the USEPA is also included in this section.
Camp, Dresser, and McKee, Inc. (CDM 1989)
In 1987, CDM conducted a study for the Narragansett Bay Commission of several urban rivers draining to Narragansett Bay (CDM 1989). As part of the study, CDM completed a wet weather sampling study of three storm events: April 28, 1987, August 27, 1987, and October 27, 1987. Water quality samples were collected at four stations in the Woonasquatucket (downstream of Manton Dam, Manton Ave., Valley Street Bridge, and Atwells Ave.). Samples were analyzed for several parameters including fecal coliform and total metals (Cd, Cr, Cu, Pb, Ni, and Zn). In addition to wet weather sampling, dry weather samples were collected on May 11, 1987 and September 28, 1987. Fecal coliform concentrations during dry weather ranged from 23 to 24,000 MPN/100ml at the four stations; wet weather fecal coliform concentrations ranged from 93 to 2,400,000 MPN/100ml. The mean fecal coliform concentrations at each station exceeded 200 MPN/100 ml at all times. Detection limits for dissolved metals were comparatively high (i.e. inadequate for comparison to the applicable water quality standards and the development of TMDLs) therefore the data were not examined.

21
University of Rhode Island- Wet Weather Study (Wright et al. 1991)
In 1988 and 1989, URI researchers conducted a study for the Narragansett Bay Commission to assess the impacts of CSO events on the Providence River and upper Narragansett Bay under wet weather conditions. URI conducted the study during three storm events in 1988 and 1989. Water quality samples were collected before, during, and after each of three storms at one station on the Woonasquatucket River. Samples were analyzed for several parameters including fecal coliform and dissolved metals (Cd, Cr, Cu, Pb, and Ni). As expected, measured fecal coliform concentrations exceeded applicable water quality criteria during all three events. Dissolved Cd, Cu, and Pb concentrations exceeded the 1991 applicable chronic and/or acute criteria during each of three storm events. River Rescue Water Quality Monitoring (Kerr and Lee 1996) The River Rescue Project is a water quality program that was conducted from 1990 to 1995 (Kerr and Lee 1996). Monitoring was conducted at ten stations in several of Narragansett Bay’s urban rivers, including the Woonasquatucket. Two stations on the Woonasquatucket River were located at the Route 44 crossing in North Providence and at Valley Street in Providence. Sample analysis consisted of in-situ measurements of pH, temperature, dissolved oxygen, TSS, and hardness, as well as nutrient and total Cd, Cu, Cr, Pb, and Ni analysis. The Kerr and Lee (1996) report indicated that the Woonasquatucket River consistently violated applicable acute and chronic Cu criteria at both stations, and existing chronic criteria for Pb at one station. The report concluded that overall, water quality has improved compared to historical data. I-95 Stormdrain Retrofit Demonstration Project
Under the Intermodal Surface Transportation Efficiency Act of 1991, the Rhode Island Department of Transportation (RIDOT) was given monies for the design and construction of a stormdrain retrofit on I-95 and other state highways to protect water quality in Narragansett Bay and its major tributaries. In a cooperative effort with the RIDOT, the University of Rhode Island (URI) evaluated pollution entering tributaries of Narragansett Bay and established a ‘pollution potential’ of selected highway outfalls draining to those tributaries. Studied basins included the Pawtuxet, Woonasquatucket, and Moshassuck. As part of the project, URI and RIDOT identified a total of 6 outfalls from I-95 and eighteen outfalls from Route 6 that discharge to the Woonasquatucket River. Two outfalls in the Woonasquatucket with the largest catchment areas are known as W6, located off of Mancini Drive in Providence and W23, located north of Kinsley Avenue near the Providence Place Mall. Both outfalls were sampled during four seasonal storm events. Samples were analyzed for dissolved Cd, Cu, Pb, Zn, fecal coliform bacteria, and numerous other constituents. Results for W6 and W23 are presented below and provide insight on pollutant concentrations from road and highway surfaces which discharge to the river. Table 2.1 Pollutant Summary for W6 and W23 outfalls.
Parameter W6 Max Conc. W23 Max Conc. W6 Min Conc. W23 Min Conc.
Fecal coliform (fc/100ml) 25000 73000 5.0 fc/100ml 10.0
Dissolved Cd (ug/l) 3.68 3.70 0.07 ug/l 0.20
Dissolved Cu (ug/l) 87.20 83.6 2.80 ug/l 4.50
Dissolved Pb (ug/l) 95.44 205.9 0.30 ug/l 12.4
Dissolved Zn (ug/l) 700 1000 40 ug/l 30.0 USEPA Centerdale Manor metals sampling During the fall of 2000 through summer of 2001, EPA collected surface water samples in the mainstem just upstream of Allendale Mill Pond, the mouth of Assapumpsett Brook, just upstream of the Lymanville Dam, and just downstream of the Esmond Mill Dam as part of a source area investigation at the Centerdale Manor

22
Superfund Site, located in North Providence. The source area extends down the Woonasquatucket River from the main portion of the Site, south to the Lyman Mill Dam, and includes the recently restored Allendale Dam. The study included collection of surface water, sediment, and groundwater data. Approximately 15 samples were collected at each station. The samples were analyzed for a suite of metals and included total and dissolved Cd, Cu, Pb, and Zn. Surface water concentrations of dissolved Cd, Cu, Pb, and Zn concentrations at all stations met applicable acute and chronic criteria (calculated using a hardness value of 30.0 mg/l). Groundwater samples were analyzed for a suite of metals, including dissolved Cd, Cu, Pb, and Zn. The majority of samples met RI Groundwater Quality Standards. Summary of Historical Water Quality Data
A summary of historical water quality data collected by various organizations shows consistent violations of fecal coliform bacteria standards. These historical data show water quality impairments during both dry and wet weather, particularly in areas impacted by CSO outfalls. Wet weather fecal coliform concentrations are typically several orders of magnitude greater than dry weather concentrations. The above studies all indicate that stormwater, CSO discharges, and nonpoint pollution are the primary sources of fecal coliform bacteria in the watershed. Characterization of the mainstem using historical metals data is limited by high detection limits and primary analysis for total, rather than dissolved metals. Dissolved metal concentrations that frequently exceeded water quality criteria (applicable at that time period) in the lower segment of the river consisted of Cd, Cu, and Pb. Historical data reveal that the Smithfield WWTF is a source for Cu and Zn. Other primary sources include stormwater runoff, CSO discharges and other miscellaneous sources including groundwater and sediment.

23
3.0 Present Condition of the Waterbody The most recent water quality conditions are reflected in the data collection efforts of RIDEM, Louis Berger Group, Inc., and the Narragansett Bay Commission. The TMDLs are based on water quality data collected by these organizations between 1998 and 2004. An overview of the pertinent water quality investigations and the current NBC monitoring program is presented below. Applicable water quality data for each study are given in Appendix A. A schematic of the Woonasquatucket is presented in Figure 3.1, which shows water quality station locations, stormwater sampling sites, the Smithfield WWTF outfall site, and the reach impacted by combined sewer overflows. Station WR7A is located at the mouth of Assapumpset Brook.
3.1 Applicable Studies
NBC Water Quality Monitoring
The Narragansett Bay Commission, as part of the Urban Rivers Team, conducted a water quality study of the Woonasquatucket River during the summer of 1998. The objective of this study was to examine the water quality of the river and provide a baseline dataset for future monitoring activities. Samples were collected at 11 sites along the Woonasquatucket River from Sillwater Dam to Waterplace Park. The following laboratory analysis were conducted for each sample: total and dissolved metals (cadmium, chromium, copper, lead, nickel, silver, and zinc), hardness, total Kjeldahl nitrogen (TKN), nitrate-nitrite, ammonia, total phosphate, fecal coliform, total suspended solids (TSS), and biochemical oxygen demand (BOD5). The study consisted of eight sampling events during the summer of 1998: July 15, July 22, July 29, August 5, August 12, August 19, August 24, and October 7. NBC also conducted a 24-hr sampling study on August 24 to 25 and October 7 to 8. The detection limits for many of the metals, particularly dissolved Pb and Cu were near or higher than the water quality criteria. Therefore, dissolved metals data are considered questionable and were not used in the TMDL analysis. Fecal coliform data are reported in Table 1 Appendix A. Fecal coliform data were used in combination with other recent fecal coliform datasets to assess compliance with the states water quality criteria, calculate percent reductions, and determine load and wasteload allocations for this TMDL. Fecal coliform concentrations exceeded the applicable water quality standard frequently along the entire length of the river between Georgiaville Pond and the mouth near the confluence with the Moshassuck River. NBC Routine Water Quality Monitoring
The NBC’s Environmental Monitoring and Data Analysis (EMDA) section routinely monitors Providence-area rivers for fecal coliform bacteria as part of their Combined Sewer Overflow (CSO) Project and for routine maintenance activities of CSO interceptors and regulators. Six (6) stations along the Woonasquatucket River have been monitored weekly and bi-weekly since 1998. The sampling is routine and occurs under both dry and wet weather conditions. Samples are typically collected in the beginning of the week and analyzed by the NBC Laboratory for fecal coliform bacteria using the A1 Medium method within a 24-hr period. Rain data are collected by NBC’s Interceptor Maintenance and Construction section (IMC) and/or RIDEM and sent to EMDA for correlation with coliform results. Water quality data are used to determine if regulator and/or interceptor maintenance is required. EMDA Scientists examine the data on a monthly basis to detect any major changes or trends in problematic sections in the Woonasquatucket River.

24
Figure 3.1 Schematic of the Woonasquatucket River showing water quality station locations, stormwater sampling sites, WWTF outfall site, and CSO reach.

25
Table 2 in Appendix A presents fecal coliform data from 1998 through 2004. These data were used in combination with other recent fecal coliform datasets to assess compliance with the state’s water quality criteria and calculate percent reductions for the TMDL. This dataset also provides the most long term and comprehensive sampling data on fecal coliform in the lower Woonasquatucket River and within the CSO area. Table 3.1 summarizes yearly data from the NBC weekly monitoring program for stations along the mainstem and within the CSO service area from 1998 to 2004. NBC, RIDEM, and LBG Inc., Wet Weather Water Quality Study
The primary objective of the wet-weather monitoring program was to locate sources of wet weather impairments to the Woonasquatucket River. Separate Quality Assurance Plans (NBC 2001, Louis Berger Group, Inc. 2000), available for review at DEM offices in Providence, provide more information regarding monitoring protocol and field and laboratory quality control/quality assurance. NBC sampled for fecal coliform and dissolved metals analyses at five (5) stations along the mainstem of the Woonasquatucket. RIDEM and LBG Inc. conducted sampling to characterize pollutant sources to the river from storm sewers and tributaries. Comprehensive wet weather surveys were carried out on Sept 20-21, 2001 and August 29-30, 2002. Fecal coliform samples were collected at nine (9) mainstem, 1 tributary, and 6 point source locations (5 stormwater outfalls, and 1 WWTF outfall). Dissolved metals samples were collected at 7 mainstem, 1 tributary, and 6 point-source locations (5 stormwater outfall, and 1 WWTF outfall). Station locations are presented in Figure 3.1 and water quality data are available in the final report authored by the Louis Berger Group, Inc. and titled: Woonasquatucket River Wet-Weather Sampling Data Report. This report is available in the Office of Water Resource at DEM in Providence. Fecal coliform criteria were consistently violated during each event. However, fewer than expected dissolved metals violations occurred in the mainstem during both events-likely due to the amount of dilution from stormflow relative to source contribution/source strength. RIDEM Dry Weather Dissolved Metals and Fecal Coliform Sampling
Four dry weather water quality surveys were performed in the Woonasquatucket River by RIDEM in the summer of 2001. Surveys were carried out on June 28, July 26, August 1, and September 6, 2001. Thirteen mainstem, 1 tributary, and 2 point source stations were sampled for fecal coliform and dissolved metals (Cd, Cu, Pb, Zn, and silver). Station locations and water quality data are presented in Table 3 Appendix A. Dissolved Pb and Zn were the primary dissolved metals exceeding water quality criteria, particularly between Route 6 and the Atwells Avenue Bridge. Fecal coliform concentrations were highest within the CSO reach between Manton Avenue and the confluence with the Moshassuck River.

26
Table 3.1 Summary of routine pathogen data collected by NBC from 1998 to 2004. Station Year Dry
Weather na
Wet Weather
na
Dry Weather Geometric
Mean (fc/100ml)
Wet Weather Geometric
Mean (fc/100ml)
Dry Weather Percentile
Value (fc/100ml)
Wet Weather Percentile
Value (fc/100ml)
S-9 1998 26 18 138 187 430 2172 Manton 1999 29 13 189 430 1500 9280 Avenue 2000 31 18 74 236 430 1341 2001 23 8 134 394 1866 2340 2002 31 28 80 485 430 3180 2003 41 13 108 223 430 2026 2004 28 10 153 317 580 930 Summary 98-04 209 108 117 312 436 2490 S-8A 1998 25 18 428 549 890 9300 Olneyville 1999 29 13 381 422 2320 20120 Footbridge 2000 33 17 410 768 7920 5580 2001 22 6 636 2311 22530 48800 2002 29 24 125 727 430 34990 2003 44 12 318 837 4300 8600 2004 27 10 262 635 930 4800 Summary 98-04 209 100 324 699 2780 9300 S-8C 1998 7 1 624 1000 854 1000 Bridge on 2000 17 5 306 698 2300 2952 Delaine St. 2001 19 9 748 1572 11200 13600 2002 29 30 215 2151 2060 110000 2003 45 12 512 862 18120 8600 2004 29 10 249 714 1204 4300 Summary 98-04 146 67 373 1350 4300 46000 S-8B 1998 21 14 817 1337 4300 18890 Valley St. 1999 20 9 1013 2838 24000 46000 Bridge 2000 16 12 865 1536 24000 41830 2001 3 2 369 727 744 2093 2002 0 4 9781 34990 Summary 98-02 60 41 857 1936 24000 46000 S-8 1998 26 18 1309 2132 16150 23400 Atwells 1999 29 13 734 2213 11000 92800 Avenue 2000 33 17 359 1023 10660 9300 Bridge 2001 22 5 480 1221 8800 14760 2002 31 23 366 982 2400 9300 2003 57 15 354 1194 3100 17400 2004 43 13 418 617 3900 4300 Summary 98-04 241 104 475 1227 9300 20600 S-7B 2000 17 5 549 1820 11580 66300 Pleasant 2001 19 6 541 5240 5300 60500 Valley 2002 33 23 537 1693 8800 9300 Parkway 2003 57 14 595 2309 6300 21300 2004 46 12 748 1189 9300 4300 Summary 00-04 172 60 609 1910 9300 11400 S-7A 2000 17 5 984 2498 24000 29320 Kinsley St. 2001 19 6 636 781 9000 2400 2002 32 23 756 2147 9120 46000 2003 51 15 506 2298 4300 37200 2004 39 13 663 2029 5300 24000 Summary 00-04 158 62 648 1980 9300 46000 S-7 1998 26 18 1883 3024 33000 43000 Exchange 1999 29 13 1600 1949 12240 41600 St. Bridge 2000 16 12 1171 4068 6950 43800 Summary 98-00 71 43 1583 2876 23000 45400
a n = number of samples

27
3.2 Water Quality Summary and Resource Impairments
Dry Weather Fecal Coliform Bacteria
Figure 3.2 summarizes dry weather geometric mean and percentile values for each station in the Woonasquatucket River, including the mouth of Assapumpset Brook. A schematic of the watershed, showing sampling station and point source locations is presented in Figure 3.1. Overall, a consistent and increasing trend in fecal coliform bacteria concentrations is observed in the downstream direction. During dry weather, the Woonasquatucket River consistently violates Class B, B1, and B1a fecal coliform criteria between the outlet of Georgiaville Pond and the mouth of the river near the confluence with the Moshassuck.
River Mile (downstream--------------->)
0.01.02.03.04.05.06.07.08.09.010.011.012.013.0
Feca
l Col
iform
/100
ml
468
20
406080
200
400600800
2000
400060008000
20000
10
100
1000
10000
468
20
406080
200
400600800
2000
400060008000
20000
10
100
1000
10000
Dry Weather Geometric Mean Value Dry Weather Percentile Value
1. Stillwater Reservoir2. Georgiaville Pond3. Greystone Mill Pond, WWTF outfall4. Allendale Mill Pond5. Lyman Mill Pond6. CSO reach
1
2 3
4 5
6
Class B WQ criteria400 fc/100ml
Class B WQ criteria200fc/100ml
CSO reach
Figure 3.2 Dry weather fecal coliform summary in mainstem Woonasquatucket River. Geometric means and percentile values increase downstream from the outlet of Georgiaville Dam (RM 9.3) to the outlet of Allendale Mill Pond (RM 6.3), and then decrease downstream to the outlet of Lyman Mill Pond (RM 5.4). Both statistical values increase again from RM 5.4 to the RM 0.2 near the confluence with the Moshassuck River. CSO outfalls are located along the mainstem between Glenbridge Avenue (RM 3.6) and the confluence with the Moshassuck River. The highest dry weather geometric mean and percentile values are located within this reach. Fecal coliform concentrations in the effluent of the Smithfield Wastewater Treatment Facility (RM 8.11) were always below 50 MPN/100 ml. Wet Weather Fecal Coliform Bacteria
Bacteria data collected during wet weather conditions are available for nearly the entire mainstem of the Woonasquatucket from the outlet of Stillwater Reservoir Dam (RM 12.0) to Exchange Street (RM 0.2), near the confluence with the Moshassuck River. Figure 3.3 summarizes wet weather fecal coliform concentrations in the mainstem Woonasquatucket. A schematic of the watershed, showing sampling station and point source locations is presented in Figure 3.1.

28
Figure 3.3 Wet weather fecal coliform summary in mainstem Woonasquatucket River. Overall, wet weather bacteria concentrations in the downstream direction parallel those during dry weather, with a consistent and increasing trend in concentrations observed between the outlet of Stillwater Reservoir Dam (RM 12.0) and the mouth of the river at Exchange Street (RM 0.2). Wet weather geometric mean values in the mainstem are typically an order of magnitude greater than dry weather geometric mean values. Generally, the fecal coliform concentrations were highest in the lower sections of the river as a result of the CSO discharges. Geometric mean values increase in a downstream direction with notable peaks seen at RM 9.3, 7.0, and the mouth of Assapumpset Brook (RM 5.8). A large and consistent increase in both geometric mean and percentile values is seen in a downstream direction between Glenbridge Avenue (RM 3.6) and Pleasant Valley Parkway (RM 5.4). Exceptionally high geometric mean and percentile values occur between Bath Street (RM 0.7) and Exchange Street (RM 0.2). A statistical summary of dry and wet weather fecal coliform concentrations in the Woonasquatucket River is presented in Table 3.2. Bold text indicates that applicable criteria are met.
River Mile (downstream--------------->)
0.01.02.03.04.05.06.07.08.09.010.011.012.013.0
Feca
l Col
iform
/100
ml
68
20
406080
200
400600800
2000
400060008000
20000
40000
10
100
1000
10000
68
20
406080
200
400600800
2000
400060008000
20000
40000
10
100
1000
10000
Wet Weather Geometric Mean Value Wet Weather Percentile Value
1. Stillwater Reservoir2. Georgiaville Pond3. Greystone Mill Pond, WWTF outfall4. Allendale Mill Pond5. Lyman Mill Pond6. CSO reach
1
2 34
5
6
Class B WQ criteria400 fc/100ml
Class B WQ criteria200fc/100ml
CSO reach
207,000
S4 and S5 outfalls
S1S2
S3
named outfalls

29
Table 3.2 Fecal coliform statistics for the Woonasquatucket River1,2.
Station
River Mile
DW Geometric
Mean (fc/100ml)
DW 90th Percentile
Value (fc/100ml)
WW Geometric
Mean (fc/100ml)
WW 90th Percentile
Value (fc/100ml) WR1 12.0 4 19 65 178 WR2 10.9 24 54 77 444 WR3 9.3 247 552 1789 5470
WR3A 8.3 354 824 1065 2550 WR5 7.5 98 402 1063 23750 WR6 7.0 397 682 2026 10440 WR7 6.3 538 2240 1163 6180
WR7A3 5.8 796 3630 5895 17400 WR7B 5.4 104 347 259 2065 WR8 4.6 117 436 312 2490 WR9 3.6 240 15324 1064 2220
WR10 3.2 370 950 3612 15180 WR11 2.5 324 2780 699 9300 WR12 2.3 373 4300 1350 46000 WR13 1.9 857 24000 1936 46000 WR14 1.6 475 9300 1227 20600
7B 0.9 609 9300 1910 11400 WR15 0.7 1407 9000 8272 196000
7A 0.5 648 9300 1980 46000 WR16 0.2 1583 23000 2876 45400
1Bold indicates stations meeting water quality criteria 2Red stations are those located within the CSO reach. 3Station located at the mouth of Assapumpset Brook. Dry Weather Dissolved Metals Summary
In support of the TMDL, three sampling events were conducted during periods of dry weather steady-state conditions. Pre-storm samples from wet weather events also meet the dry weather sampling criteria and were incorporated into the dry weather dataset. The mean daily flow, averaged over five (3 dry weather and 2 pre-storm) surveys was 15.4 cfs (0.44 cms). Dry weather concentrations of dissolved Cd, Cu, Pb, and Zn are presented in Figures 3.4 to 3.7, which show scatter plots displaying mean and maximum dissolved metals concentrations for all mainstem stations and point sources. The applicable chronic criteria are displayed as solid blue lines. Consistent with EPA’s Technical Support Document for Water Quality-based Toxics Control (1991), dissolved metals data for this TMDL were evaluated under both low and high flow conditions. RI Water Quality Regulations state that the four-day average concentration of a pollutant should not exceed the chronic criteria more than once every three years on average. In order to assess compliance with dissolved metals criteria during dry weather and low flow conditions, each dissolved metals value for each mainstem station was compared to the chronic criteria. Dry weather metals concentrations did not fluctuate significantly in the Woonasquatucket, therefore each of the monthly data points was assumed to be representative of a four-day average concentration. Dissolved Cd, Cu, Pb, and Zn all tend to increase in a downstream direction from the Stillwater Reservoir Dam (RM 12.0) to the bridge on Allendale Avenue (RM 6.3), just upstream from the confluence with Assapumpset Brook. Concentrations then show a marked decrease at the outlet of Lyman Mill Dam at RM 5.4. From the outlet of Lyman Mill Dam to the confluence with the Moshassuck, dissolved metals concentrations show significant increases. Most notable are the increases in all dissolved metals downstream of the S4 outfall, located at Mancini Drive in Providence, between RM 3.6 and 3.2. Dissolved Zn and Cd showed a four-fold increase in concentration within this reach while concentrations of Cu and Pb increased two-fold. The average concentrations of all dissolved metals within the CSO reach (RM 3.2 to RM 0) are greater than those upstream in the non-CSO

30
impacted reach (Table 3.3). This reach also contains the S4 outfall, located just downstream of RM 3.6. Table 3.3 compares the maximum and mean dissolved Cd, Cu, Pb, and Zn concentrations inside and outside of the CSO reach. Table 3.3 Dry weather dissolved metals summary within and outside of the CSO reach.
Metal Non-CSO Reach CSO Reach Mean (ug/l) Maximum (ug/l) Mean (ug/l) Maximum (ug/l) Cadmium 0.01 0.03 0.02 0.14 Copper 1.20 3.98 1.71 8.20 Lead 0.25 0.69 0.54 4.08 Zinc 13.99 58.00 19.05 86.40
Figure 3.4 Dry weather dissolved Cd concentrations in the Woonasquatucket River. Average dry weather dissolved Cd concentrations were low, ranging from 0.003 and 0.019 ug/l in the mainstem Woonasquatucket (Figure 3.4). Average Cd source concentrations to the Woonasquatucket River ranged from 0.014 ug/l at the mouth of Assapumpset Brook to 0.096 ug/l at the Smithfield WWTF outfall. Average dissolved Cd concentrations within the CSO reach average twice those in upstream reaches (Table 3.3). A steady increase in Cd is visible from RM 12.0 (outlet of Stillwater Reservoir Dam) to RM 7.0 (Bridge on Allendale Ave.). From RM 7.0 to RM 3.6 at Glenbridge Avenue Cd concentrations decrease to levels observed at RM 12.0. Cd concentrations then increase in the downstream direction throughout the CSO reach.
River Mile (distance from mouth)
1.02.03.04.05.06.07.08.09.010.011.012.0
Con
cent
ratio
n in
ug/
l
0.0000
0.0025
0.0050
0.0075
0.0100
0.0125
0.0150
0.0175
0.0200
0.0800
0.1200
0.1600 Cadmium- Cd
Assapumpset Brook
CSO Reach
S-4 Outfall
maximum conc.
mean conc.
Smitfield WWTF outfall
Seg 10A chronic Cd criteria 0.09
Seg 10B chronic Cd criteria 0.09
Seg 10C chronic Cd criteria 0.11
WR1
WR3
WR3A
WR5WR6
WR7
WR7A
WR7BWR8
WR9
WR10WR11
WR13
WR14WR15
WR12
Seg 10D chronic Cd criteria 0.12
Chronic Cd criteria 0.14

31
A significant increase in dissolved Cd occurs downstream of the S4 outfall, located at Mancini Drive in Providence. The average dry weather dissolved Cd concentration at S4 was 0.068 ug/l. Other significant increases occur between RM 1.9 (Valley Street Bridge) and RM 0.7 (Bath Street). Existing (2005) acute and chronic Cd criteria were met at all stations in the Woonasquatucket River. Existing acute and chronic Cd criteria were met at Station WR7A, located at the mouth of Assapumpset Brook.
Figure 3.5 Average dry weather dissolved Cu concentrations in the Woonasquatucket River.
Average dissolved Cu concentrations ranged between 0.44 and 1.41 ug/l at all stations in the mainstem Woonasquatucket (Figure 3.5). Average source concentrations ranged from 1.54 ug/l at the mouth of Assapumpset Brook to 6.78 ug/l at the Smithfield WWTF outfall. A steady increase in dissolved Cu between RM 12.0 and RM 7.0 is apparent in Figure 3.5 with the most notable increase occurring downstream of the Smithfield WWTF outfall. Cu concentrations level off and remain constant downstream of RM 6.3 at Allendale Avenue to RM 0.7 at Bath Street. Applicable acute and chronic Cu criteria were met at all stations in the Woonasquatucket River during dry weather. Both acute and chronic Cu criteria were met at Station WR7A, located at the mouth of Assapumpset Brook.
River Mile (distance from mouth)
1.02.03.04.05.06.07.08.09.010.011.012.0
Con
cent
ratio
n in
ug/
l
0.0
0.5
1.0
1.5
2.0
2.5
3.0
3.5
4.0
4.5
5.0
5.5
6.0
6.5
7.0Copper-Cu
Assapumpset Brook
CSO Reach
S4 outfallmaximum conc.
mean conc.
Smithfield WWTFoutfall
WR1WR3 WR3A
WR5WR6
WR7WR7B WR8
WR9 WR10
WR11WR12
WR13
WR14 WR15
13.4max
7.3 max
Seg 10A chronic Cu criteria 2.44
Seg 10B chronic Cu criteria 2.67 Seg 10C chronic
Cu criteria 3.2
Seg 10D chronic Cu criteria 3.86 Chronic Cu
criteria 4.52

32
Figure 3.6. Average dry weather dissolved Pb concentrations in the Woonasquatucket River. Average dissolved Pb concentrations increase in a downstream direction and range between 0.12 and 0.46 ug/l (Figure 3.6). Average source concentrations ranged from 0.20 ug/l at the mouth of Assapumpset Brook to 0.95 ug/l at the Smithfield WWTF outfall. Average dissolved Pb concentrations within the CSO reach are nearly double those outside and upstream of the CSO reach. The largest increases in dissolved Pb in the mainstem occur downstream of both the Smithfield WWTF and the S4 outfall located at Mancini Drive in Providence. Applicable acute and chronic Pb criteria were met at all stations in the Woonasquatucket River during dry weather. Acute and chronic Pb criteria were also met at Station WR7A, located at the mouth of Assapumpset Brook.
River Mile (distance from mouth)
1.02.03.04.05.06.07.08.09.010.011.012.0
Con
cent
ratio
n in
ug/
l
0.00
0.10
0.20
0.30
0.40
0.50
0.60
0.70
0.80
0.90
1.001.90
1.95
2.00Lead- Pb
Assapumpset Brook
CSO Reach
S4 outfall
maximum conc.
mean conc.
Smithfield WWTF outfall
WR1 WR3
WR5 WR6WR7
WR7B
WR8
WR9
WR10
WR11
WR12WR13
WR14
WR15
1.1 max
2.0 max
0.40 max
Seg 10A chronic Pb criteria 0.46
Seg 10B chronic Pb criteria 0.52
Seg 10C chronic Pb criteria 0.66
Seg 10D chronic Pb criteria 0.85
Chronic Pbcriteria 1.04

33
Figure 3.7 Average dry weather dissolved Zn concentrations in the Woonasquatucket River. Average dissolved Zn concentrations ranged between 4.69 and 32.80 ug/l at all stations in the mainstem Woonasquatucket (Figure 3.7). Average point source concentrations ranged from 23.62 ug/l at the mouth of Assapumpset Brook to 71.73 ug/l at the S5 outfall. The average dissolved Zn concentration from the Smithfield WWTF outfall was 38.73 ug/l. The largest instream increases in Zn occur downstream of the Smithfield WWTF and the S4 outfall, located at Mancini Drive in Providence. A large increase also occurs between RM 0.5 (Kinsley Street) and RM 0.2 (Exchange Street). Violations of applicable chronic Zn criteria occurred at two stations within the CSO reach at R.M. 3.2 and 0.7 (Stations WR10 and WR15). The violations at Station WR10 are most likely the result of inputs from the S4 outfall, located at Mancini Drive in Providence. Both acute and chronic Zn criteria were met at Station WR7A, located at the mouth of Assapumpset Brook. Wet Weather Dissolved Metals Summary
Two of four planned storm-sampling events were completed by DEM in 2001 and 2002. Sampling event #2 was conducted on September 20-21, 2001 with 0.24 inches (0.6 cm) of total precipitation preceded by a dry period of six days. Sampling event #4 was conducted on August 29-30, 2002 with 0.58 inches (1.5 cm) of total precipitation preceded by an eight-day antecedent dry period. Event averaged concentrations of dissolved Cd, Cu, Pb, and Zn are presented in Figures 3.8 to 3.11, which show scatter plots displaying mean and maximum dissolved metals concentrations for all mainstem stations and point sources. Applicable acute criteria for each reach are displayed as solid blue lines in each figure, while applicable chronic criteria are displayed as solid red lines. A typical wet weather dataset contains pre- and post- storm values, as well as 3-5 samples collected during the event when the majority of point sources are flowing and river discharge has responded to the increase in surface flows from the immediate watershed.
River Mile (distance from mouth)
1.02.03.04.05.06.07.08.09.010.011.012.0
Con
cent
ratio
n in
ug/
l
05
1015202530354045505560657075
125
130
135Zinc-Zn
Assapumpset Brook
CSO ReachS4 outfall
maximum conc.
mean conc.
Smithfield WWTF outfall
WR1
WR3
WR3A
WR5WR6 WR7
WR7BWR8
WR9
WR10
WR11
WR12
WR13
WR14
WR15
51.0 max
44.2 max
133.0 max
Seg 10A chronic Zn criteria 32.5
Seg 10B chronic Zn criteria 35.6
Seg 10C chronic Zn criteria 42.6
Seg 10D chronic Zn criteria 51.3
Chronic Zn criteria 59.9

34
Consistent with the Rhode Island Water Quality Regulations and EPA’s Technical Support Document for Water Quality-based Toxics Control (1991), dissolved metals data are evaluated under both low and high flow conditions for this TMDL. Two evaluations are used to assess compliance with dissolved metals criteria during high flow wet weather conditions. Acute criteria are compared to the maximum value of both wet weather datasets. Chronic criteria are compared to the mean of both storm datasets, including pre-and post- storm values. Point source statistics are presented but are not compared to either acute or chronic criteria. Wet weather dissolved metals concentrations in the mainstem were lower than dry weather concentrations, however source concentrations were typically much higher than during dry weather. Average concentrations of dissolved Cd, Cu, Pb, and Zn for all seven point sources were typically two to ten times the average concentrations observed at mainstem stations. Dissolved Cd, Cu, Pb, and Zn concentrations increased in the downstream direction with the highest concentrations typically found within the CSO reach.
Figure 3.8 Wet weather dissolved Cd concentrations in the Woonasquatucket River. Mean wet weather dissolved Cd concentrations ranged from 0.004 ug/l at RM 12.0 to 0.049 ug/l at RM 0.7. Despite the elevated source strengths, few notable increases are seen at any of the mainstem stations. A slight increase in dissolved Cd was observed downstream of the S4 and S5 outfalls at RM 3.2 (Station WR10), located at Mancini Drive in Providence. Mean Cd concentrations were marginally higher within the CSO reach. Applicable acute and chronic Cd criteria were met at all stations in the Woonasquatucket River. Both acute and chronic Cd criteria were met at Station WR7A, located at the mouth of Assapumpset Brook.
River Mile (distance from mouth)
0.01.02.03.04.05.06.07.08.09.010.011.012.013.0
Con
cent
ratio
n in
ug/
l
0.00
0.02
0.04
0.06
0.08
0.10
0.12
0.14
0.300.450.600.75
maximum conc compared to acute criteria.
mean conc compared to chronic criteria
Cadmium- Cd
Smithfield WWTF outfall
S1
S2 S3
S4
S5
Assapumpset Brook
CSO Reach
WR1
WR3AWR5
WR6 WR7 WR7B WR8
WR9WR10 WR12
WR13WR15
Seg 10A chronic Cd criteria 0.09
Seg 10B chronic Cd criteria 0.09
Seg 10C chronic Cd criteria 0.11
Seg 10D chronic Cd criteria 0.12
No violations of acuteCd criteria for any segments

35
Figure 3.9 Wet weather dissolved Cu concentrations in the Woonasquatucket River. Average wet weather dissolved Cu concentrations exhibited slightly more variation in the downstream direction (Figure 3.9) and ranged from 0.30 ug/l at RM 12 to 3.40 ug/l at RM 0.7. Notable increases were seen downstream of the Smithfield WWTF outfall and downstream of the S4 and S5 outfalls, located at Mancini Drive in Providence. Average dissolved Cu concentrations from the WWTF outfall were 6.95 ug/l. Stormwater outfalls S1-S5 exhibited some of the highest levels of dissolved Cu of all the sampled point sources with a maximum of 24.0 ug/l measured at outfall S3, located at Woonasquatucket Ave in North Providence. One violation of the acute Cu criteria occurred at RM 0.7 (Bath Street). All other applicable chronic and acute Cu criteria were met. Acute and chronic Cu criteria were met at the mouth of Assapumpset Brook.
River Mile (distance from mouth)
0.01.02.03.04.05.06.07.08.09.010.011.012.013.0
Con
cent
ratio
n in
ug/
l
0
1
2
3
4
5
6
7
8
9
10
11
max conc. compared to acute criteria
mean conc. compared to chronic criteria
Copper- Cu
Smithfield WWTF outfall
S1
S2 max 16.0
S3
S4
S5
Assapumpset Brook
CSO Reach
WR1WR3A
WR5 WR6 WR7
WR7B
WR8 WR9
WR10 WR12 WR13
WR15
max 24.0
max 12.0
max 9.6
Chroniccriteria 2.44
Chronic criteria 2.67
Chronic criteria 3.20
Chronic criteria 3.86 Acute
criteria 3.20Acutecriteria 3.54
Acutecriteria 4.32
Acutecriteria 5.32
Acute Chronic6.32 4.52

36
Figure 3.10 Wet weather dissolved Pb concentrations in the Woonasquatucket River. Average wet weather Pb concentrations ranged from 0.10 ug/l at RM 12.0 to 1.50 ug/l at RM 0.7. Wet weather dissolved Pb concentrations remained fairly constant (Figure 3.10) throughout the mainstem from RM 12.0 at the outlet of Stillwater Reservoir Dam to RM 3.62 at Glenbridge Avenue. Dissolved Pb concentrations in the mainstem increased downstream of the S4 and S5 outfalls, located at Mancini Drive in Providence and continued to increase in a downstream direction to RM 0.7 at Bath Street. This section of the mainstem is within the CSO reach. Point source Pb concentrations were elevated relative to mainstem Pb concentrations with the highest Pb concentrations measured at the stormwater outfalls S1-S5. One violation of the chronic Pb criteria occurred at RM 0.7 (Bath Street). All other chronic and acute Pb criteria were met. Both acute and chronic Pb criteria were met at the mouth of Assapumpset Brook.
River Mile (distance from mouth)
0.01.02.03.04.05.06.07.08.09.010.011.012.013.0
Con
cent
ratio
n in
ug/
l
0.0
0.2
0.4
0.6
0.8
1.0
1.2
1.4
1.6
1.8
2.0
2.2
2.4
2.6
maximum conc. compared to acute criteria
mean conc. compared to chronic criteria
Lead- Pb
Smithfield WWTF outfall
S1
S2
S3
S4
S5
Assapumpset Brook
CSO Reach
Seg 10A acute 11.90Seg 10B acute 13.45 Seg 10C acute 17.04Seg 10D acute 21.81Seg 01 acute 26.74Seg 01 chronic 1.04
max 4.08max 2.9
WR1 WR3A WR5 WR6 WR7WR7B
WR8 WR9
WR10
WR12 WR13
WR15
Seg 10A chronic 0.46
Seg 10B chronic 0.52
Seg 10C chronic 0.66
Seg 10D chronic 0.85

37
Figure 3.11 Wet weather dissolved Zn concentrations in the Woonasquatucket River. Average wet weather dissolved Zn concentrations ranged from 7.09 ug/l to 28.06 at stations in the mainstem Woonasquatucket (Figure 3.11). A slight elevation in Zn was measured downstream of the WWTF with a more notable increase observed at Allendale Avenue (RM 6.3) located just downstream from outfall S2, located at the Route 44 Bridge in North Providence. Dissolved Zn concentrations at sampled stormwater outfall sources (S1-S5) were significantly elevated relative to concentrations in the mainstem. The average wet weather Zn concentration at outfalls S4 and S5, located at Mancini Drive in Providence, was 129.7 and 79 ug/l, respectively. The acute Zn criteria are violated at RM 12.0 (outlet of Stillwater Reservoir Dam) and RM 0.7 (Bath Street). Acute and chronic Zn criteria are met at all remaining instream stations. Both acute and chronic Zn criteria are met at the mouth of Assapumpset Brook. Summary of Present Waterbody Condition
The existing fecal coliform bacteria data confirm water quality impairments under both steady state and wet weather conditions. The geometric mean and 90th percentile statistics presented in Table 3.2 demonstrate that under existing conditions, the majority of the river does not support designated uses. Further examination of Table 3.2 indicates significant differences in water quality between CSO and non-CSO impacted reaches. Statistics presented below in Table 3.4 highlight these differences.
River Mile (distance from mouth)
0.01.02.03.04.05.06.07.08.09.010.011.012.013.0
Con
cent
ratio
n in
ug/
l
0
10
20
30
40
50
60
70
80
90
100
110
120
130
140
maximum conc. compared to acute criteria
mean conc. compared to chronic criteria
Seg 10A acute 32.24Seg 10B acute 35.34Seg 10C acute 42.25Seg 10D acute 50.93Seg 01 acute 59.46
Zinc- Zn
Smithfield WWTF outfall
S1
S2
S3
S4
S5
Assapumpset Brook
CSO Reach
max 209.0
max 287.0
max 129.0
max 124.0
WR1 WR3A
WR5
WR6WR7
WR7B WR8 WR9
WR10WR12 WR13
WR15
Seg 10A chronic32.5
Seg 10B chronic35.63
Seg 10C chronic42.59
Seg 10D chronic51.34
Seg 01chronic59.94

38
Table 3.4 Fecal coliform bacteria summary in selected reaches of the Woonasquatucket River.
Reach
Average DW
Geometric Mean (fc/100ml)
Average DW 90th
Percentile Value (fc/100ml)
Average WW
Geometric Mean (fc/100ml)
Average WW 90th Percentile
Value (fc/100ml) Non CSO1 265 2228 1343 6653
CSO impacted2 738 10214 2651 48431 1Reach extends from headwaters of Woonasquatucket River to Glenbridge Avenue. 2Reach extends from Glenbridge Avenue to confluence with Moshassuck River.
Acute and chronic dissolved Cd criteria were met at all stations in the Woonasquatucket River and Assapumpset Brook during both steady state and wet weather conditions. Sampled point sources did exhibit elevated levels of dissolved Cd, however no violations occurred at downstream stations.
One violation of acute Cu criteria occurred in the mainstem Woonasquatucket at RM 0.7 (Bath Street in Providence). This violation occurred under high flow conditions and within the CSO reach. No other violations of Cu exist. Point source concentrations of dissolved Cu were, on average, an order of magnitude larger than in-stream concentrations. The largest instream increases in dissolved Cu occur downstream of the Smithfield WWTF.
Dissolved Pb concentrations in the mainstem tended to increase in a downstream direction under both low and high flow assessments. No low flow violations of acute Pb criteria exist, however dissolved Pb concentrations do increase downstream of the Smithfield WWTF and within the CSO reach. One violation of the acute Pb criteria occurred under high flow conditions at Bath Street (RM 0.7) in Providence. All other acute Pb criteria are met within the mainstem and Assapumpsett Brook.
Violations of the acute Zn criteria occurred in the mainstem Woonasquatucket during low flow conditions at the following stations: RM 3.2 (Merino Park-WR10), and RM 0.7 (Bath Street-WR15). Two violations of the acute Zn criteria occurred during wet weather. The violations exist at RM 12.0, at the outlet of the Woonasquatucket Reservoir in Smithfield, and at RM 0.7 at Bath Street in Providence. Point sources exhibited elevated levels of Zn. Several of these sources appear to contribute directly to violations of either acute or chronic Zn criteria. Table 3.5 Wet weather dissolved metals summary within and outside of the CSO reach.
Metal Non-CSO Reach CSO Reach Mean (ug/l) Maximum (ug/l) Mean (ug/l) Maximum (ug/l) Cd 0.01 0.02 0.03 0.09 Cu 1.07 1.85 2.38 4.31 Pb 0.22 0.49 0.81 2.0 Zn 11.78 22.26 17.48 38.75

39
4.0 Pollution Sources Sources of dissolved metals and fecal coliform bacteria in the Woonasquatucket River watershed were identified through review of historical information, water quality surveys conducted during dry and wet weather conditions, and through targeted inspection and sampling of storm drain systems and facilities throughout the watershed. General conclusions about sources of Cd, Cu, Pb, and Zn can be made based on the similarity of the identified sources of metals in urban runoff gleaned from similar studies throughout the region and the country. If the major sources of these metals in urban runoff are similar in all urban areas, a reasonable assumption is that the same sources are present in the Woonasquatucket River watershed. TMDL staff reviewed existing data within the Department, focusing on information available from the RIPDES permitting, Solid Waste, and Compliance and Inspection (OCI) programs. TMDL staff reviewed available information from cities and towns, and the Department of Transportation to identify storm drain network and outfall information. This information, gleaned mainly from as-built drawings, was used to estimate flow networks and sub-catchments associated with storm drains discharging to the river. TMDL staff then conducted surveys of stormwater catchments considered to be significant (based on size and land use) to establish monitoring stations for the wet weather surveys. In the combined sewer area, TMDL staff examined historical water sampling data collected by the NBC to examine the dry and wet weather status of the river. This information was combined with operating reports submitted by NBC to examine the dry weather performance of CSOs along the lower river. TMDL staff followed up with site inspections that included inspections of the structures with NBC maintenance crews and discussions with NBC staff. These were followed by riverbank surveys, detailed examination of CSO structures, and inspections of significant facilities and mills in the CSO service area. Water quality surveys were conducted along the length of the river during dry and wet weather. All dry weather surveys were carried out by DEM staff and wet weather surveys were conducted by DEM, NBC, and LBG staff. Two wet weather surveys conducted during September 2001 and September 2002. DEM staff also conducted a number of follow-up surveys to identify potential sources, particularly between Route 44 and the Allendale Dam. Sources of bacterial and metals contamination to the Woonasquatucket River include stormwater runoff; dry weather urban runoff; dry and wet weather CSO discharges; treated effluent from the Smithfield WWTF; discharges from miscellaneous pipes and outfalls draining commercial and industrial land uses; and pet, wildlife, and vermin waste. Groundwater and sediment contamination may also be a potential source of dissolved metals to the river. Actual and potential sources are summarized in Table 4.1 and are discussed below.

40
Table 4.1 Actual and potential sources of pollution to the Woonasquatucket River. Source Location / Explanation
Stormwater Runoff
Throughout watershed particularly in Esmond area of Smithfield, all of North Providence, Johnston, and Providence. Contaminated runoff from industrial, commercial, urban parking lots, streets, roofs, and runoff contaminated with residential and feral pet and vermin wastes. Heavy metals (Cd, Cu, Pb, and Zn), pet and vermin waste, and litter are all transported to the nearest storm drain or drainage swale and are eventually delivered, untreated, into the Woonasquatucket River.
Wet and Dry Weather CSO Discharges
(City of Providence)/ CSO reach from Glenbridge Avenue to confluence with Moshassuck River. Combined sewers carry sanitary waste and stormwater runoff. CSO discharges contain municipal and industrial wastes, floating debris, and pathogens, stormwater runoff, and raw sewage. Dry weather CSO discharges occur as a result of blockages from debris and garbage, structural failures, and improperly engineered outfalls.
Urban Runoff from Dry Weather
Watershed-Wide Flows resulting from various urban land use practices that cause water to enter storm drains (MS4s) including lawn irrigation runoff, car washing, sidewalk washing and commercial pavement washing. These urban flows can initially contain metals and may also accumulate metals as they travel across other urban surfaces, transporting them to the MS4 system and the Woonasquatucket River.
Pet and vermin waste
Watershed-Wide Pet waste left to decay on streets, sidewalks, or on grass near the street may be washed into storm sewers by rain or melting snow. Vermin and feral cats and dogs, attracted by urban litter, food, and debris, congregate and waste is washed directly into the Woonasquatucket.
Wildlife Watershed-Wide Contamination from geese, ducks, raccoons, deer, etc.
Urban litter Watershed-Wide particularly in Greystone, Centerdale, Allendale, Lymansville, Manton, Dyerville, Olneyville and Smith Hill. Urban litter, garbage, and debris blocks can lead to dry weather CSO discharges and wet weather CSO blockages, attracts vermin and stray animals, which are a source of bacteria.
Smithfield WWTF
Smithfield WWTF discharges to the Woonasquatucket River at Greystone Mill Pond. Effluent from the WWTF contains elevated levels of Cd, Cu, Pb, and Zn. The WWTF does not meet its current permit limits for Total Cu and Zn. DEM RIPDES Program has issued a consent agreement with interim limits and compliance schedules. The facility is meeting its fecal coliform bacteria limits and therefore is not considered a source.
Metals Recycling L.L.C.
Metals Recycling L.L.C. located in Johnston, RI has historically been a primary point source for dissolved metals discharging to the Woonasquatucket via a small unnamed stream to the Woonasquatucket River near Glenbridge Avenue. DEM metals sampling has documented elevated levels of Cd, Cu, Pb, and Zn being discharged from this outfall during both dry and wet weather.
Miscellaneous Discharges
The Region 1 EPA Office of Environmental Measurement and Evaluation (OEME) surveyed the river in July-August 1998 and found a total of 317 pipes discharging from 180 locations along the Woonasquatucket downstream of Georgiaville Pond. EPA found 57 of the pipes flowing in dry weather during their survey. A follow-up review by DEM uncovered additional pipes that did not discharge directly to the river. It is certain that additional pipes that discharge to tributaries and storm drains also exist. These pipes fall into three general groups: inactive or vestigial discharge pipes from mills, storm drains, and miscellaneous pipes. These pipes may be a source for pathogens, and dissolved metals.
Groundwater and Sediment Contamination
Watershed-Wide Numerous CERCLA, LUST, and State Remediation Sites exist in the watershed. Many of these sites are the result of historical land uses and associated contamination of groundwater and sediments has been documented. Elevated metal concentrations have been documented at several sites but the effects of the movement of metal-enriched groundwater on metal loading in the river are unclear.
Septic System Failures
Watershed-Wide/ Failing or improperly designed or installed on-site septic tanks and/or drainfields that allow discharge of partially treated effluent to groundwater or surface water.
Sewage Leaks and Spills
Watershed-Wide Sporadic sewage line blockages convey untreated sewage to storm drains. The Woonasquatucket Interceptor also surcharged on an unknown number of occasions, discharging sewage to the river. Wastewater ISDS.
Illegal Sources Watershed-Wide More frequently in urbanized areas of Providence, Johnston, and North Providence. Automotive coolant dumping, oil dumping, and dumping of other deleterious substances occur in the Woonasquatucket River watershed.
4.1 Stormwater Runoff Stormwater runoff is a significant and ubiquitous source of pollution to the Woonasquatucket River and its tributaries, particularly in the more urbanized areas of Providence, North Providence, and Johnston. Storm sewers

41
within the watershed rapidly collect, concentrate and route polluted runoff from streets and highways directly to the river. Stormwater is also generated from urban areas, parking lots, and commercial and industrial areas and is conveyed directly to the Woonasquatucket River via overland flow or other conveyance. The storm drain network in the watershed is extensive, and in many areas is not adequately mapped. The Region 1 EPA Office of Environmental Measurement and Evaluation (OEME) surveyed the river in July-August 1998 and found a total of 317 pipes discharging from 180 locations downstream of Georgiaville Pond. EPA found 57 of the pipes flowing in dry weather during their survey. Many of these outfalls convey stormwater directly to the river. A follow-up review by DEM uncovered additional pipes that did not discharge directly to the river. It is certain that additional pipes that discharge to tributaries and storm drains also exist. Two separate storm events were sampled in 2001 and 2002. Point source sampling was conducted at five large stormwater outfalls, each representing specific land uses within the basin. Land uses included industrial, commercial, and high to medium density residential development. Figure 3.1 details the location of these outfalls within the basin and Table 4.2 provides a summary of pollutant concentrations measured during both storm events.
Table 4.2 Wet weather stormwater outfall sampling locations and data summary.
Outfall
Location
Predominant Catchment Land Use
Fecal Coliform (fc/100ml)
Dissolved Cd (ug/l)
Dissolved Cu (ug/l)
Dissolved Pb (ug/l)
Dissolved Zn (ug/l)
S-1
Tributary on Riverside Drive and Kenton Street located in Smithfield.
Drains Route 44 and adjacent commercial and medium density residential development
Max 240,000 Mean 83,280
Max 0.073 Mean 0.043
Max 5.80 Mean 2.97
Max 0.860 Mean 0.337
Max 45.00 Mean 26.97
S-2
36-inch RCP located at Route 44 Bridge in North Providence.
Drains Route 44 and adjacent commercial development
Max 110,000 Mean 72,500
Max 0.139 Mean 0.073
Max 16.00 Mean 6.42
Max 2.32 Mean 0.993
Max 209.00 Mean 76.48
S-3 Woonasquatucket
Avenue outfalls, Channel adjacent to Lee Romano Ball Field Access Road in North Providence
Three outfalls draining high-density residential and commercial development
Max 75,000 Mean 25,300
Max 0.212 Mean 0.070
Max 24.00 Mean 10.82
Max 2.04 Mean 1.20
Max 287.00 Mean 76.27
S-41 Outfall located off
Mancini Drive in Providence. 72” RCP.
Drains W6 area businesses and Metals Recycling L.L.C. Inc.
Max 93,000 Mean 37,400
Max 0.207 Mean 0.130
Max 12.00 Mean 9.29
Max 2.94 Mean 2.56
Max 227.00 Mean 110.8
S-5
Outfall located off Mancini Drive in Providence. 60” RCP.
Drains Route 6 and high-density residential and commercial development
Max 31,000 Mean 10,900
Max 0.145 Mean 0.086
Max 9.60 Mean 6.96
Max 2.02 Mean 1.25
Max 124.00 Mean 83.20
1 Exhibits dry weather flow
Many studies have been conducted to identify the sources of metals in stormwater runoff. Muschack (1990) identified metal sources in urban runoff that included automotive exhaust gasses, tire abrasion particles, brake lining abrasion dust, lubricating oils and greases and abrasion of roadways. The various sources of metals found in an urban watershed were detailed in a 1992 study in Santa Clara Valley by Woodward-Clyde (1992). Major sources of several metals, including copper, lead, and zinc, were identified and a percentage of the total annual load for each metal was attributed to each major source. The top sources of copper were found to be brake pads, POTWs, natural erosion, reservoir releases, and corrosion of water supply infrastructure. Major sources of lead were tailpipe emissions, natural erosion, brake pads, reservoir releases, and POTWs. The primary sources of zinc

42
were POTWs, tires, natural erosion, industry with metal processes, and brake pads. Table 4.3 summarizes the following sources of copper, lead, and zinc in urban runoff as taken from a major USEPA study conducted in 1993 (USEPA 1993).
Table 4.3 Anthropogenic constituents in urban runoff (from USEPA 1993). Constituent Primary Source Copper Metal plating, bearing and bushing wear, moving engine parts, brake lining wear, fungicides, insecticides Lead Automotive emissions, tire wear (lead oxide filler material), lubricating oil and grease, bearing wear, brake
lining wear, engine wear Zinc Tire wear (filler material and accelerator in vulcanization process as zinc oxide 0.73%), motor oil
(stabilizing additive), grease, metal plating erosion, engine wear Stormwater from industrial sources may also be a significant source of Cu, Cd, Pb, and Zn in the Woonasquatucket River, especially facilities that handle, process, or store metals that may be exposed to rainfall. These facilities would be included in both the heavy industry and light industry land uses. A study done in Santa Clara California (Woodward Clyde 1992) identified industries with potential to allow metals to enter stormwater discharges and was based on professional knowledge of processes that result in metals being exposed to stormwater. The industries that were prioritized as having the highest likelihood to discharge quantities of metals in stormwater included metal plating, industrial machinery, trucking, metal scrap industry, metal scrap industry combined with used auto part sales, automobile repair, and galvanizing and metal coating. Because of the similarities between land uses in the Santa Clara study and the Woonasquatucket, any of the same industries in the Woonasquatucket River watershed are likely to be potential metal contributors.
4.2 Combined Sewer Overflows (CSOs) A combined sewer system (CSS) is a wastewater collection system owned by a municipality (as defined by Section 502(4) of the Clean Water Act) that conveys domestic, commercial, and industrial wastewater and stormwater runoff through a single pipe system to a publicly-owned treatment works (POTW). A CSO is defined as a discharge from a point prior to the POTW treatment plant. CSOs generally occur in response to wet weather events. During wet weather periods, the hydraulic capacity of the CSS may become overloaded, causing overflows to receiving waters at discharge points within the CSS. Fourteen (14) CSOs discharge into the Woonasquatucket River downstream of Glenbridge Avenue (Figure 2.1). The management of these CSOs is the responsibility of the Narragansett Bay Commission, a POTW which is responsible for the combined sanitary and storm sewers, sanitary sewers, and the wastewater treatment plants at Fields Point and Bucklin Point. NBC’s service area encompasses the metropolitan Providence and Blackstone Valley areas, which include Providence, North Providence, Johnston, Pawtucket, Central Falls, Cumberland, Lincoln, the northern portion of East Providence and small sections of Cranston and Smithfield. CSO discharges include a mix of domestic, commercial, and industrial wastewater and stormwater runoff. As such, CSO discharges contain human, commercial, and industrial wastes as well as pollutants washed from streets, parking lots, and other surfaces. Examination of Tables 3.2 through 3.4 and Figures 3.8 through 3.11 provides compelling evidence that CSO discharges impair water quality in the lower reach of the Woonasquatucket. The average wet weather fecal coliform geometric mean for the mainstem Woonasquatucket within the CSO reach is double that of the upstream non-CSO impacted reach. Both mean and maximum dissolved Cd, Cu, Pb, and Zn values within the CSO reach are markedly higher than those in the non-CSO reach (Table 3.5).

43
Wet Weather CSO Discharges
CSOs have a significant impact on water quality during wet weather events in the Woonasquatucket River. Among the principal pollutants in CSOs are microbial pathogens and toxics, such as oil and pesticides that wash from streets into the sewer system during a rain or snowmelt event. Microbial pathogens include hundreds of different types of bacteria, viruses, and parasites. Toxics present in CSO discharges include metals (such as cadmium, lead, mercury, silver, and zinc) and synthetic organic chemicals -- such as PCBs and pesticides. These pollutants come from a variety of sources in the Woonasquatucket River watershed. Domestic wastewater contains microbial pathogens, BOD, TSS, and nutrients. Wastewater from commercial and industrial establishments can contribute pollutants such as dissolved metals and synthetic organic compounds. Pollutant concentrations associated with CSO discharges are highly variable. DEM did not sample CSO discharges for fecal coliform bacteria or dissolved metals, however Table 4.4 presents a summary compiled by the USEPA of existing pollutant data from CSOs as well as urban stormwater runoff (EPA 2004). Table 4.4 also includes wet weather data collected from CSO outfall 054 which discharges to the Woonasquatucket River at Sheridan Street in Providence It has been determined that wet weather CSO discharges in the Woonasquatucket occur, on average, approximately 70 times a year.
Table 4.4 Typical pollutant concentrations from CSOs and urban stormwater. Municipal Source
Fecal Coliform (colonies/100ml)
Cadmium (ug/l)
Copper (ug/l)
Lead (ug/l)
Zinc (ug/l)
CSOs1 Median 215,000 2.0 40.0 48.0 156.0 Range 3-40,000,000 0.16-30 10-1,827 5-1,013 10-3,740 Urban Stormwater1
Median 5,081 1.0 16.0 16.0 117.0 Range 1-5,230,000 0.04-16,000 0.6-1,360 0.2-1,200 0.1-22,500
NBC CSO-0542
Median 916,667 0.30 21.7 36.6 81.0 Range 220,000-2,100,000 0.11-0.55 10.2-38.6 16.6-85.1 40.5-133.0
1Source: 2004 Report to Congress “Impacts and Control of CSOs and SSOs”. EPA Publication # EPA 833-R-04-001 2Source: NBC wet weather CSO sampling conducted at CSO-054 (Sheridan Street in Providence) on Dec 23, 2004 and November 21-22, 2005. Median value for metals is reported as an average of samples during two events. Fecal coliform was sampled only during the 2005 study and is reported as a mean value. Dry Weather CSO Discharges
Dry weather discharges from CSOs impact water quality in the lower sections of the Woonasquatucket River. Periodic dry weather discharges occur with regularity at CSO’s 046, located at Eagle Street, 053, located at Hartford Ave, and 054, located at Sheridan Street. NBC is required to report all dry weather bypass events to DEM within 24 hours of the start of the event, including estimated time of start and end of overflow, cause of overflow, estimated volume discharged, and treatment applied. Table 4.5 summarizes dry weather bypass events for CSOs discharging to the Woonasquatucket River for the years 2002 through 2004, including a recent event in Feb 2005. The majority of dry weather bypasses occur as a result of blockages or partial obstruction of slots in the diversion structures. Most blockages or obstructions are due to debris, grease, and other litter and floatables. Review of NBC reports supports this conclusion. The reported intermittent blockages and resulting dry weather overflows correlate with short-term elevations in downstream fecal coliform bacteria levels measured by NBC staff, thus confirming this source.

44
Table 4.5 Reported dry weather combined sewer overflow events in the Woonasquatucket River.
Period Number of
Events Estimated Volume
Discharged (gallons)
Major Causes of Events July 2002 through Dec 2002 17 479,600 Jan 2003 through June 2003 14 302,400 Jan 2004 through June 2004 16 5.4 million July 2004 through Dec 2004 14 292,000 February 2, 2005 1 860,000 Mar 2005 through June 2005 6 65,000 June 2005 through Dec 2005 6 1 million Jan 2006 through June 2006 12 193,615 July 2006 through Dec 2006 2 31,600
Regulators blocked with debris, grease, and solids stuck in connector pipes
DEM staff investigated the structural integrity of many of the CSO outfalls in the lower mainstem. Information gleaned during these surveys provided insight into the role played by litter and other debris from streets, parking lots, and other areas in contributing to bacterial impairments in the river. TMDL staff found that litter and other debris in the service areas would block diversion structures in the interceptor line causing a backup and subsequent slow release after the cessation of a wet weather event. Retention and eventual release of sewage and stormwater due to initial CSO placement or design was another issue identified by TMDL staff. Dry weather CSO discharges were also found to occur at some sites, even though the diversion structures were not blocked. Structural and/or siting deficiencies may create the opportunity for dry weather discharges of fecal coliform bacteria into the Woonasquatucket River. The area encompassing CSO-054 is an example of such a problem. This CSO is partially enclosed by a retaining wall that retains a large volume of water. After a CSO discharge, sewage may be trapped within this retaining wall and therefore allowed to slowly discharge for several days after a discharge event. There had been a problem with refuse such as shopping carts collecting in this area behind the retaining wall. Aside from this specific CSO, several other CSOs are partially submerged in the river. This allows for the temporary storage of fecal material in CSO structures. This material may then discharge to the river for days after the initial discharge event.
4.3 Miscellaneous Outfalls Staff from Region 1 EPA Office of Environmental Measurement and Evaluation (OEME) surveyed the Woonasquatucket River in July-August 1998 and identified a total of 317 pipes discharging from 180 locations downstream of Georgiaville Pond. EPA found 57 of the pipes flowing in dry weather during their survey. A follow-up review by DEM uncovered additional pipes that did not discharge directly to the river. It is certain that additional pipes discharging to tributaries and storm drains also exist. These pipes fall into three general groups: inactive or vestigial discharge pipes from mills, storm drains, and miscellaneous pipes. Several non-permitted pipes were found during DEM surveys. These surveys brought a number of issues to light. These included sewage leaks, principally associated with plugged sewer lines that overflowed into storm drains, unsanitary practices at some businesses (e.g. washing out trucks on the pavement at a meat processing facility), illegal tie-ins, and failing septic systems. Several specific instances were noted and are corrected or are in the process of being corrected including a gray water connection at EPA pipe #158 (also referred to as S1 and located at Riverside Ave in North Providence), several pipes at the Atlantic Mills complex, and relict pipes at industrial facilities and mills throughout the watershed. DEM Permitting staff investigated several of these pipes and have notified several individuals that they would need to apply for a RIPDES permit. Field inspections by DEM staff revealed several storm drains that were discharging in dry weather. At least one discharge resulted from an illegal graywater connection. Any incident of a dry weather discharge was forwarded to the Office of Compliance and Inspection for additional investigation.

45
4.4 Smithfield Wastewater Treatment Facility The Town of Smithfield owns the Regional Wastewater Treatment Facility located on Esmond Mill Drive in Smithfield, Rhode Island. The discharge to the Woonasquatucket River consists of treated domestic and industrial wastewater contributed by the municipality of Smithfield. Treatment consists of screening/grinding, primary settling, activated sludge employing the A2O process, secondary clarification, disc filtration, chlorination and dechlorination. The WWTF has a design capacity of 3.5 MGD with an average daily flow of 1.75 MGD. Fecal coliform limits are based on Rhode Island requirements for Publicly Owned Treatment Works (POTWs) under Rule 17.04(b) of the RIPDES Regulations and as provided in 40 CFR 123.25. Applicable permit limitations for the WWTF are presented in Table 4.6. Table 4.7 provides a summary of discharge monitoring data for the Smithfield WWTF from 1999 to March 2005.
Table 4.6 Current1 Permit Limitations for the Smithfield Wastewater Treatment Facility. Parameter Monthly Average Weekly Average Daily Maximum Flow 3.5 MGD Fecal Coliform 200 MPN/100ml 400 MPN/100ml 400 MPN/100ml Total Cd 0.68 ug/L 1.46 ug/l Total Cu 3.28 ug/l 5.39 ug/l Total Pb 0.97 ug/l 24.93 ug/l Total Zn 47.5 ug/l 54.43 ug/l
11999-2006. Final permit expected to be issued spring 2007.
Table 4.7 Effluent Summary for Smithfield Wastewater Treatment Facility (1999-2005). Flow (MGD)
Total Cd (ug/l)a
Total Cu (ug/l)a
Total Pb (ug/l)a
Total Zn (ug/l)a
Fecal Coliform (MPN/100ml)
1.86 0.411 13.711 2.111 45.701 7.951
0.423 19.633 3.163 65.153 17.52
1 monthly average 2 weekly average 3 daily maximum
The facility’s monthly and weekly reported fecal coliform effluent concentrations are lower than both the geometric mean value at the most upstream station at Esmond Mill Drive (RM 8.3) and its current permit limitations are listed in Table 4.5. Therefore, effluent from the plant does not constitute a significant fecal coliform source to the Woonasquatucket River. Water quality based effluent limitations for dissolved metals, as they appear in the 1999 permit issued for the Smithfield WWTF were established on the basis of acute and chronic aquatic life and applicable human health criteria, as stated in DEMs Water Quality Regulations. A 1999 comparison of the Discharge Monitoring Report (DMR) and User Fee data sets with the final permit limitations indicated that the treatment facility was unable to attain the final permit limitations for the daily maximum and monthly average limits for either Cu or Zn. As a result, DEM and the Town of Smithfield entered into a Consent Agreement, details of which are provided in the Implementation section the TMDL. Figures 3.4 through 3.7 demonstrate that any downstream increases in dissolved Cd, Cu, Pb, and Zn concentrations associated with effluent from the WWTF have dissipated by approximately 0.5 km downstream, as represented by the first downstream station, WR5, where no violations in metals criteria were observed.
4.5 Metals Recycling LLC. Metals Recycling, L.L.C., located off Celia Street in Johnston, owns and operates a facility used for the recycling of scrap metal. Operations conducted at the facility include processing, separating, sorting, and stockpiling scrap

46
metal and associated by-products. As part of these operations, automobiles are transported to the facility, hazardous materials and automotive fluids are removed from the vehicles, the vehicles are shredded, and the shredded materials are sorted prior to being transported off-site for further processing. In accordance with Rule 32(b)(3)(I)(A) of the RIPDES Regulations, it has been determined that the facility is a significant contributor of pollutants and has, therefore, been required to obtain an individual RIPDES permit. Figures 3.4 through 3.7 show significant dry weather increases in dissolved Cd, Pb, and Zn downstream of the S4 outfall. The S4 outfall drains wetland area, including a waste disposal lagoon, within the Metals Recycling L.L.C. facility. The S4 outfall discharges during both dry and wet weather with flow resulting from a combination of groundwater and upstream surface water sources. A pollutant summary for the S4 outfall is presented below in Table 4.8. These data are taken from wet weather investigations by DEM, LBG, Inc. and NBC. Table 4.8 Pollutant Summary for the S4 outfall, located off Mancini Drive in Providence.
Pollutant
Statistic Fecal coliform Dissolved Cd Dissolved Cu Dissolved Pb Dissolved Zn
Mean Value 47600 fc/100ml 0.130 ug/l 9.29 ug/l 2.56 ug/l 110.8 ug/l
Maximum Value 93000 fc/100ml 0.207 ug/l 12.0 ug/l 2.94 ug/l 227.00 ug/l Metals Recycling L.L.C. currently holds a RIPDES permit (RI0023485) authorizing them to discharge treated stormwater to the Woonasquatucket River from the S4 outlet. Details of this Permit are presented in the Implementation section of this report. As stated earlier, S4 discharges during both dry and wet weather. During the preparation of this TMDL, and on numerous occasions, DEM staff observed discolored discharge from the S4 outlet.
4.6 Minor Permitted Discharges Five minor permitted discharges in the Woonasquatucket River are listed below in Table 4.9. There were no water quality impairments associated with the permitted discharges listed in Table 4.9. Table 4.9 Minor Permitted Discharges to the Woonasquatucket River.
Permittee Permit Number Location Industry Discharge Parameters Sampled
ABC Realty Company RI0023019
39 Manton Avenue Providence
Manufactures elastic clothing Condensed steam from oil heaters and boiler blowdowns
Flow, Temperature, pH, Oil and grease
Induplate, LLC RIG250006
1 Greystone Drive N. Providence
Nickel and Chrome plating of parts used in the automotive, aircraft, jewelry and tooling industries
Non-contact cooling water Flow, Temperature, pH
Parcel 2- Capitol Center Project
RI0023647
18 American Express Plaza Providence
RIDOT Construction dewatering project
Construction dewatering to groundwater
Flow, Total petroleum hydrocarbons, Tetrachloroethylene, Trichloroethylene
RI Freight Rail Improvement Project
RI0023582
Rt. 6 and Broadway Providence
RIDOT Construction
Construction dewatering associated with RI Freight Rail Improvement Project
Total Cd, Total Cr, Total Pb
Worcester Textile Company
RI0020401 1 Greystone Ave N. Providence
Manufactures yarns and worsted cloth Boiler blowdown Flow, Temperature,
pH

47
4.7 Groundwater and Sediment Contamination Groundwater may be a natural and/or anthropogenic source of metals to the Woonasquatucket River. Subterranean flows may seep directly through the riverbed or surface at other points within the floodplain. Groundwater may contain naturally occurring dissolved metals concentrations, or enriched concentrations from overlying metals contaminated soils that contribute to exceedances of metals water quality criteria in the Woonasquatucket River. Groundwater discharges to storm drains or directly to the river provide an uninterrupted pathway for dissolved metals to the river. However, groundwater flows and their contribution to the Woonasquatucket River are poorly characterized. Sediment release of toxic metals to the water column represents another likely source of contamination to the Woonasquatucket River-particularly the lower river which has received years of contaminated discharges, including sediments, from combined sewer systems. The fate of toxic metals in river sediments depends on a combination of the physical, chemical, and biologic conditions. These conditions may vary dramatically, both spatially and temporally, in response to factors ranging from seasonal changes and storm events to human activities such as dredging or remediation efforts. In addition, the movement of contaminants, including pesticides, heavy metals, etc., is influenced by factors such as sorption, redox gradients, and pH, which in turn are greatly influenced by microbial communities and their activities (Ford et al. 2005). The bacterial community metabolism can affect valence states of metals via oxidation/reduction reactions, thereby altering the chemical speciation, fate, and the ultimate toxicity of the contaminant (Ford et al. 2005). One (1) Comprehensive Environmental Response, Compensation, and Liability Act (CERCLA) site, Eight (8) Leaking Underground Storage Tank (LUST), and approximately 15 State Remediation Sites exist within 200 feet (61 m) of the mainstem of the Woonasquatucket River. Many of these sites are the result of historical land uses and associated contamination of groundwater and sediments has been documented. The effects of the movement of metal-enriched groundwater on metal loading in the river are unclear. A detailed study of the transport and fate of toxic metals from groundwater and sediment in the Woonasquatucket was beyond the scope of this project. Remediation of contaminated groundwater and sediment are discussed further in the Implementation section of this report. In general, these projects are overseen by DEM’s Office of Waste Management.
4.8 Failing septic systems During the TMDL study, several failing septic systems were identified throughout the watershed (Figure 4.1). A specific problem was encountered near Route 44 in Johnston. A failing septic system located adjacent to a storm drain that discharged directly to the Woonasquatucket was identified. Intermittent problems were observed at the discharge pipe from this storm drain system. RIDEM staff concluded that the failing septic system was contributing to the decrease in water quality at this site. The problem was referred to DEM Office of Compliance and Inspection, however the source was not located and was referred to RIDOT for follow-up investigation. The location of other documented failed septic systems in the Woonasquatucket River watershed is shown in Figure 4.1. Even failing septic systems located away from the direct vicinity of the river, may impair water quality in the river.

48
Figure 4.1 Documented ISDS Failures in the Woonasquatucket River Watershed (2000).
Other sewage leaks DEM staff have observed intermittent leaks occurring in sewer pipes that are adjacent to the Woonasquatucket River. Any leaks or discharges are reported to the Office of Compliance and Inspection. These types of problems are very difficult to quantify as they are intermittent and sporadic in nature, and depending on the size and duration of the leak, will have varying spatial and temporal effects on overall downstream water quality.
4.9 Domestic animal and vermin waste Pet waste left to decay on streets, sidewalks, or on grass near the street is often washed into storm sewers by rain or melting snow. Dogs in particular are likely a major source of fecal coliform bacteria, given their population density and daily defecation rate. DNA fingerprinting techniques have clearly shown pet waste to be a major contributor of bacteria in urban and suburban watersheds. A study by Lim and Oliveri (1982) found that dog feces were the single greatest source contributing fecal coliform and fecal strep bacteria in highly urban Baltimore catchments. Trial et al. (1993) reported that cats and dogs were the primary source of fecal coliforms in urban subwatersheds in the Puget Sound Region. Bacterial source tracking studies in a watershed in the Seattle, Washington area found that nearly 20% of the bacteria isolates that could be matched with host animals were

49
matched with dogs (Samadpour, M. and N. Checkowitz, 1998). A study conducted by the Washington State Department of Ecology determined that in an area with a population of approximately 100,000 individuals, dogs were found to generate approximately two and a half tons of feces per day, equating to nearly two million pounds per year. DEM staff observed significant amounts of pet waste in areas frequented by people walking their dogs in municipal parks and around apartment complexes throughout the watershed. Many of these areas are located directly adjacent to the river. Numerous unleashed dogs have frequently been observed roaming residential areas in Olneyville, Allendale, and Centerdale. Vermin and feral cats and dogs are attracted by urban litter, food, and debris, and congregate in and around overflowing dumpsters, grease containers near restaurants, and debris and litter piles. Some specific examples include the area surrounding CSO-054 where the collection of debris attracted a large population of rodents (NBC has subsequently cleaned this area), the area adjacent to Mancini Drive where garbage dumping may also attract large numbers of rodents and feral dogs and cats, and in Onleyville Square area where accumulated trash and dumpsters located close to the rivers edge has attracted large rodent populations. DEM staff have located several areas where open and overflowing dumpsters appear to have been raided by animals and waste was observed nearby. Many of these commercial areas directly border the river and evidence of washoff was apparent. Overflowing dumpsters and accumulated trash occur with significant regularity at the Rent a Center located on Hartford Avenue in Providence, Price Rite located at Manton Avenue, as well as the 99 Cent store, located next to the Price Rite located in Providence. These areas have been observed by the Woonasquatucket River Watershed Council to have chronic waste disposal problems.
4.10 Wildlife and Waterfowl Wildlife and waterfowl may play a role in the elevated bacteria concentrations in upstream portions of the river as well as in the numerous impoundments along the mainstem. A specific example is the area between the Greystone Dam and Allendale Dam. Elevated fecal coliform bacteria levels occur in this area during dry weather in the absence of any point sources. Large populations of swans and ducks were observed by TMDL staff in this area, particularly in Allendale Pond. Increases in fecal coliform bacteria concentrations in this area may be attributed to these waterfowl populations. RIDEM staff also observed large pigeon populations under bridges at several bridge crossings in the watershed, particularly at Providence Place Mall. Areas under the bridges were littered with pigeon waste so it may be assumed that some of this waste material is being deposited directly into the river. Raccoons have also been observed along the more urbanized reaches of the Woonasquatucket River. DEM staff have observed raccoons near CSO outfalls and other large discharge pipes. It is likely that raccoons have adapted to an underground habitat within storm drain-pipes, and use ledges in stormdrain inlets on a temporary basis.
4.11 Urban litter Trash, urban litter, and other non woody debris remains one of the watershed's most highly visible and aesthetic problems. Trash and non-woody debris, which enter the watershed's tributaries and tidal river largely through urban storm drain systems and illegal dumping, can have chemical and biological impacts on receiving waters including: interference with the establishment of aquatic plants, leaching of toxics from certain types of trash such as used oil filters and batteries, and floating trash hazards to wildlife through ingestion of or entanglement in floating debris (Herson-Jones et al., 1994). Urban litter, illegal dumping, and poor residential and commercial waste management practices contribute to water quality impairments in several ways:
• Litter and debris accumulate along streets and gutters eventually ending up in the storm drain and combined sewer systems. DEM, NBC, and City of Providence staff routinely find trash and debris blocking CSO and stormwater outfall structures. These blockages contribute to dry weather CSO discharges and subsequent bacterial impairments.

50
Trash blockages at the entrance to the orifice of the interceptor increase the head loss through the orifice and cause the majority of unnecessary overflows in passive regulators. In February 2005, a dry weather CSO overflow event in the lower Woonasquatucket River occurred which resulted in a 10-day release of approximately 860,000 gallons of untreated sewage. The cause of the overflow event was a collapsed pipe. Site investigations revealed a large amount of debris, particularly plastic bottles, lodged in the pipe.
• Poor waste management practices that result in the buildup of trash, food, and other debris in areas along the
Woonasquatucket provide habitat for rats and other vermin. DEM staff have often observed large quantities of rat, raccoon, and other mammalian excrement near trash bins from both residential and commercial properties located within several meters of the banks of the Woonasquatucket. This is particularly evident in areas adjacent to mill, commercial, and industrial sites in the Olneyville section of Providence and along several commercial areas along Manton Avenue. On at least one occasion, DEM submitted complaints to the City of Providence regarding trash buildup at the Atlantic Mills Complex. The WRWC has also submitted complaints to the City regarding this issue.
• The pervasive and widespread existence of littered streets, litter and debris in the river, overflowing litter bins,
commercial and mill complex litter, visible debris and solid waste within the channel, and dog fouling in public places is a negative stimulus for residents living in communities along the Woonasquatucket. The presence of these incivilities creates a negative impression of an unmanaged and uncared for environment. More than likely, this creates a negative feedback mechanism whereby people who live in these environments have little incentive to change or inadvertently become part of the problem through perpetuated neglect.
4.12 Background Levels of Pollutants Bacteria are a natural component of all rivers, lakes and streams and are naturally abundant in the lower intestines of humans and other warm-blooded animals. In areas unimpacted by anthropogenic sources, it may be assumed that fecal coliform concentrations are a result of wildlife inputs. There is limited background data available for the Woonasquatucket River and quantification of background is limited to the statistical summary presented for stations WR1 and WR2. Metals occur naturally and cycle by biogeochemical processes throughout the environment. Consequently, of the total metals that may be present in the Woonasquatucket River, a fraction are likely to be from natural sources. There is limited background data available for the Woonasquatucket River and quantification of background is limited to the statistical summary presented for stations WR1 and WR2 during dry weather.
4.13 Illegal Sources Copper, lead, and zinc contributions from automotive coolant dumping and oil dumping are possible in the Woonasquatucket River watershed. It is not uncommon to find used motor oil and coolant containers in the mainstem, as well as parking lots, vacant lots, and commercial areas located adjacent to the river in the lower and more urbanized portions of the watershed. Appliances and automotive debris have also been found in the lower reaches of the Woonasquatucket. Metals may leach from these objects and be released into the water column.

51
5.0 Pathogen TMDL Development
5.1 Applicable Water Quality Criteria Existing Water Quality Criteria for fecal coliform bacteria are taken from Table 1 of DEM’s Water Quality Regulations (DEM 2006). These criteria apply to all waterbody segments in the Woonasquatucket River as well as Assapumpsett Brook. As stated in the existing Regulations, Class B, B1, and B1a fecal coliform bacteria concentrations are not to exceed a geometric mean value of 200 MPN and not more than 20% of the samples can exceed a value of 500 MPN. This is the primary contact recreational/swimming criteria for freshwater. For this TMDL, the numeric water quality targets for fecal coliform bacteria in the Woonasquatucket River and Assapumpsett Brook are set to the revised (2006) water quality criteria for Class B, B1, and B1a waterbodies. These proposed regulations apply to Class B, B1, and B1a waters and state that fecal coliform bacteria concentrations are not to exceed a geometric mean value of 200 MPN and not more than 10% of the samples shall exceed a value of 400 MPN. The proposed criteria are more stringent than the current criteria and thus provide an additional margin of safety (MOS).
5.2 Water Quality and Resource Impairments Data collected by RIDEM and NBC in the Woonasquatucket River confirm that three segments-10B, 10C, and 10D are not meeting either or both parts of the water quality standards for fecal coliform bacteria. The impaired use is primary and secondary contact recreation. Water quality data collected in Assapumpsett Brook show that this waterbody is not meeting water quality standards for fecal coliform bacteria.
5.3 Critical Conditions and Seasonal Variation Clean Water Act Section 303(d)(1)(C) requires that TMDLs “be established at a level necessary to implement the applicable water quality standards with seasonal variations…”. The current regulation also states that determination of “TMDLs shall take into account critical conditions for stream flow, loading, and water quality parameters” [40 CFR 130.7(c)(1)]. Elevated fecal coliform levels occur throughout the year and under different flow regimes, however violations of the standards occur with more frequency during wet weather events. Elevated bacteria concentrations occur in all seasons, so seasonal variation is not an issue. Critical conditions vary by station therefore the TMDL analysis includes concentration reduction targets for all seasons and all weather conditions.
5.4 Margin of Safety The TMDL must contain a margin of safety (MOS) to account for uncertainty in the analysis. An explicit margin of safety equal to 10 percent of the TMDL was assumed to conservatively account for possible uncertainties in the analysis. Examination of Table 5.1 reveals that with this 10% MOS applied, segments 10B, 10C, 10D, and 01 (Assapumpsett Brook) would need over 100% reduction in fecal coliform bacteria concentrations to meet water quality criteria and support designated uses. The use of an explicit margin of safety provides a conservative estimate of reductions needed. However, RIDEM believes that pollution reductions between 90 to 100 percent should be adequate to achieve water quality standards; RIDEM will conduct follow-up monitoring to assess compliance with water quality standards

52
5.5 Technical Analysis The technical analyses are based on 7 years (1998-2004) of field data collection. The Quality Assurance Project Plans (LBG, Inc. 2000 and NBC 2001) describe the data collection program and methods to support this study. Extensive field surveys, water quality monitoring, and analysis of historic water quality studies were used to establish the link between pollutant sources and resulting water quality conditions. The existing data confirm the 303(d) fecal coliform bacteria listings for 3 segments of the Woonasquatucket River. The fecal coliform bacteria dataset contains varying amounts of dry and wet weather values for each station. In setting reductions to meet the geometric mean part of the standard, a single value for each station is calculated by comparing all data in the form of a “weighted geometric mean” based on the percentage of wet and dry weather days that occur annually in the watershed. The wet/dry weighting calculation varies with land use in the watershed area, the historic frequency of occurrence of rainfall sufficient to produce runoff, and the expected duration of water quality impacts in the water body. Because the watershed is highly urban in nature, a daily rainfall of 0.1 inches was considered sufficient to produce runoff. Historic rainfall data from T.F. Green Airport shows that 35% of days on average had rainfall totals of at least 0.1 inches. Water quality data shows that the river would be in a ‘wet’ condition during the day of the storm and the following day, making the wet percentage 70% of the year. The weighted geometric mean formula (WGM) is therefore:
WGM = [(0.3)(dry weather value) + (0.7)(wet weather value)]
A weighted statistic is calculated for comparison to both the geometric and percentile portions of the Class B fecal coliform criteria. For comparison to the geometric portion of the criteria (200 MPN), the dry and wet weather values in the above equation are geometric mean statistics. When comparing to the variability portion of the criteria (90th percentile value), the dry and wet weather values in the above equation are percentile statistics.
5.6 Loading Capacity The allowable load is defined as the maximum loading that a waterbody can receive without exceeding the numeric water quality criteria (40 C.F.R. 130.2(f)). The allowable load or loading capacity is therefore expressed as a concentration set equal to the applicable state water quality standard for fecal coliform bacteria. This concentration is considered to apply daily, in that daily values are used in calculation of geometric means and percent variability. The allowable daily load is the criteria concentration times the flow in the receiving water. For the purposes of implementation it is recommended that the concentration and percent reduction bacteria TMDL targets be used. The loading capacity for the bacteria TMDL will be expressed as concentration units set equal to the state water quality standard of a geometric mean value of 200 fc/100ml and not more than 10% exceeding 400 fc/100ml. The loading capacity is the maximum load that can be assimilated by receiving waters without violating water quality standards. Because fecal coliform has a two-part water quality standard for concentration, the loading capacity has two parts.
(1) LCGMV = applicable water quality geometric mean (concentration units)
(2) LCPV = applicable water quality percentile value (concentration units) Where GMV and PV are the “Geometric Mean Value” and “Percentile Value” for each station’s dataset, respectively.
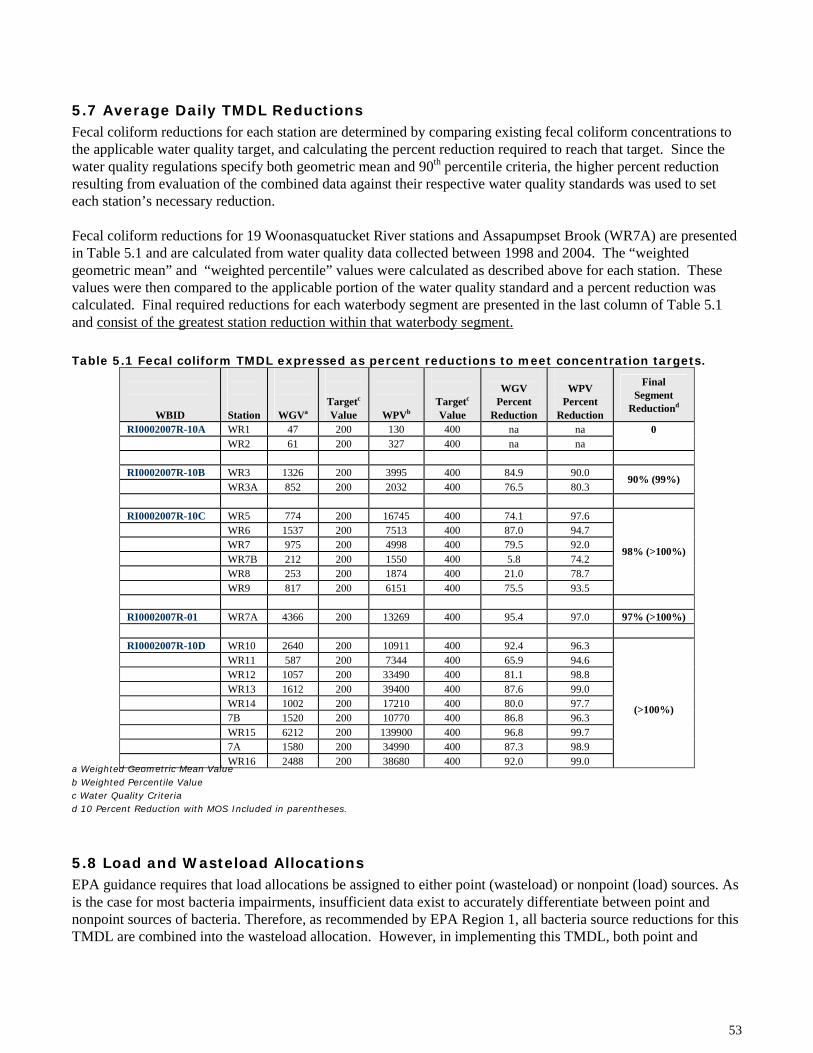
53
5.7 Average Daily TMDL Reductions Fecal coliform reductions for each station are determined by comparing existing fecal coliform concentrations to the applicable water quality target, and calculating the percent reduction required to reach that target. Since the water quality regulations specify both geometric mean and 90th percentile criteria, the higher percent reduction resulting from evaluation of the combined data against their respective water quality standards was used to set each station’s necessary reduction. Fecal coliform reductions for 19 Woonasquatucket River stations and Assapumpset Brook (WR7A) are presented in Table 5.1 and are calculated from water quality data collected between 1998 and 2004. The “weighted geometric mean” and “weighted percentile” values were calculated as described above for each station. These values were then compared to the applicable portion of the water quality standard and a percent reduction was calculated. Final required reductions for each waterbody segment are presented in the last column of Table 5.1 and consist of the greatest station reduction within that waterbody segment. Table 5.1 Fecal coliform TMDL expressed as percent reductions to meet concentration targets.
WBID
Station
WGVa
Targetc
Value
WPVb
Targetc Value
WGV
Percent Reduction
WPV
Percent Reduction
Final Segment
Reductiond
RI0002007R-10A WR1 47 200 130 400 na na WR2 61 200 327 400 na na
0
RI0002007R-10B WR3 1326 200 3995 400 84.9 90.0 WR3A 852 200 2032 400 76.5 80.3
90% (99%)
RI0002007R-10C WR5 774 200 16745 400 74.1 97.6 WR6 1537 200 7513 400 87.0 94.7 WR7 975 200 4998 400 79.5 92.0 WR7B 212 200 1550 400 5.8 74.2 WR8 253 200 1874 400 21.0 78.7 WR9 817 200 6151 400 75.5 93.5
98% (>100%)
RI0002007R-01 WR7A 4366 200 13269 400 95.4 97.0 97% (>100%) RI0002007R-10D WR10 2640 200 10911 400 92.4 96.3 WR11 587 200 7344 400 65.9 94.6 WR12 1057 200 33490 400 81.1 98.8 WR13 1612 200 39400 400 87.6 99.0 WR14 1002 200 17210 400 80.0 97.7 7B 1520 200 10770 400 86.8 96.3 WR15 6212 200 139900 400 96.8 99.7 7A 1580 200 34990 400 87.3 98.9 WR16 2488 200 38680 400 92.0 99.0
(>100%)
a Weighted Geometric Mean Value b Weighted Percentile Value c Water Quality Criteria d 10 Percent Reduction with MOS Included in parentheses.
5.8 Load and Wasteload Allocations EPA guidance requires that load allocations be assigned to either point (wasteload) or nonpoint (load) sources. As is the case for most bacteria impairments, insufficient data exist to accurately differentiate between point and nonpoint sources of bacteria. Therefore, as recommended by EPA Region 1, all bacteria source reductions for this TMDL are combined into the wasteload allocation. However, in implementing this TMDL, both point and

54
nonpoint controls will be necessary to meet the TMDL plan’s water quality targets. A summary of wasteload allocations, by segment, is presented in Sections 5.8.1 through 5.8.5. Segment RI0002007RI-10A No reductions in fecal coliform bacteria are necessary for this segment. Natural and/or background sources meet water quality criteria therefore no wasteload allocation is required. Segment RI0002007RI-10B The most prevalent source of fecal coliform bacteria to this segment is stormwater runoff. Other possible sources include illicit discharges to storm drains, leaking sanitary sewer lines, failing septic systems, and wildlife and waterfowl. With a 10% MOS included, the final segment reduction is 100%. As a source, stormwater runoff will receive 100% of the WLA. A WLA of zero (0) is set for failing septic systems that flow (via groundwater seeps and/or overland flow) into storm drains, illegal connections to storm drains, and leaking sanitary sewer lines. Segment RI0002007RI-10C The most prevalent source of fecal coliform bacteria to this segment is stormwater runoff. Other possible sources include illicit discharges to storm drains, leaking sanitary sewer lines, failing septic systems, and wildlife and waterfowl. With a 10% MOS included, the final segment reduction is 100%. As a source, stormwater runoff will receive 100% of the WLA. A WLA of zero (0) is set for failing septic systems that flow (via groundwater seeps and/or overland flow) into storm drains, illegal connections to storm drains, and leaking sanitary sewer lines. Table 5.4 presents RIPDES permit limits for fecal coliform for the Smithfield WWTF.
Table 5.2. RIPDES Permit Limits for fecal coliform at the Smithfield WWTF. Point Source
Permitted Discharge
(MGD)
Monthly Average
Weekly Average
Daily Maximum
Sampling Frequency
Smithfield WWTF 3.5 MGD 200 MPN/100ml
400 MPN/100ml
400 MPN/100ml 3/week
Segment RI0002007RI-01 Assapumpsett Brook Likely sources of fecal coliform bacteria to this segment include stormwater runoff. Other possible sources include illicit discharges to storm drains, leaking sanitary sewer lines, failing septic systems, and wildlife and waterfowl. With a 10% MOS included, the final segment reduction is 100%. As a source, stormwater runoff will receive 100% of the WLA. A WLA of zero (0) is set for failing septic systems that flow (via groundwater seeps and/or overland flow) into storm drains, illegal connections to storm drains, and leaking sanitary sewer lines. Segment RI0002007RI-10D The major sources of fecal coliform bacteria to this segment include stormwater runoff and dry and wet weather combined sewer overflow discharges. Other possible sources include illicit discharges to storm drains, leaking sanitary sewer lines, and wildlife and waterfowl. With a 10% MOS included, the final segment reduction is 100%. Sources such as dry weather CSO overflows, illicit discharges, and leaking sanitary sewer lines receive a Wasteload Allocation of zero (0) since they are prohibited. The vast majority of stormwater in this segment discharges to the NBC CSO system; Since the NBC is currently implementing a CSO abatement plan no TMDL allocations are made for this segment, at this time. Until CSO discharges are mitigated, it is difficult to determine whether reductions are necessary for any remaining separate discharges.

55
5.9 Strengths and Weaknesses in the Technical Approach
Strengths
• The TMDL is based on extensive data and knowledge of the area; • The TMDL incorporates the findings of several studies and utilizes seven years of data. • Extensive field research and photographic documentation were used to confirm sources of pollution. • The phased approach allows an emphasis on mitigation strategies rather than on modeling and more
complex monitoring to keep the focus on source reduction, and: • The TMDL is based on actual data collected in the watershed.
Weaknesses
• Most sources could not be measured on a mass basis due to lack of required resources and complexity of the area.

56
6.0 Dissolved Metals TMDL Development
6.1 Applicable Water Quality Criteria
Selection of Appropriate Hardness Values
Both chronic and acute aquatic life criteria for many metals are a function of hardness. Hardness is defined as the concentration of calcium carbonate (CaCO3) in the water column and has the units of milligram per liter (mg/l). Freshwater aquatic life criteria for certain metals are expressed as a function of hardness because hardness and/or water quality characteristics that are usually correlated with hardness can affect the toxicities of some metals. Increasing hardness has the effect of decreasing the toxicity of certain metals to aquatic life. DEM evaluated existing water quality data available throughout the mainstem of the Woonasquatucket River to determine appropriate hardness levels to use in calculating water quality criteria and establishing water quality goals for the TMDL. The analysis resulted in several observations. First, no correlation could be seen between hardness values and flow, which typically show an inverse correlation. Second, mean hardness values were observed to increase in a downstream direction under both baseflow (dry weather) and stormflow (wet weather) conditions. Third, only slight differences existed between mean dry and wet weather hardness values, particularly in segments 10A through 10C (Table 6.1). Table 6.1 Summary of mean hardness values in the Woonasquatucket River.
Segment
Average hardness (mg/l CaCO3) Dry Wet
RI0002007R-10A 22.2 21.8 RI0002007R-10B 24.3 25.6 RI0002007R-10C 30.0 31.5 RI0002007R-10D 43.9 37.4 RI0002007R-01 55.7 44.9
Based on the above analysis, DEM used the lowest of either the mean dry or mean wet weather hardness value to calculate numeric concentration targets (Table 6.2) for each of four segments of the Woonasquatucket River and tributary Assapumpsett Brook. The use of the lowest mean hardness value for each segment results in a conservative and adequately protective TMDL under both high and low flow conditions. Table 6.2 Dissolved metals numeric concentration targets for acute and chronic conditions.
ACUTE CRITERIA (calucated using lowest of dry or wet weather mean hardness value for each segment)Paramter RI0002007R-10A RI0002007R-10B RI0002007R-10C RI0002007R-10D RI0002007R-01Hardness (mg/CaCO3) 21.8 24.3 30.0 37.4 44.9Cd (ug/l) 0.46 0.51 0.62 0.77 0.92Cu (ug/l) 3.2 3.54 4.32 5.32 6.32Pb (ug/l) 11.9 13.45 17.04 21.81 26.74Zn (ug/l) 32.24 35.34 42.25 50.93 59.46
CHRONIC CRITERIA (calucated using lowest of dry or wet weather mean hardness value for each segment)Paramter RI0002007R-10A RI0002007R-10B RI0002007R-10C RI0002007R-10D RI0002007R-01Hardness (mg/CaCO3) 21.8 24.3 30.0 37.4 44.9Cd (ug/l) 0.09 0.09 0.11 0.12 0.14Cu (ug/l) 2.44 2.67 3.2 3.86 4.52Pb (ug/l) 0.46 0.52 0.66 0.85 1.04Zn (ug/l) 32.5 35.63 42.59 51.34 59.94
WATERBODY ID NUMBER
WATERBODY ID NUMBER

57
6.2 Water Quality and Resource Impairments Acute and chronic dissolved Cadmium criteria were met at all stations in the Woonasquatucket River and Assapumpset Brook during both steady state and wet weather conditions. Several stormwater outfall stations did exhibit elevated levels of dissolved Cd, however no violations occurred at any downstream stations. One violation of acute Copper criteria occurred in the mainstem Woonasquatucket at RM 0.7 (Bath Street in Providence). This violation occurred under high flow conditions and within the CSO reach. No other violations of Cu exist. Point source concentrations of dissolved Cu were, on average, an order of magnitude larger than in-stream concentrations. The largest instream increases in dissolved Cu occur downstream of the Smithfield WWTF.
Dissolved Lead concentrations in the mainstem tended to increase in a downstream direction under both low and high flow assessments. No violations of the acute Pb criteria occur under low flow conditions, however dissolved Pb concentrations do increase downstream of the Smithfield WWTF and within the CSO reach. One violation of the acute Pb criteria occurred under high flow conditions at Bath Street (RM 0.7) in Providence. All other acute Pb criteria are met within the mainstem and Assapumpsett Brook.
Violations of the acute Zinc criteria occurred in the mainstem Woonasquatucket during low flow conditions at the following stations: RM 3.2 (Merino Park-WR10), RM 6.3 (Allendale Avenue-WR07), and RM 0.7 (Bath Street-WR15). Two violations of the acute Zn criteria occurred during wet weather. The violations exist at RM 12.0, at the outlet of the Woonasquatucket Reservoir in Smithfield, and at RM 0.7 at Bath Street in Providence. Point sources exhibited elevated levels of Zn.
6.3 Critical Conditions and Seasonal Variation Clean Water Act Section 303(d)(1)(C) requires that TMDLs “be established at a level necessary to implement the applicable water quality standards with seasonal variations…”. The current regulation also states that determination of “TMDLs shall take into account critical conditions for stream flow, loading, and water quality parameters” [40 CFR 130.7(c)(1)]. Levels of dissolved Cd, Cu, Pb, and Zn show no seasonal variations along the length of the mainstem Woonasquatucket. Acute and chronic violations of dissolved Cu, Pb, and Zn criteria occur under low and high flow conditions. Dissolved metals concentrations from stormwater sources increase dramatically during periods of wet weather. It is suspected that some sources may have been intermittent during both dry and wet weather and the instream metals data appear to reflect this. Therefore, critical conditions are considered to occur under both flow regimes and are evaluated below.
6.4 Margin of Safety The TMDLs must contain a margin of safety (MOS) to account for uncertainty in the analysis. The MOS for the Woonasquatucket River metals TMDL are implicit and are listed below.
• To calculate the required percent reductions, the maximum metal concentrations in each dataset were used to represent existing dry and wet weather conditions.
• Metals criteria in the tidally-impacted reach of the Woonasquatucket were based on a mean hardness value of 37.4
mg/l CaCO3 and were calculated from data collected during periods of low or ebb tide when flow was dominated by freshwater. A mean hardness value of 600 mg/l CaCO3 was calculated for the river under periods of flood and/or high tide.
Metals toxicity decreases with increasing hardness therefore use of the lower hardness value of 37.4 mg/l CaCO3 to calculate water quality criteria applicable under all tidal conditions is fully protective under low or ebb tide and conservative under periods of high or flood tide.

58
• The most protective numeric standard (the chronic aquatic life support standard) is used to set TMDL targets. In the
case of zinc, the acute criteria are slightly lower than the chronic criteria, therefore the most protective numeric standard for zinc is the acute aquatic life support standard.
6.5 Technical Analysis The technical analyses for the metals TMDL is based on water quality data collected between 2001 and 2002. The Quality Assurance Project Plans (LBG, Inc. 2000 and NBC 2001) describe the data collection program and methods to support this study. The TMDL endpoints (acute and chronic criteria) must be met during a range of flows in order for a waterbody to maintain water quality standards and meet its designated uses. In cases where pollutant concentrations in a waterbody are dominated by point source loadings, the critical flow is typically a low flow since the highest concentrations associated with specific point source loads would be expected under low flow conditions. Conversely, elevated nonpoint source pollutant loadings generally correspond to storm events. Consistent with EPA’s Technical Support Document for Water Quality-based Toxics Control (1991), this dissolved metals TMDL is evaluated under both steady state and wet weather conditions. This TMDL is evaluated under conditions that likely reflect worst-case (critical) conditions for both point and nonpoint source loadings (i.e. low flow and high flow conditions). Determination of the TMDL under these two scenarios identifies the lower of the two loading capacities of the waterbody. The lower capacity is necessary to protect the waterbody. Data were evaluated under both conditions to ensure that the final loading capacity is protective of water quality and will support all uses during critical conditions. The total assimilative capacity, or loading capacity, is the maximum amount of pollutant that a waterbody can assimilate while maintaining water quality standards. The loading capacity is a function of different hydrodynamic processes that affect the environmental fate and transport of dissolved metals as they move through the system. For this TMDL the allowable load or loading capacity is expressed as a concentration set equal to the applicable state water quality standard for each dissolved metal. This concentration is considered to apply daily, in that daily values are used to compare against the acute and chronic criteria. The allowable daily load is the criteria concentration times the flow in the receiving water. For the purposes of implementation it is recommended that the concentration and percent reduction dissolved metals TMDL targets be used. The dissolved metals dataset used in this TMDL analysis contains a combination of data collected during baseflow and high flow conditions. However data characteristics such as overall quantity of samples and frequency of sample collection do not allow for direct comparison against either acute or chronic criteria. For acute criteria, EPA has established an averaging period of 1-hour and for chronic criteria, EPA has established an averaging period of 4 days. Dry Weather Low Flow Analysis Chronic Criteria Evaluation The existing dry weather dataset consists of monthly grab samples as well as pre-storm samples from two wet weather surveys. Dry weather data were collected during sustained low flow conditions (Table 6.3) and are therefore assumed to be representative of water quality within any steady-state and low flow period bounded by runoff events, including a four-day period of time.

59
Table 6.3 Daily mean flow and precipitation during dry weather and pre-storm surveys. Daily Rainfall Average Daily Flow
Event Date inches cfsW et W eatherPre-Storm SurveysStorm 2 9/16/2001 0 13
9/17/2001 0 129/18/2001 0 129/19/2001 0 129/20/2001 0 12
Storm 4 8/25/2002 0.01 98/26/2002 0 98/27/2002 0 98/28/2002 0 88/29/2002 0.13 11
Dry W eather SurveysSurvey 2 7/24/2001 0 25
7/25/2001 0 237/26/2001 0.71 1 267/27/2001 0 247/28/2001 0 18
Survey 3 7/30/2001 0 157/31/2001 0 14
8/1/2001 0 148/2/2001 0 148/3/2001 0.25 13
Survey 4 9/4/2001 0.06 229/5/2001 0 169/6/2001 0 149/7/2001 0 139/8/2001 0 13
Average flow of all surveys 15.4 1 Sampling performed before summer storm event. Bold indicates survey date.
Based on the flow and precipitation data presented in Table 6.3, DEM evaluated the dry weather dataset for compliance with chronic criteria by comparing each data point to the chronic criteria. Because the data were collected under sustained low flow conditions, each data point is representative of steady state conditions for that particular baseflow. One exceedance of the chronic criteria is acceptable given that the State’s WQRs stipulate “the four-day average concentration of a pollutant should not exceed the chronic criteria more than once every three years on the average”. However, more than one exceedance would constitute a violation of chronic criteria and would necessitate calculating a percent reduction. Although the State’s Water Quality Regulations provide the basis for evaluating whether or not a violation has occurred, in cases where DEM has knowledge of an actual or potential upstream pollution source, one exceedance of the chronic criteria may constitute a violation. Acute Criteria Evaluation As previously stated, each dry weather value consisted of a monthly grab sample therefore the dataset cannot be averaged to calculate an hourly mean for comparison to the acute criteria. However, under steady state conditions, any given sample should be representative of water quality within that segment for such a short period of time as one hour. Therefore each data value is compared to the acute criteria. One exceedance of the acute criteria is acceptable given that the State’s WQRs stipulate “the one-hour average concentration of a pollutant should not exceed the acute criteria more than once every three years on the average”. However, more than one exceedance would constitute a violation of acute criteria and would necessitate calculating a percent reduction.

60
As stated earlier, existing language in the State’s WQRs provides the basis for evaluating whether or not a violation has occurred. However, in cases where DEM has knowledge an actual or potential upstream pollution source, one exceedance of the acute criteria may constitute a violation. Low Flow Reductions The dissolved metals TMDLs are concentration-based. The allowable concentration is equal to the chronic criteria, which is more protective than the acute criteria. The existing concentration is calculated as the maximum dry weather dissolved metal concentration during any dry weather survey. The allowable and existing concentrations under low flow conditions are expressed as follows and are reported in Table 6.4.
Allowable Dry Weather metal concentration = Chronic Criteria (concentration in ug/l)
Existing Dry Weather metal concentration = Maximum Dry Weather Concentration (ug/l) Table 6.4 Low Flow Allowable and Existing Concentrations in the Woonasquatucket River.
Waterbody
Segment
Cd Allowable
Conc. (ug/l)
Cd Existing
Conc. (ug/l)
Cu Allowable
Conc. (ug/l)
Cu Existing
Conc. (ug/l)
Pb Allowable
Conc. (ug/l)
Pb Existing
Conc. (ug/l)
Zn Allowable
Conc. (ug/l)3
Zn Existing
Conc. (ug/l)
RI0002007R-10A 0.09 0.009 2.44 0.70 0.46 0.20 32.2 19.7 RI0002007R-10B 0.09 0.019 2.67 0.87 0.52 0.24 35.3 32.3 RI0002007R-10C 0.11 0.025 3.20 1.78 0.66 0.41 42.3 44.21
RI0002007R-10D 0.12 0.044 4.52 1.74 0.85 0.54 50.9 86.42
RI0002007R-01 0.14 0.016 4.52 1.84 1.04 0.77 59.5 58.0 1Considered a violation of criteria (single exceedance however knowledge of existing pollution source) 2Considered a violation of criteria (three individual exceedances within segment) 2Allowable concentration for zinc is the lower acute criteria To determine the necessary concentration reductions, the allowable concentration is subtracted from the existing dry weather concentration. Expressed as percent reduction, the necessary dissolved metals load reductions at each station are:
Percent Reduction = (Existing conc. – Allowable conc. / Existing conc.) x 100
No reductions are required under low flow conditions for dissolved Cd, Cu, or Pb at any mainstem stations in the Woonasquatucket. No reductions are required at Station WR7A, located at the mouth of Assapumpset Brook. Required reductions for dissolved Zn during dry weather low flow conditions are presented below in Table 6.5. Table 6.5 Low Flow Condition Percent Zinc Reductions in the Woonasquatucket.
Waterbody Segment
Required Reduction
RI0002007R-10A NONE RI0002007R-10B NONE RI0002007R-10C 4% RI0002007R-10D 41% RI0002007R-01 NONE
Wet Weather High Flow Analysis Acute Criteria Evaluation The existing wet weather dataset contains numerous samples collected before, during, and after a rainfall event. Existing data include approximately 6-8 samples per station that were collected during high flows, with the remainder of values representing either a pre- or post-storm condition. Appendix B of the State’s WQR states that

61
“the one-hour average concentration of a pollutant should not exceed the acute criteria more than once every three years on the average”. The available wet weather data do not lend themselves to a “one-hour” calculation of a mean (only one value per 2 hours exist) that can be compared to the acute criteria. EPA’s Technical Support Document for Water Quality-Based Toxics Control (1991) states that the one-hour averaging period was derived primarily from data on response time for toxicity to ammonia, a fast-acting toxicant. Additionally, the document state’s that “the 1-hour averaging period is expected to be fully protective for the fastest-acting toxicants (i.e. ammonia) and even more protective for slower-acting toxicants.” Therefore, in this case, it seems appropriate that values (of slower-acting toxicants such as Cd, Cu, Pb, and Zn) spaced 2 hours apart would be sufficient to characterize the 1-hour averaging period and satisfy that portion of the criteria. As stated above, wet weather samples were collected approximately 2 hours apart during the high-flow portion of the sampling event. Each data value collected under high-flow conditions is considered to be representative of a concentration in that waterbody for a period of one hour. Therefore, all data collected within the stormflow portion of the hydrograph is compared to the acute criteria and the maximum value is considered to conservatively represent existing conditions. If the acute criteria were exceeded once during a wet weather event then DEM considers it likely that the criteria would be exceeded again within a three-year period and therefore, the data would represent a violation of water quality standards. Under these assumptions, only one exceedance of the acute criteria during wet weather is needed in order to represent a violation of the acute criteria. Chronic Criteria Evaluation It some cases, aquatic life may be exposed to wet weather-related pollutants for a long enough period of time (> 4 days) whereby chronic effects may be seen. A detailed analysis of both precipitation and flow records would be required to determine the exact conditions where this may occur. In addition, two key assumptions would need to be made in order for this analysis to be used in TMDL development. One key assumption is that point and nonpoint pollution sources are constant during the duration of elevated flows. This runs counter to the widely accepted concept of “first-flush”, whereby the majority of pollutant load enters a waterbody during the rising limb of the hydrograph. The second key assumption is that reported daily precipitation values represent an actual intensity of rainfall that could produce runoff. In reality, a reported daily rainfall value may be spread out over a long enough period of time whereby surface runoff is minimal. Given these restrictions, and in order to satisfy the four-day chronic requirement, DEM chose to evaluate all data available within the stormflow portion of the hydrograph, and conservatively assume that these conditions represent a four-day average. Existing data during this period of elevated flow extend for two days, however assuming that these data represent four days is highly conservative since it is commonly observed that the falling portions of stormflow hydrographs may last an additional 2 days-thus providing an implicit margin of safety. If the chronic criteria were exceeded once during a wet weather event with a recurrence interval of three years or less, then DEM considers it likely that the criteria would be exceeded again within the three-year period, and therefore the data would represent a violation of water quality standards. Therefore, under these assumptions, only one exceedance of the chronic criteria during wet weather is needed in order to represent a violation of the chronic criteria. High Flow Reductions Wet weather allowable concentrations are set equal to the acute and chronic criteria and are presented in Table 6.6.

62
Table 6.6 Wet weather allowable concentrations in the Woonasquatucket River. Waterbody ID Segment
Allowable Conc. Cadmium
(ug/l)
Allowable Conc. Copper (ug/l)
Allowable Conc. Lead (ug/l)
Allowable Conc. Zinc
(ug/l) ACUTE CHRONIC ACUTE CHRONIC ACUTE CHRONIC ACUTE CHRONIC
RI0002007R-10A 0.46 0.09 3.20 2.44 11.90 0.46 32.24 32.50 RI0002007R-10B 0.51 0.09 3.54 2.67 13.45 0.52 35.34 35.63 RI0002007R-10C 0.62 0.11 4.32 3.20 17.04 0.66 42.25 42.59 RI0002007R-01 0.92 0.14 6.32 4.52 26.74 1.04 59.46 59.94 RI0002007R-10D 0.77 0.12 5.32 3.86 21.81 0.85 50.93 51.34
The existing wet weather condition at each station is evaluated from the available wet weather data as:
1. Maximum wet weather value (for comparison to acute criteria) 2. Average of storm event values (for comparison to chronic criteria)
Existing concentrations for wet weather are shown in Table 6.7. Table 6.7 Existing Wet Weather Conditions in the Woonasquatucket River.
WB ID Segment
Water Quality Station
Existing Conc. Cadmium
(ug/l)
Existing Conc. Copper (ug/l)
Existing Conc. Lead (ug/l)
Existing Conc. Zinc
(ug/l) ACUTE CHRONIC ACUTE CHRONIC ACUTE CHRONIC ACUTE CHRONIC
RI0002007R-10A WR1 0.008 0.004 0.55 0.30 0.24 0.10 38.40 8.88 RI0002007R-10B WR3A 0.033 0.018 1.33 0.84 0.49 0.19 10.70 7.09 RI0002007R-10C WR5 0.022 0.013 1.40 1.09 0.396 0.254 19.60 11.5 WR6 0.025 0.009 2.73 1.39 0.687 0.252 26.6 8.76 WR7 0.025 0.012 2.73 1.45 0.687 0.275 29.00 26.08 WR7B 0.037 0.011 3.08 1.33 0.71 0.23 23.10 10.4 WR8 0.013 0.011 1.64 1.04 0.43 0.25 17.00 13.25 WR9 0.011 0.008 1.33 1.11 0.28 0.22 13.70 8.37 RI0002007R-01 WR7A 0.036 0.018 3.98 2.08 .446 0.115 25.40 10.34 RI0002007R-10D WR10 0.044 0.020 3.1 1.98 1.3 0.44 25.6 13.2 WR12 0.032 0.020 3.10 2.2 1.3 0.7 27.00 17.1 WR13 0.130 0.030 2.90 2.0 1.34 0.62 21.0 11.6 WR15 0.144 0.05 8.2 3.4 4.1 1.5 81.4 28.1
The resulting concentration reductions in dissolved Cd, Cu, Pb, and Zn for each station for the acute evaluation are calculated as:
Percent Reduction = ((Maximum Concentration – Acute Criteria)/ Maximum Concentration) x 100%
For the chronic evaluation, the resulting equation is:
Percent Reduction = ((Average Event Concentration –Chronic Criteria)/ Average Concentration) x 100% Based on Tables 6.6 and 6.7, several stations require a percent reduction. The highest of the required acute and chronic reductions are used as the final reduction for each station. Table 6.8 summarizes the percent reductions required during high flow conditions.

63
Table 6.8 High Flow/ Wet Weather Percent Reductions in the Woonasquatucket. Water Quality Station
Waterbody ID Segment
Cu Required Reduction
Pb Required Reduction
Zn Required Reduction
WR1 RI0002007R-10A 16% WR15 RI0002007R-10D 35% 43% 37%
6.6 Final Reductions The final reductions that are required at each station are based on the largest of the dry and wet weather reductions (Tables 6.5 and 6.8). The final reduction for each segment consists of the largest reduction of any station within that segment. Table 6.9 presents the final segment reductions for dissolved Cd, Cu, Pb, and Zn. No reductions are required for dissolved Cd and only one reduction each in dissolved Cu and Pb is required at RM 0.7. The majority of the required reductions in the Woonasquatucket River apply to dissolved Zn.
Table 6.9 Metals TMDLs expressed as percent reductions to meet concentration targets. Waterbody Segment
Dissolved Cadmium
Dissolved Copper
Dissolved Lead
Dissolved Zinc
RI0002007-10A NONE NONE NONE 16% RI0002007-10B NONE NONE NONE NONE RI0002007-10C NONE NONE NONE 4% RI0002007-10D NONE 35% 43% 41%
RI0002007-01 NONE NONE NONE NONE
6.7 TMDLs, Wasteload and Load Allocations A TMDL is the combination of a total wasteload allocation (WLA) that allocates loadings for point sources, a total load allocation (LA) that allocates loadings for nonpoint sources and background sources and a Margin of Safety (MOS). In TMDL development, allowable WLA and LA from pollutant sources that cumulatively amount to no more than the TMDL must be established; this provides the basis to establish water quality-based controls. TMDLs can be expressed on a mass loading basis or as a concentration in accordance with provisions in federal regulations [40 CFR 130.2(1)]. For the Woonasquatucket River, the TMDL and consequently the WLAs and LAs are expressed as concentration targets and the percent reductions required to meet standards, as determined from follow-up ambient monitoring. The LAs are assigned to nonpoint sources and natural background sources in the watershed. These sources include air deposition of metals and groundwater contributions and may or may not include anthropogenic sources. As discussed in the Source Analysis section (Section 4.0), these sources are not considered significant at this time. These sources may be re-evaluated at a future date if any additional data become available. Since it is not possible to separate out the load allocation, it is included in the WLA and the MOS is implicit, therefore the TMDL equals the WLA.
6.8 Wasteload Allocations by Segment Federal regulations [40 CFR 130.7] require TMDLs to include individual WLAs for each point source discharge. The point sources that affect the Woonasquatucket River are the MS4 discharges, stormwater discharges from industrial sites, and discharges from the Smithfield WWTF, and in the most downstream reach, combined sewer

64
overflows. The stormwater WLA encompasses discharges from MS4s as well as stormwater from industrial activities.
Segment RI0002007RI-10A This segment requires a 16% reduction in dissolved zinc concentrations. The most likely source of zinc is stormwater runoff from Route 104 in Smithfield, therefore this source will receive 100% of the WLA. An additional source may be WESCO Oil Inc., located adjacent to the river on the left bank just downstream of the Route 104 intersection. DEM staff will conduct a site visit in order to determine if the facility may have the potential to have caused the wet weather zinc violation and would subsequently require coverage under the multi-sector general permit for a stormwater discharge associated with industrial activity. Segment RI0002007RI-10B Natural and/or background concentrations of dissolved metals in this segment meet water quality criteria therefore no reductions are necessary. Segment RI0002007RI-10C This segment requires a 4% reduction in zinc concentration necessitated from violations of the acute and chronic zinc criteria at a station located approximately 2.9 kilometers downstream of the Smithfield Wastewater Treatment Facility. It has been determined that the facility is not contributing to the observed violations at this station, however the permit will be developed accounting for this unknown source of zinc. The wasteload allocations for dissolved Cadmium, Copper, Lead, and Zinc for the Smithfield WWTF are set to the proposed 2007 RIPDES permit (RI0100251) limits (Table 6.10). The limits are calculated to ensure that water quality criteria for these dissolved metals are met in the receiving waters and take into account an unknown source of zinc downstream of the treatment facility. Limits for dissolved Cadmium, Copper, Lead, and Zinc were derived during the permit development process.
Table 6.10 Proposed Limits for dissolved Cd, Cu, Pb, and Zn- Smithfield WWTF. Limit (ug/l) Cadmium Copper Lead Zinc Daily Maximum 0.98 6.33 28.07 50.09
Monthly Average 0.16 4.45 0.88 50.09
Segment RI0002007RI-01 Assapumpsett Brook Natural and/or background concentrations of dissolved Cd, Cu, Pb, and Zn measured at the mouth of Assapumpsett Brook meet water quality criteria therefore no reductions are necessary. Segment RI0002007RI-10D
This segment requires a 35% reduction in dissolved Copper concentrations, a 43% reduction in dissolved Lead concentrations, and a 41% reduction in dissolved Zinc concentrations. The most likely source of metals contamination in this segment is stormwater runoff and dry and wet weather combined sewer overflow discharges. Other possible sources include illicit discharges to storm drains, illegal sources, and groundwater and sediment contamination. These sources receive a Wasteload Allocation of zero (0) since they are prohibited. The entire WLA is allocated to stormwater runoff and wet weather CSO discharges. The vast majority of stormwater in this segment discharges to the NBC CSO system. Until CSO discharges are mitigated, it is difficult to determine whether reductions are necessary for any remaining separate discharges. To prevent future impacts from untreated stormwater discharges, any new development or re-development within the watershed must employ stormwater controls to prevent any increase in metals concentrations (see Section 7.3).

65
6.9 Strengths and Weaknesses in the Technical Approach
Strengths
• The TMDL is based on extensive data and knowledge of the area; • The TMDL incorporates the findings of several studies and utilizes seven years of data. • Extensive field research and photographic documentation were used to confirm sources of pollution. • The phased approach allows an emphasis on mitigation strategies rather than on modeling and more
complex monitoring to keep the focus on source reduction, and: • The TMDL is based on actual data collected in the watershed.
Weaknesses
• Many sources could not be measured on a mass basis due to lack of required resources and complexity of the area.

66
7.0 Implementation This section describes the actions necessary to implement the TMDL to attain and maintain fecal coliform and dissolved copper, lead, and zinc water quality criteria in the Woonasquatucket River and Assapumpsett Brook. The plan describes implementation responsibilities assigned to cooperating agencies and other responsible parties. The goal of the Implementation Plan is to ensure that the Woonasquatucket River and Assapumpsett Brook meet water quality criteria for fecal coliform bacteria and dissolved copper, lead, and zinc at all times and in all points of the river. Since nonpoint discharges to these waterbodies are considered negligible, compliance with the TMDL will be accomplished by ensuring that all point source discharges meet the wasteload allocations set forth in Sections 5.0 and 6.0 of this report. Applicable permits will be revised to incorporate WLAs to ensure that the discharges do not contribute to an exceedance of the water quality criteria. Eliminating bacterial and dissolved metals impairments in the Woonasquatucket River and its watershed requires a reduction in both dry and wet weather inputs. All stations in the Woonasquatucket River violate water quality standards for fecal coliform bacteria after rain events. Elevated bacteria concentrations originate from within the watershed and can be traced from tributaries, stormwater outfalls, and both dry and wet weather CSO discharges. Sources of dissolved Cd, Cu, Pb, and Zn include the Smithfield WWTF, stormwater runoff, and CSOs. The cumulative impacts of stormwater runoff and CSO discharges degrade water quality and necessitate a watershed-wide pollution reduction approach directed at both point and nonpoint sources of pollution. Recommended implementation activities and current pollution reduction strategies for the Woonasquatucket River are detailed in the following sections. Several key projects in the watershed are expected to reduce pollution in the Woonasquatucket River. These include the CSO Abatement Project overseen by the Narragansett Bay Commission as well as NBC’s Best Management Practices Plan for Field’s Point and Bucklin Point Service Areas, and implementation of Phase II Stormwater Project Plans by the Cities of Providence and North Providence, and the Towns of Johnston and Smithfield, and the RI Dept. of Transportation. Other activities focus on litter and waste management controls, and other good housekeeping measures. Both Metals Recycling L.L.C. and the Smithfield WWTF are permitted to discharge to the Woonasquatucket River. Numerous monitoring efforts occurring in the Woonasquatucket River watershed will help further identify pollution sources, track water quality trends, and evaluate pollution control efforts. Comparison of water quality with state standards is made possible by the Narragansett Bay Commission’s ongoing trend monitoring of the lower Woonasquatucket surface waters within the CSO reach from Glenbridge Avenue to Kinsley Street. The Woonasquatucket River Watershed Council also monitors fecal coliform levels monthly at Donigian Park in Olneyville and Cricket Park in Johnston. DEM continues to respond to environmental complaints, conduct inspections, and issue NPDES permits as part of its responsibilities under state and federal laws and regulations. DEM will continue to work with DOT, NBC, local municipalities, private property owners, and watershed groups to identify funding sources, and evaluate locations and designs for stormwater control BMPs throughout the watershed. Sufficient reasonable assurance exists that the Woonasquatucket River TMDL goals will be met by 2020. Among the elements of reasonable assurance for the TMDL are dedicated local funding for surface water monitoring and pollution control by NBC, assurance of completion of Phase III of NBC’s CSO Abatement Project, continued implementation of Phase II SWMPPs as well as amendments to SWMPP’s required by this TMDL, stormwater abatement projects currently underway by RIDOT, and anticipated grant projects to identify and correct fecal coliform and metals pollution in the Woonasquatucket River. The most valuable assurance of Woonasquatucket River cleanup success is the considerable local involvement and commitment to water quality and natural resources of the watershed, spearheaded in part, by the Woonasquatucket River Watershed Council.

67
7.1 NBC’s CSO Abatement Program The combined sewer overflows into Narragansett Bay are a violation of the Federal Clean Water Act. The TMDL has determined that CSO discharges contribute to both dry and wet weather water quality impairments in the Woonasquatucket River. In July of 1994, DEM approved a comprehensive Combined Sewer Overflow Control Facilities Program prepared by the Narragansett Bay Commission. The Program proposed the construction of six underground storage facilities and three deep rock tunnel segments at a cost of $467 million (1992 dollars). The underground storage tanks and tunnels would contain the sewage overflows during rain events so that the stored flows could be returned to the system for treatment after the storm. Subsequently, NBC reevaluated their CSO abatement plan and prepared an amended CSO Control Facilities Program that was approved by DEM in July of 1999. The amended Program replaced the underground storage facilities with a combination of CSO interceptors and sewer separation projects, and refined the sizing of the deep rock tunnels, with a total cost of $390 million (1998 dollars). The entire CSO abatement project is being undertaken in three phases over the course of approximately 20 years. NBC has divided Phase I into eleven construction contracts. As of April 2006, seven of the contracts have been completed, three are still under construction and one has not started yet. Phases II and III of the CSO plan will address the remaining CSOs that discharge to the Woonasquatucket, Moshassuck, West, Seekonk, and Blackstone Rivers. Phase II of the CSO plan will include CSO interceptors to transport flows from remote CSOs to the main spine tunnel, separation of sanitary and storm sewers, and a constructed wetland treatment facility. Phase III will include the Pawtucket tunnel, CSO interceptors, and sewer separation. The remaining outfalls that have smaller CSO flows will be either blocked or controlled. Throughout the entire project, NBC, with DEM's assistance, will continue to work with municipalities in the NBC service area to encourage them to take steps to reduce stormwater runoff. With approval of the final plans and specifications received from DEM in 2001, the NBC began construction on the first of ten construction contracts in Phase I in June 2001, and awarded the contract for the largest construction contract in Phase I, the Main Spine Tunnel (MST), in September 2001. Construction on the MST began in the spring of 2002 and is ongoing. NBC is required to complete construction and initiate operation of Phase I of the CSO abatement plan by August 27, 2007, however, an extension of approximately one year to complete Phase I has been requested by NBC. Phases II and III are scheduled for construction in 2008-2012, and are targeted for completion by the year 2020. Water quality improvements based on both sewer system and receiving water modeling, are a reduction in overflow volume of approximately 40% after Phase I facilities are complete and approximately 98% after all phases are complete. Untreated overflow events with the entire plan in place are projected to be about four per year. Shellfishing and bathing uses will be greatly enhanced once the project is complete. It is projected that areas that are now conditionally closed to shellfishing will be closed 50% less in the Upper Bay and 78% less is the lower Bay after Phase I of the project is completed. These numbers will increase to 68% and 95% less, respectively, after Phases II and III are complete. NBC Sewer System Maintenance and Improvements BMP Implementation Throughout the course of the TMDL study, DEM staff have observed evidence of surcharging manholes along the Woonasquatucket River interceptor, upstream of Glenbridge Avenue. These surcharges constitute a source of pollution to the Woonasquatucket River. NBC should evaluate the economic and technical feasibility of reducing the volume of stormwater runoff to the interceptor, particularly in that area upstream of CSO 055. The study should delineate the contributing source area and describe the hydraulic characteristics of the area. Source control alternatives should be examined including infiltration, detention, and/or partial separation/detention/storage of

68
stormwater runoff. NBC should work with the cities of Providence and North Providence by incorporating components of their Phase II strategies for reducing stormwater runoff in these areas. DEM issued a final permit (No.RI0100315) to the Narragansett Bay Commission on January 31, 2001. Section D of the Permit authorizes NBC to discharge from 14 CSOs providing the discharges comply with EPA and RIDEM CSO Policies and the discharges receive treatment at a level providing Best Practicable Control Technology Currently Available (BPT), Best Conventional Pollutant Control Technology (BCT) to control and abate conventional pollutants and Best Available Technology (BAT) to control and abate non-conventional and toxic pollutants. RIDEM and EPA have made a Best Professional Judgment (BPJ) determination that BPT, BCT, and BAT for combined sewer overflow include the implementation of Nine Minimum Controls (NMC) specified below and detailed further in Part I.D.2 of the Permit:
• Proper operation and regular maintenance programs for the sewer system and the combined sewer overflows.
• Maximum use of the collection system for storage • Review and modification of the pretreatment program to assure CSO impacts are minimized. • Maximization of flow to the POTW for treatment. • Prohibition of dry weather overflows • Control of solid and floatable materials in CSO. • Pollution prevention programs that focus on containment reduction activities. • Public notification to ensure that the public receives adequate notification of CSO occurrences and CSO
impacts. • Monitoring to effectively characterize CSO impacts and the efficacy of CSO controls.
As part of implementing a Best Management Practices Plan for Field’s Point and Bucklin Point service areas, NBC is required to submit semi-annual reports detailing combined sewer overflow/regulator maintenance and repair, water quality monitoring, and total dry weather overflow discharge volumes. The goal of NBCs BMP implementation and sewer system maintenance and improvement strategies are to reduce or eliminate dry weather CSO discharges and inspect and maintain the approximately 105 miles (170 km) of interceptors. This is an important and ongoing component of the BMP implementation and maintenance program. There are currently 14 active combined sewer overflows discharging to the Woonasquatucket River between Glenbridge Avenue and the confluence with the Moshassuck River. As of July 2005, one or more meters are maintained at the following CSOs: (3) at OF045, (1) at OF046, (1) at OF048, (1) at OF049, (2) at OF050, (1) at OF051, (1) at OF052, (2) at OF053, (1) at OF054, (1) at OF055, and (1) at OF058. At these sites, flowmeters monitor either volume of overflow or activity of the overflow. The flow monitoring results are used to determine if and when an overflow to the Woonasquatucket occurs, monitor surcharging in the interceptor, and to develop a history of the flow data to better identify problem situations and improve efficiency. Table 4.5 in Section 4.0 summarizes dry weather CSO events in the Woonasquatucket between 2002 and 2005. The majority of these events were the result of blockages due to miscellaneous debris and grease, and pipe failures. However DEM believes that several of the outfalls, particularly CSO #54 may be cited incorrectly and allow some portion of a past wet weather overflow event to become trapped and slowly released, thereby extending the overall duration of the event as well as the resulting instream bacterial impairment. NBC is committed to eliminating or reducing all dry weather overflows in their service area and has made significant progress in this area. DEM recommends that NBC continue to undertake interim measures, including the modification of diversion structures where feasible, to eliminate dry weather overflows. NBC has two flowmeters equipped with wireless telemetry at CSO #54 and #42. This equipment is meant to measure potential overflows and help estimate the total volume from an overflow event. In the event of an

69
overflow, a signal is transmitted to NBC headquarters and staff are immediately available to respond to the event. This is a pilot project with the ultimate goal of equipping each overflow that is not eliminated under Phase I of the CSO Plan with flowmeters and telemetry. The use of telemetry flow monitoring data represents best available technology and should provide NBC with real time data necessary to minimize dry weather overflows and determine which overflows need specific BMPs. On February 7, 2007, the US Environmental Protection Agency (USEPA) issued an Administrative Order to the Narragansett Bay Commission (NBC) and other wastewater treatment facilities in Rhode Island regarding sanitary sewer overflows (SSOs). The USEPA in conjunction with the RI Department of Environmental Management (RIDEM) will embark upon an aggressive program of education and enforcement to eliminate SSOs in Rhode Island. The SSO program in Rhode Island will likely be the national model in the US EPA’s SSO strategy. The Administrative Order sets out a schedule for mandated SSO-reduction activities. Within 180 days, the NBC must submit a Capacity Management Operations and Maintenance (CMOM) Program Self-Assessment to determine whether improvements are necessary in order to preserve the infrastructure of the NBC’s sewer pipes. Because the NBC has already undertaken a CMOM program, the self assessment will document the work the NBC has done to date. Within 270 days, the NBC must develop and submit a corrective action plan that addresses any SSO-related deficiencies identified in the self-assessment. Much of the corrective work is already underway with on-going construction projects such as the Phase I CSO program, regulator modifications and sewer replacement/relining projects. Within 365 days, the NBC must submit a comprehensive CMOM program document, which must consolidate all preventive and reactive maintenance programs and capital improvement plans. RIDEM will also require a CMOM Program Implementation Annual Report to ensure that SSOs are properly identified and eliminated. The CMOM portion of the study is already complete and the interceptor capacity study is in the public meeting/public hearing stage.
7.2 Smithfield WWTF DEM issued the last Rhode Island Pollutant Discharge Elimination System (RIPDES) permit (RIPDES No. RI0100251) to the Town of Smithfield, for its Wastewater Treatment Facility, on January 25, 2000. Allowable effluent limitations, including those for Cd, Cu, Pb, and Zn, were established using the applicable acute and chronic aquatic life criteria, human health criteria, background receiving water concentrations, and available dilution. Based on historic effluent data, the Smithfield WWTF was not able to comply with the final limits for Cu and Zn. As a result, a Consent Agreement was entered into by and between DEM and the Town of Smithfield in accordance with Chapters 46-12 and 42-17.1 of the Rhode Island General Laws. The Consent Agreement included an enforceable schedule for the Town to attain compliance with the final effluent limits for average monthly and daily maximum Cu and average monthly and daily maximum Zn as specified in Part I.A.5 of the RIPDES Permit. As part of the Consent Agreement the Town was required to complete a Clean Sampling and Clean Analysis Comparative Study for both Cu and Zn in order to determine whether the sampling and analytical procedures currently being used are resulting in higher than actual metals concentrations due to contamination of the samples during collection, transport, or analysis. The study included four (4) months of comparative sampling utilizing two levels of increasing sampling and analysis cleanliness and the Town’s existing sampling and analysis protocol. The Town submitted the results of the Clean Sampling and Clean Analysis Comparative Study to DEM in May 2002 which concluded that “ultra-clean” sampling procedures did not result in lower metals concentrations when compared to the concentrations observed using existing protocols (i.e. no significant variability in the analytical results was observed). Upon evaluation of the report, DEM agreed with the conclusion that compliance with the new Cu and Zn limits cannot be achieved by implementing a clean sampling and clean analysis program.

70
However, the DEM required that the Town evaluate the current analytical test method for Zn and, if needed, change it to a test that provides greater precision and accuracy. In January 2004, the Town submitted a plan to further evaluate the analytical test methods for Zn and in February 2004, DEM approved the evaluation plan. The Town submitted the results of the evaluation in May 2004, which concluded that the sampling and analysis program the Town has been utilizing provides an accurate analysis of the Town’s sewage treatment plant effluent Zn concentration. DEM concurred with the Town’s conclusions and required the Town to move forward with implementing the requirements of Part 11(c) of the Consent Agreement which stated “ Within nine (9) months of the completion of the implementation of the recommended clean sampling and analysis techniques, the Town shall submit a Metals Compliance Report indicating if compliance with the Permit limitations for Average Monthly Copper, Daily Maximum Copper, Average Monthly Zinc, and Daily Maximum Zinc can be achieved”. In April 2005, the Town of Smithfield submitted a Local Limits and Metals Compliance Report. In order to move towards compliance with the effluent limitations for Cu and Zn and lower the overall copper and zinc loading to the WWTF, the DEM RIPDES Program suggested the following implementation schedule:
• Investigation into lowering the water supply copper concentration.
• Ensuring all significant industrial and commercial dischargers of copper and zinc have been identified.
• Evaluating all sampling sites that were used to estimate background concentrations to ensure that commercial facilities were not missed and are not contributing copper to the sampling locations.
• Collecting additional WWTF and domestic/commercial sampling data to refine values used in the
calculations. Performing a copper mass balance for the collection system, requiring industrial copper minimization plans.
• Implementing measures to address or regulate elevated loadings from non-industrial sources.
If the above tasks do not result in compliance with the copper and zinc limitations, it will be necessary to develop an additional Consent Agreement to address additional measures, above and beyond those identified above. When the new permit is issued, the Town and DEM will develop a new Consent Agreement which will include an updated compliance schedule. As part of that new consent agreement DEM will require the Town to investigate additional options such as conducting a Metals Translator Study, developing Site Specific Criteria for copper and zinc, adopting more stringent local limits, and pursuing treatment plant modifications to enhance removal if they are need to comply with final limits.
7.3 Stormwater Management
A. Phase II – Six Minimum Measures
While other wet weather sources of bacteria and dissolved metals exist, the volume of stormwater generated by the large amounts of impervious areas within the basin suggest that it is the major source of wet weather impairments in the non-CSO impaired segments of the river. Significant stormwater is generated in the urban watershed within the Cities of Providence and North Providence, and the Towns of Smithfield and Johnston. Large amounts of stormwater are also generated on RIDOT owned roadways. The City of Providence and the Towns of Johnston, North Providence, and Smithfield, and the RI Dept. of Transportation operate small Municipal Separate Storm Sewer Systems (MS4s) that discharge to the surface waters of the Woonasquatucket River and its tributaries. These entities have applied for and obtained coverage

71
under the RIPDES General Permit and have developed and submitted the required Storm Water Management Program Plans (SWMPPs). The plans contain implementation schedules that include interim milestones, frequency of activities and reporting of results. The SWMPPs describe BMPs for the six minimum measures and include measurable goals and schedules for each measure:
• A public education and outreach program to inform the public about the impacts of storm water on surface water bodies,
• A public involvement/participation program,
• An illicit discharge detection and elimination program,
• A construction site storm water runoff control program for sites disturbing 1 or more acres,
• A post construction storm water runoff control program for new development and redevelopment sites
disturbing 1 or more acres, and
• A municipal pollution prevention/good housekeeping operation and maintenance program. Storm sewers and ditches associated with stormwater runoff frequently cross municipal boundaries, and have multiple interconnections between MS4s. DEM encourages cooperation between operators of MS4s (including RIDOT) in developing and implementing the six minimum measures and constructing Best Management Practices throughout the drainage area contributing to a discharge, by the way of inter-agency agreements. Communities affected by the Phase II program are encouraged to cooperate on any portion of, or an entire minimum measure when developing and implementing their stormwater programs. Post-construction storm water management in areas undergoing new development or redevelopment is necessary because runoff from these areas has been shown to significantly affect receiving waterbodies. To meet the requirements of the Phase II minimum control measure relating to Post Construction Runoff Control, the operator of a regulated small MS4 will need to at a minimum:
• Develop and implement strategies which include a combination of structural and/or nonstructural BMPs;
• Develop an ordinance or other regulatory mechanism requiring the implementation of post-construction runoff controls to the extent allowable under State or local law;
• Ensure adequate long-term operation and maintenance of controls;
• Determine appropriate best management practices (BMPs) and measurable goals for this minimum
control measure. B. Required Amendments to Phase II Stormwater Management Program Plans Part IV.D of the General Permit states that the operator must address the TMDL provisions in the SWMPP if a TMDL has been approved for any waterbody into which storm water discharges from the MS4 contribute directly or indirectly the pollutants(s) of concern (Part II.C3). Accordingly, upon approval of this TMDL, the RI Department of Transportation, City of Providence, and Towns of North Providence, Johnston, and Smithfield will be required to submit SWMPP amendments addressing the TMDL provisions within one hundred and eighty (180) days of the date of written notice from the RIPDES Program (Rule 31 (f)(8)(iii), as described in greater detail below.

72
More specifically, the SWMPPs must be revised to describe the six minimum measures and other additional controls that are or will be implemented to address the TMDL pollutants of concern [bacteria (for sites contributing to MS4s which discharge directly to segments 10B-10D in the Woonasquatucket River and segment 01-Assapumpset Brook) and zinc (for direct discharges to reach 10A only) and zinc, copper, and lead (in reach 10D] including any specific provisions described herein. The operators must provide measurable goals for the development and/or implementation of the six minimum measures and additional structural and non-structural BMPs that will be necessary to address provisions for the control of storm water identified in this TMDL including an implementation schedule, which includes all major milestone deadlines including the start and finish calendar dates, the estimated costs and proposed or actual funding sources, and the anticipated improvement(s) to water quality. If no structural BMPs are recommended, the operator must evaluate whether the six minimum measures alone (including any revisions to ordinances) are sufficient to meet the TMDL’s specified pollutant reduction targets. The revised SWMPP must specifically address the following:
1. Determine the land areas contributing to the discharges identified in TMDL using sub-watershed boundaries as determined from USGS topographic maps or other appropriate means;
2. Address all contributing areas and the impacts identified by the Department;
3. Assess the six minimum control measure BMPs and additional controls currently being implemented or
that will be implemented in the SWMPP and describe the rationale for the selection of controls including the location of the discharge(s), receiving waters, water quality classification, shellfish growing waters, and other relevant information;
4. Identify and provide tabular description of the discharges identified in the TMDL including:
a. the location of discharge (latitude/longitude and street or other landmark; b. size and type of conveyance (e.g. 15” diameter concrete pipe);
c. any existing discharge data (flow data and water quality monitoring data);
d. impairment of concern and any suspected sources(s);
e. interconnections with other MS4s within the system; f. TMDL provisions specific to the discharge;
g. any BMP(s) that have or will be implemented to address TMDL provisions and pollutants(s) of
concern;
h. schedule for construction of structural BMPs including those for which a Scope of Work (SOW) is to be prepared, as described below.
Among the six minimum measures described earlier is the requirement for operators to establish post construction storm water runoff control programs for new land development and redevelopment sites disturbing one or more acres. It is imperative that land development and re-development projects utilize best management practices if the Woonasquatucket River is to be successfully restored. To ensure consistency with the goals and recommendations of the TMDL, the revised SWMPP must also address revisions to the local ordinances to ensure that:
1. new land development employ stormwater controls to prevent any net increase in those pollutant(s) of concern [bacteria (for sites contributing to MS4s which discharge directly to segments 10B-10D in the

73
Woonasquatucket River and segment 01-Assapumpsett Brook) and zinc (for sites contributing to MS4’s which discharge directly to reach 10A of the Woonasquatucket River and for zinc, copper, and lead for segments 10D]; and
2. redevelopment projects employ stormwater controls to reduce those pollutant(s) of concern to the maximum extent feasible [bacteria (for sites contributing to MS4s which discharge directly to segments 10B-10D in the Woonasquatucket River and segment 01-Assapumpsett Brook) and zinc (for sites contributing to MS4’s which discharge directly to reach 10A of the Woonasquatucket River and for zinc, copper, and lead for segments 10D]
The Towns should consider expanding these ordinances town-wide and lowering the threshold of applicability for these ordinances to less than 1 acre, and that the more stringent requirements apply to discharges to all surface waters within the watershed. The revised plan must include an assessment of impacts of imposing these requirements on lower threshold developments. This TMDL has determined that structural BMPs are necessary, therefore all operators of MS4s identified herein must also prepare and submit a Scope of Work describing the process and rationale that will be used to select BMPs and measurable goals to ensure that the TMDL provisions will be met. The Scope of Work must also be accompanied with a schedule prioritizing outfalls for the construction of structural stormwater BMPs. A targeted approach to construction of stormwater retrofit best management practices (BMPs) at state and locally-owned stormwater outfalls is recommended. Specifically identified priority areas for BMP construction are the stormwater outfalls located at Mancini Drive in Providence, outfalls located at the Route 44 bridge and Riverside Drive, both located in Johnston, the Woonasquatucket Avenue outfalls located in North Providence, and all Rhode Island Department of Transportation (RIDOT) outfalls draining to the Woonasquatucket. Operators of MS4s must work to identify other outfalls that contribute the greatest pollutants loads and prioritize these for BMP construction, as detailed in the following sections. C. For those operators for which specific outfalls or discharges are identified in the TMDL, the Scope of Work must:
1. Describe the tasks necessary to design and construct BMPs that reduce loads of pollutant(s) of concern (bacteria [for direct discharges to the Woonasquatucket River and Assapumpset Brook] and zinc [for direct discharges to reach 10A only]) and stormwater volumes to the maximum extent feasible including:
a. the delineation of the drainage or catchment area, b. determination of interconnections within the system and the approximate percentage of
contributing area served by each operator’s drainage system, as well as a description of efforts to cooperate with owners of the interconnected system, and
c. completion of catchment area feasibility analyses to determine drainage flow patterns (surface
runoff and pipe connectivity), groundwater recharge potentials(s), upland and end-of-pipe locations suitable for siting BMPs throughout the catchment area, appropriate structural BMPs that address the pollutants(s) of concern, any environmental (severe slopes, soils, infiltration rates, depth to groundwater, wetlands or other sensitive resources, bedrock) and other siting (e.g. utilities, water supply wells, etc.) constraints, permitting requirements or restrictions, potential costs, preliminary and final engineering requirements.
2. Establish a schedule to identify and assess all remaining discharges not identified in the TMDL (owned
by the operator) contributing to the impaired waters addressed by the TMDL, to delineate the drainage or catchment areas to these discharges, and as needed to address water quality impairments, to design and

74
construct structural BMPS. To determine the prioritization for BMP construction, the assessment of identified discharges shall determine the relative contribution of each to the pollutant(s) of concern taking into consideration pollutant loads (i.e. concentrations and flows) as indicated by drainage area, pipe size, land use, known hot spots and/or sampling data.
D. For those operators for which specific outfalls or discharges are not identified in the TMDL, the Scope of Work must:
1. Describe the tasks necessary to identify and assess all remaining discharges not identified in the TMDL (owned by the operator) contributing to the impaired waters addressed by the TMDL, and to delineate the drainage or catchment areas to these discharges. To determine prioritization for BMP construction, the assessment of identified discharges shall determine the relative contribution of each to the pollutants(s) of concern (bacteria [for direct discharges to the Woonasquatucket River and Assapumpset Brook] and zinc [for direct discharges to reach 10A only]) taking into consideration pollutant loads (i.e. concentrations and flows) as indicated by drainage area, pipe size, land use, known hot spots and/or sampling data.
2. Establish a schedule to design and construct BMPs that reduce loads of pollutant(s) of concern and
stormwater volumes to the maximum extent feasible as described in detail above.
7.4 MS4-Specific Requirements
Town of Smithfield
In March 2004, the Town of Smithfield submitted a Draft Phase II Stormwater Management Program Plan. Based on RIGIS mapping, nearly 88% of the town is located within the Woonasquatucket River basin. A majority of the land use within the town is forested and rural land, however south of Georgiaville Pond, along the mainstem Woonasquatucket, land use is a combination of high-density residential, commercial, and industrial. Water quality data collected at stations located within the town of Smithfield from Whipple Avenue downstream to the North Providence border indicate that bacterial impairments exist during both dry and wet weather. The Town of Smithfield has reported that it has located all known outfalls within the storm sewer system. Figure 10 in the Town’s 2004 SWMPP presents the location of all known outfalls within the Woonasquatucket River watershed owned and operated by the Town. According to the SWMPP there are approximately 62 outfalls that discharge to the Woonasquatucket Reservoir, Stillwater Pond, Capron Pond, Georgiaville Pond, Greystone Mill Pond, or the Woonasquatucket River mainstem or tributaries. The Town has collected pertinent information regarding outfall diameter and condition, maintenance, location, and plat-lot information. Upon approval of this TMDL, the Town will have 180 days to amend its SWMPP consistent with Part IV.D of the General Permit and more specifically, Sections 7.3B and 7.3D of this TMDL. The Town should coordinate with RIDOT to complete the identification, mapping, and determination of ownership and interconnections for all stormwater outfalls discharging directly to the river. Unless the Town provides documentation identifying higher priority areas, priority areas must include outfalls and any other stormwater conveyances located downstream of Esmond Mill, including those that discharge to Greystone Mill Pond. Streets within this area exhibit significant slopes towards the river and allow rapid concentration and transport of stormwater to the pond. Priority should also be given to those outfalls that are greater than 24” in diameter or that drain catchments having significant urban, commercial, or industrial land uses. To demonstrate that the pollutants of concern have been reduced to maximum extent feasible, all BMP evaluations must investigate the feasibility of distributing water quality treatment and/or infiltration BMPs, which specifically address the pollutants of concern, throughout the drainage area of priority outfalls. DEM encourages the Town to evaluate the feasibility of also reducing the runoff volume and load of pollutants generated on private properties, which drain to the MS4 by investigating opportunities to treat and/or infiltrate runoff on-site (i.e. infiltrating roof and site runoff and/or redirecting stormwater to areas on the property where infiltration can occur).

75
The Town’s SWMPP has recommended developing a plan to address stormwater issues at the Benny’s Warehouse, a mill in Esmond located directly adjacent to the Woonasquatucket River. Stormwater runoff from the mill complex presently drains unabated into the Woonasquatucket River via several separate conveyances. The Town plans to explore the potential to work with the mill owners to develop BMPs that will improve the quality of stormwater discharged to the river from the mill sites. DEM recommends that the Town and mill owners proactively explore the potential to reduce the volume of stormwater discharged to the river (i.e. infiltrating roof and site runoff) and investigate opportunities to redirect stormwater to areas on the property where infiltration can occur. DEM recommends that the Town also work with WESCO Inc., a facility located in Smithfield, and along the Woonasquatucket River near the outlet of the Woonasquatucket Reservoir and Farnum Pike Road. It appears that stormwater from this facility drains via approximately 5 catch basins directly to the Woonasquatucket River from a 6-10 inch corrugated pipe. A wet weather dissolved zinc violation occurred downstream of this site, as measured at Station WR1. The area served by the catch basins appears to serve a variety of commercial uses. Dye studies to verify the integrity of homeowner connections to the sewer system near the reservoir and to evaluate whether any chronic sewage leaks are occurring have been completed by the municipality at several locations in the watershed. DEM recommends that these studies continue as Town resources allow.
Town of Johnston In March 2004, the Town of Johnston submitted a Draft Phase II Stormwater Management Program Plan. Based on RIGIS mapping, much of the Town of Johnston within the Woonasquatucket basin consists of high-density residential land uses. Large commercial and industrial developments also exist within the watershed, including development along Hartford Ave. (Route 6A) and west of Route 128. Water quality data collected at stations located within the town of Johnston from Greystone Mill Pond to Dyerville Park indicate that bacterial impairments exist during both dry and wet weather. Staff from Region 1 EPA Office of Environmental Measurement and Evaluation (OEME) surveyed the Woonasquatucket River in July-August 1998 and identified a total of 317 pipes discharging from 180 locations downstream of Georgiaville Pond. The EPA outfall survey identified approximately 8 outfalls located along the Woonasquatucket River within the Town of Johnston. These outfalls range in size from 18 to 24” in diameter but it is unclear whether the outfalls are owned by the Town, RIDOT, or are privately owned. Upon approval of this TMDL, the Town of Johnston will have 180 days to amend its SWMPP consistent with Part IV.D of the General Permit and more specifically, Section 7.3B and 7.3C of this TMDL. The Town should coordinate with RIDOT to complete the identification, mapping, and determination of ownership and interconnections for all stormwater outfalls discharging directly to the river. Two priority outfalls, recently sampled during wet weather by DEM in 2001-02 and designated in the RIDEM wet weather survey as ‘S1’ (EPA outfall 158) and ‘S2’ (EPA outfall 142), exhibited elevated levels of fecal coliform bacteria and dissolved metals, particularly zinc and copper. EPA outfall 158 is located near the end of Riverside Drive near the intersection with Kenton Street. EPA outfall 142 is located on the downstream side of the Route 44 Bridge. Priority should also be given to those outfalls that are greater than 24” in diameter or that drain catchments having significant urban, commercial, or industrial land uses. To demonstrate that the pollutants of concern have been reduced to maximum extent feasible, all BMP evaluations must investigate the feasibility of distributing water quality treatment and/or infiltration BMPs, which specifically address the pollutants of concern, throughout the drainage area of priority outfalls. DEM encourages the Town of Johnston to evaluate the feasibility of also reducing the runoff volume and load of pollutants generated on private properties, which drain to the MS4 by

76
investigating opportunities to treat and/or infiltrate runoff on-site (i.e. infiltrating roof and site runoff and/or redirecting stormwater to areas on the property where infiltration can occur). Unless the Town provides documentation identifying higher priority areas, priority areas must also include areas of Johnston which drains to Mancini Drive outfall as well as those outfalls and any other stormwater conveyances located in Centerdale. Particular attention should be given to those commercial and industrial areas located between Route 128 and the mainstem of the Woonasquatucket. Many of the commercial and industrial properties are located on sloped parcels and contain large amounts of impervious area. Many other streets within Johnston exhibit a significant slope towards the river and allow rapid concentration and transport of stormwater to the river, particularly to Allendale Mill and Lyman Mill Ponds. All BMP evaluations must investigate the feasibility of distributing infiltration BMPs throughout the drainage area of priority outfalls. The Town of Johnston must make efficient removal of debris, litter, and accumulated sediments and pollutants of concern on streets a priority and tailor street sweeping activities accordingly. As part of its Good Housekeeping/Pollution Prevention requirements (Section 7.3a), the Town of Johnston must conduct street sweeping more than the required once-annual schedule within those areas located east of Route 128 that drain directly to the river The Town must provide description of maintenance activities, maintenance schedules, and long-term inspection procedures for controls to reduce floatables and other pollutants from the MS4. The description must include one or more floatable control options which could include, but are not limited to storm sewer grate retrofits, increased number of litter receptacles in areas frequented by pedestrian traffic, trash netting and/or other equivalent technologies. As stated in the SWMPP and in order to prevent water quality impairments from stormwater runoff, the Town must focus their efforts on the following:
• Focus commercial and industrial educational programs on companies located within the floodplain. These programs must include discussions of proper waste management and good housekeeping practices.
• Prioritize the Illicit Discharge and Detection Elimination surveys and bracket potential sources in
stormwater discharges within the W6 (Mancini Drive outfall) catchment area. Every effort should be made to eliminate these sources as soon as possible..
• Focus on an aggressive town-wide educational program to change current behaviors to protect and
preserve water quality in the Woonasquatucket. Topics that must be included are pet and solid waste management, proper lawn care and good housekeeping practices, and discouraging litter and debris disposal.
• Consider other litter management strategies such as increasing the number of trash cans in common areas,
using youth volunteers to pick up trash, increasing the number of dog waste receptacles, and targeted inspections by city officials to insure dumpsters are covered and regularly emptied.
• The eastern area of Johnston located between Route 128 and the Woonasquatucket River where
significant amounts of industrial, commercial, and high-density residential areas exist. Focusing on the illicit discharges in this area may dramatically reduce the amount of pathogens discharged to the Woonasquatucket River.
Town of North Providence In March 2004, the Town of North Providence submitted a Draft Phase II SWMPP. Based on RIGIS mapping, North Providence consists almost entirely of medium high to high density residential land uses. Large commercial developments also exist, including development along Mineral Springs Avenue and at its

77
convergence with Route 44 and 104. Significant industrial activities also exist along the Woonasquatucket River. Given the location of the developed areas in North Providence, in part along the Woonasquatucket River, there is significant potential for water quality impacts from stormwater runoff. Upon approval of this TMDL, the Town of North Providence will have 180 days to amend its SWMPP consistent with Part IV.D of the General Permit and more specifically, Section 7.3B and 7.3D of this TMDL. The Town of North Providence and DOT will be required to identify all outfalls to the Woonasquatucket as part of their Stormwater Phase II Requirements. The Town should coordinate with RIDOT to complete the identification, mapping, and determination of ownership and interconnections for all stormwater outfalls discharging directly to the river. The Town of North Providence has limited existing mapping of the storm sewer drainage system as a result of a study completed by the Narragansett Bay Commission in the 1980’s. Additional outfall information should include results from the EPA outfall survey which identified approximately 24 outfalls to the Woonasquatucket River in North Providence, ranging from 4 to 36 inches in diameter. North Providence must establish a plan to identify all outfalls, including channelized flows, to the Woonasquatucket as part of their Stormwater Phase II Requirements. The Town should utilize the existing information compiled by EPA and coordinate with the NBC and DOT to confirm EPA study outfalls and identify and map all remaining outfalls. Priority areas for BMP implementation must include the Woonasquatucket Ave outfall, which was sampled by DEM in 2001-02 and exhibited elevated levels of dissolved metals and fecal coliform bacteria. Unless the Town provides documentation identifying higher priority areas other priority areas must include outfalls and any other stormwater conveyances located in Greystone, Centerdale, Allendale, and Lymansville. Many streets within this area exhibit a significant slope towards the river and allow rapid concentration and transport of stormwater to the river, particularly Allendale Mill and Lyman Mill Ponds. Priority should also be given to those outfalls that are greater than 24” in diameter or that drain catchments having significant urban, commercial, or industrial land uses. To demonstrate that the pollutants of concern have been reduced to maximum extent feasible, all BMP evaluations must investigate the feasibility of distributing water quality treatment and/or infiltration BMPs, which specifically address the pollutants of concern, throughout the drainage area of priority outfalls. DEM encourages the Town of North Providence to evaluate the feasibility of reducing the runoff volume and load of pollutants generated on private properties, which drain to the MS4 by investigating opportunities to treat and/or infiltrate runoff on-site (i.e. infiltrating roof and site runoff and/or redirecting stormwater to areas on the property where infiltration can occur). As part of its Good Housekeeping/Pollution Prevention requirements (Section 7.3a), the Town must investigate the feasibility of street sweeping certain areas within the watershed more than the required once-annual schedule. Additional street sweeping would be beneficial within the Greystone, Allendale, Centerdale, and Lymansville Areas. Street sweeping could occur more regularly in those areas within the immediate topographic boundary of the river (i.e. focusing on those streets and roads that drain directly towards the river). The Town must make efficient removal of debris and litter on streets a priority and tailor street sweeping activities accordingly. As stated in the SWMPP and in order to prevent water quality impairments from stormwater runoff, the Town must focus their efforts on the following, particularly in the Lymansville, Allendale, Centerdale, and Greystone neighborhoods:
• Relative to implementation of the six minimum measures, priority areas include the area along Mineral Spring Avenue where significant amounts of industrial, commercial, medium high and high-density residential areas exist. Focusing on street sweeping and drainage system maintenance, such as catch basin cleaning, in this area could minimize water quality problems in the area. Priority areas also include the
78
land adjacent to the eastern side of the Woonasquatucket River where significant industrial and high-density areas are located. Focusing on illicit discharges in this area could drastically improve many of the existing impairments to the Woonasquatucket River.
• Conducting public awareness programs to educate the general public on the potential adverse impacts of
stormwater and involve them in pollution prevention efforts. Consider targeting the program to illicit discharges such as dumping into storm drains, outdoor washing activities, illegal dumping, pet waste management, and litter and garbage management to address the levels of pathogens discharged from the storm sewer system.
• The illicit detection program must be focused on areas discharging to the Woonasquatucket River.
• Focus commercial and industrial educational programs on companies located within the floodplain.
These programs must include discussions of proper waste management and other good housekeeping practices.
• Focus on an aggressive town-wide educational program to change current behaviors to protect and
preserve water quality in the Woonasquatucket. Topics that must be included are pet and solid waste management, proper lawn care and good housekeeping practices, and discouraging litter and debris disposal.
• Consider other litter management strategies such as increasing the number of trash cans in common areas,
using youth volunteers to pick up trash, increasing the number of dog waste receptacles, and targeted inspections by city officials to insure dumpsters are covered and regularly emptied.
City of Providence The City of Providence submitted a Draft Phase II Stormwater Management Program Plan in March 2004. TMDL recommendations for the city focus on the control of stormwater from the large amounts of impervious area draining to the river. The EPA Pipe Reconnaissance Survey identified approximately 236 pipes along the Woonasquatucket within the city limits of Providence. The SWMPP requires the City to compile a map of existing storm sewer outfalls based on existing municipal mapping and GIS projects. The City should utilize the existing information compiled by EPA and coordinate with the NBC and RIDOT to confirm EPA study outfalls and identify and map any remaining outfalls. Upon approval of this TMDL, the City of Providence will have 180 days to amend its SWMPP consistent with Part IV.D of the General Permit and more specifically, Section 7.3B and 7.3D of this TMDL. The City of Providence will be required to identify all outfalls, including channelized flows, to the Woonasquatucket as part of their Stormwater Phase II Requirements. The City should coordinate with RIDOT to complete the identification, mapping, and determination of ownership and interconnections for all stormwater outfalls discharging directly to the river. BMP Priority areas must include those outfalls and any other stormwater conveyances located in Dyerville, Olneyville, and Smith Hill. Many streets within this area exhibit a significant slope towards the river and allow rapid concentration and transport of stormwater to the river. Priority must be given to those outfalls that are greater than 24’ in diameter. All BMP evaluations must investigate the feasibility of distributing infiltration throughout the drainage area of priority outfalls. As part of its Good Housekeeping/Pollution Prevention requirements (Section 7.3a), the City must investigate the feasibility of street sweeping certain areas within the watershed more than the required once-annual schedule.

79
Additional street sweeping would be beneficial within the Olneyville areas. Street sweeping must also occur more regularly in those areas within the immediate topographic boundary of the river (i.e. focusing on those streets and roads that drain directly towards the river). In addition, the City must make efficient removal of debris and litter on streets a priority and tailor street sweeping activities accordingly. The City should coordinate with NBC and examine the feasibility of increased street sweeping activities within the CSO catchments. This would have the added benefit of reducing litter and debris that enters and oftentimes blocks regulators and diversion structures causing dry weather overflows. As stated in the SWMPP and in order to prevent water quality impairments from stormwater runoff, the City must focus their efforts on the following, particularly in the Smith Hill and Olneyville neighborhoods:
• Focus commercial and industrial educational programs on companies located within the floodplain. These programs must include discussions of proper waste management and good housekeeping practices. The City should continue to work with and support the efforts of watershed organizations such as the Woonasquatucket River Watershed Council.
• Focus on an aggressive city-wide educational program to change current behaviors to protect and preserve
water quality in the Woonasquatucket. Topics that must be included are pet and solid waste management, proper lawn care and good housekeeping practices, and discouraging litter and debris disposal.
• The areas located along Kinsley and Promenade Street where significant amounts of industrial,
commercial, and high-density residential areas exist. Focusing on the illicit discharges in this area may dramatically reduce the amount of pathogens discharged to the Woonasquatucket River.
• Consider other litter management strategies such as increasing the number of trash cans in common areas,
using youth volunteers to pick up trash, increasing the number of dog waste receptacles, and targeted inspections by city officials to insure dumpsters are covered and regularly emptied.
RIDOT Stormwater Retrofit Projects Major state roads within the Woonasquatucket basin include Route 6, Route 10, Route 95, and Route 44. Under the Intermodal Surface Transportation Efficiency Act of 1991, the Rhode Island Department of Transportation (RIDOT) was given monies for the design and construction of a stormdrain retrofit on I-95 and other highway runoff programs to protect Narragansett Bay and its major tributaries. The results are presented in the “I-95 Stormdrain Retrofit Demonstration Project” report (URI 1996). RIDOT is currently in Phase III of the stormdrain retrofit program, which represents an innovative, pro-active and cooperative approach to design stormwater projects. RIDOT worked cooperatively with the URI Department of Civil and Environmental Engineering to perform an extensive evaluation of all 196 existing state outfalls within the watersheds of the Pawtuxet, Woonasquatucket, and Moshassuck Rivers. Upon completion of this assessment, URI identified the top 20 priority outfalls and recommended those for consideration of stormwater improvements. Of 20 priority outfalls, three discharge to the Woonasquatucket River, W6 (Mancini Drive outfall), W23 (48-inch outfall near Providence Place Mall), and W2 (24-inch outfall near Providence Place Mall). RIDEM has worked with RIDOT and its consultant to design stormwater BMPs at each of these locations. An infiltration trench and 2 water quality detention ponds to capture and treat runoff from Route 6 are planned for the W6 catchment area. Whereas due to severe site constraints, only subsurface swirl type BMPs will be installed at W23 and W2. Construction of these BMPs is planned for Spring 2007. DEM recommends that DOT construct stormwater BMPs at all state roads draining to the two outfalls comprising W6 including Hartford Ave and Killingly Street. As stated previously, DEM also recommends that the City of

80
Providence and the Town of Johnston conduct complementary catchment area analyses to identify opportunities for stormwater treatment and volume reduction prior to discharge into the state drainage systems. Stormwater Phase II Plan RIDOT submitted a Draft Phase II Stormwater Management Program Plan in March 2003. RIDOT owns numerous direct stormwater discharges throughout the Woonasquatucket River watershed. RIDOT must coordinate its efforts, particularly outfall mapping and identification, with the local municipalities in the priority areas of Providence, North Providence, Johnston, and Smithfield. As part of its SWMPP, DOT plans to hire a mapping vendor to identify and map outfalls in the Woonasquatucket River watershed within year 2 of the plan. RIDOT is in the process of developing a scope of work for a Request for Proposals to hire a vendor. The scope of work will include GPS location and documentation, inspection of outfalls for dry weather flows, and sampling of dry weather flows. Upon approval of this TMDL, RIDOT will have 180 days to amend its SWMPP consistent with Part IV.D of the General Permit and more specifically, Section 7.3b and 7.3d of this TMDL. RIDOT should coordinate with Cities and Towns within the Woonasquatucket River watershed to complete the identification, mapping, and determination of ownership and interconnections for all stormwater outfalls discharging directly to the river. RIDOT should utilize existing studies that have identified and mapped many of the outfalls within the watershed. Two major studies exist that would provide valuable information needed to complete this BMP. As part of a I-95 Stormwater Retrofit Demonstration Project, URI researchers identified a total of six stormdrains from I-95 and eighteen from Route 6 that discharge directly to the Woonasquatucket River. Additionally, The Region 1 EPA Office of Environmental Measurement and Evaluation (OEME) surveyed the river in July-August 1998 and found a total of 317 pipes discharging from 180 locations downstream of Georgiaville Pond. It is unclear how many of these outfalls are owned by RIDOT however the survey does provide location information that could be used by RIDOT. Following outfall identification and mapping of RIDOT owned outfalls in the Woonasquatucket watershed, RIDOT should work with the towns of Smithfield, Johnston, and North Providence, and the city of Providence to prioritize outfalls and investigate areas for stormwater treatment. RIDOT should conduct a BMP feasibility study to identify ways to mitigate stormwater entering the Woonasquatucket from Route 6, Route 44, Interstate 295, and Interstate 95. Consistent with post construction stormwater requirements, transportation infrastructure construction must employ stormwater controls to prevent any net increase in those pollutant(s) of concern [bacteria (for direct discharges to the Woonasquatucket River and Assapumpset Brook) and zinc (for direct discharges to reach 10A only)], and transportation infrastructure reconstruction must employ stormwater controls to reduce those pollutant(s) of concern [bacteria (for direct discharges to the Woonasquatucket River and Assapumpset Brook) and zinc (for sites contributing to MS4’s which discharge directly to reach 10A of the Woonasquatucket River and for zinc, copper, and lead for segments 10D] to the maximum extent feasible
Mancini Drive Outfall (W6) Catchment Area The catchment draining to the Mancini Drive outfall, also referred to as W6, consists of approximately 37 commercial businesses within Johnston and Providence and includes Metals Recycling L.L.C. The W6 outfall is comprised of two outfalls, S4 (72” RCP) and S5 (60” RCP). Land use within both S4 and S5 catchments include commercial, industrial, transportation (RIDOT-owned roadways), and high-density residential within the city of Providence and the Town of Johnston. A NPS Pollution Abatement Grant was awarded to the University of Rhode Island in 2003 to conduct pollution prevention assessments in all commercial and industrial areas within the W6 catchment portion of the Woonasquatucket River watershed. The project was funded as part of ongoing efforts by DEM and NBC to assess potential non-point source pollution in the catchment area. Because of the high concentration of

81
commercial businesses in the area, particularly automotive recycling, repair, and autobody refinishing businesses, it was originally assumed that these businesses might contribute to the pollution loadings to the Woonasquatucket River. The project consisted of inspections, audits, and pollution prevention outreach and education by URI and DEM Office of Compliance and Inspection staff for the approximately 37 businesses within the W6 catchment. The final report, prepared by URI, indicates that the businesses within the catchment are not a significant contributor of nonpoint source pollution. The only potential discharge issues were determined to be related to car washing and wet sanding in autobody shops. The two autobody shops, which URI worked with, have subsequently adopted methods to minimize the amount of water used to better control handling of potential pollutants like metals and bonding chemicals. Where operating procedures previously allowed unspecified amounts of washwater to leave the site and enter local storm drains, these facilities currently make use of dry sanding and dry wiping techniques to remove old paint, chemicals, dirt and grit prior to using small amounts of water to clean off residual materials. Any excess water created is collected in floor trench systems. URI plans to continue to work with businesses in the catchment to continue to provide assistance with pollution prevention and control, and continue efforts to improve wastewater collection. Stormwater from Industrial Facilities
The TMDL has demonstrated that stormwater is a major source contributing to violations of fecal coliform and metals criteria in the Woonasquatucket River and bacteria criteria in Assapumpset Brook. Stormwater discharges from industrial facilities may be discharged to these waters directly or via the MS4s and may contain bacteria and/or dissolved metals concentrations that contribute to these exceedances. Stormwater discharges from facilities that discharge “stormwater associated with industrial activity” are regulated under the statewide general RIPDES permit prescribed in Chapter 46-12, 42-17.1 and 42-35 of the General Laws of the State of Rhode Island. In accordance with Part I.B.3.j of the RIPDES Multi-Sector General Permit, prior to authorization to discharge stormwater associated with industrial activity, the applicant is required to demonstrate that the stormwater discharge is consistent with the requirements of the TMDL. With completion of this TMDL, consistent with Part I.C. of the general permit, facilities currently authorized to discharge under the permit must either demonstrate that the existing Storm Water Pollution Prevention Plan (SWPPP) is consistent with the TMDL or amend their plan demonstrating consistency with the TMDL. More specifically, the TMDL requires that facilities currently authorized or seeking authorization to discharge to the Woonasquatucket River or Assapumpset Brook must demonstrate that their SWPPP reduces to the maximum extent feasible bacteria and also zinc if they discharge to reach 10A, as further described below. Permittees will have 90 days from written notification by RIDEM to submit this documentation including revised SWPPPs to RIDEM. The owner/operators of facilities currently authorized are listed below.
• North Providence Auto Salvage • Reds Auto Recycling • RI National Guard • RI National Guard • The Providence Journal • Tanury Plating Company
The SWPPP must identify the potential sources of pollution, including specifically the TMDL pollutants of concern (bacteria and for reach 10A, zinc), which may reasonably be expected to affect the quality of storm water discharges from the facility; and describe and ensure implementation of practices, which the permittee will use to reduce the pollutants in storm water discharges from the facility. The SWPPP must address all areas of the

82
facility and describe existing and/or proposed BMPs that will be used to achieve the maximum extent feasible reduction of the TMDL pollutants of concern. As stated in Part IV.F.7 of the permit, selection of BMPs should take into consideration: 1.the quantity and nature of the pollutants, and their potential to impact the water quality of receiving waters; 2.opportunities to combine the dual purposes of water quality protection and local flood control benefits (including physical impacts of high flows on streams - e.g., bank erosion, impairment of aquatic habitat, etc.); and 3.opportunities to offset the impact of impervious areas of the facility on ground water recharge and base flows in local streams. For existing facilities, the SWPPP must include a schedule specifying when each control will be implemented. Facilities that are not currently authorized will be required to demonstrate compliance with these requirements prior to authorization. Metals Recycling L.L.C. During the TMDL technical study, and prior to adoption and compliance with the Stormwater Pollution Prevention Plan, it was determined that Metals Recycling was a source of Cd, Cu, Pb, and Zn to the Woonasquatucket River via the S4 outfall. Elevated concentrations of dissolved Cd, Cu, Pb, and Zn were measured during both wet and dry weather. The catchment area for the W6 outfall includes Metals Recycling L.L.C. and approximately 37 other commercial businesses, many of which are autobody repair shops. The primary contributor of metals to the W6 outfall was determined to be Metals Recycling L.L.C, therefore DEM staff conducted detailed investigations of both day-to-day operations and exiting stormwater management at the facility. These investigations revealed several problems with facility operations that likely contributed to water quality impairments in the Woonasquatucket. During the technical study, Metals Recycling L.L.C. used both of its settling ponds as a disposal site of water used in the metal recycling/quenching process. These basins then discharged, during dry weather, to an unnamed stream, which then discharged to the S4 outfall, located at Mancini Drive. It was also determined that stormwater runoff from the facility was coming into contact with industrial/recycling operations and transporting pollutants to the unnamed stream and W6. A large portion of the facility is sited on old wetlands and an unnamed stream drains portions of the site, including the waste lagoon located near the sorting and crushing operations. EPA entered into two Administrative Consent Orders with Metals Recycling,LLC,of Johnston, RI, to resolve alleged violations of RCRA. The alleged violations included, but were not limited to, unpermitted storage of non-metallic material, known as auto shredder residue (ASR), which was above lead hazardous waste levels. The piles of ASR stored by the company were estimated to weigh between 10,000 and 20,000 tons. Under the first agreement finalized on September 29,2001,the company agreed to pay a cash penalty of $200,000.The second agreement, finalized on November 5,2001,required the facility to reduce the lead contamination on-site by treating the ASR piles using portland cement in order to prevent leachates into the ground. In recent years, Metals Recycling L.L.C. has worked with RIDEM to implement more environmentally responsible management practices and develop a stormwater management plan to address the transport of onsite contaminants associated with stormwater to the S4 outfall. DEM issued a final individual permit (No.RI0023485) to Metals Recycling L.L.C. on October 1, 2004. The permit authorizes the discharge of stormwater and certain non-stormwater discharges and also establishes requirements for the control of pollutants in stormwater. The Permit requires Metals Recycling L.L.C. to comply with the terms and conditions of the approved SWPPP, including completion of construction, and initiation of operation of stormwater controls and Best Management Practices identified in the METALS RECYCLING, L.L.C. STORMWATER POLLUTION PREVENTION PLAN dated May 27, 2003 (the “SWPPP”). The SWPPP prepared to meet the requirements for SWPPPs for scrap recycling and waste recycling facilities as set forth in the RIPDES General Permit for Storm Water Discharge Associated with Industrial Activity (General Permit) issued March 2003. The major elements of the SWPPP for Metals Recycling L.L.C. are as follows:

83
• Description of potential pollutant sources including a list of significant materials exposed to stormwater,
a history of significant spills and leaks, a prediction of stormwater runoff flow direction, a list of pollutants , a summary of existing sampling data, and an itemization of non-stormwater discharges.
• Stormwater management controls including the identification of a stormwater pollution prevention team,
risk identification and assessment, material inventory, descriptions of preventative maintenance, good housekeeping, spill prevention and response procedures, stormwater management and sediment and erosion prevention practices, employee training, visual inspections, record keeping and internal reporting procedures, and an evaluation for non-stormwater discharges.
• Annual facility inspections.
• Certifications by the facility owner and operator.
Quarterly compliance monitoring will take place at the major outfall (001A) on site and located upstream from the S4 outfall. Monitoring will include the analysis of total Cd, Cu, Pb, and Zn. As stated in the Permit and starting twelve (12) months after the effective date of the Permit, Metals Recycling L.L.C. is required to compare all sampling results to the following benchmark monitoring concentrations listed in the Permit. Exceedances of the benchmark values will trigger a review of the facility’s SWPPP by the permittee and reasonable modification as necessary. A report of the permittee’s ability to comply with the benchmark concentrations shall be submitted to DEM annually with a Comprehensive Site Evaluation Report.
7.5 Other Implementation Measures
CERCLA Sites, LUST Sites, DSR Sites Given the fact that contaminated sediments and groundwater have the potential to be sources of dissolved metals to the Woonasquatucket River, it is essential that existing programs dedicated to the identification and remediation of known sites continue. RIDEM Office of Waste Management oversees several programs that provide comprehensive and consistent regulation of the investigation and remediation of hazardous waste and hazardous material releases consistent with federal program. The State program is designed to determine if a site poses a threat to human health and the environment and efficiently determine a remedy which is effective but not overly burdensome to the parties involved. This program also supports the redevelopment and reuse of contaminated sites through the Brownfields program. Sites are identified, evaluated, and cleaned up, both in a reactive and proactive manner, and brought back to beneficial reuse in Rhode Island communities. Waterfowl and Domestic Pets Past TMDL studies have shown that waterfowl, wildlife, and domestic pets contribute significantly to elevated bacteria concentrations in surface water. Pet waste left to decay on the sidewalk, or on grass near the street, may be washed into storm sewers by rain or melting snow and cause water quality impairments. Individuals, particularly children, who play in yards or in parks where pet waste is present can pick up illnesses from disease-causing bacteria and parasites. Stormwater Phase II requirements include an educational program to inform the public about the impact of stormwater. The Woonasquatucket River communities should address the importance of picking up after pets and not feeding birds in their education and outreach programs. Pet wastes should be disposed of away from the Woonasquatucket River and any stormwater system that discharges to any of these locations. The Woonasquatucket River Watershed Council should work with volunteers from Providence, North Providence, and Johnston to map locations where pet waste is significant and chronic problem. This work should be incorporated
84
into the municipalities Phase II plans and should result in an evaluation of strategies to reduce the impact of pet waste on water quality. This may include installing signage, providing pet waste receptacles or pet waste digester systems in high-use areas, and targeting educational and outreach programs in problem areas. Owners of all MS4’s should install signage at all parks and public greenway areas where pets are commonly walked. The signage should include detailed information regarding the local ordinances regarding pet waste disposal, as well as the risks to human health and water quality. Pet waste collection bags and receptacles should be placed and maintained within these areas. Mailings to pet owners detailing the above-mentioned information should be considered. Fish and Wildlife Regulations, Part XIV Section 14.13 (2006) prohibits feeding wild waterfowl at any time in the state of Rhode Island (http://www.dem.ri.gov/pubs/regs/regs/fishwild/hunt0607.pdf). Educational programs should emphasize that feeding waterfowl, such as ducks, geese, and swans, contributes to water quality impairments in the Woonasquatucket River and can harm human health and the environment. Municipalities should ensure that mention of this regulation is included in their SWMPPs. Urban Litter, Commercial and Residential Waste Management Municipalities should work with the Woonasquatucket River Watershed Council (WRWC) to identify and map problem disposal sites that border the Woonasquatucket River. Once these sites are identified, the municipalities should develop aggressive plans to address these issues. BMPs should be incorporated into the SWMPPs. DEM recommends an effective integrated catchment-wide litter management strategy including educational campaigns to bring about greater public awareness and response to the litter problem, waste reduction to reduce the generation of urban waste, cleansing operations to prevent urban waste from getting into the river, and law enforcement to insure compliance. All municipalities need to actively enforce complaints. Citizens and watershed groups need to ensure that complaints are submitted and followed up on. Consideration should be given to placement and routine emptying of trash receptacles in areas of heavy pedestrian traffic. Municipalities should also consider use of youth volunteers or interns to pick up trash on city streets. City officials should also conduct periodic inspections of commercial properties and document routine violations or problem areas to receive immediate notification of failure to comply and subsequent enforcement actions.
7.6 Implementation Measures Summary DEM will continue to work with DOT and the local municipalities to identify funding sources and evaluate locations and designs for stormwater control BMPs throughout the watershed. Table 7.1 summarizes the recommended implementation activities, as well as ongoing water quality improvement projects for all communities within the Woonasquatucket River watershed.
Table 7.1 TMDL Implementation Actions Summary.
Implementation Project
Description of Implementation Activity Responsible Parties Projected
Completion Date CSO Abatement CSO project would result in Narragansett Bay Commission Phase III to be

85
Project containment of sewage overflows during rain events and release to facilities for treatment. Will result in the reduction of wet weather overflows from 70 to 4 per year.
City of Providence completed by 2020.
NBC Sewer System Maintenance and Improvements
NBC must comply with EPA and RIDEM CSO Policies to control and abate non-conventional and toxic pollutants. NBC to investigate Woonasquatucket Interceptor surcharges and evaluate interim measures to reduce frequency and volume of overflows.
Narragansett Bay Commission Ongoing
Re-issuance of permit for Smithfield WWTF
Goal is to have WWTF comply with permit limitations for total Cd, Cu, Pb, and Zn.
Town of Smithfield New permit issued in 2007
Stormwater Phase II Minimum Measures and Additional Measures
Implementation of Six-minimum measures and additional measures specific to each municipality recommended by this TMDL.
RIDOT Providence North Providence Smithfield Johnston
Plans submitted to DEM as required. All SWMPPs to be modified within 180 days of final approval of TMDL.
Adoption of local requirements for new development and re-development to reduce runoff volumes
Local Ordinances should institute stormwater volume reduction requirements for redevelopment of commercial and industrial properties
Providence North Providence Smithfield Johnston
As part of Phase II minimum measures
Educational Programs
Programs should target pet waste, feeding waterfowl, litter control and proper waste management
Providence North Providence Smithfield Johnston Woonasquatucket River Watershed Council
As part of Phase II minimum measures
8.0 Public Participation

86
A public meeting will be held following the EPA initial review when the draft Woonasquatucket River fecal coliform and dissolved metals TMDL’s are presented for public review and comment. Following the presentation, the public will have a 30-day period in which to submit comments on the study and its findings. DEM presented the draft TMDL plan to stakeholders and the general public on January 4th, 2007. The public meeting began the 30-day public comment period, which ended on February 5th, 2007. Letters were sent to key stakeholders in advance of the meeting. In addition, the meeting was publicized in a press release, public notices-which were posted at all Town and City Halls and Libraries, and by contacting the Woonasquatucket River Watershed Council. The meeting was held at DEM offices in Providence but was sparsely attended by the public, public officials, and other agencies. Total attendance was estimated at 12 individuals, not counting DEM staff. DEM received several comments during the public comment period. These are presented in Appendix B. Meeting notes are presented in Appendix C.
87
9.0 Future Monitoring This is a phased TMDL and, as such, additional monitoring is required to ensure that water quality objectives are met as remedial actions are accomplished. Monitoring by two organizations, the Woonasquatucket River Watershed Council (WRWC) and the Narragansett Bay Commission will be the principle method of obtaining the data necessary to track bacteriological water quality conditions in the watershed. Periodic dissolved metals sampling will be carried out at specific locations jointly by the Town of Smithfield and RIDEM, as specified in the permit. Six (6) stations along the Woonasquatucket River will continue to be monitored weekly and bi-weekly by staff from the NBC. The sampling is routine and occurs under both dry and wet weather conditions. Samples are typically collected in the beginning of the week and analyzed by the NBC Laboratory for fecal coliform bacteria using the A1 Medium method within a 24-hr period. Rain data are collected by NBC’s Interceptor Maintenance and Construction section (IMC) and/or RIDEM and sent to EMDA for correlation with coliform results. These water quality data are used to determine if regulator and/or interceptor maintenance is required and/or if blockages have occurred and require immediate maintenance. EMDA Scientists examine the data on a monthly basis to detect any major changes or trends in problematic sections in the Woonasquatucket River. As part of the URI Watershed Watch Program, the WRWC has been monitoring water quality at Donigian Park in Providence since 2003 and at Cricket Park (Greystone) in Johnston/North Providence since 2005. Dissolved oxygen and temperature are monitored weekly at both sites from May to October. In addition, on a monthly basis WRWC volunteers monitor pH, alkalinity, nutrients, and bacteria at both sites. The data are regularly posted on the group’s website http://www.woonasquatucket.org/index.htm.
DEM and the Smithfield Wastewater Treatment Facility plan to undertake a program of water quality monitoring during 2009 and 2010. This water quality monitoring program goals are to measure the instream concentration of dissolved Zinc in the water column at the following four locations on the Woonasquatucket River: (Station numbers are taken from the Woonasquatucket River TMDL)
1. Station 3A (immediately upstream of the treatment facility outfall in an area not impacted by the facility) 2. Station 5 (immediately downstream of the bridge by Greystone Fabrics) 3. Station 6 (immediately downstream of the Route 44 bridge) 4. Station 7 (immediately downstream of the dormant Allendale Ave. bridge)
The draft permit will require samples to be taken four days per year (one day each in June, July, August, and September) during 2009 and 2010. Sampling shall take place during dry weather (i.e. no rain within 48 hours). Results shall be reported to RIDEM by December 31, 2010.

88
10.0 References CDM (Camp, Dresser, and McKee, Inc.) 1989. Combined Sewer Overflow Mitigation Study, CSO Area C, Upper
Woonasquatucket River Interceptor Drainage Basin. Engstrom. 2004 Characterizing Water Quality of Urban Stormwater Runoff: Interactions of Heavy Metals and
Solids in Seattle Residential Catchments. Thesis. University of Washington Department of Civil and Environmental Engineering.
Ford, T. and Ryan, D. 2005. Toxic Metals in Aquatic Ecosystems: A Microbiological Perspective. In:
Environmental Health Perspectives. Volume 113. No. 3. Halberg, H.N., Knox, C.E., and Pauszek, F.H. 1961. Water Resources of the Providence Area, Rhode Island.
USGS Water-Supply Paper 1499-A, 50pp. Herson-Jones, L., A. Warner, B. Jordan and K. Hagan. 1994. Anacostia Watershed water quality report: 1987-
1990. Metropolitan Washington Council of Governments, Washington, DC. 200 pages.
Kerr, M. and Lee, V. Water Quality in Rhode Island’s Urban Rivers: Blackstone, Moshassuck, Pawtuxet, Ten
Mile, Woonasquatucket. River Rescue Results. 1990-1995, May 1996. Lim, S. and V. Olivieri. 1982. Sources of Microorganisms in Urban Runoff. Johns Hopkins School of Public
Health and Hygiene. Jones Falls Urban Runoff Project. Baltimore, MD 140 pp. Louis Berger Group, Inc. 2000. Quality Assurance Project Plan for Wet Weather Sampling for the
Woonasquatucket River. Final Report submitted to RIDEM Office of Water Resources. Louis Berger Group, Inc. 2001. Water Quality Characterization for the Woonasquatucket River Basin. Volume I:
Data Summary. Final Report submitted to RIDEM Office of Water Resources. Minton, G.R., 2002. Stormwater Treatment: Biological, Chemical, and Engineering Principles. Gary Minton,
Seattle, Washington, 416 pp. Muschack, W., 1990. Pollution of Street Runoff by Traffic and Local Conditions. The Science of the Total
Environment 93:419-431. NBC (Narragansett Bay Commission). 2001. Quality Assurance Project Plan: An Assessment of Wet Weather
Water Quality Concerns in the Upper Woonasquatucket River. Submitted to EPA Region I, Boston, MA. RIDEM. 2006. State of Rhode Island 2006 Water Quality Regulations: July, 2006. Rhode Island Department of
Environmental Management, Office of Water Resources, Providence, RI. Samadpour, M. and N. Checkowitz, 1998. Little Soos Creek microbial source tracking. RESOURCE, Spring,
1998. University of Washington Urban Water Resources Center. Thiem, L., Bade, S., and Alkhatib, E., I-95 Stormdrain Retrofit Demonstration Project, Phase II Evaluation and
Mitigation of Highway Runoff, September 3, 1996.
89
Trial, W. et al. 1993. Bacterial Source Tracking: Studies in an Urban Seattle Watershed. Puget Sound Notes. 30:1-
3. U.S. EPA. 1980. Ambient Water Quality Criteria for Cadmium. EPA 440/5-80-025. Office of Water Regulations
and Standards. Criteria and Standards Division. Washington, D.C. 20460. U.S. EPA. 1980. Ambient Water Quality Criteria for Copper. EPA 440/5-80-030. Office of Water Regulations
and Standards. Criteria and Standards Division. Washington, D.C. 20460. U.S. EPA. 1980. Ambient Water Quality Criteria for Lead. EPA 440/5-80-057. Office of Water Regulations and
Standards. Criteria and Standards Division. Washington, D.C. 20460. U.S. EPA. 1980. Ambient Water Quality Criteria for Zinc. EPA 440/5-80-079. Office of Water Regulations and
Standards. Criteria and Standards Division. Washington, D.C. 20460. U.S. EPA. 1983. Results of the Nationwide Urban Runoff Program, Vol. 1, Final report. NTIS PB84-185552. U.S. EPA. 1991. Technical Support Document for Water Quality-Based Toxics Control. EPA#: 505/2-90-001. Woodward-Clyde Consultants. Source Identification and Control Report prepared for the Santa Clara Valley
Nonpoint Source Pollution Control Program. Oakland, CA. December 1, 1992. World Health Organisation (WHO). 1992. Environmental Health Criteria 134 - Cadmium International
Programme on Chemical Safety (IPCS) Monograph.

90
Appendix A.
Water Quality Data Table A.1 Narragansett Bay Commission (NBC) 1998 Dry Weather Fecal Coliform Data Summary.
StationNo. Station Name 7/15/98 7/16/98 7/22/98 7/29/98 8/5/98 8/12/98 8/19/98 8/24/98 10/7/98 Count
Geom.Mean
Mini-mum
Maxi-mum
WR-01 Stillwater Reservoir Dam 1 … 1 2 20 1 16 1 1 8 2 1 20
WR-02 Bridge on Capron Road 16 … 28 50 28 70 500 31 11 8 41 11 500
WR-03 Sri Chimnoy Peace Bridge 460 … 310 120 480 7,500 160 300 560 8 449 120 7,500
WR-3a Bridge on Esmond Mill Drive 520 … 790 480 960 1,000 460 620 73 8 501 73 1,000
WR-04 Smithfield WWTF … … … … 9 10 40 1 20 5 9 1 40
WR-05 Bridge on Greystone Street 355 … 400 67 117 65 403 72 69 8 140 65 403
WR-06 Centerdale Bridge # 148 210 … 580 270 440 390 670 467 320 8 393 210 670
WR-07 Bridge on Allendale Ave 350 … 420 270 450 2,400 4,200 820 110 8 597 110 4,200
WR-7a Assapumpset Brook … … … 1,200 … … 2,000 1,200 … 3 1,423 1,200 2,000
WR-7b Lymansville Dam 330 … 200 87 130 497 3,200 96 28 8 206 28 3,200
WR-08 Manton Ave Bridge 430 … 230 210 98 190 1,260 76 34 8 183 34 1,260
WR-09 Dyerville Mill Complex 300 … 360 240 200 110 1,650 100 79 8 229 79 1,650
WR-10 Merino Park, Heath Street 350 … 370 440 690 150 1,700 1,400 240 8 491 150 1,700
WR-11 Footbridge in Olneyville 350 … 390 550 830 700 2,200 520 385 8 610 350 2,200
WR-12 Bridge on Delanie St. … 350 430 600 830 820 1,000 670 890 8 661 350 1,000
WR-13 Valley Street Bridge 560 … 320 370 583 1,000 3,000 660 560 8 675 320 3,000
WR-14 Bridge on Atwells Avenue … 130 620 410 620 2,100 3,500 840 480 8 705 130 3,500
WR-15 Bridge on Bath Street 485 … 770 110,000 9,000 1,450 3,600 855 585 8 2,361 485 110,000WR-16 Bridge on Exchange Street … 560 680 95,000 2,300 580 5,700 600 240 8 1,584 240 95,000
…Not Sampled

91
Table A.2 Narragansett Bay Commission (NBC) Routine Fecal Coliform Monitoring Data (1998-2004).

92
Table A.2 Continued.

93
Table A.2 Continued

94
Table A.2 Continued

95
Table A.2 Continued

96
Table A.3 RIDEM Dry Weather Survey Fecal Coliform Data Summary.
Table A.4 RIDEM wet weather bacteria data for stations WR1-WR3 (2001).
Station Date Time FC/100ml
WR-1 09/20/2001 12:40 12 09/20/2001 13:50 4 09/21/2001 1:12 30 09/21/2001 3:59 12 09/21/2001 8:25 80
WR-2 09/20/2001 12:50 12 09/21/2001 1:30 12 09/21/2001 4:14 15
WR-3 09/20/2001 12:57 430
09/21/2001 1:48 7,500
Table A.5 RIDEM wet weather bacteria data for stations WR1-WR3 (2002). Time (hours after start
of storm) Station
WR-3 WR-2 WR-1
Pre storm 569 430 15 1 430 90 90 2 2400 191 40 3 4600 430 150 4 4600 230 430 5 930 40 90 6 930 15 70
Post storm 430 15 15

97
Table A.6 RIDEM wet weather bacteria data for stations WR4, WR5, S-1 (2001). Station Date Time FC/100ml
WR-4 (WWTF) 09/20/2001 13:25 12 09/21/2001 4:45 12
S-1 09/21/2001 2:50 93,000 WR-5 09/20/2001 13:25 30
09/21/2001 8:05 130 Table A.7 RIDEM wet weather bacteria data for stations WR4, WR5, S-1 (2002). Time (hours after start
of storm) Station
WR-6 WR-5 S-1 WR-4 WR-3a
PS 15000 930 15 150 1 7500 430 240000 2300 2 9300 46000 110000 3900 3 430 110000 930 4 430 1500 46000 15 430 5
Final 930 Post 90 15
Table A.8 RIDEM wet weather bacteria data for stations WR7- WR9, S-2, S-3 (2001).
Station Date Time FC/100ml
WR-7 09/20/2001 13:10 1,600 09/20/2001 13:45 150 09/21/2001 1:55 230 09/21/2001 3:50 2,400 09/21/2001 5:00 24,000 09/21/2001 7:55 1,600
WR-8 09/20/2001 14:55 12 09/21/2001 2:08 750 09/21/2001 5:10 930
WR-9 09/20/2001 12:00 23 09/20/2001 15:00 70 09/21/2001 2:39 930 09/21/2001 5:15 4,300 09/21/2001 7:40 300
WR-7A 09/20/2001 14:00 430 09/21/2001 2:55 4,300
S-2 09/21/2001 1:30 230
S-3 09/21/2001 0:57 230 09/21/2001 2:15 4,300 09/21/2001 3:35 4,300 09/21/2001 3:40 23,000

98
Table A.8 RIDEM wet weather bacteria data for stations WR7- WR9, S-2, S-3 (2002).
Time (hours after start of storm)
Station
WR-9 WR-8 WR-7B WR-7A S-3 WR-7 S-2 PS 190 70 230 930 230 1 1500 1000 930 4600 24000 2400 110000 2 1400 1300 90 7500 46000 930 110000 3 1300 2700 15 24000 7500 430 46000 4 1700 1900 40 24000 5 290 230
Final 270 Post 230 930
Table A.9 RIDEM wet weather bacteria data for stations WR12, WR15, S-4, S-5 (2001).
Station Date Time FC/100ml WR-12 09/20/2001 15:20 430
09/21/2001 5:23 24,000 WR-15 09/20/2001 14:35 300
09/20/2001 15:30 430 09/21/2001 2:15 300 09/21/2001 3:10 2,300 09/21/2001 5:32 430,000 09/21/2001 7:20 7,000
S-4 09/21/2001 2:30 43,000 09/21/2001 3:20 93,000 09/21/2001 4:25 4,300
S-5 09/20/2001 11:45 170 09/21/2001 2:15 5,000 09/21/2001 2:45 2,400 09/21/2001 3:15 2,400 09/21/2001 5:00 2,400
Table A.10 RIDEM wet weather bacteria data for stations WR12, WR15, S-4, S-5 (2002). Time (hours after start
of storm) Station
WR-15 WR-13 WR-12 WR-10 S-5
PS 450 2300 91000 4300 23000 1 45000 9300 180000 24000 31000 2 7800 46000 210000 9300 16000 3 130000 9300 31000 930 10000 4 71000 2300 7800 2300 5600 5 9400 17000 1600
Final Post
Geometric Mean 15469 7322 49174 4597 10037

99
Table A.11 RIDEM Wet Weather Dissolved Metals Data Summary.
RI0002007R-10A WET WEATHER DATAStation Sample Date Cd Cu Pb Zn Notes*WR-1
9/21/2001 0.006 0.49 0.16 36.6 WW 2 Data does not* = replicate 9/21/2001* 0.008 0.32 0.1 4.3 WW 2 meet QA/QC guidelines
9/21/2001 0.003 0.35 0.1 38.4 WW 27/26/2001 0.005 0.55 0.235 12.6 DWS (actual wet)
8/30/2002 0.003 0.38 0.16 0.9 WW4 post8/29/2002 0.001 0.23 0.15 0.7 WW 48/29/2002 0.24 0.05 0.3 WW 48/29/2002 0.19 0.05 0.7 WW 48/29/2002 0.003 0.26 0.03 0.4 WW 48/29/2002 0.003 0.16 0.05 1.3 WW 48/29/2002 0.005 0.16 0.05 1.5 WW 4
Red indicates individual exceedance of criteria.WR2 no wet weather data collected at WR2Acute and Chronic metals criteria calculated using a hardness value of 22.2 mg/LApplicable Criteria Cd Cu Pb ZnAcute 0.47 3.25 12.14 32.74Chronic 0.09 2.47 0.47 33
Dissolved Metal in ug/L
RI0002007R-10B WET WEATHER DATAStation WR3A Sample Date Cd Cu Pb Zn Notes*
9/21/2001 0.027 1.06 0.27 9.4 ww29/21/2001 0.014 0.71 0.10 4.7 ww29/21/2001 0.014 0.64 0.13 3.8 ww29/21/2001 0.033 1.33 0.49 10.7 ww2
7/26/2001 0.014 1.16 0.39 9.00 DWS (actual wet)8/29/2002 0.017 0.84 0.09 7.5 ww48/29/2002 0.016 0.78 0.15 8.3 ww48/30/2002 0.017 0.63 0.11 6.2 ww48/30/2002 0.013 0.44 0.01 4.2 ww4
WR3 No data collected at WR3Acute and Chronic metals criteria calculated using a hardness value of 24.3 mg/L
Applicable Criteria Cd Cu Pb ZnAcute 0.51 3.54 13.45 35.34Chronic 0.09 2.67 0.52 35.63
Dissolved Metal in ug/L

100
RI0002007R-10C Station WR7A characterize Assapumpsett Brook segment RI0002007R-01Wet Weather Data
Sample Station Date Cd Cu Pb Zn Notes*WR-5
9/21/2001 0.004 1.39 0.13 15.8 WW 29/21/2001 0.007 1.4 0.18 19.6 WW 27/26/2001 0.022 1.130 0.396 9.2 DEM single wet8/29/2002 0.016 1.130 0.330 10.0 DEM/PS/WW48/29/2002 0.014 1.04 0.26 9.6 WW 48/29/2002 0.014 0.85 0.25 10.0 WW 48/29/2002 0.014 0.98 0.18 8.5 WW 48/30/2002 0.016 1.03 0.28 9.1 WW 48/30/2002 0.0145 0.88 0.355 9.9 WW4 post
WR-7
9/21/2001 0.017 2.48 0.34 29.0 WW 29/21/2001 0.011 2.1 0.39 133.0 decision made to throw out data (outlier)7/26/2001 0.025 2.73 0.687 26.6 DEM single wet
8/29/2002 0.013 0.87 0.12 6.0 WW 48/29/2002 0.009 0.88 0.16 7.9 WW 48/29/2002 0.006 0.86 0.2 8.3 WW 48/30/2002 0.77 0.14 8.1 WW 48/30/2002 0.003 0.9 0.2 7.5 WW 48/30/2002 0.014 1.48 0.24 8.3 WW4 post
WR-7A 9/21/2001 0.008 1.23 0.06 4.7 WW 29/21/2001 0.01 1.32 0.07 4.5 WW 29/21/2001 0.016 2 0.02 4.1 WW 27/26/2001 0.029 3.98 0.446 23.6 DEM single wet
8/29/2002 0.013 1.79 0.04 6.1 WW 48/29/2002 0.021 2.99 0.16 7.5 WW 48/29/2002 0.036 2.19 0.05 25.4 WW 48/30/2002 0.012 1.16 0.07 6.8 WW4 post
WR-88/29/2002 0.003 0.84 0.244 5.0 data does not meet QA/QC guidelines8/29/2002* 0.006 0.78 0.186 16.6 data does not meet QA/QC guidelines8/29/2002 0.68 0.174 8.0 WW 48/29/2002 0.013 1.09 0.244 17.0 WW 48/30/2002 0.004 0.77 0.196 8.8 WW 48/30/2002 0.013 0.65 0.126 16.3 WW 4 post7/26/2001 0.012 1.64 0.43 10.9 DEM single wet
WR-99/21/2001 0.008 1.33 0.28 13.7 WW 2
8/29/2002 0.007 0.89 0.22 6.4 WW 48/29/2002 0.009 1.22 0.262 8.2 WW 48/29/2002 0.011 1.04 0.124 6.7 WW 48/30/2002 0.007 1.06 0.234 6.9 WW 4
WR 6
9/21/2001 0.018 2.46 0.28 12.7 WW2 9/21/2001 0.010 1.81 0.24 11.5 WW29/21/2001 0.011 1.81 0.30 11.8 WW27/26/2001 0.025 2.73 0.687 26.6 DEM single wet
8/29/2002 0.003 0.51 0.15 2.0 WW4 8/29/2002 0.001 0.54 0.12 1.8 WW48/30/2002 0.003 0.71 0.16 1.5 WW48/30/2002 0.000 0.56 0.09 2.2 WW4
Dissolved Metal in ug/L

101
WR7B9/21/2001 0.008 1.00 0.09 4.4 WW2 9/21/2001 0.001 1.02 0.14 6.7 WW29/21/2001 0.003 1.05 0.09 3.5 WW29/21/2001 0.000 0.93 0.07 5.8 WW27/26/2001 0.004 1.26 0.369 23.1 DEM single wet
8/29/2002 0.037 3.08 0.71 20.2 WW4 8/29/2002 0.014 1.67 0.33 12.2 WW48/30/2002 0.019 1.06 0.14 8.9 WW48/30/2002 0.015 0.89 0.09 8.7 WW4
RI0002007R-10D
Cd Cu Pb ZnWR-12
8/29/2002 0.032 3.1 1.06 27.00 data does not meet QA/QC guidelines8/29/2002 0.027 2.57 1.28 21.00 data does not meet QA/QC guidelines8/29/2002 0.018 2.28 0.61 14.42 WW 408/30/02 0.019 1.74 0.32 12.2 WW 408/30/02 0.014 1.1 0.15 10.72 WW4 post
WR- 109/21/2001 0.007 1.34 0.23 5.6 WW2 9/21/2001 0.019 2.50 0.34 15.1 WW2 9/21/2001 0.016 1.97 0.26 8.2 WW2 9/21/2001 0.008 1.66 0.16 8.0 WW2 9/21/2001 0.018 2.96 0.84 19.7 WW2 7/26/2001 0.044 2.69 1.30 25.6 DEM single wet
8/29/2002 0.037 3.08 0.71 20.2 WW4 8/29/2002 0.014 1.67 0.33 12.2 WW48/30/2002 0.019 1.06 0.14 8.9 WW48/30/2002 0.015 0.89 0.09 8.7 WW4
WR- 139/21/2001 0.015 1.22 0.10 6.0 WW2 9/21/2001 0.026 1.40 0.19 7.1 WW2 9/21/2001 0.034 2.58 1.34 17.0 WW2 9/21/2001 0.020 2.00 0.43 10.7 WW2 9/21/2001 0.033 2.86 1.31 19.5 WW2 7/26/2001 0.13 2.62 0.79 21 DEM single wet
8/29/2002 0.031 2.04 0.62 9.7 WW4 8/29/2002 0.026 2.45 0.76 11.4 WW48/30/2002 0.006 1.62 0.41 7.7 WW48/30/2002 0.007 1.20 0.22 5.9 WW4
WR-15 Sample Date Cd Cu Pb Zn Notes*
9/21/2001 0.048 1.71 0.10 16.8 WW 29/21/2001 0.03 1.77 0.22 15.8 WW 27/26/2001 0.144 8.2 4.08 81.4 DEM single wet
8/29/2002 0.03 2.52 1.30 17.54 WW 48/29/2002 0.037 2.97 1.42 27.2 WW 48/29/2002 0.029 3.42 1.78 17.46 WW 48/30/2002 0.027 3.2 1.61 20.2 WW 4
Dissolved Metal in ug/L
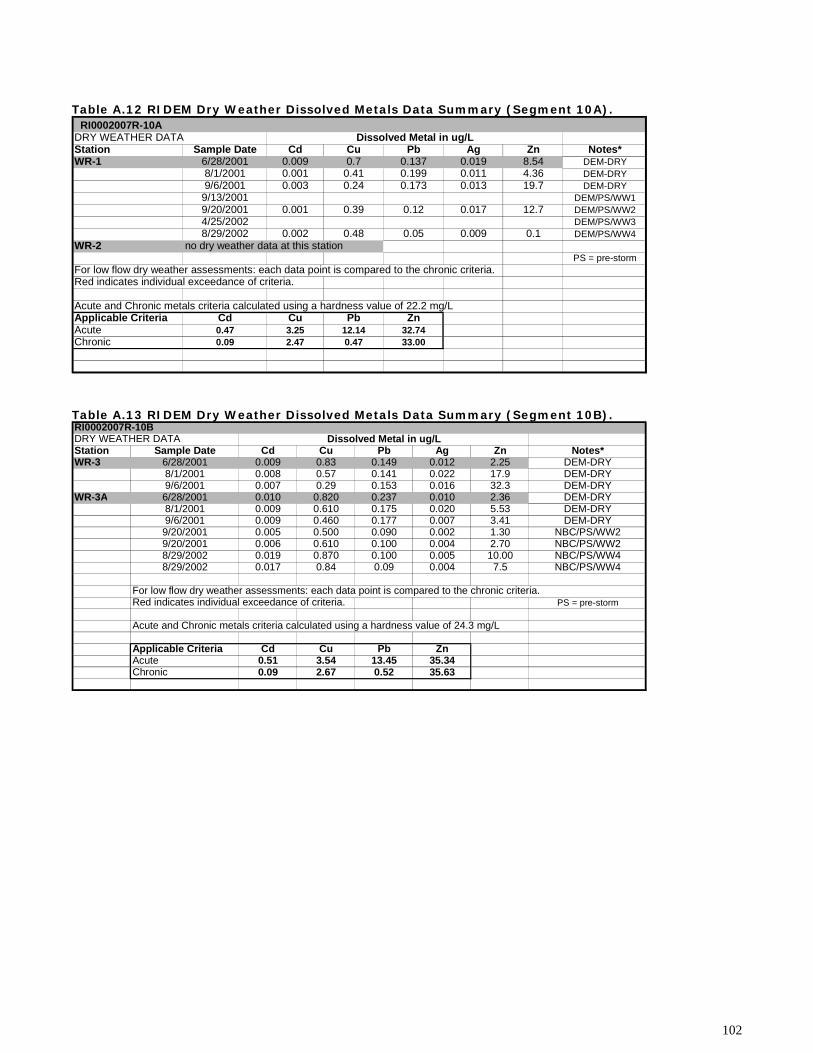
102
Table A.12 RIDEM Dry Weather Dissolved Metals Data Summary (Segment 10A). RI0002007R-10A DRY WEATHER DATAStation Sample Date Cd Cu Pb Ag Zn Notes*WR-1 6/28/2001 0.009 0.7 0.137 0.019 8.54 DEM-DRY
8/1/2001 0.001 0.41 0.199 0.011 4.36 DEM-DRY9/6/2001 0.003 0.24 0.173 0.013 19.7 DEM-DRY
9/13/2001 DEM/PS/WW19/20/2001 0.001 0.39 0.12 0.017 12.7 DEM/PS/WW24/25/2002 DEM/PS/WW38/29/2002 0.002 0.48 0.05 0.009 0.1 DEM/PS/WW4
WR-2 no dry weather data at this stationPS = pre-storm
For low flow dry weather assessments: each data point is compared to the chronic criteria.Red indicates individual exceedance of criteria.
Acute and Chronic metals criteria calculated using a hardness value of 22.2 mg/LApplicable Criteria Cd Cu Pb ZnAcute 0.47 3.25 12.14 32.74Chronic 0.09 2.47 0.47 33.00
Dissolved Metal in ug/L
Table A.13 RIDEM Dry Weather Dissolved Metals Data Summary (Segment 10B). RI0002007R-10B DRY WEATHER DATAStation Sample Date Cd Cu Pb Ag Zn Notes*WR-3 6/28/2001 0.009 0.83 0.149 0.012 2.25 DEM-DRY
8/1/2001 0.008 0.57 0.141 0.022 17.9 DEM-DRY9/6/2001 0.007 0.29 0.153 0.016 32.3 DEM-DRY
WR-3A 6/28/2001 0.010 0.820 0.237 0.010 2.36 DEM-DRY8/1/2001 0.009 0.610 0.175 0.020 5.53 DEM-DRY9/6/2001 0.009 0.460 0.177 0.007 3.41 DEM-DRY9/20/2001 0.005 0.500 0.090 0.002 1.30 NBC/PS/WW29/20/2001 0.006 0.610 0.100 0.004 2.70 NBC/PS/WW28/29/2002 0.019 0.870 0.100 0.005 10.00 NBC/PS/WW48/29/2002 0.017 0.84 0.09 0.004 7.5 NBC/PS/WW4
For low flow dry weather assessments: each data point is compared to the chronic criteria.Red indicates individual exceedance of criteria. PS = pre-storm
Acute and Chronic metals criteria calculated using a hardness value of 24.3 mg/L
Applicable Criteria Cd Cu Pb ZnAcute 0.51 3.54 13.45 35.34Chronic 0.09 2.67 0.52 35.63
Dissolved Metal in ug/L

103
Table A.14 RIDEM Dry Weather Dissolved Metals Data Summary (Segment 10C). RI0002007R-10C Station WR7A characterize Assapumpsett Brook segment RI0002007R-01DRY WEATHER DATA PS = pre-stormStation Sample Date Cd Cu Pb Ag Zn Notes*WR-5 6/28/2001 0.013 1.340 0.390 0.007 5.65 DEM-DRY
8/1/2001 0.012 1.060 0.305 0.030 11.00 DEM-DRY9/6/2001 0.011 1.310 0.334 0.009 8.22 DEM-DRY9/13/2001 DEM/PS/WW19/20/2001 0.008 1.690 0.170 0.023 33.50 DEM/PS/WW24/25/2002 DEM/PS/WW38/29/2002 0.016 1.130 0.330 0.008 10.00 DEM/PS/WW4
WR-6 6/28/2001 0.012 1.310 0.427 0.012 5.71 DEM-DRY8/1/2001 0.010 1.670 0.348 0.019 36.90 DEM-DRY
9/6/2001 0.011 1.520 0.313 0.013 20.80 DEM-DRY9/20/2001 0.013 1.500 0.210 0.006 7.80 NBC/PS/WW29/20/2001 0.007 1.520 0.180 0.032 8.90 NBC/PS/WW28/29/2002 0.025 1.750 0.320 0.005 23.00 NBC/PS/WW4
WR-7 6/28/2001 0.012 1.250 0.370 0.005 6.60 DEM-DRY8/1/2001 0.013 1.780 0.540 0.013 44.20 DEM-DRY
9/6/2001 0.012 1.540 0.426 0.007 17.70 DEM-DRY9/13/2001 DEM/PS/WW19/20/2001 0.013 1.640 0.210 0.020 16.00 DEM/PS/WW24/25/2002 DEM/PS/WW38/29/2002 0.008 0.960 0.100 0.006 7.90 DEM/PS/WW4
WR-7A 6/28/2001 0.016 1.840 0.408 0.013 3.62 DEM-DRY8/1/2001 0.015 1.610 0.122 0.011 58.00 DEM-DRY9/6/2001 0.010 1.170 0.083 0.009 9.23 DEM-DRY
WR-7B 6/28/2001 0.009 1.460 0.386 0.006 7.44 DEM-DRY8/1/2001 0.006 1.370 0.357 0.006 14.96 DEM-DRY9/6/2001 0.003 0.840 0.254 0.006 13.40 DEM-DRY9/20/2001 0.014 1.330 0.100 0.002 6.30 NBC/PS/WW29/20/2001 0.002 1.060 0.110 0.004 4.60 NBC/PS/WW28/29//2002 0.001 0.760 0.120 0.006 3.00 NBC/PS/WW4
WR-8, S-9 6/28/2001 0.005 1.310 0.444 0.027 6.48 DEM-DRY8/1/2001 0.011 1.280 0.377 0.006 9.52 DEM-DRY9/6/2001 0.006 0.950 0.244 0.005 25.40 DEM-DRY9/13/2001 DEM/PS/WW19/20/2001 DEM/PS/WW24/25/2002 0.005 0.960 0.289 0.003 6.30 DEM/PS/WW38/29/2002 DEM/PS/WW4
WR-9 6/28/2001 DEM-DRY9/20/2001 0.006 1.460 0.170 0.010 26.00 DEM/PS/WW24/25/2002 DEM/PS/WW38/29/2002 0.003 0.800 0.074 0.002 5.86 DEM/PS/WW4
For low flow dry weather assessments: each data point is compared to the chronic criteria.Red indicates individual exceedance of criteria.Applicable Criteria Cd Cu Pb ZnAcute 0.62 4.32 17.04 42.25 Acute and Chronic metals criteria calculated using a hardness value of 30.0 mg/LChronic 0.11 3.2 0.66 42.59
Applicable Criteria Cd Cu Pb ZnAcute 1.14 7.74 33.97 71.37 Acute and Chronic metals criteria for Assapumpsett Brook calculated using Chronic 0.16 5.43 1.32 71.95 a hardness value of 55.7 mg/l
Dissolved Metal in ug/L
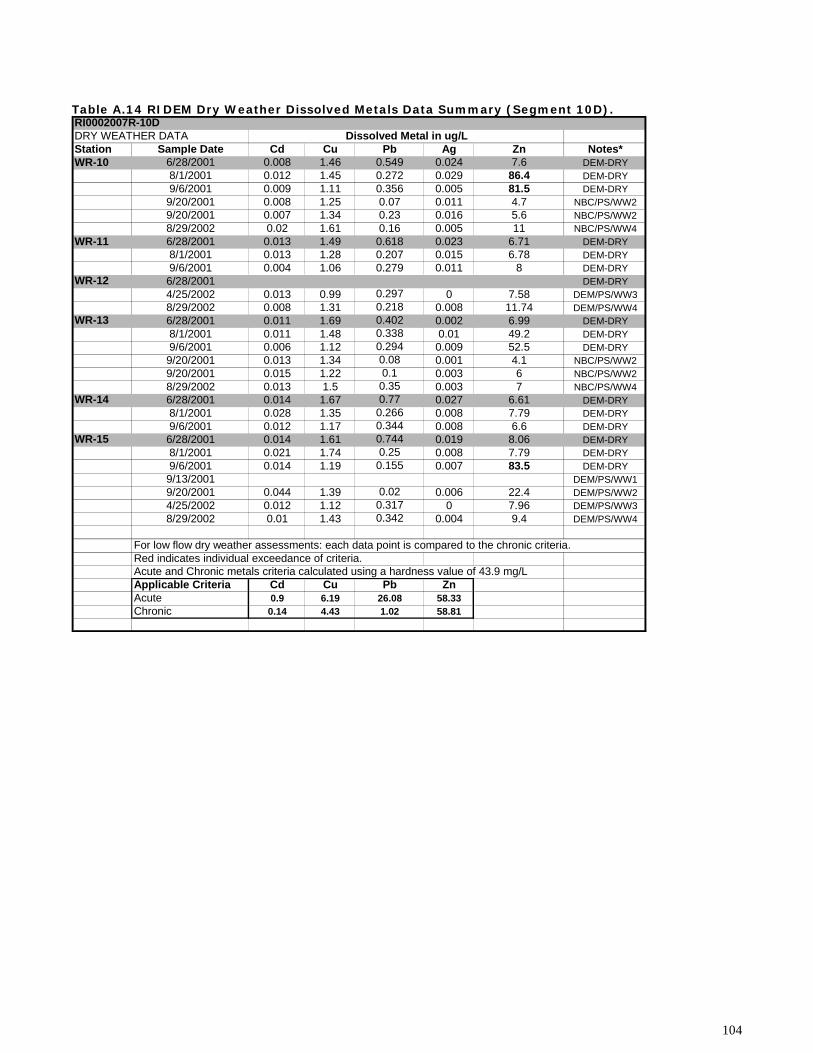
104
Table A.14 RIDEM Dry Weather Dissolved Metals Data Summary (Segment 10D). RI0002007R-10D DRY WEATHER DATAStation Sample Date Cd Cu Pb Ag Zn Notes*WR-10 6/28/2001 0.008 1.46 0.549 0.024 7.6 DEM-DRY
8/1/2001 0.012 1.45 0.272 0.029 86.4 DEM-DRY9/6/2001 0.009 1.11 0.356 0.005 81.5 DEM-DRY9/20/2001 0.008 1.25 0.07 0.011 4.7 NBC/PS/WW29/20/2001 0.007 1.34 0.23 0.016 5.6 NBC/PS/WW28/29/2002 0.02 1.61 0.16 0.005 11 NBC/PS/WW4
WR-11 6/28/2001 0.013 1.49 0.618 0.023 6.71 DEM-DRY8/1/2001 0.013 1.28 0.207 0.015 6.78 DEM-DRY9/6/2001 0.004 1.06 0.279 0.011 8 DEM-DRY
WR-12 6/28/2001 DEM-DRY4/25/2002 0.013 0.99 0.297 0 7.58 DEM/PS/WW38/29/2002 0.008 1.31 0.218 0.008 11.74 DEM/PS/WW4
WR-13 6/28/2001 0.011 1.69 0.402 0.002 6.99 DEM-DRY8/1/2001 0.011 1.48 0.338 0.01 49.2 DEM-DRY9/6/2001 0.006 1.12 0.294 0.009 52.5 DEM-DRY9/20/2001 0.013 1.34 0.08 0.001 4.1 NBC/PS/WW29/20/2001 0.015 1.22 0.1 0.003 6 NBC/PS/WW28/29/2002 0.013 1.5 0.35 0.003 7 NBC/PS/WW4
WR-14 6/28/2001 0.014 1.67 0.77 0.027 6.61 DEM-DRY8/1/2001 0.028 1.35 0.266 0.008 7.79 DEM-DRY9/6/2001 0.012 1.17 0.344 0.008 6.6 DEM-DRY
WR-15 6/28/2001 0.014 1.61 0.744 0.019 8.06 DEM-DRY8/1/2001 0.021 1.74 0.25 0.008 7.79 DEM-DRY9/6/2001 0.014 1.19 0.155 0.007 83.5 DEM-DRY9/13/2001 DEM/PS/WW19/20/2001 0.044 1.39 0.02 0.006 22.4 DEM/PS/WW24/25/2002 0.012 1.12 0.317 0 7.96 DEM/PS/WW38/29/2002 0.01 1.43 0.342 0.004 9.4 DEM/PS/WW4
For low flow dry weather assessments: each data point is compared to the chronic criteria.Red indicates individual exceedance of criteria.Acute and Chronic metals criteria calculated using a hardness value of 43.9 mg/LApplicable Criteria Cd Cu Pb ZnAcute 0.9 6.19 26.08 58.33Chronic 0.14 4.43 1.02 58.81
Dissolved Metal in ug/L

105
Appendix B.
30-Day Public Comment Documents February 5, 2007 Brian Zalewsky Rhode Island Department of Environmental Management Office of Water Resources 235 Promenade Street Providence, RI 02908-5767 RE:: Comments on Draft Woonasquatucket River TMDL Dear Mr. Zalewsky: The Town of Smithfield has reviewed the draft TMDL for the Woonasquatucket River for bacteria and dissolved metals dated December 2006. While the Town appreciates the effort that went into developing this TMDL, it trusts that RIDEM realizes the effort and resources that will be required by municipalities to comply with the measures included in this TMDL. To that end, the Town has several comments relating to the way the allocation was handled for metals and the requirements for MS4 permits. In the allocation of metals, upstream background concentrations were increased by 20% for future growth. Clearly, there will be reductions to inputs of metals from stormwater and illicit connections that will be realized with the continued implementation of the MS4 general permits. Moreover, the TMDL requires that municipalities address, as part of their revised SWMPPs, revisions to local ordinances to ensure that new development employ stormwater controls to prevent any net increase in the pollutants of concern. Taking these factors into account, 20% increase of upstream background concentrations is overly conservative and burdensome. For these reasons, the Town requests that the TMDL be allocated taking into account more realistic background increases. RIDEM Response: The DEM, upon considering the Town’s objection, has decided not to allocate 20% of background metals levels to upstream future growth. Instead, the DEM has chosen a 10% allocation of background metals to upstream future growth. Please note that metals limitations have been upwardly revised accordingly in the final permit. The allocation for zinc took into account an unidentified source downstream from the Smithfield Wastewater Treatment Facility. The Town firmly believes that none of the downstream source of zinc should be allocated to the river in the TMDL. It is obvious that this loading is an illegal point source. This source is either from a non stormwater pipe into the riverine system or is being introduced via a stormwater conveyance system. In either case, detection and elimination (since sewers are available) of the source should be the goal. Until every attempt to accomplish this has been exhausted, the additional burden should not be carried by the Town in its zinc limit. Therefore the Town maintains that the TMDL be allocated eliminating this source of zinc. RIDEM Response: The DEM has reviewed DMR data for Zinc for 2006 and understands that monthly average Zinc data has been well below the Zinc limit proposed in the August, 2006 14-day draft (47.5 ug/l) for the months of May through December of 2006. Furthermore, by using a 10% allocation (as opposed to a 20% allocation) for Zinc upstream of the facility raises the final Zinc limit to 50.1 ug/l. The 50.1 ug/l includes a reduction of 90% of the unknown downstream source of Zinc. The DEM does not believe that it is appropriate to allocate more than a 90% reduction to the unknown source. The DEM intends to continue its efforts to search for the unknown source in the future and this issue can be revisited during the next permit reissuance cycle.

106
Upon finalization of this TMDL, MS4 permittees are required to revise their SWMPPs within 180 days to address the TMDL provisions as they pertain to stormwater. The requirements for this revision as detailed in section 7.3 of the TMDL will be quite time consuming and costly. Requiring the work be completed in six months adds significant effort to municipalities’ resources which are already overburdened. The Town asks that the requirements the MS4 permittees be phased in a timeframe that is more reasonable. RIDEM Response: The requirement of 180 days is a permit requirement and it requires a modification (public notice/public comment) if it is changed to a less strict requirement. A great deal of the information required has already been collected by DEM or the Town of Smithfield. The Department feels that 180 days gives municipalities ample time to develop measurable goals for the six minimum measures, as well as an implementation schedule for identifying, prioritizing outfalls and proposing structural BMPs. As a note, page 45, section 4.4 describes the Smithfield Wastewater Treatment Facility treatment processes. This description is no longer relevant. It should read “Treatment consists of screening/grinding, primary settling, activated sludge employing the A2O process, secondary clarification, disc filtration, chlorination and dechlorination”. In addition, page 72 includes a paragraph on the Smithfield Local Limits and Metals Compliance Report. The language in this paragraph gives the impression that RIDEM has approved the plan and the Town is in implementation. Although the Town submitted the report, it has not been approved by RIDEM. RIDEM Response: DEM has made these changes to the TMDL document regarding the treatment process. The DEM acknowledges that the Local Limits and Metals Compliance Report submitted by the Town not been formally approved. As indicated in the permit Fact Sheet, the DEM plans on entering a consent agreement for Copper that will contain interim limitations, monitoring requirements, and a compliance schedule. As part of the development of this consent agreement, the DEM will review the previously submitted Local Limits and Metals Compliance Reports and either approve them or issue formal comments." In summary, the Town of Smithfield has several concerns with the methodology and time requirements found in this TMDL. The increase of upstream background concentrations by 20% is overly conservative in that it does not take into account reductions that will be seen with further implementation of the MS4 permits or with the requirements of no net increase of pollutants by new development. The unidentified source of zinc in reach 10C should not be included in the allocation. Finally, the requirements on MS4 permittees, while not arguing their validity, are burdensome particularly in relation to timeframes for action. Should you have any questions, please contact me at 401-233-1037. Sincerely, Carlene B. Newman Contract Administrator/Engineer Cc: Stanley J. Usovicz B. James Suzman Richard Geldard, P.E. Seth Lemoine Karen Goffe

107
Rhode Island Department of Transportation Environmental and Intermodal Planning Two Capitol Hill, Providence, RI 02903-1124 February 2, 2007 Mr. Brian Zalewsky, Environmental Planner Office of Water Resources, RIDEM 235 Promenade Street Providence, RI 02908-5767 RE: Woonasquatucket River Fecal Coliform Bacteria and Dissolved Metals TMDLs Dear Mr. Zalewsky: This letter constitutes RIDOT’s written comments regarding the Woonasquatucket River TMDL report. RIDOT has reviewed the report, and offers the following:
• RIDOT Storm Water Retrofit Projects (pg 81-82): The construction schedule of the BMPs has been changed. The W6 BMP contract will go out to bid this Spring, with construction beginning later this year. S1, W2, and W23 BMPs have been designed, but are awaiting funding (anticipated Fall 2007).
RIDEM Response DEM has made changes to the TMDL document as appropriate.
• Storm Water Phase II Plan (pg 82): The outfalls in the Woonasquatucket River Watershed have been
identified, described, and mapped by this Office. Work was completed in 2004. Maps and data are available upon request. Dry weather discharge surveys were conducted at the time of mapping. Any outfalls that had dry weather flow (flow 72-hours after a 0.10 inch rain event), or is suspected of illicit discharge, will be sampled by this Office this year (Permit Year 4).
RIDEM Response DEM has made changes to the TMDL document as appropriate.
• RIDOT is in the process of revising its SWMPP. RIDOT no longer anticipates hiring a vendor to map,
survey, and sample the majority of RIDOT outfalls. A consultant is being hired to implement an Asset Management Program in the Maintenance Division, and within this contract, outfalls along limited-access roadways will be mapped, surveyed, and sampled. This TMDL has been addressed as part of the SWMPP revision.
RIDOT will continue to work with the Office of Water Resources and interconnected MS4s in both the Stormwater Retrofit Program and the Storm Water Management Program. RIDOT will also implement each Minimum Measure with any new construction project that is developed within the Woonasquatucket River TMDL area, to the maximum extent practicable. Should you have any questions regarding this matter, please contact Ms. Allison LeBlanc of this office at 222-2023, Extension 4097. Sincerely, Edward S. Szymanski, P.E., Associate Chief Engineer, Office of Environmental Programs February 5, 2007 Mr. Brian Zalewsky

108
RI Department of Environmental Management Office of Water Resources Providence, RI 02906 Dear Mr. Zalewsky: I would like to commend the RIDEM on the completion of the Woonasquatucket River Fecal Coliform Bacteria and Dissolved Metals Total Maximum Daily Loads Report and thank you for the opportunity to comment on this document. In reviewing this document, the NBC has several comments and concerns that we wish to bring to the attention of the Department. Use of Water Quality Data: The NBC recently submitted comments to the Department on Section 5 Assessment and Evaluation Methodology of the RIDEM CALM Draft Report. As we mentioned in those comments, the use of older data to determine water quality conditions may not accurately take into account improvements implemented after the data was collected. If there is a 3-year time window for exceedences of the chronic water quality criteria, data older than this should not be used for determining the current water quality state of the river segments. The NBC has two full years of pathogen data available for year 2005 and 2006, but none of this data was included in the assessment of pathogen impacts. That is not to say that the CSOs have not contributed to the pathogen impairments since 2004, but the magnitude of those impacts may have changed, making some of the suggested percent reductions inaccurate. RIDEM Response: While DEM is concerned that “older” data may no longer be representative of current conditions in a waterbody, there are clearly circumstances where there is no doubt that an impairment is ongoing. A majority of the pathogen impairments in the Woonasquatucket result from stormwater runoff and both dry and wet weather CSO discharges, which, for the most part, continue to this day with the same frequency of occurrence, have the same duration, and produce the same water quality impacts. Therefore, DEM feels that using the 1999-2004 dataset is adequate to characterize water quality in the river under both dry and wet weather conditions and set pollution reduction targets based on an existing condition. DEM has received the 2005 and 2006 pathogen datasets for the lower portion of the Woonasquatucket. A basic statistical summary, generated from this data, is presented below.
Statistic
Manton Ave (S9)
Olneyville (S8A)
Delainie St. (S8C)
Atwells Ave. (S8)
Pleasant Valley Parkway (S7B)
Kinsley St. (S7A)
99-04 Geometric Mean Value
164 413 568 635 826 887
99-04 Percentile Value
930 4600 9300 9300 9300 24000
05-06 Geometric Mean Value
150 514 442 506 809 834
05-06 Percentile Value
1215 9300 9300 9120 24000 22500

109
Another way of determining if dry weather CSO discharges continue to have an appreciable effect on water quality during between 1999 and the present would be to evaluate the total volume of dry weather CSO discharges to the Woonasquatucket from 1999-2007. DEM believes that these types of analysis would be useful and informative, particularly if submitted as part of the semi-annual reports that are generated by NBC as part of their Best Management Practices Plan Implementation and Sewer System Maintenance and Improvements work. To gauge the effectiveness of our Pretreatment and Pollution Prevention Programs at controlling toxic pollutant discharges from CSOs, the NBC conducts monitoring of at least two CSO wet weather events annually as a monitoring element of our Nine Minimum CSO Controls Program. One sampling event is typically conducted in each of our service districts annually and samples are collected for bacteria and toxic pollutants at various time frequencies from first flush through the end of the discharge period. Data generated from NBC CSO monitoring conducted on the Woonasquatucket River was not evaluated in the TMDL report. The NBC recommends that the Department contact our Environmental Monitoring & Data Analysis (EMDA) Section so that the most recent and complete data sets can be reviewed and included in the analysis for this report. RIDEM Response: We have obtained the CSO monitoring data from the EMDA Section. The data for CSO-054 is summarized in Table 4.4 of the TMDL document. Many of the data studies referenced in this report are more than a decade old, and while this may not be a problem with regard to bacteriological studies, there have been dramatic improvements in water quality associated with heavy metals. During the late 1980 to mid-1990s, the many mill buildings located along the Woonasquatucket River housed numerous metalfinishing and electroplating firms that routinely impacted the water quality of this river. During this time period it was routine for NBC Pretreatment staff to investigate the river turning green, blue and orange, and oftentimes these impacts were associated with the dumping of plating chemicals from metals processing tanks. Quite often the source was identified and the firm was required to correct plumbing in the mill to redirect hundred-year old mill connections from the river to the sanitary sewer system. Since that time Rhode Island has also experienced a dramatic decline in metals manufacturing and electroplating, and these riverfront mills are being redeveloped for commercial and residential uses. As a result of the many changes involving toxic pollutant discharge reductions that have occurred over the past ten years, the use of older metals data is not recommended. RIDEM Response: Historic studies reported in the TMDL in Section 2.3 were summarized in order to describe historic water quality conditions in the river, however these data were not used to develop the TMDL. Only data collected jointly by DEM and the NBC were used. DEM used metals data from 2001 and 2002, which is roughly 4-5 years old. Since many of the impairments result from stormwater runoff and wet weather CSO discharges, which more than likely continue to this day with the same frequency of occurrence, have the same duration, and produce the same water quality impacts, DEM feels that use of the data to develop the TMDL is warranted. In addition, the dissolved metals data used to develop the TMDL met all quality assurance criteria as required in the Quality Assurance Project Plan. Pollution Sources and Implementation: The executive summary states that insufficient data exists to accurately differentiate between point and non-point sources of bacteria. Therefore, all bacteria source reductions for this TMDL are combined into the Waste Load Allocation (WLA) for point sources only. This should not be interpreted to assume that all pathogens impacting the river are from point sources, as the evidence presented for fecal coliform results show elevated levels of pathogens upstream from the CSO reach and upstream of the Smithfield POTW.
110
The NBC is concerned that delaying the identification of non-point source contributions to pathogen impairments may delay our mutual goal to meet Rhode Island water quality standards. The water quality improvements that occur as a result of the many point source water quality improvements taking place within the Woonasquatucket River watershed and those expected to occur may not be sufficient to meet water quality standards and years will have passed without action to address non-point sources of pollution. The NBC requests that RI DEM address this issue thoroughly in the TMDL. If fecal coliform values exceeded RI water quality criteria ‘frequently along the entire length of the river between Georgiaville Pond and the mouth near the confluence with the Mosshasuck River’ upstream of NBC CSOs and upstream of the Smithfield WWTF, this clearly indicates that some of the downstream signal in segments 10-C and 10-D could be associated with upstream values which are not being addressed for correction in the TMDL report. RIDEM Response: DEM acknowledges that not all pathogens impacting the Woonasquatucket River come from point sources, however it is clear that the majority of pathogen impairments are associated with stormwater runoff and both dry and wet weather CSO discharges. Paragraph 5 in the Executive Summary states that “in implementing this TMDL, both point and nonpoint controls will be necessary to meet the TMDL plan’s water quality targets”. Furthermore, Section 7.5 discusses measures needed to address nonpoint sources of pollution including failing and substandard ISDS, waterfowl and domestic pets, as well as urban litter, and commercial and residential waste management. In addition, DEM has made recommendations in the TMDL for all MS4s to aggressively address nonpoint sources of pollution as described below (This language is taken directly from the TMDL):
• Focus commercial and industrial educational programs on companies located within the floodplain. These programs should include discussions of proper waste management and good housekeeping practices. The City should continue to work with and support the efforts of watershed organizations such as the Woonasquatucket River Watershed Council.
• Focus on an aggressive city or town-wide educational programs to change current behaviors to protect
and preserve water quality in the Woonasquatucket. Topics that should be included are pet and solid waste management, proper lawn care and good housekeeping practices, and discouraging litter and debris disposal.
• Focus commercial and industrial educational programs on companies located within the floodplain.
These programs should include discussions of proper waste management and other good housekeeping practices.
• Consider other litter management strategies such as increasing the number of trash cans in common areas,
using youth volunteers to pick up trash, increasing the number of dog waste receptacles, and targeted inspections by city officials to insure dumpsters are covered and regularly emptied.
As a result, it is recommended that agricultural runoff and failing septic systems in the watershed be evaluated and an implementation plan for corrective action addressed in the TMDL report. The assumption that non-point sources are negligible seems inaccurate and insufficient to protect water quality. Failing ISDSs are a significant, yet unquantified source of bacteria. Many Northern portions of the watershed are not sewered and discharge to some type of ISDS system. Bacterial discharges to the W6 area of the river may be attributed to the 37 unsewered businesses operating in this low lying area of Johnston. It is recommended that the Department obtain a list of properties in unsewered areas of the watershed and compare the results of this list to the ISDS permit records to determine the properties discharging to inadequate or failing septic systems and cesspools. A plan of corrective action for these non-point sources should be included in the report. RIDEM Response:

111
DEM acknowledges that there are many businesses operating within the unsewered portion of the W6 catchment. Extensive reconnaissance was completed by DEM’s Office of Compliance and Inspection (OCI) several years ago, however this work focused primarily at the potential for these businesses to generate metals. Staff from OCI plan to continue investigations in this area with the focus shifting to bacteria and possible failing ISDS. Although there is a very small amount of agricultural land in the upper portion of the watershed, DEM knows of no agriculture-related water quality impairments in the Woonasquatucket River. If such sources existed and were of such magnitude to impact water quality it is likely that the 2001 and 2002 sampling would have identified this problem. If NBC has additional information regarding agriculture-related water quality issues in the Woonasquatucket, it is recommended that NBC contact DEM staff for investigation. DEM does acknowledge that failing septic systems may be intermittently impacting water quality in the river. DEM has added language under ‘Wastewater Management’ in the Implementation Section of the TMDL which discusses strategies for controlling fecal pollution from ISDS in portions of Johnston, North Providence, and Smithfield. Both Smithfield and Johnston have submitted an Onsite Wastewater Management Plan for DEM review. With regard to effluent from the Smithfield WWTF, although the effluent does indeed meet permit limits for fecal coliform, fecal coliform bacteria, like other bacteria, can reproduce at high rates given the appropriate environmental conditions, and thus the Smithfield WWTF discharges can impact water quality during warmer temperatures and low flow conditions despite having met RIPDES effluent standards at the end of the pipe. As previously noted, the metalfinishing industry, along with textile firms, have a long history working along the banks of the Woonasquatucket River and these industries have directly discharged to the river for over one hundred years, contributing heavy metals and other toxics to the silted up riverbed. Scouring of riverbeds during high flow situations can dislodge materials that can be high in both metals and pathogenic bacteria. This is an uncontrollable source of toxic materials that have been confirmed to be present at specific sites within the Woonasquatucket River. Over the past few years there have been many discussions amongst regulatory agencies and stakeholder groups regarding dredging the contaminated spoils from the CSO reaches of the lower river. Dredging the river to its former depths would not only remove the toxic metals, but would allow quicker flushing of pollutants from silted up CSOs and storm drains, a problem noted in the TMDL report. Page 44 of the TMDL seems to indicate that a retaining wall partially enclosing CSO-054 is holding back pollutants after a storm, allowing their discharge over several more days. Please note that this retaining wall is not part of the NBC infrastructure. It is the NBC’s belief that this structure is a footing for a utility crossing. Since this structure is not part of the NBC’s infrastructure, the NBC does not have the ability to remove the structure. RIDEM Response: DEM recommends that NBC confirm the ownership of this structure (or footing) and contact the owner to inquire whether it may be removed by the owner and/or NBC, and determine if a permit is required for removal and if that permit can be streamlined for easy approval. DEM would like to work collaboratively to address this problem. TMDL Development: With regard to the hardness values used for determination of the water quality criteria, if there was no significant difference between wet and dry hardness measurements, why wouldn’t the entire dataset be used to determine mean hardness values by river segment? (Page 57). Otherwise, the lower hardness, which produces lower water quality standards and is more protective of aquatic life, should be used. Additionally, the vast majority of water quality impairments are associated with wet weather (stormwater and run-off from the high degree of impervious surfaces in an urban environment) and so the wet weather hardness values would provide both a more realistic and more protective determination of the water quality standards applicable to each segment.

112
RIDEM Response: Hardness summaries, calculated from available data, for each segment of the Woonasquatucket River are provided below. Segment Mean Value in mg/l
CaCO3 Dry Wet
10A 22.2 21.8 10B 24.3 25.6 10C 30.0 31.5 10D 43.9 37.4 01 (Assapumpsett Brook) 55.7 44.9
DEM has, as suggested, used the lowest of either dry or wet weather mean hardness values for each segment to calculate applicable water quality criteria and set percent concentration reductions. Changes have been made accordingly in Segments 10A, 10D, and Segment 01 (Assapumpsett Brook). These modifications have resulted in minor changes in required copper, lead, and zinc concentration reductions for segment 10D only. DEM feels that it has been highly conservative in determining appropriate metals criteria to use throughout the mainstem and major tributary Assapumpsett Brook. All associated changes have been made in applicable text and tables throughout the TMDL document. In particular, the choice of hardness value used to calculate criteria in highly urbanized Segment 10D is overly conservative and results in a highly protective set of water quality criteria for dissolved copper, lead, zinc, and cadmium. This was considered a part of the ‘Margin of Safety’ when developing the TMDL. Text taken from Section 6.4 of the TMDL, and below, provides additional information regarding the highly conservative assumptions used to determine metals criteria in all segments, including 10D.
6.4 Margin of Safety The TMDLs must contain a margin of safety (MOS) to account for uncertainty in the analysis. The MOS for the Woonasquatucket River metals TMDL are implicit and are listed below.
• To calculate the required percent reductions, the maximum metal concentrations in each dataset were used to represent existing dry and wet weather conditions.
• Metals criteria in the tidally-impacted reach of the Woonasquatucket (Segment 10D) were based on a mean hardness
value of 37.4 mg/l CaCO3 (the lower of both the dry and wet weather mean hardness values) and were calculated from data collected during periods of low or ebb tide when flow was dominated by freshwater. A mean hardness value of 600 mg/l CaCO3 was calculated for the river under periods of flood and/or high tide.
Metals toxicity decreases with increasing hardness therefore use of the lower hardness value of 37.4 mg/l CaCO3 to calculate water quality criteria applicable under all tidal conditions is fully protective under low or ebb tide and conservative under periods of high or flood tide.
• The most protective numeric standard (the chronic aquatic life support standard) is used to set TMDL targets. In the
case of zinc, the acute criteria are slightly lower than the chronic criteria, therefore the most protective numeric standard for zinc is the acute aquatic life support standard.

113
In all segments of the Woonasquatucket River, the acute water quality criteria for zinc is lower than the chronic value. In this situation, we believe that they should both be set to the lower of the two in order to devise TMDL limits. RIDEM Response: DEM has modified the document accordingly. Acute criteria for zinc are lower than chronic criteria. The difference is minor and does not result in changes in required zinc reductions for any segments. Page 43: Domestic wastewater also contains significant amounts of Copper and Zinc from pipe corrosion within domestic residences. Future Monitoring: The Future Monitoring section indicates that the NBC’s fecal coliform monitoring as well as the Woonasquatucket River Watershed Council monitoring initiatives will be used to evaluate water quality of the river. Although the NBC has no immediate plans to change our existing Woonasquatucket River monitoring initiative, we cannot predict future monitoring requirements, initiatives or funding levels. Therefore it is strongly recommended that the Department develop and fund a comprehensive monitoring plan for the river that will ensure that the TMDL can be fully implemented and water quality goals achieved. RIDEM Response:
DEM has proposed a comprehensive monitoring strategy which includes (1) periodic assessment of rivers and streams applied in a rotating basin approach using an intensive sampling design (geometric design); and (2) regular monitoring at fixed-stations on a limited number of large rivers. The rotating basin approach will involve the periodic monitoring and assessment of multiple sites located in multiple streams and rivers within specific basins or watersheds. It constitutes a change from past practice in Rhode Island, but is expected to yield significant benefits in terms of more comprehensively characterizing water quality conditions on a statewide basis.
In the geometric design, sampling locations are located proportional to the network of streams within the watershed. In the application of a geometric design, a sampling location is established at the mouth of the targeted river watershed. The upstream drainage area is then halved and stations are located at all stream points with drainage areas of this size. The process continues with the area halved again and stations again located to reflect drainage areas of the corresponding size. The process is typically completed when the drainage area reaches a 1-2 square mile area. There are seven (7) watershed assessment units in the rotating basin approach. The Urban Rivers assessment unit consists of the Ten Mile, Woonasquatucket, Moshassuck, Palmer, and Lower Taunton watersheds. Prior to sampling in this unit (estimated to be in 2008) the geometric design will be applied to the Woonasquatucket River, resulting in greater coverage of the basin as a whole. This will more than likely result in not only mainstem stations being sampled but will also include many of the tributaries within the basin. Overall, the geometric design results in sampling approximately 2.5 stations per square mile. This would result in approximately 20 stations being sampled in the Woonasquatucket River watershed. Macroinvertebrate sampling would be conducted at each station, once, a minimum of five (5) samples collected at each station would be analyzed for pathogens (fecal coliform and Enterococcus, and two (2) to three (3) samples collected at each station would be analyzed for chemistry (BOD, Chloride, Conductivity, Sodium, Hardness, Dissolved Oxygen, NH3-N, NO3-N, pH, PO4-P, Temperature, total Nitrogen, Total Phosphorus, Total Suspended Solids (TSS), Total Volatile Solids (TVS), Dissolved Cadmium, Zinc, Lead, and Copper, Total Iron, and Turbidity).

114
Page 23 contains the following statement: “Detection limits for dissolved metals were greater than or equal to the water quality criteria”. Also, during the public hearing it was mentioned that the Department did not know how they would be able to evaluate such low levels for metals in the river. Please note that the NBC has a project underway to significantly lower our detection limits for metals and we would be willing to discuss partnering with the Department on such a future monitoring initiative. RIDEM Response: Comment is duly noted. We appreciate your offer of collaboration for future monitoring in the Woonasquatucket. Other Comments: The concept that stormwater and redevelopment guidelines are segment specific (i.e. Zinc controls for Segment 10A only) seems to make the assumption that water quality issues will remain confined to their individual segments. Particularly during storm events, high metals inputs can have further reaching effects due to higher flow conditions, and for this reason, the implementation of toxic control measures should be uniform, not site-specific, and they should be addressed, though perhaps not with the same urgency. RIDEM Response: Although DEM has required segment-specific BMPs to address metals impairments a majority of improvements will likely be realized on a watershed basis as a result of implementation of TMDL requirements for Phase II plans The watershed map on page 24 is an excellent reference. Throughout the TMDL report, however, reference is made to river Segments 10A, 10B, 10C and 10D, which are not shown on the map. We suggest that these river segments be added to the map on page 24. RIDEM Response: We have modified Figure 3.1 accordingly. On page 69 of the TMDL report, it is stated that the NBC should “encourage” municipalities in our service area to take steps to reduce stormwater runoff. Please note that the NBC has no regulatory authority to “encourage” such activities from the municipalities we service. Rather, this initiative should be required by the Department, the CRMC, or both. The NBC regulations do allow us to require developers to prepare Stormwater Management & Mitigation Plans to eliminate and reduce stormwater inputs to our sewage system as part of the sewer connection permitting process. These developers are required to implement Low Impact Design (LID) and BMP technologies into their development and construction projects. Since 2003 this program has reduced 2.6 million gallons of stormwater flow into the Field’s Point sewer system based upon a 3-month storm, the design basis for the NBC Phase I CSO tunnel project. The benefits of this program are immediate as we are reducing storm flow to our system, reducing CSO discharges and in the future storm flow to the CSO Tunnel will be minimized providing additional capacity. The 6 Minimum Stormwater Phase II Measures noted in the TMDL report will include a measure for MS4s to implement a “stormwater runoff control program for new development and redevelopment of sites disturbing 1 or more acres”. The NBC Stormwater Management Mitigation program applies to developments of any size, and success of this program at reducing stormwater flow into the NBC sewer system can be duplicated throughout the Woonasquatucket River watershed if required of the MS4 facilities by the Department. RIDEM Response: Text on page 69 of the TMDL report states that “….NBC, with DEM’s assistance, will continue to work with municipalities in the NBC service area to encourage them to take steps to reduce stormwater runoff.” As it is

115
clearly in NBC’s rights to regulate discharges to its’ combined sewage overflow system, we re-iterate our recommendation that NBC work with municipalities, as well as private developers, to reduce stormwater runoff discharges into the combined sewage overflow system. Through the RIPDES Phase II and TMDL Programs, DEM will continue to work with municipalities and private developers, as appropriate to reduce both the volume of runoff and discharge of pollutants of concern to the Woonasquatucket River. Page 84: typo: existing, not exiting RIDEM Response: Correction made Illegal dumping of waste oil, tires and other materials are addressed as a problem in the TMDL report. The Narragansett Bay Commission has worked for many years to clean up the lower sections of the river and has also worked to address the problem of illegal dumping. The NBC and RI Resource Recovery Corporation has jointly funded a study to determine the extent of statewide dumping of “Hard to Dispose Items”. I have attached a copy of this report for your reference. Many of the conclusions and recommendations from this report may be applicable for implementation in the TMDL report. Thank you for the opportunity to comment on your TMDL Report and for considering the concerns of the Narragansett Bay Commission. If I may provide additional information pertaining to this matter, please do not hesitate to contact me at (401) 461-8848 Ext. 470. Sincerely, Thomas P. Uva Director of Planning, Policy & Regulation Narragansett Bay Commission Cc: Raymond Marshall, PE Paul Nordstrom, PE Thomas Brueckner, PE John Motta Eric Beck, PE – DEM, include Hard to Dispose Report Elizabeth Scott - DEM, include Hard to Dispose Report February 5, 2007

116
Brian Zalewsky RI Department of Environmental Management 235 Promenade Street Providence, RI 02908 Dear Mr. Zalewsky: I am writing on behalf of the Woonasquatucket River Watershed Council (WRWC) to respectfully submit the following comments on the draft Bacteria and Dissolved Metals TMDL for the Woonasquatucket River for your consideration:
• Nonpoint Sources The Executive Summary states that “the largest and most persistent wet weather pollution sources
include stormwater runoff (nonpoint) and CSO discharges.” Further down, it states that “all bacteria source reductions for this TMDL are combined into the wasteload (point) allocation.” We recognize that, as also stated in the Summary, that insufficient data exists to differentiate between point and nonpoint sources, but feel this statement could be rewritten to underscore the critical need to address nonpoint sources, despite the evaluation difficulties. The CSO abatement project will have major impacts on water quality in the lower river – but not until/if it is completed in 2020. Other measures must be taken in the interim to help relieve pollutant inputs. We maintain that there needs to be strong state oversight and enforcement of the four MS4’s stormwater management plans in order to fully realize the benefits these plans are expected to achieve.
RIDEM Response:
The Woonasquatucket River Bacteria and Dissolved Metals TMDL will require the implementation of additional and enforceable measures above and beyond those currently required by MS4s and represents a more aggressive approach in dealing with stormwater. Detailed information is provided in Section 7.3 of the TMDL.
• Municipalities You have done a great job in identifying and listing recommended actions for each Town to take in order to meet goals of the TMDL plan. We would prefer to see stronger language in this section that would compel towns to adopt these actions. For example, in the Johnston section, page 78, instead of “The Town should provide descriptions of maintenance activities, maintenance schedules and long term inspection procedures…: “The Town must provide descriptions of maintenance activities, maintenance schedules and long term inspection procedures…” Another example is in the table on page 87, “Implementation Action Summaries”: “Local Ordinances should institute stormwater volume reduction requirements for redevelopment of commercial and industrial properties”. It is time that local ordinances must institute and enforce stormwater volume reduction requirements.
RIDEM Response: DEM has made changes in Section 7.4 of the TMDL, which details specific requirements for MS4s in the watershed. In cases where the TMDL is requiring additional and stronger measures that the Towns must adopt as part of their Phase II permit requirements, the word “should” has been changed to “must”. DEM has also reviewed the rest of the Implementation Section for consistency in this regard and has made changes where appropriate.

117
• Cumulative Impacts We are concerned about the “1 acre” standard by which towns are “encouraged” to implement construction and post-construction BMPs. In Providence for example, most developable lots along the River are under 1 acre. Is there a strategy for taking into account the cumulative impact/loads from small development activities? RIDEM Response: The TMDL currently states that revised SWMPPs must address revisions to the local ordinances to ensure that: 1. new land development employ stormwater controls to prevent any net increase in those pollutant(s) of
concern [bacteria (for sites contributing to MS4s which discharge directly to the Woonasquatucket River and Assapumpset Brook) and zinc (for direct discharges to reach 10A only)]; and
2. redevelopment projects employ stormwater controls to prevent any net increase in those pollutant(s) of
concern [bacteria (for sites contributing to MS4s which discharge directly to the Woonasquatucket River and Assapumpset Brook) and zinc (for direct discharges to reach 10A only)].
DEM has added additional language in this Section of the TMDL. DEM will request that for new land development and redevelopment projects that Towns consider expanding on the above mentioned revisions to local ordinances on a Town-wide basis and lowering the current threshold (of greater than one acre) to less than one acre, and that the more stringent requirements apply to discharges to all surface waters within the watershed. The revised plan must also include an assessment of impacts of imposing these requirements on lower threshold developments.
• Tributaries We would agree with the comment raised at the public meeting that we would like to see more sampling conducted in the tributaries to the Woonasquatucket to get a clearer picture of conditions in contributing waters. RIDEM Response: DEM has proposed a comprehensive monitoring strategy which includes (1) periodic assessment of rivers and streams applied in a rotating basin approach using an intensive sampling design (geometric design); and (2) regular monitoring at fixed-stations on a limited number of large rivers. The rotating basin approach will involve the periodic monitoring and assessment of multiple sites located in multiple streams and rivers within specific basins or watersheds. It constitutes a change from past practice in Rhode Island, but is expected to yield significant benefits in terms of more comprehensively characterizing water quality conditions on a statewide basis. In the geometric design, sampling locations are located proportional to the network of streams within the watershed. In the application of a geometric design, a sampling location is established at the mouth of the targeted river watershed. The upstream drainage area is then halved and stations are located at all stream points with drainage areas of this size. The process continues with the area halved again and stations again located to reflect drainage areas of the corresponding size. The process is typically completed when the drainage area reaches a 1-2 square mile area. There are seven (7) watershed assessment units in the rotating basin approach. The Urban Rivers assessment unit consists of the Ten Mile, Woonasquatucket, Moshassuck, Palmer, and Lower Taunton watersheds. Prior

118
to sampling in this unit (estimated to be in 2008) the geometric design will be applied to the Woonasquatucket River, resulting in greater coverage of the basin as a whole. This will more than likely result in not only mainstem stations being sampled but will also include many of the tributaries within the basin. Overall, the geometric design results in sampling approximately 2.5 stations per square mile. This would result in approximately 20 stations being sampled in the Woonasquatucket River watershed. Macroinvertebrate sampling would be conducted at each station, once, a minimum of five (5) samples collected at each station would be analyzed for pathogens (fecal coliform and Enterococcus, and two (2) to three (3) samples collected at each station would be analyzed for chemistry (BOD, Chloride, Conductivity, Sodium, Hardness, Dissolved Oxygen, NH3-N, NO3-N, pH, PO4-P, Temperature, total Nitrogen, Total Phosphorus, Total Suspended Solids (TSS), Total Volatile Solids (TVS), Dissolved Cadmium, Lead, Zinc, Copper, Total Iron, and Turbidity). • Timeliness Development is in progress on the Woonasquatucket and more is slated to start within the year. We urge RI DEM to move as quickly as possible to put measures in place.
We commend you and the other RI DEM staff who have put so much time and effort into the development of this plan. Despite the lack of a TMDL for debris, an insidious problem on the River, we noted and appreciated the consideration brought to that issue within this TMDL document. We also praise your specificity in targeting high priority outfalls, W-6 and W-23 for immediate attention from RI DOT. We greatly appreciate the vast amount of time and effort that has gone into the development of this document and look forward to working with you on ways we can maximize its effectiveness as a tool for improving water quality in the Woonasquatucket River basin. Thank you for your consideration of our comments.
Sincerely,
Jennifer Pereira Executive Director

119
Appendix C. Final Public Meeting Summary

120
Woonasquatucket River TMDL public meeting notes January 4, 2007 Room 300 @ 530pm DEM Offices, Providence 12 people in attendance not counting DEM staff. Approximately 90 stakeholder letters sent out. Meeting public noticed at main libraries in each of four municipalities, as well as all Town Halls. Meeting began promptly at 530pm. DEM staff in attendance were Elizabeth Scott, Brian Zalewsky, Eric Beck, Sam Kaplan, Joe Haberek, Maragaritta Chatterton, Lou Maccarone. Liz Scott began the meeting with introductions and project overview. Brian Zalewsky: Technical Presentation, overview of NBC CSO abatement project and Interceptor Maintenance and BMP work. Liz Scott: remainder of implementation and TMDL recommendation slides. Stormwater Phase II and additional measures summary. Industrial Stormwater, other. Questions and Comments: Question from Eugenia Marks (Audubon Society): Q: Why has the TMDL not included Deerfield River or Reaper Brook (or many other tributaries to the Woonasquatucket River). Will there be a process for reviewing contributions from these streams? What about redevelopment in this area of the watershed? DEM Response: Due to staff and resource constraints we were not able to sample all tributaries. Hundreds of pipes discharging to Woonasquatucket River. Some tributaries are sampled but did not show elevated levels of pollution. May not be on 303d List. Process for reviewing contributions or at least addressing outfalls is via Phase II outfall identification work should have been completed by entitites. Should we be modifying language in Phase II additional recommendation section to include all tributaries or is this implicit in the language? Q: Jenny Pereira (Woonasquatucket River Watershed Council): Can the TMDL be used to discourage inappropriate development activities? (Eagle Square area plan to extend paving for parking lot). DEM Response: TMDL not an enforceable document however the TMDL recommends that municipalities be more aggressive in dealing with these issues. Local ordinances should be modified in SWMPPs to address these issues. Towns should be amending their ordinances such that applicant must demonstrate that they are not adding to pollutant of concern. Q: Tom Uva (Narragansett Bay Commission): NBC requires developers to address stormwater. There is a lack of a state stormwater manual and there are no volume controls. DEM Response: We agree and have been working on developing the state stormwater manual.

121
Q: Don Pryor (Brown U): TMDL only looks at dissolved metals in surface water does not address the issue of metals in sediments and complexing issues and sediments as a source and/or sink of metals, especially in the lower portion of the Woonasquatucket River. TMDL should evaluate possible transport mechanisms. Perhaps add a paragraph that significant amounts of sediments are transported to the river in the lower portions. DEM Response: The TMDL does mention that metals release from sediments may be a likely source of surface water contamination. As you know, the fate of toxic metals in river sediments depends on a combination of the physical, chemical, and biological conditoins Eugenia Marks: What is the status of other parameters and other waterbodies (Group 2 and 5) in Woonasquatucket Basin? Latham Brook? Nine Foot Brook? Lower Sprague Reservoir? Liz Scott reviewed status (some had status unknown) and provided updates to the best of her knowledge regarding other waterbodies. Jane Sherman: What about PCB impairments in the river, when will those be addressed. Liz Scott: We haven’t even thought about that parameter yet. Can imagine that the scope and cost and time to develop a PCB TMDL is huge and beyond staff expertise. PCB TMDL is far out on development timeframe. Eugenia Marks: What about the extensive Auto Salvage Yards in Assapumpsett Brook where stream confluences with Woonasquatucket? Are they contributors? We will give status of ERP, PP efforts with specific auto salvage yards in Assapumpsett Brook in TMDL. Ask Eugenia if she has any additional information about facilities. Tom Uva: How did you conduct CSO sampling? We did not conduct CSO sampling, only large stormwater outfalls consisting of grab samples during storm. Bruce (WRWC): There are other Watershed Watch Sampling locations in the Woonasquatucket. See website. When will DEM be monitoring in the river again? DEM conducts sampling on a revolving watershed, basin approach. Will check to see when we plan to be in the basin. Mention NBC and WRWC sampling to help track changes in water quality as time progresses. Tom Uva: How will the TMDL address bacteria problems upstream of CSOs? Eric Beck to answer: dry weather outfall sampling as Part of Phase II-screening process. Anything flowing is sampled twice. Catchbasin and structure inspections looking for illegal connections.
Related Documents