ARTICLE Rhythmic glucose metabolism regulates the redox circadian clockwork in human red blood cells Ratnasekhar Ch 1,7,11 , Guillaume Rey 1,8,11 , Sandipan Ray 2,3,9 , Pawan K. Jha 2,3 , Paul C. Driscoll 4 , Mariana Silva Dos Santos 4 , Dania M. Malik 2,3 , Radoslaw Lach 1,10 , Aalim M. Weljie 2,3 , James I. MacRae 4 , Utham K. Valekunja 2,3 & Akhilesh B. Reddy 2,3,5,6 ✉ Circadian clocks coordinate mammalian behavior and physiology enabling organisms to anticipate 24-hour cycles. Transcription-translation feedback loops are thought to drive these clocks in most of mammalian cells. However, red blood cells (RBCs), which do not contain a nucleus, and cannot perform transcription or translation, nonetheless exhibit circadian redox rhythms. Here we show human RBCs display circadian regulation of glucose metabolism, which is required to sustain daily redox oscillations. We found daily rhythms of metabolite levels and flux through glycolysis and the pentose phosphate pathway (PPP). We show that inhibition of critical enzymes in either pathway abolished 24-hour rhythms in metabolic flux and redox oscillations, and determined that metabolic oscillations are necessary for redox rhythmicity. Furthermore, metabolic flux rhythms also occur in nucleated cells, and persist when the core transcriptional circadian clockwork is absent in Bmal1 knockouts. Thus, we propose that rhythmic glucose metabolism is an integral process in circadian rhythms. https://doi.org/10.1038/s41467-020-20479-4 OPEN 1 University of Cambridge Metabolic Research Laboratories, Institute of Metabolic Science, University of Cambridge, Addenbrooke’s Hospital, Cambridge CB2 0QQ, UK. 2 Department of Systems Pharmacology and Translational Therapeutics, Perelman School of Medicine, University of Pennsylvania, Pennsylvania, PA 19104, USA. 3 Institute for Translational Medicine and Therapeutics, Perelman School of Medicine, University of Pennsylvania, Philadelphia, PA 19104, USA. 4 The Francis Crick Institute, 1 Midland Road, London NW1 1AT, UK. 5 Institute for Diabetes, Obesity, and Metabolism, University of Pennsylvania Perelman School of Medicine, Philadelphia, PA 19104, USA. 6 Chronobiology and Sleep institute (CSI), Perelman School of Medicine, University of Pennsylvania, Philadelphia, PA 19104, USA. 7 Present address: School of Biological Sciences, Queen’s University Belfast, Belfast BT9 5DL, UK. 8 Present address: Unilabs Genetics Laboratory, 1003 Lausanne, Switzerland. 9 Present address: Department of Biotechnology, Indian Institute of Technology Hyderabad, Kandi, Sangareddy 502285, Telangana, India. 10 Present address: Department of Oncology, University of Cambridge, Cambridge Biomedical Campus, Cambridge CB2 0XZ, UK. 11 These authors contributed equally: Ratnasekhar Ch, Guillaume Rey. ✉ email: [email protected] NATURE COMMUNICATIONS | (2021)12:377 | https://doi.org/10.1038/s41467-020-20479-4 | www.nature.com/naturecommunications 1 1234567890():,;

Welcome message from author
This document is posted to help you gain knowledge. Please leave a comment to let me know what you think about it! Share it to your friends and learn new things together.
Transcript
ARTICLE
Rhythmic glucose metabolism regulates the redoxcircadian clockwork in human red blood cellsRatnasekhar Ch 1,7,11, Guillaume Rey 1,8,11, Sandipan Ray2,3,9, Pawan K. Jha2,3, Paul C. Driscoll 4,
Mariana Silva Dos Santos 4, Dania M. Malik2,3, Radoslaw Lach1,10, Aalim M. Weljie2,3, James I. MacRae 4,
Utham K. Valekunja 2,3 & Akhilesh B. Reddy2,3,5,6✉
Circadian clocks coordinate mammalian behavior and physiology enabling organisms to
anticipate 24-hour cycles. Transcription-translation feedback loops are thought to drive these
clocks in most of mammalian cells. However, red blood cells (RBCs), which do not contain a
nucleus, and cannot perform transcription or translation, nonetheless exhibit circadian redox
rhythms. Here we show human RBCs display circadian regulation of glucose metabolism,
which is required to sustain daily redox oscillations. We found daily rhythms of metabolite
levels and flux through glycolysis and the pentose phosphate pathway (PPP). We show that
inhibition of critical enzymes in either pathway abolished 24-hour rhythms in metabolic flux
and redox oscillations, and determined that metabolic oscillations are necessary for redox
rhythmicity. Furthermore, metabolic flux rhythms also occur in nucleated cells, and persist
when the core transcriptional circadian clockwork is absent in Bmal1 knockouts. Thus, we
propose that rhythmic glucose metabolism is an integral process in circadian rhythms.
https://doi.org/10.1038/s41467-020-20479-4 OPEN
1 University of Cambridge Metabolic Research Laboratories, Institute of Metabolic Science, University of Cambridge, Addenbrooke’s Hospital, Cambridge CB20QQ, UK. 2Department of Systems Pharmacology and Translational Therapeutics, Perelman School of Medicine, University of Pennsylvania, Pennsylvania,PA 19104, USA. 3 Institute for Translational Medicine and Therapeutics, Perelman School of Medicine, University of Pennsylvania, Philadelphia, PA 19104,USA. 4 The Francis Crick Institute, 1 Midland Road, London NW1 1AT, UK. 5 Institute for Diabetes, Obesity, and Metabolism, University of PennsylvaniaPerelman School of Medicine, Philadelphia, PA 19104, USA. 6 Chronobiology and Sleep institute (CSI), Perelman School of Medicine, University ofPennsylvania, Philadelphia, PA 19104, USA. 7Present address: School of Biological Sciences, Queen’s University Belfast, Belfast BT9 5DL, UK. 8Presentaddress: Unilabs Genetics Laboratory, 1003 Lausanne, Switzerland. 9Present address: Department of Biotechnology, Indian Institute of TechnologyHyderabad, Kandi, Sangareddy 502285, Telangana, India. 10Present address: Department of Oncology, University of Cambridge, Cambridge BiomedicalCampus, Cambridge CB2 0XZ, UK. 11These authors contributed equally: Ratnasekhar Ch, Guillaume Rey. ✉email: [email protected]
NATURE COMMUNICATIONS | (2021) 12:377 | https://doi.org/10.1038/s41467-020-20479-4 | www.nature.com/naturecommunications 1
1234
5678
90():,;
C ircadian rhythms allow species to adapt their physiology todaily environmental variation tied to the Earth’s rotation1.They govern essential processes, including the regulation
of hormones, the sleep-wake cycle, cell division, and immunity2,3.Disruption of circadian rhythms is associated with metabolicsyndrome, obesity, type 2 diabetes and various neurological dis-orders4,5. Circadian rhythms are thought to be driven bytranscriptional-translational feedback loops (TTFLs), wherebyrhythmic expression of clock gene products regulate the expres-sion of associated genes in an approximately 24-h cycle6. How-ever, genetic studies of circadian clocks in various modelorganisms (cyanobacteria, Drosophila, Arabidopsis, mice, andhumans) has shown that most clock genes are not evolutionarilyconserved across distinct phylogenetic kingdoms, and TTFLcomponents are not shared between organisms7. Several studiesimplicate non-transcriptional components in circadian rhythmi-city. These include post-translational circadian oscillation ofcyanobacterial KaiC phosphorylation and cytosolic mechanismssuch as Ca2+/cAMP8,9. However, there is limited homology ofthese posttranslational clock components across various modelorganisms10, and thus it has been challenging to study post-translational aspects of circadian biology in nucleated mamma-lian cells.
We previously found circadian rhythms in reduction-oxidation(redox) cycles of peroxiredoxin proteins in mammalian red bloodcells (RBCs), which do not have nuclei and do not produce newRNA or protein11. We also found similar posttranslational per-oxiredoxin rhythms in various prokaryotes and eukaryotescommonly used as circadian model systems10,12. This suggeststhat redox processes are important in circadian rhythm genera-tion across phylogenetic boundaries, and may have evolved ~2.5billion years ago with specific mechanisms to counteract thedeleterious consequences of oxidative stress7,10. However, whatdrives circadian timing of redox balance is unclear. Metabolism isone such important player that may be a connecting nodebetween redox processes and the clockwork.
In this study, we sought to understand the metabolic basis ofperoxiredoxin oscillations in human red blood cells. To do this,we characterized circadian regulation of metabolites in humanred blood cells using metabolomics and computed metabolicfluxes. Importantly, we uncovered rhythmic oscillations in gly-colysis and pentose phosphate pathway metabolites and meta-bolic fluxes with distinct and opposite phases. Moreover, we findthat circadian regulation of metabolic switching in glycolysis andpentose phosphate pathways is tightly coupled to redox oscilla-tions. Perturbing key components of these metabolic pathwaysresults in loss of redox rhythms in human RBCs. We thenexamined nucleated mammalian cells and found analogousmetabolic oscillations, with and without the core TTFL clockfeedback circuit. Thus, we find that circadian metabolic fluxrhythms persist regardless of whether the TTFL is present.
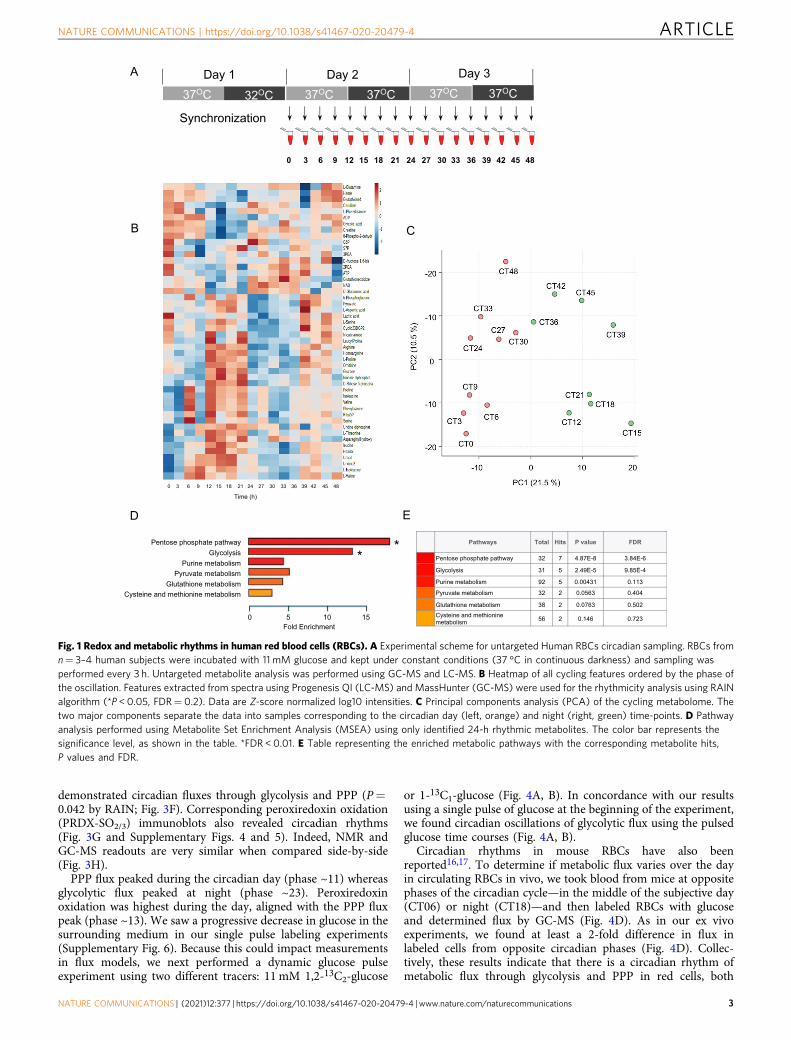
ResultsMetabolomics reveals circadian regulation of metabolites inhuman RBCs. Because human RBCs cannot perform transcrip-tion and/or protein synthesis, they completely rely on metabolicprocesses to combat reactive oxygen species (ROS), created byauto-oxidation of hemoglobin, for survival11,13,14. As such, wehypothesized that metabolism exhibits non-transcriptional oscil-lations in RBCs. To determine whether metabolism exhibits adaily rhythm, we first analyzed the RBC metabolome in samplesfrom human subjects. We collected fresh blood samples andincubated purified RBCs in constant conditions (at 37 °C incontinuous darkness) ex vivo to exclude any temporal cues thatcould drive oscillations (Fig. 1A)11,15–17. Thus, any measurements
made reflect self-sustained rhythms in the isolated cells. Wesampled cells every 3 h over two days and performed untargetedmetabolite profiling by gas chromatography (GC) and liquidchromatography (LC) mass spectrometry (MS). We detected1,698 features that had a coefficient of variation <30% in qualitycontrol samples. This included 533 features from negative modeLC-MS and 1074 from positive mode, with an additional 91 fromGC-MS (Supplementary Fig. 1). We identified 43 rhythmicmetabolites (padj < 0.05) using Rhythmicity Analysis Incorporat-ing Nonparametric methods (RAIN)18 (Fig. 1B, and Supple-mentary Table 1).
The majority of rhythmic metabolites included carbohydratesand redox metabolites. Overall, 20% (43 of 213 known detectedmetabolites) of the RBC metabolome displayed a 24-h cycle. Thisis consistent with the circadian metabolome of human bloodplasma (∼15–22%)19,20. Since RBCs cannot perform fatty acidsynthesis, protein synthesis, the citric acid cycle, or nucleotidesynthesis, these aspects of metabolism are not under circadiancontrol. Principal Components Analysis (PCA) revealed that thecorresponding time points from the first and second daysgrouped together, and that the major component separating thecycling metabolome was time of the day (Fig. 1C). Pathwayenrichment analysis of rhythmic metabolites identified anenrichment in glycolysis and PPP pathways (false discovery rate,FDR < 0.01), but not others (Fig. 1D, E).
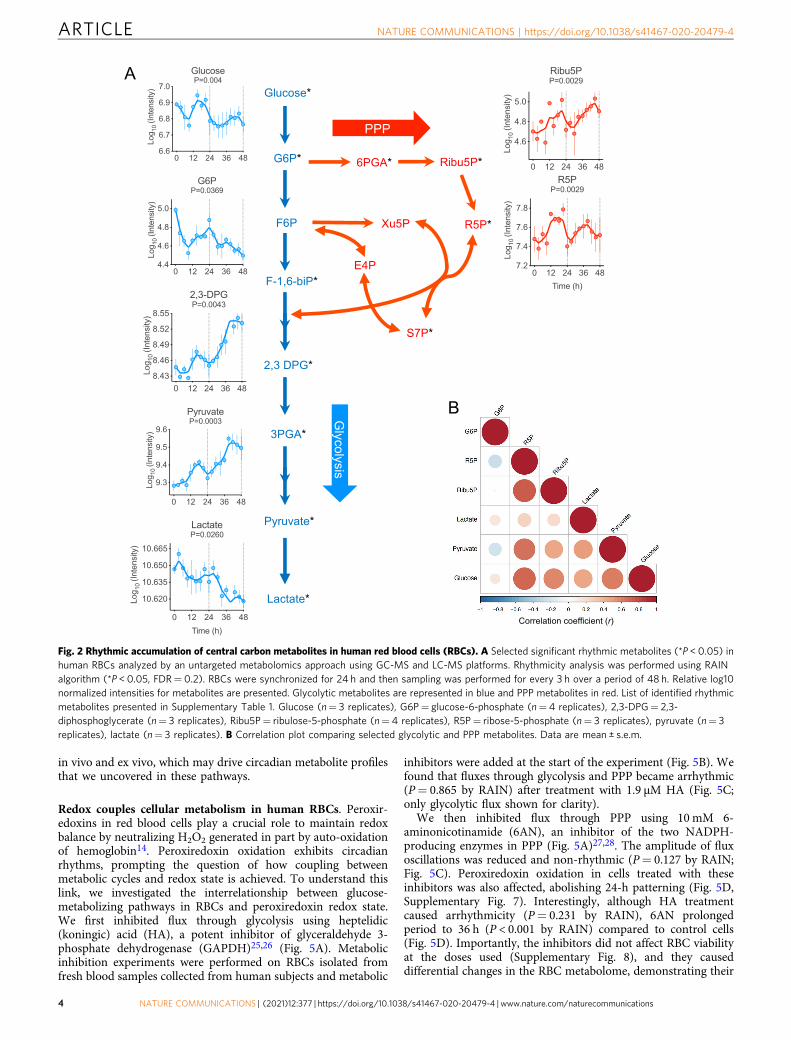
Glucose displayed a well-defined 24-h oscillation (P= 0.005 byRAIN), with glucose-6-phosphate (G6P) showing a similar phase,albeit with reduced rhythmicity (P= 0.0369 by RAIN) (Fig. 2A).Importantly, ribose-5-phosphate (R5P), a principal metabolite inthe PPP, exhibited daily cycling in anti-phase to G6P (Fig. 2A, B).In addition, many other metabolites in the glycolytic pathwayshowed robust circadian cycles over at least two days (Fig. 2A,Supplementary Table 1). Together, these data show that there iscircadian oscillation of specific glycolytic and PPP metabolites inhuman RBCs.
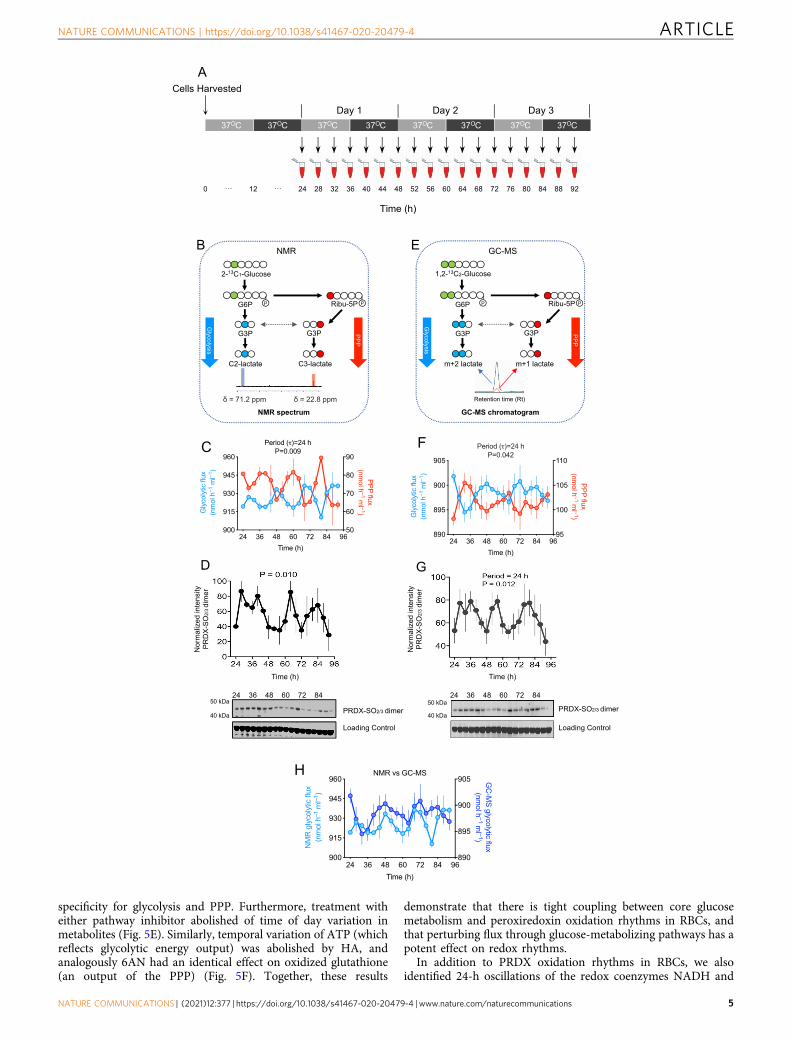
Rhythmic glycolysis and PPP fluxes in human RBCs. Metabo-lites levels are dependent on the input of fluxes through metabolicpathways, and these metabolic pathway fluxes are considered acrucial biological function, and are under strong evolutionaryselection procedure21,22. To determine how rhythmic abundanceof metabolites occurs, and the enrichment of metabolites in dif-ferent circadian phases, we assessed the rate of flow throughglycolysis and PPP. We employed an established labeling modelto measure metabolic fluxes in human RBCs by nuclear magneticresonance spectroscopy (NMR)23. Under constant conditions, asdescribed above, we took samples at 4 h intervals over three daysto determine flux through glycolysis and PPP (Fig. 3A). Wecollected samples at least 24-h after incubating cells in 11 mMlabeled glucose. When 2-13C1-glucose is metabolized by glyco-lysis, it produces lactate labeled at position 2 (2-13C1-lactate; C2-lactate). In contrast, 3-13C1-lactate (C3-lactate) is produced whenthe labeled glucose passes through PPP (Fig. 3B). We quantifiedthese differentially labeled lactates at a chemical shift (δ) of 71.2(C2-lactate) and 22.8 (C3-lactate) using NMR (Fig. 3B). We thencalculated fluxes through PPP and glycolysis. We found circadianoscillation of glycolysis (P= 0.009 by RAIN), and PPP in anti-phase, for three consecutive days (Fig. 3C).
Peroxiredoxin oxidation (PRDX-SO2/3) in RBCs from the samesamples demonstrated circadian rhythms (Fig. 3D, Supplemen-tary Figs. 2 and 3). We validated circadian flux measurements byperforming an independent experiment with 11 mM 1,2-13C2-Glucose, assayed by GC-MS (Fig. 3E–G). When 1,2-13C2-glucoseis administered to RBCs, glycolysis generates m+ 2 lactate, whilePPP generates m+ 1 lactate (Fig. 3E)24. GC-MS also
ARTICLE NATURE COMMUNICATIONS | https://doi.org/10.1038/s41467-020-20479-4
2 NATURE COMMUNICATIONS | (2021) 12:377 | https://doi.org/10.1038/s41467-020-20479-4 | www.nature.com/naturecommunications
demonstrated circadian fluxes through glycolysis and PPP (P=0.042 by RAIN; Fig. 3F). Corresponding peroxiredoxin oxidation(PRDX-SO2/3) immunoblots also revealed circadian rhythms(Fig. 3G and Supplementary Figs. 4 and 5). Indeed, NMR andGC-MS readouts are very similar when compared side-by-side(Fig. 3H).
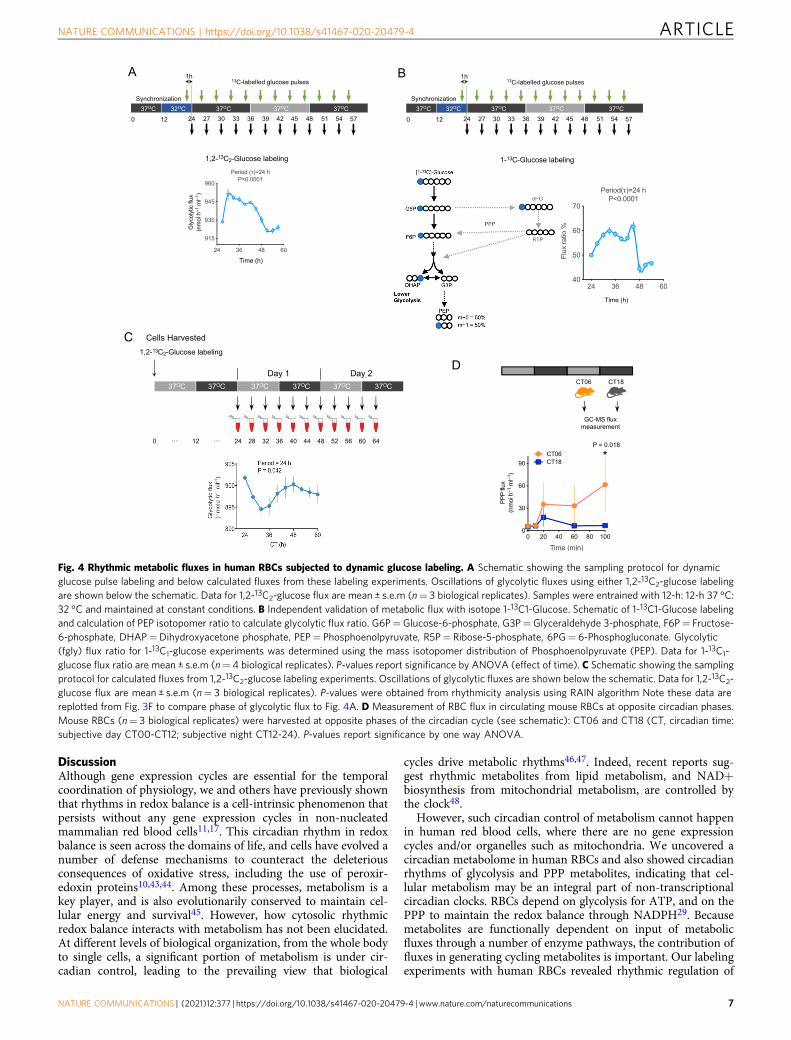
PPP flux peaked during the circadian day (phase ~11) whereasglycolytic flux peaked at night (phase ~23). Peroxiredoxinoxidation was highest during the day, aligned with the PPP fluxpeak (phase ~13). We saw a progressive decrease in glucose in thesurrounding medium in our single pulse labeling experiments(Supplementary Fig. 6). Because this could impact measurementsin flux models, we next performed a dynamic glucose pulseexperiment using two different tracers: 11 mM 1,2-13C2-glucose
or 1-13C1-glucose (Fig. 4A, B). In concordance with our resultsusing a single pulse of glucose at the beginning of the experiment,we found circadian oscillations of glycolytic flux using the pulsedglucose time courses (Fig. 4A, B).
Circadian rhythms in mouse RBCs have also beenreported16,17. To determine if metabolic flux varies over the dayin circulating RBCs in vivo, we took blood from mice at oppositephases of the circadian cycle—in the middle of the subjective day(CT06) or night (CT18)—and then labeled RBCs with glucoseand determined flux by GC-MS (Fig. 4D). As in our ex vivoexperiments, we found at least a 2-fold difference in flux inlabeled cells from opposite circadian phases (Fig. 4D). Collec-tively, these results indicate that there is a circadian rhythm ofmetabolic flux through glycolysis and PPP in red cells, both
Fig. 1 Redox and metabolic rhythms in human red blood cells (RBCs). A Experimental scheme for untargeted Human RBCs circadian sampling. RBCs fromn= 3–4 human subjects were incubated with 11 mM glucose and kept under constant conditions (37 °C in continuous darkness) and sampling wasperformed every 3 h. Untargeted metabolite analysis was performed using GC-MS and LC-MS. B Heatmap of all cycling features ordered by the phase ofthe oscillation. Features extracted from spectra using Progenesis QI (LC-MS) and MassHunter (GC-MS) were used for the rhythmicity analysis using RAINalgorithm (*P < 0.05, FDR= 0.2). Data are Z-score normalized log10 intensities. C Principal components analysis (PCA) of the cycling metabolome. Thetwo major components separate the data into samples corresponding to the circadian day (left, orange) and night (right, green) time-points. D Pathwayanalysis performed using Metabolite Set Enrichment Analysis (MSEA) using only identified 24-h rhythmic metabolites. The color bar represents thesignificance level, as shown in the table. *FDR < 0.01. E Table representing the enriched metabolic pathways with the corresponding metabolite hits,P values and FDR.
NATURE COMMUNICATIONS | https://doi.org/10.1038/s41467-020-20479-4 ARTICLE
NATURE COMMUNICATIONS | (2021) 12:377 | https://doi.org/10.1038/s41467-020-20479-4 | www.nature.com/naturecommunications 3
in vivo and ex vivo, which may drive circadian metabolite profilesthat we uncovered in these pathways.
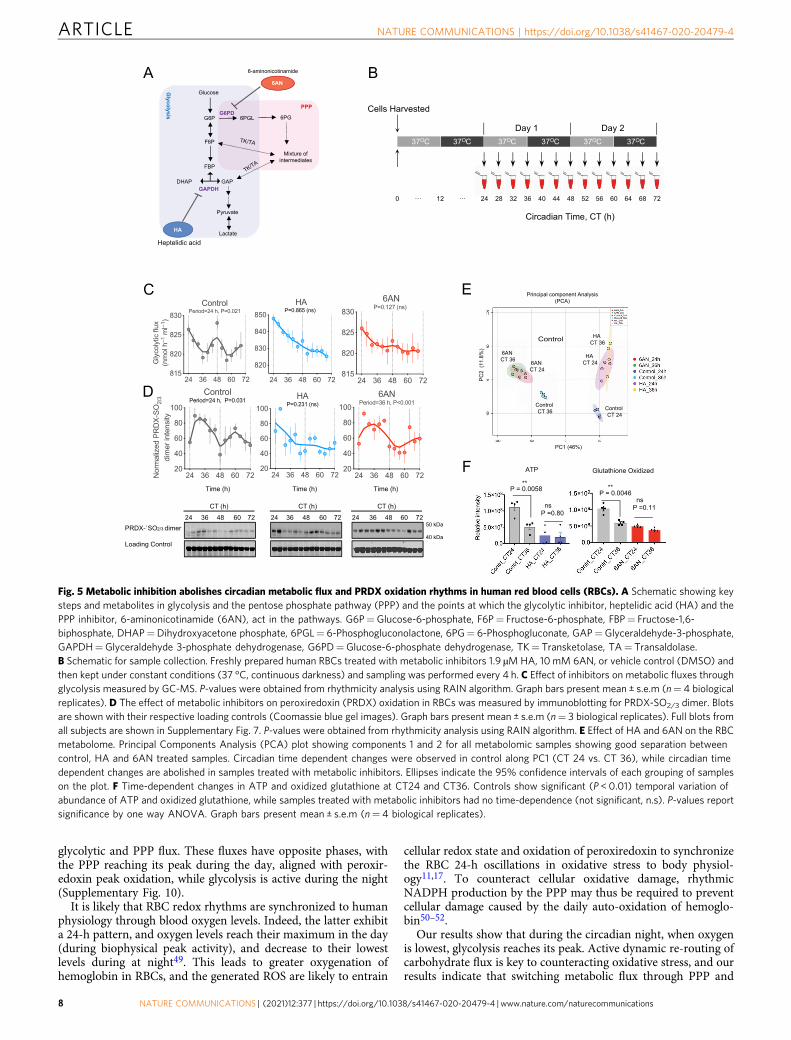
Redox couples cellular metabolism in human RBCs. Peroxir-edoxins in red blood cells play a crucial role to maintain redoxbalance by neutralizing H2O2 generated in part by auto-oxidationof hemoglobin14. Peroxiredoxin oxidation exhibits circadianrhythms, prompting the question of how coupling betweenmetabolic cycles and redox state is achieved. To understand thislink, we investigated the interrelationship between glucose-metabolizing pathways in RBCs and peroxiredoxin redox state.We first inhibited flux through glycolysis using heptelidic(koningic) acid (HA), a potent inhibitor of glyceraldehyde 3-phosphate dehydrogenase (GAPDH)25,26 (Fig. 5A). Metabolicinhibition experiments were performed on RBCs isolated fromfresh blood samples collected from human subjects and metabolic
inhibitors were added at the start of the experiment (Fig. 5B). Wefound that fluxes through glycolysis and PPP became arrhythmic(P= 0.865 by RAIN) after treatment with 1.9 µM HA (Fig. 5C;only glycolytic flux shown for clarity).
We then inhibited flux through PPP using 10 mM 6-aminonicotinamide (6AN), an inhibitor of the two NADPH-producing enzymes in PPP (Fig. 5A)27,28. The amplitude of fluxoscillations was reduced and non-rhythmic (P= 0.127 by RAIN;Fig. 5C). Peroxiredoxin oxidation in cells treated with theseinhibitors was also affected, abolishing 24-h patterning (Fig. 5D,Supplementary Fig. 7). Interestingly, although HA treatmentcaused arrhythmicity (P= 0.231 by RAIN), 6AN prolongedperiod to 36 h (P < 0.001 by RAIN) compared to control cells(Fig. 5D). Importantly, the inhibitors did not affect RBC viabilityat the doses used (Supplementary Fig. 8), and they causeddifferential changes in the RBC metabolome, demonstrating their
Fig. 2 Rhythmic accumulation of central carbon metabolites in human red blood cells (RBCs). A Selected significant rhythmic metabolites (*P < 0.05) inhuman RBCs analyzed by an untargeted metabolomics approach using GC-MS and LC-MS platforms. Rhythmicity analysis was performed using RAINalgorithm (*P < 0.05, FDR= 0.2). RBCs were synchronized for 24 h and then sampling was performed for every 3 h over a period of 48 h. Relative log10normalized intensities for metabolites are presented. Glycolytic metabolites are represented in blue and PPP metabolites in red. List of identified rhythmicmetabolites presented in Supplementary Table 1. Glucose (n= 3 replicates), G6P= glucose-6-phosphate (n= 4 replicates), 2,3-DPG= 2,3-diphosphoglycerate (n= 3 replicates), Ribu5P= ribulose-5-phosphate (n= 4 replicates), R5P= ribose-5-phosphate (n= 3 replicates), pyruvate (n= 3replicates), lactate (n= 3 replicates). B Correlation plot comparing selected glycolytic and PPP metabolites. Data are mean ± s.e.m.
ARTICLE NATURE COMMUNICATIONS | https://doi.org/10.1038/s41467-020-20479-4
4 NATURE COMMUNICATIONS | (2021) 12:377 | https://doi.org/10.1038/s41467-020-20479-4 | www.nature.com/naturecommunications
specificity for glycolysis and PPP. Furthermore, treatment witheither pathway inhibitor abolished of time of day variation inmetabolites (Fig. 5E). Similarly, temporal variation of ATP (whichreflects glycolytic energy output) was abolished by HA, andanalogously 6AN had an identical effect on oxidized glutathione(an output of the PPP) (Fig. 5F). Together, these results
demonstrate that there is tight coupling between core glucosemetabolism and peroxiredoxin oxidation rhythms in RBCs, andthat perturbing flux through glucose-metabolizing pathways has apotent effect on redox rhythms.
In addition to PRDX oxidation rhythms in RBCs, we alsoidentified 24-h oscillations of the redox coenzymes NADH and
NATURE COMMUNICATIONS | https://doi.org/10.1038/s41467-020-20479-4 ARTICLE
NATURE COMMUNICATIONS | (2021) 12:377 | https://doi.org/10.1038/s41467-020-20479-4 | www.nature.com/naturecommunications 5
NADPH previously11. Since RBCs do not possess organelles, suchas mitochondria, NADH and NADPH originate from glycolysisand PPP29. The redox coenzymes NADH and NADPH producedby glycolysis and PPP are likely links between glucose metabolismand redox cycling of peroxiredoxins. However, their respectiverole in the generation of circadian rhythmicity in RBCs remainsundefined.
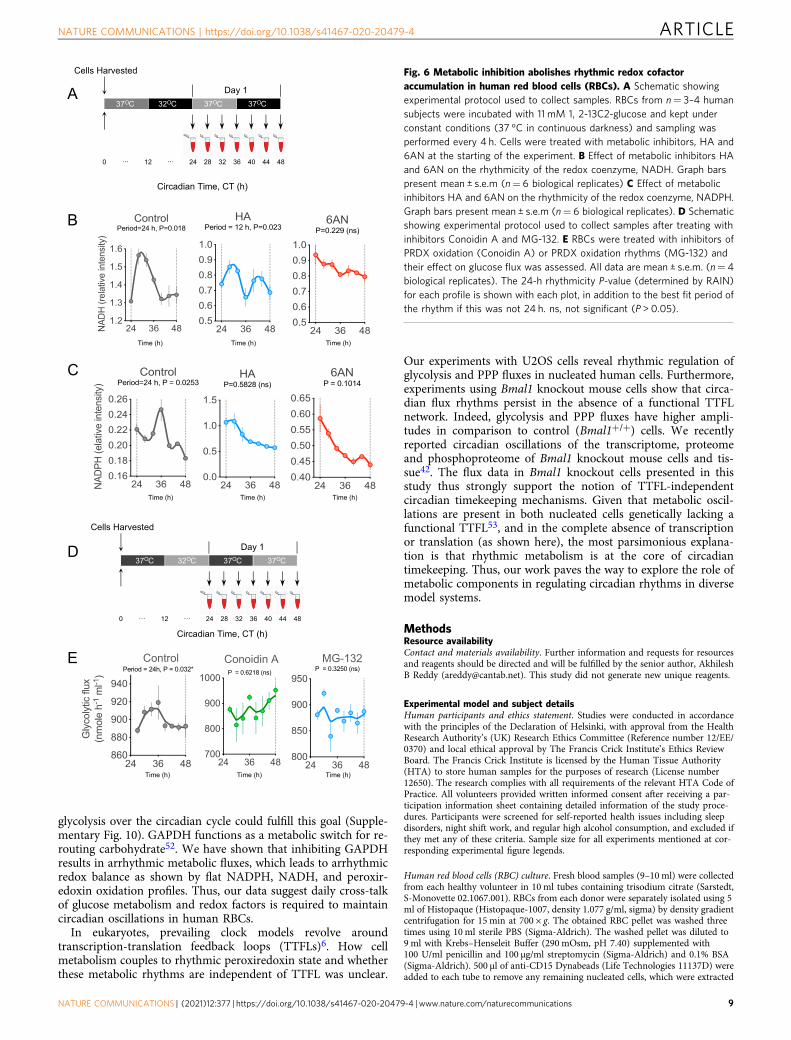
We first measured NADH and NADPH in RBCs every 4 h overa period of 24 h after treating cells with the glycolytic and PPPinhibitors, HA and 6AN, respectively (Fig. 6A). We did not finddiscernible 24-h rhythms in either NADH or NADPH when cellswere treated with the inhibitors (Fig. 6B, C), although a residualnon-circadian (12-h) NADH rhythm appeared to persist in cellstreated with HA (Fig. 6B). This suggests coupling between cellularmetabolism and redox factors NAHD and NADPH. Thus,rhythmic glucose flux is necessary for robust redox oscillations(PRDX-SO2/3, NADH, and NADPH). To test whether theconverse is true, that redox oscillations are needed for fluxrhythms, we treated RBCs with a compound that inhibits PRDXoxidation (conoidin A)30–33 and one that abolishes PRDXoxidation rhythms (MG-132)17 in RBCs (Fig. 6D). Treatmentwith either inhibitor resulted in non-rhythmic flux (Fig. 6E).These data indicate that rhythmic glucose metabolism is a crucialdeterminant of circadian redox rhythms, and reciprocally, redoxrhythms are required for flux rhythms in RBCs.
Metabolic flux rhythms in nucleated mammalian cells. We nexttested whether metabolic flux oscillations also occur in nucleatedcells. Human U2OS cells have been extensively used to investigatemolecular clock mechanisms, including small molecule screen-ing28,34,35. Unlike RBCs, U2OS cells exhibit autonomous circa-dian rhythms in gene transcription and translation. U2OS cellsalso exhibit circadian PRDX oxidation rhythms28 and these redoxrhythms are intrinsically coupled to clock components throughreversible redox modifications36. As well as being essential redoxfactors in RBCs, NADH and NADPH influence the activity oftranscription factors in nucleated cells by modulating the bindingof circadian components such as CLOCK and BMAL1 to thegenome37,38.
We therefore determined glycolytic and PPP fluxes in U2OScells. Cells were grown to confluence (i.e., non-dividing to excludecontributions from the cell cycle), cultured for three days instandard glucose (25 mM) medium, and then synchronized with a15 min 100 nM dexamethasone pulse28. Then, we replacedmedium with that containing 25 mM 1,2-13C2-glucose. Beginning
24 h after synchronization, we took samples for 48 h andmeasured metabolic flux (Fig. 7A). GC-MS analysis of cellularextracts showed that glycolytic and PPP flux exhibit circadianoscillations, as in RBCs (P < 0.001 by RAIN; Fig. 7B; onlyglycolytic flux shown for clarity).
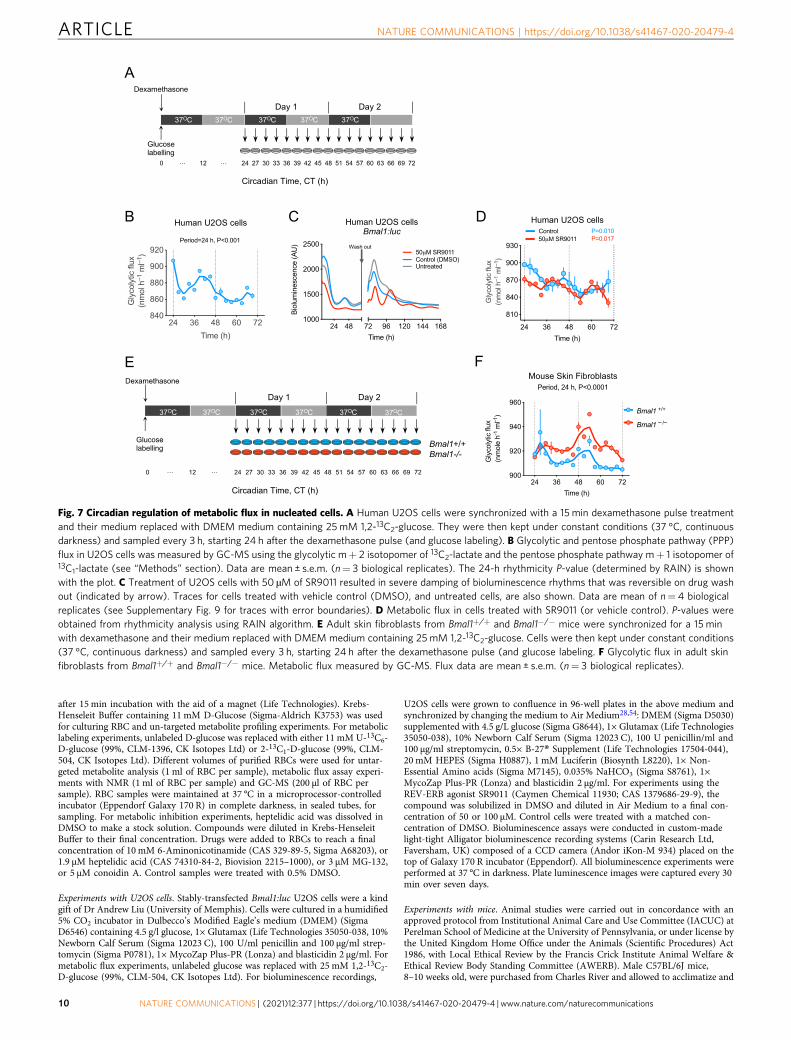
Glycolytic and PPP fluxes are independent of BMAL1 innucleated cells. Metabolic regulation is closely associated with thecircadian clock machinery, and REV-ERB proteins play criticalroles in feedback regulation of the core TTFL oscillator becausethey are direct targets of BMAL1 and CLOCK transcriptionfactors39. Accordingly, recently developed REV-ERB agonists,such as SR9011, alter circadian behavior and metabolism in miceby affecting core clock genes40. We treated U2OS cells with50 µM SR9011, which resulted in severe blunting of circadianoscillations of the reporter Bmal1:luciferase (Bmal1:luc). Theeffect was reversible on washing out the compound (Fig. 7C,Supplementary Fig. 9). Of note, although higher concentrations ofSR9011 (e.g., 100 µM) completely abolished rhythms, recovery ofrhythms was not apparent on wash out because of cell death athigher concentrations (Supplementary Fig. 9). Despite compro-mised transcriptional rhythms in SR9011-treated cells, we foundpersistent circadian rhythms of glycolytic and PPP fluxes(Fig. 7D; only glycolytic flux shown for clarity).
To validate these results in a different model, we performed timecourses on skin fibroblasts from adult Bmal1−/− and Bmal1+/+
mice. BMAL1 (MOP3) is considered to be an essential componentof the circadian transcriptional clockwork, and is necessary forbehavioral rhythms41. Bmal1+/+ and Bmal1−/− fibroblasts weregrown to confluence, cultured for three days in standard glucose(25mM) medium, and then synchronized for 15min with a100 nM dexamethasone pulse28,42. We then replaced medium withthat containing 25mM 1,2-13C2-glucose (Fig. 7E). Twenty-fourhours after synchronization, we took samples every three hours for48 h and measured metabolic flux (Fig. 7E). We found robustrhythms in relative glucose flux in both Bmal1+/+ and Bmal1−/−
cells (Fig. 7F). These findings are consistent with data suggestingresidual, but non-circadian, oscillations of glycolytic metabolites(biphosphoglycerate, ATP, ADP, and lactate) in U2OS cells whenBmal1 was knocked down by RNA interference (RNAi)35. More-over, non-canonical circadian mRNA, protein and post-translational rhythms (including PRDX-SO2/3) were also reportedin Bmal1−/− cells and tissue42, showing that metabolic fluxoscillations are an additional type of BMAL1-independent circadianrhythm.
Fig. 3 Circadian regulation of glycolysis and pentose phosphate pathways (PPP) fluxes in human red blood cells (RBCs). A Schematic showingexperimental protocol used to collect samples. RBCs from n= 3 human subjects were incubated with either 11 mM 2-13C1-glucose or 1,2-13C2-glucoseand kept under constant conditions (37 °C in continuous darkness) and sampling was performed every 4 h over 3 days period. B Schematic showing fate of2-13C1-Glucose metabolized through glycolysis and the pentose phosphate pathway (PPP). Metabolic fluxes for glycolysis and PPP were quantifiedby 13C-NMR (nuclear magnetic resonance) spectroscopy. When 2-13C1-glucose is used as a tracer, it is metabolized via glycolysis and produces singlylabeled 13C1-2-lactate with chemical shift, δ= 71.2. The same 2-13C1-glucose metabolized through the PPP produces singly labeled 13C1-3-lactate withchemical shift δ= 22.8. C Rhythmic glycolytic and PPP fluxes (P= 0.009) in RBCs measured by NMR. P-values were obtained from rhythmicity analysisusing RAIN algorithm. Graph bars present mean ± s.e.m (n= 3 biological replicates). D Rhythmic PRDX oxidation used as a control for circadian rhythmicityin RBCs for measuring metabolic fluxes by NMR experiment. P-values were obtained from rhythmicity analysis using RAIN algorithm. Data are presentedmean ± s.e.m (n= 3 biological replicates). E Schematic showing fate of 1,2-13C2-Glucose metabolized by glycolysis and the pentose phosphate pathway(PPP). Metabolic fluxes were measured with GC-MS. When 1,2-13C2-glucose is used as a tracer, it is metabolized via glycolysis and produces doublylabeled 2,3-13C2-lactate. The same 1,2-13C2-glucose metabolized through the PPP produces singly labeled 13C1-lactate. The glycolytic m+ 2 isotopomer of13C2-lactate and the pentose phosphate pathway m+ 1 isotopomer of 13C1-lactate were thus used for flux measurements (see Methods). f Rhythmicregulation of glycolysis and PPP fluxes in RBCs measured by GC-MS. P-values were obtained from rhythmicity analysis using RAIN algorithm. Data arepresented mean ± s.e.m (n= 3 biological replicates). G Rhythmic PRDX oxidation used as a control for circadian rhythmicity in RBCs for measuringmetabolic fluxes by GC-MS experiment. P-values were obtained from rhythmicity analysis using RAIN algorithm. Data are presented mean ± s.e.m (n= 3biological replicates). H Comparison of glycolytic flux measurements in RBCs measured by NMR and GC-MS methods. This correlation figure is obtainedfrom Fig. 3C, F. Data are presented mean ± s.e.m (n= 3 biological replicates).
ARTICLE NATURE COMMUNICATIONS | https://doi.org/10.1038/s41467-020-20479-4
6 NATURE COMMUNICATIONS | (2021) 12:377 | https://doi.org/10.1038/s41467-020-20479-4 | www.nature.com/naturecommunications
DiscussionAlthough gene expression cycles are essential for the temporalcoordination of physiology, we and others have previously shownthat rhythms in redox balance is a cell-intrinsic phenomenon thatpersists without any gene expression cycles in non-nucleatedmammalian red blood cells11,17. This circadian rhythm in redoxbalance is seen across the domains of life, and cells have evolved anumber of defense mechanisms to counteract the deleteriousconsequences of oxidative stress, including the use of peroxir-edoxin proteins10,43,44. Among these processes, metabolism is akey player, and is also evolutionarily conserved to maintain cel-lular energy and survival45. However, how cytosolic rhythmicredox balance interacts with metabolism has not been elucidated.At different levels of biological organization, from the whole bodyto single cells, a significant portion of metabolism is under cir-cadian control, leading to the prevailing view that biological
cycles drive metabolic rhythms46,47. Indeed, recent reports sug-gest rhythmic metabolites from lipid metabolism, and NAD+biosynthesis from mitochondrial metabolism, are controlled bythe clock48.
However, such circadian control of metabolism cannot happenin human red blood cells, where there are no gene expressioncycles and/or organelles such as mitochondria. We uncovered acircadian metabolome in human RBCs and also showed circadianrhythms of glycolysis and PPP metabolites, indicating that cel-lular metabolism may be an integral part of non-transcriptionalcircadian clocks. RBCs depend on glycolysis for ATP, and on thePPP to maintain the redox balance through NADPH29. Becausemetabolites are functionally dependent on input of metabolicfluxes through a number of enzyme pathways, the contribution offluxes in generating cycling metabolites is important. Our labelingexperiments with human RBCs revealed rhythmic regulation of
Fig. 4 Rhythmic metabolic fluxes in human RBCs subjected to dynamic glucose labeling. A Schematic showing the sampling protocol for dynamicglucose pulse labeling and below calculated fluxes from these labeling experiments. Oscillations of glycolytic fluxes using either 1,2-13C2-glucose labelingare shown below the schematic. Data for 1,2-13C2-glucose flux are mean ± s.e.m (n= 3 biological replicates). Samples were entrained with 12-h: 12-h 37 °C:32 °C and maintained at constant conditions. B Independent validation of metabolic flux with isotope 1-13C1-Glucose. Schematic of 1-13C1-Glucose labelingand calculation of PEP isotopomer ratio to calculate glycolytic flux ratio. G6P=Glucose-6-phosphate, G3P=Glyceraldehyde 3-phosphate, F6P= Fructose-6-phosphate, DHAP=Dihydroxyacetone phosphate, PEP= Phosphoenolpyruvate, R5P= Ribose-5-phosphate, 6PG= 6-Phosphogluconate. Glycolytic(fgly) flux ratio for 1-13C1-glucose experiments was determined using the mass isotopomer distribution of Phosphoenolpyruvate (PEP). Data for 1-13C1-glucose flux ratio are mean ± s.e.m (n= 4 biological replicates). P-values report significance by ANOVA (effect of time). C Schematic showing the samplingprotocol for calculated fluxes from 1,2-13C2-glucose labeling experiments. Oscillations of glycolytic fluxes are shown below the schematic. Data for 1,2-13C2-glucose flux are mean ± s.e.m (n= 3 biological replicates). P-values were obtained from rhythmicity analysis using RAIN algorithm Note these data arereplotted from Fig. 3F to compare phase of glycolytic flux to Fig. 4A. D Measurement of RBC flux in circulating mouse RBCs at opposite circadian phases.Mouse RBCs (n= 3 biological replicates) were harvested at opposite phases of the circadian cycle (see schematic): CT06 and CT18 (CT, circadian time:subjective day CT00-CT12; subjective night CT12-24). P-values report significance by one way ANOVA.
NATURE COMMUNICATIONS | https://doi.org/10.1038/s41467-020-20479-4 ARTICLE
NATURE COMMUNICATIONS | (2021) 12:377 | https://doi.org/10.1038/s41467-020-20479-4 | www.nature.com/naturecommunications 7
glycolytic and PPP flux. These fluxes have opposite phases, withthe PPP reaching its peak during the day, aligned with peroxir-edoxin peak oxidation, while glycolysis is active during the night(Supplementary Fig. 10).
It is likely that RBC redox rhythms are synchronized to humanphysiology through blood oxygen levels. Indeed, the latter exhibita 24-h pattern, and oxygen levels reach their maximum in the day(during biophysical peak activity), and decrease to their lowestlevels during at night49. This leads to greater oxygenation ofhemoglobin in RBCs, and the generated ROS are likely to entrain
cellular redox state and oxidation of peroxiredoxin to synchronizethe RBC 24-h oscillations in oxidative stress to body physiol-ogy11,17. To counteract cellular oxidative damage, rhythmicNADPH production by the PPP may thus be required to preventcellular damage caused by the daily auto-oxidation of hemoglo-bin50–52.
Our results show that during the circadian night, when oxygenis lowest, glycolysis reaches its peak. Active dynamic re-routing ofcarbohydrate flux is key to counteracting oxidative stress, and ourresults indicate that switching metabolic flux through PPP and
Fig. 5 Metabolic inhibition abolishes circadian metabolic flux and PRDX oxidation rhythms in human red blood cells (RBCs). A Schematic showing keysteps and metabolites in glycolysis and the pentose phosphate pathway (PPP) and the points at which the glycolytic inhibitor, heptelidic acid (HA) and thePPP inhibitor, 6-aminonicotinamide (6AN), act in the pathways. G6P=Glucose-6-phosphate, F6P= Fructose-6-phosphate, FBP= Fructose-1,6-biphosphate, DHAP=Dihydroxyacetone phosphate, 6PGL= 6-Phosphogluconolactone, 6PG= 6-Phosphogluconate, GAP=Glyceraldehyde-3-phosphate,GAPDH=Glyceraldehyde 3-phosphate dehydrogenase, G6PD=Glucose-6-phosphate dehydrogenase, TK= Transketolase, TA= Transaldolase.B Schematic for sample collection. Freshly prepared human RBCs treated with metabolic inhibitors 1.9 µMHA, 10mM 6AN, or vehicle control (DMSO) andthen kept under constant conditions (37 °C, continuous darkness) and sampling was performed every 4 h. C Effect of inhibitors on metabolic fluxes throughglycolysis measured by GC-MS. P-values were obtained from rhythmicity analysis using RAIN algorithm. Graph bars present mean ± s.e.m (n= 4 biologicalreplicates). D The effect of metabolic inhibitors on peroxiredoxin (PRDX) oxidation in RBCs was measured by immunoblotting for PRDX-SO2/3 dimer. Blotsare shown with their respective loading controls (Coomassie blue gel images). Graph bars present mean ± s.e.m (n= 3 biological replicates). Full blots fromall subjects are shown in Supplementary Fig. 7. P-values were obtained from rhythmicity analysis using RAIN algorithm. E Effect of HA and 6AN on the RBCmetabolome. Principal Components Analysis (PCA) plot showing components 1 and 2 for all metabolomic samples showing good separation betweencontrol, HA and 6AN treated samples. Circadian time dependent changes were observed in control along PC1 (CT 24 vs. CT 36), while circadian timedependent changes are abolished in samples treated with metabolic inhibitors. Ellipses indicate the 95% confidence intervals of each grouping of sampleson the plot. F Time-dependent changes in ATP and oxidized glutathione at CT24 and CT36. Controls show significant (P < 0.01) temporal variation ofabundance of ATP and oxidized glutathione, while samples treated with metabolic inhibitors had no time-dependence (not significant, n.s). P-values reportsignificance by one way ANOVA. Graph bars present mean ± s.e.m (n= 4 biological replicates).
ARTICLE NATURE COMMUNICATIONS | https://doi.org/10.1038/s41467-020-20479-4
8 NATURE COMMUNICATIONS | (2021) 12:377 | https://doi.org/10.1038/s41467-020-20479-4 | www.nature.com/naturecommunications
glycolysis over the circadian cycle could fulfill this goal (Supple-mentary Fig. 10). GAPDH functions as a metabolic switch for re-routing carbohydrate52. We have shown that inhibiting GAPDHresults in arrhythmic metabolic fluxes, which leads to arrhythmicredox balance as shown by flat NADPH, NADH, and peroxir-edoxin oxidation profiles. Thus, our data suggest daily cross-talkof glucose metabolism and redox factors is required to maintaincircadian oscillations in human RBCs.
In eukaryotes, prevailing clock models revolve aroundtranscription-translation feedback loops (TTFLs)6. How cellmetabolism couples to rhythmic peroxiredoxin state and whetherthese metabolic rhythms are independent of TTFL was unclear.
Our experiments with U2OS cells reveal rhythmic regulation ofglycolysis and PPP fluxes in nucleated human cells. Furthermore,experiments using Bmal1 knockout mouse cells show that circa-dian flux rhythms persist in the absence of a functional TTFLnetwork. Indeed, glycolysis and PPP fluxes have higher ampli-tudes in comparison to control (Bmal1+/+) cells. We recentlyreported circadian oscillations of the transcriptome, proteomeand phosphoproteome of Bmal1 knockout mouse cells and tis-sue42. The flux data in Bmal1 knockout cells presented in thisstudy thus strongly support the notion of TTFL-independentcircadian timekeeping mechanisms. Given that metabolic oscil-lations are present in both nucleated cells genetically lacking afunctional TTFL53, and in the complete absence of transcriptionor translation (as shown here), the most parsimonious explana-tion is that rhythmic metabolism is at the core of circadiantimekeeping. Thus, our work paves the way to explore the role ofmetabolic components in regulating circadian rhythms in diversemodel systems.
MethodsResource availabilityContact and materials availability. Further information and requests for resourcesand reagents should be directed and will be fulfilled by the senior author, AkhileshB Reddy ([email protected]). This study did not generate new unique reagents.
Experimental model and subject detailsHuman participants and ethics statement. Studies were conducted in accordancewith the principles of the Declaration of Helsinki, with approval from the HealthResearch Authority’s (UK) Research Ethics Committee (Reference number 12/EE/0370) and local ethical approval by The Francis Crick Institute’s Ethics ReviewBoard. The Francis Crick Institute is licensed by the Human Tissue Authority(HTA) to store human samples for the purposes of research (License number12650). The research complies with all requirements of the relevant HTA Code ofPractice. All volunteers provided written informed consent after receiving a par-ticipation information sheet containing detailed information of the study proce-dures. Participants were screened for self-reported health issues including sleepdisorders, night shift work, and regular high alcohol consumption, and excluded ifthey met any of these criteria. Sample size for all experiments mentioned at cor-responding experimental figure legends.
Human red blood cells (RBC) culture. Fresh blood samples (9–10 ml) were collectedfrom each healthy volunteer in 10 ml tubes containing trisodium citrate (Sarstedt,S-Monovette 02.1067.001). RBCs from each donor were separately isolated using 5ml of Histopaque (Histopaque-1007, density 1.077 g/ml, sigma) by density gradientcentrifugation for 15 min at 700 × g. The obtained RBC pellet was washed threetimes using 10 ml sterile PBS (Sigma-Aldrich). The washed pellet was diluted to9 ml with Krebs–Henseleit Buffer (290 mOsm, pH 7.40) supplemented with100 U/ml penicillin and 100 μg/ml streptomycin (Sigma-Aldrich) and 0.1% BSA(Sigma-Aldrich). 500 μl of anti-CD15 Dynabeads (Life Technologies 11137D) wereadded to each tube to remove any remaining nucleated cells, which were extracted
Fig. 6 Metabolic inhibition abolishes rhythmic redox cofactoraccumulation in human red blood cells (RBCs). A Schematic showingexperimental protocol used to collect samples. RBCs from n= 3–4 humansubjects were incubated with 11 mM 1, 2-13C2-glucose and kept underconstant conditions (37 °C in continuous darkness) and sampling wasperformed every 4 h. Cells were treated with metabolic inhibitors, HA and6AN at the starting of the experiment. B Effect of metabolic inhibitors HAand 6AN on the rhythmicity of the redox coenzyme, NADH. Graph barspresent mean ± s.e.m (n= 6 biological replicates) C Effect of metabolicinhibitors HA and 6AN on the rhythmicity of the redox coenzyme, NADPH.Graph bars present mean ± s.e.m (n= 6 biological replicates). D Schematicshowing experimental protocol used to collect samples after treating withinhibitors Conoidin A and MG-132. E RBCs were treated with inhibitors ofPRDX oxidation (Conoidin A) or PRDX oxidation rhythms (MG-132) andtheir effect on glucose flux was assessed. All data are mean ± s.e.m. (n= 4biological replicates). The 24-h rhythmicity P-value (determined by RAIN)for each profile is shown with each plot, in addition to the best fit period ofthe rhythm if this was not 24 h. ns, not significant (P > 0.05).
NATURE COMMUNICATIONS | https://doi.org/10.1038/s41467-020-20479-4 ARTICLE
NATURE COMMUNICATIONS | (2021) 12:377 | https://doi.org/10.1038/s41467-020-20479-4 | www.nature.com/naturecommunications 9
after 15 min incubation with the aid of a magnet (Life Technologies). Krebs-Henseleit Buffer containing 11 mM D-Glucose (Sigma-Aldrich K3753) was usedfor culturing RBC and un-targeted metabolite profiling experiments. For metaboliclabeling experiments, unlabeled D-glucose was replaced with either 11 mM U-13C6-D-glucose (99%, CLM-1396, CK Isotopes Ltd) or 2-13C1-D-glucose (99%, CLM-504, CK Isotopes Ltd). Different volumes of purified RBCs were used for untar-geted metabolite analysis (1 ml of RBC per sample), metabolic flux assay experi-ments with NMR (1 ml of RBC per sample) and GC-MS (200 μl of RBC persample). RBC samples were maintained at 37 °C in a microprocessor-controlledincubator (Eppendorf Galaxy 170 R) in complete darkness, in sealed tubes, forsampling. For metabolic inhibition experiments, heptelidic acid was dissolved inDMSO to make a stock solution. Compounds were diluted in Krebs-HenseleitBuffer to their final concentration. Drugs were added to RBCs to reach a finalconcentration of 10 mM 6-Aminonicotinamide (CAS 329-89-5, Sigma A68203), or1.9 µM heptelidic acid (CAS 74310-84-2, Biovision 2215–1000), or 3 µM MG-132,or 5 µM conoidin A. Control samples were treated with 0.5% DMSO.
Experiments with U2OS cells. Stably-transfected Bmal1:luc U2OS cells were a kindgift of Dr Andrew Liu (University of Memphis). Cells were cultured in a humidified5% CO2 incubator in Dulbecco’s Modified Eagle’s medium (DMEM) (SigmaD6546) containing 4.5 g/l glucose, 1× Glutamax (Life Technologies 35050-038, 10%Newborn Calf Serum (Sigma 12023 C), 100 U/ml penicillin and 100 μg/ml strep-tomycin (Sigma P0781), 1× MycoZap Plus-PR (Lonza) and blasticidin 2 μg/ml. Formetabolic flux experiments, unlabeled glucose was replaced with 25 mM 1,2-13C2-D-glucose (99%, CLM-504, CK Isotopes Ltd). For bioluminescence recordings,
U2OS cells were grown to confluence in 96-well plates in the above medium andsynchronized by changing the medium to Air Medium28,54: DMEM (Sigma D5030)supplemented with 4.5 g/L glucose (Sigma G8644), 1× Glutamax (Life Technologies35050-038), 10% Newborn Calf Serum (Sigma 12023 C), 100 U penicillin/ml and100 μg/ml streptomycin, 0.5× B-27® Supplement (Life Technologies 17504-044),20 mM HEPES (Sigma H0887), 1 mM Luciferin (Biosynth L8220), 1× Non-Essential Amino acids (Sigma M7145), 0.035% NaHCO3 (Sigma S8761), 1×MycoZap Plus-PR (Lonza) and blasticidin 2 μg/ml. For experiments using theREV-ERB agonist SR9011 (Caymen Chemical 11930; CAS 1379686-29-9), thecompound was solubilized in DMSO and diluted in Air Medium to a final con-centration of 50 or 100 μM. Control cells were treated with a matched con-centration of DMSO. Bioluminescence assays were conducted in custom-madelight-tight Alligator bioluminescence recording systems (Carin Research Ltd,Faversham, UK) composed of a CCD camera (Andor iKon-M 934) placed on thetop of Galaxy 170 R incubator (Eppendorf). All bioluminescence experiments wereperformed at 37 °C in darkness. Plate luminescence images were captured every 30min over seven days.
Experiments with mice. Animal studies were carried out in concordance with anapproved protocol from Institutional Animal Care and Use Committee (IACUC) atPerelman School of Medicine at the University of Pennsylvania, or under license bythe United Kingdom Home Office under the Animals (Scientific Procedures) Act1986, with Local Ethical Review by the Francis Crick Institute Animal Welfare &Ethical Review Body Standing Committee (AWERB). Male C57BL/6J mice,8–10 weeks old, were purchased from Charles River and allowed to acclimatize and
Fig. 7 Circadian regulation of metabolic flux in nucleated cells. A Human U2OS cells were synchronized with a 15 min dexamethasone pulse treatmentand their medium replaced with DMEM medium containing 25mM 1,2-13C2-glucose. They were then kept under constant conditions (37 °C, continuousdarkness) and sampled every 3 h, starting 24 h after the dexamethasone pulse (and glucose labeling). B Glycolytic and pentose phosphate pathway (PPP)flux in U2OS cells was measured by GC-MS using the glycolytic m+ 2 isotopomer of 13C2-lactate and the pentose phosphate pathway m+ 1 isotopomer of13C1-lactate (see “Methods” section). Data are mean ± s.e.m. (n= 3 biological replicates). The 24-h rhythmicity P-value (determined by RAIN) is shownwith the plot. C Treatment of U2OS cells with 50 µM of SR9011 resulted in severe damping of bioluminescence rhythms that was reversible on drug washout (indicated by arrow). Traces for cells treated with vehicle control (DMSO), and untreated cells, are also shown. Data are mean of n= 4 biologicalreplicates (see Supplementary Fig. 9 for traces with error boundaries). D Metabolic flux in cells treated with SR9011 (or vehicle control). P-values wereobtained from rhythmicity analysis using RAIN algorithm. E Adult skin fibroblasts from Bmal1+/+ and Bmal1−/− mice were synchronized for a 15 minwith dexamethasone and their medium replaced with DMEM medium containing 25mM 1,2-13C2-glucose. Cells were then kept under constant conditions(37 °C, continuous darkness) and sampled every 3 h, starting 24 h after the dexamethasone pulse (and glucose labeling. F Glycolytic flux in adult skinfibroblasts from Bmal1+/+ and Bmal1−/− mice. Metabolic flux measured by GC-MS. Flux data are mean ± s.e.m. (n= 3 biological replicates).
ARTICLE NATURE COMMUNICATIONS | https://doi.org/10.1038/s41467-020-20479-4
10 NATURE COMMUNICATIONS | (2021) 12:377 | https://doi.org/10.1038/s41467-020-20479-4 | www.nature.com/naturecommunications
entrain in a 12-h light-dark cycle (LD). Light intensity during light and darkperiods was 200 and <3 lux, respectively. Humidity and temperature (21 ± 1 °C)were kept within standard ranges. After 3 weeks, mice were transferred to constantdarkness (DD; dim red light, <3 lux) and on the second day of DD blood wascollected by cardiac puncture under terminal anesthesia (sodium pentobarbital,170 mg/kg, intraperitoneal) at CT24 and CT36.
Experiments with Bmal1−/− mouse skin fibroblasts. Bmal1+/+ and Bmal1−/− adultmouse skin fibroblasts (MSF) cells were grown in Dulbecco’s Modified EagleMedium (DMEM) containing 10% (v/v) HyClone III Serum (Analab; Cat #SH30109.03), 1/100 Glutamax-I (Invitrogen; Cat # 35050-038), 1/100 Penicillin-Streptomycin (SIGMA; Cat # P4333) and 1/500 MycoZap™ (Lonza; Cat # VZA-2022) in multiple six-well plates until fully confluent (n= 3, per time-point, pergenotype). Confluent MSF cells were treated with 100 nM (final concentration) ofdexamethasone (DEX) for 15 min to synchronize the cells. MSF cells were thenwashed three times with PBS (37 °C) and were incubated in HEPES-bufferedMedium; 1× DMEM powder (SIGMA; Cat # D5030), 5 mg/ml 1, 2-13C2 (99%)D-glucose (Cambridge Isotope Laboratories, Cat # CLM-504-1), 0.35 mg/mLsodium bicarbonate, 0.01M HEPES, 5% (v/v) HyClone III Serum, 1/100 Glutamax-I, 1× B-27 supplement (LifeTech Cat # 17504-044), 1× Non-Essential Amino acids,and 1/500 MycoZap™, pH 7.4 (adjusted with HCl) and osmolality 350 mOsm(adjusted with NaCl) at 37 °C under DD cycle. Twenty-four hours after the DEXtreatment, MSF cells were harvested at every three-hour interval for two days forsubsequent metabolic flux analysis.
Metabolite extraction for untargeted metabolite profiling. At each time point,1.5 ml Eppendorf tubes containing 1 ml of purified RBCs in Krebs-Henseleit Bufferwere collected from the incubator and samples were immediately centrifuged for 2min at 375 × g at 4 °C. The supernatant was removed and the RBC pellet washedtwice with ice-cold PBS. RBC metabolite extractions were performed using areported protocol55 with slight modifications. Briefly, metabolites were extractedfrom RBCs by adding 450 μl of methanol. Vortex mixed for 10 s to lyse the cells inmethanol. Immediately, 200 μl of chloroform and 200 μl of water was added to thepellet at 4 °C, followed by sonication for 10 min and then vortexing for 20 min.Samples were then centrifuged at 18,400×g for 20 min at 4 °C. The upper aqueouslayer was collected and lower chloroform layer (containing non-polar metabolites)was discarded. Two more extractions were performed on the same RBC pellet with50% methanol:water with vortexing for 20 min, and centrifugation at 18,400×g for20 min at 4 °C. 13C5-15N-Valine was used as an internal standard during allextractions. The three extracts were combined and dried with a vacuum con-centrator (Concentrator plus, Eppendorf). The dried extracts were subsequentlyused for GC-MS and LC-MS analysis for metabolite profiling.
UPLC-MS based data acquisition for untargeted metabolite profiling. Driedsamples were reconstituted in 500 μl methanol:water (1:1, v/v). LC-MS analysis wasconducted using a Dionex UltiMate Liquid Chromatography (LC) system coupledto a Q-Exactive Orbitrap mass spectrometer (both Thermo Scientific), adaptedfrom a reported method56. LC separation was performed using hydrophilicinteraction chromatography (HILIC) on a ZIC-pHILIC column (150 mm×4.6 mm,5 μm particle size; Merck Sequant) with a gradient solvent A (20 mM ammoniumcarbonate in water; Optima HPLC grade, Sigma Aldrich) and solvent B (acetoni-trile; Optima HPLC grade, Sigma Aldrich). A 15 min elution gradient of 80 to 20%Solvent B was used, followed by a 5 min wash of 5% Solvent B and 5 min re-equilibration. Other LC parameters were: flow rate 300 μl/min; column tempera-ture 25 °C; injection volume 10 μl; auto sampler temperature 4 °C. MS was per-formed with positive/negative polarity switching using a HESI II probe. MSparameters were: spray voltage 3.5 kV and 3.2 kV for positive and negative modes,respectively; probe temperature 320 °C; sheath and auxiliary gases were 30 and 5arbitrary units, respectively; full scan range: 70 to 1050 m/z with settings of AGCtarget and resolution as Balanced and High (3 × 10⁶ and 70,000) respectively. Datawas recorded using Xcalibur 3.0.63 software (Thermo Scientific). To enhancecalibration stability, lock-mass correction was also applied to each analytical runusing ubiquitous low-mass contaminants. Parallel reaction monitoring (PRM)parameters: resolution 17,500; collision energies were set individually in high-energy collisional dissociation (HCD) mode.
GC-MS based data acquisition for untargeted metabolite profiling. Driedsample extracts were used for GC-MS analysis. Untargeted metabolite profiling wasperformed by GC-MS using an Agilent 7890A-5975C GC-MSD after derivatizationof metabolites with methoxyamine hydrochloride (20 mg/ml in pyridine, bothSigma) and N,O-bis-(trimethylsilyl)trifluoroacetamide (containing 1% trimethyl-chlorosilane)57. GC separation was achieved using an Agilent DB-5 MS column(30 m × 0.25 mm × 0.5 μm). The GC oven temperature program was: 70 °C, 2 minhold; ramp 12.5 °C/min to 295 °C, 0 min hold; ramp 25 °C/min to 320 °C, 3 minhold. Other GC parameters were: injection volume 1 μl; inlet temperature 270 °C;Helium was used as a carrier gas at a flow rate of 0.9 ml/min; transfer line tem-perature 280 °C. Electron impact ionization was used for mass spectrometrydetection with scan range m/z 50–565.
Metabolic flux measurements with NMR. For RBC metabolic flux experiments,cultures were incubated with Krebs-Henseleit Buffer containing 11 mM 2-13C1-D-glucose and at each time point a 1.5 ml Eppendorf tube containing 1 ml RBCs wascollected from the incubator, and immediately centrifuged for 2 min at 4 °C at375 × g. The supernatant was collected and the pellet washed with ice-cold PBS twotimes and centrifuged again for 2 min at 4 °C and at 375 × g. The RBC pellet andwas then immediately flash frozen in liquid nitrogen. Frozen samples stored at−80 °C till the analysis. Frozen samples were thawed at 4 °C, and then placed in aboiling water bath for 9 min to lyse cells and halt enzymatic activity23,58. Boiledlysates were sonicated for 10 min at 4 °C on ice, followed by vortex mixed for10 min. Samples were then centrifuged for 20 min at 18,400 × g at 4 °C. Nine-hundred microliter of each supernatant was dried in a vacuum concentrator(Concentrator plus, Eppendorf). Dried sample extracts were suspended in 750 μlD2O (Sigma 151882) containing 0.05% of 3-(trimethlysilyl)-1-propanesulfonicacid-d6 sodium salt (Sigma 613150). 13C-NMR spectroscopy was performed on a BrukerAM-500 MHz spectrometer (Chemistry Department, University of Cambridge) ora Bruker Avance III 600MHz spectrometer equipped with a 5 mm TCI Cryoprobe(MRC Biomedical NMR Centre, Francis Crick Institute). Spectra were recordedusing a 30° 13C excitation pulse, 1 s acquisition time, and 3 s relaxation delay. Thespectra were 1H-broadband de-coupled using WALTZ16, which was also employedduring the relaxation delay to exploit the {1H}13C heteronuclear Overhauserenhancement. Labeled C2-lactate, C3-lactate and alpha-anomers, beta-anomers ofglucose were identified and peak integrals were evaluated using the Bruker NMRsoftware package TopSpin 3.5.
Metabolic flux measurements with GC-MS. For RBC metabolic flux experi-ments, cultures were incubated with Krebs–Henseleit Buffer containing 11 mM 1,2-13C2-D-glucose and at each time point a 1.5 ml Eppendorf tube containing 200 µlRBCs was collected from the incubator, and immediately centrifuged for 2 min at4 °C at 375 × g. The supernatant was collected and the pellet washed with ice-coldPBS two times and centrifuged again for 2 min at 4 °C and at 375 × g. The RBCpellet and was then immediately flash frozen in liquid nitrogen and metabolitesextracted with 80% methanol:water followed by vortexing for 10 min, and thencentrifugation at 18,400 × g for 15 min at 4 °C. The aqueous layer was collected anddried using a vacuum concentrator (Concentrator plus, Eppendorf).
For U2OS cell experiments, cultures were incubated with medium containing25 mM 1,2-13C2-D-glucose and at each time point, culture supernatant wasremoved and cells washed with ice-cold PBS three times. Immediately, 1 ml of ice-cold 80% methanol:water (pre-cooled to −80 °C) was added and cells collected byscraping into 1.5 ml Eppendorf tubes. Cells were flash frozen in liquid nitrogen andstored at −80 °C.
For lactate isotopomer analysis, samples were derivatized as above and analyzedon an Agilent GC-MSD. Parameters were as for untargeted GC-MS analyses above,but with the following GC temperature gradient: 120 °C, 2 min hold; ramp 8 °C/min to 180 °C; ramp 20 °C/min to 290 °C, 3 min hold. Selective ion monitoring(SIM) for lactate isotopomers m+ 0 (unlabeled 12C-lactate), m+ 1 (13C1-lactate),m+ 2 (13C2-lactate), m+ 3 (13C3-lactate).
Extracellular glucose from the media obtained from incubating RBCs withU-13C-Glucose over a period of 72 h were analyzed after drying of 1 μl of medium.Derivatization and GC-MS conditions were the same as mentioned above.
Pulse labeling experiments. Pulsed isotopic labeling was performed by feedingRBCs with either 1,2-13C2-glucose or 1-13C-glucose. To minimize potential clockresetting and perturbation of cells due to replacement of normal glucose mediumwith labeled medium, we used conditioned medium, which was obtained byincubating RBCs for 1 h in labeled medium and storing immediately at 4 °C.Metabolic measurements for 1,2-13C2-glucose experiments were performed asfollows. Briefly, 800 μl of the upper fraction was dried in a speed-vacuum for 4.5 h.The resulting dried sample was reconstituted in 200 μl of acetonitrile:water, vor-texed for 20 s, and centrifuged at 13,300 rpm for 15 min. The undiluted sample wasused for glucose measurements while a 30-fold diluted sample was utilized forlactate measurements. Samples were measured in analytical duplicates with eachsample set run in a randomized manner with pooled quality control samplesmeasured at the start of the run, after every 10th sample, and at the end of the run.For both glucose and lactate measurements, 2 μl of each sample was analyzed in amanner similar to the methods previously described59,60, modified for isotopomeranalysis. Targeted multiple reaction monitoring (MRM) methods were utilized todetect lactate and glucose isotopologues in each respective run. Data were pro-cessed and integrated using Waters TargetLynx software (version 4.1) with naturalabundance correction and further processing of ion counts performed in R.
Metabolic measurements for 1-13C-glucose experiments was measured withAgilent LC-QTOF 6545. Metabolites were confirmed by running standards inparallel. Isotopic labeling was measured using Agilent MassHunter Profinder v.B.08.00 (Batch Isotopologue extraction) and the personal compound database andlibrary (PCDL).
Flux measurements in Bmal1−/− mouse skin fibroblasts. MSF cells collected ateach time point were washed with ice-cold PBS three times and then homogenizedin 1 ml 80% methanol (precooled at −80 °C). Samples were then flash frozen in
NATURE COMMUNICATIONS | https://doi.org/10.1038/s41467-020-20479-4 ARTICLE
NATURE COMMUNICATIONS | (2021) 12:377 | https://doi.org/10.1038/s41467-020-20479-4 | www.nature.com/naturecommunications 11
liquid nitrogen and were stored at −80 °C until extraction. In the extractionprocess, mild sonication was applied to the samples for 10 min (30 s on, 30 s off;medium power) using a Bioruptor Standard (Diagenode) instrument. Then thesamples were vortexed for 20 mins at 4 °C and the lysates were centrifuged at14,000 rpm for 20 min at 4 °C. Supernatants were carefully separated and trans-ferred into new microcentrifuge tubes. Samples were dried by vacuum cen-trifugation and were stored at −80 °C until GC-MS analysis for flux measurements.
Gel electrophoresis and immunoblotting. At each time point during a timecourse, samples were removed from the incubator and 75 μl of RBCs (and medium)from each sample tube lysed in 250 μl of 2× LDS buffer (Life Technologies) andplaced in a thermomixer heating block (Grant Instruments, model PHMT) for 10min at 70 °C at 800 rpm. Immediately, samples were flash frozen in liquid nitrogenand stored at −80 °C until analysis. Samples were allowed to reach room tem-perature before analysis, which was performed as described previously11,15,28.Briefly, NuPAGE Novex 4–12% Bis-Tris gradient gels (Life Technologies) wereloaded and run with a non-reducing MES SDS running buffer as per the manu-facturer’s guidelines. Protein transfer to nitrocellulose membrane was performedusing the iBlot system (Life Technologies) with a standard P3, 7 min protocol. Thenitrocellulose membrane was blocked for 1 h at room temperature in blockingbuffer, composed of 0.5% w/w BSA, (Sigma A7906)/non-fat dried milk (Marvel) inTris buffered saline/0.05% Tween-20 (TBST). After blocking, membranes wereincubated with 1:10,000 anti-PRDX-SO2/3 antiserum (Abcam ab16830), diluted inblocking buffer, overnight at 4 °C. The following day, blots were washed for 3 × 5min in TBST and then incubated for 1 h at room temperature with a 1:10,000 HRP-conjugated secondary antiserum (Sigma A6154). Blots were washed 4 × 10min inTBST before performing chemiluminescence detection using Immobilon Fortereagent (Millipore). Equal protein loading in each lane was checked with the aid ofgels stained with Coomassie SimplyBlue SafeStain (Life Technologies). Coomassiestained gel images were obtained using an Odyssey system (Licor Biosciences).Immunoblot membranes were scanned using an Amersham Imager 600 (GEHealthcare). Quantification of images was performed using NIH Image Jsoftware11,16.
NADH and NADPH assays. At each time point, samples were collected from theincubator and centrifuged for 2 min at 375 × g at 4 °C. RBC pellets were washedwith ice-cold PBS twice and then centrifuged for 2 min at 375 × g at 4 °C. Super-natant was discarded and the RBC pellet flash frozen in liquid nitrogen and storedat −80 °C. Extraction of metabolites was performed with the buffers supplied withcommercial assay kits following the manufacturer’s instructions (Abcam ab65348for NADH and ab65349 for NADPH measurements). Colorimetric measurementswere made at 450 nm absorbance and at 25 °C using a PerkinElmer Ensightmultimode plate reader. NADH and NADPH concentrations were determinedfrom a standard calibration curve according to the manufacturer’s instructions.NADH/NADPH absorbance measurements were acquired using Kaleido patereader software.
Cell viability assays for metabolic inhibitor experiments. RBCs were isolatedfrom donors as mentioned above. The RBC pellet was made up to 9 ml with Krebs-Henseleit Buffer. 420 µl of RBCs were aliquoted into the wells of a 96 deep wellplate for drug addition. 2.1 µl of diluted drug (1:200 dilution; 0.5% DMSO final)was added to each well and mixed thoroughly. For 6AN, concentrations werescreened from 0 to 10 mM. For heptelidic acid, concentrations were screened overthe range of 0 to 1 mM. Fifty microliter of RBCs preparation with compoundsadded (and control RBCs with only 0.5% DMSO added) were aliquoted into 96-well plates. The plates were incubated at 37 °C in constant darkness. Sampling wasthen performed every 24 h over a period of 96 h. At each time point, RBCs in aplate were re-suspended by pipetting up and down. The 96-well plates were thenspun for 5 min at 375 × g and 25 µl of the supernatant transferred into a 384-wellplate for assaying. A standard curve was prepared by lysing untreated cells withwater (hypotonic lysis) and then performing serial dilutions in a 96-well plate. Theabsorbance of the sample supernatants was measured at 480 nm (in a 384-wellplate) and using a Tecan M1000 plate reader. Red cell absorbance measurementswere acquired using Tecan M1000 plate reader software.
Red cell microscopy. During the circadian time course with metabolic inhibitors,10 µl of sample was collected at specific time points and spread onto a microscopeslide (Thermo Scientific Superfrost Plus) and air dried. Microscopic images werecaptured using a Leica DM IL LED inverted microscope with LAS softwareversion 4.8.
Quantification and statistical analysisMass spectrometry data processing, identification and meta-bolite enrichment analysis. Vendor specific LC-MS raw data filesfrom the mass spectrometer were extracted using Progenesis QIfor metabolomics using parameters: feature detection= highresolution, peak processing= centroid data with 70,000 (FWHM)
resolution. In positive ionization mode, M+H, M+ 2H, M+Na, M+NH4, in negative ionization mode, M-H, M-2H, M+Na-2H were considered. Agilent Mass Hunter software v B.07.00was used to extract GC-MS data. Features having a coefficient ofvariation (CV) lower than 30% among quality control sampleswere selected for downstream analyses and features having CVmore than 30% were dropped from the dataset. We detected1,698 features that had a coefficient of variation <30% in qualitycontrol samples. This included 533 features from negative modeLC-MS and 1074 from positive mode, with an additional 91 fromGC-MS. Metabolite Set Enrichment Analysis was performedusing Metaboanalyst software v 4.0, implemented in the R pro-gramming language.
Rhythmic metabolites were identified using retention time andMS/MS spectra of metabolite standards for LC-MS samples.Retention time and MS spectra from GC-MS analyzed sampleswere compared with metabolite standards and the NationalInstitute of Standards and Technology (NIST) mass spectrallibrary to confirm identification. The maximum number ofmetabolites detected in the RBC metabolome until now is 21357.The percentage of rhythmic metabolites in this study is 21% (46rhythmic metabolites from total known RBC metabolome, i.e.,213 metabolites).
Metabolic flux calculations. Metabolic fluxes were estimated byusing previously well-established models23,58,61,62. Briefly, thePentose Cycle (PC) can be estimated using NMR by measuringdifferential enrichment of C3-lactate and C2-lactate after feedingcells with 2-13C1-Glucose with the formula:
C3� LactateC2� Lactate
¼ 2PC1þ 2PC
ð1Þ
Where PC refers to fraction of glucose used to produce pentosephosphate pathway-derived Glyceraldehyde-3-phosphate.
Differential enrichment of 13C1-lactate (m+ 1) and 13C2-lactate (m+ 2) determined using GC-MS can be used to estimatefluxes after feeding cells with 1,2-13C2-Glucose with the formula:
Mþ 1ð Þ LactateMþ 2ð Þ Lactate ¼
3PC1� PC
ð2Þ
Metabolic fluxes for various metabolic pathways can becalculated from PC and glucose uptake as follows:
PPP flux ¼ PC ´Glucose consumption ð3Þ
Glycolytic flux ¼ 1� PCð Þ ´Glucose consumption ð4Þ
Rhythmicity analysis. Analysis of circadian waveforms wasperformed using two independent statistical methods22, theRhythmicity Analysis Incorporating Nonparametric method(RAIN)18 and a harmonic regression method (ARSER)22,63,which are implemented in the R programming language. P-valueoutputs are shown for each plot, along with the best-fitting period(e.g., for short or long period oscillations that deviate from 24 h).Only P-values for RAIN analyses are shown in the text and fig-ures, but the alternative rhythm detection algorithm ARSERyielded results matching RAIN. Plots were produced in either Ror GraphPad Prism (version 7 and 8). Statistical parameters suchas details of replication and error bar meaning were reported inthe figure legends.
Bioluminescence assay analysis. Exported images were quanti-fied in a time series using NIH Image J software. Circadianrhythmicity in bioluminescence data was measured using amodified version of the R script “CellulaRhythm”28,64.
ARTICLE NATURE COMMUNICATIONS | https://doi.org/10.1038/s41467-020-20479-4
12 NATURE COMMUNICATIONS | (2021) 12:377 | https://doi.org/10.1038/s41467-020-20479-4 | www.nature.com/naturecommunications
Reporting summary. Further information on research design is available in the NatureResearch Reporting Summary linked to this article.
Data availabilityAll data are available from the authors upon request. Source Data are provided with theonline version of the paper: for Fig. 3D it is provided in Supplementary Fig. 2 andSupplementary Fig. 3, that for Fig. 3G in Supplementary Fig. 4 and Supplementary Fig. 5,that for Fig. 5D in Figs. 5 and 6 in Supplementary Fig. 8, and that for Fig. 7C, D inSupplementary Fig. 9. Metabolomics data for Fig. 1 can be accessed on the Metabolightsplatform; Study submission code: MTBLS1285 and link https://www.ebi.ac.uk/metabolights/MTBLS1285. Source Data for flux experiments for Figs. 3B, C, E, F, 4A, B,6D, E, 7B, D–F are provided in an Excel spreadsheet. The remaining data are availablefrom the authors upon request. Source data are provided with this paper.
Code availabilityRAIN and ARSER codes adapted from Thaben and Westermark18 and Yang et al.63,respectively. Bioluminescence Circadian-R script “CellulaRhythm” was adapted from Reyet al.28 and Hirota et al.64.
Received: 29 July 2020; Accepted: 1 December 2020;
References1. Bass, J. Circadian topology of metabolism. Nature 491, 348–356 (2012).2. Gamble, K. L., Berry, R., Frank, S. J. & Young, M. E. Circadian clock control of
endocrine factors. Nat. Rev. Endocrinol. 10, 466–475 (2014).3. Feillet, C., van der Horst, G. T. J., Levi, F., Rand, D. A. & Delaunay, F.
Coupling between the circadian clock and cell cycle oscillators: implication forhealthy cells and malignant growth. Front. Neurol. 6, 96 (2015).
4. Maury, E., Ramsey, K. M. & Bass, J. Circadian rhythms and metabolicsyndrome: from experimental genetics to human disease. Circulation Res. 106,447–462 (2010).
5. Leng, Y., Musiek, E. S., Hu, K., Cappuccio, F. P. & Yaffe, K. Associationbetween circadian rhythms and neurodegenerative diseases. Lancet Neurol. 18,307–318 (2019).
6. Ko, C. H., Ko, C. H. & Takahashi, J. S. Molecular components of themammalian circadian clock. Hum. Mol. Genet. 15, R271–R277 (2006).
7. Loudon, A. S. I. Circadian biology: a 2.5 billion year old clock. Curr. Biol. 22,R570–R571 (2012).
8. O’Neill, J. S. & Reddy, A. B. The essential role of cAMP/Ca2+ signalling inmammalian circadian timekeeping. Biochem. Soc. Trans. 40, 44–50 (2012).
9. Tomita, J., Nakajima, M., Kondo, T. & Iwasaki, H. No transcription-translation feedback in circadian rhythm of KaiC phosphorylation. Science307, 251–254 (2005).
10. Edgar, R. S. et al. Peroxiredoxins are conserved markers of circadian rhythms.Nature 485, 459–464 (2012).
11. O’Neill, J. S. & Reddy, A. B. Circadian clocks in human red blood cells. Nature469, 498–503 (2011).
12. Olmedo, M. et al. Circadian regulation of olfaction and an evolutionarilyconserved, nontranscriptional marker in Caenorhabditis elegans. Proc. NatlAcad. Sci. USA 109, 20479–20484 (2012).
13. Neumann, C. A. et al. Essential role for the peroxiredoxin Prdx1 in erythrocyteantioxidant defence and tumour suppression. Nature 424, 561–565 (2003).
14. Harper, V. M. et al. Peroxiredoxin-2 recycling is inhibited during erythrocytestorage. Antioxid. Redox Signal. 22, 294–307 (2015).
15. Milev, N. B. et al. Analysis of the redox oscillations in the circadian clockwork.Meth. Enzymol. 552, 185–210 (2015).
16. Henslee, E. A. et al. Rhythmic potassium transport regulates the circadianclock in human red blood cells. Nat. Commun. 8, 1978 (2017).
17. Cho, C.-S., Yoon, H. J., Kim, J. Y., Woo, H. A. & Rhee, S. G. Circadian rhythmof hyperoxidized peroxiredoxin II is determined by hemoglobin autoxidationand the 20S proteasome in red blood cells. Proc. Natl Acad. Sci. USA 111,12043–12048 (2014).
18. Thaben, P. F. & Westermark, P. O. Detecting rhythms in time series withRAIN. J. Biol. Rhythms 29, 391–400 (2014).
19. Dallmann, R., Viola, A. U., Tarokh, L., Cajochen, C. & Brown, S. A. Thehuman circadian metabolome. Proc. Natl Acad. Sci. USA 109, 2625–2629(2012).
20. Grant, L. K. et al. Circadian and wake-dependent changes in human plasmapolar metabolites during prolonged wakefulness: a preliminary analysis. Sci.Rep. 9, 4428–14 (2019).
21. Ebenhöh, O. & Heinrich, R. Evolutionary optimization of metabolic pathways.Theoretical reconstruction of the stoichiometry of ATP and NADH producingsystems. Bull. Math. Biol. 63, 21–55 (2001).
22. Thurley, K. et al. Principles for circadian orchestration of metabolic pathways.Proc. Natl Acad. Sci. USA 114, 1572–1577 (2017).
23. Lewis, I. A., Campanella, M. E., Markley, J. L. & Low, P. S. Role of band 3 inregulating metabolic flux of red blood cells. Proc. Natl Acad. Sci. USA 106,18515–18520 (2009).
24. Jang, C., Chen, L. & Rabinowitz, J. D. Metabolomics and isotope tracing. Cell173, 822–837 (2018).
25. Kato, M., Sakai, K. & Endo, A. Koningic acid (heptelidic acid) inhibition ofglyceraldehyde-3-phosphate dehydrogenases from various sources. Biochim.Biophys. Acta 1120, 113–116 (1992).
26. Maller, C., Schröder, E. & Eaton, P. Glyceraldehyde 3-phosphatedehydrogenase is unlikely to mediate hydrogen peroxide signaling: studieswith a novel anti-dimedone sulfenic acid antibody. Antioxid. Redox Signal. 14,49–60 (2011).
27. Köhler, E., Barrach, H. J. & Neubert, D. Inhibition of NADP dependentoxidoreductases by the 6-aminonicotinamide analogue of NADP. FEBS Lett.6, 225–228 (1970).
28. Rey, G. et al. The pentose phosphate pathway regulates the circadian clock.Cell Metab. 24, 462–473 (2016).
29. Wiback, S. J. & Palsson, B. O. Extreme pathway analysis of human red bloodcell metabolism. Biophys. J. 83, 808–818 (2002).
30. Causton, H. C., Feeney, K. A., Ziegler, C. A. & O’Neill, J. S. Metabolic cycles inyeast share features conserved among circadian rhythms. Curr. Biol. 25,1056–1062 (2015).
31. Haraldsen, J. D. et al. Identification of conoidin a as a covalent inhibitor ofperoxiredoxin II. Org. Biomol. Chem. 7, 3040–3048 (2009).
32. Brizuela, M. et al. Treatment of erythrocytes with the 2-cys peroxiredoxininhibitor, Conoidin A, prevents the growth of Plasmodium falciparum andenhances parasite sensitivity to chloroquine. PLoS ONE 9, e92411 (2014).
33. Liu, G. et al. Optimisation of conoidin A, a peroxiredoxin inhibitor.ChemMedChem 5, 41–45 (2010).
34. Lande-Diner, L., Boyault, C., Kim, J. Y. & Weitz, C. J. A positive feedback looplinks circadian clock factor CLOCK-BMAL1 to the basic transcriptionalmachinery. Proc. Natl Acad. Sci.USA 110, 16021–16026 (2013).
35. Krishnaiah, S. Y. et al. Clock regulation of metabolites reveals couplingbetween transcription and metabolism. Cell Metab. 25, 961–974.e4 (2017).
36. Pei, J.-F. et al. Diurnal oscillations of endogenous H2O2 sustained by p66Shcregulate circadian clocks. Nature 21, 1553–1564 (2019).
37. Rutter, J., Reick, M. & McKnight, S. L. Metabolism and the control ofcircadian rhythms. Annu. Rev. Biochem. 71, 307–331 (2002).
38. Rutter, J., Reick, M., Wu, L. C. & McKnight, S. L. Regulation of clock andNPAS2 DNA binding by the redox state of NAD cofactors. Science 293,510–514 (2001).
39. Preitner, N. et al. The orphan nuclear receptor REV-ERBalpha controlscircadian transcription within the positive limb of the mammalian circadianoscillator. Cell 110, 251–260 (2002).
40. Solt, L. A. et al. Regulation of circadian behaviour and metabolism bysynthetic REV-ERB agonists. Nature 485, 62–68 (2012).
41. Bunger, M. K. et al. Mop3 is an essential component of the master circadianpacemaker in mammals. Cell 103, 1009–1017 (2000).
42. Ray, S. et al. Circadian rhythms in the absence of the clock gene Bmal1.Science 367, 800–806 (2020).
43. Wood, Z. A., Poole, L. B. & Karplus, P. A. Peroxiredoxin evolution and theregulation of hydrogen peroxide signaling. Science 300, 650–653 (2003).
44. Trachootham, D., Lu, W., Ogasawara, M. A., Nilsa, R.-D. V. & Huang, P.Redox regulation of cell survival. Antioxid. Redox Signal. 10, 1343–1374(2008).
45. Chatterjee, R. & Yuan, L. Directed evolution of metabolic pathways. TrendsBiotechnol. 24, 28–38 (2006).
46. Dyar, K. A. et al. Atlas of circadian metabolism reveals system-widecoordination and communication between clocks. Cell 174, 1571–1585.e11(2018).
47. Aviram, R. et al. Lipidomics analyses reveal temporal and spatial lipidorganization and uncover daily oscillations in intracellular organelles. Mol.Cell 62, 636–648 (2016).
48. Zhong, X. et al. Circadian clock regulation of hepatic lipid metabolism bymodulation of m6A mRNA methylation. CellReports 25, 1816–1828.e4 (2018).
49. Latenkov, V. P. [Diurnal rhythm of acid-base equilibrium and blood gascomposition]. Biull. Eksp. Biol. Med. 101, 614–616 (1986).
50. Stromme, J. H. & Eldjarn, L. The role of the pentose phosphate pathway in thereduction of methaemoglobin in human erythrocytes. Biochem. J. 84, 406–410(1962).
51. Nakao, K., Minato, N., Uemoto, S., Mullarky, E. & Cantley, L. C. Divertingglycolysis to combat oxidative stress. Innovative Med. 12, 3–23 (2015).
NATURE COMMUNICATIONS | https://doi.org/10.1038/s41467-020-20479-4 ARTICLE
NATURE COMMUNICATIONS | (2021) 12:377 | https://doi.org/10.1038/s41467-020-20479-4 | www.nature.com/naturecommunications 13
52. Ralser, M. et al. Dynamic rerouting of the carbohydrate flux is key tocounteracting oxidative stress. J. Biol. 6, 10–18 (2007).
53. Rey, G. et al. Metabolic oscillations on the circadian time scale in Drosophilacells lacking clock genes. Mol. Syst. Biol. 14, e8376 (2018).
54. Hastings, M. H., Reddy, A. B., McMahon, D. G. & Maywood, E. S. Analysis ofcircadian mechanisms in the suprachiasmatic nucleus by transgenesis andbiolistic transfection. Meth. Enzymol. 393, 579–592 (2005).
55. Sana, T. R., Waddell, K. & Fischer, S. M. A sample extraction andchromatographic strategy for increasing LC/MS detection coverage of theerythrocyte metabolome. J. Chromatogr. B 871, 314–321 (2008).
56. Zhang, T., Creek, D. J., Barrett, M. P., Blackburn, G. & Watson, D. G.Evaluation of coupling reversed phase, aqueous normal phase, andhydrophilic interaction liquid chromatography with Orbitrap massspectrometry for metabolomic studies of human urine. Anal. Chem. 84,1994–2001 (2012).
57. MacRae, J. I. et al. Mitochondrial metabolism of sexual and asexual bloodstages of the malaria parasite Plasmodium falciparum. BMC Biol. 11, 67(2013).
58. Schrader, M. C., Eskey, C. J., Simplaceanu, V. & Ho, C. A carbon-13 nuclearmagnetic resonance investigation of the metabolic fluxes associated withglucose metabolism in human erythrocytes. Biochim. Biophys. Acta 1182,162–178 (1993).
59. Rhoades, S. D. & Weljie, A. M. Comprehensive optimization of LC-MS.Metabolomics Methods Using Des. Exp. 12, 911 (2016).
60. Malik, D. M., Rhoades, S. & Weljie, A. Extraction and analysis of pan-metabolome polar metabolites by ultra performance liquid chromatography-tandem mass spectrometry (UPLC-MS/MS). Bio Protoc. 8, e2715 (2018).
61. Delgado, T. C., Castro, M. M., Geraldes, C. F. & Jones, J. G. Quantitation oferythrocyte pentose pathway flux with [2-13C]glucose and 1H NMR analysisof the lactate methyl signal. Magn. Reson. Med. 51, 1283–1286 (2004).
62. Lee, W. N. et al. Mass isotopomer study of the nonoxidative pathways ofthe pentose cycle with [1,2-13C2]glucose. Am. J. Physiol 274, E843–E851(1998).
63. Yang, R. & Su, Z. Analyzing circadian expression data by harmonic regressionbased on autoregressive spectral estimation. Bioinformatics 26, i168–i174(2010).
64. Hirota, T. et al. A chemical biology approach reveals period shortening of themammalian circadian clock by specific inhibition of GSK-3beta. Proc. NatlAcad. Sci. USA 105, 20746–20751 (2008).
AcknowledgementsA.B.R. acknowledges funding from the Perelman School of Medicine, University ofPennsylvania, and the Institute for Translational Medicine and Therapeutics (ITMAT),Perelman School of Medicine, University of Pennsylvania. Research reported in thispublication was supported by the National Institute of Diabetes and Digestive andKidney Diseases (NIDDK) of the National Institutes of Health (NIH) under awardnumber DP1DK126167 to A.B.R. The content is solely the responsibility of the authorsand does not necessarily represent the official views of the National Institutes ofHealth. We thank J. Millar of the University of Pennsylvania Institute of Diabetes,Obesity and Metabolism (IDOM) Metabolic Tracing Core for carbon labeling experi-ments. A.B.R. also acknowledges funding from the European Research Council (ERCStarting Grant No. 281348, MetaCLOCK), the EMBO Young Investigators Programme,
and the Lister Institute of Preventive Medicine. A.B.R. was supported in part by aWellcome Trust Senior Fellowship in Clinical Science (100333/Z/12/Z) at the Universityof Cambridge, and also in part by the Francis Crick Institute, which receives its corefunding from Cancer Research UK (FC001534), the UK Medical Research Council(FC001534), and the Wellcome Trust (FC001534). G.R. was supported by an AdvancedSNSF Postdoctoral Mobility Fellowship and an EMBO Long-Term Fellowship. We thankP. Grice for assistance with NMR experiments, and J. Jones for help with blood samplingfor preliminary experiments. We are also grateful for access to the MRC BiomedicalNMR Centre at the Francis Crick Institute.
Author contributionsR.C, G.R., and A.B.R. designed and planned the experiments. R.C., G.R., R.L., and S.R.performed cell experiments. P.K.J. performed mouse experiments with R.C. U.K.V.performed elements of the circadian data analysis. R.C. and S.R. performed the meta-bolite extractions. R.C., P.D., M.S.D.S., and D.M.M. performed NMR and mass spec-trometry analyses for metabolomics samples, with oversight from J.I.M., A.M.W., andA.B.R. R.C. and A.B.R. wrote the manuscript, with contributions from all of the authors.
Competing interestsThe authors declare no competing interests.
Additional informationSupplementary information is available for this paper at https://doi.org/10.1038/s41467-020-20479-4.
Correspondence and requests for materials should be addressed to A.B.R.
Peer review information Nature Communications thanks Alireza Delfarah, Oren Froy,and the other, anonymous, reviewer(s) for their contribution to the peer review of thiswork. Peer reviewer reports are available.
Reprints and permission information is available at http://www.nature.com/reprints
Publisher’s note Springer Nature remains neutral with regard to jurisdictional claims inpublished maps and institutional affiliations.
Open Access This article is licensed under a Creative CommonsAttribution 4.0 International License, which permits use, sharing,
adaptation, distribution and reproduction in any medium or format, as long as you giveappropriate credit to the original author(s) and the source, provide a link to the CreativeCommons license, and indicate if changes were made. The images or other third partymaterial in this article are included in the article’s Creative Commons license, unlessindicated otherwise in a credit line to the material. If material is not included in thearticle’s Creative Commons license and your intended use is not permitted by statutoryregulation or exceeds the permitted use, you will need to obtain permission directly fromthe copyright holder. To view a copy of this license, visit http://creativecommons.org/licenses/by/4.0/.
© The Author(s) 2021
ARTICLE NATURE COMMUNICATIONS | https://doi.org/10.1038/s41467-020-20479-4
14 NATURE COMMUNICATIONS | (2021) 12:377 | https://doi.org/10.1038/s41467-020-20479-4 | www.nature.com/naturecommunications
Related Documents


![Genomics of circadian rhythms in health and disease · 2019. 12. 17. · rhythmic behaviors [43]. Together, these studies show that rhythmic modulation of chromatin conformation adds](https://static.cupdf.com/doc/110x72/6127244f0bf857642b6f7339/genomics-of-circadian-rhythms-in-health-and-disease-2019-12-17-rhythmic-behaviors.jpg)