Rhodopsin Photoproducts in 2D Crystals Reiner Vogel 1 * †, Jonathan Ruprecht 2 †, Claudio Villa 2 , Thorsten Mielke 2 Gebhard F. X. Schertler 2 and Friedrich Siebert 1 1 Biophysics Group, Institut fu ¨r Molekulare Medizin und Zellforschung Albert-Ludwigs-Universita ¨t Freiburg, Hermann-Herder-Str. 9, D-79104 Freiburg, Germany 2 Structural Studies Division MRC Laboratory of Molecular Biology, Hills Road, Cambridge CB2 2QH, UK The published electron microscope and X-ray structures of rhodopsin have made available a detailed picture of the inactive dark state of rhodopsin. Yet, the photointermediates of rhodopsin that ultimately lead to the activated receptor species still await a similar analysis. Such an analysis first requires the generation and characterization of the photo- products that can be obtained in crystals of rhodopsin. We therefore studied with Fourier-transform infrared (FTIR) difference spectroscopy the photoproducts in 2D crystals of bovine rhodopsin in a p22 1 2 1 crystal form. The spectra obtained by cryotrapping revealed that in this crystal form the still inactive early intermediates batho, lumi, and meta I are similar to those obtained from rhodopsin in native disk membranes, although the transition from lumi to meta I is shifted to a higher tempera- ture. However, at room temperature, the formation of the active state, meta II, is blocked in the crystalline environment. Instead, an intermediate state is formed that bears some features of meta II but lacks the specific conformational changes required for activity. Despite being unable to activate its cognate G protein, transducin, to a significant extent, this inter- mediate state is capable of interacting with functional transducin-derived peptides to a limited extent. Therefore, while unable to support formation of rhodopsin’s active state meta II, 2D p22 1 2 1 crystals proved to be very suitable for determining 3D structures of its still inactive precursors, batho, lumi, and meta I. In future studies, FTIR spectroscopy may serve as a sensitive assay to screen crystals grown under altered conditions for potential formation of the active state, meta II. q 2004 Elsevier Ltd. All rights reserved. Keywords: infrared spectroscopy; protein conformation; G protein-coupled receptor; membrane protein; visual pigment *Corresponding author Introduction Rhodopsin is the visual pigment responsible for dim light vision in the rod photoreceptor cells. It constitutes a prototype within class A of the large family of G protein-coupled receptors (GPCRs) that play an important role in transmembrane signaling. 1,2 Recently published X-ray structures from 3D crystals of bovine rhodopsin have provided us with a detailed picture of the inactive dark state of rhodopsin. 3,4 They have confirmed the arrangement of rhodopsin’s seven membrane-spanning helices proposed from homology data, 5 and from projec- tion structures obtained from 2D crystals of rho- dopsin by means of electron cryomicroscopy. 6–9 From the archaeal light-driven proton pump bacteriorhodopsin, another example of a retinal- bound membrane protein with seven trans- membrane helices, 3D crystals can be obtained that remain stable under continuous illumination. This facilitated the collection of diffraction data and the calculation of 3D structures from the ground state of bacteriorhodopsin and from inter- mediates of its photocycle. 10,11 In contrast to 0022-2836/$ - see front matter q 2004 Elsevier Ltd. All rights reserved. † R.V. and J.R. contributed equally to this work. Present address: T. Mielke, Institut fu ¨ r Medizinische Physik und Biophysik, Charite-Universita ¨tmedizin Berlin, Schumannstraße 20/21, D-10098 Berlin, Germany E-mail address of the corresponding author: [email protected] Abbreviations used: GPCR, G protein-coupled receptor; FTIR, Fourier-transform infrared; HOOP, hydrogen-out-of-plane; DMPC, dimyristoyl phosphatidylcholine; DPPC, dipalmitoyl phosphatidylcholine; DSPC, distearoyl phosphatidylcholine; POPC, palmitoyl oleyl phosphatidylcholine. doi:10.1016/j.jmb.2004.03.006 J. Mol. Biol. (2004) 338, 597–609

Welcome message from author
This document is posted to help you gain knowledge. Please leave a comment to let me know what you think about it! Share it to your friends and learn new things together.
Transcript

Rhodopsin Photoproducts in 2D Crystals
Reiner Vogel1*†, Jonathan Ruprecht2†, Claudio Villa2, Thorsten Mielke2
Gebhard F. X. Schertler2 and Friedrich Siebert1
1Biophysics Group, Institut furMolekulare Medizin undZellforschungAlbert-Ludwigs-UniversitatFreiburg, Hermann-Herder-Str.9, D-79104 Freiburg, Germany
2Structural Studies DivisionMRC Laboratory of MolecularBiology, Hills Road, CambridgeCB2 2QH, UK
The published electron microscope and X-ray structures of rhodopsinhave made available a detailed picture of the inactive dark state ofrhodopsin. Yet, the photointermediates of rhodopsin that ultimately leadto the activated receptor species still await a similar analysis. Such ananalysis first requires the generation and characterization of the photo-products that can be obtained in crystals of rhodopsin. We thereforestudied with Fourier-transform infrared (FTIR) difference spectroscopythe photoproducts in 2D crystals of bovine rhodopsin in a p22121 crystalform. The spectra obtained by cryotrapping revealed that in this crystalform the still inactive early intermediates batho, lumi, and meta I aresimilar to those obtained from rhodopsin in native disk membranes,although the transition from lumi to meta I is shifted to a higher tempera-ture. However, at room temperature, the formation of the active state,meta II, is blocked in the crystalline environment. Instead, an intermediatestate is formed that bears some features of meta II but lacks the specificconformational changes required for activity. Despite being unable toactivate its cognate G protein, transducin, to a significant extent, this inter-mediate state is capable of interacting with functional transducin-derivedpeptides to a limited extent. Therefore, while unable to support formationof rhodopsin’s active state meta II, 2D p22121 crystals proved to be verysuitable for determining 3D structures of its still inactive precursors,batho, lumi, and meta I. In future studies, FTIR spectroscopy may serveas a sensitive assay to screen crystals grown under altered conditions forpotential formation of the active state, meta II.
q 2004 Elsevier Ltd. All rights reserved.
Keywords: infrared spectroscopy; protein conformation; G protein-coupledreceptor; membrane protein; visual pigment*Corresponding author
Introduction
Rhodopsin is the visual pigment responsible fordim light vision in the rod photoreceptor cells. Itconstitutes a prototype within class A of the large
family of G protein-coupled receptors (GPCRs) thatplay an important role in transmembranesignaling.1,2 Recently published X-ray structuresfrom 3D crystals of bovine rhodopsin have providedus with a detailed picture of the inactive dark state ofrhodopsin.3,4 They have confirmed the arrangementof rhodopsin’s seven membrane-spanning helicesproposed from homology data,5 and from projec-tion structures obtained from 2D crystals of rho-dopsin by means of electron cryomicroscopy.6 – 9
From the archaeal light-driven proton pumpbacteriorhodopsin, another example of a retinal-bound membrane protein with seven trans-membrane helices, 3D crystals can be obtainedthat remain stable under continuous illumination.This facilitated the collection of diffraction dataand the calculation of 3D structures from theground state of bacteriorhodopsin and from inter-mediates of its photocycle.10,11 In contrast to
0022-2836/$ - see front matter q 2004 Elsevier Ltd. All rights reserved.
† R.V. and J.R. contributed equally to this work.
Present address: T. Mielke, Institut fur MedizinischePhysik und Biophysik, Charite-UniversitatmedizinBerlin, Schumannstraße 20/21, D-10098 Berlin, Germany
E-mail address of the corresponding author:[email protected]
Abbreviations used: GPCR, G protein-coupledreceptor; FTIR, Fourier-transform infrared; HOOP,hydrogen-out-of-plane; DMPC, dimyristoylphosphatidylcholine; DPPC, dipalmitoylphosphatidylcholine; DSPC, distearoylphosphatidylcholine; POPC, palmitoyl oleylphosphatidylcholine.
doi:10.1016/j.jmb.2004.03.006 J. Mol. Biol. (2004) 338, 597–609

crystals of bacteriorhodopsin, 3D crystals ofrhodopsin were shown not to be stable towardsillumination even at 4 8C. Instead, the crystal latticedeteriorated irreversibly after photolysis, leadingto the disappearance of diffraction peaks.12 Thisseriously hampers efforts to obtain a high-resolution structure of light-activated rhodopsinand to provide a detailed molecular picture of theactivation mechanism, which is currently based onless direct methods.
In contrast to 3D crystals, 2D crystals of rhodopsinproved to be capable of forming photointermediateseven at room temperature without losing their crys-talline long-range order (J.R. & G.F.X.S., unpublishedresults). We sought a method to characterize whichphotointermediates are formed in the 2D crystals,and to compare these photointermediates with thoseobtained in native disk membranes or in detergentsolution, before initiating structural studies. Thephotoproducts of rhodopsin in membranes or deter-gent micelles have been well characterized in recentyears, e.g. by means of UV–visible spectroscopy,13
Fourier-transform infrared (FTIR) spectroscopy,14,15
Raman spectroscopy16 and electron paramagneticresonance spectroscopy of spin-labelled pigments,17,18
and by various biochemical assays involvingthe introduction of cross-links between trans-membrane helices.19 – 21
FTIR difference spectroscopy has been shown tobe a particularly well suited method for sensitivelymonitoring the changes of both the chromophoreand the protein moiety of rhodopsin in thesequence of photo intermediates.14,15,22 Applicationof this technique to 2D p22121 crystals of rhodopsinrevealed that the crystalline environment does notsupport the conformational changes required forthe ultimate transition to the activated receptorspecies, meta II. Despite being able to interactwith functional peptides derived from rhodopsin’scognate G protein, transducin, the room-tempera-ture photoproduct in 2D crystals was not capableof activating transducin and thus initiating signaltransduction. The transitions to the still inactiveprecursors of the active state were not blocked inthe crystals. The difference spectra of batho, lumi,and meta I were very similar to those obtained inthe native membrane environment, although thetransition temperature to meta I was higher in the2D crystals. These findings establish a basis forfurther structural studies on 2D crystals ofrhodopsin using electron crystallography toprovide us with more detailed information aboutthe structural changes taking place in the earlierphotointermediates of rhodopsin.
Results
Rhodopsin photoproducts in native diskmembranes
We first give a short summary on the photo-products of rhodopsin in its native disk membrane
environment. Illumination of the dark state ofrhodopsin leads to isomerization of its covalentlybound retinal chromophore from an inactivating11-cis to an all-trans geometry. This produces innative disk membranes a series of still inactivephotointermediates that can be trapped belowcharacteristic transition temperatures (Scheme 1):batho (lmax 543 nm, T , 2140 8C/133 K), lumi(lmax 497 nm, T , 240 8C/233 K), and meta I (lmax
480 nm).23,24 The last inactive intermediate, meta I,is in a pH and temperature-dependent equilibriumwith meta II (lmax 380 nm), which can be shiftedtowards meta II by lowering the pH or increasingthe temperature.25,26 Meta II represents the activereceptor state, which is capable of interaction withand activation of the visual G protein, transducin.The transition to meta II involves significant con-formational changes of the protein. These changes,which lead to a deprotonation of the Schiff base inmeta II, render the equilibrium with its meta Iprecursor remarkably sensitive to pH and tempera-ture, and to pressure, fluidity and spontaneouscurvature of the lipid or detergent matrix wherethe protein is embedded.23,27 – 31
Low-temperature photoproducts in 2D crystals
As a first step in the characterization of rhodop-sin’s photoproducts in 2D crystals, we studied thelow-temperature photoproducts batho and lumi,which were stabilized by cooling the samples to2183 8C (90 K) and 293 8C (180 K), respectively,prior to photolysis, such that they could beexamined by static FTIR difference spectroscopy.To characterize the different photoproduct states,we recorded spectra before and after photolysis ofthe sample and formed the difference between thetwo. In the conventional representation (photo-product minus initial dark state), positive bands inthe difference spectra belong to the photoproduct
Scheme 1.
598 Rhodopsin Photoproducts in 2D Crystals

state, while negative bands represent the initialdark state. In Figure 1, we can compare thedifference spectra of batho and lumi obtainedfrom rhodopsin in native disk membranes (grey)with the photoproducts obtained from rhodopsinin 2D crystals (black) under otherwise identicalconditions. Obviously, the overall vibrationalpatterns of the difference spectra obtained from2D crystals superimpose very well with those inthe difference spectra obtained from disk mem-branes, and the vibrational marker bands of therespective states are present in both the crystallineand the membranous environment. Such markersare the strong ethylenic mode at 1535 cm21, thefingerprint mode at 1208 cm21, and the intensehydrogen-out-of-plane (HOOP) mode at 921 cm21
in the case of batho, and the HOOP modes around940 cm21, as well as the shape of the band patternof protonated carboxylic acids above 1700 cm21
and in the amide I range around 1650 cm21 in thecase of lumi.14 This indicates that the batho andlumi photoproduct states are regularly formed inthe crystalline environment. Some slight differencesare discernible in the relative amplitudes of somevibrational bands in the range around 1550 cm21 ofthe chromophores ethylenic mode and the proteinamide II modes, as well as in the fingerprint range
between 1300 cm21 and 1050 cm21, reflecting theC–C stretching vibrations of the chromophore.These differences arise presumably from a higherdegree of pigment orientation in samples preparedfrom crystals in combination with a non-vanishinglinear dichroism of the involved bands, assuggested by comparison of the spectra with thoseobtained from membrane samples with a betterorientation obtained by isopotential spin drying(F. Nusken & F.S., unpublished results).
The batho state is stable in 2D crystals and indisk membranes below 2130 8C. In the tempera-ture range between 2130 8C and 290 8C, wefound a similar temperature-dependence for thetransition to lumi for the 2D crystals as comparedto disk membranes.
Transition to the meta I state
In disk membranes, lumi is stable below 260 8C,such that pure meta I spectra can be obtained attemperatures above 240 8C. For rhodopsin in 2Dcrystals, stable lumi-like difference spectra can beobtained up to 230 8C and pure meta I is observedonly at 210 8C or higher.
We studied meta I at 10 8C and pH 8.5, andobtained similar difference spectra for both mem-branes and crystals (Figure 2A, upper spectra).Both spectra show the typical bands of the meta Iphotoproduct, as e.g. the positive amide I band at1664 cm21 or the HOOP difference band of thechromophore at 2969/þ950 cm21. The presenceof the typical positive band at 1203 cm21 ofchromophore C–C stretching vibrations furtherindicates a protonated Schiff base in both photo-products. Corresponding UV–visible spectra ofthe photoreaction obtained under the same con-ditions (Figure 2B) confirm a photoproduct with aprotonated Schiff base with the absorption peak at480 nm typical of meta I. For a closer examinationof the protein conformation, we show in Figure 3an enlarged view of the spectral region between1500 cm21 and 1800 cm21. As can be seen inFigure 3A, meta I difference spectra obtained fromdisk membranes are clearly altered at differenttemperatures. The bands at 1538, 1643, and1664 cm21 differ significantly in intensity, and theband pattern around 1700 cm21 is altered. Thesedifferences are clearly not due to contributions oflumi or meta II to the meta I spectra, as contri-butions by their spectra (shown in shades of grey)should influence other bands as well. The identityof meta I is confirmed by the 480 nm visibleabsorption peak at both temperatures. Meta I spec-tra obtained from disk membranes therefore varyas a function of temperature, and they do so in areproducible manner. In Figure 3B we show metaI spectra obtained from 2D crystals at 10 8C and0 8C, both at pH 8.5, and again, for comparison,the meta I spectra obtained at 10 8C from diskmembranes. The meta I spectra obtained from the2D crystals show a small variation with tempera-ture and they show deviations from the spectrum
Figure 1. The transitions to the low-temperaturephotointermediates batho and lumi are unperturbed in2D crystals. FTIR difference spectra were obtained at2183 8C (90 K) for the batho intermediate, and at293 8C (180 K) for lumi, both from rhodopsin in 2Dcrystals (black) and from rhodopsin in its native diskmembrane environment (grey), all at pH 7.0. In thisrepresentation (photoproduct minus dark state),vibrational bands of the initial dark state are negative,while those of the photoproduct states are positive. Asthe spectra obtained from 2D crystals correspond tothose obtained from the membrane environment, thetransitions to both batho and lumi are unperturbed bythe crystalline environment.
Rhodopsin Photoproducts in 2D Crystals 599

obtained from the disk membranes. The latterdifferences are particularly pronounced for thebands at 1538 cm21, 1643 cm21, and 1664 cm21.These are, however, the bands that have been
shown to have the largest intrinsic variability inmeta I in Figure 3A, and the amplitude of thesedifferences is of comparable size. We shouldfurther keep in mind that the different degrees ofpigment orientation in crystal and membranesamples may contribute to these deviations, as hasbeen discussed above for the low-temperaturestates. The meta I spectra obtained from 2Dcrystals do therefore fully correspond to the meta Ispectra obtained from disk membranes within thelimits imposed by their naturally occurringintrinsic variability.
Figure 2. The transitions to the meta states. A, In nativedisk membranes (grey), rhodopsin forms the still inactivemeta I photoproduct at 10 8C and pH 8.5, while at 20 8Cand pH 5.0, the active state conformation of meta II isadopted by the protein. In 2D crystals, the meta I state cor-responds to that obtained in disk membranes, while at20 8C and pH 5.0, the transition to meta II is blocked.Instead, an intermediate state is formed with a differencespectrum that lacks some of the features of a meta II differ-ence spectrum, as e.g. at 1747 cm21and at 1644 cm21. B,Corresponding UV–visible spectra obtained from mem-brane samples show the shift of the visible absorptionpeak from 500 nm for the dark state to 480 nm for meta Iat 10 8C and pH 8.5, and to 380 nm at 20 8C and pH 5.0,reflecting the deprotonation of the retinal Schiff base inmeta II. The spectra obtained from 2D crystal samplesunder the same conditions reveal a 480 nm photoproductwith a largely protonated Schiff base.
Figure 3. Comparison of the meta I states in diskmembranes and in 2D crystals. A, Comparison of the1500–1800 cm21 range of meta I spectra obtained fromdisk membranes at 0 8C (green) and 10 8C (red), both atpH 8.5, and of lumi (dark grey) and meta II spectra(light grey) shows the intrinsic variability of meta Ispectra as a function of temperature. B, Meta I spectraobtained from 2D crystals of rhodopsin at 0 8C (lightblue) and 10 8C (dark blue), both at pH 8.5, do showsome deviations from the meta I spectrum obtainedfrom disk membranes at 10 8C (red). Within the naturallyoccurring intrinsic variability of the spectra shown in A,the spectra obtained from 2D crystals fully conform tothose obtained from disk membranes.
600 Rhodopsin Photoproducts in 2D Crystals

The transition to meta II is blocked in the2D crystals
Under meta II conditions at 20 8C and pH 5.0, thephotoproduct obtained in disk membranes showsthe typical absorption shift to 380 nm, whichreflects the deprotonation of the Schiff base inmeta II (Figure 2B). In 2D crystals, on the otherhand, this formation of a 380 nm photoproduct islargely absent. This is paralleled in the FTIRspectra obtained under the same conditions(Figure 2A, lower spectra). The difference spec-trum obtained from disk membranes shows thetypical difference bands reflecting the transition tothe active state conformation of meta II. Thesechanges involve, among others, the pronouncedpattern above 1700 cm21 that arises mainly fromCvO stretching vibrations of protonated car-boxylic acid residues and that reflects hydrogenbonding or protonation changes of the membrane-embedded residues Asp83, Glu122, Glu113, andGlu181 (our unpublished results),32 – 34 as well asthe particularly intense amide I difference band at1644 cm21 that reflects a perturbation of the back-bone structure due to the conformational transitionof the protein.
For 2D crystals, the spectrum obtained at 20 8Cand pH 5.0 fails to show these typical meta IImarker bands. As there is no substantial deproto-nation of the Schiff base in the 2D crystals, someof the deviations from the meta II spectrumobtained with disk membranes merely reflectprotonation-sensitive chromophore bands, whichare discussed in more detail elsewhere.35 Thissensitivity to Schiff base protonation explains thepositive fingerprint band of the photoproduct at1203 cm21 and the reduced intensity of the nega-tive band at 1556 cm21, corresponding to the CvCstretching vibration of the chromophore, in the 2Dcrystals. The intensity of the latter band decreasesconsiderably when the retinal Schiff base deproto-nates, such that in the difference spectrumobtained from disk membranes, we see clearly theCvC vibration of the dark state, while in 2Dcrystals, this band is partially cancelled by thecorresponding band of the photoproduct. How-ever, other differences, particularly the reducedintensities of the positive band at 1747 cm21
corresponding to the CvO stretching vibration ofprotonated Asp83 and Glu122,32,34 and of the metaII amide band at 1644 cm21, indicate that the fullconformational transition to meta II is inhibited inthe 2D crystals. This is supported further by thestill pronounced intensity of the slightly shiftedmeta I marker band at 1666 cm21. An interestingfeature in the spectrum obtained from 2D crystalsis the positive band centered at 1709 cm21, whichis broader and less asymmetric than the corre-sponding band in the meta II spectrum obtainedfrom disk membranes. In the meta II spectrum,this band is known to comprise the CvO stretch-ing mode of Glu113, which becomes protonatedin the course of receptor activation. The similar
intensities of this band in both spectra may suggestthat Glu113 is protonated in the photoproductobtained from 2D crystals, which would be inagreement with a recently proposed counterionswitch occurring already during the transition tometa I.36 A quantitative determination of the contri-bution of Glu113 to the observed band pattern inthe 2D crystal photoproduct is difficult, however,due to overlapping negative bands. Furthermore,the CvO stretching vibration of protonatedGlu122 absorbs in the native meta I state in thesame range,37 and may therefore contribute to theobserved band.
Comparison to the spectrum obtained undermeta I conditions (as e.g. 10 8C and pH 8.5) clearlyshows that in 2D crystals, the sequence of photo-products gets stuck in a conformation that is inter-mediate between that of the inactive meta I stateand that of active meta II. The molecular environ-ment of rhodopsin in the 2D crystals thereforelimits the conformations accessible to the receptorcompared to disk membranes.
Influence of pH, temperature, and lipidcomposition on the conformation of the metastates in 2D crystals
In disk membranes, the meta I/meta II equi-librium responds to a variety of parameters, e.g.temperature, pH, or the composition of its lipidenvironment. We therefore investigated by IRspectroscopy how far the conformation of theroom-temperature intermediate state in 2D crystalsresponds to pH, temperature, and lipid environ-ment, with the aim to shift it further towards thatof active meta II.
As shown above, the difference spectrumobtained at 10 8C and pH 8.5 corresponds to thatof meta I. Starting from these temperature and pHvalues, we observe the appearance of meta IImarker bands (which, in the following, comprisethe positive band at 1747 cm21, composed of contri-butions by Asp83 and Glu122, as well as theintense amide I band at 1644 cm21) upon increasingthe temperature to 20 8C and/or decreasing the pHto 4.0; however, never exceeding 50% of the fullintensity of these bands (as observed in diskmembranes) under any of the assayed conditions.Again, the appearance of these marker bands doesnot imply an activation of the receptor molecule,which should be detectable by its activity towardstransducin, but rather the formation of an inactiveintermediate state bearing some, but not allfeatures of meta II. Increasing the temperature to30 8C yielded no substantial further increase ofmeta II features in the IR spectra (data notshown), yet decreased noticeably the stability ofthe photoproduct. Interestingly, we observed at20 8C, and even more at 30 8C, a deprotonationof the retinal Schiff base in the photoproduct atalkaline pH, causing a UV–visible absorptionpeak at 380 nm (spectra not shown). This deproto-nation, however, did not reflect formation of a
Rhodopsin Photoproducts in 2D Crystals 601
meta II state, but rather indicated a titratable Schiffbase in the photoproduct, possibly due to a slightlylooser protein environment of the Schiff base atthese temperatures. Maybe this product corre-sponds to a meta I species with deprotonatedSchiff base, meta I380, which is formed transientlyin disk membranes above 20 8C as shown by time-resolved UV–visible spectroscopy.38
Cholesterol is known to shift the meta I/meta IIequilibrium in disk membranes towards theinactive meta I state.30 We therefore omittedaddition of cholesterol in the crystallization proto-col (see Materials and Methods) and compared thephotoproducts obtained in these crystals withthose from regular crystals, where cholesterol isadded routinely to improve crystal quality.39 How-ever, formation of meta II was inhibited in thesecrystals (termed w/o cholesterol), despite theamplitude of meta II marker bands being slightlyincreased (compare Figure 5A). These crystalswere used also in the following experiments,where we probed the interaction with G proteinand G protein-derived peptides.
Activity of the room-temperature photoproducttowards G protein
We tested the capability of the room-temperaturephotoproduct in 2D crystals to induce nucleotideexchange and thus activation of the visual G
protein, transducin, at 20 8C at pH 5.0, pH 6.0, andpH 7.0 by a real-time fluorescence assay.40
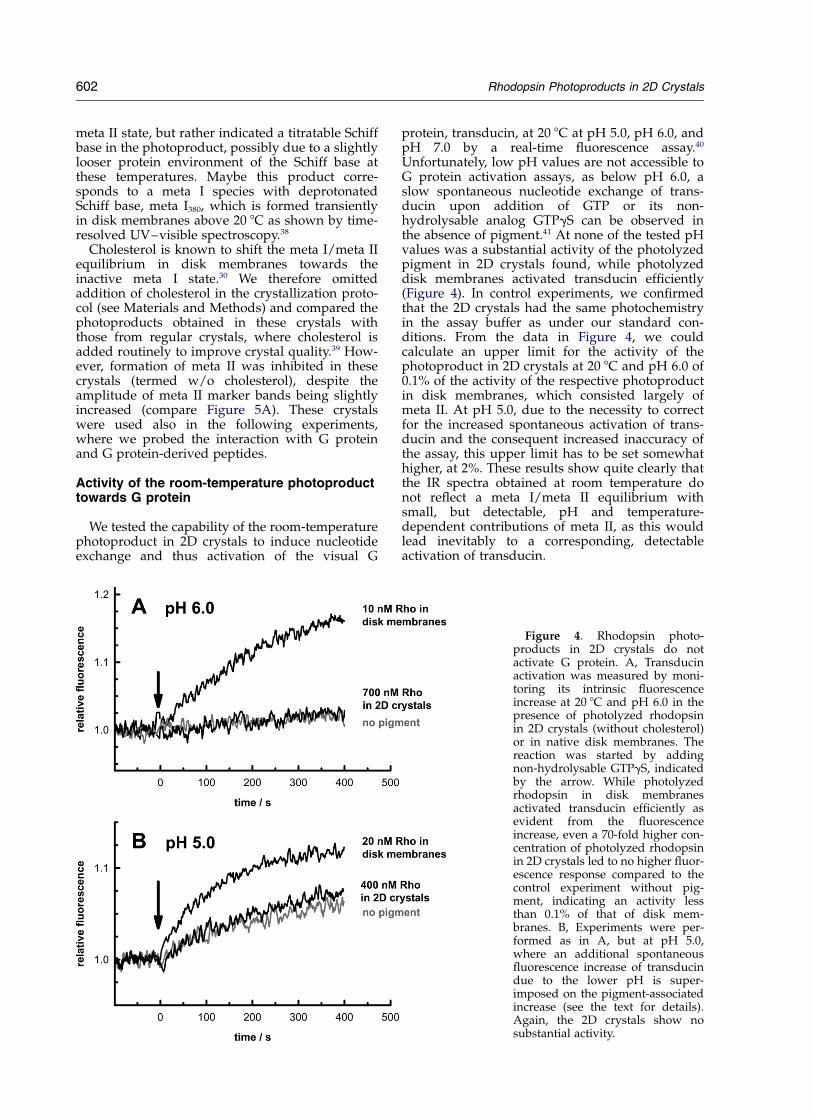
Unfortunately, low pH values are not accessible toG protein activation assays, as below pH 6.0, aslow spontaneous nucleotide exchange of trans-ducin upon addition of GTP or its non-hydrolysable analog GTPgS can be observed inthe absence of pigment.41 At none of the tested pHvalues was a substantial activity of the photolyzedpigment in 2D crystals found, while photolyzeddisk membranes activated transducin efficiently(Figure 4). In control experiments, we confirmedthat the 2D crystals had the same photochemistryin the assay buffer as under our standard con-ditions. From the data in Figure 4, we couldcalculate an upper limit for the activity of thephotoproduct in 2D crystals at 20 8C and pH 6.0 of0.1% of the activity of the respective photoproductin disk membranes, which consisted largely ofmeta II. At pH 5.0, due to the necessity to correctfor the increased spontaneous activation of trans-ducin and the consequent increased inaccuracy ofthe assay, this upper limit has to be set somewhathigher, at 2%. These results show quite clearly thatthe IR spectra obtained at room temperature donot reflect a meta I/meta II equilibrium withsmall, but detectable, pH and temperature-dependent contributions of meta II, as this wouldlead inevitably to a corresponding, detectableactivation of transducin.
Figure 4. Rhodopsin photo-products in 2D crystals do notactivate G protein. A, Transducinactivation was measured by moni-toring its intrinsic fluorescenceincrease at 20 8C and pH 6.0 in thepresence of photolyzed rhodopsinin 2D crystals (without cholesterol)or in native disk membranes. Thereaction was started by addingnon-hydrolysable GTPgS, indicatedby the arrow. While photolyzedrhodopsin in disk membranesactivated transducin efficiently asevident from the fluorescenceincrease, even a 70-fold higher con-centration of photolyzed rhodopsinin 2D crystals led to no higher fluor-escence response compared to thecontrol experiment without pig-ment, indicating an activity lessthan 0.1% of that of disk mem-branes. B, Experiments were per-formed as in A, but at pH 5.0,where an additional spontaneousfluorescence increase of transducindue to the lower pH is super-imposed on the pigment-associatedincrease (see the text for details).Again, the 2D crystals show nosubstantial activity.
602 Rhodopsin Photoproducts in 2D Crystals

Capability of the meta photoproducts tointeract with G protein-derived functionalpeptides
We next analyzed whether the photoproducts in2D crystals are capable of interacting with a high-affinity analog peptide to the C terminus of thetransducin a-subunit. This undecamer (acetyl-VLEDLKSCGLF) was found to bind to the activemeta II intermediate in disk membranes and toshift the meta I/meta II conformational equi-librium towards meta II.42 The latter behavior istermed the extra-meta II effect.23,43,44
In Figure 5A, we show FTIR difference spectraobtained in the presence and in the absence ofpeptide. By forming the difference between thetwo difference spectra (with peptide minus with-out peptide), we obtain information about confor-mational changes induced by the presence of thepeptide. These peptide-induced double differencespectra obtained at 20 8C at pH 5.0, pH 6.0, andpH 8.5 are shown in Figure 5B.
In Figure 5C, we have calculated the correspond-ing peptide-induced double difference spectra fordisk membranes under meta II conditions (red,20 8C, pH 5.0) as well as under meta I conditions(blue, 10 8C, pH 8.5). The red spectrum reflects theformation of the meta II/peptide complex withcharacteristic positive bands at 1656 cm21,1646 cm21, and 1535 cm21 as described.45 – 47 It wasfound recently that the functionally similar wild-type peptide undergoes a conformational changeupon complex formation with meta II,48 such thatthe peptide-induced double difference spectrumobtained under meta II conditions (shown in red)likely contains the difference bands due to this con-formational change.
Under meta I conditions, the presence of thepeptide efficiently stabilizes the active-state confor-mation of meta II in disk membranes and therebyshifts the conformational equilibrium almost com-pletely from meta I to meta II (extra-meta II effect).The corresponding peptide-induced differencespectrum (Figure 5C, blue spectrum) shows, there-fore, in addition, the large difference bands due tothe extra-meta II effect.
If we compare these two spectra in Figure 5Cwith the corresponding spectrum obtained at pH5.0 with the 2D crystals in Figure 5B (redspectrum), it becomes evident that in the 2Dcrystals the key characteristics of formation of areceptor/peptide complex are there, but that thereare only small contributions of the extra-meta IIeffect, which can be best determined from thesmall meta II-like difference bands visible above1700 cm21. As all spectra are to scale (normalizedby the 1238 cm21 fingerprint band of dark staterhodopsin), comparison of the amplitudes of thespectra in Figure 5B with that of the red spectrumin Figure 5C allows the conclusion that, as com-pared to native membranes, complex formation isalmost quantitative at pH 5.0, where the inter-mediate state is formed, but not at pH 8.5, where
the conformation of the receptor correspondsrather to that of meta I. The corresponding declineof the amplitude of the peptide-induced doubledifference spectrum with increasing pH rules outnon-specific interactions between peptide and theprotein film as a source of the observed spectralchanges. Therefore, despite not being able toactivate transducin, the intermediate state formedat pH 5.0 is capable of interacting with the trans-ducin-derived peptide. However, the free energy
Figure 5. G protein-derived peptides interact withphotoproducts in 2D crystals. A, The presence of a20-fold excess of a high-affinity peptide analog of thetransducin a-subunit C terminus gives rise to smallchanges in the light-induced difference spectrumobtained from rhodopsin in 2D crystals (withoutcholesterol) at 20 8C and pH 5.0. B, Subtraction of thespectrum obtained in the absence of peptide from thatobtained in its presence yields a peptide-induced doubledifference spectrum, which was obtained at different pHvalues at 20 8C. C, Corresponding peptide-inducedspectra were obtained for rhodopsin in disk membranesunder meta I conditions (blue, 10 8C, pH 8.5) and meta IIconditions (red, 20 8C, pH 5.0). The red spectrum,obtained under meta II conditions, shows mainly amideI and II difference bands that are evoked by structuralchanges within the complex that is formed quantitativelybetween the peptide and the active meta II photo-product. The blue spectrum, obtained under meta I con-ditions, reflects in addition the peptide-induced shift ofthe photoproduct equilibrium of the receptor frommeta I towards meta II (extra-meta II effect). A similarlypronounced extra-meta II effect can, however, not beobserved in the 2D crystals. All spectra were normalizedusing the 1238 cm21 fingerprint band of the dark state.
Rhodopsin Photoproducts in 2D Crystals 603

released by formation of the receptor/peptidecomplex and by the structural changes induced inthe peptide seems to be very small and notsufficient to induce the conformational changesrequired for completion of the transition to meta II.
A rigid lipid bilayer may mimic the inhibitoryeffect of the crystalline environment
Does the restriction of helix re-arrangement andthus the inhibition of meta II formation resultfrom specific protein–protein contacts in the 2Dcrystals or are they a consequence of the increasedrigidity of the crystalline environment? To tacklethis question, we reconstituted purified rhodopsinin a series of saturated diacyl phosphatidylcholinelipids to study the effect of a rigid lipid environ-ment on the conformational flexibility of the photo-receptor. The transition temperatures from thelow-temperature, rigid-gel phase to the more fluidliquid-crystalline phase have been reported foraqueous dispersions of the pure lipids to be24.0 8C for dimyristoyl phosphatidylcholine(DMPC, C14), 41.5 8C for dipalmitoyl phosphatidyl-choline (DPPC, C16), and 54.3 8C for distearoylphosphatidylcholine (DSPC, C18).
49
At 20 8C and pH 5.0, we found in the long-chainDSPC a photoproduct with an FTIR differencespectrum very similar to those obtained from 2Dcrystals under same conditions (Figure 6A).Namely, the transition to meta II is blocked inDSPC. Similar results were obtained for DPPC.There, however, the amplitudes of meta II markerbands were slightly higher than in 2D crystals, butagain below 50% compared to native meta II indisk membranes (not shown). In DMPC with itsshorter acyl chains, the photoproduct was foundto be unstable under the assayed conditions,decaying rapidly to a species bearing some of thecharacteristics of a non-native loose helix bundle,which has been described as a decay product ofrhodopsin photoproducts in disk membranes atextreme pH.50 In a control experiment withrhodopsin reconstituted in unsaturated palmitoyloleyl phosphatidylcholine (POPC) or egg PC, aregular meta II spectrum was observed (notshown).
We therefore focused on DSPC and DPPCbilayers, and studied these systems in more detail.As in 2D crystals, the transition temperaturebetween lumi and meta I was increased in bothlipids. Also G protein activation and interactionwith transducin-derived peptides were similar tothe 2D crystals: rhodopsin reconstituted in eitherDSPC or DPPC bilayers was not able to activatetransducin, while it showed a pronounced inter-action with transducin-derived functional pep-tides, as shown in Figure 6B and C for the case ofDSPC. Again, this interaction with the peptidewas not sufficient to overcome the restraintimposed by the rigid lipid matrix onto the confor-mational flexibility of the protein and to inducethe conformational transition to meta II. Previous
studies on rhodopsin reconstituted into DPPCbilayers indicated that the protein–lipid mem-brane partitions into rhodopsin-rich domains andrather pure lipid patches below the characteristicphase transition temperature of the recombinantmembranes.51 Such a segregation of rhodopsinmolecules into more densely protein-packeddomains may contribute to the observed behaviorin our study.
Discussion
While 3D crystals of rhodopsin are not stableunder illumination even at 4 8C, but rather losetheir X-ray diffraction quality,52 2D crystals of
Figure 6. DSPC membrane vesicles mimic the environ-ment of 2D crystals. A, The photoproducts of rhodopsinreconstituted into DSPC lipids (black) are very similarto those obtained from 2D crystals (grey), as shown herefor the photoproduct obtained at 20 8C and pH 5.0,where the transition to meta II is blocked. B, For theinteraction of the transducin a-subunit-derived peptidewith this photoproduct in DSPC, characteristics similarto those of 2D crystals (see Figure 5B) were observed.Namely, the pigment is capable of interacting with thepeptide, but the binding of the peptide is not sufficientto induce the conformational transition to meta II in thereceptor. C, The transducin activation assay was con-ducted as described for Figure 4 at pH 6.0 and 20 8C.Rhodopsin in DSPC vesicles was found to be incapableof activating transducin, like rhodopsin in 2D crystals.
604 Rhodopsin Photoproducts in 2D Crystals

rhodopsin retain their crystalline order even whenilluminated at room temperature (J.R. & G.F.X.S.,unpublished results). Therefore, electron crystallo-graphy of 2D crystals seems a feasible way toobtain direct structural data of rhodopsin’s room-temperature photoproducts, meta I and meta II,which form a conformational equilibrium. Incontrast to the active-state meta II, its precursormeta I is not capable of activating transducin. Thetransition to the active state has been shown toinvolve a re-arrangement of the transmembranehelices, which prepares rhodopsin’s cytoplasmicsurface for the binding and the activation of the Gprotein.53 This re-arrangement has been studied bya variety of means, including cross-linking ofindividual helices,20,21,54 spin-labelling,18,19 fluor-escence decay55 or accessibility experiments.56,57
Pressure relaxation techniques have further shownthat this re-arrangement is accompanied by a slightexpansion of the receptor molecule.27,28
Our studies have shown that the conformationalchanges of the protein that lead to the activereceptor species, meta II, are inhibited in theenvironment of our p22121 2D crystals. While aregular meta I photoproduct can be obtained at10 8C and pH 8.5, the expected transition to metaII at lower pH and/or higher temperature isinhibited. Instead a state intermediate betweenmeta I and meta II is formed, which has a largelyprotonated retinal Schiff base and is completelyinactive towards rhodopsin’s cognate G protein,transducin. The conformation of this intermediatestate bears, to some extent, characteristics of bothmeta I and meta II. It shows characteristicstructural marker bands of meta II, as e.g. in thefrequency range of protonated carboxylic acids orin the amide I range, yet the amplitude of thesebands is reduced to less than 50% of that observedin functional meta II in disk membranes. Remark-ably, only the positive band at 1709 cm21 hasabout the same intensity as the correspondingband in meta II, although being somewhat broaderand more symmetric (Figure 2A, lower spectra).Part of this positive band in the meta II differencespectra had been assigned previously to the CvOstretch vibration of Glu113, which forms thecounterion to the protonated Schiff base in thedark state and becomes protonated duringthe transition to meta II.33 This may indicate thatprotonation of Glu113, despite being a requirementfor receptor activation,58 is, in this particular case,not sufficient to pave the way to meta II.
Two properties of this intermediate state seemparticularly important. First, it should not be con-sidered as a native state of the protein, i.e. a statethat reflects intrinsic properties of the protein inthe disk membrane, as the known photointer-mediates of rhodopsin do. It rather represents anartificial state that is formed solely due to thelimitations exerted by the crystalline environmenton the conformational freedom of the receptor.Second, it cannot result from a merely shiftedequilibrium between meta I and meta II, such that
contributions of meta II marker bands to theobtained IR difference spectrum arise from a rela-tively small occupancy of the meta II state underthe given conditions in the 2D crystals. If this wasthe case, we would expect the photoproduct to beactive towards transducin, to a degree correspond-ing to the amount of meta II that should be presentto generate the observed difference spectrum. Thiscan be clearly excluded, however, on the basis ofthe negative transducin activation assays. Further-more, no substantial extra-meta II effect isobserved in the presence of transducin-derivedpeptides in 2D crystals, despite the fact that bind-ing of these peptides is not inhibited. Such an effectwould, however, be expected in the case of a metaI/meta II conformational equilibrium.
In addition to the importance for structuralstudies, our results have relevance for theactivation mechanism. The helix re-arrangement,which is known to be required for the transition tothe active receptor species, seems to involve onlya relatively small free energy gain, which is notsufficient to induce the required structural changesin the immediate environment within the crystal-line matrix or to break the lattice order of thecrystal. This may indicate that the expected move-ment of helix 6 suggested by studies performedwith a variety of structurally sensitive methods(see Meng & Bourne53 and references therein)should be considered as a release of interhelicalconstraints rather than an active pushing.
Is the inhibition of receptor activation in 2Dcrystals a direct consequence of the crystal latticeand the defined contacts between protein andlipid arising from it? A recent electron microscopestudy on the same rhodopsin p22121 2D crystalsindicates close contacts between helices 4 and 6 ofneighboring molecules,7 which might hint at adirect involvement of the crystalline order and ofthe resulting defined helix–helix contacts. On theother hand, we observe a quite identical inhibitionafter reconstitution of delipidated rhodopsin intothe rigid environment of DSPC bilayers in the gelphase. Rhodopsin activation is known to dependon the presence of lipids with highly unsaturatedfatty acid chains, which seem to form a fluid beltaround the receptor molecule, as suggested byrecent molecular dynamics simulations.59 Such asolvation of the receptor is not given in a DSPCbilayer with fully saturated long acyl chains nor inthe generally lipid-poor 2D crystals. The slightinhibitory effect of cholesterol in the 2D crystalsfurther supports this notion that it is not thecrystalline property of the 2D crystals alone butrather the rigidity of the immediate receptorenvironment, including the lipids, that preventsreceptor activation. These results emphasize theimportance of the interplay between protein con-formational equilibria and environmentalconditions.
Binding and activation of transducin to theactivated receptor is known to involve at least tworecognitions sites on the a and the g-subunits of
Rhodopsin Photoproducts in 2D Crystals 605

the G protein.60 Synthetic peptides correspondingto these recognition sites are known to interactwith the receptor and to stabilize its active-stateconformation.44,61 It was shown by FTIRspectroscopy that a large part of the inducedvibrational pattern in the complex between the acti-vated receptor and full-length transducin can beobserved already in the complex with the shortpeptides.45–47 The peptide-induced changesobserved in the IR difference spectra likely reflect, tosome extent, conformational changes within the pep-tide in the complex with active meta II observedrecently by transferred nuclear Overhauser effectNMR spectroscopy.48,62 Our observation that thelow-pH, room-temperature photoproduct in 2Dcrystals is capable of interacting with the transdu-cin-derived peptides, but is completely inactivetowards transducin itself, is interesting and may beof more general relevance. It could suggest that theinteraction of an activated receptor with its G proteinconsists of a sequence of at least two events: the firstevent involves binding and induced conformationalchange of at least one of the recognition sites on theG protein, giving rise to the IR signature of the recep-tor–peptide complex. This interaction seems to beless pronounced, if the conformation of the receptoris closer to that of meta I, yet it does not require thefull structural re-arrangement of the receptor thatoccurs during formation of active meta II. This fullhelix re-arrangement is required only in the secondstep, which catalyzes the structural changes withinthe G protein, leading to nucleotide exchange in theG protein’s nucleotide-binding pocket and therebyto its activation.
Our studies have revealed that the environmentof rhodopsin in 2D crystals does not allow for fullactivation of the photoreceptor. Instead, the helixre-arrangement required for the transition to activemeta II is inhibited and the sequence of photo-intermediates is blocked somewhere between metaI and meta II. Does this restriction imposed by therigid environment also affect the earlier, inactiveintermediates? Both batho and lumi, which weretrapped at 2183 8C and 293 8C in the 2D crystals,were very similar to their counterparts formed innative disk membranes. Also, the transition tempera-ture between both intermediates was found not to beaffected by the changed environment. Such an inter-ference is observed only during the transition fromlumi to meta I, where the transition temperature isincreased in 2D crystals from 240 8C to above220 8C. This influence of the environment on therelaxation of the protein shows that the lumi to metaI transition of rhodopsin must involve small struc-tural changes that couple to the matrix surroundingthe protein. Such changes could involve slight helixdeformations, which, however, should be muchsmaller than those involved in the activation stepleading to meta II. Meta I itself does not show aunique FTIR spectrum. Instead, the intensities ofmeta I marker bands vary with temperature.Within the limits imposed by this intrinsic vari-ability of meta I marker bands, the meta I spectra
obtained from the 2D crystals are very similar tothose obtained from disk membranes. Therefore,irrespective of the 20–30 K upshift of the transitiontemperature, the resulting meta I state in 2Dcrystals corresponds to that observed in nativedisk membranes, as judged from the FTIR spectra.The inactive intermediates, which can be trappedin the 2D crystals at cryogenic temperatures in thecase of batho and lumi or by lowered room tem-perature and/or alkaline pH in the case of meta I,seem to reflect faithfully the conformation of therespective states in native disk membranes. The2D crystals are therefore very well suited to deter-mine the structure of these intermediates by meansof electron crystallography and to broaden ourunderstanding of signal transduction in rhodopsinas well as other G protein-coupled receptors.
Materials and Methods
Isolation, purification, and crystallizationof rhodopsin
For crystallization, rhodopsin was isolated frombovine rod outer segments, purified in lauryldimethyl-amine oxide by concanavalin A affinity chromatography,and crystallized according to established proceduresresulting in 2D p22121 crystals.9 To improve the yieldand the quality of crystalline material, a modified proto-col was used for crystallization that included thereconstitution of rhodopsin in the presence of additionalcholesterol.39 In some preparations, called w/ocholesterol, no exogenous cholesterol was added priorto crystallization (although there may be a small amountof endogenous cholesterol present in the 2D crystals thatwas not stripped off during the purification step indetergent). The 2D crystals were stored at 4 8C in dialysisbuffer containing 20 mM Hepes, 100 mM NaCl, 10 mMMgCl2, 3 mM NaN3, 4 mM mercaptoethanol, 4 mM DTT,2.5% (v/v) isopropanol, adjusted to pH 7. All manipula-tions were performed under dim red light to avoidbleaching of the pigment.
Rhodopsin in washed disk membranes was preparedaccording to established procedures.63 For pigmentreconstitution in lipid bilayers of defined composition,rhodopsin was purified on concanavilin A in 1.2%(w/v) n-octyl b-D-glucoside (b-OG)64 and mixed withthe respective lipid (Sygena, Liestal, Switzerland), dis-solved in 1.2% b-OG, at a molar ratio of 1 : 200. Aftershort sonication and incubation for two hours on ice,this mixture (10 nmol of rhodopsin in a total volume of100–400 ml) was dialyzed over a period of at least36 hours against a volume of 40 ml of 1 mM phosphatebuffer (pH 6.5), at 4 8C in a micro-flow-through systemusing microdialyzer units with a 7 kDa cutoff (PierceBiotechnology, Rockford, IL, USA) and a buffer flow-rate of 150 ml/hour. After dialysis, samples werepelleted and stored at 280 8C.
FTIR spectroscopy
FTIR spectroscopy was performed with a Bruker IFS28 spectrometer equipped with a mercury–cadmium-telluride detector. The 2D crystals were transferred fromdialysis buffer to 1 mM sodium phosphate buffer(pH 6.5), by centrifugation prior to sample preparation.
606 Rhodopsin Photoproducts in 2D Crystals
We prepared sandwich samples from 0.5 nmol to1.0 nmol of pigment in either 2D crystals, disk mem-branes, or defined lipid membranes as described.15,65 Asbuffers, we used 20 ml of 200 mM sodium citrate, Mes(2-N-morpholinoethanesulfonic acid), or BTP (Bis-Tris–propane) buffer, in overlapping ranges, containing200 mM NaCl. As a control, we checked that the sand-wich samples of 2D crystals show the same room-temperature photochemistry in the UV–visible range assuspensions of 2D crystals.
The IR spectra were recorded in blocks of 512 scanswith a spectral resolution of 4 cm21 (acquisition time ofone minute) and corrected for temporal baseline drifts.To initiate the photoreaction, samples were photolyzedfor 30 seconds with light from a 150 W tungsten lampfitted to fiber optics. We generally used a .530 nmlong-pass filter for illumination, except for the bathoand the lumi intermediates, which were obtained byillumination with light between 455 nm and 500 nm andbetween 435 nm and 480 nm, respectively, to allow foran efficient formation of the respective purephotoproduct.66 Batho and lumi photointermediateswere trapped at cryogenic temperatures in a custom-made, continuous-flow cryostat cooled by liquidnitrogen to the desired temperature. FTIR spectra weregenerally normalized using the 1238 cm21 band ofrhodopsin.
UV–visible spectroscopy
For UV–visible spectroscopy, sandwich samplesidentical with the infrared samples were used in aPerkin–Elmer Lambda 17 double-beam spectro-photometer equipped with a temperature-controlledsample holder. Illumination was similar to the IRexperiments.
Transducin activation assay
Transducin was isolated from illuminated, osmoticallyshocked rod outer segments from bovine retinae andpurified by hexylagarose chromatography essentially asdescribed.67,68 Purified transducin was dialyzed against10 mM sodium phosphate (pH 7.0), 150 mM NaCl,2 mM MgCl2, 1 mM DTT, 0.1 mM phenylmethylsulfonylfluoride, 50% (w/v) glycerol, and stored at 220 8C.Transducin activation was assayed by monitoring itsintrinsic tryptophan fluorescence changes upon nucleo-tide exchange40 in a custom-made instrument withexcitation by a deuterium lamp and a 290–310 nmband-pass filter. Fluorescence was detected in 908geometry from a 1 ml thermostatically controlled fluor-escence cuvette under continuous stirring through a.340 nm long-pass filter by a photo multiplier insingle-photon counting mode. The assay was performedat 20 8C in 900 ml of 20 mM citric acid buffer (pH 5.0) orMes (pH 6.0 and pH 7.0), 150 mM NaCl, and 2 mMMgCl2 with 400 nM transducin and catalytic amounts ofpigment. The pigment was photolyzed (.530 nm long-pass filter) and, after having recorded a fluorescencebaseline for 100 seconds, nucleotide exchange wasstarted by the addition of 50 ml of non-hydrolysableGTPgS to a final concentration of 10 mM. The fluor-escence traces were corrected for background intensityof the system and the dilution effect and then normal-ized to the initial fluorescence intensity.
The relative activity was calculated from the slope ofthe fluorescence increase at time zero divided by that
obtained with rhodopsin in disk membranes at a givenconcentration of pigment. This was achieved by fittingthe intensity of the fluorescence traces to the model func-tion IðtÞ ¼ I0 2 ID expð2t=tÞ to yield the parameters IDand t. The slope at time zero was determined by formingthe first derivative, yielding d=dtIðtÞlt¼0 ¼ ID=t: In thecase of a slow fluorescence response, a linear fit wasused instead. In addition, the slope of the baseline priorto addition of GTPgS was determined and accountedfor by adding a corresponding linear term to the modelfunction in the fitting procedure. This term, however,was found to be very small throughout.
FTIR experiments with transducin-derived peptides
Peptides were added in a 20-fold excess to the pig-ment suspensions prior to sample preparation. We useda high-affinity analog to the C terminus of the transducina-subunit (acetyl-VLEDLKSCGLF).42
Acknowledgements
We thank S. Ludeke for helpful discussion, andB. Mayer, W. Sevenich, W. D. Schielin, P. Merkt,and K. Zander for technical assistance. Part ofthis work was supported by grants from the DFG(Si 278/16-3,4 to F.S. and R.V.) and Fonds derChemischen Industrie (to F.S.), by an HFSP grant(RGP 0054/2002) and an MRC PredoctoralFellowship (to J.R.).
References
1. Menon, S. T., Han, M. & Sakmar, T. P. (2001).Rhodopsin: structural basis of molecular physiology.Physiol. Rev. 81, 1659–1688.
2. Okada, T., Ernst, O. P., Palczewski, K. & Hofmann,K. P. (2001). Activation of rhodopsin: new insightsfrom structural and biochemical studies. TrendsBiochem. Sci. 26, 318–324.
3. Palczewski, K., Kumasaka, T., Hori, T., Behnke, C. A.,Motoshima, H., Fox, B. A. et al. (2000). Crystalstructure of rhodopsin: a G protein-coupled receptor.Science, 289, 739–745.
4. Okada, T., Fujiyoshi, Y., Silow, M., Navarro, J.,Landau, E. M. & Shichida, Y. (2002). Functional roleof internal water molecules in rhodopsin revealedby X-ray crystallography. Proc. Natl Acad. Sci. USA,99, 5982–5987.
5. Baldwin, J. M. (1993). The probable arrangement ofthe helices in G protein-coupled receptors. EMBO J.12, 1693–1703.
6. Schertler, G. F. X., Villa, C. & Henderson, R. (1993).Projection structure of rhodopsin. Nature, 262,770–772.
7. Krebs, A., Edwards, P. C., Villa, C., Li, J. & Schertler,G. F. (2003). The three-dimensional structure ofbovine rhodopsin determined by electron cryo-microscopy. J. Biol. Chem. 278, 50217–50225.
8. Unger, V. M., Hargrave, P. A., Baldwin, J. M. &Schertler, G. F. X. (1997). Arrangement of rhodopsintransmembrane a-helices. Nature, 389, 203–206.
9. Krebs, A., Villa, C., Edwards, P. C. & Schertler, G. F.(1998). Characterisation of an improved two-dimensional
Rhodopsin Photoproducts in 2D Crystals 607
P22121 crystal from bovine rhodopsin. J. Mol. Biol.282, 991–1003.
10. Lanyi, J. K. & Luecke, H. (2001). Bacteriorhodopsin.Curr. Opin. Struct. Biol. 11, 415–419.
11. Kuhlbrandt, W. (2000). Bacteriorhodopsin—themovie. Nature, 406, 569–570.
12. Okada, T., Le Trong, I., Fox, B. A., Behnke, C. A.,Stenkamp, R. E. & Palczewski, K. X-R. (2000). X-raydiffraction analysis of three-dimensional crystals ofbovine rhodopsin obtained from mixed micelles.J. Struct. Biol. 130, 73–80.
13. Lewis, J. W. & Kliger, D. S. (2000). Absorption spec-troscopy in studies of visual pigments: spectral andkinetic characterization of intermediates. MethodsEnzymol. 315, 164–178.
14. Siebert, F. (1995). Application of FTIR spectroscopyto the investigation of dark structures and photo-reactions of visual pigments. Israel. J. Chem. 35,309–323.
15. Vogel, R. & Siebert, F. (2003). New insights from FTIRspectroscopy into molecular properties and acti-vation mechanisms of the visual pigment rhodopsin.Biospectroscopy, 72, 133–148.
16. Pan, D. & Mathies, R. A. (2001). Chromophorestructure in Lumirhodopsin and Metarhodopsin Iby time-resolved resonance Raman microchipspectroscopy. Biochemistry, 40, 7929–7936.
17. Hubbell, W. L., Cafiso, D. S. & Altenbach, C. (2000).Identifying conformational changes with site-directed spin labeling. Nature Struct. Biol. 7, 735–739.
18. Farahbakhsh, Z. T., Hideg, K. & Hubbell, W. L.(1993). Photoactivated conformational changes inrhodopsin: a time-resolved spin label study. Science,262, 1416–1419.
19. Farrens, D. L., Altenbach, C., Yang, K., Hubbell, W. L.& Khorana, H. G. (1996). Requirement of rigid-bodymotion of transmembrane helices for light activationof rhodopsin. Science, 274, 768–770.
20. Sheikh, S. P., Zvyaga, T. A., Lichtarge, O., Sakmar,T. P. & Bourne, H. R. (1996). Rhodopsin activationblocked by metal-ion-binding sites linking trans-membrane helices C and F. Nature, 383, 347–350.
21. Yu, H., Kono, M. & Oprian, D. D. (1999). State-dependent disulfide cross-linking in rhodopsin.Biochemistry, 38, 12028–12032.
22. Vogel, R. & Siebert, F. (2000). Vibrationalspectroscopy as a tool for probing protein function.Curr. Opin. Chem. Biol. 4, 518–523.
23. Hofmann, K. P. (1986). Photoproducts of rhodopsinin the disc membrane. Photobiochem. Photobiophys.13, 309–327.
24. Shichida, Y. & Imai, H. (1998). Visual pigment:G-protein-coupled receptor for light signals. Cell.Mol. Life Sci. 54, 1299–1315.
25. Matthews, R. G., Hubbard, R., Brown, P. K. & Wald,G. (1963). Tautomeric forms of metarhodopsin.J. Gen. Physiol. 47, 215–240.
26. Parkes, J. H. & Liebman, P. A. (1984). Temperatureand pH dependence of the metarhodopsinI–metarhodopsin II kinetics and equilibria in bovinerod disk membrane suspensions. Biochemistry, 23,5054–5061.
27. Lamola, A. A., Yamane, T. & Zipp, A. (1974). Effectsof detergents and high pressures upon themetarhodopsin I–metarhodopsin II equilibrium.Biochemistry, 13, 738–745.
28. Attwood, P. V. & Gutfreund, H. (1980). Theapplication of pressure relaxation to the study of the
equilibrium between metarhodopsin I and II frombovine retinas. FEBS Letters, 119, 323–326.
29. Konig, B., Welte, W. & Hofmann, K. P. (1989). Photo-activation of rhodopsin and interaction with trans-ducin in detergent micelles. Effect of ’doping’ withsteroid molecules. FEBS Letters, 257, 163–166.
30. Niu, S. L., Mitchell, D. C. & Litman, B. J. (2002).Manipulation of cholesterol levels in rod diskmembranes by methyl-beta-cyclodextrin: effects onreceptor activation. J. Biol. Chem. 277, 20139–20145.
31. Botelho, A. V., Gibson, N. J., Thurmond, R. L., Wang,Y. & Brown, M. F. (2002). Conformational energeticsof rhodopsin modulated by nonlamellar-forminglipids. Biochemistry, 41, 6354–6368.
32. Fahmy, K., Jager, F., Beck, M., Zvyaga, T. A., Sakmar,T. P. & Siebert, F. (1993). Protonation states ofmembrane-embedded carboxylic acid groups inrhodopsin and metarhodopsin II: a Fourier-trans-form infrared spectroscopy study of site-directedmutants. Proc. Natl Acad. Sci. USA, 90, 10206–10210.
33. Jager, F., Fahmy, K., Sakmar, T. P. & Siebert, F. (1994).Identification of glutamic acid 113 as the Schiff baseproton acceptor in the metarhodopsin II photo-intermediate of rhodopsin. Biochemistry, 33,10878–10882.
34. Rath, P., DeCaluwe, L. L., Bovee-Geurts, P. H.,DeGrip, W. J. & Rothschild, K. J. (1993). Fouriertransform infrared difference spectroscopy ofrhodopsin mutants: light activation of rhodopsincauses hydrogen-bonding change in residue asparticacid-83 during meta II formation. Biochemistry, 32,10277–10282.
35. Vogel, R., Fan, G. B., Siebert, F. & Sheves, M. (2001).Anions stabilize a metarhodopsin II-like photo-product with a protonated Schiff base. Biochemistry,40, 13342–13352.
36. Yan, E. C., Kazmi, M. A., Ganim, Z., Hou, J. M., Pan,D., Chang, B. S. et al. (2003). Retinal counterionswitch in the photoactivation of the G protein-coupled receptor rhodopsin. Proc. Natl Acad. Sci.USA. In the press.
37. Beck, M., Sakmar, T. P. & Siebert, F. (1998). Spectro-scopic evidence for interaction between trans-membrane helices 3 and 5 in rhodopsin.Biochemistry, 37, 7630–7639.
38. Thorgeirsson, T. E., Lewis, J. W., Wallace-Williams,S. E. & Kliger, D. S. (1993). Effects of temperature onrhodopsin photointermediates from lumirhodopsinto metarhodopsin II. Biochemistry, 32, 13861–13872.
39. Mielke, T., Villa, C., Edwards, P. C., Schertler, G. F. &Heyn, M. P. (2002). X-ray diffraction of heavy-atomlabelled two-dimensional crystals of rhodopsinidentifies the position of cysteine 140 in helix 3 andcysteine 316 in helix 8. J. Mol. Biol. 316, 693–709.
40. Phillips, W. J. & Cerione, R. A. (1988). The intrinsicfluorescence of the alpha subunit of transducin.Measurement of receptor-dependent guanine nucleo-tide exchange. J. Biol. Chem. 263, 15498–15505.
41. Cohen, G. B., Oprian, D. D. & Robinson, P. R. (1992).Mechanism of activation and inactivation of opsin:role of Glu113 and Lys296. Biochemistry, 31,12592–12601.
42. Martin, E. L., Rens-Domiano, S., Schatz, P. J. &Hamm, H. E. (1996). Potent peptide analogues of aG protein receptor-binding region obtained with acombinatorial library. J. Biol. Chem. 271, 361–366.
43. Emeis, D., Kuhn, H., Reichert, J. & Hofmann, K. P.(1982). Complex formation between MetarhodopsinII and GTP-binding protein in bovine photoreceptor
608 Rhodopsin Photoproducts in 2D Crystals

membranes leads to a shift of the photoproductequilibrium. FEBS Letters, 143, 29–34.
44. Hamm, H. E., Deretic, D., Arendt, A., Hargrave, P. A.,Konig, B. & Hofmann, K. P. (1988). Site of G proteinbinding to rhodopsin mapped with synthethicpeptides from the a subunit. Science, 241, 832–835.
45. Fahmy, K. (1998). Binding of transducin and trans-ducin-derived peptides to rhodopsin studied byattenuated total reflection-Fourier transform infrareddifference spectroscopy. Biophys. J. 75, 1306–1318.
46. Nishimura, S., Kandori, H. & Maeda, A. (1998). Inter-action between photoactivated rhodopsin and theC-terminal peptide of transducin alpha-subunitstudied by FTIR spectroscopy. Biochemistry, 37,15816–15824.
47. Bartl, F. J., Ritter, E. & Hofmann, K. P. (2000). FTIRspectroscopy of complexes formed betweenMetarhodopsin II and C-terminal peptides from theG-protein a and g subunits. FEBS Letters, 473,259–264.
48. Kisselev, O. G., Kao, J., Ponder, J. W., Fann, Y. C.,Gautam, N. & Marshall, G. R. (1998). Light-activatedrhodopsin induces structural binding motif in Gprotein alpha subunit. Proc. Natl Acad. Sci. USA, 95,4270–4275.
49. Blume, A. (1983). Apparent molar hear capacities ofphospholipids in aqueous dispersion. effects ofchain length and head group structure. Biochemistry,22, 5436–5442.
50. Vogel, R. & Siebert, F. (2002). Conformation andstability of a-helical membrane proteins. 2. Influenceof pH and salts on stability and unfolding ofrhodopsin. Biochemistry, 41, 3536–3545.
51. Chen, Y. S. & Hubbell, W. L. (1973). Temperature-and light-dependent structural changes inrhodopsin-lipid membranes. Expt. Eye Res. 17,517–532.
52. Okada, T. & Palczewski, K. (2001). Crystal structureof rhodopsin: implications for vision and beyond.Curr. Opin. Struct. Biol. 11, 420–426.
53. Meng, E. C. & Bourne, H. R. (2001). Receptor acti-vation: what does the rhodopsin structure tell us?Trends Pharmacol. Sci. 22, 587–593.
54. Struthers, M., Yu, H. & Oprian, D. D. (2000). G pro-tein-coupled receptor activation: analysis of a highlyconstrained, “straitjacketed” rhodopsin. Biochemistry,39, 7938–7942.
55. Mielke, T., Alexiev, U., Glasel, M., Otto, H. & Heyn,M. P. (2002). Light-induced changes in the structure
and accessibility of the cytoplasmic loops ofrhodopsin in the activated MII state. Biochemistry,41, 7875–7884.
56. Abdulaev, N. G. & Ridge, K. D. (1998). Light-inducedexposure of the cytoplasmic end of transmembranehelix seven in rhodopsin. Proc. Natl Acad. Sci. USA,95, 12854–12859.
57. Dunham, T. D. & Farrens, D. L. (1999). Confor-mational changes in rhodopsin. Movement of helix fdetected by site-specific chemical labeling and fluor-escence spectroscopy. J. Biol. Chem. 274, 1683–1690.
58. Fahmy, K., Siebert, F. & Sakmar, T. P. (1995). Photo-activated state of rhodopsin and how it can form.Biophys. Chem. 56, 171–181.
59. Feller, S. E., Gawrisch, K. & Woolf, T. B. (2003).Rhodopsin exhibits a preference for solvation bypolyunsaturated docosohexaenoic acid. J. Am. Chem.Soc. 125, 4434–4435.
60. Kisselev, O. G., Meyer, C. K., Heck, M., Ernst, O. P. &Hofmann, K. P. (1999). Signal transfer fromrhodopsin to the G-protein: evidence for a two- sitesequential fit mechanism. Proc. Natl Acad. Sci. USA,96, 4898–4903.
61. Kisselev, O. G., Ermolaeva, M. V. & Gautam, N.(1994). A farnesylated domain in the G proteingamma subunit is a specific determinant of receptorcoupling. J. Biol. Chem. 269, 21399–21402.
62. Kisselev, O. G. & Downs, M. A. (2003). Rhodopsincontrols a conformational switch on the transducing subunit. Structure, 11, 367–373.
63. Papermaster, D. S. (1982). Preparation of retinal rodouter segments. Methods Enzymol. 81, 48–52.
64. DeGrip, W. J. (1982). Purification of bovinerhodopsin over cancanavalin A-Sepharose. MethodsEnzymol. 81, 197–207.
65. Vogel, R. & Siebert, F. (2001). Conformations of theactive and inactive states of opsin. J. Biol. Chem. 276,38487–38493.
66. Ganter, U. M., Gartner, W. & Siebert, F. (1988).Rhodopsin-lumirhodopsin phototransition of bovinerhodopsin investigated by Fourier transform infrareddifference spectroscopy. Biochemistry, 27, 7480–7488.
67. Kuhn, H. (1980). Light- and GTP-regulated inter-action of GTPase and other proteins with bovinephotoreceptor membranes. Nature, 283, 587–589.
68. Fung, B. K. K., Hurley, J. B. & Stryer, L. (1981). Flowof information in the light-triggered cyclic nucleotidecascade of vision. Proc. Natl Acad. Sci. USA, 78,152–156.
Edited by G. von Heijne
(Received 13 January 2004; received in revised form 1 March 2004; accepted 4 March 2004)
Rhodopsin Photoproducts in 2D Crystals 609
Related Documents