RHODES - ITMS TEMPE FIELD TEST PROJECT: Implementation and Field Testing Of RHODES, A Real-Time Traffic Adaptive Control System Final Report 447 Prepared by: Pitu B. Mirchandani David E. Lucas ATLAS Research Center Systems & Industrial Engineering Department The University of Arizona Tucson, Arizona 85721 September 2001 Prepared for: Arizona Department of Transportation 206 S. 17 th Avenue Phoenix Arizona 85007 in cooperation with U.S. Department of Transportation Federal Highway Administration

Welcome message from author
This document is posted to help you gain knowledge. Please leave a comment to let me know what you think about it! Share it to your friends and learn new things together.
Transcript

RHODES - ITMS TEMPE FIELD TEST PROJECT:
Implementation and Field Testing Of RHODES, A Real-Time Traffic Adaptive Control System
Final Report 447 Prepared by: Pitu B. Mirchandani David E. Lucas ATLAS Research Center Systems & Industrial Engineering Department The University of Arizona Tucson, Arizona 85721
September 2001 Prepared for: Arizona Department of Transportation 206 S. 17th Avenue Phoenix Arizona 85007 in cooperation with U.S. Department of Transportation Federal Highway Administration

Technical Report Documentation Page
1. Report No. FHWA-AZ01-447
2. Government Accession No.
3. Recipient's Catalog No.
4. Title and Subtitle
RHODES-ITMS TEMPE FIELD TEST PROJECT: 5. Report Date September 2001
Implementation And Field Testing Of RHODES, A Real-Time Traffic Adaptive Control System
6. Performing Organization Code
7. Author
Pitu B. Mirchandani and David E. Lucas
8. Performing Organization Report No.
9. Performing Organization Name and Address:
ATLAS Research Center Systems & Industrial Engineering Department The University of Arizona Tucson, Arizona 85721
10. Work Unit No.
11. Contract or Grant No. JPA 94-109 / SPR-PL-1(49)-447
12. Sponsoring Agency Name And Address: Arizona Department Of Transportation 206 S. 17th Avenue
13.Type of Report & Period Covered Final Report 7/98-9/01
Phoenix, Arizona 85007 14. Sponsoring Agency Code
15. Supplementary Notes
Prepared in cooperation with the U.S. Department of Transportation, Federal Highway Administration
16. Abstract RHODES is a traffic-adaptive signal control system that optimally controls the traffic that is observed in real time. The RHODES-ITMS Program is the application of the RHODES strategy for the two intersections of a freeway-arterial diamond interchange. This report addresses the latest phase of the RHODES-ITMS Program that resulted in a field-test in the City of Tempe, Arizona. In summary, this phase involved: (i) the integration of the RHODES logic within the signal controller, (ii) the validation of the RHODES logic using “hardware-in-the-loop” simulation, (iii) the integration of the RHODES algorithms within Tempe’s traffic management system, (iv) the deployment of RHODES for the field test and (v) the data gathering and evaluation of traffic performance “with” and “without” the RHODES logic. The objectives of this project were: (i) to see if a communication/computation infrastructure could be designed and implemented for second-by-second detector data collection and signal phase commands, (ii) to see if a traffic-adaptive signal control system could be implemented on an off-the-shelf Advanced Traffic Controller, (iii) to determine whether the RHODES strategy is viable in the field, and (iv) to evaluate the traffic performance of RHODES. The answers for the first three objectives were positive: that is, the communication/computation infrastructure was designed and implemented, and RHODES control strategy was integrated within the infrastructure and proved to be viable. With regard to the fourth objective, RHODES was able to match the performance of the current well-tuned semi-actuated control being used by the City of Tempe. The major contributions of the RHODES-ITMS Program can be categorized into the development and implementation (i) of new integrated hardware/software infrastructure that includes a new communication system, and (ii) of a traffic-adaptive signal control system. The infrastructure (i) integrates traffic-adaptive features within the 2070 Advanced Traffic Controllers, (ii) deploys, for the first time, a 2070 Controller within a TS2 cabinet, and (iii) implements a communication system for second-by-second decision making. The traffic-adaptive system has the following attributes and benefits: (i) it is second-by-second responsive, (ii) it has a hierarchical and distributed modular architecture that allows additional traffic control features, and (iii) it requires low maintenance of timing plans by traffic engineers. Last, but not least, the effort has extended the cutting edge in systems engineering methodology for the design of real-time decision-making systems and has expanded the workforce in traffic systems engineering by graduating several students through this research effort.
17. Key Words
RHODES, Real-time Traffic Adaptive Signal Control, 2070 Advanced Traffic Controller, Interchange Traffic Control
18. Distribution Statement Document is available to the U.S. Public through the National Technical Information Service, Springfield, Virginia, 22161
23. Registrant's Seal
19. Security Classification Unclassified
20. Security Classification Unclassified
21. No. of Pages 97
22. Price

LIST OF ACRONYMS
ABOR Arizona Board of Regents ADOT Arizona Department of Transportation ADT Average Daily Traffic ATLAS Advanced Transportation, Logistics, Algorithms and Systems ATMS Advanced Traffic Management System ATRC Arizona Transportation Research Center AVL Automatic Vehicle Location BIU Bus Interface Unit CAPRI Categorized Arrival-based Phase Re-optimization at Intersection/Interchange CID Controller Interface Device CORSIM Corridor Simulator DLL Dynamic Link Library DP Dynamic Programming FHWA Federal Highway Administration LCD Liquid Crystal Display MAG Maricopa Association of Governments MIPS Millions of Instructions Per Second MMU Malfunction Management Unit MOE Measure of Effectiveness MTCS Metropolitan Traffic Control System MVP Machine Vision Processor NEMA National Electrical Manufacturers Association PAG Pima Association of Governments PC Personal Computer RHODES-ITMS Real-time Hierarchical Optimized Distributed Effective System – Integrated Traffic Management System RTMS Remote Traffic Microwave Sensor SCATS Sydney Coordinated Adaptive Traffic System SCOOT Split, Cycle, Offset Optimization Technique SDLC Synchronous Data Link Control SDRAM Synchronous Dynamic Random Access Memory TAC Technical Advisory Committee TOC Traffic Operations Center TOD Time of Day TRANSYT Traffic Network Study Tool UTCS Urban Traffic Control System VME Versa Module Eurocard

TABLE OF CONTENTS
PREFACE ......................................................................................................................... 1
1. INTRODUCTION AND PROJECT BACKGROUND ............................................. 3 1.1 Project Scope and Objectives ..................................................................................................... 3 1.2 Background and History of the Project....................................................................................... 4 1.3 Project Tasks ............................................................................................................................. 8 1.4 Project Oversight ...................................................................................................................... 11
2. RHODES TRAFFIC SYSTEM: TECHNICAL BACKGROUND......................... 12 2.1 RHODES System Architecture................................................................................................. 12 2.2 Simulation Modeling for Testing Real-Time Algorithms......................................................... 14 2.3 Prediction Algorithms in RHODES-ITMS............................................................................... 17 2.4 Optimization Algorithms in RHODES-ITMS .......................................................................... 23 2.5 Simulation Results for the Tempe Interchange......................................................................... 29
3. IMPLEMENTATION OF RHODES WITHIN 2070 CONTROLLER ................ 33 3.1 Integration of RHODES within 2070 ....................................................................................... 33 3.2 Testing RHODES/2070 with Hardware-in-the-Loop Simulation............................................. 39
4. IMPLEMENTATION OF RHODES IN THE FIELD ........................................... 41 4.1 Integration of RHODES/2070 Controller/TS2 Cabinet ............................................................ 41 4.2 Integration of RHODES within Tempe TOC ........................................................................... 45 4.3 Bench Testing of Field Test Setup............................................................................................ 47 4.4 Procedure to Turn RHODES On/Off........................................................................................ 51
5. PERFORMANCE OF TEMPE FIELD TEST ......................................................... 52 5.1 Field Data Collection ............................................................................................................... 52 5.2 Field Test Results ..................................................................................................................... 53 5.3 Further Observations on the Field Test..................................................................................... 64
6. OVERALL EVALUATION....................................................................................... 67 6.1 “Adaptive” Control and Systems Responsiveness.................................................................... 67 6.2 Traffic Performance for Recurrent Conditions ......................................................................... 69 6.3 Potential New Traffic Control Functions.................................................................................. 69 6.4 Other Benefits........................................................................................................................... 72 6.5 Costs ......................................................................................................................................... 73
7. PROJECT CONTRIBUTIONS ................................................................................. 75
8. LESSONS LEARNED AND DIRECTIONS OF FUTURE WORK ...................... 77 8.1 Lessons Learned ....................................................................................................................... 77 8.2 Directions of Future Work........................................................................................................ 79
REFERENCES................................................................................................................ 81

APPENDIX 1 TIMING AND OTHER PARAMETERS FOR US-60 & RURAL ROAD................ 83 APPENDIX 2 RHODES INSTALLATION INSTRUCTIONS........................................................... 84
APPENDIX 3 DATA COLLECTION AND DATA RELIABILITY.................................................. 88

LIST OF FIGURES
Figure 1 Map of Site ................................................................................................................................ 6 Figure 2 The interchange: control area and detectors utilized ................................................................. 8 Figure 3 The RHODES Architecture ..................................................................................................... 12 Figure 4 CORSIM Simulation Model .................................................................................................... 16 Figure 5 Actuated signal phasing with minimums and maximum green times...................................... 17 Figure 6 Basic traffic intersection showing approaches, approach volumes, movements and vehicle detectors............................................................................................. 18 Figure 7 Graphical depiction of the effect of future arrivals on scheduling phase sequences and durations ............................................................................................... 18 Figure 8 Prediction scenario based on detectors on the approaches to the upstream intersection (B) ........................................................................................................ 20 Figure 9 Delays associated with the prediction of arrivals at the detector dA......................................... 21 Figure 10 Implementation of single-variable rolling horizon approach................................................... 25 Figure 11 Sample traffic volume profile for vehicles entering the interchange ....................................... 30 Figure 12 (a) Total vehicle delay and (b) vehicle trips served using actuated control and RHODES-ITMS control strategies ................................................................................... 31 Figure 13 Average vehicle delay versus throughput (vehicles trips per hour) using actuated control and RHODES-ITMS control strategies......................................................... 32 Figure 14 Eagle 2070N Advanced Traffic Controller.............................................................................. 33 Figure 15 Rear view of the 2070 showing the VME Chassis................................................................... 34 Figure 16 MEN Card ............................................................................................................................... 36 Figure 17 Data transfer within the 2070 .................................................................................................. 37 Figure 18 Messages exchanged between NextPhase and RHODES each second.................................... 38 Figure 19 TS1 Controller Interface Device.............................................................................................. 39 Figure 20 Detector location diagram........................................................................................................ 43 Figure 21 Physical configuration of the Peer Communications Network ................................................ 46 Figure 22 RHODES Field Configuration................................................................................................. 48 Figure 23 Screen Snapshot of the RHODES Display Tool..................................................................... 50 Figure 24 Lane groups and location of queue data collection................................................................. 54 Figure 25 September 7, 2000, 7AM-10AM, Total Traffic Volumes (RHODES OFF).......................... 56 Figure 26 September 7, 2000, 11AM-2PM, Total Traffic Volumes (RHODES ON)............................ 57 Figure 27 September 7, 2000, 3PM-6PM, Total Traffic Volumes (RHODES OFF) .............................. 58 Figure 28 September 14, 2000, 7AM-10AM, Total Traffic Volumes (RHODES ON) .......................... 59 Figure 29 September 14, 2000, 11AM-2PM, Total Traffic Volumes (RHODES OFF) ......................... 60 Figure 30 September 14, 2000, 3PM-6PM, Total Traffic Volumes (RHODES ON) ............................. 61 Figure 31 Through movement delays ..................................................................................................... 63 Figure 32 Left-turn movement delays..................................................................................................... 64 Figure 33 Illustrative midterm traffic disruption..................................................................................... 68 Figure 34 Simplified illustration how bus priority may be included in RHODES.................................. 70 Figure 35 Implementation of Transit Priority within RHODES Architecture ........................................ 70 Figure 36 Implementation of Emergency Vehicle Preempt/Priority within RHODES Architecture................................................................................................. 71 Figure 37 Implementation of Railway At-grade Crossing within RHODES Architecture ..................... 72

LIST OF TABLES
Table 1 Means and variances for vehicle delays (in seconds)................................................................. 32
Table 2 Detector Mapping Between TS2/NextPhase/RHODES ............................................................. 44
Table 3 95th Percentile Queue Sizes (number of vehicles) ...................................................................... 55
Table 4 Control Delay per Vehicle (seconds) ......................................................................................... 55
Table 5 OFF scenario: 15-minute Control Delay (s/veh.) and Volumes (veh/15 min.) .......................... 62
Table 6 ON scenario: 15-minute Control Delay (s/veh.) and Volumes (veh/15 min.) ............................ 62

1
PREFACE This report documents the work performed on the RHODES-ITMS Tempe Field Test Project. The Arizona Department of Transportation (ADOT) funded this research effort. Essentially, the scope of this project was to implement in the field a method to optimally control, based on traffic observed in real time, the traffic signal operations of the two intersections of a freeway-arterial diamond interchange. The development of the architecture, algorithms, and simulation-based analysis was addressed in an earlier phase of the RHODES-ITMS Program [Head and Mirchandani, 1997]. This report addresses the latest phase of the program that resulted in the field-testing of RHODES-ITMS in Tempe, Arizona. In summary, this phase involved:
• the integration of the RHODES logic within the controller, • the validation of the RHODES logic using “hardware-in-the-loop” simulation, • the integration of the RHODES algorithms within Tempe’s traffic management system, • the deployment of RHODES for the field test, and • the data gathering and evaluation of traffic performance “with” and "without” the RHODES logic.
The major objectives of this project were:
1. to see if a communication/computation infrastructure could be designed and implemented for second-by-second detector data collection and signal phase commands,
2. to see if a traffic-adaptive signal control system can be implemented on an off-the-shelf advanced traffic controller using either the existing operating system or an external board that communicates with the operating system,
3. to see if RHODES real-time control strategy is viable in the field with the above communication/computation infrastructure plus whatever other existing traffic system hardware/software, for example the traffic control cabinets, various types of detector systems, and existing traffic management system, and,
4. to evaluate the traffic performance of the new traffic-adaptive strategy referred to as RHODES. The answers for the first three objectives were positive: that is, the communication/computation infrastructure was designed and implemented, and RHODES control strategy was integrated within the infrastructure and proved to be viable. With regard to the fourth objective, RHODES was able to match the performance of the current well-tuned semi-actuated control being used by the City of Tempe. Although the main focus of the project was to implement RHODES and measure the resultant traffic performance, the contributions of the project were of much greater dimension and extent. The major contributions were: • Second-by-Second Traffic Responsive. This was the first implementation of a traffic adaptive
control system that measures traffic variables every second and computes phase durations to be implemented for the next few minutes.
• Hierarchical and Distributed Modular Architecture. The RHODES architecture that was
implemented is both hierarchical to account for the natural time constants of obtained traffic measures, and distributed to exploit the spatial aspects of traffic activities and local processing of these measurements. Also, this architecture allows for straightforward modular expansion that can include several other traffic control functions such as transit priority and railway grade crossing preemption.
• Integration of Adaptive Features in the 2070 Controller. This is the first time that a traffic control
system was implemented that includes a second-generation UTCS with an adaptive feature which can be turned ON or OFF by a traffic engineer.
• Implementation of a 2070 within a TS2 Cabinet. This was the first time a 2070 Controller was
implemented in a TS2 cabinet. • Implementation of a communication system for second-by-second decision making. A new
engineering design was implemented where data from upstream detectors to a central traffic control system, and then to a traffic controller at the interchange, was communicated with latency of a less

2
than a second. Also, the subsequent optimal setting of signals was communicated with the latency of less than a second.
• Implementation of a system that requires low maintenance by traffic engineers. A system such as
RHODES does not require continuous manual refinement of timing plans to maintain its performance level, thereby freeing transportation staff for other tasks.
• Workforce expansion. Over the course of the project several graduate students from the University of
Arizona with significant background and experience in traffic and systems engineering have gone into the workforce, thereby considerably expanding the workforce in traffic systems engineering.
• Real-time decision-making and optimization. This project also extended the cutting edge in systems
engineering by (i) developing a system design framework for real-time decision systems and (ii) the subsequent implementation and deployment of a system that uses a client-server framework for automated real-time optimization
This report was written primarily by the principal investigator, Pitu B. Mirchandani, and by co-investigator, David E. Lucas, both of the ATLAS Research Center, Systems and Industrial Engineering Department at the University of Arizona. Also, several other individuals have contributed towards the writing and/or field implementation and data gathering. In particular, the efforts of the following individuals are acknowledged: Douglas Crawford Siemens Gardner Transportation System Inc., Tucson, AZ Jim Decker Transportation Department, City of Tempe, AZ K. Larry Head Siemens Gardner Transportation System Inc., Tucson, AZ Ken M. Howell TASK Engineering Company, Inc., Phoenix, AZ In addition, the principal investigators wish to acknowledge their appreciation to the Project’s Technical Advisory Committee (TAC) whose continual active participation, technical input and support resulted in the RHODES-ITMS results being even more relevant to traffic engineering and control. The following individuals served on the TAC at various times:
Jim Decker Traffic Operations, City of Tempe Ron Amaya Traffic Operations, City of Peoria (previously City of Tempe) Sarath Joshua Maricopa Association of Governments (previously at ATRC, ADOT) Alan Hansen Federal Highway Administration Tom Fowler Federal Highway Administration Tim Wolfe ADOT Technology Group Dan Powell ADOT District 1 Tom Parlante ADOT Traffic Engineering Glenn Jonas ADOT Freeway Management Manny Agah ADOT Freeway Management Jerry Pfiefer ADOT Freeway Management Phil Carter ADOT Freeway Management Jim Shea ADOT Freeway Management Pierre Pretorius Maricopa County Transportation and Development Agency Don Wiltshire Maricopa County Transportation and Development Agency Dave Wolfson Maricopa County Transportation and Development Agency Ben McCawley Maricopa County Transportation and Development Agency Scott Nodes Traffic Operations, City of Peoria (previously City of Phoenix) Steve Owen RHODES-ITMS Project Manager, ATRC, ADOT
The contents of this report reflect the views of the authors who are responsible for the facts and the accuracy of the data presented herein. The contents do not necessarily reflect the official views of the Arizona Department of Transportation, or the Federal Highway Administration. This report does not constitute a standard, specification or regulation.

3
1. INTRODUCTION AND PROJECT BACKGROUND 1.1 Project Scope and Objectives
Over the last ten years, a research team at the University of Arizona (UA) has been developing a real-time
traffic adaptive system referred to as RHODES (Real-time Hierarchical Optimizing Distributed Effective
System) that is based on second-by-second real-time vehicle detection and phase setting. During the period
of system development, Arizona Department of Transportation (ADOT) and Federal Highway
Administration (FHWA) have provided research funding to assist in the exploration of RHODES concepts,
the development of its algorithms, and the design and prototype development of the software system. The
previous phase of ADOT support referred to as “The RHODES-Integrated Traffic Management System
(ITMS) Project” addressed the design and development of a real-time traffic adaptive control system for
Freeway-Arterial Diamond Interchanges using the concepts underlying the RHODES traffic-adaptive
signal control system. This document reports the results of the next phase of ADOT on “Implementation
and Field testing of RHODES-ITMS” at a specific diamond interchange in Tempe, Arizona.
The traffic "controls" at a diamond interchange are the two sets of closely spaced traffic signals located at
the arterial, on both sides of the freeway, and the ramp meters at the on-ramps to the freeway. To
efficiently manage all the traffic at the interchange, the control system must do both, in real time, set the
phase durations of the intersection traffic signals and control the ramp-metering rates, taking into account
local traffic objectives as well as network-wide objectives. However, the scope of RHODES-ITMS Project
was to develop a method to optimize only the interchange traffic signal operations, for only the traffic that
passes through the two intersections of the interchange, either entering or exiting the freeway or
progressing along the arterial, with ramp-metering rates given externally. Nevertheless, it is necessary to
have information about the queues at the on-ramps in order to effectively manage all the vehicles that use
the arterials, the frontage roads parallel to the freeway (if they exist) and the ramps at the interchange.
There are two reasons for not adjusting the ramp-metering rates locally: (1) current practice is that the state
traffic agency (e.g., ADOT in Arizona) sets these rates directly, with consideration of region-wide freeway
flow management objectives, and (2) ideally, ramp-metering rates should consider first area-wide traffic
management objectives and then, only secondarily, consider the local flows at the interchange. (In fact, in
a complementary project “RHODES-ITMS Ramp Metering Field Test” [Ciarallo and Mirchandani, 1998],
ADOT is exploring methods to adaptively set ramp metering rates in real time.)
The development of the RHODES-ITMS architecture, algorithms, and simulation-based analysis was
addressed in an earlier phase of the project [Head and Mirchandani, 1997]. This report addresses the latest

4
phase of the project that resulted in the field-testing of RHODES-ITMS in Tempe, Arizona. In summary,
this phase involved:
1. the integration of the RHODES logic within the controller,
2. the validation of the RHODES logic using “hardware-in-the-loop” simulation,
3. the integration of the RHODES algorithms within Tempe’s traffic management system,
4. the deployment of RHODES for the field test, and
5. the data gathering and evaluation of traffic performance “with” and "without” the RHODES logic.
These were all accomplished as planned, except that the implemented RHODES system was a version that
did not include the consideration of queues at the on-ramps because the component to get vehicle
detections and the associated communication subsystem to send these detections to the RHODES controller
was not available to the research team during the field test.
The major objectives of this phase were:
1. to see if a communication/computation infrastructure can be designed and implemented for
second-by-second detector data collection and signal phase commands,
2. to see if a traffic-adaptive signal control system can be implemented on an off-the-shelf advanced
traffic controller using either the existing operating system or an external board that communicates
with the operating system,
3. to see if RHODES real-time control strategy is viable in the field that has the above
communication/computation infrastructure plus whatever other existing traffic system
hardware/software, for example the traffic control cabinets, various types of detector systems, and
existing traffic management system, and,
4. to evaluate the traffic performance of the new traffic-adaptive strategy referred to as RHODES.
The above objectives seek new research results and boundaries in traffic management systems and, if
successful, the project will contribute significantly to traffic engineering and science.
1.2 Background and History of the Project
In June 1991, the Arizona Department of Transportation, working closely with the City of Tucson and the
Pima Association of Governments (PAG), supported the initial R&D efforts on the development of the
RHODES surface street traffic control system within the Department of Systems and Industrial Engineering
at the University of Arizona [Mirchandani and Head, 1994; Head and Mirchandani, 1994].
In December 1993, ADOT (from SP&R funds) and Maricopa Association of Governments (MAG) jointly
funded the project entitled "Real-Time Traffic Adaptive Control for Integrated Traffic Management of the
I-17 Corridor" and referred to as the "RHODES-ITMS Project" for short. The scope of the project was to

5
develop an improved traffic control strategy for a freeway-arterial diamond interchange using RHODES
concepts, for a possible field testing at a site on Interstate 17 in Maricopa County. The activities and the
findings of that project are documented in the final report [Head and Mirchandani, 1997].
In June 1994, FHWA initiated a project with the RHODES Team (with JHK & Associates as
subcontractors) to develop a working prototype of the RHODES strategy, implementing only the last two
levels of the hierarchy - intersection and network flow control, which was to be laboratory tested by a third
party contractor. Since the RHODES system requires some innovative communication approaches and on-
line algorithmic computations, FHWA awarded a follow-up contract entitled “An Open Systems
Communication/Control Architecture for Real-Time Traffic Adaptive Signal Control” in September 1997,
which included the implementation of RHODES on an arterial corridor in Tucson.
In July 1998, based on the results from the RHODES-ITMS Project, and due to the special requirements
for communication and on-line computations needed for RHODES, ADOT initiated another project to field
test the RHODES-ITMS system developed in the 1993-97 project. This project was referred to as the
“RHODES-ITMS Tempe Field Test Project” and this document is the final report for that project. The
freeway-arterial diamond interchange at US60 and Rural Road, in the City of Tempe, was selected over a
site on I-17 because of several factors including:
• This interchange has functioning ramp meters,
• This interchange was highly detectorized, needing only a few more detectors for RHODES,
• Because of another major ITS Project (AzTech) that included Rural Road, second-by-second
detection from upstream intersections was implementable,
• Tempe’s Transportation Department staff assured the research team that the Computran system
that operates Tempe’s traffic signals was flexible enough for it to be modified so that data from
upstream detectors could be communicated to the RHODES algorithms, and
• Above all, Mr. Jim Decker and other staff in Tempe’s Transportation Department were champions
for the RHODES-ITMS field test project and had volunteered to be dedicated partners in this
endeavor.
The Rural Road test site is one of the busiest diamond interchanges in the Phoenix metropolitan area (see
Figure 1). It carries 51,000 average daily traffic (ADT) north of U.S. 60, and 56,000 ADT south of U.S.
60, according to the City of Tempe Traffic Counts Map.

6
Scale: 5 km Scale 900 ft
Figure 1 - Map of Site (Source: www.mapquest.com, July 28,2001)
Rural Road has three lanes in each direction at this location. Each ramp terminal is signalized, and a single
controller operates both signals. The controller normally runs a time-based semi-actuated and coordinated
signal control plan.
Each off ramp has separate right and left turn lanes and middle shared left-right turn lane. There are dual
left turn lanes on Rural Road between the ramp terminals, which can store queues of about 16 vehicles.
Left turn lane storage capacity extends to the north and south along Rural Road, far enough that left turn
bay overflow conditions were not observed during the test.
Upstream signals in the north are on the intersection of Rural and Southern Avenue and in the south at
Rural and a minor street serving the Embassy Suites Hotel. The Southern Avenue signal is located about
one-half mile north (about 30-40 seconds at free-flow speed). The Embassy Suites signal is located about
600 feet south (about 8-10 seconds south) of the eastbound on-ramp. The on-ramps are metered during
AM and PM peak hour conditions. Separate controllers under ADOT jurisdiction control the ramp meters.
Tempe’s current approach to control the traffic on the arterial of the interchange is a time-of-day semi-
actuated approach, where loop detectors recognize traffic on specific lanes and/or movements and based on
some pre-defined logic provide specified phases, phase extensions, force-offs and gap-outs to allow for the
movement of the detected traffic. The nominal offsets, splits, and cycle time parameters are included in
time-of-day traffic plans that are pre-determined and loaded on the interchange controllers. The major
deficiency of such a strategy is that there is no way for the controller to respond to actual arrivals - by
varying phase durations and/or using more appropriate cycle times and phase sequencing - even though

7
detectors at upstream intersections and at the off-ramps may have identified unusual traffic conditions
(either unusually large volumes or very small volumes, due to, for example, events and incidents). Also,
unusually large queues detected at the on-ramps are not considered in phase durations; vehicles may be
directed on to the queued on-ramps, which results in no apparent effect on their delays but instead induces
queue spillbacks and possibly increases delays for other traffic. Furthermore, queue spillback into the
freeway from the off-ramps can also occur at this diamond interchange but current detections do not allow
RHODES to observe this.
The previous studies of RHODES-ITMS had indicated, through simulation, that the RHODES strategy had
the potential to improve traffic performance at an interchange [Head and Mirchandani, 1997]. However,
since the RHODES system requires considerable on-line data gathering, data handling, communication
networking and on-line algorithmic computations, implementing such a system poses many challenges.
Therefore, besides the major goal of developing and field testing a new traffic-adaptive method to optimize
the interchange traffic signal operations, the other goals of the project were to investigate whether the
interchange control/communication/detection systems can be configured to send data/commands at once-
per-second frequencies, and to configure the new 2070 Controller to set phase durations instead of the
traditional cycles/splits/offsets timing parameters. Success for the latter two goals will allow testing for
other phase-optimizing approaches besides the RHODES approach tested in this project.
Thus, in summary, the objectives of the RHODES-ITMS Tempe Field Test Project were to (1) integrate
control/communication/detection systems to send data/commands at once-per-second frequencies, (2)
configure the new 2070 Controller to set phase durations, (3) investigate if the RHODES-type strategy
works in the field, and (4) determine if the RHODES-ITMS system improves traffic performance.
Figure 2 gives a schematic diagram of the field test site. Only the interchange traffic signals, for the traffic
that passes through the two intersections of the interchange including traffic on off-ramps and on-ramps
(and not the freeway traffic going under the interchange) were under real-time adaptive control using the
RHODES-ITMS System.

8
Figure 2 - The interchange: control area and detectors utilized
1.3 Project Tasks
The RHODES-ITMS Tempe Field Test Project consisted of the following tasks:
Task A: Simulation Modeling and Analysis
Task B: Integration of RHODES within 2070 Controller
Task C: Hardware-in-the-loop Simulation
Task D: Integration of RHODES/2070 Controller/TS2 Cabinet
Task E: Integration of RHODES/2070 Controller/TS2 Cabinet/TOC Systems
Task F: Laboratory Testing
Task G: Field data gathering for RHODES Parameters
Task H: Field Implementation
Task I: Field Bench Testing
Task J: Field Testing: Field Data Collection and Evaluation
Task K: Organizing TAC Meetings and Demonstrations
Task L: Draft and Final Reports
S W
N
E
Legend Presence Detector Passage Detector Signal Set
Field Site US60 and Rural Road
h
Rural
Rural
US60
US60
Ramp Meter
TS-2 Cabinet

9
Below we briefly describe these tasks. Some of these tasks, and the design and analysis as a result of these
tasks, are further elaborated in later subsections.
Task A consisted of developing a CORSIM simulation model of the Tempe (Rural Road and U.S. 60)
Interchange:
1. for assuring that the RHODES Team had all the physical and traffic information for the
interchange (much of this is also needed for the RHODES algorithms),
2. to get an idea of the traffic performance under current operations, and
3. to get an idea of anticipated performance under RHODES control.
In the first phase of the RHODES-ITMS Project a simulation model of the Indian School Road and I-17
Interchange was developed. Some of the lessons learned were beneficial for developing a model for the
Tempe Interchange. Anderson [1997] gives details of the simulation model in a Master-of-Science Report.
Task B focused on the integration of the RHODES code on the 2070 Controller that was to be
implemented at the Interchange. For this purpose a field-hardened processor was purchased from Mikro
Elektronik Gmbh (MEN) in Nürnberg, Germany. Hereafter referred to as a “MEN Card”, this unit contains
a 50 Mhz Motorola 68060 processor with 32 MB of SDRAM for storage and processing of the RHODES
data and algorithms and is enclosed within the VME chassis of the 2070. In this configuration, RHODES
receives and transmits information from/to the 2070’s processor (in this case, a Motorola 68360) via the
2070’s internal VME bus. Running under the OS-9 operating system, the NextPhase controller software,
developed by Gardner Transportation Systems (GTS, now a business unit of Siemens Energy and
Automation, Inc.), was used to control the diamond interchange in accordance with Tempe’s existing traffic
control plans. Thus, Task B entailed the integration of the RHODES algorithms (residing on the MEN
Card) with the NextPhase software within the 2070 Controller.
Task C was to integrate the CORSIM model of the Tempe Interchange with the 2070 Controller
programmed with the RHODES logic. In other words, the CORSIM model simulated detector and signal
status data, which were then input to the 2070 via a Controller Interface Device (CID). This was to assure
that messages that emulated the field were passed to the controller, which in turn provided the phase
duration messages (from RHODES) to run the simulation.
The signal cabinet that Tempe uses at the Interchange is a NEMA TS2 type. The proposed configuration
called for the integration of the 2070 Controller within this cabinet. Since RHODES requires local signal
and detector information as well as the same from upstream intersections, the integration also required that
this information (from loops, video detectors, signals, etc.) be properly channeled to the RHODES
processor. Task D was the effort to do this integration.

10
The current traffic management system at the Tempe Traffic Operations Center (TOC) is the one developed
by Computran Inc. Thus the natural follow-on to Task D is to interface the field 2070 with the Computran
System, making sure that the upstream detector and signal data is actually received by the 2070, through
the Computran System, with negligible delays (for real-time traffic control purposes) and with appropriate
reliability. Task E focused on this interfacing.
Three venues for laboratory testing were (1) the RHODES Laboratory at the University of Arizona (UA),
(2) the testing laboratory at GTS, and (3) the Tempe TOC. In Task F, we tested the interfaces between
RHODES on the MEN Card and NextPhase on the 2070 CPU using a TS2 suitcase tester in the UA
laboratory. The interface between the 2070 (including NextPhase and RHODES) and TS2 was tested in the
GTS laboratory, and the complete integration between Computran and 2070/NextPhase/RHODES was
tested in the Tempe TOC.
In order to run RHODES at a particular intersection, fixed parameters such as number of lanes, permitted
and protected turn movements, and distances from upstream detectors need to be hard coded within
RHODES. Traffic parameters such as turn ratios, travel times or speeds, and queue discharge rates needed
to be measured and input for associated parameter values within RHODES. Task G was to gather this data
for the particular field site and input it in RHODES.
Task H, Field Implementation, entailed (1) having the site-specific RHODES version on the MEN Card,
(2) having NextPhase/2070 run the interchange under the standard timing plans that Tempe uses, (3)
making sure that the communication system between the upstream detectors and the field 2070 (through the
Computran System) was functioning, (4) fine-tuning some of the RHODES prediction parameters so that
queue estimates at the stop-bars were approximately correct, and (5) ensuring that RHODES was properly
called and functioning when “adaptive control” is requested through NextPhase.
Once the research team felt that the hardware and software were all functioning, RHODES was run in the
field for several hours. The controller was observed to see if everything was properly functioning, and to
check the response when something unexpected occurred, such as, for example, when the signals are being
preempted by an emergency vehicle, or when there is a power shut down. This was done in Task I, referred
to as Field Bench Testing.
Only after the research team had run RHODES for several hours on different days during Field Bench
Testing, was the system run for field test data collection and evaluation by a third-party evaluator (TASK
Engineering, Inc.) under Task J.

11
Due to the long duration of the project, and several natural milestones, there were many Technical
Advisory Committee meetings and demonstrations of RHODES running in (1) a hardware-in-the-loop
simulation, (2) the Tempe TOC, and (3) in the field, at the interchange. The effort on this is grouped as
Task K. Finally, Task L is the documentation of the project through which this final report was prepared.
1.4 Project Oversight
A Technical Advisory Committee (TAC) comprised of representatives from key agencies provided project
oversight. The project was administered by the Arizona Transportation Research Center (ATRC) of
ADOT. The following individuals served on the TAC at various times:
Jim Decker Traffic Operations, City of Tempe
Ron Amaya Traffic Operations, City of Peoria (previously City of Tempe)
Sarath Joshua Maricopa Association of Governments (previously at ATRC, ADOT)
Alan Hansen Federal Highway Administration
Tom Fowler Federal Highway Administration
Tim Wolfe ADOT Technology Group
Dan Powell ADOT District 1
Tom Parlante ADOT Traffic Engineering
Glenn Jonas ADOT Freeway Management
Manny Agah ADOT Freeway Management
Jerry Pfiefer ADOT Freeway Management
Phil Carter ADOT Freeway Management
Jim Shea ADOT Freeway Management
Pierre Pretorius Maricopa County Transportation and Development Agency
Don Wiltshire Maricopa County Transportation and Development Agency
Dave Wolfson Maricopa County Transportation and Development Agency
Ben McCawley Maricopa County Transportation and Development Agency
Scott Nodes Traffic Operations, City of Peoria (previously City of Phoenix)
Steve Owen RHODES-ITMS Project Manager, ATRC, ADOT.

12
2. RHODES TRAFFIC SYSTEM: TECHNICAL BACKGROUND
2.1 RHODES System Architecture
RHODES-ITMS uses the concepts underlying the RHODES traffic-adaptive signal control system [Head,
Mirchandani and Sheppard, 1992]. The current approaches to control the traffic on the arterial of the
interchange are (1) fixed time, perhaps based on time-of-day traffic conditions, and (2) actuated (or semi-
actuated) where loop detectors detect traffic on specific lanes and/or movements and based on some pre-
defined logic to provide specified phases, phase extensions, force-offs and gap-outs to allow for the
movement of the detected traffic. The major deficiency for such types of strategies is that there is no way
for the control system to tradeoff or optimize signal settings to respond to anticipated arrival volumes - by
varying phase durations and/or using more appropriate cycle times and phase sequencing - even though
detectors at the off-ramps and upstream intersections may have identified unusual traffic conditions (either
unusually large volumes or very small volumes, due to, for example, events and incidents). Also, unusually
large queues detected at the on-ramps are not considered in phase durations; vehicles may be directed on to
the queued on-ramps, which results in no apparent effect on their delays but instead induces queue
spillbacks into the intersections and possibly increases delays for other traffic. The RHODES concept and
architecture (Figure 3) responds to this deficiency.
Destinations/Origins
Network LoadControl
Network FlowControl
IntersectionControl
Traffic SignalActivation
Detectors and Surveillance
Actual Travel Behavior and Traffic
NetworkLoads
Target Timings
ActualTimings
ControlSignal
Vehicle Flow Prediction
Scenario
Origins/Destinations
Current Capacities, Travel Times,Network Disruptions
(seconds)
(minutes)
(minutes/hours/days)
Platoon Flow Prediction
Network LoadEstimator/Predictor
Network FlowEstimator/Predictor
Intersection FlowEstimator/Predictor
Measurements
y(t)
ATIS
Historical/Infrastructure Data
Figure 3 - The RHODES Architecture

13
To briefly review the RHODES concept, the RHODES architecture for surface streets is depicted in Figure
3. At the highest level of RHODES is the "dynamic network loading" model that captures the slow-varying
characteristics of traffic. These characteristics pertain to the network geometry (available routes including
road closures, construction, etc.) and the typical route selection of travelers. Based on the slow-varying
characteristics of the network traffic loads, estimates of the load on each particular link, in terms of vehicles
per hour, can be calculated. The load estimates then allow RHODES to allocate "green time" for each
different demand pattern and each phase (North-South through movement, North-South left turn, East-West
left turn, and so on). These decisions are made at the middle level of the hierarchy, referred to as "network
flow control". Traffic flow characteristics at this level are measured in terms of platoons of vehicles and
their speeds. Given the approximate green times, the "intersection control" at the third level selects the
appropriate phase change epochs based on observed and predicted arrivals of individual vehicles at each
intersection. The RHODES architecture and its software implementation are modular; it allows the
accommodation of new modeling methodologies and new technologies as they are developed.
There are three aspects of the RHODES philosophy that make it a viable and effective system to
adaptively control traffic signals. First, it recognizes that recent technological advances in
communication, control, and computation (a) make it possible to move data quickly from the street to
the computing processors (even now most current systems have communication capabilities that are
not utilized to their potential), (b) make processing of this data to algorithmically select optimal signal
timings fast, and (c) allow the flexibility to implement, through modern controllers, a wide-variety of
control strategies. Second, RHODES recognizes that there are natural stochastic variations in the
traffic flow and therefore one must expect the data to stochastically vary (simply smoothing the data
and working with average values does not make the actual traffic that the system sees smooth and
average, as assumed by other real-time traffic control schemes). And third, RHODES proactively
responds to these variations by explicitly predicting individual vehicle arrivals, platoon arrivals and
traffic flow rates, for the three corresponding levels of hierarchies described above.
The implemented RHODES-ITMS algorithms relate only to the third level - here referred to as
intersection/interchange control (recall that the diamond interchange includes intersections on both sides
of the freeway). Basically, the developed RHODES-ITMS system predicts arrivals and queues of
individual vehicles at the arterial approaches on both sides of the freeway, as well as arrivals from the off-
ramps, and the departures and queues at the on-ramps; and based on these predictions and a given criterion
of performance determines the optimal phasing of the signals at the two intersections. The prediction and
the optimization algorithms for this purpose are briefly reviewed in Sections 2.3 and 2.4.

14
To test real-time algorithms (RHODES or any other), we developed a CORSIM-based simulation model
(CORSIM is a software package, developed by FHWA, for modeling and simulating traffic on a network.)
This was used as a platform to implement and test RHODES-ITMS. Issues related to the simulation
modeling and the simulation-based testing of the algorithms are discussed in the next section. Results of
the RHODES simulations are discussed in Section 2.5.
2. 2 Simulation Modeling for Testing Real-Time Algorithms
It is clear that any type of traffic control algorithm needs to be tested in the "laboratory" before it is
implemented and evaluated in the field. The most appropriate method to do this "laboratory" testing is to
(1) have a realistic simulation model of traffic flow at an interchange, (2) emulate the (loop) detection of
the traffic flow, and (3) observe the resulting changes that would come about if the algorithm was
implemented in place of the current control system. The functional requirements for simulation models for
development, testing and evaluation of real-time traffic-adaptive signal control logic in this setting include:
• the ability to realistically simulate arriving/departing vehicular traffic at an interchange;
• the ability to generate dynamic traffic conditions, including recurrent and non-recurrent congestion
such as incidents and special events;
• the ability to obtain surveillance/detector output at required frequencies;
• the ability to implement decisions (e.g., from RHODES) to control traffic signals in real-time; and
• the ability to compute various measures of effectiveness based on traffic characteristics (including
those that are not necessarily observable, such as queue lengths).
The ability to represent dynamic recurrent and non-recurrent congestion, as well as other non-congested
traffic conditions, is needed for measuring the algorithm's capability to respond to real-time traffic
conditions.
Simulation models used for testing must provide the same surveillance and detection information as that
available in the field. The frequency of surveillance and detector system output and the frequency of the
signal control input dictate the minimal resolution, and hence the responsiveness, of the signal control
logic. Also, the simulation model must be able to represent data-input and control-output rates that will be
achievable when the control logic is implemented for field-testing.
It may be desirable for the signal control algorithms to optimize different measures of performance, based
on traffic conditions or dictated by the operating jurisdictions. Therefore, it is essential that the simulation

15
model provide a wide variety of measures of effectiveness (MOE) to evaluate the real-time traffic adaptive
signal control algorithms.
The simulation model requirements from a development and testing perspective differ from the
requirements for performance evaluation. Clearly, the most important requirement of a simulation model is
that it accurately represents the dynamics of traffic flow and its response to dynamic signal control. This
requirement dictates that the simulation model chosen for development and testing not be based on a
macroscopic flow model that assumes constant cycle length and deterministic traffic flow characteristics.
Rather, the model should include microscopic flow characteristics, such as car following, and include an
ability to simulate real-time traffic controls (not necessarily having constant cycle lengths) and attendant
vehicle response to actual traffic signals.
During the development and testing phase it is essential to have access to both traffic and signal control
variables so that detailed behavior can be studied. One may distinguish between traffic simulation
information/data that is needed for validation and testing and that information/data which is available as
traffic surveillance/detection data for the signal control algorithms. For example, for the purpose of testing
a traffic model used in an optimization routine, it may be desirable to compare the traffic model's state-of-
the-traffic measures, such as queue length, to the corresponding measures in the simulation model. This
form of testing requires that the traffic simulation model provide accurate measurements of queue lengths
despite the fact that the existing traffic surveillance technology may not provide this information.
Another important consideration is the frequency at which required testing data is available. For example,
the average queue length for a simulation period is insufficient for testing a routine that estimates real-time
queue lengths. This information must be available as frequently as possible, at least as frequently as queue
estimates are generated.
The interchange and the neighboring area simulated consisted of the freeway (US 60), a cross arterial
(which makes this a diamond interchange), six signalized intersections (two on one side and four on the
other side of the freeway), and pairs of off-ramps and on-ramps (see Figure 4). The fact that the two
signals right next to the freeway are rather closely spaced (375 feet apart) poses a significant traffic control
challenge to keep the traffic moving, as well as to prevent excessive queue spillbacks. Fixed-time and
actuated signal control strategies (internal to CORSIM) were implemented and animations were observed
to confirm if the traffic was indeed moving appropriately. Having fine-tuned the actuated timing parameters
within the simulation model so that traffic performance was as good as can be expected, RHODES-ITMS
was interfaced with the simulation model and evaluated (results are given in Section 2.5). Figure 5 shows

16
the various phases, and their corresponding minimum and maximum green times, which were used in
simulating the current actuated signal control.
8165
141
143
142
140
US 60 US 60
124
19
17 18 8125 8123 Southern Avenue
143
148 8249 23
149 149 24 25 8150 8148
150 26 27 8149
165 28 29 8166 8164 Baseline Road
Baseline Road
Minton Drive
Minton Drive
Lakeshore Dr
30
Carter Drive
Carter Drive
147 20 21 8248 8146 Fairlane Village
Embassy Suites
8124
Rural Road
= dummy node or intersection without signal control
= intersection with signal control
= entry/exit node
Legend
US60 & Rural Road Network
Southern Avenue
247
W
N
E
S
81328131
Rural Road
Rural Road
8151
Figure 4 - CORSIM Simulation Model
An essential element of external real-time signal control logic is the traffic surveillance system. In the
experiments performed by the research team, the internal surveillance detector logic of CORSIM was used for
the placement and processing of detector events, while external logic was used for processing this detector
data. This approach allows the estimation of any necessary traffic parameter(s), in addition to the standard
count and occupancy values.

17
Figure 5 - Actuated signal phasing with minimums and maximum green times (in seconds)
2.3. Prediction Algorithms in RHODES-ITMS This section will only review prediction algorithm in RHODES-ITMS; more details are available in an
earlier report [Head and Mirchandani, 1997]
For proactive traffic control, it is important to predict vehicle arrivals, turning ratios and queues at an
intersection, in order to compute phase timings that optimize a given measure of effectiveness (e.g. average
delay). To emphasize this importance, consider the intersection shown in Figure 6. This intersection has
four approaches. Associated with each approach are several possible traffic movements: left turn, right turn
and a through movement. For the purpose of signal timing, the right turn and through movements are
generally considered as a single movement. Any non-conflicting combination of movements that can share
the intersection at any one time can be assigned a signal phase that allows those movements protected use
of the intersection. The traffic demand for a phase is determined by the approach volume (measured using a
group of loop detectors on the approach to each intersection and in the left-turn pockets) and the turning
ratios associated with vehicle routes.
min. 5 max 45
min. 5 max 45
Rural Rd
min. 8 max 22
min. 8 max 22
Rural Rd
Phase
1-5
2-6
4-8
min. 5 max 60
min. 5 max 60
Rural Rd

18
Now consider the signal-timing problem given two possible perfect predictions of arrivals during the
planning horizon as depicted in Figure 7. Each arrival pattern represents the number of vehicles to arrive at
an intersection in fixed time intervals. Both arrival patterns are identical until time t0 when the signal
control has to decide whether to serve this approach or to serve another approach. In the top case, the
demand occurs immediately following t0 , whereas in the bottom case there is little demand immediately
following t0 and greater demand in the future. In each case the total number of vehicle arrivals are equal.
Approach 1
V1
App
roac
h 3
Approach 2
Approach 4
V4
V3
V2
VehicleDetector
VehicleDetector
VehicleDetector
VehicleDetector
Figure 6 - Basic traffic intersection showing approaches, approach volumes, movements and vehicle detectors.
Phase ?
?t0
Time
Time
Vehicles
Vehicles
Figure 7 - Graphical depiction of the effect of future arrivals on scheduling phase sequences and durations.

19
However, the optimal signal timings could be significantly different. It is essential to know the temporal
arrival distribution to build truly real-time traffic-adaptive signal control logic.
Three issues are important to predicting traffic flow: (1) the length of the time horizon, (2) the number of
prediction points per time horizon (called the prediction frequency) and (3) the number and location of
information sources. The prediction time horizon provides the real-time traffic-adaptive signal timing
control logic with the ability to plan future signal timing decisions. If the prediction horizon is short,
perhaps several seconds, then the signal timing decisions are restricted. For example, if the predictions are
made over a 10-second horizon, the signal timing logic can only make timing decision that extend or
shorten the current phase. On the other hand, if the predictions are made over a longer horizon, the signal
timing decisions can include decisions on phase termination times and phase sequencing. For example, if
the prediction horizon is 30-40 seconds, then the signal timing logic might schedule the next two phases
and their durations based on the predicted demand instead of following a fixed phase sequence.
The prediction frequency provides information about the distribution of vehicle arrivals over time. If the
predictions are made at a frequency of only one prediction for the decision time horizon, then the signal
timing logic must assume that the vehicles are distributed uniformly over that time. If the predictions are
made more frequently, say every second over the prediction horizon, then the signal timing logic will have
a more accurate representation of the distribution of vehicle arrivals over time.
The number and location of information sources determine the ability of any prediction algorithm to predict
future conditions based on current conditions at other spatial points. For example, if a detector is located,
say, 10 seconds upstream of the desired prediction point, then prediction will be easier but only for a 10-
second horizon. The further away the location of other information sources, the longer the potential
prediction horizon. But, the temporal information may become more distorted (e.g. due to platoon
dispersion) and thus less valuable for prediction. In addition, the further away the information sources are
located, the greater are the effects of exogenous factors, such as traffic signals and traffic sources/sinks, on
prediction. Clearly, a system with many well-placed detectors will provide the best information for
prediction.
The PREDICT algorithm [Head, 1995] in RHODES-ITMS uses the output of the detectors on the approach
of each upstream intersection, together with information on the traffic state and planned phase timings for
the upstream signals, to predict future arrivals at the intersection/interchange under RHODES control. This
approach allows a longer prediction time horizon since the travel distance to the intersection is longer and
the delays at the upstream signal are considered. A benefit of this approach is that it includes the effects of
the upstream traffic signals in the intersection/interchange control optimization problem.

20
To understand how this approach works consider the scenario shown in Figure 8. It is desired to predict the
flow approaching intersection A at detector dA . Making the prediction for the point dA is important
because it is a point on link AB where the actual flow can be measured, hence the quality of the prediction
can be assessed in real-time.
A B
dA
dr
dt
dl
Figure 8 - Prediction scenario based on detectors on the approaches to the upstream intersection (B)
Traffic contributing to the flow at dA originates from the approaches to intersection B and can be
measured at detectors dl , dt and dr representing the flows that will turn left, pass through and turn right,
respectively, onto link AB . It is possible to have other traffic that originates at sources between
intersections A and B , but this can be considered as immeasurable "noise". Also, it is possible that
vehicles passing over dl , dt , and dr will terminate their trip before arriving at dA . This can also be
considered as "noise" in the prediction.
When a vehicle passes a detection point, say di where i ∈ {l,t,r}, several factors affect when it will arrive
at dA including (1) the travel time from di to the stop bar at intersection B , (2) the delay due to an
existing queue at B , (3) the delay due to the traffic signal at B , and (4) the travel time between B and
dA .
Figures 9 (a)-(d) depict the delay associated with each of these factors. In Figure 9(a) the vehicle arrives at
detector di and passes freely to detector dA . In Figure 9(b) the vehicle arrives at detector di and is
delayed by the signal at intersection B . Hence the travel time from di to dA must account for the travel
time from di to the stop bar, the delay due to the signal and the travel time from the stop bar to dA . In Figure 9(c) the arrival at di encounters delay for the signal as well as a standing queue, and has to travel
from di to the stop bar at B, and from the stop bar to dA . Figure 9(d) depicts the case when the arrival at
di occurs after the signal has begun serving the desired phase, but a standing queue is present. This case is

21
similar to the above, except that the delay due to the standing queue must be adjusted based on the amount
of time that has elapsed between the onset of the signal and the arrival of the vehicle at di and the travel
time to the back of the queue.
(a) Detected vehicle passes freely
through intersection.
(b)Detected vehicle arrives during red
signal - signal delay.
(c) Detected vehicle arrives during red signal and a queue exists - signal and queue delay.
(d)Detected vehicle arrives during the green signal and a queue exists - queue delay.
di
dA
di
dA
di
dA
di
dA
B B
B B
Figure 9 - Delays associated with the prediction of arrivals at the detector dA
Once the arrival time at dA is predicted, the PREDICT model adds a fraction to the current estimate of the
expected number of arrivals at that time. For example, if 15% of the vehicles that pass over di continue on
to dA , then for each actuation of di , 0.15 is added to the current estimate of the expected number of arrivals at the predicted arrival time ta .
Note that to use the PREDICT model, several parameters (given in bold) need to be provided: (1) travel
times on links (detector to detector) which depends on the link free-flow speed and current traffic volumes,
(2) queue discharge rates which also depends on volumes (as well as on queue spillbacks and opposing-
and cross-traffic volumes), and (3) turning ratios.

22
Link free-flow speed can be estimated from historical data and capacity analysis. Link free-flow speeds
are needed even in traditional off-line models to optimize fixed phase timings (cycle times, offsets, splits)
so to obtain these should pose no major problem. Appendix 1 gives the travel times (instead of the speeds)
used for the field site.
Through-traffic queue discharge rates are affected by downstream through-traffic volumes, which can be
easily measured. Likewise, left-turn queue discharge rates depend on opposing traffic volumes, and right-
turn queue discharge rates depend on cross-traffic in that direction. These three discharge rates may be
initially given from calculated default functions (functions of traffic volumes), and then can be adjusted
based on how well they predict remaining queues at the stop-bar presence detectors. For example, if the
left-turn queue estimate tends to be non-zero when in fact it is zero then the left-turn discharge rate can be
adjusted upwards. An approach to adjust discharge rates is given in Mirchandani and Head [2001]; in the
field test, however, we used default values and did not adaptively change discharge rates. Appendix 1
gives queue discharge rates used for the field site.
The PREDICT model, as well as the interchange control algorithms (referred to as CAPRI later), requires
that turn ratios are known. An assumption for RHODES (as well as current off-line methods to set signal
timings) is that some estimates for turn ratios at the intersection are given. Even the CORSIM model needs
this information. However, from real-time traffic control perspective, these ratios are not deterministic;
they change stochastically over time. For example, suppose PWN is the ratio that a vehicle arriving from the
West to some intersection will turn left (North), then it is clear that PWN will depend on the time of the day,
the volume of traffic, and the particular mix of the origins/destinations in the group of arrivals being
modeled. In other words, PWN is described by a random process.
Our assumptions for PWN are (1) a prior estimate is available whose uncertainty is modeled with a Normal
distribution with known mean and variance; (2) at any given time, we have measured the percentage of
vehicles that have turned left in the last, say, three phase durations, as well as percentages that turned right
and driven straight through the intersection; and (3) we know the error distributions for these
measurements. An approach to adjust turn ratios is given in Mirchandani, Nobe and Wu [2001]; in the field
test, however, we used measured values for three time-of day periods and did not adaptively change turn
ratios. Appendix 1 gives these turn ratios for the field site.
It is important to note that the PREDICT model is based on processing arrival data as it becomes available.
At any point in time the predicted arrival flow pattern at dA accounts for vehicles that have already passed
the detectors dl , dt and dr . The benefit of this vehicle-additive process of the predictor is that it
constantly provides, for a given prediction horizon, (1) nearly complete information of anticipated vehicle

23
arrivals in the very near future (of those vehicles that have already passed the upstream intersections) and
(2) partial information of anticipated vehicles in remaining part of the prediction time horizon (of those
vehicles that have not passed the upstream intersections, since some new vehicles may still arrive that will
effect the delays in the prediction time horizon). Results of an evaluation study of the PREDICT algorithm
for arrivals at an intersection have been reported by Head [1995].
Interchange Predictions
Unlike the case of predictions of vehicle arrivals and queues at an intersection, in the case of the
interchange we need to get detector data from additional sources such as off-ramps and on-ramps detectors,
and predict arrivals/queues at two intersections and two on-ramps.
Referring to Figure 2, in the interchange scenario the prediction method takes (1) input from passage
detectors (one for each lane) just after (on the far-side of) the upstream arterial intersection locations, from
passage detectors at the two signals of the interchange locations, and from passage detectors at off-ramps
for predicting arrivals, and (2) input from presence detectors (one for each lane) at the two interchange
signals, from presence detectors at off-ramps, and from presence detectors at on-ramps for predicting
queues; the method outputs prediction of arrivals/queues at interchange signals and at on-ramps. It is
important to note that the predictions require the state of the signals at all times and the ramp metering
rates. As we indicated earlier, the scope of this effort does not allow our RHODES-ITMS algorithm to set
ramp metering rates; the algorithm assumes that these rates are set externally to the interchange control.
These rates need to be provided to PREDICT for estimating on-ramp queues in real-time. The prediction equations for the interchange are similar to those for PREDICT for an intersection but there
are more cases to consider. For example arrivals on the far side of bridge, from the North, depend on the
arrivals from the upstream signal at Southern, from left-turners at the off-ramps from the East, and on the
corresponding phase durations at the North-side signal at the interchange. Similarly, queues at on-ramp to
the West depend on arrival streams from that location on the bridge, the arrival streams from Southern, the
signal timings at intersection at the North-side signal, and the ramp metering rate at the on-ramp.
2.4. Optimization Algorithms in RHODES-ITMS Existing control strategies are based on a signal timing plan defined in terms of operating parameters for
traditional signal control, namely cycle time, splits, and offsets. These parameters are generally developed
based on traffic studies and standard procedures, such as the Highway Capacity Manual [Transportation
Research Board, 1998], or signal timing software such as TRANSYT [Robertson, 1969; Wallace et al.,

24
1998] and PASSER [Chang and Messer, 1991]. The traffic studies result in estimates of traffic conditions,
link volumes and turning percentages, for specified time periods. Signal timing parameters are developed
for each of these time periods and, typically, implemented on a time-of-day basis considering only average
or typical traffic conditions. In many cases, even the use of standard procedures for the development of
signal timing plans is abandoned and traffic engineers operate in a judgment-based fashion with moderate
levels of success. None of these approaches is truly traffic-adaptive or even attempt to actually minimize
some measure of real-time traffic performance such as average vehicle-delay.
Currently available traffic responsive systems such as SCOOT [Hunt et al., 1981] and SCATS [Luk, 1984;
Sims, 1988] attempt to address the problem of responding to actual traffic conditions by switching these
parametric signal timing plans based on average wide-area traffic conditions observed in the last several
minutes rather than time of day. This requires that signal-timing parameters be developed for a variety of
possible traffic conditions. Nevertheless, implicit in the usage of parametric timing plans is the assumption
that for the next several minutes, or even hours, the traffic in the network can be well characterized by the
observed average flows and parameters. No account is taken of the fact that the second-by-second and
minute-by-minute variability of traffic are significant and plans based on averages produce unnecessary
delays for some traffic movements when the traffic on conflicting movements is absent, or very small,
during some periods.
The RHODES approach is to predict both the short-term and the medium term fluctuations of the traffic (in
terms of individual vehicle arrivals and platoon movements respectively), and explicitly set phases that
maximize a given traffic performance measure. Note that RHODES does not set timing plans in terms of
cycle times, splits and offsets, but rather in terms of phase durations for any given phase sequence.
(RHODES does not necessarily require a pre-specified phase sequence, but since many traffic engineers
prefer a pre-specified sequence, RHODES has been developed to allow the traffic engineer to specify a
desired sequence.) In other words, in the RHODES control strategy, the emphasis shifts from changing
timing parameters in reacting to traffic conditions just observed to proactively setting phase durations for
predicted traffic conditions.
To adaptively control an intersection in a surface street network, Sen and Head [1997] developed a
dynamic-programming (DP) based model where each “stage” corresponds to a time interval (in our case,
this is usually a second) and each stage corresponds to the phase in a given “phase order”. The possible
decision at each stage is to either remain in the current phase or switch to the next phase in the phase order.
The solution of the DP gives a set of switching points. For this research effort, this model was generalized
for the freeway-arterial diamond interchange. The total and average vehicle delays at the interchange are
greatly reduced by explicitly considering these delays in selecting the controllers’ phase durations as done

25
in the RHODES real-time interchange control scheme. (Traditionally, the tightly coupled operation of the
two intersections comprising the interchange has been addressed by using a specialized phasing strategy
with pre-defined time-of-day timing plans.) We refer to the intersection/interchange module of RHODES
as CAPRI, referring to “Categorized Arrival-based Phase Reoptimization at Intersection/interchange”,
since in the general algorithm arrivals streams are categorized into classes (straight-through buses, left-turn
cars, fire engines, etc.).
Figure 10 depicts the states of the dynamic programming (DP) formulation. A rolling horizon approach is
used to allow the optimization to take advantage of the most recent predictions and observations. An
optimization is started at some time t0 and considers a time horizon of T seconds, say 45-60 seconds. A
phase order is provided to CAPRI so that at each stage decision corresponds to a phase. The result of the
DP optimization provides the time (xj time units) that must be allocated to each phase j in the phase order.
If the traffic engineer does not restrict the phases to be in a particular sequence, then this flexibility allows
for variable phase sequencing through phase skipping (by effectively allocating zero time for the
corresponding stage).
Current time
(Optimize)
Optimize Optimize Optimize
decision horizon
sj
sj-1 xj
r
Figure 10 - Implementation of single-variable rolling horizon approach
Each decision xj has an associated value based on a performance measure such as stops or delay. This value
is determined by using the predicted vehicle arrivals, the current and prior decisions, and an imbedded
traffic flow model that accounts for estimated queues, startup lost time, queue discharge and arrivals, as
well as other traffic dynamics that relate the decision to the performance measure.
The decision for the first phase is implemented as the desired signal control. Just prior to the end of this
first phase, the optimization problem is solved again in a rolling horizon approach. The sequence of phases
in the second optimization begins with the current phase, which allow for the phase to be terminated early
or extended based on the re-evaluation with more recent observations and predictions.

26
Since phasing sequence and timing decisions are applicable only for a short time-horizon, the problem is
formulated such that the optimization horizon T is long enough to account for sufficient propagation of
traffic flow to get good predicted performance measures, but “short enough” to allow for computations in
real time. Furthermore, CAPRI implements timing decisions only for the first few seconds of the
optimization horizon T, as depicted in Figure 10 (the variables on the figure will be described shortly). As
predicted vehicle arrival information is updated with additional detector actuations, the algorithm runs
again to re-optimizes the phase timings and sequence for the un-implemented portion of the previous
optimization horizon, and propagates the optimization an additional t time units into the future. In this
way, CAPRI produces a rolling-horizon optimization that can extend the timing of phases previously
scheduled given new updated vehicle arrival information.
RHODES-ITMS proceeds as follows at any iteration: (1) collect current detector actuations at the
interchange and adjacent intersections and update the detector database, (2) use the PREDICT model to
propagate those detector actuations into the future and update flow predictions, (3) assess various phase
timing/switching decisions with the CAPRI rolling-horizon dynamic programming algorithm.
CAPRI's DP framework allows one to take into account any operating and jurisdictional constraint imposed
by the traffic engineer. For example, if it is required that a phase sequence is specified and phases cannot
be skipped, then the phase order will correspond to the given phase sequence and a non-zero minimum
green time threshold will be imposed on all the phases in the phase order. Or, if it is allowed that non-
conflicting movements of two consecutive phases "overlap" instead of requiring explicit clearance phase,
then this is also possible in the DP framework. Or, if a pedestrian clearance is required, the corresponding
minimum green time can be set equal to the pedestrian clearance interval
Suppose any phase sequence is allowed, but a minimum green time of g(Φj) is required if phase Φj is used.
Then, given the value for the state variable sj, the control variable xj (for the jth stage and the corresponding
phase in the given phase order) can assume values from the following feasible discrete set:
Xj (s j ) =0 if s j − r < g,
0,g,g +1,...,sj − r otherwise.
where r is the required clearance interval.
We use the following relationship between the stages of the DP (see Figure 10) if a clearance interval of length r(Φi|Φk) is required between phases:
s j−1 = sj − hj (x j )

27
where
hj(xj ) =0 if x j = 0,
xj + r(p( j) / p( j −1)) otherwise.
On the other hand, if some phases are allowed to overlap, then depending on p(j), the current non-zero
duration phase decision and p(j-k), the last non-zero duration phase decision (say, at time j-k), clearance
interval r(p(j)/p(j-k)) may be set to zero.
An important assumption for DP is that the objective function of the optimization should be additive,
namely
vj (s j ) = f1(s1,x1) + f2(s2,x2) + ... + f j(sj, x j )
which is true for many types of performance functions. For the standard traffic performance measures,
total delays and stops, this measure is approximately additive. In the simulation experiments reported in
this paper we used delays (a linear combination of accumulated delays of currently queued vehicles plus
expected delays of predicted arrivals) as our performance criteria that we tried to minimize with our traffic
controls.
The forward DP recursion is performed to evaluate possible phase sequences, timings and the associated performance measures at each recursive step. To initialize, v0(s0) is set to zero. Using the recursion
vj (sj)= Min xj {fj(sj,xj) + vj-1(sj-1) | xj in Xj(sj)} the DP starts with j=1 and proceeds recursively for j=2,3,... until vj(T) does not change for a whole cycle in
the phase order. However, in the current implementation of the algorithm, for computational efficiency, we
simply terminated the DP after a fixed number (M) of phases were determined. The resulting errors from
the optimal solution were small. At each stage in the forward recursion, the method computes the optimal value of vj(sj), and stores the optimal xj(sj) and the corresponding phase p(j), for all possible values of sj:
The optimal phase sequence and timings are retrieved in a backward pass, beginning at the end of the time
horizon and progressing towards the beginning. Since M denotes the last stage for which the value function vj(sj) has been computed, we simply perform the following backward recursion starting with j =M-1, and
ending with j = 1.

28
The set of phases that must be considered by CAPRI and the corresponding phase order to be used in the
algorithm is a design element that must be provided by the traffic engineer in the implementation of
CAPRI. In our current implementation of CAPRI we used three Phases 1-5, 2-6, 4-8 as the phase order,
and the corresponding minimum and maximum green times shown in Figure 5.
Computation of Performance Function
If one does not consider the queues at the ramps, then the essential differences between the application of
CAPRI for an intersection and an interchange are:
1. the phases and the phase order are different,
2. additional constraints for clearing the queued vehicles on the arterial segment between the two
intersections of the interchange may be imposed, and
3. predictions of arrivals and queues for more locations are needed.
Here the performance functions based on delays are essentially the same. In the computation of the delay-
based performance measure, every second a vehicle is delayed at the intersections being controlled
contributes an additional one vehicle-second to the overall objective function value. Equivalently, one-
second delay of VT, a vehicle going straight through on the arterial, is equal to one-second delay of a
vehicle VL waiting to make a left turn on to the on-ramp.
However, when one considers the queues at the on-ramps that may result in an additional delay for VL, then
the last statement is not necessarily correct. For example, if one knows that it will take 10 seconds for
vehicle VL to reach the ramp-meter but the current queue q(t) at the ramp meter is large so that the vehicle
will have to wait an additional 3 seconds at the on-ramp anyway, then there is no decrease in the total delay
of vehicle VL through the interchange if it is held back another 3 seconds at the intersection traffic signal.
In the meantime, other vehicles like VT may be able to get through the interchange without incurring a
traffic signal delay.
On the other hand, if there is no queue, or a small queue, at the ramp meter then one-second delay of VL
does in fact contribute 1 vehicle-second to the overall objective function value. Thus, depending on the
size of queue, if it exists, at the on-ramp, as well as on the turning ratio for getting on to the ramp, a one-
second delay of vehicle VL may have to be "discounted" using a multiplicative factor ρ, 0 < ρ < 1. Details
of this discounting approach are given in the earlier RHODES-ITMS Project report [Head and
Mirchandani, 1997].

29
2.5. Simulation Results for the Tempe Interchange
Integration of CORSIM, PREDICT and CAPRI
As described earlier, CORSIM was used for laboratory testing the real-time traffic control algorithms for
the freeway-arterial diamond interchange. Current system timing strategies, and associated timing
parameters were obtained from the City of Tempe. Physical characteristics of the interchange were
observed and required measurements such as distances from the intersections to the ramp-meters, the
lengths of left-turn bays, distances between the detectors and stop bar, etc., were obtained either from
detailed drawings of the interchange or through actual measurements. Although the simulation model was
not validated - to see if it exactly represented the Rural/ US 60 interchange, the research team felt that it
was sufficiently realistic for laboratory testing of the algorithms.
Briefly, the simulation procedure for the integrated set-up worked as follows:
1. Check if specified simulation end time has been reached. If yes, STOP.
2. Otherwise, simulate the traffic dynamics for one second (by execution of CORSIM)
3. Collect specified measures of effectiveness
4. Collect detector outputs and the signal states in the last second
5. Update predicted arrivals and queues (using PREDICT)
6. Check if CAPRI needs to be executed for the given predictions. If no, then go to Step 1.
7. Otherwise, run CAPRI for the specified rolling horizon. Schedule time for next CAPRI execution
8. Implement recommended phase decisions, and go to Step 1.
Simulation Results
Two scenarios were considered in the simulation testing. The first scenario consisted of semi-actuated (or
coordinated actuated) control using signal phasing currently adopted by Tempe. This was for comparison
purposes. The second scenario used an implementation of the RHODES algorithms.
Five loading factors were considered, all of them having relatively high transient loads to allow for some
queue build-ups at the ramps, in order to test the effectiveness of the RHODES algorithms. Figure 11 gives
a sample profile of traffic volumes input in one direction of the main arterial of the interchange (the other
direction had a similar profile). With this arrival pattern, during the peaks the interchange is oversaturated
(with large queues at the intersections and the ramps) and during the intervening lulls the congestion clears
out. Observe that in the 240 minutes of simulation time, there are four peaks with oversaturated conditions

30
-- somewhat unrealistic as normal traffic conditions. However, since it is anticipated that a signal system
that is truly traffic-responsive will be most beneficial in highly varying traffic conditions this profile was
used to emphasize the potential benefits of a traffic-adaptive system.
0
200
400
600
800
1000
1200
1400
1600
1800
0 60 120 180 240
Minutes of Simulation
Inpu
t Vol
ume
Leve
l (vp
h)
Figure 11 - Sample traffic volume profile for vehicles entering the interchange
For each of the loads, five runs were conducted for the “actuated” scenario and five for the “RHODES-
ITMS” scenario. The lowest load averaged approximately 3100 vehicle-trips per hour through the
interchange. In the next four levels, approximately 3250, 3450, 3600 and 3750 vehicle trips per hour were
loaded, respectively. Figure 12(a) shows total delay (in seconds per vehicle) of the vehicles through the
interchange; and 12(b) the total number of vehicles trips on the links of the interchange, for each of the 25
runs for the two control scenarios.
Observe first, from Figure 12(b), that the number of trips through the interchange was mostly the same for
actuated and RHODES-ITMS scenarios. This should be expected since in steady state the number entering
must equal to the number exiting for otherwise the queues would grow indefinitely and oversaturation
would take place. Now observe, from Figure 12(a) that the total vehicle delay for RHODES-ITMS was
always lower than for the actuated scenario. RHODES-ITMS reduced average delays by 18.3%, 20.1%,
19.2%, 18.5%, and 17.5% for load levels 1 to 5, respectively. (See Table 1).

31
(a)
(b)
Figure 12 - (a) Total vehicle delay and (b) vehicle trips served using
actuated control and RHODES-ITMS control strategies
0
5
10
15
20
25
30
35
0 5 10 15 20 25
Simulation Run
Del
ay (s
ec/v
eh)
Actuated RHODES-ITMS
0
500
1000
1500
2000
2500
3000
3500
4000
0 5 10 15 20 25
Simulation Run
Trip
s Se
rved
(veh
/hr)
Actuated RHODES-ITMS

32
Table 1 - Means and variances for vehicle delays (in seconds)
Level 1 Level 2 Level 3 Level 4 Level 5
Actuated Mean 24.98 25.89 26.70 27.10 28.10 Standard Deviation 0.73 0.39 0.26 0.68 0.69
RHODES Mean 20.41 20.69 21.58 22.09 23.19 Standard Deviation 0.35 1.01 0.65 0.66 0.64 Differential 4.57 5.20 5.12 5.01 4.91 (as % of Actuated) 18.3 20.1 19.2 18.5 17.5
To account for the delay based on throughput, one can plot delay per vehicle (in seconds) versus trips per
hour, by dividing the total delay (in vehicle seconds) by the number of vehicles trips completed during the
simulation period. Figure 13 gives such a plot.
Figure 13 - Average vehicle delay versus throughput (vehicle trips per hour) using actuated control and
RHODES-ITMS control strategies
From Table 1 and Figure 13 we see that, in the low load case, RHODES-ITMS results in vehicle delays of
20.4 seconds versus the 25 seconds for the actuated case - a 18.3 % improvement. For the next level the
respective numbers are 20.7 seconds for RHODES-ITMS and 25.9 seconds for the actuated case (a 20.1 %
improvement); for the third level they are 21.6 seconds for RHODES-ITMS versus 26.7 seconds for the
actuated case (a 19.2% improvement) and for the fourth level they are 22.1 seconds for RHODES-ITMS
versus 27.1 seconds for the actuated case (a 18.5% improvement). For the highest level the averages are
23.2 seconds for RHODES-ITMS versus 28.1 seconds for the actuated case (a 17.5% improvement).
0
5
10
15
20
25
30
35
3000 3100 3200 3300 3400 3500 3600 3700 3800 3900Volume (vehicles/hour)
Del
ay (s
econ
ds/v
ehic
le)
RHODES-ITMSActuated
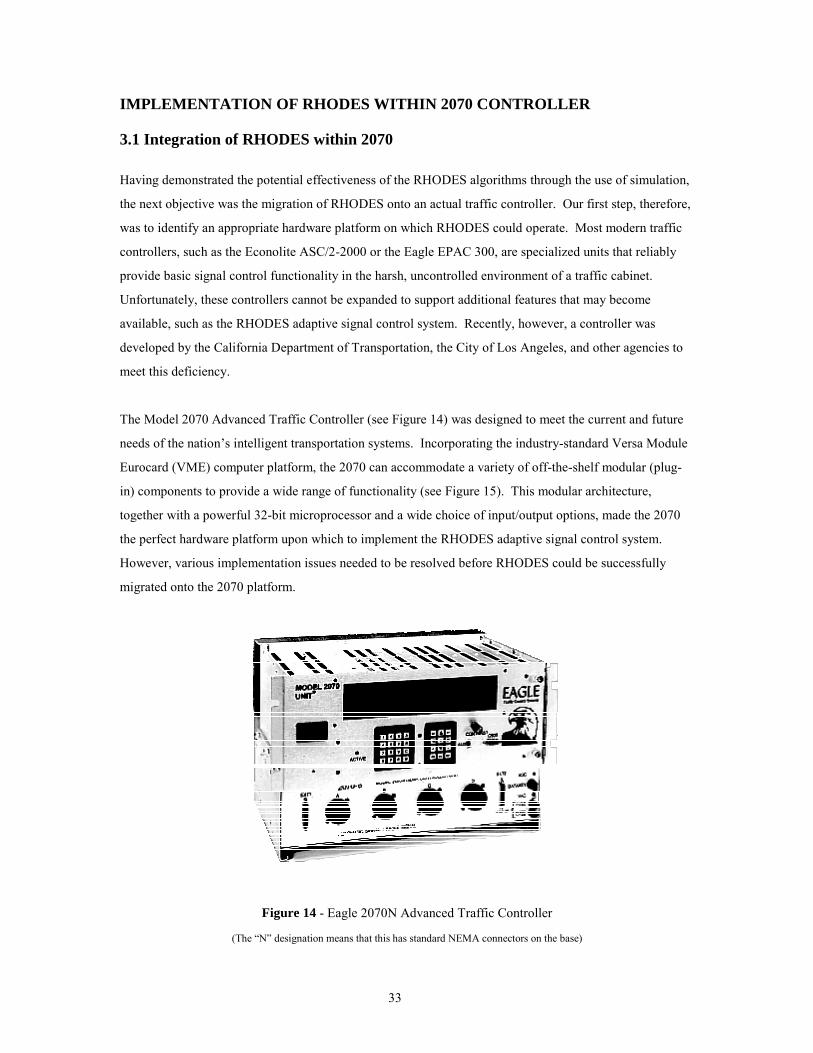
33
IMPLEMENTATION OF RHODES WITHIN 2070 CONTROLLER 3.1 Integration of RHODES within 2070
Having demonstrated the potential effectiveness of the RHODES algorithms through the use of simulation,
the next objective was the migration of RHODES onto an actual traffic controller. Our first step, therefore,
was to identify an appropriate hardware platform on which RHODES could operate. Most modern traffic
controllers, such as the Econolite ASC/2-2000 or the Eagle EPAC 300, are specialized units that reliably
provide basic signal control functionality in the harsh, uncontrolled environment of a traffic cabinet.
Unfortunately, these controllers cannot be expanded to support additional features that may become
available, such as the RHODES adaptive signal control system. Recently, however, a controller was
developed by the California Department of Transportation, the City of Los Angeles, and other agencies to
meet this deficiency.
The Model 2070 Advanced Traffic Controller (see Figure 14) was designed to meet the current and future
needs of the nation’s intelligent transportation systems. Incorporating the industry-standard Versa Module
Eurocard (VME) computer platform, the 2070 can accommodate a variety of off-the-shelf modular (plug-
in) components to provide a wide range of functionality (see Figure 15). This modular architecture,
together with a powerful 32-bit microprocessor and a wide choice of input/output options, made the 2070
the perfect hardware platform upon which to implement the RHODES adaptive signal control system.
However, various implementation issues needed to be resolved before RHODES could be successfully
migrated onto the 2070 platform.
Figure 14 - Eagle 2070N Advanced Traffic Controller
(The “N” designation means that this has standard NEMA connectors on the base)

34
VME CAGE ASSEMBLY, (EXPOSED) SEE NOTE 5
���
��� �����
��� �����
C1S
C11S2070-2AFIELD I/O MODULE
2070-6 2070-4SERIAL COMM MODULE
POWER SUPPLY MODULE2070-1
MCB
MODEL 2070 CHASSIS REAR VIEW
TEES, MARCH 1997 9-7-2
H1 H2 H3 H4
S1 S2 S3 S4 S5
REAR VIEW, LOADED
REAR VIEW, UNLOADED
DATAKEY
SEE NOTE 1
NOTES (THIS DETAIL) 1. Four permanently attached 203.2 mm long Card Guides SAE 1800F (OR EQUAL) beginnning 13 mm from the backplane mounting surface. 2. TB - TRANSITION BOARD MCB - MAIN CONTROLLER BOARD 3. Maximum length of harness shall be 101.60 mm, and shall not protrude beyond the back of the 2070 unit. 4. Blank 1 X Wide panel with two TSD #3, top and bottom. 5. The VME Cage Assembly Opening shall be delivered covered by blank panels (see Note 4). Matching M3 PEM fasteners shall be provided on the back plane surface for panel mounting.
2070-1TB
5.75
165.50 177.00
145.45
15.775.75
SEE NOTE 3
117.22
SEE NOTE 4 SEE
NOTE 4
TITLE:
NO SCALE
141.64
C2S
C20S
TX RX
TX RX
ENABLE
DISABLE
MODEM
ENABLE
DISABLE
MODEM
VME CAGE ASSEMBLY
��� �����
�����
20.00 10.00
2070-7ASYNC SERIAL COMM MODULEC21S
C22S
TX RX
TX RXON
OFF
C12S
Figure 15 - Rear view of the 2070 showing the VME Chassis [Miller, 1996]

35
The research team’s first issue concerned the processing and memory requirements of RHODES. Up to
this point in its development, RHODES had existed as a Dynamic Link Library (DLL) software module
containing the various control functions comprising the RHODES algorithms. Using the TSIS simulation
environment and the CORSIM traffic simulator, a selected intersection would be placed under RHODES
control by making a procedure call to the appropriate RHODES routines, once each second, to update the
status of the traffic signal according to the phase durations produced by RHODES. All communication
between RHODES and CORSIM was handled through a shared-memory environment that allowed each
program to communicate indirectly with the other in order to exchange information on detector actuations
and signal status indications. In addition, as the software was run within a personal computer (PC)
environment with a large amount of RAM and disk space available, memory typically was not an issue. In
addition, processing power merely affected how long it would take a given simulation to complete in real-
world time, since the same basic computations would be completed, regardless of the speed of the PC’s
processor. Each time CORSIM placed a call to RHODES, requesting an update to the current signal status,
the CORSIM simulation would be paused until the RHODES procedure returned its results. Thus,
regardless of how much time had elapsed in the real world while RHODES performed its computations,
only one second would have elapsed during this time in the simulation world. However, when running in a
real-world environment within a 2070, RHODES would have a finite computational time budget and a
memory budget to work with in order to produce timely and usable results.
As a result, the first task was to identify a processing environment that would allow RHODES to complete
its computations within the desired time budget without exceeding the available memory. While the 2070’s
Motorola 68360 processor was indeed more powerful than those used in previous controllers, after
examining RHODES’ requirements in its current environment, it was determined that the 68360 would be
insufficient to meet the computational load of the RHODES algorithms on top of the controller’s current
traffic control processing functions. For this reason, a modular processor that would fit in an available
VME slot within the 2070 was considered for housing the RHODES software.
The research team first looked at Matrix Corporation’s PENTX card, which consisted of a Pentium 133
MHz processor on a VME board, designed to provide full PC functionality for rugged, embedded
applications. While the PENTX card provided a suitable platform for the RHODES algorithms within the
2070, and was successfully implemented as such, issues arose regarding its selection. For one, since the
PENTX card was intended to provide the functionality of a full-fledged PC, all of the necessary peripherals
needed to actually develop the application and make any modifications to it required that an external
monitor, mouse, keyboard, hard disk and floppy drive be made available (usually in a standard mini-tower
PC case), all of which were then to be connected to the PENTX card via external cables. While a potential
benefit was the PENTX card’s use of the Windows™ NT operating system, as it required less work to port

36
the source code, NT is not a real-time OS and includes much more functionality than is required for our
purposes. These issues, in conjunction with concerns over the ability of the PENTX board to provide
sufficient processing capability to satisfy the real-time operating requirement, led the research team to
abandon the development on the PENTEX and consider other processing platforms.
As a result, a field-hardened processor manufactured by Mikro Elektronik Gmbh (MEN) in Nürnberg,
Germany (see Figure 16) was selected for RHODES processing. Containing a Motorola 68060 processor
running at 25 MHz (4.5 MIPS) with 32MB of SDRAM and 4MB of flash memory, this MEN card would
also be capable of providing an operating platform for RHODES, but without the need for any external
peripherals to provide access during development and/or operation. In addition, the MEN card used the
same OS-9 real-time operating system as the 2070’s 68360 processor. Use of the same operating system
not only simplifies the interface between RHODES and the controller software, but also facilitates the
eventual migration of the entire RHODES system onto the primary controller processor as future advances
increase its computational power.
With the operating environment now completely determined, it was now necessary to migrate RHODES
from Windows™ NT to OS-9. In addition, a means for communicating between RHODES and the
controller software had to be developed. Whereas before RHODES communicated more or less directly
with its environment via a segment of shared memory, in this environment a new communications method
had to be created. In this endeavor, the UA research team worked with Gardner Transportation Systems
(now a business unit of Siemens Energy and Automation, Inc.) to design an interface between RHODES
and NextPhase, Gardner’s traffic control software for the 2070.
Figure 16 - MEN Card

37
As the traffic control software residing on the 2070, NextPhase would receive all controller inputs from the
cabinet, such as pedestrian calls, detector actuations and signal states, and would provide all controller
outputs, namely the current signal decisions. RHODES, residing on the 68060 processor on the MEN card,
would receive its input from NextPhase and send its output to NextPhase, with RHODES having no direct
connection to the traffic cabinet; NextPhase would be the intermediary between RHODES and the traffic
cabinet. In field operation, NextPhase would implement signal changes according to either its own internal
logic or, when RHODES is operating, according to the optimized signal phase settings received from
RHODES (see schematic in Figure 17). In this configuration, phase settings received from RHODES
would be subject to any constraints in place in NextPhase, such as minimum green times and pedestrian
clearance intervals. In addition, the NEMA TS2 cabinet specification includes a Malfunction Management
Unit (MMU) that continuously monitors the signal indications received from the controller to ensure that
no conflicting movements (e.g., intersecting green phases) are permitted. Therefore, in this configuration,
no explicit conflict resolution logic is required within RHODES as the supporting hardware environment
already provides it.
Figure 17 - Data transfer within the 2070
Using the concept of a pipe, which is a software construct that provides buffering/queueing of messages,
several communications channels between the RHODES process (residing on the MEN card) and the
NextPhase software (residing on the 2070’s 68360 processor) were created. This was done using a shared
area of memory on the MEN card for storage of the actual messages and communicated over the internal
VME bus.
The data passed between RHODES and NextPhase were organized into four distinct messages (see Figure
18). The first is the ModeMsg, to be passed from NextPhase to RHODES once per second. This message
contains both the current “traffic plan number” and the “mode” in which RHODES should be currently
68360 CPU(NextPhase)
68060 CPU(RHODES)
2070
DetectorActuations
SignalPhase Settings
SignalPhase Settings
DetectorActuations
68360 CPU(NextPhase)
68060 CPU(RHODES)
2070
DetectorActuations
SignalPhase Settings
SignalPhase Settings
DetectorActuations

38
operating. The “traffic plan number” allows RHODES to load time-of-day (TOD) specific information as
needed, for example, different min/max green values to match those of the changing TOD plans within
NextPhase. The “mode” reflects the method of RHODES operation, according to the current NextPhase
setting, which is user determined. RHODES operates in three different modes, OFFLINE, STANDBY or
ONLINE, indicating that RHODES is either not in operation; running in the background and passively
collecting data; or is in control of the intersection signals, respectively.
Figure 18 - Messages exchanged between NextPhase and RHODES each second
The second message is the SyncTimeMsg, passed from NextPhase to RHODES once per second for the
purpose of ensuring that the operating system clocks on both processors are in synch -- by modifying the
clock on the MEN card, if necessary, to match that of the 2070’s 68360 processor.
The third, DetectorMsg, contains the values of all (up to 64) local detectors (i.e., those connected to the
cabinet in which the 2070 resides) as well as the current signal status. This information is critical in order
for RHODES to maintain an accurate picture of the intersection over which it has control. Upon receiving
this data, RHODES updates its internal databases to reflect the changes since the last update. When
running in ONLINE mode (i.e., RHODES is in control of the intersection’s traffic signals) RHODES
reruns, when necessary, its optimization routine, CAPRI, to determine the optimal signal phasing to
implement. This information, in the form of forceoffs and holds, is communicated back to NextPhase via
the SignalMsg returned by RHODES. Upon receipt of this message, NextPhase attempts to implement the
signal phasing requested by RHODES. Note that it is possible that RHODES will not have its requested
signal phasing put into effect by NextPhase, if for doing so conflicts, for instance, with timing parameters
such as min/max greens. While this should not occur if care is taken when configuring RHODES so that
all such parameters are in agreement, it is important to note that NextPhase, and hence the 2070, has the
“final say” on what signal phasing is allowed. In addition, for emergency vehicle preemption, in which a
specific phase is requested for the expedient passage of an emergency vehicle through the intersection, the
control was configured so that NextPhase assumes control of the intersection for the duration of the
preemption, effectively ignoring any signal phasing requests received from RHODES. It is in light of this
NextPhaseSignalMsg
DetectorMsg RHODESSyncTimeMsg
ModeMsg
NextPhaseSignalMsg
DetectorMsg RHODESSyncTimeMsg
ModeMsg

39
possibility that, as part of the DetectorMsg, RHODES receives information regarding the current signal
phasing, so that it may determine if its last request was honored or not and can update its data accordingly.
At this point in the project, the communication system between the two processes was finalized. The
system allowed RHODES to receive data from the intersection and return optimized signal phasing
requests, in real-time. During laboratory testing, the research team experimented with varying latencies for
the different message types to investigate which were feasible given the load placed on each processor by
its various tasks. It was found that the RHODES’ optimization algorithm, CAPRI, required less than a
second of processing time to complete its computations, under all but the most congested traffic conditions,
with the database update requiring minimal additional processing time.
3.2 Testing RHODES/2070 with Hardware-in-the-Loop Simulation
With RHODES implemented on the MEN card within the 2070 controller, the next step was to verify the
data path between RHODES and the hardware in a realistic environment, which essentially consisted of
two subtasks. First, it was necesary to verify communications between the real world and the 2070, then
between the 2070 and RHODES. The Controller Interface Device (CID), developed by Bullock [1997] was
utilized for this purpose. Using a CID, a TS1 cabinet environment was simulated with a CORSIM
simulation model generating detections and receiving signal phasing from a 2070. As shown in Figure 19,
the CID is connected to a 2070N using the standard NEMA - A, B, C connectors. The CID, in turn, is
connected, via a serial cable, to a PC running a CORSIM simulation. (Although the 2070 would be
installed within a TS2 cabinet at the Tempe interchange, a TS1 environment was used instead because a
CID using the NEMA TS2’s SDLC connection is not available currently.)
Figure 19 - TS1 Controller Interface Device

40
In this configuration, an intersection within the simulation is flagged for external control via the CID
interface, much as was done during the earlier software-only simulations. Then, as vehicles within the
simulation traverse the detectors located on the approaches to this intersection, actuations are sent over the
NEMA - A, B, C connectors to the 2070, just as they would be in a real TS1 traffic cabinet environment.
NextPhase then encapsulates this detector data within a DetectorMsg and passes it to RHODES via the
internal VME bus. Upon receipt of this message, RHODES re-computes its optimized signal phasing
considering any new detector data it may have received and issues a request for a specific signal phase via a
set of holds and forceoffs. The signal phase request is encapsulated within the SignalMsg for transmission
to NextPhase. NextPhase then implements the desired signal request, always ensuring, of course, that no
timing constraints are violated. This results in the signal to either remain in the same phase or to begin
transitioning to a different one. To communicate this information to the cabinet load switches, NextPhase
sends this request out via the NEMA - A, B, C connectors connected to the CID. Upon receipt of the signal
phasing request, the CID passes it on to the CORSIM simulation model via the serial interface connecting
the CID and the PC. Accordingly, CORSIM then updates the status of the externally controlled
intersection signals.
This entire cycle, from CORSIM to CID to 2070 to NextPhase to RHODES and back again, is repeated
every second, and, most importantly, is performed in real-time! Unlike software-only simulation,
hardware-in-the-loop simulation, because it incorporates actual traffic control hardware, operates in real
time. As a result, hardware-in-the-loop simulation afforded the research team the first opportunity to
evaluate how RHODES would operate in a real-world environment.
Using the CORSIM (software-only) simulation of the U.S. 60 & Rural Road interchange that was used to
provide the results in section 2.5, several extended tests of RHODES within the hardware-in-the-loop
simulation environment were performed. These tests confirmed that all data received at the hardware
interface properly reflected the data that was being received/transmitted by NextPhase and hence,
RHODES. Most importantly, it was verified that, under realistic loading conditions, RHODES would be
able to complete its required data transfer and processing within the available time budget, ensuring that it
operates successfully in real-time. With the hardware-in-the-loop simulation completed, the research team
was now ready to implement a RHODES-enabled 2070 within a TS2 cabinet to reflect the environment at
the field test location.
41
4. IMPLEMENTATION OF RHODES IN THE FIELD 4.1 Integration of RHODES/2070 Controller/TS2 Cabinet
Surprisingly enough, though the 2070 is an Advanced Traffic Controller, it was not designed to be placed
within a TS2 Type 2 cabinet. As a result, one of the first problems experienced in the field implementation
was installing a 2070 in a TS2 cabinet. To do this, several different hardware-related issues had to be
resolved.
In a TS2 cabinet, the unwieldy point-to-point wiring of the TS1 cabinet has been replaced by a backplane
comprising a high-speed Synchronous Data Link Control (SDLC) serial data bus interconnecting all of the
cabinet equipment. SDLC is a standard communication protocol and its use helps to ensure compatibility
between hardware manufacturers as well as makes communication between components simpler, allowing
components to be added in a modular fashion. In a TS2 cabinet, a Bus Interface Unit (BIU) is used to
provide a communication interface between the controller and groups of detectors and load switches. In the
typical configuration, detectors are arranged in “racks” of up to 16 detector cards each, with load switches
arranged in “racks” of up to 8 each. A BIU in each rack handles communication between the rack
components and the rest of the cabinet over the SDLC bus. Hence, for the 2070 to operate the cabinet, it
must be able to communicate properly with each BIU in order to communicate with its associated elements.
When testing the 2070 within a TS2 cabinet, the research team found that there were problems with the
communication via the BIU. The problem was traced to the C12 capacitor on the BIU, which was not
capable of holding the RS485 signal up long enough for the 2070 to read the entire message. After
notifying Econolite (the manufacturer of the BIUs used in the Tempe cabinet) of the problem, ‘modified’
BIUs which contained a different capacitor were received. In addition, as the Autoscope units incorporate
the BIU functionality, these also were sent back for modification, so that the 2070 would be able to
communicate with them to receive the associated detections.
After resolving the BIU problem, an incompatibility between the Econolite ASC2-2100 controller and the
Eagle 2070 was discovered in the next attempt to place a 2070 within a TS2 cabinet. The Econolite
controller, via its A connector, provides an input to the cabinet’s fault monitor which indicates whether the
controller is active or not, signaling the possible presence of a fault. Unfortunately, the 2070 does not
provide this functionality. So, the initial, temporary, stopgap solution was to ground the fault monitor input
on the cabinet’s backplane with a jumper in order for the 2070 to operate in the cabinet. The final solution
to this problem was to utilize the fault monitor output of the NEMA A connector of the 2070-8 base unit
and set this value from within the NextPhase software to mirror the functionality of the Econolite

42
controller. It is for this reason, as well as another to be explained below, that the 2070-8 NEMA base was
utilized as part of the 2070 implementation.
Yet, there was one more hardware issue to resolve. As mentioned earlier, the 2070 was not intended for
use in a TS2 Type 2 cabinet. The 2070 Field Input/Output module comes in two versions. The 2070-2 is
supplied with the basic 2070 controller and has both C1S and C11S 170-style connectors while the 2070-
2A is supplied with the 2070N controller and has no inputs other than the connector from the 2070-8
NEMA base unit. As neither of these modules supplied the input/output needs alone, an alternative means
of making an SDLC connection was necessary. To do this, one of the external serial ports (EXT1) on the
front of the 2070-8 NEMA base unit was utilized as a SDLC port. Using this port required an adapter
between the standard 15-pin sub D connector and the 25-pin sub D connector on the front of the 2070, but
required no further hardware modification. Together with the need to utilize the fault monitor pin of the
NEMA A connector, the usage of the EXT1 serial port required that the 2070 be used in its NEMA
configuration, with the 2070-8 base unit and the 2070-2A FIO module.
At this point in the project, all hardware-related issues affecting the ability of the 2070 to operate within the
Tempe TS2 cabinet had been resolved, and the research team focused on providing the input to RHODES.
In order for RHODES to receive detector data from the many detectors located around the interchange (see
Figure 20), detector inputs needed to be mapped between the various elements that would handle them.
While some detector actuations would be received from more traditional inductive loops, the vast majority
were ‘virtual’ actuations received from the two Autoscope Machine Vision Processors (MVP) located
within the cabinet. For the Tempe interchange configuration, 8 Autoscope cameras were used,
necessitating the use of two MVPs, as each can only handle up to four cameras. As mentioned earlier, the
Autoscope MVP incorporates the BIU functionality, so Autoscope actuations are passed over the SDLC
data bus in the same manner as other actuations. However, as the input from each individual detector is
partially identified by its associated BIU, a mapping was needed between each of the detector inputs
RHODES expected to see and where these data sources existed in the cabinet. Using this mapping,
NextPhase could be configured properly to ensure that the data received by RHODES reflected its view of
which detector would be associated with the data. Table 2 shows the mapping between the various passage
and presence detectors placed along the six approaches of the interchange, as labeled in Figure 20. Note
that detectors 91-93 and 97-99 are listed as ‘Peer’ detectors and are shown coming into the 2070 directly,
rather than via a BIU as the others do. The purpose of these detectors and how their data were sent to
RHODES will be described in the next section. Otherwise, they were treated as any other detector input in
terms of how RHODES processed this detector data.

43
N
93 91 92
34
36 35
38
40 39
99 97 98
Embassy Suites
Southern Avenue
9 7 8 10 29 31 30 28
1 2 3 4 5
24 26 25 23 14 12 13 15
21 20 19 18 17
Detector Locations
US60 & Rural Road
TS2
Approach 1
Approach 2
Approach 3
Approach 4
Approach 5
Approach 6
US 60
Rural Road
41 Detectors
Figure 20 – Detector location diagram (not to scale)

44
Tabl
e 2
- Det
ecto
r map
ping
bet
wee
n TS
2/Ne
xtPh
ase/
RH
OD
ES
D
etec
tor T
ype
Det
ecto
r Loc
atio
nA
ppro
ach
Equi
pmen
t Con
nect
ion
TS2
Cab
inet
Con
nect
ion
Nex
tPha
seR
HO
DES
Pres
ence
Sout
hbou
nd R
ight
Tur
n Po
cket
1Au
toSc
ope
2 - S
witc
h 2
- LED
1R
ack
2 - D
etec
tor 1
Det
ecto
r 1D
etec
tor 1
Pres
ence
Sout
hbou
nd T
hrou
gh L
ane
11
Auto
Scop
e 2
- Sw
itch
2 - L
ED 2
Rac
k 2
- Det
ecto
r 2D
etec
tor 2
Det
ecto
r 2Pr
esen
ceSo
uthb
ound
Thr
ough
Lan
e 2
1Au
toSc
ope
2 - S
witc
h 2
- LED
3R
ack
2 - D
etec
tor 3
Det
ecto
r 3D
etec
tor 3
Pres
ence
Sout
hbou
nd T
hrou
gh L
ane
31
Auto
Scop
e 2
- Sw
itch
2 - L
ED 4
Rac
k 2
- Det
ecto
r 4D
etec
tor 4
Det
ecto
r 4Pr
esen
ceSo
uthb
ound
Thr
ough
Lan
e 4
1Au
toSc
ope
2 - S
witc
h 2
- LED
5R
ack
2 - D
etec
tor 5
Det
ecto
r 5D
etec
tor 5
Auto
Scop
e 2
- Sw
itch
2 - L
ED 6
Rac
k 2
- Det
ecto
r 6D
etec
tor 6
Pass
age
Sout
hbou
nd B
ridge
Thr
ough
Lan
e 1
6Au
toSc
ope
2 - S
witc
h 2
- LED
7R
ack
2 - D
etec
tor 7
Det
ecto
r 7D
etec
tor 7
Pass
age
Sout
hbou
nd B
ridge
Thr
ough
Lan
e 2
6Au
toSc
ope
2 - S
witc
h 2
- LED
8R
ack
2 - D
etec
tor 8
Det
ecto
r 8D
etec
tor 8
Pass
age
Sout
hbou
nd B
ridge
Thr
ough
Lan
e 3
6Au
toSc
ope
2 - S
witc
h 6
- LED
1R
ack
2 - D
etec
tor 9
Det
ecto
r 9D
etec
tor 9
Pass
age
Sout
hbou
nd B
ridge
Thr
ough
Lan
e 4
6Au
toSc
ope
2 - S
witc
h 6
- LED
2R
ack
2 - D
etec
tor 1
0D
etec
tor 1
0D
etec
tor 1
0Au
toSc
ope
2 - S
witc
h 6
- LED
3R
ack
2 - D
etec
tor 1
1D
etec
tor 1
1Pr
esen
ceSo
uthb
ound
Brid
ge T
hrou
gh L
ane
16
Auto
Scop
e 2
- Sw
itch
6 - L
ED 4
Rac
k 2
- Det
ecto
r 12
Det
ecto
r 12
Det
ecto
r 12
Pres
ence
Sout
hbou
nd B
ridge
Thr
ough
Lan
e 2
6Au
toSc
ope
2 - S
witc
h 6
- LED
5R
ack
2 - D
etec
tor 1
3D
etec
tor 1
3D
etec
tor 1
3Pr
esen
ceSo
uthb
ound
Brid
ge T
hrou
gh L
ane
36
Auto
Scop
e 2
- Sw
itch
6 - L
ED 6
Rac
k 2
- Det
ecto
r 14
Det
ecto
r 14
Det
ecto
r 14
Pres
ence
Sout
hbou
nd B
ridge
Lef
t Tur
n Po
cket
6Au
toSc
ope
2 - S
witc
h 6
- LED
7R
ack
2 - D
etec
tor 1
5D
etec
tor 1
5D
etec
tor 1
5Pa
ssag
eEa
stbo
und
Offr
amp
5Au
toSc
ope
2 - S
witc
h 6
- LED
8R
ack
2 - D
etec
tor 1
6D
etec
tor 1
6D
etec
tor 1
6Pr
esen
ceN
orth
boun
d R
ight
Tur
n Po
cket
4Au
toSc
ope
1 - S
witc
h 3
- LED
1R
ack
3 - D
etec
tor 1
Det
ecto
r 17
Det
ecto
r 17
Pres
ence
Nor
thbo
und
Thro
ugh
Lane
14
Auto
Scop
e 1
- Sw
itch
3 - L
ED 2
Rac
k 3
- Det
ecto
r 2D
etec
tor 1
8D
etec
tor 1
8Pr
esen
ceN
orth
boun
d Th
roug
h La
ne 2
4Au
toSc
ope
1 - S
witc
h 3
- LED
3R
ack
3 - D
etec
tor 3
Det
ecto
r 19
Det
ecto
r 19
Pres
ence
Nor
thbo
und
Thro
ugh
Lane
34
Auto
Scop
e 1
- Sw
itch
3 - L
ED 4
Rac
k 3
- Det
ecto
r 4D
etec
tor 2
0D
etec
tor 2
0Pr
esen
ceN
orth
boun
d Th
roug
h La
ne 4
4Au
toSc
ope
1 - S
witc
h 3
- LED
5R
ack
3 - D
etec
tor 5
Det
ecto
r 21
Det
ecto
r 21
Auto
Scop
e 1
- Sw
itch
3 - L
ED 6
Rac
k 3
- Det
ecto
r 6D
etec
tor 2
2Pa
ssag
eN
orth
boun
d Br
idge
Thr
ough
Lan
e 1
3Au
toSc
ope
1 - S
witc
h 3
- LED
7R
ack
3 - D
etec
tor 7
Det
ecto
r 23
Det
ecto
r 23
Pass
age
Nor
thbo
und
Brid
ge T
hrou
gh L
ane
23
Auto
Scop
e 1
- Sw
itch
3 - L
ED 8
Rac
k 3
- Det
ecto
r 8D
etec
tor 2
4D
etec
tor 2
4Pa
ssag
eN
orth
boun
d Br
idge
Thr
ough
Lan
e 3
3Au
toSc
ope
1 - S
witc
h 7
- LED
1R
ack
3 - D
etec
tor 9
Det
ecto
r 25
Det
ecto
r 25
Pass
age
Nor
thbo
und
Brid
ge T
hrou
gh L
ane
43
Auto
Scop
e 1
- Sw
itch
7 - L
ED 2
Rac
k 3
- Det
ecto
r 10
Det
ecto
r 26
Det
ecto
r 26
Auto
Scop
e 1
- Sw
itch
7 - L
ED 3
Rac
k 3
- Det
ecto
r 11
Det
ecto
r 27
Pres
ence
Nor
thbo
und
Brid
ge T
hrou
gh L
ane
13
Auto
Scop
e 1
- Sw
itch
7 - L
ED 4
Rac
k 3
- Det
ecto
r 12
Det
ecto
r 28
Det
ecto
r 28
Pres
ence
Nor
thbo
und
Brid
ge T
hrou
gh L
ane
23
Auto
Scop
e 1
- Sw
itch
7 - L
ED 5
Rac
k 3
- Det
ecto
r 13
Det
ecto
r 29
Det
ecto
r 29
Pres
ence
Nor
thbo
und
Brid
ge T
hrou
gh L
ane
33
Auto
Scop
e 1
- Sw
itch
7 - L
ED 6
Rac
k 3
- Det
ecto
r 14
Det
ecto
r 30
Det
ecto
r 30
Pres
ence
Nor
thbo
und
Brid
ge L
eft T
urn
Pock
et3
Auto
Scop
e 1
- Sw
itch
7 - L
ED 7
Rac
k 3
- Det
ecto
r 15
Det
ecto
r 31
Det
ecto
r 31
Pass
age
Wes
tbou
nd O
ffram
p2
Auto
Scop
e 1
- Sw
itch
7 - L
ED 8
Rac
k 3
- Det
ecto
r 16
Det
ecto
r 32
Det
ecto
r 32
Pres
ence
Nor
thbo
und
Brid
ge L
eft T
urn
Pock
etLo
cal L
oop
- Dire
ct C
onne
ctR
ack
1 - D
etec
tor 1
Det
ecto
r 33
Pres
ence
Wes
tbou
nd O
ffram
p R
ight
Tur
n Po
cket
2Lo
cal L
oop
- Dire
ct C
onne
ctR
ack
1 - D
etec
tor 2
Det
ecto
r 34
Det
ecto
r 34
Pres
ence
Wes
tbou
nd O
ffram
p M
iddl
e La
ne2
Loca
l Loo
p - D
irect
Con
nect
Rac
k 1
- Det
ecto
r 3D
etec
tor 3
5D
etec
tor 3
5Pr
esen
ceW
estb
ound
Offr
amp
Left
Turn
Poc
ket
2Lo
cal L
oop
- Dire
ct C
onne
ctR
ack
1 - D
etec
tor 4
Det
ecto
r 36
Det
ecto
r 36
Pres
ence
Sout
hbou
nd B
ridge
Lef
t Tur
n Po
cket
Loca
l Loo
p - D
irect
Con
nect
Rac
k 1
- Det
ecto
r 5D
etec
tor 3
7Pr
esen
ceEa
stbo
und
Offr
amp
Left
Turn
Poc
ket
5Lo
cal L
oop
- Dire
ct C
onne
ctR
ack
1 - D
etec
tor 6
Det
ecto
r 38
Det
ecto
r 38
Pres
ence
East
boun
d O
ffram
p M
iddl
e La
ne5
Loca
l Loo
p - D
irect
Con
nect
Rac
k 1
- Det
ecto
r 7D
etec
tor 3
9D
etec
tor 3
9Pr
esen
ceEa
stbo
und
Offr
amp
Rig
ht T
urn
Pock
et5
Loca
l Loo
p - D
irect
Con
nect
Rac
k 1
- Det
ecto
r 8D
etec
tor 4
0D
etec
tor 4
0Pa
ssag
eSo
uthb
ound
Ups
tream
Thr
ough
Lan
e 1
120
70 -
Port
1Pe
er 1
- D
etec
tor 1
Peer
1 -
1D
etec
tor 9
1Pa
ssag
eSo
uthb
ound
Ups
tream
Thr
ough
Lan
e 2
120
70 -
Port
1Pe
er 1
- D
etec
tor 2
Peer
1 -
2D
etec
tor 9
2Pa
ssag
eSo
uthb
ound
Ups
tream
Thr
ough
Lan
e 3
120
70 -
Port
1Pe
er 1
- D
etec
tor 3
Peer
1 -
3D
etec
tor 9
3Pa
ssag
eN
orth
boun
d U
pstre
am T
hrou
gh L
ane
34
2070
- Po
rt 1
Peer
4 -
Det
ecto
r 4Pe
er 4
- 4
Det
ecto
r 97
Pass
age
Nor
thbo
und
Ups
tream
Thr
ough
Lan
e 2
420
70 -
Port
1Pe
er 4
- D
etec
tor 5
Peer
4 -
5D
etec
tor 9
8Pa
ssag
eN
orth
boun
d U
pstre
am T
hrou
gh L
ane
14
2070
- Po
rt 1
Peer
4 -
Det
ecto
r 6Pe
er 4
- 6
Det
ecto
r 99

45
4.2 Integration of RHODES within Tempe TOC
With the hardware issues more or less resolved, the research team was now at the point where the Econolite
controller could be replaced with an Eagle 2070 and have it control the interchange using the NextPhase
traffic control software to mimic the functionality of the Econolite. Furthermore, RHODES could now
receive all local detector actuations, as well as the signal indications, run its optimization routines and issue
signal requests to the cabinet hardware. However, RHODES was not quite ready to control the
interchange. In addition to the local detector actuations from the interchange (detectors 1 through 40 on
Figure 20), the implementation also called for upstream peer data from the intersections of Rural &
Southern and Rural & Embassy Suites (detectors 91-93 and 97-99 on Figure 20). This data was required to
provide RHODES with the ability to predict future vehicle arrivals at the north and southbound approaches
to the interchange in order to determine an optimal signal phasing for the next several seconds (refer to the
discussion in Section 2.3).
As the City of Tempe did not have any upstream passage detection capability on the north and southbound
approaches to the interchange, it was decided to add this capability in the following way. First, the
northbound-facing camera of the Autoscope system currently in place, but unused, at the intersection of
Rural & Southern was turned 180 degrees and was pointed down at a steep angle, so that it could obtain
“farside” (after the intersection) detections for the traffic that would be arriving from the north of the
interchange. Next, the City of Tempe installed a Remote Traffic Microwave Sensor (RTMS) on the farside
of the northbound approach of Rural & Embassy Suites to provide detection data for the traffic that would
be arriving from the south of the interchange.
Once the detection equipment was in place, a way to communicate the detector actuations to RHODES was
needed. To provide this capability, the RHODES research team requested that Computran Systems
Corporation, through the City of Tempe, make a small modification to its Metropolitan Traffic Control
System (MTCS), which Tempe uses to monitor all of its signalized intersections. Computran, through a
subcontract with UA, added the ability to obtain second-by-second signal and detector data from a number
of intersections surrounding the U.S. 60 & Rural interchange, including the two of interest, and
communicating this data back to the MTCS at Tempe’s Traffic Operations Center (TOC) where it could be
accessed. Next, the specific data RHODES required from within this new data stream needed to be isolated
and, subsequently, sent to RHODES, within the 2070 at the interchange. Towards this end, it was decided
to create a software program that would read in the output from the MTCS modification, and filter out the
specific data desired (i.e., detections from the two intersections of interest). This program would then
repackage this data and transmit it to RHODES over a phone line between the TOC and the interchange,
using an external modem at each end. Upon arrival at the interchange, NextPhase would read the data, via

46
an available serial port on the back of the 2070, where it would then be passed on to RHODES each second
via an internal communications channel over the VME bus. This configuration is illustrated in Figure 21.
Figure 21 - Physical configuration of the Peer Communications Network
To provide this functionality, a personal computer (PC) was located within the computer room of the
Tempe TOC in order to have direct access to the output from the Computran system via a serial connection.
Using the Windows™ NT operating system, a service called ITMSComm was installed on the PC. This
service is used by Gardner Transportation Systems (GTS) to provide communication between its Advanced
Traffic Management System, icons™, which was also installed on the PC, and each intersection within its
network (in this case, just U.S. 60 & Rural). Using this service allowed the use of the communication
functionality already available between NextPhase and ITMSComm. The Peer Decoder program,
developed by GTS, filtered out the desired data from the Computran System and sent it out using one of the
PC’s serial ports connected to an external modem, over a dedicated phone circuit between the TOC and the
interchange cabinet. Upon arriving at the traffic cabinet, the data was received by NextPhase through an
external modem that was connected to a serial port on the back of the 2070. NextPhase, in addition to its
other tasks, monitors this serial port; upon receiving data on this link, it packages it up into a DetectorMsg
for transmission to RHODES via the VME bus. To differentiate between the local DetectorMsg and the
one containing peer data, an address field within the message was used to prevent confusion.
68360 CPU(NextPhase)
68060 CPU(RHODES)
2070
LocalDetector
Actuations
SignalPhase Settings
SignalPhase Settings
Local & PeerDetector
Actuations
TOC
Rural &
Southern
Rural &
Embassy Suites
…
Computran MTCS
PC withPeer Decoder
Programmodem
modem
LocalDetector
Actuations
LocalDetector
Actuations
PeerDetector
Actuations
PeerDetector
Actuations

47
With this communications path in place, the research team made further use of it by having NextPhase send
a RHODES status message back to the TOC each second (note the bi-directional arrows in Figure 21).
This message travels the same path back to the PC located at the TOC, where it is displayed on the PC’s
monitor by the Peer Decoder program to provide real-time status information that is specific to RHODES.
(The details of what is included in this RHODES status message will be discussed in the next section.) In
addition, NextPhase sends its standard status message back to ITMSComm each second, which is then used
to update the intersection’s status within icons™, showing the current signal settings. An additional benefit
of having an icons™ PC available in the TOC was the capability to remotely change the current traffic plan
being used by NextPhase at the intersection. As RHODES was only operational when the current traffic
plan ran in the “Adaptive” mode of NextPhase, this functionality effectively provided the ability to turn
RHODES “ON” or “OFF” from the Tempe TOC. (This feature was not used during the field test, except to
verify that RHODES worked during the experiment.)
With this communication configuration, RHODES now had the capability to receive upstream detector
actuations critical for prediction of arrivals to the interchange. In addition, real-time monitoring of the
control status was now possible. Because this peer data is critical to the effective operation of RHODES,
the research team decided that the absence of this data, due to a communications failure, should also be
detectable by RHODES so that in the event this data stream is lost, RHODES could automatically switch to
“STANDBY” mode until upstream peer data is once again available. In order to do this, the arrival of data
from each peer was tracked and, in the case where no data was received from a peer for a period of 10
seconds, the status of that peer would be indicated as FAULT and RHODES would be forced to change to
STANDBY mode. This would prevent RHODES from issuing signal phase settings that may be
inconsistent with the current traffic conditions, a situation that would arise if RHODES lost its ability to
predict arrivals from peer intersections.
4.3 Bench Testing of Field Test Setup
Figure 22 summarizes the overall field configuration. With all hardware and software issues resolved, the
research team turned its attention towards making the final adjustments necessary to properly configure
RHODES at the interchange test site. First, the team verified the proper operation of all equipment,
including loop detectors, Autoscope cameras, RTMS detectors, the external modems and the 2070 itself.

48
Figu
re 2
2 –
RH
OD
ES F
ield
Con
figur
atio
n
Emba
ssy
Suite
s Rur
al
Rur
al
N
N
N
Tem
pe T
OC
(see
Fig
ure
21)
Aut
osco
pe D
etec
tion
Zone
In
duct
ive
Loop
Det
ectio
n R
TMS
Det
ectio
n Zo
ne
Sout
hern
Rur
al
US
60
US
60
TS2
Cab
inet
Det
ecto
r Rac
k
Load
Sw
itche
s
2070
B I U
B I U N
extP
hase
R
HO
DES
S D L C
Aut
osco
pe
MV
P
Mal
func
tion
Man
agem
ent U
nit
Aut
osco
pe
MV
P (see
Fig
ures
17-
18) M
ode
To T
empe
TO
C

49
(A representative from the City of Tempe Traffic Signal Division was present at the traffic cabinet at all
times during the operation of RHODES or when any hardware/software configurations were adjusted.)
Then, the team observed the system while in operation, in case any problems arose, so that any new issues
could be dealt with quickly. In addition, the team fine-tuned some parameters used by RHODES, such as
(1) travel times between upstream detectors and downstream queues, (2) queue discharge rates and (3)
turning proportions, so that they were reasonable and reflected the experience of the vehicles passing
through the interchange.
To aid in debugging and bench testing, the research team developed a static display tool, which proved to
be extremely helpful, that displayed all of the data received by RHODES, along with its outputs and
various statistics to track its performance and help identify possible problems (see Figure 23). Using a
telnet session between a laptop PC and the Ethernet port of the 2070, the user could obtain a real-time
representation of the intersection from the point of view of RHODES. This was very helpful when
diagnosing problems, as it allowed the research team to isolate where any problem was occurring by
comparing the cabinet equipment LEDs, the NextPhase output screen, actual traffic conditions and this
display to identify discrepancies. Using this tool, it was a simple matter to verify that all detectors were
functioning properly; that is, when a vehicle passed over either an inductive loop or virtual detector, one
could easily check if RHODES has received an actuation. If it did not, the cause could be investigated
immediately. Similarly, the research team was able to confirm the correct operations of the Peer Decoder
program and the associated communications link by observing upstream traffic and matching the
observations with the peer detector actuations received. Also, being able to visually compare the size of the
actual queues and those estimated by RHODES, by quickly glancing at a meaningful onscreen display,
made the process of fine-tuning parameters less tedious and less prone to error. In addition, some of the
data shown in the RHODES display tool had also been made available on a NextPhase screen accessible
via the 2070 front panel, in particular the current queue estimates, the current RHODES mode and the
status of each peer intersection. Similarly, this data was transferred to the Tempe TOC via the RHODES
status message for remote monitoring purposes.
During this bench test period, adjustments were made to almost all variable parameters in an attempt to
ensure that they reflected actual conditions at the interchange. When the research team was satisfied that
all subsystems appeared to be working well, the City of Tempe was requested to consider making
RHODES operational. Since Tempe was satisfied with the system’s performance thus far, it was ready to
perform some additional tests of its own by leaving the intersection under unattended RHODES control for
extended periods of time. This resulted in no additional reported problems other than some interesting
observations concerning some differences between RHODES control and the existing method that will be

50
Figure 23 – Screen Snapshot of the RHODES Display Tool
RHODES 2.00a Real-Time Adaptive Signal Control System ATLAS Research Center, University of Arizona Copyright (C) 1991-2000, ABOR; All Rights Reserved =-=-=-=-=-=-=-=-=-=-=-=-=-=-=-=-=-=-=-=-=-=-=-=-=-=-=-=-=-=-=-=-= 19:18:36 US60 & Rural Avenue 08/03/2000 Tempe, Arizona =-=-=-=-=-=-=-=-=-=-=-=-=-=-=-=-=-=-=-=-=-=-=-=-=-=-=-=-=-=-=-=-= | - - - | | | | | Peer 12345678 SB Time: 00:00:30 | | | Status: . . | | | OL Time: 00:00:00 | 1 6 | | Ped 12345678 | SBR SBT | | Calls: | X X - X - | | ------------------+ +------------------- X WBR 1 - - - - - WBL 0 ------------------+ +------------------- | - - - - | - X X X | Current Mode: SB | | NBrL NBrT | Current Phase: 26 | | 0 8 | Desired Mode: OL | | | Desired Phase: 26 | | | Current Plan: 1 | | | Signal Stage: Grn | 5 0 | | Xition Time: 32 | SBrT SBrL | | Elapsed Stage: 11 | X X X - | - - - - | ------------------+ +------------------- 1 EBL X - - - - 0 EBR - ------------------+ +------------------- | | - - - - - | Ph: 15 26 48 Cyc | | NBT NBR | COP: CPU Intrvl | | 0 0 | Cur: -- 11 -- --- | | | Cur: ----- -- Min: -- 10 -- --- | | | Min: ----- -- Avg: -- 10 -- --- | | | Avg: ----- -- Max: -- 11 -- --- | | | Max: ----- -- | | - - - | =-=-=-=-=-=-=-=-=-=-=-=-=-=-=-=-=-=-=-=-=-=-=-=-=-=-=-=-=-=-=-=-= Q SBT SBR | WBL WBR | NBrL NBrT | NBT NBR | EBL EBR | SBrL SBrT Avg: 0 0 | 0 0 | 0 0 | 0 0 | 0 0 | 0 0 Max: 6 1 | 0 1 | 0 8 | 0 0 | 1 0 | 0 5 =-=-=-=-=-=-=-=-=-=-=-=-=-=-=-=-=-=-=-=-=-=-=-=-=-=-=-=-=-=-=-=-= RHODES MESSAGES:

51
discussed later in Section 5. At this point, no further modifications were made and preparations were made
for the evaluation period to commence.
4.4 Procedure to Turn RHODES On/Off
The RHODES implementation at the US60 and Rural Road is a complex system, and the process of
implementing it has not been a simple one. As a result, the process of turning RHODES “ON” or “OFF” is
more than just a matter of flipping a switch. Between the extraneous hardware/software elements involved
and the many checks that must be performed, it was felt that the research team should provide a detailed
procedure listing the steps to be followed when initiating/ceasing RHODES control at the interchange. In
addition, the development of these procedures ensured that all parties were clear on the function of each
component, how it would affect the overall system and how to respond should a problem arise. The
complete set of procedures for initiating/ceasing RHODES control at the U.S. 60 & Rural Interchange is
provided in Appendix 2.

52
5. PERFORMANCE OF TEMPE FIELD TEST 5.1 Field Data Collection The University of Arizona issued a subcontract to TASK Engineering Company Inc. to collect data during
the field test and evaluate the traffic performance of RHODES. TASK was chosen as a third-party
evaluator to decrease any bias that ADOT (the research sponsor) or the RHODES research team (the
developer of the traffic control algorithms) might interject if one of them conducted the evaluation. TASK
provided a draft report in December 2000, which was subsequently updated in June 2001 [Howell, 2001].
Some of the material provided in this section is from the draft report, where verbatim material is given
quoted italics.
Data was collected during two Thursdays, one week apart, in September 2000. During those days the
interchange was run with RHODES in control – the ON scenario – for four hours at a time, and, at other
times under usual semi-actuated time-of-day control used by Tempe – the OFF scenario. The data-
collection periods with respective scenarios were as follows:
DATE 7AM-10AM 11 AM-2PM 3PM-6PM
(AM Period) (Midday) (PM Period)
September 7, 2000 OFF ON OFF
September 14, 2000 ON OFF ON.
Much of the data was collected manually using 2- and 3-person teams. The Highway Capacity Manual
(Transportation Research Board, 1998) describes a method for collecting traffic control delay data in the
field. TASK states, “This consists of teams of 2 persons each collecting queue data on each approach.
The queue data is then used to calculate estimated control delay. Since there are 10 lane groups and two
through approaches at the traffic interchange (see Figure 24), a team of 6 persons can collect
approximately 60 minutes of data on each approach during a 3-hour peak period.”
TASK reported that the following traffic parameters were calculated:
• Control Delay per vehicle, by lane group
• Control Delay per vehicle for the interchange as a whole
• 95th Percentile queues length in vehicles for each lane group
• Platoon Ratio, for each direction on the arterial
• Total traffic entering the interchange.

53
TASK states “Control delay is the total delay to vehicles at a traffic signal, including stopped delay, move-
up in queue time, lost time due to acceleration and lost time due to deceleration. Control delay is the best
single measure of operations of a signalized intersection”. TASK used procedures from the Highway
Capacity Manual, which required the collection of the number of cars in queue at designated intervals.
“Queue lengths for 95th percentile measure the length of a back-up from the intersection. Long queue
lengths should be associated with long control delays.”
“The platoon ratio is a measure of traffic signal progression. Platoon Ratio is defined by the Highway
Capacity Manual chapter on signalized intersections.”
Traffic counters were used to count total traffic volumes. These were used to compare the ON and OFF
scenarios and to validate manually collected data. Figure 24 gives the location where queues and traffic
counts were taken.
Since platoon ratio definition is dependent on cycle times, this measure is not reported in this document.
Readers interested in this measure and details on procedures for the data collection are referred to the
TASK report. TASK’s discussion on data collection and the reliability of data is reproduced in Appendix 3.
5.2 Field Test Results
Figures 25 – 30 give the traffic volume data. Note the significant variations in traffic volumes, both with
respect to the date and with respect to time of day. Although the data collection was conducted on the same
day of the week in an attempt to recreate similar conditions, traffic varied significantly on the two days.
TASK provided the 95th percentile queue sizes (i.e., these are exceeded only 5% of the time) as shown in
Table 3. Except in a very few instances where the queues are rather large in the ON scenario, there appear
to be no systemic differences between the ON and OFF scenarios. However, comparison of queues does
not mean much unless some consideration is given to the traffic volumes that generate the queues. In
addition, since queue length is highly nonlinear with respect to the arrival rates, small increases in arrival
rate could result in large differences in queue lengths – as is the case here where we notice high traffic
volumes (see Figures 25 – 30) when there are large queues. This issue becomes clearer when the control
delays at various traffic volumes is considered below.

54
N
Embassy Suites
Southern
141
Field MeasurementsUS60 & Rural Road
Q10 Q9
Q1Q2
Q8
Q3
Q5 Q4
Q7Q6
US60
Qi : Queue Data at lanes i
Traffic counts
KEY
Figure 24 – Lane groups and location of queue data collection
TS2
Rural Road

55
Table 3 - 95th Percentile Queue Sizes (number of vehicles)
Location
Q1 Q2 Q3 Q4 Q5 Q6 Q7 Q8 Q9 Q10
NB Thru
NB LT
EB Ramp
SB LT/B
SB Thru/B
NB LT/B
NB Thru/B
WB Ramp
SB LT
SB Thru
95th Percentile Queues
AM Period ON (9/14) 34.40 4.00 8.00 6.00 6.80 7.00 7.00 16.10 3.00 10.50 OFF (9/7) 32.00 4.00 9.00 7.45 8.00 11.40 9.00 13.00 2.00 8.00 Midday Period ON (9/7) 16.65 4.75 9.55 6.50 7.00 9.00 5.00 15.30 4.00 13.15 OFF (9/14) 8.00 3.00 7.00 6.00 8.00 8.00 6.00 15.00 3.00 12.00 PM Period ON (9/14) 18.25 4.00 11.00 5.00 10.90 8.00 5.00 21.00 4.00 41.00 OFF (9/7) 9.00 2.30 8.00 8.00 11.00 6.05 5.00 21.00 3.50 29.10
Key: NB: North Bound; EB: East Bound; SB: South Bound; WB: West Bound; LT: Left Turn; B: Bridge
TASK provided the delay per vehicle results given in Table 4. Differences of more than 10% between the
OFF and the ON scenarios are given in bold. In the last column, the average delay is computed as the
weighted average for all the approaches, where the weights are proportional to the traffic volumes. Hence,
the last column corresponds to the average delay per vehicle for all the vehicles moving through the
intersection. Therefore, although it appears that during the midday periods the OFF scenario has smaller
delays, when vehicle volumes are accounted for (in the last column) the differences between the average
delays are not significant. (Also, the midday OFF scenario data may have a systematic bias as will be
argued below when we examine 15-minute data.)
Table 4 - Control Delay per Vehicle (seconds)
Location Q1 Q2 Q3 Q4 Q5 Q6 Q7 Q8 Q9 Q10 Average
NB Thru
NB LT
EB Ramp
SB LT/B
SB Thru/B
NB LT/B
NB Thru/B
WB Ramp
SB LT
SB Thru
(for all vehicles)
Control Delay per Vehicle
AM Period ON (9/14) 18.37 18.22 32.87 36.68 13.80 26.47 12.62 52.00 22.24 20.77 36.40 OFF (9/7) 21.04 19.35 32.75 37.99 14.66 39.94 13.17 40.75 18.25 17.08 34.74 Midday Period ON (9/7) 17.12 21.93 31.05 32.80 14.27 36.23 14.19 45.47 22.01 16.83 36.07 OFF (9/14) 14.01 15.90 24.88 30.04 12.93 32.15 12.88 38.52 20.43 21.23 36.36 PM Period ON (9/14) 15.84 20.47 31.35 24.29 13.44 33.64 12.74 61.34 19.93 28.77 41.50 OFF (9/7) 14.31 15.91 26.03 31.81 13.94 32.25 13.25 45.03 19.09 22.76 35.81
Key: NB: North Bound; EB: East Bound; SB: South Bound; WB: West Bound; LT: Left Turn; B: Bridge

56
N
Embassy Suites
Southern
141
Field MeasurementsUS60 & Rural Road
US60
TRAFFIC VOLUMESSeptember 7, 2000
7 AM – 10 AM
647 2807
13584852
45361250
3014 598
1781
1390
Figure 25 – September 7, 2000, 7AM-10AM, Total Traffic Volumes (RHODES OFF)
TS2
Rural Road

57
Embassy Suites
Southern
Field MeasurementsUS60 & Rural Road
US60
TRAFFIC VOLUMESSeptember 7, 2000
11 AM – 2 PM
947 4099
11243710
34431012
3965 796
1742
1600
Figure 26 – September 7, 2000, 11AM-2PM, Total Traffic Volumes (RHODES ON)
TS2

58
N
Embassy Suites
Southern
Field MeasurementsUS60 & Rural Road
US60
TRAFFIC VOLUMESSeptember 7, 2000
3 PM – 6 PM
1130 5753
9863945
3807 740
5828 755
1873
1654
Figure 27 – September 7, 2000, 3PM-6PM, Total Traffic Volumes (RHODES OFF)
TS2
Rural Road
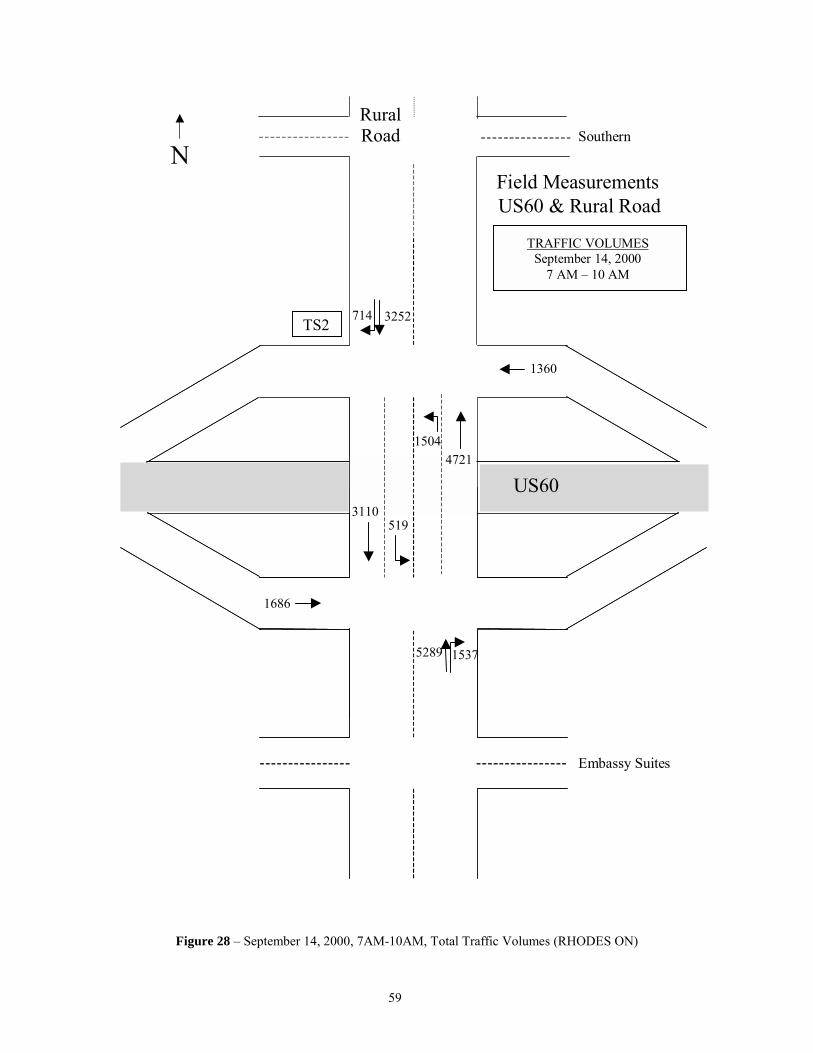
59
N
Embassy Suites
Southern
Field MeasurementsUS60 & Rural Road
US60
TRAFFIC VOLUMESSeptember 14, 2000
7 AM – 10 AM
714 3252
15375289
47211504
3110 519
1360
1686
Figure 28 – September 14, 2000, 7AM-10AM, Total Traffic Volumes (RHODES ON)
TS2
Rural Road

60
N
Embassy Suites
Southern
43
Field MeasurementsUS60 & Rural Road
US60
TRAFFIC VOLUMESSeptember 14, 2000
11 AM – 2 PM
968 4471
11553547
3090 966
5095 749
1495
1755
Figure 29 – September 14, 2000, 11AM-2PM, Total Traffic Volumes (RHODES OFF)
TS2
Rural Road

61
N
Embassy Suites
Southern
Field MeasurementsUS60 & Rural Road
US60
TRAFFIC VOLUMESSeptember 14, 2000
3 PM – 6 PM
1236 7238
10394012
3946 797
7950 707
1744
1933
Figure 30 – September 14, 2000, 3PM-6PM, Total Traffic Volumes (RHODES ON)
TS2
Rural Road

62
The research team requested that TASK also provide 15-minute data on traffic volumes and delays. TASK
was able to provide this information for the middle hour of each data collection period (i.e., 8AM-9AM,
12PM-1PM and 4PM-5PM). Tables 5 and 6 give this data. Inspection of the data shows that regardless if
RHODES is OFF or ON, the delays for “straight-through” traffic are in a different “ball park” than the
delays for the “left-turn” traffic. A quick plot of delays versus volume confirmed this. Subsequently, the
research team developed Figures 31 and 32 for accurate plots of delay-versus-volume for the through traffic
and the left-turn traffic.
Table 5 - OFF scenario: 15-minute Control Delay (s/veh.) and Volumes (veh/15 min.)
Location Q4 Q5 Q6 Q7 South-Bound
Left-turn on Bridge
South-Bound Through on Bridge
North-Bound Left-turn on Bridge
North-Bound Through on Bridge
Time AM Midday PM AM Midday PM AM Midday PM AM Midday PM
Delay (s) NA 19.21 41.02 NA 14.55 14.15 NA 30.68 30.29 NA 12.98 12.48 Volumes NA 152 91 NA 301 447 NA 83 50 NA 306 380 Delay (s) NA 16.97 22.05 NA 12.50 14.57 NA 34.42 20.67 NA 13.18 13.22 Volumes NA 231 45 NA 496 458 NA 71 43 NA 288 359 Delay (s) NA 16.74 25.35 NA 12.52 13.85 NA 34.26 32.50 NA 12.95 12.74 Volumes NA 192 56 NA 437 506 NA 96 61 NA 281 312 Delay (s) NA 20.42 35.41 NA 12.85 13.34 NA 27.35 47.69 NA 12.45 14.86 Volumes NA 134 60 NA 603 563 NA 73 54 NA 322 300 (NA : Data not available because at that particular AM period data was not collected in 15 min. periods.)
Table 6 - ON scenario: 15-minute Control Delay (s/veh.) and Volumes (veh/15 min.)
Location Q4 Q5 Q6 Q7 South-Bound
Left-turn on Bridge
South-Bound Through on Bridge
North-Bound Left-turn on Bridge
North-Bound Through on Bridge
Time AM Midday PM AM Midday PM AM Midday PM AM Midday PM
Delay (s) 21.62 55.16 28.76 12.89 15.19 13.96 23.05 36.9 35.47 13.38 13.63 12.58 Volumes 39 62 50 280 401 457 108 75 51 526 312 396 Delay (s) 48.94 20.64 23.14 15.59 13.35 13.03 28.3 25.94 35.42 11.89 13.57 12.97 Volumes 51 63 65 257 338 491 95 81 62 478 280 353 Delay (s) 46.76 36.85 20.2 13.26 14.91 13.59 25.99 40.34 34.27 12.14 14.04 12.23 Volumes 53 52 45 243 326 470 103 87 73 509 302 332 Delay (s) 24.55 24.81 22.49 13.52 13.13 13.33 20.55 34.6 24.85 13.06 15.57 13.17 Volumes 46 69 63 199 348 568 74 85 47 402 293 352
By and large, the plots for the “through” traffic show very little difference between the OFF and the ON
scenarios. Given the fact that the average delays at the intersections were between 12s and 16s for all the
volumes up to 2400 vehicles/hr, it may be imputed that:

63
• the through-capacity for both the semi-actuated and RHODES controls was high enough so that
the intersections are operating in the “flat” part of the delay versus volume curves for queuing
systems, and
• RHODES performed as well as Tempe’s current finely-tuned semi-actuated coordinated control
Figure 31 – Through movement delays
These plots cannot be directly compared with the simulation results of Figure 13. In this case the delays are
for the vehicles at each intersection whereas in the simulation results the delays are for “trips” where the
cumulative stopped delay of each vehicle that goes through the interchange (including the on-ramps delays
if any) is considered. Nonetheless, if does show that the trip delays in the simulations were around the
numbers that would be expected from the intersection delays observed in the field. For example, the
average delay for straight-through trips for the two intersections is the sum of the delays at each
intersection, and this was between 24s and 32s in the field data, approximately the delays obtained in the
simulation results.)
The left-turn data indicates larger average delays with smaller traffic volumes. This is to be expected since
the queue discharge rate for left turning vehicles is slower than the straight-through vehicles (and hence
queue “service time” is larger). If one examines the data for the southbound midday period (on September
14th) with RHODES OFF, substantially lower delays for very large volumes will be noticed. The fact that
all of these “outlying” data points were taken at the same time and are significantly different
8
10
12
14
16
18
20
400 800 1200 1600 2000 2400
Traffic Volume (veh/hr)
Del
ay (s
/veh
)
RHODES ON RHODES OFF

64
Figure 32 – Left-turn movement delays
than the rest, even with the other OFF scenario data, makes them suspect. (Perhaps the data gatherers
during this time had different training or were distracted.) Thus, this data are outliers and most probably in
error. Figure 32 gives the plot of left-turn delays (the outliers are not included; they would be outside the
figure with volumes of over 500 vehicles/hr. and delays of 20s and less). Again, there does not appear to be
significant differences between the ON and OFF scenarios, except that it could be argued (by simply
looking at Figure 32) that the ON scenario (RHODES) may have slightly better traffic performance than
the OFF scenario (semi-actuated control) for volumes at the higher end (350-450 left-turn-vehicles per
hour).
5.3 Further Observations on the Field Test
Considering the above results obtained in the field, it may be stated that for the periods that data was
collected with RHODES enabled, RHODES performed as well as the current well-tuned semi-actuated
control. However, RHODES was run with only one set of parameters, which did not vary with time-of-
day, unlike for the current approach. In addition, RHODES did not require the collection of a large amount
of data and the running of an off-line optimization model, such as TRANSYT-7F, to determine optimal
cycle times, offsets and splits for different times of day. With RHODES, the matching of signal phasing to
detected traffic was done “on-the-fly”, in real time. Also, RHODES was constrained by City of Tempe’s
operational requirements that did not allow (1) phase skipping and (2) adjustment of minimum/maximum
green times; it is likely that relaxation of these constraints would have improved RHODES performance.
0
10
20
30
40
50
60
100 150 200 250 300 350 400 450 500Traffic Volume (veh/hr)
Del
ay (s
/veh
)
RHODES ON RHODES OFF

65
RHODES works better when it has larger prediction time horizons. When the prediction horizon is long,
more phase duration alternatives are evaluated in the CAPRI optimizations, thereby giving, in general, a
better (calculated) objective function value. In this field test, except for those from Southern/Rural, the
count measurements were from detectors that were 7-10 seconds upstream, from the two off-ramps and
from Embassy/Rural. This allowed RHODES to obtain good predictions for only a time horizon of 7-10
seconds, the remaining part of the decision horizon assumed average arrival streams. The research team
believes that if either more detections from the neighborhood were available or if the RHODES prediction
model was enhanced with a better representation of “arrival streams” then it is possible that RHODES
performance would be improved further.
The RHODES model implemented in Tempe assumed fixed turning ratios, queue-discharge rates, and
travel times from upstream detectors. Current research into future RHODES enhancements include “on-
line” estimation of these parameters – these modifications would have improved RHODES’ performance
further.
In the original design of RHODES and in the simulation evaluations, queues at ramps were also considered
in setting phase durations. If one considers the delays at the signals as well as at the ramp meters, then, as
the simulations show, the RHODES system should do better for all traffic using the interchange.
Unfortunately, the detections from the on-ramps were not available at the 2070 Controller that was
controlling the interchange. If they were available and the delays at the ramp meters were measured, then it
would have been possible to evaluate the types of results as per the simulations.
It is useful to note two other visual observations. When RHODES was controlling the interchange but no
data was being collected, Tempe Transportation Department on-site personnel and the RHODES team
noticed the following:
• On one occasion, a single lane at the bridge was blocked off for some ADOT maintenance work.
RHODES continued to adapt and control traffic with no apparent degradation in traffic flow.
• On one occasion an emergency vehicle pre-empt went into effect. The Tempe Transportation
Department on-site personnel felt that RHODES recovered faster from the pre-empt transients than
the current system.
Although the above observations were not during heavy traffic and may only be considered “anecdotal”, it
is reassuring to note that the Tempe Transportation Department on-site personnel expressed satisfaction

66
with RHODES’ performance, especially given that this was its first operational test and many obstacles on
the hardware/software integration had to be overcome.
Based on the evaluation of the data gathered, and the observations of the Tempe Transportation Department
on-site personnel, the research team concludes that RHODES is a promising approach for real-time
responsive traffic signal control. This is further attested by TASK in their statement ”The RHODES
program was not able to improve the traffic performance at the field survey site, over and above the traffic
level of service resulting from a well executed timing plan by traditional methods. Nevertheless, RHODES
shows promise of increasing the performance of traffic signals…. In addition RHODES ability to quickly
generate new traffic control plans in response to changing conditions is a potential advantage.”

67
6. OVERALL EVALUATION In this section of the report, an overall evaluation of the RHODES-ITMS system is provided based on the
field test results described in Section 5, as well as other observations and considerations.
In considering the implementation of any traffic control system, one must evaluate (1) its potential benefits
and (2) the marginal costs of implementing the system to achieve these benefits. The benefits for a traffic
control system could include (i) an improvement in traffic performance, (ii) an improvement in the
transportation of people, goods and services, (iii) an increase in safety, (iv) a decrease in energy
consumption, and (v) an improvement in air quality. Though not quantitatively shown in all cases, it will be
argued below that RHODES has the potential to positively influence all the above benefits.
On the other hand, these benefits do not come freely. RHODES requires additional technological systems
(i) to get more traffic data -- in terms of more and better detectors, (ii) to move this data fast to where it is
utilized – in terms of communication systems that are faster and of higher capacity, and (iii) to process this
data quickly – in terms of more powerful computing systems. These technological systems cost more than
what are currently in place in cities like Tempe. In addition, there are the costs of training, maintenance and
operation of a system, whether or not it includes traffic adaptive features.
Although the primary scope of the project was only to implement RHODES-ITMS and evaluate the
resultant traffic performance in the field (the subject of Sections 3-5 of the report), in this section an overall
evaluation of the system will be provided that includes the field-test results and considerations of other
potential benefits and costs. To do so, the actual and anticipated traffic performance improvements from
RHODES will be discussed first. Next discussed will be the other potential traffic control functions that
may be available once the required infrastructure and RHODES architecture has been implemented. In
concluding this section, we will comment on other benefits and marginal costs that may be associated with
the implementation of RHODES.
6.1 “Adaptive” Control and System Responsiveness
While the focus of RHODES is to “adapt” to prevailing traffic conditions, the motorists themselves also
adapt, over time, to traffic conditions. The ability of RHODES to adapt to the various types of changes in
traffic patterns is measured by its “responsiveness”, in terms of how well it adapts and how fast it adapts.
However, these changes in traffic patterns are due to both the inherent stochasticity of traffic flows and
driver adaptation.

68
Long-term driver adaptation (the kind considered in static traffic equilibrium models used for network
planning), is when groups or percentages of travelers start choosing different routes to go around or avoid a
long-term disruption, such as major road construction. In this case, RHODES may be enhanced to learn the
changes in underlying traffic parameters, such as turning ratios, and hence, in turn, adapt to long-term
driver adaptation. In this case, the requirement for “responsiveness” is only on how well RHODES adapts,
and not how fast.
The mid-term, or tactical, driver adaptation occurs when travelers make local lane or route change
decisions to avoid a temporary disruption, such as traffic incidents or an unusually large congestion level.
For example drivers may go “around the block”, or make a turn earlier than originally planned, to avoid an
incident downstream. If the network of detectors and RHODES signals covers this local re-routing
adaptation, then RHODES will respond well to this type of driver adaptation. In the Tempe field test site,
if incidents occur just upstream of the upstream detectors (see Figure 33), then the change in flow to the
interchange will be detected by RHODES which will set signal timing appropriately. Another type of mid-
term traffic disruption is when an emergency vehicle pre-empt goes into effect. During that time some
phases get extended or gapped out and hence the traffic flow pattern is altered for a few minutes. However,
neither an emergency pre-empt nor the type of incident illustrated in Figure 33 took place during the data
collection period, and hence this element of traffic performance was not evaluated in the current field test.
Nevertheless, as mentioned in the last part of Section 5, anecdotal evidence suggests that RHODES does
respond well to these types of traffic disruptions.
X RURAL RD.
Figure 33 - Illustrative midterm traffic disruption (X indicates a traffic incident).
Finally there are the short-term, minute by minute, traffic fluctuations that are inherent in traffic flow, even
when the long term and midterm patterns are statistically equilibrated. These are referred to as recurrent
traffic conditions and the current RHODES-ITMS system is, in fact, designed to respond timely to the
attendant traffic fluctuations.

69
6.2 Traffic Performance for Recurrent Conditions
Obviously for RHODES to even be considered as a viable traffic control system it must perform at least as
well as the widely prevalent second-generation UTCS-type system. Presumably it does better.
Field data gathered by TASK during the field test show that RHODES does as well as the current time-of-
day (TOD) semi-actuated coordinated system. As was pointed out by TASK in their report [2001], the
current system performs very well, providing a high level of service given the large volume of traffic using
the interchange on a regular basis. However, this level of performance has been attained with constant
fine-tuning over an extended period of time, as Tempe’s Transportation Staff have worked to continually
improve the performance of the interchange to keep up with changing conditions. Currently, three different
fixed-cycle signal timing plans are used at this location in an attempt to adapt the traffic controller’ s
performance to changing conditions during morning rush hour, evening rush hour and other remaining
times. RHODES, on the other hand, does not need any time-of-day information, as it continually adapts to
changing conditions throughout the day, instead of adjusting at specific time epochs.
TASK’s data shows that the current version of RHODES, with a limited amount of fine-tuning of the few
parameters, was able to perform as well as the current well-tuned TOD coordinated system used by Tempe.
6.3 Potential New Traffic Control Functions
Given the well-defined architecture of the current RHODES system (see Figure 3) it is possible to add other
traffic control features such as transit priority, emergency vehicle priority/preempt and railway-vehicle
grade crossing control. The RHODES-ITMS implementation in Tempe was only at the
intersection/interchange level within the RHODES hierarchy, and the CAPRI module considers only a
single category of arrivals: vehicles. Figure 34 shows a simplified illustration of how bus priority may be
implemented. Buses will be another category of arrival that has to be served by the interchange signals and
as such may be given a different “weight” as compared to other vehicles. For example, if the traffic/transit
management objectives were to have on-time performance for buses, then a weight may be given that
depends on the lateness of buses and the number of passengers. Figure 35 illustrates the implementation of
bus priority in RHODES.

70
Figure 34 - Simplified illustration how bus priority may be included in RHODES
Figure 35 - Implementation of Transit Priority within RHODES Architecture
Detectors, signal status, and location and status of buses
RHODES Decision System
Prediction of queues and arrivals of vehicles and buses
processed data
Feedback & Decisions
rawdata
Bus Stop A Bus Stop B
PREDICT arrivals
& queues
INTERSECTION CONTROL
TURN RATIOS
DISCHARGE RATES
TRAVEL TIMES
APRES-NET arrivals
& queues
REALBAND
NETWORK FLOW CONTROL
Transit/bus Priority (position and “weight”)
CAPRI
Detectors and signals
PRIORITY ASSIGNMENT
Bus scheduleBus location (via AVL)

71
Priority for emergency vehicles means providing a path through the network with no stops. By
constraining the intersection to provide the appropriate green phase when the emergency vehicle
approaches the intersection, RHODES can “prime” the intersection so that there is minimum disruption for
other traffic (a hard emergency pre-empt, as provided by many current systems, can also be implemented to
provide a redundant safety feature). Figure 36 illustrates how an emergency pathway may be provided
within the RHODES architecture.
Figure 36 - Implementation of Emergency Vehicle Preempt/Priority within RHODES Architecture
Finally, consider the movement of trains through a set of at-grade crossings. With upstream detection (on
the rail tracks) of train movement, one can predict, several minutes in advance, the times that the crossing
will be occupied by a moving train and be blocked to vehicular traffic. Given this information, RHODES
can time the signals at the intersections of the railroad crossings to minimize disruption of the surface
traffic. Again, a hard signal preemption may be included as a redundant safety feature to make sure that
vehicles do not cross the tracks at that time. In other words, RHODES priority would decrease the number
of vehicles waiting to cross the intersection when the train approaches, thereby decreasing the exposure to a
vehicle-train incident and increasing safety. Figure 37 illustrates how signal priority/preemption at railroad
crossings may be implemented in the RHODES architecture.
PREDICT arrivals
& queues
INTERSECTION CONTROL
TURN RATIOS
DISCHARGE RATES
TRAVEL TIMES
APRES-NET arrivals
& queues
REALBAND
NETWORK FLOW CONTROL
CAPRI
Detectors and signals
EMERGENCY VEHICLE PATH ASSIGNMENT
Emergency Unit’s Origin Incident Location
Route constraints for Emergency vehicle

72
The main point of this section is that even though the traffic control functions discussed above were not
implemented in the current version of RHODES, they can be implemented in future versions. Then, by
responding to categorized arrivals at the intersections and railroad crossings, RHODES can provide further
benefits to the overall traffic performance.
Figure 37 - Implementation of Railway At-grade Crossing within RHODES Architecture
6.4 Other Benefits
In the RHODES algorithms, estimates of travel times, delays and queues are updated using second-by-
second real data. These are computed internally in the algorithms, so that the optimization routines may
maximize given performance measures that are functions of these variables. It is possible to communicate
these variables to (i) the TOC for better monitoring and management of traffic and (ii) traveler information
providers so that drivers can get more and better information to make better route and departure time
decisions. Thus, the use of RHODES-derived measures could also enhance travelers’ driving experience.
There may also be additional safety benefits because with RHODES the intersections/interchanges (and the
railway crossings) will have less traffic waiting when emergency vehicles (and trains) preempt the signals
and disrupt traffic flow.
PREDICT arrivals
& queues
INTERSECTION CONTROL SUBSYTEM
TURN RATIOS
DISCHARGE RATES
TRAVEL TIMES
APRES-NET arrivals
& queues
REALBAND
NETWORK FLOW CONTROL SUBSYSTEM
CAPRI
Detectors and signals
PRIORITIES & CONSTRAINTS ASSIGNMENT
Train movement (position and schedule)

73
Since standing queues of vehicles contribute negatively to air quality, system-wide RHODES installation
may improve air quality, because RHODES can implement objectives of minimizing queue sizes. Finally,
both travel time delays and large queues make gasoline consumption less efficient; RHODES can
alternatively implement an objective that reflects the minimization of energy consumption due to delays
and queues.
6.5 Costs
Quantifying the cost of developing timing plans for a current second-generation UTCS system is difficult,
as the associated effort consists of a series of refinements made over a long period of time for a variety of
reasons. Usually, the costs for developing timing plans are included within the Operations and
Management (O&M) budget of a city’s transportation division and are therefore difficult to break out
individually for any specific intersection. RHODES, however, does not require continuous manual
refinement of timing plans to maintain its performance level, thereby freeing transportation staff for other
tasks. Unfortunately, it is difficult to put a dollar amount on the cost of maintaining such timing plans,
making it difficult to quantify the cost savings from using RHODES in lieu of semi-actuated TOD control.
Easier, perhaps, is putting a dollar amount on the cost of a RHODES installation versus the more traditional
second-generation control. While both have different equipment requirements, in either case, a traffic
cabinet, controller and basic detection capability are required. RHODES however, does have specific
requirements regarding the controller and software involved. In particular, RHODES is currently limited to
operating in a 2070 Advanced Traffic Controller environment, utilizing the NextPhase controller software
to interface with the cabinet hardware. In addition, an additional processor, the MEN Card discussed
earlier, is required to provide the memory and processing capability required by RHODES. Furthermore, if
the existing detection capability is insufficient, that is, the required type and/or number of detectors for
RHODES’ PREDICT algorithms are not implemented, additional detection must be installed, though there
is no requirement regarding the specific detection technology that needs to be used, (i.e., induction loop
detectors, video detection, microwave detection, etc.). As a result, while maintenance of timing plans may
be decreased, there may be an increased cost to maintain these additional detectors.
Additional features may also be added as desired, as with any traffic control method, but these elements are
sufficient for basic RHODES operation. Estimates of the marginal cost for a new RHODES installation
range from $30K - $65K, depending upon (i) whether integration with an Advanced Traffic Management
System (ATMS), such as icons, is desired, (ii) the complexity of the installation, and (iii) requirements for
any non-standard feature, such as additional communications capability and traffic monitoring.

74
However, this is in addition to the cost of installing a traffic management system, such as the Computran
traffic control system in Tempe, which would cost several hundreds of thousands of dollars. Thus,
RHODES may seem an expensive alternative, especially if one considers the field-test data that showed no
significant difference between the results of the two control methods. However, there are two general
reasons to believe that RHODES may be a better alternative to second-generation control. One is that the
data-collection was performed solely during two days, each day for three three-hour periods experienced at
the field test site. While the two systems were comparable in performance during these peak periods, no
data-collection and evaluation was done for the remaining 15 hours of each day that the interchange was in
use. In addition, the field data itself showed the need for an adaptive control method. By comparing the
traffic volumes between the two days during which the systems were evaluated, it can be observed that
there are significant traffic variations, even though the two days were just one week apart! While the
current second-generation method has been adjusted to perform well during average peak periods, it is
limited in its ability to adjust to conditions outside of the range of peak traffic volumes. Also, as discussed
above, the current methods are limited in their ability to respond to mid-term and short term disruptions in
traffic patterns, while RHODES adapts, in a timely fashion, to such variations in traffic flows. Once
RHODES has been installed and is in place, no adjustments will need to be made in response to incidents
resulting in lane closures, normal and abnormal fluctuations in directional flows and/or traffic volumes or
signal preemption.
The other general reason why RHODES may be a preferred alternative to second-generation control is the
range of various other benefits that are discussed above, including the option to include other traffic control
functions within the RHODES architecture, and the potential improvements in safety, air quality and
energy consumption.

75
7. PROJECT CONTRIBUTIONS Although the main focus of the project was to implement RHODES and measure the resultant traffic
performance, the contributions of the project were of much greater dimension and extent. The following is
a list of the major contributions, in bulleted form:
• Second-by-second traffic responsive. To the authors’ knowledge, this is the first implementation
of a traffic adaptive control system that measures traffic variables every second and computes
durations for traffic signal phases to be implemented for the next few minutes.
• Hierarchical and Distributed Modular Architecture. The RHODES architecture that was
implemented is both hierarchical to account for the natural time constants of obtained traffic
measures, and distributed to exploit the spatial aspects of traffic activities and local processing of
these measurements. Furthermore this architecture allows for straightforward modular expansion
that can include several other traffic control functions such as transit priority and railway grade
crossing preemption.
• Integration of Adaptive Features in the 2070 Controller. This is the first time that a standard
traffic control system was implemented that includes second-generation UTCS (NextPhase in our
case) with an adaptive feature (RHODES in our case) which can be turned ON or OFF by a traffic
engineer.
• Implementation of a 2070 within a TS2 Cabinet. Although it was not something that was
specifically included in the planned tasks by the research team (since it was assumed in the project
proposal that this would have been done by the time the field test required it or it would be easy to
do so when the time came), the effort to implement a 2070 Controller in a TS2 was considerable
and this was the first time it was ever done. (As of this report, there have been a few 2070
implementations, but these have been within a NEMA-TS1 Cabinet).
• Implementation of a communication system for second-by-second decision making. The
communication system that was developed and implemented, which consisted of sending data
from upstream detectors to a central traffic control system (in our case the Computran System at
Tempe) to the controller at the interchange, with latency of a less than a second, and the
subsequent implementation of signals, again with the latency of less than a second, is a new
engineering design and was implemented for the first time through this project.

76
• Implementation of a system that requires low maintenance by traffic engineers. As discussed
in the last section, the effort to develop timing plans for a current second-generation UTCS system
consists of a series of refinements made over a long period of time. A system such as RHODES,
however, does not require continuous manual refinement of timing plans to maintain its
performance level, thereby freeing transportation staff for other tasks. (On the other hand, there
may be some additional cost to maintain the extra detectors required by RHODES.)
• Workforce expansion. Over the course of the project several UA graduate students were
involved with the research, development and deployment of a real-time transportation system, and
some of them completed a Master’s thesis/project or a doctoral dissertation. After graduation,
these students, now with significant background and experience in traffic and systems engineering,
have gone into the workforce, thereby considerably expanding the workforce in traffic systems
engineering.
• Real-time decision-making and optimization. This project also extended the cutting edge in
systems engineering by (i) developing a system design framework for real-time decision systems
and (ii) the subsequent implementation and deployment of a system that uses a client-server
framework for automated real-time optimization (in our case real-time dynamic programming).

77
8. LESSONS LEARNED AND DIRECTIONS OF FUTURE WORK
8.1 Lessons Learned
The precursors for this project were the earlier RHODES development projects [Mirchandani and Head,
1994, Head and Mirchandani, 1994, Head and Mirchandani, 1997] where the research team developed
algorithms and software and tested them using simulation models. Given the team’s knowledge of the
computer/communication architecture available at the City of Tempe’s TOC, and the possibility of support
from the Traffic Engineering Department and its vendor (Computran Inc.) for Tempe’s traffic management
system, it was envisioned that the application of RHODES-ITMS for the US60/Rural interchange would be
straightforward. The development of the simulation model for the interchange and the RHODES-ITMS
algorithms was indeed straightforward, and these were done in time and on budget.
However, the research team faced many obstacles in the implementation of the hardware and software
within the TOC and the field. Over the duration of the project, the focus of the effort changed from
algorithm and software development to communication system design and system integration. This
significantly delayed the completion of the project. The team had to learn new material on communication
technologies/systems, system security, data-transfer protocols, etc. Furthermore, the Project’s specific
application and the communication requirements were challenging and, after the fact, the team realized that
the design of a reliable, real-time-capable communications system is much more difficult than was
originally anticipated. It involves many significant new issues, which were quite different than the traffic
engineering and algorithmic issues that the team had dealt with earlier. From specifying the requirements
for the number and type of interfaces needed, to procuring the equipment, to actually installing and testing
it, obstacles, both technological and organizational, continually arose and had to be dealt with. With a
project such as this, involving a variety of agencies and people of varying backgrounds, the key factors to
overcoming obstacles and successfully implementing state-of-the-art technologies and methods were:
1. A champion within the host organization who provided leadership and smooth interfacing to help
“make things work” (Jim Decker of the City of Tempe, in our case)
2. A set of technical advisors who were interested in the success of the project and were helpful with
suggestions and actions that supported the research team’s efforts (the TAC members, in our case)
3. Subcontractors who were as interested in seeing the proposed system work as was the research
team (Siemens Gardner Transportation Systems and Computran, in our case)
4. And the team’s determination to apply the state of the art in every aspect of the project.

78
Perhaps the most important aspect of this project is the team’s newfound respect for the various interface
issues that must be resolved whenever integrating a variety of hardware/software systems produced by
various vendors/manufacturers. From reading this report, it should be clear that a very large part of the
work involved in this project was focused on the various interfaces that needed to be developed. From
overcoming the problem of installing a 2070 inside a TS2 Type 2 cabinet, to interfacing the NextPhase
software with RHODES, to obtaining upstream detector data from the Computran TCS located at the
Tempe TOC, a variety of interfaces were designed, created, tested and redesigned until they worked
properly. The team clearly did not anticipate the magnitude of the interface issue at the time this project
was proposed and initiated, but has come away with a much better appreciation of this aspect of system
integration as a result.
In concluding this subsection, we must mention some organizational issues that came up and, perhaps, must
be dealt differently in any future effort of this kind. Given the total effort budgeted for the project, there is
the constant issue of how much time should be devoted to “getting the job done” versus how much time
should be spent on communicating via TAC meetings, minutes, and presentations to keep interested parties
informed. While communication is very important, there are cases where it can also lead to added delays.
As an example, there were many times when the team had to spend large amounts of time on technical
obstacles, especially dealing with interface issues, and it had to use a fine-tooth comb and “forensic-type”
investigation to see how they would be overcome. Still, they had to spend significant effort to let the TAC
know of these problems and the team was sometimes not able to make the TAC appreciate the magnitude
of the problem and/or the need for its resolution. Fewer TAC meetings, and the use of timely “mini-status”
reports which briefly provide the status of tasks and problem/obstacle resolutions, as a mechanism to keep
the team and the TAC involved without spending an inordinate amount of time for presentations was
helpful in diverting more effort to resolve the original problems/obstacles.
Finally, the dependence of some tasks upon the completion of others had a major impact upon the schedule
adherence of the project, reducing the ability of partners (ADOT, Tempe, Siemens Gardner Systems,
Computran, etc) to work in parallel on some tasks. While improved program scheduling and management
may have helped somewhat, the very nature of the tasks to be completed and the existing organization of
the participants dictated the situation, in large part. In addition, one should note that each partner is
involved in a myriad of projects, of which this was only one. This presented a problem at times, as various
deadlines unrelated to the current project intruded at inopportune times.

79
8.2 Directions of Future Work
RHODES has now been successfully field-tested, and it is shown to be a viable traffic control method with
many potential benefits. However, there remains much work to be done before it is fully accepted and
widely implementable.
First, more field data must be gathered and RHODES’ real-time responsiveness needs to be evaluated.
While the evaluation performed by TASK Engineering follows standard practice, albeit for a single
intersection, the research team feels that this method is insufficient for evaluating an interchange operating
with an adaptive traffic control systems, such as RHODES. As a real-time adaptive system, RHODES is
capable of providing optimized signal timing in a variety of traffic conditions and its traffic performance
evaluation should reflect this. It is for this reason that the team has proposed a follow-up project to re-
evaluate the traffic performance of RHODES as implemented at the US60 & Rural Road interchange.
Towards this end, we are in the process of developing an evaluation design for adaptive traffic control
systems that fully explores the potential advantages of such a system. This design involves additional data
collection during a series of scenarios to represent traffic conditions that may arise at any time, including
lane closure, major volume fluctuations and signal preemption. Including these types of events within the
existing evaluation procedure, while making additional modifications to ensure that a comprehensive set of
data is collected, would allow agencies to make informed decisions when comparing the performance of an
adaptive control system with a more traditional one.
Along these same lines, the difference between real-time systems and off-line methods should be
investigated to aid in the design and development of future real-time systems, which include the
consideration of many issues currently not faced in the design of off-line systems. Some of these issues
are:
1. What should be the time resolution in the real-time system (milliseconds, seconds, minutes, etc.)?
2. What should be the prediction horizon (decision rolling horizon)?
3. What should be the control time horizon (decision roll period)?
4. What type of communication system is needed (capacity, speed, etc.)?
5. What computing platform is needed?
Given the experience in the design, development, and implementation of RHODES, it will be useful to
develop a framework for designing real-time decision systems in the transportation industry.
The RHODES-ITMS system included only two intersections under RHODES real-time control strategy. It
will be useful to investigate the RHODES performance for a set of intersections on an arterial and its

80
performance in a grid. Fortunately, the research team has planned two new projects, which are supported
by FHWA, ADOT, and UA, that extend RHODES to an arterial (Speedway Blvd. in Tucson) and a grid
(two sets of arterials that cross each other, also in Tucson).
Finally, one of the original goals of RHODES-ITMS was to provide integration between the freeway traffic
management and surface street traffic control. RHODES-ITMS integrated with MILOS [Gettman, Head
and Mirchandani, 1999] provides an opportunity to achieve this goal. However, to test this integrated
freeway/surface-street management, we must first test the control concepts in the laboratory using
simulation models (a straightforward effort) and then implement them in the field (a greater challenge).
The latter effort must be supported by enhanced communications/computation capability and infrastructure,
and more importantly, by assistance and support of participating agencies. Future research should be in
this direction -- to provide integrated management of surface street signals, ramp meters and variable
message signs, to make the movement of all categories of vehicles appropriately efficient for each category,
and to make the trip taking behavior of drivers and travelers smoother and safer, with less impact on air
quality and energy consumption.

81
REFERENCES
Anderson ,T., (1997), Freeway-Arterial Diamond Interchanges: The RHODES Approach, Master’s Report, Department of Systems and Industrial Engineering, University of Arizona, Tucson.
Ciarallo, F., and Mirchandani, P.B., (2001), RHODES-ITMS Ramp Metering, Project sponsored by the Arizona Department of Transportation, July 1998-August 2001. Bullock, D., (1997), CORSIM Computer Simulation Interface Equipment, Technical report, Louisiana State University Remote Sensing and Image Processing Laboratory, Baton Rouge, LA. California Department of Transportation (1999), Transportation Equipment Electrical Standards (TEES),
Chang, E.C.P., and Messer, C.J., (1991), PASSER II-90 Program User’s Guide, Texas Transportation Institute, Texas A&M University, College Station.
Gettman, D., Head, K.L., and Mirchandani, P.B., (1999), RHODES-ITMS Corridor Control Project, Final Report, FHWA-AZ99-462, Arizona Department of Transportation, Phoenix, Arizona, May 1999.
Head, K.L., (1995), “An Event-Based Short-term Traffic Flow Prediction Model,” Transportation Research Record 1510, pp.45-52.
Head, K.L., and Mirchandani, P.B., (1994), RHODES Project:Phase II(a), Final Report, FHWA-AZ94-383, Arizona Department of Transportation, Phoenix, Arizona, July 1994.
Head, K.L., and Mirchandani, P.B., (1997), RHODES ITMS, Final Report, FHWA-AZ-SP-9701, Arizona Department of Transportation, Phoenix, Arizona, April 1997.
Head, K.L., Mirchandani, P.B., and Sheppard, D., (1992), “Hierarchical Framework for Real-time Traffic Control,” Transportation Research Record 1360, pp.82-88.
Howell, K., (2001), RHODES-ITMS Field Test at US-60 and Rural Road Interchange, Final Subcontract Report, TASK Engineering, Inc., Phoenix, Arizona, June 2001.
Hunt, P.B., Robertson, D.I., Bretherton, R.D., and Winston,R.I., (1981), SCOOT - A Traffic Responsive Method of Coordinating Signal, Report LR1014, Transportation and Road Research Laboratory, Crowthorne, Berkshire, England.
ITT Systems & Sciences Corporation (1998), CORSIM User’s Manual, Version 1.04, FHWA, U.S. Department of Transportation, Washington DC.
Luk, J.Y.K., (1984), “Two Traffic Responsive Area Traffic Control Methods: SCAT and SCOOT” Traffic Engineering and Control, pp.14-20.
Miller, D., (1996), Model 2070 ATMS Controller Unit User’s Manual, Issue B.01, Automatic Signal/Eagle Signal, Austin, Texas.
Head, K.L., and Mirchandani, P.B., (1994), RHODES Project, Final Report, PAG-U-RHD 1, (for Pima Association of Governments), Systems and Industrial Engineering Department, The University of Arizona, March.
Head, K.L., and Mirchandani, P.B., (2001), “RHODES: A Real-time Traffic Signal Control System: Architecture, Algorithms and Analysis,“ Transportation Research, 9C(6), pp. 415-432. Mirchandani, P.B., Nobe, S., and Wu, W., (2001), “The Use of On-Line Turning Proportion Estimation in Real-time Traffic-Adaptive Signal Control,” Transportation Research Record, (based on paper presented at the 80th Transportation Research Board Annual Meeting), Washington, D.C., (to appear). National Electrical Manufacturers Association (1992), Traffic Controller Assemblies, NEMA Standards Publications No. TS2-1992, Washington, DC.

82
Robertson, D.I., (1969), TRANSYT: A Traffic Network Study Tool, Report LR253, Road Research Laboratory, Crowthorne, Berkshire, England.
Sen, S., and Head, K.L., (1997), “Controlled Optimization of Phases at an Intersection” Transportation Science 31, pp.5-17.
Sims, A.G., (1979), “The Sydney Co-ordinated Adaptive Traffic Systems” Proceedings of the Engineering Foundation Conference on Research Directions in Computer Control of Urban Traffic Systems, (Edited by W.S. Levine, E. Lieberman, and J.J. Fearnsides), ASCE Publication, New York pp.12-27.
Transportation Research Board (1998), Highway Capacity Manual, Special Report 209, Washington DC.
Wallace, C.E., Courage, K.G., Hadi, M.A., and Gan, A.C., (1998) “TRANSYT-7F User’s Guide,” Transportation Research Center, University of Florida, Gainesville.

83
APPENDIX 1
TIMING AND OTHER PARAMETERS FOR US-60 & RURAL ROAD Time-of-day plans for US-60 and Rural Road (in seconds):
Time Cycle Time Offset Phase 15 Phase 26 Phase 48 7AM – 8.30AM 110 80 24 34 52
3.30PM – 6.30PM 110 85 21 34 55 Other times 94 80 20 33 41
Turn ratios and travel times (in seconds) from upstream detectors:
Turn Proportions Approach (see Fig A) Left turn Through Right Turn
Travel Time from upstream
Approach 1 0 .88 .12 30 s Approach 2 .66 0 .34 8 s
Approach 3L 1.0 0 0 5 s Approach 3T 0 1.0 0 5 s Approach 4 0 .83 .17 8 s Approach 5 .40 0 .60 6 s
Approach 6L 1.0 0 0 5 s Approach 6T 0 1.0 0 5 s
Queue discharge rates (vehicles per second) by lane group:
Discharge rates in GREEN (vps) Discharge rates in RED (vps) Approach (see Fig A) Left turn Through Right
Turn Left turn Through Right Turn
Approach 1 0 1.8 0.5 0 0 0.3 Approach 2 0.25 0.25 0.25 0 0 0
Approach 3L 0.4 0 0 0 0 0 Approach 3T 0 1.5 0 0 0 0 Approach 4 0 1.8 0.5 0 0 0.3 Approach 5 0.25 0.25 0.25 0 0 0.3
Approach 6L 0.4 0 0 0 0 0 Approach 6T 0 1.5 0 0 0 0
Approach 3T Approach 4 Approach 3L Approach 1 Approach 6L Approach 6T
Figure A - Designation of Approaches at the Interchange
N App. 2
App 5
US60 RURAL RD.

84
APPENDIX 2
RHODES INSTALLATION INSTRUCTIONS For US60 and Rural Road in Tempe, Arizona
(August 2000)
Part A: Installation of the 2070 Advanced Traffic Controller in a TS2 cabinet
1. Install the 2070: a. Put the intersection into a flash condition. b. Physically remove the existing traffic controller from the cabinet and replace it with the
2070 controller.
2. Connect SDLC: a. Connect the cabinet’s 15-pin SDLC cable to the 15-pin connector on the end of the
SDLC adapter, ensuring that the spring clips are securely connected to the latching blocks.
b. Connect the 25-pin connector of the SDLC adapter to the SDLC port of the 2070 (located to the left of the NEMA A connector), ensuring that the spring clips are securely connected to the latching blocks.
3. Connect Power: a. Connect the cabinet’s NEMA A connector to the round A connector on the base of the
2070. b. Verify that the base unit is receiving power by checking the position of the toggle switch
located in the lower right corner, above the fuse assemblies. If the switch is in the on position, but the indicator light is not lit, verify that step 3a was completed properly. If the indicator light is still not lit, check the fuses located below the switch to verify they are intact. If they are in proper working order, there may be something wrong with the base unit; replace it, or the entire 2070, before continuing.
c. Verify that the top unit is receiving power by checking the LCD screen and/or the active light to the left of the two front panel keypads. If both are dark, open the front panel by pulling the black door latch (on the left side of the LCD) to the right, and examine the status of the power switch and indicator light. If the switch is in the on position, but the indicator light is not lit, verify that the power cord leading from the 2070-4 Power Supply Unit (located in the rear of the 2070) is plugged into the 2-outlet receptacle in the base unit. If it is, but the power indicator is not lit, there may be a problem with the 2070-4 unit; replace it, or the entire 2070, before continuing.
4. Start the 2070: a. Remove the cabinet’s flash condition and reset the MMU to begin controller operations. b. From the NextPhase main screen, go to 3) Status and 1) PhaseTim to verify the controller
is timing the intersection properly. Part B: Installation of the RHODES Traffic-Adaptive Signal Control System
5. Verify Integrity of Peer Data Connection (TOC-side): a. Confirm that the following are in place:
i. A serial connection from port 16 of Digiboard #3 (the Computran output port) to the RHODES PC serial port labeled from Computran.
ii. A serial connection from the RHODES PC serial port labeled to modem to the StarComm modem
iii. An RJ-11 connection from the StarComm modem to the twisted pair leading out to the traffic cabinet

85
iv. The RHODES PC powered up and the user currently logged on (the Administrator password is the Enter key)
b. Launch the Peer Decoder program by clicking on the desktop shortcut on the RHODES PC. Once the program window is open, click on Start under the Action submenu to begin decoding the Computran data for transmission to RHODES.
c. If the Peer Decoder software is properly receiving the Computran data, the response for each CompuMsg should be Good. If you see a response of Read Timeout, recheck the serial connection between the Computran System and the RHODES PC.
d. Confirm that the StarComm modem is receiving power via the AC adapter. e. Check to see if the StarComm modem has established a connection to the cabinet-side
modem by examining the LEDs on the modem’s display (MR, TR, OH, CD and HS will be lit). (NOTE: If the modem is unable to establish a connection, the cabinet-side modem may not be powered up, so continue with step 6.)
f. Once a connection has been established, the Peer Decoder software should begin sending data to the 2070 in the cabinet. This can be verified by examining the SD light on the StarComm modem’s display to make sure it is blinking, indicating the transmission of a message each second.
g. If the cabinet-side connection is already in place and operational, the RD light on the StarComm modem’s display will also blink, indicating the reception of a message from the 2070 each second. The received data can be verified by examining the Peer Decoder display on the RHODES PC. If ITMS_Response is ITMS_Good, then a good connection to the 2070 has been established and is operational. However, if the message type is instead ITMS_Error, with a status of CommResponseError or CommResponseNone, then a connection to the 2070 could not be established and an inspection of the cabinet-side connection (as in step 6) is required.
6. Verify Integrity of Peer Data Connection (Cabinet-side): a. Confirm that the following are in place:
i. A 2070 controller installed at the cabinet ii. An RJ-11 connection from the twisted pair leading into the traffic cabinet to the
StarComm modem iii. A serial connection from the StarComm modem to the 2070 serial port labeled
Peer Data Connection (located in the rear of the controller) b. Confirm that the StarComm modem is receiving power via the AC adapter. c. Check to see if the StarComm modem has established a connection to the TOC-side
modem by examining the LEDs on the modem’s display (MR, TR, OH, CD and HS will be lit).
d. Once a connection is established, the 2070 should begin sending data to the TOC. This can be verified by examining the SD light on the StarComm modem’s display to make sure it is blinking, indicating the transmission of a message every second. In addition, if the TOC-side connection has been setup properly, the RD light will blink, indicating the reception of a peer data message each second.
e. Verify that the peer data are being received by RHODES. i. From the NextPhase main screen, go to 3) Status, 9) More and 3) AdptStat.
(This screen displays the Peer Status as a series of 8 flags, one for each of 8 potential peers. A blank entry means that the specified peer is not being used, an “X” indicates a failure and a “.” (dot) indicates the peer is functioning properly.)
ii. Verify that peers 1 and 4 are operating correctly.
7. Verify RHODES initialization: a. From the NextPhase main screen, go to 3) Status, 9) More and 3) AdptStat. (This screen
displays the mode that NextPhase would like RHODES to be in, the state in which RHODES is currently running and the remaining time (in seconds) which must elapse before RHODES may run in Online mode.)
b. Verify that RHODES is currently running in Standby mode and that the OnLineRdy time is 0.

86
c. If the state indicates either NoRhodes or NoAdapt, RHODES has failed to initialize properly and can only be reset by restarting the 2070 (which will put the cabinet into flash). This may indicate a configuration problem with the MEN processor in the 2070, so contact the RHODES Project team if the problem persists.
8. Start RHODES (at the cabinet): a. Verify that the OnLineRdy time is 0 before continuing. (NOTE: If this is not done, then
after the end of the current cycle, RHODES will start in phase 15 and remain in that phase until OnLineRdy time reaches 0.)
b. From the NextPhase main screen, go to 1) Control. (This screen indicates the current control configuration of the NextPhase 2070 controller software. A ControlMode of Sched indicates that the 2070 is running Time Based Coordination in Scheduled mode, while Manual indicates that the 2070 is running under external control; in this case, under RHODES control. When running under Sched mode, the FreePln indicates the current plan, while under Manual mode, ManPln indicates the current plan.)
c. On the right keypad, depress the “–“ key repeatedly until ControlMode indicates Manual. Next, depress the ESC key, then the YES key to save this change.
d. From the NextPhase main screen, go to 3) Status, 9) More and 3) AdptStat to verify that the mode has changed from Standby to Online. (NOTE: RHODES will not switch to Online mode until the end of the current cycle, i.e., the end of phase 48.)
e. Next, from the NextPhase main screen, go to 3) Status, 9) More and 3) AdptStat to verify that the state has changed from Standby to Online, i.e., RHODES is now controlling the intersection.
f. From the NextPhase main screen, go to 3) Status, 9) More and 4) AdptQue. (This screen shows the current queue estimates used by RHODES when making decisions regarding the optimal phasing plan to follow. (NOTE: While viewing this screen, hit the ENT key on the right keypad to view the current phasing information and ESC to go back.) The sixteen movements are labeled as follows:
SBL Southbound Left SBT Southbound Through SBR Southbound Right WBL Westbound Left WBT Westbound Through WBR Westbound Right NBrL Northbound Bridgedeck Left NBrT Northbound Bridgedeck Through NBL Northbound Left NBT Northbound Through NBR Northbound Right EBL Eastbound Left EBT Eastbound Through EBR Eastbound Right SBrL Southbound Bridgedeck Left SBrT Southbound Bridgedeck Through
9. Halt RHODES (at the cabinet):
a. From the NextPhase main screen, go to 1) Control. On the right keypad, depress the “+” key repeatedly until ControlMode indicates Sched. Next, depress the ESC key, then the YES key to save this change. (NOTE: This change will become effective at the end of the current phase and will have the effect of putting RHODES in Standby mode and returning the interchange to TBC.)
10. Start RHODES (at the TOC): a. From the NextPhase main screen, go to 1) Control. On the right keypad, depress the “+“
key repeatedly until ControlMode indicates Remote. (Note: When the 2070 is in Remote mode, the controller will continue to operate the current active plan until it receives a command from icons to do otherwise.) Next, depress the ESC key, then the YES key to save this change.
b. On the RHODES PC located within the TOC Computer Room, begin by verifying that the NT Service “ITMS TrafficControl” is running. To do this, open up the Services control panel and scroll down to ITMS TrafficControl. Verify that the service has a status of Started. If it does not, highlight the ITMS TrafficControl service entry and click on the Start button to activate the service.
c. Next, from within the icons main window, click on the Control menubar command, then Manual Assignment in the drop-down menu. Within the Manual Assignment window, click on the “+” sign next to the Tempe system to display the associated intersections and

87
highlight US60 & Rural. Next, click on the Add Row button to create a new assignment command for this controller. This will cause a new row to be created with default entries. Click on Action and select PAT: from the list of options which appears. Then, position the cursor just after the “:” after PAT and enter the number “1” (without the quotes). Next, click on the empty space under the entry EN to enable this assignment. Then, click on the Apply button, followed by the OK button to close the window. You should now notice the current plan, on both the icons and PeerDecoder-RHODES Status screens reflect the fact that the 2070 is now in Plan 1, which effectively turns RHODES on. To put RHODES back into Standby mode, repeat the above procedure, but changing the # value after PAT: to the desired plan. In order to revert to Sched mode, step 10a will also need to be repeated, this time changing from Remote to Sched mode.

88
APPENDIX 3
DATA COLLECTION AND DATA RELIABILITY (Excerpted from TASK Engineering Inc. Final Report)
DESCRIPTION OF DATA COLLECTION EFFORT Traffic data were collected for two scenarios, one with the existing traffic signal control system, called the Off scenario, and the other scenario with the RHODES software controlling the traffic signals, called the On scenario. The traffic data were collected on two weekdays in September, exactly one week apart. Data was collected for the 7:00 AM to 10:00 AM, 11:00 AM to 2:00 PM and 3:00 PM to 6:00 PM peak periods, using the existing signal control procedures. It is assumed that these procedures are optimal for the existing traffic flows and signal timing theory. By collecting data on the same day of the week in the same month, we hope to minimize temporal variations in the data. On the first weekday, Thursday, September 7, 2000, Off scenario data were collected in the AM and PM periods, and On scenario data were collected in the Midday period. On the following Thursday, September 14, On scenario data were collected during the AM and PM periods, and Off scenario data were collected during the Midday period. The following traffic parameters were calculated for AM and PM peak periods for the Off and On scenarios:
• Control Delay per vehicle, by lane group. • Control Delay per vehicle for the interchange as a whole. • 95th Percentile queues length in vehicles for each lane group. • Platoon Ratio, for each direction on the arterial. • Total traffic entering the interchange.
Control delay is the total delay to vehicles at a traffic signal, including stopped delay, move-up in queue time, lost time due to acceleration and lost time due to deceleration. Control delay is the best single measure of operations of a signalized intersection. The lower the control delay per vehicle, the better. The procedure for estimating control delay from field data is found in Appendix III of Chapter 9 of the 1998 update of the Highway Capacity Manual, [Transportation Research Board, 1998, Page 9-117].… Queue lengths for 95th percentile measure the length of a back-up from the intersection. Long queue lengths should be associated with long control delays. In addition, long queue lengths have the potential of effecting operations at upstream intersections and driveways, or of overflowing storage bays. Either phenomena creates secondary delays. Traffic arriving on freeway off-ramps can be assumed to arrive at a platoon ratio of 1.0. The platoon ratio is a measure of traffic signal progression. A platoon ratio above 1.0 indicates positive signal progression. Higher platoon ratios indicate better progression. Platoon Ratio is defined by the Highway Capacity Manual chapter on signalized intersections [Transportation Research Board, 1998, Page 9-11]. It is:
Rp = P(C/gi) where,
Rp = Platoon Ratio P = proportion of all vehicles in movement arriving during the green phase. C = Cycle length gi = effective green time for movement i.

89
For any given intersection, control delay and queue lengths are expected to be functions of traffic flows. So for the before and after scenarios to be comparable, they must have nearly identical traffic flows. The Highway Capacity Manual, 1998 Update, describes a method for collecting control delay data in the field (Chapter 9, Appendix III). This consists of teams of 2 persons each collecting queue data on each approach. The queue data is then used to calculate estimated control delay. There are 10 lane groups and two through approaches at the traffic interchange, so a team of 6 persons can collect approximately 60 minutes of data on each approach during the three-hour peak period. The same group of data collectors can collect Platoon Ratio data on the cross street approaches during the same time period. Queue lengths are directly calculated from the same data used to estimate control delay. Traffic counters are in place on each approach to count total traffic. This is used to compare the before and after time periods and as a check on manually collected data. Table 1 shows an example schedule for data collection for the AM period.
Table 1 Example Schedule for AM period
RHODES-ITMS Field Test Start Time 7:00 AM 7:30 AM 8:00 AM 8:30 AM 9:00 AM 9:30 AM
Team 1 P2 Q9 Q9 Q10 Q10 P2 Team 2 P1 Q1 Q1 Q2 Q2 P1 Team 3 Q3 Q3 * * Q8 Q8
* Collect Q4 and Q5 at intervals, and Q6 and Q7 at interval midpoints. TASK Engineering together with Traffic Research & Analysis collected the data manually. This method is chosen over use of video cameras to reduce the expense. Manual data collectors also have a better view than a video camera, and can move up and down the queue to collect data. Another method of collecting delay data is by floating car travel time study; similar to the data we are collecting now for the City of Mesa. However, the chosen method will probably be more accurate because it counts delay for a much larger number of vehicles and can collect delay for all movements through the intersection. The specific steps in the project are: Task 1. Scheduling and training. Data collectors receive 2 hours training on procedures and schedule. Task 2. Off Scenario data collection. Three teams of 2 persons each collect queue length and platoon arrival data at U.S. 60/Rural Road interchange from 7:00 AM to 10:00 AM, 11:00 AM to 2:00 PM and from 3:00 PM to 6:00 PM on a typical weekday. Stopwatches were used for timing, which created a source of error because data collectors punched the end of one period followed by the start of the next. About one second was lost between the two punches. A correction factor was used in the data reduction process to expand queue length data to account for the missing time. Arriving vehicles were counted using electronic counting devices for the busier movements. This also provided an accurate accounting of time. Task 3. On Scenario data collection. Four teams of 2 persons each collect queue length and platoon arrival data at U.S. 60/Rural Road interchange from 7:00 AM to 10:00 AM, 11:00 AM to 2:00 PM and from 3:00 PM to 6:00 PM on a weekday exactly one week after the before scenario. Task 4. Data Reduction. The data collected in task 2 and 3 is used to calculate the statistics described above. Task 5. Draft and Final Report.

90
RELIABLITY OF DATA Traffic arriving at several approaches could be compared directly with machine counts at the same location. This was possible for 36 one-hour periods. For these 36 periods, the manual count was lower by an average of about 34 vehicles. An undercount is reasonable, since humans can expect to miss an occasional vehicle at high volumes. The undercount is influenced by two large undercounts on through traffic on the overpass. This was the most difficult count due to high volume and uncomfortable conditions. Counters were also collecting extra data during this count. Even including the two high counts, the standard deviation of 143 is about 19 percent of the average manual count. The standard deviation of the measured control data for the On scenario is also related to the reliability of the data. Large standard deviations may be due to errors in data collection or variation in real results. For 10 of the 12 cases, the standard deviation was less than 16 percent of the mean. For two cases, it was between 40 and 50 percent. The two cases with highest standard deviation as a percent of mean were a left turn move with lower volumes. Hence, higher variation might be expected in the data. Time interval data was difficult for data collectors to get correct. Stopwatches were used to record 18 second intervals. At the end of one interval, a data collector pressed a stopwatch, called the time, and then pressed reset. A second or so was lost each time interval between the time the watch is pressed to stop one interval and the time it is pressed to start the next. So if only 190 queues were recorded in an hour, the actual time interval was slightly more than 18 seconds. An adjustment to the data was made to account for this variation in time interval. At the end of the data collection period, counters were instructed to keep count of cars that did not clear during that time period, and record them for as many intervals as was needed for them to leave the intersection. This instruction was difficult for data collectors to understand, and so was usually not included. Because the time period counted was relatively long, 60 minutes, this source of error is probably not high.
Related Documents