Eberbach et al. Plant Methods 2013, 9:3 http://www.plantmethods.com/content/9/1/3 Rhizo-lysimetry: facilities for the simultaneous study of root behaviour and resource use by agricultural crop and pasture systems Eberbach et al. PLANT METHODS

Welcome message from author
This document is posted to help you gain knowledge. Please leave a comment to let me know what you think about it! Share it to your friends and learn new things together.
Transcript
Eberbach et al. Plant Methods 2013, 9:3http://www.plantmethods.com/content/9/1/3
Rhizo-lysimetry: facilities for the simultaneousstudy of root behaviour and resource use byagricultural crop and pasture systemsEberbach et al.
PLANT METHODS
METHODOLOGY Open Access
Rhizo-lysimetry: facilities for the simultaneousstudy of root behaviour and resource use byagricultural crop and pasture systemsPhilip L Eberbach1*, Jeffrey Hoffmann1,2, Sergio J Moroni1, Leonard J Wade1 and Leslie A Weston1
Abstract
Background: Rhizo-lysimeters offer unique advantages for the study of plants and their interactions with soils. Inthis paper, an existing facility at Charles Sturt University in Wagga Wagga Australia is described in detail and itspotential to conduct both ecophysiological and ecohydrological research in the study of root interactions ofagricultural crops and pastures is quantitatively assessed. This is of significance to future crop research efforts insouthern Australia, in light of recent significant long-term drought events, as well as potential impacts of climatechange as predicted for the region. The rhizo-lysimeter root research facility has recently been expanded toaccommodate larger research projects over multiple years and cropping rotations.
Results: Lucerne, a widely-grown perennial pasture in southern Australia, developed an expansive root system to adepth of 0.9 m over a twelve month period. Its deeper roots particularly at 2.05 m continued to expand for theduration of the experiment. In succeeding experiments, canola, a commonly grown annual crop, developed a moreextensive (approximately 300%) root system than wheat, but exhibited a slower rate of root elongation at rates of7.47 x 10–3 m day–1 for canola and 1.04 x10⁻² m day–1 for wheat. A time domain reflectometry (TDR) network wasdesigned to accurately assess changes in soil water content, and could assess water content change to within 5%of the amount of water applied.
Conclusions: The rhizo-lysimetry system provided robust estimates of root growth and soil water change underconditions representative of a field setting. This is currently one of a very limited number of global research facilitiesable to perform experimentation under field conditions and is the largest root research experimental laboratory inthe southern hemisphere.
Keywords: Rhizo-lysimeter, Time Domain Reflectometry (TDR), Mini-rhizotron-root observation tube, Root growth,Lucerne, Canola, Wheat
BackgroundA major challenge facing plant scientists and ecologists isachieving a greater understanding of the behaviour of plantroots, particular when growing in undisturbed field soils,and how of these organs respond to various resources orstimuli. Traditional knowledge of the effect of a particulartreatment on plant roots has largely been derived fromdestructive samplings, yet a more comprehensive under-standing of the relationship between plant roots and
applied stimuli can be gained from non-destructive,repeated observations of root activity. There is an increa-sing need to develop improved methods to enable in situobservations of plant roots in response to soil treatmentsCurrent methods to quantify root behaviour in situ have
been reviewed [1,2]. Approaches that do not involve thedestructive harvest of plant tissue are rare, but includerhizotron techniques; specifically the use of root windows(flat surfaces) or mini-rhizotrons (curved surfaces) [1,3,4],or root imaging techniques, such as computer aidedtomography or magnetic resonance [5]. While imagingtechniques have good spatial resolution, they can onlyscan comparatively small volumes and therefore arerestricted to small pot studies, mainly with young plants.
* Correspondence: [email protected] Graham Centre for Agricultural Innovation, School of Agricultural andWine Sciences, Charles Sturt University, Boorooma St, Wagga Wagga, NSW2678, AustraliaFull list of author information is available at the end of the article
PLANT METHODS
© 2013 Eberbach et al.; licensee BioMed Central Ltd. This is an Open Access article distributed under the terms of the CreativeCommons Attribution License (http://creativecommons.org/licenses/by/2.0), which permits unrestricted use, distribution, andreproduction in any medium, provided the original work is properly cited.
Eberbach et al. Plant Methods 2013, 9:3http://www.plantmethods.com/content/9/1/3
Conversely, rhizotron techniques lack the spatial reso-lution of imaging but can be used in field studies, andallow for repeated observations of root activity at theinterface of the viewing window with the soil media at aconstant location [1]. However, the presence of an artificialinterface can lead to abnormal root activity at the inter-face. Additionally, as mini-rhizotron tubes are ofteninstalled in the field at angles of up to 45° to the groundsurface, they can encourage vertical root tracking [3].While some studies have investigated the bias created bythe non-horizontal installation of mini-rhizotron tubesand methods to correct this bias [6], it is generallyaccepted that horizontally installed mini-rhizotrons arepreferred for the spatial assessment of root growth overtime.In 1995, a large, field-based rhizo-lysimeter complex
was constructed in an agricultural field at Charles SturtUniversity’s (CSU) farm at Wagga Wagga, in south-easternAustralia. The design of this facility permitted lateral accessto the subsurface of each monolith, which could allow forthe lateral installation of suction cups for soil solute sam-pling, horizontal placement of mini-rhizotron tubes forquantification of root growth [7,8] and a networked TDRfor simultaneous measurement of soil water content. Sinceconstruction, several major research projects have beenconducted, to investigate a typical agricultural pasture-croprotation with the intent of understanding the implicationsfor root growth and water use by the sequence of cropswithin the rotation. The objective of this manuscript, there-fore, is to describe the operation of this facility, its capacity,and sensitivity in measuring plant root system developmentas well as quantifying the hydrologic behaviour of soils. Spe-cifically, we consider the strengths and weaknesses of sucha facility with the intention of informing the design of fu-ture rhizo-lysimeters.
ResultsQuantitative analysis of root growthWe report on results from two major studies conductedin the rhizo-lysimeter to simulate the prevailing mixedfarming rotation, using species of agronomic importanceand growing in two contrasting soils. Over the period1999–2003, lucerne was grown as a perennial pasture,followed by a series of annual, agricultural crops overthe period 2004–2006; a rotation typical of the region.
Root growth of lucerneThe study conducted over 1999–2003 focussed on the es-tablishment pattern of lucerne roots, and their use ofwater in relation to depth, as affected by summer rainfall.The development of the lucerne root system during
season one, in relation to soil depth and surface wateringis shown in Figure 1, while development over the twosubsequent years (September 2000 – April 2003) is
shown in Figure 2. The observations made over theduration of the study indicate that lucerne roots proli-ferated at shallow depths (0.65 and 0.9 m) in year 1(Figure 1), and in this season at depths greater than 1 m,mainly in response to the application of surface water inFebruary 2000 and April 2000. In subsequent seasons,further growth of lucerne roots were mainly deeper(2.05 m) in the soil (Figure 2).A limited number of studies have investigated root
growth of lucerne in a variety of soils in the northernhemisphere, and in general, showed that the abundance offine roots, occurring in the surface layer (0 – 0.3 m), taperoff as soil depth increases e.g. Luo et al. [9]. In contrast,observational data presented from our study indicated thereverse (Figure 2). However, as water was supplied to thedeep subsoil (2.4 m), with the soil water potential main-tained between −10 and −18 kPa in each core at a depthof 2.05 m, the prolific root growth observed at this depthin the later years of this study was attributed to their unre-stricted access to deep subsoil water at this time and tothe lower soil strength associated with moist soil. Theseresults differ from those previously reported under typicalfield conditions when no access to a water table existed[9], but illustrate the degree of control and quantificationof root growth offered by facilities such as these in con-trast to field-based studies.
Error analysisWhile the use of mini-rhizotrons allowed for repeated rootobservations, a proportion of error about the mean of thesix replicate cores could be attributed to this technique forassessment of root growth. Error bars about each point inFigures 1 and 2 increased in magnitude with increasingmean root number and also with increasing depth. How-ever, analysis of the magnitude of standard error about themean, as a proportion of the mean (SE/M) (Figure 3a),indicated that this statistic was relatively stable, particu-larly in 2001 & 2002. Closer examination of Figure 3ashowed that for the roots in the shallower soil layer(0.65 m & 0.9 m), for the duration of the experiment,SE/M was relatively constant, and that the increase inSE/M in both layers at the sampling dates from September13, 2000 in year 1 until 3 January 3, 2001 in year 2 corre-sponded with a period when a short (35 cm) borescopewas used to assess root intersections, while the regularborescope was under repair (Figure 3a). At this time, rootcounts collected using the 0.3 m borescope were con-verted to root counts across the entire observation tube(0.76 m), by means of a regression coefficient obtainedusing data captured on the Feburary 15 2001 (22 monthsafter sowing) from all tubes using both borescopes as:
y ¼ �6:13þ 42:7� R2 ¼ 0:31
Eberbach et al. Plant Methods 2013, 9:3 Page 2 of 18http://www.plantmethods.com/content/9/1/3

0.65 m
0
10
20
30
40
0.9 m
Num
ber o
f roo
ts in
ters
ectin
g tw
o sc
ribe
lines
per
min
i-rhi
zotro
n tu
be
0
10
20
30
1.45 m
0
10
20
30
2.05 m
Date
9.3.
00
16.3
.00
20.3
.00
30.3
.00
15.4
.00
28.4
.00
0
10
20
30
Figure 1 Number of lucerne root intersecting score lines on mini-rhizotron tubes at four depths during 2000. Each data point representsthe mean of data collected from six cores and bars reflect the standard error for each mean.
Eberbach et al. Plant Methods 2013, 9:3 Page 3 of 18http://www.plantmethods.com/content/9/1/3

0.65 m
0
100
200
300
0.9 m
Num
ber o
f roo
ts in
ters
ectin
g tw
o sc
ribe
lines
per
min
i-rhi
zotro
n tu
be
0
100
200
300
1.45 m
0
100
200
300
2.05 m
Date
13.9
.00
7.11
.00
11.1
2.00
3.1.
0115
.2.0
16.
3.01
26.3
.01
12.4
.01
25.4
.01
16.5
.01
8.6.
0130
.6.0
124
.7.0
115
.8.0
11.
10.0
11.
12.0
128
.12.
0124
.1.0
222
.3.0
215
.4.0
2
0
100
200
300
Figure 2 Number of lucerne root intersecting score lines on mini-rhizotron tubes at four depths from 2000 to 2002. Each data pointrepresents the mean of data collected from six cores and the bars reflect the standard error for each mean. It is important to note that the lowernumber of points counted over the first four periods (September 9 2000 to January 1 2001) were counted using a shorter borescope and using aconversion function calculated for each tube using data collected on February 15 2001 using both the shorter and longer boroecope.
Eberbach et al. Plant Methods 2013, 9:3 Page 4 of 18http://www.plantmethods.com/content/9/1/3

where y = estimated number of root intersections acrossthe whole core and × is the number of root intersectionsobserved using the short borescope. The low R2 in thisrelationship indicates that the shorter borescope was apoor alternative for the longer instrument, confirmingthe heterogeneity of root growth in soil at these depthsas a product of the roots tendency to congregate inzones of fractured soil or biochannels [10]. Our findingsindicated that the evidence of root activity in a sole loca-tion is not a reliable predictor of root activity elsewherein the same horizontal plane.Unlike the magnitude of the error seen in shallower
layers, the SE/M was comparatively high in the first seasonin the deeper layers (1.45 & 2.05 m), which is likely indica-tive of a sparse root system early in the establishmentphase of a perennial plant but later, like in the upperlayers, SE became a smaller proportion of the mean. The
reduction in variability in later seasons was probably dueto plant modification of the soil environment over time,such as cracking of soil in response to plant water uptakeand soil drying, as well as the creation of biopores afterthe senescence of roots [11,12]. While the magnitude oferror is a primary consideration, transforming the rawdata, using a square root function, reduced the ratio ofstandard error to the mean substantially (Figure 3b).While the apparent standard error for each meanappeared to increase with depth, comparing square roottransformed SE/M, showed that regardless of depth,standard error as a proportion of the mean was similar(Figure 3b), particularly in later seasons (e.g. years 2 and 3(2001 and 2002). For consistent estimates of root growth,the expression of SE/M over all depths indicated that sixreplicates of each treatment was likely adequate, a findingwhich was comparable with findings of O’Toole and Bland
a: Untransformed
Sta
ndar
d er
ror
as a
pro
port
ion
of th
e m
ean
of r
oot i
nter
sect
ions
rec
orde
d at
eac
h de
pth
0.0
0.5
1.0
1.5
2.0
b: Square root transformed data
Date
9.3.
0016
.3.0
020
.3.0
030
.3.0
015
.4.0
028
.4.0
013
.9.0
07.
11.0
011
.12.
003.
1.01
15.2
.01
6.3.
0126
.3.0
112
.4.0
125
.4.0
116
.5.0
18.
6.01
30.6
.01
24.7
.01
15.8
.01
1.10
.01
1.12
.01
28.1
2.01
24.1
.02
22.3
.02
15.4
.02
Sta
ndar
d er
ror
as a
pro
port
ion
of th
e m
ean
for
s
quar
e ro
ot tr
ansf
orm
ed r
oot i
nter
sect
ions
rec
orde
d at
eac
h de
pth
0.0
0.5
1.0
1.5
0.65 m0.9 m1.45 m2.05 m
Figure 3 Analysis of the standard error as a proportion of the mean for lucerne root intersection data from 2000–2002. (a) Standarderror as a proportion of the mean for untransformed data. (b) Standard error as a proportion of the mean for square-root transformed data.
Eberbach et al. Plant Methods 2013, 9:3 Page 5 of 18http://www.plantmethods.com/content/9/1/3
[13]. The residual error reflected, in part, the relatively lowvolume of soil sampled at any particular depth with mini-rhizotrons (about 6%), and of the tendency of roots toclump in zones of reduced physical resistance [11,12],particularly in deeper soil layers. Consequently, furtherreductions in error using this technique are probably moredifficult to obtain. Although larger volumes of soil wouldbe useful to sample for more precise root growth assess-ment, the time consuming nature and cost of assessmentin using sampling procedures other than mini-rhizotrons
to assess growth would seriously limit most researcher’scapacity to perform this work. Therefore, the use of mini-rhizotrons for root growth assessment appears a reason-able compromise to obtain reliable root data.
Root growth of annual crops following lucerneThe subsequent study, over the period 2004–2006 investi-gated root development and water-use behaviour of cropssucceeding lucerne in the rotation, and used some soilcores from the previous study.
a
Date
26.0
7.20
042.
08.2
004
11.0
8.20
0418
.08.
2004
25.0
8.20
041.
09.2
004
6.09
.200
412
.09.
2004
17.0
9.20
0424
.09.
2004
30.0
9.20
046.
10.2
004
12.1
0.20
0418
.10.
2004
25.1
0.20
041.
11.2
004
8.11
.200
415
.11.
2004
22.1
1.20
0430
.11.
2004
Roo
t Int
erse
ctio
n co
unts
0
200
400
600
800
Total root counts0.2 m0.4 m0.65 m0.9 m1.45 m
b
Days after sowing
20 40 60 80 100 120
Dep
th (m
)
-0.8
-0.6
-0.4
-0.2
0.0
y = 0.499- 0.0104 R2=0.98
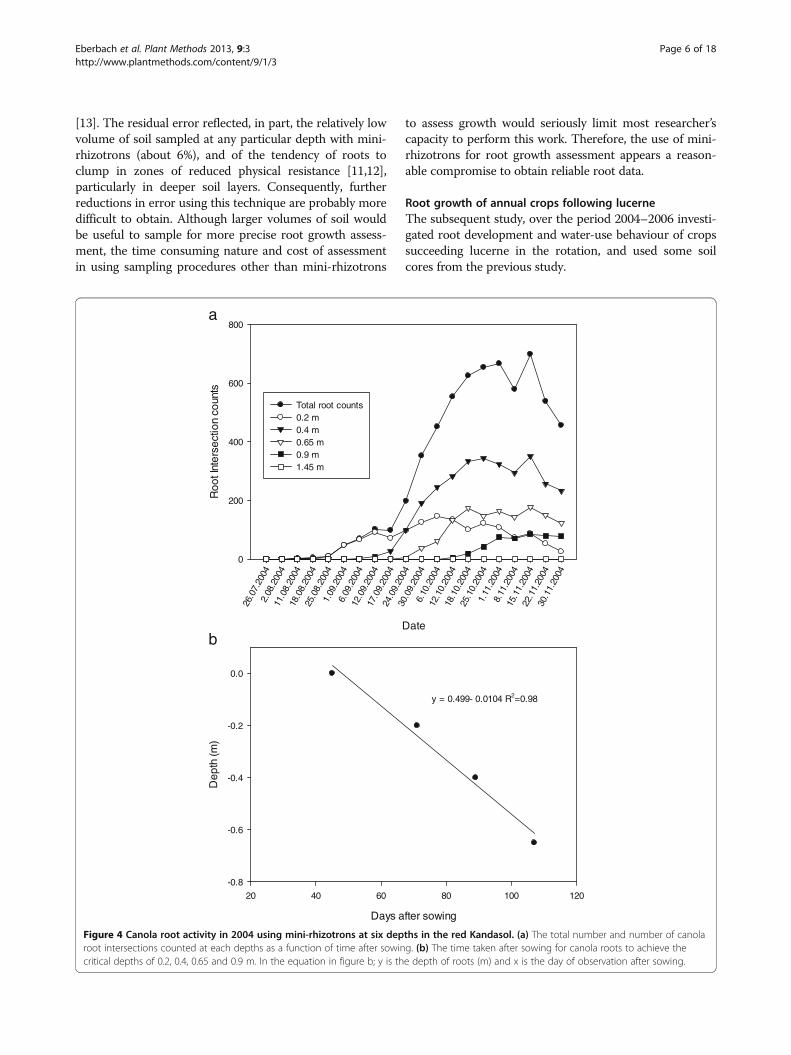
Figure 4 Canola root activity in 2004 using mini-rhizotrons at six depths in the red Kandasol. (a) The total number and number of canolaroot intersections counted at each depths as a function of time after sowing. (b) The time taken after sowing for canola roots to achieve thecritical depths of 0.2, 0.4, 0.65 and 0.9 m. In the equation in figure b; y is the depth of roots (m) and x is the day of observation after sowing.
Eberbach et al. Plant Methods 2013, 9:3 Page 6 of 18http://www.plantmethods.com/content/9/1/3

Over the crop growth season, root development wasmonitored several times per week at depths of 0.2, 0.4,0.65, 0.9 1.45 and 2.05 m, and expressed as: 1) total rootcounts per layer, 2) total root counts per core, 3) timetaken (after sowing) for the first root to appear at aparticular depth and, 4) the deepest observed rootgrowth. In a comparison of the two annual crops whichare commonly grown in rotation with lucerne, canolaproduced a more extensive root system than wheat(approximately 700 root intersections per core for canola
compared with 235 root intersections for wheat), butwheat produced maximal root number several weeksearlier than canola (October 18 2004 wheat; November1 2004 canola) (Figures 4a & 5a). Further examinationindicated differential patterns of root growth existed be-tween the two crops. In relation to soil depth, canolaproduced a greater proportion of roots in the 0.4 mlayer; in contrast, wheat favoured the development ofroots deeper in the soil profile (0.65 m) (Figure 4a & 5a).Maximum root numbers developed for each crop at
b
Days after sowing
20 40 60 80 100 120
Dep
th (m
)
-0.8
-0.6
-0.4
-0.2
0.0 y= 0.16 - 7.47x10⁻³X R2=0.96
a
Date
26.0
7.20
042.
08.2
004
11.0
8.20
0418
.08.
2004
25.0
8.20
041.
09.2
004
6.09
.200
412
.09.
2004
17.0
9.20
0424
.09.
2004
30.0
9.20
046.
10.2
004
12.1
0.20
0418
.10.
2004
25.1
0.20
041.
11.2
004
8.11
.200
415
.11.
2004
22.1
1.20
0430
.11.
2004
Roo
t int
erse
ctio
n co
unts
0
50
100
150
200
250
Total root counts0.2 m0.4 m0.65 m0.9 m1.45 m
Figure 5 Wheat root activity in 2004 using mini-rhizotrons at six depths in the red Kandasol. (a) The total number and number of wheatroot intersections counted at each depths as a function of time after sowing. (b) The time taken after sowing for wheat roots to achieve thecritical depths of 0.2, 0.4, 0.65 and 0.9 m. In the equation in figure b; y is the depth of roots (m) and x is the day of observation after sowing.
Eberbach et al. Plant Methods 2013, 9:3 Page 7 of 18http://www.plantmethods.com/content/9/1/3

each depth were achieved about the same time aftersowing (e.g. canola and wheat; 100 & 94 DAS at 0.2 m,120 & 113 DAS at 0.4 m; 113 & 113 DAS at 0.65 m; 140& 148 DAS at 0.9 m respectively), with no root growthobserved at soil depths below 90 cm. This indicated thedistribution of roots occurred above 1 m in both annualcrops during the course of this particular growingseason.Linear regression analysis indicated that for each crop,
the relationship between root elongation rate anddepth was linear (Figure 4b & 5b), and that the rate ofelongation of canola roots (1.04 × 10⁻² m day–1) wassimilar to the rate of elongation of wheat roots (7.47 ×10⁻³ m day–1), with both achieving a maximumobserved root depth at approximately the same time(DAS 107 canola; DAS 113 wheat). These measuredrates of elongation compare well with estimates for otherwinter growing crops such as barley and chickpea, whichranged from 1.40 to 2.43 × 10⁻² m day–1 and 1.60 to2.36 × 10–2 m day–1 respectively, when measured usingthe water extraction front velocity [14], a less directmethod of measuring downward progress of roots. But,these values were considerably less than values recordedfor summer growing crops such as sunflower, soybean,maize and peanut, all of which had water extractionfront velocities of 4.4 × 10⁻²; 3.4 × 10⁻²; 3.0 × 10⁻²; and2.3 × 10–2 m day–1 respectively [15].
TDR and soil hydrologyIn a study to calibrate the TDR and to assess water infiltra-tion in relation to depth, water added on the 2 November2007 infiltrated the soil to a depth of 1.20 m, with littlechange at depths of 1.5 and 2 m (Figure 6). The averagechange in soil water content in each core increased by anaverage of 51.2 mm with standard error of 2.2 mm, fromthe application of 49.6 mm of simulated rainfall. Despitereference in the literature to a diversion of the dielectricconstant (Ka) in some soils from the Topp’s curve [16,17],the TDR system was able to capture and document therelative change in soil water content, and illustrated itssuitability for quantifying plant water uptake from soil layer,as well as drainage and water redistribution between soillayers in these soils.Based on standard errors, the TDR system was able to
predict a change in water content over the entire core,with a precision of within 5% of the amount of waterapplied to each soil core. This error could be furtherreduced by increasing the number of TDR probes percore, so that the depth increment between probes wasreduced and precision improved. The improvement in thelevel of precision offered under this condition might allowfor estimations of evapotranspiration (Et) to be made at alevel of precision, approaching that offered by weighinglysimeter facilities.
DiscussionRhizo-lysimetric facilities are an ideal facility to undertakeresearch of edaphic influences on plant root performance,as the level of experimental precision available exceedsthat normally available from field studies. Additionally,having access to undisturbed cores with horizontallymounted observation tubes and with TDR capability,temporal root development in situ and resource use canbe quantified at predetermined depths without the risk ofroot tracking occurring. This allows agricultural systemsto be studied over a number of years as occurs in mixed-farming rotations, where the legacy of a crop in oneseason can be followed and attributed directly to thedevelopment and growth of succeeding crops.
Methodology considerationsDesign considerationsThe Charles Sturt University facility offers several designadvantages. The fully incorporated structural designused mass-produced concrete products for use as silos,and concrete in-filled reinforced keys between each siloto support the roof without the need for pillars, both ofwhich are attributed to the low construction costs asso-ciated with building the present facility. Additionally,this design ensured good contact between the rear ofeach silo and the surrounding soil which enabled the soiltemperatures in each core to be maintained near that ofthe field soils which surround the facility.However, in spite of the temperature regulation advan-
tage, the current rhizo-lysimeter design reduced access toeach individual core as only 13% of each core was acces-sible from the underground chamber. This may not be animpediment for the location of certain instruments whichare entirely buried, but for equipment requiring horizontalaccess via the underground chamber, limited verticalaccess could result in a vertical plane of weakness due tothe vertical placement of equipment, and increase the riskof occurrence of anomalous root behaviour. Alternately,an open plan facility where there is 360° access to eachcore, such as in the facility at Lincoln University in Christ-church, New Zealand, would improve access and enablemore uniform placement of instrumentation to lessen ver-tical bias, but may make the soil cores more vulnerable totemperature within the underground chamber and be lessrepresentative of the surrounding soil.
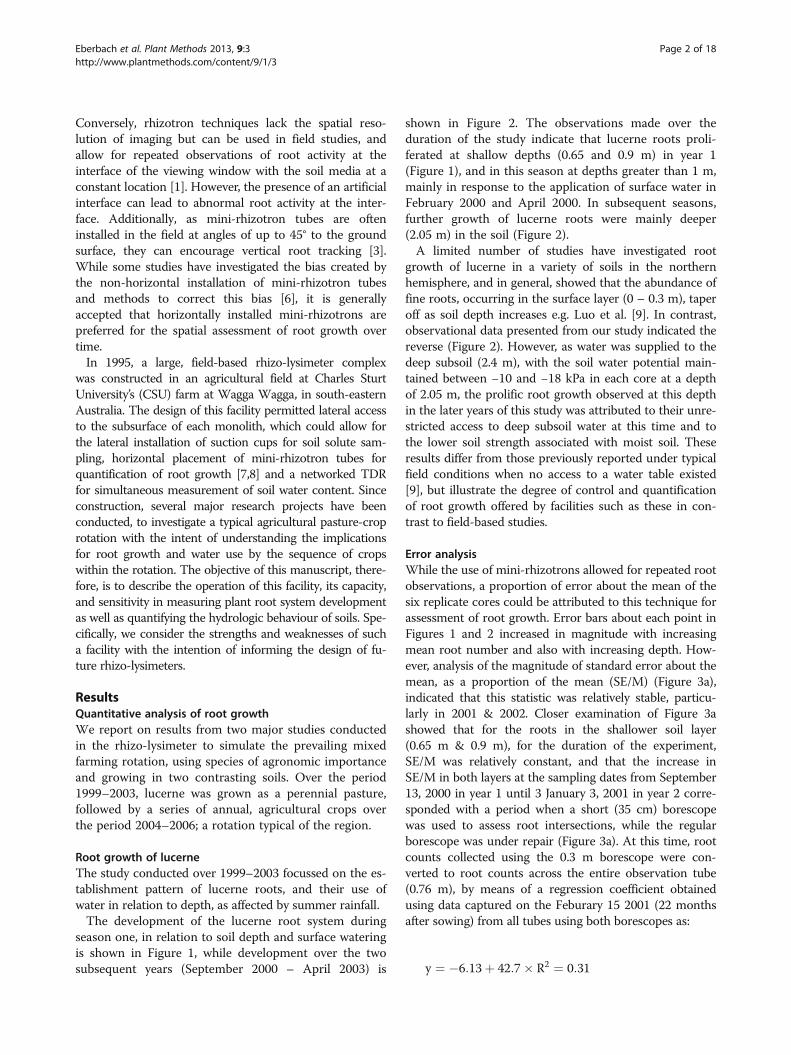
Assessment of root growth using mini-rhizotronsMini-rhizotrons are a simple method to quantify in situ,temporal root development and senescence at pre-determined depths (see Figures 7 & 8). However, as thistechnique makes spatial inferences about root systems fromdiscrete observations, it is important that soil about themini-rhizotrons are uncompromised, so that root activity inthis zone represents probable root activity in the bulk soil.
Eberbach et al. Plant Methods 2013, 9:3 Page 8 of 18http://www.plantmethods.com/content/9/1/3

As with any soil research, in using mini-rhizotrons there isa risk of modifying the soil environment as may occureither during installation, or as a result of their presence ofequipment which may affect subsequent root activity withinthe vicinity of the mini-rhizotron. Profligate root activity inthe vicinity of root observation tubes has previously been
reported but, mainly involves vertical or off-verticalmounted tubes where roots may be induced to track down-ward [3]. Carefully installed, horizontally-mounted tubesare unlikely to experience this effect. But more serioushowever, is the risk of soil disturbance either via fracturingor compaction that may occur in soil surrounding the
0.2 m
0.20
0.25
0.30
0.35
0.40
0.4 m
0.20
0.25
0.30
0.35
0.40
0.55 m
0.20
0.25
0.30
0.35
0.40
0.75 m
Vol
umet
ric w
ater
con
tent
(m3 m
-3)
0.20
0.25
0.30
0.35
0.40
1.05 m
0.20
0.25
0.30
0.35
0.40
1.35 m
0.20
0.25
0.30
0.35
0.40
2.05 m
Julian days
156 158 160 162 164 166
0.20
0.25
0.30
0.35
0.40
Figure 6 The change in volumetric soil water content of a red Kandasol at seven depths after 49.7 mm of simulated rainfall.
Eberbach et al. Plant Methods 2013, 9:3 Page 9 of 18http://www.plantmethods.com/content/9/1/3

mini-rhizotron during their installation. While damage mayoccur, careful installation into moist soil where the mois-ture content approaches field capacity and using installationprocedures and tools such as in Box et al. [4] which cutsand removes excavated soil into the coring tube, tends tominimize this risk. Consequently from our experience inthe present facility, we have not seen any evidence ofimperfect installation influencing subsequent root activity,and believe the installation technique adopted was suffi-cient. Additionally, whereas vertically and off-verticallymounted observation tubes can only observe roots in adefined spatial location, horizontally installed tubes offer anaddition spatial dimension as observations are made along
a transect at a fixed depth. From our calculations, weestimate the field of view from each mini-rhizotron tubesto be about 6% of the soil volume at each depth. As aconsequence, these observations have allowed for spatialroot behaviour such as root clumping around soil cracks orpre-existing root channels to be quantified.Several methods have been proposed to quantify
observations of root activity using rhizotrons or mini-rhizotrons: (1) enumeration of intersections of rootswith horizontal lines on the wall of the observationsvessel; (2) enumeration of intersections of roots witha grid pattern scribed to the surface of the rhizotron,and; (3) enumeration of the number of root membersintercepted at the wall of the rhizotron [18]. Usingthe CSU rhizo-lysimeter, Hoffmann [19] observedlucerne (Medicago sativa) root numbers by root inter-section of scribed reference lines on each mini-rhizotron tube over the three year study, and inferredroot development at the four depths studied. Thisapproach was adopted since it has been reported thatthe number of roots intersecting a reference point ona rhizotron wall is less influenced by conditions atthe wall surface than are estimations of root intensity[3,20]. Methods to extrapolate root intersection datato more tangible root growth parameters such as rootlength have been proposed [21,22], and are based onthe assumption of homogeneity in the soil medium.However, undisturbed soils and in particular subsoils,are not homogeneous as their physico-chemical prop-erties can change markedly over time [13] anddistance, and roots are often constrained withinbiopores and other zones of weakness [11,12,23]. Theassumption of homogeneity will in most instancesgive unreliable estimates of root length with a largeerror term comprising both experimental and compu-tational error. Conversely, other research has showngood linearity between mini-rhizotron root numbersand root length for a range of perennial woodyspecies [24], but report the relationship for eachspecies to be empirical. Yet, such reports on theexistence of a linear relationship between root inter-sections and root activity imply that the quantifica-tion of root intersections and its analysis is perhaps agood indicator of root activity in relation to genotype.Currently the CSU facility uses two different endoscopes
for viewing roots depending on the depth of the observa-tion tubes. In the two upper observation tubes (0.2 m and0.4 m depth), where vertical access to the tube is required,a flexible endoscope (Olympus IF8C5-30) has been exten-sively use. At deeper depths, where horizontal access isenabled via the underground chamber, a rigid borescope(Olympus R080-084-090-50) is used. While the flexibleendoscope is perhaps more difficult to use as it does nothave rotational flexibility of the optic fibre, and requires
Figure 7 Photograph of a wheat root at a depth of 0.65 mcrossing a mini-rhizotron scribe line in a red Kandasol. Arrowsindicate a secondary lateral root and root hairs. The indentations onthe scribe line indicate a distance of 10 mm. Photograph taken 14September 2004.
Figure 8 Photograph of a senescing wheat root taken in thesame location as figure 7. Arrows indicate a senescing secondarylateral root. The indentations on the scribe line indicate a distance of10 mm. Photograph taken 20 April 2005.
Eberbach et al. Plant Methods 2013, 9:3 Page 10 of 18http://www.plantmethods.com/content/9/1/3

the operator to manually rotate the entire scope in movingfrom one reference line to the other, optically there is littledifference between the two. However, a new range ofindustrial videoscope are becoming commercially availablewhich feature more flexible fibreoptics, trigger griphandles and controls, and integrated cameras, and thesewill greatly lessen the demand on the operator and easethe routine collection of this data.
Estimation of soil waterEarly research in the present facility relied on the neutronmoisture meter to quantify change in soil water content ineach profile. The transition from neutron emission toTDR has produced numerous advantages, but severaldisadvantages have emerged.TDR is commonly used to quantify soil water content
[25,26]. While neutron emission is an excellent techniquefor quantifying soil water content, TDR technology offers
other advantages including installation at remote fieldsites, networking through a series of tiered multiplexers[27,28], and a high resolution capacity, coupled with thehigh frequency of measurement which allows for infiltra-tion, drainage events and redistribution events to beobserved (e.g. Figure 9). However, salt concentration andsoil temperature can limit the applicability of TDR tomeasure Ka of soil as in saline soils; the waveform tendsnot to be reflected due to salt, short-circuiting the sensor[29], while temperature can affect the waveform [30].Additionally soils with high clay content confound Topp’sequation for the determination of soil water content[16,17].To overcome the effect of high salt contents, several
authors suggest sheathing the sensor to insulate the wave-guide [28,31]. Mojid et al. [32] showed polyethylene tosatisfactorily insulate the wire, allowing the endpoint tothe signal to be resolved. In the CSU facility, increasing
Vol
umet
ric w
ater
con
tent
(m
3 m-3
)
0.26
0.28
0.30
0.32
0.34
0.36
0.38
0.40
Julian days
156 158 160 162 164 166
0.20
0.25
0.30
0.35
0.40
0.45
Irrigation event
Drainage
Redistribution
Increase in water content due to drainage from layers above
Redistribution
0.2 m
0.65 m
Figure 9 TDR trace from a single core at two depths (0.2 and 0.4 m) after a major irrigation event where evaporation was preventedfrom occurring.
Eberbach et al. Plant Methods 2013, 9:3 Page 11 of 18http://www.plantmethods.com/content/9/1/3
concentrations of salts in the red Kandasol [33] and at alldepth in the grey Vertosol [33] necessitated coating themiddle wire with electrical heat-shrink insulation. Thistreatment resulted in reasonable reflectance of the signalsfrom the coated electrode so suitable estimates of Kacould be determined.However, both soil types in the CSU facility were
dominated by the presence of substantial amounts ofclay. This high concentration of clay prevented our useof the universal calibration to measure absolute soilvolumetric water content. In situ calibration of TDRrevealed that error estimates of actual soil water contentat various depths in both soil types was high. Roth et al.[16] and Bridge et al. [17] reported in high clay contentsoils that Ka as estimated by TDR, frequently deviatedfrom the Topp curve. Bridge et al. [17] indicated thatthis was due to the unique dielectric differences betweenbound water (mono-layer adsorbed) @ Ka =3.2 com-pared with free water at 20°C @ Ka=80.4. As clay soilshave a high surface area in contrast to sandy or loamsoils [17], they contain vastly greater amounts of boundwater compared with sandy textured soils. While bound(or adhesion) water is reflected uniformly in the calcula-tion of soil water content, its lower Ka biases theintegrated estimate of Ka for the soil layer, but once allsolid surfaces have an adhering monolayer of water,further increases in soil water occur as free (unbound)water, which normally results in a linear increase in Kaof the soil until saturation occurs, and allows change insoil water content to be estimated accurately [17]. Con-sistent with this hypothesis, TDR in the CSU facility,while unable to predict absolute volumetric water con-tent of each of the layers, was able to measure with greatprecision changes in free (or unbound) water, which iswater which normally enters the soil through rainfall oracquired by plants as transpiration and is hence ofagricultural significance.
Robustness of the system designMany lysimeter facilities tend to use large soil monolithswhich have a large evaporative surface. For example,Schneider and Howell [34] reviewed 10 different facilitiesfor measuring Et of intact ecosystems, with surface areasranging from 2.25 – 12.6 m2. A preference for largermonoliths exists as their ability to mimic field conditionsincreases as their edge to area ratio declines and hence theboundary influence decreases. This is in stark contrast tothe small pot sizes (e.g., 0.015 m2) that are commonly usedin controlled environment studies, often with disturbedsoils, and whose relationship to field conditions is ques-tionable [35]. In contrast, the comparatively larger size ofthe undisturbed soil cores used in the present facility(0.45 m2), represents a reasonable compromise betweensizes sufficiently large to reflect accurately represent field
conditions, while still being of a size that doesn’t impedecollection from the field at a reasonable cost. Largerundisturbed soil cores would be extremely difficult tocollect intact from the field from an engineering perspec-tive. Further, the precision of TDR, as was demonstratedin this study, can provide useful estimates of core Et basedon calculations of soil water deficits at multiple depths.Our multi-year experimental results demonstrate clearlythat this system can provide robust measures of rootgrowth, water use and Et, under conditions representativeof the field and in relation to the succession of crops.
ConclusionThe Charles Sturt University lysimeter in Wagga WaggaNSW Australia has proven to be a versatile experimentalfacility, which contains monoliths of soils collected fromtwo locations remote from the facility. The lysimeter isunique due to its capability to contribute to our under-standing of below-ground, temporal ecology of agricul-turally-modified environments. Our particular interest inthis field of research has in the past been motivated by theincreasing prevalence and severity of dryland salinizationin highly modified catchments in southern Australia. Inaddition, an understanding of the hydrologic impact asso-ciated with the conversion of a catchment from perennial,native vegetation to short-lived, annual crops and pasturesis of particular relevance. In this context, the lysimeter hasbeen an invaluable tool to study the root-zone and rhizo-sphere of crops or pastures over time and to assess thelegacy of that historical sequence on current crop beha-viour. Statistical analyses of our observations on rootbehaviour indicate that the history of preceding speciesmay have an enduring influence on the root behaviour ofsubsequent species. Further, the legacy of an individualspecies may subsequently affect the soil architectureaffecting the hydrological behaviour of the regolith. Theselong-term studies will be the subject of subsequentpublications.Despite research aimed at understanding the hydro-
logical footprint of agricultural systems, a decade or moreof drought in southern Australia has caused a change inour research focus, with climate change and plant adapta-tion to water deficit stress becoming of increasing interest.This facility will assume an increasingly important role inthe examination of the kinetics of root behaviour, withquestions related to the depth of rooting, the chemicalnature of organic matter as deposited by roots, patterns ofroot turnover, and relationships with soil microflora androot decay rates emerging as issues of immediaterelevance. Pursuit of these interests may lead to a philo-sophical change in the management of the facility,however, to date, the cores have been preserved in time,and physical sampling of soils has been discouraged. Withthe emergence of a need for more information on the
Eberbach et al. Plant Methods 2013, 9:3 Page 12 of 18http://www.plantmethods.com/content/9/1/3
carbon sequestration potential of agricultural systems, anda more thorough understanding of rhizosphere processes,there will be a great demand to sample the soils withineach core and for methods to enable this to occur, whilepreserving the crop rotation legacy.
MethodsLocation and description of the research facilityThe facility is located in a 15 ha agricultural paddock onthe Charles Sturt University Farm at Wagga Wagga, NewSouth Wales, Australia (Latitude 35° 03’ 15.40” S Longitude147° 20’ 14.53” E) at an elevation of 219 m above sea level.The site is serviced by single phase 240 VAC power supply,and underground high pressure water mains, telephoneand a high speed data communications cable.The research facility comprises two rows of 12 concrete
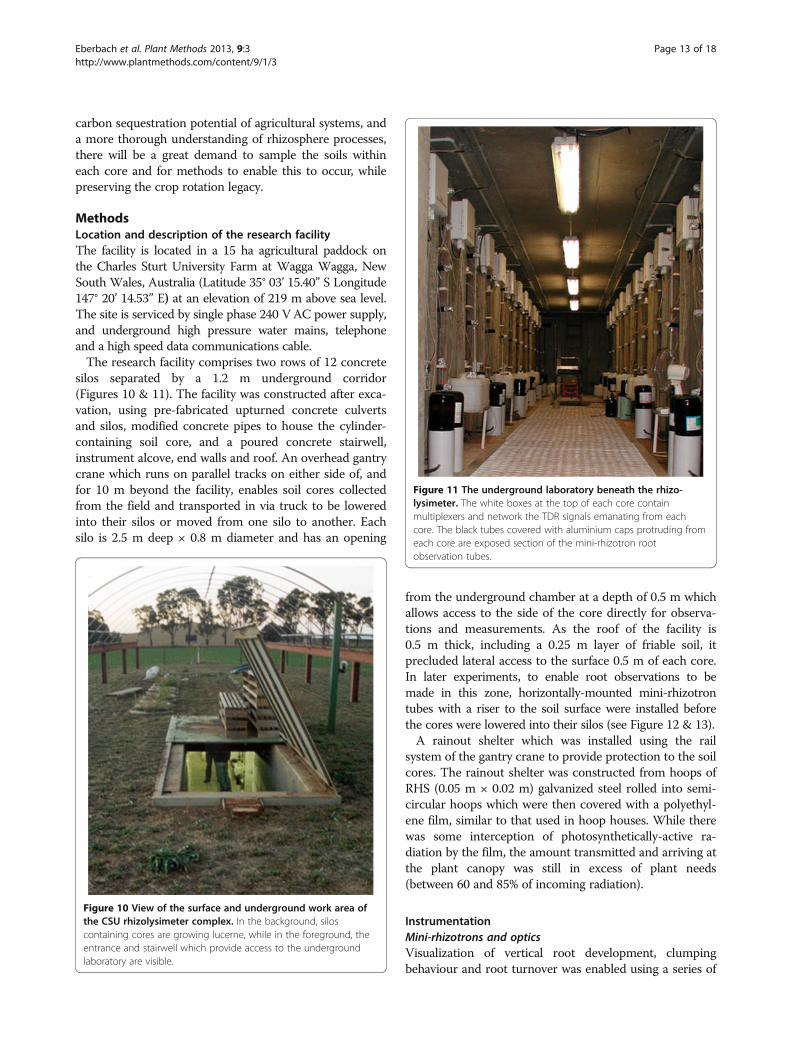
silos separated by a 1.2 m underground corridor(Figures 10 & 11). The facility was constructed after exca-vation, using pre-fabricated upturned concrete culvertsand silos, modified concrete pipes to house the cylinder-containing soil core, and a poured concrete stairwell,instrument alcove, end walls and roof. An overhead gantrycrane which runs on parallel tracks on either side of, andfor 10 m beyond the facility, enables soil cores collectedfrom the field and transported in via truck to be loweredinto their silos or moved from one silo to another. Eachsilo is 2.5 m deep × 0.8 m diameter and has an opening
from the underground chamber at a depth of 0.5 m whichallows access to the side of the core directly for observa-tions and measurements. As the roof of the facility is0.5 m thick, including a 0.25 m layer of friable soil, itprecluded lateral access to the surface 0.5 m of each core.In later experiments, to enable root observations to bemade in this zone, horizontally-mounted mini-rhizotrontubes with a riser to the soil surface were installed beforethe cores were lowered into their silos (see Figure 12 & 13).A rainout shelter which was installed using the rail
system of the gantry crane to provide protection to the soilcores. The rainout shelter was constructed from hoops ofRHS (0.05 m × 0.02 m) galvanized steel rolled into semi-circular hoops which were then covered with a polyethyl-ene film, similar to that used in hoop houses. While therewas some interception of photosynthetically-active ra-diation by the film, the amount transmitted and arriving atthe plant canopy was still in excess of plant needs(between 60 and 85% of incoming radiation).
InstrumentationMini-rhizotrons and opticsVisualization of vertical root development, clumpingbehaviour and root turnover was enabled using a series of
Figure 10 View of the surface and underground work area ofthe CSU rhizolysimeter complex. In the background, siloscontaining cores are growing lucerne, while in the foreground, theentrance and stairwell which provide access to the undergroundlaboratory are visible.
Figure 11 The underground laboratory beneath the rhizo-lysimeter. The white boxes at the top of each core containmultiplexers and network the TDR signals emanating from eachcore. The black tubes covered with aluminium caps protruding fromeach core are exposed section of the mini-rhizotron rootobservation tubes.
Eberbach et al. Plant Methods 2013, 9:3 Page 13 of 18http://www.plantmethods.com/content/9/1/3

hollow, horizontal, clear polycarbonate mini-rhizotrontubes (0.75 m (L) × 0.042 m (dia) id × 0.003 m (wall thick-ness)) which were installed into pre-cored holes. Prior toinsertion, two scribe lines were etched along the axis ofeach tube at positions of 10 and 2 o’clock (300° and 60°respectively), indented every cm, and dyed blue to allowfor colour contrast against a soil background. For researchundertaken during the period of 1999–2003, four mini-rhizotron tubes were installed per core at depths of 0.65,0.90, 1.45 and 2.0 m beneath the soil surface, and in subse-quent years, two additional mini-rhizotron tubes were in-stalled at depths of 0.2 and 0.4 m. These tubes wereinstalled at soil depths where horizontal access was notpossible due to the height of the roof, but access wasallowed by attaching a 900 angle PVC tube to their endand connecting vertical PVC risers which rose above thesoil surface (Figure 12).At all depths, the procedure of Box et al. [4] was
employed to install mini-rhizotrons. At each depth a pilothole was drilled using a rotary hammer drill, and this hole
was enlarged using a sampling tube fitted with a cuttingtip similar to that described by Box et al. [4], and designedso that soil displaced by the cutting tip was compressedtoward the centre of the sampling tube which minimizedthe compression of soil external to the tube. Following theremoval of the coring tube, the internal surface of the holewas gently abraded using a fine wire brush to remove anysmeared or soil reoriented by the sample tube and ensuredgood contact between the mini-rhizotron and the sur-rounding soil.Roots at depths of 0.2 and 0.4 m beneath the soil surface
were viewed using a 3 m flexible fiberscope (IF8C5-30;Olympus Australia Pty Ltd) with an optical adapter(AT60S/NF; Olympus Australia Pty Ltd) and a side-viewing window with a field of view of 60° was used. Atother depths, a 0.84 m (8 mm diameter) rigid borescope(R080-084-090-50; Olympus Australia Pty Ltd) with alateral view of 90° and a 50° field view was used. Roots incores were illuminated by attaching a Microlight 150 lightsource (Fibreoptics Lightguides, Australia) fitted with a
Minirhizotron tubes
Time domain reflectometry
probes
Drainage base
Soil surface
0.2m
0.4m
0.65m
0.9m
1.45m
2.0m
0.2m
0.2m
0.55m
0.75m
1.05m
1.35m
2.05m
Figure 12 Cross-section view of each soil core illustrating the placement of instrumentation. TDR probes were located at approximately0.2, 0.4, 0.55, 0.75, 1.05, 1.45, 2.0 m beneath the soil surface. Mini-rhizotron placements were at approximately 0.2, 0.4, 0.65, 0.9, 1.45 and 2.05 mbeneath the soil surface. The two mini-rhizotron tubes closest to the soil surface were installed in 2003 and were accessible by a vertical riserusing a flexible endoscope.
Eberbach et al. Plant Methods 2013, 9:3 Page 14 of 18http://www.plantmethods.com/content/9/1/3

150 watt halogen lamp to the scope. A digital camera(WAT-202D; Watec Co., LtD., Japan) was attached to therigid borescope and connected to a TV monitor(TFTV535BK Palsonic Australia) on which the root imageswere displayed. The camera was also connected to a laptopcomputer by way of a video capture card (VCE-PRP;ImperX Incorporated; Boca Raton, USA), and digital imagesor film clips could be captured and analysed at a later date.At all depths, mini-rhizotron tubes were visually
scanned for the number of roots intersecting the twoetched lines at a given time, based on a theory developedby Lang and Melhuish [21]; in later experiments withannual crop species, the time taken to reach particulardepths was also recorded.
Soil water determination: neutron moisture meterIn all cores, a single aluminium access tubes (1.8 m deep ×0.05 m diameter), positioned slightly off-centre to avoidinteraction with mini-rhizotron were installed into handaugured holes and grouted into place with a kaolin slurryusing the procedure of Greacen [36]. The neutron moisturemeter (503 DR Hydroprobe, CPN International) wascalibrated for each soil type by the installation of similaraccess tubes at an undisturbed site adjacent to where thecores were originally collected, at both the wet and dry endsof the range of soil water content [19]. The time for eachcount of the Neutron Moisture Meter was 16 seconds.
Soil water determination: time domain reflectometryIn 2003, seven 0.3 m three wire type TDR probes(0.0048 m diameter and 0.045 m spacing) (CS605,
Campbell Scientific Pty Ltd) were installed laterallyinto each core at depths of 0.2, 0.4, 0.55, 0.75, 1.05,1.35 and 2.0 m and connected to a centralized TDRnetwork (Figure 11). The TDR system included aTektronics 1502C Metallic Cable Tester (Tektronics,Inc) with an effective bandwidth of 1 GHz equippedwith a communications interface (SDM1502; Camp-bell Scientific Pty Ltd). The system was controlledwith a CR10X datalogger (Campbell Scientific PtyLtd) and a series of twenty-six integrated multiple-xers (SDMX50; Campbell Scientific Pty Ltd) whichprovided a network for measuring soil water contentin each core at each depth.TDR probes were inserted horizontally into 28 cm
pre-drilled, slightly undersized pilot holes, as Rothe et al.[37] found that pushing probes into undisturbed soilincreased the bulk density of soil immediately surround-ing the probe and resulted in a lower estimation of soilwater content. At the 20 and 40 cm depths, the TDRprobe heads were entirely buried in soil, (note detail inFigure 12) with only the cable protruding, while atgreater depths, probes were inserted into soil such thatthe wires on each probe were more than 0.03 m awayfrom the outer wall to avoid interference from the steelcylinder so that the probe head partially protruded out-side of the steel casing.The networked system had the capacity to analyse soil
water content in each core at each depth at a maximumrate of once every 48 minutes using the Topps calibra-tion equation [26], soil volumetric water content wasdetermined at each depth.
Effluentdrain
Silo
Backfilled soil layer
Bluemetal gravel layer
Underground instrument tunnel
Concrete roof
Drainagebase
0.55m
0.75m
1.05m
1.35m
2.05m
Soil core
Figure 13 Cross-section view of the rhizo-lysimeter tunnel illustrating the nature of the roof and soil above the roof and the fit of acore in a silo.
Eberbach et al. Plant Methods 2013, 9:3 Page 15 of 18http://www.plantmethods.com/content/9/1/3

Collection of undisturbed cores from the fieldSoil monoliths were collected from the field in rolled steelcylinders (2.4 m × 0.76 m dia) made from 6 mm mild,galvanized steel plate. The cutting end of each core wasreinforced by welding on an additional 6 mm mild steelrim cut at a 45° chamfer.At the time of collection, soil cores were collected
from the field intact. Soil cores were collected by using amild steel pressing plate 0.8 m in diameter and 0.05 mthick with a machine steel centre, on top of the core andusing the boom, the weight of the excavator was broughtto bear on the core. Once the core had been pushed ver-tically into the ground to a depth of about 1 – 1.5 m(Figure 14), the perimeter soil around the matrix ofcores was excavated to a depth of 2.5 m and the corehammered in to a depth of 2.35 m using a hydraulichammer attached to the boom of the excavator. Thecylinder and soil core were removed using the boom ofthe excavator and lifting chains, and once removed asand-filled drainage base welded to the core. The sand-filled steel drainage base contained a perforated plastictube which protruded from the side of the base andenabled drainage water to be collected.
Root growth of lucerne (1999–2003)This study was conducted using two soils; a red Kandasol[33], a medium clay, composed principally of illite andkaolin clay particles, and physically and chemically fertile;a grey Vertosol [33] a heavy smectite-dominated, sodicclay, known to physically and chemically impede theproduction of agriculturally-important pasture and cropspecies. Pre-inoculated lucerne (Medicago sativa) seed,either Pioneer L34 or Pioneer L90, were sown into hand-cultivated, pre-fertilized cores in 17 cm-spaced rows at arate equivalent to 4 kg ha–1 in May 1999. After establish-ment, plants were thinned to about 120 seedlings m–2 andover the ensuing study period, further self-thinningoccurred such that by year three, lucerne populations wereapproximately 45 plants m–2.Over the subsequent three years, root development
and turnover at depths of 0.65, 0.9, 1.45 or 2.05 m be-neath the soil surface were monitored, and the change insoil water content in the upper 1.8 m monitored using aneutron moisture meter. During the first season (sum-mer of 1999–2000), surface water was applied using adrip irrigation system to the lucerne-containing coreson two occasions: February 20 2000, where 120 mmof water was applied, and on April 4 2000, where 50 mmof water was applied. In subsequent years, lucernecores were watered during the winter and spring (May-October) by rainfall (379.6 mm and 248.2 mm during2000 and 2001 respectively). In contrast, during thesummer-autumn period of 2000–01 and 2001–02, coreswere surface watered using drip irrigation at the rate of25 mm of water per core per week. Additionally, duringthe period from February 2001 – May 2002, the deepsubsoils of all cores (2.4 m) were continuously wateredvia capillary rise from a permanent and unlimited supplyof water into the drainage bases.
Figure 14 Excavator hammering the steel core in to collect theundisturbed soil core.
Table 1 Change in volumetric soil water content (mm) insix red Kandasol monoliths as estimated for each soillayer using a 0.3 m unbalanced, mid-mounted TDR inresponse to a simulated rainfall event of 49.6 mm
Horizon depth (m) Core number
1 2 3 4 5 6 Mean
mm mm mm mm mm mm mm
0 – 0.3 15 11.5 10.2 11.7 16.2 11.1 12.6
0.3 – 0.5 5.6 6.2 5.6 5.4 4.4 5.6 5.5
0.5 – 0.75 6 8 7.8 6. 8.3 8.8 7.5
0.75 – 1.15 8.4 22 13.6 16.4 15.2 16.4 15.3
1.15 – 1.35 2.8 7.4 10 5.6 13 6.2 7.5
1.35 – 1.75 0.4 1.5 1.6 0.4 -1.6 0.4 -0.6
1.75 – 2.25 9 4.5 1 1 2 3 3.4
Total 47.2 58.1 46.7 46.5 57.5 51.5 51.3
Eberbach et al. Plant Methods 2013, 9:3 Page 16 of 18http://www.plantmethods.com/content/9/1/3

Root growth of annual crops following lucerne (2004–2006)Treatments selected in year one (2004) were either canola(Brassica napus cv Rivette) or wheat (Triticum aestivumcv Diamond Bird) following lucerne or in similar coreswith no prior history of lucerne. The wheat and canolacultivars selected tolerated a short growing season andwere, in the case of canola, resistant to blackleg. In yeartwo, cores which in the previous year had been sown tocanola were sown with wheat, or visa versa.For the duration of the experiment, each core received
an allocation of water per month equivalent to the long-term average rainfall calculated for the Wagga Waggaregion for that particular month. Monthly water applica-tions were split into two even allocations per core permonth and applied as during the lucerne phase via a dripirrigation system.Over the subsequent two years, root development at
depths of 0.2, 0.4, 0.65, 0.9, 1.45 or 2.05 m beneath thesoil surface were monitored using a flexible endoscope(0.2 and 0.4 m depths only) and a rigid borescope(0.65, 0.9, 1.45 and 2.05 m), on a weekly basis and thechange in soil water content in the upper 2 m monitoredusing TDR.
TDR and soil hydrologySix plant-free cores containing the red Kandasol were cali-brated on several occasions by adding 22.5 L of water toeach core, the equivalent of 49.6 mm of rainfall, using four2 L hr–1 drippers and by eliminating soil evaporation. Thechange in volumetric soil water content over the entiresoil monolith, the volumetric soil water content (Θv)24 hours prior to and after the addition of water was esti-mated at each depth, and from this, the change in Θv ateach depth calculated. In scaling up to the monolith, thechange in Θv at each probe was assumed to be representa-tive of the soil water content up to half way between thisand the next probe, and hence, an average change in Θv
for a particular depth horizon calculated. The average ofeach horizon was then summed and the difference in coreΘv prior to and 24 hours after watering calculated. Theresults of the calibration conducted over October andNovember 2008 for six cores are given in Table 1.
AbbreviationsTDR: Time domain reflectometry; SE/M: Standard error about the mean as aproportion of the mean; DAS: Days after sowing; Ka: Dielectric constant;RHS: Rolled hollow section; Θv: Soil volumetric water content;Et: Evapotranspiration.
Competing interestsThe authors declare they have no competing interests.
Authors’ contributionsPLE obtained the grant and built the facility and conceived with LJW theconcept of the manuscript and drafted the manuscript. PLE conceived theidea and received the grant, and JH ran the lucerne study for which he wasawarded a PhD. PLE conceived the idea and received the grant and SM ran
the canola and wheat study. All authors approved and commented on themanuscript. PLE and LAW revised the manuscript.
AcknowledgementsThe development and construction of such a facility required the input ofmany people with varied interests and skills. Principally, the authors wish toacknowledge contributions by Dr Wayne Meyer, HTL Engineering, JohnBiddle and Vince Baker and the Australian Research Council Mechanism B forfinancing this project. TDR advice was kindly provided by Dr Steve Zegelin(CSIRO, Canberra). The authors wish to thank Dr P Gregory for his usefulcomments on a related manuscript, and acknowledge the contributionmade by two anonymous reviewers. Additionally, the EducationInfrastructure Fund and Charles Sturt University are acknowledged forrecently providing AUD $35 M and $10 M respectively to construct a SciencePrecinct at the Wagga Wagga campus of Charles Sturt University. Of this,more than $3.0 M was used to add two further 36 silo wings to the existinglysimeter facility, which greatly enhances the capacity to address theresearch challenges discussed above.
Author details1EH Graham Centre for Agricultural Innovation, School of Agricultural andWine Sciences, Charles Sturt University, Boorooma St, Wagga Wagga, NSW2678, Australia. 2 , Ceranya, Lockhart, NSW 2656, Australia.
Received: 6 August 2012 Accepted: 29 January 2013Published: 31 January 2013
References1. Gregory P: Plant Roots: Growth, activity and interactions with soil. London:
Blackwell Publishing; 2006.2. Smit AL, Bengough AG, Engels C van Noordwijk M, Pellerin S, van de Geijn
S: Root methods. Berlin: Springer-Verlag; 2000.3. Smit AL, George E, Groenwold J: Root observations and measurements at
(transparent) interfaces with soil. In Root methods. Edited by Smit AL,Bengough AG, Engels C van Noordwijk M, Pellerin S, van de Geijn S. Berlin:Springer-Verlag; 2000:235–271.
4. Box JE, Smucker AJM, Ritchie JT: Mini-rhizotron installation techniques forinvestigating root responses to drought and oxygen stress. Soil Sci SocAm J 1989, 53:115–118.
5. Asseng S, Aylmore LAG, MacFall JS, Hopmans JW, Gregory PJ: Computerassisted tomography and magnetic resonance imaging. In Root methods.Edited by Smit AL, Bengough AG, Engels C van Noordwijk M, Pellerin S, vande Geijn S. Berlin: Springer-Verlag; 2000:343–363.
6. Horgan GW, Buckland ST, Mackie-Dawson LA: Estimating three-dimensional line process densities from tube counts. Biometr 1993,49:899–906.
7. Smit AL, Groenwold J, Vos J: The Wageningen Rhizolab – a facility tostudy soil-root-shoot-atmosphere interactions in crops. II Methods ofroot observations. Plant Soil 1994, 161:289–298.
8. Van de Geijn CS, Vos J, Groenwold J, Goudriaan J, Leffelaar PA: TheWageningen Rhizolab – a facility to study soil-root-shoot-atmosphereinteractions in crops. 1. A description of main functions. Plant Soil 1994,161:275–287.
9. Luo Y, Meyerhoff PA, Loomis RS: Seasonal patterns and verticaldistributions of fine roots of alfalfa (Medicago sativa L). Field Crop Res1995, 40:119–127.
10. Robinson D, Hodge A, Fitter A: Constraints on the Form and Function ofRoot Systems. In Root Ecology. Edited by de Kroon H, Visser EJW. Berlin:Springer-Verlag; 2003:1–31. Baldwin IT, Caldwell MM, Heldmaier G, LangeOL, Mooney HA, Schulze ED, Sommer U (Series Editors): Ecological Studies,Vol 168.
11. Watt M, Kirkegaard J, McCully ME: Fast wheat root growth overcomes soilconstraints. Farm Ahead 2003, 134:45–47.
12. Watt M, Silk WK, Passioura JB: Rates of root and organism growth, soilcondtions and temporal and spatial development of the rhizosphere.Ann Bot 2006, 97:839–855.
13. O’Toole JC, Bland WL: Genotypic variation in crop plant root systems. AdvAgro 1987, 41:91–145.
14. Thomas, Fukai S, Hammer GL: Growth and yield response of barley andchickpea to water stress under three environments in south east
Eberbach et al. Plant Methods 2013, 9:3 Page 17 of 18http://www.plantmethods.com/content/9/1/3

Queensland. II Root growth and soil water extraction patterns. Aust JAgric Res 1995, 46:35–48.
15. Dardanelli JL, Bachmeier OA, Sereno R, Gil R: Rooting depth and soil waterextraction patterns of different crops in a silty loam Haplustoll. Field CropRes 1997, 54:29–38.
16. Roth CH, Malicki MA, Plagge R: Empirical evaluation of the relationshipbetween soil dielectric constant and volumetric water content as thebasis for calibrating soil moisture measurements. J Soil Sci 1992, 43:1–13.
17. Bridge BJ, Sabburg J, Habash KO, Ball JAR, Hancock NH: The dielectricbehaviour of clay soils and its application to time domain reflectometry.Aust J Soil Res 1996, 34:825–835.
18. Merrill SD, Upchurch DR: Converting root numbers observed at mini-rhizotrons to equivalent root length density. Soil Sci Soc Am J 1994,58:1061–1067.
19. Hoffmann JD: The response of lucerne to a stratified soil water environmentand the implications for dryland salinity management in southern Australia,PhD Thesis. Charles Sturt University: School of Agricultural and WineSciences; 2006.
20. Upchurch DR: Conversion of minirhizotron-root intersections to rootlength density. In Minirhizotron observation tubes: Methods and applicationsfor measuring rhizosphere dynamics. Edited by Taylor HM. Number 50,Madison WI: American Society of Agronomy Spec. Publ; 1987:51–57.
21. Lang ARG, Melhuish FM: Lengths and diameters of plant roots in non-random populations by analysis of plane surfaces. Biometr 1970,26:421–431.
22. Merrill SD, Upchurch DR, Black AL, Bauer A: Theory of root directionalityobservations with minirhizotrons and its application to wheat and corn.Soil Sci Soc Am J 1994, 58:664–671.
23. Passioura JB: Environmental biology and crop improvement. Funct PlantBiol 2002, 29:537–546.
24. Crocker TL, Hendreck RL, Ruess RW, Pregitzer KS, Burton AJ, Allen MF, ShanJ, Morris LA: Substituting root numbers for length: improving the use ofminirhizotrons to study fine root dynamics. App Soil Ecol 2003,23:127–135.
25. Davis JL, Chudobiak WJ: In situ meter for measuring relative permittivityof soils. Geol Surv Can Part A 1975, 75:75–79.
26. Topp GC, Davies JL, Annan AP: Electromagnetic determination of soil-water content: measurements in coaxial transmission lines. Water ResourRes 1980, 16:574–582.
27. Baker JM, Allmaras RR: System for automating and multiplexing soilmoisture measurement by time-domain reflectometry. Soil Sci Soc Am J1990, 54:1–6.
28. Noborio K: Measurement of soil water content and electrical conductivityby time domain reflectometry: a review. Comput Electron Agric 2001,31:213–237.
29. Heimovaara TJ: Design of triple wire time-domain reflectometry probe inpractice and theory. Soil Sci Soc Am J 1993, 57:1410–1417.
30. Logsdon S: Time domain reflectometry range of accuracy for highsurface area soils. Vadose Zone J 1995, 4:1011–1019.
31. Shaun FK, Kelly F, Selker JS, Green JL: Using short soil moisture probeswith high bandwidth time-domain reflectometry instruments. Soil Sci SocAm J 1995, 59:97–102.
32. Mojid MA, Wyseure GCL, Rose DA: The use of insulated time-domainreflectometry sensors to measure water content in highly saline soils.Irrig Sci 1998, 18:55–61.
33. Isbell R: An Australian Soil Classification. Melbourne: Inkata Press; 1996.34. Schneider AD, Howell TA: Large, monolithic weighing lysimeters. In
Lysimeters for evapotranspiration and environmental measurements,Proceedings of the International Symposium on Lysimetry. Edited by Allen RG,Howell TA, Pruitt WO, Walter IA, Jensen ME. Honolulu: American Society ofCivil Engineers; 1991.
35. Passioura JB: The perils of pot experiments. Funct Plant Biol 2006,33:1075–1079.
36. Greacen EL: Soil water assessment by the neutron method. East Melbourne:CSIRO Publishing; 1981.
37. Rothe A, Weis W, Kreutzer K, Matthies D, Hess U, Ansorge B: Changes in soilstructure caused by the installation of time domain reflectometry probesand their influence on the measurement of soil water. Water Resourc. Res1997, 33:1585–1593.
doi:10.1186/1746-4811-9-3Cite this article as: Eberbach et al.: Rhizo-lysimetry: facilities for thesimultaneous study of root behaviour and resource use by agriculturalcrop and pasture systems. Plant Methods 2013 9:3.
Submit your next manuscript to BioMed Centraland take full advantage of:
• Convenient online submission
• Thorough peer review
• No space constraints or color figure charges
• Immediate publication on acceptance
• Inclusion in PubMed, CAS, Scopus and Google Scholar
• Research which is freely available for redistribution
Submit your manuscript at www.biomedcentral.com/submit
Eberbach et al. Plant Methods 2013, 9:3 Page 18 of 18http://www.plantmethods.com/content/9/1/3
Related Documents