RHEUMATOLOGIST SURVEY OVERVIEW Final Report Prepared for: The American College of Rheumatology Prepared by: The Lewin Group Paul F. Hogan Ellen Bouchery June 2006

Welcome message from author
This document is posted to help you gain knowledge. Please leave a comment to let me know what you think about it! Share it to your friends and learn new things together.
Transcript

RHEUMATOLOGIST SURVEY OVERVIEW
Final Report Prepared for: The American College of Rheumatology Prepared by: The Lewin Group Paul F. Hogan Ellen Bouchery June 2006

RHEUMATOLOGIST SURVEY OVERVIEW
Final Report
Prepared for: The American College of Rheumatology
Prepared by:
The Lewin Group Paul F. Hogan Ellen Bouchery
June 2006

Table of Contents
1. BACKGROUND AND METHODS .................................................................................................................1
1.1 PURPOSE ..........................................................................................................................................................1 1.2 SURVEY UNIVERSE ..........................................................................................................................................1 1.3 SAMPLING METHODS .......................................................................................................................................3 1.4 RESPONSE RATES.............................................................................................................................................3
2. SURVEY RESULTS ..........................................................................................................................................6 2.1 WORK FORCE DEMOGRAPHICS ........................................................................................................................6 2.2 PRACTICE CHARACTERISTICS...........................................................................................................................7 2.3 WORK EFFORT AND PRODUCTIVITY...............................................................................................................13
2.3.1 Distribution of Hours by Activity .........................................................................................................13 2.3.2 Hours Worked......................................................................................................................................15 2.3.3 Retirement Plans..................................................................................................................................19
2.4 JOB SATISFACTION.........................................................................................................................................21 2.5 MEASURES OF EXCESS DEMAND....................................................................................................................24 2.6 INCOME..........................................................................................................................................................27
3. DISCUSSION ...................................................................................................................................................34
APPENDIX A: RHEUMATOLOGIST SURVEY............................................................................................... A-1
APPENDIX B: ACADEMIC JOB ATTRIBUTES AND GRANT FUNDING...................................................B-1

1. BACKGROUND AND METHODS
1.1 Purpose The American College of Rheumatology (ACR) asked The Lewin Group to conduct a workforce study of rheumatologists. The purpose of the workforce study is to better understand the factors affecting the supply of and demand for rheumatologists, to quantify the factors where possible, to project likely paths for the evolution of the workforce, and to assess the implications. As part of this study, The Lewin Group with support of Baselice and Associates conducted a survey of practicing rheumatologists between November 2005 and February 2006. The purpose of the survey was to provide more detailed information on the rheumatology community in support of the workforce study, because limited information was available in public databases. The survey included the following topics: education and professional qualifications, work effort and productivity, conditions treated, distribution of time across work activities, employment setting characteristics, measures of excess demand, job satisfaction, retirement plans, sources (e.g., grant support, clinical trials, office-based technologies) and level of income. A major source of information for this study was our Advisory Group formed by the chairman of the Committee on Training and Workforce Issues, Dr. Walter Barr, and chaired by Dr. Chad Deal. The Advisory Group was a source of institutional and clinical information relevant to the rheumatology physician workforce, as well as guidance for the study itself.1
1.2 Survey Universe The first task in developing the survey was to define the survey universe. The Advisory Group to our study was instrumental in helping us develop this definition. We developed our baseline count of rheumatologist from the American Medical Association (AMA) master file. In this file, we defined rheumatologists for the purposes of the workforce study as any MD or DO who meets the following criteria as self-reported to the AMA:
1) Must not claim “Resident” as their current major professional activity. Only physicians who have completed their training and have entered the workforce should be considered.
2) Must report that they are “active” physicians, be less than 75 years of age, and working in the U.S. or Puerto Rico. We only want to consider those physicians who are actively practicing in the U.S. or Puerto Rico.
3) Must have completed graduate medical training (GMT) in rheumatology or pediatric rheumatology or be board-certified in rheumatology or pediatric rheumatology.
1 The members of the Advisory Group were Walter Barr, Neal Birnbaum, Dennis Boulware, Paul Caldron, Timothy
Harrington, Marc Hochberg, Roderick Hooker, Julianne Orlowski, Stephen Paget, Christy Park, Audrey Uknis, and Patience White.

The implications of our criteria are shown in Table 1-1. Some physicians are board-certified and/or fellowship trained in both rheumatology and pediatric rheumatology. These physicians are listed in a separate column in Table 1-1. Note also that the total in the rows are not mutually exclusive. For example, the number “Board Certified” will also include fellowship trained.
Table 1-1 Baseline Count of Practicing Rheumatologists from AMA, 2005
Training
Adult Rheumatology
Pediatric Rheumatology
Adult and Pediatric
Rheumatology
Board Certified 4,049 138
45
Fellowship Trained 3,856 59
46
Total (Board Certified and/or Fellowship Trained) 4,857 171
46 We supplemented the data from the AMA masterfile with data from the ACR membership list for pediatric and academic rheumatologists. These groups were selected for comparison because statistics from ACR suggested they might be under-represented in the AMA master list. When the pediatric rheumatologists in the AMA masterfile and ACR membership list were compared, we found that 147 pediatric rheumatologists were included in both files, 70 were only in the AMA file, and 39 were only in the ACR file. Therefore, our total count of pediatric rheumatologists was raised to 256. This includes some physicians who were board certified and/or fellowship trained in adult rheumatology as well as pediatric rheumatology. Names and addresses for all pediatric rheumatologists were available from the AMA masterfile, however, names and addresses from the AMA masterfile were only available for the random sample of academic physicians who would be surveyed. Random sampling suggested 14.8 percent of adult rheumatologists (excluding those with adult and pediatric training or certification) or 717 were in an academic setting based on the AMA master file. However, the ACR membership list included 768 adult rheumatologists in an academic setting. Therefore, we increased our count for the universe of adult rheumatologists by 51 to account for adult rheumatologists in an academic setting who were not included in the AMA masterfile. The AMA master file counts with these adjustments yielded the estimated counts for the universe of adult and pediatric rheumatologists listed in Table 1-2.
The Lewin Group, Inc. 2

Table 1-2 Universe of Practicing Rheumatologists, 2005
(AMA File Supplemented with ACR Membership List)
Training Adult Rheumatology Pediatric Rheumatology
Total 4,908 256
1.3 Sampling Methods Rheumatologists were randomly selected within strata for participation in the survey. The mutually exclusive strata are listed in Table 1-3 with the size of the associated universe and sample. Strata were selected to include subcategories of rheumatologists who were of particular interest to assure that sample sizes for these groups would be sufficient to estimate statistics for the particular group with an acceptable level of precision.
Table 1-3 Survey Sampling Strata
Strata Definition Size of Universe Sample Size Pediatric Board-certified or fellowship
trained in pediatric rheumatology. 256 256
Academic Not included in above strata and works in an academic setting based on the ACR membership file.
768 233
Rural Not included in the above strata and office address is in area with population less than 50,000.
214 169
Less than 40 Years of Age
Not included in the above strata and under 40 years of age as of January 1, 2005.
538 184
Other All other rheumatologists not in any of the above strata.
3,388 893
1.4 Response Rates The overall response rate to the survey was 37 percent. Table 1-4 displays response rates by sample strata. Response rates were similar across most strata with the exception of the less than 40 year old group which had a lower response rate. Although the response rate for the less than 40 year old strata was only 29%, there were 106 individuals less than 40 in the sample including individuals who were less than 40 in the pediatric, academic, and rural strata.
The Lewin Group, Inc. 3

Table 1-4 Response Rates by Sampling Strata
Strata Sample Size Number of
Respondents Response
Rate Pediatric 256 100 39.1% Academic 233 92 39.5% Rural 169 66 39.1% Less than 40 Years of Age 184 53 28.8% Other 893 316 35.4% Figures 1-1 and 1-2 display response rates by demographic group and region. The response rate for the less than 40 year old group is the lowest at 30%. The response rate for individuals less than 40 is slightly higher than for the less than 40 year old strata because individuals in the pediatric, academic, and rural strata may be less than 40 and have responded at a slightly higher rate than individuals in the less than 40 year old strata.
Figure 1-1 Response Rates by Demographic Group
30%
38% 39%42%
39%
34%37% 38% 37% 37%
0%
5%
10%
15%
20%
25%
30%
35%
40%
45%
<40
40-49
50-59
60+
Male
Female
Urba
n
Rural
Pedia
tric
Adult
Response rates were fairly similar by region. The West North Central, East South Central, Mountain, and New England regions had the best response. Puerto Rico, East North Central and the Pacific regions had the lowest response rates.
The Lewin Group, Inc. 4

Figure 1-2 Response Rates by Region
33%
44%37%
43% 42%
34% 36%
46%
37%33%
0%5%
10%15%20%25%30%35%40%45%50%
East N
orth
Centra
l
East S
outh
Centra
l
Middle
Atlanti
c
Mounta
in
New E
nglan
d
Pacific
South
Atlanti
c
Wes
t Nor
th Cen
tral
Wes
t Sou
th Cen
tral
PR
The Lewin Group, Inc. 5

2. SURVEY RESULTS In this section, we present the results of the survey. The results are divided into seven sections:
• workforce demographics; • practice characteristics; • work effort and productivity; • retirement plans; • job satisfaction; • measures of excess demand; and • income.
Each topic is discussed in turn below.
2.1 Work Force Demographics Information on the age and sex distributions of the rheumatology workforce are available by analysis of the AMA masterfile or the ACR membership list, however, information on the race/ethnicity and family status of the rheumatology workforce is not available from these sources. The AMA masterfile includes information on race and ethnicity, however, this variable is not filled for 34% of physicians in the AMA masterfile. Figure 2-1 compares the race and ethnicity of the rheumatology community to that of physicians overall in the AMA masterfile. The race and ethnicity of the rheumatology community is very similar to that of physicians overall. Seventy-nine percent of rheumatologists self-designated that they are white and 12% that they are Asian. Only 1% and 4% indicated that they are Black or Hispanic, respectively.
Figure 2-1 Distribution of Rheumatologists by Race and Ethnicity
0%
10%
20%
30%
40%
50%
60%
70%
80%
90%
Asian Black Hispanic NativeAmerican
Other White
RheumatologistsPhysicians Overall
The Lewin Group, Inc. 6

In terms of family status, 89% of rheumatologists are married and 16% and 44% have children under the age of six or between 6 and 18, respectively. Women were more likely than men to have children and men were more likely to be married. These differences are probably related to the age distribution of male and female rheumatologists. Since female rheumatologists are on average younger than their male counterparts, they are more likely to be single or have a young family.
Figure 2-2 Distribution of Rheumatologists by Family Status
0%
10%
20%
30%
40%
50%
60%
70%
80%
90%
100%
Married Has Kids <6 Has Kids 6-18
Female
Male
Total
2.2 Practice Characteristics In this section, we describe the practice characteristics of rheumatologists. Most rheumatologists (94%) treat patients for some portion of their time. Figure 2-3 indicates that rheumatologists who are board-certified and/or fellowship trained in both pediatric and adult rheumatology are more likely to treat patients while those board-certified and/or fellowship trained in only pediatric rheumatology are slightly more likely not to treat patients.
Figure 2-3 Percent Who Treat Patients
94%
99%
91%
86%
88%
90%
92%
94%
96%
98%
100%
Adult Both Ped
The Lewin Group, Inc. 7

Figure 2-4 displays the primary practice setting of rheumatologists by whether or not they treat patients for some of their time. Those rheumatologists that we label ‘non-clinical’ do not treat any patients. Fifty-two percent of non-clinical rheumatologists work in industry, 14% work for a hospital and 5% work in government. Among rheumatologists who treat patients 16% indicated their primary practice setting was a medical school, 32% indicated a solo or partnership practice, and 43% indicated a group practice.
Figure 2-4 Primary Practice Setting for Clinical and Non-Clinical Rheumatologists
0.0%
10.0%
20.0%
30.0%
40.0%
50.0%
60.0%
Staff M
odel
HMO
Indu
stry
Governm
ent
Hosp
ital
Partn
ersh
ip Practice
Sing
le Sp
ecial
ty
Figure 2-5 displays the percentage of rheumatologists who are self-employed by age and sex. Forty-eight percent of rheumatologists are self-employed. On average males are more likely to be self-employed than females.
Figure 2-5
Percent Self-Employed by Age and Sex
36%
47%54% 50%
64%
53%46% 50%
0%
10%
20%
30%
40%
50%
60%
70%
Female
, <40
Female
, 40-
49
Female
, 50-
59
Female
, 60+
Male, <
40
Male, 4
0-49
Male, 5
0-59
Male, 6
0+
Group
Med
ical S
choo
l
Solo
Prac
tice
Mult
i-Spe
cialty
Group
Clinical
Non-Clinical
The Lewin Group, Inc. 8

Figure 2-6 displays the share of rheumatologists who are in practices with fiscal control of the listed technologies. Although the treatment of rheumatoid arthritis patients with infusion only began in 1999, 74% of rheumatologists are in practices with an infusion unit and an additional 8% are in practices that plan to acquire this technology within the next five years. Densitometry, X-ray and laboratories are also commonly found in rheumatology practices with 64%, 55% and 61% of rheumatologists in practices with these technologies.
Figure 2-6
Percent of Rheumatologists Whose Practices Have the Listed Technology
0.0%10.0%20.0%30.0%40.0%50.0%60.0%70.0%80.0%
Infusio
n Un
it
Ultra
soun
d
Dens
itometry
MRI
of H
and/Fe
et
X-Ra
y
Labo
ratory
CurrentlyAvailable
Expect toAcquirewithin 5Years
Just as they have been quick to adopt new technology, rheumatologists, have responded to research indicating the benefits of early treatment for rheumatoid arthritis patients. The next figure shows that 21% of rheumatologists are in practices that have established early arthritis care centers.
Figure 2-7 Percent of Rheumatologists in a Practice
with an Early Arthritis Care Center
79%
21%
YesNo
The Lewin Group, Inc. 9

The next several figures look at the age distribution of patients treated by rheumatologists with different types of training or certification. The purpose of these figures is to provide information on the population served by rheumatologists with different training and/or certification. In these figures, we divide rheumatologists into three groups based on their training and/or certification. The first group includes those rheumatologists with training and/or certification in pediatric rheumatology, the second group includes those with training and/or certification in adult rheumatology and the final group is those with training and/or certification in both pediatric and adult rheumatology. Figure 2-8 indicates that 97% of the patients served by adult rheumatologists are 18 or older and 94% of the patients served by pediatric rheumatologists are less than 18 years of age. These data suggest that adult and pediatric rheumatologists serve separate populations. Rheumatologists with training and/or certification in both pediatric and adult rheumatology serve primarily adults with 86 percent of their patients 18 or older. Individuals 65 or older make-up a large share of the patients for adult rheumatologists, 41%, however, patients 18 to 64 years of age make up a larger share 57%.
Figure 2-8 Age Distribution of Patients by Rheumatology Training
0%10%20%30%40%50%60%70%80%90%
100%
Adult Both Ped
<1818-6465+
The next two figures address the age range rheumatologists are willing to treat based on their training and/or certification. Rheumatologists with training and/or certification in pediatric rheumatology were asked the age of the oldest patient they were willing to treat. The results are displayed in Figure 2-9. Ninety-two percent of those without adult training and/or certification reported a maximum age between 16 and 21.
The Lewin Group, Inc. 10

Figure 2-9 Oldest Age of Patient
Pediatric Rheumatologist are Willing to Treat
1.3% 0.0%
14.1%
44.9%
33.3%
3.8% 2.6%
0.0%
10.0%
20.0%
30.0%
40.0%
50.0%
Any Age 5-15 16-17 18 19-21 22-25 26-60
The survey asked all rheumatologists with pediatric training or certification to report the age of the oldest patient they would be willing to treat, however, the question was not clear to rheumatologists with adult and pediatric training or certification. Twenty-three percent of these rheumatologists did not respond to the question and another 23 percent responded only to the adult portion of the question reporting only the age of the youngest patient they are willing to treat. Thirty-one percent reported as pediatric rheumatologists indicating an age 21 or less as the oldest age they would be willing to treat, however, their responses to the questions on the age distribution of their patients indicates they treat primarily adults. Thus, their response likely indicates the maximum age they would treat with only pediatric training. Eighteen percent of the respondents reported that the oldest patient they would treat was 99 or older and the age distribution for these rheumatologists indicates that they treat both individuals less than 18 and older than 65. The remainder of those with both adult and pediatric training and/or certification, 5%, reported as pediatric rheumatologists and the age distribution of their patients indicates that they primarily treat pediatric patients. Figure 2-10 indicates the youngest age of patients adult rheumatologists are willing to treat. Twenty-seven percent of adult rheumatologists are willing to treat children under 12. Thus, it appears some adult rheumatologists would be willing to treat children. Since, there are a small number of pediatric rheumatologists, access to rheumatology care for children in rural or small urban areas may be limited and it appears adult rheumatologists might provide some care for children in these cases.
The Lewin Group, Inc. 11
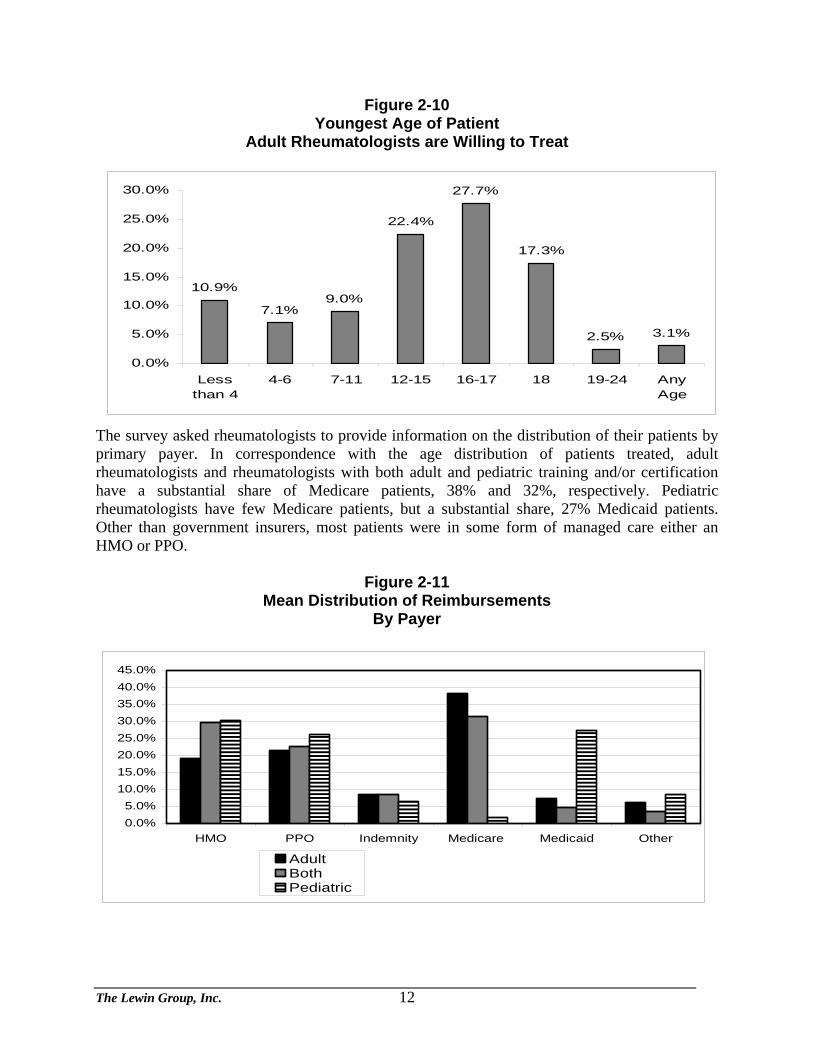
Figure 2-10 Youngest Age of Patient
Adult Rheumatologists are Willing to Treat
10.9%
7.1%9.0%
22.4%
27.7%
17.3%
2.5% 3.1%
0.0%
5.0%
10.0%
15.0%
20.0%
25.0%
30.0%
Lessthan 4
4-6 7-11 12-15 16-17 18 19-24 AnyAge
The survey asked rheumatologists to provide information on the distribution of their patients by primary payer. In correspondence with the age distribution of patients treated, adult rheumatologists and rheumatologists with both adult and pediatric training and/or certification have a substantial share of Medicare patients, 38% and 32%, respectively. Pediatric rheumatologists have few Medicare patients, but a substantial share, 27% Medicaid patients. Other than government insurers, most patients were in some form of managed care either an HMO or PPO.
Figure 2-11
Mean Distribution of Reimbursements By Payer
0.0%5.0%
10.0%15.0%20.0%25.0%30.0%35.0%40.0%45.0%
HMO PPO Indemnity Medicare Medicaid Other
AdultBothPediatric
The Lewin Group, Inc. 12

The last practice characteristic addressed by the survey was whether practices included nurse practitioners and physician’s assistants. Figure 2-12 indicates that 25% of rheumatologists are in a practice with nurse practitioners or physicians assistants. Nurse practitioners were twice as common as physician’s assistants.
Figure 2-12
Percent of Rheumatologists in a Practice With a Nurse Practitioner or Physician’s Assistant
15.5%
7.2%
2.8%
0.0%
2.0%
4.0%
6.0%
8.0%
10.0%
12.0%
14.0%
16.0%
18.0%
Nurse Practitioner Physician's Asst Both
2.3 Work Effort and Productivity In this section, we discuss information gathered from the survey on hours of work by activity and total number of hours worked and patient visits.
2.3.1 Distribution of Hours by Activity Figure 2-13 displays the distribution of rheumatologist clinical hours by the type of care provided. Over 90% of clinical time for all types of rheumatologists is spent on providing specialty rheumatology care. Rheumatologists spend very little time providing primary care services or other types of specialty care indicating that there is strong demand for specialty rheumatology care.
The Lewin Group, Inc. 13

Figure 2-13 Mean Distribution of Clinical Hours
By Type of Care
0.0%10.0%20.0%30.0%40.0%50.0%60.0%70.0%80.0%90.0%
100.0%
AdultRheum
Ped Rheum Gen InternalMed
Gen Ped Other
AdultBothPediatric
The next figure displays the distribution of hours worked for clinical rheumatologists by whether or not they practice in an academic setting. Rheumatologists who are not in an academic setting spend substantially more time in patient care 87% versus 57% for academic rheumatologists. Academic rheumatologists spend more time on non-patient care related administration, medical teaching, and research.
Figure 2-14 Mean Distribution of Hours
By Activity for Clinical Rheumatologists
0%10%20%30%40%50%60%70%80%90%
Clin. C
are -
Offic
e
Clin. C
are -
Hos
p.
Admin
- Pat.
Care
Admin
- Othe
r
Medica
l Tea
ching
Basic
/Ben
ch R
esea
rch
Clinica
l Res
earch
Drug T
rials
Tran
s. Res
earch
Prac
t. Impr
ovem
ent
Academic
Non-Academic
The Lewin Group, Inc. 14

The next figure displays the distribution of hours worked for non-clinical rheumatologists by whether or not they work in an academic setting. Rheumatologists who are not in an academic setting primarily spend their time on drug trials and in administration. Those in an academic setting are engaged primarily in research and administration.
Figure 2-15 Mean Distribution of Hours
By Activity for Non-Clinical Rheumatologists
0%
10%
20%
30%
40%
50%
60%
Admin
- Pat. C
are
Admin
- Other
Med
ical T
each
ing
Basic
/Ben
ch R
esea
rch
Clini
cal R
esea
rch
Drug
Tria
ls
Tran
s. Re
search
Prac
t. Im
prov
emen
t
Academic
Non-Academic
2.3.2 Total Hours Worked and Total Visits The next figure shows the distribution of hours worked per year by age group. The figure indicates that those under 40 are more likely to work fewer hours than those in older age groups and those 50-59 tend to have the highest levels of work hours.
Figure 2-16
Mean Distribution of Hours Worked per Year By Age Group
0.0%
5.0%
10.0%
15.0%
20.0%
25.0%
30.0%
35.0%
40.0%
LessThan960
961-1439
1440-1919
1920-2399
2400-2879
2880-3359
3360 orMore
<4040-4950-5960+
The Lewin Group, Inc. 15

The next figure shows hours of work per year for males and females. The figure indicates that women are generally working fewer hours per year than men. Assuming an average of 4 weeks of vacation per year, 28% of women work less than 40 hours per week compared with 17% of men. Meanwhile, 61% of men work more than 50 hours per week while only 43% of women work more than 50 hours per week.
Figure 2-17
Mean Distribution of Hours Worked per Year By Sex
0.0%
5.0%
10.0%
15.0%
20.0%
25.0%
30.0%
35.0%
40.0%
LessThan960
961-1439
1440-1919
1920-2399
2400-2879
2880-3359
3360 orMore
FemaleMale
The survey asked rheumatologists to compare their current work effort to their work effort five years ago and their expected level of work effort five years in the future. The next figure shows the results by age group. The figure shows male rheumatologists on average working fewer hours per week now than five years ago and anticipating to work fewer hours five years in the future. Women between 40 and 59 indicated they are on average working more hours now than 5 years ago while those under 40 and 60 or older are working fewer. Similar to the men all the age groups for women indicate that they expect to work fewer hours in five years. It is significant that all the groups indicated they plan to work fewer hours in the future. This suggests that the supply of rheumatology services per rheumatologist will decrease in the future as rheumatologist work fewer hours on average.
The Lewin Group, Inc. 16

Figure 2-18 Mean Distribution of Past, Present and Future Hours Worked
By Age and Sex
0
10
20
30
40
50
60
Female
, <40
Female
, 40-49
Female
, 50-59
Female
, 60+
Male, <
40
Male, 4
0-49
Male, 5
0-59
Male, 6
0+
FiveYearsAgo
Now
5 YearsFromNow
The next figure shows the reported number of visits produced per year by age and sex group. Similar to the reports of hours worked, the reports of visits indicate that female rheumatologists produce fewer visits per year than male rheumatologists. The data also suggest that men 60 and older reduce their work effort.
Figure 2-19 Mean Number of Patient Visits per Year
By Age and Sex
0500
1,0001,5002,0002,5003,0003,5004,0004,500
Female
<40
Female
40-49
Female
50 or
Olde
r
Male <4
0
Male 40
-49
Male 50
-59
Male 60
or O
lder
The Lewin Group, Inc. 17

We used the survey responses to develop a multivariate model for hours worked per year. This type of model can isolate the impact of a given factor on hours worked holding other factors constant. The model predicts hours worked per year for a rheumatologist given their characteristics including: primary employment setting, family status, age and sex, and region of the country. The results indicate that when you control for family status and other factors, hours worked are similar across age groups with the exception of those over 60 who work significantly less than other age groups. Family status has very important impacts on hours worked. In particular, married women (83% of female rheumatologists) work 440 fewer hours per week and women with children under six (26% of female rheumatologists) work about 600 fewer hours per year than single women. Married men work about 330 more hours per year than single men, but reduce their hours by about 100 when they have children under 18. The model indicates that primary employment setting also has an important impact on hours worked. Those working in medical schools, industry, and hospitals tend to work more hours than those in private practices.
Table 2-1 Multivariate Model of Hours Worked per Year
Independent Variable Change in Annual Hours Worked Board Cert or Fellowship Trained in Pediatrics 133.4 Non-US Medical School Graduate -208.9* Primary Employment Setting (Relative to Group Practice) Employ effects are relative to this group. Solo Practice -27.9 Partnership Practice -192.3* Government 12.3 Medical School 301.2* Industry 534.5* Hospital 269.5* Age Category (Relative to 40-49) < 40 Years Old -53.7 50-59 Years Old 4.9 Over 60 Years Old -261.9* Family Characteristics (Relative to Single Female) Family effects are relative to this group. Male -220.9 Married Male 109.8 Male with Children Less Than 6 -103.5 Male with Children 6-18 -124.0* Married Female -439.0* Female with Children Less Than 6 -173.6 Female with Children 6-18 -70.4 * Significantly different from zero at 90% confidence level.
The Lewin Group, Inc. 18

2.4 Retirement Plans This section discusses survey results related to retirement plans. The first two figures display results related to reductions in work effort planned prior to retirement. The second two figures indicate age of retirement. Figure 2-20 displays the distribution of rheumatologist by age group by the age at which they plan to reduce their work effort in anticipation of retirement. These reports suggest that younger rheumatologists plan to reduce their work effort earlier than their older counterparts. However, it should be noted that particularly for the over 60 age group the results are biased, because these results only include physicians who are currently working, so physicians who are currently over 60 and who are already retired are not included in the results.
Figure 2-20 Age Rheumatologists Plan to Reduce Work Effort Prior to Retirement
By Age Group
0.0%
10.0%
20.0%
30.0%
40.0%
50.0%
60.0%
Less Than55
55-59 60-64 65-69 70 or Older
<4040-4950-5960+
The next figure presents the same results for men and women. The figure suggests that on average women plan to reduce their work effort at a younger age than men.
The Lewin Group, Inc. 19

Figure 2-21 Age Rheumatologists Plan to Reduce Work Effort Prior to Retirement
By Sex
0.0%
5.0%
10.0%
15.0%
20.0%
25.0%
30.0%
35.0%
40.0%
Less Than55
55-59 60-64 65-69 70 or Older
FemaleMale
Figure 2-22 displays anticipated retirement age by age group. Again, it appears those under 40 plan to retire earlier than their counterparts in the older age groups. However, it should be noted that particularly for the over 60 age group the results are biased, because these results only include physicians who are currently working, so physicians who are currently over 60 and who are already retired are not included in the results.
Figure 2-22 Age Rheumatologists Plan to Retirement
By Age Group
0
10
20
30
40
50
60
LessThan 60
60-64 65-69 70-74 75-79 80 orOlder
<4040-4950-5960+
The Lewin Group, Inc. 20

The next figure displays planned age of retirement for males and females. The figure indicates that women plan to retire earlier than their male counterparts.
Figure 2-23 Age Rheumatologists Plan to Retirement
By Sex
0.0%5.0%
10.0%15.0%20.0%25.0%30.0%35.0%40.0%45.0%50.0%
LessThan 60
60-64 65-69 70-74 75-79 80 orOlder
FemaleMale
2.5 Job Satisfaction The survey asked rheumatologists how satisfied they were with their current practice of rheumatology. Figure 2-24 displays these results by age group.
Figure 2-24
Satisfaction with Your Current Practice of Rheumatology By Age Group
0.0%
5.0%
10.0%
15.0%
20.0%
25.0%
30.0%
35.0%
40.0%
45.0%
<4040-4950-5960+
Extremely
Dissatisfied Extremely Satisfied
The Lewin Group, Inc. 21

Over three-quarters of rheumatologists in each age group reported that they were satisfied with their rheumatology practice. Only 6-10% depending on the age group reported some level of dissatisfaction. The next figure displays these results for men and women. This figure indicates that men are somewhat more satisfied than women. Women were more likely to report a neutral response between dissatisfaction and satisfaction (21% versus 11%), while men were more likely to report satisfaction (82% versus 70%).
Figure 2-25 Satisfaction with Your Current Practice of Rheumatology
By Sex
0.0%
5.0%
10.0%
15.0%
20.0%
25.0%
30.0%
35.0%
40.0%
FemaleMale
Extremely Dissatisfied
Extremely Satisfied
The next question related to job satisfaction asked rheumatologists if they would like their workload to change. Half indicated that they would like their workload to stay the same. Forty-six percent indicated they wanted their workload to decrease.
The Lewin Group, Inc. 22

Figure 2-26 How Would You Like Your Workload to Change
0.0%
10.0%
20.0%
30.0%
40.0%
50.0%
60.0%
70.0%
DecreaseMore Than
20%
Decrease1-20%
StaySame
Increase1-20%
IncreaseMore Than
20%
Total
Pat. Care
Pat. CareAdmin.
Non-Pat.Care Admin
Next, the survey asked about satisfaction with particular job attributes. About three-quarters indicated satisfaction with location, job security, and colleagues/partners as displayed in Figure 2-27.
Figure 2-27 How Satisfied Are You with Listed Job Attributes
0.0%
5.0%
10.0%
15.0%
20.0%
25.0%
30.0%
35.0%
Location
JobSecurity
Colleagues/Partners
Extremely Dissatisfied
Extremely Satisfied
Respondents were less satisfied with career opportunities, income and reimbursement rates with only 71%, 55%, and 20% reporting satisfaction and 13%, 24%, and 55% expressing dissatisfaction as shown in the next figure.
The Lewin Group, Inc. 23

Figure 2-28
How Satisfied Are You with Listed Job Attributes
0.0%
5.0%
10.0%
15.0%
20.0%
25.0%
30.0%
35.0%
CareerOpp.
Income
Reimb.Rates
Extremely Dissatisfied
Extremely Satisfied
Overall, while rheumatologists are generally satisfied with their practices many would like to see shorter hours, more career opportunity, higher reimbursement rates, and higher income.
2.6 Measures of Excess Demand Growth in the earnings of rheumatologists between 1998 and 2002 at rates which exceed inflation is one indication of strong demand for rheumatologists, in this section we present several other indicators of demand for rheumatologists that were derived from the survey of rheumatologists. First, survey respondents were asked if their practices were accepting new patients or if they limited patients to those who received a referral from a primary care physician. Only 3 percent of rheumatologists indicated that their practices were closed to new patients, but 48 percent restricted access by requiring a referral from a primary care physician. This suggests that nearly half of rheumatologists have excess demand for their services and are using referrals to limit access. Rheumatologists were also asked about mean wait times for appointments among early arthritis and non-urgent patients. Since the introduction of pharmaceuticals with the ability to prevent joint destruction and disability with early treatment, the benefits of identifying early arthritis patients and beginning treatment promptly has been demonstrated, therefore we expected much shorter wait times for early arthritis patients than for non-urgent patients. Figure 2-29 presents the distribution of wait times for early arthritis patients. The mean wait time for early arthritis patients among the physicians sampled was 18 days. About 39% percent of early arthritis patients were seen within 7 days. This demonstrates that many rheumatologists see
The Lewin Group, Inc. 24

early arthritis patient quickly in an effort to prevent joint damage. Unfortunately, 15% percent of rheumatologists said early arthritis patients wait a month or more for their first visit.
Figure 2-29 Wait Time to First Appoint for Early Arthritis Patients
14.1%
24.5%27.6%
13.1%
5.4%
11.7%
3.5%
0.0%
5.0%
10.0%
15.0%
20.0%
25.0%
30.0%
3 Days orLess
4-7 Days 8-14 Days 15-21Days
22-28Days
29-60Days
More than60 Days
Figure 2-30 presents wait times for non-urgent patients. These wait times are substantially longer than for early arthritis patients. The mean wait time for a non-urgent patient is 37 days. Almost half of rheumatologists reported that their non-urgent patients wait more than four weeks to be seen.
Figure 2-30
Wait Time to First Appoint for Non-Urgent Patients
19.6%17.5% 17.6%
10.5%
21.0%
13.9%
0.0%
5.0%
10.0%
15.0%
20.0%
25.0%
0-13 Days 14-20 Days 21-28 Days 29-35 Days 36-60 Days More than 60Days
For comparison purposes Table 2-2 below compares these wait times to mean wait times for Non-surgical internal medicine generalists and subspecialists. Although wait times for internal
The Lewin Group, Inc. 25

medicine physicians increased between 1999 and 2001. The wait time for early arthritis patients is similar to the mean wait time for all new patients and the mean wait time for non-urgent patients substantially exceeds the wait times reported for internal medicine overall.
Table 2-2 Mean Wait Times for New Patients
Specialty 1999 2001 Overall Internal Medicine 12.0 18.0 General Internal Medicine 12.4 18.3 Cardiovascular Disease 11.8 17.2 Gastroenterology 12.1 18.3 Other 9.1 16.0
*AMA Physician Socioeconomic Statistics, 2000-2002 and 2003. Our final indicator of demand for rheumatology services is the percentage of surveyed physicians whose practices are currently seeking to hire or plan to hire in the next five years, a rheumatologists, a pediatric rheumatologist, or a physician’s assistance or nurse practitioner. Over 30% of rheumatologists are in practices currently hiring and over 50% are in practices planning to hire in the next five years.
Figure 2-31
Percentage of Rheumatologists Whose Practice Plans to Hire
0.0%
10.0%
20.0%
30.0%
40.0%
50.0%
60.0%
Rheumatologist Ped Rheum Phys Asst/NursePrac.
Currently
Within 5Years
In summary, the high percentage of practices hiring or planning to hire indicates strong demand for rheumatology services. That almost half of rheumatologists report limiting access based on referral and almost half report wait times for non-urgent patients exceeding four weeks suggests
The Lewin Group, Inc. 26

that there is considerable excess demand for rheumatology services. That is, the current supply of rheumatologist visits is not equal to the demand for those visits such that rheumatologists are limiting access through requiring referrals or having long wait times for appointment.
2.7 Income Survey respondents were asked to report the category for their net income related to their medical practice in 2004. This figure was to include income from clinical practice, speaking/consultation, clinical trials and medical legal work in the form of fees, salaries retainers, bonuses deferred compensation and other forms of monetary compensation, but not investment income from medical-related enterprises and the estimated cash value of any fringe benefits. There was a very high response rate for this question, 94%. Data from this survey might be compared to the data on physician compensation from the Medical Group Management Association (MGMA). In their physician compensation and production report on data for 2002 and 1998, MGMA reports median rheumatologist income for private practice physicians of $193 and $151 thousand, respectively, indicating 28% income growth in this four year period. Compensation for academic physicians reported by MGMA for 2002 and 1998 indicates substantially lower compensation and compensation growth. Median compensation for academics in 2002 and 1998, respectively, is $139 and $124 thousand annually. We divided those responding to the survey into two groups for the income analysis: those working full-time or 40 or more hours a week and those working part-time or less than 40 hours a week. The responses indicate a mean income of $215 and $162 thousand annually among those working full-time and part-time, respectively. Median income reported by respondents was $175 and $125 thousand among those working full-time and part-time, respectively. The income distributions for these two groups are reported in Figures 2-32 and 2-33, respectively. Figures 2-32A and 2-33A display the share of respondents in each income category. Figures 2-32B and 2-33B display the same data in an alternative fashion indicate the share of respondents with income exceeding a given level.
The Lewin Group, Inc. 27

Figure 2-32A Income Distribution For Full-Time Workers
9%
25%
20%17%
9%8%
3% 3% 2%5%
0%
5%
10%
15%
20%
25%
30%
<$100 $100-$149
$150-$199
$200-$249
$250-$299
$300-$349
$350-$399
$400-$449
$450-$499
$500+
Figure 2-32B Income Distribution For Full-Time Workers
91%
66%
46%
29%20%
12% 9% 6% 5%0%
20%
40%
60%
80%
100%
$100
K or M
ore
$150
K or M
ore
$200
K or M
ore
$250
K or M
ore
$300
K or M
ore
$350
K or M
ore
$400
K or M
ore
$450
K or M
ore
$500
K or M
ore
Among those working full-time only 9% reported earning less than $100,000 per year. The majority earned between $100 and $249 thousand dollars per year. Among part-time workers
The Lewin Group, Inc. 28

45% earned less than $100 thousand per year. Another 40% earned between $100 and $249 thousand per year.
Figure 2-33A Income Distribution For Part-Time Workers
45%
19%
9%12%
3% 1% 1% 1% 3% 5%
0%5%
10%15%20%25%30%35%40%45%50%
<$100 $100-$149
$150-$199
$200-$249
$250-$299
$300-$349
$350-$399
$400-$449
$450-$499
$500+
Figure 2-33B Income Distribution For Part-Time Workers
55%
36%27%
15% 12% 11% 9% 8% 5%0%
20%
40%
60%
80%
100%
$100
K or M
ore
$150
K or M
ore
$200
K or M
ore
$250
K or M
ore
$300
K or M
ore
$350
K or M
ore
$400
K or M
ore
$450
K or M
ore
$500
K or M
ore
The Lewin Group, Inc. 29

We looked at income by demographic group in Figure 2-34. This figure shows males earning more than females and those age 50-59 earning more than their counterparts in other age groups. The income of those in rural areas is similar to that of those working in urban areas.
Figure 2-34
Mean Income by Demographic Group
$0
$50
$100
$150
$200
$250
$300
Male
Female <4
040
-49
50-59
60+
Rural
Urba
n
Inco
me pe
r Yea
r (in
thou
sand
s)
The next figure reports income by practice characteristics. This figure indicates part-time workers earning less than full-time worker, non-academics earning more than academics, and adult rheumatologists earning more than pediatric rheumatologists.
Figure 2-35 Mean Income by Practice Characteristics
$0
$50
$100
$150
$200
$250
Part-t
ime
Full-t
ime
Acade
mic
Non-A
cade
micAdu
ltBoth
Pediat
ric
Inco
me
per Y
ear (
in th
ousa
nds)
We used the survey responses to develop a multivariate model for income. This type of model can isolate the impact of a given factor on income holding other factors constant. Ordinary least
The Lewin Group, Inc. 30
squares regression was used to predict annual income based on: number of initial and follow-up visits provided per year, primary employment setting, family status, office technologies, age and sex, and region of the country. The purpose of this model was to determine the importance of these factors as predictors of rheumatologist income. Table 2-3 displays the regression results. The results indicate that each initial and follow-up visit adds $24 and $19, respectively to a rheumatologist’s income. In terms of primary employment setting, the results indicate that rheumatologists in solo and partnership practices (2 physicians) have a similar income as those in group practices. In contrast, relative to physicians in group practices, physicians in government and medical schools make $25 and $26 thousand less per year, however, only the results for medical school are statistically significant probably due to the small number in the sample working in government. The model indicated some differences in income by age even controlling for the number of initial and follow-up visits provided per year. The results indicate that rheumatologists less than 40 and over 60 had a similar level of income to those 40-49. However, those 50-59 had a substantially higher income than those 40-49 by $40 thousand per year.
The Lewin Group, Inc. 31

Table 2-3 Income Regression Results (Adjusted R-Square = .364)
Independent Variable Change in Annual Income
($1000s) Visits per Year (1000s) Initial $23.6* Follow-up $18.8* Primary Employment Setting (Relative to Group Practice)
Employ effects are relative to this group.
Solo Practice $2.1 Partnership Practice -$3.3 Government -$25.4 Medical School -26.4* Industry $18.2 Hospital $33.4* Age Category (Relative to 40-49) Age effects are relative to this group. < 40 Years Old -$1.1 50-59 Years Old $39.8* Over 60 Years Old $9.6 Family Characteristics (Relative to Single Female)
Family effects are relative to this group.
Male $35.3 Married Male $34.1* Male with Children Less Than 6 -$27.3* Male with Children 6-18 $30.0* Married Female $22.6 Female with Children Less Than 6 -$4.0 Female with Children 6-18 $5.3 Practice Has Control of: Infusion Technology $6.6 Ultrasound -$17.9* Densitometry $17.0* MRI-Hand/Foot $10.6 X-Ray $21.7* Lab $6.1 Non-US Medical School Graduate -$6.1 Board Cert. or Fellow Trained Pediatric Rheumatology -$5.1 Hiring Rheumatologist or NP/PA $9.6 * Significantly different from zero at 85% confidence level.
The results by sex and family status were not significantly different from zero for women. However the results indicated that married men ($34 thousand) and married men with children 6-18 ($64 thousand) earn substantially more than single women. In contrast married men with children less than six only earn about $7 thousand more per year than single women. Again these
The Lewin Group, Inc. 32

differences exist even after controlling for differences in the number of initial and follow-up visits provided per year. Finally, fiscal control of certain office technologies has important implications for income. Rheumatologists in practices with densitometry and X-ray had incomes $17 and $22 thousand higher than those without these technologies. Meanwhile rheumatologists in practices with ultrasound had incomes $18 thousand dollars less than rheumatologists without this technology.
The Lewin Group, Inc. 33

3. DISCUSSION The purpose of this survey was to provide more detailed information on the rheumatology community to support analysis of the current workforce and projections of the future supply of and demand for rheumatologists. In terms of the supply of rheumatology services, the survey results suggest that visits per rheumatologist are likely to decline in the future. First, when asked the number of hours they currently work per week and the number they expected to work per week five years in the future, on average rheumatologists of all age groups indicated that they plan to decrease their work hours in the next five years. Similarly, when asked if they would like to their work hours to increase, decrease or stay the same, 46% of respondents indicated that they wanted their workload to decrease, only 4% indicated that they wanted an increase. In addition, the share of rheumatologists who are female and over the age of 60 is expected to increase over the next twenty years and reported numbers of visits per month for female rheumatologists and those over the age of 60 are lower than the average number of visits per month for rheumatologists overall. In terms of demand for rheumatology services, many of the measures indicate that there is currently excess demand for rheumatology services. The high percentage of practices hiring or planning to hire indicates strong demand for rheumatology services. That almost half of rheumatologists report limiting access based on referral and almost half report wait times for non-urgent patients exceeding four weeks also suggests that there is considerable excess demand for rheumatology services. That is, the current supply of rheumatologist visits is not equal to the demand for those visits such that rheumatologists are limiting access through requiring referrals or having long wait times for appointment. Affecting both supply and demand, it is also important to note that rheumatologists have been quick to adopt new technologies and to change their practices in reaction to recent research on RA treatment. Over 70% of rheumatologists are in practices with fiscal control over an infusion unit. Since use of this new technology is already well established in many rheumatology practices, we might expect the rate of increase in demand for rheumatologist services that was sparked by the introduction of infliximab in 1999 will slow. However, research into other new treatments and methods of identifying patients early and monitoring progress continues. As new treatments and technologies are introduced, demand is likely to again increase rapidly. Finally, the results of the survey suggest that rheumatologists are generally satisfied with their current practices with only 6-10% reporting dissatisfaction. However, when asked about specific job attributes, many rheumatologists indicated dissatisfaction with reimbursement rates and income. These responses may be in reaction to recent changes in Medicare payment policy which reduced reimbursement levels for infusion services. Maintaining high levels of job satisfaction and competitive income levels for rheumatologists will be important to attracting young physicians into rheumatology and thereby reducing projected excess demand for rheumatologist services over the next 20 years.
The Lewin Group, Inc. 34

Appendix A: Rheumatologist Survey
Rheumatologists Survey
Please answer the questions on this survey by marking the appropriate choice before each response or by filling in the correct information.
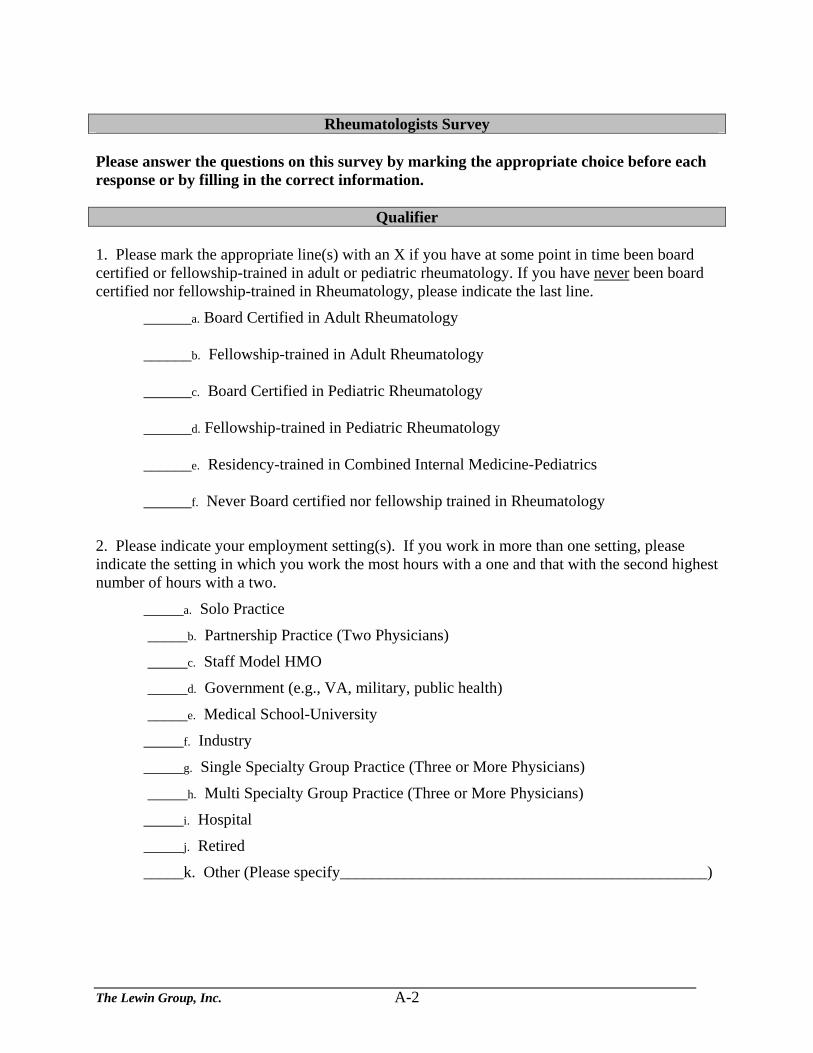
Qualifier 1. Please mark the appropriate line(s) with an X if you have at some point in time been board certified or fellowship-trained in adult or pediatric rheumatology. If you have never been board certified nor fellowship-trained in Rheumatology, please indicate the last line.
______a. Board Certified in Adult Rheumatology
______b. Fellowship-trained in Adult Rheumatology ______c. Board Certified in Pediatric Rheumatology
______d. Fellowship-trained in Pediatric Rheumatology ______e. Residency-trained in Combined Internal Medicine-Pediatrics
______f. Never Board certified nor fellowship trained in Rheumatology
2. Please indicate your employment setting(s). If you work in more than one setting, please indicate the setting in which you work the most hours with a one and that with the second highest number of hours with a two.
_____a. Solo Practice
_____b. Partnership Practice (Two Physicians)
_____c. Staff Model HMO
_____d. Government (e.g., VA, military, public health)
_____e. Medical School-University
_____f. Industry
_____g. Single Specialty Group Practice (Three or More Physicians)
_____h. Multi Specialty Group Practice (Three or More Physicians)
_____i. Hospital
_____j. Retired
_____k. Other (Please specify______________________________________________)
The Lewin Group, Inc. A-2

Clinical Practice Characteristics 3. The next set of questions (questions 4 to 20) relate to patients you treat or clinical practice characteristics. Do you currently treat patients ?
_____1. Yes (Please continue with question 4.) _____2. No (Please skip to question 21.)
4. Please indicate the percentage of your clinical care work hours spent providing the following types of care in a typical work week. % of Clinical Care Hours
Type of Care
a. Adult Rheumatology
b. Pediatric Rheumatology
c. General internal medicine (Primary care for patients without rheumatic disease)
d. General pediatrics (Primary care for patients without rheumatic disease)
e. Allergy and immunology
f. Geriatric medicine
g. Other (please specify_____________________________________)
100% Total (please total to 100%)
5. For what percentage of your patients with rheumatic disease do you serve as a primary care provider? ______% of patients with rheumatic disease
The Lewin Group, Inc. A-3
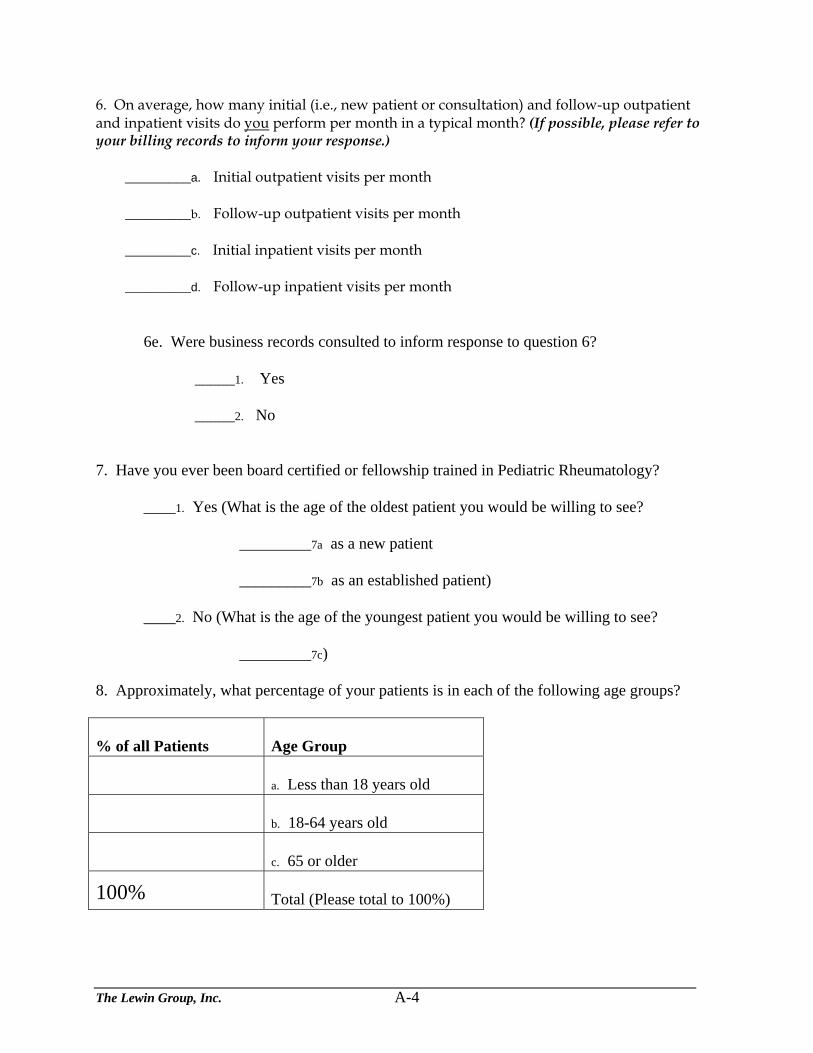
6. On average, how many initial (i.e., new patient or consultation) and follow-up outpatient and inpatient visits do you perform per month in a typical month? (If possible, please refer to your billing records to inform your response.) _________a. Initial outpatient visits per month _________b. Follow-up outpatient visits per month _________c. Initial inpatient visits per month _________d. Follow-up inpatient visits per month
6e. Were business records consulted to inform response to question 6? _____1. Yes _____2. No
7. Have you ever been board certified or fellowship trained in Pediatric Rheumatology?
____1. Yes (What is the age of the oldest patient you would be willing to see? _________7a as a new patient _________7b as an established patient)
____2. No (What is the age of the youngest patient you would be willing to see?
_________7c) 8. Approximately, what percentage of your patients is in each of the following age groups? % of all Patients
Age Group
a. Less than 18 years old
b. 18-64 years old
c. 65 or older
100% Total (Please total to 100%)
The Lewin Group, Inc. A-4

9. Are you currently accepting new patients? _____1. Yes _____2. No
10. Do you require new patients to have a physician referral?
_____1. Yes _____2. No
11. Has your practice established an early arthritis care clinic (center) in an attempt to see patients with inflammatory conditions sooner?
_____1. Yes _____2. No
12. How many days does an early arthritis patient wishing to see you typically have to wait for an appointment (please answer this question regardless of how you answered question 11)?
___________ days (seven calendar days is equal to one week) 13. How many days does a non-urgent new patient wishing to see you typically have to wait for an appointment?
___________ days (seven calendar days is equal to one week)
The Lewin Group, Inc. A-5

14. Please indicate the number of Rheumatologists and physician assistants (PAs) and nurse practitioners (NPs) directed by the Rheumatologists that are in your main clinical practice setting. Once you have indicated the number of professionals please indicate the number of FTEs represented by these professionals. For example, if you have two nurse practitioners who each work 20 hours per week, you would indicate two for the number of professionals and one for the number of FTEs represented by these professionals. # of professionals practicing in main clinical practice setting
# of FTEs represented by professionals indicated at left
Type of Medical Professional
a. b. Physician - Adult Rheumatologist
c. d. Physician - Pediatric Rheumatologist
e. f. Physician Assistants
g. h. Nurse Practitioners
15. Please indicate the number by which your practice or academic division is actively seeking to increase each of the following types of professionals. Beyond your current recruiting efforts, please also indicate the number by which you expect your practice or academic division to increase each of the following types of professionals on staff within the next five years. Number Actively Seeking to Increase By Currently
Number Expect to Increase By in Next 5 Years
Type of Professional
a. b. Rheumatologist
c. d. Pediatric Rheumatologist
e. f. Physician Assistant/Nurse Practitioner
The Lewin Group, Inc. A-6

16. In the first column below, please indicate with an X if your practice or academic division currently includes a non-rheumatologist clinical physician(s) in any of the following specialties AND you sometimes work collaboratively with this physician(s). In the second column, please indicate with an X if your practice or academic division plans to add a non-rheumatologist clinical physician(s) in any of the following specialties within the next five years AND you intend to sometimes work collaboratively with this physician(s). (Mark as many as apply.) Currently Includes
Expect to Include within 5 Years
Type of Clinical Physician
a. b. Orthopedist
c. d. Physiatrist
e. f. Primary Care Physician
g. h. Other Specialist (please specify______________________)
17. Do you “job share” (i.e., work less than 30 hours per week and share responsibility for your patients with another part-time professional)?
_____ 1. Yes
_____ 2. No (17a. Would you like to job share in the future? _____1. Yes _____2. No)
18. Please mark with an X the technologies currently available at your private physician practice or within your academic division. If your practice or academic division does not currently have the listed technology, please indicate whether you expect your practice or academic division to acquire the technology within the next five years. (Please include only technologies that are under the direct fiscal control of your practice or academic division.) Currently Available1
Expect to Acquire within 5 years2
Not Currently Available/ Do Not Expect to Acquire3
Technology
a. Infusion Unit
b. Ultrasound
c. Densitometry
d. MRI of hand/feet
e. X-ray
f. Laboratory
The Lewin Group, Inc. A-7

19. What proportion of your patients has the following primary source of payment? (If possible, please refer to your billing records to inform your response.) % of Patients Primary Source of Payment
a. HMO
b. PPO
c. Indemnity
d. Medicare
e. Medicaid
f. Worker’s Compensation
g. Self-Pay
h. No Charge
i. Other (Please specify __________________________________)
100% Total (Please total to 100%)
The Lewin Group, Inc. A-8

20. Please indicate only the top six conditions that represent the primary diagnosis for visits among new or initial consultation and follow-up patients, respectively, that you treated during the last six months. Please use 1 to indicate the condition with the greatest share of visits and 6 to indicate the condition with the 6th greatest share. Under other please write-in any condition in your top six which is not listed. (If possible, please refer to your billing records to inform your response.) Rank Top 6 for New Patients
Rank Top 6 for Follow-up Patients
Primary Diagnosis for Visit
a. b. Rheumatoid Arthritis (714.0)
c. d. Juvenile Arthritis (714.3)
e. f. Osteoarthritis/Osteoarthrosis (715.0x-715.9x)
g. h. Disorders of Joint (719.0x-719.9x)
i. j. Systemic lupus erythematosus (710.0)
k. l. Fibromyalgia (729.x)
m. n. Psoriatic arthropathy (696.0)
o. p. Unspecified polyarthropathy/polyarthritis (716.5x)
q. r. Polymyalgia rheumatica (725)
s. t. Osteoporosis (733.0x)
u. v. Gout (274.x)
w. x. Other (please specify ______________________________)
y. z. Other (please specify ______________________________)
aa. ab. Other (please specify ______________________________)
ac. ad. Other (please specify ______________________________)
ae. af. Other (please specify ______________________________)
ag. ah. Other (please specify ______________________________)
The Lewin Group, Inc. A-9

20a. Were business records consulted to inform responses to questions 19 and 20?
Question 19 Question 20 Yes, business records were used to exactly calculate response.
ai. aj.
No, response was estimated. ak. al.
Retirement Plans The next two questions are related to your retirement plans. Please do not consider mid-career reductions in work effort. 21. At what age do you plan to substantially reduce your direct patient care hours (i.e., partially retire)? _____ Expected age when substantially reduce patient care hours 22. At what age do you plan to completely retire from patient care? _____ Expected age at full retirement from patient care
Professional Experiences The next three sections relate to your experiences in all professional activities including clinical care, research, teaching, or work for industry. 23. Are you primarily:
____1. Employed by others ____2. Self-Employed
24. Currently, in a typical work week, approximately how many total hours (including all professional activities) do you work?
_______ hours worked per week 25. Approximately how many weeks per year is this true?
_______ weeks per year
The Lewin Group, Inc. A-10

26. Currently, in a typical work week, how many clinical half days do you schedule per week?
_______ half days scheduled per week 27. Five years ago, approximately how many total hours (including all professional activities) did you work in a typical work week?
_______ hours worked per week 28. Five years from now, approximately how many total hours (including all professional activities) do you expect to work in a typical work week?
_______ hours worked per week 29. In a typical work week, what percentage of your work hours is spent on the following activities? % of Work Hours Professional Activity
a. Clinical care provided in an office setting
b. Clinical care provided in a hospital
c. Administration in support of patient care (e.g., insurance/billing, practice staff management)
d. Administration that does not support patient care (e.g., non-clinical responsibilities at an teaching institution)
e. Medical teaching
f. Basic/bench research
g. Clinical research (including clinical epidemiology or health services research, but excluding drug trials)
h. Drug Trials
i. Translational research
j. Practice improvement activities
k. Other (please specify___________________________________________)
100% Total (please total to 100%)
The Lewin Group, Inc. A-11

30. Do you participate in or desire to participate in clinical drug trials?
_____1. Yes (Please respond to question 30a.) _____ 2. No (Please skip to Career Paths question 31.)
30a. If yes, do you feel you have had adequate preparation/training for this?
_____1. Yes _____2. No
Career Paths 31. Do you spend the majority of your time in a non-academic setting?
_____1. Yes (Please respond to question 32.) _____2. No (Please skip to Current Job Satisfaction question 33.)
32. Within the last five years have you held an academic position that occupied the majority of your time?
_____1. Yes (Please respond to 32a and 32b below.) _____2. No (Please skip to Current Job Satisfaction question 33.)
32a. Why did you leave academics? (check as many as applicable.)
______a. Lack of strong divisional and/or institutional support ______b. Difficulty obtaining funding for research and/or other activities ______c. Desire for higher pay ______d. Desire for shorter work hours ______e. Inadequate mentoring ______f. Preference for community clinical care ______g. Other (please specify_______________________________________)
The Lewin Group, Inc. A-12

32b. Where did you go after your academic position(s) ended? ______1. Private practice ______2. Industry ______3. Government ______4. Other (Please specify_______________________________________)
Current Job Satisfaction 33. Overall how satisfied are you with your current practice of Rheumatology? (Circle one number.)
Extremely Dissatisfied
Extremely Satisfied
1 2 3 4 5 6 7 34. Would you like to see the following attributes of your professional workload increase, decrease, or remain unchanged? (Please circle one number in each row.)
a. Number of hours worked per week
1
2
3
4
5
b. Number of hours per week in direct patient care
1
2
3
4
5
c. Number of hours per week on administrative activities supporting patient care
1
2
3
4
5
d. Number of hours per week on administrative activities that do not support patient care
1
2
3
4
5
Decrease more than
20%
Decrease 1-20%
Stay Same
Increase 1-20%
Increase more than
20%
The Lewin Group, Inc. A-13

35. Overall how satisfied are you with the following job attributes: (Please circle one number in each row.)
Extremely Dissatisfied
Extremely Satisfied
a. Career options /professional growth
1
2
3
4
5
6
7
b. Geographic location
1 2 3 4 5 6 7
c. Income
1 2 3 4 5 6 7
d. Job security
1 2 3 4 5 6 7
e. Reimbursement rates
1 2 3 4 5 6 7
f. Colleagues/Partners 1 2 3 4 5 6 7
Education and Professional Qualifications 36. Did you graduate from:
____1. US Medical School ____2. Non-US Medical School
37. In what year did you graduate from medical school?
_____ year graduated from medical school 38. How many years have you been practicing Rheumatology in the United States?
_____ years practicing Rheumatology
The Lewin Group, Inc. A-14

Academic Setting The next set of questions, relate to professional experiences in an academic setting. If you are not working in an academic setting, please skip to the Grant Support section below (question 45). If you work in an academic setting, please respond to the next six questions. (These questions do not apply to volunteer unsalaried clinical faculty.) 39. What is your academic rank?
____1. Instructor ____2. Assistant Professor ____3. Associate Professor ____4. Professor ____5. Other (please specify____________________________________________________)
40. Are you eligible for tenure or already in a tenured position?
_____1. Tenured _____2. Non-tenure track _____3. Tenure eligible track _____4. Other (please specify_______________________________________________)
41. What percent of your total salary (not necessarily total income) comes from the following sources?
% of Total Salary Funding Source
a. Federal Grant
b. Industry Grant
c. Non-Federal, Non-Industry Grant
d. Departmental/Institutional/Endowment Support
e. Practice/Clinical Income
f. Federal Government/VA Salary
g. Other (please specify______________________________________)
100% Total (Please total to 100%)
The Lewin Group, Inc. A-15

42. Please indicate as a dollar amount or percentage of salary, what is the minimum R01 equivalent grant support required by your institution to cover your salary? $________________a. or ___________b. % of salary 43. If you are an independent investigator (e.g., have your own lab or supervise your own research program), how long did it take before you were in this independent position?
_____a. PGYs after MD _____b. Not applicable/I am not completely independent
44. Do you supplement your salary with income from any of the following sources (mark as many as applicable): _____a. Outside consulting _____b. Honoraria _____c. Speaking fees _____d. Inventions/royalties _____e. Other (please specify_______________________________________________) _____f. Not allowed to supplement salary
The Lewin Group, Inc. A-16

Grant Support
The next two questions, 45 and 46, refer to grant support you may currently receive or have received at some point in the past. If you have never received grant support please skip to Demographics (question 47). 45. Do you currently have independent (an individual award not a mentored award such as a K award) grant support?
_____1. Yes (Please respond to questions 45a and 45b.) _____2. No (Please skip to question 46.)
45a. When after completing your training did you first receive independent (an individual award not a mentored award such as a K award) grant support?
_____a. Years after completing rheumatology fellowship ( MDs ) _____b. Years after completing post-doctoral training ( PhDs )
45b. During the time between completion of your fellowship or post-doctoral training
and receipt of your first independent grant support, did you receive any of the following types of grants? (mark as many as applicable.)
_____c. K01 _____f. K08 _____i. K12
_____d. K23 _____g. F32 _____j. T32
_____e. REF Award _____h. Arthritis Foundation National Grant _____k. Arthritis Foundation Local Chapter
Grant _____l. Other Foundation Grant (please specify ________________________) _____m. Other Source of Funding (please specify________________________)
The Lewin Group, Inc. A-17

46. How many of the following research grants do you currently hold or have you ever received? Type of Research Grant Currently Hold Formerly
Received NIH R01
a. b.
NIH R03
c. d.
NIH R21
e. f.
NIH P01, P60
g. h.
VA Merit Award
i. j.
Program/Center Grant (ACE, P30, etc)
k. l.
NSF Grant
m. n.
FIRST Awards
o. p.
Howard Hughes Grants
q. r.
Pew Grants
s. t.
Wellcome Awards
u. v.
NIH “K” Awards
w. x.
NIH NRSA F32 Award
y. z.
ACR/REF Clinical Investigator Fellowship Award
aa. ab.
ACR/REF Physician Scientist Development Award
Ac. ad.
Arthritis Foundation Arthritis Investigator
Ae. af.
Arthritis Foundation Post-Doctoral Award
Ag. ah.
Arthritis Foundation Physician Scientist
ai. aj.
VA Physician Scholar Award
Ak. al.
VA Associate Scholar Award
Am. an.
Other Private Foundation Training Awards
Ao. ap.
Other (please specify ________________________) Aq. ar.
Other (please specify ________________________) As. at.
The Lewin Group, Inc. A-18

Demographics
47. What is your age?
______ years old
48. What is your gender?
_____1. Male _____2. Female
49. Are you currently married?
_____1. Yes _____2. No
50. How many children under 6 and 6 to 18 years of age do you have? ______a. Number of children less than 6 ______b. Number of children 6 to 18 51. How would you describe yourself with regard to race or ethnicity? (Mark one or more)
____a. White ____b. Black or African American ____c. Hispanic
____d. Native American ____e. Asian/Pacific Islander ____f. Other
The Lewin Group, Inc. A-19

52. What was your own net income from medical practice in 2004? Please include all income from clinical practice, speaking/consultation, clinical trials and medical legal work in the form of fees, salaries retainers, bonuses deferred compensation and other forms of monetary compensation, but not investment income from medical-related enterprises. Do not add to your cash income the estimated value of any fringe benefits you may have.
_____1. Less than $100,000 _____2. $100,000-$149,999 _____3. $150,000-$199,999 _____4. $200,000-$249,999 _____5. $250,000-$299,999 _____6. $300,000-$349,999 _____7. $350,000-$399,999 _____8. $400,000-$449,999 _____9. $450,000-$499,999 _____10. $500,000 or more
Thank you for taking the time to complete this survey. Please return in the stamped, self-addressed envelope provided
By
XXXXXXXX X, 200X
The Lewin Group, Inc. A-20

APPENDIX B:
ACADEMIC JOB ATTRIBUTES AND GRANT FUNDING

Questions focused on rheumatologists who practice in academic settings and on grant funding were added to the workforce survey. Figures summarizing the results of these survey questions are reported here.
Academic Job Attributes
Figure B-1
Distribution of Academic Rheumatologists by Academic Rank
29.7%27.7%
32.0%
2.2%
8.3%
0.0%
5.0%
10.0%
15.0%
20.0%
25.0%
30.0%
35.0%
Instructor AssistantProfessor
AssociateProfessor
Professor Other
Figure B-2 Distribution of Academic Rheumatologists by Eligibility for Tenure
27.7%
45.6%
15.5%11.2%
0.0%5.0%
10.0%15.0%20.0%25.0%30.0%35.0%40.0%45.0%50.0%
Tenured Non-TenureTrack
Tenure EligibleTrack
Other
The Lewin Group, Inc. B-2
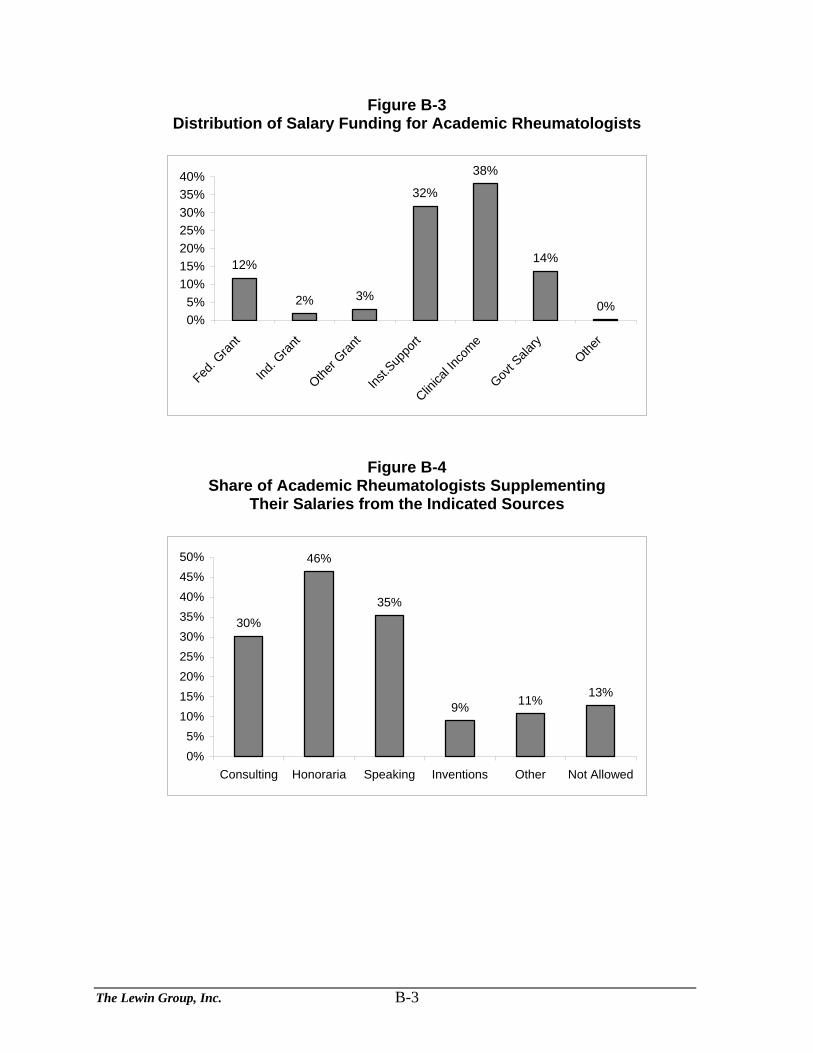
Figure B-3 Distribution of Salary Funding for Academic Rheumatologists
12%
2% 3%
32%
38%
14%
0%0%5%
10%15%20%25%30%35%40%
Fed. G
rant
Ind. G
rant
Other G
rant
Inst.S
uppo
rt
Clinica
l Inco
me
Govt S
alary
Other
Figure B-4 Share of Academic Rheumatologists Supplementing
Their Salaries from the Indicated Sources
30%
46%
35%
9% 11% 13%
0%5%
10%15%20%25%30%35%40%45%50%
Consulting Honoraria Speaking Inventions Other Not Allowed
The Lewin Group, Inc. B-3

Figure B-5 Number of Years to Achieve Independent Investigator Position
5%9%
16%
34%
16%
2%
9%6%
2%
0%
5%
10%
15%
20%
25%
30%
35%
40%
1-2 3-4 5-6 7-8 9-10 11-12 13-14 15-16 17
The Lewin Group, Inc. B-4

GRANT FUNDING
Figure B-6 Share of Rheumatologist Who Currently or Formerly Held Grants
9%
21%
0%
5%
10%
15%
20%
25%
Currently Hold Held in Past
Figure B-7 Share of Rheumatologist Who Currently Have Independent Grant Support
By Academic or Non-Academic Employment Setting
1%
22%
0%
5%
10%
15%
20%
25%
Non-Academic Academic
The Lewin Group, Inc. B-5

Figure B-8 Share of Rheumatologists with Independent Grant Support Who Had Listed Grant Type Prior to Independent Support
1%
17%
3% 2% 2%5%
15%
26% 26% 25%
36%
0%5%
10%15%20%25%30%35%40%
K01 K08 K12 K23 F32 T32
REF Award
Arthriti
s Fou
nd Lo
cal
Arthriti
s Fou
nd N
atl
Other F
ound
Other S
ource
Figure B-9 Share of Rheumatologists who Have Ever Received Grant Support
Who Received the Listed Grant Type Currently or in the Past
0%5%
10%15%20%25%30%35%40%
NIH R
01
NIH R
03
NIH R
21
NIH P
01, P
60
VA Meri
t Award
Prgrm/C
e Pew
Wellcome
nter
NSF Gran
t
FIRST Awards
Howard H
ughes
Currently
Past
The Lewin Group, Inc. B-6

Figure B-10 Share of Rheumatologists who Have Ever Received Grant Support
Who Received the Listed Grant Type Currently or in the Past
0%5%
10%15%20%25%30%35%40%45%
NIH "K
"
NIH N
RSA F32
ACR/REF C
I
ACR/REF P
S
AF- In
vesti
gator
AF- P
ost-D
octor
al
AF - S
cienti
st
VA Phy
sician
VA Ass
ociat
e
Other P
rivate
Train
ing
Other
CurrentlyPast
Figure B-11 Share of Salary Required to Be Covered by Grant Support
18%
8%
28%
45%
0%5%
10%15%20%25%30%35%40%45%50%
1%-24% 25%-49% 50%-74% 75% or More
The Lewin Group, Inc. B-7

CLINICAL TRIALS
Figure B-12 Share of Rheumatologists Desiring to Participate in Clinical Trials
43%
57%
NoYes
Figure B-13 Among Those Who Desire to Participate in Clinical Trials
Do You Believe You Have Adequate Training
26%
74%
NoYes
The Lewin Group, Inc. B-8

LEFT ACADEMICS
Figure B-14 Share of Non-Academics Who Left Academics Within the Last 5 Years
10%
90%
Yes
No
Figure B-15 Reason for Leaving Academics
50.5%
31.6%
50.2%
27.0%
13.2% 9.6%
33.7%
0.0%
10.0%
20.0%
30.0%
40.0%
50.0%
60.0%
Lack
of S
uppo
rt
Diff. F
undin
g Res
earch
Higher
Pay
Shorte
r Wor
k Hou
rs
Inade
quate
Men
toring
Pref. C
omm C
linica
l Car
e
Other
The Lewin Group, Inc. B-9

Figure B-16 Where Did You Go After Leaving Academics
Private Practice61%
Industry23%
Government2%
Other14%
The Lewin Group, Inc. B-10
Related Documents