I I , RHEOLOGY OF FRICTION-REDUCING POLYMER SOLUTIONS lii by P. I. Gold and P. K. Amar D EPARTMENT OF MECHANICAL ENGINEERING March, 1971 NATIONAL TECHNICAL INFORMATIO80 SERVICE Sc.rn~ficus, Va 222151 P 11947 I -I -I APPROVED OR PUB'eIC IRE.LEASE: DI•STR~r•YI'1ON UN!fl'TEO. ! -- i

Welcome message from author
This document is posted to help you gain knowledge. Please leave a comment to let me know what you think about it! Share it to your friends and learn new things together.
Transcript

I
I ,
RHEOLOGY OF FRICTION-REDUCING POLYMER SOLUTIONS
lii by
P. I. Gold
and
P. K. Amar
D EPARTMENT OF MECHANICAL ENGINEERING
March, 1971
NATIONAL TECHNICALINFORMATIO80 SERVICE
Sc.rn~ficus, Va 222151 P
11947
I -I
-I APPROVED OR PUB'eIC IRE.LEASE: DI•STR~r•YI'1ON UN!fl'TEO.
! -- i

T
TRHEOLOGY OF FRICTION REDUCING POLYMER SOLUTIONS
by
P.1. Gold
and
P. K. Amar
Department of Mechanical Engineering gCalifornia State College, Los Angeles
ILI
This research was ccn.iucted under the spovisership of theNaval Undersea Research and Development Center, Pasadena""alifornia, under cont;-act No. N16600i-70-C-0723.
--

-- ;M
Abstract el
,' Stress decay characteristics of concentrated (0.14% - 1.03%)PEO,ý.solutions were measured. Apparent viscosity loses of up to 50% were
recorded at 300C. Shear rates ranged up to 1370/see'. Limiting vis-
cosities were found to be relatively independent of solution history.
I �Moreover, limiting viseosities could be correlated by a poer-law model
J Iover a four decade-shear rate range.
-Disk flow was used to investigate tile phenomenon of turbulent drag
reduction and subsequent mechanical degradation of dilute zquebus solu-
I tions of polyethylene oxide. The relationship of drag reduction and
degradation to the:molecular weight, solution concentration and tempera-
SI ture was investigated. ,Reduced viscosity measurements (which are a measure
of molecular weight o- polymer) were carried out directly on the dilute
solutions tested., --
It vas found that the extent of initial drag reduction, except for
I very lo,.ve concentrations, is essentially independent of the polymer molec-
ular weight foi- this particular apparatus. In addition, lower molecular
weight polymers degraded more -slow.ly than higher molecular weight polytiers
1 if coip4prison was made in terms of degradation of reduced visuz-ty rather
than in decrease of percent drag reduction. The results also indicated
that the drag reduction depends primarily on the high molecular weight
Scoimponents of the distribution. The failure of reduced viscosity to cor-
relate with drag reduction degradation wa.s also noted. The rate of degrada-
tion of drag reduction %.as fouud to be very seevere at hieher te-D•eratures.I •
.~-.-+ .. . -

I IIkIt was determined that the shearing of concentrated solutions did not
. { cause any measurable change in drag reduction effectiveness and degrada-tion characteristics of subsequently diluted forms.
Hif TI
V
Mi
U. -?
A5! :I
I' I•| ii:4:

_t~~~n.~ ,,-- , -
Table of Contents
pageAbstract .i . ...
1.0 Introduction ......... ...... . .......... . .
.:20 Summary of Results ........ ... ......... . . 3'2.1 Concentrated Solution Rheology .......... . 3"2.2 Frictioii Reduction in Dilute Solutions............. 4
3.0 Experiment Techniques and-Procedures ... ........... . 6I 3.1 Polymers Studied . . . . .................... 6
3.2 Solution Pireparation Techniques . . ............ 63.2-, Vortex Miier Method . . .................... 61iI 3.-2.2 Boiling Water ethod . ............. 8
1 3.3 Str:ess Decay and Viscositybasurements in Concentrated, ,Solutions . ........... . .... . 8
3.4 Turbulent Fl ow Rheoireter. ................... . 14-S 1-= 3.5 Chiaracterization 'of Dilute &Polymer Solutions ....-... ..... 15
S3.5.1 Vi scomter . . ................ -151 .5.2- Capilla6ry., Fl ow- el ati ons..... .. ... . ... .. ... . 16.3.5.3 :ntrrinsic Viscosity and,-,olecular Weight Relations . . . . 18
Figu;es 22
"4.0 Rheology ofoncentrated Solutions 31, 4.1 General ......... . . ........... . . 31
1 4.2 Rheology of Concentrated PEOo Sol6tions . .. . . .. .. 34," 4.2.1 Stress Decay Characteristics of Concentrated PEO-Solutions 36'
4.2.2 'Step Sequence Experiments .. ............. 5?Figures ......... ... .. ..... ............. 58
I '5.0 Frictional Dray Reduction in Dilute PEO Solutions .......... 835.-1 Introduction ..-.. .................. .83
5.1.1 Preliminary Remarks . .............. ... . ... . .... 83-51.2 Theories of Drag Reduction- 845.1.3 Polymer Degradation...: . ...... ......... . ..... 871 5.1.4 Enclosed Disk Flow . . .. . ................. 895.1.5 Objecti-vas of the Present Investigation ............... 91-5.2 TEffect of Shearino=Thick Solutions on Drag Reduction Effec- -
- - tiveness and Mechanical Degradation .... ........... .. 925.3 , echanical Degradation of Dilute Solutions of PEO in a
"Thurbulent Field ..... ,..... . . . . . .. .....- 95S5. 3'.1 Theoretical1 Cackground ......... 9.55.1.2 Experimental Results .... .... ... ... ... .... . . . 985.4 The Effect of Temperature on',rag Reduction and MechanicalI Degradation . . . . . . ..... 1075.5 Effect of Static- Storage of Haster Solutions- on Drag 'Reduction 1105.6 Sta~tic Viscosity Degradation 'of -Dilute -Sol ions ........ 1117
IIV•/ C ~Fig'ures .... ................ ~... ...... 1- _?
S-' ' iv --
I:-- ? I

{ I, 6,.0 Conclusions and-Recommendations .... ....... . . . . . 1366.1 Recommendations for Continuing Efforts ... .... . . . . . 139
- 7.0 Bibliography................. ........ . 141
8.0 Appendix I. End Corrections for Filled>Cup-Newtonian Fluid 145
0.-:0 Appendix II. Kinet ic Energy Correction ............. ... 148-1,.;0.0 -Anpehd*x i'III. WIall Shear RatL of Capillary Viscometer . . . 149
Si .11.0 -Appendix IV. Data Tables . ................ .
12.0 Appendix' V. Power Law Analysis of- 14!isce11ane6us Prelimi-nary-Data ........ ....................... 166
i}i
P
,--I

S"- " • • • • . ,i: z.'-• - --- ----
:1.0 Introduction.#14
T ,Many of the physical characteristics of solutions of polyethylene oxide
are sensitive to mechanical degradation effects encountered in mixing and
-handling processes. In particular, rheological properties have proved to be
1' st!ongly 'dependent upon the mode of solution preparation (28, 29).1 That is
shearii:q iction due to agitation during preparation can influence the meas- J
ured rheoloAical oroperties of a solution.. This sensitivity to mechanical
j ' effects is due largely 4.u the rathee Comnplex molecular structure of these
solutions. Thus, even in relatively dilute solutions, a high degree 0.f mole-
c-ular entanglement exists between: and within lona chain polymer molecules.
I Coupled with the existence of relatively weak and easily ruptured inter-chain
Shydrogen :bonds and the possibility of actual. polymer chain scission under the
action-of shearing forces this leads to the so-called "viscosity ITss:' so'
Tx. •often -observed in concentrated solutions..
T The priacipal obj2ctive of this research has-been the determination of
the critical rheological properties of aqueous solutions of polyethylene oxide
1' and the development of a-.molecular Thterpretation of these properties, parti-
cularly as they may relate to the friction-reducing characteristics of -very
dilute solutions.
SIn the next section,. a brief sun-nary of the results of the research cln-
-duct.d during this program is presented. Section 3.0 provides a detailed
description of i unstrmental techniques and experimental procedures. The re-
I. sults of the study of the rheological characteristics of concentrated
+ ftmbers in parentheses refer to refertces listed at the end of this report.
• -
- -- _- .- -'--' - 'X ,-~~~ - -

si 2
solutions are described in, Section 4.0. An extensive investigation of the
* friction reducing characteristics of very dilute solutions is cnntained in
Section 5.0. Emphasis here is placed upon the influence of mechanical
degradation of friction -1.duction. A roview of the principle conclusions
steming from these results, as well -as recmmendations for future efforts
is provided in Section 6:0. A n-Uber -of analytical developments and data
summaries are relegated to-the appendices at the end of this report.
I -jIT
4. -4
6- " •%
I• .. . . .- .
+hy
S2.0 Summary of Results.The nr1-P.ir6ai efforts of this research-were directed along .two
-distinct?ý c~hannels. First, -was the study of thd vis'rometric characteris-
tics of concentrated solutions, with particular emphasis on time-dependent
rheology. The second area -of emphasis was centered about the investigation
Sof txtrbulent flow frictioa reducing characteristics of very dilute solutions.•4
-+is--c41,-the influenc( •6f mechanical-degradation on polymer molecular
I.,aigb. a f ,';, ion redt' tion capability received- primary attention.
[ - -" topits a~e treated in detail inf-the following sections. The
purpose of this section is to.p~oVide a b~1ef summary of the essential
res,_-ts of thihe'e studies.
1( 2.1 COncentrated S6lution Rheology..
S I Aikey factor in :dscribing the -rheological characteristic of cnncen- -
- ated polyethylene oxide solutions is -the recognition of the importance of
tilme dependence of those characteristics. In this work, relatively unsheared
"" fresh" solutions were prepared using-the vortex mixer described in sectiofi
3-.0 :Solutions in the concentration range of 0.14% - 1,3443% (by Weight) of
polymer were.prepared. Each solution was sheared-at a series of conistant
" 1s - hear rates ranging -from 25 secJ to 1370 sec-, and the time-dependent shear
- ~ stress response wias recorded until a steady-state shear stress response
I obtained. At that point, a series-of iteady-sta-te shear stress xreadings at
successively lower¢ shear rates were obtaihed. All experiments-were con-
I. ducted at 300C +:O.1°C.
The stress decay experiments revealed that limiting apparent- viscositi~es
{obtained- after long periods of shcar iiere fronm 25 -501Y2 low-er t1.han that
3 1

4
zjobserved at the start of shearing. Stress decay rates, being due tocom-
plex molecular tate processes, however, did not correlate with simple
mechanical models for viscoelasticity. A-comparison of limiting viscosities
obtained after each stress decay experiment revealed that limiting viscosity
i is essentially independent of the shear rate at which the fluid- is "worked`r
. during -stress diccay, but depends only upon the'shear rate at which it is
measured. This conclusion, of-course, is'restricted -to -heshear rate
I range -covered. The limiting viscosities ihdicated that concentrated poly- A
j• •.': .ethylene oxide solutions can Ibe consideraed to• be power-law fluids in whhich h
shear stress is -givert by the relation
-1DT -where -v is the shear StreSs in dynesi/cm b, ID- the Newtoniar, shear rate in
sec&"-, and K and are constants. -Values of n were found to be generally
i fin,'the range 0.5-- C 6 for a wide variety of concentr.tions and polymer
"- .sam-les, even those With vast'y, different výiscous properties.
1:'• " 2.2 :Friction Reduction iniDilute Solutions.
Friction- reduction studies in this Program emphasized the determina-
• 2- tiDon-of the effects -of mechanical . degradation or the loss of friction redt-r,
j - ing capability. Degradatioh of friction reduction was observed in a thermo-
zstated rotating disk assembly-for samples- o'1.,R-205, 44.!R--301, and coagulant
grades of polyethylene _oxide as a function of pqlymer -concentr-ation. and solu-
1 ýtion termperature.
- - Except for very low-,concentrations, ilnitiai (-time zero) friction
- reduction Ns found to be virtually in&ependent of polymer grade and solution

concentrationm. Onthe-other hand, the friction reducing capability of the
lodwer-molecular weight grade, WSR-205, -t:as found to -degrade much more
I rapidly than the higher molecular weight homologs.
. Initial drag reduction increased as 'a function of temperature in
the.-range 30C to 60°C,-- hoWever the rate of degradation of drag reduction
- was found tO be:;very severe at the higher temperatures.
- Additional exper.inents were conducted to determine the effect of
-shearing concentrated solutionstupOn the drag reduction effectiveness and
' degradation characteristics of subseýquently diluted forms. In all cases,,
" -dilute SolutiOn drag ieduction characteristics were found to be independent
-44
-. I
A,

3. -Eprmna Tehiue-h Prcdue
.1 Polymiers Studied
Three.--grades of Union Carbide's Polyox were-obt-ained-for these
e~xperiments: -Coagulant, WSW-31 and WSR-205. All were sampl'es of
4uidustfial blends donated-by the Union Carbide Company and were used
as-received, without purification and fractionation. All polymer
tests ddsicribed in this study have been conducted-with the fol'lowing.
grades- anid--blenids of Polyox-: -
Approximate,i: ~ t rade. Blend- Moleulr- W16ht
WS-205 J214-,A:-09' 900,000J WSIR-301 _j7A~1 1006-A-01 a,200,OO..
Coagul aht7 -82-58;-R, 3,50,000
The, koleculat weg sgiven- above are-based on the ir~rni viscsit
measurements-made in this study,%.hich iare described later.
S3-2 -Solution Preparation Techniques
iTI wo methods for preparing the coficentrated-"Master" solutionsý
-- were used. These wiere the-Vortex mixer method: and the boii13ng wIater
31.2.1 Vortex 4.1ixer Miethod
fThis method-Oroved t.,o .be suitable fbr the Preparation of con~
1Icenitrated I'EOsolutions inbulk amounts (30-40 Ths). The- sytteni is- ~ tho~ni schematically in F.ig~rel. ApWtog ho th sytm sgivdn
in:Figur 2., thfe- enti re system. is -moun ted on casters for -portabil-ity..

- , -7t O>
Plastic piplnj is ficorporated in the system to el imate any metallic"degradation -effect on the polymer. An orifice meter is included to
provide a-measure of control of the water fiow rate. In addition, the
holding tank is calibrated in gallons. The principal element of the
system is'the vortex mixer unit depicted in Figure 3. Tnis unit was
donated- by the Naval Undersea Research and Development Center, Pasadena,
"" California-and modified slightly to adapt to the system. -The method of
preparation involved the simultaneous control~led flow of water and the
additlon-of a calculated amount of PEO powder through the- vortex mixer.
Both Operations were performed-fnr one minute. Care was taken that pow- -
-der was added at a.uniform rate during the mxing process tO provide a
homogeneous solution.
The system is capable-of preparing master solutions in the con-
centration range of 0.1% to 1%. Since PEO solutions preparedwith
ordinary -tap water are not sui:table for making reproducible physical
"" property determinat ; because of possible chemical degradation effects
(15), -distilled water was used in all cases. Immediately after the mix-
ing, isopropyl alcohol (0.5%) was added to the solutions as-a degfada-
tion retardant (17). Solutions were then stirred gently by a 121" Ain-
nmeter propeller at 10-15 rpm. for one hour. The concentrated solutions
- were allowed to stand for at least a 24 to 48 hour period-in order tot- insure complete solution homogeneity of the solutions, several samples
vere withdrawn from various levels of the hol-ding tank and viscomet-
3 ,I r~ cally compared. The results indicated• solution uniformity.
i>1 ~ .- j 5 - ~-,.• -i

1 8
3.2.2 Boiling Water Method
In-this technique, soluticons-were prepared iccord-ing tn itanufac-
tin-er's specifications (117) with so~me modifications. A slurry of aJ
* Piqhed amount of PEO (ý gramsý) in 40 nil. of anhydrous isopropyl alcohol
-Was fir't prepared. The slurry was stirred in a V.OO nil. stainless steel'
beaker using a three-bladed impaller positioned as shown in Figure 4. A -
prscibed quantity of boiling distilled water (594 grams) was then added
ininediately and, at one tfime. The mixture. was stirred- at 600 rpm. for one
-- minute. At this-poi'nt,-the- speed of-~agitation was reduced to 150 irpnir.
- ~and maintained fur ten-A:nutes or--until the mixture developed a. sufficient
--viscbsity-to exhibit the so-called Weissenberg O~r red-climbing) effect.--
- Finally, the speed was brought down-to 75 rpm.-and a dissolving time of-
nbout-one hour was found necessary to insure-complete solution. Approxi-
maey6060 i. of a 1% master solutions are prepared in this fashion.
These-,solutions were also-allowed 24 to 48 hour. opeio toisr oge-
313 Stress Decay and Viscosi.ty M.1easuremients in Concentrated Solutions
All- viscometric measurements obtained in this program-:were- made-
j with -a: Iaake. Rotating, Viscometer (Rotovi sco). The Rotovisco is a
Couette f-low type vis5cormeter (cup and bob syst-ew) with a circular gap
-between co-axia1. concentric cylindL-rs. The inner cylinder rotates
-while the outer one is stationary. -The arrpngemnent-of bob and cup is
shown i-n-Filjure 5. A recorder is incorporat.0d int'o the systeCM i.i order
-to study -the tfiez-daendant behavior us'f te visc_.=etric cilar-acteristics

- -jý-T- - 2- -~-----;7 -
9
7
-of PEO soluticns, I-Le. thta decay e'f-shear -stress (or viscosity) as-a
fifnctiok .6f -time at 6 constant shear rate.
Preliminary exper-irtents wei'e performed to establish the-range
of shear rates obtainable using the Roto"Iisco, the particular problem.
-being relAted:to the~ tenidency of these-concentrated solutions to be
cirawn -out -of the gap. because of their' vi.coelastic-character. It- was
-decided to etend- this range by eplbYihg the bob and cup combination
- lt te cupcmplebtely -fillIed- wiith fl ui-d ad c -ped(see Figure 5) in
-order to obtain sh ear rates -hilgh enough to zadequately-ill ustra~t.e stress,-
de6ay. Natur-illy. _thii change in geometry lea'ds -to, pos~sible errors in
K -. the form of e!ýd'-effects, flow field'perturbations, etc.,
- Kcheck with a -viscous,ý INewrtonian-itii id, glycerin, tindicated
'that the effect -using the MVI' system-was negqliqible up to3a shear rat?~eeof about '1370 seco' The results offthis -ex~periment are listed in
-ApediX- I -where thie viscosity of glycerin determined, with the atpparatus.
filled normally is tomoaredto -that with, the cup- cqmpI etel y -fi I Ied and
- capped. In addition, calculations (steeAppendix I)#sow possible end
*effects, to be no greater than, on the order-of 340 in the case of
-Newtonian fluids'.
These-determijiations cannot, on the other hand, be automaticallyv
assned, -to 'apply to the non-ttewtonian, viscoelastic fluids of primalry A
intekrest here. It has been show-n, for example, t,iat suppression of the
'Weissenberg efiecevby enclosing the sample k;_ads- to the devel pm..ent of
certain- secondary fiowis ('40), Such perturbations -to the- simple
- -

'10
Couette-flow essential to the interpretation of' the experimental data
in terms of fundamental -units could lead to unacceptable errors. In
order to shed further light upon the extent of the peoblem associated
with completely enclosing the sheared sample, a plexiglass model of -•
the RV cup was constructed' to allow direct visualization of the flew
fibl d- 4
The flow characteristics of the system where studied by suspend,-
irtg droplets 6f +the dye Rhddamine B at various locations throughout
the-system and photo0jraphitally observing the dispersion of the dye
--subsequent to-the start.of shearing. Some typical photographs illus-
trating the dye dispeision and the flow field are shown in Figure 6.
The primary feature noted is that within the annular gap between the4, outer stationary cylinder and the inner rotating cylinder the flowi is A;
essentially Couette-flow. This is effectively; illustrated by the dye
patterns visible in the Figure. There are, however, secondary flows
obser-ved which do-not-show* up in the photographs. Dye originally
Splaced above or below the bob is irnediately dram. into the gap when
T the bob is rotated. That this is not simply a starting transient is
confirmed by the occasional moven, ert of small stray bubbles into and
but of the gap during the entire course of the experiment. The signifi- -
- cance of these secondary flows:-especially wvith regard to their influ-
-ence upon the stress decay measurements will be discussed in Section 4;0.
_ - Each experiment was performed in the foloM.ing manner:
a. A solution-was prepareJ irr the v•,)rtex, mixer as previously
" -d-�scri~eJ..A
-T .~- ------ *..--'- --

y .-T --"M
.b. Each sample wis then sheared at a selected--rate..1 After
"some period of time, the applied shear rate-was reduced in
steps to the minimum rate yielding a measureable shear -
stress. Each sequence proceeded according to Table 1.
c. Each sequence was performed on a fresh (unsheare~d) sample
prepared in-the vortex mixer.
d. The initial rate runs were designed to provide-a quantita-
tive measure of the stress -decay characteristics- over a
'fairly wide range of shear rates.
e. The step sequence runs, most of-which were free of-stress
decay were included to illustrate -the influence of shear
"hisiory on apparent solution viscosity.
f. All runs w:ere conducted at 30.0%C + C.1°C.
The results of these experiments are discussed in detail in
Section 4.0.
The effect of shearing concentrated solutions on the friction.al
drag reducing characteristics of their subsequently diluted forms is
discussed in some detail in Section 5.0.
The concentrated solutions studied in this fashion were sheaved
i% •, tin the Rotovisco as described above. In this case, however, the temper- _J
ature range for all tests was 22.5 0C to 240C, depending upon room
temperature.
Sbear rates are estimated assuming Ne,,utonian-eair
4 . .su ~ u i~

--V 12
~4
-Tabl e 1
Applied Shear Rate Sequence-
'Sequence InitiaM1 ate Step Sequence RatesWRte (sec ) (sec)
"3 685,457,228,152,76,51,25,17,8
" * - 685 457,228,152,16,51,25,17,8
* 3 457 228,152,76,51,25,17,8
4 228 152,76,5125,17,8-
5 152 -76,51,25,17,8
-"- 6 .6 ,25,17,8 .
'7 5125,17s,-- - - 8. 25_ 17,
- 10 81•8•"
& 2 l7i
'9'

-13'
3.4-- TurbuIent Fldw Rhebmieter
The turbulent floit rheoineteti(TR) showin schematidally in
Figure 7, -was constructed for the study-of polýOer soluition, drag ieduc-~
:1ing and degradation characteri'stics-. -A photograph of the system isgven in-ue8. The main dimensions of the TFR are shovni in
Figure Sk. The apparatus :coflsistt of-a smrooth and-polished-disk madb-
of brass, rotating in a-closed Ixusing-of.10" I.D. and 64 idepth.-
wi th -a-volulme capiacity of 8- . liters of -sol utior~s. -the disk rotates
-ina-a plane..tyr~netica~l.y in tfhe: mi dleý-.-F:Ihtex-housi ng. Two disks
were used; -a-V 5"diAeigter disk'at 18'00 rpm.-' and' a 6" diameter disk at
1700 ~p1.,. ihf first diik- was -used for most of th6--tests, while the
sekond-disk -was used in the ltatter--part of the program t~b studyth
temperature effects onzthe dracure'duction and' degradation -character-
istics, -Corresponding Reynold~s nu blers w-.ere 9-.6 X 105 and 1.29 x 10⁶
-(based- on physical- Properties of water at 309C).
The:principal el~et6f~ this system is a Master Servodynelaboratory mixer- (supplied by- thd Cole-Parjier Irstrument Company).
The unit consists of motor-~and a control unit. The maximum torque
output of the unitL is 48 iinch-:ounce. The control unit is provided
with a visual torque indicator callbrated. in millivolt -output. -The
-unit has -the built-in capacity to 4eliver a variable torque equal to
-th demand rate- of the l'oad w..hi'Ie maintainfiig a preset speed-at a con-
A" stant leVel. The s, stem. includes a potentiometric recorder.>k

S14
-Themixer is mounted on a heavy-duty stand to reduce vibra-
tional interference. A mercury thermometer incorporated in the system
- is used" to detenmine solution temperature during each test. Solution -
temperature-is controlled by-circulating water in a jacket surround-
V ifig the closed test chamber-. The-temperature- of circulating water is
regulated by a constant te•mperature bath provided with a -themoregclator.
SThe innerhousing dontainin- the-test solution is madg ofbe0n•ze to
ensure good heat transfer characteristics. -.
- The experimental. procedure consited of setting the-disk into
b - motion at the required :Speed -(1700 rpm. foir the 6" diametef disk and-- -disk). Initially the- housing .containd-
*pure -distilled' water at a-pirticular -teeperature (300' 450, or 600C).
"As i'n the preparation of-master solutions,, distilled Water Was used
S :-for drag reduction tests, to eliminate the possibility, of chemieial
degradation occurring simultaneously with mechanical degradation.' As
4 the steady state was i-eathed (which-took 10 to 15 minutes), the torque
reading. -fd; distilled %...ater vas recorded. The desired polymer concel-l
tratirn was thefi obtained- by injecting the required ouantity of concen- -4
trated-tolutibn into the test chamber through-a fitting at the top of
""housing. The instantareous decrease in drag and the degradation of 3;
this effect was recorded for a period of time.
-The temperature for all tests was controlled to an accuracy of
+ 10C. After -each test the test zhawnber was emptied easily through a S
-drain-cock in the boltoni of tVe test chamber. The housitt Vas tVe-
[ '"

, . .. .. . . .. . . .... . . ..-.. . . ... ..... .
SI5 -
flushed twice with water to ensure complete removal of the polymer
"solution bef6re another test was made.
The effectiveness of Injecting master solutions into the test
"-.chamber wias evaluated-by conducting two identical tests with 100 wppm.
of: Polyox WSR-301. One cf the solutions was-made by injecting the
-master-solution :as described above.. The other- solution was prepared
-cutside in a polyethylene vessel: The drag reduction ahd degradation
-- chara-cteristicg of these two solutions were .found to be identical.
I T -Samples.-fof -the measurement of intrinsic viscosity (which 'is . .
described in Sec-ion 3.5)were withdratn thro~gh,.he injection -fitting. -
-*The -samples -were withdrawn from the TFR using a clean plastic syringe.
The: samples withdrawn represented a radially averaged-sample by virtue
"of the turbulent mixing. occurring in the rheoneter. On the average,
four to five samples w.re taken, each samnp, having -a volume of about
teninml.. Thus the total volume of samples taken out was less than: -
0.5% of the total vClume of the test solution (8.2 liters) in the test
chamber. Each time a-sample was taken out, it was replaced through
another syringe with an equal amount of-distilled water so that the
chambern.was completely filled at all times. This had a negligible
-effect on the solution concentration.
- I - 3.5 Characterization of Dilute Polymer Solutions
3.5.1 Viscometer
A Cannon-Fenske routine type capillary viscomater vas used to
measure ths viscosities of dilute ,,I silutions. The viscosities of -

16
the-dilute-polyymer solutions varied between 0.8 and 1.1 centipoise.
The- ASTI Standard' Methbd of Test (?2) recommends a size 50 viscometer
for viscosities ranging from.0.8 to 4 and, a-cordingly, a size 50
was used-for this study.The capillary viscOmeter was-immersed in a constant tempera- j
ture "Temp-Trol"f Viscosity- Bath. The bath was filled with Nujol
heavy mineral oil-. The temperature-was controlled with a thermo- §
ofgul£br, t which gave an accuracy of .025C. The'-ertical alignment -
S ... of the vfScometer w/as done by eye. £
A Hewle ,t-Packard Auto Visc6meter along with a photocell-lamp
L :- detector assembly was u~sed- to-automatically measure ef~flux times of
liquid-samples in the-capillary viscometer.. The times were recorded
with an accuracy of .01 second. The t.:o photocell detectors were
.- - installed-on t.he tU.o etched marks on the capillary. viscomreter. The
use :of photocells e. iminated-manual errors in measuring the flowI v
times .in the viscometer.. The, Autoviscometer also operated, a pneumatic
-pumpf which supplied a very small pressure for automatic influxing of
the sample. -After each measuremnent, the viscometer was imersed in a-,,
- solution- of technikal acetone ahd dried With dehumidified air before
the next-use. -
-- - 3.5.2 Capillary rnow Relations. - The. Hagen-Poiseuille law for laminar flO;i of Newtonian fluids'
-. -'' - -• in- a capillary is given by: .- - " -
Alt-
IT

177
U - -- 1
_3 8 QLwhere L capillary length
Q = volumeti ic flowt through the capillary
during time-t
R radius of -capillary
The pressure drop AP is due to the difference in the hydrostatic heads,
which-varies continuously as the test sample flows down. Therefore,
the mean logai.thmic:difference must bei usedL when the drop is comp:,ted
from^nthe hydrostatic heads. Thus:
-(2) n- A -1
(v2) 1A.h 2 pgn- 2hi
Since the flow rate of water is greater-thar, that of the poly-
mer solution for the same ,applied gravity driying head, a greater
proportionvaof this drvivhg"head is used up in accelerntigg the water
from rest .than in the case of pol]yer solutions. This necessitates
the.applicat.ion of "Kinetic energy correction".-For the liquid
sampli: tested the -Kinetic energy correction -was negligibie as Show'i: :. : -in, Appendix- XI.- -,.o
Equation - can then be written as:
II" (3)1 ~-=k
h2 VRsr where :. .h 2 n --: 'lIn hRg; .
A__
8QL

73
Ssince, measu~eients ,were made on dilute solutions the difference In
densities between water and polymer solutions was stall enough to
-ignore. The relative-viscosity, nr,.s from (3);
r ti*.- s ts.
%where subscripts p and s are for polymer solution:and water,
.respectively."
3.5.3 Intrit.sic Viscosity and M.lol.ecular tlei.jht Relat-io.s
The- viscosity method -of molecular -weight determination-y'as
- chosen becaused it, is the simIlest of ail the-methods available. The
pargmeter used to measure the viscosi.ty effect- of •. polymer is the
Intrinsic Viscosity, defined-as::(•) : ; : = i•. n_ (D)' n s__15 li --n
-" - " D -1-0 G S =: -
C - 0 -
*wherer n (D) = polymer solution viscosity at shear rate -
ns = -so.•ent. viscosity at the tame temperature
C = -concitatration of solute (gm./dl.)
D = shear rat& for viscosity.measurement in<. (Sec.-')
' Sinbe -the. conc~ntrat, on..is usually expressed, in gm./dl -..,n3has the P.'
-,unitts Ofdl./-.
j -• Th- intrinsic viscosity is taken a5 -a measure of -the- hydro-
dynamic, in•fluence of -the dissolva d pol-Smar . mol ecul es on the flow of- - _
I - - - --

-7, "Ilk
19
Tit-so'lvent. It represents the foirce-necessary- to dr~ag-the mnolecul e
-through the~soiventj and-hence-ithe larger 'the molecule, the hi~gher
"the intrinsic viscosity.
Pate-rson (16)' states "the ljmit of zero shear rat should be
-takdn to eliminate the effect of shear rate on the deformatihn andorientation of thq random coil since -this -deformation and orlenta-
-tion -chalnges the solution- viscosity.-. HIe fbund -~ "teong sheaf; -rate
- depende'iice of' viscosity- of dilutePEO' solutions 'at very low shear
- rates (less, than- 100-Sec. 1I)- Vai'ous, i nve-stigators have expressede
different opinions -on: the subject- of shear depelidence of viscosity ofA
-dilute'PEO solutions. Avail-able renorts cofifli'ct with one anothe'r.
Fabula (7-)-observed shear dependence for V S-361 only above coptvlfrta-ý-
tosof 5100 -wppm. using a part-icular viscometer utith an appro~imate :wall shear-rate -range of 130 to 1250 Sec.-'. However Using a different
type of viscometer, w-hich gave 'ouch lower shear rates, he foand thattheintrin~ icst increeased. Virk (27) observed the sheafý
-- independence of vitcosity -for,500 wppmn. of VWSR-301, in the-shear rate
rane6f 1-00Sc .The availabli. instrument capabilitie,_ were
- limited. and -the phenomenon of shear dependence at very low shear
rates-could not be established. The approximate shear rate Wa-S
i- 116-Sc>t a show*jn in Appendix 111.
-Paterson 4(16)- also stateis '-hat an- extrapolation to zero- -concen-
j btration is-not-required -to find [j3if measuftments of the- reduced
IT,~-

- 20
Eviscosity.. are made-at sufficidiently- loaw-concentrati-ons.
4 small correction i~s applied-for the fact that the measurements aremade atsmall-u finite-concentrations. The corrected-and uncorrected
values-of intrins-tc yis~cotity are related by the relation (16):
(6) ~100 (] Wct] =40qtri3,
whieEnj uncorrected intrinsic aic sit decie
- P~c =corrected -intrinsic viscosity-
Reduced'viscosi.ty-values in-this sftuoy have'be~en correcteddsdsrbd
above, the extrapolation to'iero-cohcentration no aigben ade
-HoWeve-r. 'because -of tht.: potsibl'- shear rate dependence of vi'scosity-of
dilute PE6 solueians at very,- iotw1s!he-r rates, ýthe values obtained fof
W* -redUced; viszosity-n~y not be reliable.
Flory (8) show-s -that linear- polymers obey an intrinsic vi sc6sij-y-ý
-miol ecul a r- wei ght relation ofll.he form: V
Where N is the molecular weight of the solute and K afid a are constants t
for a-.giVen polyme.r-solvent syst~ni at a given temperature. If- the poly-
mier is heterogeneous, i.e., a-wide spectrum ef inolecul-ar weight distr-i-
buonex*s-ts, tthen an, average -molecular weight should 'be substituted-
for, M-in tte abbVe equatioli. By--definit~ion,-this- is the viscosity
average mol ecular .wei ght denoted by 71v-. the ilithod of 1-igh scattering
(24) ulives the wei ght average, molecular areight flq; vhich car be relatbd
to th-e intvins c viscosilty by -h elation:

X-7:
21
In 7he- above' wnqatjnn K and a would be different from the values in
"equation (7). The results of Shin (23) and. Bailey (4) for Po'lyox in• •" distilled water arr:
(9) = 1.03 x 10"•4W N078 (Shin, at 25%c)1.2 X10- ý%.0 78
(10) , 1.25 x iO" .0 (Bailey, at 300C)
The constant found by Shin is thus slightly lower than the value
'obtained by Bailey. As different commercial, unfractionated samples
of Polyox were used by the two investigators, the difference in
Constant, K, may be due to the different molecular weight distribu-
tions. Shin's relation was used in .his study.
Paterson (16) shows experimentally that Shin's relation is
also valid for degraded solutions. The samples in this study were
taken directly from the TFR for molecular weight measurements. Inthis respect this study is similar to Paterson's work except that his
system involved pipe flow instead of disk flow. This procedure of -'
I taking the sample directly out of the rheometer permitted the study
of the process of polymer degradation in the turbulent flow and its
effect on drag reduction.
IT -I
- -

'F22
4 ! ', X ORIFICE METER
SPOWDER FUNNEL
PU'IP.P1
TO DISTILLEDWATER SUPPLY
\ -MANNOMETER
VORTEX MIXER
HOLDING TAN1K '
I _ _ - _ _ _ _ _ _ _ BAL A NC E -4
FIGURE I
VORTEX MIXER ASSE..MBLY
l• ,.• •i't

aw-RIV' 1- 7- 7.
23.
Re
Fi gure 2Vortex Mixer
A

'24
-~~ POLYNE!R PONDER
DI ST 1 ILED --I
VIATJ-
PRTEPA311J) WASTEIR OJT N-
- }IGUfl1' 3
VORTEX ',IXBI~i UNlTI

r -a
I, :
g-
I•
I
m RPLE- KIi

-� � � -
'.�-�-- - - �-�----�----.- --------------
-
26 K
K
� .1 *4-
.4 - 4.
* -- 4
P.
I,
I--
4.- �- ..... ''*1- . ."- .�. _____________
-iT6 1.4L�m.
�: '4�- K I . .
�1
I AIR GAl'
*...... .;.
........................................
....................................
I - :-f-.... � .. .:s&r7%.�;1;
*
I..-. I ...
-II.
___ ____'P
__________-
* -I42 iun,
- � .. �
-4'.-
A
it

27
IAI
Figure 6
Fl-v . u; Of
i• F0ow Vi stiali-zation
Reproduce-l from,.bestavailabe .copy.j
Jr-
A
j

- ~28~
DISKI
•- MOTOR VIBRATION
SSTAND
UNIT-
,"- .. DISK
•. . - THERMOSTATED TEST CHAM\•BER
S-.CONTROL..- RECORDER )
FIGURE 7 .1
"TUR•3UL=.NT FLO"W RHEONTER
C"J

29
Fi gure 8Turbulent Flow Rheorneter
R ~odu~cd frombest' available ýcopy.
I1

A~Ax-
co-1
- -I
0 -
4.1
E-4 HIL E- u : -
2E- X4
0 E-4

"" 4.0, Rheology of -Concentrate. Solutions.
°*-4-1- -Gneral.
R-_heoldgical data have- been obitained over very wide ranges of shear
stress and shear-rate for-high polymers. -Typical flow curves for
various ideal rheological- bodies exhibitiing no yield stress are presented
"in Figure. 10. -Line A- rep&esents the Newtonian fluid for which the
viscosity is constant,, independent of shedr rate. For many polymeric
matqrials,. the'-relationship between shear stress an' shear rate can be
rep resented- by a "powe.r 'law" of the, form
)I "
- over a wide range_ of shear-stresses. and shear rates, where T " the
shear stress in dynes/cm2 , D is the shear rate in sec", K is a constant,I,,and n is a constant less than, unity. Such a relationship is depicted
by curve B, and a fluid exhibiting this -behavior is called pseudoplastic
or-shear-thinning. For a few. fluids, n is greater than unity (curve C).
I - These fluids are termed dilatant or shear-thickening. For a Newtonian
j •lid, of course, n is unity and K is the ordinary Newtonian vi.'cosity-.
SIThe apparent viscosity, w~hich is the ratio of' the total shearing stress
to tot4l shear rate at a given rate of shear is exemplified by the dotted
line show_9 on Figure 10. -ience, for a case in which Equation ( 1 )
anplies, the apparentt viscosity-- n , may be written
r- I • Kn-1 "2 IS(2) ,"D
•' I - - °

ii 32,
The curves A,-B.:aA. dC of Figure WO refer to steady-stateeffects
and are considered independent of time. However, many polymeric fluids
exhibit timi-dependent fibW effects that :can be either-reversible or-
irreversible. Materials whose flow effects are reversible are said to
.exhibit thixotropy-. -The apparent, vtsdosity of a thixotropic f'luid
i.- :decreases with time 'from an initial value, -n , to-a finai limiting value'$-
Flow curyes such as those depicted in Figure 1O'-can be constructed
-from the dependence of either ro or -. -s a -function -of shear rate.
Figur'e 11 (a) (26, -35) shows a recorder trace:of stress ,decay at,
constant::rate of shear obtained on a pseudoplastic emulsi6n "n a rotational
3viscometer. Figure 11 (b)1 reveals that the shear stress-time retlatior-
ship-is a-logarithmic one, This logarithmic stress -decay'behavior
represents a first order decay rate and is quite conionly observed in
Jthixotropic fluids :(26) Figure 12 (26', 35) shows the variation with
shear rate of the apparent viscosities correslonding to zero time-and to
infinite time of shearing for the same system depicted 'in Figure 11.
In general, the apparent viscosity of a. thixotropic substance is
I reduced from no to -n in some variable amount of time. The characteristic
reversibility .of thixotropic substances is manifested by the complete
recovery of the apparent viscosity from -n back to no after -omne other,
- unspecified, period of time. Subsequent shearing reproduces the identical
result with no hysteresis. In the example cited above and depicted in! I'Figures 11 and 12, theýapparent viscosity is -reduced from %= to ;o in-
several seconds, while about 8 hours wtere needed.-for complete recovery.
>1 - -
-33
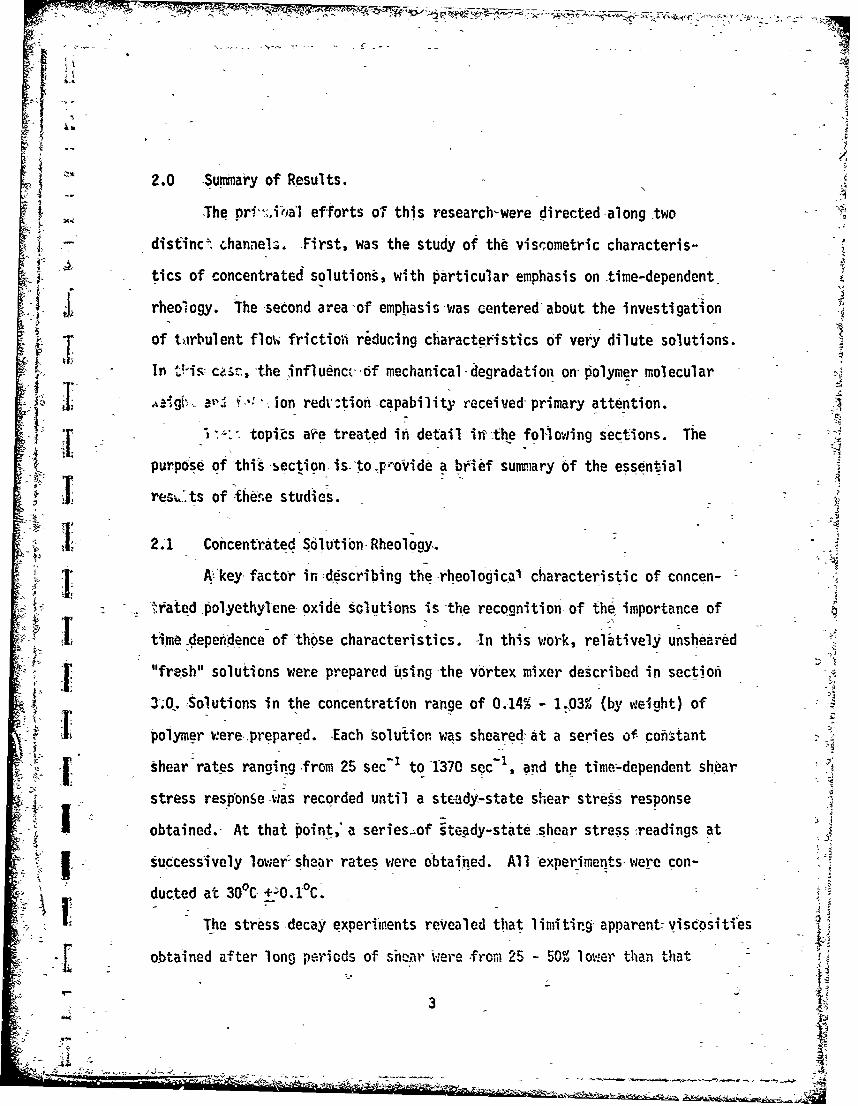
On-a microscopic orenoleeuiar level, orientation of molecular chains,
•:aswell As disengagement and reformatio6 of molecular entanglements
_pla-y an important role in pseudoplastic flow. Thixotropy undoubtedly
i nvolves similar phenomena as well as the rupture of Weak-secondary bonds
(such- as -hydrogen bonds) between molecules. Furthermore, the combik. ,tion
,of these events is such as to require a~finite time. This effect must of
Snecessity be a highly complex one, since the number, distribution,-and
relative-strenýth of these bonds must vary throughout the fluid. Thn
existence of a lifmfting viscosity, -n. , can be taken to imply that at aI• given rate of shear, there exists an appreciable number- " tuch bonds
- (and other-configurational barriers tW further stress decaY) .,hose
sfrength jis eual to or great.er than the applied steady-state stress.
T .- 2Thixofeopy. jis-ffreqUently discussed in the literature, aid techniques
have been developed. t. p~ovide a semi-quantifative description of thixo-
- tropic changes (36). Irreversible time-dependent effects, however, are71 -- -ý
A - infrequently treated. The irreversible decrease in.viscosity noted in -•
some polymer fluids subjected to high shear environments is usually - -
associate1 with chain scission- (4, 37 ). -On the 6'ther hand, viscosity
61Iso drops as a result of disentanglement and the reversibility of the
entanglerient-dse entanglement process is by no means established (37, 38).
It has been pointed 6ut .(39) that there is no obvious cause for reentangle-
ment at rest, 1.o-be as. marked as in the polymerization process, 6r as
SI severe as disertanglement-under-shear.
Elastic behavior of some r'oly-uier flj'ds is also the cause of a
number of time-depende.it effects. A viscoelastic fluid is on~e which -•
[ possesses a .certain elastic character in addition to its usmal viscous
-W$

7 F"734
properties. The well-knownf tendency for viscoelastic jiuids to flow in a
- direction. normal to the direction• of shear stress--the Weissenberg Effect--'
Ai is an example of such- behavior due -to the creatidn of normal stresses
within the fluid. Another example occurs when a viscoelastic material
enters a capillary.. Eliatic stresses develop as the fluid converges at .
the inlet which relax aS the fluid flows through the capillary.. The
magnitude of the stresses and the rel3xation time depends upon -the fluid 21
T - and the geometry-of the capillary. Stress relaxation phenomena in general
occur when-a viscoelasttic substance i. suddenly- brought to a given
T deformation.. The stress:required to maintain this deformation decreases
I with-time. 'The microscopic factors listed abpv6 can also-be used tc
explain, qualitatively, the viscoedastic behavior of polymer fluids.1 Thus, 'vscometric data represent the joint- contrbutipn of several
~eftects,,amiong which must be included those which are manifested by the
time-dependehcf of these data. The above discussion has been limited to -
several specffic rheological phenomena. In the next section, the concen-
T trated solution rheology- of polyethylene oxide WSR-301 is discussed in
the light of these phenomena.
1 4.2 Rheology of Concentrated PEO Solutions
1P. Interest in the viscous characteristics of aqueous solutions of the
-: -; homologous series :of polyethylene oxide polymers has been~high for many
years. Bailey and his tcorkws (28), reported rheoqraýs for PEC WSR-30
L i- I. A diagram illustrating the shear stress response in a sample as a _4function of shear rate is sometimes called a rheolgram,.
fr 4 4
SI ?0

35
water solutions up to about 3% (by weight) polymer over a range of shear
rates from 0.001 to-about 10,000 sec&1. Rodriguez and Goettler (32, 33)
- -. obtained data up to about 15,200 sec 1 for PEO WSR-35, -205, -301, and
"Coagulant" water solutions a's high as 10% (by weight) polymer. They
used their data to test a r.imber of models for pseudoplastic flow and
to develop a two-par'e.meter m-idel yi.lding a good fit to the data over
five decades of shear rate. Hoyt and Fabula (14)reported rheograms for
PEO (MV. 4xW0) in water over a low shear rate range (0.1 -10 sec-l
0 -0.1% polymer), and a high shear rate range (10,000 -1,000,000 sec
0 -0.01% polymer).
In addition, various workers (4, 5, 10, .6, 28, 29, 30, 34) have noted
the influence of mechanical agitation or. the viscous characteristics of
contrated PEO s~ltions. Primarily it is noted that measured viscosity
levels are str(,ngl J :pendent upon the mode of solution preparation and
that the viscosity ot a solution can be altered by stirring, pumping,
and other forms of agitation. It is also well known that fresh, unstirred
samples cf concentrated PEO solutions exhibit the classical characteristics
"of highly viscoelastic fluids such as rod climbing, elastic recovery, die
swell, etc. Furthermore, these are observed to decrease as a result of
I • continued agitation of th? soiution. These observations introduce anoth.r
more complex element into the rheological characterization of concentrated
solutions. Thus, although the non-,1Newtonian (shear thinning or pseudo-
plastic) behavior seemis to be fairly thorougl-ly documented as noted above
the tif;,e-depeudent and viscoelastic flow characteristics implied by the
apparent influence of mechanical agitation on solution viscosity an;, visco-
. •]elastic propertiý-s has only beet, quallitatively noted. i
4, 4 "J.

36
It is -clear, therefore, that a complete rheological characterization
of concentrateL PEO solutions must include a thorough delineation of
these time-dependent effects. It is also important to note that the
quantitative pseudoplastic flow properties alluded to above probably
represent the steady-state limiting viscometric data--a fact which is
not explicitly established in the references cited. In addition, it
must be recognized that even such limiting viscometric data could be
influenced by the shear history experienced by the solution during the
preparation and handling procedures prior to the viscometric measurements.
This is particularly true if the. shear environment during preparation and
handling is more severe than that in which the viscometric measurements
are conducted. This last factor will be discussed in some detail later.
In thý follow.ing sections, the results of the research conducted
during this program directed towards the resulution of these questions
-V and the delineation of the concentrated solution rheological character-
istics of PEO are presented.
4.2.1 St-ress Decay Character-istics of Concentrated PEO Solutions
- A detailed description of the instrumental techniques and experimental
"procedures utilized in this study oF the stress decay characteristics of
concentrated PEO solutions h-as been provided in Section 3. In suilimary, the
purpose of these experiments v.as to develop a description of the concentrated
aqueous solution rheology of PEO U'SR--301 with particular attention to time-
dependent effects.
The first point which must be firmly established in any such analysis
"- * is the significance of time "zetVo". Clearly, if the rheological propertiesV-
4

37
change with time under shear, then any such shearing during preparation or
handling may alter the rheological state of the fluid. Under these circum-
stances, a sample undergoing a stress-decay experiment nossesses a "solu-
tion history", and the state of the fluid at the initiation of the experi-
ment is some (unknown) function of that history. Because of this uncertainty,
all solutions used ini stress decay experiments were prepared by the vortex
mixer method also described in Section 3. This method provides for the
4 , rapid dispersion and dissolution of polymer powder with a minimum of
mechanical agitation. Of all the prepe ation techniques described in the
literature, the vortex mixer methodt probably comes the closest to yielding
a final produ':t solution which can L'e considered "unsheared". Therefore,
Sthe stress decay properties reported in this section are considered to be
characteristic of previously unsheared solutions.
The bulk of the stress decay experiments were conducted in to sequences.
In the first sequence, stress decay measurem•ents were wade on PEO solutions
TJ at concentrations of 0.24%, 0.36%, 0.41%, 0.637., 0.91%, and 0.941 (by weight)
of polymer over a shear rate range of 1370 sec- down to as low as 25 sec. 1
All solutions in this sequence were prepared with Union Carbide PEO powder
lot WSR-1006-A-O1. The results of these measttre.ments are depicted in
I Figures 13 through 18 as the decay of shear stress as a function of time
under shear. As indicated in these figures, selected runs w-ere allowed to
proceed until an apparent steady-state shear stress resprise had beer.
achieved. Because of the considerable time Yequired, rmst runs were termi--
nated at some interm~ediate time. The second sequence of stress docay
1. Unless otiio••wise sr2cified, the she-er rates reperted -?e dat.Eriined onthe basis C.' thc ":-"t.ni-. as,- ticn. z , are, -....... 1• y, .. I=.• ,::•- .l ~e'~t,
I•

38
experiments were conducted with solutions of 0.14%, 0.41%, 0.70%, and 1.03%
"(by weight) of polymer over the shear rate range of 1370 sec" down to 152
sec" using Union Carbide PEO powder WSR-1227-A-01. These stress decay
measurements are shown in Figures 19 through 22. In the second sequence,
all runs were permitted to continue until a steady-state shear stress
response was obtained. In each case, temperature was controlled to 300C +
0.1 0 C, All of these stress decay curves show only the "smoothed" data.
Examples of actual stress decay curves for some typical runs will be dis-
cussed presently. Data tables for these figures are provided in Appendix IV.
Qualitatively, the stress decay curves are observed to display some
conmnon characteristics. Each curve is characterized by the attainment of
a certain stress level followed by a more or less steadily decreasing
stress response. A distinct maximum is observed in some of the curves.
These are particularly noted at higher concentrations and lower shear rates.
Compare, for exan , Figure 13 (0.24%) and Figure 17 (0.91%). The maximum
is rnot observed at lower concentrations and higher shear rates. The
typical behavior of a viscoelastic fluid subjected to the instantaneous
imposition o a rotational shearing flow is depicted qualitatively in
Figure 23. Probably, in those cases in which the maximum disappears, it
is simply shifted so close to time t : 0 that it is obscured by the instru-
- -mental time constant.
* Figure 24 represents a composite of actual recorder output obtained
during stress decay experiments on samples of PEO WSR-301 (WSR-1006-A-01)
"solutions consisting of 0.63% (by weihnt) of polymer. These curves illus-
trate a varying degree of fluctuation superimposed on the stress-tine
relationship. The rrtnitule of th'_ -Niucjuýýions increases with shear rate.

39
The obvious necessity to explain the significance of these fluctuations
lead to the flow visualization experiments outlined in Section 3.0. The
Important characteristics of the fluctuations are that:
"a. They always appear in the initial ztress decay measurements on A
fresh solutions.
b. They do not disappear if the solution is aged by "standing".
c. They are not observed in the steady-state stress response
evidenced after the stress decay has ceased.
d. They are not observed when solutions which have been sheared at
some high for some time are then sheared at a lower rate.
The flow visualization studies have shown that:
a. The flow in the viscometer is essentially Couette-flow.
b. A secondary flow is observed in which a slow movement of fluid
t.o and out of the gap occurs.
c. These secondary flows do not diminish with time.
"It w-ould appear that the fluctuations are caused by the secondary
flows which continuously feed solution into the viscomicter gap. Any such
solution placed into the gap would not be expected to generate the same
shear stress response as the ellement of fluid being replaced, since their
shear histories would probably be different. The fluctuation would, there-
fore, be expected to continue until a steady-state shear stress level had
been reached by all the fluid in the viscometer.
"This explanation is a plausable one. Except for an uncertainty in
"the readings (especially near time zero), the fluctuations cause no parti-
cular difficulty in fpllowing the course of the over-all stress decay
curve.
~-~< ~- -

S- t L... . ;•.T I•, • - .L ''•• • • • q' - • -.... ~i
40
The stress decay curves Shown in Figures 13 through 22 effectively
depict the marked change from the initial shear stress response to that
exhibited in the steady-state after long periods of shear at some steady
rate. This can also be illustrated in terms of apparent viscosity.
Table 1 lists the apparent viscosities and n. based 3n the Newtonian
shear rate D and Equation (2)U for the stress decay seqtence on lot nun-
ber WSR-1227-A-01. The shear stresses at t = 0 are obtained from the
data by extrapolation (see the data tables in Appendix IV). The limit-
ing apparent viscosity is obtained from the steady-state shear stress
achieved after long periods of shear at the corresponding constant shear
rate. Table 2 lists only no for the corresponding sequence for lot number
WSR-1006-A-01 since most of these runs were terminated prior to attain-
ment of the steady-state shear stress response. It is striking to note
that percent reductions in apparent viscosity (% nR) of up to 50% were
observed.
At this juncture it is useful to digress briefly to discuss some
general guidelines for the evaluation of these results. A complete
quantitative interpretation would be composed of several elements:
"a, Initial apparent viscosity or shear stress rsponse.
An indicated above, n and to are, by definition, repre-
"sentative of the initial (t = 0) response of the previously
unsheared solution. As such, therefore, they are independent
of ':solution history" (there being none at t = 0), and depend
SVan Wazer (26) points out that this should be more properly termed the"apparent", apparent viscosity since the shear rate used in Equalation (2)is itself obtained by assuminng iewtonin, flo::.
I . .. - i '# . i - = " 'i • "- " - -- -

41
CV) C) c
0 CL an co co
cc w Oa CO
Vz it4 0 0; 0
in 11c 44* ý
4.)0 #- L In. 9-O f~
w C~ L 0 '2 C') CV) 12-
4.3
C) C-- V. m LO01 0 .ýL 8C
CDr- 9-4 Cl) %
5- cn-0JL r- 2'. c?) CV) co
.t4J t t al U
1- 0a
0.. 00 (' C') (V) C
r_ CV) U n C'LOU
ej CO .4 U U
C~c C') c-.. U)V-4 V-C) it) L U O ( 0 4
4.)
C'-') f~ 4') (0 (0 s4
L) U - .r% O 4 941
Cj
U)

f - 42
= u.An
0 C'i 0 fo. L r 4 m 'to C) c i ciCf J
Cc. - --
0 ~ 0C * to Li if ) .
Euc 0 04J C, 3)
.0 -f
V)c) .l-4 0 D V-if., Z, 0f al
S. 44 0 i C.$ ' -I 0 1to) oý t O CV) LOfl V
o -
4-74
jil C': ;o£~ra M

k. 43
only upon solution concentration and shear rate.
b. Limiting apparent viscosity or shear stress response.
The limiting values must be treated somewhat more cautiously.
If the limit.in9 values at a specific shear rate are defined as
those values toward Ahich n and T tend while the fluid is being
sheared at that same rate (the case described by the stress
decay curves), then no ambiguities arise, and n and T dependL . only on concentration and shear rate. On the other hand, a
fluid cani be expected to encounter a vai-'ety of shear rateb
during its handling and processing. It is of significance to
inquire into the influence of these encounters on the limiting
values at a particular shear rate.
c. Stress decay
Stress decay leads to a decrease of apparent viscosity from
its initial value n0 to its limiting value n.. Quantitatively,
therefore, stress decay can be described as a rate process and
is completely spec; ied only when the instantaneous shear stress
is knoa:n as a function of time, as vrell as concentration and
shear rate. Again, howvever, such an analysis is strictly appli-
cable only in those case! for which the shearýrate is mainta'hied
at some constant value. Shearing a solutiop, for some period of
time at a given rate and then changing to a different rate pre-
sents an entirely different problem. The stress decay at the
second rate is subject to the influence of th. "solution history"
imposed b-,, the pzior shýaring, at the initial rate.

- 44
d. Quality control.One important parameter has been thus far omitted from
.consideratiop. This can best be described as quality control.
tMore specifically, factors such as reproducability of measure- Iments, aging effects, and polymer lot variations must be evalu-
ated. This last factor is particularly rompelling in view of 1the dispersion in molecular weight distribution reported by -
the manufacturer in the PEO WSR series, and significant varia-
tions in properties for different lots of the same WSR grade
(see for example reference 16).
It is convenient at this point to consider those factors described
in paragraph d., above. It is obVious that any quantitative interpreta-
tion of stress decay data cannot be made independently of a satisfactory
demonstration of their reproducability. Figures 25 through 29 portray
several- examples of multiple runs which were conducted to test the
reproducability of these results (see also te data tables in Appendix IV).
i hese runs %.,ere made at various shear rates. Repeated runs were made on
a "same day" basis and 24 hours subsequent to the initial runs. No signifi-
cant differences due to aging effects are noted, and the runs seem to be
reproducable to better than Rbout +5%. Figure 25 also illustrates one
example of a number of tests wvhich w.ere conducted to demonstrate the in-
herent irreversibility of the st.ress decay process. In this example, the
run described was suspended after 75 minutes. The sample uas then allo..,ed -
to rest undisturbed for 17.5 honr. No recovery w.as noted when the shear-A
ing was resumed. Addi~tional test5 showed that concentrated iolutino;1s

45
stabilized with isopropyl alcohol could be safely stored for various
periods while awaiting tests' without any significant viscosity loss.
taken in the preparation, handling, and storage of concentrated solutions
to eliminate possible external causes of degradation.
-The final factor in paragraph d. which remains to be evaluated is
the influence of batch variations on the experimental parameters. In ..
this case, experience and tie conclusions of other workers (16, for
example) did not give cause for optimism. Significant lot-to-lot varia-" tions in the PEO !SR series have been repeatedly demonstrated. Whether
this is a direct result of some inherent factoi" in the manufacturing
process or is due to a lack of quality control, it is not knot-n. It is
"sufficient to note that broad differences are found. These differences
are illustrated in the case of this program by Figure 30, wher"e stress A
decay curves for lots (WSR-1006-A-01) cand ((WSR-1227-A-01) are compared
at a ccmmon concentration (0.41%) and two different shear rates (1370 sec&i
and 228 sec- 1). These differences are charactdristic of those encountered
at all leve'ssof comparison of the twio lots. 2
One other possible contribution to the existence of apparent batch
variations stems from the occurrence of degradation of the polymier powder
"itself. Several opportunities %,ere available to check on this possibility
during the course of the program. Figure 31 describes a portion of the
I Sume tests occured up to one week after preparation. See also Section5.6 describing static storage tests on dilutf.e solutions. -9
2 The exception is T, the study of turbulent flm-: rt" c"characlu~ristics of eilutr- solutio:'-s w ra.-z!trdiSviere Td.note. hee stuJles cor•duct).i iti dis. rio.J th a kaynolesnumber of abvut 106.

46
stress decay curves for three separate cases: (WSR-1006-A-01, 0.84%, powder
stored 8 months), (WSR-0OO6-A-01, 0.63%, fresh powder), and (WSR-1006-A-01,
0.91%, fresh powder). Powder used prior to the manufacturer's recommended
expiration date is classified as fresh powder. The decreased effectiveness
of the powder after eight mofiths storage is noted. Although the mechanism
by which this degradation has proceeded is uncertain, it is of interest to
note that several tests were conducted of the influence of long term storage
of concen•.,ated solutions on the-friction reducing capability of their sub-
sequently diluted forms. These tests are described in more detail in the
following section. Briefly, however,-they revealed that the concentrated
solutions stabilized with 0.5% isopropyl alcohol exhibited no discernible
decrease in friction reduciny cappbility after 8 months storage.
It seems reasonable to expect degradation of the polzymer to proceed
more rapidly in solution than in the dry powder state. According to the
observed results, however, the slow degradation process was effectively
sopped by the addition of an oxidation retardant. Presumably, therefore,
* • some deleterious residue of the manufacturing process remains in the pow.der
leading to lorg term degradation.
The ramifications of these facts are clear. The determination andcomparison of physical properties of PEO so'lutions on the basis of manu-
facturer's grade specifications is not, in general, valid. These grade
specifications purpoi't to describe the average molecular weight of the pro-
duct. No estimate of the batch-to-batch distribution of zctual molecular
weights about this average is given by the .anufacturer. Yet, these are
just the factors tupon 'b:hich ccrparisons betw:een samples must bc --.de. It
- A

-47
is important to know, as accurately as possible, th6 molecular weight
distribution of any sample b.ing investigated.
"!ntrinsic viscosity represents one measure of the average molecular
weight of a polymer in solution. Efforts made in this program to obtain
an approximate value of the intrinsic viscosity of the PEO solutions
½ - studied are discussed in Section 3.0 and 5.0. These results indicated
that intrinsic viscosity (or average molecular weight) is simply riot a
sensitive enough indicator of the molecular weight distribution to correl-
ate friction reduction-data. No effort was made to apply it to the present
problem of comparing concentrated solution properties. Sohle conmments and
suggestions for additional efforts along these lines are included in
Section 6.0.
The results of the present program, therefore, are applicable (on a
quantitative basis) only to the specific lot numbers tested Extrapola-
tions to include ,.-ISR-301 samples in general must be madc cautiously anr
with a full understanding of the inherent dangers.
The complex m6lesular factors which play a role in stress decay
have already been described. A number of quantitative examples of actual
stress decay processes in concentrated solutions have been presented. It
is now appropriate, in the light of the comments which have just been made,
to formulate an interpretbtion of these results in terms of the fundamental
processes involved.
- S.
I!

48
Itehas already been pointed out that stress decay in thixotropic
substances is often observed to exhibit a logarithmic stress-time rela-
tionship of the form
(3) In (T - .)=- A t B
where T is the instantaneous shear stress at time t, ' -is the limiting
shear stress, and A and B are constants. This type of relationship is °4
.often encountered in the literature dealing with rate processes, parti-
cularly in the field of chemical kinetics. In the coimonly used termi-
nology, the time-rate of change of a property C can be writter. as
"(4) dC k CN
where k is a rate constant whose units depend upon the constant N.
Comparing (3) and (4), it can be seen that (3) can be written in differ-
ential form as
i (•) -d•-•L _AG( - :ctA
fro-m which it can be seen that N-= 1, and B is the constant of integra-
tion when proceeding frc.i (5) to (3). Since the form of equation (4)
which corresponds to the stress decay process requires that N = 1 the
process is termed first order.
There exists c3nsiderable evidence to suggest that stress decayin viscoelastic fluids such as concentrated PEO solutions might wel be
described by a relationsh;p of the for~n (3). In treating viscoelastic
behavior, it is conmmon practice to use mechanical niodeis. The simplest
mechanical model of a system exhibiting both viscous and elastic charac-Iteristics i.s the !4ax.:ell rmodel in which thp elastic conpc,'ont';s Elre
73 _

49
represented by a Hookean spring in series with a Newtonian dashpot
representing the viscous components. For such a simple mechanical
system, the strains are additive and the stress on the spring is equal
to that on the das,.,ot. Hence, for the Maxwell model for shear,
(6) d+ 1 dT
where a is the strain, nl, is the coefficient of viscosity and 00 is the
elastic modulus.
nh the present study, the strain rate, is kept constant at D
for time greater than zero, hence
"(7) d -r G +- -d t TIM
letting X = x, and integrating,* GR
dT _I
f f dt
(8) In (T - G Dx) - + c
where c is a constant oV integration. The boundary conditions v:hich must
be met by (8) are
"T(t 0) 0
Hence,-, -Gt•D = 0 :
(10) G. =Ox
and(11) "c In (7 " C.{.) In (: )
'' ii
I

50
Inserting (10) 5nd (11) into (8),
(12)int +n (nT0 T
which has the same form as (3). Rearranging,
(13) ln (0 -0 u
According to (13), X has the form of a time constant and can be
obtained by plotting the dimensionless term In(-o- • ) as a function of
t. If the model is appropriate to the case under consideration, a
straight line will result whose slope is X. The coefficients G and ni
foliow immediately from the definition of X and (10).
Unfortunately, few polymeric systems can be represented by a
single relaxation time, because of the complexity of the molecular struc-
ture. For this reason, a generalized Maxwell model involving a spectrum
of Maxwell elements in parallel is used. The equation for this model is
suggested by the exponential form of (13). That is,
S"t/xI -t/X2(14) D = G1e + G2 e
If a constant strain rate results in the appearance of a steady-state
stress response after a long priod of time (as is the case here), then
one of the relaxation tim.es is equal to infinity and (14) should be written
St/ 1 -t/
(15) D 1e + 2Ge
AdWitiornal refine,'.ents to the treatment, such as the assumption of a
continuous spectrum of relaxation times, are possible. Furthermore, numerous
"other models Pnd app-roaches have been Postulated,
-. - ------------ ~ - - -

51
The analysis of the stress decay characteristics of the concentrated
PEO solutinns examined in this program in terms of clear-cut models of the
type just described is complicated by several factors. First, because of
the complex nature of the physical processes involved, it is not likely
that a single time constan, t will suffice to explain the data. On the other
hand, an analysis of the type implied by equation (14) vherein the data are
simply forced to fit by the inclusion of a sufficient number of terms,
tends to obscure the physical interpretation of the relaxation times. In
addition, such an analysis requires a fairly high degree of 'rescision in
the data. Unfortunately, it will be recalled, the fluctuations noted in
the stress decay curves result in some uncertainty in the magnitudes of the
stress levels at short times. :n addition, since the fluctuations presum-
ably result from a slow secondary circulation of fluid, there tends to be
a distortion of the time scale (at long times) from that which would be
expected if no circulation occurred.
As an example, the stress decay characteristics previously depicted
in Figure 21 for a 0.7% solution are sho':-n again in Figure 32. In this
case, however, the function (T - T) is plotted logarithmically as a func-
tion of time for shear rates of 1370, 685, 957, and 2Z8 sec"1 If the
IMaxweil model wereapplicable, these data would fall in a straight line,
and a single relaxation time-wrould suffice to describe the stress decay
process at each shear rate. That this is not the case is clear from the
Figure. Although they are not shown, similar plots of stress de.zay in the
other solutions studied fail to follow the Miaxwell model.
-47

52
Any further effort to analyze these data in terms of more complex
models will not be attempted here. The anomalies present in the data,
especially at long -times, are evident in Figure 32. These are charac- 4teristic of the data for the other concentration studied and result from
the factors alluded to above.
4.2.2 Step Sequence Experiments.
The operations involved in the concentrated solution viscosity
measurements aredescribed in Section 3.0. It w~ill be recalled that each
stress decay experiment w'as followed imiediately by a stepping-down, in
sequence (according to Table 1 in Section 3.0), of the shear rate. Thus,
"the stress-decay experiment provides a solution with a well defined solu-
tion history whose instantaneous apparent viscosity (or shear stress) isdetermined as a function of shear rate by the subsequent sequence. Figure
33 represents a composite of actual recorder output illustrating the
relationship of the step sequence runs to the corresponding stress decay
experiments. The essential characteristics of these curves has already
been discussed.
The limiting viscosities obtained at the end of each stress decay
experiment are given in Tables 3 through 5. In each case, the shear rate
at the head of each column represents a stress decay experiment. The
limiting values • and -r appear irmiediately below. The following sequence
of numbers in each column represents the limiting viscosities obtained in
the corresponding step sequence. The shear rates at which the stress dccay
runs were made vary by as much as a factor of 8 (10 for the !.03% solution).
The cor;esp-indin .... n-':ce li:,i i,,' ,isositis ,c& surrrisin-iy

S.. . .. ...-- -- --= , : •• -- ,• ~ • .• •- •' • ' '• '
53
Table 3
Step Sequence Limiting Viscosities(WSR-1227-A-01)
1.03%
Stress DecayShear Rtte 1370 685 457 228 152
"(sec-) In1(CP) 38.5 51 58 89.5 110
n=(avn)nm-- 526.5 348.3 264.2 203.9 167
Step SequencdShear Rate
(sec' )
1370 38.5685 52 51.5
457 57.5 61 59228 83.6 85.8 80.5 85
152 101.5 105 97 108 10476 142 146 134 146 146 143
51 180 180 167.5 180 177 17725 256 268 244 244 246 252
16 311 320 284 311 302 306
8.5 439 475 402 438 421 435

54
Table 4Step Sequence Limiting Viscosities
(WSR-1227-A-01)0.7%
Stress Decay 1Shear R4te 1370 685 457 228
(sec') "n=(cp) 18.7 25.3 30.2 42.5
dynes • (avg)256.5 173.0 137.5 97.3 Tcp)
Step Sequence.Shear Rate
(sec") I1370 18.7
685 22.7 24
457 26.5 29.4 28.7228 35.2 39.6 40.6 39.5
152 42.7 47.2 49.2 51.3 47.6
76 55 62 65 67 62
51 67 76 79 82 76
25 92 11 107 99 102
16 106 135 120 135 128
8.5 110 146 136 164 139
- tI
I

S,. 55
Tabl e5
Step Se uence Limiting Viscosities
(MR-1227-A-01)0.41%
Stress Decay"Shear Riate 1370 685 457 228
(sec-_)-n.(cp) 10.7 12,1 13.8 18." (
-dynes) (cpCm 146 83.5 63.4 42.5
Step Sequence'- *Shear Rfte
.(sec-)
1370 10.7
685 11.8 11.9457 13.2 13.2 13.4
228 16.9 17.0 15.8 17.2
"" 152 17.3 16.3 16.0 20.3 17.576 22.6 22.4 22.4 25.4 23.4
Sr " 51 25.7 27.3 28.8 30.7 28.125 30.9 30.9 30.9 35.5 32.1
i--
I

56
unaffected by these differences. There appear to be several exceptions
to this "rule", especially fir the 0.7% solution, but, they occur primarily
- - at the l,;,.er shear rates, where it is expected that errors would be greatest.
A tentative conclusion, therefore, is that at least within the range
of shear rates and concentrations studied, the limiting viscosities measured
at each shear rate are independent of the shear rate at which the stress de-
"cay is imposed. Although these results cannot be considered conclusive, it
is termDting to speculate upon their meaning in terms of an explanation of
-- the molecular mechanisms involved in the stress decay process. In particular,
"they i;ould appear to rule out any extensive molecular scission as a major
contributor to the stress decay. Sur-ely, of all the possible molecular pro-
-- cesses taking place during stress decay (disentanglement, molecular orienta-
tion, molecular scission, etc.) scission, which involves the definable
"- "energy:of activation" necessary to break bonds, would be expected to be
Sstrongly dependent upon the rate of mechanical energy input to the fluid.
SStudies of the effect of stress decay in concentrated solutions on the
friction reducing ability of corresponding diluted soluticn are described
- in the next section. Friction reduction was found to be virtually indepen-
dent of the concentrated solution history. Friction reduction is a rough
measure of molecular weight, being primarily affected by the longer chain
molecules in the molecular weight distribution. Since these longer mole-
cules should be even more susceptible to mechanical degradation, these
studies confirm the findings of this section.
One additional interesting characteristic of the limiting viscosity-
shear r~tc relationship is illustrated -n Figure 34 whero the limiting
Ii

. iC,
viscosities from Tables 3, 4, and 5 are plotted versus shear rate on log-
log coordinates. The resulting straight lines verify the power-law be-
havlor of PEO solutions over a wide range of shear rates and concentra-
tions. The applicable power law relations are, from Figure 34,
For 1.03% PEO: r 12.2D0 5 1 (8.5 -1370 sec 1 )
For 0.70% PEO: A.00.55 (16 - 1370 sec1)
For 0.41% PEO: t = 0.83D0 71 (25 - 1370 sec")
Additional confirmation of the power-law relation is detailed in
Appendix V, where some preliminary data obtained during the early part of
the program is sunrnarized.
m -a.' -

Figure 10Flow Curves for Various Ideal Rheological Bodies
A
Ln
/ CLI)
0
Rate of Shear
Ij"4- -. - - A

I'I59
Figure 11Thixotropy in a Pseudoplastic Emulsion of Soaps
and High Polymers in Gasoline at 250C (26,35)(a);.
"Rate of shear 211 sc.' I
S500
0 02 0.4 0.6 (is 1.0 12rune in Sec.
(b)
6D00
45000
?4000~
1~000 -
3{
S02 0. 0. 0.8
Una te scfse ar 21 c
aJ
C!-0i

:k .. 60
Figure 12Variation of Initial and Final Apparent Viscosities
at 280C of the Thixotropic System of Figure 11 1t2W
IDD I
. 70 "3S
V 20
""7O -, __
"•• •4 i " IT I I i 'V
4I
: "10 20 40 70 100 200 400) 7C0 ICIC0
+ +- +-Rate of O•e.r in sec.-l
• +

11 61
C)J
C.,l
i4-)
V. r-4
(nn
S- w-4-,
dil
So Vc3 t v,.lU0

62
0 0
CY) t%% co n aniLC
M %0 41 ijK 0 000
0 "
0.
00
0
'-"4ý 0C0
EnE
43- Ln 0
LD 0.00 2rClC
0 ~jElo
0 CD~-

63
u ci ci
0 0ý LO I'. cocw r- O 04 anc n
asO
tn to
CU)
cci
SI-
CA)
0 EJ
0 0 ~W0

64
~v-4
"M 2
W-4
4-4 CU)~0 ULi
* ~ ~ C 1 s1r0C~
1. 1>
00 oci)
0 13
03**- 10
Ci )
-pl0 000
o '3 0'ls is

65
+1 1 Lo 'u 'ou k'uw~ &Ln Lf n r" 11 o cm
0 0
C~) CLf 4O'A
1>3
CL 1
0 00
w-4~ 0
0 C00C
0p o
O3 b ICI Cy C) C- C C> C
C0 C) C) C mC C>0toC 1 CO 4
"I/Swý S:N t 0<-ill

66
0 u
o .. 4 co C14 %
co Lo Wn IA n f- IO40
~0 0C~
a:o
C>
C> 0 V-4
00
CC))
v1 0- C) 0
ai 0)
LL.f W
0 00cn.
0
cl 0 C-,
<3 n C C> C0
C> C C)
1'- i) ~.' C'*

67
CDI
a 4
(a InIn In<
z 0lr.:, ~
tnn
LO
I Is-XiiP
-0 '_ *r

I ,..68
o ,O
+1
(V)
100
It W- Wt C...C~'D 3C3 Lf) c0
r*ý coCY)U)0i
C' W) Cl
Q., U)0
0)0
4-4-3
L-00o) C3
3.C C 0I~

69
0 i GiC> ) 0
o0 C)).
0- 0
r-,(%Cý Co
£0 i
II 4
03 LAI- m.4 0 9*-0
-4 __ ____ ____
0 0 0
o 0 0Co
ssJjn

70 -
-GI jU) E)
co C')i
w' -4) lC
9- - -4
C) 0) iCY) 1--oI#
(Y.f 4) U)_3 t:ic ~
IIt>
000
C')C)
r11))
L C)l
s s .;o

71
-A
Figure 23Viscoelastic Phenomena in Rotational Sheariao Flows
"(a)
VAShear ARate . .$.
I_,t= 0
Ti me
(b)
"Overshoot"
Shear lHich Shear RateS . . S t r e s s
•---------Low Shear Rat2
t=0
Tinge
- y:- ,;4;-- '"4- - s'-

I ~ r
Ai N.. .
A`..
I-7.7
. ..... ---- - - - .. .. ..- -
. 1.1...
--------.. ...... I

72<-.' • -l' .' i'. ,"- .o ,..-
-A
i 72
.v
• ; : , ,. , . . , 3
* I I I . 31'I " . 3 .+"I . ._ • ,
•I, .";~ ." • I- : :--. .I .... ,+ " I: ' I -1 - . ! :. 2; -i +t +
: ,- .,--.• - - -- -- . . fl. -1. . . ,
_ _ _ _ _ _ _ _ _ _ i ,. ;- .. i . . .- ' "i!"-
S.....- -- --".- - -- ----- -. -_-'_-
" : . ... .1 I .- .:
I•• /! .,., .'3,X 9";:/ Y •... . ,.• .."" , I " , . • :•; " -
9 . " -'• t " " . 9 :. ; . 3.-" ". . ... . .. . " -- .. .. .9''.••, , -• V . . . .. +o _ u+
• -. +". . ... . + . . . . •- - <.'.- • ; .. .
o *-..--" • , --: . _t % 3. " ~ -'- I.. . .. . .,•- _ ; . . . -+. l _ _ • - _ _
___"__...... . . .-*! " . .. .. V...iu e 4 -. .i-! -. : : ... -, --. - . + . . . . i ., . . . • ., -; . , --
.3 ,........ . .
I -+
, 4 * - . - I* sc,~J
/N-1q
-+ + , . `•'+• +• - - `4• +: +`:+`•`` ``•`• +•``+`•+`+.....++ ..3 .... , .. ., . .. .o W?+;+. . . . ..• :

73A.A
J
41
CV) U) 3-r4-
C)
03 C) P I
C2 a)4 C~ian~ ~ %- > 4
4-- Cn
to0 C)~ 0
~fl S. C)LC -
U.V 4
C-, 0
-~ 0 -
ssn-.Il. le-mi

C)r
40
0) C) 00C
a) a.)to*r S0 C>
C% I 4 l
U') aI
S- 4- Ln )
sit LL.4-b
*V-
CLCC
L) 0)
+ 1U0 tX')Cr) Ln:ý4100
II aI
C)' CD
C)__C_0 0

75
ci 'pr
'-44
u~ r_
~CC)0)0 CD +1
01 V01 r_,
r-. 0.30
CJ
LIC)
00
C)
00~
C)-C0C)
. I
(Zul--Ilsatlk0 Usjs p

76
Iv/
LO
C0 go 0CV) r- -C
* 4-)
VI) r- c'U
3.' +
0) C
N. 4-3
4-' -
0 :i r-I0) L)
L.- 4?I
-otC
:13
0 CCD
-I I

77
.I00
It 4 + +
0 - CD
o4 cm 4J -.. ~S.c~ alCIO
4- I + I-
LL. -r--
0 C)-
S- l:n
0 OD <1
C11~
V.!l)swX)s:.lý ucq.
00a

78
400D Figure 30400 -Comparison of Stress' Decay
0 in Different Polymer Lotsof WSR-301
0000 T =300C + O.1°C
WSR-1227-A-OIl
0 1370 sec
0 A 228 sec"
WSR-1006-A-016 0 1370 sec-
JUL;A 228 sec"
. 200 '
! ASdi
10
i ~~~~Ti•-- ,.,''.
• - 0
I -,

79
Figure 31Effect of Polymer Powder Ape
on Concentrated Solution Viscosity
T = 300C + 0-1 0 C
D = 457 sec"
lot V1sR.-1.OOE-A-01
500 • 0.91%, fresh powder
0 C) 0.63.7, fresh powder
00.84f, powder stored0 8 mionths I
0000407 0 C O 0
Li
S300 L"- AA"-
200 "--•
El•BE ' • •[: ][ 0: 3;
100-
_____-_ ' 210 20 30
Tir-e mirales
fi

80
00
0 O
u 0
CV) C . LlO Cfl) 0000 c(Y tDu gnuC~
03C
Cv)
-0 0
=J..
W 0 Op A
o r. a I
4-0 4-'
tlt S- .4.
-r U4.)Li. cC
(Dt
(D 0
:11A
Cl( .w~!~:i~. 44) C.

-iGF • - - 4*,, 'I -
, ,.. . .. "w... .. , ..
,-. - -. ,-Y
. . .- :t•-
' " , - - .. , : , - -. " . - --
* *,* *-'q,• •.•: ' . .. . . .I --CP'.- " C *. -C *C .. . C ** " . "-.._." ,,, ... t "ip:I- ",...' ; -- -!o£.. • _ , ' . .• ; I .2 ', ' • , •. "4• •_ _ _ _ 7 : .. . -. .- ' . _._,-. _ . ..._ . ..... ; .
-2
. .. - . _. ._.1v,.. . . .:i; . t l .. I Ti . • \ i : " ! "t • -''' i " " ' " " ' "*:•-"' ' 2. ,. :\ .. 2 , . . ... . .
- ...- ,. -. . - -- - :- - -. ,i . .I -, --. - - ,,i -- -- : : .. . . . . - - _ _.1
! i . . . . . . .... -,•!. .. ;
_.---- " " " " " i. i, . -. 'CI i *' . . ...,, - -.• , , , , , . -. .r , Ao..,.1 . ..¶ . . , , , o•.. .!tI I•, % .j • '. . ,.
" .2: ": ' • l - .-- " - - - --I - , - - '- :•
-- '.•+1*A ~ ~ . I
___ 'I_5 _____ __ 1

81
. . . .. . . .. . .
:_. _ _ _.. -. ... . . . ..- .,.. . ;: . :• , i'- !. ----, i.v' -'v. _ -• - *-
d : . .-- ' . . -.. . . .. t. . . . . " " v w• •
• .:_; " . ., . ,, : .j\\" "V p.1 •'.' '¢ }Ar./P J '
-... . ... . - , "-,\.
S.. . . . - :.. -. .. . • - . . .. . - , , -s,
.wy.-
Z.. . = 7 - --. I - . '.6. - . . .• .4'- ! :- . - . "* : j" :. ; •. 4 .
• * ' " '" 4
+ - ,.. . . . .. . . - ® 1 . ... I . . . .
' •• " • 1. • ® -1 .
''. ? I. ... .. ),
4 . . . :.. .. . _ __; • : I , ..-
.•,4
S. . -- ". -•_ -- ' i- ii i i -..- i i I 1

82
C)
0-0
V-4 0i
C L) CV)u
c 14
4-. -j -j
0 L0
C) C.) 1 0L . CCk,/

5.0 Frictional Drag Reduction in. Dilute PEO Solutions
5.1 Introduction
5.1.1 Preliminary Remarks
For the past seven or eight years, the field
of Fluid Mechanics of dilute solutions of long chain
polymers has received much attention. This interest
was primarily motivated by a phenomenon generally known
as the Toms effect, which is manifested by the reduction
of wall friction in turbulent flow when very small
amounts of high molecular-weight polymers are present
in the flowing solvent. Toms (25) Jn 1948, in what has
become a landmark paper, showed for the first time the
beneficial effects of long-chain polymers added to
turbulent fluid flows. It is because of his work that
the term "Toms phenomenon" has been apnlied to this
! drag reduction effect.
The additives which exhibit the Toms effect
have 105 or more monomer units. They are highly flex-
"� ible, lit:ear molecular chains. Of all the additives
that change the characteristics of turbulent flow in
a solvent, random-coiling polymers are the most
- .t-e -- -•-s -- h-., 5 1 -
irD;.2s•i ." es 3uk~,; . "•.t.8..

84
produced per unit weigkt of additive. The dissolved
polymer molecules are said to be "randomly coiled",
because the molecular chain has a random walk config-
expanded ball-like shapes containing mostly entrained
solvent. Solutions are considered to be "dilute" when
the spatial- separation of polymer molecules dots not
permit direct physical interaction.
5.1.2 Theories of Drag Reduction
A subject of great academic interest has been
the search for an explanation of the drag reduction
phenomenon. A number of theoretical explanations
have been offered for the effect. Two comprehensive
reviews of the theories were made by Fabula (7) and
Hoyt (13). Here only a summary based on their works
is presented.
The first research was directed towards the
field of non-Newtonian shear-thinning fluids. Up to
that time the efforts of most researchers were directed
towards comparatively high polya.-r concentrations---in
the range of 2000 to 6000 weight parts per million'-I ; JL.Le.ghCat e mil ion
(wppm.). in thd s range of concent rations, the polymer >
4o

- -85
and behave as power-law fluids. A power-law fluid is
one in which the stress-shear rate relation can be
represented by the equation:
+() •=udy
where K1 and n are constants. Merrill'and Shaver (22)
made an attempt to relate friction factor-Reynolds
number data by means of th', above constants K1 and n.
However at very low concentrations of 10 to 100 wppm.,
the constants K1 and n were found to be basically the
same as for water, while the drag reduction phenomenon
persisted. Thus the hypothesis basing the drag redu!c-
tion on non-Newtonian pseudo-plasticity failed to
explain the Tons phenomenon,
According to another theory, viscoelastic prop-
erties of polymers modify the turbulent flow charac-
teristics. These dilute polymer solutions curtail
frictional drag by hindering the onset of turbulence
and by damping turbulence when it does occur. While
viscoelastic properties are quite evident in thick
solutions, dilute solutions often seem to show no
measureable viscoelstic ef.ect. Brennen and Gadd (5)
showed that fresh solutions of polyethylene oxide
(PEO) did c nrm.:a ,t÷ss c"'i ...... d b;!: this
S....... - ... • ... £ t thi

86
vanished with time, while the drag reduction remained
ur..hanged. Thu: the relation between Viscoelasticity
and drag reduction is doubtful.
Accr'Adng to a different theory, it was postu-
lated that poiymer molecules adsorb on to the flow
system boundaries. This adsorbed layer was thought to
. lower the viscosity near the wall and suppress turbulence
pulsations (6). However this concept is in conflict
with the observed contentration-drag reduction effects
noted with polymer solutions. Also it cannot explain
the observed phenomenon of drag reduction by particles
and fibres.
Shin (23) discussed the mechanism of "anisotropic
viscosity" to explain drag reduction. He stated that
polymer molecules in a turbulent flow field will be
elongated in the direction of shear. It was postulatece
that the viscosity perpendicular to the axis of elonga-
tion would be very large, while the viscosity in the
direction of elongation would be essentially the same
as that of flowing solvent. This locally anisotropic
viscosit-, it was suggested, would tend to dampen the
turbulent fluctuations.
In another: recent exten;isve wo Virk (27)
.. . . 'l ~ '~- ,----.,~- - ~ - -- ~ - -

87
found that the phenomenon of friction reduction was
associated with a "ttnreshold" or critical wall shear
stress or wall shear rate, below which the drag reduction
would not occur.
Evidence also has been presented to indicate that
perhaps the friction reduction phenomenon may be caused
by more than one mechanism. Gada (9) noted that all
polymers might not reduce friction in the same manner.
Thus agreement as to thc mechanism responsible for the
Toras phenomenon has yet t:, be achieved.
5.1.3 Polymef. Degradation
Degradation of dilute jxlymzr solutions, or the
breaking of polymer linkages to 'orm lower molecular
weight components, is a problem which invariably occurs
in flow of polymer solutions at high shear stresses.
PEO is perhaps. the most susceptible of all the drag
reducing polymers to degraoation. In addition to
mechanical degradation (nmolecular scission) caused by
shear field, PEO, in both aqueous and organic solution,
has a tendency to degrade on long-term aging; i.e. the
solution viscosity deBzeases. Prennen and Gadd (5)
found that aged PEO lost viscosity slcightly, but the
S" -1 ,-c." ......L.. (1 ,) .

88
FtPEO was very susceptible to oxidizing agentb, apparently
i. forming hydroperoxides which subsequently decompose with
consequent.chain scission. In the presence of oxidizing
substances, solutions of PEO rapidly decrea,.e in viscos-
ity. McGary also found tap water, due to its chlorine
and metallic salts gave lower initial viscosities and
pooerlong-term stabilities than distilled water
I stored in glass containers. Shin (23) found that HO
4 was subjected to bacteriological degradation which could
be eliminated by a small amount of formaldehyde. Ultra-
- violet light also causes marked degradation in terms of, viscosity loss, but this can be partially eliminated by
the addition of certain alcohols.
It seems certain that :hemical, biological and
photo-sensitivity probleims of long-te .torage of
solutions of friction reducing polymers such as PEO
can be solved with reasonable attention to the dilute
solution chemistry involved. However the major mechanical
degradation effect resulting in polymer-chain scission,
can be attacked only by specifying the raximura permiss-
I able shear stress in a particular flow; geoir.etry.
-'. Another recent field of investigation (whi-:hI represents an imrportant part of this progr.-e) is
coh:cer•n..c ".' i2: h_-, U " " ."t &:: •-- '½c, c:,ccentr-.-- t

solutions on the drag reduction effectiveness of sub-
sequently diluted forms. Thick PEO solutions show time-
dependent rheological behavior. The apparent viscosity
of fresh, initially unstirred solutions decreases with
time of shearing at constant shear rate. Asbeck and
Baxter (3) state that degradation of the polymer to one
of lower molecular weight occurs under these conditions.
This is because viscosity provides a means of measuring
molecular weight. However, Gawler (10) notes that the
mechanical shearing of thick solutions does produce
appreciable change in solution viscosity but does not
result in significant molecular scission (provided
constancy of drag reduction is taken to signify preser-•�: vation of molecular weight).
5.1.4 Enclosed Disk Flow;
The external flow of fluids on rotating disks
becomes turbulent at Reynolds numbers greater than
3 x 10⁵. The Reynolds number for disk flow is defined
as
-(2) Re w aR2
V
where
= angular velocity of disk
? A
ý- --- s-I

90
R disk radius
V Kinematic viscosity of fluid
Von Karman (20) showed theoretically that4 the turbulent
flow resisting moment on both sides of a rotating disk
in a Newtonian fluid can be represented by
where
Cm, Dimensionless moment coe-ff1icient
P Fluid density
He also found that-Cm _- 0.146 (n0Y0 2 (turbulent)
Giles (12), in his analytical work on the rotating
disk in a drag reducing non-Newtonian fluid, gave the -
following relation for the Moment coefficient:
whe~re Cm ndiae th oqenbt sides of the
-1 Velocity profiles
dedcedfrom pipe flow pressure drop data. His expression
has eeneffective in predicting disk friction in drag
reducing fluids to within about-8% of the available
experimental data. This smiall discrepancy could possibly
be due to end losses in the test disk arrantic :.ent. This
work is particularly interesting in thiat it shows that
disk and pipe flo-ws are mutually cormpatible throughi
~r~iI on 1.inir~icfl7il ciri e55nr:V.c fric on
- - -i~ - - ---- - -AU_-

91
relationships.
Most of the experimeatal work on the turbulent
disk flow of drag-reducing fluids was done by Hoyt and
X: Fabula (14) and Gilbert and Ripken (11). Whereas the
former study was concerned with drag reducing effective-
ness of various polymers, the latter involved the study
o of boundary layer -near the edge of the disk.
Measurement of driving torque provides a sensi-
-tive means of evalu~ating the frictional drag reduction
relative to Water. This-it so because most of the torque
is devdleped near the outer disk edge and torque reduction
oessentialy equivalent to friction reduction. The
percent drag: r-duction in the present study is defined
as
(5) %f100 (To--T
where
To Torque at the surface of the disk with
4 solvent (distilled water)
ST -Torque with dilute PEO solution
- 5.1.5 05jectives of the Present Investigation
As already indicated, PEO is highly 8usceptible
to mechanical dexra'dation. The main objective of the
MA

r!~92
research herein described was to study the dependence
of mechanical degradation of dilute aqueous PEO solutions
on the solution concentration, polymer molecular weight
and the solution temperature. In addition an effort was
made to investigate the effect of shearing thick PEO
solutions on the drag reduction effectiveness and sub-
sequent mechanical degradation of the subsequently
diluted forms. I
"5.2 Effect of Shearing Thick Solutions on Drag Reduction
'Effectiveness and Mechanical Degradation
Because of their high viscosity and visco-
elasticity, hahdling of thick polymer solutions causes-
problems in piping, pumps, and flow meters, Thick
"pollmer solutions also exhibit the so called Weissenberg
"effect, which seriously affects the performance of
centrifugal pumps. Handling and transfer of thick
polymer solutions becomes much easier with viscosity
reducti-on.
The objective of this series of tests was to
determine if the viscosities of thick polymer solutions
could be appreciably reduced without affecting the
friction reducing ability of dilute solutions made from
them.
2 42
N P!Uur•.•. 25•':•u-.,... •./•.• : -.:'c t~h-:-- .. ,'-• u s -

93
experiments performed to study the effect of shearing
concentrated solutions (0.44% - 1%) of PE0 in laminar
flow, on the drag reduction and subsequent mechanical
degradation of very dilute solutions (12-50 wppm.)
made from those -imples of concentrated solutions. The
Polyox samples tested were W'SR-301, Coagulant, and
WSR-205. The thick solutions were sheared in the
"Rotovisco" Previously described. Ftgure repre-sents
the viscosity degradation of six concentrated solutions.
The :-apparenth" shear rate for all viscosity degradation
-tests-was 1370(Sec.Y 1'. The range of shear stress was
-2_ 5-1350 dynes/cm . The tem~perature was not- controlled.
Hown~ever, the temipetature range for all tests was 22.5*C
to- 24*C, depending upon room teimperature.Figures 36. thog 1 wto different sets of
data representing initial drag reduction and mechanical
degradation of di"lute solutions prepared from sheared
and unsheared master solutions. In-these graphs percent
drag reduction is plotted against time. It is evident
from-these figures that the degradation characteristics
are eszentoiJally -identical for these two runs. It can be
seen from Figure 42, which represents the rela ti~onship
between p:2rcenL- friction reluc tier. and concent ration of
t Zn;rus'ls e

94
solutions, that the two sets of points fall on the same
curve* right down to very low concentrations.
These results indicate that the shearing of
concentrated solutions does not cause any measurable
change in drag reduction effectiveness and subsequent
mechanical degradation in PEO solutions. This implies
that there is no degradation of molecular weight of the
polymer. 0fowever, the viscosi-y is reduced considerably
by shearing the concentrated solutions, as shown in
Figure o This implies that the viscosity reduction is
largely due to a microscopic disentanglement and order-.
_2• ing of polymer chains and the rupture of relatively
weak inter-chain hydrogen bonds, rather than actual
molecular scission (provided constancy of initial
drag reduction and similar degradation characteristics
are taken to signify preservation of molecular weight).
These results also suggest that PEO molecules are not
fragi-le and are not readily broken in the range of
shear rates, shear stresses and concentrations involved
in the present study.
The above mentioned conclusions are in conflict
with a proposal by Asbeck and Baxter (3), who contend
that a decrease in solution viscosity represents a
IMP . -T.
I

95
results are in agreement with the results obtained by
Gawler (10). He showed that a reduction inv viscosity
(caused, in his case, by pumping the concentrated solu-
tions using a positive displacement rotary pump)-was
not necessarily accompanied by a decrease in drag rieduc-
tion erfectiveness in turbulent pipe flow.
5.3 Mechanicz! Degradation of Dilute Solutions of PED in a
Turbulent Field
5.3.1 Theoretical Background
It has been known for sometime that longe-chain
molecitles can be brokcen mechanically, both in solutionl
=and in the bulk nhase; The details of-the mechanism by
which degradation or molecular scissicn of long-chain
polyrnurs occuxrs are unkniown. Solutions of PE0 can be
degraded by the addition of certain substances to the
solution, by beating, and by subjecting the solution to
high shear fields. A qualitative model of degradation
can be obtained by attributing to the main chain bonds
a certain activation energy which, if exceeded, re:sults
i~n primary valence bond rupture. The addition. of cer-
tain subst-ances can lower this activation energy-and
heating can incre:,se the B3rownian motion energy of the
solvent. Both of these e.f1fects contr,-ibute to thz:
e - -5-r-'c szr
M_=7-

fields produce molecular stresses in the main chain which j
strain the bond. The bond will rupture in a sufficiently'
strong shear fie'd.
Under these conditions, not only is a quantitative
treatment of the hydrudynamic problem difficult, but 1"additional complications may enter, such as local intense
adiabatic heating due to cavitation. Such effects create
the possibility of chain scission by a thermal mechanism.
Apart from difficulties of this nature, a quantitative
discussion of the problem is primarily limited by the
absence of an adequate theory of non-Newtonian flow
under conditions of high shear and, frequently, as well, jby uncertainties in the rheology of the apparatus used.
Consequently, in spite of-the relatively abundant litera-
ture on hydrodynamic shear degradation, the process is
not well understood.
An attempt was made by Paterson (16) to queLi-
tatively treat the turbulent shear degradation of PEO
solutions. He assumed that the degradation proceeds
according to the first order irreversible reactior"
.A -). B +C
Where A is the initial riolecular weight and species B
and C are the two products of the molecular scission.
!e fu&r:thr as ,u.-e-c th:- tit .the LUtura Into two e" a-
__..__.. _.- •u n.o t-o q a l

97 g7
sized -'rts would be the most probable scission and that
)e- probability would decrease as the two parts become
less equal in size. Another d~astic simplification was
made by stating that the simplest model of degradation
is a "two-group" model, where the distributir- of molec-
ular weight at time, t=o, is assumed to consist of two
imolecular wei.ght srscies, one with half the molecular
i .aght of the other. He further assumed (which seems
to be verified by his experimental results) that degrada-
tion preferentially attacks the highest molecular weight
species present in the spectrum and the lower molecular
species do not degrade.
According to this model one would expect the rate
of degradation to increase with increased shear rate,
"molecule size, and solvent viscosity, but be independent
of concentration (for very dilute solutions interparticle
effects should be negligible). The above model is
-expected to approxim:_te the actual situation for very
short times when the molecular weight change is dominated
by the destruction of the high molecular weight species.
For later times the second specles (with lower molecular
weight) would dominate since the higher component would
have been destroyed. A state of "stable plateau of
residual , is reacc-•T "nr ..... ,-. -nd

98
Io
the low molecular weight species left in the system are
Shighly resistant to the existing shear field .
Paterson's model is verified, at least quali-I!tatively, in the present study (described in the next
section) in that the rate of degradation (in terms of
reduced viscosity) is very fast in the first few minutes,
then drops down to a low rate. and finally approaches
zero. No further attempt was made to compare theory and
experiment in a more quantit;itive manner since the theory
is so simplified compared to the actual experimental con-
-ditions.
5.3.2 Experi,.sntal Results
The results of turbulent shear degradation tests
appear in Figures 43 through 52. As mentioned previously,
the tests were conducted with a 5"' diameter disk atIJa constant speed setting of 1800 rpm. and 30°C (correspond-
Reynolds number ="9.6 X 10⁵).
Figures 43 through 45 show the effect of concen-
tration on initial drag reduction for three grades of
polymers. Figure 46 is the combined representation of
the abo-ve three figures. The flat shape of the curve
for each of the three different molecular weight polymers
-agrees with the results of Hoyt and Fabula (14), who
worked *i•}b -. • ,-' - 1-" " a ... - i ', •.% ;i
'I

II 99
010 oju V
A 0 0 64
.c *u 0'4
V -A -I000 10 Lr ifS .0 >3$i
E- re.___0
4)4H m '-" '14'1
r-4
< > U
E40 4 I0
0c~cm>4'
0 r 0
40-) 0A0l
rZ NP Nn cm
0 0 0

1 3 00 tD 0
ri 0 S4
.1:000 r
U M' 0 43
U C 0) (o C_ %D .-4 (
U> 4 J N H
H-) rtO =0 f_4 t C;
~~ri
C04
* H t-t Uo C; in n
- ) 0 _.1C M.in 0' 0io .
z n NI 0 0' C% 0
H' Cj 7 ~
M' (v C14 N
Q 0'0
Ou 0 0l CV)
A -; O' C; 0 C
X-1 4 0 OD* 0 C
u4~1 N c4 (4 N H H44 -r --r_
S4flu. LA 0 0 0 0
o rl 0)

471 a Wu to 0 in
ra tO S0 '01n
> M
0 0Ir
H4 .r4 r4 -
E-4 0 C41 G% CY
V.' 0
*~~~r m ~ U h 03 .
0: M
>0r4 0'. g q
E- 4 01 111 0NCN
H 0- el N 0' vO '
<0
H~ ~ ( ci: to tl l N 0
C4 C; .c:C 11o co C;0.-
1144>4n
HO * u-I ' C- ~ jto

101
~ul tflt0CA4~-44 > All to 0
ri4
0 A 00
-% 10 4L CD
*>U4
ra 0 ul
E-4~ £Q too
01Q
U t-t '4 0O 0 0UD
..4 AD cu ..w
ti c
-0L4 Z5. C'

102
_PEO solutions. lHowever, the similarity of the three flat
curves, except-for very low concentrations, as seen in
Figure 46, indicates that the extent of initial drag
reduction is essentially independent of the molecular
weight of the polymer, for-a certain Reynolds number and
for this particular flow geometry. This behavior for
disk flow does not. agree with pipe flow or circular
Couette flow. In those cases drag reduction increases
with polymer-molecular weight, other conditions being
e~qua*
Figure 47 demonstrates the relative resistance to
shear degradation of 2, 50, 100 and 200 wppm. solutions
of VSR-301. Figures 48Band 49 show the similar concen-
tration effects on the magnitude of shear aegradation for
WSR-205 and Coagulant. The 2 wppm. case for all
thiree polymerz indicates an immediate and rapid degrada-
tion effect. As the concentration is increased, the
degrada-1tion rate is lowered. This can be explained on -
the basis that a 100 wppm. solution has more polymer
than does a SO wppm. solution. These tests indicate
that tha drag increases gradually and would reach an
asymptote of residual benefits after a sufficiently long
time. This can also be s¢•en fron Tables I, I1 and III.
"_ I"A In S ES

103
aspect of PEO solutions in that many degraded molecules
can produce a drag-reduction which is comparable to
drag reduction obtainable from lower concentrations
lesser degraded molecules. For instance, in Table III,
the 200 wppm. solution after six hours-of shearing still
has the drag reducing capability of a 100 wppm. solution
which has been sheared for two hours under similar
K conditions.
Figures 50 through 52 show the effect of molecular
weight on the mechanical degradation of PEO solutions
:for three different concentrations. The curves in thes.e
figures indicate that WSR-205, which has a much lower
molecular weight than WSR-301 or Co-u'lart, degrades faster than-
the other two when comparison is made in terms of percent
drag reduction. This is also true for 50 and 100 wP11.
solut:cons of WSR-301, which degrade faster (On terms of
drag reduction) than corresponding solutions of CoaSulant.
WSR-205, WSR-301 and Coagulant sa1mples had approximate
molecular weights of 9 x 10 3.41 x 10⁶ and 3.5 x 10
respectively. These molecular weights are based on the
corrected reduced viscosities c2 200 wppm. solutions of
the above grades and Shin's relation between intrinsic
viscosity an-, molecular weight (described in Section 3.0)?

104
I
-Paterson (16) demonstrated that intrinsic vis-
cosity failed to correlate the extent of drag reduction
for fixed concentrations in pipe flow. HW± reported
that:
The solutions which have been degraded show adisproportionately large decrease in drag reductioneffectiveness for the small decrease in the intrinsicV.• viscosity. There is, of course, no a priori reasonthat drag reduction should depend on the same momentof molecular weight distribution as the intrinsic-
- { viscosity. Since degradation should preferentiallyattack the highest molecular weight species presentin the spectrum, the disproportionate decrease indrag-reduction suggests that the drag reductiondepends primarily on the high -rolecular weightcomponents of the distribution. Since these com-ponents are present in relatively small concentra-tions their disappearance would cause only a small
tl effect on the weight average molecular weight. A-V- { more appropriate average to correlate the drag
reduction would then be one which weighs the highend of the distribution to a areater extents
il Some interesting conclusions can be drawn from
these tables. The reduced viscosity of 200 wppm.
solutions of WSR--205 (Table 1) degrades by 5,35% after- [I
four hours of continuous turbulent shearing. The
corresponding reduction in drag reduction is about 47".
The change in reduced viscosity in this case must be
viewed with caution since this corresponds to a change
in efflux time of only one second in the capillary
viscometer. This very little change could possibly be
ittributed to the limit of accuracy of the Autoviscomter I
K- -I

105
and may mean that the change in reduced viscosity is
practically zero for the duration of the experiment.
Tables II and III display the typical features of
high molecular weight Coagulant. A 100 wppm. Coagulant
solution shows a drastic reduction of about 26% in
reduced viscosity in 13 minutes of shear, whereas the
change in drag reduction was only 1.66%. The correspond-
ing values for the 200 wppm. solution of Coagulant are
37% and 4.65% for 58 minutes of shear. This phenomenon,
though not tabulated, was also observed for a 200 wppm.
solution of WSR-301. In addition, it can be seen from
these tables that reduced viscosity remains essentiallyl
constant after a few hours of shearing. However, therie
is a continuous gradual decrease in drag reduction.
At fi.nst glance, the results for WSR-205 and
Coagulant seem to be in conflict with Paterson's model
described in the preceding section. For the 200 wppm.
solution of WSR-205, the reduced viscosity and drag
reduction (Table I) changed by 0.-64% and 20.34% inthe first
hour of shearing. The ccrrsponding values for the
200 wppm. Coagulant solution are 37% and 4.65%'. Thus the
initial rate of dearadation in termas of reduced viscosity
is very fast for Coagulant (which supports Paterson's-: :acK!elI), h,.uL t>' nc.: " •- . . ,: .," in dF.acg + •.•.tion is;4..
a _ _ _ L

106
disproportionately very small. This could be explained
on the basis that Coagulant has a greater proporti6in of
high molecular weight molecules in i-ts-distribution,
providing many more high molecular weight molecules than
are required for optimum drag reduction. The breaking
of these high molecular weight molecules could result in
a sharp reductirvn of reduced viscosity. However, thedrag reduction is expected to change by a small amount
because an appreciable number of high molecul3r weight
molecules is still present In the system. For the 200
wppm. solution of WSR-205, the reduced viscosity remains
essentially constant for first hour of shearing, but
drag reduction decreases by 20%. Initial drag reduction
is practically the sante as for Coagulant. This indicates jthat WSR-205 initially has enough high molecular weight A
molecules to provide a drag reduction comparable to
Coagulant, but their number must be much: smaller than-
that present in Coagulant. This means that for WSR-205,
only the narrow tail end of the distribution lies in the
drag reduction and degradation range. Breaking of these
molecules, therefore, would result in a small change of,
reduced viscosity. It would, however, reduce the drag
reduction considerably because drag reduction depends
.upon high muoect1er coniponents o:f the distr~but,4if.
4-

,1- ~ -- ,. ý -ý---7~-= -
107
The failure of reduced viscosity (which is a
measure of intrinsic viscosity) to correlate drag
reduction and degradation for disk flow is indicated
from these tables. The disproportionate decrease in
drag reduction after a few hours of shearing (while the
reduced viscosity remains essentially constant) suggests
t.hat drag reduction depends primarily on the high
molecular weight components of the distribution.
5.4 The Effect of Temperature 6n Drag RedictlioW and f~echanical
'Degradation
The purpose of this series of ex-periments was to
determine the effect of temperature on the initial drag
reduction and mechanical degradation of dilute PEO
solutions. Polyox WSR-301 wras tested at three concen-
trations (2, 50, 100 wppmi.) at three temperatures (30,
4S. and 601C). As already noted, a.6"1 diameter, brass
disk rotating at 1700 rpm. was used for temperature
studies.
Severs (21) states Ithat a solution of polymer in
a good solvent will decrease in viscosity as the tempera-
ture is raised. This de-crea-se is caused by the decrease
in solvenL viscosity w..ith termp-rature. The relative
j sastY ~r Will be essen tially c~nstant since the
.V iS C. v 4. c..~ I%:iZ
I- Z.

108
temperatu're effects. However, the relative viscosity
of a ,polymer In a poor solvent will rise with the
temperature as the polymer molecules unfold.
Temperature plays an important part in the
solubility of polyriers. Although PEO is comipletely
soluble in water at room temperature, it precipitates
from water solution at or near the boiling point. For
example, in a 100 wppm. solution of PEO in water, the
polymer would precipitate from solution at 100.5*C
(17), Alfrey, et. al. (1) demonstrated not only that a
S--polymer chain uncurls as the temperature of a poor
solvent is raised, but that there is a tendency for a
polymer chairn to curl somewhat in a good solvent as the
--- temperature is raised. They also showed that"the nearer
the polymer (in a good solvent) is to precipitation, the
smaller is the intrinsic viscosity. Pruitt e~t al. (19)
-..-. also found a decrease in reduced viscosity with increas-
ing temperature for PEO solutions. They observed that,I: -xcept for the low concentr-ations of PEO, there is little
I change in drag reduction in pipe flow ftopm 2*C to 40*C:
but a substantial loss in drag reduction from 40*C to
L 600C.
Increased degradation- due to increased temperature
Jis C- on-•- I,' = - -÷re.. .. , as th_,:;.i1 d-. Ia 2t3o._. _l r..

109
I%
temperature accelerates the chemical degradation and
increases the Brownian motion of polymer molecules.
"The data shown in Figure 53 illustrates the
drag reduction and shear degradation at different
temperatures for a 2 wppm. solution of WSR-301. Figures
54 and 55 show the effects of temperature for 50 and 100
wppm. solutions, Figure 56 indicates Uhc effect of
temperature on initial drag reduction at time, t=o, for
three concentrations of WSR-301.
For the 2 wppm. (Figures 53 and 56) solution, the
initial drag reduction remains practically unaffected-
labout 44.5%) when the temperature is changed from 30 C
to 45*c. -However at 60OW, initial drag reduction is
about 36%--a 19% "reduction" in drag reduction. For high
concentratio7 s of 50 and 100 wppm. solutions (Figures 54
and 55), the initial drag reduction increases as the
temperature increases from 30*C to 60*C. The initial
drag reduction, for both of these tests, increases by
about 10% when the temperature is changed from 30WC to
60*C. The shear degradation rate for all concentrations
is highly accelerated as solution temperature is increased.
It is notew.orthy that a substantial increase in degrada-.
tion rate occurs as the temperature is increased from
--30WC to A5°C . the -fClo-- Una
g-t
N I

110
same pattern when the temperature is changed by an equal amount
from 450C to 600C.
These results do not agree with Pruitt, et al. (Y.9), who
found, for pipe flow, a substa.atial loss in initial drag reduction
from 40 0C to 600C for concentrations varying from 2 to 250 wppm.
of Coagulant. Two possible reasons for this variation could be
dissimilar flow geometries and the quality of solvent (distilled
water instead to tap water which was used in their study).
5.5 Effect of Static Storage of MIaster Solutions on Drag keduction
Four master solutions of WSR-301 were tested in this series:
"(1) 8 months old, 0.8% solution prepared by the Vortex Mixer method
with 0.5% isopropyl alcohol, (2) 9 months old, 1% solution prepared
by the Boiling hater method, (3) a freshly prepared 0.8% solution
prepared by the Vortex Mixer method with 0.5% isopropyl alcohol, (4)
8 months old, 0.8% solution prepared by the Vortex Mixer method, but
no isopropyl alcohol added. The master solutions w.ere stored in
polyethylene bottles under normal room conditions.
These master solutions w-ere diluted to 50 wppm. concentration
to check their drag reduction ability. The results of these tests
"are depicted in Figure 57. The similarity of initial drag reduction
and shear degradation characteristics for the first three master solu-
tions sho;'s that the chemical degradation during static storage can be
practically stopped by adding isoDropyl alcohol and by using distilled
water. However, it is noteu'orthy that the master solution in the
-+- '

fourth case (where no isopropyl alcohol was added) lost its drag
reduction effectiveness completely after eight months of static
"storage.
5.6 Static Viscosity Degradation of Dilute Solutions
McGary (15) found tK.. polymer solutions in distilled water
gave good long-term stabilities. To test the effectiveness of
isopropyl alcohol and distilled water to stabilize the dilute
polymer solutions during static storage, a 200 wppm. solution of
WSR-)01 was made. This dilute solution was made from a 1% master
solution prepared by the Vortex Mixer method (0.6% isopropyl alcohol
added). S
Figure 58 shows the static viscosity degradation of the dilute
solution stored in a polyethylene vessel under norwal room conditions.
Over a period of 29 days, the relative viscosity changed from 1.264
j to 1.252 i.e., a decrease of only .94%. This behavior indicates that
the chemical degradation of dilute polyn:er solutions during static
"storage can be mitigated by adding isopropyl alcohol to m3ster solu-
tions and using distilled wtater.
t3
)

112
00 I0 l
9-0 N'
m.4. 1-4c 0 i 0-
In I f)cn14:1 n v1C v) ((J)4(n 0
'0 z! tt V) z
oo'~ ~E4
4) ):3ý 0
co C4 Z,
0~ E-H
E-
co-

113
ok
U1r- 0V)0 Let
.)$4.~I
0 01
0~ 00
QQC~!E-4
w E.
C.) 0
tI"Itlo-I f-?JCqtlcvc-ý
~4AA

114
0 V0
0,.14 tn :3 Q
ii 43 0
v ~r.% .n
14>
C140.C1 03 ucn
00 cnr 0 C14,
U U
0 itt
00ev) ci e.
JJ Cl)Al

115
co:41 0
0 01 MCO r4-D
0 Sr4 VIll
.0 14 "1
Vg) 0*
S 040S1)4 0 I0
.c Vt u Wto) 4)- ft)40
0
0: 0
-0 0r*1 ~H
LH
00

116
4; 0'
4J 14 -HSr%4 tnD
0 4J4
0) $4 :30 zO0
r41
0
-0 i E-f 0
E04
0~~~ 00 C
'4E W~
4:J- -0

117
0 :0~~0
41 14 --
giAJ v-I
$4 : 0 140
-4 0 Ed LO
00
00
Z Es -4
I ~ ~ ~ E Q% ~ 4 W
00
0 H

118
0Vx
V, .14-Hf4 ON &00
jo 14d
i 14 0 r
0 1% -Ir-
VE I- i -
0J z 0
0C~
00H 0l0'0
.2100 HO0
U E-4I<
IE -0
31
uf o~ T uog 1-I j-Drý

ii ~1191
In:-A0-P 0
$fr4 W 0
ri 0%.0 S4 tn 0
4140 Hr
6fl~Jal 0
I to 00
E4 02
0 ;A HOV k
0 U <0ofn 41 4 -. t
0.1
r'H
(s33

120
.14 I0s
c.
In-
SO0 ODMe r..l -in'0"0
0
ra:
0 [
in ix
r•1-400 0
4--.
43 H
E04
tr) E-
evu

________
100
14
"I.
uoa00
anI-'d
0
z0
NH
0.04I *~
E-o %c
0 ~W
1<jopa -0 a) 0.1Z

F •.122
-) 0
MJ
00H
-4-
14
'43
0 0 0o 0
0
f
*1 r't4 0
Ic evti

~- - 123
mc-o
I. 4m <0 0
~I)CI0 En C4
<001
0. 0
0.
eq~
o o

124
00
04
In In
0 0 0 LO .
0 *E-41
I~~E-1 U)
0
OH
r 00
Lr) v cv5L".E4l

'12
or V4
00
at 04M-C'. QOO
3: 0 w
000 r 0
*04
r- . 0
0~~ 0
r_
if
L~S>

126
- 0
004
EEL F. r<0S
0404.Q.0.0 E4<Z
0 00 C-4 r4 .0o a .. 0
uc 00
Cm0
E-4
M gUE-3
H 0 :-I
rA4 E-UE-4
z 0
El> 0
H H
E-
uo1;zl npe.>: 6iJGr qu;DDzj

127
4.3
-C
:j n Ini
Ir ýýI
r>00
U ULn
x /
I )
(tL)
C%4 HI IE l i
clq Co

= ~ ~ ~ 1 Ott- -
128
0
*n 0
14 C-40
f if IA I0r-4 0 H
m C~E-41 c t
.3.,3 0
4-1-L4000
0czc~H
* 1D4
ru V
0 ~~ f ih10i I 0
00
0pqV
uoT~~j;)npejjr± Bv-! :uo~o

129
1:0IVf 000)E-
01150).
Silo
00
4,Y
0
f5-3

"130
*14
:n oo S4 o H~00mb] L ,-4
1 <000 C0 V <,4 H H V
7 0n
E r ,•E-
0*•
-;-W 0U
1.00 u.7 - •- H1
P4 Xl
C,)f
I L* U
0 C0
n m ,,(
I 0 0 0 0 0 0Uo•.I.:) :'o•. •--'r- V -i-I;)

~~~~X.-117 4- -_l l'--
131
.to14
0U0 01M1 10 QHi
0O~LO / 00
1 40 C040
0j d(
tn Z

132
m II
00 Q4 00EO~flO 1E-4
cmr Zor11cc: 0otJ'oC) z
1r-4
0<W~
r, E-4 E-
E-i U) .
a43l
014
-44
Ellt
... u u

133
0
000
<H
00Eu
LI)2
C*t4
0 0~ V-4
011
~fNvJ.-Iny oi ,

_ --ST-
134
v140
0. MI
1-0. 0
OV-P 0 L -
Xr4 0:) C.t rq l<62 0-Cr4 41 0M-. 4 4.'- 0 C3 .r4 <c
Ql 0 W x 41 0I W
Ln $44G) PqI4
E V r V V )4
0r-f~- ~04 0 toU41
"0 4) S44 -0 -.-1
Er1~~~EL H r .rE 10 0 X- 0x
a0 0 > )LDD0n 01
to -H Z E-46 rt: 0H~
0 C) 0 0)InE ruP
UOT~tpD W T
I0__
.-- ~~ 0 4~9 I~IE-4

135
E-4
o E-4
H
I~0
E-H
E-4in4
0 Cl04 0nt
cmU
A-k AZAT~jUIC)
HA

136
6.0 Conclusions and Recomnendations.
This research has endeavored to contribute to the understanding of
degradation phenomeqa observed in PEO solutions. In concentrated solu-
tions this is manifested by a decrease in the apparent viscosity result-
ing from mechanical agitation. In dilute solutions which exhibit friction
reduction degradation, it takes the form of a decrease in the friction
reducing capability. The expressed purpose of this research effort has
been to observe both of these phenomena with a view towards the develop-
ment of an understandia.g of the fundamental processes involved.
It is clear that the degradation of dilute solutions which are
subjccted to intense turbulent flow fields results from molecular scission.
The same mechanism has been postulated to explain the decrease of apparent
viscosity in concentrated solutions subjected to intense shear fields. The
results of this program cast some doubt on the identification of scission
as the principal contributor to the observed viscosity decay.
A number of conceni ated solutions in the approximate range 0.1 -
1.0% (by weight) of polymer v:ere subjected to laminar shear flows with
shear rates ranging up to 1370 sec'and as low as 25 sec(. Although the
resulting stress decay curves could not be correlated in terms of any
simple model of viscoelasticity, net reductions in apparent viscosity of
up to 50% were noted. On the other hand, when these "sheared" concentrated
solutions were diluted and their corresponding friction reducing charac-
teristics measured, they were found to be identical to the friction reduc-
ing characteristics of diluted forms of "unsheared" concentrated solution.
This irplies that the observed viscosity reductior is largaly due to

137
microscopic disentanglement and ordering of polymer chains and the rup-
ture of relatively weak inter-chain hydrogen bonds, rather thati actual
molecular scission.
In addition to the stress decay characteristics of concentrated
solutions, measurements were made of the limiting, or steady-state,
viscosities of these solutions. From a quantitative point of view, these
limiting viscosities were found to obey a power law relationship over the
entire range of shear rates at which limiting viscosities were determined
(a matter of almost 4 decades of shear rate). In addition, it was found
that the limiting viscosities were virtually independent of the "solution
history" - at least within the shear rate range considered. That is, the
magnitude of the limiting viscosity at any shear rate was found to be
independent of any prio;- shear history, the only effect being that the
liaiting value is achieved in a much shorter time if the solution is
sheared at a higher rate.i= Turning to a consideration of the results of the study of drag reduc-
tion is dilute solutions, it was found that the extent of initial drag
reduction, except for very low concentrations, was essentially independent
"of the polymer molecular weight and solution concentration for the case of
disk flow. It is suggested that since there is a concentration plateau,
there could %..ull be a molecular weight plateau depending on the flow geometry.
"The lower molecular weight samples of PEO degrade more slow.ly than
higher molecular weight polymers if comparison is made in terms of degrada-
tion of reduced viscosity. How..,ever, the opposite is true if comparison is
"made in terms of degradation of drag reduction. This s'ocests that the

138
"phenomenon of drag reduction depends primarily on the high molecular
weight components and the process of mechanical degradation preferentially
attacks the highest molecular weight species present in the spectrum of
the molecular weight distribution. It is further concluded that Coagulant
has a greater proportion of high molecular weight molecules in its distribu-
tion. providing many more high molecular weight molecules than are required
"for optimum drag reduction. The breaking of these high molecular weight
molecules could result in a sharp reduction of reduced viscosity. Hot-ever,
the drag reduction would change by a small amount because an appreciable
"number of high molecular weight molecules is still present In the system.
In the case of low molecular weight WSR-205, the reduced viscosity remains
essentially constant during the shearing period, but drag reduction de-
creases by a disproportionately large value. The initial drag reduction
comparable to Coagulant suggests that WSR-205 initially has enough high
molecular weight molecules to provide significant drag reduction, but their
number must be much smaller than that present in Coagulant. Only the
narrow tail end of the distribution must lie in the drag reduction and[ degradation range in the case of WSR-205. Breaking of these molecules re-
sults in a smrall change of reduced viscosity. However, the drag reduction
would decrease considerably because drag reduction depends upon the high
"molecular components of the distribution.
Initial drag reduction, Except for very lot concentrations, increases
A as the temperature is raised from 300C to 600 C, The rate of degradation of
I drag reduction is very severe at higher temperatures because of the accel-
erated chcemic>-1 dccrzidation an~d in~creased Bro,..Mian Lintioin ofI polvl-er molecules.

-Yý 7 -7'~-~-.--.
139
The static storage of concentrated solutions in distilled water
containing a mir.ute amount of isopropyl alcohol for as long as nine
months does not affect their drag reducing effectiveness.
6.1 Recoiimmendations for Future Efforts.
Continuing efforts in the field should be focused upon the develop-
ment of a quantitative description of the stress decay characteristics of
concentrated solutions and degradation of friction reducing capability in
dilu e solutions in terms of the molecular processes involved. These
efforts should emphasize a number of those factors, identified in the
current research, which hinder such a development.
For example, the interpretation of the influence of polymer molecular
weight (chain length) on frictional drag characteristics is made difficult
by uncertainties in the molecular weight distributions of the PEO samples
used. Ar. effort should be made to develop separation techniques for the
preparation of more sharply defined distributions. Alternatively, it would
be useful to consider different polymer systems with inherently sharper
distributions.
The shear field which the polymer molecule experiences in the case
of disk flow varies in magnitude, being maximum at the surface of the disk
at its outside radius. It is difficult to assign an appropriate value to
the average shear stress which the polynmer experiences. In a statistical
sense, however, the intense turbulent mixing causes the average polymer
molecules to experience the same "average" shear field. It is recommiended
that the phenomenon of mechanical degradation of dilute p3lymier solutions
be studied u~nc' rn:hispe's- solutions and p'arer•bly ir. rota.rinei

140
Couette apparatus. In Couette flnw, it is possible to accurately estimate
the marngit|;de of the shearing stresses. The use of monodisperse samples
would eliminate the effects of the broad distribution on mechanical degrada-
tion. I
The process of mechanical degradation is also dependent upon the
shape of the polymer coil in solution. These configurational effects can
be studied by utilizing different solvents. The proper choice of solvent
can cause the polymer molecule to assume extended or corapacted configurations.
In terms of the study of stress decay in concentrated solutions, 71
"efforts to develop a quantitative description of this phenomenon should
continue. This activity should emphasize inprovements in the techniques
" for the measurement of transient shear stresses.
Aithough it has not been mention2d explicity, the decay of viscous
characteristics of PEO solutions is always observed to be accompanied by a
corresponding decay of viscoelastic characteristics such as the rod-climbing
or Weissenberg effect. It is suggested that research be directed towards
the quantitative investigation of these phenomena.
A

"141
7.0 Bibliography
1. Aifrey, T., Bartovics, A., and Mark, H., "Compara-tive Osmatic and Viscosity Measurements WithPolystyrene Fractions," Journal of American ChemicalSociety, Vol. 65, No. 12, Dec. 1943, pp. 2319-2323.
2. American Society for Testing and Materials, ASTIStandards, Part 17, 1968, pp. 180-186.
3. Asbeck, W. K., and Baxter, M. K., "Coatings: PhysicalStudies, Shear Degradation of Aqueous Poly(ethylezieoxide) Solutions," Project Report No. 18630, Feb.1959, Union Carbide Chemicals Company, South Charles-ton, W. Virginia.
4. B-_ileyj F. E., Kucera, J. L., and imhot, L. G.,"Molecular .eight Rlelations of Poly(ethylene oxide),"Journral of Polymer Science, Vol. 32, 1958, pp. 517-518.
5. Brennen, C., and Gadd, G. E., "Aging and Degradationin Dilute Polymer Solitions," Nature, Vol. 215,No. 5108, September 23, 196?, pp. 1363-1370.
6. El'perin, I. T., Smol'skii, Be I., and Leventhal,I, "Decreasing the Hydrodynaniic Resistance of
"Pipeline," Internation: 1. Chemical Eariineerin.c,Vol. 7, 1967, p. 276.
7. Fabula, A. G., "An Experimental Study of GridTurbulence in D5Iute High Polymer Solutions," Ph.).Thesis, June 1966, The Pennsylvania State Univ.rUzit',University Park, Pennsylvania.
8. Flory, P. J., "Determination of Nolecular ",eights,"Principles ofPc4jer C hemistrv, Corrn-..3. UniversityPress, New York, 1953, pp. 308-214.
9. "add* G. E;., "Differences in Normal Stress in Aqueou.:
Solutions of Turbulent Drag Rejucing Additives,"Natu•,e, Vol 212, No. 5068, Dec. 17, 3966, pp. 1348-
10. ,Ga-.-.Io , l n.d d- -- r-. T-,,- for R.-
"";k&.
I%
:1

1 •142
IiI
Tecnnical Note 245/67, July 1967, (Available fromNaval Undersea Research and Development Center,Pasadena, Calif.).
11. Gilbert, C. G., and Ripken, J. F., "Drag Reductionon .' Rotating Disk Using a Polymer Additive,"Visto-is Draq Reduction, Wells, C. S., ed., PlenumPresEs, New York, 1969, pp. 251-263.
12. Giles, W. B., "Similarity Laws of Friction-ReducedFlows," Journal of Hydronautics, Vol. 2, 1968,p. 34.
13. Hoyt, J. W., Hydrodynamics of Dilute Polymer Solu-tions and Suspensions, (unpublished type script)
14. Hoyt, J. W., and Fabula, A. G., "The Effect ofAdditives on Fluid Friction," ....5th Symposium on Naval Hydrodynamics, Bergen,Norway, Sept. 1964, pp. 947-974.
15. NcGary, C. W., "Degradation of Poly(ethylene oxide),"7. Journal of Polymer Science, Vol. '6, 1960, pp. 51-
57.
16. Paterson, R. W., "Turbulent Flow Drag Reduction andDegradation with Dilute Polymer Solutions, AD-"693-306, June 1969, Engineering Sciences Laboratory,Harvard University.
"17. "Polyox Water-Soluble Resins," Union Carbide Corpora-tion, Ilew York, 1967.
"18. Prandtl, L., and Tietjens, 0., Appl-ed Hydro andAer-omachines, Dover Publications, New York, 1957.
19. Pruitt, G. T., Rosen, B., and Crawford, H. R.."Effect of Polyme!r Coiling on Drag Reduction,"Technical Report No. DTMB-2, Aug. 1966, The WesternCompany, Dallas, Texas.
20. Schlichting, H., "Turbulent Boundary Layers at ZeroPressure Gradient," Boundarv Lover Theory, 6th ed.,?McGraw-Hill, Ilew: York, ]9U8, pp. 606-608.
21. Severs, S. T., " -o y: r, " : ,_

143
1962, pp. 91-92
22. Shaver, R. G., and Merrill, E. W., "Turbulence of PseudoplasticSolutions in Straight Cylindrical Tubes," Journal of AmericanInstitute of Chemical Engineers, Vol. 5, No. 2, 1959, pp. 181-"1•87.
23. Shin, H., "Reduction of Drag in Turbulence by Dilute PolymerSolutions," Sc.D. Thesis, 1965, M.I.T., Cawbridge, Mass.
24. Tarford, C., "Light Scattering," Physical Chemistry, of Macro-molecules, Wiley, New York, 1961, pp. 781-288.
25. Toms, B. A., "Some Observations on the Flow of Linear PolymerSolutions Through Straight Tubes at Large Reynoids Numbers,"Proceedings of Ist International Congress on RWieology, North
olland Publishing Co., Vol. 2, 1948, pp. I•-141.
26. Van Wazer, J. R., et al., Viscosity and Flow Measurement,Interscience Publishers, New York, 1963, pp. 107-226.
27. Virk, P. S., "The Toms Phenomenon-Turbulent Pipe Flow of DilutePolymer Solutions," Sc.D. Thesis, Nov. 1966, M.I.T., Cambridge,Mass.
28. Bailey, F. E., Jr., et. al., "High Molecular Weight Polymers ofEthylene Oxide," Ind. and Eng. Chem. E0, 8 (1958)
29. Swanson, E. D., "Degradation of Thick Polymer Solutions," NavalUndersea Research and Development Center, Pasadena, California(Code 2543), 19 February 1969.
30. Gold, P. I., "Mechanical Degradation of Thick Polymer Solutions,"Naval Undersea Research and Development Center, Pasadena,California (Code 254), 3 September 1969.
31. Hoy., J W., "A Turbulent-Flow Rheon'eter," in Symposium onRheology, A. W. Morris and J. T. S. Warg, eds., ASME, New York,pp. 71, (1965).
32. Rodriguez, F., and L. A. Goettler, "The Flc'i of ModeratelyConcentrated Polymer Solutions in Water," Trans. Soc. Rheol.,8, 3 (1964).
33. Rodriguez, F., "I.Moderately Concentrated Polymer Solutions:Correlation of Flow Data by Simple Models," Trans. Soc. Rheol.,10, 169 (1965).

144
34. Bailey, F. E., and J. V. Koleske, "Configuration and HydrodynamicProperties of the Polyoxyethylene Chain in Solution," inNonionic Surfactants, Dekker, New York, 1967.
35. Carver, E. K., and J. R. Van Wazer, J. Phys. and Colloid Chem.,51, 754 (1947).
36. Green, H., "Industrial Rheology and Rheological Structures, Wiley,New York, 1949.
37. Ram, A., "High Shear Viscometry," in Rheology Vol. 4, F. Eirich,
ed., Academic Press, New York, 1967.
38. Ram, A., Sc. D. Thesis, M.I.T., Cambridge, Mass., 1961.
39. Scott Blair G. W., "A Survey of General and Applied Rheology,"Pittman, • York, 1944.
40. Saville, D. A., and D. W. Thompson, "Secondary Flows Associated- with the Weissenberg Effect," Nature, 223, 391-2, (1969).
t

145
8.0 Appendix I. End Cerrections for Filled Cup - Newtonian Fluid
Mt = total measured torque, dyne-cm
• 1 = torque exerted due to shear stress,on annular gap, dyne-cm
h2M2 = torque exerted an cylindricalS•'-.surface inside bob, dyne-cm
eeM3 = t orque exerted on disk-shapedsurface inside bob, dyne-cn
Neglected - torque exerted on annular disks1on top and bottom of bob.Ri •_
Rb Mt Mt M 2 + 3
C -For a Newtonian fluid,
"H2 (1N 4= h W )
2NZ
1
4,rh 4-h2•, b c1 (RI R 2Mt - I-- + -- = 4•nN + R\2h +i2 ÷4
b 'c i
1 = Rb2Kc 2h/(Rc2 - Rb2)
- ti
z
A,........ .... .. ..

146
" m 2 Ri2h2_ i2Mt
M3 Ri 2/41-. t Mt
•4 ~Datat . Rb 2.004 Cm
Rb2RC2 h1 2.00)2-R 2.10Cm (2.)(2.10)" (6.0 69.7.. ~ ~ Rc -.0Cm~ Rb z (•2.10)z-- (2.004)2 =26.
WC Rb"" h1 6.0 Cm
,6CR 2h2 = (1.63)2 (3.52) = 9.4
t = 5.0Cmh ~ ~~~Ri 4 =(.6) .
h2 = 3.52 Cm f =4 5 0.4
""Ri = 1.63 Cm
= 269.7 + 9.4 + 0.4 = 279.5
m 1 0.965.. Mt
it follows, therefore, that the measured scale reading is approximately 3%too high.

S147'
TABLE I
VJ scosity of Glycerine Dete•ircnad vith RV cup (a) fijled nor-•13y.and (b) filled completely (T - 30 C)
U s (Noria) S (full)!s (Formn) s~ (fll
*8 8 8 a1 I=/3cPC/50 8"17 1T 165 16.17 16.5
514 25-- 25.5 25. 25 I5252527 52 52- 51.-5 51.51 52 51.5.18 "(9 79 79 78.5 79 78.759 15.0 15.A 15.2 15,3 EPPV/3OcC/50 15.2 15.256 2Z.5 22.7 22.5 2.5 -2.6 22.53 44.0 41&;:5 Jh1.4 4-4.2 1 I14.25 .32 66.3 65.5 66 .2 66.4 66.2
D (see -) uJ~ 7 N~)(')i'(r)(p
28.45 e93 293 3.616.9 331 302 7.225.1; 303 305 10.850.8 3V 311 21.6'(6.2 321 3o 32.4152 322 324 .8
22 320 3-2-0 97.2457 3a3 313635 314 333 291.6

148
9.0 Appendix 11. Kinetic Energy Correction
SThe kinetic energy correction (1) is = p(Vs 2 - Vp2 ). The
' quantities Vs and Vp are mean velocities for water and polymer, at
POR 2the same driving head. In addition, Vmean =n- K.E, Correction
SP•(,6P)2R4 I] n•- 5 4 - - ,jFor the extreme case of 200 wppm.
64L2 f Fo tewpmCoagulant with np, 1.06 cp. the K.E. Correction was found to be 9.6
gm./cn.-Sec. 2 . The average driving head was 9.3 cm. or 9.3 x 981 x 1
= 9123 gm./cm.-Sec. 2 . Therefore, the K.E. Correction is .001% of the
Sdriving head and can be neglected.
•,-J
It
:1Io
I

149
10.0 Appendix I11. Wall Shear Rate of Capillary Viscometer
The wall shear rate for a Newtonian fluid under laminar capillary
flow conditions is given by (26):
APRD 2nL
For Cannon-Fenske viscometer, size 50 (26):Pav = average pressure drop = h pg
avg avg
havg = average driving fluid head = 9.3 cm.
L capillary length = 7.3 + .3 cm.
R = Radius of capillary = 0.31 + 0.2 m.
n = viscosity of water at 300C = 0.7975 cp.
Making calculations for water:
D 1216 (sec.)`
The minimum shear rate occurred at 200 wppm. Coagulant with n = 1.06018 cp.
This was found to be 915 (Sec.)'.
$
[i

150
11.0 Appendix IV. Data Tables
The following tables sumnarize tihe stress decay data discussed
in Section 4.0. "Bob Speed Settings" Indicated in these tables refer
to the rpm's and Newtonian shear rates outlined in Table 1, below
Table 1Bob Speed Setting for the Rotovisco MV I
Bob and Cup System
Bob Speed Newtonian -Rotational SpeedSetting Shear RWte (RPM)
(sec")
1 1370 5822 685 291
3 457 194
6 228 97
9 152 64.818 76 32.427 5! 21.6
54 25 10.881 16 7.2
S162 8.5 3.6
°* C

151
TABLE 2Stress Decay Data
Polymer lot: WSR 301 (W-1006-A-01)S! Concentration (wt. %) 0.24
Bob Speed SettingL Time 1 2 3 6 9 18 27 54 81 162
"(n) - -Stress (dynes/cM2)
0.5 250 146 1071 247 144 104
- 2 238 139 1023 229 138 994 219 136 965 212 133 936 207 131 917 199 130 91
* 8 195 128 909 192 125 88
10 188 122 88"1i 179 114 8520 171 107 8030 161 98 70"40 153 80 60
- 50 147 67 4957 6260 M0 4870 4980 4690 46
:1I*
A

152
TABLE 34
Stress Decay Data
Polymer lot: WSR 301 (W-1006-A-01)
Concer,tration (wt. %) 0.36
Bob Speed Setting
Time 1 2 3 6 9 18 27 54 81 162(mi) Stress (dynes/Ctn 2 )
00.5 221 165 100 731 343 213 162 96 712 327 204 161 94 703 327 199 158 93 704 327 195 156 93 705 318 192 154 91 68& 318 190 151 90 68"7 302 189 148 88 678 302 185 147 87 679 286 184 144 87 65
-' 10 286 181 144 85 6211 278 178 142 8412 273 176 139 8413 269 173 139 8214 264 170 137 8215 261 167 134 80"16 257 164 131 80
-- 17 253 161 128 7918 249 161 12719 244 158 12420 241 154 12030 216 130 105"" 40 198 111 91
50 179 107 8452 10558 82
-- 60 16870 16480 161"90 156
100 153110 151"120 148126 148
•T6

153
TABLE 4
Stress Decay Data
Polymer lot: WSR 301 (W-1006-A-01)
Concentration (wt. %) 0.41Bob Speed Setting
Time I 2 3 6 9 18 27 54 8i 162(min) Stress (dynes/cm2 )
00.5 414 244 188 114 841 389 233 182 108 822 373 224 176 107 793 365 219 173 107 794 365 216 168 105 79"3 365 215 165 105 806 357 212 164 104 807 357 209 162 104 798 349 205 162 102 799 341 201 161 101 77
"10 333 196 158 99 7411 333 193 158 97 7312 325 189 154 97 7113 316 184 153 96 7014 300 181 151 94 6815 297 178 148 94 6616 291 173 145 93 6617 285 171 145 93 6518 280 167 144 6519 271 164 141 6520 266 164 13825 238 150 12430 224 141 117"35 210 130 10739 20640 122 100"44 12245 9650 96"55 96
I

154
TABLE 5
Stress Decay Data
Polymer lot: WSR 301 (W-1006-A-01)
Concentration (wt. %) 0.63
Bob Speed Setting
Time 1 2 3 6 9 18 27 54 81- 162
(min) Stress (dynes/cm2 )
0.5 600 392 321 204 1451 566 351 297 202 1512 526 351 292 198 1513 502 351 288 195 1514 494 343 283 192 1485 470 343 277 190 1476 462 343 273 187 144
f 7 454 334 270 184 1428 454 334 267 182 1419 454 334 264 178 138
10 446 334 261 17 14011 438 318 260 172 14112 421 318 258 170 14013 405 302 257 168 14014 397 302 253 168 14015 389 286 252 168 14016 389 286 247 167 14017 373 286 244 165 14018 357 281 241 16419 357 278 238 16220 357 275 237 16221 35725 261 224 15628 22130 243 14835 22940 225
A

155
TABLE 6
Stress Decay Data
Polymer lot: WSR-301 (W-1006-A-01)
Concentration (wt. %) 0.91
Bob Speed Setting
Time 1 2 3 6 9 18 27 54 81 162S(miln) Stress (dynes/cm2 )
00.25 624 510 254 175 138 107 680.5 591 494 30C 209 158 121 760.65 3090.75 575 168 133 .21 575 473 301 9`30 192 139 85
1.25 202 1421 1.5 195 144
1.75 1902 550 466 286 220 186 143 93
2.2 943 542 453 286 216 180 142 914 535 445 276 215 179 142 905 526 430 270 212 179 141 906 519 421 226 213 179 140 907 510 405 262 207 178 139 908 502 405 258 205 176 1399 499 405 256 201 176 139
10 486 405 256 199 175 13911 486 389 254 197 17312 373 252 196 17213 373 252 195 17114 373 250 195 17015 373 249 195 16816 247 194 16717 246 194 16718 245 16619 244 16520 16521 164

156
TABLE 7
Stress Decay Data
Polymer lot: WSR-301 (W-1006-A-01)
Concentration (wt. %) 0.94
Bob Speed Setting9
1 2 3 6 9 18 27 54 81 162(min- Stress (dynes/cm2)
0"0.25 713 292 239 164 1380.3 5510.5 673 535 340 264 182 1550.75 640 518 365 196 1691 624 510 365 289 204 1741.25 1791.3 2121.5 1782 600) 486 348 286 210 1753 592 470 340 282 209 1754# 583 462 .337 279 208 175
5 575 454 337 277 207 173S6 567 448 337 274 206 1737 559 446 332 272 205 1738 551 442 327 270 204 1729 551 438 321 267 204 172
S- 10 543 431 316 266 203 17211 538 429 316 264 202 17212 535 429 316 263 202 172"13 535 42W 316 263 20214 429 316 261 20115 426 316 261 20116 417 316 260 20117 417 316 260
417 316 25919 316 25920 25825 25827 258
A 5 r
C -

157
TABLE 8
•Reproduceability of Stress Decay Data
Polymer lot: WSR-301 (W-1006-A-01).
Concentration (wt. %) 0.36
Bob Speed Setting
Time 11) 1(2) i(3)(min)' -
Stress (dynes/cm2)
0.5 359 3581 351 343 3422 327 327 334
- 3 327 327 3344 327 327 3345 s19 318 334 46 110 318 3267 294 302 3268 294 302 310"9 294 286 310
10 294 286 29011 289 278 284
12 283 273 27513 277 269 27214 272 264 26715 266 261 26216 261 257 25817 258 253 25318 253 249 24919 250 244 24620 246 241 24225 232 229 22930 216 216 21635 207 20940 196 198"45 190 18950 182 17960 170 16870 164 16480 162 16190 159 156100 154 153110 153 151119 M50120 148126 148
,. (1) Initia" F'-;n
(2) Irnieditc Repeat Run(3) Repeat Run 26. Hours Lapter
.-.. ~ - - -' - - - -~--~-- ~- -~ - - - -

158
TABLE 9
Reproduceability of Stress Decay Data
Poly•ner lot: WSR-301 (W-1006-A-01)
Concentration (wt. %) 0.41
Bob Speed Setting
Time 0(1) 1(2) 3(1) 3(2) 3(3)
( Stress (dynes/cm2)
0.5 414 379, 184 195 1881 389 363 181 189 1822 373 363 178 186 1763 365 363 175 181 1734 365 355 172 178 1685 365 355 169 176 1656 357 347 167 173 1647 357 339 165 1,3 1628 349 330 164 170 1629 341 330 162 169 161
10 333 322 161 167 15911 333 314 159 165 M5812 325 314 158 i64 15413 316 306 156 161 15314 300 298 155 159 15113 297 290 153 159 14816 291 282 152 158 14517 285 282 148 156 14518 280 274 145 155 14419 271 266 144 153 14120 266 263 141 150 13825 238 233 130 138 12430 224 217 119 122 11735 210 206 113 110 10738 10539 20640 200 10045 195 9610 96
i 55 96
(1) Initial Run
(2) e'-•diat ,..•.•et Run
(3) Repeat Run 24 Hiors Later
"I - ... •:,• ',• "I . . -• i . . . • ) -• - • - =••":••-"•••-••"" •" - ••• . . • •"" "

159
TABLE 10Stress Decay Data
Pulymer lot: WSR 30] (1227-A-01)
Concentration (wt. %) 0.4%
Bob Speed Setting
Time 1 2 3 6 9 18 27 54 81 162(mmn) Stress (dynes/cm2 )
0.5 127 60 421 121 59 402 114 56 393 111 53 394 110 53 385 110 51 376 110 51 377 108
21 10127 3253 4066 2368 8892 37
. :108 84119 35125 22138 83163 80167 34188 80198 22

160
TABLE 11
Stress Decay Data
Polymer lot: WSR 301 (1227-A-01)
Concentration (wt. %) 0.41
3ob Speed SettingTime 1 2 3 6 9 18 27 54 81 162(Ifn) - -Stress (dynes/cm2 )
0.5 308 164 121 771 292 154 113 732 276 138 105 683 252 120 98 644 244 114 91 605 235 111 85 596 230 107 82 577 5 81 568 'I 81 569 219 79 56
10 215 79 5411 213 5412 20847 153 8768 15175 8478 4597 148
104 83106 45"122 44142 63150 44"189 43194 146211 43255 63
fr i

- 161
S, TABLE 12
Stress Decay Data
Polymer lot: WSR 301 (1227-A-01)
Concentration (wt. %) 0.70
Bob Speed SettingTime 1 2 3 6 9 18 27 54 81 162(mn)" Stress (dynes/cm2)
0.5 413 281 229 151"1 395 269 219 1482 358 250 206 1423 350 236 195 1394 350 227 189 1365 312 223 184 1306 •. 218 181 1287 342 216 178 1258 342 215 175 1229 342 213 172 121
10 342 210 167 11911 207 166 11912 204 165 11813 201 16414 199 16415 198 16416 19817 19618 19519 19520 30230 11331 29433 15542 11157 17863 14677 274 10481 17595 144
i05 174115 269120 102150 142160 100166 173173 263180 97183 !39195 97220 259229 133
S253 257259 2t

" 11
TABLE 13Stress Decay Data
Polymer lot: WSR 301 (1227-A-01)
Concentration (wt. %) 1.03
Bob Speed SettingTime 1 2 3 6 9 18 27 54 81 162S(min) Stress (dynes/m 2)
0.5 842 518 348 2761 810 M2 348 274 2122 761 478 334 273 2123 745 446 332 270 2114 721 437 324 263 2085 697 429 316 258 2076 693 429 316 2547 689 421 316 2538 680- 413 316 2519 664 316 250
10 648 316 248S"11 246
12 24513 244
* 14 24415 24316 2431718 38920 30922 30925 19326 237 19329 37330 54332 30037 23440 369 18854 22770 52781 22082 27788 34890 181
109 527117 270125 178"141 269160 269 204182 264186 173208 264263 167291 167
4

163
TABLE 14
Reproduceability of Stress Decay Data
Polymer lot: WSR-301 (W-1227-A-01)
Concentration (wt. %) 0.14
Bob Speed Setting
Time (1) 1(2)(min)
- - Stress (dynes/cm2 )
00.5 127 128
1 121 1222 114 1173 111 1144 110 1135 110 1136 110 1137 108 1138 1119 111
10 11120 10221 10135 9568 8880 87
108 84.. 110 85 •
120 83138 83163 80I If,. 80178 80188 80
(I) Initial Run
(2) Repeet Run 24 Hours Later

164
TABLE 15
Reproduceability of Stress Decay Data
Polymer lot: WSR-301 (W-1227-A-01)
Concentration (wt. %) 0.41
Bob Speed Setting
Time 20) 2(2)(min)16
Stress (dynes/cm)
2 138 140
372 1258 1 117591 116
10 108
12 10347 8768 8775 84104 84
(1) Initial Run
(2) Repeat hiuf 24 Hours Later
.I

165
TABLE 16
Reproduceability of Stress Decay Data
Polymer lot: WSR-301 (W-1227-A-01)
Concentration (wt. %) 0.70
Bob Speed Setting
Time 2(0) 2(2) 3(1) 3(2)(min)-
Stress (dynes/cm2)0
-. 0.5 281 286 229 2241 269 274 219 216
( 2 250 255 206 204. 3 2-36 243 195 192
4 227 233 189 1815 223 227 184 1786 6 218 224 181 1757 216 219 178 1738 215 216 175 171
, 213 215 172 16810 210 213 167 16511 207 212 166
- 12 204 210 16513 201 210 16414 199 239 16415 198 209 16416 198 20817 196 206
S18 195 20519 1%5 20320 202
- 25 193* 33 155
57 17863 14681 17595 144
105 174150 142S166 173
" " 183 139229 138
(1) Initial Rhl
4- - (?.) f�oeL "~i 24 r,.,.2 Later
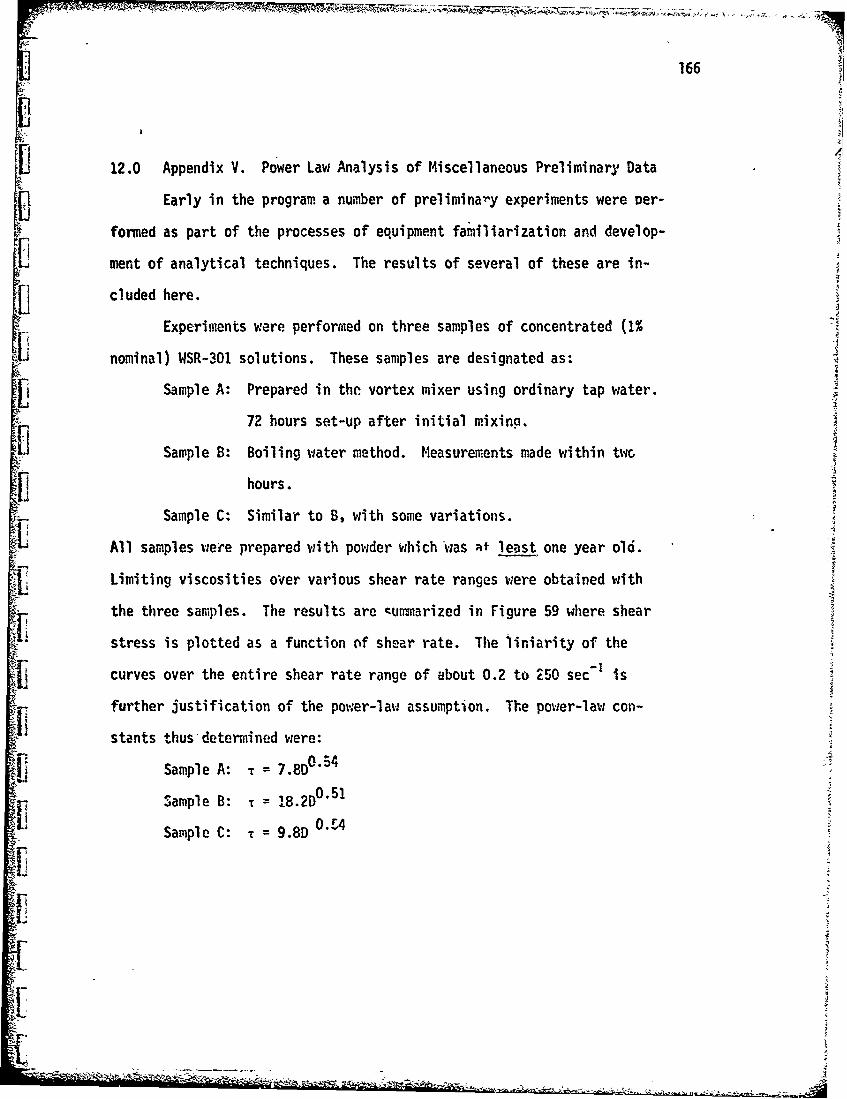
166
g-I
12.0 Appendix V. Power Law Analysis of Miscellaneous Preliminary Data
Early in the program a number of preliminaý-y experiments were per-
formed as part of the processes of equipment familiarization and develop-
ment of analytical techniques. The results of several of these are in-
cluded here.
Experiments were performed on three samples of concentrated (1%
nominal) WSR-301 solutions. These samples are designated as:
Sample A: Prepared in the vortex mixer using ordinary tap water.
72 hours set-up after initial mixing.
Sample B: Boiling water method. Measurements made within twc
hours.
Sample C: Similar to B, with some variations.
All samples were prepared with powder which was at least one year old.
Limiting viscosities over various shear rate ranges were obtained with
the three samples. The results are cummarized in Figure 59 where shear
stress is plotted as a function of shear rate. The liniarity of the
curves over the entire shear rate range of about 0.2 to 250 sec-I is
further justification of the pow.er-law assumption. The power-law con-
stants thus-determined were:
Sample A: t = 7.8D0"54
"Sample B: t = 18.2D051
[Sample C: T = 9.8D O.•5
II:
S --~,

C)
'~167
.0ets
00
S..- I . w
M >
LC) ej ':
wa
co'. -
1.
S- fo
-- C0
0u (LIa.
IL ... j )
Related Documents