Rheology of fresh concretes with recycled aggregates Flora Faleschini a , Cristian Jiménez b , Marilda Barra b , Diego Aponte b , Enric Vázquez b , Carlo Pellegrino a,⇑ a Dept. of Civil, Environmental and Architectural Engineering, University of Padova, Via Marzolo 9, 35131 Padova, Italy b Dept. of Construction Engineering, E.T.S. Ingenieros de Caminos, Canales y Puertos (Civil Engineering School), Universitat Politècnica de Catalunya, C/Jordi Girona Salgado, 1-3, Módulo B1, 08034 Barcelona, Spain highlights Viscometer measures describes better fresh concretes properties than slump value. Fresh recycled aggregate concrete (RAC) can be modelled as a Bingham fluid. The aggregate proportioning method greatly affects rheological parameters. Plug flow and gravel migration phenomena can influence rheology measurements. article info Article history: Received 18 April 2014 Received in revised form 24 September 2014 Accepted 25 September 2014 Keywords: Rheology Workability Recycled aggregate concrete Coarse recycled concrete aggregate Waste management abstract The most frequently used measure of rheology is the slump test, which evaluates workability. Since this value is often operator-sensitive, a more quantitative estimate can be derived in terms of fundamental physical quantities, such as plastic viscosity and yield stress. The higher heterogeneity in terms of experimental slump measure occurs when recycled aggregate concrete (RAC) is tested. In this work, 16 recycled mixes were analysed with two aggregates proportioning methods and results were compared with four controls: rheological parameters were measured with a ConTec BML Viscometer 3. The results represent a valid tool for better understanding of fresh RAC rheology. Ó 2014 Elsevier Ltd. All rights reserved. 1. Introduction Several recycled aggregates have recently been developed for use in concrete [1–8]. Recycled material use is an attractive alter- native to landfill disposal of waste, as it reduces the depletion of natural resources, limits the high energetic/environmental impacts in traditional concrete production, and increases the life-cycle of recycled aggregate. For satisfactorily high quality levels of concrete, recycled aggre- gate must comply with some minimum requirements [9], mainly concerning chemical stability and physical–mechanical character- istics. However, mix proportions also greatly influence the final performance of concrete. In particular, the design of recycled aggregate concrete (RAC) is usually carried out by simply replacing the Natural Aggregate (NA) of a Natural Aggregate Concrete (NAC) with recycled material, and only taking into account some of the differences in physical properties among aggregates, such as surface texture and water absorption. In general terms, Recycled Aggregate (RA) is taken as NA, and this is the main cause of the poor mechanical performance often reported in the literature when different kinds of RAC mixes are tested [10–12]. Here, a novel method, Equivalent Mortar Volume (EMV) [13] is a suitable solu- tion, as it considers RA as a two-phase material composed of NA and the mortar attached to it, which must be quantified and counted in the proportion. Since the physical properties of RA are affected by the attached mortar quantity and characteristics, this method can directly account for any deficiencies in low-quality aggregate, balancing the mix without affecting the mechanical and durability-related performance of the final concrete [13–15]. This allows the RAC mix to be prepared with a similar internal structure to that of NAC. As regards possible workability problems, replacement of NA by RA generally confers greater stiffness, as con- firmed by the lower slump values often reported in the literature. Several authors have confirmed this problem [1,3,16], arguing that the reasons for this behaviour are closely related to the physical properties of the RA, such as high water absorption, higher angu- larity, or rough surface texture. This problem can be overcome by http://dx.doi.org/10.1016/j.conbuildmat.2014.09.068 0950-0618/Ó 2014 Elsevier Ltd. All rights reserved. ⇑ Corresponding author. Tel./fax: +39 049 8275618. E-mail address: [email protected] (C. Pellegrino). Construction and Building Materials 73 (2014) 407–416 Contents lists available at ScienceDirect Construction and Building Materials journal homepage: www.elsevier.com/locate/conbuildmat

Welcome message from author
This document is posted to help you gain knowledge. Please leave a comment to let me know what you think about it! Share it to your friends and learn new things together.
Transcript
Construction and Building Materials 73 (2014) 407–416
Contents lists available at ScienceDirect
Construction and Building Materials
journal homepage: www.elsevier .com/locate /conbui ldmat
Rheology of fresh concretes with recycled aggregates
http://dx.doi.org/10.1016/j.conbuildmat.2014.09.0680950-0618/� 2014 Elsevier Ltd. All rights reserved.
⇑ Corresponding author. Tel./fax: +39 049 8275618.E-mail address: [email protected] (C. Pellegrino).
Flora Faleschini a, Cristian Jiménez b, Marilda Barra b, Diego Aponte b, Enric Vázquez b, Carlo Pellegrino a,⇑a Dept. of Civil, Environmental and Architectural Engineering, University of Padova, Via Marzolo 9, 35131 Padova, Italyb Dept. of Construction Engineering, E.T.S. Ingenieros de Caminos, Canales y Puertos (Civil Engineering School), Universitat Politècnica de Catalunya, C/Jordi Girona Salgado,1-3, Módulo B1, 08034 Barcelona, Spain
h i g h l i g h t s
� Viscometer measures describes better fresh concretes properties than slump value.� Fresh recycled aggregate concrete (RAC) can be modelled as a Bingham fluid.� The aggregate proportioning method greatly affects rheological parameters.� Plug flow and gravel migration phenomena can influence rheology measurements.
a r t i c l e i n f o
Article history:Received 18 April 2014Received in revised form 24 September 2014Accepted 25 September 2014
Keywords:RheologyWorkabilityRecycled aggregate concreteCoarse recycled concrete aggregateWaste management
a b s t r a c t
The most frequently used measure of rheology is the slump test, which evaluates workability. Since thisvalue is often operator-sensitive, a more quantitative estimate can be derived in terms of fundamentalphysical quantities, such as plastic viscosity and yield stress. The higher heterogeneity in terms ofexperimental slump measure occurs when recycled aggregate concrete (RAC) is tested. In this work, 16recycled mixes were analysed with two aggregates proportioning methods and results were comparedwith four controls: rheological parameters were measured with a ConTec BML Viscometer 3. The resultsrepresent a valid tool for better understanding of fresh RAC rheology.
� 2014 Elsevier Ltd. All rights reserved.
1. Introduction
Several recycled aggregates have recently been developed foruse in concrete [1–8]. Recycled material use is an attractive alter-native to landfill disposal of waste, as it reduces the depletion ofnatural resources, limits the high energetic/environmental impactsin traditional concrete production, and increases the life-cycle ofrecycled aggregate.
For satisfactorily high quality levels of concrete, recycled aggre-gate must comply with some minimum requirements [9], mainlyconcerning chemical stability and physical–mechanical character-istics. However, mix proportions also greatly influence the finalperformance of concrete. In particular, the design of recycledaggregate concrete (RAC) is usually carried out by simply replacingthe Natural Aggregate (NA) of a Natural Aggregate Concrete (NAC)with recycled material, and only taking into account some of thedifferences in physical properties among aggregates, such as
surface texture and water absorption. In general terms, RecycledAggregate (RA) is taken as NA, and this is the main cause of thepoor mechanical performance often reported in the literaturewhen different kinds of RAC mixes are tested [10–12]. Here, a novelmethod, Equivalent Mortar Volume (EMV) [13] is a suitable solu-tion, as it considers RA as a two-phase material composed of NAand the mortar attached to it, which must be quantified andcounted in the proportion. Since the physical properties of RA areaffected by the attached mortar quantity and characteristics, thismethod can directly account for any deficiencies in low-qualityaggregate, balancing the mix without affecting the mechanicaland durability-related performance of the final concrete [13–15].This allows the RAC mix to be prepared with a similar internalstructure to that of NAC. As regards possible workability problems,replacement of NA by RA generally confers greater stiffness, as con-firmed by the lower slump values often reported in the literature.Several authors have confirmed this problem [1,3,16], arguing thatthe reasons for this behaviour are closely related to the physicalproperties of the RA, such as high water absorption, higher angu-larity, or rough surface texture. This problem can be overcome by
408 F. Faleschini et al. / Construction and Building Materials 73 (2014) 407–416
the use of water-reducing admixtures in the mix [17] or by certainmixing procedures for RACs. The commonly named Mixing WaterCompensation Method [18,19] for elaborating concrete, based onadded water which recycled aggregate absorbs to the total neededby the mix, allows acceptable workability to be achieved. In thecase of EMV methodology, the parameters controlling workabilityshould be carefully taken into account, due to the reduced amountof fresh mortar in the mix in favour of increased coarse aggregatevolume. Knaack and Kurama [20], studying the rheological andmechanical behaviour of RAC designed according to various meth-ods – direct weight replacement (DWR), direct volume replace-ment (DVR), EMV methods – concluded that, compared withconventionally designed RAC (DWR, DVR), the workability of con-crete mixes designed with the new method is significantly wors-ened. It should be noted that rheological behaviour was analysedaccording to the ‘‘mini slump’’ test, a variation on the conventionaltest described by the same authors [21]. This method may causeproblems because it is a test with a single-number result, i.e.,one which may be produced by two different samples of concretewith different rheological behaviours, as mentioned in [22–25].
For the above reasons, the rheological properties of variousconcrete mixes produced with differing mixture proportioningmethods (including EMV) were studied here. Basic rheologicalparameters were obtained with a ConTec BML Viscometer 3, withthe aim of studying the flow behaviour of concrete with differentfresh mortar contents.
2. Rheology background
2.1. Fresh concrete as a Bingham fluid
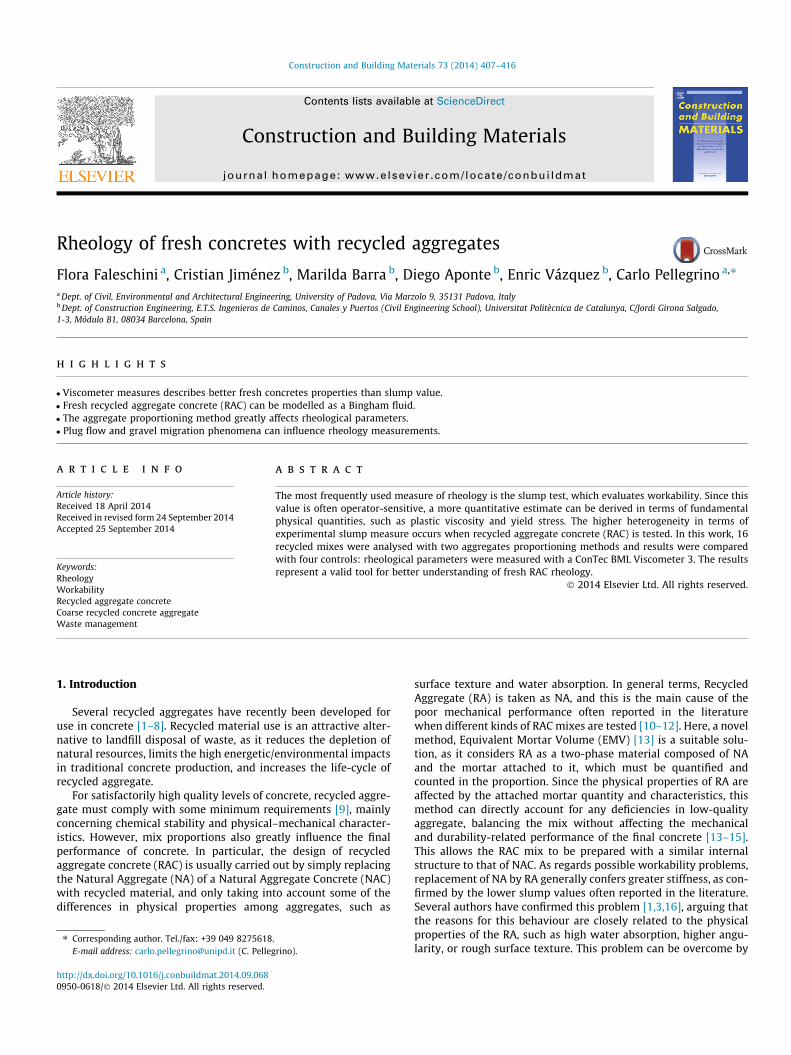
Concrete rheology has been extensively studied and the litera-ture confirms that traditional concrete (with slump values higherthan 8 cm and no segregation under gravity action) may be consid-ered – with good accuracy – as a Bingham fluid [26–29]. The flowof a granular material, such as fresh concrete, can thus be viewedas a fluid, and should be described by at least two parameters,i.e., yield stress and plastic viscosity, as defined by the Binghamequation. This equation is the most commonly used, because itsparameters can be measured independently, and also because theflow of real concrete follows it quite well. Other models can alsobe used to model fresh concrete flows (Fig. 1), such as theHerschel-Bulkley equation, which best describes the behaviour ofself-consolidating concrete [30]. With these assumptions, freshconcrete is represented as a viscoplastic fluid, characterised byyield stress s0 [Pa], which must be exceeded before significantdeformation can occur. After motion triggering, a linear relation
Fig. 1. Bingham flow curve.
associates shear stress s with the applied shear rate _c, called plasticviscosity l [Pa�s]. Fig. 1 shows the flow curve of a Bingham fluid,which can also be described by the following Eq. (1), where gð _cÞrepresents shear viscosity, depending on the shear rate (Non-Newtonian fluid):
s ¼ gð _cÞ _c ¼ lþ s0_c
� �_c ¼ l _cþ s0 with s P s0
_c ¼ 0 with s < s0
(ð1Þ
2.2. Rheometer apparatus
Several test methods are currently available to estimate howvarious kinds of fresh concrete behave rheologically. Examplesare the slump, L-box and V-funnel tests, the latter for highly flow-able mixtures. For better evaluation of specific rheological param-eters, viscometers can be used to obtain physical quantities; one ofthese, coaxial cylinder geometry for fresh concrete, has been usedwith good results since its first use in 1941 by Power and Wiler[31,32], followed by Tattersall and Banfill [23] and Wallevik[33,34], and can extract the Bingham model parameters, i.e., plasticviscosity l and yield stress s0.
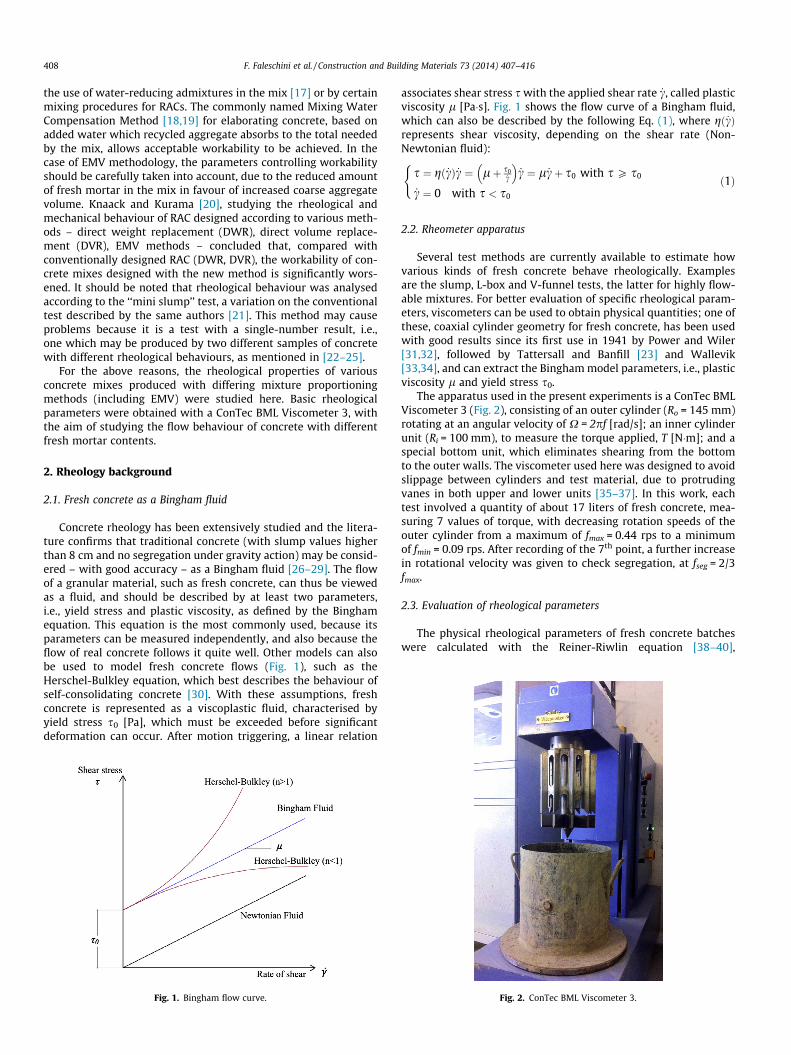
The apparatus used in the present experiments is a ConTec BMLViscometer 3 (Fig. 2), consisting of an outer cylinder (Ro = 145 mm)rotating at an angular velocity of X = 2pf [rad/s]; an inner cylinderunit (Ri = 100 mm), to measure the torque applied, T [N�m]; and aspecial bottom unit, which eliminates shearing from the bottomto the outer walls. The viscometer used here was designed to avoidslippage between cylinders and test material, due to protrudingvanes in both upper and lower units [35–37]. In this work, eachtest involved a quantity of about 17 liters of fresh concrete, mea-suring 7 values of torque, with decreasing rotation speeds of theouter cylinder from a maximum of fmax = 0.44 rps to a minimumof fmin = 0.09 rps. After recording of the 7th point, a further increasein rotational velocity was given to check segregation, at fseg = 2/3fmax.
2.3. Evaluation of rheological parameters
The physical rheological parameters of fresh concrete batcheswere calculated with the Reiner-Riwlin equation [38–40],
Fig. 2. ConTec BML Viscometer 3.
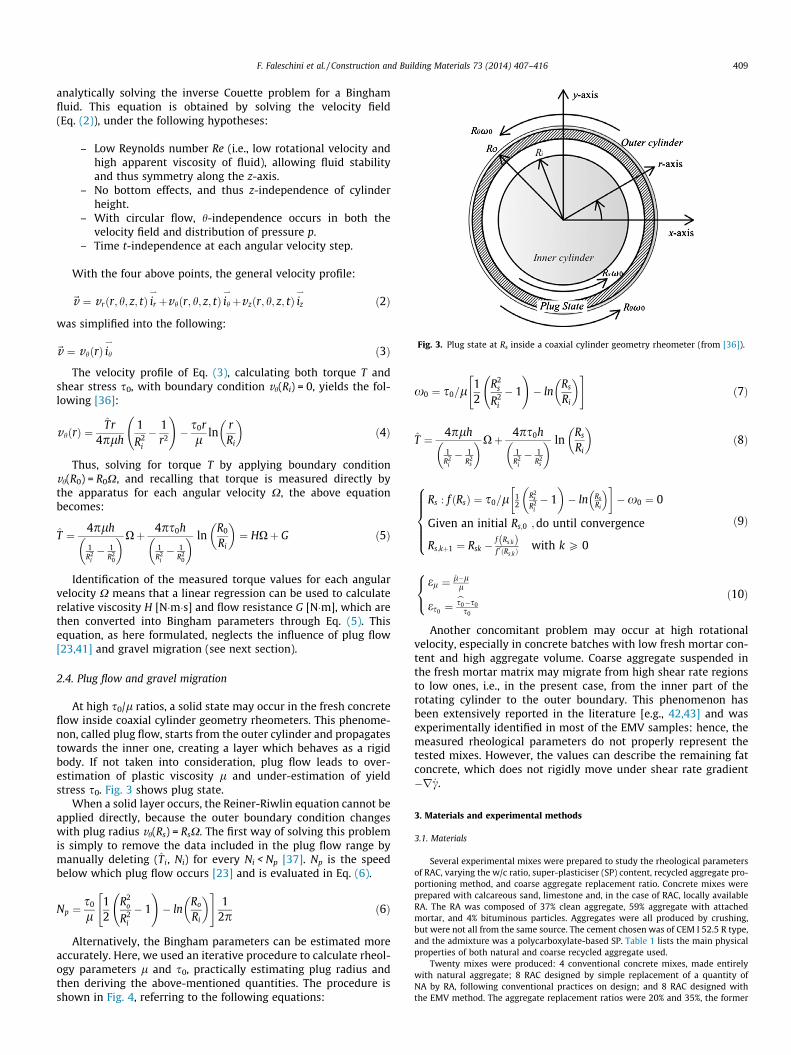
Fig. 3. Plug state at Rs inside a coaxial cylinder geometry rheometer (from [36]).
F. Faleschini et al. / Construction and Building Materials 73 (2014) 407–416 409
analytically solving the inverse Couette problem for a Binghamfluid. This equation is obtained by solving the velocity field(Eq. (2)), under the following hypotheses:
– Low Reynolds number Re (i.e., low rotational velocity andhigh apparent viscosity of fluid), allowing fluid stabilityand thus symmetry along the z-axis.
– No bottom effects, and thus z-independence of cylinderheight.
– With circular flow, h-independence occurs in both thevelocity field and distribution of pressure p.
– Time t-independence at each angular velocity step.
With the four above points, the general velocity profile:
~v ¼ v rðr; h; z; tÞ ir
*
þvhðr; h; z; tÞ ih*
þvzðr; h; z; tÞ iz
*
ð2Þ
was simplified into the following:
~v ¼ vhðrÞ ih*
ð3Þ
The velocity profile of Eq. (3), calculating both torque T andshear stress s0, with boundary condition vh(Ri) = 0, yields the fol-lowing [36]:
vhðrÞ ¼Tr
4plh1R2
i
� 1r2
!� s0r
lln
rRi
� �ð4Þ
Thus, solving for torque T by applying boundary conditionvh(R0) = R0X, and recalling that torque is measured directly bythe apparatus for each angular velocity X, the above equationbecomes:
T ¼ 4plh
1R2
i� 1
R20
� �Xþ 4ps0h
1R2
i� 1
R20
� � lnR0
Ri
� �¼ HXþ G ð5Þ
Identification of the measured torque values for each angularvelocity X means that a linear regression can be used to calculaterelative viscosity H [N�m�s] and flow resistance G [N�m], which arethen converted into Bingham parameters through Eq. (5). Thisequation, as here formulated, neglects the influence of plug flow[23,41] and gravel migration (see next section).
2.4. Plug flow and gravel migration
At high s0/l ratios, a solid state may occur in the fresh concreteflow inside coaxial cylinder geometry rheometers. This phenome-non, called plug flow, starts from the outer cylinder and propagatestowards the inner one, creating a layer which behaves as a rigidbody. If not taken into consideration, plug flow leads to over-estimation of plastic viscosity l and under-estimation of yieldstress s0. Fig. 3 shows plug state.
When a solid layer occurs, the Reiner-Riwlin equation cannot beapplied directly, because the outer boundary condition changeswith plug radius vh(Rs) = RsX. The first way of solving this problemis simply to remove the data included in the plug flow range bymanually deleting (T i, Ni) for every Ni < Np [37]. Np is the speedbelow which plug flow occurs [23] and is evaluated in Eq. (6).
Np ¼s0
l12
R2o
R2i
� 1
!� ln
Ro
Ri
� �" #1
2pð6Þ
Alternatively, the Bingham parameters can be estimated moreaccurately. Here, we used an iterative procedure to calculate rheol-ogy parameters l and s0, practically estimating plug radius andthen deriving the above-mentioned quantities. The procedure isshown in Fig. 4, referring to the following equations:
x0 ¼ s0=l12
R2s
R2i
� 1
!� ln
Rs
Ri
� �" #ð7Þ
T ¼ 4plh
1R2
i� 1
R2s
� �Xþ 4ps0h
1R2
i� 1
R2s
� � lnRs
Ri
� �ð8Þ
Rs : f ðRsÞ ¼ s0=l 12
R2s
R2i� 1
� �� ln Rs
Ri
� �� ��x0 ¼ 0
Given an initial Rs;0 ;do until convergence
Rs;kþ1 ¼ Rsk �f Rs;kð Þf 0 ðRs;kÞ
with k P 0
8>>>><>>>>: ð9Þ
el ¼ l�ll
es0 ¼bs0�s0s0
8<: ð10Þ
Another concomitant problem may occur at high rotationalvelocity, especially in concrete batches with low fresh mortar con-tent and high aggregate volume. Coarse aggregate suspended inthe fresh mortar matrix may migrate from high shear rate regionsto low ones, i.e., in the present case, from the inner part of therotating cylinder to the outer boundary. This phenomenon hasbeen extensively reported in the literature [e.g., 42,43] and wasexperimentally identified in most of the EMV samples: hence, themeasured rheological parameters do not properly represent thetested mixes. However, the values can describe the remaining fatconcrete, which does not rigidly move under shear rate gradient�r _c.
3. Materials and experimental methods
3.1. Materials
Several experimental mixes were prepared to study the rheological parametersof RAC, varying the w/c ratio, super-plasticiser (SP) content, recycled aggregate pro-portioning method, and coarse aggregate replacement ratio. Concrete mixes wereprepared with calcareous sand, limestone and, in the case of RAC, locally availableRA. The RA was composed of 37% clean aggregate, 59% aggregate with attachedmortar, and 4% bituminous particles. Aggregates were all produced by crushing,but were not all from the same source. The cement chosen was of CEM I 52.5 R type,and the admixture was a polycarboxylate-based SP. Table 1 lists the main physicalproperties of both natural and coarse recycled aggregate used.
Twenty mixes were produced: 4 conventional concrete mixes, made entirelywith natural aggregate; 8 RAC designed by simple replacement of a quantity ofNA by RA, following conventional practices on design; and 8 RAC designed withthe EMV method. The aggregate replacement ratios were 20% and 35%, the former
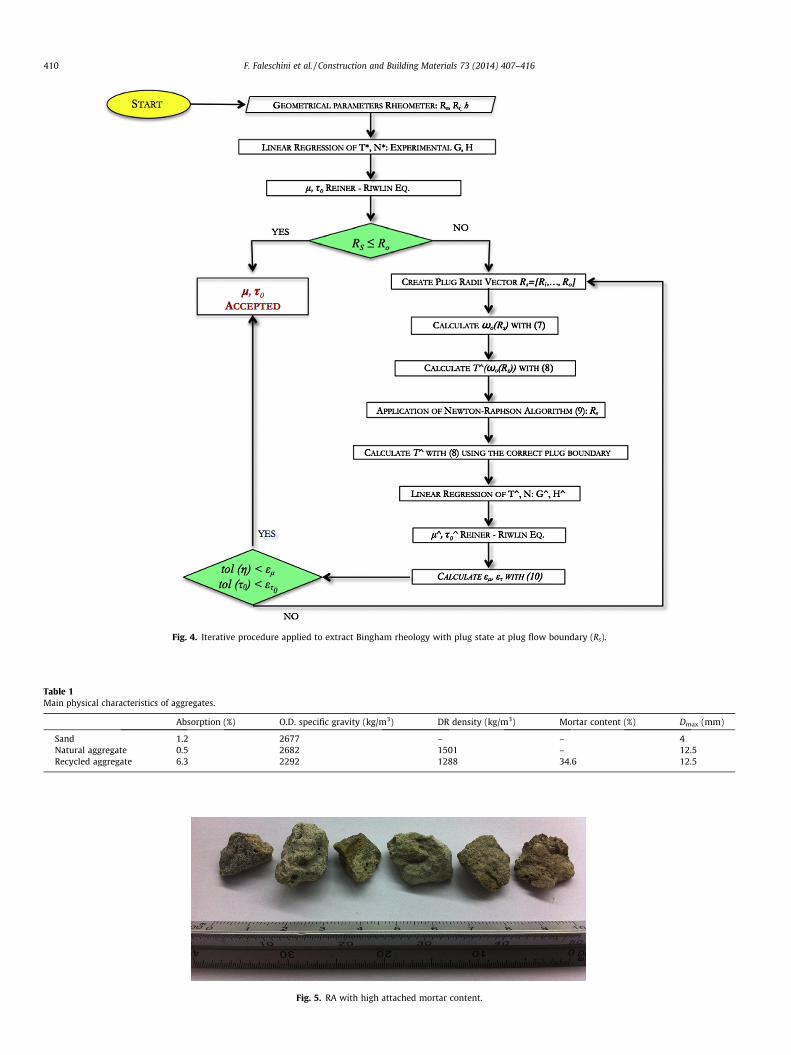
Fig. 4. Iterative procedure applied to extract Bingham rheology with plug state at plug flow boundary (Rs).
Table 1Main physical characteristics of aggregates.
Absorption (%) O.D. specific gravity (kg/m3) DR density (kg/m3) Mortar content (%) Dmax (mm)
Sand 1.2 2677 – – 4Natural aggregate 0.5 2682 1501 – 12.5Recycled aggregate 6.3 2292 1288 34.6 12.5
Fig. 5. RA with high attached mortar content.
410 F. Faleschini et al. / Construction and Building Materials 73 (2014) 407–416
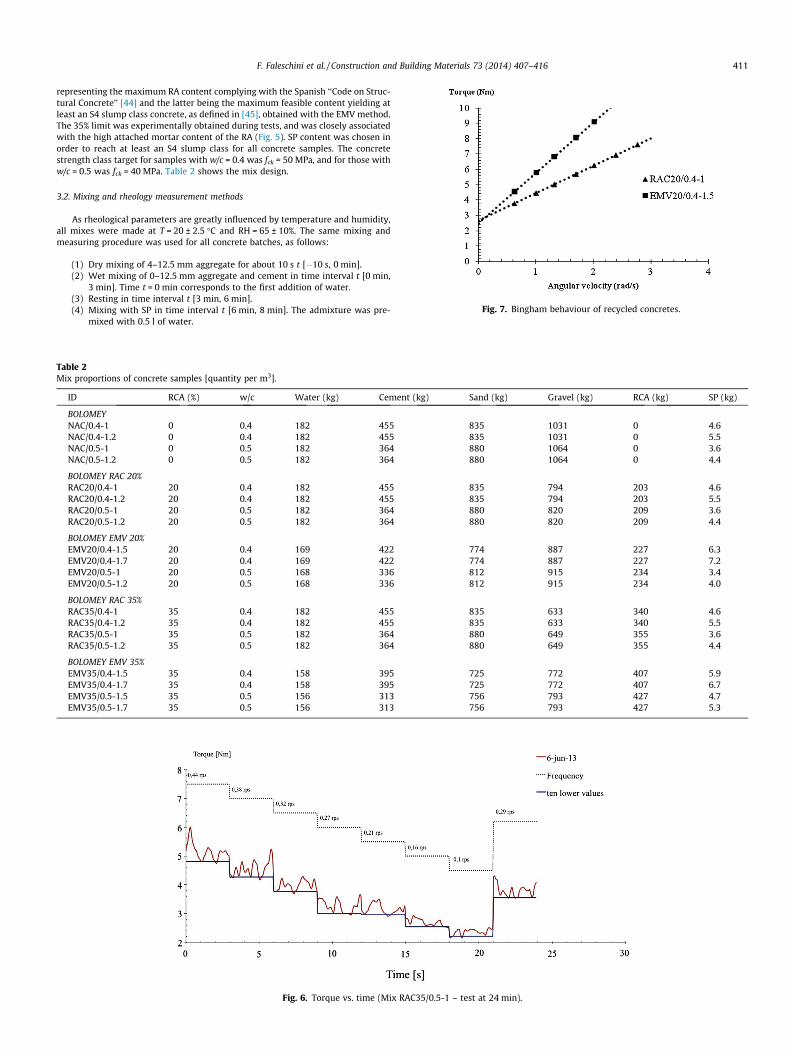
Fig. 7. Bingham behaviour of recycled concretes.
F. Faleschini et al. / Construction and Building Materials 73 (2014) 407–416 411
representing the maximum RA content complying with the Spanish ‘‘Code on Struc-tural Concrete’’ [44] and the latter being the maximum feasible content yielding atleast an S4 slump class concrete, as defined in [45], obtained with the EMV method.The 35% limit was experimentally obtained during tests, and was closely associatedwith the high attached mortar content of the RA (Fig. 5). SP content was chosen inorder to reach at least an S4 slump class for all concrete samples. The concretestrength class target for samples with w/c = 0.4 was fck = 50 MPa, and for those withw/c = 0.5 was fck = 40 MPa. Table 2 shows the mix design.
3.2. Mixing and rheology measurement methods
As rheological parameters are greatly influenced by temperature and humidity,all mixes were made at T = 20 ± 2.5 �C and RH = 65 ± 10%. The same mixing andmeasuring procedure was used for all concrete batches, as follows:
(1) Dry mixing of 4–12.5 mm aggregate for about 10 s t [�10 s, 0 min].(2) Wet mixing of 0–12.5 mm aggregate and cement in time interval t [0 min,
3 min]. Time t = 0 min corresponds to the first addition of water.(3) Resting in time interval t [3 min, 6 min].(4) Mixing with SP in time interval t [6 min, 8 min]. The admixture was pre-
mixed with 0.5 l of water.
Table 2Mix proportions of concrete samples [quantity per m3].
ID RCA (%) w/c Water (kg) Cement (kg) Sand (kg) Gravel (kg) RCA (kg) SP (kg)
BOLOMEYNAC/0.4-1 0 0.4 182 455 835 1031 0 4.6NAC/0.4-1.2 0 0.4 182 455 835 1031 0 5.5NAC/0.5-1 0 0.5 182 364 880 1064 0 3.6NAC/0.5-1.2 0 0.5 182 364 880 1064 0 4.4
BOLOMEY RAC 20%RAC20/0.4-1 20 0.4 182 455 835 794 203 4.6RAC20/0.4-1.2 20 0.4 182 455 835 794 203 5.5RAC20/0.5-1 20 0.5 182 364 880 820 209 3.6RAC20/0.5-1.2 20 0.5 182 364 880 820 209 4.4
BOLOMEY EMV 20%EMV20/0.4-1.5 20 0.4 169 422 774 887 227 6.3EMV20/0.4-1.7 20 0.4 169 422 774 887 227 7.2EMV20/0.5-1 20 0.5 168 336 812 915 234 3.4EMV20/0.5-1.2 20 0.5 168 336 812 915 234 4.0
BOLOMEY RAC 35%RAC35/0.4-1 35 0.4 182 455 835 633 340 4.6RAC35/0.4-1.2 35 0.4 182 455 835 633 340 5.5RAC35/0.5-1 35 0.5 182 364 880 649 355 3.6RAC35/0.5-1.2 35 0.5 182 364 880 649 355 4.4
BOLOMEY EMV 35%EMV35/0.4-1.5 35 0.4 158 395 725 772 407 5.9EMV35/0.4-1.7 35 0.4 158 395 725 772 407 6.7EMV35/0.5-1.5 35 0.5 156 313 756 793 427 4.7EMV35/0.5-1.7 35 0.5 156 313 756 793 427 5.3
Fig. 6. Torque vs. time (Mix RAC35/0.5-1 – test at 24 min).
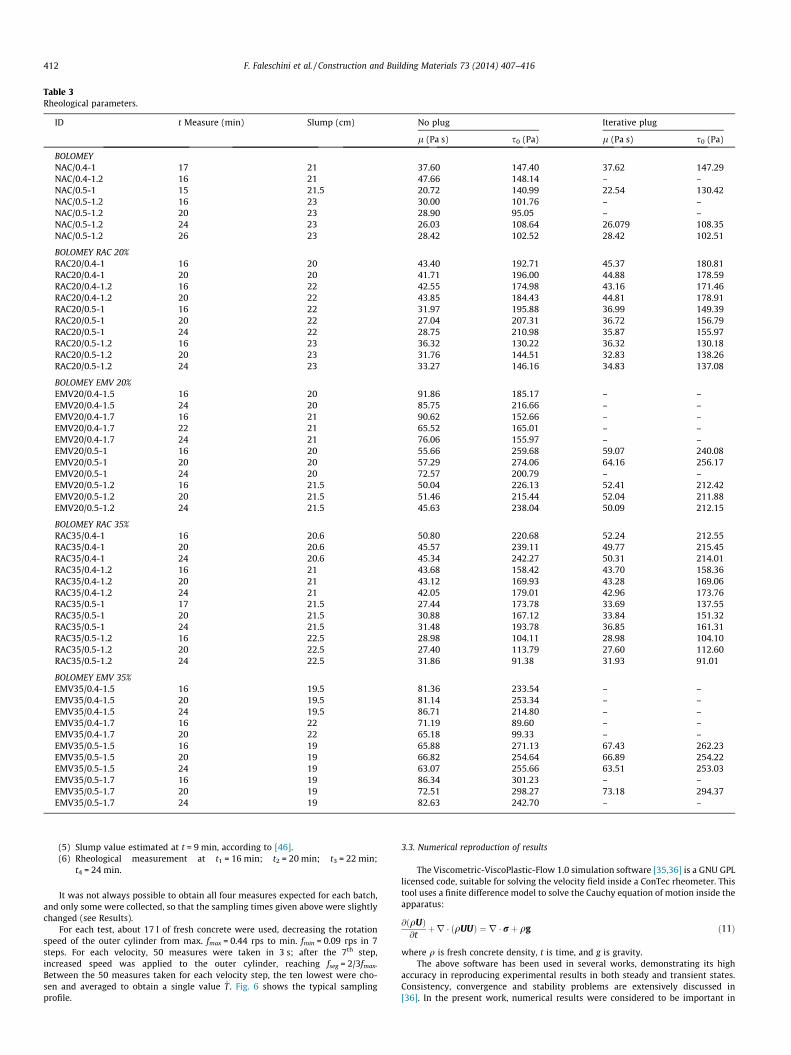
Table 3Rheological parameters.
ID t Measure (min) Slump (cm) No plug Iterative plug
l (Pa s) s0 (Pa) l (Pa s) s0 (Pa)
BOLOMEYNAC/0.4-1 17 21 37.60 147.40 37.62 147.29NAC/0.4-1.2 16 21 47.66 148.14 – –NAC/0.5-1 15 21.5 20.72 140.99 22.54 130.42NAC/0.5-1.2 16 23 30.00 101.76 – –NAC/0.5-1.2 20 23 28.90 95.05 – –NAC/0.5-1.2 24 23 26.03 108.64 26.079 108.35NAC/0.5-1.2 26 23 28.42 102.52 28.42 102.51
BOLOMEY RAC 20%RAC20/0.4-1 16 20 43.40 192.71 45.37 180.81RAC20/0.4-1 20 20 41.71 196.00 44.88 178.59RAC20/0.4-1.2 16 22 42.55 174.98 43.16 171.46RAC20/0.4-1.2 20 22 43.85 184.43 44.81 178.91RAC20/0.5-1 16 22 31.97 195.88 36.99 149.39RAC20/0.5-1 20 22 27.04 207.31 36.72 156.79RAC20/0.5-1 24 22 28.75 210.98 35.87 155.97RAC20/0.5-1.2 16 23 36.32 130.22 36.32 130.18RAC20/0.5-1.2 20 23 31.76 144.51 32.83 138.26RAC20/0.5-1.2 24 23 33.27 146.16 34.83 137.08
BOLOMEY EMV 20%EMV20/0.4-1.5 16 20 91.86 185.17 – –EMV20/0.4-1.5 24 20 85.75 216.66 – –EMV20/0.4-1.7 16 21 90.62 152.66 – –EMV20/0.4-1.7 22 21 65.52 165.01 – –EMV20/0.4-1.7 24 21 76.06 155.97 – –EMV20/0.5-1 16 20 55.66 259.68 59.07 240.08EMV20/0.5-1 20 20 57.29 274.06 64.16 256.17EMV20/0.5-1 24 20 72.57 200.79 – –EMV20/0.5-1.2 16 21.5 50.04 226.13 52.41 212.42EMV20/0.5-1.2 20 21.5 51.46 215.44 52.04 211.88EMV20/0.5-1.2 24 21.5 45.63 238.04 50.09 212.15
BOLOMEY RAC 35%RAC35/0.4-1 16 20.6 50.80 220.68 52.24 212.55RAC35/0.4-1 20 20.6 45.57 239.11 49.77 215.45RAC35/0.4-1 24 20.6 45.34 242.27 50.31 214.01RAC35/0.4-1.2 16 21 43.68 158.42 43.70 158.36RAC35/0.4-1.2 20 21 43.12 169.93 43.28 169.06RAC35/0.4-1.2 24 21 42.05 179.01 42.96 173.76RAC35/0.5-1 17 21.5 27.44 173.78 33.69 137.55RAC35/0.5-1 20 21.5 30.88 167.12 33.84 151.32RAC35/0.5-1 24 21.5 31.48 193.78 36.85 161.31RAC35/0.5-1.2 16 22.5 28.98 104.11 28.98 104.10RAC35/0.5-1.2 20 22.5 27.40 113.79 27.60 112.60RAC35/0.5-1.2 24 22.5 31.86 91.38 31.93 91.01
BOLOMEY EMV 35%EMV35/0.4-1.5 16 19.5 81.36 233.54 – –EMV35/0.4-1.5 20 19.5 81.14 253.34 – –EMV35/0.4-1.5 24 19.5 86.71 214.80 – –EMV35/0.4-1.7 16 22 71.19 89.60 – –EMV35/0.4-1.7 20 22 65.18 99.33 – –EMV35/0.5-1.5 16 19 65.88 271.13 67.43 262.23EMV35/0.5-1.5 20 19 66.82 254.64 66.89 254.22EMV35/0.5-1.5 24 19 63.07 255.66 63.51 253.03EMV35/0.5-1.7 16 19 86.34 301.23 – –EMV35/0.5-1.7 20 19 72.51 298.27 73.18 294.37EMV35/0.5-1.7 24 19 82.63 242.70 – –
412 F. Faleschini et al. / Construction and Building Materials 73 (2014) 407–416
(5) Slump value estimated at t = 9 min, according to [46].(6) Rheological measurement at t1 = 16 min; t2 = 20 min; t3 = 22 min;
t4 = 24 min.
It was not always possible to obtain all four measures expected for each batch,and only some were collected, so that the sampling times given above were slightlychanged (see Results).
For each test, about 17 l of fresh concrete were used, decreasing the rotationspeed of the outer cylinder from max. fmax = 0.44 rps to min. fmin = 0.09 rps in 7steps. For each velocity, 50 measures were taken in 3 s; after the 7th step,increased speed was applied to the outer cylinder, reaching fseg = 2/3fmax.Between the 50 measures taken for each velocity step, the ten lowest were cho-sen and averaged to obtain a single value T . Fig. 6 shows the typical samplingprofile.
3.3. Numerical reproduction of results
The Viscometric-ViscoPlastic-Flow 1.0 simulation software [35,36] is a GNU GPLlicensed code, suitable for solving the velocity field inside a ConTec rheometer. Thistool uses a finite difference model to solve the Cauchy equation of motion inside theapparatus:
@ðqUÞ@t
þr � ðqUUÞ ¼ r � rþ qg ð11Þ
where q is fresh concrete density, t is time, and g is gravity.The above software has been used in several works, demonstrating its high
accuracy in reproducing experimental results in both steady and transient states.Consistency, convergence and stability problems are extensively discussed in[36]. In the present work, numerical results were considered to be important in
F. Faleschini et al. / Construction and Building Materials 73 (2014) 407–416 413
analysing shear rate, shear stress and velocity field inside the rheometer, to under-stand the influence of gravel migration. Stationary analyses were conducted at var-ious rotational speeds, comparing the analytical (calculated with Eq. (4)) andnumerical results of the velocity fields. Grid spacing in directions r and z was uni-form and equal to Dr = Dz = 1 mm (about 19,500 grid points); Dirichlet boundaryconditions were placed both on the whole inner cylinder and the outer one (includ-ing its bottom); a Neumann boundary condition was placed at the air-concreteinterface (at the top of the tested batch). Regularisation parameter d was chosenaccording to the required approximation degree of the results and an acceptablecomputational cost (for further details of code, see [36]).
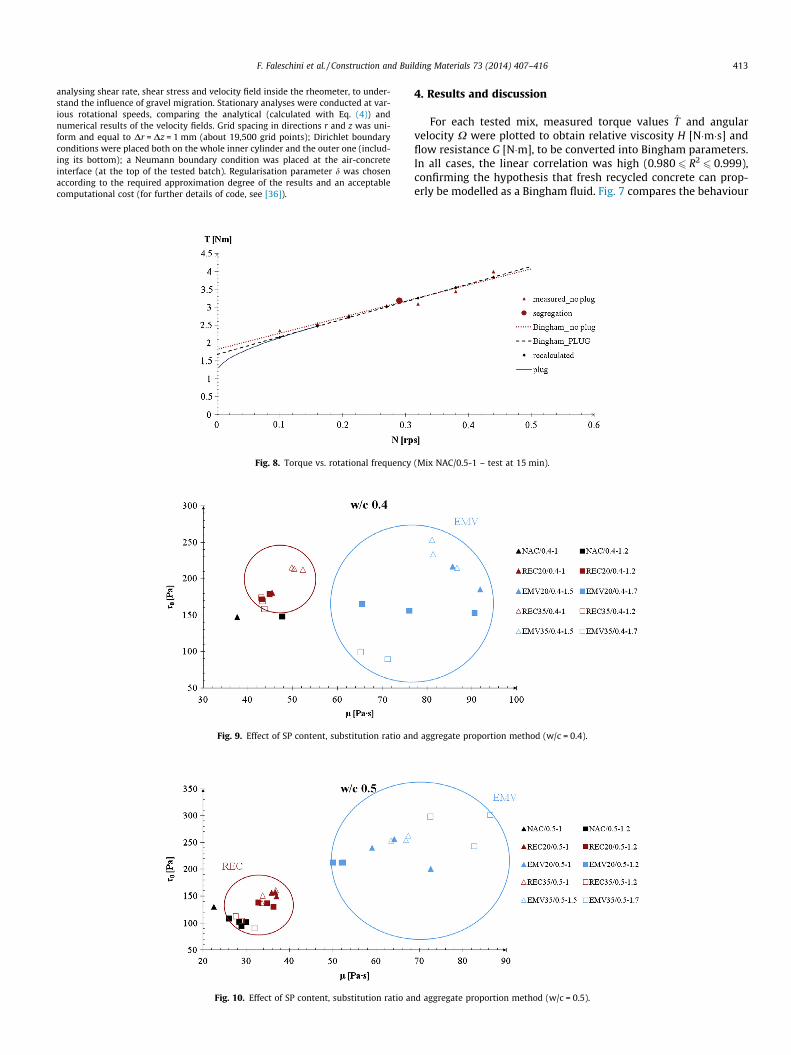
Fig. 8. Torque vs. rotational frequency
Fig. 9. Effect of SP content, substitution ratio an
Fig. 10. Effect of SP content, substitution ratio an
4. Results and discussion
For each tested mix, measured torque values T and angularvelocity X were plotted to obtain relative viscosity H [N�m�s] andflow resistance G [N�m], to be converted into Bingham parameters.In all cases, the linear correlation was high (0.980 6 R2
6 0.999),confirming the hypothesis that fresh recycled concrete can prop-erly be modelled as a Bingham fluid. Fig. 7 compares the behaviour
(Mix NAC/0.5-1 – test at 15 min).
d aggregate proportion method (w/c = 0.4).
d aggregate proportion method (w/c = 0.5).
414 F. Faleschini et al. / Construction and Building Materials 73 (2014) 407–416
of two recycled samples with the same substitution ratio (20%), w/cratio (0.4) and slump s = 20 cm, but proportioned with the twoabove methods. Measures refer to the same testing time, 16 minafter the first addition of water. Here, the increased quantity ofSP in the EMV batches (1.5%) lowered the yield stress, as in theRAC (1%) mixes. The ability of SP to reduce yield stress in the samemanner for EMV and RAC batches was experimentally observed inall mixes at w/c = 0.4. Conversely, the EMV method caused a greatincrease in plastic viscosity, clearly seen in the slope of the twocurves in Fig. 7.
Experimental results are listed in Table 3: rheological parame-ters were developed by both neglecting and considering plug flow.When s0 was too high for full shearing in the gap between thecylinders of the apparatus, large differences were found in therheological measures computed with the two methods. These dis-crepancies were generally less than 5% for both estimated viscosityand yield stress, as also confirmed by other literature data [36].Instead, in a few cases, plug flow could not be neglected, as it lastedeven at higher rotational speeds, i.e., at higher values of the s0/lratio. Fig. 8 shows an example of the recalculation of Binghamparameters for mix NAC/0.5-1, characterised by Dl = 8.77% andDs0 = �7.5%, s0/l = 5.79 and Np = 0.16 rps.
Rheological parameters are also shown as rheographs, whichcompare the various mixes in a simplified way, enabling evaluationof the effect of a single parameter on the complete rheologicalbehaviour of the samples [47]. Figs. 9 and 10 show Bingham
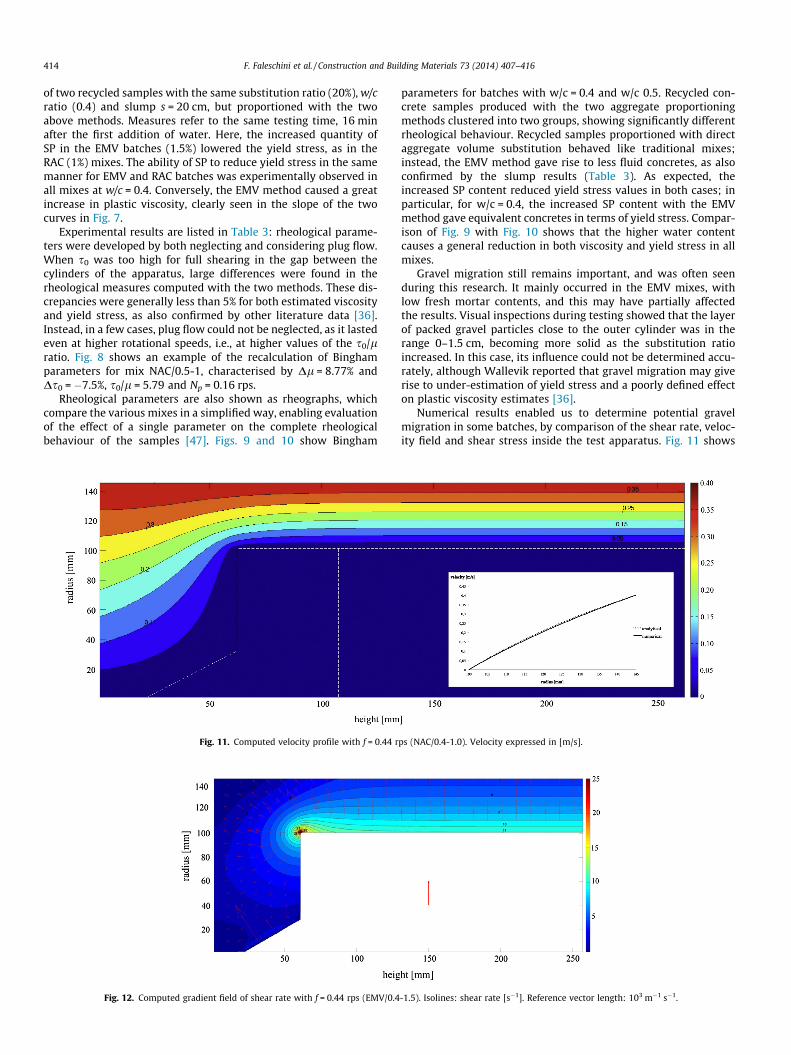
Fig. 11. Computed velocity profile with f = 0.44 r
Fig. 12. Computed gradient field of shear rate with f = 0.44 rps (EMV/0.4
parameters for batches with w/c = 0.4 and w/c 0.5. Recycled con-crete samples produced with the two aggregate proportioningmethods clustered into two groups, showing significantly differentrheological behaviour. Recycled samples proportioned with directaggregate volume substitution behaved like traditional mixes;instead, the EMV method gave rise to less fluid concretes, as alsoconfirmed by the slump results (Table 3). As expected, theincreased SP content reduced yield stress values in both cases; inparticular, for w/c = 0.4, the increased SP content with the EMVmethod gave equivalent concretes in terms of yield stress. Compar-ison of Fig. 9 with Fig. 10 shows that the higher water contentcauses a general reduction in both viscosity and yield stress in allmixes.
Gravel migration still remains important, and was often seenduring this research. It mainly occurred in the EMV mixes, withlow fresh mortar contents, and this may have partially affectedthe results. Visual inspections during testing showed that the layerof packed gravel particles close to the outer cylinder was in therange 0–1.5 cm, becoming more solid as the substitution ratioincreased. In this case, its influence could not be determined accu-rately, although Wallevik reported that gravel migration may giverise to under-estimation of yield stress and a poorly defined effecton plastic viscosity estimates [36].
Numerical results enabled us to determine potential gravelmigration in some batches, by comparison of the shear rate, veloc-ity field and shear stress inside the test apparatus. Fig. 11 shows
ps (NAC/0.4-1.0). Velocity expressed in [m/s].
-1.5). Isolines: shear rate [s�1]. Reference vector length: 103 m�1 s�1.
F. Faleschini et al. / Construction and Building Materials 73 (2014) 407–416 415
the computed velocity field (expressed in m/s) for the NAC/0.4–1.0mix at fmax = 0.44 rps; the error between computed and analyticalvelocity, evaluated with Eq. (4) in the z-independence zone, wheretorque T was experimentally measured, is clear in the graph.Reducing regularisation parameter d (Fig. 11: d = 10�3) led to animprovement in fitting experimental results and reducing errors.However, the computational cost of the numerical simulationincreased rapidly when d was reduced.
The numerical results show that EMV batches generally have ahigh concentration of shear stress, due to the higher rheologicalparameter values. However, it is worth noting that the directionand potential of gravel migration are governed by the gradient ofthe shear rate, i.e., its spatial change. The gradient field of the shearrate is shown in Fig. 12, for the EMV/0.4–1.5 mix, at fmax = 0.44 rps:the isolines show the shear rate and the arrows the shear rate gra-dient. Their magnitude can be compared with the length of the ref-erence vector, equal to 103 m�1s�1. Fig. 12 shows the potential forgravel migration, which means that a zone filled by fat concretemay form near large vectors.
5. Conclusions
This work presents the first experimental results on the rheo-logical properties of recycled aggregate concrete, according to var-ious aggregate proportioning methods. The test results allow thefollowing conclusions to be drawn:
– Recycled aggregate concrete (RAC) can be modelled as a Bing-ham fluid, and viscosity l and yield stress s0 can properlydescribe its rheological behaviour.
– The mix proportioning method greatly affects rheologicalparameters. In particular, the EMV method strongly reducesslump and thus causes an increase in yield stress. The methodalso affects plastic viscosity. However, the EMV method allowssavings in the amount of cement required, depending on mix, ofup to 14% in the cases examined here, and at the same time therequired strength class can be reached (see Section 3.1).
– The increased SP content in EMV batches may not be sufficientto allow rheological behaviour similar to that of RAC, althoughthe same slump values may be reached. Further research withother admixtures, such as air-entrainers, may help to reachthe same rheological behaviour of conventionally proportionedconcrete for EMV samples.
– The rheological measures of recycled aggregate are subject totwo concomitant phenomena, plug flow and gravel migration.The former may be treated by varying the boundary positionwhen analytically solving the inverse Couette problem for aBingham fluid. Plug flow generally caused errors of ±5% in bothl and s0; this error may increase for mixes with high yieldstress. Gravel migration mainly occurred in the EMV batches,with low fresh mortar content.
– Gravel migration still remains an open question, which must becarefully taken into account when analysing experimentalresults. In order to reduce the possibility of migration duringviscometer measurements, reduced rotational speed appliedto the outer cylinder of the apparatus will be considered infurther experimental campaigns. This solution may havebeneficial effects in lowering the shear rate gradient insidethe viscometer.
Acknowledgements
This research was carried out at the Universitat Politècnica deCatalunya, Spain. This work was also made possible by the
financial support of Fondazione Ing. Aldo Gini, Italy. The authorswould also like to thank all the technical staff of the UPClaboratories.
References
[1] Vázquez E, Barra M, Aponte D, Jiménez C, Valls S. Improvement of the durabilityof concrete with recycled aggregates in chloride exposed environment. ConstrBuild Mater 2013. http://dx.doi.org/10.1016/j.conbuildmat.2013.11.028.
[2] Marinkovic S, Radonjanin V, Malešev M, Ignjatovic I. Comparativeenvironmental assessment of natural and recycled aggregate concrete. WasteManage 2010;30:2255–64.
[3] Lima C, Caggiano A, Faella C, Martinelli E, Pepe M, Realfonzo R. Physicalproperties and mechanical behaviour of concrete made with recycledaggregates and fly ash. Constr Build Mater 2013;47:547–59.
[4] Dinelli G, Belz G, Majorana CE, Schrefler BA. Experimental investigation on theuse of fly ash for lightweight precast structural elements. Mater Struct1996;29:632–8.
[5] Khanzadi M, Behnood A. Mechanical properties of high-strength concreteincorporating copper slag as coarse aggregate. Constr Build Mater 2009;23–6:2183–8.
[6] Pellegrino C, Cavagnis P, Faleschini F, Brunelli K. Properties of concretes withblack/oxidizing electric arc furnace slag aggregate. Cem Concr Compos2013;37:232–40.
[7] Pellegrino C, Faleschini F. Experimental behavior of reinforced concrete beamswith electric arc furnace slag as recycled aggregate. ACI Mater J 2013;110–2:197–206.
[8] Pellegrino C, Gaddo V. Mechanical and durability characteristics of concretecontaining EAF slag as aggregate. Cem Concr Compos 2009;31–9:663–71.
[9] European Committee for Standardization. EN 12620 Aggregates forConcrete. Belgium: Brussels; 2013.
[10] Kou S, Poon C-S, Agrela F. Comparisons of natural and recycled aggregateconcretes prepared with the addition of different mineral admixtures. CemConcr Compos 2011;33–8:788–95.
[11] Schubert S, Hoffmann C, Leemann A, Moser K, Motavalli M. Recycled aggregateconcrete: experimental shear resistance of slabs without shear reinforcement.Eng Struct 2012;41:490–7.
[12] Kou S, Poon C-S, Etxeberria M. Influence of recycled aggregates on long termmechanical properties and pore size distribution of concrete. Cem ConcrCompos 2011;33–2:286–91.
[13] Fathifazl G, Abbas A, Razaqpur AG, Isgor OB, Fournier B, Foo S. New mixtureproportioning method for concrete made with coarse recycled concreteaggregate. J Mater Civil Eng 2009:601–11.
[14] Abbas A, Fathifazl G, Isgor OB, Razaqpur AG, Fournier B, Foo S. Durability ofrecycled aggregate concrete designed with equivalent mortar volume method.Cem Concr Compos 2009;31:555–63.
[15] Jiménez C, Aponte D, Vázquez E, Barra M, Valls S. Equivalent mortar volume(EMV) method for proportioning recycled aggregate concrete: validationunder the Spanish context and its adaptation to Bolomey methodology forconcrete proportioning. Mater Constr 2013;63–311:341–60.
[16] Corinaldesi V, Moriconi G. Recycling of rubble from building demolition forlow-shrinkage concretes. Waste Manage 2010;30–4:655–9.
[17] Barbudo A, de Brito J, Evangelista L, Bravo M, Agrela F. Influence of water-reducing admixtures on the mechanical performance of recycled concrete. JClean Prod 2013;59:93–8.
[18] Ferreira L, de Brito J, Barra M. Influence of the pre-saturation of recycled coarseconcrete aggregates on concrete properties. Mag Concrete Res 2012;63–8:617–27.
[19] de Brito J, Saikia N. Recycled aggregate in concrete. In: Use of industrial,construction and demolition waste. London: Springer; 2013.
[20] Knaac AM, Kurama YC. Rheological and mechanical behavior of concretemixtures with recycled concrete aggregates. Structures congress2012. Chicago (US): American Society of Civil Engineers; 2012. p. 2257–67.
[21] Knaack AM, Kurama YC. Design of normal strength concrete mixtures withrecycled concrete aggregates. Structures congress 2011. Las Vegas(US): American Society of Civil Engineers; 2011. p. 3068–79.
[22] Wallevik JE. Relationship between the Bingham parameters and slump. CemConcr Res 2006;36–7:1214–21.
[23] Tattersall GH, Banfill PFG. The rheology of fresh concrete. Great Britain: PitmanBooks Limited; 1983.
[24] Neville AM. Chairman’s summary, fresh concrete: important properties andtheir measurement. Proceedings of RILEM Seminar. Great Britain: University ofLeeds; 1973.
[25] Ferraris CF, Obla KH, Hill R. The influence of mineral admixtures on therheology of cement paste and concrete. Cem Concr Res 2001;31–2:245–55.
[26] Hu C, de Larrard F. The rheology of fresh high-performance concrete. CemConcr Res 1996;26–2:283–94.
[27] Feys D, Verhoeven R, De Schutter G. Fresh self compacting concrete, a shearthickening material. Cem Concr Res 2008;38:920–9.
[28] Mahmoodzadeh F, Chidiac SE. Rheological models for predicting plasticviscosity and yield stress of fresh concrete. Cem Concr Res 2013;49:1–9.
[29] Ferraris CF. Measurement of rheological properties of high performanceconcrete: state of the art report. NISTIR 5869. Gaithersburg, MD, US: NationalInstitute of Standards and Technology; 1996.
416 F. Faleschini et al. / Construction and Building Materials 73 (2014) 407–416
[30] Ferraris CF, de Larrard F. Fresh concrete rheology: recent developments.Materials science of concrete VI. In: Sidney Mindess, Jan Skalny, editors. 735Ceramic Place, Westerville, OH 43081: The American Ceramic Society; 2001.p. 215–41.
[31] Powers TC, Wiler EM. A device for studying the workability of concrete. Proc ofthe ASTM 41. Philadelphia, US: American Society for Testing and Materials;1941. p. 1003–15.
[32] Powers TC. The properties of fresh concrete. US: John Wiley & Sons Inc.; 1968.[33] Wallevik OH, Gjørv OE. In: Wierig HJ, editor. 10th Proc of the RILEM
colloquium: properties of fresh concrete. London: Chapman & Hall; 1990. p.213–24.
[34] Wallevik OH. The rheology of fresh concrete and its application on concretewith and without silica fume. The Norwegian Institute of Technology, Dr. Ing.Thesis no. 1990:45, Trondheim, Norway; 1990.
[35] Wallevik JE. Minimizing end-effects in the coaxial cylinders viscometer:viscoplastic flow inside the ConTec BML Viscometer 3. J Non-Newton FluidMech 2008;155:116–23.
[36] Wallevik JE. Rheology of particle suspensions, fresh concrete, mortar andcement paste with various types of lignosulfonates. Department of StructuralEngineering, The Norwegian University of Science and Technology, Ph.D.Thesis, Trondheim, Norway; 2003.
[37] Ferraris CF, Brower LE. Comparison of concrete rheometers: International testsat LCPC (Nantes, France) in October, 2000. NISTIR 6819; 2001.
[38] Reiner M. Deformation and flow. Great Britain: An Elementary Introduction toTheoretical Rheology. H.K. Lewis & Co. Limited; 1949.
[39] Heirman G, Vandewalle L, Van Gemerta D, Wallevik O. Integration approach ofthe Couette inverse problem of powder type self-compacting concrete in awide-gap concentric cylinder rheometer. J Non-Newton Fluid Mech2008;150:93–103.
[40] Heirman G, Hendrickx R, Vandewalle L, Van Gemert D, Feys D, De Schutter G,et al. Integration approach of the Couette inverse problem of powder type self-compacting concrete in a wide-gap concentric cylinder rheometer. Part II.Influence of mineral additions and chemical admixtures on the shearthickening flow behaviour. Cem Concr Res 2009;39:171–81.
[41] Feys D, Wallevik JE, Yahia A, Khayat KH, Wallevik OH. Extension of the Reiner–Riwlin equation to determine modified Bingham parameters measured incoaxial cylinders rheometers. Mater Struct 2013;46:289–311.
[42] Leighton D, Acrivos A. The shear-induced migration of particles inconcentrated suspensions. J Fluid Mech 1987;181:415–39.
[43] Lecompte T, Perrot A, Picandet V, Bellegou H, Amziane S. Cement-basedmixes: shearing properties and pore pressure. Cem Concr Res 2012;42–1:139–47.
[44] Comisión Permanente Del Hormigón: Instrucción de Hormigón Estructural,EHE-08. Ministerio de Fomento, Madrid.
[45] EN 206-1, Concrete – Part 1: Specification, Performance, Production andConformity. Comité Européen de Normalisation, Brussels, Belgium; 2006.
[46] EN 12350-2. Testing fresh concrete – Part 2: Slump Test, Comité Européen deNormalisation, Brussels, Belgium; 2009.
[47] Wallevik OH, Wallevik JE. Rheology as a tool in concrete science: the use ofrheographs and workability boxes. Cem Concr Res 2011;41:1279–88.
Related Documents


