REVIEW COPY NOT FOR DISTRIBUTION Rheology of cohesive granular materials across multiple dense-flow regimes Yile Gu, Sebastian Chialvo, and Sankaran Sundaresan Chemical and Biological Engineering Department, Princeton University, Princeton, New Jersey 08540, USA (Dated: August 26, 2014) We investigate the dense-flow rheology of cohesive granular materials through discrete element simulations of homogeneous, simple shear flows of frictional, cohesive, spherical particles. Dense shear flows of non-cohesive granular materials exhibit three regimes: quasistatic, inertial, and inter- mediate, which persist for cohesive materials as well. It is found that cohesion results in bifurcation of the inertial regime into two regimes: (a) a new rate-independent regime and (b) an inertial regime. Transition from rate-independent cohesive regime to inertial regime occurs when the kinetic energy supplied by shearing is sufficient to overcome the cohesive energy. Simulations reveal that inhomogeneous shear band forms in the vicinity of this transition, which is more pronounced at lower particle volume fractions. We propose a rheological model for cohesive systems that captures the simulation results across all four regimes. I. INTRODUCTION Flows of dense granular materials occur in both natu- ral and industrial processes and exhibit a variety of dis- tinct rheological behaviors. For non-cohesive particles, three flow regimes have been identified – namely, the qua- sistatic, inertial, and intermediate regimes [1–4] – each of which manifests different scalings of the mean stresses with shear rate and volume fraction. Numerous consti- tutive stress models have been constructed with these scalings in mind [2, 3, 5–10]. However, many granular flows involve cohesive interparticle forces for which the above models do not account. These cohesive effects are the primary focus of the present study. Cohesion can result from a variety of sources – includ- ing van der Waals forces [11, 12], electrostatic forces [13], capillary forces [14], and solid bridges [15] – and has a strong impact on granular rheology. For example, ag- glomeration of particles has been observed in simula- tions of cohesive granular materials in various flow ge- ometries [16–21]. Annular shear flow experiments [22] and plane shear simulations [18, 20, 23] have shown that cohesion increases the shear stress ratio η, defined as the ratio of shear stress τ to pressure p. Both simu- lations and experiments have shown that the discharge flow rate from a hopper decreases with increasing cohe- sion [24]. Rotating-drum experiments reveal that cohe- sion increases avalanche size and leads to robust pattern formation on the surface [25–27]. Despite the number of such phenomenological studies, there is relatively little literature on constituting the rheological effects of cohe- sion. One notable work is that of Rognon et al. [20], which presents modifications to friction and dilatancy laws for non-cohesive particles to account for the effects of cohesion observed in 2-D simulations. The present study goes beyond these earlier studies by exposing how the regime map for non-cohesive materials [1–4] is altered by the introduction of cohesion and formulating explicit models for the mean stresses. In this paper, we investigate the rheology of cohe- sive granular materials through discrete element method (DEM) simulations of homogeneous, simple shear flows of frictional and cohesive particles. Most of the simu- lations presented here are based on a linear (Hookean) spring-dashpot model [28] for particle-particle interaction and a commonly used model for van der Waals force be- tween particles [29]. The quasistatic regime where the stress is proportional to spring stiffness (and indepen- dent of shear rate), the inertial regime where stress is proportional to square of shear rate (and independent of spring stiffness), and the intermediate regime where stress depends on both shear rate and spring stiffness – reported previously for non-cohesive particles [2] – persist even when cohesion is added. The presence of cohesion is found to introduce a new rate-independent regime where the stress depends on the strength of cohesion. These regimes persist when the Hookean contact model is re- placed by a Hertzian contact model as well as when the van der Waals force model is replaced with an alternate cohesion model proposed by Rognon et al. [20], illus- trating the robustness of these regimes. Finally, we also modify the blended stress model proposed by Chialvo et al. [2] for dense flows of non-cohesive particles to obtain an analogous model for dense flow of cohesive particles. II. SIMULATION METHODS The DEM simulations [28] were performed using the molecular dynamics package LAMMPS [30]. Particles interact via repulsive spring-dashpot contact forces and attractive cohesive forces. In the spring-dashpot model, the normal and tangential contact forces on a spherical particle i resulting from the contact of two spheres i and j with same diameter d are F nij = f ( δ ij d 4 )[k n δ ij n ij − γ n m eff v nij ], (1) F tij = f ( δ ij d 4 )[−k t u tij − γ t m eff v tij ], (2) where δ ij is the overlap distance, k n and k t are spring elastic constants, γ n and γ t are viscous damping con-

Welcome message from author
This document is posted to help you gain knowledge. Please leave a comment to let me know what you think about it! Share it to your friends and learn new things together.
Transcript
REVIEW
COPY
NOT FOR D
ISTRIB
UTION
Rheology of cohesive granular materials across multiple dense-flow regimes
Yile Gu, Sebastian Chialvo, and Sankaran SundaresanChemical and Biological Engineering Department,
Princeton University, Princeton, New Jersey 08540, USA
(Dated: August 26, 2014)
We investigate the dense-flow rheology of cohesive granular materials through discrete elementsimulations of homogeneous, simple shear flows of frictional, cohesive, spherical particles. Denseshear flows of non-cohesive granular materials exhibit three regimes: quasistatic, inertial, and inter-mediate, which persist for cohesive materials as well. It is found that cohesion results in bifurcationof the inertial regime into two regimes: (a) a new rate-independent regime and (b) an inertialregime. Transition from rate-independent cohesive regime to inertial regime occurs when the kineticenergy supplied by shearing is sufficient to overcome the cohesive energy. Simulations reveal thatinhomogeneous shear band forms in the vicinity of this transition, which is more pronounced atlower particle volume fractions. We propose a rheological model for cohesive systems that capturesthe simulation results across all four regimes.
I. INTRODUCTION
Flows of dense granular materials occur in both natu-ral and industrial processes and exhibit a variety of dis-tinct rheological behaviors. For non-cohesive particles,three flow regimes have been identified – namely, the qua-sistatic, inertial, and intermediate regimes [1–4] – eachof which manifests different scalings of the mean stresseswith shear rate and volume fraction. Numerous consti-tutive stress models have been constructed with thesescalings in mind [2, 3, 5–10]. However, many granularflows involve cohesive interparticle forces for which theabove models do not account. These cohesive effects arethe primary focus of the present study.Cohesion can result from a variety of sources – includ-
ing van der Waals forces [11, 12], electrostatic forces [13],capillary forces [14], and solid bridges [15] – and has astrong impact on granular rheology. For example, ag-glomeration of particles has been observed in simula-tions of cohesive granular materials in various flow ge-ometries [16–21]. Annular shear flow experiments [22]and plane shear simulations [18, 20, 23] have shown thatcohesion increases the shear stress ratio η, defined asthe ratio of shear stress τ to pressure p. Both simu-lations and experiments have shown that the dischargeflow rate from a hopper decreases with increasing cohe-sion [24]. Rotating-drum experiments reveal that cohe-sion increases avalanche size and leads to robust patternformation on the surface [25–27]. Despite the number ofsuch phenomenological studies, there is relatively littleliterature on constituting the rheological effects of cohe-sion. One notable work is that of Rognon et al. [20],which presents modifications to friction and dilatancylaws for non-cohesive particles to account for the effectsof cohesion observed in 2-D simulations. The presentstudy goes beyond these earlier studies by exposing howthe regime map for non-cohesive materials [1–4] is alteredby the introduction of cohesion and formulating explicitmodels for the mean stresses.In this paper, we investigate the rheology of cohe-
sive granular materials through discrete element method
(DEM) simulations of homogeneous, simple shear flowsof frictional and cohesive particles. Most of the simu-lations presented here are based on a linear (Hookean)spring-dashpot model [28] for particle-particle interactionand a commonly used model for van der Waals force be-tween particles [29]. The quasistatic regime where thestress is proportional to spring stiffness (and indepen-dent of shear rate), the inertial regime where stress isproportional to square of shear rate (and independentof spring stiffness), and the intermediate regime wherestress depends on both shear rate and spring stiffness –reported previously for non-cohesive particles [2] – persisteven when cohesion is added. The presence of cohesion isfound to introduce a new rate-independent regime wherethe stress depends on the strength of cohesion. Theseregimes persist when the Hookean contact model is re-placed by a Hertzian contact model as well as when thevan der Waals force model is replaced with an alternatecohesion model proposed by Rognon et al. [20], illus-trating the robustness of these regimes. Finally, we alsomodify the blended stress model proposed by Chialvo etal. [2] for dense flows of non-cohesive particles to obtainan analogous model for dense flow of cohesive particles.
II. SIMULATION METHODS
The DEM simulations [28] were performed using themolecular dynamics package LAMMPS [30]. Particlesinteract via repulsive spring-dashpot contact forces andattractive cohesive forces. In the spring-dashpot model,the normal and tangential contact forces on a sphericalparticle i resulting from the contact of two spheres i andj with same diameter d are
Fnij= f(
δijd
4)[knδijnij − γnmeffvnij
], (1)
Ftij = f(δijd
4)[−ktutij − γtmeffvtij ], (2)
where δij is the overlap distance, kn and kt are springelastic constants, γn and γt are viscous damping con-
2
stants, meff = mimj/(mi + mj) is the effective mass ofspheres with masses mi and mj , vnij
and vtij are thenormal and tangential components of relative particlevelocity, and utij is the elastic shear displacement. ForHookean contact, f(x) = 1, while for Hertzian contact,f(x) =
√x. The magnitude of tangential force is lim-
ited by a static yield criterion, |Ftij | ≤ µ|Fnij|, where
µ is the particle friction coefficient. We set values ofkt/kn = 2/7 [31] and γt = 0. For Hookean contact,for the default case, γn is chosen such that the restitu-
tion coefficient e = exp(
−γnπ/√
4kn/meff − γ2n
)
= 0.7.
For Hertzian contact, we employ the same value forγn/
√
kn/meff , but now the restitution coefficient e de-pends on the collision velocities.
To account for cohesion, an attractive force FCnij
isincluded so that the total normal force between the par-ticles becomes F
Tnij
= Fnij+ F
Cnij
. For van der Waalsforce model, the cohesive force between a pair of parti-cles whose surfaces separated by a distance s is writtenas [29]
FCnij
= − Ad6
6s2(s+ 2d)2(s+ d)3, (3)
where A is the Hamaker constant. It is assumed thatthe force saturates at a minimum cutoff distance, smin =θd [29]. Additionally, since the magnitude of the cohe-sive force decreases rapidly with separation distance, amaximum cutoff distance smax = d/4 [18] is used to ac-celerate the simulation process; for s > smax, cohesiveforce is neglected.
We also investigated the alternate model of Rognon etal. [20],
FCnij
= −√
4knNAδij , (4)
where NA is specified as an input. Note that, in thestatic limit, where the relative particle velocity is zero,for Hookean contact, the total normal force between twoparticles is knδij −
√
4knNAδij . Accordingly, −NA isthe maximum attractive force between the two particles,experienced when δij = NA/kn [20].
Differences between these two cohesion models are sig-nificant. The cohesive force in the van der Waals model(Eqn. (3)) is present before the particles collide and doesnot increase with overlap between particles. In Eqn. (4),the cohesive force is only present when particles are incontact and increases with extent of overlap. Neverthe-less, it will be seen that both models lead to qualitativelysimilar results, differing in quantitative details only mod-estly.
In the DEM simulations, assemblies of about 2000monodisperse particles of diameter d and density ρs areplaced in a periodic box with fixed volume V . Throughthe Lees-Edwards boundary condition [32], particles aresubjected to homogeneous steady simple shear at a shear
rate γ. The macroscopic stress tensor is calculated as
σ =1
V
∑
i
∑
j 6=i
1
2rijFij +mi(v
′i)(v
′i)
, (5)
where rij is the normal vector pointing from the center ofparticle j to that of particle i, and v
′i is the fluctuating ve-
locity of particle i relative to its mean streaming velocity.This stress tensor is further ensemble-averaged over manytime steps. Ensemble-averaged pressure and shear stresscan thus be obtained as p = (σxx+σyy +σzz)/3 and τ =σxz. The stresses and shear rate are made dimensionlessthrough scaling with d, ρs, and elasticity k = kn. Notethat the dimensions of the spring constants and damp-ing coefficients differ for Hookean and Hertzian contacts.Thus, for example, stress will be scaled using k/d and k inHookean and Hertzian contacts, respectively. As gravityis not included in the simulations, a modified Bond num-ber Bo∗ is introduced, which compares the maximum netcohesive force experienced by a particle to a characteris-tic contact force. For Hookean contact with the van derWaals force model, Bo∗ = Fmax
coh /(kd) ≈ A/(24kθ2d2),where Fmax
coh denotes the maximum cohesive force. ForHertzian contact with the van der Waals force model,Bo∗ = Fmax
coh /(kd2) ≈ A/(24kθ2d3). Simulation resultsindicate that the results are insensitive to the particularvalue for θ (1.0 × 10⁻⁵ ≤ θ ≤ 4.0 × 10⁻⁵) for specifiedvalue of Bo∗. For the results presented in this paper,θ = 4× 10⁻⁵ is chosen [18]. Finally, for Hookean contactwith the alternate cohesion model, Bo∗ = NA/(kd).
III. FLOW REGIMES
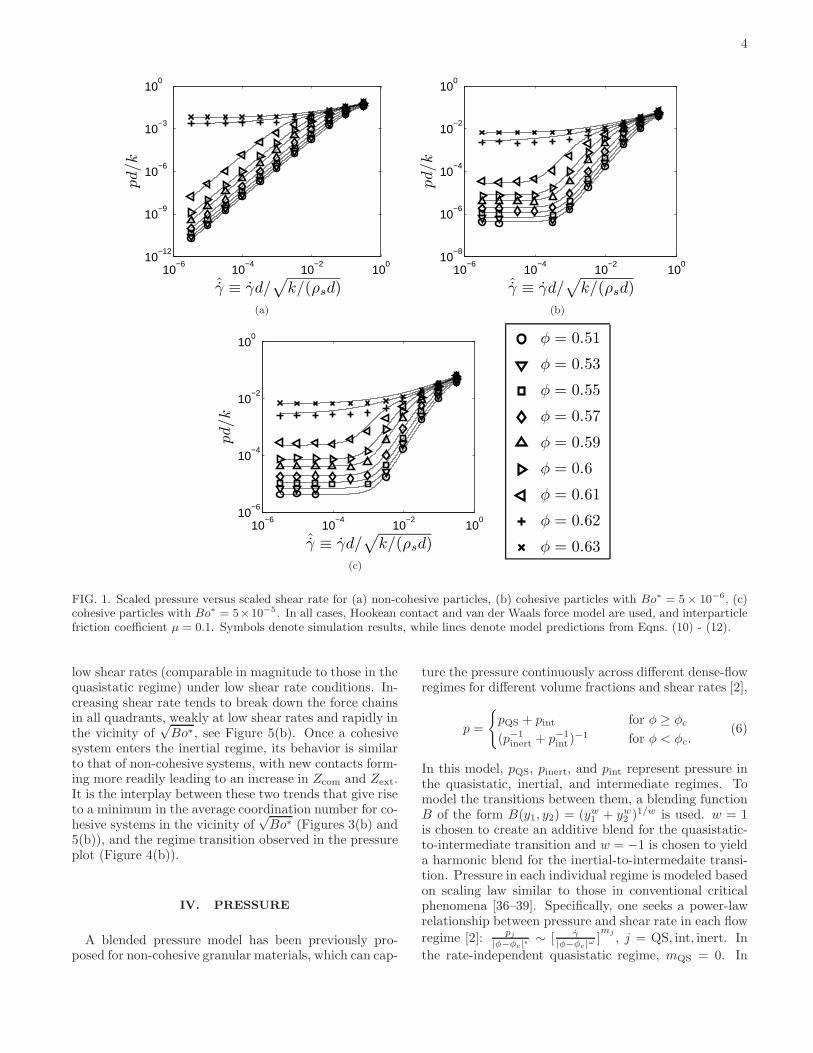
We first consider Hookean contact and van der Waalscohesion. Simulations are performed for various shearrates, volume fractions, friction coefficients, and modi-fied Bond numbers. Figure 1(a) plots the scaled pressure
pd/k against the scaled shear rate ˆγ = γd/√
k/(ρsd) fornon-cohesive particles with µ = 0.1. Three regimes arepresent [1–4]: quasistatic at low shear rates and high vol-ume fractions, inertial at low shear rates and low volumefractions, and intermediate at high shear rates and allvolume fractions. The quasistatic and inertial regimesare separated by a critical volume fraction φc which isa function of µ as summarized in Table I. When cohe-sive forces are included, however, it is found that thisregime map is modified, as shown in Figures 1(b) and(c), where Bo∗ is 5 × 10⁻⁶ and 5 × 10⁻⁵ respectively.Some aspects remain unchanged: all three non-cohesiveregimes persist with no change in φc(µ), and the qua-sistatic and intermediate pressure values show no appre-ciable changes. However, the inertial regime is now bifur-cated into two regimes occurring at different scaled shearrates: at higher ˆγ the flow remains inertial (i.e. exhibit-
ing Bagnold scaling), while at lower ˆγ the flow becomesrate-independent. We term this latter, new regime the
3
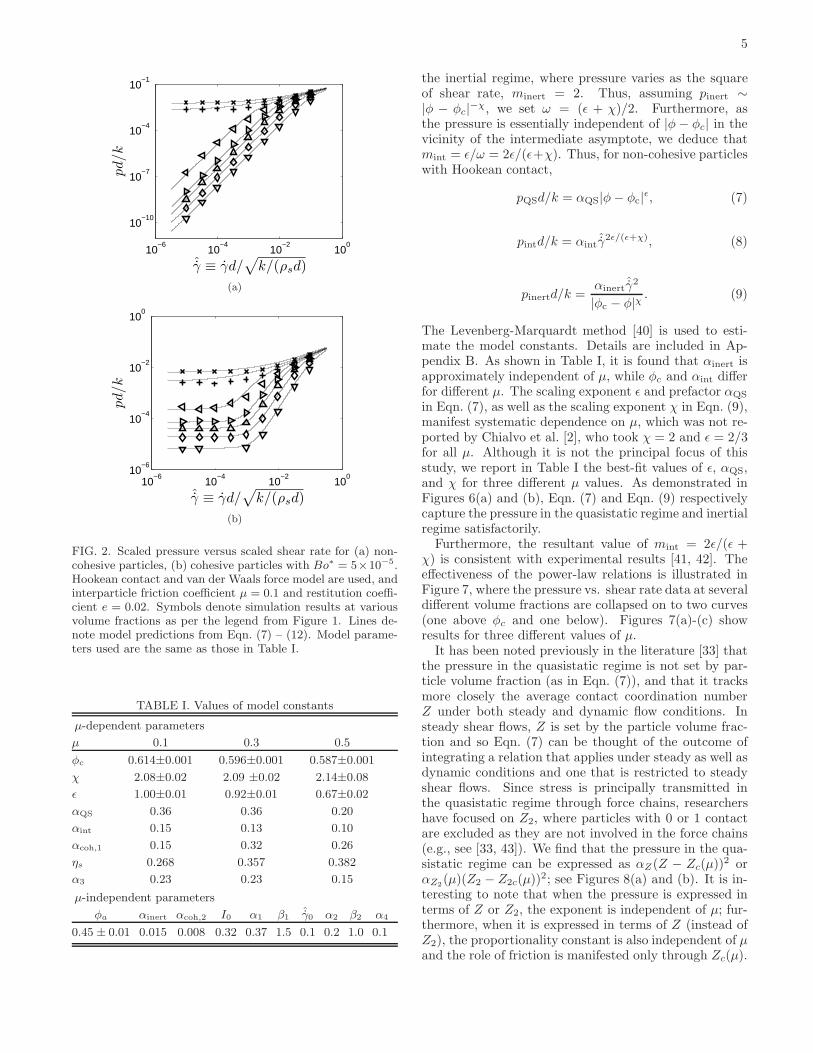
cohesive regime. As Bo∗ increases, this cohesive regimeexpands to encompass a larger domain of ˆγ, as illustratedin Figures 1(b) and (c). Simulations were also performedfor a highly inelastic system by lowering e from 0.7 (de-fault case) to 0.02. It was found that all four regimespersist even for such a highly dissipative system, withno discernible change in the magnitude of the jammingvolume fraction. (See Figure 2).
In Figures 1 and 2, we present the results only fromsimulations in which the velocity profile in the statisticalsteady state is found to be linear indicating homogeneousshear. There is a conspicuous absence of simulation re-sults in Figures 1(b)(c) and 2(b) at the lower volumefractions and shear rates in the region representing tran-sition from cohesive regime to inertial regime. In thisregion, the velocity profiles are found to be inhomoge-neous (see Appendix A for further details). These casesare not included in the analysis of the homogeneouslysheared state presented here.
The cohesive regime corresponds well to previous re-sults [18] which report the existence of a rate-independentregime due to cohesion. Also, the cohesive-to-inertialregime transition is in accord with results from dy-namic shear cell experiments on slightly cohesive pow-ders [22]; the pressure in these experiments is roughlyrate-independent at low shear rates but increases signifi-cantly at higher shear rates. Finally, the impact of cohe-sion on the scaling of pressure with respect to shear rateis consistent with previous 2-D, constant-pressure shearsimulations of Rognon et al. [20]. They utilize NA/(pd)to characterize cohesion and find that, when NA/(pd)is large, the solid fraction no longer varies with inertialnumber (defined by them as γ
√
m/p for particle massm) in their dilatancy law, which corresponds to the rate-independent behavior we observe for the pressure in thecohesive regime. The present paper details where thisnew rate-independent cohesive regime is located in pa-rameter space with respect to the other three regimesand, for the first time, provides a comprehensive regimemap for dense flows of cohesive granular materials capa-ble of explaining all of the above behaviors.
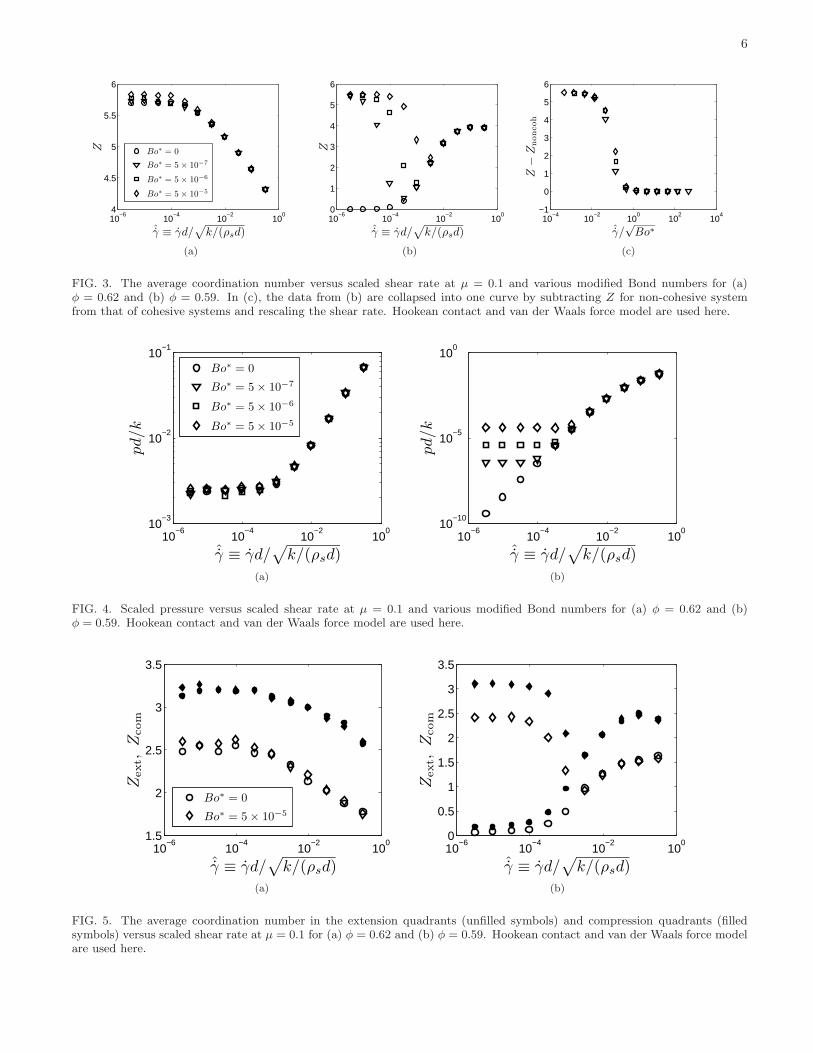
Because previous works (e.g. [20, 33]) demonstrate theimportance of microstructure on dense granular rheology,we aim to explain the cohesive-to-inertial regime transi-tion in terms of changes in microstructure. To this end,we study the average coordination number Z, which isdefined as the average number of contacts per particle inthe system. Specifically, Z = 2nc/n, where nc is the totalnumber of contacts (with particle overlap) and n is thetotal number of particles in the system. When φ > φc,cohesion has negligible impact on Z across all shear rates(i.e. quasistatic and intermediate regimes), as seen inFigure 3(a). For φ < φc, cohesion has a weak impacton Z at high shear rates (i.e. inertial and intermediateregimes), but substantially increases the value of Z inlower shear rate region (i.e. the cohesive regime), as seenin Figure 3(b). Thus, cohesion has an appreciable impacton Z only in the cohesive regime, which is consistent with
the pressure data shown in Figure 1. To make this obser-vation more transparent, we present in Figures 4(a) and4(b) the variation of pressure with shear rate correspond-ing to conditions in Figures 3(a) and 3(b), respectively.It is clear that cohesion has only a weak impact (if any)on pressure (and, as presented later, shear stress) in qua-sistatic, inertial, and intermediate regimes. The emer-gence of rate-independent regime because of the cohesiveforce can be reasoned through the average coordinationnumber characterizing the microstructure. When a denseassembly of non-cohesive particles is subjected to steady(and slow) shear, jamming occurs at a critical volumefraction, φc, which depends on the particle-particle co-efficient of friction [33, 34] and there is a correspondingaverage coordination number Zc. Under dynamic con-ditions [33], the stress tracks Z more closely than theparticle volume fraction. Hence it is more accurate tocharacterize the regimes in terms of Z and shear rate,than in terms of volume fraction and shear rate. Thisdistinction is more apparent when particles interact cohe-sively. For non-cohesive assemblies in slow, steady shear,Z falls below Zc, when φ drops below φc. In contrast,for cohesive assemblies, Z can remain large even whenφ is lowered below φc, and force chains persist, lead-ing to rate-independent regime. (Compare Figures 3(b)and 4(b).)
Another behavior connected to the coordination num-ber is the expansion of the cohesive regime with increas-ing Bo∗, as illustrated in Figure 3(b). The critical shearrate which sets the boundary between the cohesive andinertial regimes scales with
√Bo∗, as demonstrated in
Figure 3(c), where data are collapsed by scaling the di-
mensionless shear rate with√Bo∗. The
√Bo∗ scal-
ing can readily be rationalized: when cohesive energy(∼ Bo∗) is overcome by the kinetic energy supplied by
the shearing (∼ ˆγ2), the system transitions from cohesiveregime to inertial regime. This transition in dependenceof Z on shear rate between the cohesive regime and iner-tial regime is consistent with previous findings [18, 19].
The variation of Z with shear rate is analyzed in moredetail by decomposing the average coordination num-ber plotted in Figures 3(a)(b) into two components: onein the extension quadrants (Zext) and one in the com-pression quadrants (Zcom), as shown in Figures 5(a)(b).As one would expect, the average coordination numberin the compression quadrants is always higher than thecounterpart in the extension quadrants [35]. At a packingfraction of 0.62 (which is larger than φc), Zcom and Zext
are essentially the same for cohesive and non-cohesivesystems, see Figure 5(a). Furthermore, both of themremain nearly independent of shear rate at low shearrates, and decrease at higher shear rates; thus, there isno discernible difference in the behavior in the differentquadrants. At packing fractions lower than φc, inertialregime is obtained for non-cohesive systems, where bothZcom and Zext increase with shear rate (see Figure 5(b)).When the particles interact cohesively and the shear flowis in the cohesive regime, both Zcom and Zext are large at
4
10−6
10−4
10−2
100
10−12
10−9
10−6
10−3
100
ˆγ ≡ γd/√
k/(ρsd)
pd/k
(a)
10−6
10−4
10−2
100
10−8
10−6
10−4
10−2
100
ˆγ ≡ γd/√
k/(ρsd)
pd/k
(b)
10−6
10−4
10−2
100
10−6
10−4
10−2
100
ˆγ ≡ γd/√
k/(ρsd)
pd/k
(c)
10−10
10−5
100
10−6
10−4
10−2
100
≡ γd/√
k/(
φ = 0.51
φ = 0.53
φ = 0.55
φ = 0.57
φ = 0.59
φ = 0.6
φ = 0.61
φ = 0.62
φ = 0.63
FIG. 1. Scaled pressure versus scaled shear rate for (a) non-cohesive particles, (b) cohesive particles with Bo∗ = 5× 10⁻⁶, (c)cohesive particles with Bo∗ = 5×10⁻⁵. In all cases, Hookean contact and van der Waals force model are used, and interparticlefriction coefficient µ = 0.1. Symbols denote simulation results, while lines denote model predictions from Eqns. (10) - (12).
low shear rates (comparable in magnitude to those in thequasistatic regime) under low shear rate conditions. In-creasing shear rate tends to break down the force chainsin all quadrants, weakly at low shear rates and rapidly inthe vicinity of
√Bo∗, see Figure 5(b). Once a cohesive
system enters the inertial regime, its behavior is similarto that of non-cohesive systems, with new contacts form-ing more readily leading to an increase in Zcom and Zext.It is the interplay between these two trends that give riseto a minimum in the average coordination number for co-hesive systems in the vicinity of
√Bo∗ (Figures 3(b) and
5(b)), and the regime transition observed in the pressureplot (Figure 4(b)).
IV. PRESSURE
A blended pressure model has been previously pro-posed for non-cohesive granular materials, which can cap-
ture the pressure continuously across different dense-flowregimes for different volume fractions and shear rates [2],
p =
{
pQS + pint for φ ≥ φc
(p−1inert + p−1
int)−1 for φ < φc.
(6)
In this model, pQS, pinert, and pint represent pressure inthe quasistatic, inertial, and intermediate regimes. Tomodel the transitions between them, a blending functionB of the form B(y1, y2) = (yw1 + yw2 )
1/w is used. w = 1is chosen to create an additive blend for the quasistatic-to-intermediate transition and w = −1 is chosen to yielda harmonic blend for the inertial-to-intermedaite transi-tion. Pressure in each individual regime is modeled basedon scaling law similar to those in conventional criticalphenomena [36–39]. Specifically, one seeks a power-lawrelationship between pressure and shear rate in each flow
regime [2]:pj
|φ−φc|ǫ ∼ [ γ|φ−φc|ω ]
mj
, j = QS, int, inert. In
the rate-independent quasistatic regime, mQS = 0. In
5
10−6
10−4
10−2
100
10−10
10−7
10−4
10−1
ˆγ ≡ γd/√
k/(ρsd)
pd/k
(a)
10−6
10−4
10−2
100
10−6
10−4
10−2
100
ˆγ ≡ γd/√
k/(ρsd)
pd/k
(b)
FIG. 2. Scaled pressure versus scaled shear rate for (a) non-cohesive particles, (b) cohesive particles with Bo∗ = 5×10⁻⁵.Hookean contact and van der Waals force model are used, andinterparticle friction coefficient µ = 0.1 and restitution coeffi-cient e = 0.02. Symbols denote simulation results at variousvolume fractions as per the legend from Figure 1. Lines de-note model predictions from Eqn. (7) – (12). Model parame-ters used are the same as those in Table I.
TABLE I. Values of model constants
µ-dependent parameters
µ 0.1 0.3 0.5
φc 0.614±0.001 0.596±0.001 0.587±0.001
χ 2.08±0.02 2.09 ±0.02 2.14±0.08
ǫ 1.00±0.01 0.92±0.01 0.67±0.02
αQS 0.36 0.36 0.20
αint 0.15 0.13 0.10
αcoh,1 0.15 0.32 0.26
ηs 0.268 0.357 0.382
α3 0.23 0.23 0.15
µ-independent parameters
φa αinert αcoh,2 I0 α1 β1ˆγ0 α2 β2 α4
0.45 ± 0.01 0.015 0.008 0.32 0.37 1.5 0.1 0.2 1.0 0.1
the inertial regime, where pressure varies as the squareof shear rate, minert = 2. Thus, assuming pinert ∼|φ − φc|−χ, we set ω = (ǫ + χ)/2. Furthermore, asthe pressure is essentially independent of |φ− φc| in thevicinity of the intermediate asymptote, we deduce thatmint = ǫ/ω = 2ǫ/(ǫ+χ). Thus, for non-cohesive particleswith Hookean contact,
pQSd/k = αQS|φ− φc|ǫ, (7)
pintd/k = αintˆγ2ǫ/(ǫ+χ), (8)
pinertd/k =αinert
ˆγ2
|φc − φ|χ . (9)
The Levenberg-Marquardt method [40] is used to esti-mate the model constants. Details are included in Ap-pendix B. As shown in Table I, it is found that αinert isapproximately independent of µ, while φc and αint differfor different µ. The scaling exponent ǫ and prefactor αQS
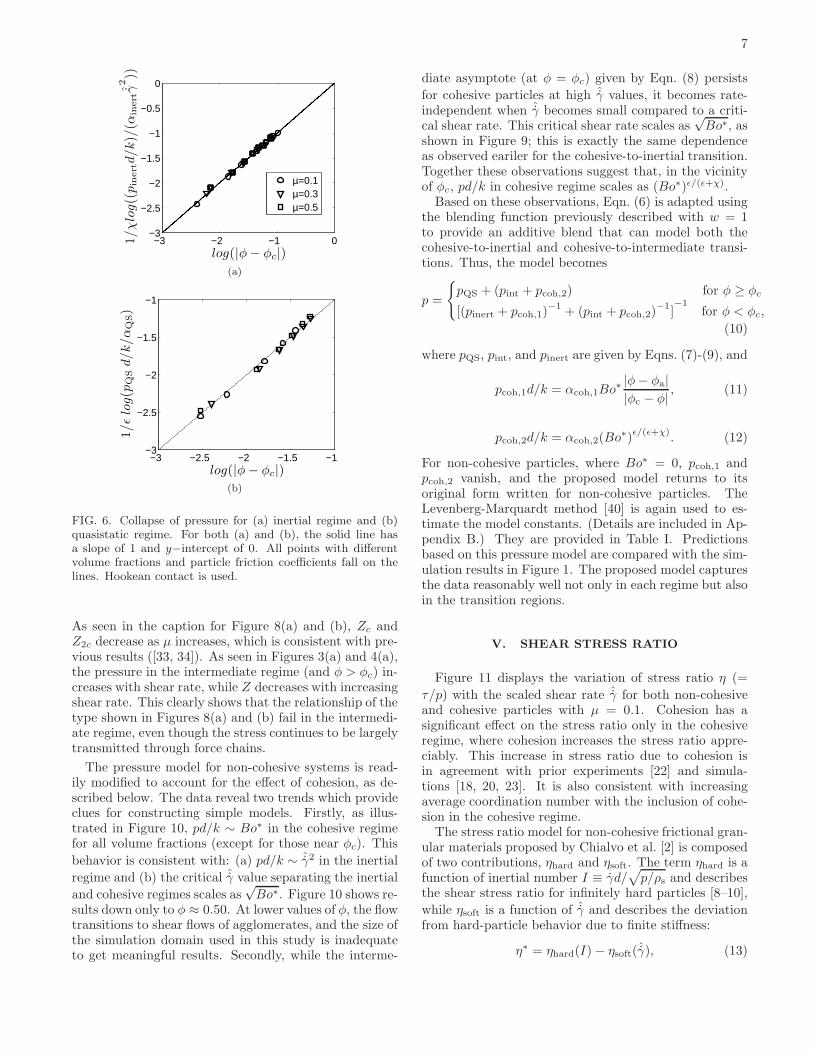
in Eqn. (7), as well as the scaling exponent χ in Eqn. (9),manifest systematic dependence on µ, which was not re-ported by Chialvo et al. [2], who took χ = 2 and ǫ = 2/3for all µ. Although it is not the principal focus of thisstudy, we report in Table I the best-fit values of ǫ, αQS,and χ for three different µ values. As demonstrated inFigures 6(a) and (b), Eqn. (7) and Eqn. (9) respectivelycapture the pressure in the quasistatic regime and inertialregime satisfactorily.Furthermore, the resultant value of mint = 2ǫ/(ǫ +
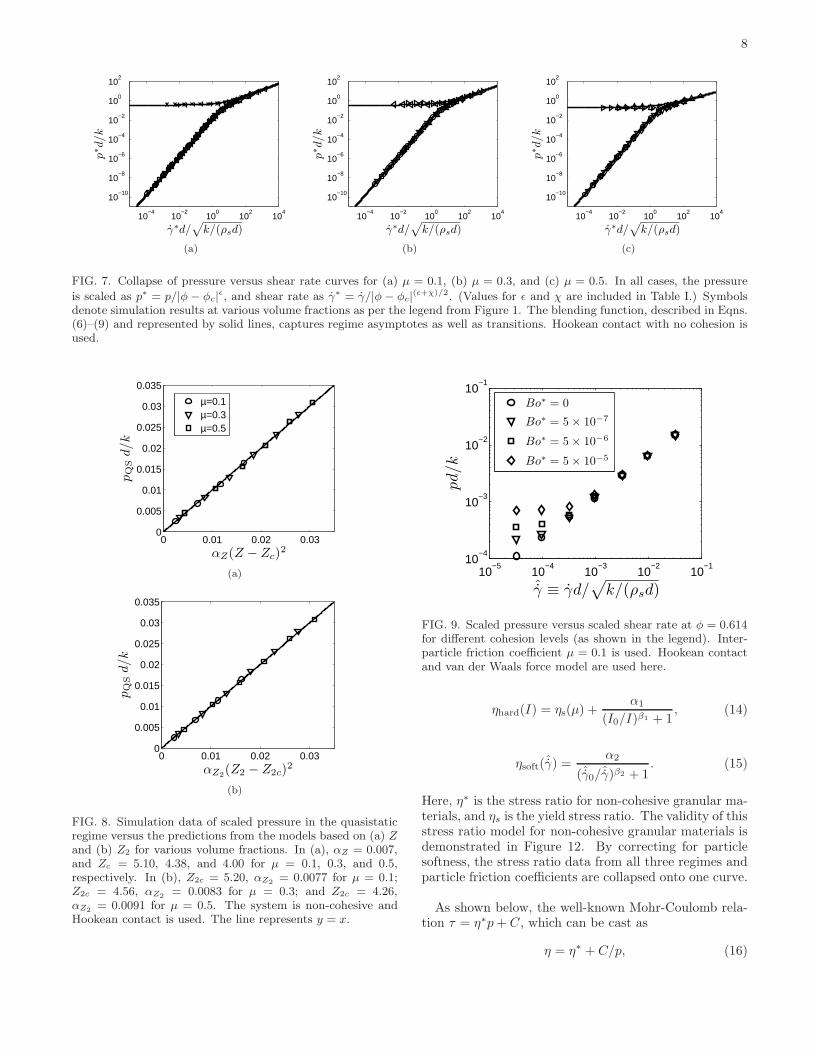
χ) is consistent with experimental results [41, 42]. Theeffectiveness of the power-law relations is illustrated inFigure 7, where the pressure vs. shear rate data at severaldifferent volume fractions are collapsed on to two curves(one above φc and one below). Figures 7(a)-(c) showresults for three different values of µ.It has been noted previously in the literature [33] that
the pressure in the quasistatic regime is not set by par-ticle volume fraction (as in Eqn. (7)), and that it tracksmore closely the average contact coordination numberZ under both steady and dynamic flow conditions. Insteady shear flows, Z is set by the particle volume frac-tion and so Eqn. (7) can be thought of the outcome ofintegrating a relation that applies under steady as well asdynamic conditions and one that is restricted to steadyshear flows. Since stress is principally transmitted inthe quasistatic regime through force chains, researchershave focused on Z2, where particles with 0 or 1 contactare excluded as they are not involved in the force chains(e.g., see [33, 43]). We find that the pressure in the qua-sistatic regime can be expressed as αZ(Z − Zc(µ))
2 orαZ2
(µ)(Z2 − Z2c(µ))2; see Figures 8(a) and (b). It is in-
teresting to note that when the pressure is expressed interms of Z or Z2, the exponent is independent of µ; fur-thermore, when it is expressed in terms of Z (instead ofZ2), the proportionality constant is also independent of µand the role of friction is manifested only through Zc(µ).
6
10−6
10−4
10−2
100
4
4.5
5
5.5
6
ˆγ ≡ γd/√
k/(ρsd)
Z
Bo∗ = 0
Bo∗ = 5 × 10⁻⁷
Bo∗ = 5 × 10⁻⁶
Bo∗ = 5 × 10⁻⁵
(a)
10−6
10−4
10−2
100
0
1
2
3
4
5
6
ˆγ ≡ γd/√
k/(ρsd)
Z
(b)
10−4
10−2
100
102
104
−1
0
1
2
3
4
5
6
ˆγ/√
Bo∗
Z−
Znoncoh
(c)
FIG. 3. The average coordination number versus scaled shear rate at µ = 0.1 and various modified Bond numbers for (a)φ = 0.62 and (b) φ = 0.59. In (c), the data from (b) are collapsed into one curve by subtracting Z for non-cohesive systemfrom that of cohesive systems and rescaling the shear rate. Hookean contact and van der Waals force model are used here.
10−6
10−4
10−2
100
10−3
10−2
10−1
ˆγ ≡ γd/√
k/(ρsd)
pd/k
Bo∗ = 0
Bo∗ = 5 × 10⁻⁷
Bo∗ = 5 × 10⁻⁶
Bo∗ = 5 × 10⁻⁵
(a)
10−6
10−4
10−2
100
10−10
10−5
100
ˆγ ≡ γd/√
k/(ρsd)
pd/k
(b)
FIG. 4. Scaled pressure versus scaled shear rate at µ = 0.1 and various modified Bond numbers for (a) φ = 0.62 and (b)φ = 0.59. Hookean contact and van der Waals force model are used here.
10−6
10−4
10−2
100
1.5
2
2.5
3
3.5
ˆγ ≡ γd/√
k/(ρsd)
Zext,
Zcom
Bo∗ = 0
Bo∗ = 5 × 10⁻⁵
(a)
10−6
10−4
10−2
100
0
0.5
1
1.5
2
2.5
3
3.5
ˆγ ≡ γd/√
k/(ρsd)
Zext,
Zcom
(b)
FIG. 5. The average coordination number in the extension quadrants (unfilled symbols) and compression quadrants (filledsymbols) versus scaled shear rate at µ = 0.1 for (a) φ = 0.62 and (b) φ = 0.59. Hookean contact and van der Waals force modelare used here.
7
−3 −2 −1 0−3
−2.5
−2
−1.5
−1
−0.5
0
log(|φ − φc|)
1/χlo
g((
pin
ertd/k)/
(αin
ert
ˆ γ2))
µ=0.1µ=0.3µ=0.5
(a)
−3 −2.5 −2 −1.5 −1−3
−2.5
−2
−1.5
−1
log(|φ − φc|)
1/ǫ
log(p
QS
d/k/α
QS)
(b)
FIG. 6. Collapse of pressure for (a) inertial regime and (b)quasistatic regime. For both (a) and (b), the solid line hasa slope of 1 and y−intercept of 0. All points with differentvolume fractions and particle friction coefficients fall on thelines. Hookean contact is used.
As seen in the caption for Figure 8(a) and (b), Zc andZ2c decrease as µ increases, which is consistent with pre-vious results ([33, 34]). As seen in Figures 3(a) and 4(a),the pressure in the intermediate regime (and φ > φc) in-creases with shear rate, while Z decreases with increasingshear rate. This clearly shows that the relationship of thetype shown in Figures 8(a) and (b) fail in the intermedi-ate regime, even though the stress continues to be largelytransmitted through force chains.
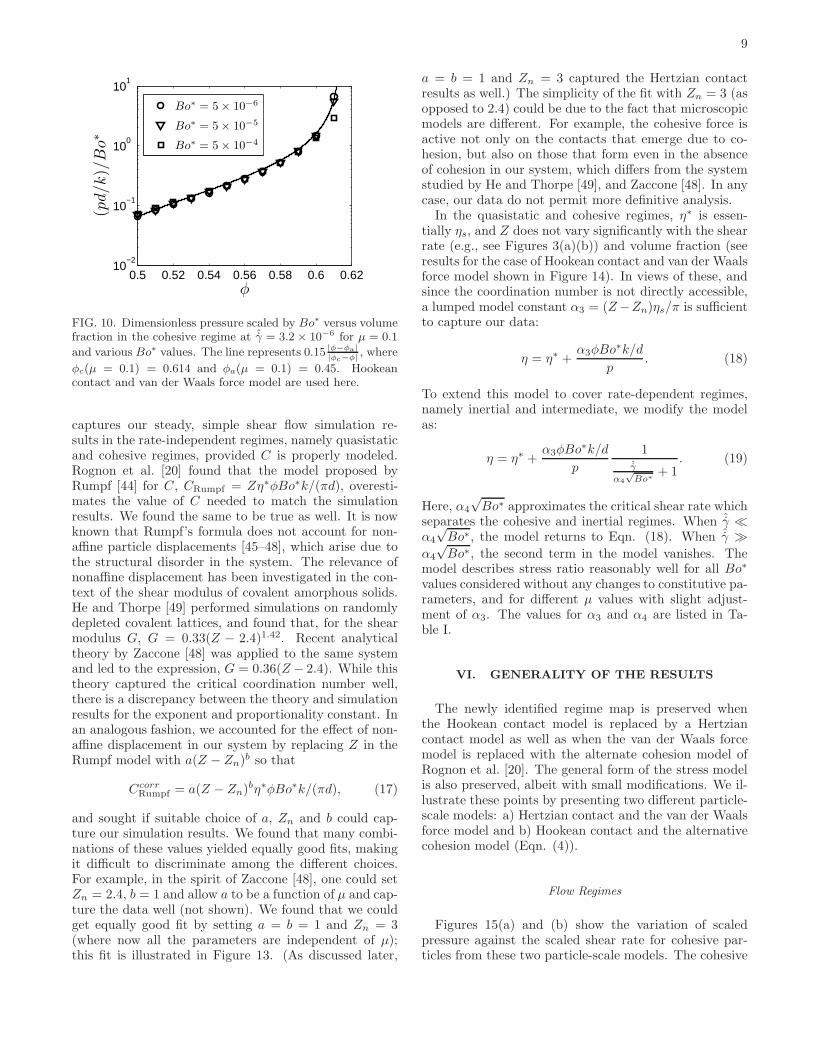
The pressure model for non-cohesive systems is read-ily modified to account for the effect of cohesion, as de-scribed below. The data reveal two trends which provideclues for constructing simple models. Firstly, as illus-trated in Figure 10, pd/k ∼ Bo∗ in the cohesive regimefor all volume fractions (except for those near φc). This
behavior is consistent with: (a) pd/k ∼ ˆγ2 in the inertial
regime and (b) the critical ˆγ value separating the inertial
and cohesive regimes scales as√Bo∗. Figure 10 shows re-
sults down only to φ ≈ 0.50. At lower values of φ, the flowtransitions to shear flows of agglomerates, and the size ofthe simulation domain used in this study is inadequateto get meaningful results. Secondly, while the interme-
diate asymptote (at φ = φc) given by Eqn. (8) persists
for cohesive particles at high ˆγ values, it becomes rate-independent when ˆγ becomes small compared to a criti-cal shear rate. This critical shear rate scales as
√Bo∗, as
shown in Figure 9; this is exactly the same dependenceas observed eariler for the cohesive-to-inertial transition.Together these observations suggest that, in the vicinityof φc, pd/k in cohesive regime scales as (Bo∗)ǫ/(ǫ+χ).Based on these observations, Eqn. (6) is adapted using
the blending function previously described with w = 1to provide an additive blend that can model both thecohesive-to-inertial and cohesive-to-intermediate transi-tions. Thus, the model becomes
p =
{
pQS + (pint + pcoh,2) for φ ≥ φc
[(pinert + pcoh,1)−1
+ (pint + pcoh,2)−1
]−1
for φ < φc,
(10)
where pQS, pint, and pinert are given by Eqns. (7)-(9), and
pcoh,1d/k = αcoh,1Bo∗|φ− φa||φc − φ| , (11)
pcoh,2d/k = αcoh,2(Bo∗)ǫ/(ǫ+χ). (12)
For non-cohesive particles, where Bo∗ = 0, pcoh,1 andpcoh,2 vanish, and the proposed model returns to itsoriginal form written for non-cohesive particles. TheLevenberg-Marquardt method [40] is again used to es-timate the model constants. (Details are included in Ap-pendix B.) They are provided in Table I. Predictionsbased on this pressure model are compared with the sim-ulation results in Figure 1. The proposed model capturesthe data reasonably well not only in each regime but alsoin the transition regions.
V. SHEAR STRESS RATIO
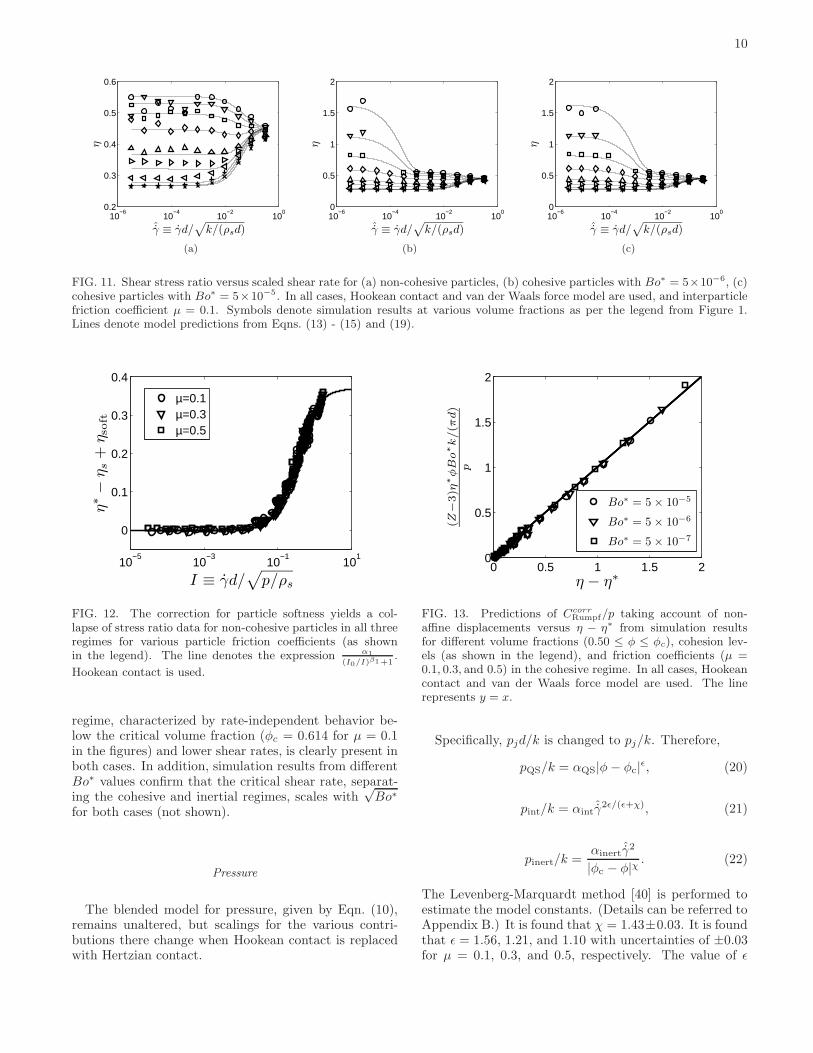
Figure 11 displays the variation of stress ratio η (=
τ/p) with the scaled shear rate ˆγ for both non-cohesiveand cohesive particles with µ = 0.1. Cohesion has asignificant effect on the stress ratio only in the cohesiveregime, where cohesion increases the stress ratio appre-ciably. This increase in stress ratio due to cohesion isin agreement with prior experiments [22] and simula-tions [18, 20, 23]. It is also consistent with increasingaverage coordination number with the inclusion of cohe-sion in the cohesive regime.The stress ratio model for non-cohesive frictional gran-
ular materials proposed by Chialvo et al. [2] is composedof two contributions, ηhard and ηsoft. The term ηhard is afunction of inertial number I ≡ γd/
√
p/ρs and describesthe shear stress ratio for infinitely hard particles [8–10],
while ηsoft is a function of ˆγ and describes the deviationfrom hard-particle behavior due to finite stiffness:
η∗ = ηhard(I)− ηsoft(ˆγ), (13)
8
10−4
10−2
100
102
104
10−10
10−8
10−6
10−4
10−2
100
102
γ∗d/√
k/(ρsd)
p∗d/k
(a)
10−4
10−2
100
102
104
10−10
10−8
10−6
10−4
10−2
100
102
γ∗d/√
k/(ρsd)
p∗d/k
(b)
10−4
10−2
100
102
104
10−10
10−8
10−6
10−4
10−2
100
102
γ∗d/√
k/(ρsd)
p∗d/k
(c)
FIG. 7. Collapse of pressure versus shear rate curves for (a) µ = 0.1, (b) µ = 0.3, and (c) µ = 0.5. In all cases, the pressure
is scaled as p∗ = p/|φ − φc|ǫ, and shear rate as γ∗ = γ/|φ − φc|
(ǫ+χ)/2. (Values for ǫ and χ are included in Table I.) Symbolsdenote simulation results at various volume fractions as per the legend from Figure 1. The blending function, described in Eqns.(6)–(9) and represented by solid lines, captures regime asymptotes as well as transitions. Hookean contact with no cohesion isused.
0 0.01 0.02 0.030
0.005
0.01
0.015
0.02
0.025
0.03
0.035
αZ(Z − Zc)2
pQ
Sd/k
µ=0.1µ=0.3µ=0.5
(a)
0 0.01 0.02 0.030
0.005
0.01
0.015
0.02
0.025
0.03
0.035
αZ2(Z2 − Z2c)
2
pQ
Sd/k
(b)
FIG. 8. Simulation data of scaled pressure in the quasistaticregime versus the predictions from the models based on (a) Zand (b) Z2 for various volume fractions. In (a), αZ = 0.007,and Zc = 5.10, 4.38, and 4.00 for µ = 0.1, 0.3, and 0.5,respectively. In (b), Z2c = 5.20, αZ2
= 0.0077 for µ = 0.1;Z2c = 4.56, αZ2
= 0.0083 for µ = 0.3; and Z2c = 4.26,αZ2
= 0.0091 for µ = 0.5. The system is non-cohesive andHookean contact is used. The line represents y = x.
10−5
10−4
10−3
10−2
10−1
10−4
10−3
10−2
10−1
ˆγ ≡ γd/√
k/(ρsd)
pd/k
Bo∗ = 0
Bo∗ = 5 × 10⁻⁷
Bo∗ = 5 × 10⁻⁶
Bo∗ = 5 × 10⁻⁵
FIG. 9. Scaled pressure versus scaled shear rate at φ = 0.614for different cohesion levels (as shown in the legend). Inter-particle friction coefficient µ = 0.1 is used. Hookean contactand van der Waals force model are used here.
ηhard(I) = ηs(µ) +α1
(I0/I)β1 + 1, (14)
ηsoft(ˆγ) =α2
(ˆγ0/ˆγ)β2 + 1. (15)
Here, η∗ is the stress ratio for non-cohesive granular ma-terials, and ηs is the yield stress ratio. The validity of thisstress ratio model for non-cohesive granular materials isdemonstrated in Figure 12. By correcting for particlesoftness, the stress ratio data from all three regimes andparticle friction coefficients are collapsed onto one curve.
As shown below, the well-known Mohr-Coulomb rela-tion τ = η∗p+ C, which can be cast as
η = η∗ + C/p, (16)
9
0.5 0.52 0.54 0.56 0.58 0.6 0.6210
−2
10−1
100
101
φ
(pd/k)/
Bo∗
Bo∗ = 5 × 10⁻⁶
Bo∗ = 5 × 10⁻⁵
Bo∗ = 5 × 10⁻⁴
FIG. 10. Dimensionless pressure scaled by Bo∗ versus volumefraction in the cohesive regime at ˆγ = 3.2× 10⁻⁶ for µ = 0.1
and various Bo∗ values. The line represents 0.15 |φ−φa ||φc−φ|
, where
φc(µ = 0.1) = 0.614 and φa(µ = 0.1) = 0.45. Hookeancontact and van der Waals force model are used here.
captures our steady, simple shear flow simulation re-sults in the rate-independent regimes, namely quasistaticand cohesive regimes, provided C is properly modeled.Rognon et al. [20] found that the model proposed byRumpf [44] for C, CRumpf = Zη∗φBo∗k/(πd), overesti-mates the value of C needed to match the simulationresults. We found the same to be true as well. It is nowknown that Rumpf’s formula does not account for non-affine particle displacements [45–48], which arise due tothe structural disorder in the system. The relevance ofnonaffine displacement has been investigated in the con-text of the shear modulus of covalent amorphous solids.He and Thorpe [49] performed simulations on randomlydepleted covalent lattices, and found that, for the shearmodulus G, G = 0.33(Z − 2.4)1.42. Recent analyticaltheory by Zaccone [48] was applied to the same systemand led to the expression, G = 0.36(Z − 2.4). While thistheory captured the critical coordination number well,there is a discrepancy between the theory and simulationresults for the exponent and proportionality constant. Inan analogous fashion, we accounted for the effect of non-affine displacement in our system by replacing Z in theRumpf model with a(Z − Zn)
b so that
CcorrRumpf = a(Z − Zn)
bη∗φBo∗k/(πd), (17)
and sought if suitable choice of a, Zn and b could cap-ture our simulation results. We found that many combi-nations of these values yielded equally good fits, makingit difficult to discriminate among the different choices.For example, in the spirit of Zaccone [48], one could setZn = 2.4, b = 1 and allow a to be a function of µ and cap-ture the data well (not shown). We found that we couldget equally good fit by setting a = b = 1 and Zn = 3(where now all the parameters are independent of µ);this fit is illustrated in Figure 13. (As discussed later,
a = b = 1 and Zn = 3 captured the Hertzian contactresults as well.) The simplicity of the fit with Zn = 3 (asopposed to 2.4) could be due to the fact that microscopicmodels are different. For example, the cohesive force isactive not only on the contacts that emerge due to co-hesion, but also on those that form even in the absenceof cohesion in our system, which differs from the systemstudied by He and Thorpe [49], and Zaccone [48]. In anycase, our data do not permit more definitive analysis.In the quasistatic and cohesive regimes, η∗ is essen-
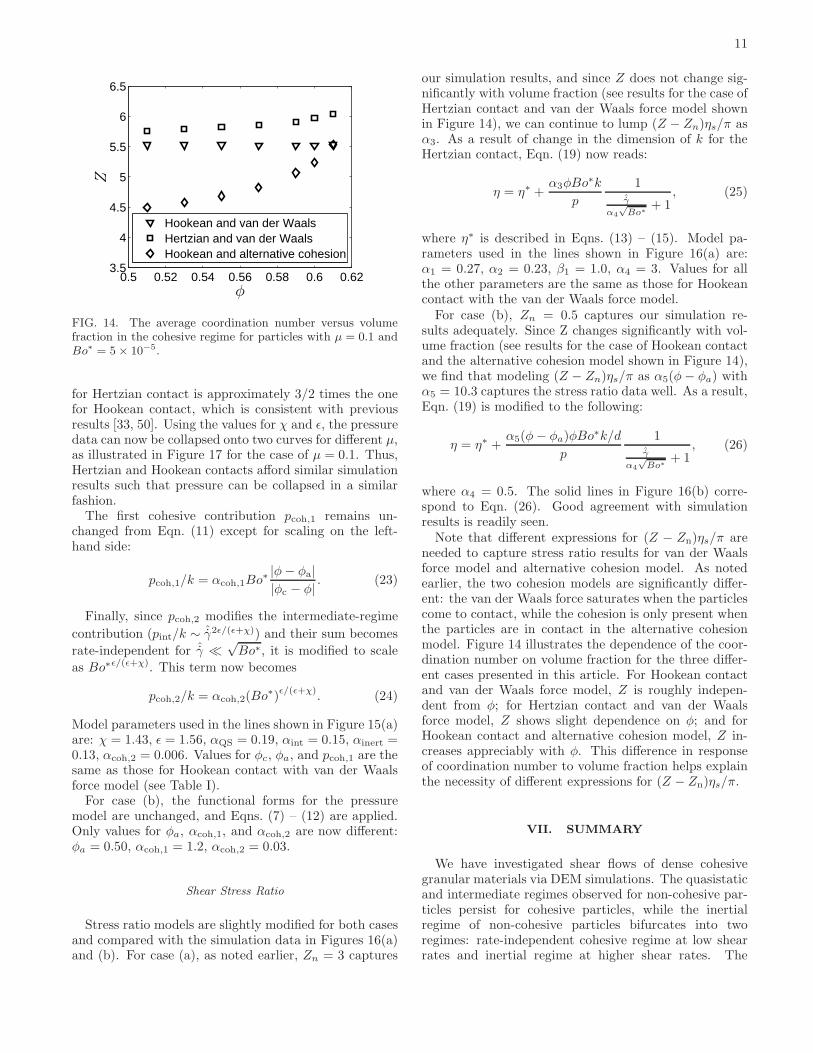
tially ηs, and Z does not vary significantly with the shearrate (e.g., see Figures 3(a)(b)) and volume fraction (seeresults for the case of Hookean contact and van der Waalsforce model shown in Figure 14). In views of these, andsince the coordination number is not directly accessible,a lumped model constant α3 = (Z−Zn)ηs/π is sufficientto capture our data:
η = η∗ +α3φBo∗k/d
p. (18)
To extend this model to cover rate-dependent regimes,namely inertial and intermediate, we modify the modelas:
η = η∗ +α3φBo∗k/d
p
1ˆγ
α4
√Bo∗
+ 1. (19)
Here, α4
√Bo∗ approximates the critical shear rate which
separates the cohesive and inertial regimes. When ˆγ ≪α4
√Bo∗, the model returns to Eqn. (18). When ˆγ ≫
α4
√Bo∗, the second term in the model vanishes. The
model describes stress ratio reasonably well for all Bo∗
values considered without any changes to constitutive pa-rameters, and for different µ values with slight adjust-ment of α3. The values for α3 and α4 are listed in Ta-ble I.
VI. GENERALITY OF THE RESULTS
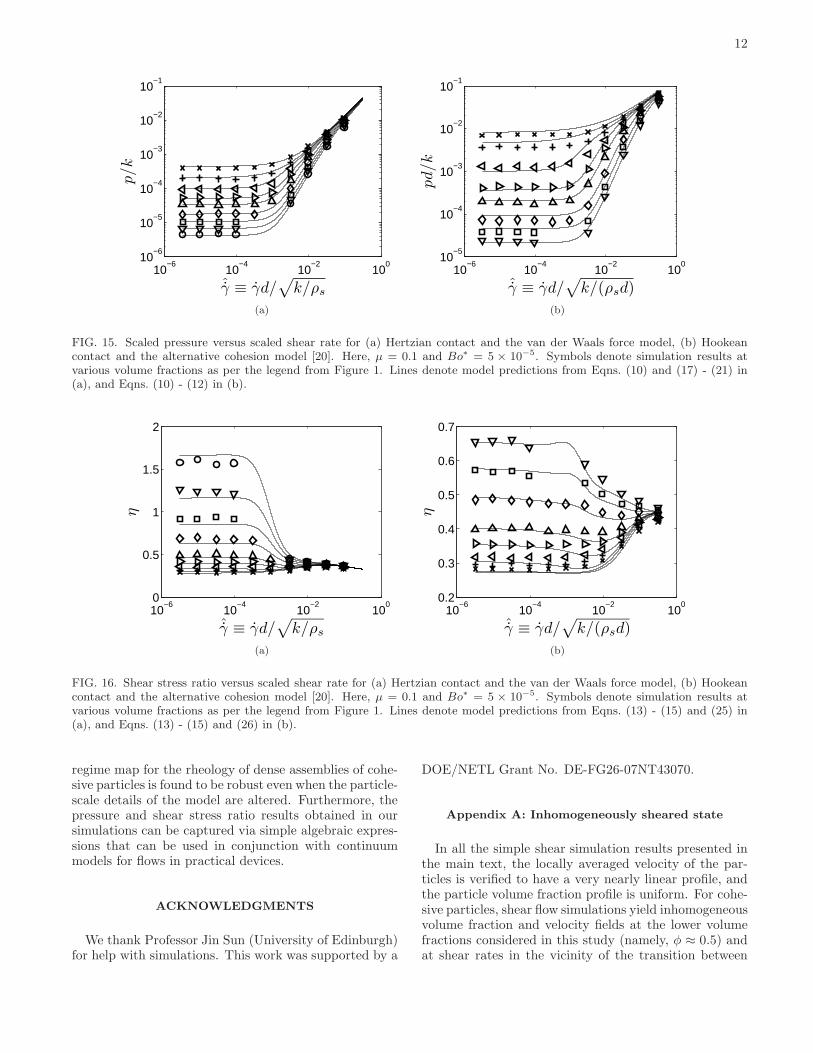
The newly identified regime map is preserved whenthe Hookean contact model is replaced by a Hertziancontact model as well as when the van der Waals forcemodel is replaced with the alternate cohesion model ofRognon et al. [20]. The general form of the stress modelis also preserved, albeit with small modifications. We il-lustrate these points by presenting two different particle-scale models: a) Hertzian contact and the van der Waalsforce model and b) Hookean contact and the alternativecohesion model (Eqn. (4)).
Flow Regimes
Figures 15(a) and (b) show the variation of scaledpressure against the scaled shear rate for cohesive par-ticles from these two particle-scale models. The cohesive
10
10−6
10−4
10−2
100
0.2
0.3
0.4
0.5
0.6
ˆγ ≡ γd/√
k/(ρsd)
η
(a)
10−6
10−4
10−2
100
0
0.5
1
1.5
2
ˆγ ≡ γd/√
k/(ρsd)
η
(b)
10−6
10−4
10−2
100
0
0.5
1
1.5
2
ˆγ ≡ γd/√
k/(ρsd)
η
(c)
FIG. 11. Shear stress ratio versus scaled shear rate for (a) non-cohesive particles, (b) cohesive particles with Bo∗ = 5×10⁻⁶, (c)cohesive particles with Bo∗ = 5×10⁻⁵. In all cases, Hookean contact and van der Waals force model are used, and interparticlefriction coefficient µ = 0.1. Symbols denote simulation results at various volume fractions as per the legend from Figure 1.Lines denote model predictions from Eqns. (13) - (15) and (19).
10−5
10−3
10−1
101
0
0.1
0.2
0.3
0.4
I ≡ γd/√
p/ρs
η∗−
η s+
η soft
µ=0.1µ=0.3µ=0.5
FIG. 12. The correction for particle softness yields a col-lapse of stress ratio data for non-cohesive particles in all threeregimes for various particle friction coefficients (as shownin the legend). The line denotes the expression α1
(I0/I)β1+1
.
Hookean contact is used.
regime, characterized by rate-independent behavior be-low the critical volume fraction (φc = 0.614 for µ = 0.1in the figures) and lower shear rates, is clearly present inboth cases. In addition, simulation results from differentBo∗ values confirm that the critical shear rate, separat-ing the cohesive and inertial regimes, scales with
√Bo∗
for both cases (not shown).
Pressure
The blended model for pressure, given by Eqn. (10),remains unaltered, but scalings for the various contri-butions there change when Hookean contact is replacedwith Hertzian contact.
0 0.5 1 1.5 20
0.5
1
1.5
2
η − η∗
(Z−
3)η
∗
φB
o∗
k/(π
d)
p
Bo∗ = 5 × 10⁻⁵
Bo∗ = 5 × 10⁻⁶
Bo∗ = 5 × 10⁻⁷
FIG. 13. Predictions of CcorrRumpf/p taking account of non-
affine displacements versus η − η∗ from simulation resultsfor different volume fractions (0.50 ≤ φ ≤ φc), cohesion lev-els (as shown in the legend), and friction coefficients (µ =0.1, 0.3, and 0.5) in the cohesive regime. In all cases, Hookeancontact and van der Waals force model are used. The linerepresents y = x.
Specifically, pjd/k is changed to pj/k. Therefore,
pQS/k = αQS|φ− φc|ǫ, (20)
pint/k = αintˆγ2ǫ/(ǫ+χ), (21)
pinert/k =αinert
ˆγ2
|φc − φ|χ . (22)
The Levenberg-Marquardt method [40] is performed toestimate the model constants. (Details can be referred toAppendix B.) It is found that χ = 1.43±0.03. It is foundthat ǫ = 1.56, 1.21, and 1.10 with uncertainties of ±0.03for µ = 0.1, 0.3, and 0.5, respectively. The value of ǫ
11
0.5 0.52 0.54 0.56 0.58 0.6 0.623.5
4
4.5
5
5.5
6
6.5
φ
Z
Hookean and van der WaalsHertzian and van der WaalsHookean and alternative cohesion
FIG. 14. The average coordination number versus volumefraction in the cohesive regime for particles with µ = 0.1 andBo∗ = 5× 10⁻⁵.
for Hertzian contact is approximately 3/2 times the onefor Hookean contact, which is consistent with previousresults [33, 50]. Using the values for χ and ǫ, the pressuredata can now be collapsed onto two curves for different µ,as illustrated in Figure 17 for the case of µ = 0.1. Thus,Hertzian and Hookean contacts afford similar simulationresults such that pressure can be collapsed in a similarfashion.The first cohesive contribution pcoh,1 remains un-
changed from Eqn. (11) except for scaling on the left-hand side:
pcoh,1/k = αcoh,1Bo∗|φ− φa||φc − φ| . (23)
Finally, since pcoh,2 modifies the intermediate-regime
contribution (pint/k ∼ ˆγ2ǫ/(ǫ+χ)) and their sum becomes
rate-independent for ˆγ ≪√Bo∗, it is modified to scale
as Bo∗ǫ/(ǫ+χ). This term now becomes
pcoh,2/k = αcoh,2(Bo∗)ǫ/(ǫ+χ). (24)
Model parameters used in the lines shown in Figure 15(a)are: χ = 1.43, ǫ = 1.56, αQS = 0.19, αint = 0.15, αinert =0.13, αcoh,2 = 0.006. Values for φc, φa, and pcoh,1 are thesame as those for Hookean contact with van der Waalsforce model (see Table I).For case (b), the functional forms for the pressure
model are unchanged, and Eqns. (7) – (12) are applied.Only values for φa, αcoh,1, and αcoh,2 are now different:φa = 0.50, αcoh,1 = 1.2, αcoh,2 = 0.03.
Shear Stress Ratio
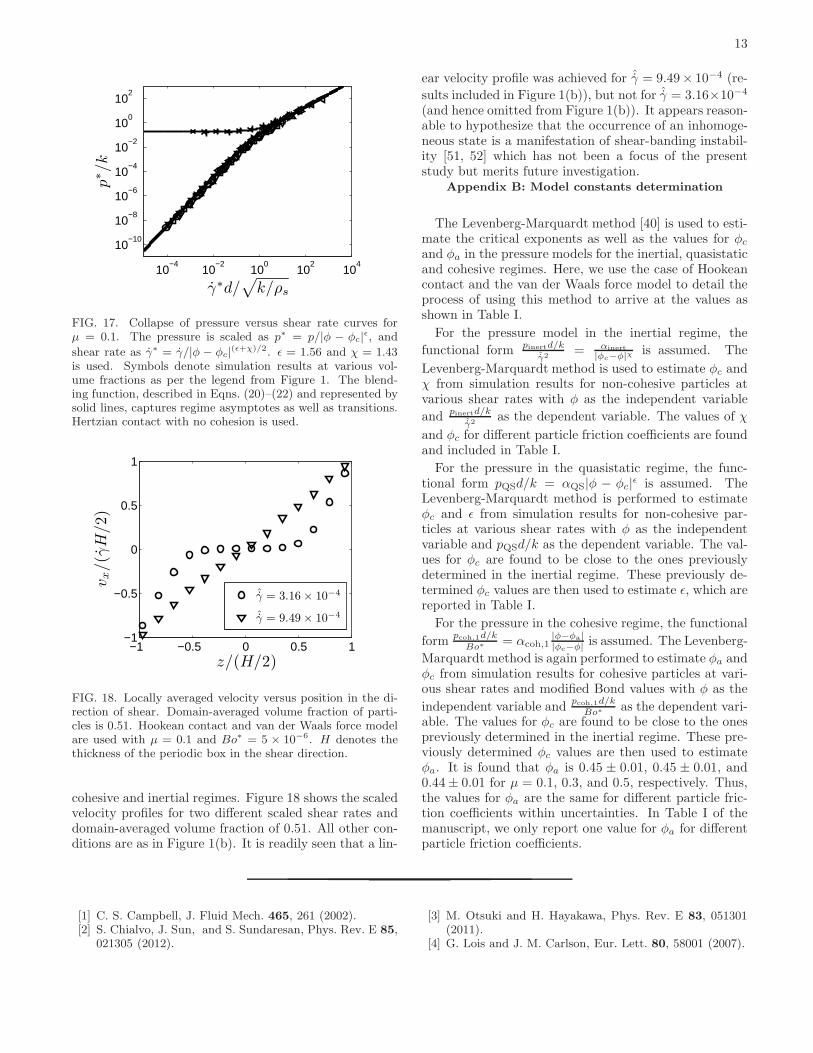
Stress ratio models are slightly modified for both casesand compared with the simulation data in Figures 16(a)and (b). For case (a), as noted earlier, Zn = 3 captures
our simulation results, and since Z does not change sig-nificantly with volume fraction (see results for the case ofHertzian contact and van der Waals force model shownin Figure 14), we can continue to lump (Z − Zn)ηs/π asα3. As a result of change in the dimension of k for theHertzian contact, Eqn. (19) now reads:
η = η∗ +α3φBo∗k
p
1ˆγ
α4
√Bo∗
+ 1, (25)
where η∗ is described in Eqns. (13) – (15). Model pa-rameters used in the lines shown in Figure 16(a) are:α1 = 0.27, α2 = 0.23, β1 = 1.0, α4 = 3. Values for allthe other parameters are the same as those for Hookeancontact with the van der Waals force model.For case (b), Zn = 0.5 captures our simulation re-
sults adequately. Since Z changes significantly with vol-ume fraction (see results for the case of Hookean contactand the alternative cohesion model shown in Figure 14),we find that modeling (Z − Zn)ηs/π as α5(φ− φa) withα5 = 10.3 captures the stress ratio data well. As a result,Eqn. (19) is modified to the following:
η = η∗ +α5(φ− φa)φBo∗k/d
p
1ˆγ
α4
√Bo∗
+ 1, (26)
where α4 = 0.5. The solid lines in Figure 16(b) corre-spond to Eqn. (26). Good agreement with simulationresults is readily seen.Note that different expressions for (Z − Zn)ηs/π are
needed to capture stress ratio results for van der Waalsforce model and alternative cohesion model. As notedearlier, the two cohesion models are significantly differ-ent: the van der Waals force saturates when the particlescome to contact, while the cohesion is only present whenthe particles are in contact in the alternative cohesionmodel. Figure 14 illustrates the dependence of the coor-dination number on volume fraction for the three differ-ent cases presented in this article. For Hookean contactand van der Waals force model, Z is roughly indepen-dent from φ; for Hertzian contact and van der Waalsforce model, Z shows slight dependence on φ; and forHookean contact and alternative cohesion model, Z in-creases appreciably with φ. This difference in responseof coordination number to volume fraction helps explainthe necessity of different expressions for (Z − Zn)ηs/π.
VII. SUMMARY
We have investigated shear flows of dense cohesivegranular materials via DEM simulations. The quasistaticand intermediate regimes observed for non-cohesive par-ticles persist for cohesive particles, while the inertialregime of non-cohesive particles bifurcates into tworegimes: rate-independent cohesive regime at low shearrates and inertial regime at higher shear rates. The
12
10−6
10−4
10−2
100
10−6
10−5
10−4
10−3
10−2
10−1
ˆγ ≡ γd/√
k/ρs
p/k
(a)
10−6
10−4
10−2
100
10−5
10−4
10−3
10−2
10−1
ˆγ ≡ γd/√
k/(ρsd)
pd/k
(b)
FIG. 15. Scaled pressure versus scaled shear rate for (a) Hertzian contact and the van der Waals force model, (b) Hookeancontact and the alternative cohesion model [20]. Here, µ = 0.1 and Bo∗ = 5 × 10⁻⁵. Symbols denote simulation results atvarious volume fractions as per the legend from Figure 1. Lines denote model predictions from Eqns. (10) and (17) - (21) in(a), and Eqns. (10) - (12) in (b).
10−6
10−4
10−2
100
0
0.5
1
1.5
2
ˆγ ≡ γd/√
k/ρs
η
(a)
10−6
10−4
10−2
100
0.2
0.3
0.4
0.5
0.6
0.7
ˆγ ≡ γd/√
k/(ρsd)
η
(b)
FIG. 16. Shear stress ratio versus scaled shear rate for (a) Hertzian contact and the van der Waals force model, (b) Hookeancontact and the alternative cohesion model [20]. Here, µ = 0.1 and Bo∗ = 5 × 10⁻⁵. Symbols denote simulation results atvarious volume fractions as per the legend from Figure 1. Lines denote model predictions from Eqns. (13) - (15) and (25) in(a), and Eqns. (13) - (15) and (26) in (b).
regime map for the rheology of dense assemblies of cohe-sive particles is found to be robust even when the particle-scale details of the model are altered. Furthermore, thepressure and shear stress ratio results obtained in oursimulations can be captured via simple algebraic expres-sions that can be used in conjunction with continuummodels for flows in practical devices.
ACKNOWLEDGMENTS
We thank Professor Jin Sun (University of Edinburgh)for help with simulations. This work was supported by a
DOE/NETL Grant No. DE-FG26-07NT43070.
Appendix A: Inhomogeneously sheared state
In all the simple shear simulation results presented inthe main text, the locally averaged velocity of the par-ticles is verified to have a very nearly linear profile, andthe particle volume fraction profile is uniform. For cohe-sive particles, shear flow simulations yield inhomogeneousvolume fraction and velocity fields at the lower volumefractions considered in this study (namely, φ ≈ 0.5) andat shear rates in the vicinity of the transition between
13
10−4
10−2
100
102
104
10−10
10−8
10−6
10−4
10−2
100
102
γ∗d/√
k/ρs
p∗/k
FIG. 17. Collapse of pressure versus shear rate curves forµ = 0.1. The pressure is scaled as p∗ = p/|φ − φc|
ǫ, and
shear rate as γ∗ = γ/|φ − φc|(ǫ+χ)/2. ǫ = 1.56 and χ = 1.43
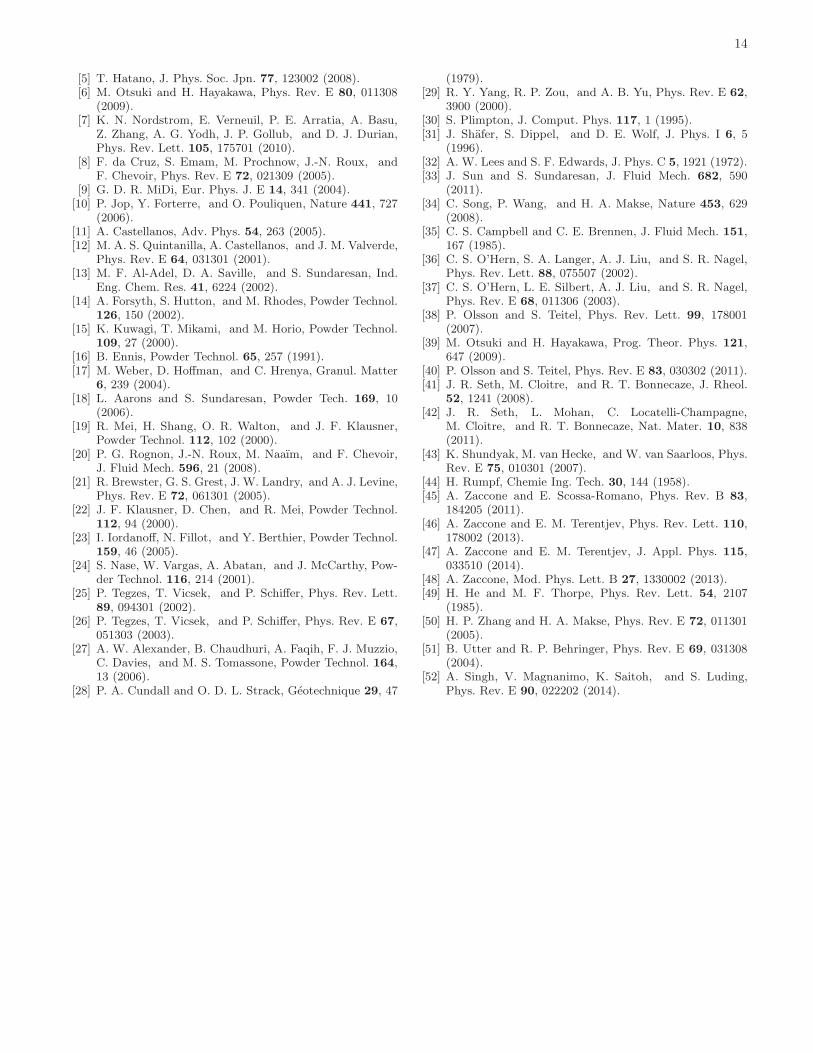
is used. Symbols denote simulation results at various vol-ume fractions as per the legend from Figure 1. The blend-ing function, described in Eqns. (20)–(22) and represented bysolid lines, captures regime asymptotes as well as transitions.Hertzian contact with no cohesion is used.
−1 −0.5 0 0.5 1−1
−0.5
0
0.5
1
z/(H/2)
v x/(γ
H/2)
ˆγ = 3.16 × 10⁻⁴
ˆγ = 9.49 × 10⁻⁴
FIG. 18. Locally averaged velocity versus position in the di-rection of shear. Domain-averaged volume fraction of parti-cles is 0.51. Hookean contact and van der Waals force modelare used with µ = 0.1 and Bo∗ = 5 × 10⁻⁶. H denotes thethickness of the periodic box in the shear direction.
cohesive and inertial regimes. Figure 18 shows the scaledvelocity profiles for two different scaled shear rates anddomain-averaged volume fraction of 0.51. All other con-ditions are as in Figure 1(b). It is readily seen that a lin-
ear velocity profile was achieved for ˆγ = 9.49× 10⁻⁴ (re-
sults included in Figure 1(b)), but not for ˆγ = 3.16×10⁻⁴
(and hence omitted from Figure 1(b)). It appears reason-able to hypothesize that the occurrence of an inhomoge-neous state is a manifestation of shear-banding instabil-ity [51, 52] which has not been a focus of the presentstudy but merits future investigation.
Appendix B: Model constants determination
The Levenberg-Marquardt method [40] is used to esti-mate the critical exponents as well as the values for φc
and φa in the pressure models for the inertial, quasistaticand cohesive regimes. Here, we use the case of Hookeancontact and the van der Waals force model to detail theprocess of using this method to arrive at the values asshown in Table I.
For the pressure model in the inertial regime, the
functional form pinertd/kˆγ2
= αinert
|φc−φ|χ is assumed. The
Levenberg-Marquardt method is used to estimate φc andχ from simulation results for non-cohesive particles atvarious shear rates with φ as the independent variable
and pinertd/kˆγ2
as the dependent variable. The values of χ
and φc for different particle friction coefficients are foundand included in Table I.
For the pressure in the quasistatic regime, the func-tional form pQSd/k = αQS|φ − φc|ǫ is assumed. TheLevenberg-Marquardt method is performed to estimateφc and ǫ from simulation results for non-cohesive par-ticles at various shear rates with φ as the independentvariable and pQSd/k as the dependent variable. The val-ues for φc are found to be close to the ones previouslydetermined in the inertial regime. These previously de-termined φc values are then used to estimate ǫ, which arereported in Table I.
For the pressure in the cohesive regime, the functional
formpcoh,1d/k
Bo∗ = αcoh,1|φ−φa||φc−φ| is assumed. The Levenberg-
Marquardt method is again performed to estimate φa andφc from simulation results for cohesive particles at vari-ous shear rates and modified Bond values with φ as the
independent variable andpcoh,1d/k
Bo∗ as the dependent vari-able. The values for φc are found to be close to the onespreviously determined in the inertial regime. These pre-viously determined φc values are then used to estimateφa. It is found that φa is 0.45 ± 0.01, 0.45 ± 0.01, and0.44± 0.01 for µ = 0.1, 0.3, and 0.5, respectively. Thus,the values for φa are the same for different particle fric-tion coefficients within uncertainties. In Table I of themanuscript, we only report one value for φa for differentparticle friction coefficients.
[1] C. S. Campbell, J. Fluid Mech. 465, 261 (2002).[2] S. Chialvo, J. Sun, and S. Sundaresan, Phys. Rev. E 85,
021305 (2012).
[3] M. Otsuki and H. Hayakawa, Phys. Rev. E 83, 051301(2011).
[4] G. Lois and J. M. Carlson, Eur. Lett. 80, 58001 (2007).
14
[5] T. Hatano, J. Phys. Soc. Jpn. 77, 123002 (2008).[6] M. Otsuki and H. Hayakawa, Phys. Rev. E 80, 011308
(2009).[7] K. N. Nordstrom, E. Verneuil, P. E. Arratia, A. Basu,
Z. Zhang, A. G. Yodh, J. P. Gollub, and D. J. Durian,Phys. Rev. Lett. 105, 175701 (2010).
[8] F. da Cruz, S. Emam, M. Prochnow, J.-N. Roux, andF. Chevoir, Phys. Rev. E 72, 021309 (2005).
[9] G. D. R. MiDi, Eur. Phys. J. E 14, 341 (2004).[10] P. Jop, Y. Forterre, and O. Pouliquen, Nature 441, 727
(2006).[11] A. Castellanos, Adv. Phys. 54, 263 (2005).[12] M. A. S. Quintanilla, A. Castellanos, and J. M. Valverde,
Phys. Rev. E 64, 031301 (2001).[13] M. F. Al-Adel, D. A. Saville, and S. Sundaresan, Ind.
Eng. Chem. Res. 41, 6224 (2002).[14] A. Forsyth, S. Hutton, and M. Rhodes, Powder Technol.
126, 150 (2002).[15] K. Kuwagi, T. Mikami, and M. Horio, Powder Technol.
109, 27 (2000).[16] B. Ennis, Powder Technol. 65, 257 (1991).[17] M. Weber, D. Hoffman, and C. Hrenya, Granul. Matter
6, 239 (2004).[18] L. Aarons and S. Sundaresan, Powder Tech. 169, 10
(2006).[19] R. Mei, H. Shang, O. R. Walton, and J. F. Klausner,
Powder Technol. 112, 102 (2000).[20] P. G. Rognon, J.-N. Roux, M. Naaım, and F. Chevoir,
J. Fluid Mech. 596, 21 (2008).[21] R. Brewster, G. S. Grest, J. W. Landry, and A. J. Levine,
Phys. Rev. E 72, 061301 (2005).[22] J. F. Klausner, D. Chen, and R. Mei, Powder Technol.
112, 94 (2000).[23] I. Iordanoff, N. Fillot, and Y. Berthier, Powder Technol.
159, 46 (2005).[24] S. Nase, W. Vargas, A. Abatan, and J. McCarthy, Pow-
der Technol. 116, 214 (2001).[25] P. Tegzes, T. Vicsek, and P. Schiffer, Phys. Rev. Lett.
89, 094301 (2002).[26] P. Tegzes, T. Vicsek, and P. Schiffer, Phys. Rev. E 67,
051303 (2003).[27] A. W. Alexander, B. Chaudhuri, A. Faqih, F. J. Muzzio,
C. Davies, and M. S. Tomassone, Powder Technol. 164,13 (2006).
[28] P. A. Cundall and O. D. L. Strack, Geotechnique 29, 47
(1979).[29] R. Y. Yang, R. P. Zou, and A. B. Yu, Phys. Rev. E 62,
3900 (2000).[30] S. Plimpton, J. Comput. Phys. 117, 1 (1995).[31] J. Shafer, S. Dippel, and D. E. Wolf, J. Phys. I 6, 5
(1996).[32] A. W. Lees and S. F. Edwards, J. Phys. C 5, 1921 (1972).[33] J. Sun and S. Sundaresan, J. Fluid Mech. 682, 590
(2011).[34] C. Song, P. Wang, and H. A. Makse, Nature 453, 629
(2008).[35] C. S. Campbell and C. E. Brennen, J. Fluid Mech. 151,
167 (1985).[36] C. S. O’Hern, S. A. Langer, A. J. Liu, and S. R. Nagel,
Phys. Rev. Lett. 88, 075507 (2002).[37] C. S. O’Hern, L. E. Silbert, A. J. Liu, and S. R. Nagel,
Phys. Rev. E 68, 011306 (2003).[38] P. Olsson and S. Teitel, Phys. Rev. Lett. 99, 178001
(2007).[39] M. Otsuki and H. Hayakawa, Prog. Theor. Phys. 121,
647 (2009).[40] P. Olsson and S. Teitel, Phys. Rev. E 83, 030302 (2011).[41] J. R. Seth, M. Cloitre, and R. T. Bonnecaze, J. Rheol.
52, 1241 (2008).[42] J. R. Seth, L. Mohan, C. Locatelli-Champagne,
M. Cloitre, and R. T. Bonnecaze, Nat. Mater. 10, 838(2011).
[43] K. Shundyak, M. van Hecke, and W. van Saarloos, Phys.Rev. E 75, 010301 (2007).
[44] H. Rumpf, Chemie Ing. Tech. 30, 144 (1958).[45] A. Zaccone and E. Scossa-Romano, Phys. Rev. B 83,
184205 (2011).[46] A. Zaccone and E. M. Terentjev, Phys. Rev. Lett. 110,
178002 (2013).[47] A. Zaccone and E. M. Terentjev, J. Appl. Phys. 115,
033510 (2014).[48] A. Zaccone, Mod. Phys. Lett. B 27, 1330002 (2013).[49] H. He and M. F. Thorpe, Phys. Rev. Lett. 54, 2107
(1985).[50] H. P. Zhang and H. A. Makse, Phys. Rev. E 72, 011301
(2005).[51] B. Utter and R. P. Behringer, Phys. Rev. E 69, 031308
(2004).[52] A. Singh, V. Magnanimo, K. Saitoh, and S. Luding,
Phys. Rev. E 90, 022202 (2014).
Related Documents