Rheol Acta (2009) 48:1005–1015 DOI 10.1007/s00397-009-0382-8 ORIGINAL CONTRIBUTION Rheology measurements of a biomass slurry: an inter-laboratory study Jonathan J. Stickel · Jeffrey S. Knutsen · Matthew W. Liberatore · Wing Luu · Douglas W. Bousfield · Daniel J. Klingenberg · C. Tim Scott · Thatcher W. Root · Max R. Ehrhardt · Thomas O. Monz Received: 5 November 2008 / Accepted: 1 July 2009 / Published online: 2 September 2009 © Springer-Verlag 2009 Abstract The conversion of biomass, specifically ligno- cellulosic biomass, into fuels and chemicals has recently gained national attention as an alternative to the use of fossil fuels. Increasing the concentration of the biomass solids during biochemical conversion has a large po- tential to reduce production costs. These concentrated biomass slurries have highly viscous, non-Newtonian behavior that poses several technical challenges to the conversion process. A collaborative effort to measure the rheology of a biomass slurry at four separate labo- ratories has been undertaken. A comprehensive set of rheological properties were measured using several dif- ferent rheometers, flow geometries, and experimental methods. The tendency for settling, water evaporation, and wall slip required special care when performing J. J. Stickel (B ) National Bioenergy Center, National Renewable Energy Laboratory, Golden, CO 80401, USA e-mail: [email protected] J. S. Knutsen · M. W. Liberatore Department of Chemical Engineering, Colorado School of Mines, Golden, CO, USA W. Luu · D. W. Bousfield Department of Chemical and Biological Engineering, University of Maine, Orono, ME, USA D. J. Klingenberg · T. W. Root · M. R. Ehrhardt · T. O. Monz Department of Chemical and Biological Engineering and Rheology Research Center, University of Wisconsin, Madison, WI, USA C. T. Scott U.S. Forest Service Forest Products Laboratory, Madison, WI, USA the experiments. The rheological properties were mea- sured at different concentrations up to 30% insoluble solids by mass. The slurry was found to be strongly shear-thinning, to be viscoelastic, and to have a signif- icant concentration-dependent yield stress. The elastic modulus was found to be almost an order of magnitude larger than the loss modulus and weakly dependent on frequency. The techniques and results of this work will be useful to characterize other biomass slurries and in the design of biochemical conversion processing steps that operate at high solids concentrations. Keywords Biomass · Yield stress · Shear thinning · Viscoelasticity · Wall slip Introduction Lignocellulosic biomass, i.e., the woody and fibrous parts of plant material, is an abundant natural resource across the globe. Liquid transportation fuels obtained by conversion of the chemical energy stored in ligno- cellulosic biomass could replace a substantial portion of the petroleum-based fuels consumed world-wide, hence the significant scientific, political, and corporate interest in recent years. Technology currently exists for the biochemical conversion of lignocellulosic biomass to fuel, typically ethanol, but with production costs that are not yet competitive with petroleum-based liquid fuels (Wyman 2007). Several research efforts at the National Renewable Energy Laboratory (NREL) and elsewhere are focused on reducing the cost of bio- chemical conversion. One possibility for cost-savings is the minimization of added water during the conversion process (Jørgensen et al. 2007; Wingren et al 2003).

Welcome message from author
This document is posted to help you gain knowledge. Please leave a comment to let me know what you think about it! Share it to your friends and learn new things together.
Transcript
Rheol Acta (2009) 48:1005–1015DOI 10.1007/s00397-009-0382-8
ORIGINAL CONTRIBUTION
Rheology measurements of a biomassslurry: an inter-laboratory study
Jonathan J. Stickel · Jeffrey S. Knutsen · Matthew W. Liberatore ·Wing Luu · Douglas W. Bousfield · Daniel J. Klingenberg · C. Tim Scott ·Thatcher W. Root · Max R. Ehrhardt · Thomas O. Monz
Received: 5 November 2008 / Accepted: 1 July 2009 / Published online: 2 September 2009© Springer-Verlag 2009
Abstract The conversion of biomass, specifically ligno-cellulosic biomass, into fuels and chemicals has recentlygained national attention as an alternative to the use offossil fuels. Increasing the concentration of the biomasssolids during biochemical conversion has a large po-tential to reduce production costs. These concentratedbiomass slurries have highly viscous, non-Newtonianbehavior that poses several technical challenges to theconversion process. A collaborative effort to measurethe rheology of a biomass slurry at four separate labo-ratories has been undertaken. A comprehensive set ofrheological properties were measured using several dif-ferent rheometers, flow geometries, and experimentalmethods. The tendency for settling, water evaporation,and wall slip required special care when performing
J. J. Stickel (B)National Bioenergy Center, National Renewable EnergyLaboratory, Golden, CO 80401, USAe-mail: [email protected]
J. S. Knutsen · M. W. LiberatoreDepartment of Chemical Engineering,Colorado School of Mines, Golden, CO, USA
W. Luu · D. W. BousfieldDepartment of Chemical and Biological Engineering,University of Maine, Orono, ME, USA
D. J. Klingenberg · T. W. Root · M. R. Ehrhardt · T. O. MonzDepartment of Chemical and Biological Engineeringand Rheology Research Center, University of Wisconsin,Madison, WI, USA
C. T. ScottU.S. Forest Service Forest Products Laboratory,Madison, WI, USA
the experiments. The rheological properties were mea-sured at different concentrations up to 30% insolublesolids by mass. The slurry was found to be stronglyshear-thinning, to be viscoelastic, and to have a signif-icant concentration-dependent yield stress. The elasticmodulus was found to be almost an order of magnitudelarger than the loss modulus and weakly dependent onfrequency. The techniques and results of this work willbe useful to characterize other biomass slurries and inthe design of biochemical conversion processing stepsthat operate at high solids concentrations.
Keywords Biomass · Yield stress · Shear thinning ·Viscoelasticity · Wall slip
Introduction
Lignocellulosic biomass, i.e., the woody and fibrousparts of plant material, is an abundant natural resourceacross the globe. Liquid transportation fuels obtainedby conversion of the chemical energy stored in ligno-cellulosic biomass could replace a substantial portionof the petroleum-based fuels consumed world-wide,hence the significant scientific, political, and corporateinterest in recent years. Technology currently exists forthe biochemical conversion of lignocellulosic biomassto fuel, typically ethanol, but with production costs thatare not yet competitive with petroleum-based liquidfuels (Wyman 2007). Several research efforts at theNational Renewable Energy Laboratory (NREL) andelsewhere are focused on reducing the cost of bio-chemical conversion. One possibility for cost-savings isthe minimization of added water during the conversionprocess (Jørgensen et al. 2007; Wingren et al 2003).
1006 Rheol Acta (2009) 48:1005–1015
Using less water can reduce the size and capital costs ofvarious upstream process vessels, as well as reduce thecosts associated with downstream water separation andrecycling. Unfortunately, the lower water content, andhence higher solids concentration, can have a negativeimpact on the process performance when using existingtechnology and ultimately results in lower conversionyields (Jørgensen et al. 2007). Although the lowerprocess performance at high solids concentrations isdue to several factors, including limitations of the com-mercially available biological catalysts (enzymes andmicroorganisms), material mixing and mass transferplay a significant role and are clear areas for improve-ments through application of engineering principles.
Biochemical conversion of lignocellulosic biomasstypically occurs in three steps: pretreatment, enzymatichydrolysis (saccharification), and fermentation (Lynd1996). The biomass material of interest here is cornstover that has undergone dilute-acid pretreatment(Schell et al. 2003) but has not yet been exposed toenzymes. Corn stover, the stalks, leaves, and cobs ofcorn plants, is a well-studied feedstock commonly usedin lignocellulosic biomass conversion research. Undi-luted pretreated corn stover (PCS) (∼ 20% insolublesolids by mass) is a suspension paste: it can easily beformed into a shape that remains when the appliedforces are removed (Coussot 2007). In these systemsthat contain dissolved salts and sugars, as well as cellu-lose fibers, a distinction needs to be made between totalsolids and insoluble solids. Total solids includes thesedissolved materials and the fibers and particles, whilethe insoluble solids are only the fibers and particles.The rheology of these systems should mainly depend onthe insoluble solids. Performing enzymatic hydrolysiswith undiluted PCS poses several challenges, includinghow to best mix in the enzymes at the beginning of thereaction. An understanding of the rheology of PCS isessential for designing appropriate reaction processesand equipment.
There have been a few studies of the rheology ofPCS and other biomass slurries related to biofuelsproduction. Performing rheometry on these materialsis quite challenging. As with most yield stress fluids,biomass slurries are prone to wall slip and nonuni-form shear profiles (Bertola et al. 2003). The materialsare heterogeneous with particles and fibers varyingwidely in terms of size and aspect ratio. Therefore,reproducible sampling and loading of a rheometer isnot trivial. Due to the presence of millimeter-sizedparticles, jamming is also a problem for narrow-gapgeometries. Pimenova and Hanley (2003, 2004) usedan impeller device to measure apparent viscosity vsapparent shear rate of PCS at concentrations up to 30%
solids by mass. Yield stress values were determined byfitting to the typical yield stress rheological models ofBingham, Casson, and Herschel-Bulkley (Nguyen andBoger 1992). Dasari and Berson (2007) measured theviscosity of sawdust slurries and Rosgaard et al. (2007)measured the viscosity of barley straw slurries, bothusing a vane. Their studies were limited to slurries upto 15% solids by mass. Viamajala et al. (2009) usedparallel plates to measure viscosity vs shear rate ofground and sieved corn stover, both untreated andpretreated, at concentrations up to 40% insoluble solidsby mass. Note that the other referenced studies werenot clear about the quantity of soluble solids in theirsamples, such as sugars and salts, that would con-tribute to a simple measurement of total solids. Yieldstress values were determined by fitting to the Cassonmodel. Interestingly, there was a sharp deviation inthe yield stress vs concentration trend for concentra-tions greater than ∼ 25% insoluble solids, dependingon the sample preparation. This was attributed to theentrainment of air and a shift to granular behavior atthese high concentrations, although the possibility ofwall slip was not explored. All of these studies werelimited to measuring three decades of shear rate orless. More recently, Ehrhardt et al. (2009) and Knutsenand Liberatore (2009) performed rheological studies ofPCS simultaneously with the work presented here.
The rheology of wood pulp fiber suspensions, analo-gous to pretreated biomass slurries, has been well stud-ied for the purposes of paper making. Bennington et al.(1990) used a concentric cylinder device with baffleson both the cylinder and the bob to measure yield-ing by slowly increasing the applied torque. Damaniet al. (1993) performed oscillatory measurements witha reservoir-type parallel plate system with roughenedplates. In addition to reporting elastic and viscous mod-uli as a function of frequency, yield stress values wereobtained by measuring the elastic modulus for increas-ing strain amplitudes. More recently, Ventura et al.(2007) used a Searle-type rotational plate viscometer(Blanco et al. 2007) to measure the shear stress vsshear rate of pulp suspensions. They fit their data to theHerschel-Bulkley model and assessed the effect of pulpproperties.
Methods were developed in this work to study thedetailed rheological properties of PCS over a concen-tration range from dilute, flow-able slurries to concen-trated, stiff pastes. We performed measurements witha variety of instruments and tools (vanes, roughenedplates, and a torque rheometer) in order to produce acomprehensive understanding of the rheology of PCS.By using state-of-the-art rheometers for some of themeasurements, oscillatory and uniform shear data were
Rheol Acta (2009) 48:1005–1015 1007
obtained for much larger ranges of frequency and shearrates than have been previously reported. Comparisonsbetween the different measurement methods help toillustrate which methods are most suited for routinemeasurements of the rheology of biomass slurries.
Material
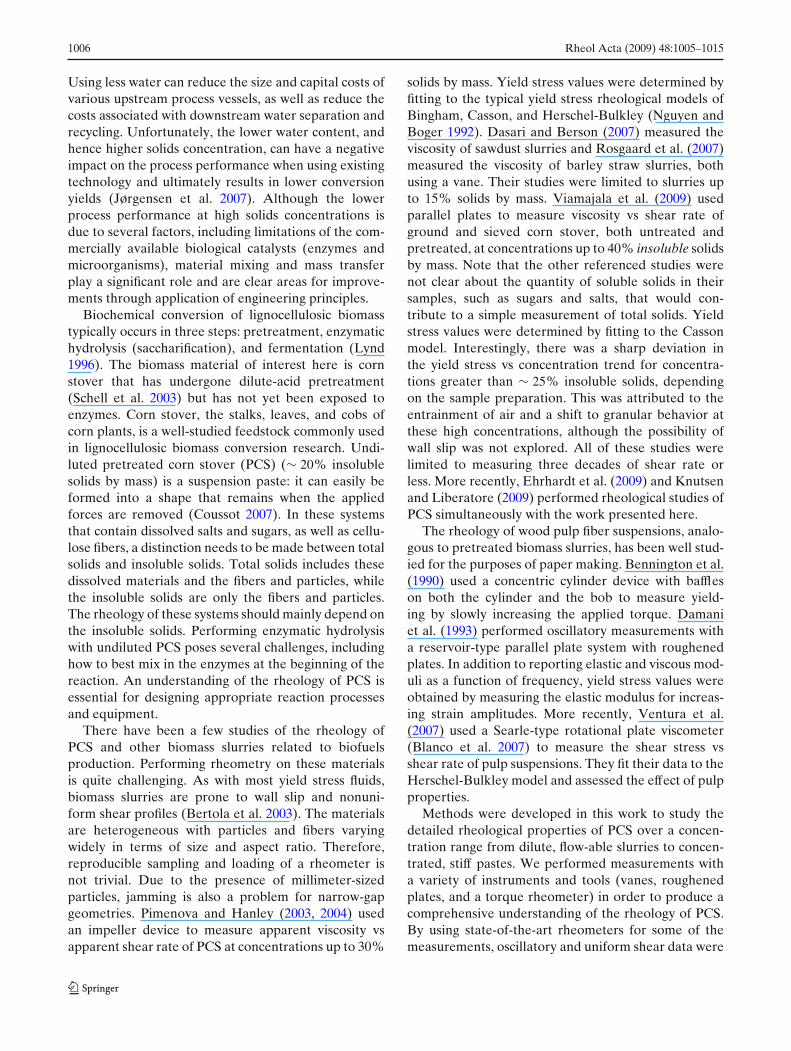
The biomass slurry used in this study was corn stoverthat was chemically pretreated in the Process Devel-opment Unit of the National Bioenergy Center atthe NREL (Golden, CO). The corn stover, previouslyground and sieved with a 5.1-cm (2 in) screen, wastreated with dilute sulfuric acid at a loading of 0.048 g/g(acid per dry biomass) and a temperature of 190◦Cfor 1 min (Schell et al. 2003). The total biomass solidsconcentration during the reaction was 30% by mass.A large portion of the hemicellulose is chemically hy-drolyzed by this method, and there is considerableparticle size reduction. The particles vary considerablyin terms of size (1–2,000 μm; volume-weighted mean ≈100 μm) and aspect ratio (1–20), as measured by opti-cal microscopy and image analysis (Particle Size Sys-tem Research Unit, Clemex Technologies, Longueuil,Québec, Canada). A photograph of undiluted PCS andan optical microscope image of a diluted sample areshown in Fig. 1.
The unmodified PCS is highly acidic (pH ≈ 1.5) andcontains soluble sugars that were released by chem-ical hydrolysis of hemicellulose during the pretreat-ment. The acidity is enough to etch most stainless steelrheometer tools. In order to raise the pH and removethe dissolved sugars, the PCS is washed with deionizedwater. The method for washing is to mix in deionizedwater, centrifuge, decant, and repeat three to six times.
The washed, centrifuged PCS was reconstituted withdeionized water to achieve the desired concentrations.All concentrations are reported here as mass percentinsoluble solids, as measured by mass ratio upon sampledrying. For washed PCS, the amount of insoluble solidsequals the amount of total solids. However, it is impor-tant to differentiate between insoluble and total solidswhen comparing to studies with unwashed biomass.Rheological properties should correlate with insolublesolids rather than total solids concentrations. It is dif-ficult to determine the volume fraction of the parti-cles because they are porous and contain a significantportion of the available water in the sample. Estimatesbased on ongoing work indicate that a concentration of20% insoluble solids roughly corresponds to a volumefraction of particles of 40% (Roche et al. 2009).
Rheometry
Rheology measurements were made by four differ-ent laboratory groups using separate instruments. Theinstrument used at the NREL was a Bohlin GeminiHR Nano rotational rheometer (Malvern Instruments,Westborough, MA, USA) with a wide-gap vane andparallel plates. The parallel plates were machined tohave serrations ∼ 1 mm deep. The instrument used atthe Colorado School of Mines (CSM) was an AR-G2 rotational rheometer (TA Instruments, New Castle,DE, USA) with a narrow-gap vane. The instrumentused at the University of Maine was a Bohlin CVOrotational rheometer (Malvern Instruments) with par-allel plates roughened by the addition of 100-grit sand-paper. A cone and plate geometry was also tested,but the truncated gap was on the order of the par-ticle size and inconsistent results were obtained. The
(a) (b)
Fig. 1 a Photograph of undiluted PCS. b Microscope image of PCS particles
1008 Rheol Acta (2009) 48:1005–1015
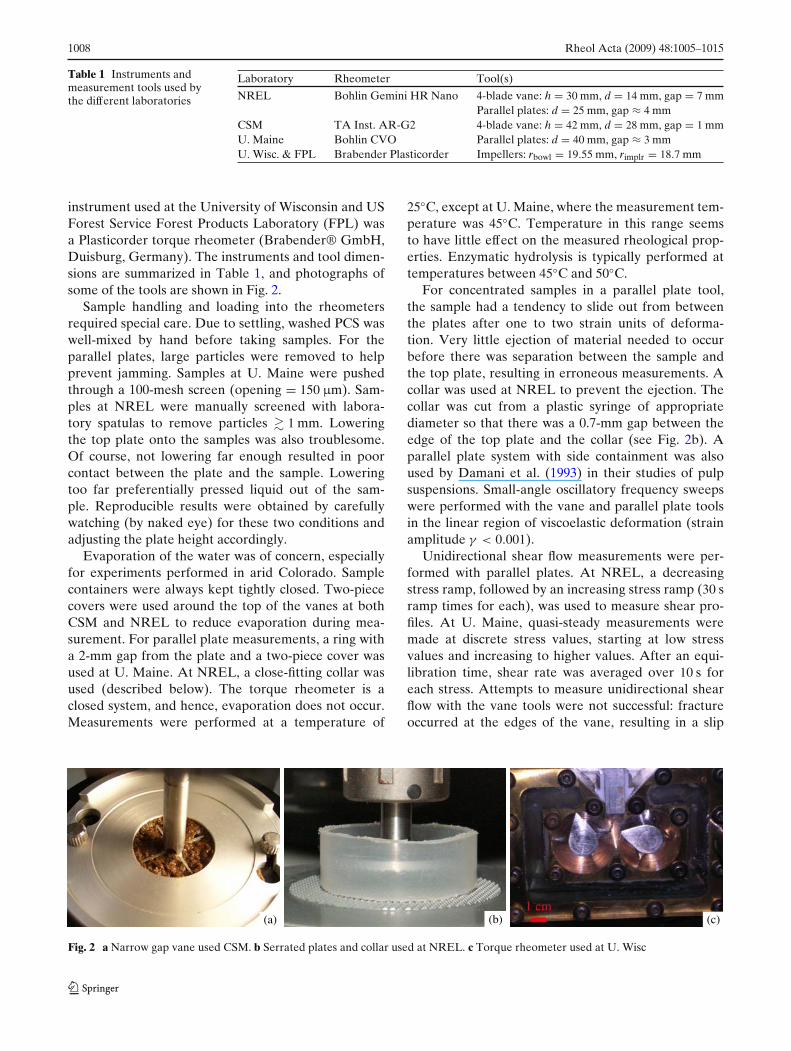
Table 1 Instruments andmeasurement tools used bythe different laboratories
Laboratory Rheometer Tool(s)
NREL Bohlin Gemini HR Nano 4-blade vane: h = 30 mm, d = 14 mm, gap = 7 mmParallel plates: d = 25 mm, gap ≈ 4 mm
CSM TA Inst. AR-G2 4-blade vane: h = 42 mm, d = 28 mm, gap = 1 mmU. Maine Bohlin CVO Parallel plates: d = 40 mm, gap ≈ 3 mmU. Wisc. & FPL Brabender Plasticorder Impellers: rbowl = 19.55 mm, rimplr = 18.7 mm
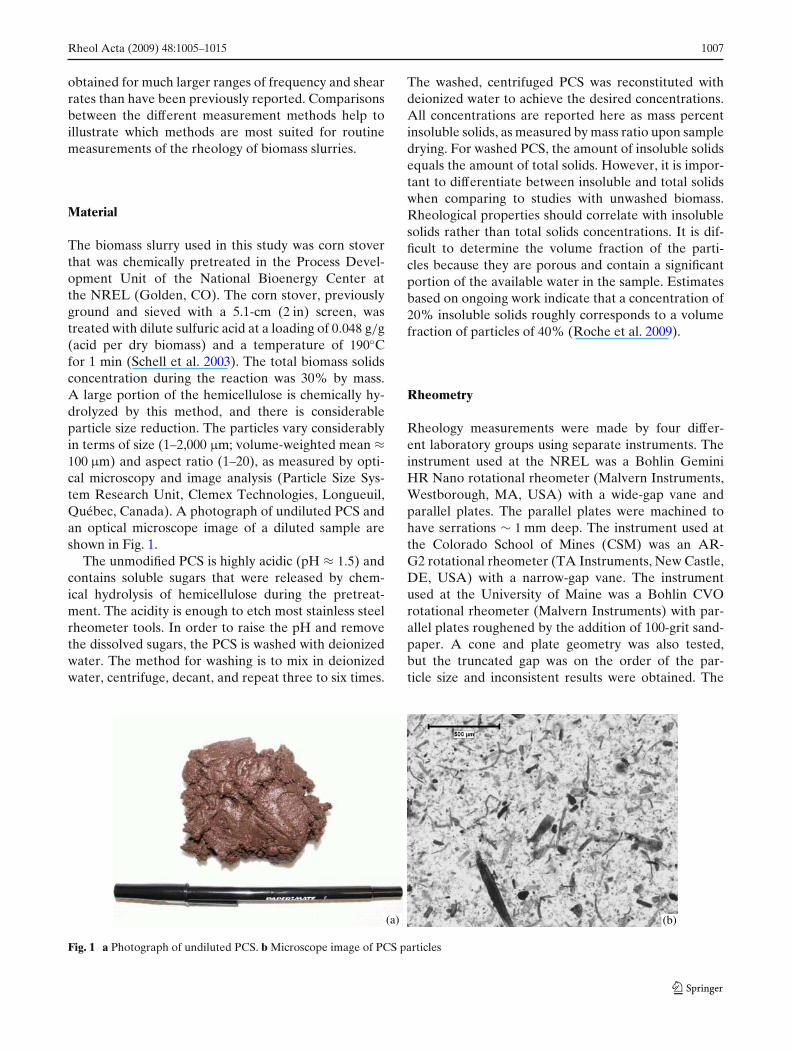
instrument used at the University of Wisconsin and USForest Service Forest Products Laboratory (FPL) wasa Plasticorder torque rheometer (Brabender® GmbH,Duisburg, Germany). The instruments and tool dimen-sions are summarized in Table 1, and photographs ofsome of the tools are shown in Fig. 2.
Sample handling and loading into the rheometersrequired special care. Due to settling, washed PCS waswell-mixed by hand before taking samples. For theparallel plates, large particles were removed to helpprevent jamming. Samples at U. Maine were pushedthrough a 100-mesh screen (opening = 150 μm). Sam-ples at NREL were manually screened with labora-tory spatulas to remove particles � 1 mm. Loweringthe top plate onto the samples was also troublesome.Of course, not lowering far enough resulted in poorcontact between the plate and the sample. Loweringtoo far preferentially pressed liquid out of the sam-ple. Reproducible results were obtained by carefullywatching (by naked eye) for these two conditions andadjusting the plate height accordingly.
Evaporation of the water was of concern, especiallyfor experiments performed in arid Colorado. Samplecontainers were always kept tightly closed. Two-piececovers were used around the top of the vanes at bothCSM and NREL to reduce evaporation during mea-surement. For parallel plate measurements, a ring witha 2-mm gap from the plate and a two-piece cover wasused at U. Maine. At NREL, a close-fitting collar wasused (described below). The torque rheometer is aclosed system, and hence, evaporation does not occur.Measurements were performed at a temperature of
25◦C, except at U. Maine, where the measurement tem-perature was 45◦C. Temperature in this range seemsto have little effect on the measured rheological prop-erties. Enzymatic hydrolysis is typically performed attemperatures between 45◦C and 50◦C.
For concentrated samples in a parallel plate tool,the sample had a tendency to slide out from betweenthe plates after one to two strain units of deforma-tion. Very little ejection of material needed to occurbefore there was separation between the sample andthe top plate, resulting in erroneous measurements. Acollar was used at NREL to prevent the ejection. Thecollar was cut from a plastic syringe of appropriatediameter so that there was a 0.7-mm gap between theedge of the top plate and the collar (see Fig. 2b). Aparallel plate system with side containment was alsoused by Damani et al. (1993) in their studies of pulpsuspensions. Small-angle oscillatory frequency sweepswere performed with the vane and parallel plate toolsin the linear region of viscoelastic deformation (strainamplitude γ < 0.001).
Unidirectional shear flow measurements were per-formed with parallel plates. At NREL, a decreasingstress ramp, followed by an increasing stress ramp (30 sramp times for each), was used to measure shear pro-files. At U. Maine, quasi-steady measurements weremade at discrete stress values, starting at low stressvalues and increasing to higher values. After an equi-libration time, shear rate was averaged over 10 s foreach stress. Attempts to measure unidirectional shearflow with the vane tools were not successful: fractureoccurred at the edges of the vane, resulting in a slip
(a) (b) (c)
Fig. 2 a Narrow gap vane used CSM. b Serrated plates and collar used at NREL. c Torque rheometer used at U. Wisc
Rheol Acta (2009) 48:1005–1015 1009
layer between the vane plug and the material in theannulus. Apparent shear stress and shear rate weremeasured in the torque rheometer at three differentspeeds. The torque rheometer avoids the problem ofmaterial ejection, enabling measurement at higher ap-parent shear rates. The torque rheometer calibrationand experimental methods are described by Ehrhardt(2008).
Although yield stress values can be inferred fromshear profile data by extrapolation or model fitting, it issometimes preferable to determine yield stress valuesby direct measurement (Nguyen and Boger 1992). Onemethod that was used was rotating a vane at a con-trolled rate, where the maximum in the torque profile,Mm, was taken to correspond to the dynamic yieldstress, τy, through the equation (Liddell and Boger1996):
τy = 2
πd3
(hd
+ 1
3
)−1
Mm, (1)
where d and h are the diameter and height of the vane,respectively. A sufficiently low applied rotation rate isnecessary to prevent a significant viscous contributionto the measured torque. Yield stress was also measuredby oscillatory experiments with increasing amplitudeusing both the vane and parallel plate tools. The yieldstress can be interpreted as the stress amplitude atwhich the elastic modulus G′ becomes smaller thanthe shear modulus G′′, or it can be interpreted as themaximum elastic stress given by τe = G′γ (Damaniet al. 1993; Shih et al. 1999; Walls et al. 2003; Yanget al. 1986). Analogous to the vane method, a suffi-
ciently low frequency is necessary to prevent significantviscous contributions to the measurement. Althoughless utilized than other methods to measure yield stress,there are advantages to determining yield stress fromdynamic amplitude sweep measurements. Most any ro-tational rheometry tool can be used, often requiringless sample volume than the vane. By simply includingan amplitude sweep with routine rheometry measure-ments, the yield stress behavior can be probed alongwith other rheological properties without reloading thesample.
Results and discussion
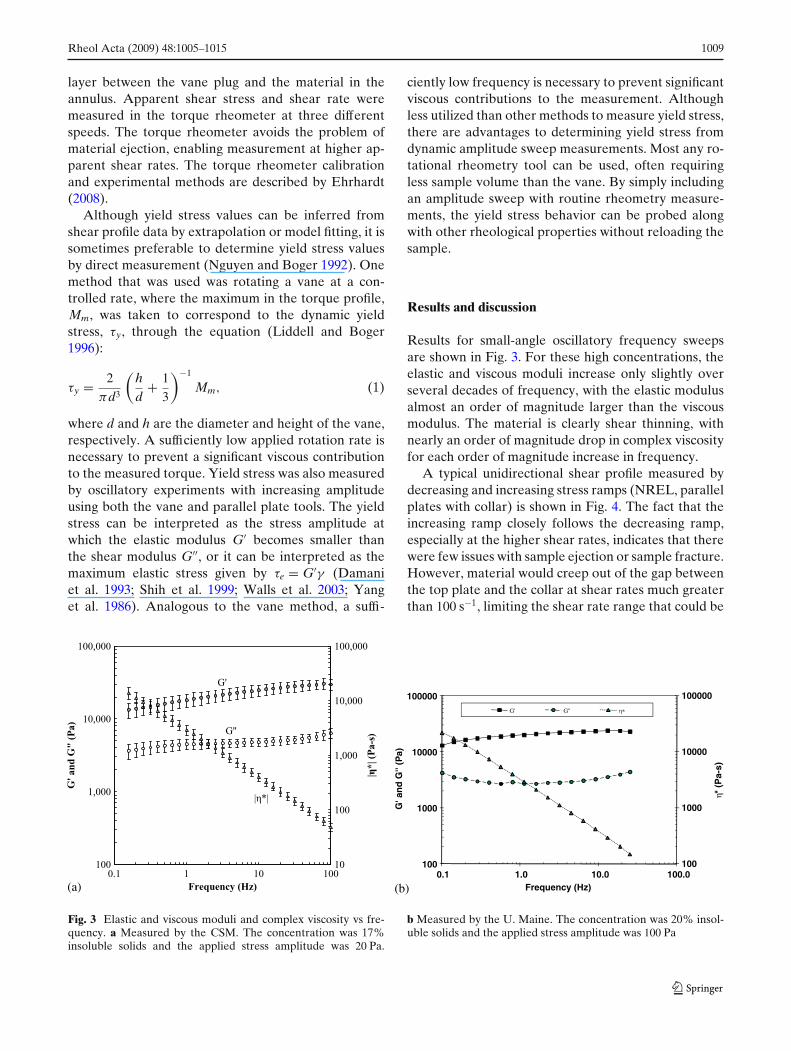
Results for small-angle oscillatory frequency sweepsare shown in Fig. 3. For these high concentrations, theelastic and viscous moduli increase only slightly overseveral decades of frequency, with the elastic modulusalmost an order of magnitude larger than the viscousmodulus. The material is clearly shear thinning, withnearly an order of magnitude drop in complex viscosityfor each order of magnitude increase in frequency.
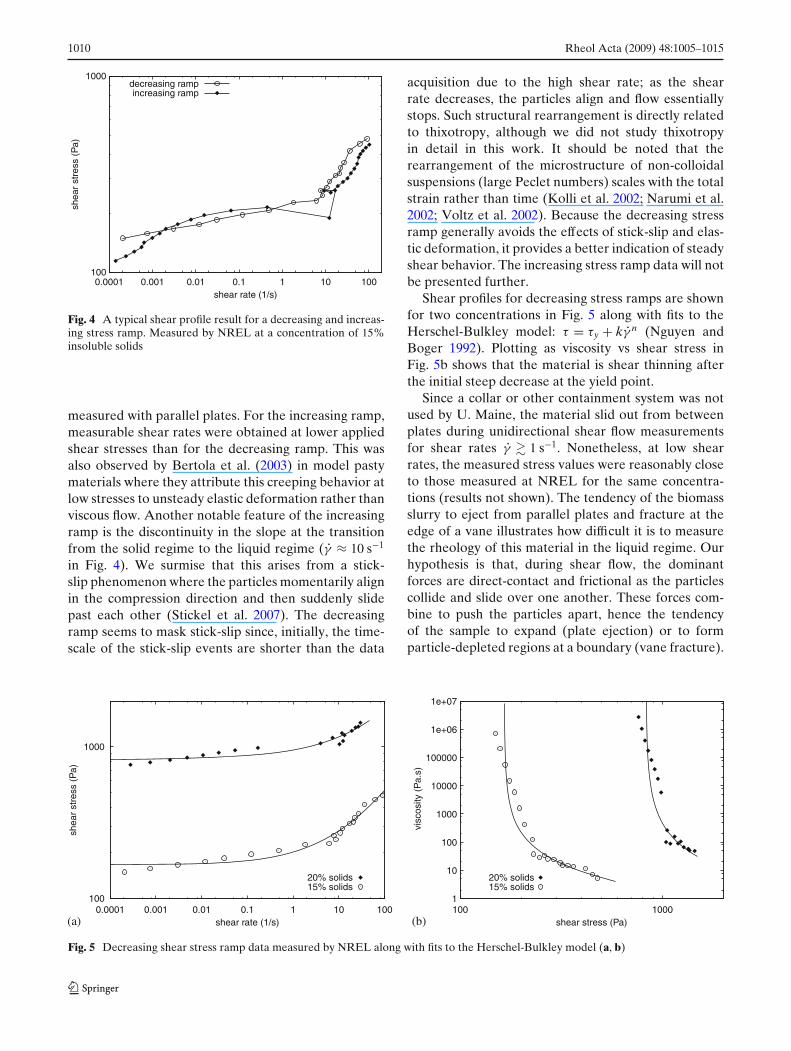
A typical unidirectional shear profile measured bydecreasing and increasing stress ramps (NREL, parallelplates with collar) is shown in Fig. 4. The fact that theincreasing ramp closely follows the decreasing ramp,especially at the higher shear rates, indicates that therewere few issues with sample ejection or sample fracture.However, material would creep out of the gap betweenthe top plate and the collar at shear rates much greaterthan 100 s−1, limiting the shear rate range that could be
(a)
100
1000
10000
100000
100
1000
10000
100000
0.1 1.0 10.0 100.0
* (P
a-s)
G' a
nd
G''
(Pa)
Frequency (Hz)
G' G''
(b)
Fig. 3 Elastic and viscous moduli and complex viscosity vs fre-quency. a Measured by the CSM. The concentration was 17%insoluble solids and the applied stress amplitude was 20 Pa.
b Measured by the U. Maine. The concentration was 20% insol-uble solids and the applied stress amplitude was 100 Pa
1010 Rheol Acta (2009) 48:1005–1015
100
1000
0.0001 0.001 0.01 0.1 1 10 100
shea
r st
ress
(P
a)
shear rate (1/s)
decreasing rampincreasing ramp
Fig. 4 A typical shear profile result for a decreasing and increas-ing stress ramp. Measured by NREL at a concentration of 15%insoluble solids
measured with parallel plates. For the increasing ramp,measurable shear rates were obtained at lower appliedshear stresses than for the decreasing ramp. This wasalso observed by Bertola et al. (2003) in model pastymaterials where they attribute this creeping behavior atlow stresses to unsteady elastic deformation rather thanviscous flow. Another notable feature of the increasingramp is the discontinuity in the slope at the transitionfrom the solid regime to the liquid regime (γ̇ ≈ 10 s−1
in Fig. 4). We surmise that this arises from a stick-slip phenomenon where the particles momentarily alignin the compression direction and then suddenly slidepast each other (Stickel et al. 2007). The decreasingramp seems to mask stick-slip since, initially, the time-scale of the stick-slip events are shorter than the data
acquisition due to the high shear rate; as the shearrate decreases, the particles align and flow essentiallystops. Such structural rearrangement is directly relatedto thixotropy, although we did not study thixotropyin detail in this work. It should be noted that therearrangement of the microstructure of non-colloidalsuspensions (large Peclet numbers) scales with the totalstrain rather than time (Kolli et al. 2002; Narumi et al.2002; Voltz et al. 2002). Because the decreasing stressramp generally avoids the effects of stick-slip and elas-tic deformation, it provides a better indication of steadyshear behavior. The increasing stress ramp data will notbe presented further.
Shear profiles for decreasing stress ramps are shownfor two concentrations in Fig. 5 along with fits to theHerschel-Bulkley model: τ = τy + kγ̇ n (Nguyen andBoger 1992). Plotting as viscosity vs shear stress inFig. 5b shows that the material is shear thinning afterthe initial steep decrease at the yield point.
Since a collar or other containment system was notused by U. Maine, the material slid out from betweenplates during unidirectional shear flow measurementsfor shear rates γ̇ � 1 s−1. Nonetheless, at low shearrates, the measured stress values were reasonably closeto those measured at NREL for the same concentra-tions (results not shown). The tendency of the biomassslurry to eject from parallel plates and fracture at theedge of a vane illustrates how difficult it is to measurethe rheology of this material in the liquid regime. Ourhypothesis is that, during shear flow, the dominantforces are direct-contact and frictional as the particlescollide and slide over one another. These forces com-bine to push the particles apart, hence the tendencyof the sample to expand (plate ejection) or to formparticle-depleted regions at a boundary (vane fracture).
100
1000
0.0001 0.001 0.01 0.1 1 10 100
shea
r st
ress
(P
a)
shear rate (1/s)
20% solids15% solids
(a)
1
10
100
1000
10000
100000
1e+06
1e+07
100 1000
visc
osity
(P
a.s)
shear stress (Pa)
20% solids15% solids
(b)
Fig. 5 Decreasing shear stress ramp data measured by NREL along with fits to the Herschel-Bulkley model (a, b)
Rheol Acta (2009) 48:1005–1015 1011
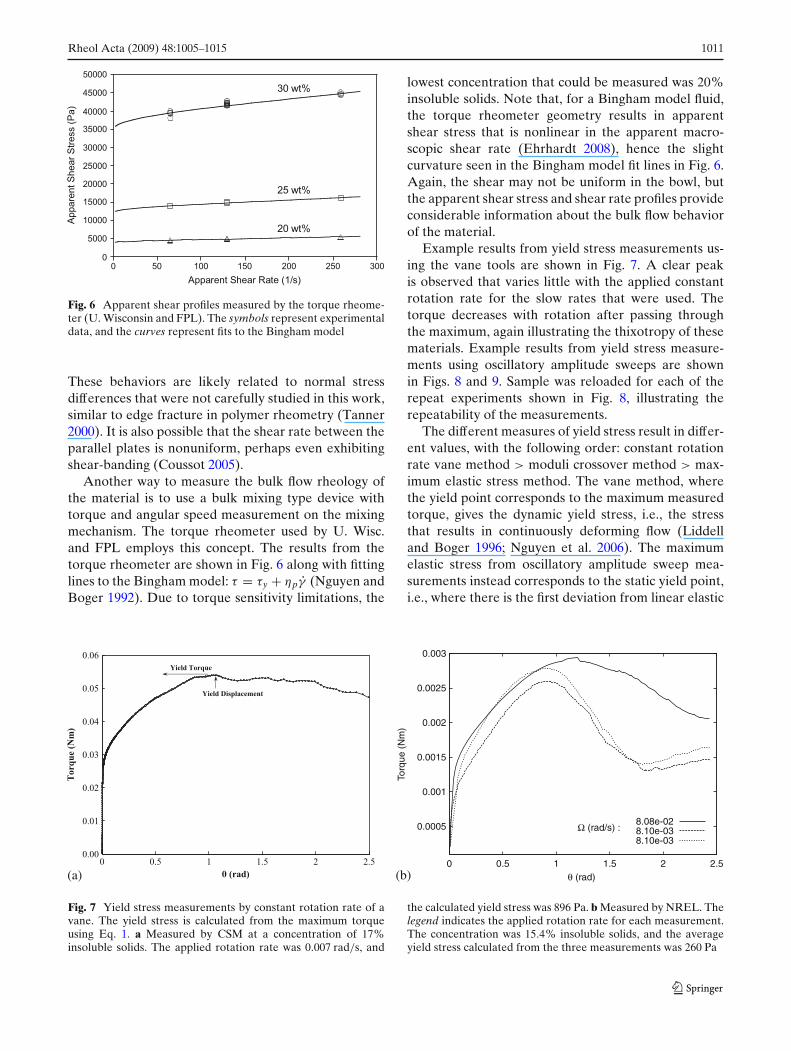
Fig. 6 Apparent shear profiles measured by the torque rheome-ter (U. Wisconsin and FPL). The symbols represent experimentaldata, and the curves represent fits to the Bingham model
These behaviors are likely related to normal stressdifferences that were not carefully studied in this work,similar to edge fracture in polymer rheometry (Tanner2000). It is also possible that the shear rate between theparallel plates is nonuniform, perhaps even exhibitingshear-banding (Coussot 2005).
Another way to measure the bulk flow rheology ofthe material is to use a bulk mixing type device withtorque and angular speed measurement on the mixingmechanism. The torque rheometer used by U. Wisc.and FPL employs this concept. The results from thetorque rheometer are shown in Fig. 6 along with fittinglines to the Bingham model: τ = τy + ηpγ̇ (Nguyen andBoger 1992). Due to torque sensitivity limitations, the
lowest concentration that could be measured was 20%insoluble solids. Note that, for a Bingham model fluid,the torque rheometer geometry results in apparentshear stress that is nonlinear in the apparent macro-scopic shear rate (Ehrhardt 2008), hence the slightcurvature seen in the Bingham model fit lines in Fig. 6.Again, the shear may not be uniform in the bowl, butthe apparent shear stress and shear rate profiles provideconsiderable information about the bulk flow behaviorof the material.
Example results from yield stress measurements us-ing the vane tools are shown in Fig. 7. A clear peakis observed that varies little with the applied constantrotation rate for the slow rates that were used. Thetorque decreases with rotation after passing throughthe maximum, again illustrating the thixotropy of thesematerials. Example results from yield stress measure-ments using oscillatory amplitude sweeps are shownin Figs. 8 and 9. Sample was reloaded for each of therepeat experiments shown in Fig. 8, illustrating therepeatability of the measurements.
The different measures of yield stress result in differ-ent values, with the following order: constant rotationrate vane method > moduli crossover method > max-imum elastic stress method. The vane method, wherethe yield point corresponds to the maximum measuredtorque, gives the dynamic yield stress, i.e., the stressthat results in continuously deforming flow (Liddelland Boger 1996; Nguyen et al. 2006). The maximumelastic stress from oscillatory amplitude sweep mea-surements instead corresponds to the static yield point,i.e., where there is the first deviation from linear elastic
(a)
0.0005
0.001
0.0015
0.002
0.0025
0.003
0 0.5 1 1.5 2 2.5
Torq
ue (
Nm
)
θ (rad)
8.08e-028.10e-038.10e-03
Ω (rad/s) :
(b)
Fig. 7 Yield stress measurements by constant rotation rate of avane. The yield stress is calculated from the maximum torqueusing Eq. 1. a Measured by CSM at a concentration of 17%insoluble solids. The applied rotation rate was 0.007 rad/s, and
the calculated yield stress was 896 Pa. b Measured by NREL. Thelegend indicates the applied rotation rate for each measurement.The concentration was 15.4% insoluble solids, and the averageyield stress calculated from the three measurements was 260 Pa
1012 Rheol Acta (2009) 48:1005–1015
100
1000
10000
10 100 1000
G’,
G’’
(Pa)
stress amplitude (Pa)
0.10.5
1: ω (1/s)
crossoverregion
(a)
10
100
10 100 1000
elas
tic s
tres
s (P
a)
stress amplitude (Pa)
0.10.10.50.5
1111
ω (1/s):
maximum elastic stress region
(b)
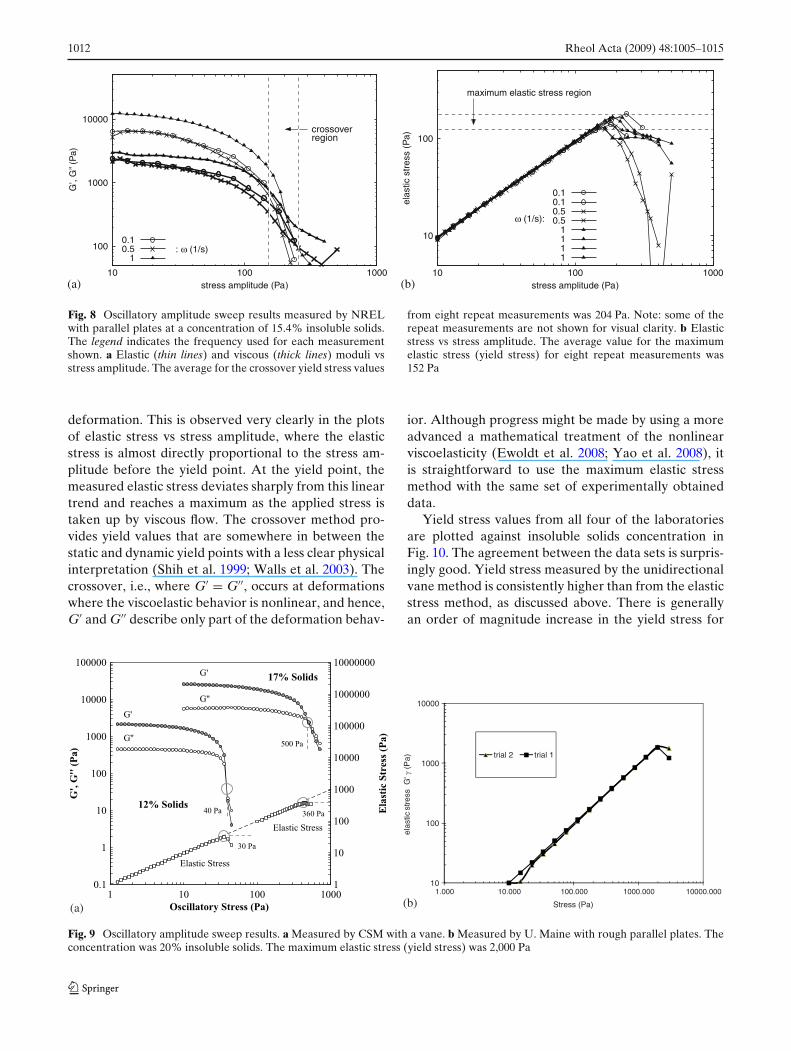
Fig. 8 Oscillatory amplitude sweep results measured by NRELwith parallel plates at a concentration of 15.4% insoluble solids.The legend indicates the frequency used for each measurementshown. a Elastic (thin lines) and viscous (thick lines) moduli vsstress amplitude. The average for the crossover yield stress values
from eight repeat measurements was 204 Pa. Note: some of therepeat measurements are not shown for visual clarity. b Elasticstress vs stress amplitude. The average value for the maximumelastic stress (yield stress) for eight repeat measurements was152 Pa
deformation. This is observed very clearly in the plotsof elastic stress vs stress amplitude, where the elasticstress is almost directly proportional to the stress am-plitude before the yield point. At the yield point, themeasured elastic stress deviates sharply from this lineartrend and reaches a maximum as the applied stress istaken up by viscous flow. The crossover method pro-vides yield values that are somewhere in between thestatic and dynamic yield points with a less clear physicalinterpretation (Shih et al. 1999; Walls et al. 2003). Thecrossover, i.e., where G′ = G′′, occurs at deformationswhere the viscoelastic behavior is nonlinear, and hence,G′ and G′′ describe only part of the deformation behav-
ior. Although progress might be made by using a moreadvanced a mathematical treatment of the nonlinearviscoelasticity (Ewoldt et al. 2008; Yao et al. 2008), itis straightforward to use the maximum elastic stressmethod with the same set of experimentally obtaineddata.
Yield stress values from all four of the laboratoriesare plotted against insoluble solids concentration inFig. 10. The agreement between the data sets is surpris-ingly good. Yield stress measured by the unidirectionalvane method is consistently higher than from the elasticstress method, as discussed above. There is generallyan order of magnitude increase in the yield stress for
(a)
10
100
1000
10000
1.000 10.000 100.000 1000.000 10000.000
elas
tic s
tress
G'
(Pa)
Stress (Pa)
trial 2 trial 1
(b)
Fig. 9 Oscillatory amplitude sweep results. a Measured by CSM with a vane. b Measured by U. Maine with rough parallel plates. Theconcentration was 20% insoluble solids. The maximum elastic stress (yield stress) was 2,000 Pa
Rheol Acta (2009) 48:1005–1015 1013
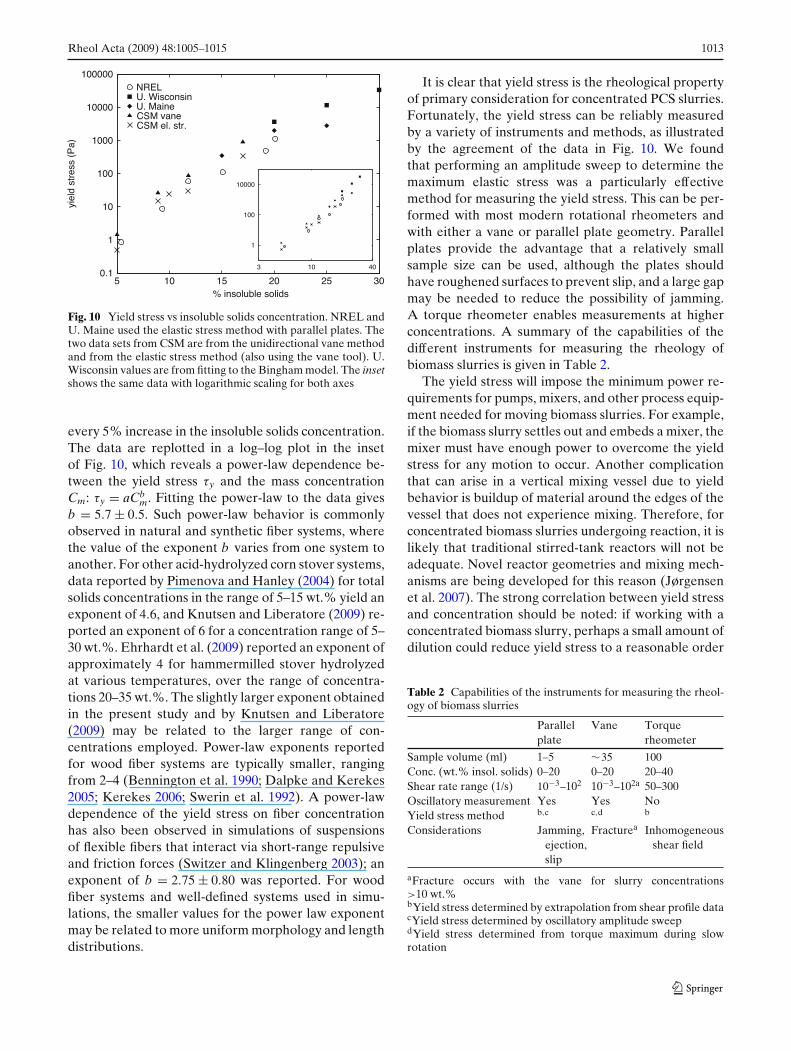
Fig. 10 Yield stress vs insoluble solids concentration. NREL andU. Maine used the elastic stress method with parallel plates. Thetwo data sets from CSM are from the unidirectional vane methodand from the elastic stress method (also using the vane tool). U.Wisconsin values are from fitting to the Bingham model. The insetshows the same data with logarithmic scaling for both axes
every 5% increase in the insoluble solids concentration.The data are replotted in a log–log plot in the insetof Fig. 10, which reveals a power-law dependence be-tween the yield stress τy and the mass concentrationCm: τy = aCb
m. Fitting the power-law to the data givesb = 5.7 ± 0.5. Such power-law behavior is commonlyobserved in natural and synthetic fiber systems, wherethe value of the exponent b varies from one system toanother. For other acid-hydrolyzed corn stover systems,data reported by Pimenova and Hanley (2004) for totalsolids concentrations in the range of 5–15 wt.% yield anexponent of 4.6, and Knutsen and Liberatore (2009) re-ported an exponent of 6 for a concentration range of 5–30 wt.%. Ehrhardt et al. (2009) reported an exponent ofapproximately 4 for hammermilled stover hydrolyzedat various temperatures, over the range of concentra-tions 20–35 wt.%. The slightly larger exponent obtainedin the present study and by Knutsen and Liberatore(2009) may be related to the larger range of con-centrations employed. Power-law exponents reportedfor wood fiber systems are typically smaller, rangingfrom 2–4 (Bennington et al. 1990; Dalpke and Kerekes2005; Kerekes 2006; Swerin et al. 1992). A power-lawdependence of the yield stress on fiber concentrationhas also been observed in simulations of suspensionsof flexible fibers that interact via short-range repulsiveand friction forces (Switzer and Klingenberg 2003); anexponent of b = 2.75 ± 0.80 was reported. For woodfiber systems and well-defined systems used in simu-lations, the smaller values for the power law exponentmay be related to more uniform morphology and lengthdistributions.
It is clear that yield stress is the rheological propertyof primary consideration for concentrated PCS slurries.Fortunately, the yield stress can be reliably measuredby a variety of instruments and methods, as illustratedby the agreement of the data in Fig. 10. We foundthat performing an amplitude sweep to determine themaximum elastic stress was a particularly effectivemethod for measuring the yield stress. This can be per-formed with most modern rotational rheometers andwith either a vane or parallel plate geometry. Parallelplates provide the advantage that a relatively smallsample size can be used, although the plates shouldhave roughened surfaces to prevent slip, and a large gapmay be needed to reduce the possibility of jamming.A torque rheometer enables measurements at higherconcentrations. A summary of the capabilities of thedifferent instruments for measuring the rheology ofbiomass slurries is given in Table 2.
The yield stress will impose the minimum power re-quirements for pumps, mixers, and other process equip-ment needed for moving biomass slurries. For example,if the biomass slurry settles out and embeds a mixer, themixer must have enough power to overcome the yieldstress for any motion to occur. Another complicationthat can arise in a vertical mixing vessel due to yieldbehavior is buildup of material around the edges of thevessel that does not experience mixing. Therefore, forconcentrated biomass slurries undergoing reaction, it islikely that traditional stirred-tank reactors will not beadequate. Novel reactor geometries and mixing mech-anisms are being developed for this reason (Jørgensenet al. 2007). The strong correlation between yield stressand concentration should be noted: if working with aconcentrated biomass slurry, perhaps a small amount ofdilution could reduce yield stress to a reasonable order
Table 2 Capabilities of the instruments for measuring the rheol-ogy of biomass slurries
Parallel Vane Torqueplate rheometer
Sample volume (ml) 1–5 ∼35 100Conc. (wt.% insol. solids) 0–20 0–20 20–40Shear rate range (1/s) 10−3–102 10−3–102a 50–300Oscillatory measurement Yes Yes NoYield stress method b,c c,d b
Considerations Jamming, Fracturea Inhomogeneousejection, shear fieldslip
aFracture occurs with the vane for slurry concentrations>10 wt.%bYield stress determined by extrapolation from shear profile datacYield stress determined by oscillatory amplitude sweepdYield stress determined from torque maximum during slowrotation
1014 Rheol Acta (2009) 48:1005–1015
of magnitude for standard liquid handling equipment.At ∼ 20% insoluble solids, the yield stress is on theorder of 1,000 Pa. However, the PCS is “pourable”at a concentration of ∼ 10% insoluble solids, whichcorresponds to a yield stress of ∼ 10 Pa. For practicalpurposes, the yield stress is effectively zero for concen-trations below 5% insoluble solids. The yield stress ofPCS also drops dramatically during further saccharifica-tion, typically by enzyme catalyst, as the cellulose solidsare broken into soluble species (Roche et al. 2009).
Probing the unidirectional shear rheology of PCSproved to be difficult due to non-uniform shear, stick-slip events, and ejection of material, as described above.Further measurements employing other techniques,e.g., capillary rheometry, may be helpful to gain abetter understanding of the shear flow behavior of PCSslurries. Extensional flow rheology, e.g., squeeze flowbetween parallel plates, would also be useful, althoughKnutsen and Liberatore (2009) report a tendency of theliquid phase to preferentially flow out of the particulatephase during squeeze flow experiments. Despite thesechallenges, it is clear that the material shears easily forimposed shear stresses above the yield stress: for lessthan an order of magnitude increase in the shear stress,the shear rate increases by several orders of magnitude(Fig. 5a) and, hence, the viscosity decreases by severalorders of magnitude (Fig. 5b). This means that, once theyield stress is overcome, very little additional energy isneeded to impose a bulk flow. Additionally, some of thephenomena that make rheology measurements difficultcould possibly be helpful. For example, transport inpipes will be aided by wall slip, and fracture can behelpful in transport by gravity feeding or conveying andin mixing by rotary tumbling.
Conclusions
A comprehensive set of rheological properties wasmeasured for PCS, with a variety of instruments andrheometry methods. There was generally good agree-ment in the results from the different groups and meth-ods, especially for measurements of yield stress, whichdominates the rheological behavior of the PCS. Rough-ened parallel plates were shown to be well suited formeasuring nearly all of the rheological properties stud-ied. With a single sample loaded between the plates,dynamic moduli, the static yield stress, and a shear pro-file were all determined by sequential oscillatory andunidirectional shear experiments. Side containment inthe form of a collar was needed to prevent mater-ial ejection during the shear experiments. A torquerheometer enabled shear measurements at higher con-
centrations of insoluble solids and at higher shear ratesthan could be measured in the parallel plates. A vanegeometry was shown to be useful for measuring thedynamic yield stress. However, unless high shear rateor dynamic (rather than static) yield information isneeded, roughened parallel plates are sufficient formeasuring the rheology of PCS.
Undiluted PCS with a concentration of 20% insolu-ble solids was found to have the rheological propertiesof a thick, stiff paste. At this concentration, the elasticmodulus was measured to be almost an order of magni-tude larger than the viscous modulus, and yield stressvalues were measured on the order of 1,000 Pa. ThePCS is shear thinning for applied shear stresses abovethe yield point.
The measured rheological properties of PCS, andthe developed rheometry methods, will be useful inlignocellulosic biochemical conversion research and de-velopment. The high yield stress and shear thinningbehavior of the concentrated pretreated biomass indi-cate that traditional tanks stirred with impellers are notadequate as reaction vessels for enzymatic hydrolysisof the biomass, at least not for the start of the reaction.The rheometry methods will be useful for studying therheology of other types of lignocellulosic biomass, bio-mass pretreated with different pretreatment conditions,and the biomass slurry as the enzymatic hydrolysis reac-tion progresses. These research efforts will help enablecost-effective biochemical conversion of lignocellulosicbiomass to biofuels.
Acknowledgements This work was funded in part by the U.S.Department of Energy Office of the Biomass Program and in partby the National Research Initiative of the USDA CooperativeState Research, Education, and Extension Service, grant number2006-35504-17401. J. Stickel would like to thank Christine Rochefor help with sample preparation.
References
Bennington CPJ, Kerekes RJ, Grace JR (1990) The yield stressof fiber suspensions. Can J Chem Eng 68(5):748–757
Bertola V, Bertrand F, Tabuteau H, Bonn D, Coussot P (2003)Wall slip and yielding in pasty materials. J Rheol 47(5):1211–1226
Blanco A, Negro C, Fuente E, Tijero J (2007) Rotor selectionfor a searle-type device to study the rheology of paper pulpsuspensions. Chem Eng Process 46(1):37–44
Coussot P (2005) Rheometry of pastes, suspensions, and granularmaterials: applications in industry and environment. Wiley,Hoboken
Coussot P (2007) Rheophysics of pastes: a review of microscopicmodelling approaches. Soft Matter 3(5):528–540
Dalpke B, Kerekes RJ (2005) The influence of fibre propertieson the apparent yield stress of flocculated pulp suspensions.J Pulp Pap Sci 31(1):39–43
Rheol Acta (2009) 48:1005–1015 1015
Damani R, Powell RL, Hagen N (1993) Viscoelastic characteri-zation of medium consistency pulp suspensions. Can J ChemEng 71(5):676–684
Dasari RK, Berson RE (2007) The effect of particle size onhydrolysis reaction rates and rheological properties in cel-lulosic slurries. Appl Biochem Biotechnol 137:289–299
Ehrhardt MR (2008) Rheology of biomass. Master’s thesis,University of Wisconsin, Madison, WI
Ehrhardt MR, Monz TO, Root TW, Connelly RK, Scott CT,Klingenberg DJ (2009) Rheology of dilute acid hydrolyzedcorn stover at high solids concentration. Appl BiochemBiotechnol. doi:10.1007/s12010-009-8606-z
Ewoldt RH, Hosoi AE, McKinley GH (2008) New measures forcharacterizing nonlinear viscoelasticity in large amplitudeoscillatory shear. J Rheol 52(6):1427–1458
Jørgensen H, Vibe-Pedersen J, Larsen J, Felby C (2007) Liq-uefaction of lignocellulose at high-solids concentrations.Biotechnol Bioeng 96(5):862–870
Kerekes RJ (2006) Rheology of suspensions—rheology of fibresuspensions in papermaking: an overview of recent research.Nord Pulp Paper Res 21(5):598–612
Knutsen JS, Liberatore MW (2009) Rheology of high-solidsbiomass slurries for biorefinery applications. J Rheol 53:877–892
Kolli VG, Pollauf EJ, Gadala-Maria F (2002) Transient normalstress response in a concentrated suspension of sphericalparticles. J Rheol 46(1):321–334
Liddell PV, Boger DV (1996) Yield stress measurements with thevane. J Non-Newton Fluid Mech 63(2–3):235–261
Lynd LR (1996) Overview and evaluation of fuel ethanol fromcellulosic biomass: technology, economics, the environment,and policy. Annu Rev Energy Environ 21:403–465
Narumi T, See H, Honma Y, Hasegawa T, Takahashi T,Phan-Thien N (2002) Transient response of concentratedsuspensions after shear reversal. J Rheol 46(1):295–305
Nguyen QD, Boger DV (1992) Measuring the flow properties ofyield stress fluids. Annu Rev Fluid Mech 24:47–88
Nguyen QD, Akroyd T, De Kee DC, Zhu LX (2006) Yield stressmeasurements in suspensions: an inter-laboratory study.Korea-Aust Rheol J 18(1):15–24
Pimenova NV, Hanley TR (2003) Measurement of rheologi-cal properties of corn stover suspensions. Appl BiochemBiotechnol 106:383–392
Pimenova NV, Hanley AR (2004) Effect of corn stover con-centration on rheological characteristics. Appl BiochemBiotechnol 114:347–360
Roche CM, Dibble CJ, Knutsen JS, Stickel JJ, Liberatore MW(2009) Particle concentration and yield stress of biomass
slurries during enzymatic hydrolysis at high-solids loadings.Biotechnol Bioeng 104(2):290–300
Rosgaard L, Andric P, Dam-Johansen K, Pedersen S, Meyer AS(2007) Effects of substrate loading on enzymatic hydroly-sis and viscosity of pretreated barley straw. Appl BiochemBiotechnol 143(1):27–40
Schell DJ, Farmer J, Newman M, McMillan JD (2003) Dilute-sulfuric acid pretreatment of corn stover in pilot-scalereactor—investigation of yields, kinetics, and enzymatic di-gestibilities of solids. Appl Biochem Biotechnol 105:69–85
Shih WY, Shih WH, Aksay IA (1999) Elastic and yield behaviorof strongly flocculated colloids. J Am Ceram Soc 82(3):616–624
Stickel JJ, Phillips RJ, Powell RL (2007) Application of a con-stitutive model for particulate suspensions: Time-dependentviscometric flows. J Rheol 51(6):1271–1302
Swerin A, Powell RL, Oedberg L (1992) Linear and nonlineardynamic viscoelasticity of pulp fiber suspensions. Nord PulpPaper Res 7(3):126–143
Switzer LH, Klingenberg DJ (2003) Rheology of sheared flex-ible fiber suspensions via fiber-level simulations. J Rheol47(3):759–778
Tanner RI (2000) Engineering rheology, 2nd edn. OxfordUniversity Press, Oxford
Ventura C, Blanco A, Negro C, Ferreira P, Garcia F, RasteiroM (2007) Modeling pulp fiber suspension rheology. TAPPI J6(7):17–23
Viamajala S, McMillan JD, Schell DJ, Elander RT (2009) Rhe-ology of corn stover slurries at high solids concentrations—effects of saccharification and particle size. Bioresour Tech-nol 100(2):925–934
Voltz C, Nitschke M, Heymann L, Rehberg I (2002) Thixotropyin macroscopic suspensions of spheres. Phys Rev E65(5):051402-1–051402-5
Walls HJ, Caines SB, Sanchez AM, Khan SA (2003) Yield stressand wall slip phenomena in colloidal silica gels. J Rheol47(4):847–868
Wingren A, Galbe M, Zacchi G (2003) Techno-economic eval-uation of producing ethanol from softwood: Comparison ofssf and shf and identification of bottlenecks. Biotechnol Prog19(4):1109–1117
Wyman CE (2007) What is (and is not) vital to advancing cellu-losic ethanol. Trends Biotechnol 25(4):153–157
Yang MC, Scriven LE, Macosko CW (1986) Some rheologicalmeasurements on magnetic iron-oxide suspensions in sili-cone oil. J Rheol 30(5):1015–1029
Yao NY, Larsen RJ, Weitz DA (2008) Probing nonlinear rheol-ogy with inertio-elastic oscillations. J Rheol 52(4):1013–1025
Related Documents