RHB PRIVATE EQUITY OPPORTUNITY FUND 1 ANNUAL REPORT 2019 For the financial year ended 31 July 2019

Welcome message from author
This document is posted to help you gain knowledge. Please leave a comment to let me know what you think about it! Share it to your friends and learn new things together.
Transcript

RHB PRIVATE EQUITY OPPORTUNITY FUND 1
ANNUAL REPORT 2019
For the financial year ended 31 July 2019
1
GENERAL INFORMATION ABOUT THE FUND
Name, Category and Type
Fund Name - RHB Private Equity Opportunity Fund 1
Fund Category - Private equity (close-ended)
Fund Type - Income and growth fund
Commencement Date, Tenure and Maturity Date
The Commencement Date of the Fund was on 28 July 2016. The tenure of the Fund
is 7 years and the Maturity Date of the Fund is on the seventh (7th) anniversary of
the Commencement Date.
Investment Objective, Policy and Strategy
Objective of the Fund
The Fund aims to provide long term^ capital appreciation by investing in the shares
of RHB Private Equity Fund I (“the Company”).
^Note: “long term” in this context refers to a period of 7 years.
Strategy
The Fund will invest principally in the United States Dollar (“USD”) denominated
shares of the Company. The Company is an exempted company with limited
liability incorporated in the Cayman Islands on 3 May 2016 under the company
law of the Cayman Islands. The Company is regulated by the Cayman Islands
Registrar of Companies.
The assets of the Company will be managed by the investment manager of the
Company, i.e. RHB Asset Management Pte Ltd (“RAM Singapore”), a company
incorporated in Singapore on 20 October 2006 to carry out fund management
activities that is regulated by the Monetary Authority of Singapore. RAM
Singapore has appointed NB Alternatives Advisers LLC as the Company’s sub-
investment manager. NB Alternatives Advisers LLC is a limited liability company
incorporated in Delaware and is a registered investment adviser with the United
States Securities and Exchange Commission.
2
The investment objective of the Company is to achieve attractive risk-adjusted
returns on its capital through investments in portfolio investments whose expected
duration is appropriate for the remaining charter life of the Company (a period of
7 years). As the Fund invests at least 95% of Net Asset Value (“NAV”) in the
shares of the Company, the investment strategy employed will be at the Company
level. The Company’s investment strategy is to primarily invest in private equity
and private debt investments, both direct investments and funds, including without
limitation private equity funds, co-investments, secondaries, private debt
investments and semi-liquid private equity investments (i.e. the portfolio
investments). The portfolio investments may consist of private equity investment
or funds managed and operated by various alternative investment managers in
which the Company’s sub-investment manager invests the Company’s assets into.
The Manager may trade in financial derivatives for the purpose of hedging the
Fund’s exposure to the USD denominated shares of the Company.
The Fund’s portfolio will be structured as follows:
At least 95% of
Net Asset Value
- Investments in the shares of RHB Private Equity Fund I.
Up to 5% of
Net Asset Value
- Investments in liquid assets including money market
instruments and Placements of Cash.
Note: Placements of Cash are placements of cash in any deposits or investment
accounts with any financial institution(s) that are not embedded with or linked to
financial derivative instruments.
3
Target Return
This Fund aims to achieve a targeted return of 15%-20% gross internal rate of
return per annum over the 7 years of the Fund.
There is no guarantee that returns targeted in any underwriting process will be
realised or achieved or that an investment strategy will be successful, and actual
returns may be significantly lower than those shown here. Investors should keep
in mind that the securities markets are volatile and unpredictable. There are no
guarantees that the historical performance of an investment, portfolio, or asset class
will have a direct correlation with its future performance.
Investment Policies and Restrictions
The Fund will invest principally in one company, i.e. the shares of RHB Private
Equity Fund I, participate in financial derivatives, invest in money market
instruments and make Placements of Cash with any financial institutions, and any
other investments in line with the Fund’s objective.
In undertaking the Fund’s investments, the Fund must not invest in a fund-of-
funds, a feeder fund or any sub-fund of an umbrella scheme which is a fund-of-
funds or a feeder fund.
Distribution Policy
Subject to the availability of income and at the Manager’s discretion of the best
interests of the Fund and the Unitholders, the Fund will declare income
distributions quarterly.
4
MANAGER’S REPORT
TARGET FUND STRATEGY
The Target Fund has two major strategies, i.e.
(1) investing in direct debt investments by investing into NB Private Equity Credit
Opportunities Fund LP (“NBPECO”), and
(2) investing in private equity investments and/or private debt instruments directly or
through co-investment deals on an opportunistic basis.
NBPECO updates
On 24 June 2019, NBPECO performed a net distribution of United States Dollar
(“USD”)183K to the Fund. The distribution is the result of several realizations in the
portfolio as well as coupon earned from February 2019 through May 2019. In total
NBPECO received in excess of USD170Million(“M”) of proceeds from the realization
of these investments and has paid down a portion of the capital call facility and recycled
the excess proceeds into new investments. In view of this, of the USD13M commitment
allocated by RHB Private Equity Fund I to this fund, RHB Private Equity Fund I has
approximately USD8.5M of commitments to NBPECO remaining unfunded. As of 19
June 2019, NBPECO had called USD486M of investor capital, will have realized
USD340M, and, based on pending and completed investment activity will have
invested and committed a total of approximately USD700M in 24 companies,
representing approximately 66% of NBPECO commitments of USD1,058M. Based on
undeployed capital and recycling provisions, NBPECO now have the ability to call
approximately USD 635M of investor commitments.
As at 31 March 2019, NBPECO’s Net MOIC (Multiple on Invested Capital) was 1.01x
and has generated gross and net Internal Rate of Return (“IRR”) of 5.1% and 0.9%
respectively. The net IRR was impacted by cumulative management fees and fund
expenses. NBPECO held USD467M of investments, which consisted of 35% first lien
loans, 6% second lien loans, 3% 144A bonds, 45% structured preferred investments,
and 11% equity and other investments
As of 31 March 2019, the NBPECO has called USD409M to support cumulative
investments of USD630M. The balance has been funded with the subscription line and
approximately USD24M of recycled proceeds. NBPECO have realised cash proceeds
of approximately USD156M and cash interest of USD33m. NBPECO realised several
large investments in April 2019 and May 2019. If these dispositions and all cash
interest associated with these realizations (in aircraft maintenance repair and overhaul,
specialty consulting, life sciences) are included, NBPECO will have distributed
5
USD308M of cash proceeds, representing a gross IRR of 20.6% and gross MOIC of
1.22x.
Forecasting the development of NBPECO IRRs over the next several months is a
difficult (and perhaps unwise) endeavor. Attempting to define a precise range of returns
for investments NB haven’t made is probably not a great use of time. Based on the
current Net Asset Value (“NAV”) (ignoring future deployment), NB do expect rolling
returns to continue to increase throughout the year as the portfolio matures. Of course,
NB cannot accurately forecast the vagaries of the market and account for all unexpected
idiosyncratic events.
Given NBPECO’s ‘dry powder’ and their disciplined approach to capital deployment,
they approached NBPECO’s Limited Partner Advisory Committee (the “LPAC”) in
February 2019 regarding an extension of NBPECO’s investment period. On 12 April
2019, they received majority consent of the LPAC to extend the investment period of
NBPECO to December 2020. NB expects that the portfolio aims to be deployed in full
by December 2020 and for it to be harvested within RHB Private Equity Fund I’s
charter life.
NB are often asked about the pace of future capital deployment. NBPECO have already
called capital to support their investment in an aerospace concern. While they have
identified several potential investment opportunities, they do not have a definitive
schedule for capital deployment. As such, to provide an approximation of future capital
calls, NB guide investors to assume that the dry powder estimate (approximately
USD635M) is invested ratably over the next six calendar quarters ending in December
2020 (roughly USD100M per quarter). This approximation can swing dramatically (up
or down) depending on prevailing market conditions.
Private Equity – Co-investments
Since inception, total commitments for co-investments of approximately USD12M
have been made, of which almost USD11M have been called. Five transactions have
seen an upward revaluation since the initial investment, these were Project Arch, WM,
Cotton, Cashier and the three CI Capital investments (Indigo, Eucalyptus, Mango) due
to on-plan performance and improvements to business operations. Project Hulk had a
slight downward valuation due to currency movement as the investment was in CAD.
Current portfolio
Project Bluemoon: September 2018, USD2M equity investment into a leading provider
of enterprise systems software that assists large organizations with managing and
optimizing their information technology needs. The lead sponsor is KKR which invests
across a variety of industries globally, with this investment forming part of their
flagship fund with ~USD14b committed capital. Bluemoon is expected to continue to
benefit from a resilient mainframe market and the growth of hybrid IT environments
6
that are increasingly complex and far-reaching. Additional growth upside driven by
better product positioning and cross-selling offerings to existing customers. CY18 total
revenue flat y-o-y due to higher than usual deferral rates in fourth quarter of year 2019,
CY18 consolidated Earnings Before Interest, Tax, Depreciation and Amortisation
("EBITDA") increased 10% Year-on-Year (“YoY”).
Project Cashier: August 2018, USD1M equity investment for the buyout of a leading
provider of Point of Sale (“POS”) terminals and systems as well as a suite of software
and value added solutions. The lead sponsor is Francisco Partners and they are a leading
global private equity firm, which specializes in investments in technology and
technology-enabled services businesses. The firm invests in opportunities where its
deep sectoral knowledge and operational expertise can help companies realize their full
potential. Under the leadership of the Francisco Partners-backed management team, a
significant cost restructuring program is being executed. The cost savings from this
restructuring are expected to be at least 30% above the amount of cost savings
underwritten by Francisco Partners. EBITDA forecast for year 2019 expected to be in
good shape.
Project Hulk: July 2018, USD1.1M equity investment into a top environmental services
company in Canada offering solid waste services, soil remediation and
liquid/hazardous waste services. It is vertically integrated from collection and sorting
to diversion and disposal. Hulk is well positioned to roll-up a highly fragmented
industry with a strong pipeline of accretive add-on acquisitions. There are favourable
environmental service market dynamics that support the base business with opportunity
for margin enhancement. The lead sponsor is BC Partners, they invest across industries,
with a focus on consumer & retail, media & telecom and business services. Hulk closed
an acquisition in November 2018 and is now the fourth largest waste management
player in North America, with a diversified geographical revenue base of ~50% Canada
and ~50% United States (“US”).
Project Indigo: Total USD600K investment commitment, with USD338K capital
previously called in May 2018 had a further USD228K called in December 2018. This
was for equity investment into a sales and marketing agency providing outsourced
sales, marketing and merchandising services to consumer packaged goods (“CPG”)
companies in US. The company is a solid platform asset with a strong foundation and
is well-positioned in the fast-growing small/mid-size CPG segment. The entry
valuation was attractive and at a discount as compared to its peers and below industry
average. The lead investors are CI Capital which have completed 33 platforms and over
240 add-on acquisitions to date representing USD9billion in enterprise value, they
focus on large fragmented industries with favourable consolidation economics,
attractive growth potential and strong cash flow. Indigo has a highly actionable
acquisition pipeline with identified targets with acquisitions completed in May 2018,
June 2018 and September 2018.
7
Project Eucalyptus: May 2018, USD600K investment commitment, with USD338K
capital called for equity investment into an operator of dermatology clinics including
general dermatology, cancer care and cosmetics options with ~30 clinics across 5 states
in US. There is a stable addressable market with strong tailwinds – increasing demand
for services driven primarily by rising occurrence of skin cancer and the aging US.
population together with shortage of dermatologists creates a supply and demand
imbalance. The lead sponsor is CI Capital. Eucalyptus has completed 19 add-on
acquisitions during CI Capital’s ownership, including 9 in the first 9 months of year
2018. It continues to pursue additional add-on acquisitions.
Project Mango: May 2018, USD1.6M investment commitment, with USD925K capital
called for equity investment into a top 3 distributor of specialty chemicals and
ingredients with a North American focus and global supply chain capabilities. Their
clients include those in the coatings, adhesives, sealants, and elastomers (“CASE”),
food, pharma, lab cleaning and other industries. They are one of few companies in the
mid-market that has scale, management sophistication, infrastructure and capital to
consolidate. The lead sponsor is CI Capital. Mango continues to make progress on the
integration of a large, strategic acquisition completed in May 2018. The company has
experienced sales growth as a result of investments in technical talent and added
formulation capabilities.
Project Jewel: April 2018, USD615K equity investment into a cosmetics brand
company that sells primarily through mass and drugstore channels in US. The core
demographic is skewed towards younger, multi-cultural millennial consumers. The
lead investors are Gryphon Investors who have a deep consumer team with a strong
track record in the sector with successful exited deals. They believe there is significant
space to further expand Jewel’s footprint with existing US. retailers and e-commerce,
significant operational improvement / brand positioning enhancement opportunities as
well as a strong historical growth profile. In year 2018, Jewel has been successful at
gaining chain wide distribution at major retailers and has shown traction with Asian
and European retailers. 2018E revenue of USD128M representing ~6% YoY growth
and EBITDA of USD37M representing 8.5% YoY growth.
Project Cotton: July 2017, Euro Dollar (“EUR”)803K equity investment into a Spanish
omni-channel apparel retailer. The co-investment was done alongside PAI Partners in
the recapitalisation of Cotton. The business operates over two thousand points of sale
in 90 countries with three main brands targeting multiple segments. It has a leading
market position in Spain where the sector has experienced a steady recovery. Vertically
integrated chains such as Cotton are expected to continue taking market share. The
company has been refocusing its brands towards core customer groups driving
meaningful ‘Like for Like’ growth across all brands. The company continues to invest
in key assets for brand building and future development: communication, digital, CRM,
loyalty and expansion. Year-to-Date ("YTD") November 2018 sales was EUR802M,
lower than the prior year by 1.1% while its EBITDA was EUR104M, improving 2.6%
vs last year. Net debt stood at 3.1x leverage.
8
Project WM: August 2017, USD1.4M equity investment into a specialty retailer and
distributor of core boating and water recreation products with over 200 stores in the
US and Puerto Rico. The company is the largest retail player in the USD5.5 billion
Recreational Boating Parts & Accessories market. The lead sponsor, Monomoy Capital
Partners targets middle market companies that face significant operational, financial or
market challenges and aims to acquire these companies through complex transactions,
significantly improve their cost structure and product mix to increase cash flow, and
sell them as healthy middle market businesses to financial or strategic buyers as the
economy stabilizes. WM’s fourth quarter of year 2018 sales declined by USD6M from
fourth quarter of year 2017 while its quarterly EBITDA exceeded prior year by
USD4.6M.
Project Arch: September 2017, USD2M equity investment into a B2B provider of
office supplies and other products to large enterprises and small/medium businesses as
well as office supplies retailer with over 1,500 stores in US and Canada. The
transaction was done at a significant discount to comparable distributor businesses. The
experienced lead sponsor for the deal, Sycamore Partners, has a strong track record in
the consumer/retail sector. At transaction close, they have successfully reorganised the
business into three standalone entities. The company is on track with its initial
underwriting plan and Sycamore is confident in executing the identified base case cost
savings as it continues to divest non-core assets. Arch has distributed over 70% of
investment capital due to proceeds from subsidiary sales, restructuring and
recapitalisation. The investment also had a valuation uplift due to on-plan performance.
In September 2018, it agreed to acquire a leading national distributor of workplace
items for a total enterprise value of approximately USD1b.
MARKET REVIEW AND OUTLOOK
Private Equity and Private Debt
NB Asset Allocation Committee maintained its neutral view for private equity and
acknowledges high valuations, but recommends a consistent and disciplined strategic
investment plan.
Unfortunately, NB have nothing insightful or differentiated to say about the credit
markets - at least for now.
At the end of May 2019, US HY spreads stood at 481 basis points (“bps”),
approximately 86bps tighter than December 2018 levels and 30bps wider than March
219. CCC HY has continued to tighten in year 2019, contracting 229bps. Leveraged
loan spreads now stand at 457bps, about 100bps tighter than December 2018 and about
20bps tighter than March 2019; Split B/CCC loans have come in about 17bps for the
year 2019. Through May 2019, the Standard and Poor (“S&P”) is up over 12%, the
Russell up about 11%, and US HY and leveraged loans have notched gains of 7.8%
9
and 5.4%. The Nasdaq Composite Index (“NASDAQ”) is up about 12% through May
2019, after peaking at 8,163 early in the month.
HY gross issuance is flat YoY, and leveraged loan gross issuance is down over 70%;
loan net new issuance (ex-refinancing and repricing) is off 30%. Despite the lack of
new supply, net CLO issuance (USD 54.9b) is up modestly versus the comparable
period in year 2018 (USD 54.7b). Leveraged loan funds have reported 28 consecutive
weeks of outflows; for year 2019, leveraged loan funds have lost about USD16b
(versus +USD10b in the comparable period last year).
NB are not going to opine on implications of the inverted yield curve, ongoing trade
discussions with China, threatened Mexican tariffs, or anti-trust risks to big-tech in the
US. NB are pretty sure that their ability to extract meaningful correlations between
macroeconomic headlines and credit price action is, at best, limited.
Instead, let’s reflect on what’s worked well for NBPECO, what hasn’t worked, and
their thoughts on where they will find value over the next 18 months. In year 2016 and
most of year 2017, NBPECO were able to take advantage of lingering dislocations in
the secondary market, as evidenced by successful trades in companies in the insurance
services and aerospace industries. At the time, position sizes were relatively small as
NBPECO had not held final closes. All of these investments could have been upsized
meaningfully.
NB have done a fantastic job in the structured preferred market, driving exceptional
risk-adjusted returns for investors. NBPECO has invested approximately USD245M in
four preferred instruments. As discussed earlier, they have realised USD127M in a life
sciences company and an aircraft MRO, generating blended gross IRRs north of 20%.
A recent healthcare investment is off to an incredibly strong start, ahead of its synergy
implementation plan with solid top-line numbers. Right now, the operating company
bonds just senior to the preferred are trading at 106-107, implying a 7.8% YTW. And
NB are excited about the prospects of an investment in the midstream sector. NBPECO
are being paid an 8.5% cash dividend in an investment-grade company, and as they
write, the stock is at a 9% discount to conversion parity. Given the structure of the
investment, there are multiple paths for us to win, including a re-rating of the stock.
Investing in structured, unsecured instruments is not something to be taken lightly.
There were several large, well-known funds that splashed preferred capital around
indiscriminately before the year 2008-2009 crisis, and their investors paid the price. As
NB have said before, you can’t entertain these investments unless you love the
businesses. Relying solely on structural protections in preferred investments without
real conviction in the earnings power of the underlying assets is foolish and misguided.
When they make these investments, they spend months picking apart the businesses
with the sponsors and management teams, envisioning every possible bad outcome.
They have turned down dozens of these opportunities and will continue with their
10
persnickety ways. They’ve been around the block a few times and will not forget the
lessons of the past.
It’s not all rainbows and butterflies though. They have taken their lumps in some
smaller names, notably a 2nd lien on a food products company and a security services
company bonds. Fortunately, these positions were sized in proportion to their
conviction levels (quite low), and mark-downs are reflected in the NBPECO’s
performance. They have discussed their largest mistake, a business service firm that
focuses on personalised coupon-printing machines at point of checkout, in numerous
quarterly letters. At this point, the position simply isn’t a key driver of future NBPECO
performance. Over 60% of the NBPECO’s original investment in the company was in
the 1st lien loan; NB sized the 2nd lien loan position to account for a material
probability of impairment. Their initial downside forecasts did not envision a draconian
capitulation in CPG promotional spending and the economically irrational behavior of
a competitor. In short, everything that could go wrong did go wrong, and they, along
with several large creditors, were caught flat-footed by the financial performance of
the firm. It’s far too early to make an accurate assessment of its ultimate recoveries.
The firm’s Japanese and European businesses are performing, and the board and
management have made great strides in stabilizing the US franchise. There are multiple
potential paths for the company, including scenarios where NB recover the majority of
the 1st lien investment.
NB are generally sanguine about the current portfolio, and barring any unforeseen
hiccups, they expect NBPECO IRRs to continue to increase throughout year 2019.
At present, the secondary market is largely unappealing. Names are picked over, and
discounts are simply not large enough to compensate the investors for the risks they
would bear. NB continue to analyze a number of structured investments, but are ever
mindful of asset quality in a frothy market. In these markets, they often hear
competitors lament about ‘nothing to do’ (they catch themselves saying it too). The
reality, however, is quite different - there’s a ton of work to be done. They are actively
researching and monitoring dozens and dozens of credits whose current indicated
trading levels make no sense in the context of absurd capital structures. They will be
more than prepared when these names become actionable. The key is not to complain
about investments they can’t make, but to do the homework to cement their conviction
levels when it’s time to make investments.
While NB see nothing that makes them believe a short-term correction is imminent,
they do see an enormous opportunity set in both primary and secondary investments.
At some point, either they can scoop up loans and bonds at attractive levels or offer
capital to sponsors who must fix real problems irrespective of silly price action.
Markets can change quickly, and no one can systematically predict when or why. NB
keep hearing about the late innings of the credit cycle. It’s an annoying phrase that
pundits like to use in lieu of the following: ‘we really don’t have a clue when it’s going
to turn but ten years of expansion seems quite long, so it stands to reason that something
11
bad is going to happen sooner rather than later.’ NB know one thing: that which causes
the overwhelming majority of investors to re-rate risk is, by definition, unforecastable.
Otherwise, it would already be baked into security prices.
PERFORMANCE REVIEW
During the financial year under review, the Fund has registered a gain of 4.77%* in net
asset value terms. The Fund has not achieved its investment objective during the 12-
month financial year under review as the review period is relatively short compared to
its objective of providing long term (7 years) capital appreciation.
Source: Lipper Investment Management (“Lipper IM”), 5 August 2019
12
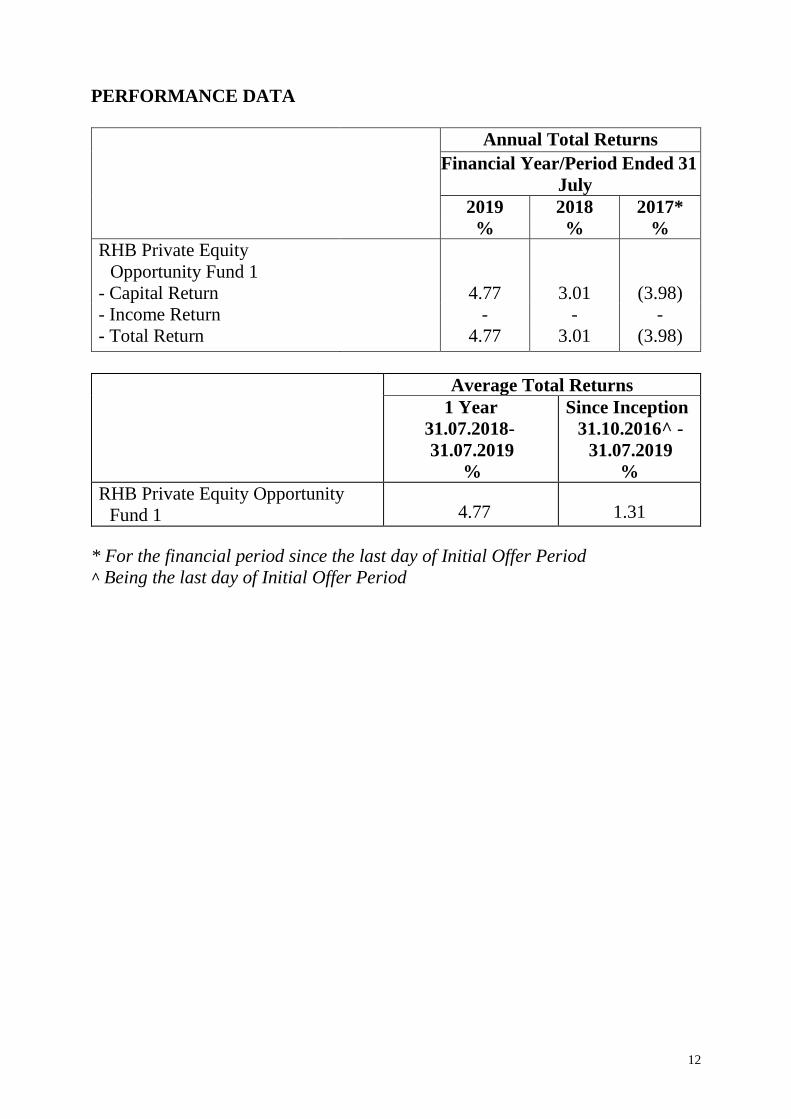
PERFORMANCE DATA
Annual Total Returns
Financial Year/Period Ended 31
July
2019 2018 2017*
% % %
RHB Private Equity
Opportunity Fund 1
- Capital Return 4.77 3.01 (3.98)
- Income Return - - -
- Total Return 4.77 3.01 (3.98)
Average Total Returns
1 Year
31.07.2018-
31.07.2019
%
Since Inception
31.10.2016^ -
31.07.2019
%
RHB Private Equity Opportunity
Fund 1 4.77 1.31
* For the financial period since the last day of Initial Offer Period
^ Being the last day of Initial Offer Period
13
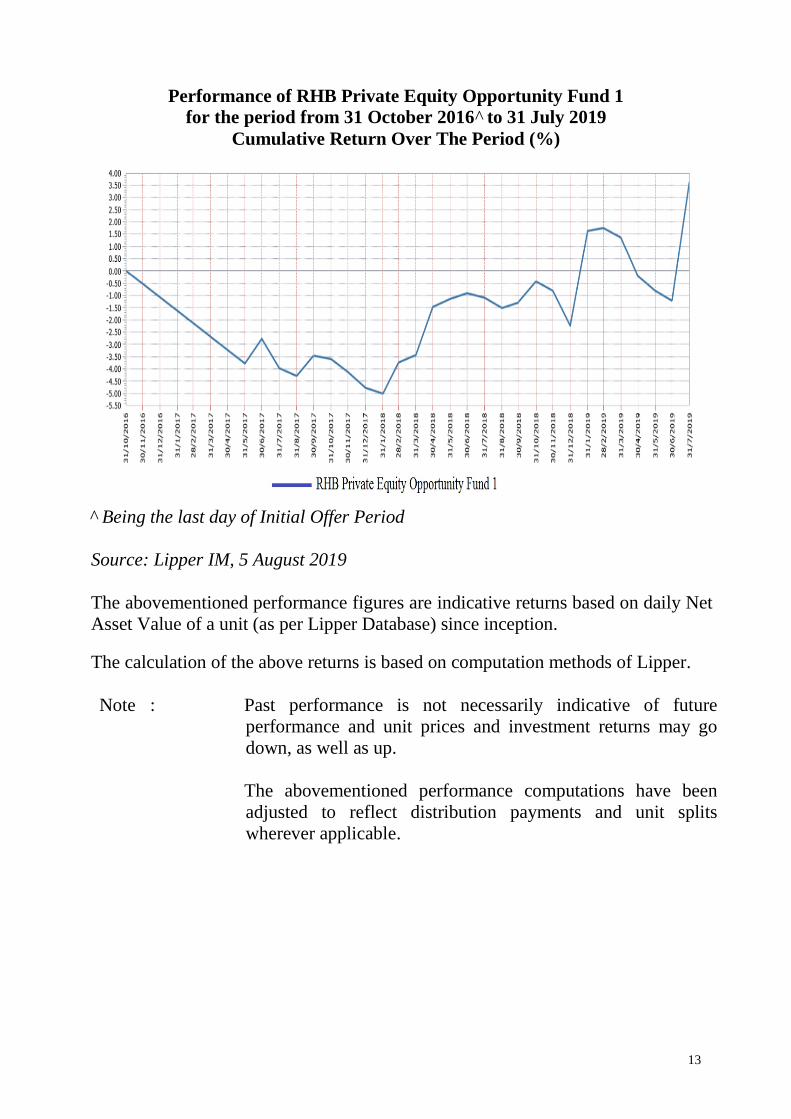
Performance of RHB Private Equity Opportunity Fund 1
for the period from 31 October 2016^ to 31 July 2019
Cumulative Return Over The Period (%)
^ Being the last day of Initial Offer Period
Source: Lipper IM, 5 August 2019
The abovementioned performance figures are indicative returns based on daily Net
Asset Value of a unit (as per Lipper Database) since inception.
The calculation of the above returns is based on computation methods of Lipper.
Note : Past performance is not necessarily indicative of future
performance and unit prices and investment returns may go
down, as well as up.
The abovementioned performance computations have been
adjusted to reflect distribution payments and unit splits
wherever applicable.
14
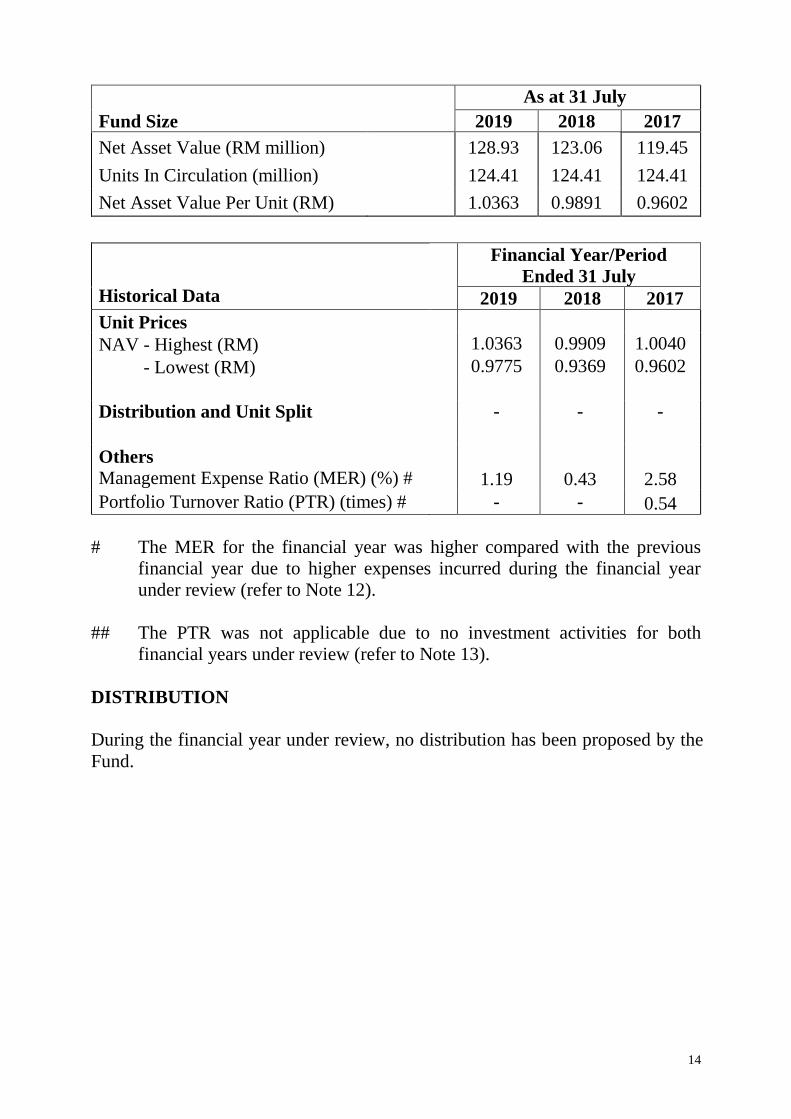
As at 31 July
Fund Size 2019 2018 2017
Net Asset Value (RM million) 128.93 123.06 119.45
Units In Circulation (million) 124.41 124.41 124.41
Net Asset Value Per Unit (RM) 1.0363 0.9891 0.9602
# The MER for the financial year was higher compared with the previous
financial year due to higher expenses incurred during the financial year
under review (refer to Note 12).
## The PTR was not applicable due to no investment activities for both
financial years under review (refer to Note 13).
DISTRIBUTION
During the financial year under review, no distribution has been proposed by the
Fund.
Historical Data
Financial Year/Period
Ended 31 July
2019 2018 2017
Unit Prices
NAV - Highest (RM) 1.0363 0.9909 1.0040
NAV - Lowest (RM) 0.9775 0.9369 0.9602
Distribution and Unit Split - - -
Others
Management Expense Ratio (MER) (%) # 1.19 0.43 2.58
Portfolio Turnover Ratio (PTR) (times) # - - 0.54
15
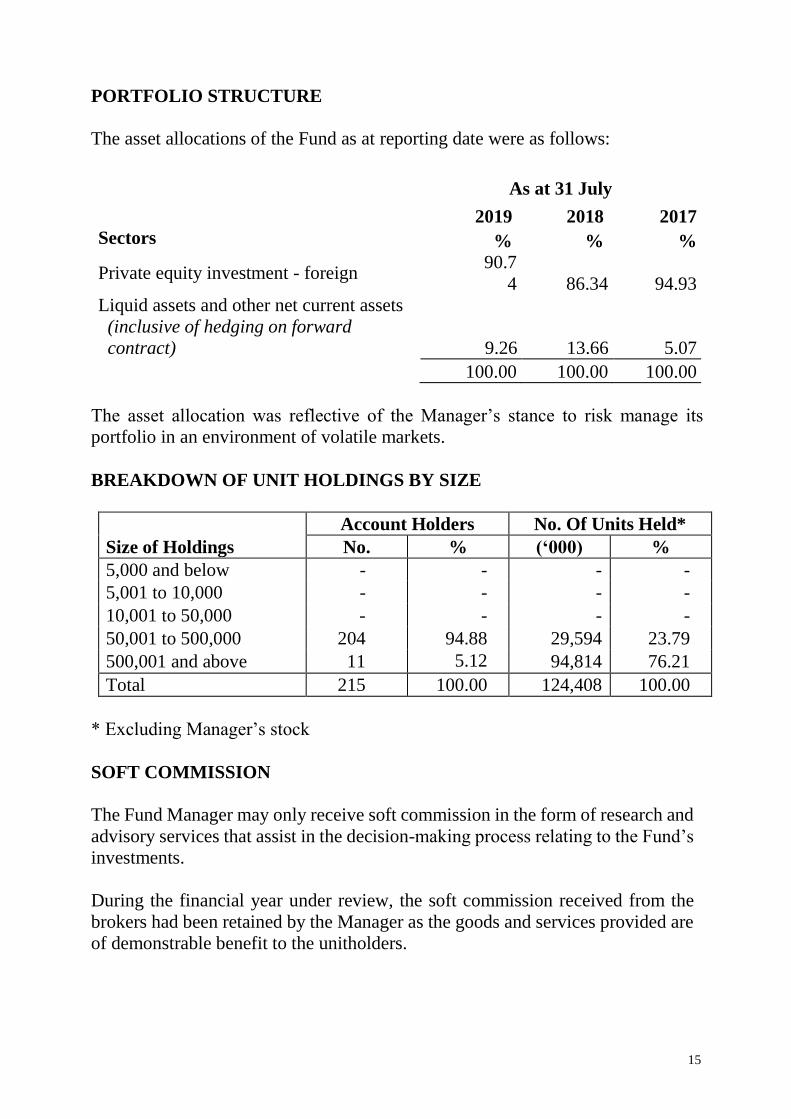
PORTFOLIO STRUCTURE
The asset allocations of the Fund as at reporting date were as follows:
As at 31 July
2019 2018 2017
Sectors % % %
Private equity investment - foreign 90.7
4 86.34 94.93
Liquid assets and other net current assets
(inclusive of hedging on forward
contract) 9.26
13.66
5.07
100.00 100.00 100.00
The asset allocation was reflective of the Manager’s stance to risk manage its
portfolio in an environment of volatile markets.
BREAKDOWN OF UNIT HOLDINGS BY SIZE
Account Holders No. Of Units Held*
Size of Holdings No. % (‘000) %
5,000 and below - - - -
5,001 to 10,000 - - - -
10,001 to 50,000 - - - -
50,001 to 500,000 204 94.88 29,594 23.79
500,001 and above 11 5.12
4 94,814 76.21
Total 215 100.00 124,408 100.00
* Excluding Manager’s stock
SOFT COMMISSION
The Fund Manager may only receive soft commission in the form of research and
advisory services that assist in the decision-making process relating to the Fund’s
investments.
During the financial year under review, the soft commission received from the
brokers had been retained by the Manager as the goods and services provided are
of demonstrable benefit to the unitholders.
16
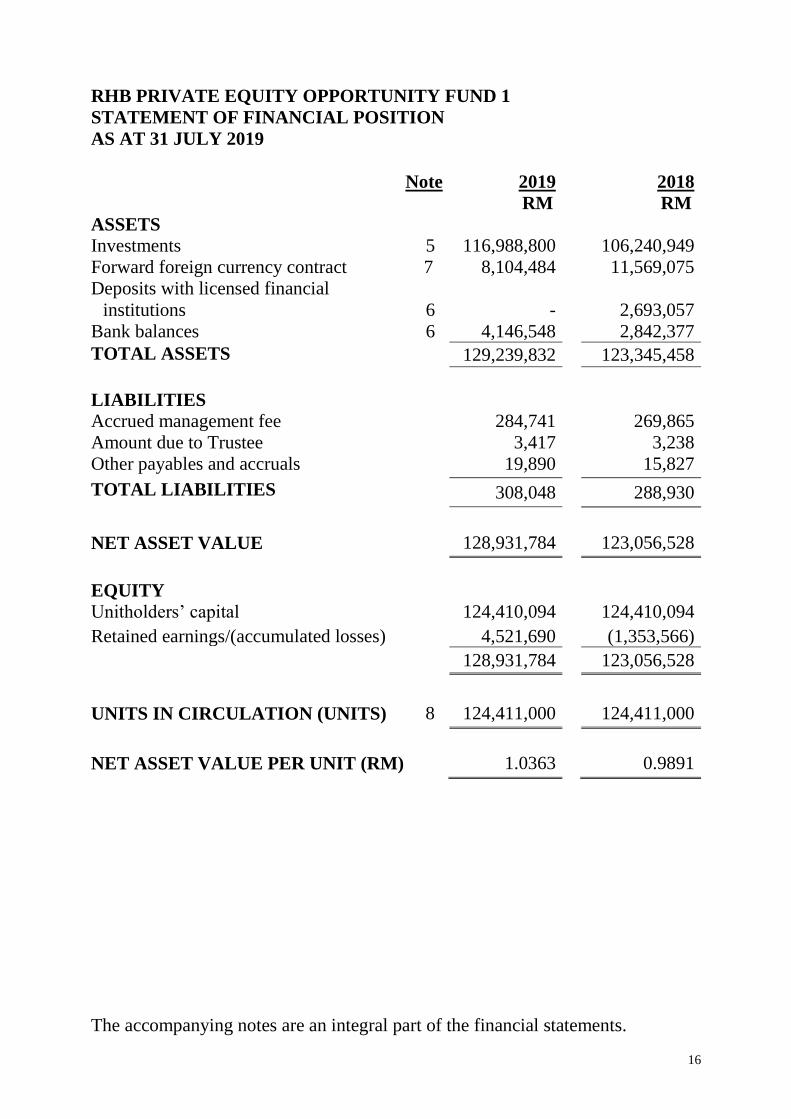
RHB PRIVATE EQUITY OPPORTUNITY FUND 1
STATEMENT OF FINANCIAL POSITION
AS AT 31 JULY 2019
Note 2019 2018
RM RM
ASSETS
Investments 5 116,988,800 106,240,949
Forward foreign currency contract 7 8,104,484 11,569,075
Deposits with licensed financial
institutions 6 -
2,693,057
Bank balances 6 4,146,548 2,842,377
TOTAL ASSETS 129,239,832 123,345,458
LIABILITIES
Accrued management fee 284,741 269,865
Amount due to Trustee 3,417 3,238
Other payables and accruals 19,890 15,827
TOTAL LIABILITIES 308,048 288,930
NET ASSET VALUE 128,931,784 123,056,528
EQUITY
Unitholders’ capital 124,410,094 124,410,094
Retained earnings/(accumulated losses) 4,521,690 (1,353,566)
128,931,784 123,056,528
UNITS IN CIRCULATION (UNITS) 8 124,411,000 124,411,000
NET ASSET VALUE PER UNIT (RM) 1.0363 0.9891
The accompanying notes are an integral part of the financial statements.
17
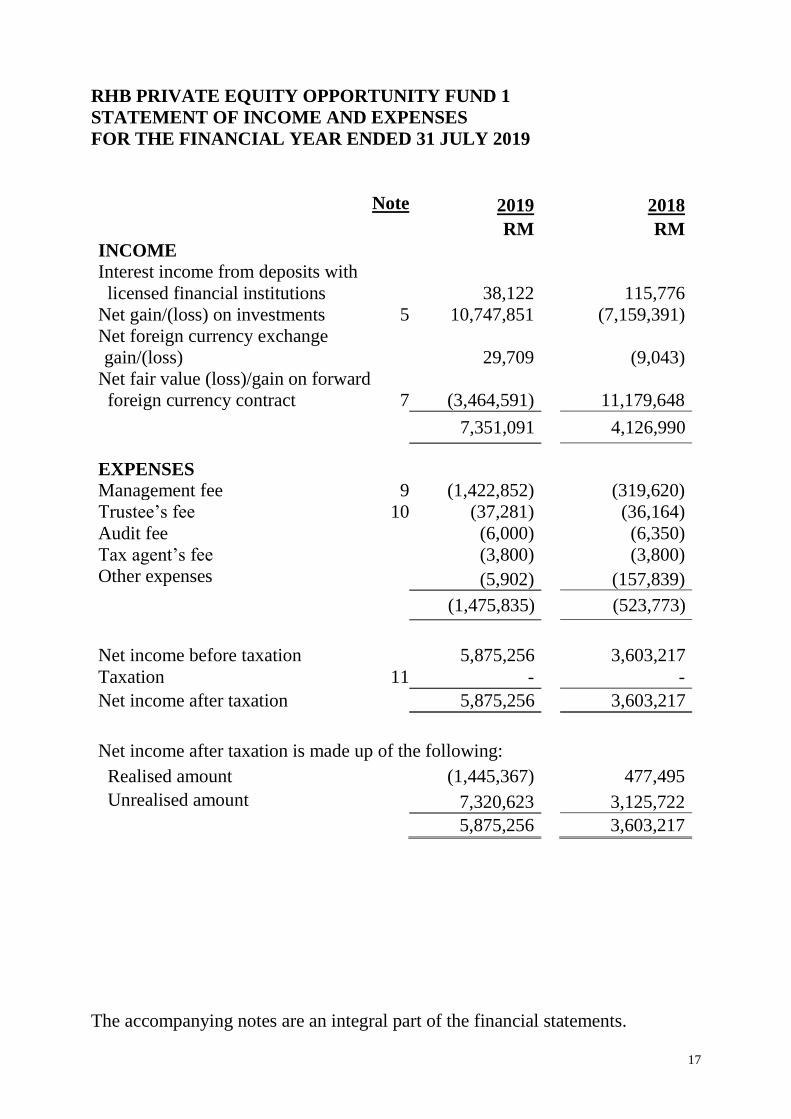
RHB PRIVATE EQUITY OPPORTUNITY FUND 1
STATEMENT OF INCOME AND EXPENSES
FOR THE FINANCIAL YEAR ENDED 31 JULY 2019
Note 2019 2018
RM RM
INCOME
Interest income from deposits with
licensed financial institutions
38,122 115,776
Net gain/(loss) on investments 5 10,747,851 (7,159,391)
Net foreign currency exchange
gain/(loss)
29,709 (9,043)
Net fair value (loss)/gain on forward
foreign currency contract
7 (3,464,591) 11,179,648
7,351,091 4,126,990
EXPENSES
Management fee 9 (1,422,852) (319,620)
Trustee’s fee 10 (37,281) (36,164)
Audit fee (6,000) (6,350)
Tax agent’s fee (3,800) (3,800)
Other expenses (5,902) (157,839)
(1,475,835) (523,773)
Net income before taxation 5,875,256 3,603,217
Taxation 11 - -
Net income after taxation 5,875,256 3,603,217
Net income after taxation is made up of the following:
Realised amount (1,445,367) 477,495
Unrealised amount 7,320,623 3,125,722
5,875,256 3,603,217
The accompanying notes are an integral part of the financial statements.
18
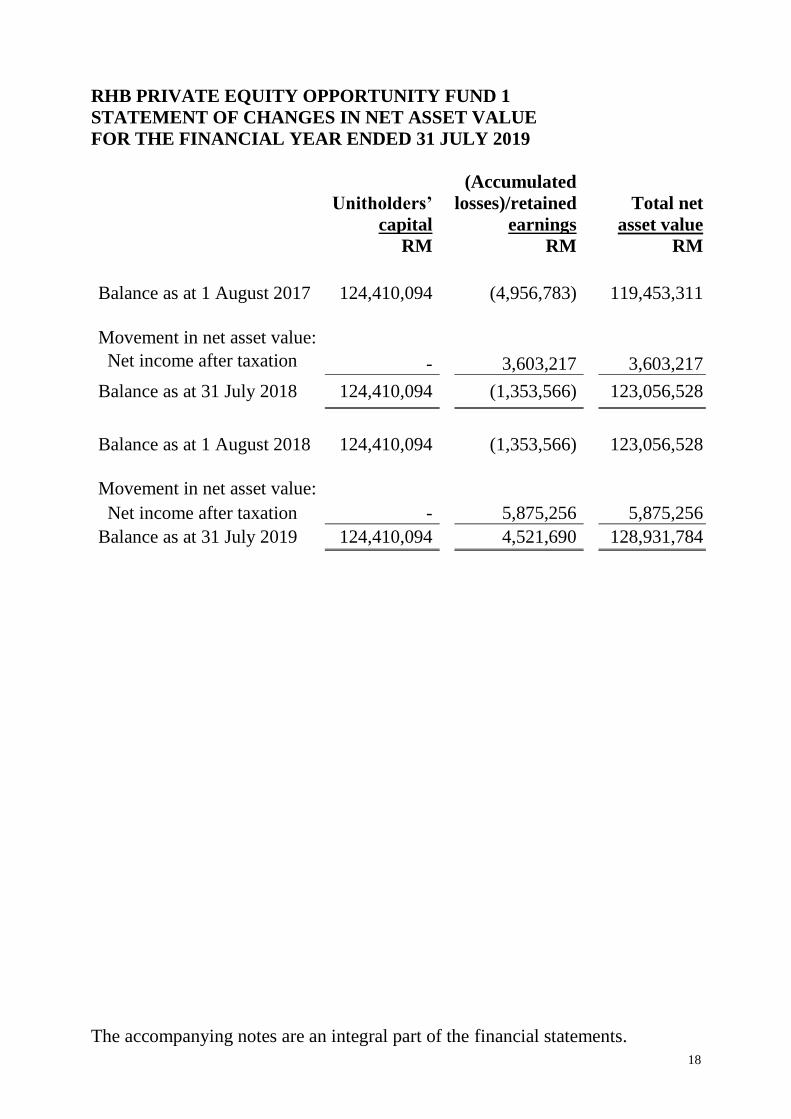
RHB PRIVATE EQUITY OPPORTUNITY FUND 1
STATEMENT OF CHANGES IN NET ASSET VALUE
FOR THE FINANCIAL YEAR ENDED 31 JULY 2019
Unitholders’
capital
(Accumulated
losses)/retained
earnings
Total net
asset value
RM RM RM
Balance as at 1 August 2017 124,410,094 (4,956,783) 119,453,311
Movement in net asset value:
Net income after taxation - 3,603,217 3,603,217
Balance as at 31 July 2018 124,410,094 (1,353,566) 123,056,528
Balance as at 1 August 2018 124,410,094 (1,353,566) 123,056,528
Movement in net asset value:
Net income after taxation - 5,875,256 5,875,256
Balance as at 31 July 2019 124,410,094 4,521,690 128,931,784
The accompanying notes are an integral part of the financial statements.
19
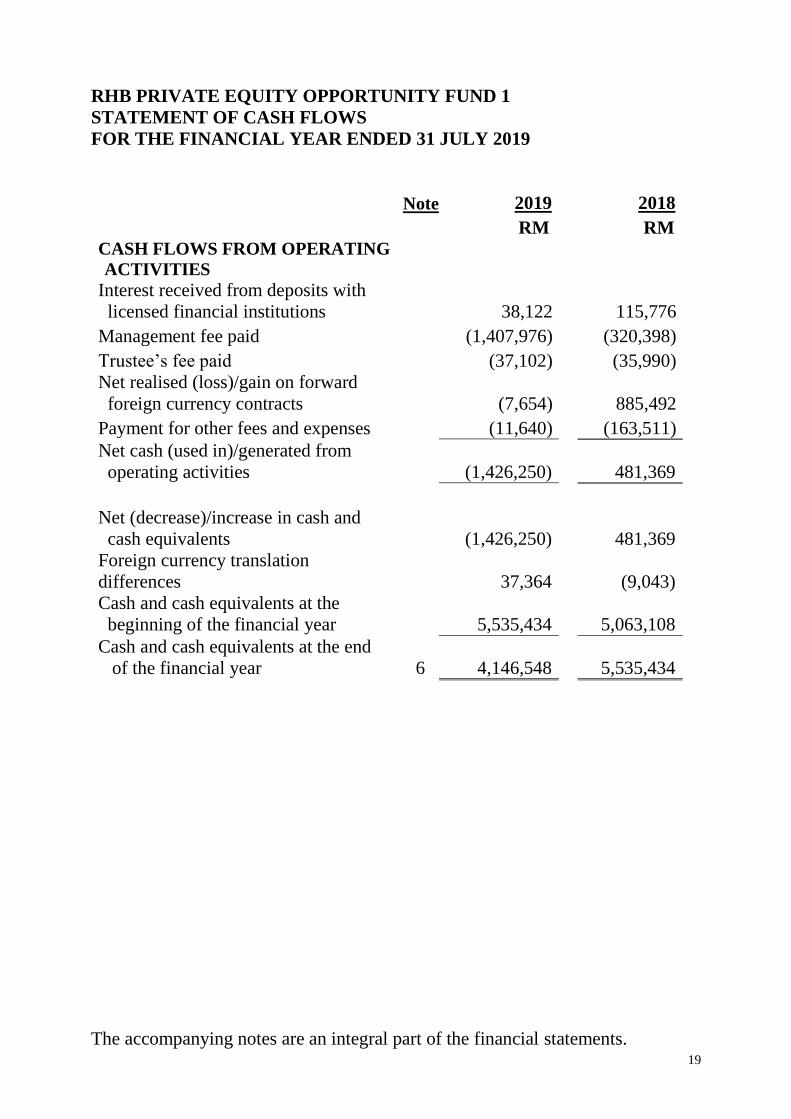
RHB PRIVATE EQUITY OPPORTUNITY FUND 1
STATEMENT OF CASH FLOWS
FOR THE FINANCIAL YEAR ENDED 31 JULY 2019
Note 2019
2018
RM RM
CASH FLOWS FROM OPERATING
ACTIVITIES
Interest received from deposits with
licensed financial institutions 38,122
115,776
Management fee paid (1,407,976) (320,398)
Trustee’s fee paid (37,102) (35,990)
Net realised (loss)/gain on forward
foreign currency contracts (7,654)
885,492
Payment for other fees and expenses (11,640) (163,511)
Net cash (used in)/generated from
operating activities
(1,426,250)
481,369
Net (decrease)/increase in cash and
cash equivalents
(1,426,250)
481,369
Foreign currency translation
differences
37,364
(9,043)
Cash and cash equivalents at the
beginning of the financial year
5,535,434
5,063,108
Cash and cash equivalents at the end
of the financial year 6 4,146,548
5,535,434
The accompanying notes are an integral part of the financial statements.
20
RHB PRIVATE EQUITY OPPORTUNITY FUND 1
NOTES TO THE FINANCIAL STATEMENTS
FOR THE FINANCIAL YEAR ENDED 31 JULY 2019
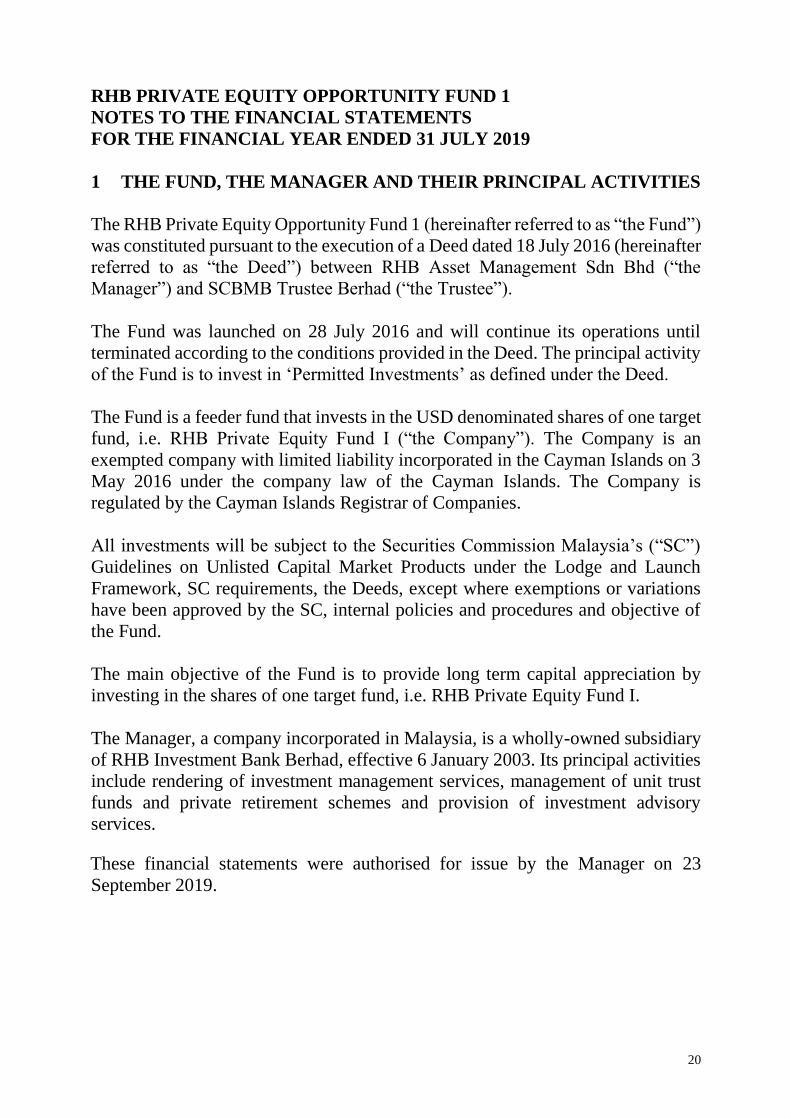
1 THE FUND, THE MANAGER AND THEIR PRINCIPAL ACTIVITIES
The RHB Private Equity Opportunity Fund 1 (hereinafter referred to as “the Fund”)
was constituted pursuant to the execution of a Deed dated 18 July 2016 (hereinafter
referred to as “the Deed”) between RHB Asset Management Sdn Bhd (“the
Manager”) and SCBMB Trustee Berhad (“the Trustee”).
The Fund was launched on 28 July 2016 and will continue its operations until
terminated according to the conditions provided in the Deed. The principal activity
of the Fund is to invest in ‘Permitted Investments’ as defined under the Deed.
The Fund is a feeder fund that invests in the USD denominated shares of one target
fund, i.e. RHB Private Equity Fund I (“the Company”). The Company is an
exempted company with limited liability incorporated in the Cayman Islands on 3
May 2016 under the company law of the Cayman Islands. The Company is
regulated by the Cayman Islands Registrar of Companies.
All investments will be subject to the Securities Commission Malaysia’s (“SC”)
Guidelines on Unlisted Capital Market Products under the Lodge and Launch
Framework, SC requirements, the Deeds, except where exemptions or variations
have been approved by the SC, internal policies and procedures and objective of
the Fund.
The main objective of the Fund is to provide long term capital appreciation by
investing in the shares of one target fund, i.e. RHB Private Equity Fund I.
The Manager, a company incorporated in Malaysia, is a wholly-owned subsidiary
of RHB Investment Bank Berhad, effective 6 January 2003. Its principal activities
include rendering of investment management services, management of unit trust
funds and private retirement schemes and provision of investment advisory
services.
These financial statements were authorised for issue by the Manager on 23
September 2019.
21
2 SUMMARY OF SIGNIFICANT ACCOUNTING POLICIES
2.1 Basis of preparation of the financial statements
The financial statements have been prepared under the historical cost convention,
as modified by the financial assets and financial liabilities (including derivative
instruments) at fair value through profit or loss, except as disclosed in the summary
of significant accounting policies, and in accordance with Malaysian Financial
Reporting Standards (“MFRS”) and International Financial Reporting Standards
(“IFRS”).
The preparation of financial statements in conformity with MFRS and IFRS
requires the use of certain critical accounting estimates and assumptions that affect
the reported amounts of assets and liabilities and disclosure of contingent assets
and liabilities at the date of the financial statements, and the reported amounts of
income and expenses during the financial year. It also requires the Manager to
exercise its judgement in the process of applying the Fund’s accounting policies.
Although these estimates and judgement are based on the Manager’s best
knowledge of current events and actions, actual results may differ.
(a) The Fund has applied the following standard and interpretation to the
existing standard for the first time for the financial year beginning on 1
August 2018:
MFRS 9 ‘Financial Instruments’
IC Interpretation 22 ‘Foreign Currency Transactions and Advance
Consideration’
The Fund applied MFRS 9 ‘Financial Instruments’ for the first time in the
2019 financial statements with the date of initial application of 1 August
2018. The standard is applied retrospectively.
In accordance with the transitional provisions provided in MFRS 9,
comparative information for 31 July 2018 was not restated and continued to
be reported under the previous accounting policies governed under MFRS
139. The cumulative effects of initially applying MFRS 9 were recognised
as an adjustment to the opening balance of retained earnings as at 1 August
2018.
The detailed impact of the change in accounting policy on financial
instruments is disclosed in Note 2.2.
Other than that, the adoption of interpretation to the existing standard above
did not have any impact on the current year or any prior period and is not
likely to affect future periods.
22
2 SUMMARY OF SIGNIFICANT ACCOUNTING POLICIES
(CONTINUED)
2.1 Basis of preparation of the financial statements (continued)
(b) The amendments to published standard and interpretation to existing
standard which are relevant to the Fund but not yet effective and have not
been early adopted are as follows:
(i) Financial year beginning on/after 1 August 2019
IC Interpretation 23 ‘Uncertainty over Income Tax Treatments’
(effective 1 January 2019) provides guidance on how to recognise
and measure deferred and current income tax assets and liabilities
where there is uncertainty over a tax treatment.
If an entity concludes that it is not probable that the tax treatment
will be accepted by the tax authority, the effect of the tax
uncertainty should be included in the period when such
determination is made. An entity shall measure the effect of
uncertainty using the method which best predicts the resolution of
the uncertainty.
IC Interpretation 23 will be applied retrospectively.
Annual Improvements to MFRSs 2015 – 2017 Cycle: Amendments
to MFRS 112 ‘Income Taxes’ (effective from 1 January 2019)
clarify that where income tax consequences of dividends on
financial instruments classified as equity is recognised (either in
profit or loss, other comprehensive income or equity) depends on
where the past transactions that generated distributable profits were
recognised. Accordingly, the tax consequences are recognised in
profit or loss when an entity determines payments on such
instruments are distribution of profits (that is, dividends). Tax on
dividend should not be recognised in equity merely on the basis that
it is related to a distribution to owners.
The adoption of the amendments to published standard and interpretation to
existing standard do not give rise to any material impact on the financial
statements of the Fund.
23
2 SUMMARY OF SIGNIFICANT ACCOUNTING POLICIES
(CONTINUED)
2.2 Financial assets
Classification
From 1 August 2018, the Fund classifies its financial assets in the following
measurement categories:
those to be measured subsequently at fair value through profit or loss, and
those to be measured at amortised cost
The Fund classifies its investments based on both the Fund’s business model for
managing those financial assets and the contractual cash flow characteristics of the
financial assets. The portfolio of financial assets is managed and performance is
evaluated on a fair value basis. The Fund is primarily focused on fair value
information and uses that information to assess the assets’ performance and to
make decisions. The Fund has not taken the option to irrevocably designate any
equity securities as fair value through other comprehensive income. The
contractual cash flows of the Fund’s debt securities are solely principal and
interest, however, these securities are neither held for the purpose of collecting
contractual cash flows nor held both for collecting contractual cash flows and for
sale. The collection of contractual cash flows is only incidental to achieving the
Fund’s business model’s objective. Consequently, all investments and derivatives
are measured at fair value through profit or loss.
The Fund classifies cash and cash equivalents at amortised cost as these financial
assets are held to collect contractual cash flows consisting of the amount
outstanding.
Up to 31 July 2018, financial assets are designated as fair value through profit or
loss when they are managed and their performance are evaluated on a fair value
basis.
The Fund designates its investment in private equity investment as financial assets
at fair value through profit or loss at inception.
Derivatives are financial assets at fair value through profit or loss categorised as
held for trading unless they are designated hedges.
Loans and receivables are non-derivative financial assets with fixed or
determinable payments that are not quoted in an active market and have been
included in current assets. The Fund’s loans and receivables comprise cash and
cash equivalents which are all due within 12 months.
24
2 SUMMARY OF SIGNIFICANT ACCOUNTING POLICIES
(CONTINUED)
2.2 Financial assets (continued)
Recognition and measurement
Regular purchases and sales of financial assets are recognised on the trade date -
the date on which the Fund commits to purchase or sell the asset. Financial assets
and financial liabilities at fair value through profit or loss are initially recognised
at fair value.
Financial assets are de-recognised when the rights to receive cash flows from the
investments have expired or the Fund has transferred substantially all risks and
rewards of ownership.
Subsequent to initial recognition, all financial assets at fair value through profit or
loss are measured at fair value. Gains or losses arising from changes in the fair
value of the ‘financial assets at fair value through profit or loss’ category are
presented in statement of income and expenses in the period in which they arise.
Private equity investment are valued based on the last published net asset value per
unit or share of such private equity investment at end of each financial year.
In accordance with the Amended and Restated Private Placement Memorandum
dated 3 July 2017 of the Target Fund, the net asset value and net asset value per
unit of the Target Fund is calculated by the administrator of the Target Fund once
every quarter on the last business day of each quarter. The net asset value per unit
of the Target Fund is published once every quarter and the published price
thereafter will remain the same until the next valuation takes place.
Derivative investments are forward foreign currency contract. Financial derivative
position will be “marked to market” at the close of each valuation day. Foreign
exchange gains and losses on the derivative financial instrument are recognised in
statement of income and expenses when settled or at the date of the statement of
financial position at which they are included in the measurement of the derivative
financial instrument.
Financial assets at amortised cost (2018: loans and receivables) are subsequently
carried at amortised cost using the effective interest method.
25
2 SUMMARY OF SIGNIFICANT ACCOUNTING POLICIES
(CONTINUED)
2.2 Financial assets (continued)
Impairment of financial assets
From 1 August 2018 onwards, the Fund measures credit risk and expected credit
losses using probability of default, exposure at default and loss given default.
Management considers both historical analysis and forward looking information
in determining any expected credit loss. Management considers the probability of
default to be close to zero as these instruments have a low risk of default and the
counterparties have a strong capacity to meet their contractual obligations in the
near term. As a result, no loss allowance has been recognised based on the 12
month expected credit losses as any such impairment would be wholly
insignificant to the Fund.
Until 31 July 2018, for assets carried at amortised cost, the Fund assesses at the
end of the financial year whether there is objective evidence that a financial asset
or group of financial assets is impaired. A financial asset or a group of financial
assets is impaired and impairment losses are incurred only if there is objective
evidence of impairment as a result of one or more events that occurred after the
initial recognition of the asset (a loss event) and that loss event (or events) has an
impact on the estimated future cash flows of the financial asset or group of
financial assets that can be reliably estimated.
Significant increase in credit risk
A significant increase in credit risk is defined by management as any contractual
payment which is more than 30 days past due or a counterparty credit rating which
has fallen below BBB/Baa.
Definition of default and credit-impaired financial assets
Any contractual payment which is more than 90 days past due is considered credit
impaired.
26
2 SUMMARY OF SIGNIFICANT ACCOUNTING POLICIES
(CONTINUED)
2.2 Financial assets (continued)
Write-off
The Fund writes off financial assets, in whole or in part, when it has exhausted all
practical recovery efforts and has concluded there is no reasonable expectation of
recovery. The assessment of no reasonable expectation of recovery is based on the
unavailability of debtor’s sources of income or assets to generate sufficient future
cash flows to repay the amount. The Fund may write-off financial assets that are
still subject to enforcement activity. Subsequent recoveries of amounts previously
written off will result in impairment gains. There are no write-offs/recoveries
during the financial year.
2.3 Financial liabilities
Financial liabilities are classified according to the substance of the contractual
arrangements entered into and the definitions of a financial liability.
Financial liabilities, within the scope of MFRS 139 up to 31 July 2018 and MFRS
9 from 1 August 2018, are recognised in the statement of financial position when,
and only when, the Fund becomes a party to the contractual provisions of the
financial instrument.
Derivatives are financial liabilities at fair value through profit or loss are
categorised as held for trading unless they are designated hedges.
The Fund’s financial liabilities which include accrued management fee, amount
due to Trustee and other payables and accruals are recognised initially at fair value
and subsequently measured at amortised cost using the effective interest method.
A financial liability is de-recognised when the obligation under the liability is
extinguished. Gains and losses are recognised in the statement of income and
expenses when the liabilities are de-recognised, and through the amortisation
process.
27
2 SUMMARY OF SIGNIFICANT ACCOUNTING POLICIES
(CONTINUED)
2.4 Unitholders’ capital
The unitholders’ contributions to the Fund meet the criteria of the definition of
puttable instruments to be classified as equity instruments under MFRS 132
“Financial Instruments: Presentation”. Those criteria include:
the units entitle the holder to a proportionate share of the Fund’s net assets
value;
the units are the most subordinated class and class features are identical;
there is no contractual obligations to deliver cash or another financial asset
other than the obligation on the Fund to repurchase; and
the total expected cash flows from the units over its life are based substantially
on the profit or loss of the Fund.
The outstanding units are carried at the redemption amount that is payable at each
financial year if the unitholders exercise the right to put the units back to the Fund.
Units are created and cancelled at prices based on the Fund’s net asset value per
unit at the time of creation or cancellation. The Fund’s net asset value per unit is
calculated by dividing the net assets attributable to unitholders with the total
number of outstanding units.
2.5 Income recognition
Interest income from deposits with licensed financial institutions is recognised on
an accrual basis using the effective interest method.
From 1 August 2018, interest income is calculated by applying the effective interest
rate to the gross carrying amount of a financial asset except for financial assets that
subsequently become credit-impaired. For credit-impaired financial assets the
effective interest rate is applied to the net carrying amount of the financial assets
(after deduction of the loss allowance).
Up till 31 July 2018, when a loan and receivable is impaired, the Fund reduces the
carrying amount to its recoverable amount, being the estimated future cash flow
discounted at the original effective interest rate of the instrument, and continue
unwinding the discount as interest income. Interest income on impaired loans and
receivables is recognised using the original effective interest rate.
Realised gain or loss on forward foreign currency contracts are measured by the
net settlement amount as per the forward foreign currency contract.
Net income or loss is the total of income less expenses.
28
2 SUMMARY OF SIGNIFICANT ACCOUNTING POLICIES
(CONTINUED)
2.6 Taxation
Current tax expense is determined according to Malaysian tax laws and includes
all taxes based upon the taxable income earned during the financial year.
2.7 Cash and cash equivalents
For the purpose of the statement of cash flows, cash and cash equivalents comprise
bank balances and deposits with licensed financial institutions which are subject
to an insignificant risk of changes in value.
2.8 Presentation and functional currency
Items included in the financial statements of the Fund are measured using the
currency of the primary economic environment in which the Fund operates (the
“functional currency”). The financial statements are presented in Ringgit Malaysia
(“RM”), which is the Fund’s presentation and functional currency.
Due to mixed factors in determining the functional currency of the Fund, the
Manager has used its judgement to determine the functional currency that most
faithfully represents the economic effects of the underlying transactions, events
and conditions and have determined the functional currency to be in RM primarily
due to the following factors:
The Fund maintains cash that is denominated in RM for the purpose of
making settlement of the creation and cancellation.
The Fund’s units are denominated in RM.
The Fund’s significant expenses are denominated in RM.
2.9 Foreign currency translations
Foreign currency transactions in the Fund are accounted for at exchange rates
prevailing at the transaction dates. Foreign currency monetary assets and liabilities
are translated at exchange rates prevailing at the reporting date. Exchange
differences arising from the settlement of foreign currency transactions and from
the translation of foreign currency monetary assets and liabilities are recognised in
statement of income and expenses.
29
2 SUMMARY OF SIGNIFICANT ACCOUNTING POLICIES
(CONTINUED)
2.10 Segmental information
Operating segments are reported in a manner consistent with the internal reporting
used by the chief operating decision-maker. The operating results are regularly
reviewed by the Manager and the Investment Committee. The Investment
Committee assumes the role of chief operating decision maker, for performance
assessment purposes and to make decisions about resources allocated to the
investment segment based on the recommendation by the Investment & Security
Selection Committee.
2.11 Derivative financial instruments
The Fund’s derivative financial instruments comprise unquoted forward foreign
currency contracts. Derivative financial instruments are initially recognised at fair
value on the date derivative contracts are entered into and are subsequently re-
measured at their fair value.
The fair value of forward foreign exchange contracts is determined using forward
exchange rates at the date of the statement of financial position, with the resulting
value discounted back to present value.
The method of recognising the resulting gain or loss depends on whether the
derivative financial instrument is designated as a hedging instrument, and the
nature of the item being hedged. Derivative financial instruments that do not
qualify for hedge accounting are classified as FVTPL and accounted for in
accordance with the accounting policy set out in Note 2.2.
30
3 FINANCIAL RISK MANAGEMENT OBJECTIVES AND POLICIES
The Fund is exposed to a variety of risks, which include market risk, price risk,
interest rate risk, currency risk, credit risk, liquidity risk and capital risk.
Financial risk management is carried out through internal control processes
adopted by the Manager and adherence to the investment restrictions as stipulated
in the Information Memorandum and Unlisted Capital Market Products under the
Lodge and Launch Framework.
Market risk
Market risk is a risk that arises when the prices of investments in the market place
are affected by circumstances such as general market or economic events. These
circumstances, which may be a local or global event, can affect a local market
where the Target Fund is invested in or global markets and subsequently, the value
of the Target Fund’s investments.
Price risk
Price risk is the risk that the fair value of an investment of the Fund will fluctuate
because of changes in market prices.
The Fund is exposed to private equity investment price risk (other than those arising
from interest risk) for its investments of RM116,988,800 (2018: RM106,240,949).
The sensitivity analysis is based on the assumption that the price of the investments
fluctuate by +/(-) 5% with all other variables held constant, the impact on statement
of income and expenses and net asset value is +/(-) RM5,849,440 (2018:
RM5,312,047).
Interest rate risk
Interest rate risk is the risk that the value of the Fund’s investments and its return
will fluctuate because of changes in market interest rates. The Fund’s exposure to
the interest rate risk is mainly confined to short term placements with financial
institutions. The Manager overcomes the exposure by way of maintaining deposits
on short term basis. Therefore, exposure to interest rate fluctuations is minimal.
31
3 FINANCIAL RISK MANAGEMENT OBJECTIVES AND POLICIES
(CONTINUED)
Currency risk
The Fund invests in the Target Fund which is denominated in United States Dollar
(“USD”). Fluctuations in foreign exchange rate between USD and Ringgit
Malaysia will affect the value of the Fund’s foreign investments when converted to
local currency and subsequently the value of unitholders’ investment. As such, the
performance of the Fund will also be affected by the movements in the exchange
rate between USD and Ringgit Malaysia.
The sensitivity analysis is based on the assumption that the foreign exchange rate
fluctuates by +/(-) 5% with all other variable held constant, the impact on statement
of income and expenses and net asset value is +RM1,369,541/-RM1,330,674
(2018: +/-RM1,219,943).
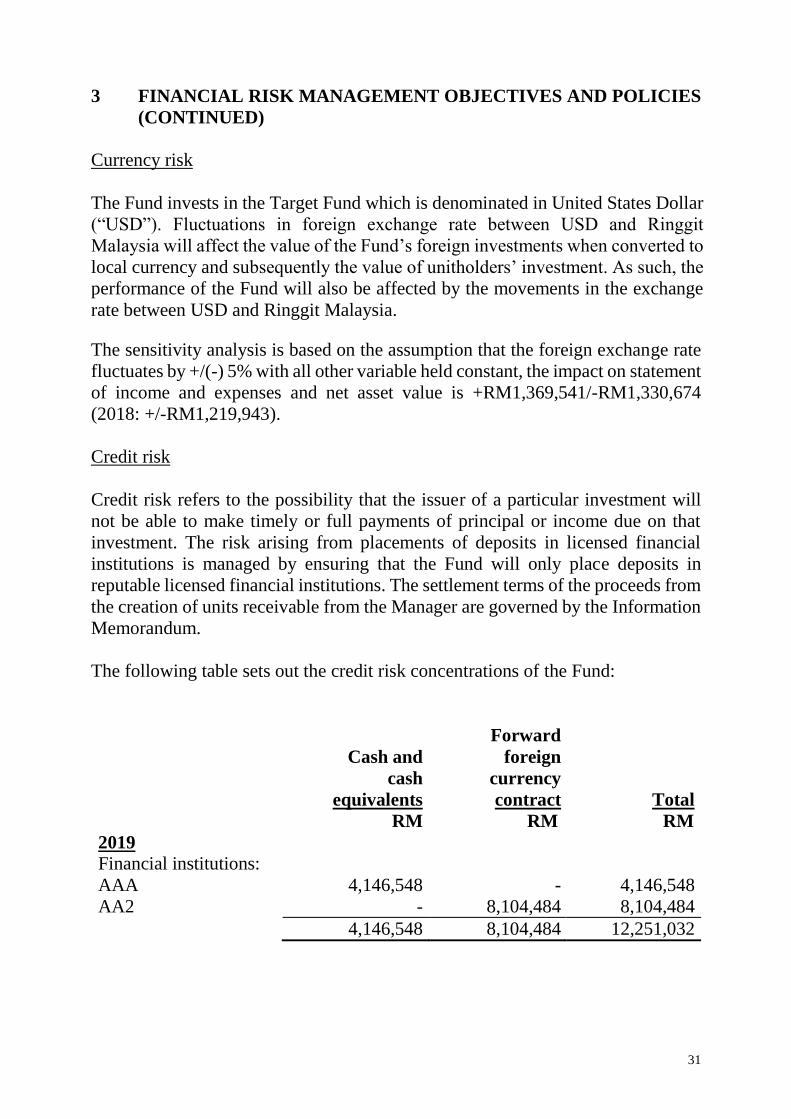
Credit risk
Credit risk refers to the possibility that the issuer of a particular investment will
not be able to make timely or full payments of principal or income due on that
investment. The risk arising from placements of deposits in licensed financial
institutions is managed by ensuring that the Fund will only place deposits in
reputable licensed financial institutions. The settlement terms of the proceeds from
the creation of units receivable from the Manager are governed by the Information
Memorandum.
The following table sets out the credit risk concentrations of the Fund:
Cash and
cash
equivalents
Forward
foreign
currency
contract
Total
RM RM RM
2019
Financial institutions:
AAA 4,146,548 - 4,146,548
AA2 - 8,104,484 8,104,484
4,146,548 8,104,484 12,251,032
32
3 FINANCIAL RISK MANAGEMENT OBJECTIVES AND POLICIES
(CONTINUED)
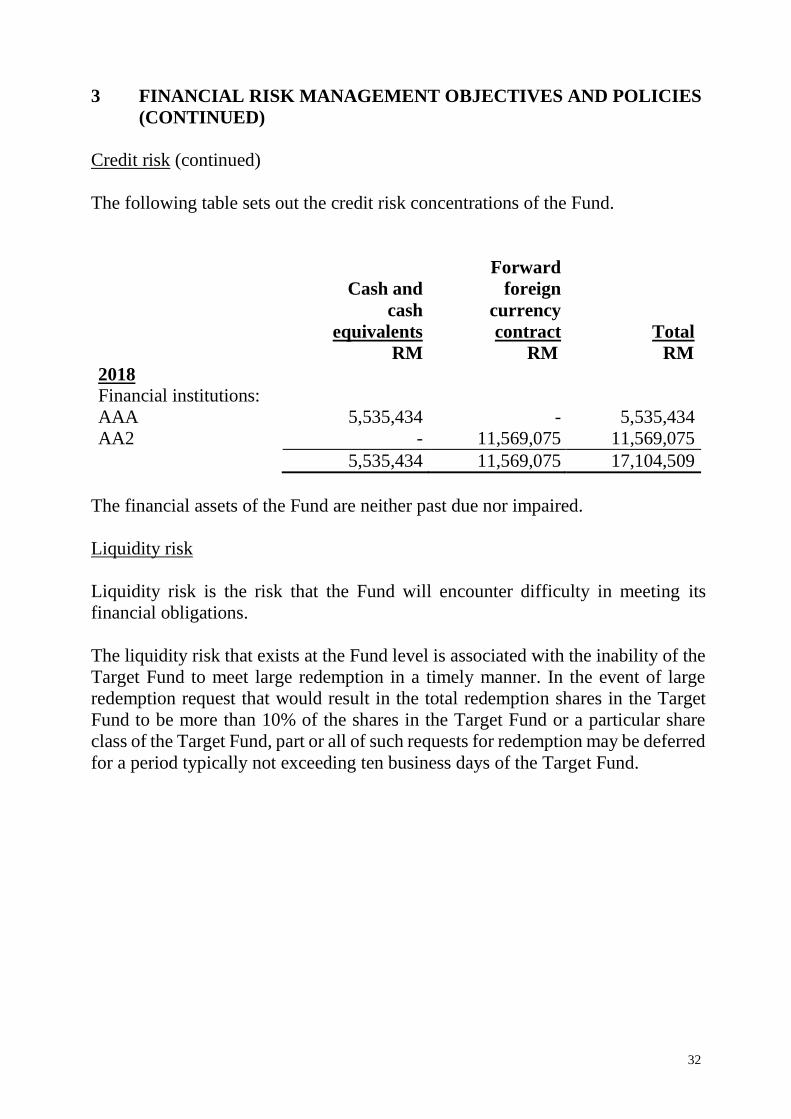
Credit risk (continued)
The following table sets out the credit risk concentrations of the Fund.
Cash and
cash
equivalents
Forward
foreign
currency
contract
Total
RM RM RM
2018
Financial institutions:
AAA 5,535,434 - 5,535,434
AA2 - 11,569,075 11,569,075
5,535,434 11,569,075 17,104,509
The financial assets of the Fund are neither past due nor impaired.
Liquidity risk
Liquidity risk is the risk that the Fund will encounter difficulty in meeting its
financial obligations.
The liquidity risk that exists at the Fund level is associated with the inability of the
Target Fund to meet large redemption in a timely manner. In the event of large
redemption request that would result in the total redemption shares in the Target
Fund to be more than 10% of the shares in the Target Fund or a particular share
class of the Target Fund, part or all of such requests for redemption may be deferred
for a period typically not exceeding ten business days of the Target Fund.
33
3 FINANCIAL RISK MANAGEMENT OBJECTIVES AND POLICIES
(CONTINUED)
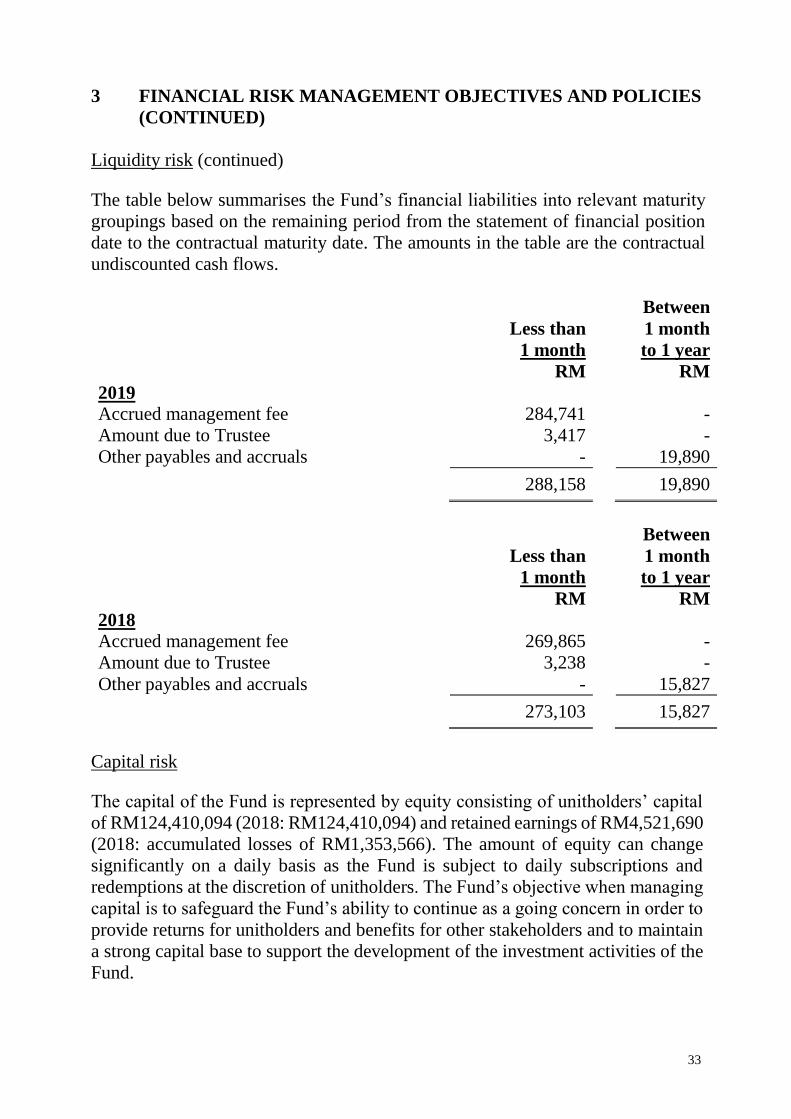
Liquidity risk (continued)
The table below summarises the Fund’s financial liabilities into relevant maturity
groupings based on the remaining period from the statement of financial position
date to the contractual maturity date. The amounts in the table are the contractual
undiscounted cash flows.
Less than
1 month
Between
1 month
to 1 year
RM RM
2019
Accrued management fee 284,741 -
Amount due to Trustee 3,417 -
Other payables and accruals - 19,890
288,158 19,890
Less than
1 month
Between
1 month
to 1 year
RM RM
2018
Accrued management fee 269,865 -
Amount due to Trustee 3,238 -
Other payables and accruals - 15,827
273,103 15,827
Capital risk
The capital of the Fund is represented by equity consisting of unitholders’ capital
of RM124,410,094 (2018: RM124,410,094) and retained earnings of RM4,521,690
(2018: accumulated losses of RM1,353,566). The amount of equity can change
significantly on a daily basis as the Fund is subject to daily subscriptions and
redemptions at the discretion of unitholders. The Fund’s objective when managing
capital is to safeguard the Fund’s ability to continue as a going concern in order to
provide returns for unitholders and benefits for other stakeholders and to maintain
a strong capital base to support the development of the investment activities of the
Fund.
34
4 FAIR VALUE ESTIMATION
Fair value is defined as the price that would be received to sell an asset or paid to
transfer a liability in an orderly transaction between market participants at the
measurement date (i.e. an exit price).
The fair value of financial assets and liabilities traded in an active market (such as
publicly traded derivatives and trading securities) are based on quoted market prices
at the close of trading on the financial year end date.
An active market is a market in which transactions for the assets or liabilities take
place with sufficient frequency and volume to provide pricing information on an
ongoing basis.
The fair value of financial assets that are not traded in an active market is
determined by using valuation techniques. The Fund uses a variety of methods and
makes assumptions that are based on market conditions existing at each financial
year end date. Valuation techniques used for non-standardised financial instruments
such as options, currency swaps and other over-the-counter derivatives, include the
use of comparable recent transactions, reference to other instruments that are
substantially the same, discounted cash flow analysis, option pricing models and
other valuation techniques commonly used by market participants making the
maximum use of market inputs and relying as little as possible on entity-specific
inputs.
The fair values are based on the following methodologies and assumptions:
(i) For bank balances and deposits with licensed financial institutions with
maturities less than 1 year, the carrying value is a reasonable estimate of fair
value.
(ii) The carrying value less impairment of receivables and payables are assumed
to approximate their fair values due to their short term nature.
35
4 FAIR VALUE ESTIMATION (CONTINUED)
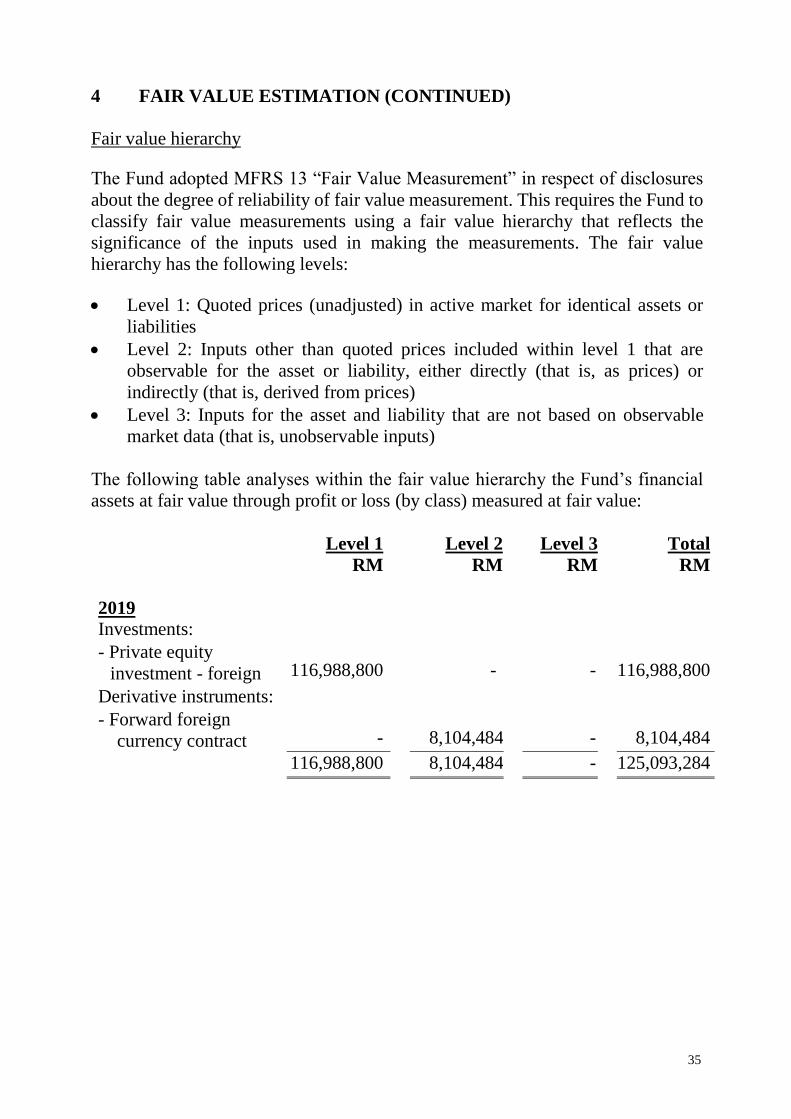
Fair value hierarchy
The Fund adopted MFRS 13 “Fair Value Measurement” in respect of disclosures
about the degree of reliability of fair value measurement. This requires the Fund to
classify fair value measurements using a fair value hierarchy that reflects the
significance of the inputs used in making the measurements. The fair value
hierarchy has the following levels:
Level 1: Quoted prices (unadjusted) in active market for identical assets or
liabilities
Level 2: Inputs other than quoted prices included within level 1 that are
observable for the asset or liability, either directly (that is, as prices) or
indirectly (that is, derived from prices)
Level 3: Inputs for the asset and liability that are not based on observable
market data (that is, unobservable inputs)
The following table analyses within the fair value hierarchy the Fund’s financial
assets at fair value through profit or loss (by class) measured at fair value:
Level 1 Level 2 Level 3 Total
RM RM RM RM
2019
Investments:
- - Private equity
investment - foreign 116,988,800 - - 116,988,800
- Derivative instruments:
- - Forward foreign
currency contract - 8,104,484 - 8,104,484
- 116,988,800 8,104,484 - 125,093,284
36
4 FAIR VALUE ESTIMATION (CONTINUED)
Fair value hierarchy (continued)
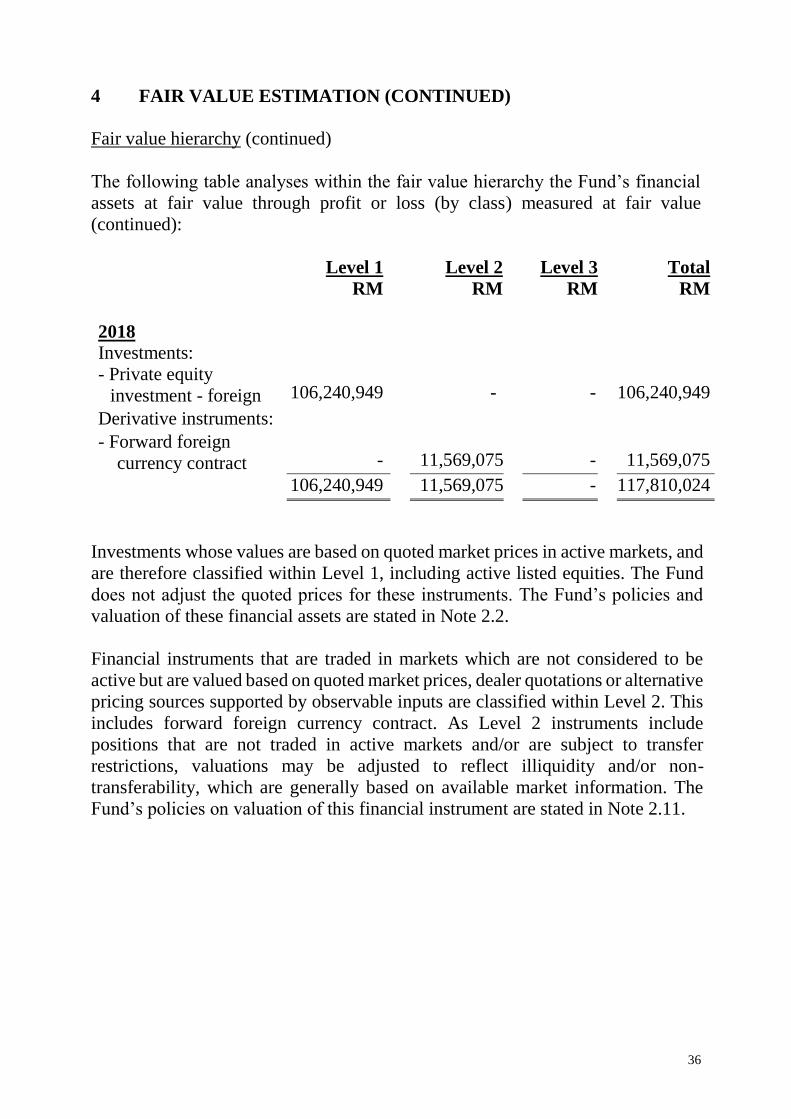
The following table analyses within the fair value hierarchy the Fund’s financial
assets at fair value through profit or loss (by class) measured at fair value
(continued):
Level 1 Level 2 Level 3 Total
RM RM RM RM
2018
Investments:
- - Private equity
investment - foreign 106,240,949 - - 106,240,949
- Derivative instruments:
- - Forward foreign
currency contract - 11,569,075 - 11,569,075
- 106,240,949 11,569,075 - 117,810,024
Investments whose values are based on quoted market prices in active markets, and
are therefore classified within Level 1, including active listed equities. The Fund
does not adjust the quoted prices for these instruments. The Fund’s policies and
valuation of these financial assets are stated in Note 2.2.
Financial instruments that are traded in markets which are not considered to be
active but are valued based on quoted market prices, dealer quotations or alternative
pricing sources supported by observable inputs are classified within Level 2. This
includes forward foreign currency contract. As Level 2 instruments include
positions that are not traded in active markets and/or are subject to transfer
restrictions, valuations may be adjusted to reflect illiquidity and/or non-
transferability, which are generally based on available market information. The
Fund’s policies on valuation of this financial instrument are stated in Note 2.11.
37
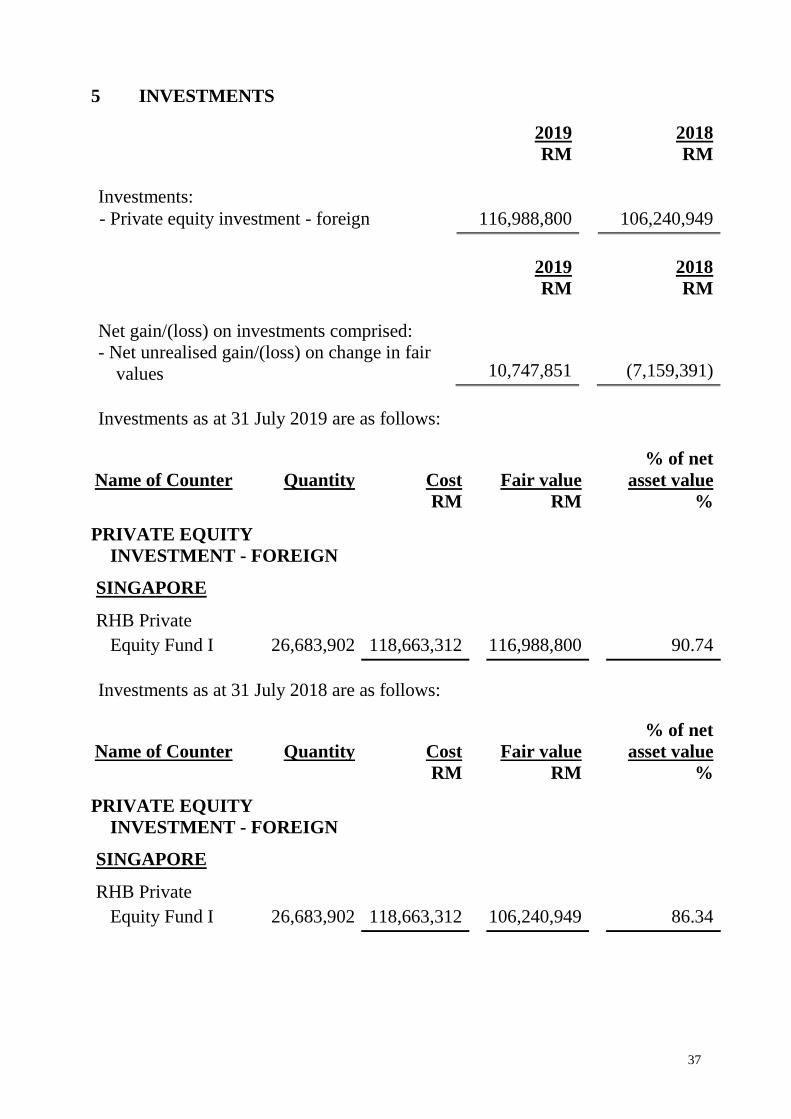
5 INVESTMENTS
2019 2018
RM RM
Investments:
- Private equity investment - foreign 116,988,800 106,240,949
2019 2018 RM RM
Net gain/(loss) on investments comprised:
- Net unrealised gain/(loss) on change in fair
values 10,747,851
(7,159,391)
Investments as at 31 July 2019 are as follows:
Name of Counter Quantity Cost
Fair value
% of net
asset value
RM RM %
PRIVATE EQUITY
INVESTMENT - FOREIGN
SINGAPORE
RHB Private
Equity Fund I 26,683,902 118,663,312
116,988,800
90.74
Investments as at 31 July 2018 are as follows:
Name of Counter Quantity Cost
Fair value
% of net
asset value
RM RM %
PRIVATE EQUITY
INVESTMENT - FOREIGN
SINGAPORE
RHB Private
Equity Fund I 26,683,902 118,663,312
106,240,949
86.34
38
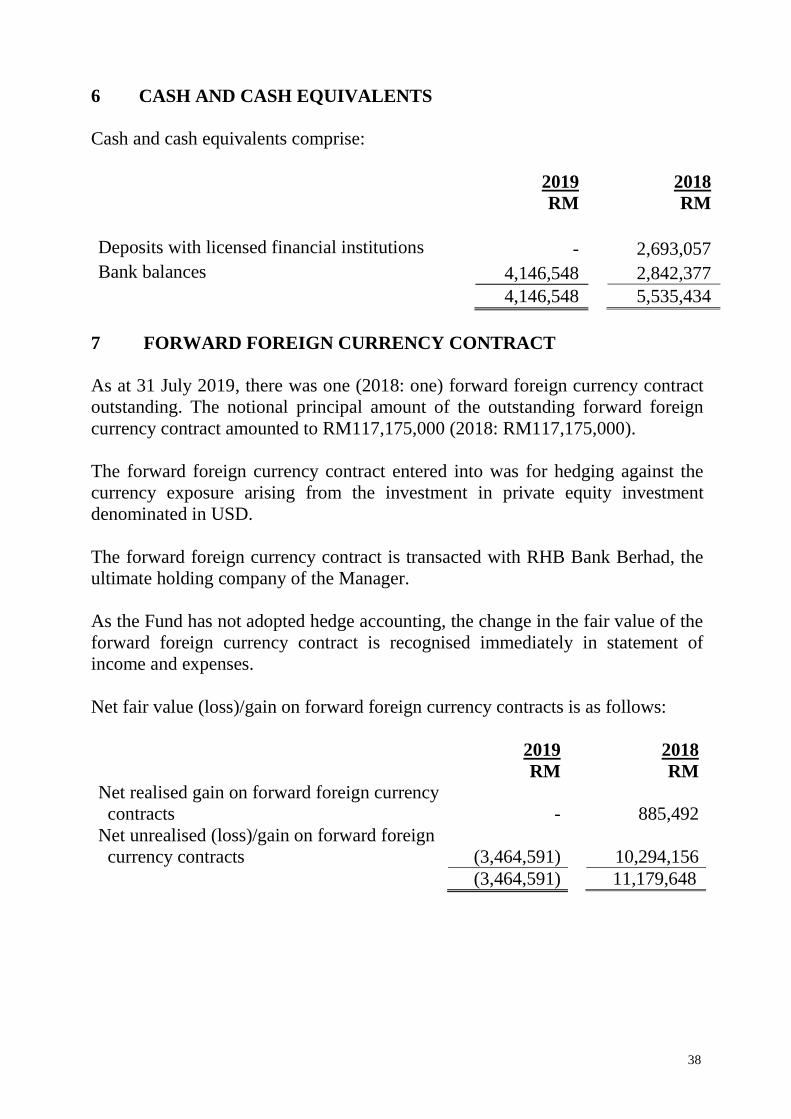
6 CASH AND CASH EQUIVALENTS
Cash and cash equivalents comprise:
2019 2018
RM RM
Deposits with licensed financial institutions - 2,693,057
Bank balances 4,146,548 2,842,377
4,146,548 5,535,434
7 FORWARD FOREIGN CURRENCY CONTRACT
As at 31 July 2019, there was one (2018: one) forward foreign currency contract
outstanding. The notional principal amount of the outstanding forward foreign
currency contract amounted to RM117,175,000 (2018: RM117,175,000).
The forward foreign currency contract entered into was for hedging against the
currency exposure arising from the investment in private equity investment
denominated in USD.
The forward foreign currency contract is transacted with RHB Bank Berhad, the
ultimate holding company of the Manager.
As the Fund has not adopted hedge accounting, the change in the fair value of the
forward foreign currency contract is recognised immediately in statement of
income and expenses.
Net fair value (loss)/gain on forward foreign currency contracts is as follows:
2019 2018
RM RM
Net realised gain on forward foreign currency
contracts
-
885,492
Net unrealised (loss)/gain on forward foreign
currency contracts
(3,464,591)
10,294,156
(3,464,591) 11,179,648
39
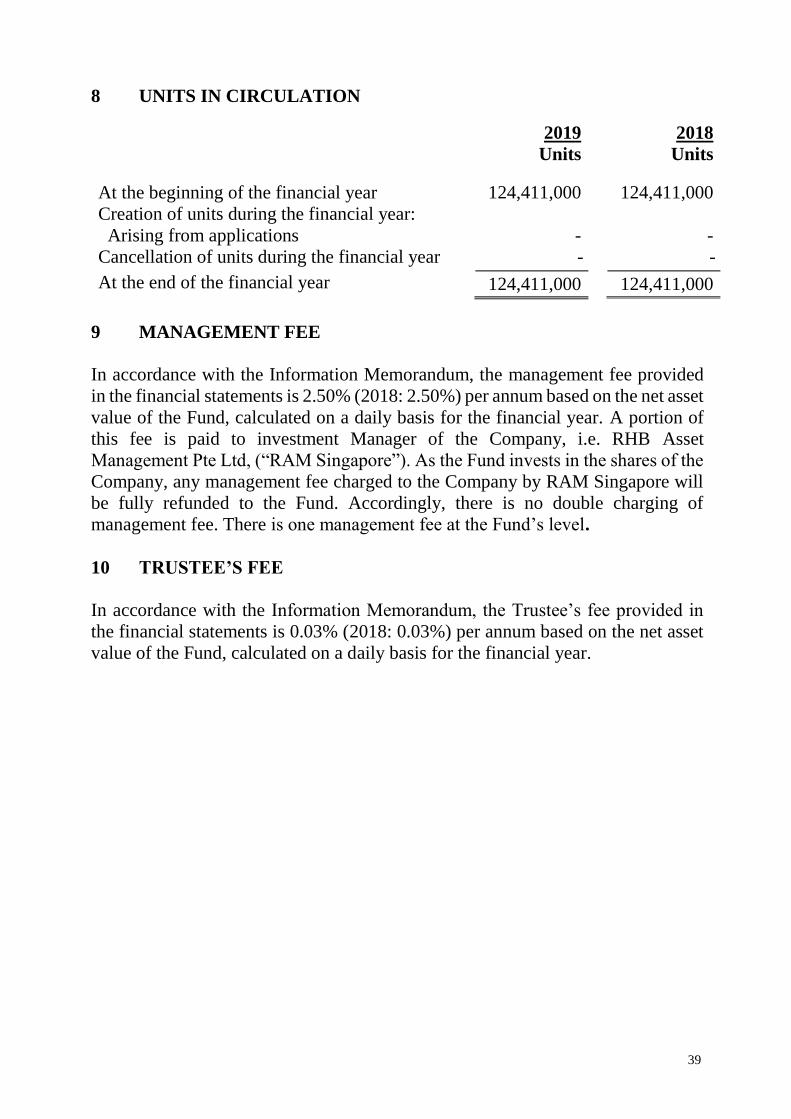
8 UNITS IN CIRCULATION
2019 2018
Units Units
At the beginning of the financial year 124,411,000 124,411,000
Creation of units during the financial year:
Arising from applications - -
Cancellation of units during the financial year - -
At the end of the financial year 124,411,000 124,411,000
9 MANAGEMENT FEE
In accordance with the Information Memorandum, the management fee provided
in the financial statements is 2.50% (2018: 2.50%) per annum based on the net asset
value of the Fund, calculated on a daily basis for the financial year. A portion of
this fee is paid to investment Manager of the Company, i.e. RHB Asset
Management Pte Ltd, (“RAM Singapore”). As the Fund invests in the shares of the
Company, any management fee charged to the Company by RAM Singapore will
be fully refunded to the Fund. Accordingly, there is no double charging of
management fee. There is one management fee at the Fund’s level.
10 TRUSTEE’S FEE
In accordance with the Information Memorandum, the Trustee’s fee provided in
the financial statements is 0.03% (2018: 0.03%) per annum based on the net asset
value of the Fund, calculated on a daily basis for the financial year.
40
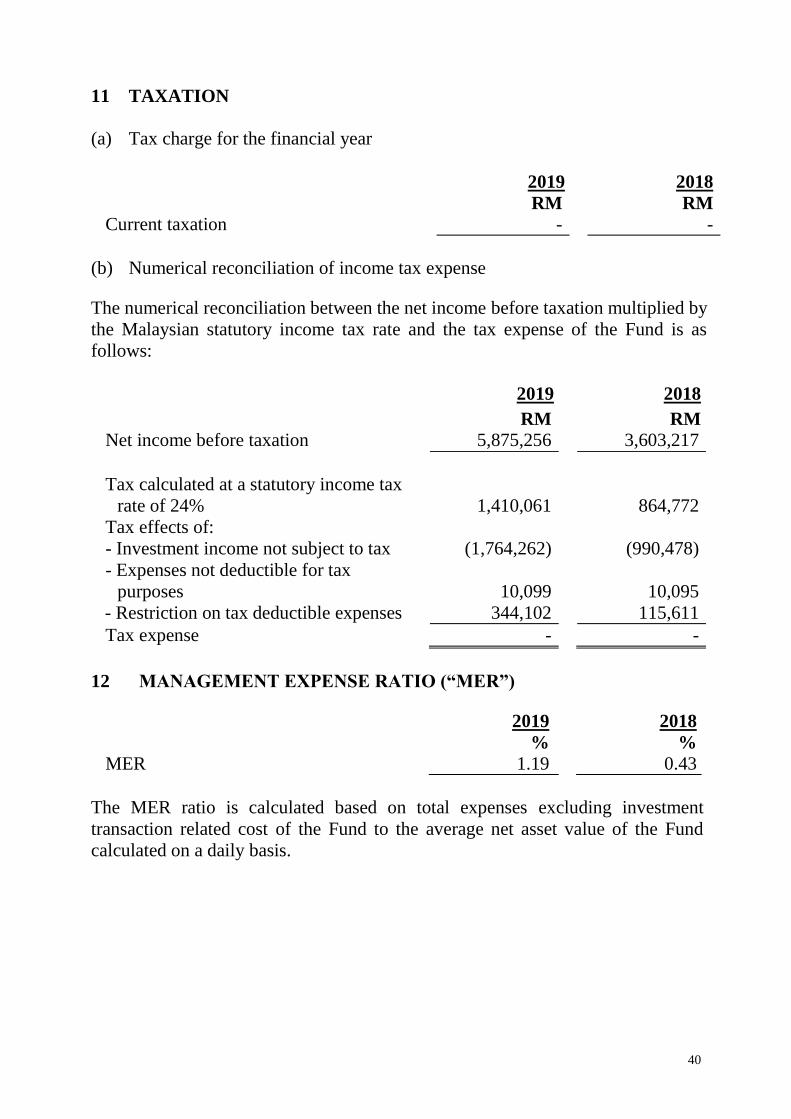
11 TAXATION
(a) Tax charge for the financial year
2019 2018
RM RM
Current taxation - -
(b) Numerical reconciliation of income tax expense
The numerical reconciliation between the net income before taxation multiplied by
the Malaysian statutory income tax rate and the tax expense of the Fund is as
follows:
2019 2018
RM RM
Net income before taxation 5,875,256 3,603,217
Tax calculated at a statutory income tax
rate of 24%
1,410,061
864,772
Tax effects of:
- Investment income not subject to tax (1,764,262) (990,478)
- Expenses not deductible for tax
purposes
10,099
10,095
- Restriction on tax deductible expenses 344,102 115,611
Tax expense - -
12 MANAGEMENT EXPENSE RATIO (“MER”)
2019 2018
% %
MER 1.19 0.43
The MER ratio is calculated based on total expenses excluding investment
transaction related cost of the Fund to the average net asset value of the Fund
calculated on a daily basis.
41
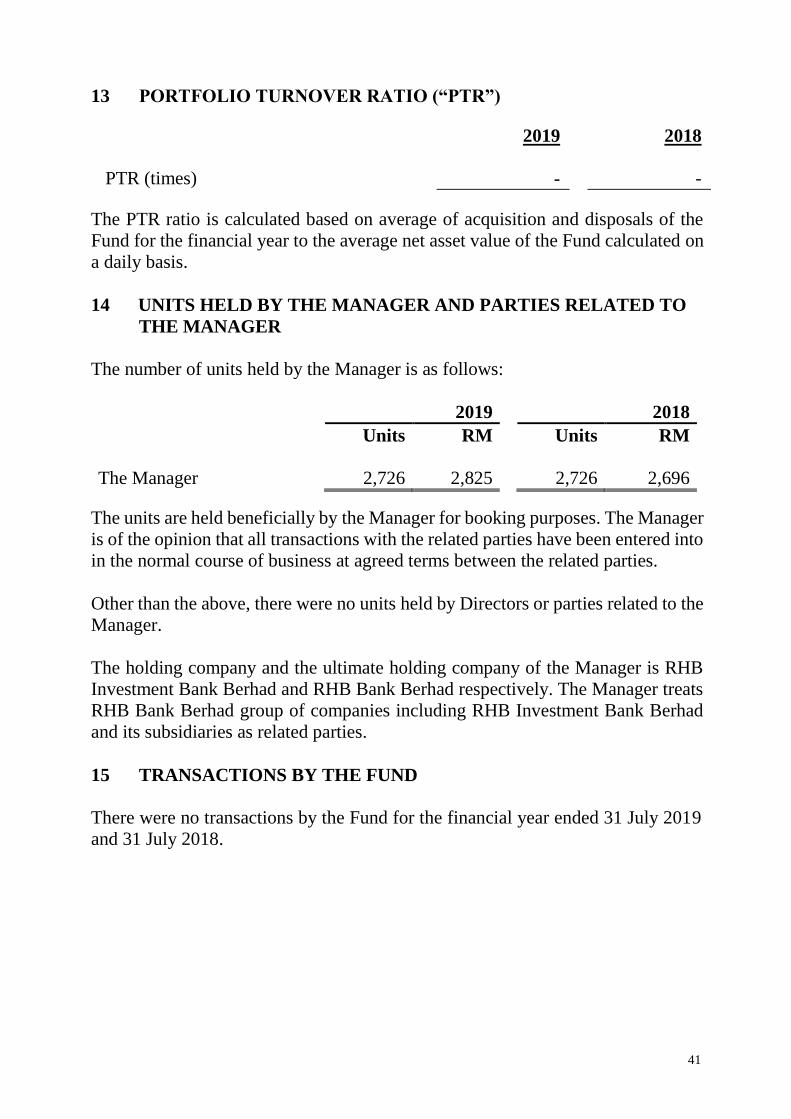
13 PORTFOLIO TURNOVER RATIO (“PTR”)
2019 2018
PTR (times) - -
The PTR ratio is calculated based on average of acquisition and disposals of the
Fund for the financial year to the average net asset value of the Fund calculated on
a daily basis.
14 UNITS HELD BY THE MANAGER AND PARTIES RELATED TO
THE MANAGER
The number of units held by the Manager is as follows:
2019 2018
Units RM Units RM
The Manager 2,726 2,825 2,726 2,696
The units are held beneficially by the Manager for booking purposes. The Manager
is of the opinion that all transactions with the related parties have been entered into
in the normal course of business at agreed terms between the related parties.
Other than the above, there were no units held by Directors or parties related to the
Manager.
The holding company and the ultimate holding company of the Manager is RHB
Investment Bank Berhad and RHB Bank Berhad respectively. The Manager treats
RHB Bank Berhad group of companies including RHB Investment Bank Berhad
and its subsidiaries as related parties.
15 TRANSACTIONS BY THE FUND
There were no transactions by the Fund for the financial year ended 31 July 2019
and 31 July 2018.
42
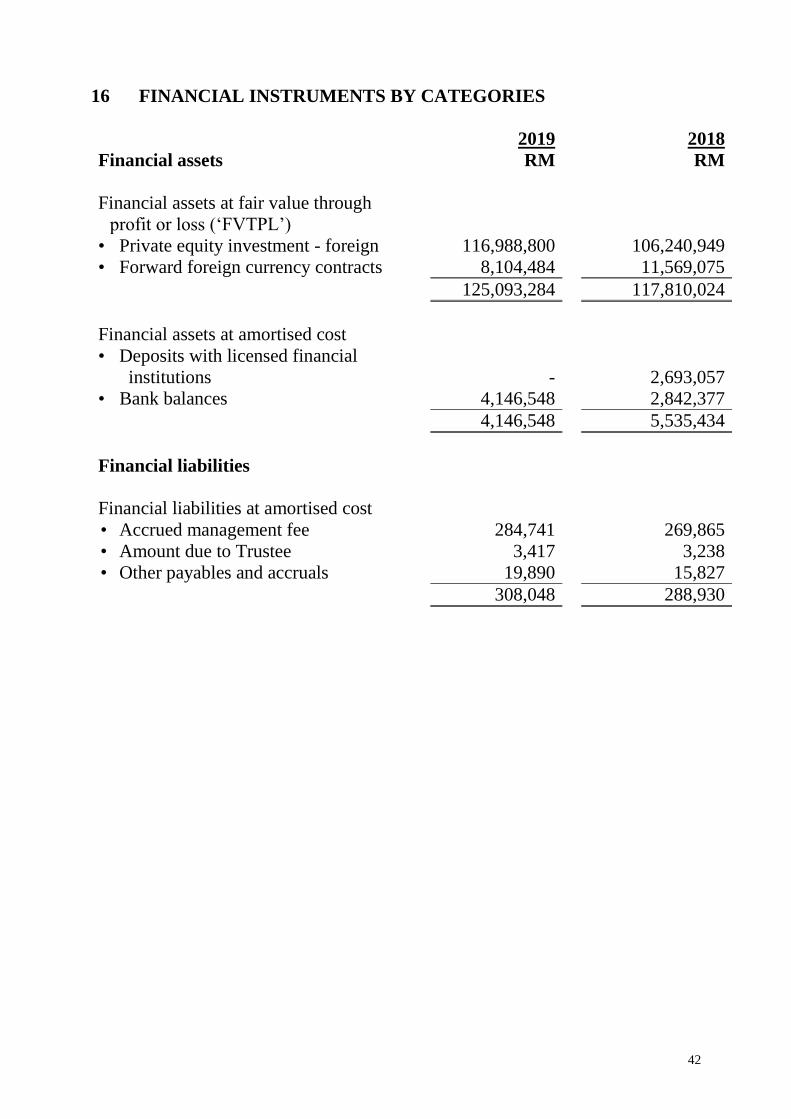
16 FINANCIAL INSTRUMENTS BY CATEGORIES
2019 2018
Financial assets RM RM
Financial assets at fair value through
profit or loss (‘FVTPL’)
• Private equity investment - foreign 116,988,800 106,240,949
• Forward foreign currency contracts 8,104,484 11,569,075
125,093,284 117,810,024
Financial assets at amortised cost
• Deposits with licensed financial
institutions
-
2,693,057
• Bank balances 4,146,548 2,842,377
4,146,548 5,535,434
Financial liabilities
Financial liabilities at amortised cost
• Accrued management fee 284,741 269,865
• Amount due to Trustee 3,417 3,238
• Other payables and accruals 19,890 15,827
308,048 288,930
43
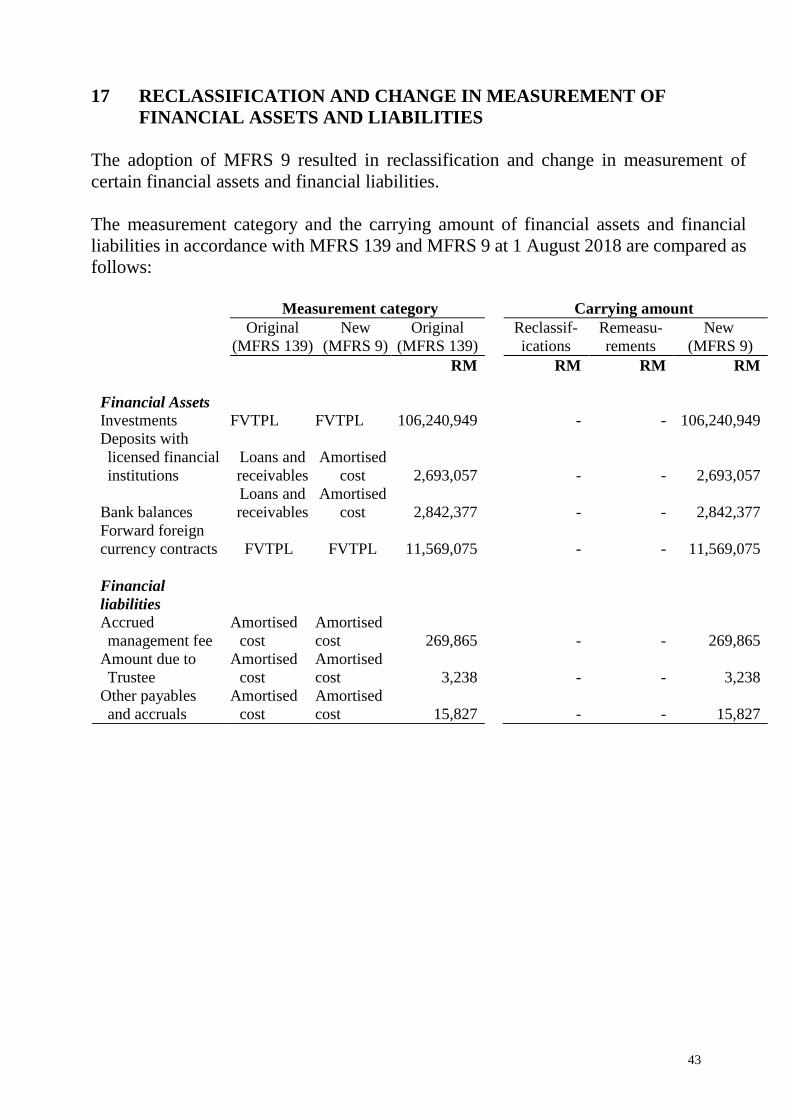
17 RECLASSIFICATION AND CHANGE IN MEASUREMENT OF
FINANCIAL ASSETS AND LIABILITIES
The adoption of MFRS 9 resulted in reclassification and change in measurement of
certain financial assets and financial liabilities.
The measurement category and the carrying amount of financial assets and financial
liabilities in accordance with MFRS 139 and MFRS 9 at 1 August 2018 are compared as
follows:
Measurement category Carrying amount
Original
(MFRS 139)
New
(MFRS 9)
Original
(MFRS 139)
Reclassif-
ications
Remeasu-
rements
New
(MFRS 9)
RM RM RM RM
Financial Assets
Investments FVTPL FVTPL 106,240,949 - - 106,240,949
Deposits with
licensed financial
institutions
Loans and
receivables
Amortised
cost 2,693,057
- - 2,693,057
Bank balances
Loans and
receivables
Amortised
cost 2,842,377
- - 2,842,377
Forward foreign
currency contracts FVTPL FVTPL 11,569,075
- - 11,569,075
Financial
liabilities
Accrued
management fee
Amortised
cost
Amortised
cost 269,865
- - 269,865
Amount due to
Trustee
Amortised
cost
Amortised
cost 3,238
- - 3,238
Other payables
and accruals
Amortised
cost
Amortised
cost 15,827
- - 15,827
44
18 SEGMENT INFORMATION
The Investment & Security Selection Committee of the Manager recommends
strategic resource allocations of the Fund to the Investment Committee of the
Manager (collectively referred to as “Committee”).
The internal reporting provided to the Committee for the Fund’s assets, liabilities
and performance is prepared on a consistent basis with the measurement and
recognition principles of MFRS and IFRS. The Committee is responsible for the
Fund’s entire portfolio and considers the business to have a single operating
segment. The Committee’s asset allocation decisions are based on a single,
integrated investment strategy and the Fund’s performance is evaluated on an
overall basis.
The reportable operating segments derive their income by seeking investments to
achieve the investment objective which commensurate with an acceptable level of
risk within each portfolio. These returns consist of interest and gains on the
appreciation in the value of investments which are derived from Malaysia and
Singapore.
There were no changes in the reportable segments during the financial year.

45
STATEMENT BY MANAGER
We, Sharifatu Laila Syed Ali and Ong Yin Suen, two of the Directors of RHB
Asset Management Sdn Bhd, do hereby state that in the opinion of the Directors
of the Manager, the accompanying statement of financial position, statement of
income and expenses, statement of changes in net asset value, statement of cash
flows and the accompanying notes, are drawn up in accordance with Malaysian
Financial Reporting Standards and International Financial Reporting Standards so
as to give a true and fair view of the financial position of the Fund as of 31 July
2019 and of its financial performance and cash flows for the financial year then
ended and comply with the provisions of the Deeds.
On behalf of the Manager
SHARIFATU LAILA SYED ALI ONG YIN SUEN
DIRECTOR DIRECTOR
23 September 2019
46
TRUSTEE’S REPORT TO THE UNITHOLDERS OF RHB PRIVATE
EQUITY OPPORTUNITY FUND 1
We have acted as Trustee of RHB Private Equity Opportunity Fund 1 (“the Fund”)
for the financial year ended 31 July 2019. To the best of our knowledge, RHB
Asset Management Sdn Bhd (“the Management Company”), has operated and
managed the Fund in accordance with the following:
(a) limitations imposed on the investment powers of the Management Company
and the Trustee under the Deed, the Securities Commission’s Guidelines on
Unlisted Capital Market Products under the Lodge and Launch Framework,
the Capital Markets and Services Act 2007 and other applicable laws;
(b) valuation/pricing is carried out in accordance with the Deed and any
regulatory requirements; and
(c) creation and cancellation of units are carried out in accordance with the Deed
and any regulatory requirements.
For SCBMB Trustee Malaysia Berhad
(Company No: 1005793T)
Prasad A/L S Vijayasundram
Chief Executive Officer
Kuala Lumpur
23 September 2019
47
INDEPENDENT AUDITORS’ REPORT TO THE UNITHOLDERS OF
RHB PRIVATE EQUITY OPPORTUNITY FUND 1
REPORT ON THE AUDIT OF THE FINANCIAL STATEMENTS
Our opinion
In our opinion, the financial statements of RHB Private Equity Opportunity Fund 1
(“the Fund”) give a true and fair view of the financial position of the Fund as at 31
July 2019 and of its financial performance and its cash flows for the financial year
then ended in accordance with Malaysian Financial Reporting Standards and
International Financial Reporting Standards.
What we have audited
We have audited the financial statements of the Fund, which comprise the statement
of financial position as at 31 July 2019, and the statement of income and expenses,
statement of changes in net asset value and statement of cash flows for the financial
year then ended, and notes to the financial statements, including a summary of
significant accounting policies, as set out on pages 16 to 44.
Basis for opinion
We conducted our audit in accordance with approved standards on auditing in
Malaysia and International Standards on Auditing. Our responsibilities under those
standards are further described in the “Auditors’ responsibilities for the audit of the
financial statements” section of our report.
We believe that the audit evidence we have obtained is sufficient and appropriate to
provide a basis for our opinion.
Independence and other ethical responsibilities
We are independent of the Fund in accordance with the By-Laws (on Professional
Ethics, Conduct and Practice) of the Malaysian Institute of Accountants (“By-
Laws”) and the International Ethics Standards Board for Accountants’ Code of
Ethics for Professional Accountants (“IESBA Code”), and we have fulfilled our
other ethical responsibilities in accordance with the By-Laws and the IESBA Code.
48
INDEPENDENT AUDITORS’ REPORT TO THE UNITHOLDERS OF
RHB PRIVATE EQUITY OPPORTUNITY FUND 1 (CONTINUED)
REPORT ON THE AUDIT OF THE FINANCIAL STATEMENTS
(CONTINUED)
Information other than the financial statements and auditors’ report thereon
The Manager of the Fund is responsible for the other information. The other
information comprises Manager’s report, but does not include the financial
statements of the Fund and our auditors’ report thereon.
Our opinion on the financial statements of the Fund does not cover the other
information and we do not express any form of assurance conclusion thereon.
In connection with our audit of the financial statements of the Fund, our
responsibility is to read the other information and, in doing so, consider whether the
other information is materially inconsistent with the financial statements of the Fund
or our knowledge obtained in the audit or otherwise appears to be materially
misstated.
If, based on the work we have performed, we conclude that there is a material
misstatement of this other information, we are required to report that fact. We have
nothing to report in this regard.
Responsibilities of the Manager for the financial statements
The Manager of the Fund is responsible for the preparation of the financial
statements of the Fund that give a true and fair view in accordance with Malaysian
Financial Reporting Standards and International Financial Reporting Standards. The
Manager is also responsible for such internal control as the Manager determines is
necessary to enable the preparation of financial statements of the Fund that are free
from material misstatement, whether due to fraud or error.
In preparing the financial statements of the Fund, the Manager is responsible for
assessing the Fund’s ability to continue as a going concern, disclosing, as applicable,
matters related to going concern and using the going concern basis of accounting
unless the Manager either intends to liquidate the Fund or to terminate the Fund, or
has no realistic alternative but to do so.
49
INDEPENDENT AUDITORS’ REPORT TO THE UNITHOLDERS OF
RHB PRIVATE EQUITY OPPORTUNITY FUND 1 (CONTINUED)
REPORT ON THE AUDIT OF THE FINANCIAL STATEMENTS
(CONTINUED)
Auditors’ responsibilities for the audit of the financial statements
Our objectives are to obtain reasonable assurance about whether the financial
statements of the Fund as a whole are free from material misstatement, whether due
to fraud or error, and to issue an auditors’ report that includes our opinion.
Reasonable assurance is a high level of assurance, but is not a guarantee that an audit
conducted in accordance with approved standards on auditing in Malaysia and
International Standards on Auditing will always detect a material misstatement when
it exists. Misstatements can arise from fraud or error and are considered material if,
individually or in the aggregate, they could reasonably be expected to influence the
economic decisions of users taken on the basis of these financial statements.
As part of an audit in accordance with approved standards on auditing in Malaysia
and International Standards on Auditing, we exercise professional judgement and
maintain professional scepticism throughout the audit. We also:
(a) Identify and assess the risks of material misstatement of the financial
statements of the Fund, whether due to fraud or error, design and perform
audit procedures responsive to those risks, and obtain audit evidence that is
sufficient and appropriate to provide a basis for our opinion. The risk of not
detecting a material misstatement resulting from fraud is higher than for one
resulting from error, as fraud may involve collusion, forgery, intentional
omissions, misrepresentations, or the override of internal control.
(b) Obtain an understanding of internal control relevant to the audit in order to
design audit procedures that are appropriate in the circumstances, but not for
the purpose of expressing an opinion on the effectiveness of Fund’s internal
control.
(c) Evaluate the appropriateness of accounting policies used and the
reasonableness of accounting estimates and related disclosures made by the
Manager.
50
INDEPENDENT AUDITORS’ REPORT TO THE UNITHOLDERS OF
RHB PRIVATE EQUITY OPPORTUNITY FUND 1 (CONTINUED)
REPORT ON THE AUDIT OF THE FINANCIAL STATEMENTS
(CONTINUED)
Auditors’ responsibilities for the audit of the financial statements (continued)
(d) Conclude on the appropriateness of the Manager’s use of the going concern
basis of accounting and, based on the audit evidence obtained, whether a
material uncertainty exists related to events or conditions that may cast
significant doubt on the Fund’s ability to continue as a going concern. If we
conclude that a material uncertainty exists, we are required to draw attention
in our auditors’ report to the related disclosures in the financial statements of
the Fund or, if such disclosures are inadequate, to modify our opinion. Our
conclusions are based on the audit evidence obtained up to the date of our
auditors’ report. However, future events or conditions may cause the Fund to
cease to continue as a going concern.
(e) Evaluate the overall presentation, structure and content of the financial
statements of the Fund, including the disclosures, and whether the financial
statements represent the underlying transactions and events in a manner that
achieves fair presentation.
We communicate with the Manager regarding, among other matters, the planned
scope and timing of the audit and significant audit findings, including any significant
deficiencies in internal control that we identify during our audit.
OTHER MATTERS
This report is made solely to the unitholders of the Fund and for no other purpose.
We do not assume responsibility to any other person for the content of this report.
PRICEWATERHOUSECOOPERS PLT
(LLP0014401-LCA & AF 1146)
Chartered Accountants
Kuala Lumpur
23 September 2019

51
CORPORATE INFORMATION
MANAGER
RHB Asset Management Sdn Bhd
REGISTERED OFFICE
Level 10, Tower One, RHB Centre, Jalan Tun Razak, 50400 Kuala Lumpur
PRINCIPAL AND BUSINESS OFFICE
Level 8, Tower Two & Three, RHB Centre, Jalan Tun Razak, 50400 Kuala Lumpur
E-mail Address : [email protected]
Tel: 03 – 9205 8000
Fax: 03 – 9205 8100
Website: www.rhbgroup.com
BOARD OF DIRECTORS
Mr Yap Chee Meng (Independent Non-Executive Chairman)
Mr Chin Yoong Kheong (Senior Independent Non-Executive Director)
Dr. Ngo Get Ping (Independent Non-Executive Director)
Puan Sharifatu Laila Syed Ali (Independent Non-Executive Chairman)
Ms Ong Yin Suen (Managing Director/Chief Executive Officer)
INVESTMENT COMMITTEE MEMBERS
Mr Yap Chee Meng (Independent Chairman)
YBhg Dato’ Darawati Hussain
Puan Sharifatu Laila Syed Ali
CHIEF EXECUTIVE OFFICER
Ms Ong Yin Suen
SECRETARY
Encik Azman Shah Md Yaman (LS No. 0006901)

52
BRANCH OFFICE
Kuala Lumpur Office B-9-6, Megan Avenue 1
No. 189, Jalan Tun Razak
50400 Kuala Lumpur
Tel: 03-2171 2755/ 03-2166 7011
Fax: 03-2770 0022
Sri Petaling Office Level 1 & 2, No 53 Jalan Radin Tengah
Bandar Baru Seri Petaling
57000 Kuala Lumpur
Tel: 03-9054 2470 Fax: 03-9054 0934
Batu Pahat Office 53, 53-A and 53-B Jalan Sultanah
83000 Batu Pahat, Johor
Tel: 07-438 0271/ 07-438 0988
Fax: 07-438 0277
Ipoh Office No.7A, Persiaran Greentown 9,
Pusat Perdagangan Greentown,
30450 Ipoh, Perak
Tel: 05-242 4311
Fax: 05-242 4312
Johor Bahru Office No 34 Jalan Kebun Teh 1
Pusat Perdagangan Kebun Teh
80250 Johor Bahru, Johor
Tel: 07-221 0129 Fax: 07-221 0291
2nd Floor, 21 & 23
Jalan Molek 1/30, Taman Molek
81100 Johor Bahru, Johor
Tel: 07-358 3587 Fax: 07-358 3581
Kuantan Office B 32-34, 2nd Floor, Lorong Tun Ismail 8
Sri Dagangan II
25000 Kuantan, Pahang
Tel: 09-517 3611 Fax: 09-517 3612
Kuching Office Lot 133, Section 20, Sublot 2 & 3,
1st Floor, Jalan Tun Ahmad Zaidi Adruce,
93200 Kuching, Sarawak
Tel: 082-550 838 Fax: 082-550 508

53
Kuching Office Lot 172, Section 49, K.T.L.D,
Jalan Chan Chin Ann,
93100 Kuching, Sarawak
Tel: 082-245 611 Fax: 082-242 712
Kota Bharu Office Ground Floor, No 3486-G,
Jalan Sultan Ibrahim,
15050 Kota Bharu, Kelantan
Tel: 09-740 6891 Fax: 09-740 6890
Kota Kinabalu Office Lot No. C-02-04, 2nd Floor
Block C, Warisan Square
Jalan Tun Fuad Stephens,
88000 Kota Kinabalu,
Sabah
Tel: 088-528 686 Fax: 088-528 685
Melaka Office 581B, Taman Melaka Raya
75000 Melaka
Tel: 06-284 4211/ 06-281 4110
Fax: 06-292 2212
Miri Office Lot 1268 & 1269, Second Floor
Centre Point Commercial Centre
Jalan Melayu
98000 Miri, Sarawak
Tel: 085-422 788 Fax: 085- 415 243
Penang Office 3rd Floor, 44 Lebuh Pantai
10300 Georgetown, Penang
Tel: 04-264 5639 Fax: 04-264 5640
Prai Office First Floor, No. 1797-1-04,
Kompleks Auto World,
Jalan Perusahaan, Juru Interchange,
13600 Perai, Penang.
Tel: 04-506 2116/ 04-506 0216
Fax: 04-505 9996
54
TRUSTEE SCBMB Trustee Berhad
BANKER RHB Bank Berhad
AUDITORS PricewaterhouseCoopers PLT
TAX ADVISER PricewaterhouseCoopers Taxation Services Sdn Bhd
DISTRIBUTORS Areca Capital Sdn Bhd CIMB Investment Bank Berhad
iFast Capital Sdn Bhd
Kenanga Investment Bank Berhad
Phillip Mutual Berhad
RHB Bank Berhad
RHB Investment Bank Berhad

55
Related Documents