RH850 Debugger and Trace 1 ©1989-2019 Lauterbach GmbH RH850 Debugger and Trace TRACE32 Online Help TRACE32 Directory TRACE32 Index TRACE32 Documents ...................................................................................................................... ICD In-Circuit Debugger ................................................................................................................ Processor Architecture Manuals .............................................................................................. RH850 ....................................................................................................................................... RH850 Debugger and Trace ................................................................................................ 1 History ................................................................................................................................ 6 Introduction ....................................................................................................................... 6 Available Tools 6 Debugger 7 Software-only Debugger for XCP 7 SFT Trace 7 On-chip Trace 7 High-Speed Serial Off-chip Trace (Aurora NEXUS) 8 Parallel Off-chip Trace (parallel NEXUS) 8 Co-Processor Debugging (GTM) 8 Multicore Debugging 8 Software Installation 9 Related Documents 9 Demo and Start-up Scripts 10 Brief Overview of Documents for New Users 10 Warning .............................................................................................................................. 11 Useful Tips ......................................................................................................................... 12 Application Starts Running at SYStem.Up 12 Greenhills Compiler 13 Stop Timers and Peripherals during application-break 13 Location of Debug Connector 13 Reset Line 13 Debugging the STOP and DeepSTOP Mode 14 Configuration ..................................................................................................................... 15 System Overview 15 Single Core Debugging - Quick Start .............................................................................. 16 Debug from Reset 16

Welcome message from author
This document is posted to help you gain knowledge. Please leave a comment to let me know what you think about it! Share it to your friends and learn new things together.
Transcript

RH850 Debugger and Trace
TRACE32 Online Help
TRACE32 Directory
TRACE32 Index
TRACE32 Documents ......................................................................................................................
ICD In-Circuit Debugger ................................................................................................................
Processor Architecture Manuals ..............................................................................................
RH850 .......................................................................................................................................
RH850 Debugger and Trace ................................................................................................ 1
History ................................................................................................................................ 6
Introduction ....................................................................................................................... 6
Available Tools 6
Debugger 7
Software-only Debugger for XCP 7
SFT Trace 7
On-chip Trace 7
High-Speed Serial Off-chip Trace (Aurora NEXUS) 8
Parallel Off-chip Trace (parallel NEXUS) 8
Co-Processor Debugging (GTM) 8
Multicore Debugging 8
Software Installation 9
Related Documents 9
Demo and Start-up Scripts 10
Brief Overview of Documents for New Users 10
Warning .............................................................................................................................. 11
Useful Tips ......................................................................................................................... 12
Application Starts Running at SYStem.Up 12
Greenhills Compiler 13
Stop Timers and Peripherals during application-break 13
Location of Debug Connector 13
Reset Line 13
Debugging the STOP and DeepSTOP Mode 14
Configuration ..................................................................................................................... 15
System Overview 15
Single Core Debugging - Quick Start .............................................................................. 16
Debug from Reset 16
RH850 Debugger and Trace 1 ©1989-2019 Lauterbach GmbH

Connect to Running Program (Hot Plug-In) 18
Troubleshooting ................................................................................................................ 19
SYStem.Up Errors 19
FAQ ..................................................................................................................................... 20
Debugging .......................................................................................................................... 22
RH850 Debug Interface Modes 22
JTAG Mode 22
LPD4 Mode 22
LPD1 Mode 23
UART Mode 23
Breakpoints 25
Software Breakpoints 25
Onchip Breakpoints 25
Breakpoint in ROM 26
Example for Breakpoints 26
Access Classes 27
Access Classes to Memory and Memory Mapped Resources 27
Access Classes to Other Addressable Core and Peripheral Resources 28
Support for Peripheral Modules 30
Runtime Measurement 30
Multicore Debugging 31
SMP Debugging 31
AMP Debugging 33
FLASH Programming Support ......................................................................................... 35
Tracing ............................................................................................................................... 37
SFT Trace via LPD4 37
NEXUS On-chip Trace 37
External Trace Ports (Parallel NEXUS/Aurora NEXUS) 37
Tracing the Program Flow 38
Tracing of Data (read/write) Transactions 39
Example: Data Trace with Address Range 39
Trace Filtering and Triggering with Debug Events 40
Event Breakpoints 40
Overview 40
Example: Selective Program Tracing 41
Example: Event Controlled Program/Data Trace Start and End 42
Example: Event Controlled Trace Recording 43
Example: Event Controlled Trigger Signals 43
Example: Event Counter 44
Tracing Peripheral Modules / Bus Masters 44
SFT Software Trace ........................................................................................................... 45
RH850 Debugger and Trace 2 ©1989-2019 Lauterbach GmbH

SFT Software Trace to On-chip Trace 45
SFT Software Trace via LPD4 debug port 46
CPU specific SYStem Commands ................................................................................... 47
SYStem.BAUDRATE Baudrate setting 47
SYStem.CONFIG.state Display target configuration 47
SYStem.CONFIG Configure debugger according to target topology 48
Daisy-Chain Example 50
TapStates 51
SYStem.CONFIG.CORE Assign core to TRACE32 instance 52
SYStem.CONFIG.DEBUGPORT Select target interface 53
SYStem.CONFIG.DEBUGPORTTYPE Select debug port type 54
SYStem.CONFIG.EXTWDTDIS Disable external watchdog 54
SYStem.CONFIG PortSHaRing Control sharing of debug port with other tool 55
SYStem.CORECLOCK Core clock frequency 55
SYStem.CPU CPU type selection 55
SYStem.CpuAccess Run-time memory access (intrusive) 56
SYStem.CpuBreak Master control to deny stopping the target (long stop) 56
SYStem.CpuSpot Master control to deny spotting the target (short stop) 58
SYStem.JtagClock JTAG clock selection 58
SYStem.LOCK Lock and tristate the debug port 59
SYStem.MemAccess Memory access selection 59
SYStem.Mode System mode selection 60
SYStem.OSCCLOCK Oscillator clock frequency 60
SYStem.RESetOut Reset target without reset of debug port 61
CPU specific SYStem.Option Commands ....................................................................... 62
SYStem.Option CFU CalibrationFunctionUnit support 62
SYStem.Option DOWNMODE Behavior of SYStem.Mode Down 62
SYStem.Option FLMD0 FLMD0 pin default level 63
SYStem.Option HoldReset Set reset hold time 63
SYStem.Option ICUS ICU-S enable 64
SYStem.Option IMASKASM Interrupt disable 65
SYStem.Option IMASKHLL Interrupt disable 65
SYStem.Option KEYCODE Keycode (G3Kx cores only) 65
SYStem.Option OCDID OnChipDebugID setting 66
SYStem.Option CFID CodeFlashID setting 66
SYStem.Option DFID DataFlashID setting 66
SYStem.Option OPtionByTe Option-byte setting 67
SYStem.Option OPtionByTe8 Option-byte setting 67
SYStem.Option PERSTOP Disable CPU peripherals if stopped 67
SYStem.Option RESetBehavior Set behavior when target reset detected 67
SYStem.Option RDYLINE RDY pin available 68
SYStem.Option SLOWRESET Timeout for ResetRiseTime 69
SYStem.Option WaitReset Set reset wait time 69
RH850 Debugger and Trace 3 ©1989-2019 Lauterbach GmbH

SYStem.Option (Exception Lines Enable) ...................................................................... 70
SYStem.Option CPINT CPINT line enable 70
SYStem.Option REQest Request line enable 70
SYStem.Option RESET Reset line enable 70
SYStem.Option STOP Stop line enable 71
SYStem.Option WAIT Wait line enable 71
CPU specific BenchMarkCounter Commands ................................................................ 72
BMC.<counter>.ATOB Enable event triggered counter start and stop 73
BMC.<counter>.EVENT Configure the performance monitor 74
BMC.<counter>.TRIGMODE BMC trigger mode 75
BMC.<counter>.TRIGVAL BMC trigger value 75
CPU specific TrOnchip Commands ................................................................................. 76
TrOnchip.CONVert Allow extension of address range of breakpoint 76
TrOnchip.EVTEN Enable ‘EVTO-’ trigger input (Aurora trace only) 77
TrOnchip.RESet Set on-chip trigger to default state 77
TrOnchip.SIZE Trigger on byte, word, long memory accesses 78
TrOnchip.state Display on-chip trigger window 78
TrOnchip.VarCONVert Convert breakpoints on scalar variables 79
Command Reference: NEXUS .......................................................................................... 81
NEXUS.BTM Program trace messaging enable 81
NEXUS.CoreENable Core specific trace configuration 81
NEXUS.CLIENT<x>.MODE Set data trace mode of nexus client 81
NEXUS.CLIENT<x>.SELECT Select a nexus client for data tracing 82
NEXUS.DTM Data trace messaging enable 82
NEXUS.OFF Disable NEXUS register access 83
NEXUS.ON Switch the NEXUS trace port on 83
NEXUS.PortMode Set NEXUS trace port frequency 83
NEXUS.PortSize Set trace port width 84
NEXUS.RESet Reset NEXUS trace port settings 84
NEXUS.SFT Software trace messaging enable 84
NEXUS.SUSpend Stall the program execution when FIFO full 84
NEXUS.SYNC Address-sync trace messaging enable 85
NEXUS.SyncPeriod Set period of timestamp sync messages 85
NEXUS.state Display NEXUS port configuration window 85
NEXUS.TimeStamps On-chip timestamp generation enable 86
Nexus specific TrOnchip Commands .............................................................................. 87
TrOnchip.Alpha Set special breakpoint function 87
TrOnchip.Beta Set special breakpoint function 88
TrOnchip.Charly Set special breakpoint function 88
TrOnchip.Delta Set special breakpoint function 89
TrOnchip.Echo Set special breakpoint function 89
Debug Connector .............................................................................................................. 90
RH850 Debugger and Trace 4 ©1989-2019 Lauterbach GmbH

Debug Connector 14 pin 100mil 90
Debug Connector 26 91
Trace Connectors and Adapters ...................................................................................... 92
Adapter for RH850 (LA-3561) 92
Parallel NEXUS Connector (Debug and Trace) 94
Aurora NEXUS SAMTEC 34-pin (Debug and Trace) 95
Aurora NEXUS SAMTEC 40-pin (Trace only) 96
Support ............................................................................................................................... 97
Available Tools 97
Compilers 104
Target Operating Systems 104
3rd-Party Tool Integrations 105
Products ............................................................................................................................. 106
Product Information 106
Debugger 106
Parallel Nexus Trace 108
High Speed Serial Nexus Trace (Aurora) 109
Order Information 110
Debugger 110
Parallel Nexus Trace 110
High Speed Serial Nexus Trace (Aurora) 111
RH850 Debugger and Trace 5 ©1989-2019 Lauterbach GmbH

RH850 Debugger and Trace
Version 06-Nov-2019
History
29-Jan-19 New option CSI for the command SYStem.CONFIG.DEBUGPORTTYPE. Revised command: NEXUS.OFF.
21-Dec-18 New command: SYStem.Option CFU.
12-Oct-18 New commands: SYStem.Option OCDID, SYStem.Option CFID, SYStem.Option DFID, TrOnchip.EVTEN, and NEXUS.SyncPeriod.
12-Oct-18 Revised commands: SYStem.CONFIG.EXTWDTDIS and SYStem.Option KEYCODE.
01-Aug-18 PowerTrace Serial details added. Descriptions of the new commands SYStem.Option WaitReset, SYStem.Option SLOWRESET, and SYStem.Option HoldReset.
28-May-18 Added section “Debugging the STOP and DeepSTOP Mode”. Revised the descriptions of the commands TrOnchip.CONVert and TrOnchip.VarCONVert.
19-Oct-17 Updated chapter “FLASH Programming Support”.
Introduction
This document describes the processor specific settings and features for RENESAS RH850.
Please keep in mind that only the Processor Architecture Manual (the document you are reading at the moment) is CPU specific, while all other parts of the online help are generic for all CPUs supported by Lauterbach. So if there are questions related to the CPU, the Processor Architecture Manual should be your first choice.
If some of the described functions, options, signals or connections in this Processor Architecture Manual are only valid for a single CPU or for specific family lines, the name(s) of the family/families is/are added in brackets.
Available Tools
This chapter gives an overview over available Lauterbach tools for the RH850 processors.
RH850 Debugger and Trace 6 ©1989-2019 Lauterbach GmbH

Debugger
Debugging RH850 requires a Lauterbach Debug Cable together with a Lauterbach PowerDebug Module.
To connect to the target the following Debug Cable can be used:
• JTAG Debugger for RH850 - LA-3719
The Debug Cable supports all debug interface modes of the RH850 (JTAG, LPD4, LPD1) plus SerialFlashProgramming.
The Debug Cable comes with a license for debugging.
Furthermore it is required to use a Debug Module from the POWER series, e.g.
• POWER DEBUG INTERFACE / USB 3
• POWER DEBUG INTERFACE / USB 2
• POWER DEBUG PRO
The DEBUG INTERFACE (LA-7701) does not support this processor series.
Software-only Debugger for XCP
TRACE32 supports debugging over a 3rd-party tool using the XCP protocol. For details see “XCP Debug Back-End” (backend_xcp.pdf).
SFT Trace
SFT trace (software trace) requires no extra Lauterbach hardware. Trace data can be saved to the On-chip trace or it can be streamed to the debug box in real time (LPD4 mode only). In streaming mode up to 32MRec of trace data can be recorded.
SFT-trace requires code instrumentation which typically is provided by the compiler tool. TRACE32 reads all SFT-trace symbol information from the loaded ELF file (currently only supported for Greenhills compiler).
Beside the display of SFT string messages, the display of function charts and calculation of runtime-statistics is supported.
On-chip Trace
On-chip tracing requires no extra Lauterbach hardware, it can be configured and read out with the regular debug hardware. On-chip tracing requires a trace license (LA-3734X).
RH850 Debugger and Trace 7 ©1989-2019 Lauterbach GmbH

High-Speed Serial Off-chip Trace (Aurora NEXUS)
Lauterbach offers off-chip trace solutions for the Aurora NEXUS trace port. Aurora is a high-speed serial interface defined by Xilinx.
Tracing can either be done with PowerTrace Serial 4 GigaByte RH850 (LA-3560) which supports up to 8 lanes, each at 12.5Gbps.
Or with Preprocessor RH850 HSTP HF-Flex and a PowerTrace II module. This configuration supports up to 4 lanes at a lower speed.
Parallel Off-chip Trace (parallel NEXUS)
Lauterbach offers an off-chip trace solution for processors with parallel NEXUS trace port.
Tracing requires the parallel preprocessor and a POWER TRACE II module.
• Preprocessor Focus II RH850 (LA-3918)
• Preprocessor RH850 (LA-3843)
Co-Processor Debugging (GTM)
Debugging the RH850 coprocessors GTM is included free of charge, i.e. there is no additional license required.
For details about coprocessor debugging, see the specific Processor Architecture Manuals:
• “GTM Debugger and Trace” (debugger_gtm.pdf)
Multicore Debugging
Lauterbach offers multicore debugging and tracing solutions, which can be done in two different setups: Symmetric Multiprocessing (SMP) and Asymmetric Multiprocessing (AMP). For details see chapter Multicore Debugging.
Multicore debugging of multiple RH850 cores requires the License for Multicore Debugging (MULTICORE).
RH850 Debugger and Trace 8 ©1989-2019 Lauterbach GmbH
Software Installation
Please follow chapter “Software Installation” (icd_quick_installation.pdf) on how to install the TRACE32 software:
• An installer is available for a complete TRACE32 installation under Windows. See “MS Windows” in ICD Quick Installation, page 23 (icd_quick_installation.pdf).
• For a complete installation of TRACE32 under Linux, see “PC_LINUX” in ICD Quick Installation, page 25 (icd_quick_installation.pdf).
Related Documents
• “GTM Debugger and Trace” (debugger_gtm.pdf): Debugging and tracing the Generic Timer Module (GTM).
• “Nexus Training” (training_nexus.pdf): Training for the NEXUS trace
• “Onchip/NOR FLASH Programming User’s Guide” (norflash.pdf): Onchip FLASH and off-chip NOR FLASH programming.
• “Debugger Basics - SMP Training” (training_debugger_smp.pdf): SMP debugging.
• “Application Note Benchmark Counter RH850” (app_rh850_bmc.pdf).
• “XCP Debug Back-End” (backend_xcp.pdf): Debugging over a 3rd-party tool using the XCP protocol.
RH850 Debugger and Trace 9 ©1989-2019 Lauterbach GmbH

Demo and Start-up Scripts
In your TRACE32 installation directory there is a subdirectory ~~/demo/rh850/ where you will find example scripts and demo software.
For getting started there are start-up scripts for various RH850 processors.
1. In TRACE32, choose File menu -> Run Script.
2. Navigate to ~~/demo/rh850/hardware/ and select your board and CPU.
The directory ~~/demo/rh850/ includes the following subdirectories:
Brief Overview of Documents for New Users
Architecture-independent information:
• “Debugger Basics - Training” (training_debugger.pdf): Get familiar with the basic features of a TRACE32 debugger.
• “T32Start” (app_t32start.pdf): T32Start assists you in starting TRACE32 PowerView instances for different configurations of the debugger. T32Start is only available for Windows.
• “General Commands” (general_ref_<x>.pdf): Alphabetic list of debug commands.
Architecture-specific information:
• “Processor Architecture Manuals”: These manuals describe commands that are specific for the processor architecture supported by your debug cable. To access the manual for your processor architecture, proceed as follows:
- Choose Help menu > Processor Architecture Manual.
• “OS Awareness Manuals” (rtos_<os>.pdf): TRACE32 PowerView can be extended for operating system-aware debugging. The appropriate OS Awareness manual informs you how to enable the OS-aware debugging.
• “XCP Debug Back-End” (backend_xcp.pdf): This manual describes how to debug a target over a 3rd-party tool using the XCP protocol.
hardware/ Ready-to-run debugging and flash programming demos. The demos are compiles to run in internal RAM and therefore can be used on any evaluation board and custom hardware.
flash/ Flash setup scripts and flash programming algorithm binaries for on-chip and external flash. See chapter FLASH programming for more information.
etc/ Examples for various RH850 related debugger features.
kernel/ Example scripts for RTOS support.
compiler/ Compiler examples.
RH850 Debugger and Trace 10 ©1989-2019 Lauterbach GmbH

Warning
Signal Level
The debugger output voltage follows the target voltage level. It supports a voltage range of 0.4 … 5.2 V.
ESD Protection
WARNING: To prevent debugger and target from damage it is recommended to connect or disconnect the debug cable only while the target power is OFF.
Recommendation for the software start:
1. Disconnect the debug cable from the target while the target power is off.
2. Connect the host system, the TRACE32 hardware and the debug cable.
3. Power ON the TRACE32 hardware.
4. Start the TRACE32 software to load the debugger firmware.
5. Connect the debug cable to the target.
6. Switch the target power ON.
7. Configure your debugger e.g. via a start-up script.
Power down:
1. Switch off the target power.
2. Disconnect the debug cable from the target.
3. Close the TRACE32 software.
4. Power OFF the TRACE32 hardware.
RH850 Debugger and Trace 11 ©1989-2019 Lauterbach GmbH

Useful Tips
Application Starts Running at SYStem.Up
Before TRACE32 can get control of the RH850, the cpu already has started the application startup code. This is a restriction of the RH850 core!
It depends on the executed startup code which peripherals are initialized and if this can cause trouble for the debugging session. E.g.
• enable watchdog
• enter power saving mode
• ECC errors …
To prevent unexpected side effects of unwanted code execution at SYStem.Up, an idle-loop should be placed to the reset exception handler.
What to do:
• Add some “NOP” instructions to the beginning of your “reset exception handler”
• One of the “NOP” instruction addresses should get a label
The “NOP” instructions are just place holders and can stay in your application code.
• For debugging a “jump-to-itself” instruction has to be patched to the “NOP-label” address
Patching example:
FLASH.ReProgram ALLData.LOAD.Elf <file> /<options> ; load application codeData.Assemble NOP-lable JR $-0 ; patch jump-to-itselfFLASH.Reprogram OFF
RH850 Debugger and Trace 12 ©1989-2019 Lauterbach GmbH

Greenhills Compiler
• Add the option “-dual_debug” to your compiler/linker settings to generate HLL debug information.
• Add the option “-No_Ignore_Debug_References” to your compiler/linker settings in case of missing HLL-Line information in the ELF file.
• Load the code with option /GHS example:
• The compiler can generates HLL line information which points to odd addresses. For TRACE32 the HLL line information and its address has priority, so it can happen the disassembly of certain code lines is terminated. In this case “/////////” is displayed. As workaround TRACE32 can ignore such HLL line information. Use command: sYmbol.CLEANUP.MidInstLines
• The compiler can generate bitfields in inverted order. Unfortunately the ELF files does not contain any information about the bit order in use. In case of wrong bit-variable display please use the option /ALTBITFIELDS when loading the code.
Stop Timers and Peripherals during application-break
Add following command to your script: SYStem.Option PERSTOP ON
Location of Debug Connector
Locate the debug connector as close as possible to the processor to minimize the capacitive influence of the trace length and cross coupling of noise onto the debug signals.
Reset Line
Ensure that the debugger signal RESET is connected directly to the RESET of the processor. This will provide the ability for the debugger to drive and sense the status of RESET.
Data.Load.Elf example.abs /GHS
Data.Load.Elf example.abs /GHS /ALTBITFIELDS
RH850 Debugger and Trace 13 ©1989-2019 Lauterbach GmbH

Debugging the STOP and DeepSTOP Mode
Ensure the application sets the register WUFMSK0[31] to “0” to enable the TDI debug line as a wake-up factor. This becomes important if the debugger should attach to an already running application which has entered the STOP- or DeepSTOP mode.
TRACE32 displays the message “running (stopmode)” in the state line if the RH850 device enters the STOP- or DeepSTOP-mode. The message will switch to “running (stop occurred)” as soon as there is a wake-up event.
Typically the wake-up is done by the application. Additionally there are several wake-up conditions which are caused by the debugger:
• Break (Break.direct)
• Real-time memory access, e.g.:
- A memory dump in a Data.dump E:<address> window
- A refresh of a Var.Watch window
• If breakpoints are changed (Break.Set or Break.Delete)
• When onchip trace is in ARM mode (<trace>.Arm or <trace>.Arm)
To prevent unintended wake-ups from the debugger side:
• Set the trace mode to <trace>.OFF or <trace>.DISable
• Disable real-time memory access with the command SYStem.MemAccess Denied
RH850 Debugger and Trace 14 ©1989-2019 Lauterbach GmbH

Configuration
System Overview
This figure shows an example of how to connect the TRACE32 hardware to your PC and your target board.
Target
DE
BU
G C
AB
LE
LA
UT
ER
BA
CH
Debug Cable
POWER DEBUG INTERFACE / USB 3
AC/DC Adapter
PC
USBCable
LAUTERBACHPOWER
SELECT
EMULATE
PODBUS OUT
US
B
PODBUS IN
DE
BU
G C
AB
LE
POWER7-9V
TRIG
POWER DEBUG USB INTERFACE / USB 3
Deb
ugC
onn
ecto
r
Windows / Linux / Mac OS
RH850 Debugger and Trace 15 ©1989-2019 Lauterbach GmbH
Single Core Debugging - Quick Start
In this section:
• Debug from Reset
• Connect to Running Program (Hot Plug-In)
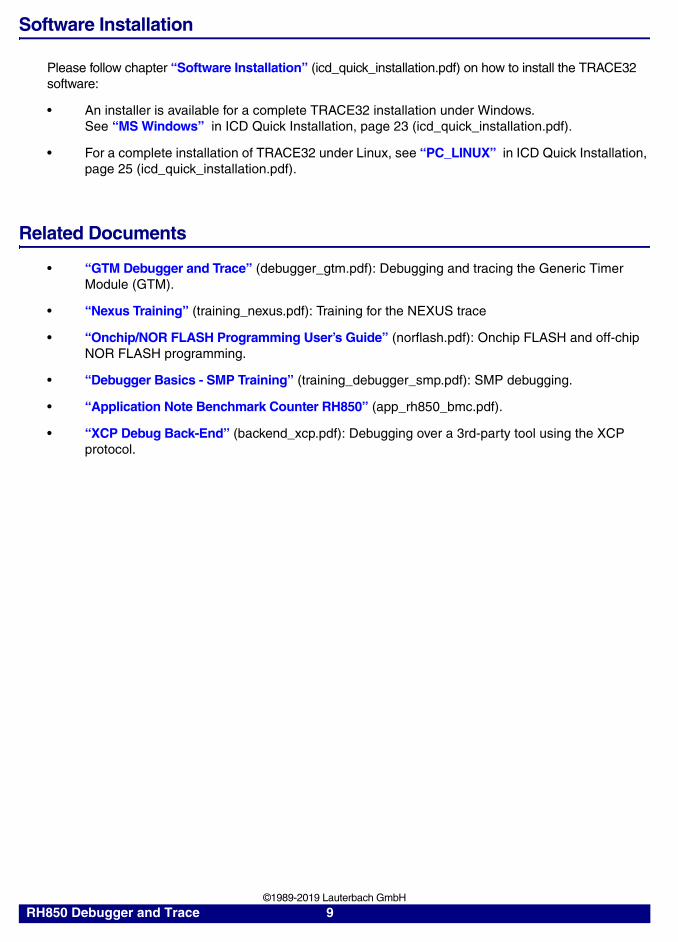
Debug from Reset
Starting up the Debugger is done as follows:
1. Select the device prompt B: for the ICD Debugger, if the device prompt is not active after the TRACE32 software was started.
2. Select the CPU type to load the CPU specific settings.
3. If the TRACE32-ICD hardware is installed properly, the following CPU is the default setting:
4. Tell the debugger where’s FLASH/ROM on the target.
This command is necessary for the use of on-chip breakpoints.
5. Enter debug mode
This command resets the CPU and enters debug mode. After this command is executed, it is possible to access the registers. Set the chip selects to get access to the target memory.
6. Load the program.
B:
SYStem.CPU R7F701035
JTAG Debugger for RH850 R7F701035
MAP.BOnchip 0x00000000++0x7FFFF
SYStem.Up
Data.Set…
Data.LOAD.ubrof sieve.d85 ; (ubrof specifies the format,; sieve.d85 is the file name)
RH850 Debugger and Trace 16 ©1989-2019 Lauterbach GmbH

The option of the Data.LOAD command depends on the file format generated by the compiler. For information on the compiler options refer to the section Compiler. A detailed description of the Data.LOAD command is given in the “General Commands Reference”.
The start-up can be automated using the programming language PRACTICE. A typical start sequence is shown below. This sequence can be written to a PRACTICE script file (*.cmm, ASCII format) and executed with the command DO <file>.
*) These commands open windows on the screen. The window position can be specified with the WinPOS command.
B:: ; Select the ICD device prompt
WinCLEAR ; Delete all windows
MAP.BOnchip 0x000000++0x07ffff ; Specify where’s FLASH/ROM
SYStem.CPU R7F701035 ; Select the processor type
SYStem.Up ; Reset the target and enter debug; mode
Data.Load.ubrof sieve.d85 ; Load the application
Register.Set PC main ; Set the PC to function main
Data.List ; Open disassembly window *)
Register.view /SpotLight ; Open register window *)
Frame.view /Locals /Caller ; Open the stack frame with ; local variables *)
Var.Watch %Spotlight flags ast ; Open watch window for variables *)
PER.view ; Open window with peripheral ; register *)
Break.Set sieve ; Set breakpoint to function sieve
Break.Set 0x1000 /Program ; Set on-chip breakpoint to address; 1000 (address 1000 is in FLASH); (Refer to the restrictions in; On-chip Breakpoints.)
Break.Set 0xFEDF8000 /Program ; Set software breakpoint to address; 0xFEDF8000 (address 0xFEDF8000 is in ; RAM)
RH850 Debugger and Trace 17 ©1989-2019 Lauterbach GmbH

Connect to Running Program (Hot Plug-In)
Hot plug-in is only supported for JTAG and LPD4 debug mode. Follow these steps to attach the debugger to a running system:
1. Select the right debug-interface mode, set the Debug Cable to tri-state mode and connect it to the target.
2. Select the target processor.
3. Load debug symbols.
4. Start debug session without resetting core.
5. Observe variables or memory.
6. Set breakpoints or halt core.
7. Display ASM/HLL core at current instruction pointer
For information about SMP and AMP debugging, see “Multicore Debugging”, page 31.
SYStem.CONFIG.DEBUGPORTTYPE LPD4SYStem.Mode.NoDebug
SYStem.CPU R7F701035
Data.LOAD.ELF project.x /NoCODE
SYStem.Mode.Attach
Var.View %E my_var your_varData.Dump E:0x40000100
Break.Set my_func /Onchip
Break
List
RH850 Debugger and Trace 18 ©1989-2019 Lauterbach GmbH
Troubleshooting
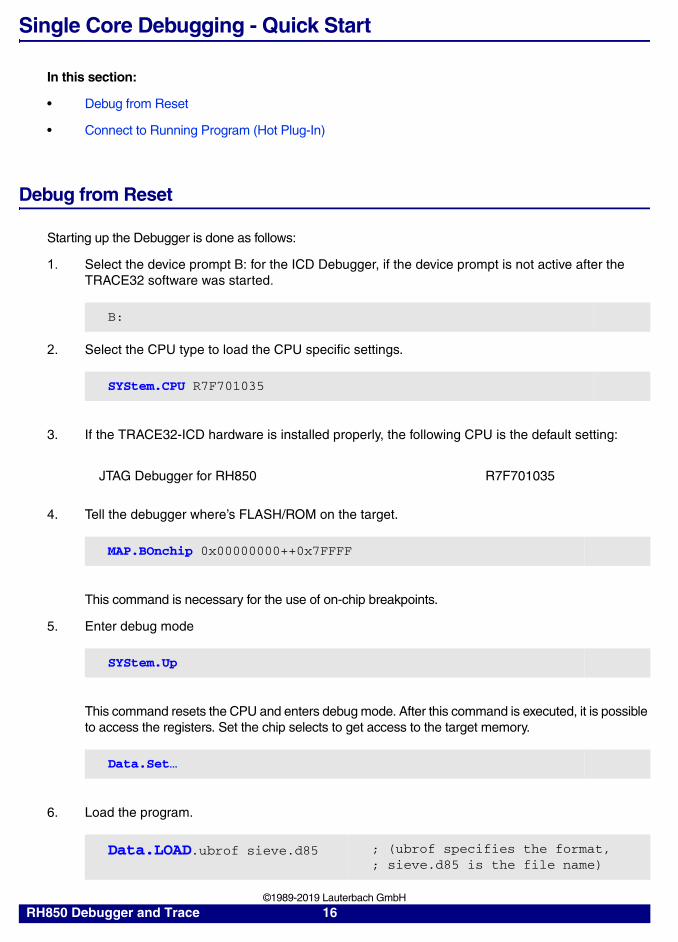
SYStem.Up Errors
The SYStem.Up command is the first command of a debug session where communication with the target is required. If you receive error messages while executing this command this may have the following reasons.
All The target has no power.
All The target is in reset:The debugger controls the processor reset and use the RESET line to reset the CPU on every SYStem.Up.
All There are additional loads or capacities on the debug lines.
All DEBUGPORTTYPE selection does not match the Debug-Interface-Mode setting of the OptionBytes.
All Wrong OSCCLOCK, CORECLOCK or BAUDRATE setting (LPD4, U, CSI mode)
All JTAG clock (JTAG mode) too high.
RH850 Debugger and Trace 19 ©1989-2019 Lauterbach GmbH

FAQ
Debugging via VPN
Ref: 0307
The debugger is accessed via Internet/VPN and the performance is very slow. What can be done to improve debug performance?
The main cause for bad debug performance via Internet or VPN are low data throughput and high latency. The ways to improve performance by the debugger are limited:
In PRACTICE scripts, use "SCREEN.OFF" at the beginning of the scriptand "SCREEN.ON" at the end. "SCREEN.OFF" will turn off screenupdates. Please note that if your program stops (e.g. on error) without exe-cuting "SCREEN.OFF", some windows will not be updated.
"SYStem.POLLING SLOW" will set a lower frequency for target statechecks (e.g. power, reset, jtag state). It will take longer for the debugger torecognize that the core stopped on a breakpoint.
"SETUP.URATE 1.s" will set the default update frequency ofData.List/Data.dump/Variable windows to 1 second (the slowest possiblesetting).
Prevent unneeded memory accesses using "MAP.UPDATEONCE<address_range>" for RAM and "MAP.CONST <address_range>" forROM/FLASH. Address ranged with "MAP.UPDATEONCE" will read thespecified address range only once after the core stopped at a breakpoint ormanual break. "MAP.CONST" will read the specified address range onlyonce per SYStem.Mode command (e.g. SYStem.Up).
RH850 Debugger and Trace 20 ©1989-2019 Lauterbach GmbH

Setting a Software Breakpoint fails
Ref: 0276
What can be the reasons why setting a software breakpoint fails?
Setting a software breakpoint can fail when the target HW is not able to implement the wanted breakpoint. Possible reasons:
The wanted breakpoint needs special features that are only possible torealize by the trigger unit inside the controller.
Example: Read, write and access (Read/Write) breakpoints ("type" in Break.Set window). Breakpoints with checking in real-time for data-values ("Data"). Breakpoints with special features ("action") like TriggerTrace, TraceEnable, TraceOn/TraceOFF.
TRACE32 can not change the memory.Example: ROM and Flash when no preparation with FLASH.Create, FLASH.TARGET and FLASH.AUTO was made. All type of memory if the memory device is missing the necessary control signals like WriteEnable or settings of registers and SpecialFunctionRegisters (SFR).
Contrary settings in TRACE32.Like: MAP.BOnchip for this memory range. Break.SELect.<breakpoint_type> Onchip (HARD is only available for ICE and FIRE).
RTOS and MMU:If the memory can be changed by Data.Set but the breakpoint doesn't work it might be a problem of using an MMU on target when setting the breakpoint to a symbolic address that is different than the writable and intended memory location.
Debugging RH850 with the V850 debug cable
Ref: 0463
Is it possible to debug RH850 using JTAG-V850 N-Wire Debugger for V850?
No, a different cable is needed. However, it is possible to debug V850 using JTAG-RH850 Debugger. You can find the adequate debug/trace solution by entering the name of your chip in the search bar of Lauterbach website.
RDY signal for RH850
Ref: 0464
What is the impact of disabling this RDY pin in RH850 target?
The RDY- signal is a CPU-output-signal which informs TRACE32 when the CPU can accept the next JTAG command. The CPU informs the debugger that it is "READY" for execution of the next command. If SYStem.Option.RDYLINE is OFF, TRACE32 gets the "ready-status" by polling a CPU debug register. This polling-sequence is slower than reading the RDY- signal directly. The performance loss is around 10%. There are no restrictions on debug functionality, all can be done with and without RDY- line.
Unstable Flash memory contents
Ref: 0465
When displaying the content of the Data-Flash on my RH850 device, the values in some address are not stable.
For RH850, "toggling values" is the normal behavior for not-programmed Data-Flash. Reading these addresses will return undefined results. This is also described in the CPU User-Manual.
RH850 Debugger and Trace 21 ©1989-2019 Lauterbach GmbH

Debugging
RH850 Debug Interface Modes
The RH850 offers three Debug Interface Modes (JTAG, LPD1, LPD4) plus the SerialFlashProgramming mode by use of the same debug connection.
• The DebugInterface modes are selected by the setting of the CPU OptionBytes.
• The SerialFlashProgramming mode is activated by the voltage level at pin FLMD0.
TRACE32 supports all debug interface modes and SerialFlashProgramming mode.
If TRACE32 can not connect to the CPU it might be necessary to modify the Option-Byte settings or the TRACE32 “DebugPortType” setting. Option Byte programming can be done in SerialFlashProgramming mode only (see below).
JTAG Mode
• Full debug/trace support
• Scripts can be found in the ~~/demo/rh850/flash, ~~/demo/rh850/compiler and ~~/demo/rh850/hardware folders
• CPU-limitation: No flashprogramming of the UserBootMat, no OptionByte programming
• TRACE32 command: SYStem.CONFIG DEBUGPORTTYPE JTAG (default)
LPD4 Mode
• Same functions/limitations as in JTAG mode
• TRACE32 command: SYStem.CONFIG DEBUGPORTTYPE LPD4
• Interface baud rate has to be defined with command SYStem.BAUDRATE <value>
NOTE: • Option-Bytes programming is only supported in SerialFlashProgramming mode (UART)!
• UserBootMat FlashProgramming is only supported in SerialFlashPro-gramming mode (UART)!
RH850 Debugger and Trace 22 ©1989-2019 Lauterbach GmbH

LPD1 Mode
• Same functions/limitations as in JTAG mode
• TRACE32 command: SYStem.CONFIG DEBUGPORTTYPE LPD1
• Interface baud rate is detected/configured automatically
• There are RH850 CPU versions which do not support LPD1 mode!
UART Mode
• For serial flash programming and OptionByte programming (no debugging!)
• All CPU internal flashes can be programmed
TRACE32 is configured with the commands:
• SYStem.CONFIG DEBUGPORTTYPE UART/UART1
• SYStem.Mode Prepare
• Special FLASH.List table (differs in programming method)
Setup script: use pull down RH850->AutoSetup->AutosSetup for SerialFlashProgramming
The script opens a dialog window which asks for some target specific parameters
• OSC clock (target-crystal)
• CPU clock (cpu-system-clock)
• UART baud rate
In the scripts you can find some example setting which were working well with the Renesas evaluation boards.
Before flash and/or Option-Byte programming, please verify serial communication works well.
Check communication
After command SYStem.Mode Prepare
• Use pull-down-menu “view\message-area”.
• Check the messages of the AREA window.
• The SIGNATURE line shows the detected CPU type (e.g. “R7F701Z00”).
• If the SIGNATURE is wrong --> check clock and baud rate settings and try again.
RH850 Debugger and Trace 23 ©1989-2019 Lauterbach GmbH

OptionByte Programming
The Option-Bytes are described in the CPU User Manual. For programming use command: SYStem.Option OPBT <opbt0>....<opbt7>
RH850/F1x --> OPBT0, bit30 and bit29 (JTAG=y11, LPD1=y10, LPD4=y01)
RH850/E1x --> OPBT2, bit30 and bit29 (JTAG=y11, LPD1=y10, LPD4=y01)
The Option-Bytes are programmed immediately, they become effective at the next RESET (SYStem.Up).
NOTE: SerialFlash-Programming mode is only needed if the Option-Bytes or UserBootFlash has to be modified. All other debugging stuff and flash programming can be done in JTAG, LPD1 or LPD4 mode.
RH850/F1x WS1.0 and RH850/E1x FCC (R7F701Z00) do not support Flash-READ in SerialFlash-Programming mode!
RH850 Debugger and Trace 24 ©1989-2019 Lauterbach GmbH

Breakpoints
There are two types of breakpoints available: Software breakpoints (SW-BP) and on-chip breakpoints (HW-BP).
Software Breakpoints
Software breakpoints are the default breakpoints. A special breakcode is patched to memory so it only can be used in RAM or FLASH areas.There is no restriction in the number of software breakpoints.
Onchip Breakpoints
Each core of a RH850 device is equipped with 12 Onchip breakpoints. These breakpoints only can be set if the RH850 has stopped program execution.
The following list gives an overview of the usage of the on-chip breakpoints by TRACE32:
Number of Onchip-Breaks
ProgramBreaks Read/Write Breaks DataValue Breaks
12 for each Processor-Element (core)
12range as bitmask
- include/exclude
12range as bitmask
break before make
- include/exclude- read/write- size ANY/8/16/32
12range as bitmask
RH850 Debugger and Trace 25 ©1989-2019 Lauterbach GmbH

Breakpoint in ROM
With the command MAP.BOnchip <range> it is possible to inform the debugger about ROM (FLASH,EPROM) address ranges in target. If a breakpoint is set within the specified address range the debugger automatically uses the available on-chip breakpoints.
Example for Breakpoints
The following breakpoint combinations are possible.
Software breakpoints:
On-chip breakpoints:
Break.Set 0x100000 /Program ; Software breakpoint 1
Break.Set 0x101000 /Program ; Software breakpoint 2
Break.Set 0x100 /Program ; On-chip breakpoint 1
Break.Set 0x0ff00 /Program ; On-chip breakpoint 2
RH850 Debugger and Trace 26 ©1989-2019 Lauterbach GmbH
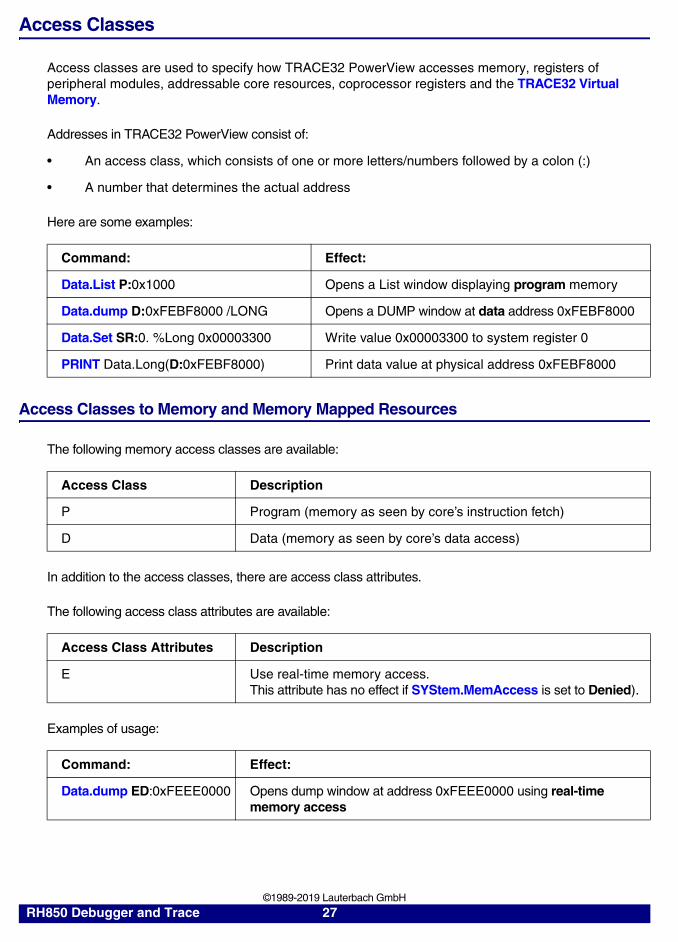
Access Classes
Access classes are used to specify how TRACE32 PowerView accesses memory, registers of peripheral modules, addressable core resources, coprocessor registers and the TRACE32 Virtual Memory.
Addresses in TRACE32 PowerView consist of:
• An access class, which consists of one or more letters/numbers followed by a colon (:)
• A number that determines the actual address
Here are some examples:
Access Classes to Memory and Memory Mapped Resources
The following memory access classes are available:
In addition to the access classes, there are access class attributes.
The following access class attributes are available:
Examples of usage:
Command: Effect:
Data.List P:0x1000 Opens a List window displaying program memory
Data.dump D:0xFEBF8000 /LONG Opens a DUMP window at data address 0xFEBF8000
Data.Set SR:0. %Long 0x00003300 Write value 0x00003300 to system register 0
PRINT Data.Long(D:0xFEBF8000) Print data value at physical address 0xFEBF8000
Access Class Description
P Program (memory as seen by core’s instruction fetch)
D Data (memory as seen by core’s data access)
Access Class Attributes Description
E Use real-time memory access.This attribute has no effect if SYStem.MemAccess is set to Denied).
Command: Effect:
Data.dump ED:0xFEEE0000 Opens dump window at address 0xFEEE0000 using real-time memory access
RH850 Debugger and Trace 27 ©1989-2019 Lauterbach GmbH

If an access class attribute is specified without an access class, TRACE32 PowerView will automatically add the default access class of the used command. For example, Data.List E:0x100 is complemented to Data.List EP:0x100.
Access Classes to Other Addressable Core and Peripheral Resources
The following access class is used to access system registers which are not mapped into the processor’s memory address space.
The RH850 supports 256 System Registers which are divided into 8 groups (selID) with 32 registers (regID) each.
Example: The ISPR register has a regID==10 and selID==2
Using the SR: access class the System Register address is defined by:
• Addressbit(4..0) = regID
• Addressbit(7..5) = selID
So the ISPR register can be accessed by commands:
The following access class is used to access chip internal debug registers. Use this only if requested by Lauterbach! Accessing debug registers (read or write) without the background knowledge of their functionality may have bad influence for debugging up to TRACE32 crash.
Access Class Description
SR System Register (SR) access
Data.dump SR:0x4A++0 /Long ;dump window showing the ISPR ;register value
PRINT Data.Long(SR:0x4A) ;print ISPR register value to ;status line
Data.Set SR:0x4A %Long 0x11223344 ;set ISPR register with value ;0x11223344
Access Class Description
DBG: Debug-Register access
EDBG: use real-time Debug-Register access
RH850 Debugger and Trace 28 ©1989-2019 Lauterbach GmbH

Each RH850 core (also called ProcessorElemet PEx) has it’s own set of debug registers. Each set can have up to 8 banks with 256 registers each.
• Address bits(7..0) = IR register number
• Address bit(11..8) = Bank number
• Address bit(12) = select JCU register-set
• Address bit(26..13) = select PE(14..1) register-set
• Address bit(27) = select broadcast access to all assigned cores (for write access only)
• Address bit(31..28) = DBG Sub-Access-Class (set to 0x1 always)
Data.Set DBG:0x100024AB %Long 0x12 ;write 0x12 to debug-register:;- ProcessorElement PE1;- Bank=0x4;- IR=0xAB
PRINT Data.Long(EDBG:0x100024AB) ;- print debug-register value to; status line;- uses real-time access to read; the value
RH850 Debugger and Trace 29 ©1989-2019 Lauterbach GmbH

Support for Peripheral Modules
TRACE32 supports access to the memory mapped registers of all peripheral modules. The peripheral register description files (*.per, so-called PER-files) for the on-chip peripherals are included in TRACE32. PER files for recent processors are usually not included in updates, but are available upon request.
For external peripherals and/or custom peripherals, it is possible to create additional PER files with custom content. See “Peripheral Files Programming Commands” (per_prog.pdf) for details.
Runtime Measurement
If the device is equipped with an Onchip- or Offchip-Trace then typically the trace recordings are used for function-run-time and function-nesting analysis.
For devices without any trace, the Onchip BenchMarkCounters can be used for core-clock accurate measurements of the min-, max- and average- runtimes. It is also possible to stop the program execution if the runtime exceeds a predefined min- or max- value.
Beside that, the debuggers RunTime.state window gives detailed information about the complete runtime of the application code and the runtime since the last Go, Step, Step.Over command. Runtime measurement is done with a resolution of about 5 µs.
RH850 Debugger and Trace 30 ©1989-2019 Lauterbach GmbH

Multicore Debugging
One or more cores (RENESAS terminology: “ProcessorElement” or “PEx”) can be assigned to a TRACE32 PowerView instance. The cores are referred to by it’s “ProcessorElement” index PE1 to PE6
TRACE32 supports either controlling each core with a separate PowerView instance (AMP debugging) or controlling multiple cores with a single PowerView instance (SMP debugging). SMP debugging is only possible for cores of the same architecture.
TRACE32 also supports mixed AMP/SMP operation. E.g. RH850/P1x-C devices can be controlled with two PowerView instances, one for PE5_core (ICU-M) and one controlling PE1_core and PE2_core in SMP mode.
SMP Debugging
In TRACE32 terminology, SMP debugging means to control more than one core in a single PowerView instance. Use this method for cores which run the same kernel / instance of the operating system. Cores controlled in a single PowerView instance share the following resources:
• Debug symbols
• OS Awareness
• Run control (Go, Step, Break) and breakpoints
• Debug and trace settings
If it is desired to have control over any of the above resources separately for each core, AMP debugging must be used.
Follow these steps to set up the debugger for SMP debugging:
1. Select the target processor, or use automatic CPU detection.
2. Assign cores to this PowerView instance
3. Start debug session and continue as usual.
SYStem.DETECT CPU
;CORE.ASSIGN <logical_core_0> <logical_core_1> [...]; assign PE1 to logical_core_0; assign PE3 to logical_core_1
CORE.ASSIGN 1 3
SYStem.Up ; connect to core PE1SYStem.Mode.Attach ; connect to core PE2
RH850 Debugger and Trace 31 ©1989-2019 Lauterbach GmbH

All core context dependent windows (Register, List, Dump, etc.) show the data as seen from the currently selected core. Select a core using the command CORE.select <logical_core_index>.
If any of the cores hits a breakpoint, PowerView automatically selects the core that hit the breakpoint. The currently selected core displayed in the status bar and can be changed by right-clicking on the core field.
It is also possible to show more than one core context at the same time, using the option /Core <logical_core_index>. All windows with core-dependent information support this option.
Example scripts for SMP debugging can be found in the demo folder.
• ~~/demo/rh850/hardware/
Further demo scripts available for download and upon request.
Register
CORE 0 ;Register window shows registers of PE1CORE 1 ;Register window shows registers of PE3
Register /CORE 0Register /CORE 1
List /CORE 0List /CORE 1
RH850 Debugger and Trace 32 ©1989-2019 Lauterbach GmbH

AMP Debugging
In AMP debugging mode, a separate PowerView instance is started for each core. The individual instances are completely independent of each other, but it is possible to synchronize run-control and system mode changes (see command SYnch).
An easy way to start multiple PowerView instances is to use T32Start. It is also possible to start further instances from a PRACTICE script.
The following steps demonstrate the setup for AMP debugging, assuming that the application is already programmed to FLASH:
1. Select the target processor, or use automatic CPU detection.
2. Assign target cores to the individual instances. Use either “SYStem.CONFIG.CORE <core_index> <chip_index>” or “CORE.ASSIGN <core_index>”. The parameter <chip_index> must be the same for all cores on the same chip.
3. SYStem.CONFIG.Slave must be OFF for the core that starts running right form reset. Set to ON for all other cores (that are released later by the first core).
4. Load debug symbols on both instances.
5. Start debug session: SYStem.Up for the core that runs right from reset. SYStem.Mode.Attach for all cores that are started later.
6. Core_0 is halted at the reset address and core_1 remains in reset, In order to halt core_1 as soon as it is released from reset, issue the Break command.
;core_0 (PE1) script: ; core_1 (PE3) script:
SYStem.CPU R7F701Z07 SYStem.CPU R7F701Z07
; core_0 (PE1) script: ; core_1 (PE3) script:
SYStem.CONFIG.CORE 1. 1. SYStem.CONFIG.CORE 3. 1.
SYStem.CONFIG.Slave OFF SYStem.CONFIG.SLAVE ON
Data.LOAD appl.x /NoCODE Data.LOAD appl.x /NoCODE
SYStem.Up SYStem.Mode.Attach
Break
RH850 Debugger and Trace 33 ©1989-2019 Lauterbach GmbH

7. Start core_0. Core_1 will halt at its reset address after being released by core_0.
Example scripts for AMP debugging can be found in the demo folder.
• ~~/demo/rh850/hardware/
Go WAIT !RUN() ; wait until cpu stops
RH850 Debugger and Trace 34 ©1989-2019 Lauterbach GmbH

FLASH Programming Support
Before Flash programming can work TRACE32 has to be informed about the CPU's flash memory mapping. This is done with the demo scripts in the ~~/demo/rh850/flash directory or by use of the TRACE32 AutoSetup.
AutoSetup offers a convenient way to connect to RH850 single-core devices and to configure TRACE32 for flash programming.
• Please click the pull-down menu RH850->AutoSetup
• Select AutoSetup for Debugging or AutoSetup for SerialFlashProgramming -> press OK.
• Finally you will be asked if flash-programming should be done
The found configuration can be saved with command: STOre <file>.cmm SYStem FLASH
The TRACE32 message area (command AREA) presents all information which was read out of the CPU and all executed TRACE32 configuration commands. In case the setup fails, please have a look to the AREA window to clarify why it did not work.
RH850 multi-core devices often require chip/application specific startup sequences. detection typically fails. Please have a look to the board specific scripts which can be found in the directory ~~/demo/rh850/hardware/
For flash programming use following command sequence:
With FLASH.ReProgram ALL all code is loaded to a virtual memory first. This means you generate a “flash-image” in virtual memory which can be modified with additional code downloads or code-patches. At the same time the data is compared against the current flash content.
In the FLASH.List window all modified flash-segments are marked as “pending”. Only this flash-segments will be erased/programmed.
FLASH.ReProgram ALL ; enable flash programming
Data.Load.Elf output/example.abs /GHS ; load application (here ; Greenhills compiler)
Data.Load...... /NoClear ; load more code (optional)
Data.Set... ; patch your code (optional)
FLASH.ReProgram OFF ; start flash-erase/program ; sequence
RH850 Debugger and Trace 35 ©1989-2019 Lauterbach GmbH
If the “flash-image” is complete use command FLASH.ReProgram OFF. Then all “pending” segments are erased and reprogrammed. The big advantage of this method is that only modified flash-segments are erased/programmed. Programming is quicker and programming-stress for the FLASH is reduced.
NOTE:
SerialFlashProgramming of “RH850-F1x WS1.0” and “RH850/E1x FCC (R7F701Z00)”
This devices do not support memory-read in UART mode. As result an UART-Error message is displayed in the AREA window. This is just for information and has no effect on flash programming. The Data.dump window is grayed out as long as no data is loaded to virtual-memory.
FlashProgramming and switching of the debug interface mode
The flash declaration of SerialFlashProgramming mode (UART) is different to the debug modes (JTAG, LPD4, LPD1)! When switching between the modes it is necessary to do a new flash declaration setup (use RH850->AutoSetup)!
RH850 Debugger and Trace 36 ©1989-2019 Lauterbach GmbH
Tracing
Processors of RH850 series implement a variety of trace modules. Depending on the module, the trace information is either stored on the processor or sent out through an external trace port. This section lists all available trace modules, their configuration options and examples.
SFT Trace via LPD4
In LPD4 debug interface mode the RH850 can transfer SFT-trace messages (software trace) to the debug box. No extra trace hardware or license is needed.
NEXUS On-chip Trace
Many processors of the RH850 family implement a feature to store the NEXUS messages of cores and peripheral trace clients into an on-chip trace memory.
Using the on-chip trace with just a debug cable (LA-3719) requires the on-chip trace license LA-3734X.
The on-chip trace license is not required if your tool in use contains one of the following parts:
• PowerTrace Serial 4 GigaByte RH850 (LA-3560)
• Serial Preprocessor RH850 (LA-3843)
• Preprocessor Focus II RH850 (LA-3918)
• Preprocessor RH850 (LA-3843)
The configuration of trace methods and clients is done through the NEXUS and TrOnchip command groups.
External Trace Ports (Parallel NEXUS/Aurora NEXUS)
NEXUS trace messages from cores and peripheral trace clients are conveyed off-chip via an external trace port. External trace ports are only provided by RH850 emulation devices.
Depending on the processor, the messages are sent through a high-speed serial connection (XILINX Aurora protocol) or through the parallel NEXUS AUX interface (MDO, MSEO, MCKO). Lauterbach offers the various trace tools to record and store the trace information
Trace tools for the high-speed serial connection:
• PowerTrace Serial 4 GigaByte RH850 (LA-3560)
• Serial Preprocessor RH850 (LA-3843) in conjunction with PowerTrace II
RH850 Debugger and Trace 37 ©1989-2019 Lauterbach GmbH

The TRACE32 online help provides a “PowerTrace Serial User´s Guide” (serialtrace_user.pdf), please refer to this manual if you are interested in details about PowerTrace Serial.
Trace tools for the parallel NEXUS AUX interface:
• Preprocessor Focus II RH850 (LA-3918) in conjunction with PowerTrace II
• Preprocessor RH850 (LA-3843) in conjunction with PowerTrace II
The TRACE32 online help provides a “AutoFocus User’s Guide” (autofocus_user.pdf), please refer to this manual if you are interested in details about Preprocessor Focus II .
The complete trace port configuration is done by TRACE32 automatically. No special settings are required.
Tracing the Program Flow
Tracing of the program flow is enabled by default.
Branch Trace Messaging (BTM)
This is the default method set in TRACE32. The processor is configured to send a trace message for indirect branches only. Information about direct branches and amount of executed instructions is sent in occasional resource full messages.
Setup of branch trace messaging:
Synchronization Trace Messaging (SYNC)
By default the NEXUS protocol uses an address compression algorithm to reduce the number of bytes per NEXUS message. From time to time a synchronization message is sent which holds the complete (non compressed) address of the program flow. For TRACE32 this message is the start for program flow reconstruction.
All recordings before the synchronization message are ignored because it is not possible to calculate the program flow. There are debug scenarios where you like to get a valid trace listing also for this “ignored” records. In this case the NEXUS.SYNC option can help.
If ON, each NEXUS message holds the complete address, the address compression is disabled.
Setup of branch sync tracing:
NEXUS.BTM ONNEXUS.SYNCH OFF
NEXUS.BTM ONNEXUS.SYNC ON
RH850 Debugger and Trace 38 ©1989-2019 Lauterbach GmbH

Note for OnchipTrace (optional bugfix):
There are RH850 devices with a bug in the NEXUS coding for Onchip-Trace. In case of flow-errors in the trace listing please set NEXUS.SYNC ON and try again.
Tracing of Data (read/write) Transactions
General data tracing is enabled using the command NEXUS.DTM. This command enables the data trace for the full address space. The amount of generated trace messages is usually too high to be sent through the trace port and the on-chip message FIFO will overflow.
The amount of generated trace messages can be reduced by defining address ranges for which data trace is generated. Up to four address ranges are possible.
Example: Data Trace with Address Range
Use TraceData to limit the data trace to an address range. Up to 8 address ranges per core are possible. TraceData has no impact on program trace messaging setting.
Another method of reducing trace data is event-triggered trace filtering.
;Enable data trace for read/write accesses to all peripherals Break.Set 0xC0000000--0xFFFFFFFF /ReadWrite /TraceData
;In addition to full program trace, enable data trace for read accesses;to the array flags NEXUS.BTM ON Var.Break.Set flags /Read /TraceData
RH850 Debugger and Trace 39 ©1989-2019 Lauterbach GmbH

Trace Filtering and Triggering with Debug Events
Event Breakpoints
Each core of a RH850 chip is equipped with 16 Event breakpoints. TRACE32 uses them for:
• Trace-recording control: TraceOn, TraceOff, TraceEnable, TraceData, WatchPoints
• Trigger control: TraceTrigger, BusTrigger, BusCount
The following list gives an overview of the usage of the Event breakpoints by TRACE32:
Event breakpoints are also supported for other Trace-Clients like GlobalRam, LocalRam, PeripheralBus.
Overview
Any Event Breakpoint can be configured to either trigger a watchpoint hit message, or to act as input event for selective tracing. TRACE32 offers a variety of features based on watchpoints.
Event Breakpoints are set using the command Break.Set, similar to breakpoints that halt the core, but additionally include an option to define the desired behavior:
Number of Event-Breaks
ProgramBreaks Read/Write Breaks DataValue Breaks
16 for each Processor-Element (core)
8or 4 ranges
8or 4 ranges
8range as bitmask
Number of Event-Breaks
ProgramBreaks Read/Write Breaks DataValue Breaks
4 for each client 4or 2 ranges
4range as bitmask
Break.Set <address>|<range> /<action> Define trace filter or trigger
RH850 Debugger and Trace 40 ©1989-2019 Lauterbach GmbH
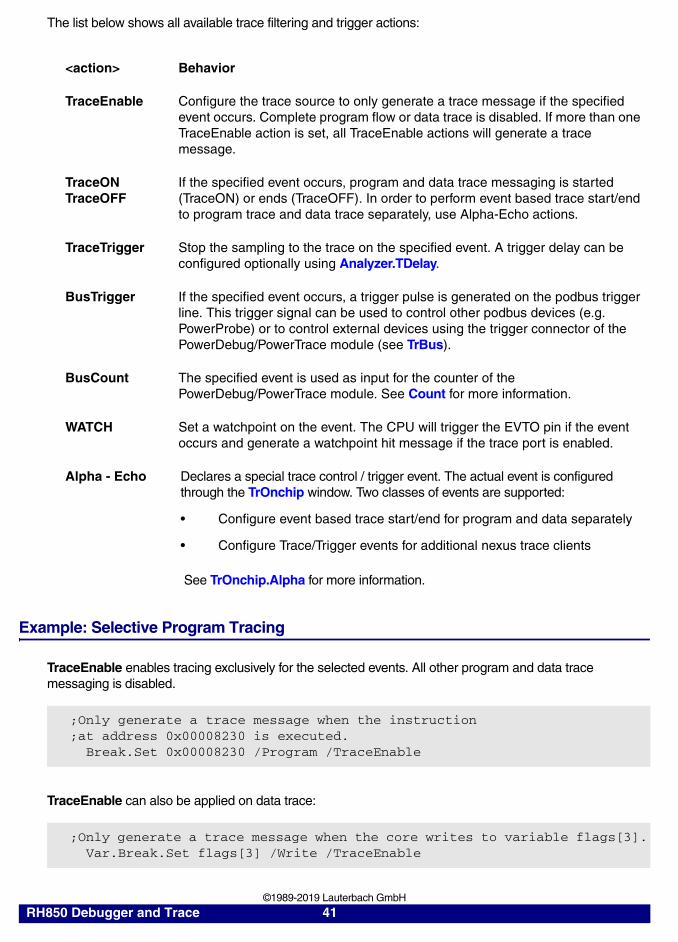
The list below shows all available trace filtering and trigger actions:
Example: Selective Program Tracing
TraceEnable enables tracing exclusively for the selected events. All other program and data trace messaging is disabled.
TraceEnable can also be applied on data trace:
<action> Behavior
TraceEnable Configure the trace source to only generate a trace message if the specified event occurs. Complete program flow or data trace is disabled. If more than one TraceEnable action is set, all TraceEnable actions will generate a trace message.
TraceONTraceOFF
If the specified event occurs, program and data trace messaging is started (TraceON) or ends (TraceOFF). In order to perform event based trace start/end to program trace and data trace separately, use Alpha-Echo actions.
TraceTrigger Stop the sampling to the trace on the specified event. A trigger delay can be configured optionally using Analyzer.TDelay.
BusTrigger If the specified event occurs, a trigger pulse is generated on the podbus trigger line. This trigger signal can be used to control other podbus devices (e.g. PowerProbe) or to control external devices using the trigger connector of the PowerDebug/PowerTrace module (see TrBus).
BusCount The specified event is used as input for the counter of the PowerDebug/PowerTrace module. See Count for more information.
WATCH Set a watchpoint on the event. The CPU will trigger the EVTO pin if the event occurs and generate a watchpoint hit message if the trace port is enabled.
Alpha - Echo Declares a special trace control / trigger event. The actual event is configured through the TrOnchip window. Two classes of events are supported:
• Configure event based trace start/end for program and data separately
• Configure Trace/Trigger events for additional nexus trace clients
See TrOnchip.Alpha for more information.
;Only generate a trace message when the instruction;at address 0x00008230 is executed. Break.Set 0x00008230 /Program /TraceEnable
;Only generate a trace message when the core writes to variable flags[3]. Var.Break.Set flags[3] /Write /TraceEnable
RH850 Debugger and Trace 41 ©1989-2019 Lauterbach GmbH

TraceEnable can be used for high precision time-distance measurements:
Example: Event Controlled Program/Data Trace Start and End
Program and data trace can be enabled and disabled based on debug events. TraceON and TraceOFF control both program and data trace depending on NEXUS.BTM / NEXUS.DTM setting. TraceON and TraceOFF control the message source, i.e. the core’s NEXUS module:
;Get start and end address of function to be measured &a1=sYmbol.BEGIN(func_to_measure) &a2=sYmbol.EXIT(func_to_measure)
;Only generate trace messages on the addresses used for measurement Break.Set &a1 /Program /TraceEnable Break.Set &a2 /Program /TraceEnable
;run application Trace.Init Go WAIT 5.s Break
;statistic analysis Trace.STATistic.AddressDURation &a1 &a2
;plot time distance over time (can take some time for analysis) Trace.PROFILECHART.DURATION /FILTERA ADDRess &a1 /FILTERB ADDRess &a2
NOTE: The analysis commands can also be used without TraceEnable breakpoints, but the measurement will be less precise.
;Enable program/data trace when func2 is entered;Disable program/data trace when last instruction of func2 is executed. Break.Set sYmbol.BEGIN(func2) /Program /TraceON Break.Set sYmbol.EXIT(func2) /Program /TraceOFF
;Enable program/data trace when variable flags[3] is written Var.Break.Set flags[3] /Write /TraceON
;Disable program/data trace data when 16-bit value 0x1122 is;written to address 0x40000230 Break.Set 0x40000230 /Write /Data.Word 0x1122 /TraceOFF
RH850 Debugger and Trace 42 ©1989-2019 Lauterbach GmbH

It is also possible to enable/disable program and data trace messaging separately:
Example: Event Controlled Trace Recording
Debug/trace events can also be used to trigger and stop the trace recording (i.e. message sink):
Example: Event Controlled Trigger Signals
TRACE32 can generate a trigger signal based on debug/trace events. The trigger signal can be used to control PowerProbe or PowerIntegrator, as well as with external tools (using the trigger connector)
;Enable program/data trace only when a specific task is active;NOTE: RTOS support must be set up correctly &magic=0x40001280 ;set &magic to the task of interest Break.Set task.config(magic) /Write /Data &magic /TraceON Break.Set task.config(magic) /Write /Data !&magic /TraceOFF
;Enable/disable only program trace based on events,;full data trace messaging NEXUS.DTM ReadWrite Break.Set func2 /Program /Onchip /Alpha TrOnchip.Alpha ProgramTraceON Var.Break.Set flags[8] /Read /Onchip /Beta TrOnchip.Beta ProgramTraceOFF
;In addition to full program trace, enable/disable data trace messaging;only for func2 NEXUS.BTM ON Break.Set sYmbol.BEGIN(func2) /Program /Onchip /Alpha TrOnchip.Alpha DataTraceON Break.Set sYmbol.EXIT(func2) /Program /Onchip /Beta TrOnchip.Beta DataTraceOFF
;Generate a trigger for the trace recording module when ;the specified event occurs. Trace recording stops delayed after;another 10% of the trace buffer size was recorded.; Break.Set sieve /Program /TraceTrigger Trace.TDelay 10%
;Generate PODBUS trigger signal on data write event with data value Var.Break.Set flags[9] /Write /Data.Byte 0x01 /BusTrigger
;forward signal to trigger connector TrBus.Connect Out TrBus.Mode High
RH850 Debugger and Trace 43 ©1989-2019 Lauterbach GmbH

Example: Event Counter
There is also a built-in event counter which can be used to count debug/trace events or to measure the event frequency:
Tracing Peripheral Modules / Bus Masters
Many processors support tracing of peripheral bus master trace clients, e.g. DMA or GlobalRam controllers. The clients are controlled with the NEXUS.CLIENT<x> commands.
As for the core’s data trace, the amount of generated trace messages is usually too high to be sent through the trace port and the on-chip message FIFO will overflow.
;Measure the execution frequency of function sieve Break.Set sieve /Program /BusCount Count.Mode Frequency Count.Gate 1.s ;measure for 1 second Go ;run application Count.Go ;start measurement PRINT "sieve freq = "+FORMAT.DECIMAL(1.,Count.VALUE()/1000.)+"Hz" Count.state ;open event counter window
RH850 Debugger and Trace 44 ©1989-2019 Lauterbach GmbH

SFT Software Trace
The use of SFT software trace requires code instrumentation done by users or OS vendors. Dedicated assembler instructions (DBCP, DBTAG, DBPUSH) are added to the code. When executed by the CPU, program counter values, immediate data or general purpose register values are output. These messages can be stored to the On-chip trace buffer or can be transferred in real time to the debug box by use of the LPD4 debug port interface.
When using a GREENHILLS compiler, TRACE32 can extract all SFT-symbol information from the loaded ELF file. The symbol information can be displayed with command sYmbol.List.PATCH.
The “enable” row shows the status of the SFT code instrumentation. If there is a checkmark the instrumentation code is active, if there is none the original instrumentation code is patched by NOP instructions and no SFT message is generated. A simple mouse-click to the checkmark enables/disables the instrumentation code.
SFT Software Trace to On-chip Trace
SFT recording is enabled by command: NEXUS.SFT ON
All other message types like branch-trace (BTM) or data-trace (DTM) should be set to OFF.
All windows related to the SFT recordings are opened with the command prefix “SFTT”.
e.g.:
SFTT.List
SFTT.Chart
Demo scripts can be found in the TRACE32 installation subdirectory ~~/demo/rh850/etc/sft_trace/
Use: demo_sfttrace.cmm
RH850 Debugger and Trace 45 ©1989-2019 Lauterbach GmbH

SFT Software Trace via LPD4 debug port
When using SFT Software Trace the LPD4 debug interface has two different operating modes.
• Debug mode as long as application code has stopped
• SFT trace mode as long as application code is executed
As a consequence real-time memory access is not supported during code execution. Breakpoint hits are detected by TRACE32 and the LPD4 debug interface is automatically switched back to debug mode.
Setup:
• SFT recording is enabled by command: SNOOP.SFT ON
• Onchip-Trace has to be disabled by command: Onchip.DISable
• Select the highest possible LPD4 baud rate to get good trace performance.
All windows related to the SFT recordings are opened with the command prefix “SNOOP”.
e.g.:
SNOOP.List
SNOOP.Chart
Demo scripts can be found in the TRACE32 installation subdirectory ~~/demo/rh850/etc/sft_trace/
Use: demo_sftsnoop.cmm
RH850 Debugger and Trace 46 ©1989-2019 Lauterbach GmbH

CPU specific SYStem Commands
SYStem.BAUDRATE Baudrate setting
Default baudrate: 9600bps.
Baudrate setting for SerialFlashProgramming mode and LPD4 debug mode:
• Maximum baudrate SerialFlashProgramming: 5000Kbps
• Maximum baudrate LPD4: 32000Kbps
SYStem.CONFIG.state Display target configuration
Opens the SYStem.CONFIG.state window, where you can view and modify most of the target configuration settings. The configuration settings tell the debugger how to communicate with the chip on the target board and how to access the on-chip debug and trace facilities in order to accomplish the debugger’s operations.
Alternatively, you can modify the target configuration settings via the TRACE32 command line with the SYStem.CONFIG commands. Note that the command line provides additional SYStem.CONFIG commands for settings that are not included in the SYStem.CONFIG.state window.
Format: SYStem.BAUDRATE [<baudrate>]
Format: SYStem.CONFIG.state [/<tab>]
<tab>: DebugPort | Jtag | XCP
<tab> Opens the SYStem.CONFIG.state window on the specified tab. For tab descriptions, see below.
DebugPort Informs the debugger about the debug connector type and the communication protocol it shall use.
Jtag Informs the debugger about the position of the Test Access Ports (TAP) in the JTAG chain which the debugger needs to talk to in order to access the debug and trace facilities on the chip.
RH850 Debugger and Trace 47 ©1989-2019 Lauterbach GmbH

SYStem.CONFIG Configure debugger according to target topology
The four parameters IRPRE, IRPOST, DRPRE, DRPOST are required to inform the debugger about the TAP controller position in the JTAG chain, if there is more than one core in the JTAG chain (e.g. ARM + DSP). The information is required before the debugger can be activated e.g. by a SYStem.Up. See Daisy-chain Example.For some CPU selections (SYStem.CPU) the above setting might be automatically included, since the required system configuration of these CPUs is known.
TriState has to be used if several debuggers (“via separate cables”) are connected to a common JTAG port at the same time in order to ensure that always only one debugger drives the signal lines. TAPState and TCKLevel define the TAP state and TCK level which is selected when the debugger switches to tristate mode. Please note: nTRST must have a pull-up resistor on the target, TCK can have a pull-up or pull-down resistor, other trigger inputs need to be kept in inactive state.
XCP Lets you configure the XCP connection to your target.
For descriptions of the commands on the XCP tab, see “XCP Debug Back-End” (backend_xcp.pdf).
Format: SYStem.CONFIG <parameter> <number_or_address>SYStem.MultiCore <parameter> <number_or_address> (deprecated)
<parameter>: CORE <core>
<parameter>:(JTAG):
DRPRE <bits>DRPOST <bits>IRPRE <bits>IRPOST <bits>TAPState <state>TCKLevel <level>TriState [ON | OFF]Slave [ON | OFF]
Multicore debugging is not supported for the DEBUG INTERFACE (LA-7701).
RH850 Debugger and Trace 48 ©1989-2019 Lauterbach GmbH

CORE For multicore debugging one TRACE32 PowerView GUI has to be started per core. To bundle several cores in one processor as required by the system this command has to be used to define core and processor coordinates within the system topology.Further information can be found in SYStem.CONFIG.CORE.
DRPRE (default: 0) <number> of TAPs in the JTAG chain between the core of interest and the TDO signal of the debugger. If each core in the system contributes only one TAP to the JTAG chain, DRPRE is the number of cores between the core of interest and the TDO signal of the debugger.
DRPOST (default: 0) <number> of TAPs in the JTAG chain between the TDI signal of the debugger and the core of interest. If each core in the system contributes only one TAP to the JTAG chain, DRPOST is the number of cores between the TDI signal of the debugger and the core of interest.
IRPRE (default: 0) <number> of instruction register bits in the JTAG chain between the core of interest and the TDO signal of the debugger. This is the sum of the instruction register length of all TAPs between the core of interest and the TDO signal of the debugger.
IRPOST (default: 0) <number> of instruction register bits in the JTAG chain between the TDI signal and the core of interest. This is the sum of the instruction register lengths of all TAPs between the TDI signal of the debugger and the core of interest.
TAPState (default: 7 = Select-DR-Scan) This is the state of the TAP controller when the debugger switches to tristate mode. All states of the JTAG TAP controller are selectable.
TCKLevel (default: 0) Level of TCK signal when all debuggers are tristated.
TriState (default: OFF) If several debuggers share the same debug port, this option is required. The debugger switches to tristate mode after each debug port access. Then other debuggers can access the port. JTAG: This option must be used, if the JTAG line of multiple debug boxes are connected by a JTAG joiner adapter to access a single JTAG chain.
Slave (default: OFF) If more than one debugger share the same debug port, all except one must have this option active.JTAG: Only one debugger - the “master” - is allowed to control the signals nTRST and nSRST (nRESET).
RH850 Debugger and Trace 49 ©1989-2019 Lauterbach GmbH

Daisy-Chain Example
Below, configuration for core C.
Instruction register length of
• Core A: 3 bit
• Core B: 5 bit
• Core D: 6 bit
SYStem.CONFIG.IRPRE 6. ; IR Core D
SYStem.CONFIG.IRPOST 8. ; IR Core A + B
SYStem.CONFIG.DRPRE 1. ; DR Core D
SYStem.CONFIG.DRPOST 2. ; DR Core A + B
SYStem.CONFIG.CORE 0. 1. ; Target Core C is Core 0 in Chip 1
Core A Core B Core C Core D TDOTDI
Chip 0 Chip 1
RH850 Debugger and Trace 50 ©1989-2019 Lauterbach GmbH

TapStates
0 Exit2-DR
1 Exit1-DR
2 Shift-DR
3 Pause-DR
4 Select-IR-Scan
5 Update-DR
6 Capture-DR
7 Select-DR-Scan
8 Exit2-IR
9 Exit1-IR
10 Shift-IR
11 Pause-IR
12 Run-Test/Idle
13 Update-IR
14 Capture-IR
15 Test-Logic-Reset
RH850 Debugger and Trace 51 ©1989-2019 Lauterbach GmbH

SYStem.CONFIG.CORE Assign core to TRACE32 instance
Default coreindex: depends on the CPU, usually 1. for generic chips
Default chipindex: derived from CORE= parameter of the configuration file (config.t32). The CORE parameter is defined according to the start order of the GUI in T32Start with ascending values.
To provide proper interaction between different parts of the debugger the systems topology must be mapped to the debuggers topology model. The debugger model abstracts chips and sub-cores of these chips. Every GUI must be connect to one unused core entry in the debugger topology model. Once the SYStem.CPU is selected a generic chip or none generic chip is created at the default chipindex.
None Generic Chips
None generic chips have a fixed amount of sub-cores with a fixed CPU type.
First all cores have successive chip numbers at their GUIs. Therefore you have to assign the coreindex and the chipindex for every core. Usually the debugger does not need further information to access cores in none generic chips, once the setup is correct.
Generic Chips
Generic chips can accommodate an arbitrary amount of sub-cores. The debugger still needs information how to connect to the individual cores e.g. by setting the JTAG chain coordinates.
Start-up Process
The debug system must not have an invalid state where a GUI is connected to a wrong core type of a none generic chip, two GUI are connected to the same coordinate or a GUI is not connected to a core. The initial state of the system is value since every new GUI uses a new chipindex according to its CORE= parameter of the configuration file (config.t32). If the system contains fewer chips than initially assumed, the chips must be merged by calling SYStem.CONFIG.CORE.
Format: SYStem.CONFIG.CORE <core_index> <chip_index>SYStem.MultiCore.CORE <core_index> <chip_index> (deprecated)
<chip_index>: 1 … i
<core_index>: 1 … k
RH850 Debugger and Trace 52 ©1989-2019 Lauterbach GmbH

SYStem.CONFIG.DEBUGPORT Select target interface
Default: depends on detection.
Selects the interface to the target. The available options depend on whether TRACE32 uses a hardware debugger or runs in HostMCI mode (without TRACE32 hardware).
With TRACE32 hardware
HostMCI mode
Format: SYStem.CONFIG.DEBUGPORT <port>
<port>: DebugCable0 | XCP0 | GTL0 … GTL4 | Unknown
DebugCable0 Uses the debug cable directly connected to a PowerDebug hardware module.
XCP0 Selects the XCP backend as interface. For a detailed description and examples, see “XCP Debug Back-End” (backend_xcp.pdf).
Unknown No backend is selected. Debugging is not possible.
GTL1, GTL2, GTL3, GTL4
Debug ports of the GTL back-end.For information about the GTL back-end, refer to “GTL Debug Back-End” (backend_gtl.pdf).
RH850 Debugger and Trace 53 ©1989-2019 Lauterbach GmbH

SYStem.CONFIG.DEBUGPORTTYPE Select debug port type
Default: JTAG.
It specifies the used debug port type. It assumes the selected type is supported by the target.
SYStem.CONFIG.EXTWDTDIS Disable external watchdog
Default: High.
Controls the WDTDIS pin of the Automotive Debug Cable. This option is only available if an Automotive Debug Cable is connected to the PowerDebug module.
Format: SYStem.CONFIG.DEBUGPORTTYPE <port_type>
<port_type>: JTAG | LDP1 | LDP4 | UART | UART1 | CSI
<port_type> For a description of the <port_types>, see “RH850 Debug Interface Modes”.
Format: SYStem.CONFIG EXTWDTDIS <option>
<option>: HighLowHIGHWHENSTOPPEDLOWWHENSTOPPED
High The WDTDIS pin is permanently driven high.
Low The WDTDIS pin is permanently driven low.
HIGHWHEN-STOPPED
The WDTDIS pin is driven high when program is stopped.
LOWWHEN-STOPPED
The WDTDIS pin is driven low when program is stopped.
RH850 Debugger and Trace 54 ©1989-2019 Lauterbach GmbH

SYStem.CONFIG PortSHaRing Control sharing of debug port with other tool
Configures if the debug port is shared with another tool, e.g., an ETAS ETK or ETKX. This option is only available if an motive Debug Cable is connected to the PowerDebug module..
The current setting can be obtained by the PORTSHARING() function, immediate detection can be performed using SYStem.DETECT PortSHaRing.
SYStem.CORECLOCK Core clock frequency
Default core clock: 80MHz.
This setting informs TRACE32 about the core clock frequency. During Serial-Flash-Programming mode this value is sent to the CPU to configure the CPU internal PLL.
SYStem.CPU CPU type selection
Default selection: R7F701035. Selects the CPU type.
Format: SYStem.CONFIG PortSHaRing [ON | OFF | DownState <downmode>]
<downmode>: RESET | TRISTATE
ON Request for access to the debug port and wait until the access is granted before communicating with the target.
OFF Communicate with the target without sending requests.
DownMode Select the mode of the reset signal when TRACE32 is in SYStem.Down mode.
Format: SYStem.CORECLOCK [<frequency>]
Format: SYStem.CPU <cpu>
<cpu>: R7F701035 | …
RH850 Debugger and Trace 55 ©1989-2019 Lauterbach GmbH

SYStem.CpuAccess Run-time memory access (intrusive)
If SYStem.CpuAccess Enable is set, it is possible to read from memory, to write to memory and to set software breakpoints while the CPU is executing the program. To make this possible, the program execution is shortly stopped by the debugger. Each stop takes 0.1-100 ms depending on the speed of the JTAG port and the operations that should be performed. A red S in the state line of the TRACE32 main window warns you that the program is no longer running in real time.
If specific windows that display memory or variables should be updated while the program is running select the memory class E: or the format option %E.
SYStem.CpuBreak Master control to deny stopping the target (long stop)
Default: Enable.
Format: SYStem.CpuAccess Enable | Denied | Nonstop
Enable Allow intrusive run-time memory access.
Denied Lock intrusive run-time memory access (default).
Nonstop Lock all features of the debugger that affect the run-time behavior.
Data.dump E:0x100
Var.View %E first
Format: SYStem.CpuBreak [<mode>]
<mode>: Enable | Denied
Enable Allows stopping the target.
Denied Denies stopping the target. This includes manual stops and stop breakpoints. However, short stops, such as spot breakpoints, may still be allowed.
SYStem.CpuBreak Denied can be used to protect a target system which does not tolerate that the program execution is stopped for an extended period of time; for example, a motor controller which could damage the motor if the motor control software is stopped. For more information, see SYStem.CpuSpot, SYStem.MemAccess.
RH850 Debugger and Trace 56 ©1989-2019 Lauterbach GmbH

Example:
SYStem.CpuBreak Denied
Break.Set main ; stop breakpoint results in an error message
Break.Set main /Spot ; spot breakpoint may be allowed
RH850 Debugger and Trace 57 ©1989-2019 Lauterbach GmbH

SYStem.CpuSpot Master control to deny spotting the target (short stop)
Default: Enable.
Spotting is an intrusive way to transfer data periodically or on certain events from the target system to the debugger. As a result, the program is not running in real-time anymore. For more information, see SYStem.CpuBreak and SYStem.MemAccess.
Example:
SYStem.JtagClock JTAG clock selection
Default frequency: 1 MHz.
Selects the JTAG port frequency (TCK). Any frequency up to 25 MHz can be entered, it will be generated by the debuggers internal PLL.
Format: SYStem.CpuSpot [<mode>]
<mode>: Enable | Denied | Target | SINGLE
Enable Allows spotting the target.
Denied Denies spotting the target.Stopping the target may still be allowed.
Target Allows spotting the target controlled by the target.This allows target-stopped FDX and TERM communication.All other spots are denied.
SINGLE Allows single spots triggered by a command.This includes spotting for changing the breakpoint configuration and the SNOOPer.PC command.This setting also allows target-stopped FDX and TERM communication.All other spots are denied.
SYStem.CpuSpot DeniedBreak.Set main /Spot ; spot breakpoint results in an error message
Format: SYStem.JtagClock [<frequency>]
RH850 Debugger and Trace 58 ©1989-2019 Lauterbach GmbH

For CPUs which come up with very low clock speeds it might be necessary to slow down the JTAG frequency. After initialization of the CPUs PLL the JTAG clock can be increased.
SYStem.LOCK Lock and tristate the debug port
Default: OFF.
If the system is locked, no access to the debug port will be performed by the debugger. While locked, the debug connector of the debugger is tristated. The main intention of the SYStem.LOCK command is to give debug access to another tool.
SYStem.MemAccess Memory access selection
Selects the method for real-time memory access while the core is running.
All debugger windows which are opened with the option /E will use the selected Non-intrusive memory access.
If there are buffers, additional loads or high capacities on the JTAG lines, reduce the debug speed.
Format: SYStem.LOCK [ON | OFF]
Format: SYStem.MemAccess <mode>
<mode>: CPUDenied
CPU Enable real-time memory access.
Denied Disables any real-time memory access.
RH850 Debugger and Trace 59 ©1989-2019 Lauterbach GmbH

SYStem.Mode System mode selection
SYStem.OSCCLOCK Oscillator clock frequency
Format: SYStem.Mode <mode>
<mode>: DownNoDebugPrepareGoAttachUp
Down Disables the Debugger.The behavior can be configured with SYStem.Option DOWNMODE.
NoDebug Disables the Debugger. The debug interface is forced to high impedance mode.
Prepare Resets the target and sets the CPU to SerialFlashProgramming mode.This setting only can be done if SYStem.CONFIG.DEBUGPORTYPE is configured for UART or CSI mode. SerialFlashProgramming allows programming of all CPU flash areas and OptionBytes. This mode can not be used for debugging. See also: RH850 Debug Interface Modes.
Go Resets the target with debug mode enabled and prepares the CPU for debug mode entry. After this command the CPU is in the SYStem.Up mode and running. Now, the processor can be stopped with the break command or until any break condition occurs.
Attach Connect to the processor without resetting target/processor. Use this command to connect to the processor without changing it’s current state.Only supported for JTAG and LPD4 debug interface modes.
StandBy Debugging/Tracing through power cycles.The debugger will wait until power-on is detected, then bring the CPU into debug mode, set all debug and trace registers and start the CPU. See also SYStem.Option RESetBehavior.
Up Resets the target and sets the CPU to debug mode. After execution of this command the CPU is stopped and prepared for debugging. All register are set to the default value.
Format: SYStem.OSCCLOCK [<frequency>]
RH850 Debugger and Trace 60 ©1989-2019 Lauterbach GmbH

Default oscillator clock: 8MHz.
This setting informs TRACE32 about the target oscillator frequency. During Serial-Flash-Programming mode this value is sent to the CPU to configure the CPU internal PLL.
SYStem.RESetOut Reset target without reset of debug port
If possible (nRESET is open collector), this command asserts the nRESET line on the debug connector. This will reset the target including the CPU but not the debug port. The function only works when the system is in SYStem.Mode.Up.
Format: SYStem.RESetOut
RH850 Debugger and Trace 61 ©1989-2019 Lauterbach GmbH

CPU specific SYStem.Option Commands
SYStem.Option CFU CalibrationFunctionUnit support
Enables TRACE32 specific support for the RH850 CalibrationFunctionUnits (G4-core variants only!).
The CalibrationFunctionUnits are only available in RH850 emulation devices. Typically the CalibrationFunctionUnits are used by other tool vendors to replace FLASH areas by Calibration-RAM.
During debugging it can be useful to get access to the original flash content and/or to modify the contents of the calibration-RAM.
If SYStem.Option CFU is set to ON:
• TRACE32 analyzes the address mapping configured in the CalibrationFunctionUnits. Users do not need to know in which address-ranges original-flash and/or Calibration-RAM is accessible, the remapping is done by TRACE32 automatically.
• The original flash content can be read by use of memory class “EAD:<flash_address>”.
• Calibration-RAM contents can be written to by use of memory class “ED:<flash_address>”
If SYStem.Option CFU is set to OFF:
• Memory class “EAD:<flash_address>” reads the memory content as it is seen by the CPU.
• Write-Access to memory class “ED:<flash_address>” have not effect.
SYStem.Option DOWNMODE Behavior of SYStem.Mode Down
Configures the behavior of SYStem.Mode Down:
Format: SYStem.Option CFU [ON | OFF]
Format: SYStem.Option DOWNMODE TriState | ReSeT
TriState (default) All drivers of the debug port are switched off.
ReSeT The CPU is held in reset.
RH850 Debugger and Trace 62 ©1989-2019 Lauterbach GmbH
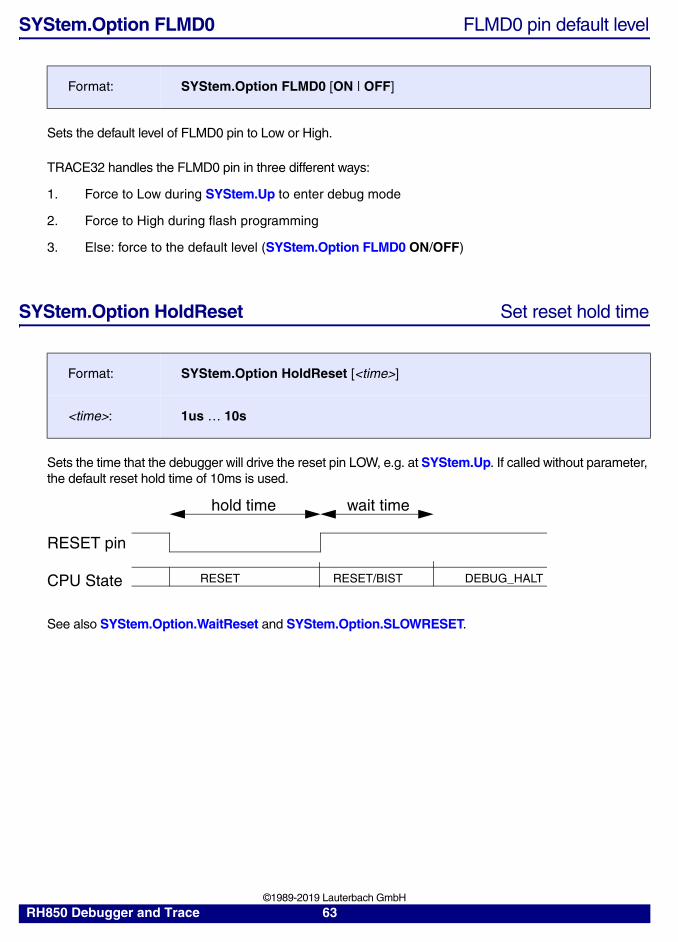
SYStem.Option FLMD0 FLMD0 pin default level
Sets the default level of FLMD0 pin to Low or High.
TRACE32 handles the FLMD0 pin in three different ways:
1. Force to Low during SYStem.Up to enter debug mode
2. Force to High during flash programming
3. Else: force to the default level (SYStem.Option FLMD0 ON/OFF)
SYStem.Option HoldReset Set reset hold time
Sets the time that the debugger will drive the reset pin LOW, e.g. at SYStem.Up. If called without parameter, the default reset hold time of 10ms is used.
See also SYStem.Option.WaitReset and SYStem.Option.SLOWRESET.
Format: SYStem.Option FLMD0 [ON | OFF]
Format: SYStem.Option HoldReset [<time>]
<time>: 1us … 10s
RESET pin
hold time wait time
CPU State RESET RESET/BIST DEBUG_HALT
RH850 Debugger and Trace 63 ©1989-2019 Lauterbach GmbH

SYStem.Option ICUS ICU-S enable
Enables/disables the ICU-S unit of the device.
The command is only relevant for devices which are equipped with an ICU-S unit.
To enable the ICU-S:
1. Enter SerialFlashProgramming mode (UART mode).
2. Program the ICU-S data-flash to prevent ECC errors.
3. Enable ICU-S.
The setting becomes active with the next reset.
To disable the ICU-S:
Disabling of the ICU-S is not supported by all devices, please check the CPU manuals. The ICU-S only can be disabled if code- and data-flash is erased before.
1. Enter SerialFlashProgramming mode (UART mode).
2. Erase code- and data-flash.
3. Disable ICU-S.
The setting becomes active with the next reset.
Format: SYStem.Option ICUS [ON | OFF]
FLASH.Erase 0xff200000++0xffffFLASH. ALLData.Set 0xff200000++0xffff 0x0 ; or any other valueFLASH. OFF
SYStem.Option ICUS ON
; erase code flashFLASH.Erase 1.
; erase application data-flashFLASH.Erase 0xff200000--(0xff207fff-IcuSize)
SYStem.Option ICUS OFF ; erases icus-data-flash + disable ICU-S
RH850 Debugger and Trace 64 ©1989-2019 Lauterbach GmbH

SYStem.Option IMASKASM Interrupt disable
Masks interrupts during assembler single steps. Useful to prevent interrupt disturbance during assembler single stepping.
SYStem.Option IMASKHLL Interrupt disable
Masks interrupts during HLL single steps. Useful to prevent interrupt disturbance during HLL single stepping.
SYStem.Option KEYCODE Keycode (G3Kx cores only)
The KEYCODE is sent to the CPU during system up to unlock the ID-Code-Protection unit. A matching KEYCODE is a must to get debug control. More details on ID-Code-Protection can be found in the CPU-Users-Manual.
The command is only relevant for devices equipped with a G3Kx-core. For all other devices use command SYStem.Option OCDID.
Format: SYStem.Option IMASKASM [ON | OFF]
Format: SYStem.Option IMASKHLL [ON | OFF]
Format: SYStem.Option KEYCODE [<16x_8bit_values>]
<16x_8bit_values> Have to be the same value as present in CPUs ID-code input registers ID_IN[0..3].
RH850 Debugger and Trace 65 ©1989-2019 Lauterbach GmbH
SYStem.Option OCDID OnChipDebugID setting
The OCDID values are sent to the CPU during SYStem.Up to unlock the debug access. Matching values are a must to get debug control.
See also: SYStem.Option KEYCODE
SYStem.Option CFID CodeFlashID setting
The CFID values are sent to the CPU during SYStem.Up to unlock the code flash access. Matching values are a must to get debug control.
SYStem.Option DFID DataFlashID setting
The DFID values are sent to the CPU during SYStem.Up to unlock the data flash access. Matching values are a must to get debug control.
Format: SYStem.Option OCDID [<8x_32bit_values>]
<8x_32bit_values> Have to be the same values as present in CPUs OCDID[0..7] registers.
Format: SYStem.Option CFID [<8x_32bit_values>]
<8x_32bit_values> Have to be the same values as present in CPUs CFID[0..7] registers.
Format: SYStem.Option DFID [<8x_32bit_values>]
<8x_32bit_values> Have to be the same values as present in CPUs DFID[0..7] registers.
RH850 Debugger and Trace 66 ©1989-2019 Lauterbach GmbH

SYStem.Option OPtionByTe Option-byte setting
Display and reprogram of CPU OptionBytes(0 to 7). OptionByte programming is only supported in SerialFlashProgramming mode.
The functionality of OptionBytes is described in the CPU user manual. OptionByte manipulation might be necessary to activate a different debug interface mode (JTAG, LPD4 or LPD1).
SYStem.Option OPtionByTe8 Option-byte setting
Display and reprogram of CPU OptionBytes(8 to 15). OptionByte programming is only supported in SerialFlashProgramming mode.
SYStem.Option PERSTOP Disable CPU peripherals if stopped
Stop CPU peripherals if program is stopped. Useful to prevent timer exceptions.
SYStem.Option RESetBehavior Set behavior when target reset detected
Defines the debugger’s action when a reset is detected.
Format: SYStem.Option OPtionByTe [<8x_32bit_values>]
Format: SYStem.Option OPtionByTe8 [<8x_32bit_values>]
Format: SYStem.Option PERSTOP [ON | OFF]
Format: SYStem.Option RESetBehavior <mode>
<mode>: DisabledAsyncHaltAsyncStartResetHaltResetStartRESYNC
RH850 Debugger and Trace 67 ©1989-2019 Lauterbach GmbH

Default setting is ResetHalt. This option is only supported for RH850 devices with G4-core.
SYStem.Option RDYLINE RDY pin available
Default: ON.
Set to OFF if cpu RDY- pin is not available or not connected to the debug connector.
The setting is only relevant if debug communication is done in JTAG mode (DEBUGPORTTYPE == JTAG).
Disabled No actions to the processor take place when a reset is detected. Information about the reset will be printed to the message AREA.
AsyncHalt Halt core as soon as possible after reset was detected. The core will halt shortly after the reset event.BIST run enabled.
AsyncStart Halt core as soon as possible after reset was detected. The debugger sets debug and trace configuration registers and afterwards starts the core(s) again.BIST run enabled.
ResetHalt When a reset is detected, the debugger keeps reset asserted and then halts the core at the reset address.BIST run disabled.
ResetStart When a reset is detected, the debugger keeps reset asserted and then halts the core at the reset address. The debugger sets debug and trace configuration registers and afterwards starts the core(s) again.BIST run disabled.
RESYNC When a reset is detected, the debugger waits until reset is released. Once the core is out of reset, the debugger sets debug and trace configuration registers on-the-fly.
Format: SYStem.Option RDYLINE [ON | OFF]
RH850 Debugger and Trace 68 ©1989-2019 Lauterbach GmbH

SYStem.Option SLOWRESET Timeout for ResetRiseTime
Terminate reset processing if target reset does not rise to high level within a certain period after debug-reset release.
See also: SYStem.Option.HoldReset and SYStem.Option.WaitReset.
SYStem.Option WaitReset Set reset wait time
Sets the time that the debugger will wait after releasing the reset pin, e.g. at SYStem.Up. If called without parameter, the default reset wait time is used (500us).
If the reference is set to OFF, the wait time starts when the debugger releases reset. If the reference is set to RESET or RSTOUT, the wait time starts when the debugger detects that reset is released on the corresponding pin.
Use this command when SYStem.Up fails, and the message AREA shows the message “Target reset detected during system.up sequence”. A wait time of several ms should be sufficient. If a wait time > 10ms is required, the target might require a stronger RESET pull-up resistor.
For related commands, see also SYStem.Option.HoldReset and SYStem.Option.SLOWRESET.
Format: SYStem.Option SLOWRESET [ON | OFF] (deprecated)
OFF (default) 4 seconds
ON 20 seconds
Format: SYStem.Option WaitReset [<time> [<reference>] ]
<time>: 1us…10s
<reference>: OFFRESETRSTOUT
RESET pin
hold time wait time
CPU State RESET RESET/BIST DEBUG_HALT
RH850 Debugger and Trace 69 ©1989-2019 Lauterbach GmbH

SYStem.Option (Exception Lines Enable)
The RH850 supports disabling of several CPU core inputs. This can be useful to lock watchdog- or target resets.
SYStem.Option CPINT CPINT line enable
No function anymore.
SYStem.Option REQest Request line enable
Default: ON.
Enables/disables the request line.
SYStem.Option RESET Reset line enable
Default: ON.
Enables/disables the reset line.
Format: SYStem.Option CPINT [ON | OFF] (deprecated)
Format: SYStem.Option REQ [ON | OFF]
Format: SYStem.Option RESET [ON | OFF]
RH850 Debugger and Trace 70 ©1989-2019 Lauterbach GmbH

SYStem.Option STOP Stop line enable
Default: ON.
Enables/disables the stop line.
SYStem.Option WAIT Wait line enable
Default: ON.
Enables/disables the wait line.
Format: SYStem.Option STOP [ON | OFF]
Format: SYStem.Option WAIT [ON | OFF]
RH850 Debugger and Trace 71 ©1989-2019 Lauterbach GmbH

CPU specific BenchMarkCounter Commands
Benchmark counters are on-chip counters that count specific hardware events, e.g., the number of executed instructions. This allows to calculate typical performance metrics like clocks per instruction (CPI).The benchmark counters can be read at run-time if real-time memory access is enabled (use the command SYStem.MemAccess CPU).
Performance counters and event counters of RH850 CPUs can be started or stopped using on-chip breakpoints. This A-to-B mode allows to determine performance metrics for a single code block.
RH850 CPUs support two different types of benchmark counters:
• Performance-counters (BCNT0..4) can be used for runtime measurement and/or various event counting. Runtime measurement is based on the core-clock frequency, the results are very accurate.
• Time-counters (TCNT0..4) can be used for runtime measurement only. Clocking of the Time-counters is based on the selected DebugPortType. The count-clock is typically slower than the core-clock. For correct runtime measurement the minimum function-runtime should be more than 5 count-clocks.
JTAG --> JTAG-clock (NOTE: TRACE32 does not support a continuous JTAG-clock --> the measurements are wrong. Counter TCNT0..4 can not be used in JTAG mode!)
LPD4 --> BaudRate frequency (set the SYStem.BAUDRATE as high as possible)
LPD1 --> Oscillator frequency
For information about architecture-independent BMC commands, refer to “BMC” (general_ref_b.pdf).
For information about architecture-specific BMC commands, see command descriptions below.
RH850 Debugger and Trace 72 ©1989-2019 Lauterbach GmbH

BMC.<counter>.ATOB Enable event triggered counter start and stop
Enables event triggered counter start/stop. The events are defines using ALPHA and BETA breakpoints set with Break.Set. Every time the Alpha breakpoint condition triggers, the counter is started. The counter stops when the Beta breakpoint condition is triggered.
Max-number of supported Alpha breakpoint: 1
Max-number of supported Beta breakpoins: 7
Example: This script measures the min-, max-, total- and average-runtime of the function sieve. This measurement includes all interrupts, sub-function calls, etc.
Format: BMC.<counter>.ATOB [ON | OFF]
;Measure runtime of function sieve (uses performance-counters) BMC.CLOCK SYStem.CORECLOCK() ; core clock frequency BMC.Init ON
BMC.BCNT0.EVENT.CLOCKS ; AtoB TotalTime BMC.BCNT0.ATOB.TOTAL BMC.BCNT0.RATIO.runtime(X/CLOCK) BMC.BCNT1.EVENT.CLOCKS ; AtoB MinTime BMC.BCNT1.ATOB.MIN BMC.BCNT1.RATIO.runtime(X/CLOCK) BMC.BCNT2.EVENT.CLOCKS ; AtoB MaxTime BMC.BCNT2.ATOB.MAX BMC.BCNT2.RATIO.runtime(X/CLOCK) BMC.BCNT3.EVENT.ATOB ; AtoB Events BMC.BCNT3.ATOB.TOTAL BMC.BCNT3.RATIO.OFF BMC.RESet Break.Delete
;set up counter start / stop events Break.Set sYmbol.BEGIN(sieve) /Onchip /Alpha Break.Set sYmbol.EXIT(sieve) /Onchip /Beta
;run measurement (for 10 seconds) BMC.Init Go Wait 10s Break
RH850 Debugger and Trace 73 ©1989-2019 Lauterbach GmbH

BMC.<counter>.EVENT Configure the performance monitor
Format: BMC.<counter>.EVENT <event>
<counter>: TCNTBCNT
<event>: OFFCLOCKSATOBINSTBRA EII FEIASEXPSEXPSTALLNINTDISINTIFUIFIFUIFNWRFLASHIFVCIIFFLASHDFFLASHDFNWR
OFF Disable counter.
CLOCKS Counts Core-Clock for BCNT, counts Debug-Clocks for TCNT.
ATOB Counts A-to-B events.
INST Counts instructions.
BRA Counts branch instructions.
EII Counts EI-interrupt acknowledges.
FEI Counts FE-interrupt acknowledges.
ASEXP Counts asynchronous exception acknowledges.
SEXP Counts synchronous exception acknowledges.
STALL Counts Stall cycles.
RH850 Debugger and Trace 74 ©1989-2019 Lauterbach GmbH

BMC.<counter>.TRIGMODE BMC trigger mode
Enables/disables the BenchMarkCounter trigger.
The program execution stops if the counter-value exceeds the predefined trigger-value, see BMC.<counter>.TRIGVAL.
Default:
• Trigger if counter-value > trigger-value
If AtoB measurement is enabled:
• AtoB-MIN --> Trigger if counter-value-min < trigger-value
• AtoB-MAX --> Trigger if counter-value-max > trigger-value
• AtoB-TOTAL --> Trigger if counter-value-total > trigger-value
BMC.<counter>.TRIGVAL BMC trigger value
Defines the BenchMarkCounter trigger value.
NINT Count No-Interrupt cycles.
DISINT Count Disabled-Interrupt cycles.
IFUIF Counts IFU-Instruction fetches.
IFUIFNWR Counts IFU-Instruction fetches with NoWaitResponse.
FLASHIF Counts Flash-Instruction fetches.
VCIIF Counts VCI-Instruction fetches.
FLASHDF Counts Flash-Data fetches.
FLASHDFNWR Counts Flash-Data fetches with NoWaitResponse.
Format: BMC.<counter>.TRIGMODE [OFF | BREAK]
Format: BMC.<counter>.TRIGVAL [<value>]
RH850 Debugger and Trace 75 ©1989-2019 Lauterbach GmbH

CPU specific TrOnchip Commands
TrOnchip.CONVert Allow extension of address range of breakpoint
Controls for all on-chip read/write breakpoints whether the debugger is allowed to change the user-defined address range of a breakpoint (see Break.Set <address_range> in the figure below).
The debug logic of a processor may be implemented in one of the following three ways:
1. The debug logic does not allow to set range breakpoints, but only single address breakpoints. Consequently the debugger cannot set range breakpoints and returns an error message.
2. The debugger can set any user-defined range breakpoint because the debug logic accepts this range breakpoint.
3. The debug logic accepts only certain range breakpoints. The debugger calculates the range that comes closest to the user-defined breakpoint range (see “modified range” in the figure above).
Format: TrOnchip.CONVert [ON | OFF] (deprecated)Use Break.CONFIG.InexactAddress instead
Range fitsto debug
logic?No
Break.Set <addr_range>
Programdebug logic
Yes
Yes unmodified range
TrOnchip.CONVert
OFF
ONmodified range
No
Error
RH850 Debugger and Trace 76 ©1989-2019 Lauterbach GmbH
The TrOnchip.CONVert command covers case 3. For case 3) the user may decide whether the debugger is allowed to change the user-defined address range of a breakpoint or not by setting TrOnchip.CONVert to ON or OFF.
In the Break.List window, you can view the requested address range for all breakpoints, whereas in the Break.List /Onchip window you can view the actual address range used for the on-chip breakpoints.
TrOnchip.EVTEN Enable ‘EVTO-’ trigger input (Aurora trace only)
Default: ON.
TRACE32 uses the CPU signal ‘EVTO-’ to force a trigger for Aurora trace recording (see command: Break.Set … /TraceTrigger).
The CPU signal ‘EVTO-’ can also be used by other tools at the same time, which can cause functional conflicts with the Aurora trace trigger input. In this case TrOnchip.EVTEN should be set to OFF.
TrOnchip.RESet Set on-chip trigger to default state
Sets the TrOnchip settings and trigger module to the default settings.
ON(default)
If TrOnchip.Convert is set to ON and a breakpoint is set to a range which cannot be exactly implemented, this range is automatically extended to the next possible range. In most cases, the breakpoint now marks a wider address range (see “modified range” in the figure above).
OFF If TrOnchip.Convert is set to OFF, the debugger will only accept breakpoints which exactly fit to the debug logic (see “unmodified range” in the figure above).If the user enters an address range that does not fit to the debug logic, an error will be returned by the debugger.
Format: TrOnchip.EVTEN [ON | OFF]
ON Enables the Aurora trace trigger input.
OFF Disables the Aurora trace trigger input.
Format: TrOnchip.RESet
RH850 Debugger and Trace 77 ©1989-2019 Lauterbach GmbH

TrOnchip.SIZE Trigger on byte, word, long memory accesses
Default: OFF.
If ON, breakpoints on single-byte, two-byte or four-byte address ranges only hit if the CPU accesses this ranges with a byte, word or long bus cycle.
TrOnchip.state Display on-chip trigger window
Opens the TrOnchip.state window.
Format: TrOnchip.SIZE [ON | OFF]
Format: TrOnchip.state
RH850 Debugger and Trace 78 ©1989-2019 Lauterbach GmbH

TrOnchip.VarCONVert Convert breakpoints on scalar variablesf
Controls for all scalar variables whether the debugger sets an HLL breakpoint with Var.Break.Set only on the start address of the scalar variable or on the entire address range covered by this scalar variable.
Format: TrOnchip.VarCONVert [ON | OFF] (deprecated)Use Break.CONFIG.VarConvert instead
Programdebug logicYes
Yes unmodified range
Range fitsto debug
logic?
TrOnchip.VarCONVert
ONsingle address
TrOnchip.CONVert
Var.Break.Set <scalar>
ONmodified range
OF
F
No
OFF
addr
rang
e
No
OFF
Error
RH850 Debugger and Trace 79 ©1989-2019 Lauterbach GmbH

In the Break.List window, you can view the requested address range for all breakpoints, whereas in the Break.List /Onchip window you can view the actual address range used for the on-chip breakpoints.
ON If TrOnchip.VarCONVert is set to ON and a breakpoint is set to a scalar variable (int, float, double), then the breakpoint is set only to the start address of the scalar variable.• Allocates only one single on-chip breakpoint resource.• Program will not stop on accesses to the variable’s address space.
OFF(default)
If TrOnchip.VarCONVert is set to OFF and a breakpoint is set to a scalar variable (int, float, double), then the breakpoint is set to the entire address range that stores the scalar variable value.• The program execution stops also on any unintentional accesses
to the variable’s address space.• Allocates up to two on-chip breakpoint resources for a single
range breakpoint.NOTE: The address range of the scalar variable may not fit to the debug logic and has to be converted by the debugger, see TrOnchip.CONVert.
RH850 Debugger and Trace 80 ©1989-2019 Lauterbach GmbH

Command Reference: NEXUS
NEXUS.BTM Program trace messaging enable
Control for NEXUS program trace messaging.
NEXUS.CoreENable Core specific trace configuration
Access to core specific trace configuration.
Default: All cores of the CPU are enabled and the program trace is just managed by the global setting of NEXUS.BTM. For e.g. a CPU with eight cores the default <core_numbers> setting is 0,1,2,3,4,5,6,7
To disable the generation of trace messages for specific cores, exclude them from the <core_numbers> list.
NEXUS.CLIENT<x>.MODE Set data trace mode of nexus client
Sets the data trace mode of the selected trace client. Select the trace client using NEXUS.CLIENT<x>.SELECT before setting the trace mode.
When using “DTM” the client trace mode follows the setting of NEXUS.DTM.
Format: NEXUS.BTM [ON | OFF]
ON (default) Program trace messaging enabled.
OFF Program trace messaging disabled.
Format: NEXUS.CoreENable [<core_numbers>]
Format: NEXUS.CLIENT1.MODE [Read | Write | ReadWrite | DTM | OFF]NEXUS.CLIENT2.MODE [Read | Write | ReadWrite | DTM | OFF]NEXUS.CLIENT3.MODE [Read | Write | ReadWrite | DTM | OFF]
RH850 Debugger and Trace 81 ©1989-2019 Lauterbach GmbH

NEXUS.CLIENT<x>.SELECT Select a nexus client for data tracing
Selects the trace client for data tracing.
NEXUS.DTM Data trace messaging enable
Controls the Data Trace Messaging method.
Format: NEXUS.CLIENT1.SELECT <client>NEXUS.CLIENT2.SELECT <client>NEXUS.CLIENT3.SELECT <client>
<client> Dedicated trace clients (e.g. EXT, LRAM, GRAM)
Format: NEXUS.DTM <mode>
<mode>: OFF | Read | Write | ReadWriteReadLimited | WriteLimited | ReadWriteLimited
OFF Data trace messaging disabled (default)
ReadWriteReadWrite
Data trace messages for read accesses (load instructions)Data trace messages for write accesses (store instructions)Data trace messages for read and write accesses (load and store instructions)
ReadLimitedWriteLimitedReadWrite-Limited
Same as above, but exclude stack operations (sp,r3)
RH850 Debugger and Trace 82 ©1989-2019 Lauterbach GmbH

NEXUS.OFF Disable NEXUS register access
The debugger does not access any of the CPUs trigger- and trace-configuration registers.
The setting is needed if a different tool likes to use the CPUs trigger- and trace-unit exclusively. The setting has to be done before the first Go or Step command to prevent any register configurations from the TRACE32 side.
NEXUS.ON Switch the NEXUS trace port on
The NEXUS trace port is switched on. All trace registers are configured by the debugger.
NEXUS.PortMode Set NEXUS trace port frequency
Sets the NEXUS trace port frequency. For parallel NEXUS, the setting is the system clock divider. For Aurora NEXUS, the setting is a fixed bit clock which is independent of the system frequency.
Format: NEXUS.OFF
NOTE: Existing register configurations are not reset when switching to OFF, the settings will stay active.
Format: NEXUS.ON
Format: NEXUS.PortMode <mode>
<mode>: Aurora NEXUS:625MBPS | 750MBPS | 850MBPS | 1000MBPS | 1250MBPS | 1500MBPS | 1700MBPS | 2000MBPS | 2500MBPS | 3000MBPS | 3125MBPS
NOTES: Aurora NEXUS: Set the bit clock according to the processor’s data sheet.
RH850 Debugger and Trace 83 ©1989-2019 Lauterbach GmbH

NEXUS.PortSize Set trace port width
Sets the nexus port width to the number of used MDO pins or Aurora lanes. The setting can only be changed if no debug session is active (SYStem.Down).
NEXUS.RESet Reset NEXUS trace port settings
Resets NEXUS trace port settings to default settings.
NEXUS.SFT Software trace messaging enable
Control for NEXUS software trace messaging.
SFT messages are stored in On-chip trace memory or the external NEXUS trace hardware.
NEXUS.SUSpend Stall the program execution when FIFO full
Stalls the program execution whenever the on-chip NEXUS-FIFO threatens to overflow. If this option is enabled, the NEXUS port controller will stop the core’s execution pipeline until all messaged in the on-chip NEXUS FIFO are sent. Enabling this command will affect (delay) the instruction execution timing of the CPU. This system option, which is a representation of a feature of the processor, will remarkably reduce the amount FIFO OVERFLOW errors, but can not avoid them completely.
Format: NEXUS.PortSize <port_size>
<port_size>: Aurora NEXUS:1Lane | 2Lane | 4Lane
Format: NEXUS.RESet
Format: NEXUS.SFT [ON | OFF]
Format: NEXUS.SUSpend [ON | OFF]
RH850 Debugger and Trace 84 ©1989-2019 Lauterbach GmbH

NEXUS.SYNC Address-sync trace messaging enable
Forces NEXUS address-sync trace messaging on all branch instructions.
Note for OnchipTrace (optional bugfix):
There are RH850 devices with a bug in the NEXUS coding for Onchip-Trace. If there are flow-errors in the trace listing please set “NEXUS.SYNC ON” and try again.
NEXUS.SyncPeriod Set period of timestamp sync messages
Forces periodical NEXUS timestamp-sync messages in the trace stream.
A correct timing-display of the program flow requires that the first timestamp-sync message appears in the trace stream as early as possible. However, sometimes the first message appears at the very end of the trace recording. As result, all the records before the very first timestamp-sync message are not displayed in the Trace.List window. In this case the NEXUS.SyncPeriod value should be reduced (e.g. to 4096.) to increase the appearance of timestamp-sync messages, then try again.
NEXUS.state Display NEXUS port configuration window
Opens the NEXUS trace configuration window.
Format: NEXUS.SYNC [ON | OFF]
Format: NEXUS.SyncPeriod <clocks>
NOTE: Only relevant for on-chip trace if NEXUS.TimeStamps are enabled.
Format: NEXUS.state
RH850 Debugger and Trace 85 ©1989-2019 Lauterbach GmbH

NEXUS.TimeStamps On-chip timestamp generation enable
When enabled, the processor is configured to add timestamps to the NEXUS messages. If the chip-external trace is used (tracing to PowerTrace unit), on-chip timestamps are usually not needed, because the PowerTrace unit will add it’s own timestamp. When using the on-chip trace, enable NEXUS.TimeStamps for run-time measurements.
Format: NEXUS.TimeStamps [ON | OFF]
NOTE: Timestamps will consume ~20% of the trace bandwidth/trace memory.
RH850 Debugger and Trace 86 ©1989-2019 Lauterbach GmbH

Nexus specific TrOnchip Commands
TrOnchip.Alpha Set special breakpoint function
Configures the functionality of the Alpha breakpoint. This breakpoint can be used to configure the on-chip NEXUS trace for special core features and for the trace clients configured via NEXUS.CLIENT<x>SELECT. For a description of the functionality, see Trace Filtering and Triggering with Debug Events.
Example 1: This script enables the core data trace at the entry of my_func and stop the data trace when the core writes to address 0x40001230. (In contrast to TraceON/TraceOFF, here program trace is enabled permanently):
Format: TrOnchip.Alpha <function>
<function>: OFF ProgramTraceONProgramTraceOFFDataTraceONDataTraceOFF
TraceEnableClient<x>TraceDataClient<x>TraceONClient<x>TraceOFFClient<x>TraceTriggerClient<x>BusTriggerClient<x>BusCountClient<x>WATCHClient<x>
<x>: [1 | 2]
;Enable data trace messaging NEXUS.DTM ReadWrite
;declare events Alpha/Beta used for trace source control Break.Set my_func /Program /Onchip /Alpha Break.Set 0x40001234 /Write /Onchip /Beta
;Set function of Alpha/Beta events TrOnchip.Alpha DataTraceON TrOnchip.Beta DataTraceOFF
RH850 Debugger and Trace 87 ©1989-2019 Lauterbach GmbH

Example 2: This script enables the trace of the DMA controller for write accesses to a specified address range:
Example 3: This script configures the trace of the DMA controller, so that DMA trace starts when the DMA controller writes to 0x1000 and stops when DMA controller wrote 0x1040.
TrOnchip.Beta Set special breakpoint function
See TrOnchip.Alpha.
TrOnchip.Charly Set special breakpoint function
See TrOnchip.Alpha.
;select DMA trace client NEXUS.CLIENT1.SELECT DMA_0
;set Alpha event on address range and write access Break.Set D:0x40001000--0x400017FF /Write /Onchip /Alpha
;Assign Alpha event to CLIENT1, function TRACEDATA TrOnchip.Alpha TraceDataClient1
;select DMA trace clientNEXUS.CLIENT1.SELECT DMA_0
; define events for DMA data trace on/offBreak.Set D:0x40001000 /WRITE /Onchip /AlphaBreak.Set D:0x40001040 /WRITE /Onchip /Beta
; assign events to data trace on/off for client 1TrOnchip.Alpha TraceONClient1TrOnchip.Beta TraceOFFClient1
Format: TrOnchip.Beta <function>
Format: TrOnchip.Charly <function>
RH850 Debugger and Trace 88 ©1989-2019 Lauterbach GmbH

TrOnchip.Delta Set special breakpoint function
See TrOnchip.Alpha.
TrOnchip.Echo Set special breakpoint function
See TrOnchip.Alpha.
Format: TrOnchip.Delta <function>
Format: TrOnchip.Echo <function>
RH850 Debugger and Trace 89 ©1989-2019 Lauterbach GmbH

Debug Connector
Debug Connector 14 pin 100mil
Signal Pin Pin SignalTCK 1 2 GND
TRST- 3 4 FLMD0TDO 5 6 (FLMD1)TDI 7 8 VCC
TMS 9 10 (FLMD2)RDY- 11 12 GND
RESET- 13 14 GND
Debug Connector
Signal Description CPU SignalJTAG
CPUSignalLPD4
CPUSignalLPD1
TCK JTAG-TCK, output of debugger TCK LPDCLK --
TRST JTAG-TRST, output of debugger TRST -- --
TDO JTAG-TDO, input for debugger TDO LPDO --
TDI JTAG-TDI, input/output of debugger
TDI LPDI LPDIO
TMS JTAG-TMS, output of debugger TMS -- --
RDYZ READY- input of debugger RDYZ LPDCLKO --
RESET RESET• Force target Reset, output
of debugger• Sense target Reset, input
for debugger
RESET RESET RESET
FLMD0 FLASH Mode0 signal, output of debugger• Enable flash programming
FLMD0 FLMD0 FLMD0
FLMD1 Mode configuration pin (optional) PullDown PullDown PullDown
FLMD2 Mode configuration pin (optional, not used yet)
-- -- --
RH850 Debugger and Trace 90 ©1989-2019 Lauterbach GmbH

Debug Connector 26
VCC Target voltage sense, input for debugger
VCC VCC VCC
GND GND GND GND GND
Signal Pin Pin SignalVTREF 1 2 TMS
GND 3 4 TCKGND 5 6 TDO
KEY(GND) - 8 TDIGND(PRESENCE) 9 10 RESET-
GND 11 12 RESETOUT-GND 13 14 WDTDISGND 15 16 TRSTGND 17 18 FLMD0GND 19 20 RDY-GND 21 22 BREQ-GND 23 24 BGRNT-GND 25 26 EXTIO
RH850 Debugger and Trace 91 ©1989-2019 Lauterbach GmbH

Trace Connectors and Adapters
Adapter for RH850 (LA-3561)
Connector Function
A AUTO26 debug connector
B JTAG14 debug connector
C Target connector
D PowerTrace Serial connector for Serial Port 1
Jumper Function
X130 Set: Connects pin 16 (EVTI) of the target connector to TRIGOUT ofPowerTrace Serial
Open: EVTI not connected
X131 Set: Connects pin 18 (EVTO) of the target connector to TRIGIN ofPowerTrace Serial
Open: EVTO not connected
B
A
C
D
RH850 Debugger and Trace 92 ©1989-2019 Lauterbach GmbH

X132 DO NOT SET!Pin 1: Connected to pin 34 of the target connector (RESOUT)Pin 2: GND
X113 DO NOT SET!Pin 1: Connected to pin 25 of the target connectorPin 2: GND
Pin27 Set: Connects pin 27 of the target connector to pin 14 (WD) of AUTO26
Open: pin 14 of Auto26 is open
Pin31 Set: Connects pin 31 of the target connector to pin 22 (BREQ) of AUTO26
Open: pin 22 of Auto26 is open
Pin33 Set: Connects pin 27 of the target connector to pin 24 (BGNT) of AUTO26
Open: pin 24 of Auto26 is open
Both debug connectors AUTO26 [A] or the JTAG14 [B] hold the same debug signals coming from the target connector [C]. Only one debug connector must be used at the time.
Jumper Function
RH850 Debugger and Trace 93 ©1989-2019 Lauterbach GmbH

Parallel NEXUS Connector (Debug and Trace)
MICTOR 38-pin for debug and trace
Signals in brackets are optional. These could be used if no additional 14pin debug connector is available on the target. Please use an adaptor (LA-3885) to split the target signals for debug and trace.
Signal Pin Pin SignalMDO12 1 2 MDO13MDO14 3 4 MDO15MDO09 5 6 N/C
N/C 7 8 MDO08(DBG-RESET) 9 10 EVTI-
(DBG-TDO) 11 12 VTREFMDO10 13 14 (DBG-RDY)
(DBG-TCK) 15 16 MDO07(DBG-TMS) 17 18 MDO06(DBG-TDI) 19 20 MDO05
(DBG-TRST) 21 22 MDO04MDO11 23 24 MDO03
N/C 25 26 MDO02N/C 27 28 MDO01
(FLMD2) 29 30 MDO00N/C 31 32 EVTO-
(FLMD1) 33 34 MCKON/C 35 36 MSEO1-
(FLMD0) 37 38 MSEO0-
RH850 Debugger and Trace 94 ©1989-2019 Lauterbach GmbH

Aurora NEXUS SAMTEC 34-pin (Debug and Trace)
This target pin-assignment requires adaptors to connect to the TRACE32 tools.
LA-xxxx: Convert SAMTEC 34pin -> SAMTEC 40pin (Trace only)
LA-xxxx: Split-adapter SAMTEC 34pin -> SAMTEC 40pin, RH850-14pin, RH850-motive
We recommend to place the even numbered pins at the PCB border side (flex cable won't be twisted).
Signal Pin Pin SignalTX0+ 1 2 VCCTX0- 3 4 TCKGND 5 6 TMSTX1+ 7 8 TDITX1- 9 10 TDOGND 11 12 TRST-TX2+ 13 14 FLMD0TX2- 15 16 (EVTI-)GND 17 18 EVTO-TX3+ 19 20 (FLMD1)TX3- 21 22 RESET-GND 23 24 GNDN/C 25 26 CLK+
(WDTDIS) 27 28 CLK-GND 29 30 GND
(ETK-BREQ) 31 32 RDY-(ETK-BGNT) 33 34 RESETOUT-
RH850 Debugger and Trace 95 ©1989-2019 Lauterbach GmbH

Aurora NEXUS SAMTEC 40-pin (Trace only)
SAMTEC 40-pin (Trace only)
We recommend to place the even numbered pins at the PCB border side (flex cable won't be twisted).
Signal Pin Pin SignalN/C 1 2 VCCN/C 3 4 N/C
GND 5 6 GNDN/C 7 8 N/CN/C 9 10 N/C
GND 11 12 GNDTX0+ 13 14 N/CTX0- 15 16 N/CGND 17 18 GNDN/C 19 20 N/CN/C 21 22 N/C
GND 23 24 GNDTX1+ 25 26 N/CTX1- 27 28 N/CGND 29 30 GNDN/C 31 32 N/CN/C 33 34 N/C
GND 35 36 EVTI-CREF+ 37 38 EVTO-CREF- 39 40 N/C
RH850 Debugger and Trace 96 ©1989-2019 Lauterbach GmbH

Support
Available Tools
CP
U
ICE
FIR
E
ICD
DE
BU
G
ICD
MO
NIT
OR
ICD
TR
AC
E
PO
WE
RIN
TE
GR
ATO
R
INS
TR
UC
TIO
NS
IMU
LA
TOR
R7F701002 YES YESR7F701003 YES YESR7F701006 YES YESR7F701007 YES YESR7F701008 YES YESR7F701009 YES YESR7F701010 YES YESR7F701011 YES YESR7F701012 YES YESR7F701013 YES YESR7F701014 YES YESR7F701015 YES YESR7F701016 YES YESR7F701017 YES YESR7F701018 YES YESR7F701019 YES YESR7F701020 YES YESR7F701021 YES YESR7F701022 YES YESR7F701023 YES YESR7F701024 YES YESR7F701025 YES YESR7F701026 YES YESR7F701027 YES YESR7F701028 YES YESR7F701029 YES YESR7F701030 YES YESR7F701031 YES YESR7F701032 YES YESR7F701033 YES YESR7F701034 YES YESR7F701035 YES YESR7F701040 YES YESR7F701041 YES YES
RH850 Debugger and Trace 97 ©1989-2019 Lauterbach GmbH

R7F701042 YES YESR7F701043 YES YESR7F701044 YES YESR7F701045 YES YESR7F701046 YES YESR7F701047 YES YESR7F701048 YES YESR7F701049 YES YESR7F701050 YES YESR7F701051 YES YESR7F701052 YES YESR7F701053 YES YESR7F701054 YES YESR7F701055 YES YESR7F701056 YES YESR7F701057 YES YESR7F701060 YES YESR7F701062 YES YESR7F701064 YES YESR7F701065 YES YESR7F701067 YES YESR7F701069 YES YESR7F701070 YES YESR7F701201 YES YESR7F701202 YES YESR7F701204 YES YESR7F701205 YES YESR7F701215 YES YESR7F701216 YES YESR7F701260 YES YESR7F701263 YES YESR7F701265 YES YESR7F701266 YES YESR7F701270 YES YESR7F701271 YES YESR7F701300 YES YESR7F701301 YES YESR7F701302 YES YESR7F701303 YES YESR7F701304 YES YESR7F701305 YES YES
CP
U
ICE
FIR
E
ICD
DE
BU
G
ICD
MO
NIT
OR
ICD
TR
AC
E
PO
WE
RIN
TE
GR
ATO
R
INS
TR
UC
TIO
NS
IMU
LA
TOR
RH850 Debugger and Trace 98 ©1989-2019 Lauterbach GmbH

R7F701306 YES YESR7F701307 YES YESR7F701308 YES YESR7F701309 YES YESR7F701310 YES YESR7F701311 YES YESR7F701312 YES YESR7F701313 YES YESR7F701314 YES YESR7F701315 YES YESR7F701318 YES YESR7F701319 YES YESR7F701320 YES YESR7F701321 YES YESR7F701322 YES YESR7F701323 YES YESR7F701325 YES YES YESR7F701326 YES YESR7F701327 YES YESR7F701328 YES YESR7F701329 YES YESR7F701330 YES YESR7F701331 YES YESR7F701333 YES YESR7F701334A YES YES YESR7F701336 YES YESR7F701337 YES YESR7F701339 YES YESR7F701341 YES YESR7F701343 YES YESR7F701345 YES YESR7F701352 YES YESR7F701362 YES YESR7F701370A YES YES YESR7F701371 YES YESR7F701372 YES YESR7F701373 YES YESR7F701374 YES YESR7F701375 YES YESR7F701376 YES YESR7F701377 YES YES
CP
U
ICE
FIR
E
ICD
DE
BU
G
ICD
MO
NIT
OR
ICD
TR
AC
E
PO
WE
RIN
TE
GR
ATO
R
INS
TR
UC
TIO
NS
IMU
LA
TOR
RH850 Debugger and Trace 99 ©1989-2019 Lauterbach GmbH

R7F701378 YES YESR7F701379 YES YESR7F701380 YES YESR7F701381 YES YESR7F701382 YES YESR7F701383 YES YESR7F701384 YES YESR7F701385 YES YESR7F701388 YES YESR7F701389 YES YESR7F701390 YES YESR7F701391 YES YESR7F701393 YES YESR7F701394 YES YESR7F701401 YES YESR7F701402 YES YESR7F701403 YES YESR7F701404 YES YESR7F701405 YES YESR7F701406 YES YESR7F701407 YES YESR7F701408 YES YESR7F701410 YES YESR7F701411 YES YESR7F701412 YES YESR7F701421 YES YESR7F701422 YES YESR7F701423 YES YESR7F701424 YES YESR7F701425 YES YESR7F701426 YES YESR7F701427 YES YESR7F701428 YES YESR7F701430 YES YESR7F701431 YES YESR7F701432 YES YESR7F701441 YES YESR7F701442 YES YESR7F701461 YES YESR7F701462 YES YESR7F701490 YES YES YES
CP
U
ICE
FIR
E
ICD
DE
BU
G
ICD
MO
NIT
OR
ICD
TR
AC
E
PO
WE
RIN
TE
GR
ATO
R
INS
TR
UC
TIO
NS
IMU
LA
TOR
RH850 Debugger and Trace 100 ©1989-2019 Lauterbach GmbH

R7F701501 YES YESR7F701502 YES YESR7F701503 YES YESR7F701506 YES YESR7F701507 YES YESR7F701508 YES YESR7F701511 YES YESR7F701512 YES YESR7F701513 YES YESR7F701515 YES YESR7F701521 YES YESR7F701522 YES YESR7F701524 YES YESR7F701525 YES YESR7F701526 YES YESR7F701527 YES YESR7F701528 YES YESR7F701529 YES YESR7F701530 YES YESR7F701531 YES YESR7F701542 YES YESR7F701543 YES YESR7F701544 YES YESR7F701545 YES YESR7F701546 YES YESR7F701547 YES YESR7F701548 YES YESR7F701549 YES YESR7F701552 YES YESR7F701553 YES YESR7F701557 YES YESR7F701560 YES YESR7F701561 YES YESR7F701562 YES YESR7F701563 YES YESR7F701564 YES YESR7F701565 YES YESR7F701566 YES YESR7F701567 YES YESR7F701568 YES YESR7F701569 YES YES
CP
U
ICE
FIR
E
ICD
DE
BU
G
ICD
MO
NIT
OR
ICD
TR
AC
E
PO
WE
RIN
TE
GR
ATO
R
INS
TR
UC
TIO
NS
IMU
LA
TOR
RH850 Debugger and Trace 101 ©1989-2019 Lauterbach GmbH

R7F701572 YES YESR7F701573 YES YESR7F701577 YES YESR7F701580 YES YESR7F701581 YES YESR7F701582 YES YESR7F701583 YES YESR7F701584 YES YESR7F701585 YES YESR7F701586 YES YESR7F701587 YES YESR7F701588 YES YESR7F701589 YES YESR7F701592 YES YESR7F701593 YES YESR7F701597 YES YESR7F701602 YES YESR7F701603 YES YESR7F701610 YES YESR7F701611 YES YESR7F701612 YES YESR7F701613 YES YESR7F701620 YES YESR7F701621 YES YESR7F701622 YES YESR7F701623 YES YESR7F701634 YES YESR7F701635 YES YESR7F701636 YES YESR7F701637 YES YESR7F701638 YES YESR7F701639 YES YESR7F701640 YES YESR7F701641 YES YESR7F701642 YES YESR7F701643 YES YESR7F701644 YES YESR7F701645 YES YESR7F701646 YES YESR7F701647 YES YESR7F701648 YES YES
CP
U
ICE
FIR
E
ICD
DE
BU
G
ICD
MO
NIT
OR
ICD
TR
AC
E
PO
WE
RIN
TE
GR
ATO
R
INS
TR
UC
TIO
NS
IMU
LA
TOR
RH850 Debugger and Trace 102 ©1989-2019 Lauterbach GmbH

R7F701649 YES YESR7F701650 YES YESR7F701651 YES YESR7F701652 YES YESR7F701653 YES YESR7F701684 YES YESR7F701685 YES YESR7F701686 YES YESR7F701687 YES YESR7F701688 YES YESR7F701689 YES YESR7F701690 YES YESR7F701691 YES YESR7F701692 YES YESR7F701693 YES YESR7F701694 YES YESR7F701695 YES YESR7F701700 YES YESR7F701701 YES YESR7F701702 YES YESR7F701703 YES YESR7F701704 YES YESR7F701705 YES YESR7F701706 YES YESR7F701707 YES YESR7F701708 YES YESR7F701709 YES YESR7F701710 YES YESR7F701711 YES YESR7F701712 YES YESR7F701713 YES YESR7F701714 YES YESR7F701715 YES YESR7F701Z00 YES YESR7F701Z04 YES YESR7F701Z05 YES YESR7F701Z06 YES YESR7F701Z07 YES YESR7F701Z11 YES YESR7F701Z12 YES YESR7F701Z18 YES YES
CP
U
ICE
FIR
E
ICD
DE
BU
G
ICD
MO
NIT
OR
ICD
TR
AC
E
PO
WE
RIN
TE
GR
ATO
R
INS
TR
UC
TIO
NS
IMU
LA
TOR
RH850 Debugger and Trace 103 ©1989-2019 Lauterbach GmbH

Compilers
Target Operating Systems
R7F702001EABG YES YESR7F702001EAFP YES YESR7F702002EABA YES YESR7F702002EABG YES YESR7F702Z00ADBG YES YES YESR7F702Z01EDBG YES YES YESR7F702Z01EDFP YES YESR7F702Z02EDBA YES YES YESR7F702Z02EDBG YES YES YESR7F702Z04EDBA YES YES YES
Language Compiler Company Option Comment
C CARH850 Renesas Technology, Corp.
ELF/NEC
C VX-RH850 TASKING ELF/DWARFC/C++ GREENHILLS-C Greenhills Software Inc. ELF/DWARFC/C++ ICCRH850 IAR Systems AB UBROFC/C++ CUBESUITE+ Renesas Technology,
Corp.ELF
Company Product Comment
Segger embOS 4.24- OSEK via ORTIETAS GmbH RTA-OS via ORTI
CP
U
ICE
FIR
E
ICD
DE
BU
G
ICD
MO
NIT
OR
ICD
TR
AC
E
PO
WE
RIN
TE
GR
ATO
R
INS
TR
UC
TIO
NS
IMU
LA
TOR
RH850 Debugger and Trace 104 ©1989-2019 Lauterbach GmbH

3rd-Party Tool Integrations
CPU Tool Company Host
WINDOWS CE PLATF. BUILDER
- Windows
CODE::BLOCKS - -C++TEST - WindowsADENEO -X-TOOLS / X32 blue river software GmbH WindowsCODEWRIGHT Borland Software
CorporationWindows
CODE CONFIDENCE TOOLS
Code Confidence Ltd Windows
CODE CONFIDENCE TOOLS
Code Confidence Ltd Linux
EASYCODE EASYCODE GmbH WindowsECLIPSE Eclipse Foundation, Inc WindowsRHAPSODY IN MICROC IBM Deutschland GmbH WindowsRHAPSODY IN C++ IBM Deutschland GmbH WindowsCHRONVIEW Inchron GmbH WindowsLDRA TOOL SUITE LDRA Technology, Inc. WindowsUML DEBUGGER LieberLieber Software
GmbHWindows
SIMULINK The MathWorks Inc. WindowsATTOL TOOLS MicroMax Inc. WindowsVISUAL BASIC INTERFACE
Microsoft Corporation Windows
LABVIEW NATIONAL INSTRUMENTS Corporation
Windows
TPT PikeTec GmbH WindowsCANTATA QA Systems Ltd WindowsRAPITIME Rapita Systems Ltd. WindowsTESSY Razorcat Development
GmbHWindows
DA-C RistanCASE WindowsTRACEANALYZER Symtavision GmbH WindowsECU-TEST TraceTronic GmbH WindowsUNDODB Undo Software LinuxTA INSPECTOR Vector WindowsVECTORCAST UNIT TESTING
Vector Software Windows
VECTORCAST CODE COVERAGE
Vector Software Windows
RH850 Debugger and Trace 105 ©1989-2019 Lauterbach GmbH

Products
Product Information
Debugger
OrderNo Code Text
LA-3719 JTAG-RH850
Debugger for RH850/V850 (ICD)supports RH850 via JTAG, LPD4, LPD1ICU-M core support includedsupports V850 via NWIREincludes software for Windows, Linux and MacOSXrequires Power Debug Interface USB 2.0/USB 3.0,Power Debug Ethernet, Power Debug II orPowerDebug PROdebug cable with 14 pin connector
LA-3719A DEBUG-RH850-A
Debugger for RH850 Additionalsupports RH850
LA-2709 DBG-RH850-AUTOPRO
Debugger for RH850/V850 Automotive PROsupports RH850 via JTAG, LPD4ICU-M core support includedsupports V850 via NWIREincludes software for Windows, Linux and MacOSXrequiresPower Debug Interface USB 2.0/USB 3.0,Power Debug Ethernet, Power Debug II orPowerDebug PROdebug cable with 26 pin connector
LA-2712 DEBUG-MPC-RH850 -AUT
Debug-Bundle MPC5xxx/RH850 Automotive PROdebug cable with license bundleincludes software for Windows, Linux and MacOSXrequiresPower Debug Interface USB 2.0/USB 3.0,Power Debug Ethernet, PowerTrace, Power Debug IIor PowerDebug PROAutomotive Debug Cable 26-pin
LA-2714 DBG-TC-RH850-AUTOPRO
Debug-Bundle TriCore/RH850 Automotive PROdebug cable with license bundleincludes software for Windows, Linux and MacOSXrequiresPower Debug Interface USB 2.0/USB 3.0,Power Debug Ethernet, PowerTrace, Power Debug IIor PowerDebug PROAutomotive Debug Cable 26-pin
LA-3739 DEBUG-RH850-AUTO
Debugger for RH850/V850 Automotivesupports RH850 via JTAG, LPD4ICU-M core support includedsupports V850 via NWIREincludes software for Windows, Linux and MacOSXrequiresPower Debug Interface USB 2.0/USB 3.0,Power Debug Ethernet, Power Debug II orPowerDebug PROdebug cable with 26 pin connector
RH850 Debugger and Trace 106 ©1989-2019 Lauterbach GmbH

LA-3753 DEBUG-TC-RH850-AUTO
Debugger-Bundle TriCore/RH850 Automotivedebug cable with license bundleincludes software for Windows, Linux and MacOSXrequiresPower Debug Interface USB 2.0/USB 3.0,Power Debug Ethernet, PowerTrace, Power Debug IIor PowerDebug PROAutomotive Debug Cable 26-pin
LA-3734X ONCHIP-TRACE-RH850
Onchip Trace Support for RH850Support for onchip trace on RH850please add the base serial number of your debugcable to your order
LA-2700 CON-AUTO26-JTAG14-RH
Conv. AUTO26 to JTAG14 RH850Converter from Automotive Debug Cable (26-pin)to 14 Pin RH850 connector on targetforLA-2709 (Debugger for RH850/V850 Automotive PRO)LA-3739 (Debugger for RH850 Automotive)
LA-2701 CON-JTAG14-AUTO26-RH
Conv. JTAG14 RH850 to AUTO26Converter from 14 pin debug connector for RH850 to AUTO26use withLA-3719 (Debugger for RH850)to connect to targets designed forLA-2709 (Debugger for RH850/V850 Automotive PRO)LA-3739 (Debugger for RH850 Automotive)
LA-2702 CON-JTAG14-NWIRE
Conv. JTAG14 RH850 to V850 N-WireConverter from 14 pin debug connector for RH850 to20 pin N-Wire for V850use withLA-3719 (Debugger for RH850)
OrderNo Code Text
RH850 Debugger and Trace 107 ©1989-2019 Lauterbach GmbH

Parallel Nexus Trace
OrderNo Code Text
LA-3885 CONV-MIC76-MIC38
Conv. Mictor76 to Mictor38 (RH850/V850)Converter from Mictor76 to Mictor38 forLA-3909 (Preprocessor for RH850/V850 Flex Cable)
LA-3918 PP-RH850-AFII
Preprocessor for RH850 AutoFocus IIPreprocessor for RH850 parallel Nexus trace interfaceVariable threshold level and termination voltage,AUTOFOCUS self calibration technology,Voltage range: 1.2 to 3.3VTrace port: 2..16 MDO (data), 1..2 MESO (control)Bandwidth: 600 MBaud (300MHz clock speed, DDR)Connector: 38 pin mictor connectorrequires PowerTrace II
LA-3918A PP-RH850-AFII-A
Trace License for RH850 on AutoFocus IISupports RH850 parallel Nexus tracingplease add the serial number of the preprocessor toyour orderAUTOFOCUS II Preprocessors with serial numberC0806xxxxxx and lower have to be send to LauterbachGermany for an hardware upgrade
LA-3909 PP-RH850
Preprocessor for RH850/V850Preprocessor for RH850 and V850 withparallel Nexus trace interfaceVoltage range: 1..5 VTRACE port: 2..16 MDO (data) lines 1..2 MSEO (control) linesData Bandwidth: up to 200 MBit/sConnector: 76 pin mictor connectorrequires PowerTrace II
LA-3909A PP-RH850-A
Trace License for RH850/V850Supports RH850 and V850 tracingplease add the serial number of the preprocessor toyour order
RH850 Debugger and Trace 108 ©1989-2019 Lauterbach GmbH

High Speed Serial Nexus Trace (Aurora)
OrderNo Code Text
LA-3943 PP-RH850-HF
Preproc. RH850 HSTP HF-FlexPreprocessor for RH850 withserial Nexus trace interfaceincluding Samtec 40-pin flex extension cablerequires PowerTrace IISupported speeds per lane:4 lanes at 4.25Gbps3 lanes at 6.0Gbps2 lanes at 6.25Gbps1 lane at 6.25GbpsLA-3560 PowerTrace Serial 4 GigaByte RH850Supports 8 lanes at 12.5Gbps
LA-3943A PP-RH850-HF-A
Trace Licence RH850 HFSupports RH850 Aurora NEXUS(high-speed trace port)requires serial preprocessor hardware newer than 08/12(serial number >= C12080164145)please add the serial number of the serial preprocessor toyour order
LA-3896 CON-RH850/40-SAM60
Conv. RH850 Aurora SAM40 to SAM60Converter to connect a RH850 HSTP Aurora Preprocessor to theRenesas Evalboard: RH850-CCC-404PIN-PB-T1-V1
LA-2771 CONV-SAM40/AUTO26-RH
Conv. Sam40 HSTP+AUTO26+RH850 to Samtec34Converter JTAG-RH850 ofLA-3719 (Debugger RH850 14pin)and from AUTO26 ofLA-2709 (Debugger for RH850/V850 Automotive PRO)LA-3739 (Debugger RH850 Automotive)and Samtec 40 pin ofLA-3943 (Preproc. RH850 HSTP HF-Flex)to Samtec ERF 34-pin RH850 pinoutIncludes Samtec 34-pin flex extension
RH850 Debugger and Trace 109 ©1989-2019 Lauterbach GmbH

Order Information
Debugger
Parallel Nexus Trace
Order No. Code Text
LA-3719 JTAG-RH850 Debugger for RH850/V850 (ICD)LA-3719A DEBUG-RH850-A Debugger for RH850 AdditionalLA-2709 DBG-RH850-AUTOPRO Debugger for RH850/V850 Automotive PROLA-2712 DEBUG-MPC-RH850 -AUT Debug-Bundle MPC5xxx/RH850 Automotive PROLA-2714 DBG-TC-RH850-AUTOPRO Debug-Bundle TriCore/RH850 Automotive PROLA-3739 DEBUG-RH850-AUTO Debugger for RH850/V850 AutomotiveLA-3753 DEBUG-TC-RH850-AUTO Debugger-Bundle TriCore/RH850 AutomotiveLA-3734X ONCHIP-TRACE-RH850 Onchip Trace Support for RH850LA-2700 CON-AUTO26-JTAG14-RH Conv. AUTO26 to JTAG14 RH850LA-2701 CON-JTAG14-AUTO26-RH Conv. JTAG14 RH850 to AUTO26LA-2702 CON-JTAG14-NWIRE Conv. JTAG14 RH850 to V850 N-Wire
Additional OptionsLA-3738 DEBUG-MPC-TC-AUTO Debugger-Bundle MPC5xxx/TriCore AutomotiveLA-3736 DEBUG-MPC5XXX-AUTO JTAG Debugger for MPC5xxx AutomotiveLA-3737 DEBUG-TRICORE-AUTO Debugger for TriCore AutomotiveLA-3501 GALVANIC-ISOLATION Galvanic Isolation for Debug CableLA-7844A JTAG-CORTEX_M-A Debug Cortex-M (ARMv6/7/8 32-bit) Add.LA-3760A JTAG-XTENSA-A JTAG Debugger License for Xtensa Add.LA-7960X MULTICORE-LICENSE License for Multicore DebuggingLA-7756A OCDS-TRICORE-A Debugger for TriCore Standard AdditionalLA-3799X TRACE-LICENSE-TC Trace License for TriCore ED
Order No. Code Text
LA-3885 CONV-MIC76-MIC38 Conv. Mictor76 to Mictor38 (RH850/V850)LA-3918 PP-RH850-AFII Preprocessor for RH850 AutoFocus IILA-3918A PP-RH850-AFII-A Trace License for RH850 on AutoFocus IILA-3909 PP-RH850 Preprocessor for RH850/V850LA-3909A PP-RH850-A Trace License for RH850/V850
RH850 Debugger and Trace 110 ©1989-2019 Lauterbach GmbH

High Speed Serial Nexus Trace (Aurora)
Order No. Code Text
LA-3943 PP-RH850-HF Preproc. RH850 HSTP HF-FlexLA-3943A PP-RH850-HF-A Trace Licence RH850 HFLA-3896 CON-RH850/40-SAM60 Conv. RH850 Aurora SAM40 to SAM60LA-2771 CONV-SAM40/AUTO26-RH Conv. Sam40 HSTP+AUTO26+RH850 to Samtec34
Additional OptionsLA-3912A PP-TRICORE-AGBT-A Trace License for TriCore AGBT
RH850 Debugger and Trace 111 ©1989-2019 Lauterbach GmbH
Related Documents