ARTICLES 488 VOLUME 17 | NUMBER 4 | APRIL 2011 NATURE MEDICINE In multiple sclerosis, activated CD4 + T cells specific for components of the myelin sheath initiate an immune response in the white matter of the brain and spinal cord 1 , resulting in demyelination, degeneration and progressive paralysis. Dendritic cells in the peripheral tissues and the central nervous system (CNS) are responsible for T cell activation and helper cell differentiation. T cell activation depends on the interaction of T cell receptors (TCRs) with their cognate antigen peptide presented on the surface of antigen-presenting cells (APCs), including dendritic cells and macrophages. Regulated adhesion of T cells to APCs through leukocyte function-associated antigen-1 (LFA-1) is a crucial step in the generation of a sustained TCR-mediated signal. The binding of integrins, including LFA-1, is also important for T cell trafficking into the brain 2 . The small GTPase Rap1, which is activated by antigens and chemokines, is a potent stimulator of integrins, including LFA-1 (refs. 3,4), and promotes immunological synapse formation and leuko- cyte migration 5 . RGMa is a membrane-bound protein that was originally identified as an axon guidance molecule in the visual system 6 . RGMa also has a role in laminar patterning in Xenopus laevis and chick embryos and in cephalic neural tube closure in mouse embryos 7 . Although RGMa is recognized as having a crucial role in the nervous system, we found that RGMa was expressed in dendritic cells by expression analysis in mice. This finding prompted us to investigate the role of RGMa in the immune system. This study describes a previously unknown role of RGMa in modulating T cell–mediated immune responses. RESULTS RGMa regulates CD4 + T cell adhesion We first examined whether RGMa is expressed in dendritic cells. Following stimulation with lipopolysaccharide (LPS), the level of mRNA encoding RGMa was increased in the BMDCs (Fig. 1a). Western blot analysis confirmed that full-length RGMa (50-kDa bands) and the proteolytically cleaved mature form of RGMa (35-kDa bands) were upregulated in LPS-stimulated BDMCs (Fig. 1b). We then assessed whether CD4 + T cells express receptors for RGMa. Human RGMa-Fc bound to splenic CD4 + T cells in a concentration-dependent manner (Fig. 1c). Therefore, RGMa is induced in activated BMDCs and CD4 + T cells express receptors for RGMa. Next, we explored the effects of RGMa on CD4 + T cell adhesion. In T lymphocytes, TCR ligation results in the transient activation of Rap1 and an increase in the GTP-bound form of Rap1 at the interface of T cells and APCs, which potentiates subsequent T cell activation 3,5 . Rap1 was activated 5 min after stimulation of splenocytes and CD4 + T cells with RGMa (Fig. 1d). As TCR-induced adhesion requires Rap1 activation 3,4,8 , we determined whether the RGMa-induced 1 Department of Molecular Neuroscience, Graduate School of Medicine, Osaka University, Osaka, Japan. 2 Japan Science and Technology Agency, Core Research for Evolutional Science and Technology, Tokyo, Japan. 3 Department of Neurobiology, Graduate School of Medicine, Chiba University, Chiba, Japan. 4 Department of Neurology, Graduate School of Medicine, Chiba University, Chiba, Japan. 5 Department of Neurology, Kitasato University School of Medicine, Kanagawa, Japan. 6 Department of Immunopathology, Research Institute for Microbial Diseases, Osaka University, Osaka, Japan. 7 Institute for Medical Science of Aging, Aichi Medical University, Aichi, Japan. 8 These authors contributed equally to this work. Correspondence should be addressed to T.Y. ([email protected]). Received 11 August 2010; accepted 2 February 2011; published online 20 March 2011; doi:10.1038/nm.2321 RGMa modulates T cell responses and is involved in autoimmune encephalomyelitis Rieko Muramatsu 1,2,8 , Takekazu Kubo 3,8 , Masahiro Mori 4 , Yuka Nakamura 1,2 , Yuki Fujita 1,2 , Tsugio Akutsu 5 , Tatsusada Okuno 6 , Junko Taniguchi 4 , Atsushi Kumanogoh 6 , Mari Yoshida 7 , Hideki Mochizuki 2,5 , Satoshi Kuwabara 4 & Toshihide Yamashita 1–3 In multiple sclerosis, activated CD4 + T cells initiate an immune response in the brain and spinal cord, resulting in demyelination, degeneration and progressive paralysis. Repulsive guidance molecule-a (RGMa) is an axon guidance molecule that has a role in the visual system and in neural tube closure. Our study shows that RGMa is expressed in bone marrow–derived dendritic cells (BMDCs) and that CD4 + T cells express neogenin, a receptor for RGMa. Binding of RGMa to CD4 + T cells led to activation of the small GTPase Rap1 and increased adhesion of T cells to intracellular adhesion molecule-1 (ICAM-1). Neutralizing antibodies to RGMa attenuated clinical symptoms of mouse myelin oligodendrocyte glycoprotein (MOG)-induced experimental autoimmune encephalomyelitis (EAE) and reduced invasion of inflammatory cells into the CNS. Silencing of RGMa in MOG-pulsed BMDCs reduced their capacity to induce EAE following adoptive transfer to naive C57BL/6 mice. CD4 + T cells isolated from mice treated with an RGMa-specific antibody showed diminished proliferative responses and reduced interferon-g (IFN-g), interleukin-2 (IL-2), IL-4 and IL-17 secretion. Incubation of PBMCs from patients with multiple sclerosis with an RGMa-specific antibody reduced proliferative responses and pro-inflammatory cytokine expression. These results demonstrate that an RGMa-specific antibody suppresses T cell responses, and suggest that RGMa could be a promising molecular target for the treatment of multiple sclerosis. © 2011 Nature America, Inc. All rights reserved.

Welcome message from author
This document is posted to help you gain knowledge. Please leave a comment to let me know what you think about it! Share it to your friends and learn new things together.
Transcript

A r t i c l e s
488 VOLUME 17 | NUMBER 4 | APRIL 2011 nAture medicine
In multiple sclerosis, activated CD4+ T cells specific for components of the myelin sheath initiate an immune response in the white matter of the brain and spinal cord1, resulting in demyelination, degeneration and progressive paralysis. Dendritic cells in the peripheral tissues and the central nervous system (CNS) are responsible for T cell activation and helper cell differentiation. T cell activation depends on the interaction of T cell receptors (TCRs) with their cognate antigen peptide presented on the surface of antigen-presenting cells (APCs), including dendritic cells and macrophages. Regulated adhesion of T cells to APCs through leukocyte function-associated antigen-1 (LFA-1) is a crucial step in the generation of a sustained TCR-mediated signal. The binding of integrins, including LFA-1, is also important for T cell trafficking into the brain2. The small GTPase Rap1, which is activated by antigens and chemokines, is a potent stimulator of integrins, including LFA-1 (refs. 3,4), and promotes immunological synapse formation and leuko-cyte migration5.
RGMa is a membrane-bound protein that was originally identified as an axon guidance molecule in the visual system6. RGMa also has a role in laminar patterning in Xenopus laevis and chick embryos and in cephalic neural tube closure in mouse embryos7. Although RGMa is recognized as having a crucial role in the nervous system, we found that RGMa was expressed in dendritic cells by expression analysis in mice. This finding prompted us to investigate the role of RGMa in the
immune system. This study describes a previously unknown role of RGMa in modulating T cell–mediated immune responses.
RESULTSRGMa regulates CD4+ T cell adhesionWe first examined whether RGMa is expressed in dendritic cells. Following stimulation with lipopolysaccharide (LPS), the level of mRNA encoding RGMa was increased in the BMDCs (Fig. 1a). Western blot analysis confirmed that full-length RGMa (50-kDa bands) and the proteolytically cleaved mature form of RGMa (35-kDa bands) were upregulated in LPS-stimulated BDMCs (Fig. 1b). We then assessed whether CD4+ T cells express receptors for RGMa. Human RGMa-Fc bound to splenic CD4+ T cells in a concentration-dependent manner (Fig. 1c). Therefore, RGMa is induced in activated BMDCs and CD4+ T cells express receptors for RGMa.
Next, we explored the effects of RGMa on CD4+ T cell adhesion. In T lymphocytes, TCR ligation results in the transient activation of Rap1 and an increase in the GTP-bound form of Rap1 at the interface of T cells and APCs, which potentiates subsequent T cell activation3,5. Rap1 was activated 5 min after stimulation of splenocytes and CD4+ T cells with RGMa (Fig. 1d). As TCR-induced adhesion requires Rap1 activation3,4,8, we determined whether the RGMa-induced
1Department of Molecular Neuroscience, Graduate School of Medicine, Osaka University, Osaka, Japan. 2Japan Science and Technology Agency, Core Research for Evolutional Science and Technology, Tokyo, Japan. 3Department of Neurobiology, Graduate School of Medicine, Chiba University, Chiba, Japan. 4Department of Neurology, Graduate School of Medicine, Chiba University, Chiba, Japan. 5Department of Neurology, Kitasato University School of Medicine, Kanagawa, Japan. 6Department of Immunopathology, Research Institute for Microbial Diseases, Osaka University, Osaka, Japan. 7Institute for Medical Science of Aging, Aichi Medical University, Aichi, Japan. 8These authors contributed equally to this work. Correspondence should be addressed to T.Y. ([email protected]).
Received 11 August 2010; accepted 2 February 2011; published online 20 March 2011; doi:10.1038/nm.2321
RGMa modulates T cell responses and is involved in autoimmune encephalomyelitisRieko Muramatsu1,2,8, Takekazu Kubo3,8, Masahiro Mori4, Yuka Nakamura1,2, Yuki Fujita1,2, Tsugio Akutsu5, Tatsusada Okuno6, Junko Taniguchi4, Atsushi Kumanogoh6, Mari Yoshida7, Hideki Mochizuki2,5, Satoshi Kuwabara4 & Toshihide Yamashita1–3
In multiple sclerosis, activated CD4+ T cells initiate an immune response in the brain and spinal cord, resulting in demyelination, degeneration and progressive paralysis. Repulsive guidance molecule-a (RGMa) is an axon guidance molecule that has a role in the visual system and in neural tube closure. Our study shows that RGMa is expressed in bone marrow–derived dendritic cells (BMDCs) and that CD4+ T cells express neogenin, a receptor for RGMa. Binding of RGMa to CD4+ T cells led to activation of the small GTPase Rap1 and increased adhesion of T cells to intracellular adhesion molecule-1 (ICAM-1). Neutralizing antibodies to RGMa attenuated clinical symptoms of mouse myelin oligodendrocyte glycoprotein (MOG)-induced experimental autoimmune encephalomyelitis (EAE) and reduced invasion of inflammatory cells into the CNS. Silencing of RGMa in MOG-pulsed BMDCs reduced their capacity to induce EAE following adoptive transfer to naive C57BL/6 mice. CD4+ T cells isolated from mice treated with an RGMa-specific antibody showed diminished proliferative responses and reduced interferon-g (IFN-g), interleukin-2 (IL-2), IL-4 and IL-17 secretion. Incubation of PBMCs from patients with multiple sclerosis with an RGMa-specific antibody reduced proliferative responses and pro-inflammatory cytokine expression. These results demonstrate that an RGMa-specific antibody suppresses T cell responses, and suggest that RGMa could be a promising molecular target for the treatment of multiple sclerosis.
© 2
011
Nat
ure
Am
eric
a, In
c. A
ll ri
gh
ts r
eser
ved
.

A r t i c l e s
nAture medicine VOLUME 17 | NUMBER 4 | APRIL 2011 489
Rap1 activation alters T cell adhesion. RGMa-stimulated CD4+ T cells showed stronger adhesion to ICAM-1 when compared with the control CD4+ T cells (Fig. 1e). Moreover, a selective inhibitor of Rap1, GGTI-298, abolished RGMa-induced adhesive activity in CD4+ T cells. These results suggest that RGMa enhances the adhesive activity of CD4+ T cells through Rap1 activation.
Expression of RGMa and neogenin in EAE and multiple sclerosisTo assess the role of RGMa in vivo, we examined the expression of RGMa and neogenin, a receptor for RGMa, in the spleens, lymph nodes and spinal cord sections of C57BL/6 mice with EAE induced by MOG. Immunohistochemical analyses reveal that the major-ity of the CD11c+ cells in these tissues expressed RGMa weakly (Fig. 2a and Supplementary Fig. 1a). RGMa expression increased in CD11c+ cells after the induction of EAE (Fig. 2a and Supplementary Fig. 1a). Although RGMa was also expressed in mouse plasmacytoid dendritic cell antigen-1 (mPDCA-1)-positive cells in these tissues, its expression was unchanged after the induction of EAE (Fig. 2b and Supplementary Fig. 1b). Furthermore, CD4+ T cells in these tissues expressed neogenin. Expression of neogenin did not change during the observation period after the induction of EAE (Fig. 2c and Supplementary Fig. 1c). Next, we assessed Rap1 activity in situ to determine whether Rap1 is activated in CD4+ T cells in the CNS after induction of EAE. Activated Rap1 was present in CD4+ T cells in the cervical spinal cords of EAE mice but not in control mice (Fig. 2d).
We performed immunohistochemical analyses on autopsied sam-ples of brain and spinal cord obtained from eight individuals with multiple sclerosis. We evaluated the presence of mature and immature dendritic cells in these tissues by using antibodies to CD83 and CD209 (also known as DC-SIGN), respectively9. CD83+ and
CD209+ dendritic cells were immunoreactive for RGMa in the brain and spinal cord sections of individuals with multiple sclerosis (Fig. 2e), but not in sections from control brains (data not shown). To examine the expression of neogenin in human cells, we puri-fied peripheral blood mononuclear cells (PBMCs) from individuals with relapsing-remitting multiple sclerosis. CD3+ T cells from these samples expressed neogenin at the time of relapse and during the remission phase (Fig. 2f). Neogenin expression did not differ in PBMCs from individuals with multiple sclerosis or healthy controls (Fig. 2g). Furthermore, neogenin was expressed in CD3+ T cells in brain and spinal cord sections from individuals with multiple sclerosis (Supplementary Fig. 1d).
RGMa-specific antibodies attenuate clinical signs in EAETo determine whether RGMa inhibition alters the clinical severity of EAE, we intraperitoneally administered RGMa-specific antibod-ies10 or control rabbit IgGs to mice on days 7 and 10 after immuni-zation with MOG. The antibody was detectable in the spleen and lymph nodes at day 7 after administration (Supplementary Fig. 2a). RGMa-specific antibody treatment reduced the clinical severity of the disease (Fig. 3a) and the percentage of mice that presented with clinical signs of EAE (Fig. 3b), but did not delay the day of onset of EAE clinical symptoms (Fig. 3c). However, the mean maximum EAE score (Fig. 3d) and the cumulative EAE scores (Fig. 3e) were lower in RGMa-specific antibody–treated mice as compared with control IgG–treated mice. These data show that RGMa-specific antibody treatment attenuates the severity of EAE.
RGMa-specific antibody treatment reduced the infiltration of cells in the spinal cord at day 21 after the induction of EAE in mice (Fig. 3f,g). The accumulation of CD4+, CD11b+, F4/80+, B220+, CD11c+ and mPDCA-1+ cells in the spinal cord (Fig. 3h) of EAE mice decreased as a result of treatment with the RGMa-specific anti-body. Myelin loss and axonal damage in EAE mice was also reduced following treatment with the RGMa-specific antibody (Fig. 3i,j) Thus, RGMa-specific antibody treatment reduces inflammatory cell accu-mulation and histological damage following the induction of EAE.
A role for RGMa in T cell activation in EAETo confirm whether RGMa expressed on dendritic cells modu-lates EAE, we carried out adoptive transfer experiments with MOG-pulsed BMDCs following RGMa knockdown. Transfection of BMDCs with RGMa siRNA downregulated RGMa expression (Supplementary Fig. 2b). Recipient C57BL/6 mice injected intra-venously with RGMa siRNA-transfected, MOG-pulsed BMDCs had moderately reduced clinical disease scores as compared with mice injected with control siRNA–transfected, MOG-pulsed BMDCs
LPS (µg ml–1)
Control 0.01 0.1 1
Rel
ativ
e in
tens
ity o
fR
GM
a m
RN
A
0 2 4 6 8 100
20
40
60
80
100
Per
cent
age
of R
GM
abi
ndin
g
RGMa
RGMa
Splenocyte CD4+ T cell
Total Rap1
Splenocyte CD4+ T cell
0
1
2
3
4
5
6
*
*
Control 0.01 0.1 1
LPS (µg ml–1)
0
2
4
6
8
10
12
RGMaGGTI-298
+
Per
cent
age
ofad
hesi
on
+++
** ****
0123456789
Human-RGMa-Fc (µg ml–1)
*
*
+–+–
+ +– –
––
––
RGMa(50 kDa)
ba
c
d
e
α-tubulin
01234567
Rel
ativ
e in
tens
ity o
fR
GM
a ex
pres
sion
LPS (µg ml–1)
Control 0.01 0.1 1
****
******
**
50 kDa35 kDa
Pull-downRap1
Rel
ativ
e R
ap1
activ
ity
RGMa(35 kDa)
Figure 1 RGMa activates Rap1 and regulates CD4+ T cell adhesion. (a) Quantitative RT-PCR showing relative expression level of mRNA encoding RGMa in LPS-stimulated BMDCs at the indicated concentrations for 24 h. (b) Western blot analysis of RGMa (50-kDa and 35-kDa bands; top rows) and α-tubulin (bottom row). Relative expression of RGMa in the BMDCs. (c) Binding of human RGMa-Fc to splenic CD4+ T cells. (d) Top, representative western blot images obtained with a Rap1 pull-down assay. The bottom graph shows the relative Rap1 activity, as determined by the band intensity of RalGDS-bound Rap1 normalized to that of total Rap1 in the lysates. (e) CD4+ T cell adhesion to ICAM-1 in the presence and absence of GGTI-298, a selective Rap1 inhibitor. Error bars are the mean ± s.e.m. of three or four independent experiments. *P < 0.05 and **P < 0.01 by one-way analysis of variance followed by Tukey’s test for a,b and e and by Student’s t test for d.
© 2
011
Nat
ure
Am
eric
a, In
c. A
ll ri
gh
ts r
eser
ved
.

A r t i c l e s
490 VOLUME 17 | NUMBER 4 | APRIL 2011 nAture medicine
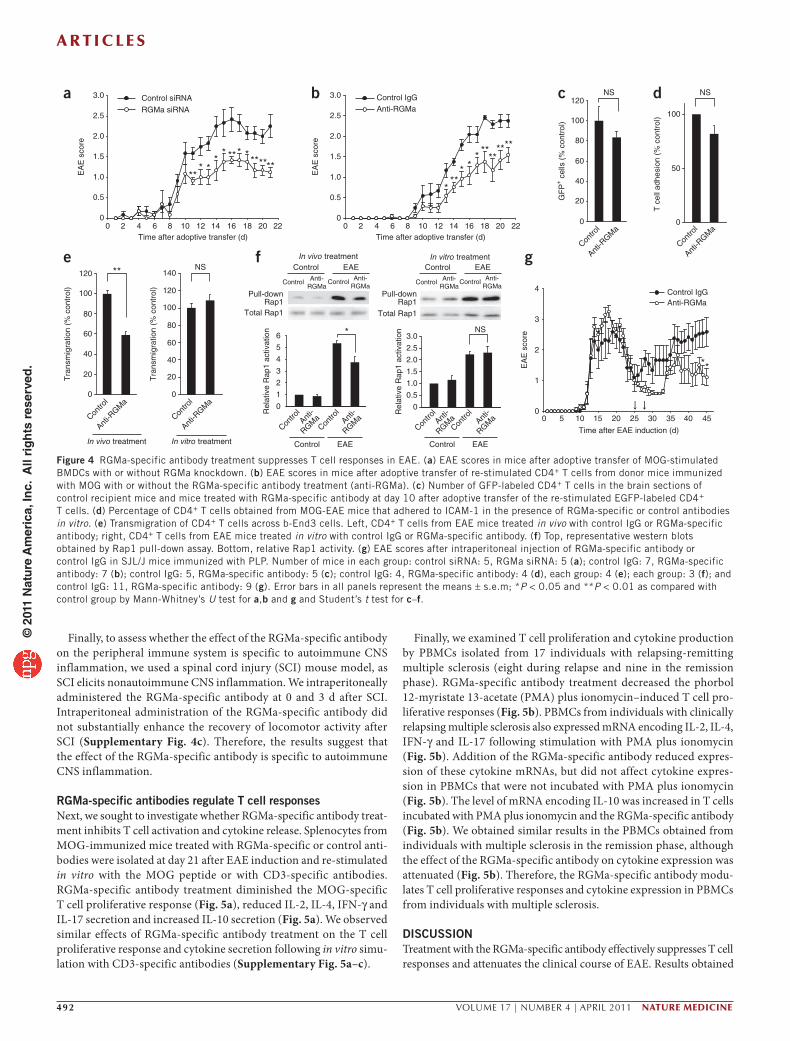
(Fig. 4a). The adoptive transfer of RGMa siRNA–transfected BMDCs resulted in reduced F4/80+ cell infiltration into the spinal cord at day 21 after EAE induction (Supplementary Fig. 2c).
To further address whether dendritic cell–derived RGMa has a role in T cell activation, we immunized C57BL/6 mice with MOG, followed by treatment with RGMa-specific antibodies or control antibodies at days −2, 0 and 5 after immunization. On day 10 after immunization, we collected cells from the spleen and draining lymph nodes of the treated mice, re-stimulated these cells with MOG peptide, purified CD4+ T cells from these cells and then adoptively transferred them into naïve recipient mice. The EAE clinical scores (see Supplementary Methods) were moderately reduced in C57BL/6 mice that were injected with CD4+ T cells from RGMa-specific antibody–treated EAE mice as compared with mice injected with CD4+ T cells from the IgG control antibody–treated mice (Fig. 4b).
Next, we assessed whether the RGMa-specific antibody directly inhibits T cell trafficking to the CNS. We immunized transgenic mice that ubiquitously express EGFP (CAG-EGFP mice) with MOG, isolated splenocytes from these mice 7 d after immunization and re-stimulated splenocytes with MOG for 3 d. We treated naïve recip-ient C57BL/6 mice with control IgG or RGMa-specific antibody 3 d before and at the time of transfer of the re-stimulated CD4+ T cells. At day 10 after adoptive transfer, there was no significant
difference in the infiltration of EGFP-labeled T cells into the CNS of control or RGMa-specific antibody–treated mice (Fig. 4c). Consistent with these in vivo observations, the RGMa-specific antibody did not inhibit adhesion of splenic CD4+ T cells from EAE mice to ICAM-1 in vitro (Fig. 4d). This result excludes the possibility that the antibody directly interfered with the adhesion of CD4+ T cells to ICAM-1. Furthermore, using an in vitro model of the blood-brain barrier consisting of brain-derived capillary endothelial b-End3 cells, splenic CD4+ T cells from MOG-EAE mice transmigrated more readily across the b-End3 cells than did CD4+ T cells isolated from EAE mice treated (in vivo) with the RGMa-specific antibody (Fig. 4e). However, transmigration of T cells was not altered fol-lowing direct addition of RGMa-specific antibody in vitro to splenic CD4+ T cells (Fig. 4e). Because Rap1 activity is associated with increased adhesion of T cells, we measured Rap1 activity by pull-down assay and found that Rap1 activity was reduced in CD4+ T cells isolated from EAE-mice treated with the RGMa-specific antibody (Fig. 4f). However, we did not observe marked suppres-sion of Rap1 activity following in vitro treatment of CD4+ T cells with the RGMa-specific antibody (Fig. 4f). Thus, we obtained no evidence suggesting that the RGMa-specific antibody directly mod-ulates the trafficking of T cells to the CNS.
*
Lymph node
*
Overlay
Overlay
0
0.5
1.0
1.5
2.0
2.5
3.0
Mul
tiple
scl
eros
is
Rel
ativ
e flu
ores
cenc
ein
tens
ity o
f RG
Ma
expr
essi
on
Rel
ativ
e flu
ores
cenc
ein
tens
ity o
f RG
Ma
expr
essi
on
EAE
** *** **
****
Con
trol
GS
TG
ST
-R
alG
DS
Con
trol
GS
TG
ST
-R
alG
DSE
AE
Con
trol
Control
EAE
EAE
Rel
ativ
e flu
ores
cenc
ein
tens
ity o
f neo
geni
nex
pres
sion
0
0.5
1.0
1.5
Control 1 week 2 weeks 3 weeks
Control 1 week 2 weeks 3 weeks
Control 1 week 2 weeks 3 weeks
EAE
0
0.5
1.0
1.5
2.0
2.5
3.0
Spinal cordLymph nodeSpleen
Rem
issi
onR
elap
seC
ontr
ol
Mul
tiple
scl
eros
is
Spinal cord
Spleen
Spinal cordLymph nodeSpleen
Rel
ativ
e flu
ores
cenc
ein
tens
ity o
f neo
geni
nRem
ission
Relaps
e
Contro
l
Multiple sclerosis
RGMa
Control
EAE
00.20.40.60.81.01.2
Control
EAE
a
b
c
d e
f g
Spi
nal
cord
Bra
in
CD83
mPDCA-1
CD4 Neogenin
CD4 Activated Rap1 Overlay RGMa CD209 RGMa
CD3 Neogenin
Overlay
Overlay
OverlayOverlay
Overlay
*
OverlayCD11c RGMa OverlayFigure 2 Expression of RGMa and neogenin in MOG-induced EAE and multiple sclerosis tissue. (a) Frozen sections of the spleen immunostained for RGMa (labeled with Alexa Fluor 568) and CD11c (labeled with Alexa Fluor 488) in EAE and control mice. The graph shows the relative expression of RGMa in CD11c+ cells in the lymph node, spleen and spinal cord before (control) and 1, 2 and 3 weeks after immunization with MOG. n = 37–51 cells for each mouse. *P < 0.05 and **P < 0.01 by one-way analysis of variance followed by Tukey’s test. (b) The sections (same sections as shown in a) of the spleen immunostained for RGMa (labeled with Alexa Fluor 568) and plasmacytoid dendritic cells (mPDCA-1) (labeled with Alexa Fluor 488). The graph shows the relative expression of RGMa in mPDCA-1+ cells. n = 40–48 cells for each mouse. (c) Expression of neogenin (labeled with Alexa Fluor 568) in CD4+ T cells (labeled with Alexa Fluor 488) in the spleen. The graph shows the relative expression of neogenin in CD4+ T cells. (d) In situ Rap1 pull-down assay (labeled with Alexa Fluor 568) in CD4+ T cells (labeled with Alexa Fluor 488) in cervical spinal cord tissue sections of EAE and control mice. (e) Multiple sclerosis brain and spinal cord tissues sections double-labeled for RGMa (with Alexa Fluor 488) in combination with CD83 or CD209 (DC-SIGN) (labeled with Alexa Fluor 568) n = 8. (f) Expression of neogenin (labeled with Alexa Fluor 488) in human CD3+ cells (labeled with Alexa Fluor 568) in relapsing-remitting multiple sclerosis and healthy control PBMCs. (g) Relative fluorescence intensity of neogenin in the immunohistochemical analysis. Error bars represent the mean ± s.e.m. of 3 or 4 independent experiments. Scale bars in a–e, 50 µm for low (overlay images in a, b, and c) and 10 µm for high (all other images) magnification images; scale bar in f, 5 µm.
© 2
011
Nat
ure
Am
eric
a, In
c. A
ll ri
gh
ts r
eser
ved
.

A r t i c l e s
nAture medicine VOLUME 17 | NUMBER 4 | APRIL 2011 491
In contrast to MOG, which causes chronic EAE, proteolipid pro-tein (PLP)139–151 peptide induces relapsing-remitting EAE in SJL/J mice, which depends on continued activation of T cells via endo-genous myelin epitopes (epitope spreading)11. We intraperitoneally administered the RGMa-specific antibody or control rabbit IgG to mice on days 25 and 28 after immunization with PLP139–151. These time points correspond to the late stage of the first paralytic inci-dent (a clinical feature of EAE). Treatment with the RGMa-specific antibody was moderately effective in reducing the clinical severity of relapses (Fig. 4g). Furthermore, it is known that T cell activation due to epitope spreading occurs directly in the CNS12. Indeed, we detected the presence of the RGMa-specific antibody in sections of the brain and the spinal cord after intraperitoneal administration (Supplementary Fig. 2d), suggesting the RGMa-specific antibody inhibits the activation of T cells by local APCs, possibly dendritic cells, in the CNS.
The role of RGMa in macrophages and microgliaNext, we performed additional experiments to characterize the effects of RGMa in other cell types. Macrophages expressed neogenin
(Supplementary Fig. 3a,b) but not RGMa (Supplementary Fig. 3c,d), whereas microglia express RGMa (ref. 10). In B cells, B220 and RGMa did not colocalize in spinal cord sections of MOG-EAE mice (Supplementary Fig. 3c).
To assess whether the neogenin expressed in macrophages plays a role in EAE, we used CD11b-DTR mice in which macrophages can be selectively depleted13. To specifically knockdown neogenin in macrophages, we adoptively transferred macrophages with or with-out neogenin knockdown (Supplementary Fig. 3e) into CD11b-DTR mice after depletion of host macrophages. EAE was then induced via MOG immunization in the recipient mice. The clinical severity of the disease did not differ between the recipient mice with wild-type macrophages or macrophage-specific neogenin knockdown (Supplementary Fig. 4a). Next, we attempted to inhibit the RGM-neogenin signals in microglia in the CNS by delivering the RGMa-specific antibody or control IgG intrathecally. The clinical severity of the resultant MOG-induced EAE did not differ between the two mouse groups (Supplementary Fig. 4b). Thus, RGM-neogenin signals in macrophages and microglia do not appear to contribute significantly to the clinical course of EAE.
h
EA
E s
core
Inci
denc
e (%
)
55.6%
100%
Day
of o
nset
Max
imum
sco
re
Cum
ulat
ive
scor
e
a b
d e
f g
c
Anti-RGMa
Control IgG
****
**** **
****
**
Time after EAE induction (d)In
flam
mat
ory
inde
x
0
0.5
1.0
1.5
2.0
2.5
3.0
3.5
Contro
l
Contro
l
Contro
l
0
1
2
3
4
0
20
40
60
80
100
02468
10121416
0
5
10
15
20
25
0 2 4 6 8 10 12 14 16 18 20 220
0.5
1.0
1.5
2.0
2.5
3.0
3.5
iControl
CD
4C
D11
bF
4/80
CD
11c
B22
0m
PD
CA
-1
Treatment
AP
P
Control
j
** **
Flu
orom
yelin
DA
PI
Ove
rlay
H&
ENS
Anti-
RGMa
Contro
lAnt
i-
RGMa
Control Anti-RGMa
Control Anti-RGMa
Contro
lAnt
i-
RGMa
Anti-
RGMa
Anti-RGMa
Anti-R
GMa
Anti-RGMa
Figure 3 RGMa-specific antibody treatment reduces the severity of MOG-induced EAE. (a) Clinical EAE disease scores (EAE score) in mice treated with control IgGs (n = 16) and RGMa-specific antibodies (anti-RGMa; n = 9). Data represent the mean ± s.e.m. *P < 0.05, and **P < 0.01 by Mann-Whitney’s U test. The arrows represent the time points of antibody administration. (b) Incidence of EAE clinical signs in MOG-induced EAE mice treated with control IgGs or RGMa-specific antibodies. (c) The average day of disease onset between the two treatment groups. (d) The mean ± s.e.m. of the maximum EAE score of each mouse with EAE. (e) The mean ± s.e.m. of the cumulative EAE scores. *P < 0.05 and **P < 0.01 by Student’s t test. NS, not significant. (f) H&E staining of the cervical spinal cord in RGMa-specific antibody– and control IgG–treated mice. (g) Histological scores (inflammatory index; see Supplementary Methods) for the inflammatory lesions. Error bars represent the mean ± s.e.m. (control IgG, n = 6; RGMa-specific antibody, n = 5). *P < 0.01 by Student’s t test. (h) Representative images of CD4+, CD11b+, F4/80+, B220+, CD11c+ and mPDCA-1+ cells in the spinal cord of control IgG- and RGMa-specific antibody–treated EAE mice. (i,j) FluoroMyelin (i) and APP (j) staining in the spinal cord of IgG- and RGMa-specific antibody–treated mice. Scale bars in f,h,i, 200 µm; scale bar in j, 100 µm.
© 2
011
Nat
ure
Am
eric
a, In
c. A
ll ri
gh
ts r
eser
ved
.
A r t i c l e s
492 VOLUME 17 | NUMBER 4 | APRIL 2011 nAture medicine
Finally, to assess whether the effect of the RGMa-specific antibody on the peripheral immune system is specific to autoimmune CNS inflammation, we used a spinal cord injury (SCI) mouse model, as SCI elicits nonautoimmune CNS inflammation. We intraperitoneally administered the RGMa-specific antibody at 0 and 3 d after SCI. Intraperitoneal administration of the RGMa-specific antibody did not substantially enhance the recovery of locomotor activity after SCI (Supplementary Fig. 4c). Therefore, the results suggest that the effect of the RGMa-specific antibody is specific to autoimmune CNS inflammation.
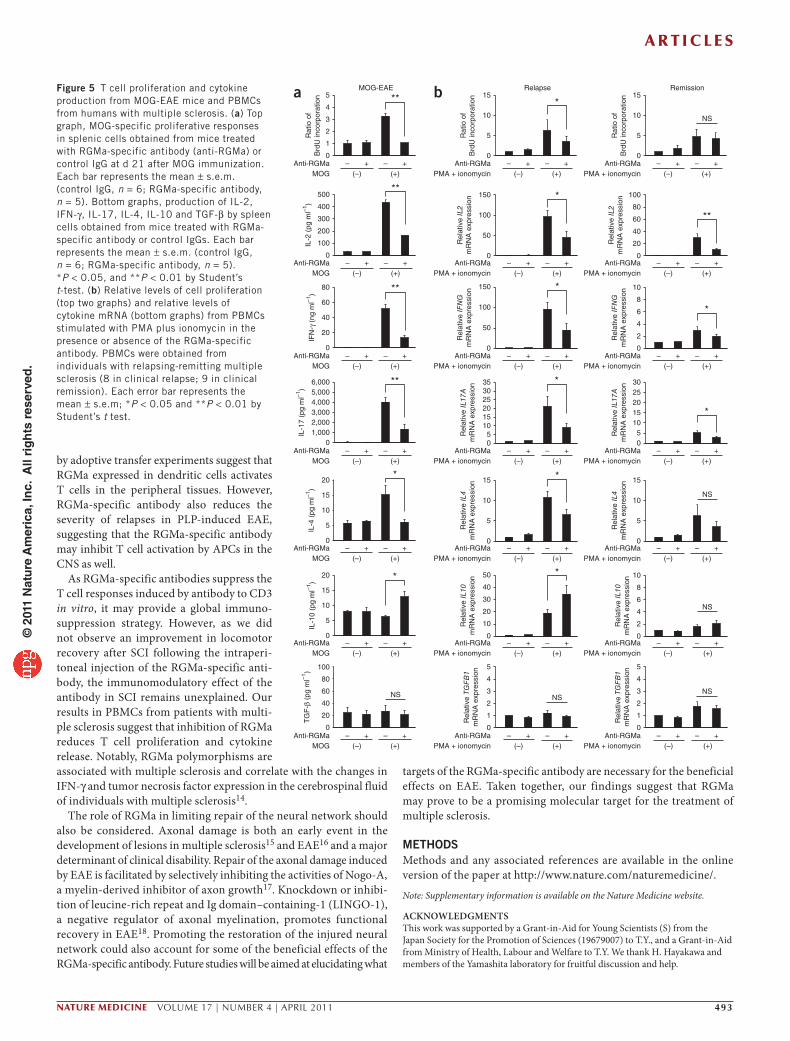
RGMa-specific antibodies regulate T cell responsesNext, we sought to investigate whether RGMa-specific antibody treat-ment inhibits T cell activation and cytokine release. Splenocytes from MOG-immunized mice treated with RGMa-specific or control anti-bodies were isolated at day 21 after EAE induction and re-stimulated in vitro with the MOG peptide or with CD3-specific antibodies. RGMa-specific antibody treatment diminished the MOG-specific T cell proliferative response (Fig. 5a), reduced IL-2, IL-4, IFN-γ and IL-17 secretion and increased IL-10 secretion (Fig. 5a). We observed similar effects of RGMa-specific antibody treatment on the T cell proliferative response and cytokine secretion following in vitro simu-lation with CD3-specific antibodies (Supplementary Fig. 5a–c).
Finally, we examined T cell proliferation and cytokine production by PBMCs isolated from 17 individuals with relapsing-remitting multiple sclerosis (eight during relapse and nine in the remission phase). RGMa-specific antibody treatment decreased the phorbol 12-myristate 13-acetate (PMA) plus ionomycin–induced T cell pro-liferative responses (Fig. 5b). PBMCs from individuals with clinically relapsing multiple sclerosis also expressed mRNA encoding IL-2, IL-4, IFN-γ and IL-17 following stimulation with PMA plus ionomycin (Fig. 5b). Addition of the RGMa-specific antibody reduced expres-sion of these cytokine mRNAs, but did not affect cytokine expres-sion in PBMCs that were not incubated with PMA plus ionomycin (Fig. 5b). The level of mRNA encoding IL-10 was increased in T cells incubated with PMA plus ionomycin and the RGMa-specific antibody (Fig. 5b). We obtained similar results in the PBMCs obtained from individuals with multiple sclerosis in the remission phase, although the effect of the RGMa-specific antibody on cytokine expression was attenuated (Fig. 5b). Therefore, the RGMa-specific antibody modu-lates T cell proliferative responses and cytokine expression in PBMCs from individuals with multiple sclerosis.
DISCUSSIONTreatment with the RGMa-specific antibody effectively suppresses T cell responses and attenuates the clinical course of EAE. Results obtained
ba
e
0 2 4 6 8 1210 14 16 18 20 220
0.5
1.0
1.5
2.0
2.5
3.0
0 5 10 20 30 4025 35 45150
1
2
3
4
0
0.5
1.0
1.5
2.0
2.5
3.0
***
* **** **
****
*** *
** ***
*******
**
c d
GF
P+ c
ells
(%
con
trol
)
T c
ell a
dhes
ion
(% c
ontr
ol)
0
50
100
0
20
100
120
80
60
40
Time after EAE induction (d)
Time after adoptive transfer (d)0 2 4 6 8 1210 14 16 18 20 22
Time after adoptive transfer (d)
Control siRNA Control IgGAnti-RGMa
Control IgGAnti-RGMa
f
Tra
nsm
igra
tion
(% c
ontr
ol)
0
20
100
120
80
60
40
0
20
100
120
80
60
40
140
Anti-R
GMa
Contro
l
Anti-R
GMa
Contro
l
**
Tra
nsm
igra
tion
(% c
ontr
ol)
In vivo treatment In vitro treatment
Anti-R
GMa
Contro
l
Anti-R
GMa
Contro
l
gR
elat
ive
Rap
1 ac
tivat
ion
Total Rap1
In vivo treatment In vitro treatment
Rel
ativ
e R
ap1
activ
atio
n
Pull-downRap1
Anti-RGMa
ControlAnti-
RGMaControl
Control EAE
EA
E s
core
EA
E s
core
EA
E s
core
Anti-RGMa
ControlAnti-
RGMaControl
Control EAE
0
0.5
1.0
1.5
2.0
2.5
3.0
0
1
2
3
4
5
6
Anti-
RGMa
Contro
lAnt
i-
RGMa
Contro
l
Control EAE
Anti-
RGMa
Contro
lAnt
i-
RGMa
Contro
l
Control EAE
*
NS
NSNS
NS
Total Rap1
Pull-downRap1
RGMa siRNA
Figure 4 RGMa-specific antibody treatment suppresses T cell responses in EAE. (a) EAE scores in mice after adoptive transfer of MOG-stimulated BMDCs with or without RGMa knockdown. (b) EAE scores in mice after adoptive transfer of re-stimulated CD4+ T cells from donor mice immunized with MOG with or without the RGMa-specific antibody treatment (anti-RGMa). (c) Number of GFP-labeled CD4+ T cells in the brain sections of control recipient mice and mice treated with RGMa-specific antibody at day 10 after adoptive transfer of the re-stimulated EGFP-labeled CD4+ T cells. (d) Percentage of CD4+ T cells obtained from MOG-EAE mice that adhered to ICAM-1 in the presence of RGMa-specific or control antibodies in vitro. (e) Transmigration of CD4+ T cells across b-End3 cells. Left, CD4+ T cells from EAE mice treated in vivo with control IgG or RGMa-specific antibody; right, CD4+ T cells from EAE mice treated in vitro with control IgG or RGMa-specific antibody. (f) Top, representative western blots obtained by Rap1 pull-down assay. Bottom, relative Rap1 activity. (g) EAE scores after intraperitoneal injection of RGMa-specific antibody or control IgG in SJL/J mice immunized with PLP. Number of mice in each group: control siRNA: 5, RGMa siRNA: 5 (a); control IgG: 7, RGMa-specific antibody: 7 (b); control IgG: 5, RGMa-specific antibody: 5 (c); control IgG: 4, RGMa-specific antibody: 4 (d), each group: 4 (e); each group: 3 (f); and control IgG: 11, RGMa-specific antibody: 9 (g). Error bars in all panels represent the means ± s.e.m; *P < 0.05 and **P < 0.01 as compared with control group by Mann-Whitney’s U test for a,b and g and Student’s t test for c–f.
© 2
011
Nat
ure
Am
eric
a, In
c. A
ll ri
gh
ts r
eser
ved
.
A r t i c l e s
nAture medicine VOLUME 17 | NUMBER 4 | APRIL 2011 493
by adoptive transfer experiments suggest that RGMa expressed in dendritic cells activates T cells in the peripheral tissues. However, RGMa-specific antibody also reduces the severity of relapses in PLP-induced EAE, suggesting that the RGMa-specific antibody may inhibit T cell activation by APCs in the CNS as well.
As RGMa-specific antibodies suppress the T cell responses induced by antibody to CD3 in vitro, it may provide a global immuno-suppression strategy. However, as we did not observe an improvement in locomotor recovery after SCI following the intraperi-toneal injection of the RGMa-specific anti-body, the immunomodulatory effect of the antibody in SCI remains unexplained. Our results in PBMCs from patients with multi-ple sclerosis suggest that inhibition of RGMa reduces T cell proliferation and cytokine release. Notably, RGMa polymorphisms are associated with multiple sclerosis and correlate with the changes in IFN-γ and tumor necrosis factor expression in the cerebrospinal fluid of individuals with multiple sclerosis14.
The role of RGMa in limiting repair of the neural network should also be considered. Axonal damage is both an early event in the development of lesions in multiple sclerosis15 and EAE16 and a major determinant of clinical disability. Repair of the axonal damage induced by EAE is facilitated by selectively inhibiting the activities of Nogo-A, a myelin-derived inhibitor of axon growth17. Knockdown or inhibi-tion of leucine-rich repeat and Ig domain–containing-1 (LINGO-1), a negative regulator of axonal myelination, promotes functional recovery in EAE18. Promoting the restoration of the injured neural network could also account for some of the beneficial effects of the RGMa-specific antibody. Future studies will be aimed at elucidating what
targets of the RGMa-specific antibody are necessary for the beneficial effects on EAE. Taken together, our findings suggest that RGMa may prove to be a promising molecular target for the treatment of multiple sclerosis.
METhODSMethods and any associated references are available in the online version of the paper at http://www.nature.com/naturemedicine/.
Note: Supplementary information is available on the Nature Medicine website.
AcKNOwledgMeNTSThis work was supported by a Grant-in-Aid for Young Scientists (S) from the Japan Society for the Promotion of Sciences (19679007) to T.Y., and a Grant-in-Aid from Ministry of Health, Labour and Welfare to T.Y. We thank H. Hayakawa and members of the Yamashita laboratory for fruitful discussion and help.
ba
0
100
200
300
400
500
0
1
2
3
4
5
0
20
40
60
80
01,0002,0003,0004,0005,0006,000
0
5
10
15
20
0
5
10
15
20
0
20
40
60
80
100
MOG-EAE
*
*
**
**
**
**
IL-2
(pg
ml–1
)IF
N-γ
(ng
ml–1
)IL
-4 (
pg m
l–1)
IL-1
0 (p
g m
l–1)
TG
F-β
(pg
ml–1
)
+(–)MOG (+)
+––
+(–)MOG (+)
+––
+(–)MOG (+)
+––
+(–)MOG (+)
+––
+(–)MOG (+)
+––
+(–)MOG (+)
+––
IL-1
7 (p
g m
l–1)
Anti-RGMa
Anti-RGMa
Anti-RGMa
Anti-RGMa
Anti-RGMa
Anti-RGMa
Anti-RGMa +(–)MOG (+)
+––
NS
Rat
io o
fB
rdU
inco
rpor
atio
n
Relapse
0
5
10
15
0
50
100
150
0
50
100
150
05
101520253035
0
5
10
15
0
10
20
30
40
50
0
1
2
3
4
5
*
*
*
*
*
*
Anti-RGMa +(–)PMA + ionomycin (+)
+––
Anti-RGMa +(–)PMA + ionomycin (+)
+––
Anti-RGMa +(–)PMA + ionomycin (+)
+––
Anti-RGMa +(–)PMA + ionomycin (+)
+––
Anti-RGMa +(–)PMA + ionomycin (+)
+––
Anti-RGMa +(–)PMA + ionomycin (+)
+––
Anti-RGMa +(–)PMA + ionomycin (+)
+––
NS
Rel
ativ
e IF
NG
mR
NA
exp
ress
ion
Rel
ativ
e IL
2m
RN
A e
xpre
ssio
n R
elat
ive
IL17
Am
RN
A e
xpre
ssio
nR
elat
ive
IL4
mR
NA
exp
ress
ion
Rel
ativ
e IL
10m
RN
A e
xpre
ssio
nR
elat
ive
TGF
B1
mR
NA
exp
ress
ion
Rat
io o
fB
rdU
inco
rpor
atio
n
Remission
0
5
10
15
0
20
40
60
80
100
05
1015202530
0
5
10
15
0
2
4
6
8
10
0
2
4
6
8
10
0
1
2
3
4
5
*
*
**
Anti-RGMa +(–)PMA + ionomycin (+)
+––
Anti-RGMa +(–)PMA + ionomycin (+)
+––
Anti-RGMa +(–)PMA + ionomycin (+)
+––
Anti-RGMa +(–)PMA + ionomycin (+)
+––
Anti-RGMa +(–)PMA + ionomycin (+)
+––
Anti-RGMa +(–)PMA + ionomycin (+)
+––
Anti-RGMa +(–)PMA + ionomycin (+)
+––
NS
NS
NS
NS
Rel
ativ
e IF
NG
mR
NA
exp
ress
ion
Rel
ativ
e IL
2m
RN
A e
xpre
ssio
nR
elat
ive
IL17
Am
RN
A e
xpre
ssio
nR
elat
ive
IL4
mR
NA
exp
ress
ion
Rel
ativ
e IL
10m
RN
A e
xpre
ssio
nR
elat
ive
TGF
B1
mR
NA
exp
ress
ion
Rat
io o
fB
rdU
inco
rpor
atio
n
Figure 5 T cell proliferation and cytokine production from MOG-EAE mice and PBMCs from humans with multiple sclerosis. (a) Top graph, MOG-specific proliferative responses in splenic cells obtained from mice treated with RGMa-specific antibody (anti-RGMa) or control IgG at d 21 after MOG immunization. Each bar represents the mean ± s.e.m. (control IgG, n = 6; RGMa-specific antibody, n = 5). Bottom graphs, production of IL-2, IFN-γ, IL-17, IL-4, IL-10 and TGF-β by spleen cells obtained from mice treated with RGMa-specific antibody or control IgGs. Each bar represents the mean ± s.e.m. (control IgG, n = 6; RGMa-specific antibody, n = 5). *P < 0.05, and **P < 0.01 by Student’s t-test. (b) Relative levels of cell proliferation (top two graphs) and relative levels of cytokine mRNA (bottom graphs) from PBMCs stimulated with PMA plus ionomycin in the presence or absence of the RGMa-specific antibody. PBMCs were obtained from individuals with relapsing-remitting multiple sclerosis (8 in clinical relapse; 9 in clinical remission). Each error bar represents the mean ± s.e.m; *P < 0.05 and **P < 0.01 by Student’s t test.
© 2
011
Nat
ure
Am
eric
a, In
c. A
ll ri
gh
ts r
eser
ved
.

A r t i c l e s
494 VOLUME 17 | NUMBER 4 | APRIL 2011 nAture medicine
AUTHOR cONTRIBUTIONST.K. performed preliminary experiments for expression analysis, behavioral and histological analysis of EAE, and cytokine production, and contributed to conceiving the study. Later, R.M. took over the work and performed all experiments, with the exception of the portions indicated below. Y.N. performed EAE induction, adoptive transfer experiments, immunohistochemical analyses and spinal cord injury experiments. Y.F. performed the lymphocyte binding assay, Rap1 activity assay and cytokine analysis. M.M., J.T. and S.K. performed experiments with PBMCs. T.O. helped with irradiation experiments. M.M., T.A., J.T., M.Y., H.M. and S.K. performed experiments with autopsy samples. T.K and T.Y. conceived the project and developed the hypothesis. T.K, R.M., A.K. and T.Y. designed the experiments. A.K. and T.O. discussed the hypothesis and helped with data interpretation. T.Y. coordinated and directed the project and wrote the manuscript.
cOMPeTINg FINANcIAl INTeReSTSThe authors declare no competing financial interests.
Published online at http://www.nature.com/naturemedicine/. Reprints and permissions information is available online at http://npg.nature.com/reprintsandpermissions/.
1. Trapp, B.D., Ransohoff, R.M., Fisher, E. & Rudick, R. Neurodegeneration in multiple sclerosis: relationship to neurological disability. Neuroscientist 5, 48–57 (1999).
2. Smith, A. et al. The role of the integrin LFA-1 in T-lymphocyte migration. Immunol. Rev. 218, 135–146 (2007).
3. Katagiri, K. et al. Rap1 is a potent activation signal for leukocyte function-associated antigen 1 distinct from protein kinase C and phosphatidylinositol-3-OH kinase. Mol. Cell. Biol. 20, 1956–1969 (2000).
4. Reedquist, K.A. et al. The small GTPase, Rap1, mediates CD31-induced integrin adhesion. J. Cell Biol. 148, 1151–1158 (2000).
5. Katagiri, K., Hattori, M., Minato, N. & Kinashi, T. Rap1 functions as a key regulator of T-cell and antigen-presenting cell interactions and modulates T-cell responses. Mol. Cell. Biol. 22, 1001–1015 (2002).
6. Stahl, B., Müller, B., von Boxberg, Y., Cox, E.C. & Bonhoeffer, F. Biochemical characterization of a putative axonal guidance molecule of the chick visual system. Neuron 5, 735–743 (1990).
7. Yamashita, T., Mueller, B.K. & Hata, K. Neogenin and repulsive guidance molecule signaling in the central nervous system. Curr. Opin. Neurobiol. 17, 29–34 (2007).
8. Suga, K. et al. CD98 induces LFA-1–mediated cell adhesion in lymphoid cells via activation of Rap1. FEBS Lett. 489, 249–253 (2001).
9. Serafini, B. et al. Dendritic cells in multiple sclerosis lesions: maturation stage, myelin uptake and interaction with proliferating T cells. J. Neuropathol. Exp. Neurol. 65, 124–141 (2006).
10. Hata, K. et al. RGMa inhibition promotes axonal growth and recovery after spinal cord injury. J. Cell Biol. 173, 47–58 (2006).
11. McRae, B.L., Vanderlugt, C.L., Dal Canto, M.C. & Miller, S.D. Functional evidence for epitope spreading in the relapsing pathology of experimental autoimmune encephalomyelitis. J. Exp. Med. 182, 75–85 (1995).
12. McMahon, E.J. et al. Epitope spreading initiates in the CNS in two mouse models of multiple sclerosis. Nat. Med. 11, 335–339 (2005).
13. Duffield, J.S. et al. Selective depletion of macrophages reveals distinct, opposing roles during liver injury and repair. J. Clin. Invest. 115, 56–65 (2005).
14. Nohra, R. et al. RGMA and IL21R show association with experimental inflammation and multiple sclerosis. Genes Immun. 11, 279–293 (2010).
15. Trapp, B.D., Ransohoff, R. & Rudick, R. Axonal pathology in multiple sclerosis: relationship to neurologic disability. Curr. Opin. Neurol. 12, 295–302 (1999).
16. Onuki, M., Ayers, M.M., Bernard, C.C. & Orian, J.M. Axonal degeneration is an early pathological feature in autoimmune-mediated demyelination in mice. Microsc. Res. Tech. 52, 731–739 (2001).
17. Karnezis, T. et al. The neurite outgrowth inhibitor Nogo A is involved in autoimmune-mediated demyelination. Nat. Neurosci. 7, 736–744 (2004).
18. Mi, S. et al. LINGO-1 antagonist promotes spinal cord remyelination and axonal integrity in MOG-induced experimental autoimmune encephalomyelitis. Nat. Med. 13, 1228–1233 (2007).
© 2
011
Nat
ure
Am
eric
a, In
c. A
ll ri
gh
ts r
eser
ved
.

nAture medicinedoi:10.1038/nm.2321
ONLINE METhODSMice. C57BL/6 (Japan SLC), SJL/J (Charles River), CAG-EGFP (Japan SLC) mice and CD11b-DTR mice (The Jackson Laboratory) (ages: 8−10 weeks; C57BL/6, SJL/J, and CAG-EGFP mice: male; CD11b-DTR mice: 7 male and 3 female) were bred and maintained. The Institutional Animal Care and Use Committees of Graduate School of Medicine, Chiba University and Osaka University approved all experimental procedures.
EAE induction. We induced EAE by subcutaneous injection of 200 µl of an emulsion (1:1 PBS or complete Freund’s adjuvant (CFA, Difco) containing 100 µg of MOG35–55 peptide (MEVGWYRSPFSRVVHLYRNGK) (Greiner Bio-One) to C57BL/6 mice or PLP139–151 peptide (HSLGKWLGHPDKF) (Greiner Bio-One) to SJL/J mice in PBS and 500 µg of Mycobacterium tuberculosis extract H37Ra (Difco) in CFA. At 0 h and 48 h after immuni-zation, mice received 200 ng of pertussis toxin intravenously (List Biological Laboratories). 400 µg of RGMa-specific antibodies (28045F; IBL) or control antibodies (rabbit IgG; I5006; Sigma-Aldrich) were administered intraperi-toneally to mice on days 7 and 10 after MOG immunization and on day 25 and 28 after PLP immunization. We generated RGMa-specific rabbit antisera against the synthetic peptide (residues 309–322) as the immunogen. The pep-tide sequence is specific to RGMa but has no similarity to the RGMb or RGMc sequence. The antisera were purified by affinity chromatography. The antibody blocked the inhibitory effect of RGMa on neurite growth10.
Adoptive transfer experiments. For adoptive transfer of BMDCs with RGMa knockdown, we intravenously injected mice with 6 × 10⁵ cells per 0.1 ml live BMDCs pulsed in vitro with 100 µg ml−1 MOG35–55 for 4–6 h. We subcutane-ously injected mice with 0.2 ml of CFA containing 500 µg of Mycobacterium tuberculosis. Mice received 200 ng of pertussis toxin intravenously 0 h and 48 h after immunization.
We also immunized donor mice with MOG in CFA with or without the RGMa-specific antibody treatment (days −2, 0 and 5). On day 10 after immu-nization, we collected the spleens and draining lymph nodes, prepared single-cell suspensions and lysed red blood cells. Cells (5 × 10⁶ cells per ml) were cultured with 40 µg ml−1 MOG35–55 peptide. After 3 d of culture, we collected cells and isolated CD4+ T cells by negative selection with a CD4+ T cell isolation kit (Miltenyi Biotec). Sublethally irradiated (500 Gy) mice intravenously received the cells.
T cell proliferation and cytokine analysis. On day 21 after induction of EAE, we cultured splenocytes (5 × 10⁵ cells per 0.1 ml) from these mice with in 96-well
plates in RPMI-1640 medium supplemented with glutamine (Gibco), sodium pyruvate (Gibco), penicillin (Gibco), streptomycin (Gibco), 2-ME (Wako) and 10% (vol/vol) heat-inactivated FBS (Gibco) for the proliferation assay. CD4+ T cells were re-stimulated with 20 µg ml−1 of MOG peptide or 5 µg ml−1 of CD3-specific monoclonal antibody (2C11; BD Biosciences). We estimated cell proliferation by measuring BrdU incorporation into the newly synthesized cellular DNA for 24 h with a cell proliferation enzyme-linked immunosorbent assay and BrdU (colorimetric) assay (Roche Diagnostics) according to the manufacturer’s instructions. To measure the production of IL-2, IFN-γ, IL-17, IL-4, IL-10 and TGF-β, we cultured the splenocytes (2 × 10⁶ cells per ml) obtained from the mice with EAE in 24-well plates with or without 20 µg ml−1 of MOG peptide or 5 µg ml−1 of the CD3-specific monoclonal antibody. We collected the supernatants after 72 h in culture. We then performed cytokine ELISAs according to the manufacturer’s instructions (IL-2, IFN-γ, IL-17, IL-4: BioSource, Invitrogen; IL-10 and TGF-β, R&D Systems).
Human subjects. The research protocol was approved by the Human Use Review Committees of the Graduate School of Medicine, Chiba University; Kitasato University School of Medicine; and Aichi Medical University. Informed consent was obtained from all subjects. 17 individuals with relapsing-remitting multiple sclerosis were diagnosed according to the McDonald criteria19. We obtained samples from eight individuals (seven women; median age: 39.0 years; range: 24–57 years) during clinical relapse and nine individuals (eight women; median age: 37.5 years; range: 32–62 years) during clinical remission. These individuals were under no treatment at the time of study. We obtained autopsied brain and spinal cord tissues from nine individuals who died with relapsing-remitting multiple sclerosis. We excluded the tissue from one individual because of unsuc-cessful immunohistochemistry, and analyzed tissue from eight individuals with relapsing-remitting multiple sclerosis (six brains and two spinal cord samples; three women; median age: 56.5 years; range: 40–67 years). We obtained the control brain from a subject with polymyositis.
Statistical analysis. Data are presented as means ± s.e.m. For EAE scores, significance among the groups was examined using Mann-Whitney U test. Other analyses were performed by one-way analysis of variance followed by Tukey’s test or Student’s t test. P values of <0.05 were considered significant.
Additional methods. Detailed methodology is supplied in the Supplementary Methods.19. Polman, C.H. et al. Diagnostic criteria for multiple sclerosis: 2005 revisions to the
“McDonald Criteria”. Ann. Neurol. 58, 840–846 (2005).
© 2
011
Nat
ure
Am
eric
a, In
c. A
ll ri
gh
ts r
eser
ved
.
Related Documents