Reynolds number, thickness and camber effects on flapping airfoil propulsion M.A. Ashraf n , J. Young, J.C.S. Lai School of Engineering and Information Technology, University of New South Wales, Australian Defence Force Academy, Northcott Drive Campbell, Canberra, Australian Capital Territory 2600, Australia article info Article history: Received 8 April 2010 Accepted 10 November 2010 Available online 11 January 2011 Keywords: Flapping airfoil Propulsion Airfoil shape Reynolds number Navier–Stokes simulations abstract The effect of varying airfoil thickness and camber on plunging and combined pitching and plunging airfoil propulsion at Reynolds number Re=200, 2000, 20 000 and 2 10 6 was studied by numerical simulations for fully laminar and fully turbulent flow regimes. The thickness study was performed on 2-D NACA symmetric airfoils with 6–50% thick sections undergoing pure plunging motion at reduced frequency k = 2 and amplitudes h = 0.25 and 0.5, and for combined pitching and plunging motion at k =2, h =0.5, phase f =901, pitch angle y o =151 and 301 and the pitch axis was located at 1/3 of chord from leading edge. At Re=200 for motions where positive thrust is generated, thin airfoils outperform thick airfoils. At higher Re significant gains could be achieved both in thrust generation and propulsive efficiency by using a thicker airfoil section for plunging and combined motion with low pitch amplitude. The camber study was performed on 2-D NACA airfoils with varying camber locations undergoing pure plunging motion at k =2, h = 0.5 and Re = 20 000. Little variation in thrust performance was found with camber. The underlying physics behind the alteration in propulsive performance between low and high Reynolds numbers has been explored by comparing viscous Navier–Stokes and inviscid panel method results. The role of leading edge vortices was found to be key to the observed performance variation. & 2010 Elsevier Ltd. All rights reserved. 1. Introduction Flapping wing aerodynamics has attracted significant attention recently not only because of its importance in understanding the fundamental science of flight in nature and in practical applications for the development of micro- aerial vehicles (MAVs) but also because of its potential to be employed for power generation. A detailed historical perspective of studies related to flapping wings is well covered in a numbers of papers (Lai and Platzer, 1999; Shyy et al., 1999; Rozhdestvensky and Ryzhov, 2003; Triantafyllou et al., 2004; Platzer et al., 2008). Several analysis methods such as unsteady potential flow, Navier–Stokes (NS) computations and experiments have been employed to analyse the flow physics and to examine the effects of important flapping parameters on thrust generation and propulsive efficiency. Detailed experimental analysis related to the effects of kinematics as well as the wake visualisation behind the flapping airfoils can be found in Freymuth (1988), Koochesfahani (1989), Triantafyllou et al. (1993), Anderson et al. (1998), Lai and Platzer (1999), Read et al. (2003) and Schouveiler et al. (2005). Extensive computational work pertaining to oscillating foils can be found in Garrick (1937), Streitlien and Triantafyllou (1998), Isogai et al. (1999), Wang (2000) and Young and Lai (2004). Most of these studies were focused on the influence of kinematic parameters such as flapping frequency, amplitude and phase difference between pure plunge and pitch motion on the thrust generation and propulsive efficiency. By comparison, Contents lists available at ScienceDirect journal homepage: www.elsevier.com/locate/jfs Journal of Fluids and Structures 0889-9746/$ - see front matter & 2010 Elsevier Ltd. All rights reserved. doi:10.1016/j.jfluidstructs.2010.11.010 n Corresponding author. Tel.: +61 02 62688258; fax: +61 02 62688276. E-mail addresses: [email protected], [email protected] (M.A. Ashraf). Journal of Fluids and Structures 27 (2011) 145–160

Welcome message from author
This document is posted to help you gain knowledge. Please leave a comment to let me know what you think about it! Share it to your friends and learn new things together.
Transcript
Contents lists available at ScienceDirect
Journal of Fluids and Structures
Journal of Fluids and Structures 27 (2011) 145–160
0889-97
doi:10.1
n Corr
E-m
journal homepage: www.elsevier.com/locate/jfs
Reynolds number, thickness and camber effects onflapping airfoil propulsion
M.A. Ashraf n, J. Young, J.C.S. Lai
School of Engineering and Information Technology, University of New South Wales, Australian Defence Force Academy,
Northcott Drive Campbell, Canberra, Australian Capital Territory 2600, Australia
a r t i c l e i n f o
Article history:
Received 8 April 2010
Accepted 10 November 2010Available online 11 January 2011
Keywords:
Flapping airfoil
Propulsion
Airfoil shape
Reynolds number
Navier–Stokes simulations
46/$ - see front matter & 2010 Elsevier Ltd. A
016/j.jfluidstructs.2010.11.010
esponding author. Tel.: +61 02 62688258; fa
ail addresses: [email protected], arif373@
a b s t r a c t
The effect of varying airfoil thickness and camber on plunging and combined pitching and
plunging airfoil propulsion at Reynolds number Re=200, 2000, 20 000 and 2�106 was
studied by numerical simulations for fully laminar and fully turbulent flow regimes. The
thickness study was performed on 2-D NACA symmetric airfoils with 6–50% thick sections
undergoing pure plunging motion at reduced frequency k=2 and amplitudes h=0.25 and
0.5, and for combined pitching and plunging motion at k=2, h=0.5, phase f=901, pitch
angle yo=151 and 301 and the pitch axis was located at 1/3 of chord from leading edge. At
Re=200 for motions where positive thrust is generated, thin airfoils outperform thick
airfoils. At higher Re significant gains could be achieved both in thrust generation and
propulsive efficiency by using a thicker airfoil section for plunging and combined motion
with low pitch amplitude. The camber study was performed on 2-D NACA airfoils with
varying camber locations undergoing pure plunging motion at k=2, h=0.5 and Re=20 000.
Little variation in thrust performance was found with camber. The underlying physics
behind the alteration in propulsive performance between low and high Reynolds
numbers has been explored by comparing viscous Navier–Stokes and inviscid panel
method results. The role of leading edge vortices was found to be key to the observed
performance variation.
& 2010 Elsevier Ltd. All rights reserved.
1. Introduction
Flapping wing aerodynamics has attracted significant attention recently not only because of its importance inunderstanding the fundamental science of flight in nature and in practical applications for the development of micro-aerial vehicles (MAVs) but also because of its potential to be employed for power generation. A detailed historical perspectiveof studies related to flapping wings is well covered in a numbers of papers (Lai and Platzer, 1999; Shyy et al., 1999;Rozhdestvensky and Ryzhov, 2003; Triantafyllou et al., 2004; Platzer et al., 2008). Several analysis methods such as unsteadypotential flow, Navier–Stokes (NS) computations and experiments have been employed to analyse the flow physics and toexamine the effects of important flapping parameters on thrust generation and propulsive efficiency. Detailed experimentalanalysis related to the effects of kinematics as well as the wake visualisation behind the flapping airfoils can be found inFreymuth (1988), Koochesfahani (1989), Triantafyllou et al. (1993), Anderson et al. (1998), Lai and Platzer (1999), Read et al.(2003) and Schouveiler et al. (2005). Extensive computational work pertaining to oscillating foils can be found in Garrick(1937), Streitlien and Triantafyllou (1998), Isogai et al. (1999), Wang (2000) and Young and Lai (2004).
Most of these studies were focused on the influence of kinematic parameters such as flapping frequency, amplitude andphase difference between pure plunge and pitch motion on the thrust generation and propulsive efficiency. By comparison,
ll rights reserved.
x: +61 02 62688276.
yahoo.com (M.A. Ashraf).
Nomenclature
a plunge amplitude, mCL coefficient of lift, CL ¼ ðLift=0:5rU2
o cÞ
CD coefficient of drag, CD ¼ ðDrag=0:5rU2o cÞ
CM coefficient of moment, CM ¼Moment=0:5rU2
o c2
CPmean time averaged power coefficient, CPmean ¼
� 1T
R tþT½CLðtÞ _yðtÞþCMðtÞ _yðtÞ�dt=UO
CTmean time averaged thrust coefficient,
CTmean ¼�1T
R tþTt CDðtÞdt
Cp pressure coefficient, Cp ¼ ðp�poÞ=ð0:5rU2o cÞ
c chord, mf frequency of oscillation, Hzh nondimensional plunge amplitude, a/ck reduced frequency, 2pfc=Uo
Re Reynolds numberSt Strouhal number, f(2a)/Uo(=kh/p)T period of oscillationUo free-stream velocity, m/sy plunge position of airfoilZP propulsive efficiency, ZP ¼ ðCTmean=CPmeanÞ
M.A. Ashraf et al. / Journal of Fluids and Structures 27 (2011) 145–160146
systematic investigation of airfoil shape on thrust generation and propulsive efficiency has received much less attention.Freymuth (1988) used a NACA0015 airfoil for his wake visualisation experiments. Koochesfahani (1989), Anderson et al.(1998), Read et al. (2003), Schouveiler et al. (2005) and Triantafyllou et al. (1993) employed a NACA0012 section for theirexperiments of the flow over oscillating airfoil. Streitlien and Triantafyllou (1998) used a 12% thick Joukowski profile tonumerically investigate the effect of frequency and Strouhal number on the thrust estimation of combined pitching andplunging. Isogai et al. (1999) and Young and Lai (2004) employed a NACA0012 airfoil for their NS simulations. Wang (2000)employed a fourth order finite difference NS solver to study the flow over 12.5% and 25% thick elliptic airfoil sections flappingat Re=192. Although this study was mainly focused on the optimal frequency selection, she also reported that in the case ofthinner ellipse, more vortices were shed due to a sharper corner resulting in higher lift.
Using unsteady panel code simulations in comparison to Garrick’s linear theory (Garrick, 1937) for NACA0003, NACA0009,NACA0012 and NACA0015 sections, Cebeci et al. (2004) found a negligible effect of increasing thickness on the propulsiveefficiency of a plunging airfoil. Rozhdestvensky and Ryzhov (2003) briefly discussed the results of experiments conducted atthe Institute of Theoretical and Applied Mechanics of the Academy of Sciences of the USSR for an isolated rigid verticallysubmerged wing having NACA sections with thickness between 6% and 21% undergoing lateral oscillations in water at rest. Incontrast to the inviscid calculations of Cebeci et al. (2004), these results indicate that the thrust increases with airfoilthickness. Lentink and Gerritsma (2003) numerically studied the influence of airfoil shape with NS simulations on plungingairfoils at Re=150. They compared the performance of a blunt 10% ellipse and NACA0010 section with the thinner and sharper2% ellipse, NACA0002 and NACA4702 airfoil sections. They reported that the NACA0010 section creates greater thrust thanNACA0002 because of the higher frontal area against which low pressure leading edge vortices react. The NACA4702 sectionproduced greater thrust than all the other airfoils tested, and they concluded that aft camber is highly important for highthrust and high efficiency in insect flight. However their study lacked the range of different thicknesses to conclude theoptimal thickness for plunging airfoil propulsion.
Further, Vandenberghe et al. (2006) performed experiments on a rigid symmetric wing that flapped vertically and was freeto rotate around a fixed vertical axis. Thrust produced by the wing drove rotation about the vertical axis, showing the onset offorward flight. They used a rectangular cross-section wing at Reynolds number based on vertical flapping velocity of around200–2000. They reported that increasing the thickness (from 8.4% to 16.8%) decreased the resultant rotational speed of thewing, and further thickness increase (to 25.2%) produced no rotational motion, indicating no net thrust. More recently, An et al.(2009) used the lattice Boltzmann method to study plunging bodies of varying thickness from 5% (thin ellipse), 10% and then insteps of 10–100% thick (circular cylinder) at very low Reynolds number of (Re=50, 100 and 185) and Strouhal number of(St=0.2 and 0.4). Based on the wake vortex pattern and velocity profiles behind the plunging body, they identified that thethickness distribution of the airfoil is a crucial design parameter for thrust generation. Although they reported that a 10% thickelliptic airfoil produced maximum thrust at Re=185 and St=0.4, they did not explore the physics producing maximum thrustat this thickness as the main focus of their study was the aerodynamic transition from drag to thrust. Further, Dickinson andGotz (1993) performed an experimental study at Re=197 to study the effect of camber on unsteady aerodynamic forces. Theycompared a smooth 1 mm thick rounded leading edge and sharp trailing edge section wing with a cambered section. Thecamber was introduced by bending the profile by 121 about a point 0.3 chord from the leading edge. They reported that camberdid not alter the performance of the wing, except for a slight increase in drag and greater instability at high angle of attack.
In summary, the results in Rozhdestvensky and Ryzhov (2003), Lentink and Gerritsma (2003) and An et al. (2009) indicate thatthick airfoils can improve plunging airfoil performance, whereas Vandenberghe et al. (2006) and Wang (2000) suggest that thinairfoils perform better, and the inviscid analysis of Cebeci et al. (2004) concludes no influence of airfoil thickness on plungingairfoil propulsion. Also according to the literature (Mueller and Batill, 1982; Kunz and Kroo, 2001) for static (nonflapping) airfoilsat low Reynolds number flows, thin and sharp airfoils perform better than the thick and blunt airfoils. These contradictoryfindings are a result of limited knowledge of low Reynolds number flows, and suggest that there exists an optimal thickness andshape of airfoil for the best flapping airfoil performance which is strongly influenced by the Reynolds number of the flow.
In this paper, we systematically evaluate and quantify the effect of varying the thickness and camber of a thrust producingharmonically pure plunging and combined pitching and plunging NACA airfoil on their propulsion performance. To elaborate
M.A. Ashraf et al. / Journal of Fluids and Structures 27 (2011) 145–160 147
the differences of thickness effects reported in literature, this study has been undertaken for different Reynolds numbersregimes Re=200, 2000, 20 000 and 2�106, where Rer20 000 represents fully laminar regime and Re=2�106 representsfully turbulent regime. The current study employs a Navier–Stokes (NS) viscous flow solver which allows leading edge flowseparation and vortex shedding effects to be evaluated. The physics behind the production of higher thrust and higherefficiency by varying thickness and camber is highlighted.
2. Numerical method
2.1. Solver
The unsteady flow field around the airfoil section was simulated using the commercially available CFD package Fluentversion 6.3.26, with an unsteady incompressible solver and second-order upwind spatial discretization. The plunging motionof the airfoil was modelled by the introduction of a source term in the Navier–Stokes equations which allowed the unsteadyformulation to be 2nd order accurate in time. For combined pitching and plunging motion, two zones of grid were used with asliding grid interface. The inner zone employed a moving mesh for pitching motion and a source term for plunging whereasthe outer zone was fixed with the source term only as employed by Kinsey and Dumas (2008).
The free-stream velocity of Uo=0.292 m/s was used and the kinematic viscosity was varied to achieve different Re. AtRe=200 and 2000, the flow field was assumed to be laminar. At Re=20 000, the force coefficients of a plunging NACA0012airfoil section at St=0�0.7 (St=kh/p, k=0–12.5) and h=0.175 computed by NS simulations for laminar flows agree very wellwith the experiments as shown by Young and Lai (2007) and Heathcote and Gursul (2007). Also the flow field results for similarRe range were validated using laminar flow assumption in Young and Lai (2004). However, recent work has been conducted byVisbal et al. (2009) and Visbal (2009) on the laminar-turbulent-transitional effects on flow over plunging a SD7003 airfoil atRe=10 000 and 40 000 with reduced frequency pfc/UN=3.93 (or k=7.86) and plunge amplitude h=0.05. At Re=10 000, theyshow that the instantaneous and phase averaged flow structures agree well with each other. However, at Re=40 000, the flowbecame a complex mixed transitional-turbulent flow due to spanwise instabilities. The instabilities caused fine scalestructures in instantaneous representation which disappeared in phase-averaged flow representation. In this paper,Re=20 000 is considered to be within the limits validated by Young and Lai (2004; 2007). However, the test cases for pureplunge motion are conducted at h=0.5 (St=0.31, k=2) which causes a higher angle of attack and therefore there may be sometransitional effects even at Re=20 000. To account for possible turbulent-transitional cases, a fully turbulent Spalart–Allmaras(SA) model (1992) is employed in addition to the laminar assumption, to establish the limiting behaviour of the flow at this Re.
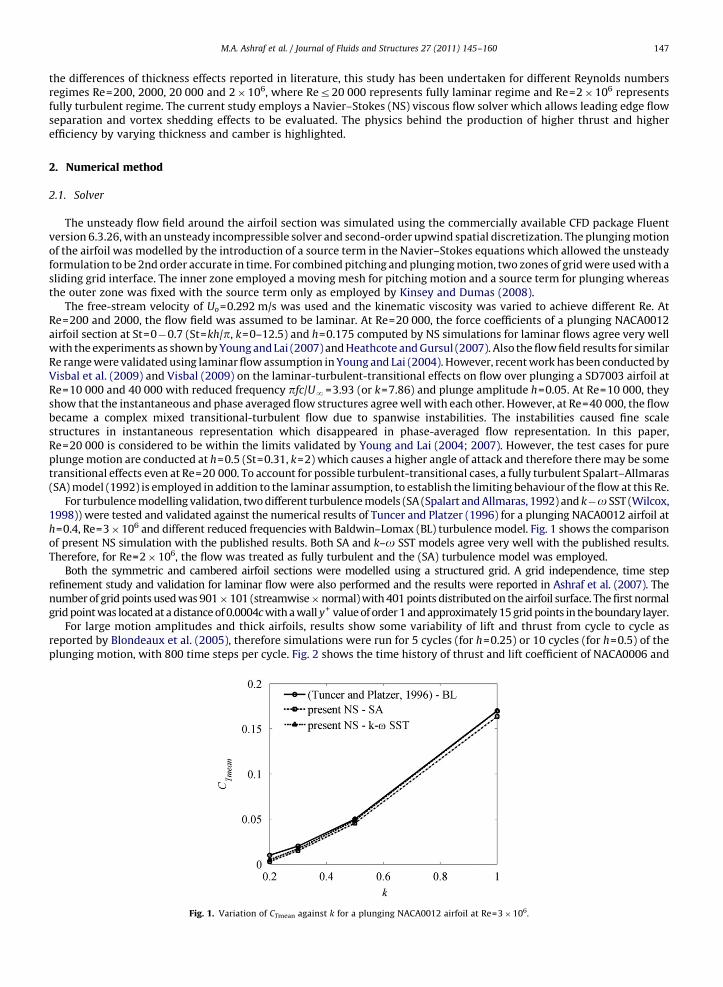
For turbulence modelling validation, two different turbulence models (SA (Spalart and Allmaras, 1992) and k�o SST (Wilcox,1998)) were tested and validated against the numerical results of Tuncer and Platzer (1996) for a plunging NACA0012 airfoil ath=0.4, Re=3�106 and different reduced frequencies with Baldwin–Lomax (BL) turbulence model. Fig. 1 shows the comparisonof present NS simulation with the published results. Both SA and k–o SST models agree very well with the published results.Therefore, for Re=2�106, the flow was treated as fully turbulent and the (SA) turbulence model was employed.
Both the symmetric and cambered airfoil sections were modelled using a structured grid. A grid independence, time steprefinement study and validation for laminar flow were also performed and the results were reported in Ashraf et al. (2007). Thenumber of grid points used was 901�101 (streamwise�normal) with 401 points distributed on the airfoil surface. The first normalgrid point was located at a distance of 0.0004c with a wall y+ value of order 1 and approximately 15 grid points in the boundary layer.
For large motion amplitudes and thick airfoils, results show some variability of lift and thrust from cycle to cycle asreported by Blondeaux et al. (2005), therefore simulations were run for 5 cycles (for h=0.25) or 10 cycles (for h=0.5) of theplunging motion, with 800 time steps per cycle. Fig. 2 shows the time history of thrust and lift coefficient of NACA0006 and
Fig. 1. Variation of CTmean against k for a plunging NACA0012 airfoil at Re=3�106.
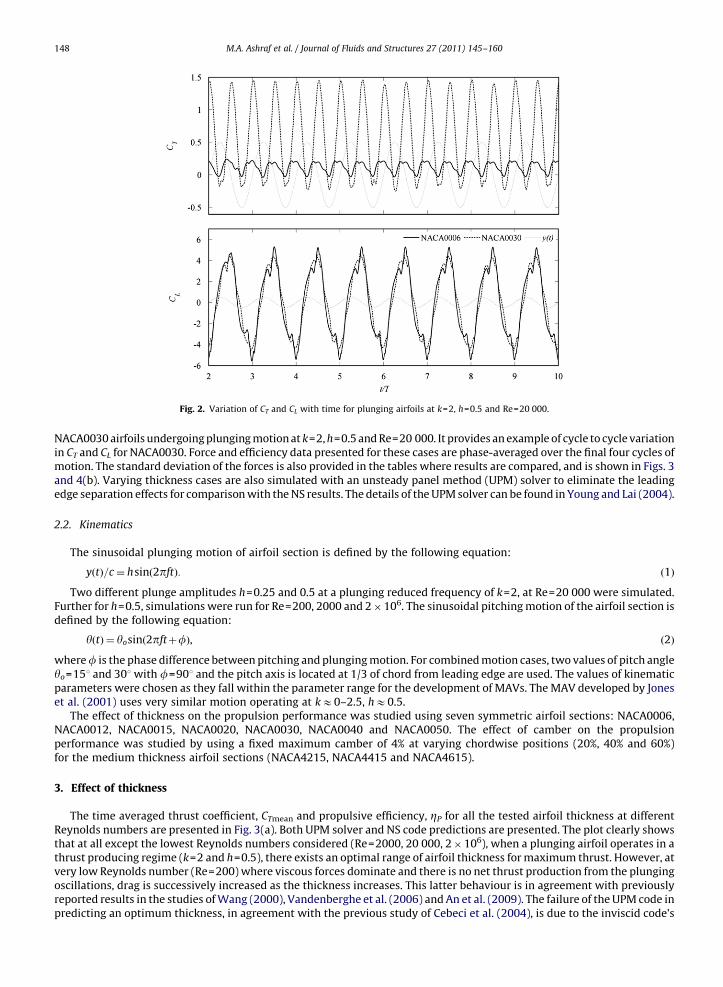
Fig. 2. Variation of CT and CL with time for plunging airfoils at k=2, h=0.5 and Re=20 000.
M.A. Ashraf et al. / Journal of Fluids and Structures 27 (2011) 145–160148
NACA0030 airfoils undergoing plunging motion at k=2, h=0.5 and Re=20 000. It provides an example of cycle to cycle variationin CT and CL for NACA0030. Force and efficiency data presented for these cases are phase-averaged over the final four cycles ofmotion. The standard deviation of the forces is also provided in the tables where results are compared, and is shown in Figs. 3and 4(b). Varying thickness cases are also simulated with an unsteady panel method (UPM) solver to eliminate the leadingedge separation effects for comparison with the NS results. The details of the UPM solver can be found in Young and Lai (2004).
2.2. Kinematics
The sinusoidal plunging motion of airfoil section is defined by the following equation:
yðtÞ=c¼ hsinð2pftÞ: ð1Þ
Two different plunge amplitudes h=0.25 and 0.5 at a plunging reduced frequency of k=2, at Re=20 000 were simulated.Further for h=0.5, simulations were run for Re=200, 2000 and 2�106. The sinusoidal pitching motion of the airfoil section isdefined by the following equation:
yðtÞ ¼ yosinð2pftþfÞ, ð2Þ
wheref is the phase difference between pitching and plunging motion. For combined motion cases, two values of pitch angleyo=151 and 301 with f=901 and the pitch axis is located at 1/3 of chord from leading edge are used. The values of kinematicparameters were chosen as they fall within the parameter range for the development of MAVs. The MAV developed by Joneset al. (2001) uses very similar motion operating at kE0–2.5, hE0.5.
The effect of thickness on the propulsion performance was studied using seven symmetric airfoil sections: NACA0006,NACA0012, NACA0015, NACA0020, NACA0030, NACA0040 and NACA0050. The effect of camber on the propulsionperformance was studied by using a fixed maximum camber of 4% at varying chordwise positions (20%, 40% and 60%)for the medium thickness airfoil sections (NACA4215, NACA4415 and NACA4615).
3. Effect of thickness
The time averaged thrust coefficient, CTmean and propulsive efficiency, ZP for all the tested airfoil thickness at differentReynolds numbers are presented in Fig. 3(a). Both UPM solver and NS code predictions are presented. The plot clearly showsthat at all except the lowest Reynolds numbers considered (Re=2000, 20 000, 2�106), when a plunging airfoil operates in athrust producing regime (k=2 and h=0.5), there exists an optimal range of airfoil thickness for maximum thrust. However, atvery low Reynolds number (Re=200) where viscous forces dominate and there is no net thrust production from the plungingoscillations, drag is successively increased as the thickness increases. This latter behaviour is in agreement with previouslyreported results in the studies of Wang (2000), Vandenberghe et al. (2006) and An et al. (2009). The failure of the UPM code inpredicting an optimum thickness, in agreement with the previous study of Cebeci et al. (2004), is due to the inviscid code’s
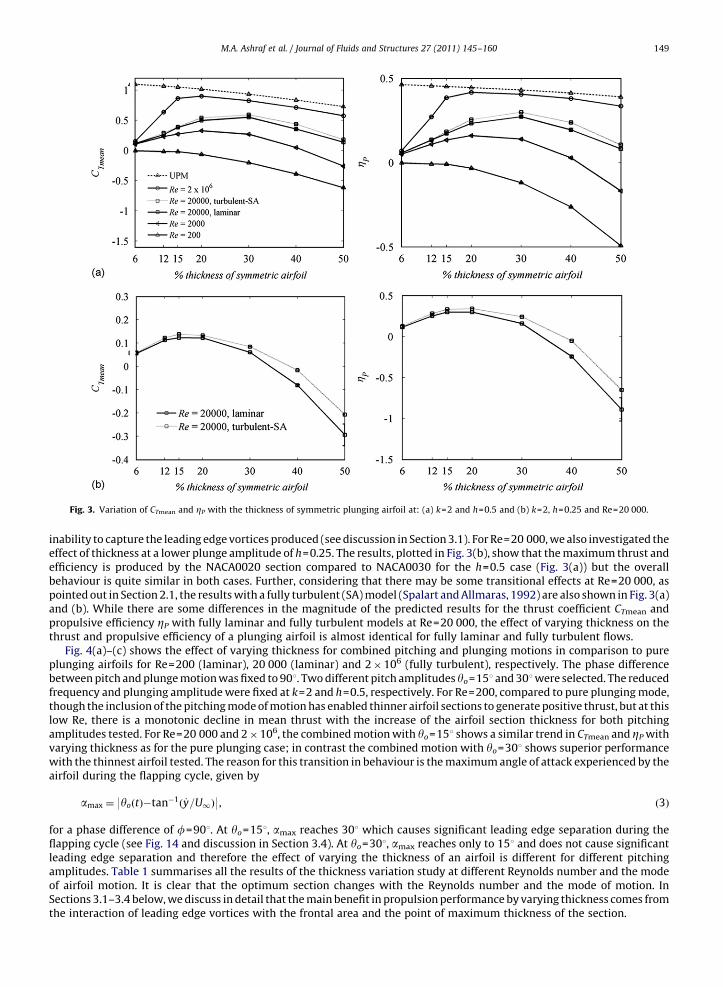
Fig. 3. Variation of CTmean and ZP with the thickness of symmetric plunging airfoil at: (a) k=2 and h=0.5 and (b) k=2, h=0.25 and Re=20 000.
M.A. Ashraf et al. / Journal of Fluids and Structures 27 (2011) 145–160 149
inability to capture the leading edge vortices produced (see discussion in Section 3.1). For Re=20 000, we also investigated theeffect of thickness at a lower plunge amplitude of h=0.25. The results, plotted in Fig. 3(b), show that the maximum thrust andefficiency is produced by the NACA0020 section compared to NACA0030 for the h=0.5 case (Fig. 3(a)) but the overallbehaviour is quite similar in both cases. Further, considering that there may be some transitional effects at Re=20 000, aspointed out in Section 2.1, the results with a fully turbulent (SA) model (Spalart and Allmaras, 1992) are also shown in Fig. 3(a)and (b). While there are some differences in the magnitude of the predicted results for the thrust coefficient CTmean andpropulsive efficiency ZP with fully laminar and fully turbulent models at Re=20 000, the effect of varying thickness on thethrust and propulsive efficiency of a plunging airfoil is almost identical for fully laminar and fully turbulent flows.
Fig. 4(a)–(c) shows the effect of varying thickness for combined pitching and plunging motions in comparison to pureplunging airfoils for Re=200 (laminar), 20 000 (laminar) and 2�106 (fully turbulent), respectively. The phase differencebetween pitch and plunge motion was fixed to 901. Two different pitch amplitudes yo=151 and 301were selected. The reducedfrequency and plunging amplitude were fixed at k=2 and h=0.5, respectively. For Re=200, compared to pure plunging mode,though the inclusion of the pitching mode of motion has enabled thinner airfoil sections to generate positive thrust, but at thislow Re, there is a monotonic decline in mean thrust with the increase of the airfoil section thickness for both pitchingamplitudes tested. For Re=20 000 and 2�106, the combined motion with yo=151 shows a similar trend in CTmean and ZP withvarying thickness as for the pure plunging case; in contrast the combined motion with yo=301 shows superior performancewith the thinnest airfoil tested. The reason for this transition in behaviour is the maximum angle of attack experienced by theairfoil during the flapping cycle, given by
amax ¼ 9yoðtÞ�tan�1ð _y=U1Þ9, ð3Þ
for a phase difference of f=901. At yo=151, amax reaches 301 which causes significant leading edge separation during theflapping cycle (see Fig. 14 and discussion in Section 3.4). At yo=301, amax reaches only to 151 and does not cause significantleading edge separation and therefore the effect of varying the thickness of an airfoil is different for different pitchingamplitudes. Table 1 summarises all the results of the thickness variation study at different Reynolds number and the modeof airfoil motion. It is clear that the optimum section changes with the Reynolds number and the mode of motion. InSections 3.1–3.4 below, we discuss in detail that the main benefit in propulsion performance by varying thickness comes fromthe interaction of leading edge vortices with the frontal area and the point of maximum thickness of the section.
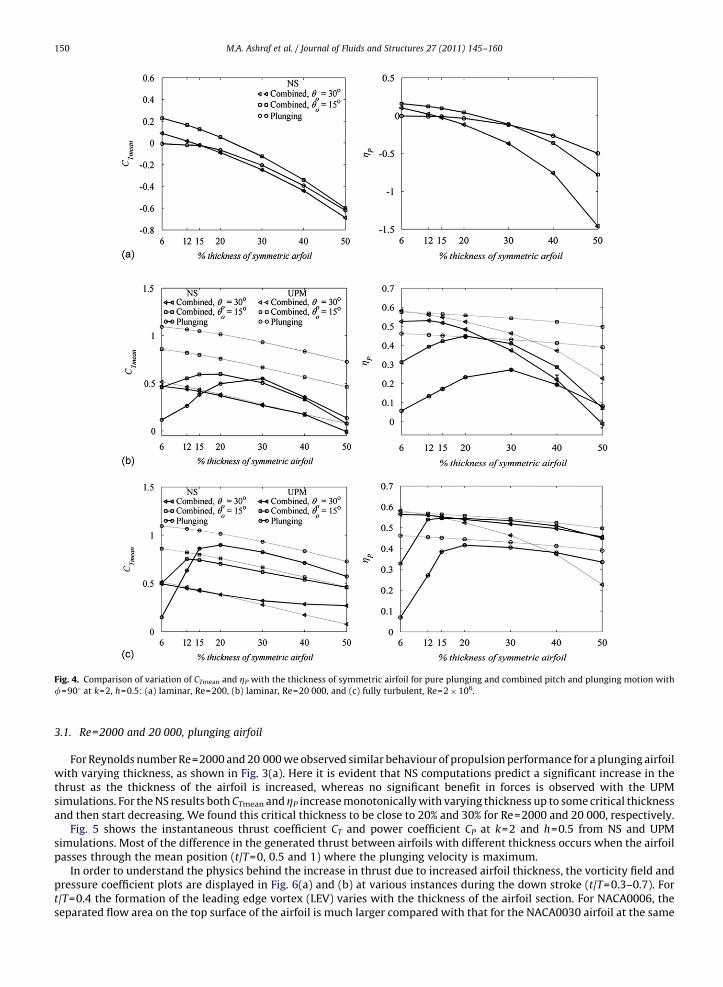
Fig. 4. Comparison of variation of CTmean and ZP with the thickness of symmetric airfoil for pure plunging and combined pitch and plunging motion with
f=901 at k=2, h=0.5: (a) laminar, Re=200, (b) laminar, Re=20 000, and (c) fully turbulent, Re=2�106.
M.A. Ashraf et al. / Journal of Fluids and Structures 27 (2011) 145–160150
3.1. Re=2000 and 20 000, plunging airfoil
For Reynolds number Re=2000 and 20 000 we observed similar behaviour of propulsion performance for a plunging airfoilwith varying thickness, as shown in Fig. 3(a). Here it is evident that NS computations predict a significant increase in thethrust as the thickness of the airfoil is increased, whereas no significant benefit in forces is observed with the UPMsimulations. For the NS results both CTmean andZP increase monotonically with varying thickness up to some critical thicknessand then start decreasing. We found this critical thickness to be close to 20% and 30% for Re=2000 and 20 000, respectively.
Fig. 5 shows the instantaneous thrust coefficient CT and power coefficient CP at k=2 and h=0.5 from NS and UPMsimulations. Most of the difference in the generated thrust between airfoils with different thickness occurs when the airfoilpasses through the mean position (t/T=0, 0.5 and 1) where the plunging velocity is maximum.
In order to understand the physics behind the increase in thrust due to increased airfoil thickness, the vorticity field andpressure coefficient plots are displayed in Fig. 6(a) and (b) at various instances during the down stroke (t/T=0.3–0.7). Fort/T=0.4 the formation of the leading edge vortex (LEV) varies with the thickness of the airfoil section. For NACA0006, theseparated flow area on the top surface of the airfoil is much larger compared with that for the NACA0030 airfoil at the same
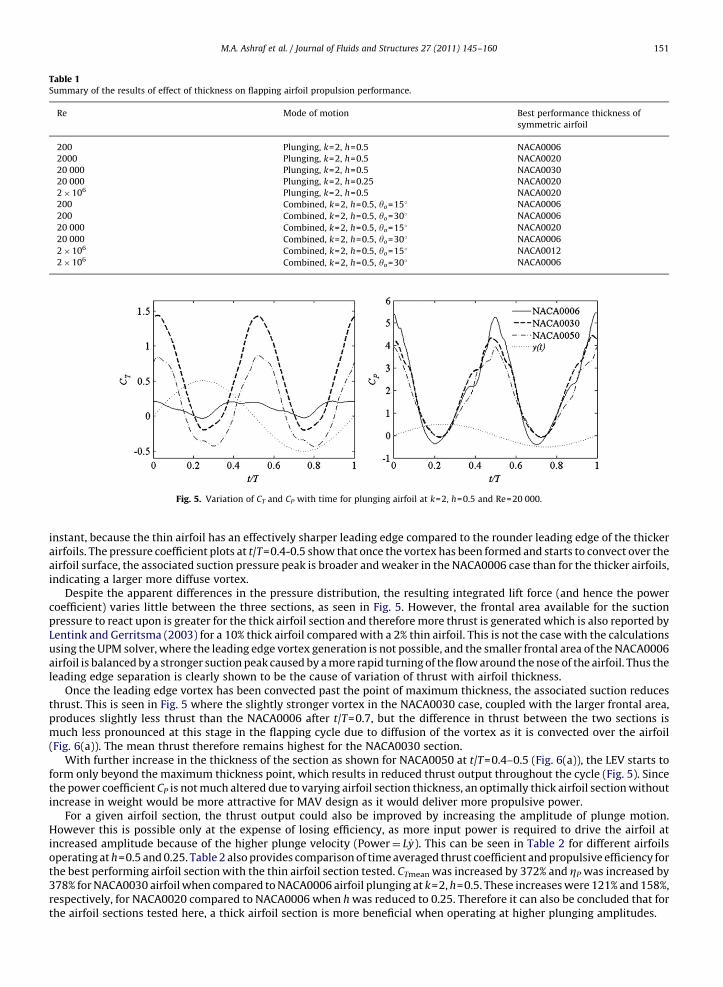
Table 1Summary of the results of effect of thickness on flapping airfoil propulsion performance.
Re Mode of motion Best performance thickness of
symmetric airfoil
200 Plunging, k=2, h=0.5 NACA0006
2000 Plunging, k=2, h=0.5 NACA0020
20 000 Plunging, k=2, h=0.5 NACA0030
20 000 Plunging, k=2, h=0.25 NACA0020
2�106 Plunging, k=2, h=0.5 NACA0020
200 Combined, k=2, h=0.5, yo=151 NACA0006
200 Combined, k=2, h=0.5, yo=301 NACA0006
20 000 Combined, k=2, h=0.5, yo=151 NACA0020
20 000 Combined, k=2, h=0.5, yo=301 NACA0006
2�106 Combined, k=2, h=0.5, yo=151 NACA0012
2�106 Combined, k=2, h=0.5, yo=301 NACA0006
Fig. 5. Variation of CT and CP with time for plunging airfoil at k=2, h=0.5 and Re=20 000.
M.A. Ashraf et al. / Journal of Fluids and Structures 27 (2011) 145–160 151
instant, because the thin airfoil has an effectively sharper leading edge compared to the rounder leading edge of the thickerairfoils. The pressure coefficient plots at t/T=0.4-0.5 show that once the vortex has been formed and starts to convect over theairfoil surface, the associated suction pressure peak is broader and weaker in the NACA0006 case than for the thicker airfoils,indicating a larger more diffuse vortex.
Despite the apparent differences in the pressure distribution, the resulting integrated lift force (and hence the powercoefficient) varies little between the three sections, as seen in Fig. 5. However, the frontal area available for the suctionpressure to react upon is greater for the thick airfoil section and therefore more thrust is generated which is also reported byLentink and Gerritsma (2003) for a 10% thick airfoil compared with a 2% thin airfoil. This is not the case with the calculationsusing the UPM solver, where the leading edge vortex generation is not possible, and the smaller frontal area of the NACA0006airfoil is balanced by a stronger suction peak caused by a more rapid turning of the flow around the nose of the airfoil. Thus theleading edge separation is clearly shown to be the cause of variation of thrust with airfoil thickness.
Once the leading edge vortex has been convected past the point of maximum thickness, the associated suction reducesthrust. This is seen in Fig. 5 where the slightly stronger vortex in the NACA0030 case, coupled with the larger frontal area,produces slightly less thrust than the NACA0006 after t/T=0.7, but the difference in thrust between the two sections ismuch less pronounced at this stage in the flapping cycle due to diffusion of the vortex as it is convected over the airfoil(Fig. 6(a)). The mean thrust therefore remains highest for the NACA0030 section.
With further increase in the thickness of the section as shown for NACA0050 at t/T=0.4–0.5 (Fig. 6(a)), the LEV starts toform only beyond the maximum thickness point, which results in reduced thrust output throughout the cycle (Fig. 5). Sincethe power coefficient CP is not much altered due to varying airfoil section thickness, an optimally thick airfoil section withoutincrease in weight would be more attractive for MAV design as it would deliver more propulsive power.
For a given airfoil section, the thrust output could also be improved by increasing the amplitude of plunge motion.However this is possible only at the expense of losing efficiency, as more input power is required to drive the airfoil atincreased amplitude because of the higher plunge velocity (Power¼ L _y). This can be seen in Table 2 for different airfoilsoperating at h=0.5 and 0.25. Table 2 also provides comparison of time averaged thrust coefficient and propulsive efficiency forthe best performing airfoil section with the thin airfoil section tested. CTmean was increased by 372% and ZP was increased by378% for NACA0030 airfoil when compared to NACA0006 airfoil plunging at k=2, h=0.5. These increases were 121% and 158%,respectively, for NACA0020 compared to NACA0006 when h was reduced to 0.25. Therefore it can also be concluded that forthe airfoil sections tested here, a thick airfoil section is more beneficial when operating at higher plunging amplitudes.
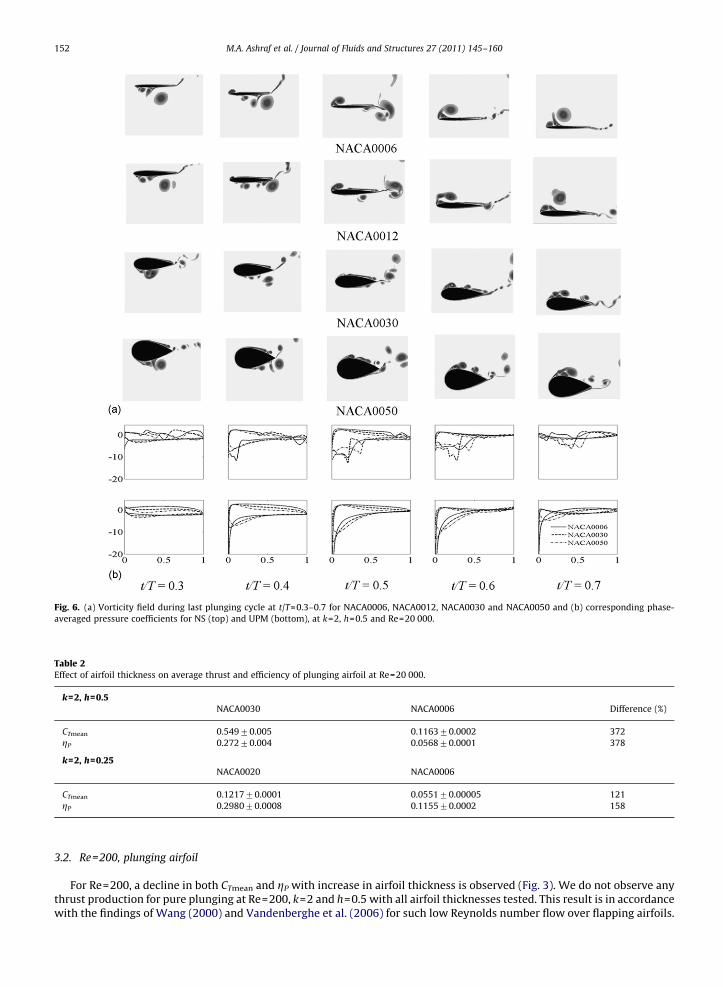
Fig. 6. (a) Vorticity field during last plunging cycle at t/T=0.3–0.7 for NACA0006, NACA0012, NACA0030 and NACA0050 and (b) corresponding phase-
averaged pressure coefficients for NS (top) and UPM (bottom), at k=2, h=0.5 and Re=20 000.
Table 2Effect of airfoil thickness on average thrust and efficiency of plunging airfoil at Re=20 000.
k=2, h=0.5NACA0030 NACA0006 Difference (%)
CTmean 0.54970.005 0.116370.0002 372
ZP 0.27270.004 0.056870.0001 378
k=2, h=0.25NACA0020 NACA0006
CTmean 0.121770.0001 0.055170.00005 121
ZP 0.298070.0008 0.115570.0002 158
M.A. Ashraf et al. / Journal of Fluids and Structures 27 (2011) 145–160152
3.2. Re=200, plunging airfoil
For Re=200, a decline in both CTmean and ZP with increase in airfoil thickness is observed (Fig. 3). We do not observe anythrust production for pure plunging at Re=200, k=2 and h=0.5 with all airfoil thicknesses tested. This result is in accordancewith the findings of Wang (2000) and Vandenberghe et al. (2006) for such low Reynolds number flow over flapping airfoils.
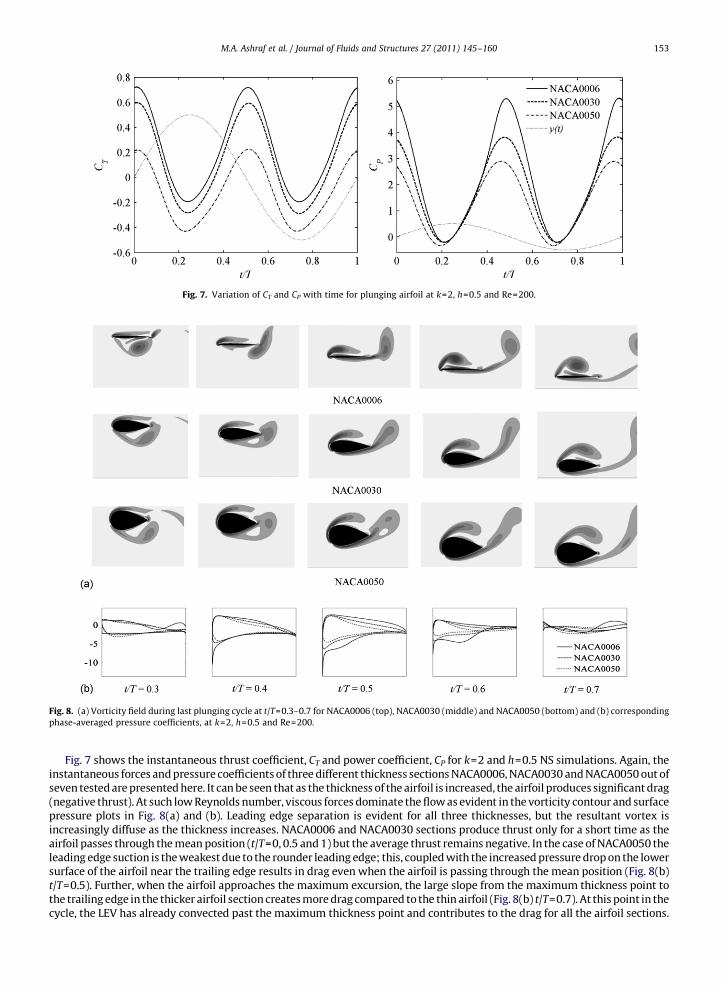
Fig. 7. Variation of CT and CP with time for plunging airfoil at k=2, h=0.5 and Re=200.
Fig. 8. (a) Vorticity field during last plunging cycle at t/T=0.3–0.7 for NACA0006 (top), NACA0030 (middle) and NACA0050 (bottom) and (b) corresponding
phase-averaged pressure coefficients, at k=2, h=0.5 and Re=200.
M.A. Ashraf et al. / Journal of Fluids and Structures 27 (2011) 145–160 153
Fig. 7 shows the instantaneous thrust coefficient, CT and power coefficient, CP for k=2 and h=0.5 NS simulations. Again, theinstantaneous forces and pressure coefficients of three different thickness sections NACA0006, NACA0030 and NACA0050 out ofseven tested are presented here. It can be seen that as the thickness of the airfoil is increased, the airfoil produces significant drag(negative thrust). At such low Reynolds number, viscous forces dominate the flow as evident in the vorticity contour and surfacepressure plots in Fig. 8(a) and (b). Leading edge separation is evident for all three thicknesses, but the resultant vortex isincreasingly diffuse as the thickness increases. NACA0006 and NACA0030 sections produce thrust only for a short time as theairfoil passes through the mean position (t/T=0, 0.5 and 1) but the average thrust remains negative. In the case of NACA0050 theleading edge suction is the weakest due to the rounder leading edge; this, coupled with the increased pressure drop on the lowersurface of the airfoil near the trailing edge results in drag even when the airfoil is passing through the mean position (Fig. 8(b)t/T=0.5). Further, when the airfoil approaches the maximum excursion, the large slope from the maximum thickness point tothe trailing edge in the thicker airfoil section creates more drag compared to the thin airfoil (Fig. 8(b) t/T=0.7). At this point in thecycle, the LEV has already convected past the maximum thickness point and contributes to the drag for all the airfoil sections.
M.A. Ashraf et al. / Journal of Fluids and Structures 27 (2011) 145–160154
3.3. Re=2�106, plunging airfoil
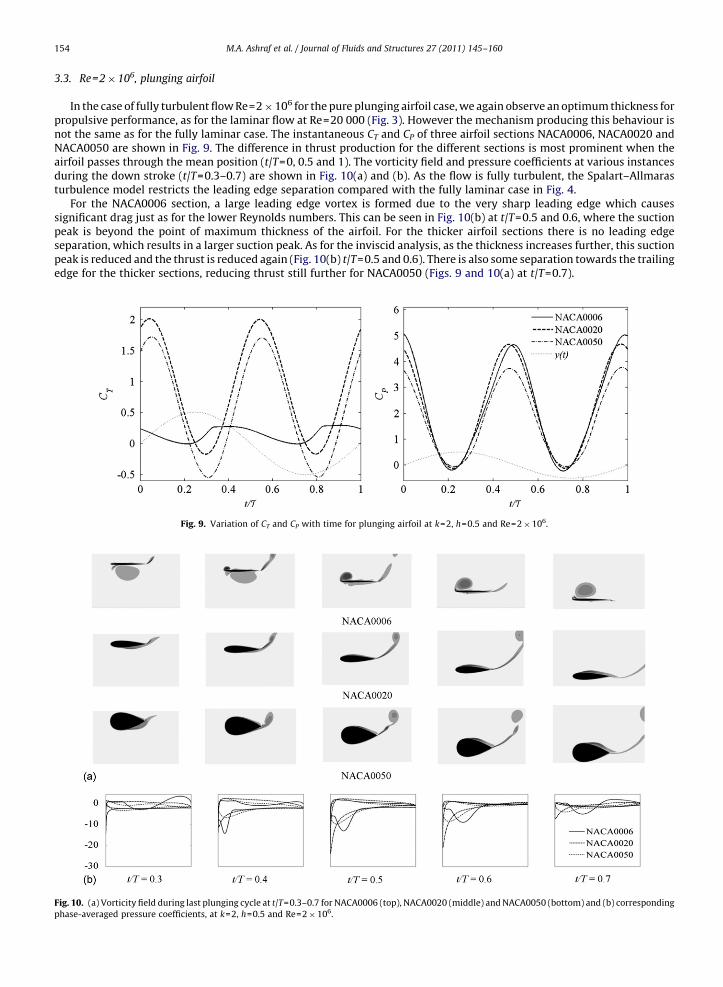
In the case of fully turbulent flow Re=2�106 for the pure plunging airfoil case, we again observe an optimum thickness forpropulsive performance, as for the laminar flow at Re=20 000 (Fig. 3). However the mechanism producing this behaviour isnot the same as for the fully laminar case. The instantaneous CT and CP of three airfoil sections NACA0006, NACA0020 andNACA0050 are shown in Fig. 9. The difference in thrust production for the different sections is most prominent when theairfoil passes through the mean position (t/T=0, 0.5 and 1). The vorticity field and pressure coefficients at various instancesduring the down stroke (t/T=0.3–0.7) are shown in Fig. 10(a) and (b). As the flow is fully turbulent, the Spalart–Allmarasturbulence model restricts the leading edge separation compared with the fully laminar case in Fig. 4.
For the NACA0006 section, a large leading edge vortex is formed due to the very sharp leading edge which causessignificant drag just as for the lower Reynolds numbers. This can be seen in Fig. 10(b) at t/T=0.5 and 0.6, where the suctionpeak is beyond the point of maximum thickness of the airfoil. For the thicker airfoil sections there is no leading edgeseparation, which results in a larger suction peak. As for the inviscid analysis, as the thickness increases further, this suctionpeak is reduced and the thrust is reduced again (Fig. 10(b) t/T=0.5 and 0.6). There is also some separation towards the trailingedge for the thicker sections, reducing thrust still further for NACA0050 (Figs. 9 and 10(a) at t/T=0.7).
Fig. 9. Variation of CT and CP with time for plunging airfoil at k=2, h=0.5 and Re=2�106.
Fig. 10. (a) Vorticity field during last plunging cycle at t/T=0.3–0.7 for NACA0006 (top), NACA0020 (middle) and NACA0050 (bottom) and (b) corresponding
phase-averaged pressure coefficients, at k=2, h=0.5 and Re=2�106.
M.A. Ashraf et al. / Journal of Fluids and Structures 27 (2011) 145–160 155
3.4. Re=200, 20 000 and 2�106, combined motion
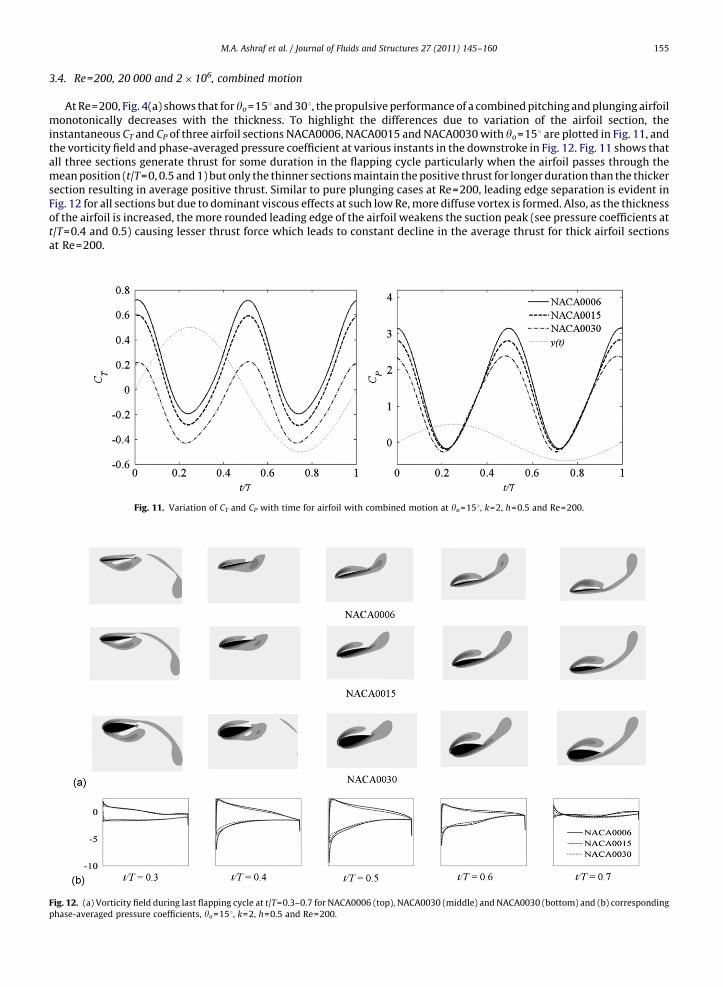
At Re=200, Fig. 4(a) shows that for yo=151 and 301, the propulsive performance of a combined pitching and plunging airfoilmonotonically decreases with the thickness. To highlight the differences due to variation of the airfoil section, theinstantaneous CT and CP of three airfoil sections NACA0006, NACA0015 and NACA0030 with yo=151 are plotted in Fig. 11, andthe vorticity field and phase-averaged pressure coefficient at various instants in the downstroke in Fig. 12. Fig. 11 shows thatall three sections generate thrust for some duration in the flapping cycle particularly when the airfoil passes through themean position (t/T=0, 0.5 and 1) but only the thinner sections maintain the positive thrust for longer duration than the thickersection resulting in average positive thrust. Similar to pure plunging cases at Re=200, leading edge separation is evident inFig. 12 for all sections but due to dominant viscous effects at such low Re, more diffuse vortex is formed. Also, as the thicknessof the airfoil is increased, the more rounded leading edge of the airfoil weakens the suction peak (see pressure coefficients att/T=0.4 and 0.5) causing lesser thrust force which leads to constant decline in the average thrust for thick airfoil sectionsat Re=200.
Fig. 11. Variation of CT and CP with time for airfoil with combined motion at yo=151, k=2, h=0.5 and Re=200.
Fig. 12. (a) Vorticity field during last flapping cycle at t/T=0.3–0.7 for NACA0006 (top), NACA0030 (middle) and NACA0030 (bottom) and (b) corresponding
phase-averaged pressure coefficients, yo=151, k=2, h=0.5 and Re=200.
M.A. Ashraf et al. / Journal of Fluids and Structures 27 (2011) 145–160156
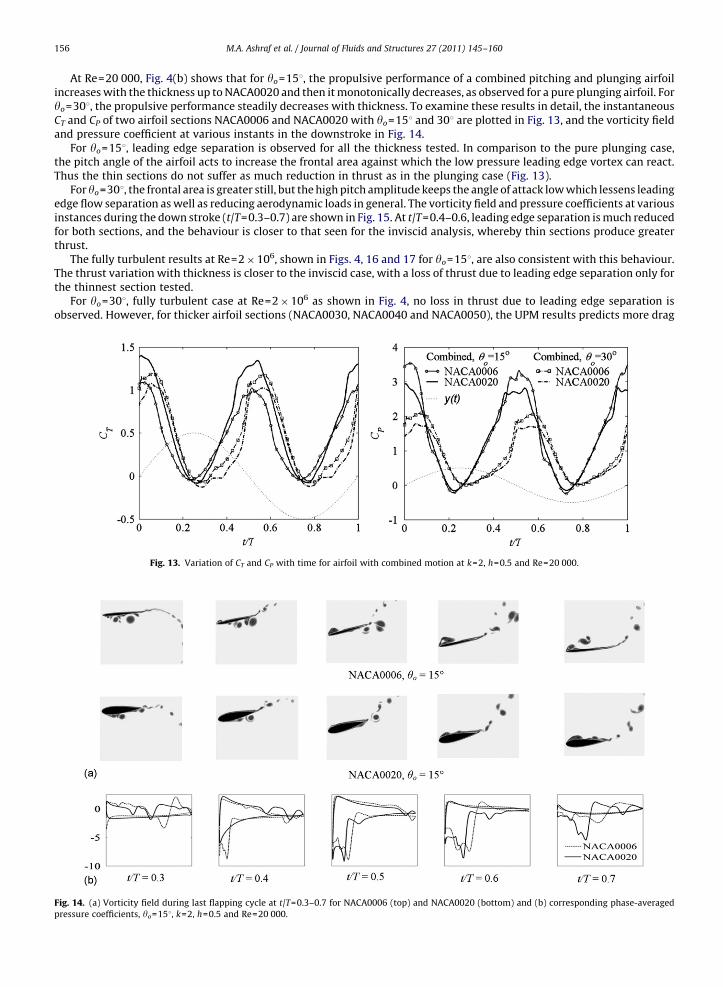
At Re=20 000, Fig. 4(b) shows that for yo=151, the propulsive performance of a combined pitching and plunging airfoilincreases with the thickness up to NACA0020 and then it monotonically decreases, as observed for a pure plunging airfoil. Foryo=301, the propulsive performance steadily decreases with thickness. To examine these results in detail, the instantaneousCT and CP of two airfoil sections NACA0006 and NACA0020 with yo=151 and 301 are plotted in Fig. 13, and the vorticity fieldand pressure coefficient at various instants in the downstroke in Fig. 14.
For yo=151, leading edge separation is observed for all the thickness tested. In comparison to the pure plunging case,the pitch angle of the airfoil acts to increase the frontal area against which the low pressure leading edge vortex can react.Thus the thin sections do not suffer as much reduction in thrust as in the plunging case (Fig. 13).
For yo=301, the frontal area is greater still, but the high pitch amplitude keeps the angle of attack low which lessens leadingedge flow separation as well as reducing aerodynamic loads in general. The vorticity field and pressure coefficients at variousinstances during the down stroke (t/T=0.3–0.7) are shown in Fig. 15. At t/T=0.4–0.6, leading edge separation is much reducedfor both sections, and the behaviour is closer to that seen for the inviscid analysis, whereby thin sections produce greaterthrust.
The fully turbulent results at Re=2�106, shown in Figs. 4, 16 and 17 for yo=151, are also consistent with this behaviour.The thrust variation with thickness is closer to the inviscid case, with a loss of thrust due to leading edge separation only forthe thinnest section tested.
For yo=301, fully turbulent case at Re=2�106 as shown in Fig. 4, no loss in thrust due to leading edge separation isobserved. However, for thicker airfoil sections (NACA0030, NACA0040 and NACA0050), the UPM results predicts more drag
Fig. 13. Variation of CT and CP with time for airfoil with combined motion at k=2, h=0.5 and Re=20 000.
Fig. 14. (a) Vorticity field during last flapping cycle at t/T=0.3–0.7 for NACA0006 (top) and NACA0020 (bottom) and (b) corresponding phase-averaged
pressure coefficients, yo=151, k=2, h=0.5 and Re=20 000.
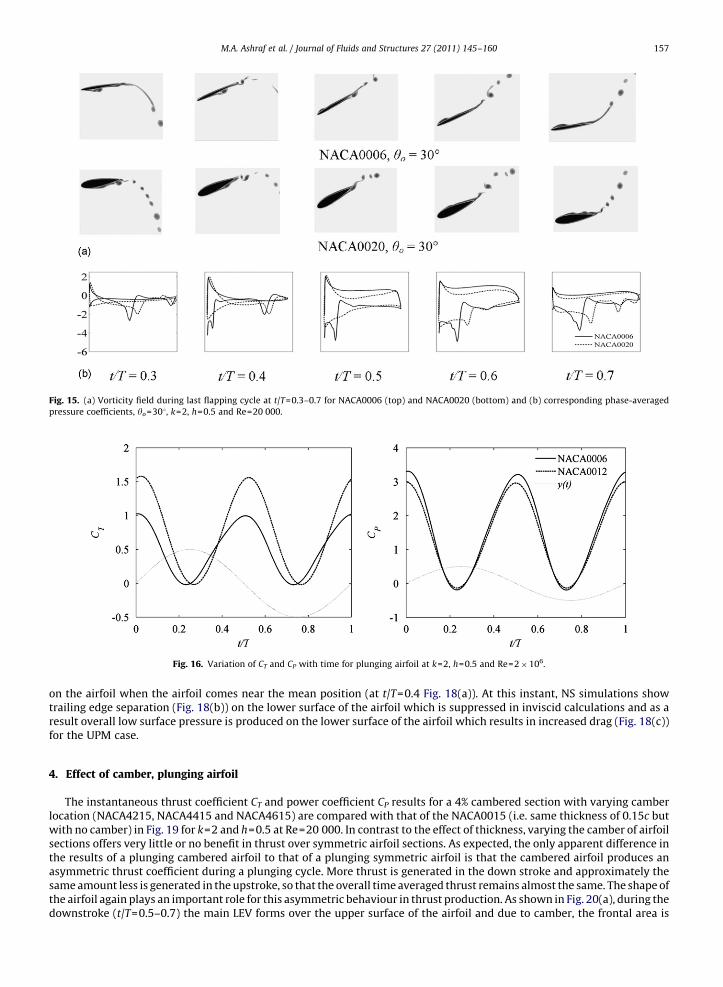
Fig. 15. (a) Vorticity field during last flapping cycle at t/T=0.3–0.7 for NACA0006 (top) and NACA0020 (bottom) and (b) corresponding phase-averaged
pressure coefficients, yo=301, k=2, h=0.5 and Re=20 000.
Fig. 16. Variation of CT and CP with time for plunging airfoil at k=2, h=0.5 and Re=2�106.
M.A. Ashraf et al. / Journal of Fluids and Structures 27 (2011) 145–160 157
on the airfoil when the airfoil comes near the mean position (at t/T=0.4 Fig. 18(a)). At this instant, NS simulations showtrailing edge separation (Fig. 18(b)) on the lower surface of the airfoil which is suppressed in inviscid calculations and as aresult overall low surface pressure is produced on the lower surface of the airfoil which results in increased drag (Fig. 18(c))for the UPM case.
4. Effect of camber, plunging airfoil
The instantaneous thrust coefficient CT and power coefficient CP results for a 4% cambered section with varying camberlocation (NACA4215, NACA4415 and NACA4615) are compared with that of the NACA0015 (i.e. same thickness of 0.15c butwith no camber) in Fig. 19 for k=2 and h=0.5 at Re=20 000. In contrast to the effect of thickness, varying the camber of airfoilsections offers very little or no benefit in thrust over symmetric airfoil sections. As expected, the only apparent difference inthe results of a plunging cambered airfoil to that of a plunging symmetric airfoil is that the cambered airfoil produces anasymmetric thrust coefficient during a plunging cycle. More thrust is generated in the down stroke and approximately thesame amount less is generated in the upstroke, so that the overall time averaged thrust remains almost the same. The shape ofthe airfoil again plays an important role for this asymmetric behaviour in thrust production. As shown in Fig. 20(a), during thedownstroke (t/T=0.5–0.7) the main LEV forms over the upper surface of the airfoil and due to camber, the frontal area is
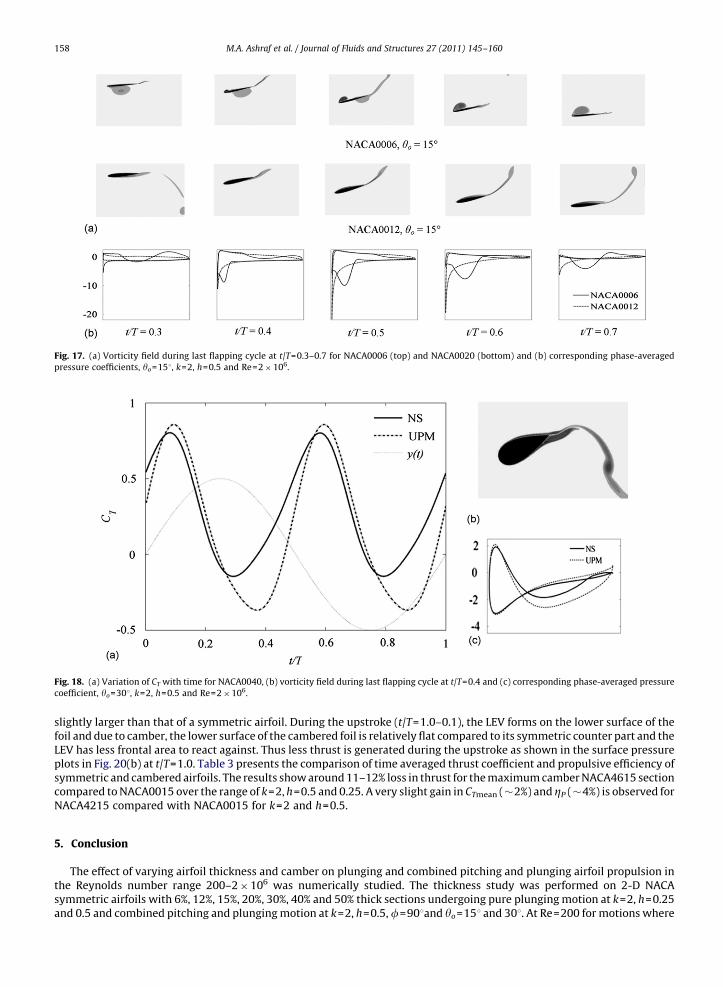
Fig. 17. (a) Vorticity field during last flapping cycle at t/T=0.3–0.7 for NACA0006 (top) and NACA0020 (bottom) and (b) corresponding phase-averaged
pressure coefficients, yo=151, k=2, h=0.5 and Re=2�106.
Fig. 18. (a) Variation of CT with time for NACA0040, (b) vorticity field during last flapping cycle at t/T=0.4 and (c) corresponding phase-averaged pressure
coefficient, yo=301, k=2, h=0.5 and Re=2�106.
M.A. Ashraf et al. / Journal of Fluids and Structures 27 (2011) 145–160158
slightly larger than that of a symmetric airfoil. During the upstroke (t/T=1.0–0.1), the LEV forms on the lower surface of thefoil and due to camber, the lower surface of the cambered foil is relatively flat compared to its symmetric counter part and theLEV has less frontal area to react against. Thus less thrust is generated during the upstroke as shown in the surface pressureplots in Fig. 20(b) at t/T=1.0. Table 3 presents the comparison of time averaged thrust coefficient and propulsive efficiency ofsymmetric and cambered airfoils. The results show around 11–12% loss in thrust for the maximum camber NACA4615 sectioncompared to NACA0015 over the range of k=2, h=0.5 and 0.25. A very slight gain in CTmean (�2%) and ZP (�4%) is observed forNACA4215 compared with NACA0015 for k=2 and h=0.5.
5. Conclusion
The effect of varying airfoil thickness and camber on plunging and combined pitching and plunging airfoil propulsion inthe Reynolds number range 200–2�106 was numerically studied. The thickness study was performed on 2-D NACAsymmetric airfoils with 6%, 12%, 15%, 20%, 30%, 40% and 50% thick sections undergoing pure plunging motion at k=2, h=0.25and 0.5 and combined pitching and plunging motion at k=2, h=0.5, f=901and yo=151 and 301. At Re=200 for motions where
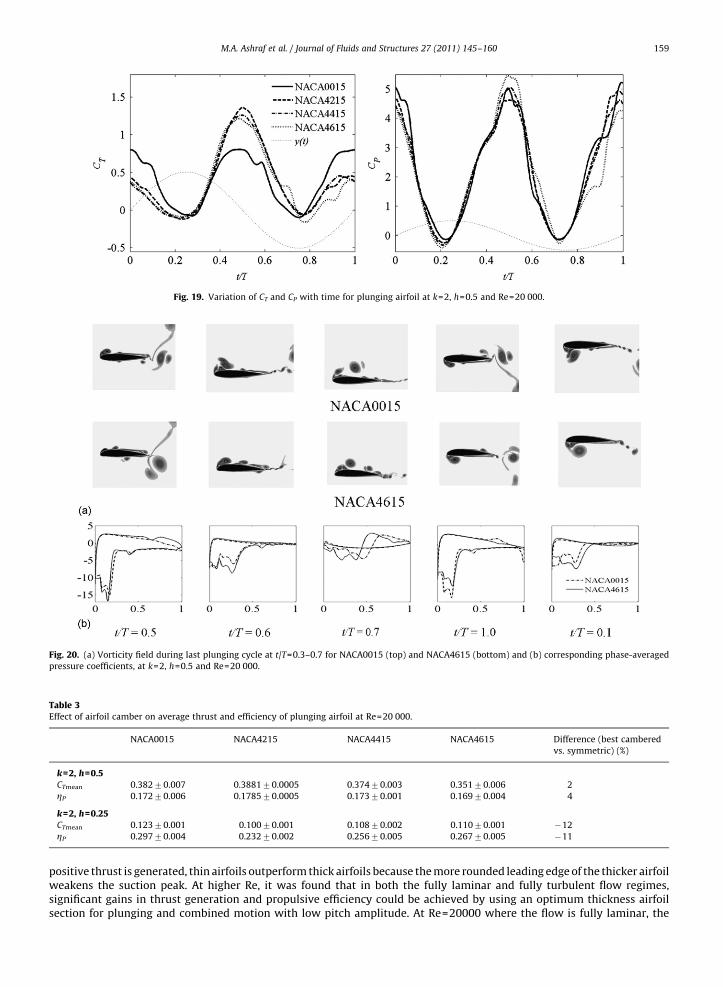
Fig. 19. Variation of CT and CP with time for plunging airfoil at k=2, h=0.5 and Re=20 000.
Fig. 20. (a) Vorticity field during last plunging cycle at t/T=0.3–0.7 for NACA0015 (top) and NACA4615 (bottom) and (b) corresponding phase-averaged
pressure coefficients, at k=2, h=0.5 and Re=20 000.
Table 3Effect of airfoil camber on average thrust and efficiency of plunging airfoil at Re=20 000.
NACA0015 NACA4215 NACA4415 NACA4615 Difference (best cambered
vs. symmetric) (%)
k=2, h=0.5CTmean 0.38270.007 0.388170.0005 0.37470.003 0.35170.006 2
ZP 0.17270.006 0.178570.0005 0.17370.001 0.16970.004 4
k=2, h=0.25CTmean 0.12370.001 0.10070.001 0.10870.002 0.11070.001 �12
ZP 0.29770.004 0.23270.002 0.25670.005 0.26770.005 �11
M.A. Ashraf et al. / Journal of Fluids and Structures 27 (2011) 145–160 159
positive thrust is generated, thin airfoils outperform thick airfoils because the more rounded leading edge of the thicker airfoilweakens the suction peak. At higher Re, it was found that in both the fully laminar and fully turbulent flow regimes,significant gains in thrust generation and propulsive efficiency could be achieved by using an optimum thickness airfoilsection for plunging and combined motion with low pitch amplitude. At Re=20000 where the flow is fully laminar, the
M.A. Ashraf et al. / Journal of Fluids and Structures 27 (2011) 145–160160
time-averaged thrust coefficient and propulsive efficiency was increased by 372% and 378%, respectively, for a NACA0030airfoil undergoing pure plunging motion when compared to NACA0006 airfoil for k=2, h=0.5; this increment was reduced to121% and 158% when h was reduced to 0.25 for NACA0020 compared to NACA0006. This benefit in the fully laminar flowregime is due to the stronger suction and larger separation zone produced by the leading edge vortex as it interacts with theincreased frontal area and point of maximum thickness of a thicker airfoil, and has not been observed by previous researchersusing attached flow assumptions inherent in inviscid codes and linear analysis methods. On the other hand, in the fullyturbulent flow regime, the mechanism for optimum performance due to thickness is different. For the thin airfoil sectionNACA0006, a large leading edge vortex is produced because of the very sharp leading edge, whereas for thicker sections,leading edge separation is suppressed by turbulence, thus resulting in larger suction peak which decreases with thickness.
Irrespective of whether it is in the fully laminar or turbulent flow regime, an optimally thick airfoil produces larger thrustand higher efficiency in combined pitch/plunge motion than in pure plunge motion.
It has also been shown that a cambered airfoil offers little to no benefit over symmetric airfoils in terms of the timeaveraged thrust coefficient and propulsive efficiency. This is because more thrust is generated in the downstroke butapproximately the same amount less is generated in the upstroke due to the effective increase in thickness of upper surfaceand decrease in thickness on lower surface of the airfoil caused by the camber.
All the results presented in this paper are two-dimensional. Visbal (2009) found for low amplitude high frequency motionsthat the LEV breaks down into small-scale three-dimensional structures for Re=40 000 and above. For high amplitude casessimilar to the conditions used in the present study, the LEV has been shown to remain coherent and stable (Ashraf, 2010).
Acknowledgements
Navier–Stokes calculations were performed in part with the support of a grant under the Merit Allocation Scheme of theAustralian National Computational Infrastructure National Facility (NCI-NF). The first author (MAA) acknowledges receipt ofa University College Postgraduate Research Scholarship for the pursuit of this study.
References
An, S., Maeng, J., Han, C., 2009. Thickness effect on the thrust generation of heaving airfoils. Journal of Aircraft 46 (1), 216–222.Anderson, J.M., Streitlien, K., Barrett, D.S., Triantafyllou, M.S., 1998. Oscillating foils of high propulsive efficiency. Journal of Fluid Mechanics 360, 41–72.Ashraf, M.A., 2010. Numerical simulation of the flow over flapping airfoils in propulsion and power extraction regimes. Canberra, The University of New
South Wales at Australian Defence Force Academy. Ph.D. Thesis.Ashraf, M.A., Lai, J.C.S., Young, J., 2007. Numerical analysis of flapping wing aerodynamics. In: Proceedings of the 16th Australian Fluid Mechanics Conference,
Crown Plaza, Gold Coast, Australia, December 2–7.Blondeaux, P., Guglielmini, L., Triantafyllou, M.S., 2005. Chaotic flow generated by an oscillating foil. AIAA Journal 43 (4), 918–922.Cebeci, T., Platzer, M., Chen, H., Chang, K.-C., Shao, J.P., 2004. Analysis of Low-Speed Unsteady Airfoil Flows. Horizons Publishing Inc.Dickinson, M.H., Gotz, K.G., 1993. Unsteady aerodynamic performance of model wings at low Reynolds numbers. Journal of Experimental Biology 174, 45–64.Freymuth, P., 1988. Propulsive vortical signature of plunging and pitching airfoils. AIAA Journal 26 (7), 881–883.Garrick, I.E., 1937. Propulsion of a flapping and oscillating airfoil. NACA, 567.Heathcote, S., Gursul, I., 2007. Flexible flapping airfoil propulsion at low Reynolds number. AIAA Journal 45 (5), 1066–1078.Isogai, K., Shinmoto, Y., Watanabe, Y., 1999. Effects of dynamic stall on propulsive efficiency and thrust of flapping airfoil. AIAA Journal 37 (10), 1145–1151.Jones, K.D., Lund, T.C., Platzer, M.F., 2001. Experimental and computational investigation of flapping wing propulsion for micro aerial vehicles. Progress in
Astronautics and Aeronautics 195, 307–339.Kinsey, T., Dumas, G., 2008. Parametric study of an oscillating airfoil in a power-extraction regime. AIAA Journal 46 (6), 1318–1330.Koochesfahani, M.M., 1989. Vortical patterns in the wake of an oscillating airfoil. AIAA Journal 27 (9), 1200–1205.Kunz, P.J., Kroo, I., 2001. Analysis and design of airfoils for use at ultra-low Reynolds numbers. In: Mueller, T.J. (Ed.), Fixed and Flapping Wing Aerodynamics
for Micro Air Vehicle Applications, vol. 195. AIAA, Reston.Lai, J.C.S., Platzer, M.F., 1999. Jet characteristics of a plunging airfoil. AIAA Journal 37 (12), 1529–1537.Lentink, D., Gerritsma, M., 2003. Influence of airfoil shape on performance in insect flight. In: Proceedings of the 33rd AIAA Fluid Dynamics Conference and
Exhibit Orlando, Florida, June 23–26.Mueller, T.J., Batill, S.M., 1982. Experimental studies of separation on a two dimensional airfoil at low Reynolds numbers. AIAA Journal 20 (4), 457–463.Platzer, M.F., Jones, K.D., Young, J., Lai, J.C.S., 2008. Flapping-wing aerodynamics—progress and challenges. AIAA Journal 46 (9), 2136–2149.Read, D.A., Hover, F.S., Triantafyllou, M.S., 2003. Forces on oscillating foils for propulsion and maneuvering. Journal of Fluids and Structures 17 (1), 163–183.Rozhdestvensky, K.V., Ryzhov, V.A., 2003. Aerohydrodynamics of flapping-wing propulsors. Progress in Aerospace Sciences 39 (8), 585–633.Schouveiler, L., Hover, F.S., Triantafyllou, M.S., 2005. Performance of flapping foil propulsion. Journal of Fluids and Structures 20, 949–959.Shyy, W., Berg, M., Ljungqvist, D., 1999. Flapping and flexible wings for biological and micro air vehicles. Progress in Aerospace Sciences 35 (5), 455–505.Spalart, P., Allmaras, S., 1992. A one-equation turbulence model for aerodynamic flows. AIAA Paper 92-0439.Streitlien, K., Triantafyllou, G.S., 1998. On thrust estimates for flapping foils. Journal of Fluids and Structures 12, 47–55.Triantafyllou, G.S., Triantafyllou, M.S., A., G.M., 1993. Optimal thrust development in oscillating foils with application to fish propulsion. Journal of Fluids and
Structures 7, 205–224.Triantafyllou, M.S., Techet, A.H., Hover, F.S., 2004. Review of experimental work in biomimetic foils. IEEE Journal of Oceanic Engineering 29 (3), 585–594.Tuncer, I.H., Platzer, M.F., 1996. Thrust generation due to airfoil flapping. AIAA Journal 34 (2), 324–331.Vandenberghe, N., Childress, S., Zhang, J., 2006. On unidirectional flight of a free flapping wing. Physics of Fluids 18, 014102-1–8.Visbal, M.R., 2009. High-fidelity simulation of transitional flows past a plunging airfiol. AIAA Journal 47 (11), 26852697.Visbal, M.R., Gordnier, R.E., Galbraith, M.C., 2009. High-fidelity simulations of moving and flexible airfoils at low Reynolds numbers. Experiments in Fluids
46, 903–922.Wang, Z.J., 2000. Vortex shedding and frequency selection in flapping flight. Journal of Fluid Mechanics 410, 323–341.Wilcox, D.C., 1998. Turbulence modeling for CFD. California, DCW Industries, Inc., La Canada.Young, J., Lai, J.C.S., 2004. Oscillation frequency and amplitude effects on the wake of plunging airfoil. AIAA Journal 42 (10), 2042–2052.Young, J., Lai, J.C.S., 2007. Mechanisms influencing the efficiency of oscillating airfoil propulsion. AIAA Journal 45 (7), 1695–1702.
Related Documents