WP/14/229 Revisiting Tourism Flows to the Caribbean: What is Driving Arrivals? Nicole Laframboise, Nkunde Mwase, Joonkyu Park, and Yingke Zhou

Welcome message from author
This document is posted to help you gain knowledge. Please leave a comment to let me know what you think about it! Share it to your friends and learn new things together.
Transcript

WP/14/229
Revisiting Tourism Flows to the Caribbean: What is Driving Arrivals?
Nicole Laframboise, Nkunde Mwase, Joonkyu Park, and Yingke Zhou
2
© 2014 International Monetary Fund WP/14/229
IMF Working Paper
Western Hemisphere Department
Revisiting Tourism Flows to the Caribbean: What is Driving Arrivals?
Prepared by Nicole Laframboise, Nkunde Mwase, Joonkyu Park, and Yingke Zhou1
Authorized for distribution by Jan Kees Martijn
December 2014
Abstract
The Caribbean share of the global tourism market has been declining. This study examines what is driving tourism flows. It estimates the determinants of tourism and explores variations based on sample differences, and also constructs a static nominal price comparison index. The paper finds that: (i) tourism arrivals and expenditure are sensitive to both price and income factors in source markets; (ii) price and income elasticities of tourism have declined since 2008; (iii) price elasticity is statistically insignificant for “high-end” destinations; and (iv) the nominal cost of an average one week beach holiday in the Caribbean is higher than in other beach destinations around the world. These results point to the need for structural reforms to raise product quality, cost reduction or containment in “low-end” destinations, including possibly via exchange rates, and an adjustment in aggregate consumption to adapt to the implications of a lower contribution to GDP from tourism.
JEL Classification Numbers: C33, L83, N16, O54 Keywords: price elasticity, income elasticity, Carribean, tourism arrivals and expenditure
Authors’ E-Mail Addresses: [email protected], [email protected], [email protected], [email protected]
1 We are grateful to Roberto Garcia-Saltos, Charles Kramer, Herman Kamil, Jan Kees Martijn, Andre Meier, Roberto Perrelli, Evan Curtis Tanner, Kazuaki Washimi, Alejandro Werner, and seminar participants from WHD and SPR at the IMF, and from the University of West Indies for their comments and suggestions. Thank you also to research assistants Sashana Whyte and Francis Strodel for their excellent work.
This Working Paper should not be reported as representing the views of the IMF. The views expressed in this Working Paper are those of the author(s) and do not necessarily represent those of the IMF or IMF policy. Working Papers describe research in progress by the author(s) and are published to elicit comments and to further debate.

3
Table of Contents
Abstract ......................................................................................................................................2
I. Introduction ............................................................................................................................4
II. Literature Review ..................................................................................................................5
III. Tourism Performance in Recent Years ................................................................................6
IV. Determinants of Tourism Arrivals and Expenditure .........................................................10 A. Data .........................................................................................................................10 B. Estimation Strategy .................................................................................................10 C. Empirical Results ....................................................................................................12
V. “Week at the Beach” Index .................................................................................................15 A. Data .........................................................................................................................15 B. Concept and Approach ............................................................................................15 C. Findings ...................................................................................................................16 D. Caveats. ...................................................................................................................16
VI. Conclusions and Policy Considerations.............................................................................17 A. Conclusions .............................................................................................................17 B. Policy Considerations ..............................................................................................18
Appendices I. Data .......................................................................................................................................20 II. Regression Results ..............................................................................................................21 III. Composition of “A Week at the Beach Index” ..................................................................24 IV. “A Week at the Beach Index” and Other Variables ..........................................................24 Tables 1. Determinants of Tourism Arrivals and Expenditures ..........................................................14 2. Post-Financial Crisis Versus Pre-FInancial Crisis ...............................................................14 3. High-End Versus Lower-Cost Destinations .........................................................................15 Figures 1. Tourism Growth in the Caribbean .........................................................................................7 2. Tourism Market Share Change from 2007 to 2013 ...............................................................7 3. Tourism Growth in Selected Countries, Economic Performance in Key Source Markets ....8 4. Change in Source Market Composition .................................................................................9 5. Selected Supply Side Indicators .............................................................................................9 6. Natural Disasters and Tourist Arrivals ................................................................................10 7. A Week at the Beach Index .................................................................................................17 References ................................................................................................................................27

4
I. INTRODUCTION
The Caribbean region is highly dependent on tourism. In many countries, the importance of tourism increased steadily as the system of agricultural trade preferences was dismantled. Tourism gradually became the dominant sector, and now accounts for a large share of GDP, ranging from 8 to 40 percent of GDP for most of the 16 countries studied in this paper.2 Tourism is of course the main driver of economic growth and employment, and is a key source of government revenues. In recent years, however, the rate of growth in tourist arrivals has stalled, and the region’s share of the global market has been shrinking. Moreover, many Caribbean countries are facing significant macroeconomic imbalances as growth has slowed and public finances have deteriorated. Thus there is strong interest in understanding what drives tourism flows. This study aims to find out what attracts tourists to the Caribbean and whether this has changed since the global financial crisis, and how the nominal cost of a visit to a Caribbean island compares with a beach holiday in other parts of the world. A better understanding of what is driving tourism flows at this time should help to inform strategies for reinvigorating the sector and ultimately strengthening its contribution to growth. The scope of this study is on tourism flows and it does not consider the impact of tourism on the broader economy, nor does it aim to quantify non-price factors driving tourism choices. The paper contributes to the literature in three ways: (i) it revisits the determinants of tourism and explores new factors like the impact of competitors from periphery Europe; (ii) it investigates the extent to which the global financial crisis and recession may have altered tourism demand; and (iii) it introduces the concept of a “week at the beach” index to compare the nominal cost of similar tourism products across different beach destinations around the world. It expands on work by Mwase (2013) which explored the impact of high-end and low-end destinations on tourism flows by examining the price and income elasticities for different products. We are not aware of any other study that differentiates between types of destinations. Using data covering the period 2000–2013 for 16 Caribbean countries, the paper finds that both price and income factors are found to have a significant impact on tourism arrivals and expenditure, although price elasticity is found to be statistically insignificant for high-end destinations. The number of airlines also has a statistically positive impact on arrivals and expenditure. 2 The paper focuses on tourism-based economies in the Caribbean with receipts as a share of GDP above 8%: Anguilla (37%), Antigua & Barbuda (26%), The Bahamas (27%), Barbados (24%), Belize (19%), Dominica (20%), Dominican Republic (8%), Grenada(14%), Jamaica (15%), St. Kitts & Nevis (13%), St. Lucia (25%), St. Vincent & the Grenadines (13%). We exclude the following non tourism-based economies in some of the empirical work: Guyana (4%), Haiti (3%), Suriname (1%), and Trinidad & Tobago (2%). See section V and Appendices I and III.
5
A simple static comparison of 10 Caribbean countries with 18 other beach holiday destinations in the world (including Cancun and Puerto Rico) in 2014 finds that the nominal cost of an “average” beach holiday in the Caribbean is higher than in other parts of the world. The result suggests that non-price factors would need to be superior to ensure that the marginal cost of a holiday in the Caribbean does not exceed the marginal benefit. The index is based on three components: (i) the average room rate of three star hotels from one common source, (ii) the taxi fare between the hotel and airport, (iii) three meals per day, (iv) two liters of water, one beer and one cup of coffee. The paper starts with a short literature review (Section II). Section III provides stylized facts about trends in tourism after the global financial crisis. Section IV–VI presents the empirical work as well as the static relative price index. The former is based on a dynamic panel regression that attempts to identify the key determinants of, and trends in, tourism arrivals and expenditure over a 14 year period, including by type of destination. Second, we experiment with a simple relative price index that contrasts nominal, “on the ground” prices of a holiday at the beach anywhere around the world. This index copies the Big Mac Index (Economist) idea, but does not go as far as inferring underlying real exchange rate valuations. Rather, its aim is to provide a snapshot in time only of comparator prices as one part of efforts to gather information on the factors driving tourism consumption behavior.
II. LITERATURE REVIEW
There is an abundance of research on tourism in the Caribbean. This review focuses on studies that explore the determinants of tourism flows and competitiveness. Starting with the empirical work on global tourism, Culiuc (2014) found that OECD countries exhibit higher elasticity with respect to economic variables (GDP, real exchange rates, bilateral trade), in part due to a larger share of business travel. However, he found that tourism to small islands is less sensitive to changes in real exchange rates, but more sensitive to the introduction/ removal of direct flights. Wolfe and Romeu (2011) measured the impact of changing economic conditions in OECD countries on tourist arrivals to Latin America and the Caribbean. Their estimates suggest that tourism demand is price sensitive, and that a variety of factors affecting the cost of tourism services can drive market share outcomes. Their estimate shows that a 1.0 percent decline in the cost of tourism services is found to increase tourist arrivals by 1.2–1.6 percent. Crouch (1994) investigated a number of empirical studies and found an average price elasticity of demand for international tourism of -0.6 to -0.8, while the magnitude is different depending on a number of methodological factors. Caribbean-specific literature provides quite mixed results about the importance of price and income factors in attracting tourists. Archibald and others (2008) argued that long-term trends in arrivals can be influenced by changes in capacity and the price of tourism in the destination relative to the source country and other destinations, as well as fluctuations in exchange rates and airfares. The results indicate that a 1.0 percent rise in destination prices relative to the source market reduces arrivals by about 0.1 percent. Tsounta (2008) showed that tourism arrivals are significantly affected by economic developments in source countries
6
as well as price considerations and external shocks, while supply factors, such as developments in foreign direct investment and the number of airlines servicing a destination, are also significant determinants of tourism demand. According to her estimates, income elasticity (per capita GDP of source countries) is 1.5 and price elasticity (source market-based real effective exchange rate) is -1.3. On the other hand, Mwase (2013) found that tourism flows to the Caribbean are income elastic, with the exception of flows from Spain and the U.S., but are not very sensitive to price changes. Bolaky (2011) argued that a real exchange rate depreciation could increase tourism competitiveness, but only in relation to stay-over arrivals of Canadian tourists. When increases in transport costs are linked to hikes in oil prices, there is a drop in stay-over arrivals, especially from Canada and the U.K.. Greenidge and Jackman (2010) found that the structure and nature of tourism demand for Barbados had evolved and that income elasticities for arrivals from the U.K., U.S., Canada, and CARICOM had become smaller over time.
III. TOURISM PERFORMANCE IN RECENT YEARS
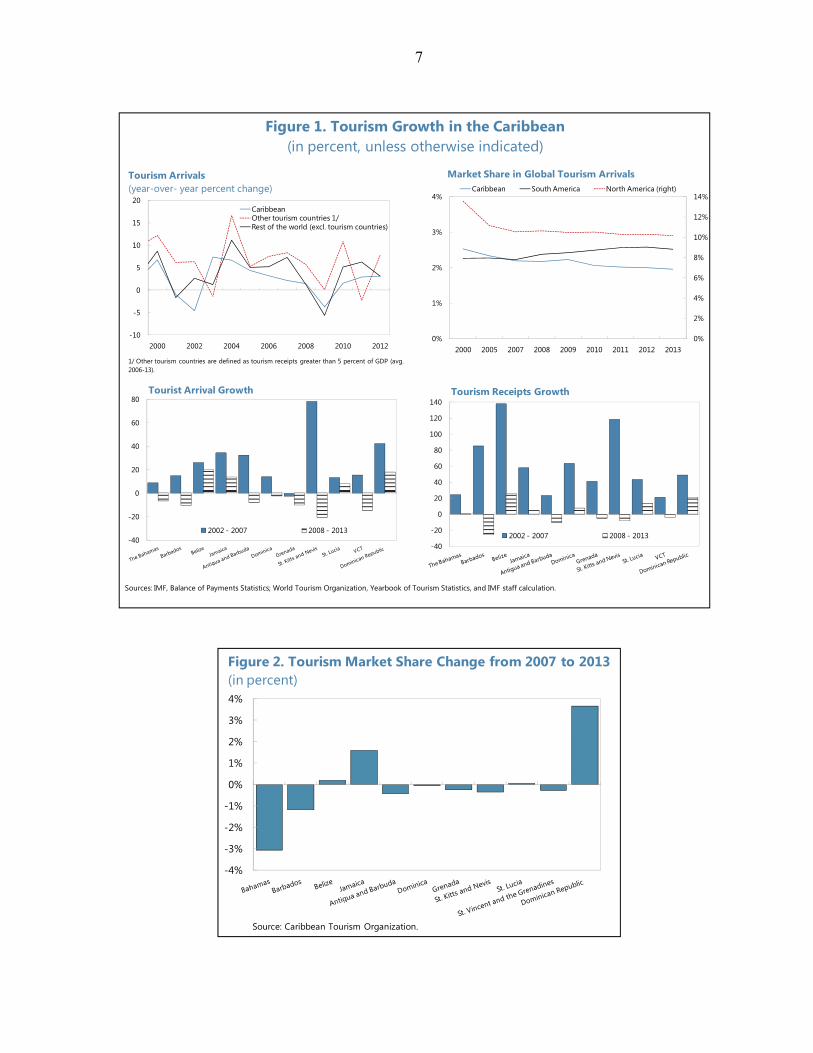
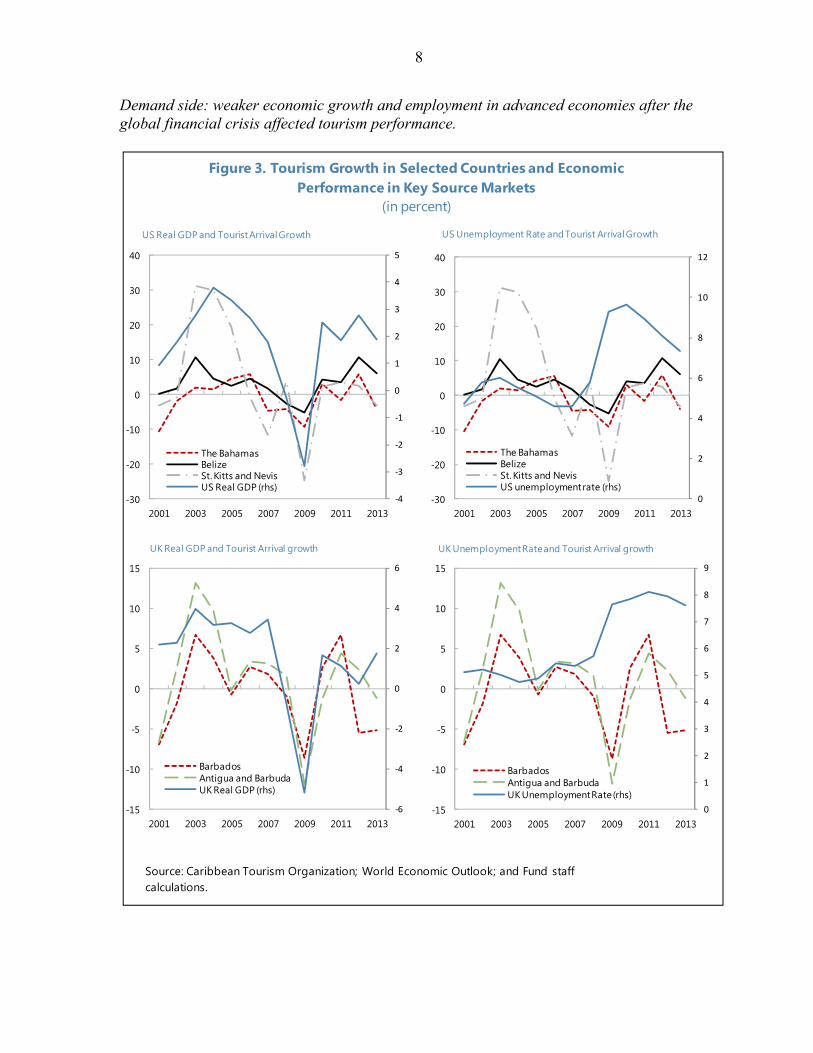
Tourism in the Caribbean displayed solid growth during the 2000s, fueled by steady growth in key advanced economies and strong inflows of foreign direct investment (FDI). Since mid-2008, the global downturn led to a collapse in external demand which significantly affected tourism performance. While there have been some signs of gradual recovery in recent years, the pace of growth has been weaker than in other regions. The Caribbean share in the global tourism market has continued to decline, falling to about 2 percent in 2013 (Figure 1) compared to about 2.5 percent in 2000. However, within the Caribbean there are some notable exceptions, namely Belize, the Dominican Republic, and Jamaica, where performance has been resilient. As a result, there has been a shift in market share within the Caribbean (Figure 2). Historically, economic cycles in advanced economies were transmitted rapidly to the Caribbean through the tourism sector, and this relationship persists today in countries dependent on arrivals from the U.S. (the Bahamas, Belize, St. Kitts & Nevis) and the U.K. (Barbados, Antigua and Barbuda).3 However, the Great Recession left a more profound impact. With output contracting sharply in the U.S., Canada and the U.K., unemployment at elevated levels for many years, and U.S. household net wealth depressed, tourism arrivals fell sharply after the crisis and have remained weak since (Figure 3).
3 For The Bahamas, Belize, and St. Kitts & Nevis, the U.S. is the most important source market, representing more than 60 percent of total tourist arrivals. For Barbados and Antigua and Barbuda, U.K is the most important source market, accounting for more than 35 percent of total tourist arrivals.
7
-4%
-3%
-2%
-1%
0%
1%
2%
3%
4%
Figure 2. Tourism Market Share Change from 2007 to 2013(in percent)
Source: Caribbean Tourism Organization.
0%
2%
4%
6%
8%
10%
12%
14%
0%
1%
2%
3%
4%
2000 2005 2007 2008 2009 2010 2011 2012 2013
Caribbean South America North America (right)
Market Share in Global Tourism Arrivals
-40
-20
0
20
40
60
80
2002 - 2007 2008 - 2013
Tourist Arrival Growth
-40
-20
0
20
40
60
80
100
120
140
2002 - 2007 2008 - 2013
Tourism Receipts Growth
-10
-5
0
5
10
15
20
2000 2002 2004 2006 2008 2010 2012
CaribbeanOther tourism countries 1/Rest of the world (excl. tourism countries)
1/ Other tourism countries are defined as tourism receipts greater than 5 percent of GDP (avg. 2006-13).
Tourism Arrivals (year-over- year percent change)
Figure 1. Tourism Growth in the Caribbean(in percent, unless otherwise indicated)
Sources: IMF, Balance of Payments Statistics; World Tourism Organization, Yearbook of Tourism Statistics, and IMF staff calculation.
8
Demand side: weaker economic growth and employment in advanced economies after the global financial crisis affected tourism performance.
Figure 3. Tourism Growth in Selected Countries and Economic Performance in Key Source Markets
(in percent)
Source: Caribbean Tourism Organization; World Economic Outlook; and Fund staff calculations.
‐6
-4
-2
0
2
4
6
-15
-10
-5
0
5
10
15
2001 2003 2005 2007 2009 2011 2013
UK Real GDP and Tourist Arrival growth
BarbadosAntigua and BarbudaUK Real GDP (rhs)
0
1
2
3
4
5
6
7
8
9
-15
-10
-5
0
5
10
15
2001 2003 2005 2007 2009 2011 2013
BarbadosAntigua and BarbudaUK Unemployment Rate (rhs)
UK Unemployment Rate and Tourist Arrival growth
-4
-3
-2
-1
0
1
2
3
4
5
-30
-20
-10
0
10
20
30
40
2001 2003 2005 2007 2009 2011 2013
US Real GDP and Tourist Arrival Growth
The BahamasBelizeSt. Kitts and NevisUS Real GDP (rhs)
0
2
4
6
8
10
12
-30
-20
-10
0
10
20
30
40
2001 2003 2005 2007 2009 2011 2013
The BahamasBelizeSt. Kitts and NevisUS unemployment rate (rhs)
US Unemployment Rate and Tourist Arrival Growth
9
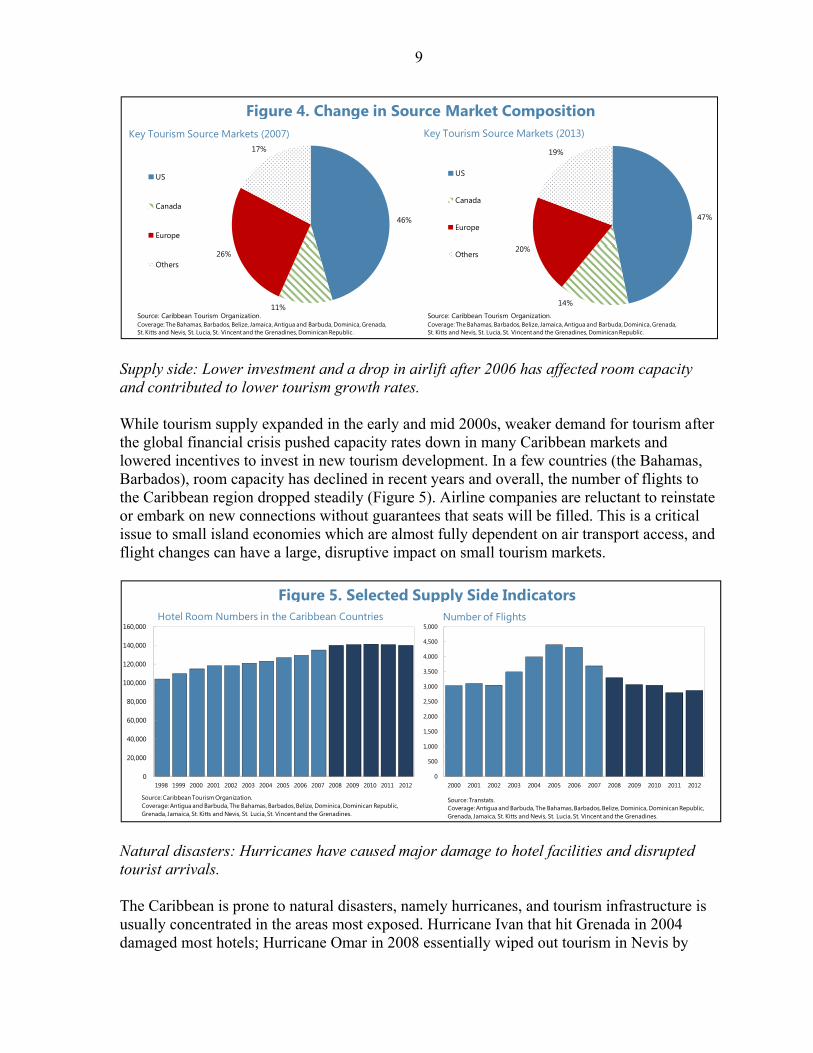
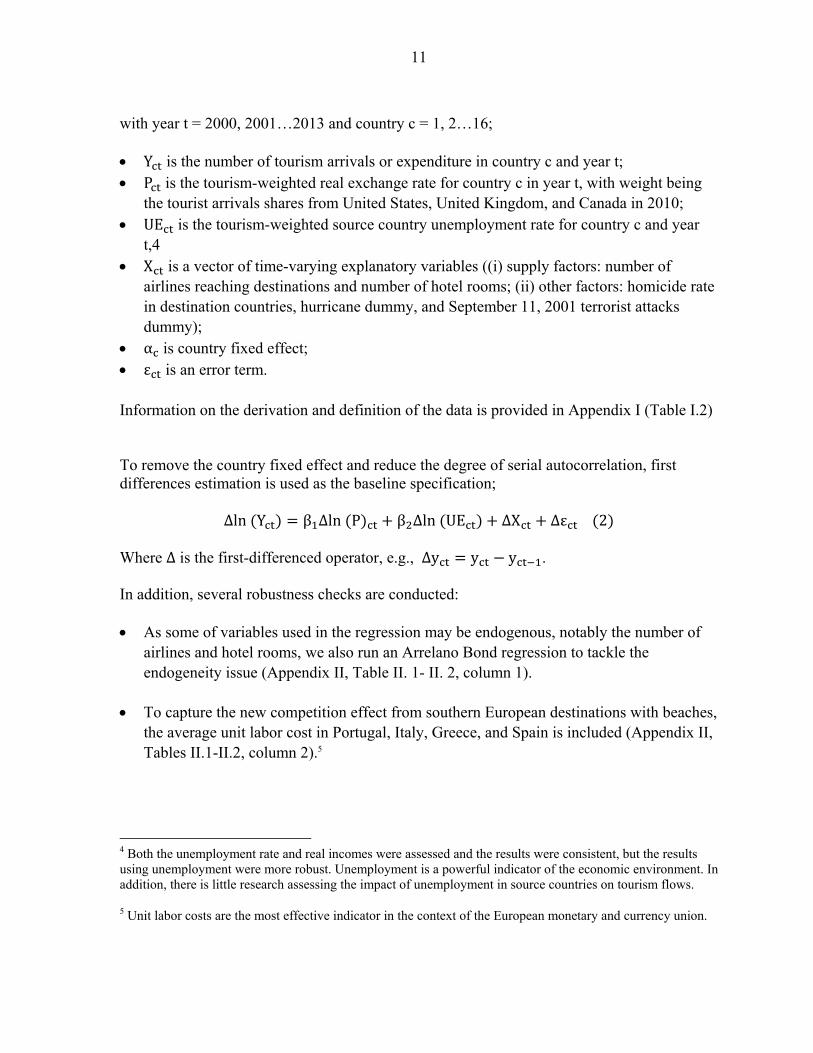
Supply side: Lower investment and a drop in airlift after 2006 has affected room capacity and contributed to lower tourism growth rates. While tourism supply expanded in the early and mid 2000s, weaker demand for tourism after the global financial crisis pushed capacity rates down in many Caribbean markets and lowered incentives to invest in new tourism development. In a few countries (the Bahamas, Barbados), room capacity has declined in recent years and overall, the number of flights to the Caribbean region dropped steadily (Figure 5). Airline companies are reluctant to reinstate or embark on new connections without guarantees that seats will be filled. This is a critical issue to small island economies which are almost fully dependent on air transport access, and flight changes can have a large, disruptive impact on small tourism markets.
Natural disasters: Hurricanes have caused major damage to hotel facilities and disrupted tourist arrivals. The Caribbean is prone to natural disasters, namely hurricanes, and tourism infrastructure is usually concentrated in the areas most exposed. Hurricane Ivan that hit Grenada in 2004 damaged most hotels; Hurricane Omar in 2008 essentially wiped out tourism in Nevis by
46%
11%
26%
17%
US
Canada
Europe
Others
Key Tourism Source Markets (2007)
Source: Caribbean Tourism Organization. Coverage: The Bahamas, Barbados, Belize, Jamaica, Antigua and Barbuda, Dominica, Grenada, St. Kitts and Nevis, St. Lucia, St. Vincent and the Grenadines, Dominican Republic.
47%
14%
20%
19%
US
Canada
Europe
Others
Key Tourism Source Markets (2013)
Source: Caribbean Tourism Organization. Coverage: The Bahamas, Barbados, Belize, Jamaica, Antigua and Barbuda, Dominica, Grenada, St. Kitts and Nevis, St. Lucia, St. Vincent and the Grenadines, Dominican Republic.
Figure 4. Change in Source Market Composition
0
20,000
40,000
60,000
80,000
100,000
120,000
140,000
160,000
1998 1999 2000 2001 2002 2003 2004 2005 2006 2007 2008 2009 2010 2011 2012
Hotel Room Numbers in the Caribbean Countries
Source: Caribbean Tourism Organization. Coverage: Antigua and Barbuda, The Bahamas, Barbados, Belize, Dominica, Dominican Republic, Grenada, Jamaica, St. Kitts and Nevis, St. Lucia, St. Vincent and the Grenadines.
0
500
1,000
1,500
2,000
2,500
3,000
3,500
4,000
4,500
5,000
2000 2001 2002 2003 2004 2005 2006 2007 2008 2009 2010 2011 2012
Number of Flights
Source: Transtats.Coverage: Antigua and Barbuda, The Bahamas, Barbados, Belize, Dominica, Dominican Republic, Grenada, Jamaica, St. Kitts and Nevis, St. Lucia, St. Vincent and the Grenadines.
Figure 5. Selected Supply Side Indicators

10
damaging the main hotel on the island (Figure 6), and Hurricane Sandy in 2012 caused disruptions to hotel operations in The Bahamas that negatively affected stopover tourists. In the Eastern Caribbean Currency Union, the debt-to-GDP ratio rises by almost 5 percentage points on average the year a storm strikes (Acevedo, 2014).
Clearly tourism in the Caribbean is vulnerable to shocks, and also to events in key source markets. Stronger growth, higher consumer confidence, and declining unemployment levels in North America and the U.K. should contribute to reinvigorating growth in the sector. However, some of the trends presented above point to a possible secular shift in tourism demand and activity in the region. This study will look at the factors underlying recent tourism trends to shed light on structural features of the sector that might inform macro and micro policy decisions.
IV. DETERMINANTS OF TOURISM ARRIVALS AND EXPENDITURE
A. Data
To examine the determinants of tourism arrivals and expenditure, annual data for the period 2000–2013 for the 16 countries in the sample are used. Of particular note, some of the series used as independent variables to estimate price and income coefficients are based on tourism-weights. So for example, the weights for the real-effective exchange rate series are based on tourism source market shares. Please see Appendix I, Table I.1, and Table I.2 for further details.
B. Estimation Strategy
Using a dynamic panel regression, explanatory variables related to price factors, income factors, supply factors, and other factors are applied. We further check whether these determinants vary over time, i.e., post- versus pre- financial crisis, and across countries, i.e., high-end versus low-end destinations. Specifically, the following equation is estimated:
ln Y α β ln P β ln UE X ε 1
0
20,000
40,000
60,000
80,000
100,000
120,000
140,000
160,000
2000 2001 2002 2003 2004 2005 2006 2007 2008 2009 2010 2011 2012 2013
Grenada: Tourist Arrivals
Source: Caribbean Tourism Organization.
Hurricane Ivan
0
20,000
40,000
60,000
80,000
100,000
120,000
140,000
160,000
2000 2001 2002 2003 2004 2005 2006 2007 2008 2009 2010 2011 2012 2013
St. Kitts and Nevis: Touris Arrivals
Source: Caribbean Tourism Organization.
Hurricane Omar
Figure 6. Natural Disasters and Tourist Arrivals
11
with year t = 2000, 2001…2013 and country c = 1, 2…16; Y is the number of tourism arrivals or expenditure in country c and year t; P is the tourism-weighted real exchange rate for country c in year t, with weight being
the tourist arrivals shares from United States, United Kingdom, and Canada in 2010; UE is the tourism-weighted source country unemployment rate for country c and year
t,4 X is a vector of time-varying explanatory variables ((i) supply factors: number of
airlines reaching destinations and number of hotel rooms; (ii) other factors: homicide rate in destination countries, hurricane dummy, and September 11, 2001 terrorist attacks dummy);
α is country fixed effect; ε is an error term.
Information on the derivation and definition of the data is provided in Appendix I (Table I.2) To remove the country fixed effect and reduce the degree of serial autocorrelation, first differences estimation is used as the baseline specification;
∆ln Y β ∆ln P β ∆ln UE ∆X ∆ε 2 Where ∆ is the first-differenced operator, e.g., ∆y y y . In addition, several robustness checks are conducted: As some of variables used in the regression may be endogenous, notably the number of
airlines and hotel rooms, we also run an Arrelano Bond regression to tackle the endogeneity issue (Appendix II, Table II. 1- II. 2, column 1).
To capture the new competition effect from southern European destinations with beaches,
the average unit labor cost in Portugal, Italy, Greece, and Spain is included (Appendix II, Tables II.1-II.2, column 2).5
4 Both the unemployment rate and real incomes were assessed and the results were consistent, but the results using unemployment were more robust. Unemployment is a powerful indicator of the economic environment. In addition, there is little research assessing the impact of unemployment in source countries on tourism flows.
5 Unit labor costs are the most effective indicator in the context of the European monetary and currency union.

12
To capture the competition effect from cruise passengers, we control for the number of cruise passengers (Appendix II, Tables II.1-II.2, column 3).
For alternative price factors in the destinations, the following two proxies are used: o the Rogoff measure of exchange rate misalignment (Tables II.1-II.2, column 4) o the “UN per diem” rate (Tables II.1-II.2, column 5)
For alternative income factors, the following three proxies are applied6:
o tourism-weighted source country real GDP per capita (Tables II.1-II.2, column 6) o US household net wealth (Tables II.1-II.2, column 7) o tourism-weighted unemployment gap with HP- filter (Tables II.1-II.2, column 8)
To focus on tourism-based economies, countries where the tourism sector as a share of
GDP was below 5 percent in 2010 (Guyana, Haiti, Suriname, and Trinidad and Tobago) are excluded (Tables II.1-II.2, column 9).
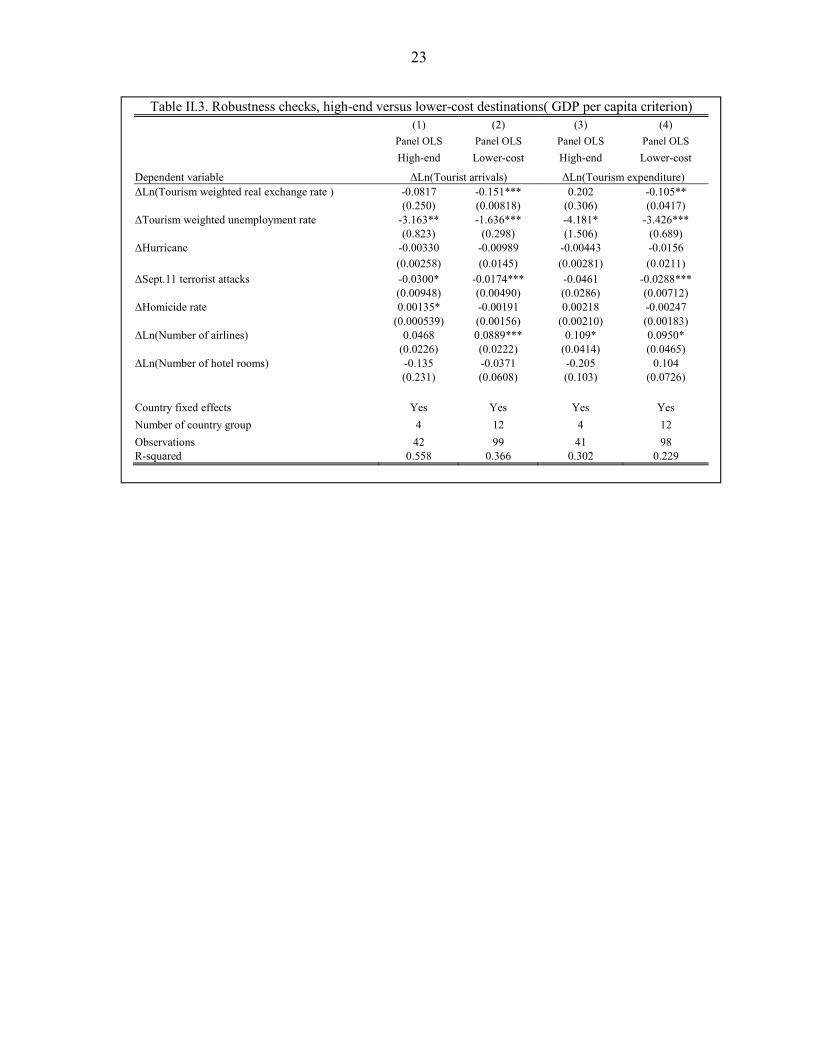
Heterogeneous effects over time and across countries are also checked, specifically: Post-financial crisis versus pre-financial crisis. To check whether price and income elasticities have changed since the global financial crisis, the sample is split into two periods, post-financial crisis (after 2008) versus pre-financial crisis (pre-2008). High-end versus lower-cost destinations. To check whether countries with different characteristics have different price and income elasticities, the sample is divided into high (i.e. luxury) and lower-cost destinations. Two possible criteria are used to classify the high versus lower-cost countries, namely: (i) the number of 4–5 star hotels as a share of total7, and (ii) GDP per capita8. Both criteria could be said to reflect the host countries’ ability to provide the infrastructure and services needed to support high-end travelers.
C. Empirical Results
Overall, both price and income factors are found to have a significant impact on tourism arrivals and expenditure.
6 As the country fixed effects in our model captures all time-invariant country specific characteristics, including distance, we did not use distance-weighted real GDP per capita or the unemployment rate.
7 Based on a ratio of 4-5 star hotels to the total in 2014 with a threshold of 30 percent, higher end destinations are Anguilla, The Bahamas, Barbados, and St. Kitts and Nevis; the remainder of the sample in Table A.1 is lower-cost destinations.
8 Higher end destinations here have a per capita GDP value above US$15,000 and include Anguilla, Barbados, The Bahamas, and Trinidad & Tobago; the remainder in Table A.1 is lower income destinations.

13
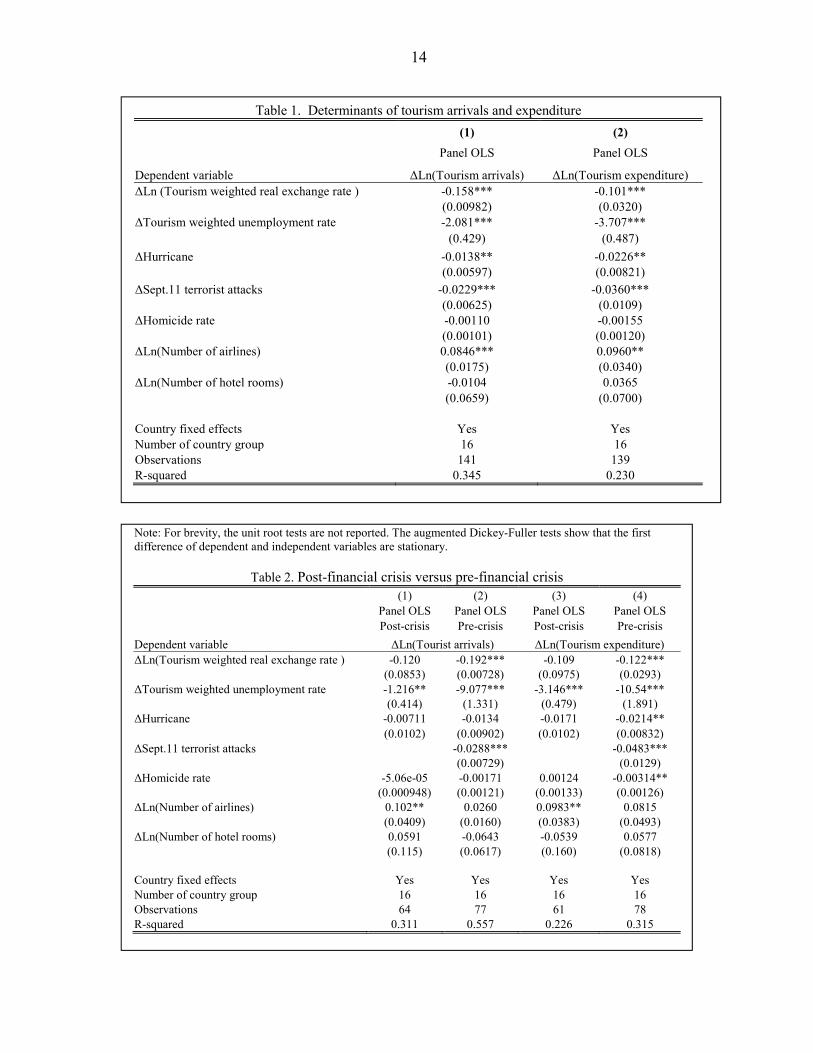
Price factor. A 1.0 percent appreciation of the tourism-weighted real exchange rate is associated with 0.16 percent decrease in arrivals, and a 0.1 percent decrease in tourism expenditure in the baseline specification during 2000-2013 (Table 1). These results are broadly consistent with the literature, e.g., Culiuc (2014) and Mwase (2013). However, price elasticity becomes marginally insignificant after the global financial crisis (Table 2). Interestingly, price elasticity is found to be statistically insignificant for high-end destinations (Table 3). This suggests, not surprisingly, that these destinations attract tourists who are less sensitive to the price factor. Intuitively, travelers to higher-end destinations might be less sensitive to price (real effective exchange rate) changes since consumer preferences (typical of higher income tourists) suggest a greater willingness to pay a higher marginal cost to maximize utility, for a given tourism product.
Income factor. A 1.0 percent increase in the tourism-weighted unemployment rate implies a 2.1 percent decrease in arrivals, and a 3.7 percent decrease in expenditure in the baseline specification during 2000-2013 (Table 1). The income elasticity becomes smaller after the global financial crisis (Table 2). The finding shows that arrivals in the Caribbean are very sensitive to economic conditions in source countries.
Supply factors. The number of airlines has a statistically positive impact on arrivals and
expenditure. The number of hotel rooms is found to have no significant impact on tourism arrivals to, or expenditure in the Caribbean, either for the higher end or lower cost destinations (Table 1). To address concerns of reverse causality, the number of hotel rooms and airlines lagged by one year are also tested; the results are similar.
Other factors. Both hurricane and the September 11 terrorist attack have negative and
significant impacts on arrivals and expenditure. However, tourism arrivals and expenditure are not sensitive to homicide rates (Table 1).
Caveats. There could be some country-specific time-varying omitted variables, for
example, the service quality of destinations, and the competition effect from other regions in the Caribbean. It is difficult to capture all the determinants of tourism arrivals and expenditure due to lack of data.
14
Table 1. Determinants of tourism arrivals and expenditure
(1) (2)
Panel OLS Panel OLS
Dependent variable ΔLn(Tourism arrivals) ΔLn(Tourism expenditure) ΔLn (Tourism weighted real exchange rate ) -0.158*** -0.101***
(0.00982) (0.0320) ΔTourism weighted unemployment rate -2.081*** -3.707***
(0.429) (0.487)
ΔHurricane -0.0138** -0.0226** (0.00597) (0.00821)
ΔSept.11 terrorist attacks -0.0229*** -0.0360*** (0.00625) (0.0109)
ΔHomicide rate -0.00110 -0.00155 (0.00101) (0.00120)
ΔLn(Number of airlines) 0.0846*** 0.0960** (0.0175) (0.0340)
ΔLn(Number of hotel rooms) -0.0104 0.0365 (0.0659) (0.0700)
Country fixed effects Yes Yes Number of country group 16 16 Observations 141 139 R-squared 0.345 0.230
Note: For brevity, the unit root tests are not reported. The augmented Dickey-Fuller tests show that the first difference of dependent and independent variables are stationary.
Table 2. Post-financial crisis versus pre-financial crisis (1) (2) (3) (4)
Panel OLS Panel OLS Panel OLS Panel OLS Post-crisis Pre-crisis Post-crisis Pre-crisis
Dependent variable ΔLn(Tourist arrivals) ΔLn(Tourism expenditure) ΔLn(Tourism weighted real exchange rate ) -0.120 -0.192*** -0.109 -0.122***
(0.0853) (0.00728) (0.0975) (0.0293) ΔTourism weighted unemployment rate -1.216** -9.077*** -3.146*** -10.54***
(0.414) (1.331) (0.479) (1.891) ΔHurricane -0.00711 -0.0134 -0.0171 -0.0214**
(0.0102) (0.00902) (0.0102) (0.00832) ΔSept.11 terrorist attacks -0.0288*** -0.0483***
(0.00729) (0.0129) ΔHomicide rate -5.06e-05 -0.00171 0.00124 -0.00314**
(0.000948) (0.00121) (0.00133) (0.00126) ΔLn(Number of airlines) 0.102** 0.0260 0.0983** 0.0815
(0.0409) (0.0160) (0.0383) (0.0493) ΔLn(Number of hotel rooms) 0.0591 -0.0643 -0.0539 0.0577
(0.115) (0.0617) (0.160) (0.0818) Country fixed effects Yes Yes Yes Yes Number of country group 16 16 16 16 Observations 64 77 61 78 R-squared 0.311 0.557 0.226 0.315

15
V. ‘WEEK AT THE BEACH’ INDEX
A. Data
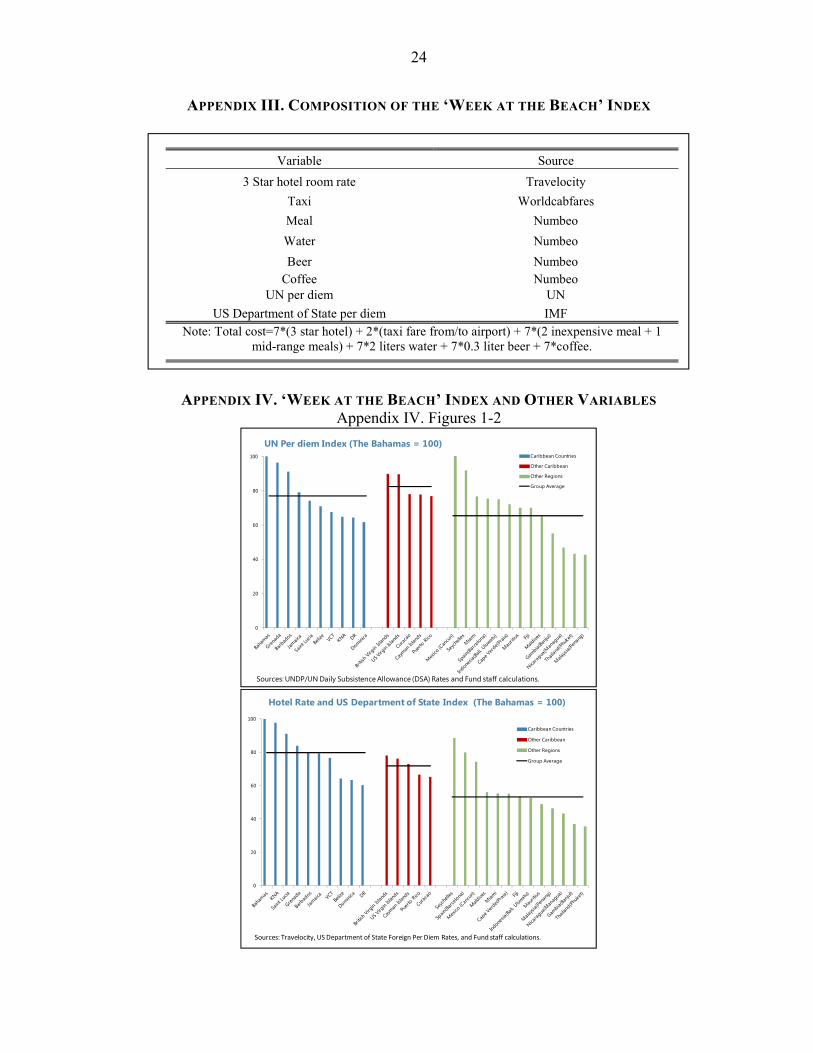
To construct an index based on the core costs of spending one week at the beach, three broad cost categories are compiled based on 2014 data from a common source across all countries. The categories comprise costs for hotel, food, and transportation. For example, hotel rates are based on the average room rate for three star hotels as determined by Travelocity. Please see Appendix III and Table III.1 for source information.
B. Concept and Approach
The real effective exchange rate is commonly used as a measure of change in aggregate external competitiveness. Creating an index based on an identical basket of goods and/or services is another way to assess relative costs. The Big Mac Index is such an index. Invented by the Economist magazine as a “lighthearted” approach to estimate whether currencies are at their “correct” level, it is based on the theory of purchasing-power parity (PPP), i.e., that exchange rates should ―in the long run―move towards the rate that would equalize the
Table 3: High-end versus lower-cost destinations
(1) (2) (3) (4) Panel OLS Panel OLS Panel OLS Panel OLS
High-end Lower-cost High-end Lower-cost
Dependent variable ΔLn(Tourist arrivals) ΔLn(Tourism expenditure) ΔLn(Tourism weighted real exchange rate ) 0.0865 -0.153*** 0.0904 -0.106**
(0.0695) (0.0139) (0.280) (0.0416)
ΔTourism weighted unemployment rate -3.888*** -1.590*** -3.818* -3.676***
(0.271) (0.254) (1.324) (0.722)
ΔHurricane -0.00993 -0.0103 -0.0106 -0.0198
(0.00678) (0.0118) (0.00711) (0.0189)
ΔSept.11 terrorist attacks -0.0375* -0.0207*** -0.0335 -0.0337**
(0.0158) (0.00578) (0.0347) (0.0114)
ΔHomicide rate 0.000176 -0.00198 0.00172 -0.00214
(0.00137) (0.00144) (0.00323) (0.00189)
ΔLn(Number of airlines) 0.0247 0.0879*** 0.0721 0.105**
(0.0521) (0.0207) (0.0808) (0.0448)
ΔLn(Number of hotel rooms) -0.234** 0.0938 -0.00511 0.000637
(0.0689) (0.0634) (0.0475) (0.161)
Country fixed effects Yes Yes Yes Yes
Number of country group 4 12 4 12
Observations 44 97 42 97
R-squared 0.543 0.405 0.301 0.229
16
prices of an identical basket of goods and services. In the Big Mac case, the product is a hamburger of a globally similar quality, derived with the same inputs.
Borrowing this concept, we developed a simple cost comparison indicator we call a ‘Week at the Beach’ index based on a simple basket of expenditures typically encountered during a beach holiday (Appendix III). The prices and data are drawn from a common source so as to minimize quality variation. Expenditures are composed of: (1) the average room rate in a three star hotel (as rated by one tour operator), (2) average taxi fare between the airport and hotel; (3) two inexpensive meals and one mid-price meal; (4) and beverages (a two liter bottle of water, one imported beer, and one coffee per day).
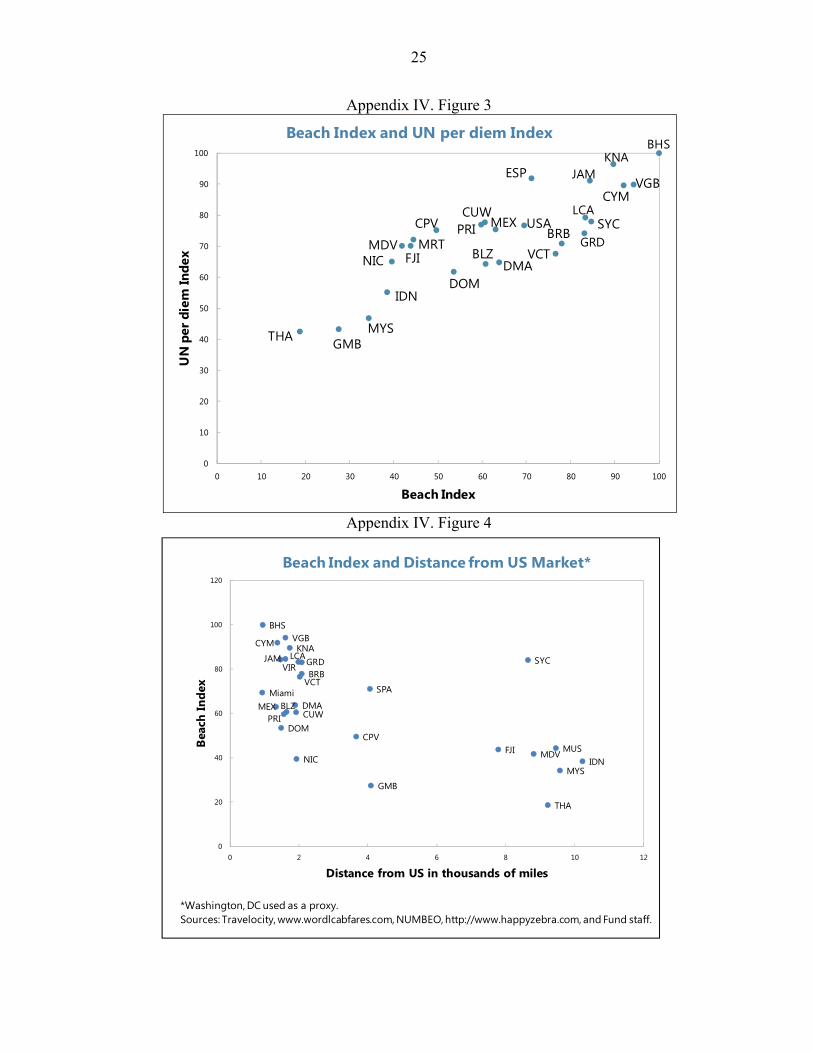
For comparison purposes, we considered two other sources to construct a similar cost index: the “United Nations per diem” which is based on the daily subsistence allowance offered to UN employees that covers lodging, meals, gratuities and other incidentals; and a “Hotel + U.S. Department of State per diem” index. The latter covers the similar items excluding hotel, so we added the average room rate for a three star hotel as per above (Travelocity). All three indices produced similar results. In addition, the correlation between the ‘Week at the Beach’ Index and the UN and State Department per diem indices is 0.72 and 0.92 respectively (Appendix IV, Figures 1-3).
C. Findings
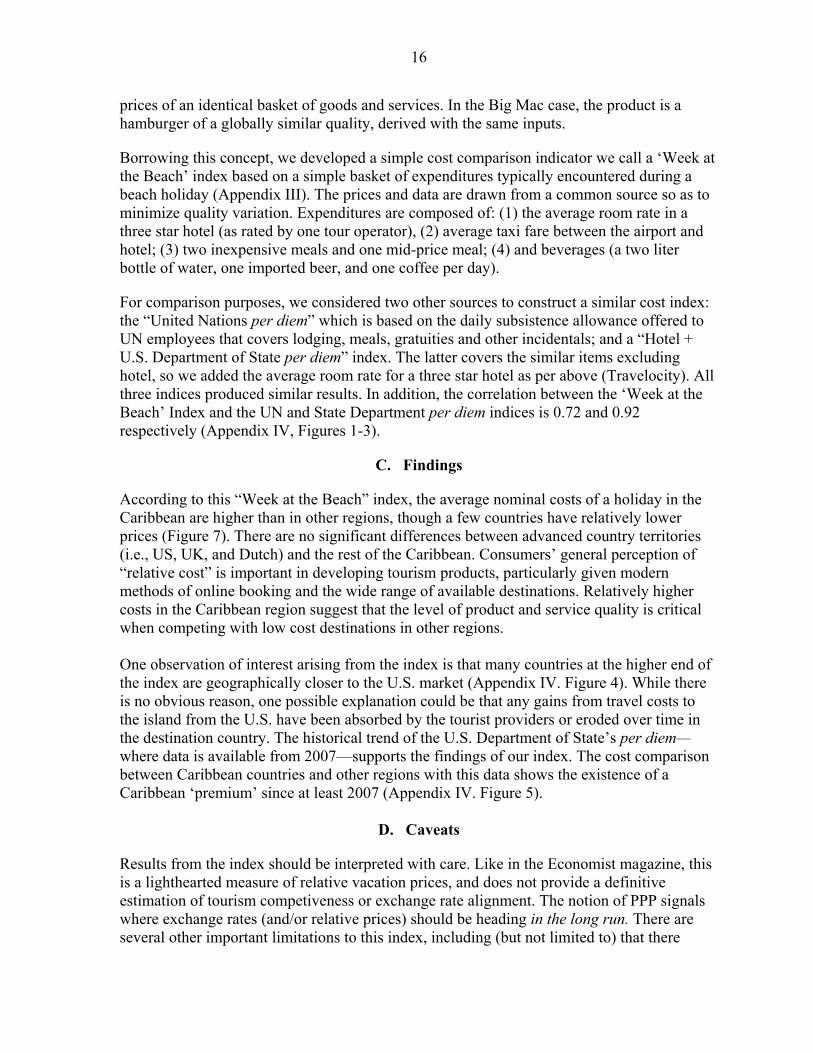
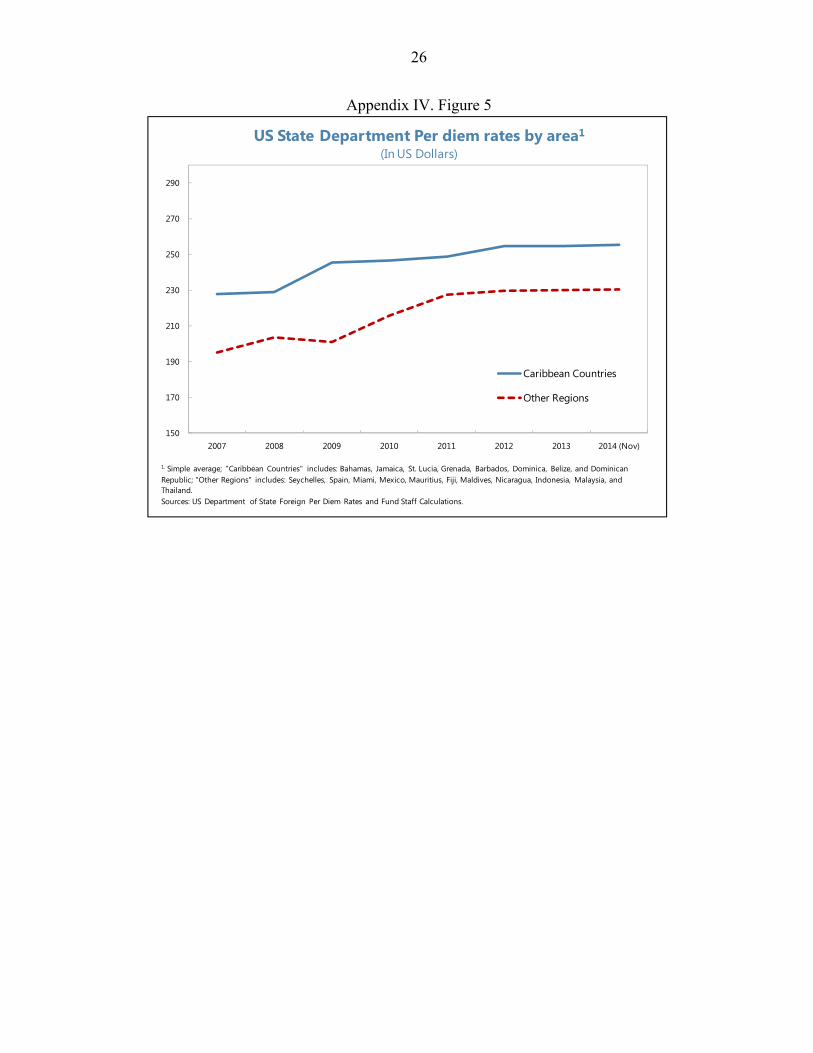
According to this “Week at the Beach” index, the average nominal costs of a holiday in the Caribbean are higher than in other regions, though a few countries have relatively lower prices (Figure 7). There are no significant differences between advanced country territories (i.e., US, UK, and Dutch) and the rest of the Caribbean. Consumers’ general perception of “relative cost” is important in developing tourism products, particularly given modern methods of online booking and the wide range of available destinations. Relatively higher costs in the Caribbean region suggest that the level of product and service quality is critical when competing with low cost destinations in other regions. One observation of interest arising from the index is that many countries at the higher end of the index are geographically closer to the U.S. market (Appendix IV. Figure 4). While there is no obvious reason, one possible explanation could be that any gains from travel costs to the island from the U.S. have been absorbed by the tourist providers or eroded over time in the destination country. The historical trend of the U.S. Department of State’s per diem—where data is available from 2007—supports the findings of our index. The cost comparison between Caribbean countries and other regions with this data shows the existence of a Caribbean ‘premium’ since at least 2007 (Appendix IV. Figure 5).
D. Caveats
Results from the index should be interpreted with care. Like in the Economist magazine, this is a lighthearted measure of relative vacation prices, and does not provide a definitive estimation of tourism competiveness or exchange rate alignment. The notion of PPP signals where exchange rates (and/or relative prices) should be heading in the long run. There are several other important limitations to this index, including (but not limited to) that there

17
could be important quality variations between hotels and meals, even using the same star rating from a common source; it does not account for differences in administered fees like import duties, or differences in the costs of non-tradable goods such as property; and it does not capture non price features (e.g., tourist attraction, language) that might matter to tourists.
VI. CONCLUSIONS AND POLICY CONSIDERATIONS
A. Conclusions
Findings from the preceding analysis point to following conclusions. Most notably:
1. Tourism arrivals and expenditure in the Caribbean are sensitive to the real effective exchange rate. However, this finding is not supported in higher-end tourism destinations.
2. Tourism arrivals and expenditure are sensitive to source countries’ unemployment rate. Per capita income in the source markets is also an important determinant of tourism flows.
3. The behavior of tourism flows and expenditure changed after the onset of the global financial crisis in 2008. Both price and income elasticities of tourism have declined since the start of the Great Recession.
0
20
40
60
80
100Caribbean Countries
Other Caribbean
Other Regions
Group Average
Sources: Travelocity, www.worldcabfares.com, NUMBEO, and Fund staff calculations.
Figure 7. A Week at the Beach Index, v.1(The Bahamas = 100)
18
4. A simple nominal price comparison, excluding taxes and non-price features, suggests that the cost of an average one week beach holiday in the Caribbean is higher than in other beach regions of the world.
B. Policy Considerations
From these findings, the following issues might be taken into consideration when developing macroeconomic and structural policies with the tourism sector in mind.
Price and cost factors. The findings have different implications for each country grouping. At the higher end, countries should ensure that the tourism “plant” (hotels, facilities, restaurants) and service remain of a quality commensurate with the “high-end” brand. This highlights the importance of having supporting infrastructure, social development, and institutions that provide the public services and security expected by high-end tourists. In this regard, governments should reduce administrative impediments to doing business and avoid sustained exchange rate overvaluation that could erode profitability―in order to encourage private sector operators to invest adequately. Governments should also make sure that public investment in infrastructure and institutions supports the delivery of a “high end” tourism environment. In the absence of the price instrument to affect demand for high-end destinations, and depending on available substitutions, countries could experience sharp declines in tourist arrivals if quality does not meet the “high-end” caliber. Declining tourist arrivals to a small island state would have adverse effects on the balance of payments, fiscal revenues and employment. Lower-cost destinations, on the other hand, may wish to focus more on ways to lower domestic costs, for example the costs of energy and water, labor, and transportation, to affect a boost in the tourism demand response. The exchange rate could also be used to help lower relative costs, but consideration would also need to be given to other factors such as the share of tourism in the economy, its contribution to the balance of payments, the openness of the economy, the impact on external debt, to name a few. Post-financial crisis. Since 2008, tourism arrivals and expenditure are less sensitive to price or income indicators, which suggests a structural change in the behavior of tourism demand from traditional markets. In this respect, the Caribbean may not see sustained strong growth in the tourism sector again, or at least not until we see pre-crisis growth rates and full employment again in North America and Europe. In the near term, potential growth may have been affected, suggesting the need for structural reforms to encourage resource re-allocation and increase productivity. Until output capacity is enhanced through other means, in a transition period, governments would need to pursue prudent fiscal policies to adjust domestic absorption to match with potential GDP. Price and tourism quality. In designing a tourism sector strategy, the findings for “high end” destinations suggest that it would be important to review carefully whether product and service quality is consistent with the “high end” classification. For the Caribbean overall, the ‘Week at the Beach’ index suggests that non price factors would, ceteris paribus, need to be

19
superior to ensure that the marginal benefit is at least as high, or higher, than the marginal cost of a holiday in Caribbean. Vulnerability. Since the demand for tourism in the Caribbean is sensitive to shocks in key source countries, governments may wish to place more emphasis on policies that help diversify source markets, and especially to countries with higher growth rates, such as large emerging markets in Latin America.

20
APPENDIX I. DATA
Table I.1. Country list
Anguilla Antigua & Barbuda The Bahamas Barbados
Belize Dominica Dominican Republic Grenada
Guyana Haiti Jamaica St. Kitts & Nevis
St. Lucia St. Vincent & the Grenadines Suriname Trinidad & Tobago
Table I.2. List of variables in determinants analysis (annual data)
Variable Rationale Source
Tourism arrivals Dependent variable Caribbean Tourism Organization
Tourism receipts Dependent variable WEO
Tourism-weighed real exchange rates* Proxy for price factor WEO
UN per diem Proxy for price factor UN
Tourism-weighed Unemployment rate* Proxy for income factor WEO
Tourism-weighed per capita real GDP* Proxy for income factor WEO
US household net wealth Proxy for income factor Fed
Homicide rates Proxy for non-economic factor WHO
Average unit labor cost Proxy for competition effect HAVER
Hurricanes Proxy for external shock Climatology of Caribbean Hurricanes
September 11 terrorist attacks Proxy for external shock Wikipedia
Number of airlines Proxy for supply factor Transtats
Number of hotel rooms Proxy for supply factor Caribbean Tourism Organization
Ratio of 4-5 star hotels to all hotels Proxy for high end Travelocity
Note: *The weights are based on the share tourist arrivals from the United States, United Kingdom, and Canada in 2010.
21
APPENDIX II. REGRESSION RESULTS
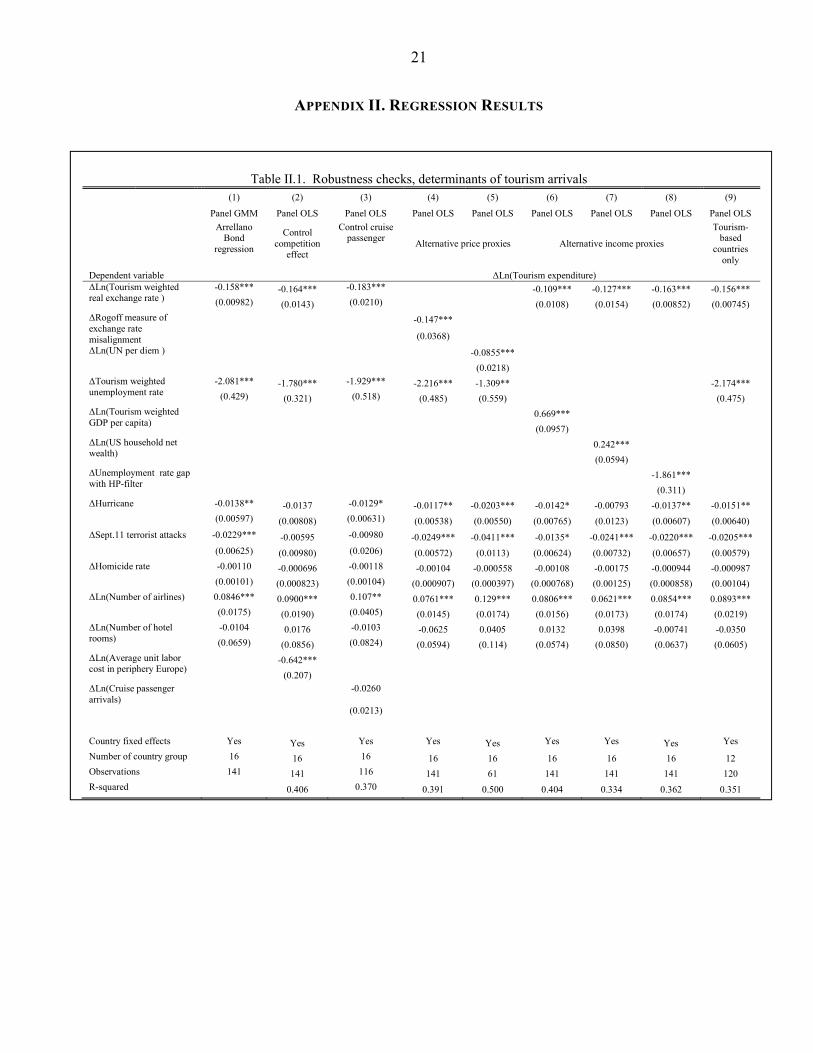
Table II.1. Robustness checks, determinants of tourism arrivals
(1) (2) (3) (4) (5) (6) (7) (8) (9)
Panel GMM Panel OLS Panel OLS Panel OLS Panel OLS Panel OLS Panel OLS Panel OLS Panel OLS
Arrellano Bond
regression
Control competition
effect
Control cruise passenger
Alternative price proxies Alternative income proxies
Tourism-based
countries only
Dependent variable ΔLn(Tourism expenditure) ΔLn(Tourism weighted real exchange rate )
-0.158*** -0.164*** -0.183*** -0.109*** -0.127*** -0.163*** -0.156*** (0.00982) (0.0143) (0.0210) (0.0108) (0.0154) (0.00852) (0.00745)
ΔRogoff measure of exchange rate misalignment
-0.147***
(0.0368)
ΔLn(UN per diem ) -0.0855*** (0.0218) ΔTourism weighted unemployment rate
-2.081*** -1.780*** -1.929*** -2.216*** -1.309** -2.174*** (0.429) (0.321) (0.518) (0.485) (0.559) (0.475)
ΔLn(Tourism weighted GDP per capita)
0.669*** (0.0957)
ΔLn(US household net wealth)
0.242*** (0.0594)
∆Unemployment rate gap with HP-filter
-1.861*** (0.311)
ΔHurricane -0.0138** -0.0137 -0.0129* -0.0117** -0.0203*** -0.0142* -0.00793 -0.0137** -0.0151** (0.00597) (0.00808) (0.00631) (0.00538) (0.00550) (0.00765) (0.0123) (0.00607) (0.00640)
ΔSept.11 terrorist attacks -0.0229*** -0.00595 -0.00980 -0.0249*** -0.0411*** -0.0135* -0.0241*** -0.0220*** -0.0205***
(0.00625) (0.00980) (0.0206) (0.00572) (0.0113) (0.00624) (0.00732) (0.00657) (0.00579) ΔHomicide rate -0.00110 -0.000696 -0.00118 -0.00104 -0.000558 -0.00108 -0.00175 -0.000944 -0.000987
(0.00101) (0.000823) (0.00104) (0.000907) (0.000397) (0.000768) (0.00125) (0.000858) (0.00104) ΔLn(Number of airlines) 0.0846*** 0.0900*** 0.107** 0.0761*** 0.129*** 0.0806*** 0.0621*** 0.0854*** 0.0893***
(0.0175) (0.0190) (0.0405) (0.0145) (0.0174) (0.0156) (0.0173) (0.0174) (0.0219) ΔLn(Number of hotel rooms)
-0.0104 0.0176 -0.0103 -0.0625 0.0405 0.0132 0.0398 -0.00741 -0.0350 (0.0659) (0.0856) (0.0824) (0.0594) (0.114) (0.0574) (0.0850) (0.0637) (0.0605)
ΔLn(Average unit labor cost in periphery Europe)
-0.642***
(0.207)
ΔLn(Cruise passenger arrivals)
-0.0260
(0.0213)
Country fixed effects Yes Yes Yes Yes Yes Yes Yes Yes Yes
Number of country group 16 16 16 16 16 16 16 16 12 Observations 141 141 116 141 61 141 141 141 120 R-squared 0.406 0.370 0.391 0.500 0.404 0.334 0.362 0.351
22
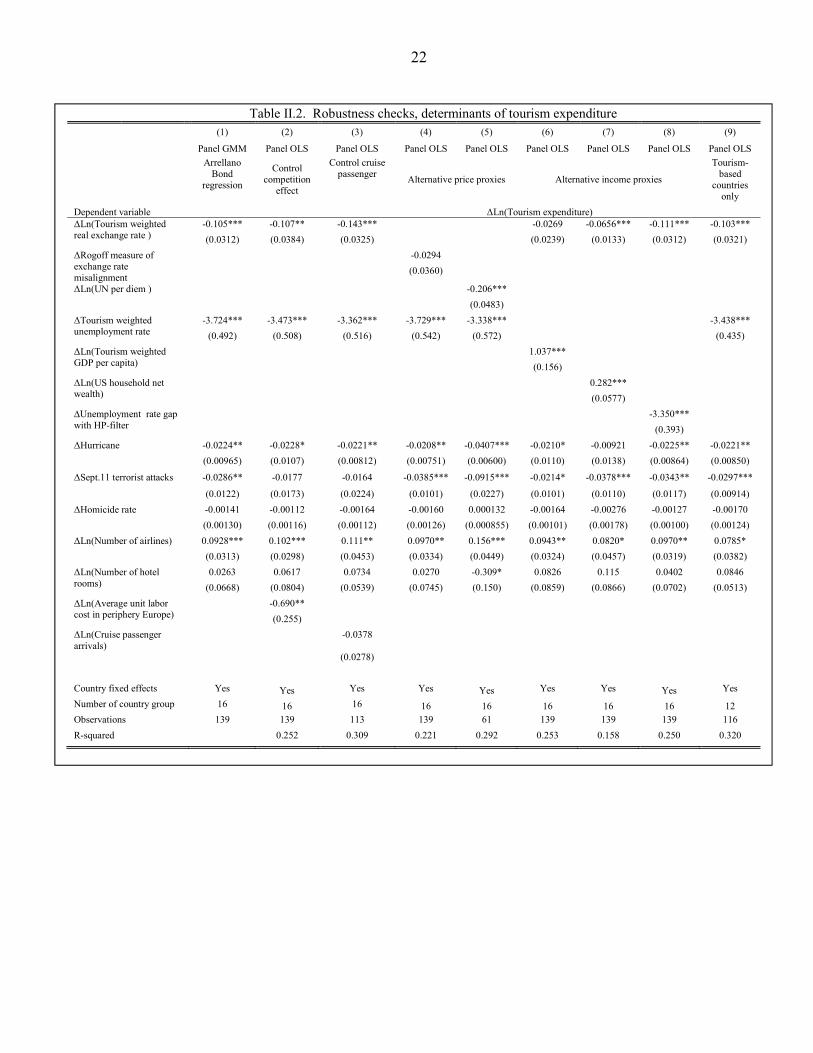
Table II.2. Robustness checks, determinants of tourism expenditure
(1) (2) (3) (4) (5) (6) (7) (8) (9)
Panel GMM Panel OLS Panel OLS Panel OLS Panel OLS Panel OLS Panel OLS Panel OLS Panel OLS
Arrellano Bond
regression
Control competition
effect
Control cruise passenger
Alternative price proxies Alternative income proxies
Tourism-based
countries only
Dependent variable ΔLn(Tourism expenditure) ΔLn(Tourism weighted real exchange rate )
-0.105*** -0.107** -0.143*** -0.0269 -0.0656*** -0.111*** -0.103***
(0.0312) (0.0384) (0.0325) (0.0239) (0.0133) (0.0312) (0.0321)
ΔRogoff measure of exchange rate misalignment
-0.0294
(0.0360)
ΔLn(UN per diem ) -0.206***
(0.0483)
ΔTourism weighted unemployment rate
-3.724*** -3.473*** -3.362*** -3.729*** -3.338*** -3.438***
(0.492) (0.508) (0.516) (0.542) (0.572) (0.435)
ΔLn(Tourism weighted GDP per capita)
1.037***
(0.156)
ΔLn(US household net wealth)
0.282***
(0.0577)
∆Unemployment rate gap with HP-filter
-3.350***
(0.393)
ΔHurricane -0.0224** -0.0228* -0.0221** -0.0208** -0.0407*** -0.0210* -0.00921 -0.0225** -0.0221**
(0.00965) (0.0107) (0.00812) (0.00751) (0.00600) (0.0110) (0.0138) (0.00864) (0.00850)
ΔSept.11 terrorist attacks -0.0286** -0.0177 -0.0164 -0.0385*** -0.0915*** -0.0214* -0.0378*** -0.0343** -0.0297***
(0.0122) (0.0173) (0.0224) (0.0101) (0.0227) (0.0101) (0.0110) (0.0117) (0.00914)
ΔHomicide rate -0.00141 -0.00112 -0.00164 -0.00160 0.000132 -0.00164 -0.00276 -0.00127 -0.00170
(0.00130) (0.00116) (0.00112) (0.00126) (0.000855) (0.00101) (0.00178) (0.00100) (0.00124)
ΔLn(Number of airlines) 0.0928*** 0.102*** 0.111** 0.0970** 0.156*** 0.0943** 0.0820* 0.0970** 0.0785*
(0.0313) (0.0298) (0.0453) (0.0334) (0.0449) (0.0324) (0.0457) (0.0319) (0.0382)
ΔLn(Number of hotel rooms)
0.0263 0.0617 0.0734 0.0270 -0.309* 0.0826 0.115 0.0402 0.0846
(0.0668) (0.0804) (0.0539) (0.0745) (0.150) (0.0859) (0.0866) (0.0702) (0.0513)
ΔLn(Average unit labor cost in periphery Europe)
-0.690**
(0.255)
ΔLn(Cruise passenger arrivals)
-0.0378
(0.0278)
Country fixed effects Yes Yes Yes Yes Yes Yes Yes Yes Yes
Number of country group 16 16 16 16 16 16 16 16 12 Observations 139 139 113 139 61 139 139 139 116
R-squared 0.252 0.309 0.221 0.292 0.253 0.158 0.250 0.320
23
Table II.3. Robustness checks, high-end versus lower-cost destinations( GDP per capita criterion) (1) (2) (3) (4)
Panel OLS Panel OLS Panel OLS Panel OLS
High-end Lower-cost High-end Lower-cost
Dependent variable ΔLn(Tourist arrivals) ΔLn(Tourism expenditure)ΔLn(Tourism weighted real exchange rate ) -0.0817 -0.151*** 0.202 -0.105**
(0.250) (0.00818) (0.306) (0.0417) ΔTourism weighted unemployment rate -3.163** -1.636*** -4.181* -3.426***
(0.823) (0.298) (1.506) (0.689)ΔHurricane -0.00330 -0.00989 -0.00443 -0.0156
(0.00258) (0.0145) (0.00281) (0.0211) ΔSept.11 terrorist attacks -0.0300* -0.0174*** -0.0461 -0.0288***
(0.00948) (0.00490) (0.0286) (0.00712)ΔHomicide rate 0.00135* -0.00191 0.00218 -0.00247
(0.000539) (0.00156) (0.00210) (0.00183)ΔLn(Number of airlines) 0.0468 0.0889*** 0.109* 0.0950*
(0.0226) (0.0222) (0.0414) (0.0465)ΔLn(Number of hotel rooms) -0.135 -0.0371 -0.205 0.104
(0.231) (0.0608) (0.103) (0.0726)
Country fixed effects Yes Yes Yes Yes
Number of country group 4 12 4 12
Observations 42 99 41 98R-squared 0.558 0.366 0.302 0.229
24
APPENDIX III. COMPOSITION OF THE ‘WEEK AT THE BEACH’ INDEX
APPENDIX IV. ‘WEEK AT THE BEACH’ INDEX AND OTHER VARIABLES Appendix IV. Figures 1-2
Variable Source
3 Star hotel room rate Travelocity
Taxi Worldcabfares
Meal Numbeo
Water Numbeo
Beer Numbeo Coffee Numbeo
UN per diem UN
US Department of State per diem IMF Note: Total cost=7*(3 star hotel) + 2*(taxi fare from/to airport) + 7*(2 inexpensive meal + 1
mid-range meals) + 7*2 liters water + 7*0.3 liter beer + 7*coffee.
0
20
40
60
80
100
UN Per diem Index (The Bahamas = 100)Caribbean Countries
Other Caribbean
Other Regions
Group Average
Sources: UNDP/UN Daily Subsistence Allowance (DSA) Rates and Fund staff calculations.
0
20
40
60
80
100
Caribbean Countries
Other Caribbean
Other Regions
Group Average
Sources: Travelocity, US Department of State Foreign Per Diem Rates, and Fund staff calculations.
Hotel Rate and US Department of State Index (The Bahamas = 100)
25
Appendix IV. Figure 3
Appendix IV. Figure 4
0
10
20
30
40
50
60
70
80
90
100
0 10 20 30 40 50 60 70 80 90 100
UN
per
die
m In
dex
Beach Index
Beach Index and UN per diem IndexBHS
BLZ
LCA
BRB
JAM
GRDVCT
KNA
DMA
THA
NIC
CPV
GMB
IDN
ESP
DOM
MYS
MEX
MDV MRTFJI
CUWPRI USA SYC
VGBCYM
BHSVGBCYM KNA
VIRJAM SYCLCA
GRDBRB
VCTSPAMiami
DMAMEX BLZCUWPRI
DOMCPV
MUSFJI MDVNIC IDNMYS
GMB
THA
0
20
40
60
80
100
120
0 2 4 6 8 10 12
Bea
ch In
dex
Distance from US in thousands of miles
Beach Index and Distance from US Market*
*Washington, DC used as a proxy.Sources: Travelocity, www.wordlcabfares.com, NUMBEO, http://www.happyzebra.com, and Fund staff.
26
Appendix IV. Figure 5
150
170
190
210
230
250
270
290
2007 2008 2009 2010 2011 2012 2013 2014 (Nov)
US State Department Per diem rates by area1
(In US Dollars)
Caribbean Countries
Other Regions
1. Simple average; "Caribbean Countries" includes: Bahamas, Jamaica, St. Lucia, Grenada, Barbados, Dominica, Belize, and Dominican Republic; "Other Regions" includes: Seychelles, Spain, Miami, Mexico, Mauritius, Fiji, Maldives, Nicaragua, Indonesia, Malaysia, and Thailand.Sources: US Department of State Foreign Per Diem Rates and Fund Staff Calculations.

27
References Acevedo, Sebastian, 2014, “Debt, Growth and Natural Disasters: A Caribbean Trilogy,” IMF Working Paper No. 14/125. Archibald, Xiomara, Jason LaCorbinière, and Winston Moore, 2008, “Analysis of Tourism Competitiveness in the Caribbean: A gravity Model Approach,” Central Bank of Barbados. Bolaky, Bineswaree, 2011, “Tourism competitiveness in the Caribbean,” Cepal Review 104, pp. 55-76 Crouch, Geoffrey, 1994, “Price Elasticities in International Tourism,” Journal of Hospitality & Tourism Research, vol. 17, no. 3, pp. 27-39. Culiuc, Alexander, 2014, “Determinants of International Tourism,” IMF Working Paper No. 14/82. Greenidge, Kevin and Mahalia Jackman, 2010, “Modeling and Forecasting Tourist Flows to Barbados using Structural Time Series Models,” Tourism and Hospitality Research, Vol. 10, No. 1, pp. 1-13. Mwase, Nkunde, 2013, “Tourism flows to Caribbean islands: an empirical note,” Applied Economics Letters, Volume 20, Issue 10, pp. 957-965. Tsounta, Evridiki, 2008, “What Attracts Tourists to Paradise?” IMF Working Paper No. 08/162. Wolfe, Andy and Rafael Romeu, 2011, “Recession and Policy Transmission to Latin American Tourism: Does Expanded Travel to Cuba Offset Crisis Spillovers?” IMF Working Paper No. 11/32.
Related Documents