This article is protected by copyright. All rights reserved REVISITING THE ROLE OF THE ENVIRONMENT IN THE CAPABILITIES– FINANCIAL PERFORMANCE RELATIONSHIP: A META-ANALYSIS AMIT KARNA *, 1 Indian Institute of Mangement Ahmedabad Business Policy Area IIMA Campus, Vastrapur Ahmedabad - 380015 INDIA Tel.: +91 79 6632 3456 e-mail: [email protected] ANSGAR RICHTER 1 University of Liverpool Management School Organisation & Management Group Chatham Street Liverpool L69 7ZH UNITED KINGDOM Tel.: +44 151 7953713 e-mail: [email protected] EBERHARD RIESENKAMPFF 1 EBS Business School Management & Economics Department Rheingaustrasse 1 65375 Oestrich-Winkel GERMANY Tel.: +49 611 7102 1363 e-mail: [email protected] Keywords: dynamic capabilities; ordinary capabilities; environmental dynamism; firm performance; meta-analysis This article has been accepted for publication and undergone full peer review but has not been through the copyediting, typesetting, pagination and proofreading process, which may lead to differences between this version and the Version of Record. Please cite this article as doi: 10.1002/smj.2379 * Corresponding author 1 The authors contributed equally to this study.

Welcome message from author
This document is posted to help you gain knowledge. Please leave a comment to let me know what you think about it! Share it to your friends and learn new things together.
Transcript
This article is protected by copyright. All rights reserved
REVISITING THE ROLE OF THE ENVIRONMENT IN THE CAPABILITIES–FINANCIAL PERFORMANCE RELATIONSHIP: A META-ANALYSIS
AMIT KARNA*, 1 Indian Institute of Mangement Ahmedabad
Business Policy Area IIMA Campus, Vastrapur
Ahmedabad - 380015 INDIA
Tel.: +91 79 6632 3456 e-mail: [email protected]
ANSGAR RICHTER1 University of Liverpool Management School
Organisation & Management Group Chatham Street
Liverpool L69 7ZH UNITED KINGDOM Tel.: +44 151 7953713
e-mail: [email protected]
EBERHARD RIESENKAMPFF1 EBS Business School
Management & Economics Department Rheingaustrasse 1
65375 Oestrich-Winkel GERMANY
Tel.: +49 611 7102 1363 e-mail: [email protected]
Keywords: dynamic capabilities; ordinary capabilities; environmental dynamism; firm performance; meta-analysis
This article has been accepted for publication and undergone full peer review but has not been through the copyediting, typesetting, pagination and proofreading process, which may lead to differences between this version and the Version of Record. Please cite this article as doi: 10.1002/smj.2379
* Corresponding author 1 The authors contributed equally to this study.
This article is protected by copyright. All rights reserved
The capabilities-based view of the firm suggests that in order to gain competitive advantage,
firms need both ‘ordinary capabilities’ that allow them to operate their chosen lines of
business efficiently, and ‘dynamic capabilities’ that help them to upgrade existing or create
new ordinary capabilities (Winter, 2003). In their seminal work, Teece, Pisano, and Shuen
(1997) argue that dynamic capabilities are particularly important for performance in
situations of environmental change, when a firm’s needs to rejuvenate its set of ordinary
capabilities are greatest.
At the same time, scholars have raised concerns about the special status afforded to
dynamic capabilities (Barreto, 2010). Some authors have found the notion of dynamic
capabilities to be elusive (Kraatz and Zajac, 2001), intractable (Danneels, 2008),
contradictory (Schreyögg and Kliesch-Eberl, 2007) or tautological (Williamson, 1999). Even
proponents of the capabilities-based view acknowledge that the distinction between ordinary
and dynamic capabilities is blurry (Helfat and Winter, 2011). Eisenhardt and Martin (2000)
have suggested that dynamic capabilities may not constitute a source of competitive
advantage in high-velocity environments i.e., in exactly those conditions in which Teece et
al. (1997) see the need for dynamic capabilities as greatest (Peteraf, Di Stefano, and Verona,
2013).
The idea that capabilities in general enhance firm performance has found widespread,
albeit not universal, support (Newbert, 2007; see also Arend and Bromiley, 2009). However,
little empirical research has addressed the question of how different environmental conditions
affect the relationship between (ordinary and dynamic) capabilities and firm performance;
and the evidence that is available to date is inconclusive (Barreto, 2010; Wu, 2010). In his
recent work, Schilke (2014a) suggested that environmental dynamism may moderate the
performance effects of dynamic capabilities. However, whether this moderating effect holds
This article is protected by copyright. All rights reserved
across different types of dynamic capabilities, and whether it is specific to dynamic
capabilities—or it also affects the ordinary capabilities–performance relationship—is unclear.
Finally, the nature of the relationship between ordinary and dynamic capabilities as well as
their relative importance for firm performance in different environmental conditions has not
been examined conclusively (Drnevich and Kriauciunas, 2011; Helfat and Winter, 2011). Do
ordinary capabilities suffice for firm performance in stable environments, whereas dynamic
capabilities are required in situations of change? Do the two types of capabilities substitute
for or complement one another?
We investigate the role of ordinary and dynamic capabilities as drivers of the financial
performance of firms under different environmental conditions by meta-analyzing 115
empirical studies comprising 121 samples. First, we assess the strengths of the effects of
ordinary and dynamic capabilities on the one hand, and firm performance on the other.
Second, we explore the role of environmental dynamism as a moderating factor in the
capabilities–firm performance relationship. Third, we test a model of the capabilities–
performance relationship that accounts for the relationship between ordinary and dynamic
capabilities. Our work seeks to advance our understanding of the distinction between
ordinary and dynamic capabilities, and the role of environmental dynamism as a moderator of
the capabilities–performance relationship.
THEORY AND HYPOTHESES
According to Amit and Schoemaker (1993: 35), the notion of capabilities refers to a ‘firm’s
capacity to deploy resources, usually in combination, using organizational processes, to effect
a desired end’. Proponents of the capabilities-based view consider the heterogeneity in
capabilities to be a major reason for performance differences between firms (Felin et al.,
2012; Peteraf, 1993). Empirical research has provided a considerable body of evidence
This article is protected by copyright. All rights reserved
confirming the positive effects of capabilities on firm performance (e.g., Combs and Ketchen,
1999; Henderson and Cool, 2003; Maijoor and Witteloostuijn, 1996; Makadok, 1999; Miller
and Shamsie, 1996; Yeoh and Roth, 1999).
The capabilities-based view of the firm has also established a distinction between two
categories of capabilities, broadly construed. First, ordinary capabilities [OC], are those that
enable a firm to ‘make a living’ (Winter, 2003) on a continuous basis, for example by helping
it to optimize its processes and thereby reduce costs (Kaleka, 2002). These capabilities
‘reflect an ability to perform the basic functional activities of the firm, such as plant layout,
distribution logistics, and marketing campaigns, more efficiently than competitors’ (Collis,
1994: 145). Note that in this perspective, ordinary capabilities are seen as conferring
competitive advantage in a given domain (i.e., a firm’s existing line of business).
Second, the capabilities-based view suggests that firms need dynamic capabilities in order
to renew their stock of ordinary capabilities over time (Collis, 1994; Teece and Pisano, 1994).
Dynamic capabilities [DC] are defined as ‘the firm's ability to integrate, build, and
reconfigure internal and external competences to address rapidly changing environments’
(Teece et al., 1997: 516). Examples for dynamic capabilities include those that facilitate
organizational change (Hult and Ketchen, 2001; Yiu and Lau, 2008), innovation-related
capabilities (Cho and Pucik, 2005; Worren, Moore, and Cardona, 2002), strategic decision-
making (Douglas and Ryman, 2003; Mithas, Ramasubbu, and Sambamurthy, 2011), alliance
management capabilities (Schilke, 2014a, 2014b) and the ability to develop and reconfigure
an organization’s human resources (strategic human capital management; Huselid, Jackson,
and Schuler, 1997; Zahra and Nielsen, 2002).
Despite its popularity, the distinction between ordinary and dynamic capabilities is an
ambiguous one (Helfat and Winter, 2011) to the point where it is doubtful whether it is
This article is protected by copyright. All rights reserved
meaningful at all. If dynamic capabilities were conceptually distinct from ordinary ones, their
effects should show in particular in situations of environmental change.
The moderating effect of the industry environment on the capabilities–performance relationship
Environmental dynamism involves a combination of instability and turbulence (Aldrich,
1979; Dess and Beard, 1984). It is defined as ‘the amount and unpredictability of change in
customer tastes, production or service technologies, and the modes of competition in the
firm’s principal industries’ (Miller and Friesen, 1983: 233). Firms competing in the same
industry face similar input and output market as well as technological conditions, defining the
task environment in which organizations operate (Nohria and Gulati, 1994).
While proponents of the capabilities-based view of the firm agree that ordinary
capabilities are good for firm performance in situations of environmental stability (e.g.,
Morgan, Vorhies, and Mason, 2009; Vorhies, Morgan, and Autry, 2009), they are divided as
to whether environmental dynamism affect the relationship between ordinary capabilities and
firm performance. One perspective suggests that environmental change tends to lower the
marginal returns to investments in ordinary capabilities, at least relative to those obtained
from investing in dynamic capabilities (Winter, 2003). Scholars (e.g., Collis, 1994; Winter,
2003) have described ordinary capabilities as routines or ‘zero-order’ capabilities, as they
enable a firm to continue producing and selling the same product or service in a repetitive
pattern. In stable environments, firm performance derives from following behaviors that draw
on tacit knowledge, thus making them hard to imitate and enhancing the firm’s
competitiveness (Peteraf, 1993; Winter, 2003).
In contrast to this perspective, we argue that environmental change reinforces the
relationship between ordinary capabilities and firm performance, at least in the short term.
This article is protected by copyright. All rights reserved
Changing industry environments are often characterized by shifts in supply (e.g., due to
disruptive technologies) and demand (e.g., due to shifts in consumer preferences). Such
changes enable the industry leaders to obtain greater rents from their existing capabilities in
form of higher producer surplus (Amit and Schoemaker, 1993; Williamson, 1991). Industry
laggards, however, see their market share shrinking, and thus rely to a greater extent on their
ordinary capabilities in order to extract cost reductions and efficiency gains (Brush and Artz,
1999). Furthermore, as margins in industries affected by rapid changes in technology,
consumer preferences and other factors shrink, firms are in greater need of generating cash,
so as to cut themselves some slack which has positive performance effects, at least up to a
point (Pierce and Aguinis, 2013; Tan and Peng, 2003). Ordinary capabilities may also help
companies to take full advantage of new opportunities, e.g., by enabling them to ramp up
production quickly to meet increased demand. Overall, we believe that environmental
dynamism will raise the effect of ordinary capabilities on firm performance.
Hypothesis 1: Ordinary capabilities will affect firm performance more strongly in changing industry environments than in relatively stable industry environments.
With respect to dynamic capabilities, two views in the literature provide different
perspectives on whether DCs are conducive to firm performance even in situations of relative
environmental stability (Di Stefano, Peteraf, and Verona, forthcoming; Peteraf et al., 2013).
The first, more sanguine strand of the capabilities-based view regards dynamic capabilities as
uniquely important in situations of environmental turbulence (Teece, 2007; Teece, 2014;
Teece et al., 1997). This perspective conceives dynamic capabilities as a ‘firm’s ability to
integrate, build, and reconfigure internal and external competences to address rapidly
changing environments’ (Teece et al., 1997: 516); they are ‘especially relevant in a
Schumpeterian world’ (Teece et al., 1997: 509) where innovation is equated with creative
destruction of existing competences. The examples for dynamic capabilities given in this
This article is protected by copyright. All rights reserved
stream of literature include market responsiveness, rapid and flexible product innovation,
technological capabilities, and R&D intensity (Chang and Rhee, 2011; Sher and Yang, 2005).
Proponents of this perspective expect the benefits of dynamic capabilities to materialize in
the form of mastery of change, success at breakthrough innovation, long-term firm growth
and survival (Hung et al., 2010). In contrast, they do not see the primary role of dynamic
capabilities in enhancing the operating capabilities that may have been important drivers of
success in the past, but whose importance they expect to be waning as a result of
environmental turbulence (Ambrosini and Bowman, 2009). In sum, the more sanguine strand
of the capabilities-based view suggests that dynamic capabilities should have relatively
independent and direct effects on performance primarily in situations of environmental
turbulence. However, it does not offer a clear view on whether dynamic capabilities should
enhance firm performance even in situations of relative stability.
The second, more moderate stream sees dynamic capabilities as ‘first order’ capabilities
that operate to extend, modify or upgrade the resource base of the firm (Helfat et al., 2007;
Winter, 2003). According to this perspective, dynamic capabilities have structural similarities
to ordinary ones in that they are routinized (i.e., patterned, practiced) activities that help to
alter a firm’s resource base (Eisenhardt and Martin, 2000; Zollo and Winter, 2002). They
enable changes in processes, products, and services (Drnevich and Kriauciunas, 2011), as
well as in ad hoc problem solving (Winter, 2003). As dynamic capabilities are closely related
to ordinary capabilities, they, too, should have a positive, albeit more indirect, effect on
performance. Firms that are good at upgrading and recreating their ordinary capabilities on a
regular basis will have a competitive edge over those that are slower in this respect. They also
make better use of situations of relative stability in their industry environments to prepare
themselves for more drastic changes later on, or even for creating disruptive change in their
respective industries in the first place (Easterby-Smith, Lyles, and Peteraf, 2009; Eisenhardt
This article is protected by copyright. All rights reserved
and Martin, 2000). To summarize, according to this view, dynamic capabilities positively
affect firm performance even in relatively stable or moderately dynamic environments
(Eisenhardt and Martin, 2000; Zahra, Sapienza, and Davidsson, 2006).
Overall, we concur with proponents of the more moderate view that dynamic capabilities
are beneficial for firm performance even in situations of relative environmental stability. This
notion is rooted in the need for innovation and change innovating in a world where a degree
of dynamism is conceived as integral to ‘normal,’ stable conditions (see Helfat and Winter,
2011).
Hypothesis 2: Even in relatively stable industry environments, dynamic capabilities will positively affect firm performance.
At the same time, we expect environmental dynamism to reinforce this relationship even
further, for two reasons. First, as a firm’s environment becomes more dynamic, firms will
need to rejuvenate their (ordinary) capabilities more speedily than in stable conditions (Wang
and Ang, 2004). Therefore, in line with evolutionary economics (Nelson and Winter, 1982)
and the resource-based view (Helfat et al., 2007), we argue that changing industry
environments require firms to adapt their existing organizational routines and update their
resource base, and dynamic capabilities allow them to do so. Second, changing environments
are characterized by a better pay-off on investments in dynamic capabilities (Maritan, 2001;
Winter, 2003). Dynamic capabilities are associated with learning, innovation and change, and
their value is greater in turbulent than in more stable environments (Helfat and Raubitschek,
2000). For example, dynamic capabilities enable firms to learn or even create the ‘rules of the
game’ in newly emerging industries quickly, and thus to gain market power (Teece, 2007).
Both of the arguments developed above are related to the potential of dynamic capabilities to
create time economies i.e., to outpace competitors in the development and introduction of
This article is protected by copyright. All rights reserved
new products, the entering of new markets, or the adoption of new business models (Augier
and Teece, 2009; Danneels, 2002). We thus propose that:
Hypothesis 3: In changing industry environments, dynamic capabilities will affect firm performance more strongly than in stable industry environments.
The relationship between ordinary and dynamic capabilities
In addition to offering diverging perspectives on the moderating role of environmental
dynamism, the two strands of the capabilities–based view of the firm sketched above
conceive the relationship between dynamic and ordinary capabilities differently. The earlier,
stronger view emphasizes the distinctiveness and independence of dynamic capabilities
(Teece et al., 1997). Proponents of this view have explicitly argued for a hierarchy between
the capability types. Collis (1994) proposes that the primary role of dynamic capabilities is to
act upon ordinary capabilities. Winter (2003) suggests that dynamic capabilities may not only
extend or modify, but even create ordinary capabilities. Teece (2014) argues that whereas a
firm may not even need to own ordinary capabilities as long as it can access them, dynamic
capabilities are constitutive for its long-run competitive advantage.
In contrast, the more moderate perspective conceives ordinary and dynamic capabilities
as both conceptually related and mutually reinforcing, such that together they explain firm
performance better than does either one of them independently. The more moderate
perspective thus rejects the view that dynamic capabilities are superior to ordinary ones
(Ambrosini, Bowman, and Collier, 2009). Eisenhardt and Martin (2000) characterize
dynamic capabilities as relatively ‘homogenous’ (p. 1116), as ‘simple rules’ (p. 1118) and
‘best practices’ (p. 1110) that many firms may possess at the same time (‘significant
commonalties across firms’; p. 1105), and that may serve ‘equifinal’ (p. 1110) purposes.
These attributes render dynamic capabilities conceptually close to ordinary ones (to the point
where Teece [2014, p. 338] conceives them to be the same as ordinary capabilities in his
This article is protected by copyright. All rights reserved
approach). Furthermore, Eisenhardt and Martin (2000) cast doubt on the stability of dynamic
capabilities, making them a relatively weak concept.
In sum, the more moderate view cautions that although dynamic capabilities may help
improve ordinary capabilities, the latter may also enhance the former, and that they jointly
explain performance better than does each of them on their own. It thus portrays the
relationship between ordinary and dynamic capabilities as a complementary rather than as a
causal one. Complementarity is defined as a situation where the marginal returns to one
phenomenon increase in the level of the other one (Milgrom and Roberts, 1994; Rothaermel
and Hess, 2007), emphasizing the mutuality of the relationship. Adegbesan (2009) argues that
complementarities among different types of resources (including capabilities), rather than
single, ‘special’ resources on their own, as constitutive for the emergence of competitive
advantage (see also Clougherty and Moliterno, 2010). In their review, Ennen and Richter
(2010) find that 28.7 percent of the 108 empirical studies on complementarity contained in
their sample focused on complementarities between different types of capabilities, and
virtually all of these studies found different types of capabilities to be mutually enhancing.
For these reasons, we propose that ordinary and dynamic capabilities exist in a mutual, bi-
directional relationship, in which they enhance one another, and that any model that takes
into account their mutual association will provide a better explanatory model for their
performance effects than models that omit this association. We therefore hypothesize that:
Hypothesis 4a: Dynamic capabilities and ordinary capabilities will be positively associated.
Hypothesis 4b: Models that take into account the positive association between dynamic and ordinary capabilities will explain firm performance better than models that do not take this association into account.
DATA AND METHODS
This article is protected by copyright. All rights reserved
We used meta-analysis in order to aggregate findings from primary empirical research and to
assess the magnitude of the effects of (different types of) capabilities on firm performance
(Glass, 1976; Humphrey, 2011; Hunter and Schmidt, 1990). Meta-analysis exploits the
variation in the settings of different studies in order to quantify the moderating influence of
environmental states as boundary conditions on relationships studied in primary research
(Aguinis et al., 2011b; Geyskens et al., 2009).
Selection of primary literature
In order to establish an exhaustive database, we followed a three-step process. First, we
searched the top 100 journals by impact factor in the Social Science Citation Index 2009,
2010, and 2011 rankings (categories ‘Business,’ ‘Economics,’ and ‘Management’), resulting
in a total of 139 journals. We used the combination of the search terms ‘capabilit*’ and
‘perform*’ or ‘resource*’ or ‘RBV’ or ‘RBT’ in the abstract and searched the years 1991
through 2012. Second, we searched reference sections of relevant reviews and of the papers
that had surfaced in the first step. Third, in order to mitigate the possibility of publication bias
and of the ‘file-drawer problem’ (Pfeffer, 2007; Rosenthal, 1995), we contacted authors of
unpublished studies directly using scholarly networks, and searched the EBSCO database as
well as a major PhD dissertation database (oatd.org) for unpublished studies. We tested our
sample for publication bias (Rothstein, Sutton, and Borenstein, 2006) by analyzing the effect
sizes of both, ordinary and dynamic capabilities in separate tests.
To establish our sample, we focused on empirical papers that used capabilities and firm
performance as variables. If papers did not report correlations or other information to
compute effect sizes, we contacted the authors directly to ask for additional data. This process
resulted in a data set of 115 studies comprising 121 independent samples (see Appendices 1
and 2).
This article is protected by copyright. All rights reserved
Variable classification
We coded the studies, respectively the variables used therein, based on three attributes: types
of capabilities, performance measures, and dynamism of the environment. Two of the authors
coded the types of capabilities of all studies independently of one another. The Perreault and
Leigh (1989) index of reliability between the coders was 91 percent, which is considered
sufficiently high (LeBreton and Senter, 2008; Nunnally and Bernstein, 1994).
Types of capabilities
In order to classify capabilities as ordinary or dynamic, we followed a two-step approach.
First, we identified five categories of ordinary capabilities and six categories of dynamic
capabilities from prominent conceptual work. For ordinary capabilities we relied on Winter
(2003) and Helfat and Winter (2011), who emphasize the capacity to ‘make a living’, and to
operate within the existing business model. We matched this approach with Drnevich’s and
Kriauciunas’ (2011) discussion of ordinary capabilities; they put greater emphasis on a firm’s
ability to enhance its operations or its products and services, yet without altering them
fundamentally. Our five categories of ordinary capabilities are: (1) operations/processes, (2)
product/service/quality, (3) resources/assets, (4) organization/structure, and (5)
customer/supplier relationships. For dynamic capabilities we relied on Teece et al. (1997),
Teece (2007), Eisenhardt and Martin (2000), Winter (2003), Helfat et al. (2007), and Helfat
and Winter (2011). We grouped the examples of dynamic capabilities to create six categories:
(1) R&D/innovation/technology, (2) strategic decision making/market research, (3)
cooperation/alliance/external relations, (4) knowledge management, (5) intangible
assets/reputation, and (6) strategic human capital management.
Second, we grouped the variables used in the 115 studies according to the categories of
dynamic and ordinary capabilities. In the few cases in which a variable could not be clearly
This article is protected by copyright. All rights reserved
coded as a dynamic or ordinary capability, we did not include the variable in our data set.
Details on the coding of the capability variables are presented in Appendices 3 and 4.
Financial Performance
We purposefully focused on ‘bottom-line’ measures of firms’ financial performance,
specifically accounting-related and capital market-related ones. We also included perceptual
measures of ‘bottom-line’ performance (e.g., survey data where respondents were asked to
rate the relative profitability of their firm). For the categorization of different performance
measures we relied on Richard et al. (2009). For details see Appendix 5.
Dynamism of the industry environment
We coded the dynamism of the industry environment using categorical measures, focusing
exclusively on the authors’ descriptions of the industry in which the primary study was
conducted. Our coding rules involved the search for specific words/word groups in the
descriptions of the industry setting(s) in these primary studies. We based our coding of word
groups on Dess and Beard (1984) and Aldrich (1979) for relatively stable as well as for
changing industries. Typical descriptions of ‘relatively stable’ industry environments include
‘relatively stable’ (Combs and Ketchen, 1999: 782), ‘low technologically turbulent
environment’ (Song et al., 2005: 269), and ‘because of its maturity, industry recipes/norms
[…] are established’ (Sirmon and Hitt, 2009: 1382). Typical descriptions of ‘changing’
industry environments include ‘changing conditions’ (Helfat, 1997: 339), ‘increasingly
competitive’ (Griffith, Noble, and Chen, 2006: 51), and ‘changing, ambiguous, and unstable’
(Voss and Voss, 2008: 8). We also found 16 studies investigating a diverse set of industries in
emerging or developing economies (e.g., Choi, Lee, and Williams, 2011; Drnevich and
Kriauciunas, 2011; Gubbi et al., 2010) which indicated that these studies were carried out in
environments characterized by a low degree of maturity or a fast pace of development.
This article is protected by copyright. All rights reserved
Hence, we classified these as studies in changing environments. Robustness checks where we
omitted these 16 studies (see Table 4, Models 5 and 6, as compared to our main Models 3 and
4) yielded results that did not differ materially from those of our full analysis. The studies
that described the industry setting to be a mixture—of all industries or of relatively stable and
changing industries—were classified as ‘diverse’. Overall, our coding resulted in 12 samples
being classified as ‘relatively stable,’ 67 samples as having a ‘changing’ industry
environment, and 42 as having a ‘diverse’ industry environment.
Data analysis
HOMA procedure
In order to test Hypotheses 1 and 2, we used Hedges-Olkin-type meta-analysis (HOMA) to
calculate mean effect sizes for different relationships (Geyskens et al., 2009; Hedges and
Olkin, 1985; Lipsey and Wilson, 2001). We ran HOMA twice, first using Pearson product–
moment correlation coefficients, and second using partial correlation coefficients (for details
on this approach, and for further information on the HOMA, see Appendix 6).
MARA procedure
In order to assess the relationship between effect size and moderator variables, we used meta-
analytic regression analysis (MARA), a particular type of weighted least squares (WLS)
regression analysis (Lipsey and Wilson, 2001). As in HOMA, we weighted the effect sizes by
wi*. A special macro by Lipsey and Wilson (2001) allows data analysis software to interpret
these weights as weightings of single effect sizes. We used mixed effects models to estimate
the MARA (Drees and Heugens, 2013; van Essen, van Oosterhout, and Heugens, 2013).
We began by running the MARA as constant-only models, using the effect sizes of
ordinary and dynamic capabilities as the dependent variables, respectively. We then entered a
battery of controls for methodological study characteristics (Stanley and Jarrell, 2005). We
This article is protected by copyright. All rights reserved
also ran a separate MARA with partial correlation coefficients in which we included a
dummy variable denoting those primary studies that applied methods controlling for
endogeneity (e.g., instrumental variables, two stage least squares regressions). We used this
approach in order to obtain indicative evidence as to whether primary studies that fail to
account for endogeneity concerns are liable to providing inflated estimates of the
capabilities–performance relationship (van Essen, Otten, and Carberry, 2012).
Finally, we added a dummy variable to our MARA which takes the value of one for
changing environments and of zero for relatively stable (and diverse) environments to
account for the contextual effects of the environment as well as control variables.
MASEM procedure
In order to test Hypothesis 4 we used random effects meta-analytic structural equations
modeling (MASEM; Aguinis et al., 2011a; Aguinis et al., 2011b; Cheung and Chan, 2005;
Viswesvaran and Ones, 1995). In the first step of the two-stage procedure we established
mean correlations between variables of interest through separate HOMA analyses. Second,
we applied structural equations modeling on the matrix of mean correlations, using
maximum-likelihood modeling routines (Cheung and Chan, 2005). As pointed out by Carney
et al. (2011), MASEM provides an advantage in that not all relationships must have been
included in each primary study (Landis, 2013); each cell in the matrix structure of data can be
represented by a different subset of studies such that there is at least one study for each
relationship, and one for all relationships (Cheung, 2008; Viswesvaran and Ones, 1995). We
used a special macro published by Cheung (2014) to perform the MASEM which allowed us
to correctly apply the sample sizes of the correlation matrices. Specifically, we used the total
sample size as advised by Landis (2013) for two-stage procedures. However, as the use of
total sample sizes carries the danger that ‘large samples influence effect size estimates more
This article is protected by copyright. All rights reserved
than small samples’ (Combs, 2010), we performed robustness checks using harmonic means
(see Appendix 7), and the results did not differ materially from those obtained using total
sample sizes. We additionally controlled for the influence of firm size (total assets, sales, or
employees) and firm age (years since founding) on performance, dynamic capabilities, and
ordinary capabilities.
RESULTS
In order to guard against the possibility of publication bias, we first generated funnel plots
(Sutton et al., 2000a; Sutton et al., 2000b), which did not provide any evidence of this
problem. We then applied the trim and fill method (Duval and Tweedie, 2000), which
demonstrated that no trimming had to be performed and the data were unchanged for both,
ordinary and dynamic capabilities.
The results of our analyses provide clear and consistent support for the three central
convictions underlying our work namely, that ordinary and dynamic capabilities are closely
associated, that both of them enhance firm performance, and that environmental dynamism
reinforces these effects. Tables 1, 2, and 3 present the results of our HOMA.
----------------------------------------- Insert Tables 1–3 here
-----------------------------------------
In the HOMA, Cochran’s Q-values reject the assumption of homogeneity for all
hypotheses tested with more than seven effect sizes. The HOMA results reported in Tables
1a–c provide clear evidence that both ordinary and dynamic capabilities have positive effects
on firm performance, both in relatively stable and in changing environments. When using
Pearson correlation coefficients (Table 1a), HOMA provided mean effect sizes ranging
between r̄ = 0.1332 and r̄ = 0.1978, and all of these values differ from zero at 99.95 percent
significance level or higher. Interestingly, the mean effect sizes of ordinary capabilities across
This article is protected by copyright. All rights reserved
environments (r̄ = 0.1885) and those of dynamic capabilities ( r̄ = 0.1861) are of similar
magnitude, and their difference is barely significant. Based on the suggestions by Bijmolt and
Pieters (2001), we replicated our primary HOMA (Table 1a) but used the complete set of
measurements instead of averaging, which produced similar results (see Appendix 8).
We also disaggregated our HOMA results by capability sub-categories based on the
complete set of measurements (Table 2), and these results yielded positive and significant
effect sizes for all relationships. Customer/supplier relationship capabilities (classified as
ordinary capabilities) yielded the largest effect size (r̄ = 0.2559), whereas the dynamic
capability of strategic human capital management had the weakest effect size (r̄ = 0.0709).
Overall, there are considerable variations in effect sizes within both the ordinary and the
dynamic capability category.
In order to test the robustness of these findings, we performed four analyses. First, in
order to provide stronger indications for a causal interpretation of the relationships we
reproduced our HOMA using partial correlation coefficients for the subset of primary studies
for which both Pearson and partial correlation coefficients were available (Table 1b–c). Table
1b shows that, with a range from r̄ = 0.0812 to r̄ = 0.1455, mean effect sizes calculated on
the basis of partial correlation coefficients are lower than those calculated on the basis of
Pearson correlation coefficients; nevertheless, they are statistically significant. The Pearson
correlation coefficients based HOMA results for the same set of studies (Table 1c) do not
differ greatly from our earlier HOMA (Table 1a) .
Second, we tested whether the relationship between (ordinary and dynamic) capabilities
and performance holds across different measures of performance used. We thus replicated
our HOMA reported in Table 1a, distinguishing between those studies that used non-
perceptual performance measures (i.e., accounting performance and/or capital market
performance) and those that used perceptual performance measures. The results, reported in
This article is protected by copyright. All rights reserved
Table 3, suggest that studies using perceptual performance measures show considerably
higher effects of capabilities on performance than those using non-perceptual ones. However,
even the latter group of studies report mean effect sizes that range from r̄ = 0.0957 to
r̄ = 0.1123, and that differ from zero at 99.99 percent significance level. In other words,
although studies that use non-perceptual performance measures tend to report considerably
lower effects, they too suggest that both ordinary and dynamic capabilities enhance
performance.
Third, MARA (Table 4) enabled us to test whether the positive effects of ordinary and
dynamic capabilities on performance are susceptible to the methodological choices made in
the primary research on which our meta-analyses draw. In Model 1, we reproduced our
HOMA results in the baseline constant-only models, in order to then include a battery of
controls (Models 2–4). These MARA show a positive and significant coefficient on the
journal quality control variable (SSCI) in Models 2a, 3a and 4a, suggesting that high-impact
journals find stronger effects of ordinary capabilities on firm performance. This finding
raised our confidence in the reliability of the results, as higher-impact journals are likely to be
more rigorous and selective in their publication strategies. At the same time, it might also
raise concern about the possibility of publication bias. Therefore, we repeated our earlier
funnel plot analysis, but using the SSCI 2011 impact factor score instead of standard errors of
each effect size as criterion variable, and again, we did not find any evidence of publication
bias. Furthermore, we controlled for studies that use panel data for their analysis.
Interestingly, the coefficient was negative and significant only in Models 3 and 4. This
finding suggests that studies involving longitudinal data tend to report weaker relationships
between (ordinary and dynamic) capabilities and performance, when changing environmental
conditions are also accounted for.
----------------------------------------- Insert Table 4 here
This article is protected by copyright. All rights reserved
-----------------------------------------
We also ran MARA with partial correlation coefficients as compared to Pearson
correlation coefficients, and included a dummy for those studies that employ methods
controlling for endogeneity. Out of the 121 samples included in our meta-analysis, less than a
quarter (28) use approaches such as instrumental variable designs, 2SLS regressions or
application of the Heckman procedure post-regression. However, the control variable
denoting the use of these methods was not statistically significant in any of our MARA
specifications, thus providing no evidence that studies that do not account for endogeneity
concerns in the capabilities–performance relationship overestimate the effect size of that
relationship in a systematic fashion.
Fourth, our MASEM results (Table 5) show that the relationship between ordinary and
dynamic capabilities on the one hand and firm performance on the other holds even when
other potential antecedents of firm performance (firm size and age), as well as the association
between ordinary and dynamic capabilities itself, are accounted for. The coefficients on both
ordinary and dynamic capabilities are positive and significant at 99.5 percent significance
level or higher throughout, regardless of the level of environmental dynamism. We also
found that in all environments firm size is positively and significantly associated with
ordinary and dynamic capabilities, as well as with firm performance. In our main MASEM,
firm age was not significantly associated with ordinary or with dynamic capabilities however,
when we calculated the MASEM using harmonic means, the associations were positive and
statistically significant (see Appendix 7).
----------------------------------------- Insert Table 5 here
-----------------------------------------
Our HOMA and MARA also suggest a significant moderating effect of environmental
dynamism on the ordinary capabilities–performance relationship (Hypothesis 1) and on the
dynamic capabilities–performance relationship (Hypotheses 2 and 3). Beginning with the
This article is protected by copyright. All rights reserved
former, the effect size of ordinary capabilities was higher in changing environments
(r̄ = 0.1873; Table 1a) than it was in relatively stable environments (r̄ = 0.1332). A t-test
ascertained the significance of this difference (∆ r̄ = 0.0541; t < 0.0001), providing support
for Hypothesis 1. Other HOMA specifications (Tables 1b–c) provide similar results.
Likewise, environmental change reinforces the relationship between dynamic capabilities and
firm performance. According to Table 1a, dynamic capabilities have a significant positive
effect on firm performance (r̄ = 0.1404) even in relatively stable environmental conditions,
thus confirming Hypothesis 2. However, in changing environments, their effect is even
greater ( r̄ = 0.1978), and the difference between the effects (∆ r̄ = 0.0574) is highly
significant (t < 0.0001). The results in Tables 1b and 1c suggest the same. Therefore,
Hypothesis 3 is supported.
Our strongest test of the moderating effects of environmental change, however, is
provided by the MARA (Table 4). Inclusion of the changing industry variable in Models 3a
and 3b resulted in an increase in the explanatory power of the models by 15–20 percentage
points as compared to the controls-only Models 2a and 2b. These results were unaffected by
the inclusion of a further sample control for studies carried out in emerging and developing
countries (see Models 4a and 4b), or by the exclusion of the 16 studies investigating a diverse
set of industries in emerging or developing countries (see Models 5a–6b). Additional
evidence of the moderating effect of environmental dynamism is provided by the MASEM
(Table 5), which shows higher coefficient values on ordinary and dynamic capabilities in
changing environments than in relatively stable ones.
Overall, the findings of the HOMA, the MARA and the MASEM suggest a similar
reinforcing effect of environmental dynamism on the OC–performance relationship as on the
DC–performance relationship. In other words, the empirical results do not lend support to the
This article is protected by copyright. All rights reserved
view that environmental change enhances the effects of dynamic capabilities on performance
over and above the effects of ordinary capabilities.
According to Hypothesis 4a, we expected a positive association between ordinary and
dynamic capabilities. Our MASEM, whose results are reported in Table 5 and illustrated in
Figure 1, provide strong support for this hypothesis.
-------------------------------- Insert Figure 1 here
--------------------------------
Overall, our model (Table 5) shows good fit (χ2 = 372.41). At a level of 0.2721, the
association between ordinary and dynamic capabilities is large and highly significant, and
these results hold in different environmental conditions. In fact, this association consistently
turns out to be the strongest one of all the relationships included in our various MASEM
models. In order to test Hypothesis 4b, we ran alternative MASEM models, in which we
included either ordinary capabilities or dynamic capabilities (but excluded the other one), and
one in which we included the effects of both types of capabilities on performance, but not the
correlations between ordinary and dynamic capabilities. We then compared the quality of the
models on the basis of the Akaike information criterion (AIC) and the Bayesian information
criterion (BIC). Models with lower AIC values are to be considered closer to the truth, and
those with lower BIC values more likely to be the true models, than models with higher AIC
and BIC values, respectively (Burnham and Anderson, 2002, 2004). These comparisons
confirmed that the model displayed in Figure 1 is superior to any of the other models we
estimated. Our MASEM thus suggests that in order to adequately depict the relationship
between ordinary and dynamic capabilities on the one hand and firm performance on the
other, any model should take into account the strong and positive association between
ordinary and dynamic capabilities themselves.
This article is protected by copyright. All rights reserved
DISCUSSION
Summary and theoretical implications
The capabilities-based view of the firm has established itself an important theoretical lens in
the management field (Acedo, Barroso, and Galan, 2006; Newbert, 2007). However, there is
considerable debate surrounding the conventional distinction between ordinary and dynamic
capabilities, their exact nature, and their relationship with firm performance under different
environmental conditions, and with one another (Helfat and Winter, 2011; Peteraf et al.,
2013; Vogel and Güttel, 2013). Our findings summarized below address these issues.
First, we find support for the idea that both ordinary and dynamic capabilities positively
affect the financial performance of firms, and that they do so in both stable and changing
environments. The mean size of most of the effects of capabilities on firm performance
ranges between 0.10 and 0.20. This finding is in line with meta-analyses of similar
relationships, such as innovation–performance (Rosenbusch, Brinckmann, and Bausch, 2011)
and resources–performance (Crook et al., 2008). Our MASEM also suggests that capabilities
are associated not only with financial performance, but also with firm size, which can also be
understood as a measure of organizational success (as it reflects past growth).
However, we do not find that one type of capability outweighs the other one in its effects
on performance. The evidence shows that the effects of ordinary capabilities, and those of
dynamic ones, are of comparable magnitudes. In fact, the differences in effect sizes within
different categories of ordinary capabilities and within different categories of dynamic
capabilities appear to be larger than the difference between ordinary and dynamic
capabilities. The disaggregated HOMA by capability sub-category (Table 2) suggests that the
effect sizes of relatively ‘hard’, structurally embedded capabilities (e.g., ‘resources/assets’,
‘organization/structure’, and ‘strategic human capital management’) are relatively lower than
This article is protected by copyright. All rights reserved
those of the ‘softer’, less tangible capabilities (e.g., ‘customer/supplier relationships’,
‘intangible assets/reputation’).
Despite the strength of the capabilities–performance relationship reported above, we find
that studies of this relationship are susceptible to the methodological choices that researchers
make. The relationship between both types of capabilities and performance is particularly
strong when perceptual performance indicators are used, but weaker (albeit still significant)
when more ‘objective’ performance measures (such as accounting data) are used.
Furthermore, we find that studies using panel data report considerably weaker effects of
capabilities than those using cross-sectional ones (see Appendix 9). Although this finding is
tentative due to the relatively low number of studies using panel data, it raises theoretical
concerns in that it casts doubt on the extent to which capabilities, once established, provide
lasting sources of competitive advantage (Eisenhardt and Martin, 2000). However, our
HOMA and MARA using partial correlation coefficients provide no indication that the
relationship between capabilities and firm performance should not be considered a causal
one, a view that has been questioned by authors such as Zahra et al. (2006). Of course, meta-
analysis always relies on the methodological quality of the underlying primary studies, and so
it is unable to establish causality conclusively.
Second, our findings provide evidence that environmental dynamism has a reinforcing
effect on both types of capabilities. In changing environments, both ordinary and dynamic
capabilities were found to be significantly more strongly associated with firm performance
than in relatively stable environments. Roughly speaking, in changing environments the
effect size of capabilities on performance is 40 percent higher (Table 1a) than it is in
relatively stable environments. This finding is in line with recent literature that posits a
significant role for environmental dynamism in the capability–performance relationship
(Schilke, 2014a). Some earlier treatments of capabilities (e.g., Makadok, 2001) do not
This article is protected by copyright. All rights reserved
acknowledge the role of the environment. Many empirical studies (e.g., Acar and Zehir,
2010; Chatain, 2011; Terjesen, Patel, and Covin, 2011) focus on single environmental
settings, thus not enabling them to draw conclusions on the moderating role of the
environment. The meta-analytic nature of our study makes it possible to overcome this
hurdle, suggesting that environmental dynamism plays an important role in the capabilities–
performance relationship.
We believe our finding that environmental dynamism enhances the performance effects
of dynamic capabilities more than the performance effects of ordinary ones attests to the
fundamental need for ordinary capabilities as the basic building blocks for the performance of
firms (Winter, 2003). Ordinary capabilities are the sine qua non for the success of firms.
Changing environmental conditions do not lessen, but rather increase the importance of firms
doing what they do to their best ability. Therefore, the value of capabilities does not depend
exclusively on a firm’s need to master environmental change (Kraaijenbrink, Spender, and
Groen, 2010). They are needed in stable environments, too.
Third, we find strong evidence that the categories of ordinary and dynamic capabilities
are closely related to one another. Their association is stronger than any other contained in
Figure 1, and its omission would result significantly weaker model fit. Furthermore, the use
of model selection criteria indicates that an adequate modelling of the effects of both ordinary
and dynamic capabilities on performance, must take the relationship between these different
types of capabilities themselves into account. Our findings suggest that dynamic capabilities
and ordinary capabilities do not substitute for each other, neither in stable nor in dynamic
environments.
Overall, our findings attest to the importance of capabilities, yet caution against
perspectives that take too grand a view of dynamic (as compared to ordinary) capabilities. In
short, they offer support for a more moderate capabilities-based view of the firm. This view
This article is protected by copyright. All rights reserved
emphasizes the relatedness and mutual dependence of dynamic and ordinary capabilities
(e.g., Eisenhardt and Martin, 2000; Zahra et al., 2006; Zollo and Winter, 2002). Our analysis
thus provides indications for a complementary relationship between dynamic and ordinary
capabilities (Clougherty and Moliterno, 2010). Complementarity holds when the presence of
one element enhances the returns to another one, so that both of them are likely to coalesce
and thus correlate (Brynjolfsson and Milgrom, 2013). Conceptualizing the relationship
between ordinary and dynamic capabilities as a complementary one may also offer avenues
for resolving the ‘infinite regress’ problem (Collis, 1994), which is predicated on a clear
hierarchical ordering of different capability types. Complementarity is to be distinguished
from causality, which requires – amongst others – a clear temporal ordering between the two
phenomena under consideration (i.e., the cause precedes the consequence; see (Antonakis et
al., 2010). In a complementary relationship, there is no space for the superior status that
proponents of a stronger DCV tend to ascribe to dynamic capabilities.
If ordinary and dynamic capabilities complement each other, the decisive question is how
they do so. The literature we reviewed in the context of our meta-analysis suggests at least
two mechanisms in this respect. The first one is an informational one. Ordinary capabilities –
and the activities in which they are exerted – may constitute a source of firm-specific
knowledge that enhances the value of activities involving dynamic capabilities. For example,
Katila and Ahuja (2002) show that search depth (a firm’s use of its existing knowledge) and
search scope (how widely the firm explores for new knowledge) are mutually reinforcing.
The organizational learning literature argues that a firm’s existing knowledge may
complement its search for new knowledge from external sources (Cohen and Levinthal, 1994;
Winter, 1984). Information differs from other resources in that it is not finite, therefore there
is no tradeoff between using it simultaneously in both ordinary and exploratory activities
(Gupta, Smith, and Shalley, 2006).
This article is protected by copyright. All rights reserved
The second way in which ordinary and dynamic capabilities may complement one
another can be described as an implementation-based one. The presence of ordinary
capabilities may both direct the search, and narrow the search scope, for dynamic capabilities,
and thus ensure that firms develops those ideas that it can implement successfully. Dynamic
capabilities are closely associated with strategizing (Augier and Teece, 2009); yet it is widely
known that many ‘good’ strategies fail because their implementation makes demands that an
organization is unable to fulfill. If a firm has both the capacity to develop new ideas and
strategies and the ability to ‘make them work in practice’, it can also economize on
coordination costs involved in bringing such ideas in-house or transferring existing ones to
outside parties. There is thus value in having both ordinary and dynamic capabilities in the
same organization.
However, there is an alternative interpretation of the correlation between ordinary and
dynamic capabilities, and the finding that their performance effects are of similar magnitude.
There is the possibility that the two concepts lack in discriminant validity, so that despite the
theoretical distinctions we may draw between them, they refer to the same, underlying
capabilities. The ‘blurriness’ of the distinction between ordinary and dynamic capabilities has
already been acknowledged in the literature (Helfat and Winter, 2011). The distinction
between ‘ordinary’ and ‘dynamic’ capabilities would thus contradict the law of parsimony.
We find considerable variation in terms of the performance effects of different capability
types within what we consider to be the ordinary and dynamic capability categories (Table 2),
suggesting that some kind of grouping of capabilities may well be meaningful. However, the
extant distinction between ordinary and dynamic capabilities may not be as useful as the
proponents of the more sanguine dynamic capabilities view of the firm suggest.
Therefore, our meta-analysis does not preclude the possibility that the distinction between
ordinary and dynamic capabilities may well be a theoretical convention. Clearly, firms need
This article is protected by copyright. All rights reserved
to do both, operate their existing lines of business as efficiently as possible, and develop,
upgrade and renew their capacity to do so. Similarly, the ambidexterity literature (Raisch and
Birkinshaw, 2008) argues that an organization needs to both ‘exploit’ its existing lines of
activity, and ‘explore’ new ones (Tushman and O'Reilly, 1996), yet it does emphasize the
value of keeping both of these abilities within the same organization (Gibson and Birkinshaw,
2004). Nevertheless, we believe a re-grouping of different types of capabilities into more
meaningful, conceptually distinct categories would provide a better theoretical understanding
of the role of capabilities as performance drivers.
Limitations and directions for future research
Our meta-analysis is beset by several limitations characteristic of this approach. For example,
incomplete or imprecise information from the underlying primary studies constrain the
precision of meta-analyses (Hunter and Schmidt, 1990). Our results (Table 4) show that
studies using perceptual performance measures tend to report larger effect sizes than those
using non-perceptual ones. Therefore, common methods variance remains a salient source of
concern, in particular as many of these primary studies do not conform to the standards
outlined by Conway and Lance (2010) and Podsakoff et al. (2003). Although our additional
HOMA (Table 3) suggests that even the studies using non-perceptual performance measures
find positive effects, we believe that the use of perceptual measures in this line of research
has been largely exhausted, and that non-perceptual measures should provide a more realistic,
if more cautious, assessment of the capabilities–performance relationship. Due to missing
data in the primary studies we could not correct for dichotomization, so we cannot fully rule
out effects resulting from potential false dichotomization (Geyskens et al., 2009; MacCallum
et al., 2002).
Furthermore, the primary purpose of meta-analysis is to aggregate findings on relatively
near-term relationships, whereas this method is not geared towards analyzing process-
This article is protected by copyright. All rights reserved
oriented studies and truly longitudinal ones. For this reason, we excluded from our data base
survival analyses such as the ones by Chen, Zou, and Wang (2009). Relatedly, we took into
account only studies that used ‘bottom-line’ financial performance measures, but not those
looking at the effects of ordinary and dynamic capabilities on longer-term performance
indicators such as firm growth, innovation, and the like (e.g., Lee, Lee, and Pennings, 2001).
For a more complete understanding of the role of capabilities in the development of firms, an
assessment of the literature on these longer-term effects is urgently needed.
We also note that we used a single dimension of environmental dynamism namely, the
degree of change in the industry environment in which firms are active. In contrast, the
institutional dimension of the environment in which firms play has not received sufficient
attention in the dynamic capabilities literature (Peteraf, 2013). Which particular capabilities
help firms to navigate situations of institutional turbulence? Are they the same as or do they
differ from those capabilities that help firms succeed as their industries change? Future
research on these issues is urgently needed.
Despite these limitations, we believe our study has both theoretical and managerial
implications that are positive in nature. Most importantly, our paper re-affirms the view that
firms with strong capabilities are likely to have better performance than those without. The
robustness of our findings suggests that capabilities are relatively reliable sources of success,
and that investments in capability development should yield positive returns (Maritan, 2001).
Furthermore, capabilities should become even more valuable in volatile conditions. Even in
turbulent situations, firms benefit from a focus on efficiency and effectiveness, while they
should use situations of stability to prepare themselves for changes to come (Stalk, Evans,
and Shulman, 1992). Despite our remaining skepticism with respect to the distinction
between ordinary and dynamic capabilities, our study reaffirms the idea that variations in
capabilities across firms are central to explaining variations in performance.
This article is protected by copyright. All rights reserved
The authors would like to thank editor Will Mitchell and two anonymous referees for their constructive feedback. We are also grateful to Margaret Peteraf, David Teece, Klaus Uhlenbruck, and to participants at conference sessions, research seminars and workshops held at the Academy of Management Annual Meeting, LMU Munich, the Organization Section of the German Academic Association for Business Research (VHB), and at our home institutions, for their helpful comments.
REFERENCES
Acar AZ, Zehir C. 2010. The harmonized effects of generic strategies and business capabilities on business performance. Journal of Business Economics & Management 11(4): 689-711.
Acedo FJ, Barroso C, Galan JL. 2006. The resource-based theory: Dissemination and main trends. Strategic Management Journal 27(7): 621-636.
Adegbesan JA. 2009. On the origins of competitive advantage: Strategic factor markets and heterogeneous resource complementarity. Academy of Management Review 34(3): 463-475.
Aguinis H, Dalton DR, Bosco FA, Pierce CA, Dalton CM. 2011a. Meta-analytic choices and judgment calls: Implications for theory building and testing, obtained effect sizes, and scholarly impact. Journal of Management 37(1): 5-38.
Aguinis H, Pierce CA, Bosco FA, Dalton DR, Dalton CM. 2011b. Debunking myths and urban legends about meta-analysis. Organizational Research Methods 14(2): 306-331.
Aldrich HE. 1979. Organizations and environments. Prentice Hall: Englewood Cliffs, NJ. Ambrosini V, Bowman C. 2009. What are dynamic capabilities and are they a useful
construct in strategic management? International Journal of Management Reviews 11(1): 29-49.
Ambrosini V, Bowman C, Collier N. 2009. Dynamic capabilities: An exploration of how firms renew their resource base. British Journal of Management 20(S1): S9-S24.
Amit R, Schoemaker PJH. 1993. Strategic assets and organizational rent. Strategic Management Journal 14(1): 33-46.
Antonakis J, Bendahan S, Jacquart P, Lalive R. 2010. On making causal claims: A review and recommendations. The Leadership Quarterly 21(6): 1086-1120.
Arend RJ, Bromiley P. 2009. Assessing the dynamic capabilities view: Spare change, everyone? Strategic Organization 7(1): 75-90.
Augier M, Teece DJ. 2009. Dynamic capabilities and the role of managers in business strategy and economic performance. Organization Science 20(2): 410-421.
Barreto I. 2010. Dynamic capabilities: A review of past research and an agenda for the future. Journal of Management 36(1): 256-280.
Bijmolt THA, Pieters RGM. 2001. Meta-analysis in marketing when studies contain multiple measurements. Marketing Letters 12(2): 157-169.
Brush TH, Artz KW. 1999. Toward a contingent resource-based theory: The impact of information asymmetry on the value of capabilities in veterinary medicine. Strategic Management Journal 20(3): 223-250.
Brynjolfsson E, Milgrom P. 2013. Complementarity in organizations. In The handbook of organizational economics. Gibbons R, Roberts J (eds.), Princeton University Press: Princeton, NJ.
Burnham KP, Anderson DR. 2002. Model selection and multimodel inference: A practical information-theoretic approach (2 ed.). Springer: New York, NY.
This article is protected by copyright. All rights reserved
Burnham KP, Anderson DR. 2004. Multimodel inference - Understanding AIC and BIC in model selection. Sociological Methods & Research 33(2): 261-304.
Carney M, Gedajlovic ER, Heugens PP, Van Essen M, Van Oosterhout J. 2011. Business group affiliation, performance, context, and strategy: A meta-analysis. Academy of Management Journal 54(3): 437-460.
Chang S-J, Rhee JH. 2011. Rapid FDI expansion and firm performance. Journal of International Business Studies 42(8): 979-994.
Chatain O. 2011. Value creation, competition, and performance in buyer-supplier relationships. Strategic Management Journal 32(1): 76-102.
Chen X, Zou H, Wang DT. 2009. How do new ventures grow? Firm capabilities, growth strategies and performance. International Journal of Research in Marketing 26(4): 294-303.
Cheung MW-L. 2008. A model for integrating fixed-, random-, and mixed-effects meta-analyses into structural equation modeling. Psychological Methods 13(3): 182-202.
Cheung MW-L. 2014. Fixed- and random-effects meta-analytic structural equation modeling: Examples and analyses in R. Behavior Research Methods 46(1): 29-40.
Cheung MW-L, Chan W. 2005. Meta-analytic structural equation modeling: A two-stage approach. Psychological Methods 10(1): 40-64.
Cho H-J, Pucik V. 2005. Relationship between innovativeness, quality, growth, profitability, and market value. Strategic Management Journal 26(6): 555-575.
Choi SB, Lee SH, Williams C. 2011. Ownership and firm innovation in a transition economy: Evidence from China. Research Policy 40(3): 441-452.
Clougherty JA, Moliterno TP. 2010. Empirically eliciting complementarities in capabilities: Integrating quasi-experimental and panel data methodologies. Strategic Organization 8(2): 107-131.
Cohen WM, Levinthal DA. 1994. Fortune favors the prepared firm. Management Science 40(2): 227-251.
Collis DJ. 1994. Research note: How valuable are organizational capabilities? Strategic Management Journal 15(S1): 143-152.
Combs JG. 2010. Big samples and small effects: Let's not trade relevance and rigor for power. Academy of Management Journal 53(1): 9-13.
Combs JG, Ketchen DJ. 1999. Explaining interfirm cooperation and performance: Toward a reconciliation of predictions. Strategic Management Journal 20(9): 867-888.
Conway JM, Lance CE. 2010. What reviewers should expect from authors regarding common method bias in organizational research. Journal of Business and Psychology 25(3): 325-334.
Crook TR, Ketchen DJ, Combs JG, Todd SY. 2008. Strategic resources and performance: A meta-analysis. Strategic Management Journal 29(11): 1141-1154.
Danneels E. 2002. The dynamics of product innovation and firm competences. Strategic Management Journal 23(12): 1095-1121.
Danneels E. 2008. Organizational antecedents of second-order competences. Strategic Management Journal 29(5): 519-543.
Dess GG, Beard DW. 1984. Dimensions of organizational task environments. Administrative Science Quarterly 29(1): 52-73.
Di Stefano G, Peteraf M, Verona G. forthcoming. The organizational drivetrain: A road to integration of dynamic capabilities research. Academy of Management Perspectives.
Douglas TJ, Ryman JA. 2003. Understanding competitive advantage in the general hospital industry: Evaluating strategic competencies. Strategic Management Journal 24(4): 333-347.
This article is protected by copyright. All rights reserved
Drees JM, Heugens PPMAR. 2013. Synthesizing and extending resource dependence theory: A meta-analysis. Journal of Management 39(6): 1666-1698.
Drnevich PL, Kriauciunas AP. 2011. Clarifying the conditions and limits of the contributions of ordinary and dynamic capabilities to relative firm performance. Strategic Management Journal 32(3): 254-279.
Duval SJ, Tweedie RL. 2000. A nonparametric “trim and fill” method of accounting for publication bias in meta-analysis. Journal of the American Statistical Association 95(449): 89-98.
Easterby-Smith M, Lyles MA, Peteraf MA. 2009. Dynamic capabilities: Current debates and future directions. British Journal of Management 20(S1): S1-S8.
Eisenhardt KM, Martin JA. 2000. Dynamic capabilities: What are they? Strategic Management Journal 21(10/11): 1105-1121.
Ennen E, Richter A. 2010. The whole is more than the sum of its parts—or is it? A review of the empirical literature on complementarities in organizations. Journal of Management 36(1): 207-233.
Felin T, Foss NJ, Heimeriks KH, Madsen TL. 2012. Microfoundations of routines and capabilities: Individuals, processes, and structure. Journal of Management Studies 49(8): 1351-1374.
Geyskens I, Krishnan R, Steenkamp J-BEM, Cunha PV. 2009. A review and evaluation of meta-analysis practices in management research. Journal of Management 35(2): 393-419.
Gibson CB, Birkinshaw J. 2004. The antecedents, consequences, and mediating role of organizational ambidexterity. Academy of Management Journal 47(2): 209-226.
Glass GV. 1976. Primary, secondary, and meta-analysis of research. Educational Researcher 5(10): 3-8.
Griffith DA, Noble SM, Chen Q. 2006. The performance implications of entrepreneurial proclivity: A dynamic capabilties approach. Journal of Retailing 82(1): 51-62.
Gubbi SR, Aulakh PS, Ray S, Sarkar MB, Chittoor R. 2010. Do international acquisitions by emerging-economy firms create shareholder value? The case of Indian firms. Journal of International Business Studies 41(3): 397-418.
Gupta AK, Smith KG, Shalley CE. 2006. The interplay between exploration and exploitation. Academy of Management Journal 49(4): 693-706.
Hedges LV, Olkin I. 1985. Statistical methods for meta-analysis. Academic Press: Salt Lake City, UT.
Helfat CE. 1997. Know-how and asset complementarity and dynamic capability accumulation: The case of R&D. Strategic Management Journal 18(5): 339-360.
Helfat CE, Finkelstein S, Mitchell W, Peteraf M, Singh H, Teece D, Winter SG. 2007. Dynamic capabilities: Understanding strategic change in organizations. Wiley-Blackwell: Malden, MA.
Helfat CE, Raubitschek RS. 2000. Product sequencing: Co-evolution of knowledge, capabilities and products. Strategic Management Journal 21(10/11): 961-979.
Helfat CE, Winter SG. 2011. Untangling dynamic and operational capabilities: Strategy for the (n)ever-changing world. Strategic Management Journal 32(11): 1243-1250.
Henderson J, Cool K. 2003. Learning to time capacity expansions: An empirical analysis of the worldwide petrochemical industry, 1975-95. Strategic Management Journal 24(5): 393-413.
Hult GTM, Ketchen DJ. 2001. Does market orientation matter? A test of the relationship between positional advantage and performance. Strategic Management Journal 22(9): 899-906.
Humphrey SE. 2011. What does a great meta-analysis look like? Organizational Psychology Review 1(2): 99-103.
This article is protected by copyright. All rights reserved
Hung RYY, Yang B, Lien BY-H, McLean GN, Kuo Y-M. 2010. Dynamic capability: Impact of process alignment and organizational learning culture on performance. Journal of World Business 45(3): 285-294.
Hunter JE, Schmidt FL. 1990. Methods of meta-analysis: Correcting error and bias in research findings. Sage: Newbury Park, CA.
Huselid MA, Jackson SE, Schuler RS. 1997. Technical and strategic human resources management effectiveness as determinants of firm performance. Academy of Management Journal 40(1): 171-188.
Kaleka A. 2002. Resources and capabilities driving competitive advantage in export markets: Guidelines for industrial exporters. Industrial Marketing Management 31(3): 273-283.
Katila R, Ahuja G. 2002. Something old, something new: A longitudinal study of search behavior and new product introduction. Academy of Management Journal 45(6): 1183-1194.
Kraaijenbrink J, Spender JC, Groen AJ. 2010. The resource-based view: A review and assessment of Its critiques. Journal of Management 36(1): 349-372.
Kraatz MS, Zajac EJ. 2001. How organizational resources affect strategic change and performance in turbulent environments: Theory and evidence. Organization Science 12(5): 632-657.
Landis RS. 2013. Successfully combining meta-analysis and structural equation modeling: Recommendations and strategies. Journal of Business and Psychology 28(3): 251-261.
LeBreton JM, Senter JL. 2008. Answers to 20 questions about Interrater reliability and interrater agreement. Organizational Research Methods 11(4): 815-852.
Lee C, Lee K, Pennings JM. 2001. Internal capabilities, external networks, and performance: A study on technology-based ventures. Strategic Management Journal 22(6/7): 615-640.
Lipsey MW, Wilson DB. 2001. Practical meta-analysis. Sage: Thousand Oaks, CA. MacCallum RC, Zhang S, Preacher KJ, Rucker DD. 2002. On the practice of dichotomization
of quantitative variables. Psychological Methods 7(1): 19-40. Maijoor S, Witteloostuijn AV. 1996. An empirical test of the resource-based theory: Strategic
regulation in the Dutch audit industry. Strategic Management Journal 17(7): 549-569. Makadok R. 1999. Interfirm differences in scale economies and the evolution of market
shares. Strategic Management Journal 20(10): 935-952. Makadok R. 2001. Toward a sythesis of the resource-based and dynamic capability views of
rent creation. Strategic Management Journal 22(5): 387-401. Maritan CA. 2001. Capital investment as investing in organizational capabilities: An
empirically grounded process model. Academy of Management Journal 44(3): 513-531. Milgrom P, Roberts J. 1994. Complementarities and systems: Understanding Japanese
economic organization. Estudios Economicos 9(1): 3-42. Miller D, Friesen PH. 1983. Strategy-making and environment: The third link. Strategic
Management Journal 4(3): 221-235. Miller D, Shamsie J. 1996. The resource-based view of the firm in two environments: The
Hollywood film studios from 1936 to 1965. Academy of Management Journal 39(3): 519-543.
Mithas S, Ramasubbu N, Sambamurthy V. 2011. How information management capability influences firm performance. MIS Quarterly 35(1): 137-A115.
Morgan NA, Vorhies DW, Mason CH. 2009. Market orientation, marketing capabilities, and firm performance. Strategic Management Journal 30(8): 909-920.
Nelson RR, Winter SG. 1982. An evolutionary theory of economic change. Harvard University Press: Cambridge, MA.
Newbert SL. 2007. Empirical research on the resource-based view of the firm: An assessment and suggestions for future research. Strategic Management Journal 28(2): 121-146.
This article is protected by copyright. All rights reserved
Nohria N, Gulati R. 1994. Firms and their environments. In Handbook of economic sociology. Smelser N, Swedberg R (eds.), Princeton University Press: Princeton, NJ.
Nunnally JC, Bernstein IH. 1994. Psychometric theory. McGraw-Hill: New York, NY. Perreault WD, Leigh LE. 1989. Reliability of nominal data based on qualitative judgments.
Journal of Marketing Research 26(2): 135-148. Peteraf M. 2013. Capability building across countries in MNCs: Panel Presentation. Paper
presented at the Strategic Management Society Annual Conference, Atlanta, GA. Peteraf M, Di Stefano G, Verona G. 2013. The elephant in the room of dynamic capabilities:
Bringing two diverging conversations together. Strategic Management Journal 34(12): 1389-1410.
Peteraf MA. 1993. The cornerstones of competitive advantage: A resource-based view. Strategic Management Journal 14(3): 179-191.
Pfeffer J. 2007. A modest proposal: How we might change the process and product of managerial research. Academy of Management Journal 50(6): 1334-1345.
Pierce JR, Aguinis H. 2013. The too-much-of-a-good-thing effect in management. Journal of Management 39(2): 313-338.
Podsakoff PM, MacKenzie SB, Lee J-Y, Podsakoff NP. 2003. Common method biases in behavioral research: A critical review of the literature and recommended remedies. Journal of Applied Psychology 88(5): 879-903.
Raisch S, Birkinshaw J. 2008. Organizational ambidexterity: Antecedents, outcomes, and moderators. Journal of Management 34(3): 375-409.
Richard PJ, Devinney TM, Yip GS, Johnson G. 2009. Measuring organizational performance: Towards methodological best practice. Journal of Management 35(3): 718-804.
Rosenbusch N, Brinckmann J, Bausch A. 2011. Is innovation always beneficial? A meta-analysis of the relationship between innovation and performance in SMEs. Journal of Business Venturing 26(4): 441-457.
Rosenthal R. 1995. Writing meta-analytic reviews. Psychological Bulletin 118(2): 183-192. Rothaermel FT, Hess AM. 2007. Building dynamic capabilities: Innovation driven by
individual-, firm-, and network-level effects. Organization Science 18(6): 898-921. Rothstein HR, Sutton AJ, Borenstein M. 2006. Publication bias in meta-analysis: Prevention,
assessment and adjustments. John Wiley & Sons: Chichester, UK. Schilke O. 2014a. On the contingent value of dynamic capabilities for competitive advantage:
The nonlinear moderating effect of environmental dynamism. Strategic Management Journal 35(2): 179-203.
Schilke O. 2014b. Second-order dynamic capabilities: How do they matter? Academy of Management Perspectives 28(4): 368-380.
Schreyögg G, Kliesch-Eberl M. 2007. How dynamic can organizational capabilities be? Towards a dual-process model of capability dynamization. Strategic Management Journal 28(9): 913-933.
Sher PJ, Yang PY. 2005. The effects of innovative capabilities and R&D clustering on firm performance: The evidence of Taiwan's semiconductor industry. Technovation 25(1): 33-43.
Sirmon DG, Hitt MA. 2009. Contingencies within dynamic managerial capabilities: Interdependent effects of resource investment and deployment on firm performance. Strategic Management Journal 30(13): 1375-1394.
Song M, Droge C, Hanvanich S, Calantone R. 2005. Marketing and technology resource complementarity: An analysis of their interaction effect in two environmental contexts. Strategic Management Journal 26(3): 259-276.
Stalk G, Evans P, Shulman LE. 1992. Competing on capabilities: The new rules of corporate strategy. Harvard Business Review 63(March-April): 57-67.
This article is protected by copyright. All rights reserved
Stanley T, Jarrell SB. 2005. Meta-regression analysis: A quantitative method of literature surveys. Journal of Economic Surveys 19(3): 299-308.
Sutton AJ, Duval SJ, Tweedie RL, Abrams KR, Jones DR. 2000a. Empirical assessment of effect of publication bias on meta-analyses. British Medical Journal 320(7249): 1574-1577.
Sutton AJ, Song F, Gilbody SM, Abrams KR. 2000b. Modelling publication bias in meta-analysis: A review. Statistical Methods in Medical Research 9(5): 421-445.
Tan J, Peng MW. 2003. Organizational slack and firm performance during economic transitions: Two studies from an emerging economy. Strategic Management Journal 24(13): 1249-1263.
Teece D, Pisano G. 1994. The dynamic capabilities of firms: An introduction. Industrial & Corporate Change 3(3): 537-556.
Teece DJ. 2007. Explicating dynamic capabilities: The nature and microfoundations of (sustainable) enterprise performance. Strategic Management Journal 28(13): 1319-1350.
Teece DJ. 2014. The foundations of enterprise performance: Dynamic and ordinary capabilities in an (economic) theory of firms. Academy of Management Perspectives 24(4): 328-352.
Teece DJ, Pisano G, Shuen A. 1997. Dynamic capabilities and strategic management. Strategic Management Journal 18(7): 509-533.
Terjesen S, Patel PC, Covin JG. 2011. Alliance diversity, environmental context and the value of manufacturing capabilities among new high technology ventures. Journal of Operations Management 29(1/2): 105-115.
Tushman ML, O'Reilly CA. 1996. Ambidextrous organizations: Managing evolutionary and revolutionary change. California Management Review 38(4): 8-30.
van Essen M, Otten J, Carberry EJ. 2012. Assessing managerial power theory: A meta-analytic approach to understanding the determinants of CEO compensation. Journal of Management 41(1): 164-202.
van Essen M, van Oosterhout J, Heugens PPMAR. 2013. Competition and cooperation in corporate governance: The effects of labor institutions on blockholder effectiveness in 23 European countries. Organization Science 24(2): 530-551.
Viswesvaran C, Ones DS. 1995. Theory testing: Combining psychometric meta-analysis and structural equations modeling. Personnel Psychology 48(4): 865-885.
Vogel R, Güttel WH. 2013. The dynamic capability view in strategic management: A bibliometric review. International Journal of Management Reviews 15(4): 426-446.
Vorhies DW, Morgan RE, Autry CW. 2009. Product-market strategy and the marketing capabilities of the firm: Impact on market effectiveness and cash flow performance. Strategic Management Journal 30(12): 1310-1334.
Voss GB, Voss ZG. 2008. Competitive density and the customer acquisition–retention trade-off. Journal of Marketing 72(6): 3-18.
Wang CK, Ang BL. 2004. Determinants of venture performance in Singapore. Journal of Small Business Management 42(4): 347-363.
Williamson OE. 1991. Strategizing, economizing, and economic organization. Strategic Management Journal 12(S2): 75-94.
Williamson OE. 1999. Strategy research: Governance and competence perspectives. Strategic Management Journal 20(12): 1087-1108.
Winter S. 2003. Understanding dynamic capabilities. Strategic Management Journal 24(10): 991-995.
Winter SG. 1984. Schumpeterian competition in alternative technological regimes. Journal of Economic Behavior & Organization 5(3): 287-320.
This article is protected by copyright. All rights reserved
Worren N, Moore K, Cardona P. 2002. Modularity, strategic flexibility, and firm performance: A study of the home appliance industry. Strategic Management Journal 23(12): 1123-1140.
Wu L-Y. 2010. Applicability of the resource-based and dynamic-capability views under environmental volatility. Journal of Business Research 63(1): 27-31.
Yeoh P-L, Roth K. 1999. An empirical analysis of sustained advantage in the U.S. pharmaceutical industry: Impact of firm resources and capabilities. Strategic Management Journal 20(7): 637-653.
Yiu DW, Lau C-M. 2008. Corporate entrepreneurship as resource capital configuration in emerging market firms. Entrepreneurship: Theory & Practice 32(1): 37-57.
Zahra SA, Nielsen AP. 2002. Sources of capabilities, integration and technology commercialization. Strategic Management Journal 23(5): 377-398.
Zahra SA, Sapienza HJ, Davidsson P. 2006. Entrepreneurship and dynamic capabilities: A review, model and research agenda. Journal of Management Studies 43(4): 917-955.
Zollo M, Winter SG. 2002. Deliberate learning and the evolution of dynamic capabilities. Organization Science 13(3): 339-351.
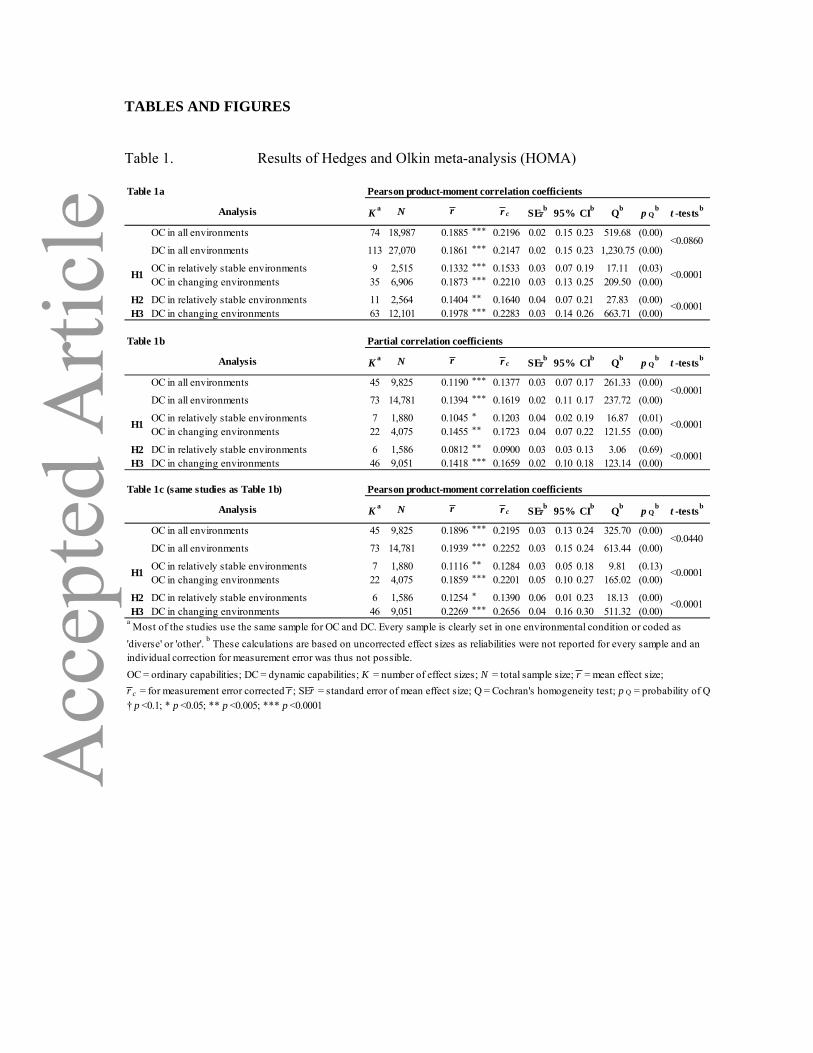
TABLES AND FIGURES
Table 1. Results of Hedges and Olkin meta-analysis (HOMA)
Table 1a Pearson product-moment correlation coefficients
Analysis K a N r c SErb Qb p Q
b t -testsb
OC in all environments 74 18,987 0.1885 *** 0.2196 0.02 0.15 0.23 519.68 (0.00)
DC in all environments 113 27,070 0.1861 *** 0.2147 0.02 0.15 0.23 1,230.75 (0.00)
OC in relatively stable environments 9 2,515 0.1332 *** 0.1533 0.03 0.07 0.19 17.11 (0.03)OC in changing environments 35 6,906 0.1873 *** 0.2210 0.03 0.13 0.25 209.50 (0.00)
H2 DC in relatively stable environments 11 2,564 0.1404 ** 0.1640 0.04 0.07 0.21 27.83 (0.00)H3 DC in changing environments 63 12,101 0.1978 *** 0.2283 0.03 0.14 0.26 663.71 (0.00)
Table 1b Partial correlation coefficients
Analysis K a N r c SErb Qb p Q
b t -testsb
OC in all environments 45 9,825 0.1190 *** 0.1377 0.03 0.07 0.17 261.33 (0.00)
DC in all environments 73 14,781 0.1394 *** 0.1619 0.02 0.11 0.17 237.72 (0.00)
OC in relatively stable environments 7 1,880 0.1045 * 0.1203 0.04 0.02 0.19 16.87 (0.01)OC in changing environments 22 4,075 0.1455 ** 0.1723 0.04 0.07 0.22 121.55 (0.00)
H2 DC in relatively stable environments 6 1,586 0.0812 ** 0.0900 0.03 0.03 0.13 3.06 (0.69)H3 DC in changing environments 46 9,051 0.1418 *** 0.1659 0.02 0.10 0.18 123.14 (0.00)
Table 1c (same studies as Table 1b) Pearson product-moment correlation coefficients
Analysis K a N r c SErb Qb p Q
b t -testsb
OC in all environments 45 9,825 0.1896 *** 0.2195 0.03 0.13 0.24 325.70 (0.00)
DC in all environments 73 14,781 0.1939 *** 0.2252 0.03 0.15 0.24 613.44 (0.00)
OC in relatively stable environments 7 1,880 0.1116 ** 0.1284 0.03 0.05 0.18 9.81 (0.13)OC in changing environments 22 4,075 0.1859 *** 0.2201 0.05 0.10 0.27 165.02 (0.00)
H2 DC in relatively stable environments 6 1,586 0.1254 * 0.1390 0.06 0.01 0.23 18.13 (0.00)H3 DC in changing environments 46 9,051 0.2269 *** 0.2656 0.04 0.16 0.30 511.32 (0.00)
OC = ordinary capabilities; DC = dynamic capabilities; K = number of effect sizes; N = total sample size; r = mean effect size; r c = for measurement error corrected r ; SEr = standard error of mean effect size; Q = Cochran's homogeneity test; p Q = probability of Q† p <0.1; * p <0.05; ** p <0.005; *** p <0.0001
H1
H1
H1
a Most of the studies use the same sample for OC and DC. Every sample is clearly set in one environmental condition or coded as 'diverse' or 'other'. b These calculations are based on uncorrected effect sizes as reliabilities were not reported for every sample and an individual correction for measurement error was thus not possible.
<0.0001
<0.0860
<0.0001
<0.0001
95% CIb
r 95% CIb
r
r
<0.0440
95% CIb
<0.0001
<0.0001
<0.0001
<0.0001
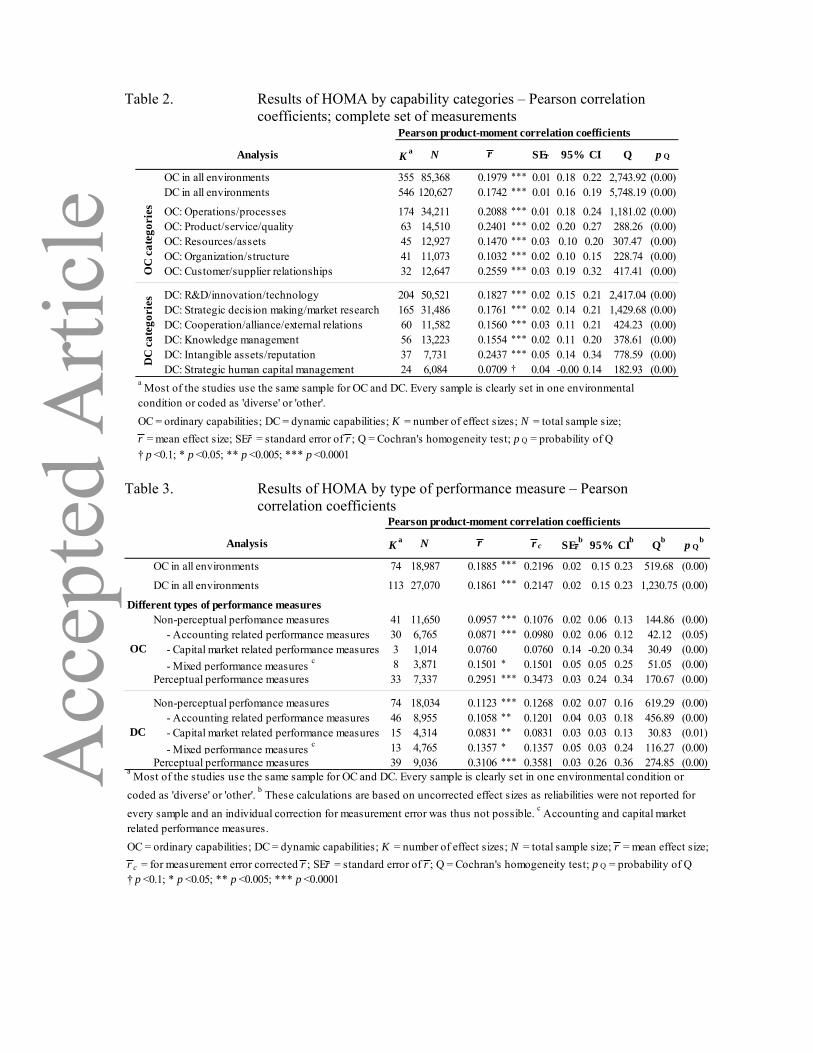
Table 2. Results of HOMA by capability categories – Pearson correlation coefficients; complete set of measurements
Table 3. Results of HOMA by type of performance measure – Pearson correlation coefficients
Pearson product-moment correlation coefficients
Analysis K a N SEr Q p Q
OC in all environments 355 85,368 0.1979 *** 0.01 0.18 0.22 2,743.92 (0.00)DC in all environments 546 120,627 0.1742 *** 0.01 0.16 0.19 5,748.19 (0.00)
OC: Operations/processes 174 34,211 0.2088 *** 0.01 0.18 0.24 1,181.02 (0.00)OC: Product/service/quality 63 14,510 0.2401 *** 0.02 0.20 0.27 288.26 (0.00)OC: Resources/assets 45 12,927 0.1470 *** 0.03 0.10 0.20 307.47 (0.00)OC: Organization/structure 41 11,073 0.1032 *** 0.02 0.10 0.15 228.74 (0.00)OC: Customer/supplier relationships 32 12,647 0.2559 *** 0.03 0.19 0.32 417.41 (0.00)
DC: R&D/innovation/technology 204 50,521 0.1827 *** 0.02 0.15 0.21 2,417.04 (0.00)DC: Strategic decision making/market research 165 31,486 0.1761 *** 0.02 0.14 0.21 1,429.68 (0.00)DC: Cooperation/alliance/external relations 60 11,582 0.1560 *** 0.03 0.11 0.21 424.23 (0.00)DC: Knowledge management 56 13,223 0.1554 *** 0.02 0.11 0.20 378.61 (0.00)DC: Intangible assets/reputation 37 7,731 0.2437 *** 0.05 0.14 0.34 778.59 (0.00)DC: Strategic human capital management 24 6,084 0.0709 † 0.04 -0.00 0.14 182.93 (0.00)
OC = ordinary capabilities; DC = dynamic capabilities; K = number of effect sizes; N = total sample size;r = mean effect size; SEr = standard error of r ; Q = Cochran's homogeneity test; p Q = probability of Q† p <0.1; * p <0.05; ** p <0.005; *** p <0.0001
r 95% CIO
C c
ateg
orie
sD
C c
ateg
orie
s
a Most of the studies use the same sample for OC and DC. Every sample is clearly set in one environmental condition or coded as 'diverse' or 'other'.
Pearson product-moment correlation coefficients
Analysis K a N r c SErb Qb p Q
b
OC in all environments 74 18,987 0.1885 *** 0.2196 0.02 0.15 0.23 519.68 (0.00)
DC in all environments 113 27,070 0.1861 *** 0.2147 0.02 0.15 0.23 1,230.75 (0.00)
Different types of performance measuresNon-perceptual perfomance measures 41 11,650 0.0957 *** 0.1076 0.02 0.06 0.13 144.86 (0.00) - Accounting related performance measures 30 6,765 0.0871 *** 0.0980 0.02 0.06 0.12 42.12 (0.05) - Capital market related performance measures 3 1,014 0.0760 0.0760 0.14 -0.20 0.34 30.49 (0.00) - Mixed performance measures c 8 3,871 0.1501 * 0.1501 0.05 0.05 0.25 51.05 (0.00)Perceptual performance measures 33 7,337 0.2951 *** 0.3473 0.03 0.24 0.34 170.67 (0.00)
Non-perceptual perfomance measures 74 18,034 0.1123 *** 0.1268 0.02 0.07 0.16 619.29 (0.00) - Accounting related performance measures 46 8,955 0.1058 ** 0.1201 0.04 0.03 0.18 456.89 (0.00) - Capital market related performance measures 15 4,314 0.0831 ** 0.0831 0.03 0.03 0.13 30.83 (0.01) - Mixed performance measures c 13 4,765 0.1357 * 0.1357 0.05 0.03 0.24 116.27 (0.00)Perceptual performance measures 39 9,036 0.3106 *** 0.3581 0.03 0.26 0.36 274.85 (0.00)
OC = ordinary capabilities; DC = dynamic capabilities; K = number of effect sizes; N = total sample size; r = mean effect size; r c = for measurement error corrected r ; SEr = standard error of r ; Q = Cochran's homogeneity test; p Q = probability of Q† p <0.1; * p <0.05; ** p <0.005; *** p <0.0001
r 95% CIb
OC
DC
a Most of the studies use the same sample for OC and DC. Every sample is clearly set in one environmental condition or coded as 'diverse' or 'other'. b These calculations are based on uncorrected effect sizes as reliabilities were not reported for every sample and an individual correction for measurement error was thus not possible. c Accounting and capital market related performance measures.
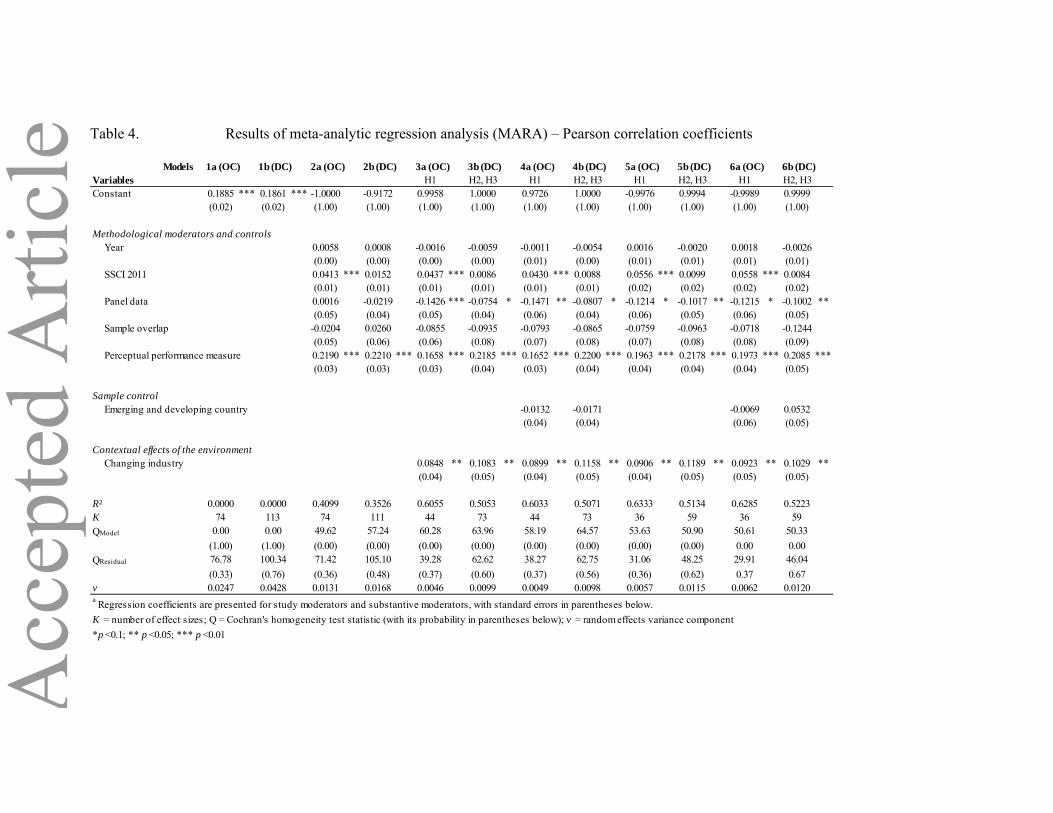
Table 4. Results of meta-analytic regression analysis (MARA) – Pearson correlation coefficients
Models 1a (OC) 1b (DC) 2a (OC) 2b (DC) 3a (OC) 3b (DC) 4a (OC) 4b (DC) 5a (OC) 5b (DC) 6a (OC) 6b (DC)Variables H1 H2, H3 H1 H2, H3 H1 H2, H3 H1 H2, H3Constant 0.1885 *** 0.1861 *** -1.0000 -0.9172 0.9958 1.0000 0.9726 1.0000 -0.9976 0.9994 -0.9989 0.9999
(0.02) (0.02) (1.00) (1.00) (1.00) (1.00) (1.00) (1.00) (1.00) (1.00) (1.00) (1.00)
Methodological moderators and controlsYear 0.0058 0.0008 -0.0016 -0.0059 -0.0011 -0.0054 0.0016 -0.0020 0.0018 -0.0026
(0.00) (0.00) (0.00) (0.00) (0.01) (0.00) (0.01) (0.01) (0.01) (0.01)SSCI 2011 0.0413 *** 0.0152 0.0437 *** 0.0086 0.0430 *** 0.0088 0.0556 *** 0.0099 0.0558 *** 0.0084
(0.01) (0.01) (0.01) (0.01) (0.01) (0.01) (0.02) (0.02) (0.02) (0.02)Panel data 0.0016 -0.0219 -0.1426 *** -0.0754 * -0.1471 ** -0.0807 * -0.1214 * -0.1017 ** -0.1215 * -0.1002 **
(0.05) (0.04) (0.05) (0.04) (0.06) (0.04) (0.06) (0.05) (0.06) (0.05)Sample overlap -0.0204 0.0260 -0.0855 -0.0935 -0.0793 -0.0865 -0.0759 -0.0963 -0.0718 -0.1244
(0.05) (0.06) (0.06) (0.08) (0.07) (0.08) (0.07) (0.08) (0.08) (0.09)Perceptual performance measure 0.2190 *** 0.2210 *** 0.1658 *** 0.2185 *** 0.1652 *** 0.2200 *** 0.1963 *** 0.2178 *** 0.1973 *** 0.2085 ***
(0.03) (0.03) (0.03) (0.04) (0.03) (0.04) (0.04) (0.04) (0.04) (0.05)
Sample controlEmerging and developing country -0.0132 -0.0171 -0.0069 0.0532
(0.04) (0.04) (0.06) (0.05)
Contextual effects of the environmentChanging industry 0.0848 ** 0.1083 ** 0.0899 ** 0.1158 ** 0.0906 ** 0.1189 ** 0.0923 ** 0.1029 **
(0.04) (0.05) (0.04) (0.05) (0.04) (0.05) (0.05) (0.05)
R² 0.0000 0.0000 0.4099 0.3526 0.6055 0.5053 0.6033 0.5071 0.6333 0.5134 0.6285 0.5223K 74 113 74 111 44 73 44 73 36 59 36 59QModel 0.00 0.00 49.62 57.24 60.28 63.96 58.19 64.57 53.63 50.90 50.61 50.33
(1.00) (1.00) (0.00) (0.00) (0.00) (0.00) (0.00) (0.00) (0.00) (0.00) 0.00 0.00QResidual 76.78 100.34 71.42 105.10 39.28 62.62 38.27 62.75 31.06 48.25 29.91 46.04
(0.33) (0.76) (0.36) (0.48) (0.37) (0.60) (0.37) (0.56) (0.36) (0.62) 0.37 0.67v 0.0247 0.0428 0.0131 0.0168 0.0046 0.0099 0.0049 0.0098 0.0057 0.0115 0.0062 0.0120a Regression coefficients are presented for study moderators and substantive moderators, with standard errors in parentheses below.K = number of effect sizes; Q = Cochran's homogeneity test statistic (with its probability in parentheses below); v = random effects variance component*p <0.1; ** p <0.05; *** p <0.01
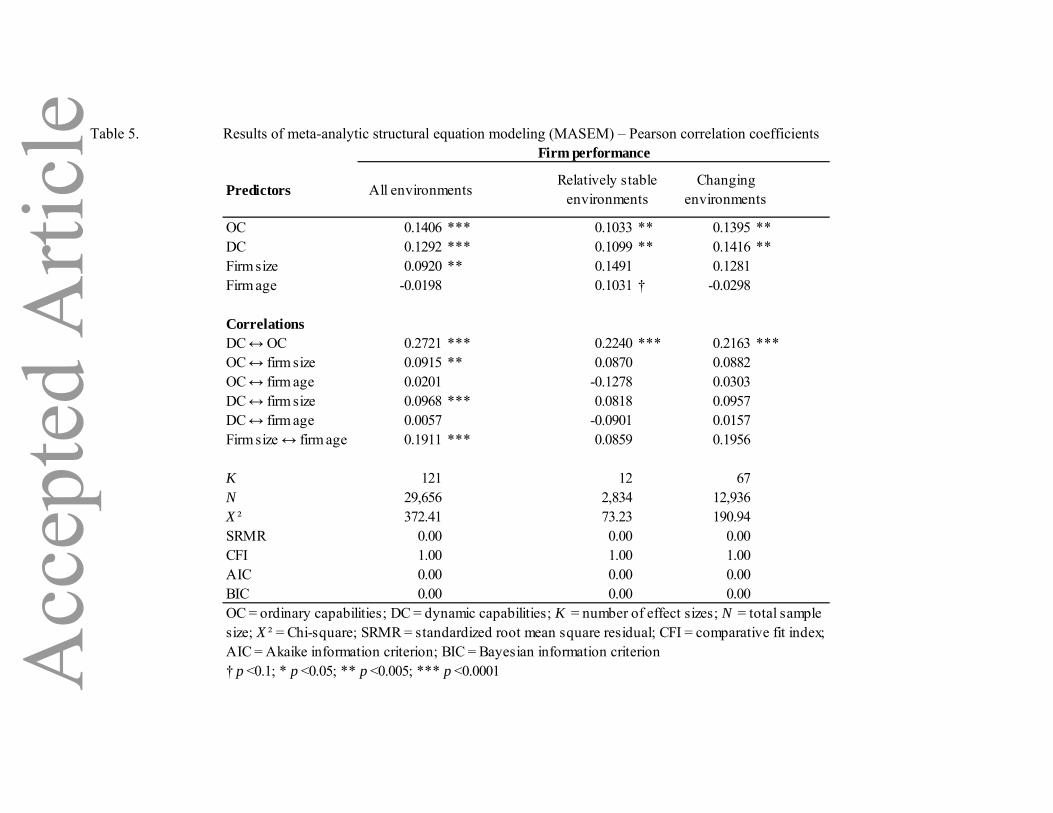
Table 5. Results of meta-analytic structural equation modeling (MASEM) – Pearson correlation coefficients
Predictors All environments
OC 0.1406 *** 0.1033 ** 0.1395 **DC 0.1292 *** 0.1099 ** 0.1416 **Firm size 0.0920 ** 0.1491 0.1281Firm age -0.0198 0.1031 † -0.0298
CorrelationsDC ↔ OC 0.2721 *** 0.2240 *** 0.2163 ***OC ↔ firm size 0.0915 ** 0.0870 0.0882OC ↔ firm age 0.0201 -0.1278 0.0303DC ↔ firm size 0.0968 *** 0.0818 0.0957DC ↔ firm age 0.0057 -0.0901 0.0157Firm size ↔ firm age 0.1911 *** 0.0859 0.1956
K 121 12 67N 29,656 2,834 12,936X ² 372.41 73.23 190.94SRMR 0.00 0.00 0.00CFI 1.00 1.00 1.00AIC 0.00 0.00 0.00BIC 0.00 0.00 0.00OC = ordinary capabilities; DC = dynamic capabilities; K = number of effect sizes; N = total samplesize; X ² = Chi-square; SRMR = standardized root mean square residual; CFI = comparative fit index;AIC = Akaike information criterion; BIC = Bayesian information criterion† p <0.1; * p <0.05; ** p <0.005; *** p <0.0001
Firm performance
Relatively stable environments
Changing environments
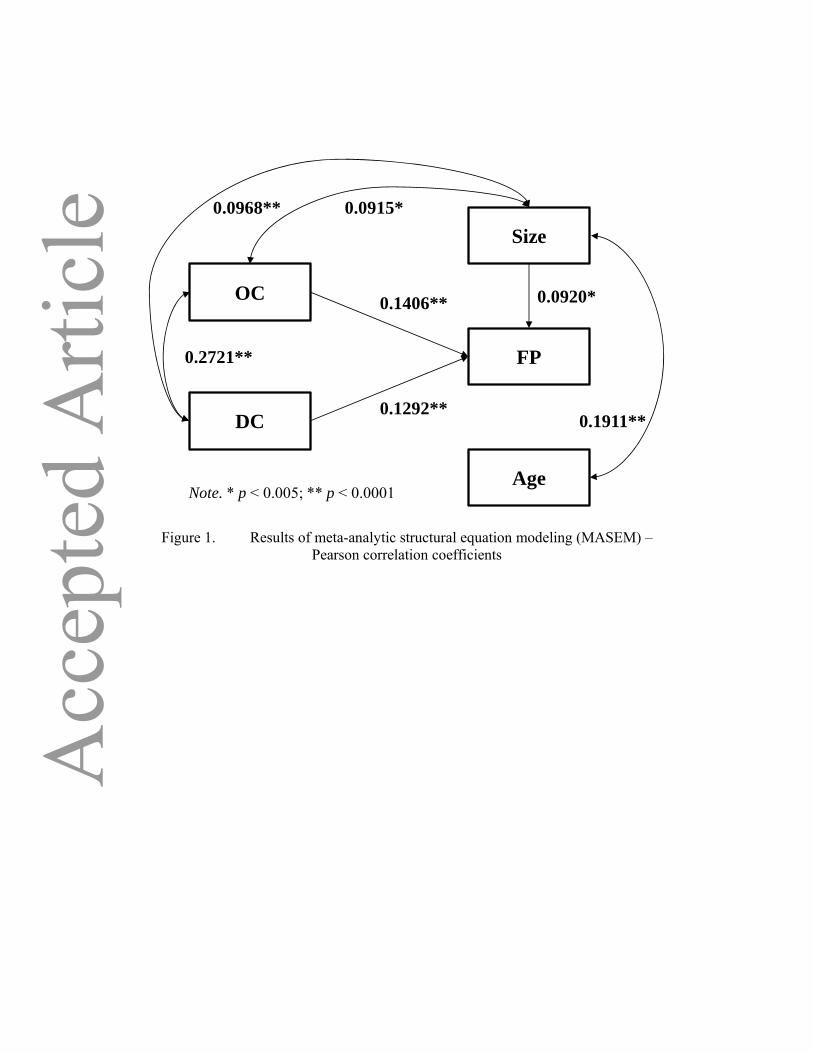
Figure 1. Results of meta-analytic structural equation modeling (MASEM) – Pearson correlation coefficients
OC
DC
FP
0.1406**
0.1292**
0.2721**
Size
Age
0.0920*
0.1911**
0.0915*0.0968**
Note. * p < 0.005; ** p < 0.0001
Related Documents