REVISITING RATING FORMAT RESEARCH: COMPUTER-BASED RATING FORMATS AND COMPONENTS OF ACCURACY by Scott Parrill Thesis submitted to the faculty of the Virginia Polytechnic Institute and State University in partial fulfillment of the requirements for the degree of Master of Science In Psychology Neil Hauenstein, chair Roseanne Foti John Donovan 12 May, 1999 Blacksburg, VA Keywords: Rating, Format, Appraisals, Accuracy Copyright 1999, Scott Parrill

Welcome message from author
This document is posted to help you gain knowledge. Please leave a comment to let me know what you think about it! Share it to your friends and learn new things together.
Transcript

REVISITING RATING FORMAT RESEARCH: COMPUTER-BASEDRATING FORMATS AND COMPONENTS OF ACCURACY
byScott Parrill
Thesis submitted to the faculty of the Virginia Polytechnic Institute and State Universityin partial fulfillment of the requirements for the degree of
Master of ScienceIn
Psychology
Neil Hauenstein, chairRoseanne FotiJohn Donovan
12 May, 1999Blacksburg, VA
Keywords: Rating, Format, Appraisals, Accuracy
Copyright 1999, Scott Parrill

REVISITING RATING FORMAT RESEARCH: COMPUTER-BASEDRATING FORMATS AND COMPONENTS OF ACCURACY
Scott Parrill
Abstract
Prior to 1980, most research on performance appraisal focused on rating formats.Since then, most performance appraisal research has focused on the internal processes ofraters. This study redirects the focus back onto rating format with a critical eye towardsrating accuracy. Ninety subjects read several hypothetical descriptions of teacherbehavior and then rated the teachers on different dimensions of teaching performanceusing computer-based rating formats. It was found that rating format does affect somemeasures of rating accuracy. In addition, support was found for the viability of a newrating format. Graphic rating scales with no anchors received higher accuracy scores oncertain measures of accuracy, higher ratings for liking of the rating format, higher levelsof comfort with the rating format, and higher levels of interrater reliability than eitherBARS or graphic rating scales with numerical anchors. This study supports the ideas thatrating format research should be reexamined with a focus on rating accuracy and thatcomputer-based graphic scales with no anchors should be considered as an alternative tomore traditional rating methods.

iii
CONTENTS
TABLE OF CONTENTS....................................................................................... iiiLIST OF TABLES ................................................................................................. iv
CHAPTER 1: INTRODUCTION ........................................................................... 1The Nature of Appraisals ............................................................................ 2Appraisal Instruments ................................................................................. 3
CHAPTER 2: LITERATURE REVIEW ................................................................ 4Graphic Rating Scales ................................................................................. 4BARS .......................................................................................................... 8A Quandary with Appraisal Instruments................................................... 12
CHAPTER 3: HYPOTHESES.............................................................................. 15Theory ....................................................................................................... 15Predictions of Accuracy and Reliability.................................................... 16
CHAPTER 4: METHOD ...................................................................................... 18Vignettes and Rating Scales...................................................................... 18Procedures ................................................................................................. 20Dependent Measures ................................................................................. 21
CHAPTER 4: RESULTS ...................................................................................... 24
CHAPTER 5: DISCUSSION................................................................................ 32Conclusions ............................................................................................... 36
APPENDIX A: BARS........................................................................................... 39
APPENDIX B: GRS W/ NUMERICAL ANCHORS........................................... 43
APPENDIX C: GRS W/ NO ANCHORS............................................................. 46
APPENDIX D: FOLLOW-UP QUESTIONS....................................................... 49
BIBLIOGRAPHY ................................................................................................. 50
VITA ..................................................................................................................... 54
iv
TABLES
Table 1: True Scores for Behavioral Incidents.................................................................. 22Table 2: Influence of Demographic Variables on Accuracy............................................. 24Table 3: Observed Scores for BARS................................................................................. 25Table 4: Observed Scores for Graphic Scales with Numerical Anchors .......................... 25Table 5: Observed Scores for Graphic Scales with No Anchors ...................................... 25Table 6: Intercorrelation Matrix for Performance Dimensions......................................... 26Table 7: Format Effects on Accuracy (Significance)........................................................ 26Table 8: Format Effects on Accuracy (Individual Statistics)............................................ 27Table 9: Comparison of GRS w/ No Anchors to GRS w/ Numerical Anchors ................ 27Table 10: Comparison of GRS w/ No Anchors to BARS................................................. 28Table 11: Comparison of GRS w/ Numerical Anchors to BARS..................................... 28Table 12: Comparison of Reliability Estimates ................................................................ 29Table 13: Format Effects on Follow-up Questions ........................................................... 29Table 14: Statistics for Follow-up Questions Based on Format........................................ 30Table 15: Comparisons of Means for Significant Follow-up Questions........................... 30

1
CHAPTER 1: INTRODUCTION
The idea of appraising or evaluating the performance of a worker is not an ideaoriginating in modern organizations. The general concept of performance appraisal hashistorical precedents dating back, at least, hundreds of years. As early as the thirdcentury A.D., a Chinese philosopher criticized the practices of the “Imperial Rater”because he rated workers according to how well he liked them, not based on how wellthey performed their duties (Murphy & Cleveland, 1995).
Formal, merit-based systems have existed in America and abroad since the early1800’s. As early as 1916, at least one major department store chain utilized a formalappraisal process not dissimilar from those in use today (Benjamin, 1952). Gradually, theidea of appraising worker performance has increased in popularity, sometimes spurred onby the social zeitgeist. The popularity of the civil rights movement of the 1960’s and70’s and the ensuing legislation created a need for the increased usage of valid appraisalpractices (Murphy & Cleveland, 1995). Since then, the attention devoted to performanceappraisal has continued to increase to a point where job performance is now the mostfrequently studied criterion variable in both the areas of human resource management andorganizational behavior (Heneman, 1986). With the growing number of successful,multinational companies, performance appraisal is rapidly becoming a global, not just anAmerican, topic. For example, DeVries, Morrison, Schullman, and Gerlach (1986) foundthat approximately 82% of the organizations in Great Britain have instituted a formalappraisal process of some kind.
Throughout the years, there has been a tremendous amount of research dedicatedto the appraisal process and appraisal instruments. Graphic rating scales date back to thefirst quarter of this century (Paterson, 1922). They were widely viewed as a method toaccurately and fairly assess an employee’s performance. Over time, researchers becamemore aware of the strengths and the limitations of graphic rating scales. The scales weresimple to use and develop, but the evaluations were often contaminated by various ratingerrors. The desire to improve the quality of performance ratings spurred research intoother rating formats. Most popular was Smith & Kendall’s (1963) behaviorally anchoredrating scale (BARS). Again, as researchers systematically explored the BARS method,the literature soon revealed their strengths and weaknesses as well. Numerous studieswere conducted to compare the different formats and the conditions in which they wereadministered. Many other, less popular, styles of rating scales were developed andcompared with the BARS and graphic rating scales. These include behavioralobservation scales (Tziner, Kopelman, & Livneh, 1993), behavioral expectation scales(Keaveny & McGann, 1975; Schneier, 1977), mixed-standard scales (Kingstrom & Bass,1981), and quantitative ranking scales (Chiu & Alliger, 1990). Through it all, however,the BARS and the graphic rating scales received, by far, the most attention.
The accumulated body of rating format research examined every part of theappraisal process, the rater, the ratee, intervening variables, gender, age, race, and theformat itself. However, with all of this research, there was no clear consensus as to whatwas the best rating format. In 1980, Landy & Farr called for a moratorium on format

2
research. Soon, the focus of researchers began to move to a more cognitive perspectiveof the rating process, and they began to focus on improving the rater rather than theformat. Researchers devised cognitive models of the appraisal process (DeNisi, Cafferty,& Meglino, 1984), developed methods of training raters to yield better appraisals(Bernardin & Buckley, 1981; Latham, Wexley, and Pursell, 1975; Stamoulis &Hauenstein, 1993), and experimented with motivational processes that affect the appraisalprocess (Neck, Stewart, & Manz, 1995).
With the focus on cognitive aspects of appraisal, little research is presentlydirected towards rating format. However, there may be a good reason to revisit a line ofresearch that has been deemed fruitless. Previous expeditions into the realm of formatresearch have been based largely upon the notions of freedom from halo and leniencyerrors, high levels of reliability, and increased variance in performance ratings (Borman& Dunnette, 1975; Friedman & Cornelius, 1976; Kingstrom & Bass, 1981). However,much of the research currently published in the area of performance appraisal isconcerned with levels of rating accuracy (Day & Sulsky, 1995; Murphy & Balzer, 1989;Stamoulis & Hauenstein, 1993). This focus on rating accuracy is noticeably absent fromthe rating format research of the past. Previous conclusions that rating format has little orno effect on the quality of ratings may have been drawn due to the erroneous beliefsregarding the importance of halo and leniency error, reliability, and variability in ratings.Research has since revealed that these criteria are not as important as measures of ratingaccuracy for determining the merits of a method of rating performance. Therefore, basedon the new focus on rating format, a second look at rating format may be necessary.
To date, there has been little applied research attempting to combine the domainsof format research and the cognitive approach to performance appraisal. Not only do we,as a field need to re-examine rating format research based on the notion of maximizingaccuracy, but there is also a necessity to combine format research with the new focus onthe cognitions that surround and are involved with performance appraisal.
The Nature of Appraisals
Performance appraisal can be thought of as “…the systematic description of job-relevant strengths and weaknesses within and between employees or groups…(Cascio,1998, p.58).” Simply put, performance appraisal is a measurement of how well someoneperforms a job-relevant task. Performance appraisals (PAs), however, are not limited toformal evaluations administered in an organizational setting. Other examples of PAsinclude praise from a boss or co-worker for a job well done, grades given to students, andstatistics of proficiency for athletes. However, given the prevalence of formal appraisalinstruments, one typically associates appraisal with organizational settings.
Formal appraisals are an important and integral part of any organization. Oneimportant purpose for appraisal is a basis for employers to take disciplinary action suchas denying a pay increase or justification of employee termination (Jacobs, 1986).Organizations can also use performance appraisals for determining employee’s strengthsand weaknesses (Cleveland, Murphy, & Williams, 1989). Perhaps the most obvious useof performance appraisal is to assist in the decisions regarding promotions and/or pay

3
raises (Murphy & Cleveland, 1995). In addition to those purposes mentioned above,performance appraisals serve a host of other functions including, but not limited to:determination of transfers and assignments, personnel planning, assisting in goalidentification, reinforcing the authority structure, and identifying widespreadorganizational developmental needs.
Since appraisals are so pervasive in modern organizations, it is only prudent thatresearchers investigate all factors that affect the rating process. Organizations spendmillions of dollars per year to rate their employees for a variety of reasons. Because ofthis, as much attention as possible should be devoted to every facet of the rating process.Numerous studies have focused on characteristics of the rater and characteristics of theratee. A third area of concern is the vehicle by which ratings are made: the appraisalinstrument. Landy & Farr (1980) note that there is a general consensus that the appraisalinstrument is a very important part of the appraisal process, and different instruments canaffect the accuracy and the utility of the performance evaluation information. This is thefocus of concern for the rest of this paper.
Appraisal Instruments
People administering performance appraisal instruments, or raters, have theoption of two general categories of performance measures (Cascio, 1998). Objectiveperformance measures have the benefit of being easily quantified, objective measuresrelative to job performance. They may include production data (how many units wereproduced, how many errors were committed, the total dollar value of sales) andemployment data (tardiness, absences, accidents). Although these measures appear to bedesirable, they do not focus on the behavior of the employee and are often impracticaland unsuitable for appraisal purposes (Heneman, 1986).
Subjective measures, on the other hand, attempt to directly measure a worker’sbehavior. However, since they depend on human judgements, they are vulnerable to awhole host of biases. Subjective measures include relative and absolute ranking systems,behavioral checklists, forced-choice systems, critical incidents, graphic rating scales, andbehaviorally anchored rating scales (Cascio, 1998). Behaviorally based ratings andgraphic rating scales have received a great deal of the attention devoted to performanceappraisal research (Landy & Farr, 1980). Therefore, these are the two formats uponwhich attention will be focused.

4
CHAPTER 2: LITERATURE REVIEW
Graphic Rating Scales
The first known method of graphically representing an employee’s performanceemerged from the disenchantment about the fairness of a seniority-based system forpromotions and raises. In 1922, Paterson developed, and published, what he called thegraphic rating scale. The scale was a straight line for each dimension of performance tobe measured with adjectives placed underneath the line to indicate level of proficiency.However, these labels were not anchors of any kind, they were simply guides. The raterwas free to place a check mark anywhere along the continuum he felt best evaluated theratee on that dimension. To translate this check mark into a score, a stencil was placedover the line, indicating a corresponding numerical value for the rater’s evaluation. Therater would repeat this procedure for all of the dimensions for a specific employee.
Paterson (1922) felt this method had several advantages over other methods ofevaluation. First, the procedure is very simple. All the rater is required to do is place acheck mark on a line indicating performance on a certain dimension. Secondly, the ratercan make a precise judgment about a worker’s performance. The rater is not restricted inhis responses and is not forced to place the ratee in a category or class. Finally, the rateris freed from quantitative terms such as numbers to describe a worker’s performance.Paterson felt that these quantitative terms influenced a rater’s judgement. With thismethod, the rater can evaluate performance without numbers biasing his judgment.
The reaction to this method of ratings was overwhelming. Graphic rating scalesrapidly grew in popularity. Within 30 years of Paterson’s publication, the graphic ratingscale was the most popular method for assigning merit-based ratings in organizations(Benjamin, 1952). Ryan (1958) observed that the graphic rating scale was used in almostany organizational activity where it was necessary to evaluate an individual’sperformance. Over the years, with the advent of new methods of ratings, popularity ofthe graphic rating scales has declined somewhat. However, it still continues to be one ofthe most widely used and distributed methods for evaluating performance (Bernardin &Orban, 1990; Borman, 1979; Cascio, 1998; Finn, 1972).
The reason why this method still retains its popularity more than 75 years after itsinception is most likely due to its many advantages. To begin with, graphical ratingscales are very simple. They are easily constructed (Friedman & Cornelius, 1976) andimplemented (Chiu & Alliger, 1990), and they are a cost-effective method of evaluatingemployees. In comparison, other methods of evaluating performance are very expensiveand require a more complex development process (Landy & Farr, 1980). Anotheradvantage of graphical rating scales is that the results from this method are standardized(Cascio, 1998; Chiu & Alliger, 1990). This means that once the employees have beenevaluated, comparison can be made to other ratees for the purposes of disciplinary action(Jacobs, 1986), feedback and development (Squires & Adler, 1998), promotions andadvancement decisions (Cleveland, Murphy, & Williams, 1989), etc. Also, graphicalrating scales have the advantage of being appealing to the actual evaluator, or rater.

5
Some research has demonstrated that raters actually prefer to rate using graphic ratingscales due to their simplicity and ease of rating (Friedman & Cornelius, 1976). Raters aretypically more reluctant to use a rating method that is rather complex and involved(Jacobs, 1986). Ease of development, simplicity of use, relatively little expense, andgeneralizablity across ratees all make for a method of evaluation that is attractive toorganizations.
As originally proposed by Paterson, a graphic rating scale was a check mark, orevaluation, made on a continuous line. However, this began to change very rapidly.Soon, graphic rating scales were being scored on computers used by researchers to maketheir jobs easier. Instead of using continuous lines, however, researchers were designingscales with anchor points along a continuum. Each anchor was given a certain value tofacilitate entry into the computer (Bendig, 1952a). Limiting answers to a set number ofanchor points (e.g., five, seven or nine) on a line replaced answering on a continuum.Instead of a graphic rating scale, this format could have been more appropriately labeleda ‘forced interval’ format. For better or for worse, this new format was soon beingreferred to as the “traditional” graphical rating scale format (Taylor & Hastman, 1956).
Graphic rating scales are relatively simple to develop. The first step is to use jobanalysis to identify and define the most important and most relevant dimensions of jobperformance to be evaluated (Friedman & Cornelius, 1976; Jacobs, 1986). It is alsorecommended that after relevant dimensions have been identified, they should becarefully refined to echo exactly what facets of job performance the rater wants tomeasure (Friedman & Cornelius, 1976).
Following this, the rater should decide how many scale points, or anchors, areneeded on the rating scale. [This begs the question of whether anchors are needed at all(Landy & Farr, 1980). However, Barrett, Taylor, Parker, & Martens (1958) conducted astudy on clerical workers in the Navy that helps to resolve this issue. In reviewingdifferent rating formats to measure performance, he found that anchored scales, onaverage, are more effective than scales without anchors.] Bendig (1952a, 1952b)conducted studies with students who were to rate the performance of their collegeteachers. He found that increasing the anchoring on the rating scales led to increasedreliability of the scale. It was assumed, for a while at least, that more anchors lead tobetter ratings. However, other research disputes this claim.
Lissitz and Green (1975) conducted a Monte Carlo study that investigated thismatter. They noted that previous studies concerned with the number of anchor points ongraphic rating scales have advocated either one specific number or no specific number ofanchor points. They felt that deciding the proper number of points on a scale is based onthe objectives and purpose of the study. However, they did suggest that 7 points areoptimal for a scale, but the increase in reliability begins to level off after 5 points. Theidea that a smaller number of scale points (for example, seven as compared to twelve orfifteen) is preferable is a sentiment echoed by other researchers (Finn, 1972; Landy &Farr, 1980). McKelvie, (1978) investigated the effects of different anchoring formats by

6
having students rate personality characteristics of certain groups of people. His resultswere consistent with those of Lissitz and Greene (1975).
Once the number of scale points has been decided, the scale developer shoulddecide the format of the anchors (Jacobs, 1986). Anchors can either be numerical,adjectival, or behavioral in nature. French-Lazovik and Gibson (1984) claimed that bothverbal (behavioral and/or adjectival) and numerical anchors are preferable whenanchoring a rating scale. Barrett et al. (1958), however, demonstrated that behavioralanchors tend to clearly be more effective than numerical or adjectival ones. Otherresearch has also arrived at the same conclusion (Bendig, 1952a; Smith & Kendall,1963). Jacobs (1986) notes that this is most likely because these types of anchorscommunicate more clearly, to the raters, what each point on the scale represents. (In fact,it was interest in these behavioral anchors that spawned research into a new type of ratingformat which will be discussed in more detail later in this paper.) However, it should becautioned that anchors could become too complicated.
Barrett et al. (1958) found that scale effectiveness decreased when too muchinformation was included in the anchors. The extra information seems to confuse therater and interfere with the rating process. There is also evidence that reliability does notnecessarily increase for scales with more specifically defined levels (Finn, 1972).However, there is a general consensus that behavioral anchors are preferable to adjectivesor numbers (Landy & Farr, 1980). In general, it seems that when constructing graphicrating scales, one should make sure to have approximately seven anchor points that arebehavioral in nature, taking care not to include too much information in any one anchor.
Graphic rating scales are not without their critics or criticisms. Although their usewas very popular and widespread, graphic rating scales were not subjected to muchempirical testing until the years following World War II. However, it became clear veryquickly that problems existed with graphic rating scales. Questions were raised, andmany researchers soon became concerned with how these problems could impact theeffectiveness and appropriateness of graphic rating scales’ widespread use inorganizations.
One of the problems with graphic rating scales that quickly became apparent aftertheir introduction is the so-called ‘halo effect.’ When examining graphic ratings ofperformance, Ford (1931) found that there was a tendency for raters to give similar scoresto a ratee on all dimensions of performance. To rate a worker in this manner would bethe equivalent of rating the worker on one single scale, as opposed to many differentscales that measure different aspects of work performance. Other researchers alsodiscovered this problem. Soon, there was a great deal of literature documenting theproblem of halo when using graphic rating scales (Barrett et al., 1958; Ryan, 1945; Ryan,1958; Taylor & Hastman, 1956). More current literature has also documented theproblem of halo, indicating that it continues to be a pervasive problem with graphic ratingscales (Cascio, 1998; Keaveny & McGann, 1975; Landy & Farr, 1980; Tziner, 1984).

7
For a while, it was thought that halo could be eliminated, or at least attenuated, bytraining. By warning raters of this pitfall associated with the graphic rating scales, scoreswould contain less halo, and the ratings would be more appropriate. However, researchhas shown this not to be the case (Ryan, 1958). Some have proposed the alternative ofstatistical correction to compensate for halo. However, this process, also, seems to lackpromise (Feldman, 1986).
Halo has traditionally been considered a serious problem for the effectiveness ofan appraisal system. Organizations typically use performance evaluations to make somesort of decision about a worker and his job (Cleveland, Murphy, & Williams, 1989).When evaluating a person, the organization attempts to measure the worker on severaldifferent criteria. In this way, the worker, with the help of the organization, is able to beaware of his strengths and can target areas for improvement. Halo eliminates thevariance between measurements of different performance dimensions. The person scoressimilarly across all dimensions and, thus, is unable to know which areas are strengths andwhich areas should be targeted for development.
In addition to halo, a leniency bias also plagues the use of graphic rating scales.Leniency is characterized by the tendency of a rater to be generous in his evaluation of anemployee’s performance across all dimensions of performance and across all ratees(Cascio, 1998). Like halo, leniency has been well documented as a source of error whenusing graphic rating scales (Barrett et. al., 1958; Bendig, 1952; Bernardin & Orban, 1990;Borman, 1979; Borman & Dunnette, 1975; Keaveny & McGann, 1975; Landy & Farr,1980; Taylor & Hastman, 1956).
Leniency presents a problem for organizations in the following way. Performanceappraisals are used to establish variance between the performance level of employees.Typically, these evaluations are used so that some merit-based decision can be madeabout the employees for the purposes of raises, promotions, benefits, etc (Cleveland et.al., 1989). These evaluations could also be used for employment decisions, decidingwhich employees should be terminated due to poor performance or which employeesshould be kept in an era of downsizing and layoffs (Bernardin & Cascio; 1988).Leniency eliminates the variance between employees, making it very difficult, if notimpossible, to make organizational decisions based on the measurement of employees’performance.
New research, however, challenges the traditional notion of associating these so-called rating errors with poor judgements of worker performance. One of the firstscientists to challenge the traditional conception of leniency and halo error was Borman(1979). He noted that the literature of the time supported the idea that most performanceratings were probably contaminated by error (e.g., halo, leniency), thereby renderinginaccurate ratings of employees. However, the results from his study failed to supportthis notion, and he suggested that an increase in accuracy was not as strongly correlatedwith a decrease in rating errors as once believed.

8
Over time, greater numbers of researchers began to realize the danger of equating“rating error” with a lack of accuracy. Murphy & Balzer (1989) found that the averagecorrelation between rating errors and measures of accuracy was near zero. Based on thedata, they felt that rating errors were not very likely to contribute to the decrease in ratingaccuracy. Jackson (1996) also found evidence that the point of maximum accuracy for atask does not necessarily coincide with the lowest measures of rating errors. Someresearchers (Balzer & Sulsky, 1992) went on to claim that any relation (high, low, orzero) could be empirically found between accuracy and rating errors. Nathan & Tippins(1990) were even so bold as to claim that ratings errors might actually contribute to anincrease in accuracy.
Gradually, performance appraisal researchers were beginning to realize that ratingerrors are not reliable or consistent indicators as to the effectiveness of performanceratings despite what was thought in the past (Balzer & Sulsky, 1992). The traditionalconception that leniency and halo were only measures of error was wrong. A moreplausible conceptualization was that these “rating errors” actually contained some true-score variance, not just error (Hedge & Kavanagh, 1988). Regardless, the traditionalcriticism of the graphic rating scale’s susceptibility to these “errors” no longer holds thesame concern that it once did.
There are other problems associated with graphic rating scales besides thetraditional problems of halo and leniency. Graphic rating scales have also been accusedof having problems associated with validity (Tziner, 1984), poor inter-rater agreement(Barrett et. al., 1958; Borman & Dunnette, 1975; Lissitz & Green, 1975; Taylor &Hastman, 1956), and personal biases of a rater (Kane & Bernardin, 1982; Landy & Farr,1980). Though important, these other problems associated with graphic rating scales arenot as prevalent in the research literature and have not traditionally been attributed thesame level of importance and influence as halo and leniency.
Behaviorally Anchored Rating Scales (BARS)
Due to the growing disenchantment with graphic rating scales (Ryan, 1958) anddue to their own desire to develop a better method of rating employees’ performance,Smith & Kendall (1963) devised a new method of appraising performance, BehaviorallyAnchored Rating Scales (BARS). They felt that evaluations varied too widely from raterto rater using older methods. They wanted a method that relied on interpretations ofbehaviors in relation to specified traits. They felt that better ratings could be obtainedfrom a rater “…by helping him to rate. We should ask him questions which he canhonestly answer about behaviors which he can observe.” (Smith & Kendall, 1963, p. 151)
The format they used was a series of graphic rating scales arranged in a verticalmanner. Behavioral descriptions representing parts of desired performance dimensionswere printed at various heights on the graphical scale, serving as anchors. A typical scalewill usually contain seven or nine of these behaviorally anchored points (Landy &Barnes, 1979). These descriptions serve as anchors in aiding the rater’s evaluation.Smith and Kendall (1963) note that “the examples we used, therefore, represent not

9
actual observed behaviors, but inferences or predictions from observations.” (p. 150) Thewhole premise behind their method was to “…facilitate a common frame of reference sothat they would look for the same kind of behaviors and interpret them in essentially thesame way. (Bernardin & Smith, 1981, p. 460)”
This method, introduced by Smith and Kendall (1963), immediately becamepopular. It has several advantages over graphic rating scales. The behaviorally basedmethod doesn’t seem to suffer from the traditional problems of leniency and halo whichplague graphic rating scales. Several researchers (Borman & Dunnette, 1975; Campbell,Dunnette, Arvey, & Hellervik, 1973; Friedman & Cornelius, 1976; Keaveny & McGann,1975; Tziner, 1984) have noted a reduced susceptibility to halo and/or leniency error withBARS as compared to graphic rating scales. Keaveny and McGann (1975), however, didfind some conflicting results. When students were asked to rate their professors witheither a behaviorally based scale or a graphic rating scale, although the BARS method didhave reduced halo error, the two methods did not differ in their amount of error due toleniency. However, two separate reviews of the performance appraisal literature(Kingstrom & Bass, 1981; Landy & Farr, 1980) both support the notion that the BARSmethod does, in fact, promote decreased levels of leniency and halo.
Another distinct advantage of the BARS method is that the scales are oftendeveloped by the same people who will eventually use them (Campbell et al., 1973;Smith & Kendall, 1963). This is helpful in the sense that when eventual raters participatein scale development, they may have a heightened understanding and awareness of thescale, and they might even gain more insight into the job they are to rate (Friedman &Cornelius, 1976; Smith & Kendall, 1963). Also, BARS are helpful to raters by theirusage of technical terms. The BARS method defines the dimensions and behaviorallabels in the language and terminology of the rater (Campbell et al., 1973; Smith &Kendall, 1963). This helps to ensure that the dimensions and the labels are interpretedthe same by all raters (Campbell et al., 1973). Perhaps one of the most appealing featuresof BARS is that it uses specific behavioral incidents as anchors. Barrett et al. (1958) andBorman (1986) both noted that the increased specificity of the behavioral anchors givesthe rater a more concrete guideline for making his evaluation. In addition, behaviorallybased methods have been shown to lead to elevated levels of goal clarity, goalcommitment, and goal acceptance compared to graphic rating scales (Tziner, Kopelman,& Livneh, 1993), and they have led to increased interrater agreement (Kingstrom & Bass,1981). In summary, the BARS format not only corrects for errors in graphic ratingscales, it provides many substantial advantages over other scale formats.
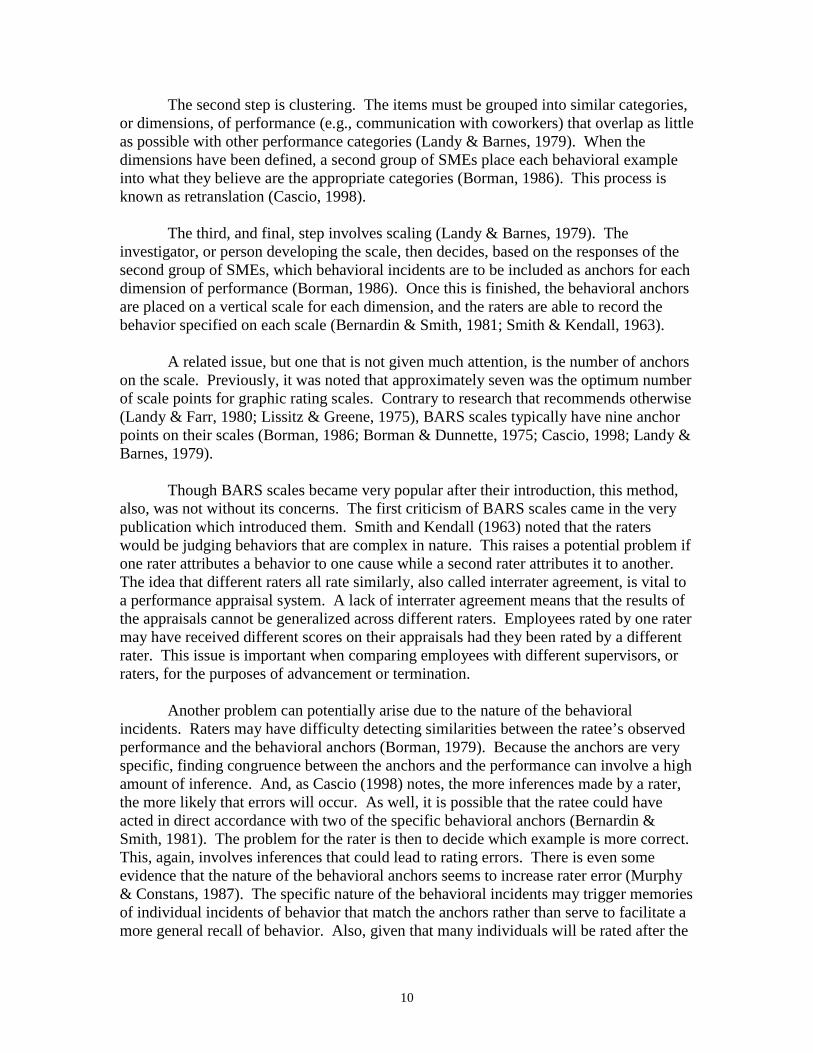
Admittedly, developing a BARS scale is an involved process. It requires carefulplanning and precision in order to develop a “successful” scale (Bernardin & Smith,1981). Smith and Kendall’s (1963) procedure for developing a BARS scale can besummarized in three steps. First, items must be selected that distinguish good frommediocre from poor incidents of performance. Borman (1986) notes that severalexamples of performance on all levels should be collected from individuals who areknowledgeable about the target position. These people are referred to as Subject MatterExperts (SMEs).
10
The second step is clustering. The items must be grouped into similar categories,or dimensions, of performance (e.g., communication with coworkers) that overlap as littleas possible with other performance categories (Landy & Barnes, 1979). When thedimensions have been defined, a second group of SMEs place each behavioral exampleinto what they believe are the appropriate categories (Borman, 1986). This process isknown as retranslation (Cascio, 1998).
The third, and final, step involves scaling (Landy & Barnes, 1979). Theinvestigator, or person developing the scale, then decides, based on the responses of thesecond group of SMEs, which behavioral incidents are to be included as anchors for eachdimension of performance (Borman, 1986). Once this is finished, the behavioral anchorsare placed on a vertical scale for each dimension, and the raters are able to record thebehavior specified on each scale (Bernardin & Smith, 1981; Smith & Kendall, 1963).
A related issue, but one that is not given much attention, is the number of anchorson the scale. Previously, it was noted that approximately seven was the optimum numberof scale points for graphic rating scales. Contrary to research that recommends otherwise(Landy & Farr, 1980; Lissitz & Greene, 1975), BARS scales typically have nine anchorpoints on their scales (Borman, 1986; Borman & Dunnette, 1975; Cascio, 1998; Landy &Barnes, 1979).
Though BARS scales became very popular after their introduction, this method,also, was not without its concerns. The first criticism of BARS scales came in the verypublication which introduced them. Smith and Kendall (1963) noted that the raterswould be judging behaviors that are complex in nature. This raises a potential problem ifone rater attributes a behavior to one cause while a second rater attributes it to another.The idea that different raters all rate similarly, also called interrater agreement, is vital toa performance appraisal system. A lack of interrater agreement means that the results ofthe appraisals cannot be generalized across different raters. Employees rated by one ratermay have received different scores on their appraisals had they been rated by a differentrater. This issue is important when comparing employees with different supervisors, orraters, for the purposes of advancement or termination.
Another problem can potentially arise due to the nature of the behavioralincidents. Raters may have difficulty detecting similarities between the ratee’s observedperformance and the behavioral anchors (Borman, 1979). Because the anchors are veryspecific, finding congruence between the anchors and the performance can involve a highamount of inference. And, as Cascio (1998) notes, the more inferences made by a rater,the more likely that errors will occur. As well, it is possible that the ratee could haveacted in direct accordance with two of the specific behavioral anchors (Bernardin &Smith, 1981). The problem for the rater is then to decide which example is more correct.This, again, involves inferences that could lead to rating errors. There is even someevidence that the nature of the behavioral anchors seems to increase rater error (Murphy& Constans, 1987). The specific nature of the behavioral incidents may trigger memoriesof individual incidents of behavior that match the anchors rather than serve to facilitate amore general recall of behavior. Also, given that many individuals will be rated after the

11
rater has already seen the appraisal instrument, the specific nature of the behavioralanchors may serve to prime the rater to look more carefully for behaviors that matchthose on the rating scale (Murphy & Constans, 1987).
Perhaps the largest problem with BARS scales is their development. Severalauthors (Borman & Dunnette, 1975; Campbell et al., 1973; Landy & Farr, 1980) havenoted that BARS scales are extremely expensive and time-consuming to develop.Campbell et al. (1973) noted that managers did learn a great deal from the process.However, they invested a tremendous amount of time and energy. The time spent couldbe occupied with any number of tasks from administrative duties to rating employees.The company not only has to pay the manager for time spent helping to develop the scale,but they also have to pay many other managers for the same activity as well as fund thestaff that is overseeing the construction process. It becomes a question of whether thegains of the BARS method outweigh the costs of development and administration. Someauthors (Borman, 1979) cast serious doubt on the idea that the advantages outweigh thedisadvantages of BARS scales, claiming that the time and effort spent is unwarranted.
The research literature in the 1970’s focused extensively on the differencesbetween different rating formats, most often the differences between graphic rating scalesand BARS. However, the actual differences between the scales were very simple.Different numbers and different styles of anchors are the real difference between graphicrating scales and BARS. Graphic rating scales rely on relatively simple anchors,numbers, to guide performance evaluations. On the other hand, behavioral anchors aremuch more complex in nature, and they are much more specific. So, at the most basiclevel, the only real difference between graphic rating scales and BARS is the specificityof the anchors.
Traditionally, the specific nature of the anchors in BARS has been considered oneof its advantages. Some claim that the specificity of behavioral anchors communicateswhat each point on the scale represents better than less specific anchors (Jacobs, 1986).As mentioned previously, these more specific anchors were considered to be morepreferable than less specific anchors (Barrett et. al, 1958; Bendig, 1952a; Smith &Kendall, 1963). The general belief was that scales with more specific anchors were moreeffective. However, the “effectiveness” criteria included increased reliability andvariance of the ratings (Finn, 1972). Researchers typically did not focus on measures ofrating accuracy when evaluating scales.
Rating accuracy has long been a neglected criterion for determining theeffectiveness of performance appraisals. Literature has recently begun to focus on thismeasure of rating quality, however. (The importance of accuracy as a criterion of ratingeffectiveness will be addressed at length in a subsequent section of this paper.) Based onthis new focus, research should re-examine old conclusions about anchor specificity witha new criterion, accuracy. Behavioral incidents are not necessarily the “ideal” anchorthat some researchers have claimed them to be. As early as 1959, Kay cautioned thatcritical incidents of behavior may be too specific for use as scale anchors. Barrett et al.

12
(1958) also noted that to much information contained in an anchor can have adverseeffects on evaluating performance.
Although research on the topic is limited, there is some evidence to indicate thatmore specific anchors can actually serve to bias the subject to respond in a certainmanner. A verbal label near the middle of a rating scale can actually serve to increase ordepress the value of ratings (French-Lazovik & Gibson, 1984). This, of course, wouldnot occur with a less specific type of anchoring such as a numerical anchor. Murphy &Constans (1987) have also focused on the biasing nature of anchors. They note thatincreased specificity of anchors does not always translate into increased ratingeffectiveness. They claim that behavioral anchors, specifically, affect the rater by biasingmemory for behavior.
Behavioral anchors are not as ‘ideal’ as once suspected. As previously noted,research needs to be conducted that challenges the notion that behaviorally-based anchorsare superior to other forms of anchoring with a focus on rating accuracy as thedeterminant of ‘effectiveness.’ Current literature cautions that increased specificity ofanchors may bias the raters to rate in a certain manner. Taking this into consideration,one might arrive at the conclusion that less specific anchors are actually better.
A Quandary with Appraisal Instruments
It is quite apparent from the voluminous research that although they both sufferfrom the same types of subjective biases, Graphic rating scales (GRS) and BARS scalesalso have their own advantages and their disadvantages. The question to both researchersand consultants in the field of Industrial Psychology then becomes: Which format is themore desirable? Borman (1979) noted that despite the numerous studies devoted torating format research, the research provides no clear picture of which type of scale is the“best.” Two years later, Kingstrom & Bass (1981) published a study that echoedBorman’s sentiments. Although they felt it was inappropriate to claim that BARS are notsuperior to traditional rating methods, there is relatively little empirical evidence tosupport such a position. As early as 1958, Barrett et al. revealed that variability in ratingsacross ratees, a desirable characteristic of performance appraisals, did not systematicallyvary as a function of the rating format. Around the same time, Taylor & Hastman (1956)arrived at a similar conclusion. They found that varying the rating format did not resultin increased interrater reliability, nor did it result in increased variability of ratings or, asthey called it, dispersion.
It appears that rating format research has come full circle. There are currentlyseveral different methods available to organizations who wish to appraise theiremployees’ performance, including GRS and BARS. However, they are faced with adifficult task of deciding which method to use. Unfortunately, all of the aforementionedresearch indicates that if they picked a method at random, they would get very similarresults. Organizations are left to decide for themselves what constitutes the best methodof performance appraisal. Doverspike, Cellar, & Hajek (1987) note that the problem inthe research literature stems from failure to achieve consensus regarding what criteriaconstitute the “best” method of rating performance. They point out that some researchers

13
use freedom from leniency or halo error as the prime criterion for determining thesuperiority of a rating method. Other methods of determining a rating scale’s worthinclude variability in ratings and interrater agreement. Based on Doverspike et al.’sargument, it is difficult, if not impossible to determine which rating format is superior.However, new research is focusing on rating accuracy as the best criterion for assessingthe quality of performance ratings.
The concern for accuracy in the ratings of workers’ performance levels hasalways been present. However, historically, the level of accuracy in performanceevaluations has always been implied by examining other statistical measures. Mostcommonly, rating errors, or the lack thereof, have implied the level of accuracy inperformance evaluations (Murphy & Cleveland, 1995) . The vast majority of studies thatcompared different rating formats examined criteria other than explicit measures of ratingaccuracy. Several studies compared rating formats on the basis of reliability (Barrett etal., 1958; Borman & Dunnette, 1975; Kingstrom & Bass, 1981) and variance amongperformance ratings of workers (Barrett et al., 1958; Borman & Dunnette, 1975).However, many studies compared rating formats based on the notion of reducingleniency and halo, so-called “rating errors” (Borman & Dunnette, 1975; Chiu & Alliger,1990; Friedman & Cornelius, 1976; Kingstrom & Bass, 1981). The conclusion of thesestudies, both independently and collectively, was that performance ratings are notaffected by the rating format. Landy & Farr (1980) examined the research conducted todate and concluded that format does not affect the outcome of the performance ratings.The foundation for these arguments, however, was faulty.
As previously stated, it was traditionally assumed that accuracy was linked torating errors. More specifically, the fewer rating errors contained in a rating instrument(lower levels of leniency and halo), the higher the level of accuracy. However, researchsoon began to accumulate that suggested this was not entirely true. Bernardin & Pence(1980) actually found a situation where lowered levels of leniency and halo correspondedwith a decrease in rating accuracy. They trained subjects to evaluate performance in amanner such that there was greater variation of ratings both within subjects and acrosssubjects. However, the dilemma they encountered was that the “true” level ofperformance exhibited by ratees may such that there is little variation in performancefrom one ratee to the next or across dimensions within the same ratee. So, by loweringthese measures of leniency and halo, Bernardin & Pence actually lowered the level ofrating accuracy as well.
In subsequent research, the ideas of Bernardin & Pence were expanded upon. Forexample, Balzer & Sulsky (1992) commented that it is even possible to achieve a zerocorrelation between measures of accuracy and halo error. In a meta-analysis, Murphy &Balzer (1989) even made the bold claim that rating errors could actually contribute to,rather than take away from, measures of rating accuracy. So, based on current research,it would be erroneous to conclude that the level of accuracy of performance evaluationscan be inferred from the level of rating errors. In light of these recent findings, it isapparent that rating format research should be revisited. This time, instead of focusing onreliability, variance in ratings, or freedom from rating errors such as halo or leniency,

14
research should use rating accuracy as the primary criterion for determining theeffectiveness of ratings.

15
CHAPTER 3: HYPOTHESIS
Theory
When Landy & Farr (1980) made their claim that rating format research wasuseless and should be abandoned, researchers turned their attention away from researchon rating formats. Instead, research turned inward, focusing upon the cognitive processesof the rater. When studying these cognitive processes, researchers focused on thepurpose of appraisal (Murphy, Philbin, & Adams, 1989), the cognitive makeup of therater (Schneier, 1977), internal drive and self-affirmation for the rating task (Neck,Stewart, & Manz, 1995), and the effect of memory and judgement on ratings (Woehr &Feldman, 1993). Instead of focusing on devising better rating instruments, the focus ofthis new approach is to make better raters.
In light of the new focus on the cognitive aspects of ratings, perhaps one goal ofthe research on performance appraisals should be to devise a method of ratingperformance that helps the rater rate. All major rating formats explored by research thusfar, BARS, Behavioral Observation Scales, and even GRS, do not allow a rater todocument workers’ performance levels at the same level at which the rater cognitivelyinterprets and rates the behaviors. All of these methods require a rater to judgeperformance on a scale, usually from a value to 1 to a value of 5, 7, or 9. All major ratingformat research to date has not allowed the rater to finely, and accurately, discriminatebetween stimuli. Some research has suggested that as a rater rates more and more ratees,the rater’s ability to discriminate between the different levels of performance can actuallyincrease (Coren, Porac, & Ward, 1979). To allow the raters to rate at this high level ofdiscrimination, continuous rating scales should be used.
Rating performance on a continuous scale would allow raters to discriminatebetween ratees at as precise of a level as they desire. No longer would raters be tied toanchors as the only possible responses about performance levels. Simply increasing thenumber of anchors on a rating scale would not have the same effect. Increasing thenumber of anchors to eleven, fifteen, or even twenty points does not allow for the rater torate in the areas between the scale anchors. Increased anchoring still does not allow forthe maximum level of discrimination between ratees that is possible. A continuous scale,however, does allow for this level of discrimination.
A continuous rating scale can be thought of, conceptually, as having an infinitenumber of anchor points. Some research has focused on the effects of increasing thenumber of anchors on a rating scale. Most of the studies that focus on the topic of scaleanchors (Finn, 1972; French-Lazovik & Gibson, 1984; Lissitz & Greene, 1975) have notexamined the effect of the number of scale points on rating accuracy. (The importance ofrating accuracy as the primary criterion for judging the effectiveness of a rating scale wasdiscussed earlier in the paper.) Their conclusions that five or seven scale points is the“optimum” number are, therefore, based on criteria such as reliability, variance in ratings,and freedom from rating errors in the performance ratings. Therefore, no assumptionscan be made about the detrimental effect of increased anchoring on rating accuracy.

16
The focus of this study comes from previous theoretical work and empiricalsupport. Clearly, the rating format research of the past has garnered few, if any, realadvances in the area of performance appraisal. It is the supposition of this paper that:(1) the lack of substantial advances in the area of rating format research in the past is dueto the fact that previous research did not seek to modify performance appraisals that fitwith the cognitive structure of the raters (i.e., previous research did not adopt somemethod of rating on a continuous scale), and (2) there was an inappropriate focus onminimizing “rating errors” rather than striving to increase accuracy. Most of thetraditional rating format research has focused on inappropriate criteria: leniency, halo,and variability of ratings. Instead, rating format research should be re-examined andfocus on maximizing accuracy rather than minimizing error or increasing variability inratings.
It should be noted that accuracy can actually be conceptualized in different ways(Cronbach, 1955). Elevation can be thought of as the overall level of rating, combinedacross raters and different performance dimensions. Differential Elevation collapsesaccuracy judgements across rating dimensions, but it examines each rater separately. Theopposite of differential elevation, stereotype accuracy, examines each performancedimensions separately, but it combines the judgements of all raters. The final measure ofaccuracy, differential accuracy, examines each performance dimensions separately foreach rater.
Through the history of rating format research, there has been an implicitassumption that scale anchors are necessary for rating scales to be effective. Perhaps thisis the reason that, to date, no one has examined a “true” graphical rating scale sansanchors. As previously noted, there is some support for the idea that anchors can actuallyserve to bias a rater (Murphy & Constans, 1987). The presence of these anchorsmisdirects the observations or recall of the ratee’s behavior. The presence of any type ofanchor (numerical, adjectival, or behavioral) can have the effect of biasing a rater’sjudgement. However, behavioral anchors generate the largest amount of bias on a rater’sperformance judgements. Murphy & Constans concluded that a rating scale might notalways benefit from scale anchors, particularly those of a behavioral nature.
Also, traditional rating format research has focused on the rating instrument buthas largely ignored the rater. As demonstrated above, the natural tendencies of humanperception, to notice very slight differences in stimuli (worker performance), have beenincompatible with the rating formats used to date.
Hypothesis 1: Performance evaluations conducted using a graphic rating scale(GRS) without any type of anchors will demonstrate higher levels rating accuracywhen compared to a standard than will performance evaluations conducted usinga graphic rating scale (GRS) containing numerical anchors.
Hypothesis 2: Performance evaluations conducted using a graphic rating scale(GRS) without any type of anchors will demonstrate higher levels of rating

17
accuracy when compared to a standard than will performance evaluationsconducted using a behaviorally anchored rating scale (BARS).
Hypothesis 3: Performance evaluations conducted using a graphic rating scalewith numerical anchors will demonstrate higher levels of rating accuracy whencompared to a standard than will performance evaluations conducted using abehaviorally anchored rating scale (BARS).
Interrater reliability is also a topic of concern for performance appraisals. Thismeasure determines the extent to which the various raters agree on the level of observedperformance of the ratees. One could argue that continuous rating scales with no anchorsshould lead to higher reliability than scales with anchors. When a rater observesperformance from several ratees, the rater mentally rank-orders the ratees and then rateseach ratee. A ratee’s rating depends on their rank order compared to other ratees. Acontinuous scale with no anchors allows the rater to precisely preserve the ratees’ rankorders in the rating process with no bias. Since there is an almost infinite number ofplaces along the rating continuum where a ratee will fit, each ratee can be ratedaccurately, and the rank order of the ratees can stay consistent.
In continuous scales with anchors, however, performance ratings can be biased bythe increasing specificity of anchors (Murphy & Constans, 1987). Due to this bias, arater’s evaluations are more likely to fall closer to the scale anchors. When theperformance ratings fall closer to the anchors, there is a greater chance that the integrityof the rank ordering of the ratees is not preserved. For example, if a ratee’s performancehas a true score of 4.63, the anchors may bias the rater to actually record the level ofperformance closer to the “5.00” anchor. The score may actually be recorded as a 4.8.However, ratees’ true scores of 4.58 and 4.75 may also be recorded as 4.8 due to thebiasing effect of the anchors. When this happens, the rank order of the ratees is notpreserved. All three ratees appear to have the same level of performance when, in fact,they do not. A different rater may not be as biased by the anchors and may record aperformance value closer to the true score for each ratee. Thus, there is a lack ofagreement between the two raters regarding the level of performance exhibited by thesethree ratees. Due to the biasing effect of the anchors, there would be a low level ofinterrater reliability. In a scale without the bias from anchors, this problem would notoccur.
Hypothesis 4: Graphic rating scales with no anchors will demonstrate higherlevels of interrater reliability for performance evaluations than will BARS orgraphic rating scales with numerical anchors.

18
CHAPTER 4: METHODS
102 subjects (51 female) participated in one of three rating format conditions.Students participating in this experiment were drawn from an Introductory Psychologycourse at Virginia Tech University. The study is a 3 (format) x 10 (ratee) x 6 (dimension)design with accuracy measures collapsing across both ratees and dimensions. Foranalysis, the study is a one-way design. The three between subject conditions of thestudy are based on format used to evaluate performance: a traditional BARS scale, agraphic rating scale with numerical anchors, and a graphic rating scale without any kindof anchors. All subjects were randomly assigned to one of the three between-subjectsconditions. In each condition, subjects were asked to rate the performance of tendifferent people on each of six different performance dimensions. The students receivedextra credit for their participation.
Vignettes and Rating Scales
The stimuli for the subjects in this experiment were a series of vignettes thatdescribe the actions of teachers in the classroom. The vignettes were composed of a setof critical incidents depicting teachers’ behaviors in the context of a class setting. Thecritical incidents used for the vignettes came from a larger pool of critical incidents. Thesame pool of critical incidents was also used to construct behavioral anchors in the BARSformat condition of the experiment. Although both the vignettes and the BARS scalesdraw on the same pool of critical incidents, the two groups do not share any commonincidents of behavior.
The critical incidents of teaching behavior were developed in accordance withspecific guidelines concerning the development of BARS scales (Cascio, 1998; Smith &Kendall, 1963). The first step in the scale development was to collect critical incidents ofteaching behavior. Smith & Kendall (1963) suggested that the people used to generatecritical incidents of the ratee’s behavior should be knowledgeable in the specific field.College students were judged to have the appropriate familiarity and knowledge of theratee’s job behaviors, so they were used to generate critical incidents of teachingbehaviors. Thirty-six undergraduate students from Virginia Tech were used to gather thecritical incidents. Once the lists of behaviors that the students generated were screened toeliminate repetitions, vague items, and non-specific behaviors, there were 234 specificteaching behaviors remaining.
The next step in the development of the scale was to assign each behavior to theappropriate dimension of teaching performance. The experimenter screened the list ofbehaviors for common trends or groups of teaching performance. In all, ten distinctdimensions of teaching performance were identified in the list: teacher dedication, classpreparation, classroom organization, technological savvy, teacher expertise, courtesy andrespect for students, adequately preparing students for exams, appropriate class content,appropriate grading procedures, and classroom delivery and presentation. Once thedimensions were identified by the experimenter, another group of twenty undergraduatestudents from Virginia Tech University were used to assign each behavior to a specific

19
dimension. Of the original 234 incidents of behavior, seven items were deleted due tolack of agreement among subjects when assigning those items to a specific dimension.
The final step in scale development involved retranslation. This is a process ofassigning a numerical value to each of the 227 specific incidents of behavior. TraditionalBARS scales are based on a scale of one to nine (Cascio, 1998; Campbell et al., 1973;Smith & Kendall, 1963). Hence, when assigning numerical values during theretranslation process, subjects were asked to rate each item as to the extent it representseffective teaching within the context of its appropriate dimension. Again, the subjectsused for the retranslation process were 28 undergraduate students from Virginia TechUniversity.
This whole process yielded a list of 227 specific incidents of teaching behaviorsgrouped into ten distinct dimensions of performance. A combination of these incidentswas then used to construct ten different teaching scenarios with each scenariorepresenting the actions of a different teacher within the context of class. Each scenariocontained specific incidents related to all six performance dimensions. Rating scaleswere constructed to measure the teacher’s level of performance across each of the sixdimensions. A continuous graphic scale with numerical anchors and a continuousgraphic scale without anchors were constructed along with a BARS scale. For the BARSscale, the behavioral anchors for each dimension were placed along the scale according totheir values as assigned in the retranslation process.
BARS scales traditionally range from one to nine. In order to make faircomparison across rating formats, it was decided that both types of graphic scales shouldalso yield rating values between one and nine. This allows for direct comparison ofresponses on a certain performance dimension for a specific vignette across ratingformats. In addition, all rating formats are continuous scales. In other words, a subjectcan also rate performance at any point between the numerical anchors along the ratingscale and not just be limited to rating on the numerical anchors. The computer programallowed precise measurement of the ratings to two decimal places. This is to allow for afair comparison between the “observed score” and the “true score” since the “true score”for each of the behavioral incidents used in the teaching vignettes is also measured to twodecimals.
All six performance dimensions measure behaviors that are familiar to the subjectand can be easily identified or recognized. Teacher dedication refers to behaviors thatshow a teacher’s attitude toward the class and their commitment to both the class materialand the students. Classroom preparation and organization is concerned with the “nutsand bolts” of the teacher in the classroom: how organized they are, whether classroombehavior is random or it has a planned purpose, does the teacher always have thenecessary materials for class to run effectively, etc. For the dimension of teacherexpertise, the teacher’s overall level of knowledge about the class material is beingmeasured. Incidents included in the courtesy and respect for students dimension areconcerned with topics such as the how respectful the teacher is toward the students, thelevel of consideration displayed toward the students, and the teacher’s general demeanor
20
in interacting with students. The adequately prepares students for exams dimensionmeasures how well effective a teacher is in giving students the tools and skills necessaryto perform well on the class tests. The last dimension, classroom delivery andpresentation, refers to the style of a teacher’s lectures, the effectiveness of a teacher inclass, and how successful they are in presenting the class material to the students.
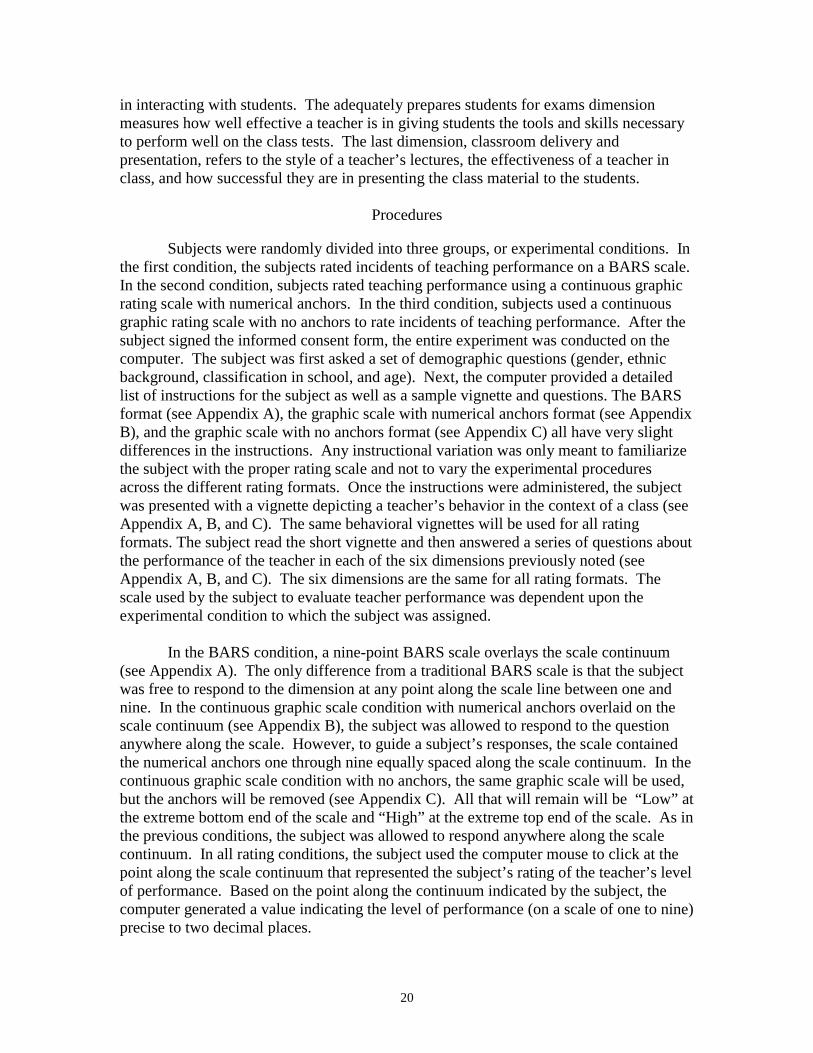
Procedures
Subjects were randomly divided into three groups, or experimental conditions. Inthe first condition, the subjects rated incidents of teaching performance on a BARS scale.In the second condition, subjects rated teaching performance using a continuous graphicrating scale with numerical anchors. In the third condition, subjects used a continuousgraphic rating scale with no anchors to rate incidents of teaching performance. After thesubject signed the informed consent form, the entire experiment was conducted on thecomputer. The subject was first asked a set of demographic questions (gender, ethnicbackground, classification in school, and age). Next, the computer provided a detailedlist of instructions for the subject as well as a sample vignette and questions. The BARSformat (see Appendix A), the graphic scale with numerical anchors format (see AppendixB), and the graphic scale with no anchors format (see Appendix C) all have very slightdifferences in the instructions. Any instructional variation was only meant to familiarizethe subject with the proper rating scale and not to vary the experimental proceduresacross the different rating formats. Once the instructions were administered, the subjectwas presented with a vignette depicting a teacher’s behavior in the context of a class (seeAppendix A, B, and C). The same behavioral vignettes will be used for all ratingformats. The subject read the short vignette and then answered a series of questions aboutthe performance of the teacher in each of the six dimensions previously noted (seeAppendix A, B, and C). The six dimensions are the same for all rating formats. Thescale used by the subject to evaluate teacher performance was dependent upon theexperimental condition to which the subject was assigned.
In the BARS condition, a nine-point BARS scale overlays the scale continuum(see Appendix A). The only difference from a traditional BARS scale is that the subjectwas free to respond to the dimension at any point along the scale line between one andnine. In the continuous graphic scale condition with numerical anchors overlaid on thescale continuum (see Appendix B), the subject was allowed to respond to the questionanywhere along the scale. However, to guide a subject’s responses, the scale containedthe numerical anchors one through nine equally spaced along the scale continuum. In thecontinuous graphic scale condition with no anchors, the same graphic scale will be used,but the anchors will be removed (see Appendix C). All that will remain will be “Low” atthe extreme bottom end of the scale and “High” at the extreme top end of the scale. As inthe previous conditions, the subject was allowed to respond anywhere along the scalecontinuum. In all rating conditions, the subject used the computer mouse to click at thepoint along the scale continuum that represented the subject’s rating of the teacher’s levelof performance. Based on the point along the continuum indicated by the subject, thecomputer generated a value indicating the level of performance (on a scale of one to nine)precise to two decimal places.

21
The subject rated the teacher presented in the vignette on each of the sixdimensions listed above. Once finished with a vignette, the subject then proceeded to thenext vignette and rated that teacher on the six performance dimensions. While rating aspecific teacher, any of the ratings within that specific vignette could be altered as manytimes as necessary. However, once a subject proceeded on to the following vignette, theratings of the teacher were not be able to be changed. The subject followed the sameprocedure until all ten teachers (vignettes) had been evaluated on all six performancedimensions. At that time, the subject then answered a series of six likert-type questionsconcerning personal preference and liking for the appraisal instrument (see Appendix D).Following these questions, the subject’s participation was concluded.
Follow-up Questions
At the end of the experiment, the subject were asked a series of likert-typequestions that dealt with their feelings about the vignettes and the scales used to judgeteaching performance (see Appendix D). The subjects were asked (1) how comfortablethey were in using the scales, (2) how clear were the behavioral scenarios, (3) the qualityof the rating scales, (4) how well they liked the scale, (5) how realistic the scenarioswere, and (6) how well the behavioral scenarios were constructed. These questions allowthe researchers to determine the quality of the appraisal instrument. These responsescould serve to guide construction of future appraisal instruments. In addition, theseresponses allow us to examine the level of subjects’ rating accuracy as compared to theirliking for the appraisal instrument.
Dependent Measures
Subjects in this study evaluated a teacher’s level of performance on class-relatedduties. Six performance dimensions were evaluated for each of ten different teachers fora total of sixty total ratings. Two of the scales used by the subjects were labeled withanchors ranging from one to nine, and the third scale contained no anchors. Based on thenumber of pixels on the computer screen between the two ends of the rating scale, thecomputer program calculated the value for each of the ratings based on where the subjectresponded along the scale continuum. Based on the position of the subject’s response onthe answer continuum, the computer calculated a value of “level of performance” preciseto two decimal places for all three rating formats. The performance dimensions that wereevaluated included teacher dedication, class preparation and organization, teacherexpertise, courtesy and respect for students, adequate preparation for exams, andclassroom delivery and presentation.
True scores of performance were developed through the BARS procedure fordeveloping behavioral incidents of performance (see Table 1). The true scores wereestablished in the same manner as the value for the behavioral anchors used in the BARS.Since these true scores were established using the proper BARS procedure, they are morediagnostic of their respective performance dimensions than a list of behavioral incidentsthat did not go through the retranslation procedure. Because they did go through theproper procedure, there is less overlap across performance dimensions for specific

22
behavioral incidents and they retain more diagnosticity of their respective dimensions ofteaching performance.
Table 1: True Scores of Behavioral IncidentsDim.1 Dim. 2 Dim. 3 Dim. 4 Dim. 5 Dim. 6 Ratee
AverageRatee 1 7.61 2.61 8.56 1.46 8.36 2.11 5.12Ratee 2 2.04 2.11 7.5 7.86 7.5 2.93 4.99Ratee 3 7.39 7.71 1.54 1.18 8.14 7.54 5.583Ratee 4 7.36 2.29 8.00 1.71 7.75 7.71 5.81Ratee 5 1.68 7.43 7.50 2.00 1.46 2.82 3.82Ratee 6 8.11 2.11 2.11 7.82 8.21 1.82 5.03Ratee 7 8.18 7.43 7.29 7.86 1.96 2.29 5.84Ratee 8 3.04 8.00 2.14 1.96 8.36 2.50 4.33Ratee 9 8.11 7.39 1.71 8.32 8.14 2.11 5.96Ratee 10 7.79 7.86 8.56 8.11 8.25 7.79 8.06Dim.Average
6.13 5.49 5.49 4.83 6.81 3.962 *5.45
Note: The value marked with “*” represents the overall mean of all true scores
Dependent variables for the study include the four separate measures of accuracy(Cronbach, 1955). The first of these measures, elevation, reflects the judgements of allratees combined across all performance dimensions being evaluated compared to the“true score” or target ratings. Elevation is the measure associated with the ideas of ratingerrors such as leniency or halo (Hauenstein, Facteau, & Schmidt, 1999).
E = Square Root[(X..- T..)2]
In this equation, X.. represents the grand mean of all observed scores of performance, andT.. represents the grand mean of all true scores. Differential elevation, is the second typeof accuracy judgement. However, this type of accuracy collapses across dimensions andonly focuses on the evaluation of each ratee. It can be represented by the following:
DE = Square Root[{∑[(Xi.-X..)-(Ti.-T..)]2}/6]
In the figures Xij or Tij, “i” refers to the ratee being evaluated and “j” represents thedimension on which ratee “i” is being rated. A “.” represents the mean of the appropriatelevel of the statistic, and X represents observed scores while T represents true scores. Forexample, X1. would represent the mean of a rater’s observed scores on ratee 1 averagedacross all performance dimensions.
Stereotype accuracy is the opposite of differential elevation. It focuses on how arater judges performance on the different dimensions, but it collapses across ratees. It iscomputed using the following equation:
SA = Square Root[{∑[(X.j-X..)-(T.j-T..)]2}/10]
23
Differential accuracy, the final accuracy judgement, reflects how a rater rates eachratee on each dimension. This measure examines accuracy for all ratees on eachdimension and can be computed with the following equation:
DA = Square Root[{∑[(Xij-Xi.-X.j+X..)- (Tij-Ti.-T.j+T..)]2}/60]
It should be noted that on all accuracy measures, values closer to zero are better.That is, the lower the value of any measure of accuracy, the more accurate theperformance ratings are as compared to the true score. Without specifying purpose ofappraisal, there would be no a priori reason to state which measure of accuracy is the“best” for this study. Elevation might be the most desirable if the purpose was to assess aglobal pattern of a rater’s ratings. Differential elevation would be the preferred variableif one was interested in a ratee’s overall level of performance across performancedimensions. If the area of concern was improving areas of performance that weresubstandard across all employees, stereotype accuracy would be the preferred measure ofaccuracy on which to focus. Also, if one was interested in looking at each ratee’s level ofperformance on each performance dimension, differential accuracy would be the mostimportant measure. However, without any of these concerns, there is no reason to state, apriori, which is the most important measure of accuracy for this study.
Measures of interrater reliability were also used as dependent measures. Thereliability estimates are calculated within each of the three rating formats. Interraterreliability is a measure that illustrates the degree to which the responses of one rater aresimilar to other raters within that same format. To assess reliability within a format, theresponses of each subject were correlated with the responses of every other subject withinthat same rating format. A mean of these correlations was used for the measure ofinterrater reliability.
In addition, the answers to the follow-up questions asked of the subjects aredependent variables. The six questions are measured on a 7-point likert scale. Thesemeasures were collected in order to assess preferences and comfort levels with the ratingscale used by each subject.

24
CHAPTER 5: RESULTS
Before assessing the hypotheses, potential moderators of the ratingformat/accuracy relationship were tested. An analysis of variance revealed that therewere no mean differences in the four types of accuracy based on age, classification, sex,or ethnicity significant at the p < .05 level (see Table 2). Descriptive statistics for thesubjects’ responses can be found in Tables 3, 4, and 5. These tables contain the meansand the standard deviations for each of the sixty performance evaluations made by eachsubject. In the tables, the results are separated according to rating format used. Theoverall mean of the observed scores for each of the three formats was higher than theoverall mean of the true scores. This indicates a slight tendency to rate in a favorablemanner. This bias toward more positive ratings can also be seen by an examination ofthe statistics. Also, Table 6 provides the intercorrelations between the performancedimensions. The levels of intercorrelation between the performance dimensions rangefrom .214 to .592 with an average correlation of .388. These are, generally speaking,modest level correlations. Typically, performance appraisals have higher levels ofintercorrelation between performance dimensions.
Table 2: Demographic Variables’ Influences on Rating AccuracyVariable DF F-value Prob > F
Elevation Age 2, 99 .124 .884Class 4, 97 .241 .914Ethnic 4, 97 .191 .943Sex 1, 100 .393 .532
DifferentialElevation
Age 2, 99 .196 .822
Class 4, 97 .716 .583Ethnic 4, 97 2.014 .109Sex 1, 100 .048 .827
StereotypeAccuracy
Age 2, 99 2.329 .103
Class 4, 97 1.706 .155Ethnic 4, 97 1.641 .170Sex 1, 100 .048 .827
DifferentialAccuracy
Age 2, 99 2.431 .092
Class 4, 97 1.761 .143Ethnic 4, 97 2.291 .072Sex 1, 100 .479 .491

25
Table 3: Mean Observed Scores for BARSDim. 1 Dim. 2 Dim. 3 Dim. 4 Dim. 5 Dim. 6 Ratee
AverageRatee 1 5.62 4.67 7.19 4.53 6.67 4.67 5.56
Ratee 2 4.99 4.76 7.03 5.47 4.87 4.20 5.22Ratee 3 6.07 7.03 4.49 2.39 6.14 5.94 5.34Ratee 4 6.86 4.88 7.14 6.82 4.74 7.26 6.28Ratee 5 4.47 5.95 6.11 2.76 2.78 4.39 4.41Ratee 6 6.97 4.44 4.56 8.06 7.31 3.31 5.77Ratee 7 7.06 7.18 7.09 5.65 3.60 6.06 6.11Ratee 8 4.56 4.26 4.08 3.36 6.49 3.29 4.34Ratee 9 6.72 6.33 5.14 7.35 4.91 5.70 6.02Ratee 10 8.13 8.25 8.41 8.06 8.22 8.20 8.21Dim.Average
6.15 5.77 6.12 5.44 5.57 5.30 *5.73
Note: The value marked with “*” represents the average of all observed scores
Table 4: Mean Observed Scores for Graphic Scales with Numerical AnchorsDim. 1 Dim. 2 Dim. 3 Dim. 4 Dim. 5 Dim. 6 Ratee
AverageRatee 1 6.54 5.82 7.34 6.13 7.49 4.93 6.73
Ratee 2 4.91 4.11 6.98 5.60 5.15 4.24 5.17Ratee 3 6.18 6.71 4.29 3.05 6.16 5.73 5.34Ratee 4 7.46 6.45 7.01 6.89 6.45 8.05 7.05Ratee 5 4.57 6.12 6.68 3.83 3.18 4.23 4.77Ratee 6 7.72 4.47 5.11 8.30 7.49 3.61 6.12Ratee 7 7.50 7.43 7.63 7.42 7.35 6.36 7.28Ratee 8 4.64 4.48 5.17 3.53 5.77 3.39 4.50Ratee 9 6.91 6.23 4.90 7.22 5.50 5.23 6.00Ratee 10 8.09 8.25 8.20 8.38 8.23 8.43 8.27Dim.Average
6.45 6.01 6.33 6.04 6.27 5.42 *6.09
Note: The value marked with “*” represents the average of all observed scores
Table 5: Mean Observed Scores for Graphic Scales with No AnchorsDim. 1 Dim. 2 Dim. 3 Dim. 4 Dim. 5 Dim. 6 Ratee
AverageRatee 1 6.33 4.94 6.86 5.95 7.11 4.34 5.92
Ratee 2 4.03 3.65 6.73 5.43 3.97 3.80 4.60Ratee 3 6.42 6.93 5.15 2.45 6.96 5.63 5.59

26
Ratee 4 7.37 5.65 6.47 6.54 5.30 7.69 6.50Ratee 5 4.30 5.19 6.03 2.89 2.90 4.53 4.31Ratee 6 7.07 3.97 4.64 7.99 7.17 2.81 5.61Ratee 7 7.26 6.65 6.87 6.91 6.58 5.56 6.64Ratee 8 3.63 4.04 4.21 3.12 6.11 3.18 4.05Ratee 9 6.58 5.06 4.32 7.14 4.60 4.71 5.40Ratee 10 8.22 8.04 8.24 8.43 8.16 8.29 8.23Dim.Average
6.12 5.41 5.95 5.69 5.89 5.05 *5.69
Note: The value marked with “*” represents the average of all observed scores
Table 6: Correlations Among Performance DimensionsDim. 1 Dim. 2 Dim. 3 Dim. 4 Dim. 5 Dim. 6
Dim. 1 1.00Dim. 2 .514 1.00Dim. 3 .312 .378 1.00Dim. 4 .573 .238 .313 1.00Dim. 5 .478 .302 .214 .395 1.00Dim. 6 .504 .592 .416 .319 .276 1.00Note: All correlations are significant at the 0.05 level
Regression equations were used to test the effects of rating format on the variousmeasures of rating accuracy. The “model summary” for each of these regressionequations was examined for all four measures of accuracy. They revealed the overalleffect that rating format has on the various measures of rating accuracy (see Tables 7 and8). For the effects of rating format on the various measures of rating accuracy, elevationhad an R-square of .137, differential elevation had an R-square of .011, stereotypeaccuracy had an R-square of .099, and differential accuracy had an R-square of .007 (seeTable 7). Table 8 presents descriptive statistics for the various measures of accuracy foreach of the three rating formats.
Table 7: Analysis of Rating Format’s Effect on Measures of AccuracyType ofAccuracy
R-Square MS BetweenGroups
MS WithinGroups
F-value Prob > F
Elevation .137 3.892 .494 7.881 .001DifferentialElevation
.011 110.54 71.73 1.541 2.19
StereotypeAccuracy
.099 13.43 2.47 5.445 .006
DifferentialAccuracy
.007 1373.52 4027.61 .341 .712

27
Table 8: Analysis of Rating Format’s Effects on Measures of AccuracyType of Accuracy Format N Mean Standard DeviationElevation 1 35 .401 .341
2 33 .756 .5533 34 .429 .320
Differential Elevation 1 35 .875 .3512 33 1.023 .3683 34 .869 .299
Stereotype Accuracy 1 35 .862 .1642 33 .743 .1773 34 .758 .152
Differential Accuracy 1 35 .288 .2882 33 .206 .2063 34 .226 .226
Note: Format1 = BARS, Format 2 = GRS with Numerical Anchors, Format 3 = GRS withNo Anchors
The hypotheses predicted that certain rating formats would yield higher measuresof accuracy than others would. The first hypothesis was that graphic scales with noanchors would be more accurate than graphic scales with numerical anchors. A series ofdummy-coded regression equations were used to test if there were significant meandifferences in the four measures of rating accuracy between the two rating formats.Table 9 provides a comparison of the two formats. For the elevation measure ofaccuracy, graphic rating scales with no anchors were significantly more accurate thangraphic rating scales with numerical anchors, t (65) = 3.228, p < .05. I followed Cohen’s(1992) guidelines for computing effect sizes for the comparisons of independent means.The effect size for the elevation measure of this comparison was .742. For differentialelevation, graphic scales with no anchors were also significantly more accurate thangraphic scales with numerical anchors, t (65) = 1.843, p < .05. The comparison yieldeda small to medium effect of .445. In addition, there were no significant mean differencespresent either for measures of stereotype accuracy, t (65) = .378, p > .05, or for measuresof differential accuracy, t (65) = .231, p > .05. The effect for stereotype accuracy was.089 , and the effect for differential accuracy was very small, .057. Since graphic scaleswith no anchors were more accurate than graphic scales with numerical anchors only forelevation and for differential elevation, hypothesis 1 was only partially supported.
Table 9: A Comparison of GRS with No Anchors to GRS with Numerical AnchorsAccuracy Measure at-value Effect SizeElevation *3.228 .742Differential Elevation *1.843 .445Stereotype Accuracy .378 .089Differential Accuracy .231 .057Note. N=67aAll hypotheses tested using one-tailed tests of significance*p < .05

28
Hypothesis 2 stated that graphic scales with no anchors would yield higher levelsof accuracy than BARS. Dummy-coded regression equations were employed to test thishypothesis also. A comparison of the two formats can be found in Table 10. Nosignificant mean differences in elevation were found between the two different ratingformats, t (67) = .278, p > .05. The effect size for the comparison was very small, .063.Also, for measures of differential elevation, there were no significant mean differences, t(67) = .070, p > .05. Only a small effect of .017 was present for differential elevation.Analysis revealed that graphic scales with no anchors did result in higher levels ofstereotype accuracy than BARS, t (67) = 2.628, p < .05. The effect of .607 was ofmedium to large size. However, there were no differences between the formats formeasures of differential accuracy, t (67) = .68, p > .05, and the effect size was a small.165. Since graphic scales with no anchors were more accurate than BARS only forstereotype accuracy, hypothesis 2 was only partially supported.
Table 10: A Comparison of GRS with No Anchors to BARSAccuracy Measure at-value Effect SizeElevation .278 .063Differential Elevation .070 .017Stereotype Accuracy *2.628 .607Differential Accuracy .680 .165Note. N=69aAll hypotheses tested using one-tailed tests of significance*p < .05
Hypothesis 3 predicted that graphic scales with numerical anchors would be moreaccurate than BARS. As seen in Table 11, subjects using graphic scales with numericalanchors were more accurate, as measured by elevation, than ratings obtained usingBARS, t (66) = 3.526, p < .05. There was a large effect size of .805 for elevation. Formeasures of stereotype accuracy, graphic scales with numerical anchors were moreaccurate than BARS, t (66) = 2.989, p < .05. Also, there was a medium to large effect of.701. However, BARS were more accurate than graphic scales with numerical anchorswhen measuring differential elevation, t (66) = 1.787, p < .05. For differential elevation,there was a medium-sized effect of .429. Although graphic scales with numericalanchors were more accurate than BARS according to measures of differential accuracy,the differences were not significant, t = .442, p > .05. Differential accuracy had only asmall effect size of .108. Although graphic scales were slightly more accurate thanBARS for differential accuracy, graphic scales were significantly more accurate only formeasures of stereotype accuracy. Therefore, hypothesis 3 was only partially supported.
Table 11: A Comparison of GRS with Numerical Anchors to BARSAccuracy Measure at-value Effect SizeElevation *3.526 .805Differential Elevation *1.787 .429

29
Stereotype Accuracy *2.989 .701Differential Accuracy .442 .108Note. N=68aAll hypotheses tested using one-tailed tests of significance*p < .05
In order to test hypothesis 4, interrater reliability estimates were calculatedseparately for each rating format. Within each format, pairwise comparisons were madebetween each subject’s responses and the responses of all of the other subjects. Each ofthese pairwise comparisons yielded a correlation representing the reliability between thetwo subjects for the rendered performance judgements. The average of these correlationsyielded a measure of interrater reliability for each rating format. Descriptive statistics forthe reliability estimates can be found in Table 12. Subjects using the BARS had anaverage reliability of .4934 with a standard deviation of .1498. Graphic scales withnumerical anchors yielded a reliability of .5378 and a standard deviation of .1369.Subjects using graphic scales with no anchors had the highest level of interrater reliabilitywith .6071 and a standard deviation of .1018. As predicted in hypothesis 4, graphicscales with no anchors were more reliable than both of the other rating formats. Inaddition to being more reliable, graphic scales with no anchors also had the lowestamount of variability in the distribution of correlations.
Table 12: Comparisons of Interrater Reliability EstimatesMean SD Range Skewness
GRS w/ No Anchors .6071 .1018 .76 -.258GRS w/ Numerical Anchors .5378 .1369 .68 -.300BARS .4934 .1497 .84 -.432
I also conducted analyses on the follow-up questions (see Appendix D). Ananalysis of variance was performed on all of the follow-up measures to determine ifrating format affected the way in which subjects responded. The results for the tests ofsignificance can be found in Table 13, and the means and standard deviations are locatedin Table 14.
Table 13: Analysis of Rating Format’s Effect on Follow-up QuestionsQuestion MS Between Groups MS Within Groups F-value Prob > F1 10.416 2.343 4.446 .0142 6.060 2.147 2.823 .0643 5.591 2.178 2.576 .0824 16.964 2.770 6.123 .0035 2.411 1.593 1.513 .2256 4.263 2.978 1.431 .244

30
Table 14: Statistics for Follow-up Questions Based on Rating FormatQuestion Format N Mean SD1 1 35 4.43 1.63
2 33 5.30 1.383 34 5.44 1.56
2 1 35 4.86 1.592 33 5.61 1.393 34 5.56 1.40
3 1 35 4.40 1.742 33 5.15 1.353 34 5.03 1.29
4 1 35 4.11 1.832 33 5.30 1.573 34 5.35 1.57
5 1 35 5.77 1.592 33 6.18 1.073 34 6.26 1.02
6 1 35 3.86 1.732 33 4.42 1.793 34 4.50 1.66
Note: Format 1 = BARS, Format 2 = GRS w/ no anchors, Format 3 = GRS w/ numerical anchors
According to the analysis, format had a significant main effect on howcomfortable the subjects felt using the rating scale, F (2, 99) = 4.446, p < .05. ABonferroni’s test was used post hoc to determine if there were significant meandifferences between the different formats. Table 15 illustrates the comparisons of meanscores on question one for each of the rating formats. There were no significantdifferences between the means for BARS vs. GRS with numerical anchors or for GRSwith no anchors vs. GRS with numerical anchors. However, subjects reportedsignificantly greater liking for the GRS with no anchors compared to the BARS.
Table 15: Comparisons of Mean Responses for Follow-up Questions w/ Sig. EffectsFormat (I) Format (J) Mean Difference (I-J) Std. Error Prob > F
Question1 1 2 -.87 .371 .0621 3 -1.01 .369 .0212 3 -.14 .374 1.00
Question 4 1 2 -1.19 .404 .0121 3 -1.24 .401 .0082 3 -.0499 .407 .407
Note: Format 1 = BARS, Format 2 = GRS w/ numerical anchors, Format 3 = GRS w/ no anchors

31
Analysis of variance was also conducted to reveal that format does not have asignificant main effect on question two, F (2, 99) = 2.823, p > .05, the subject’sassessment of how clearly the scenarios describe teaching behavior. Since there was nomain effect, no post-hoc tests were performed on the data.
Question three measured the extent to which the subjects felt the scale they usedallowed and accurate assessment of the teachers’ performance. Analysis of variancerevealed that there is no significant main effect of rating format on the results of questionthree, F (2, 99) = 2.567, p > .05.
In question four, subjects were asked how well they liked the scale they usedcompared with others they used in the past. Analysis of variance demonstrated that therewas a significant main effect in question four due to rating format, F (2, 99) = 6.123,p < .05. A Bonferroni’s test was performed post hoc to test for significant meandifferences in response based on rating format. Table 15 illustrates the comparisons ofmean scores for each of the rating formats. Subjects significantly preferred both the GRSwith numerical anchors and the GRS with no anchors to the BARS. There were nosignificant mean differences in preference between the GRS with numerical anchors andthe GRS with no anchors.
The next question, question five, measured how true to life the subject felt theteaching scenarios were. The ANOVA showed that there was no main effect of ratingformat on responses to question five, F (2, 99) = 1.513, p > .05.
The final question measured the extent to which the subjects felt they had enoughinformation to make an accurate judgement about the teachers’ levels of performance.Analysis revealed no significant main effects of format on responses to the question, F (2,99) = 1.431.

32
CHAPTER 6: DISCUSSION
The results of this study provide partial support for the hypotheses presented.Three of the four measures of accuracy had a significant portion of their varianceattributable to format effects. For elevation and differential elevation, graphic ratingscales with no anchors were superior to graphic rating scales with numerical anchors,providing support for hypothesis one. For stereotype accuracy, graphic scales of bothtypes were superior to BARS. This provides partial support for hypotheses 2 and 3.Hypothesis 4 concerning interrater reliability was supported in that those using graphicrating scales without anchors provided more reliable evaluations.
In general, the results indicate that format potentially affects rating accuracy. Forboth differential elevation and differential accuracy, format does not predict a significantamount of variance in ratings. However, rating format accounts for 14% of the variancein elevation and 10% of the variance in stereotype accuracy. Although there is a largeportion of variance for both of these measures of accuracy that is not accounted for byrating format, these results should not be overlooked. There are numerous factors thatcan affect the assignment of performance ratings to a ratee. For one variable to accountfor 10 or 14 percent of the variance is an important finding. Taken as a whole, the resultsshow that rating format can affect the reliability and accuracy of performance ratings.
Earlier in the paper, it was noted that more specific anchors might bias the raterand prevent accurate ratings. Murphy and Constans (1987) noted that anchors can biasratings if a ratee exhibited a specific behavior that was anchored in the scale, but this onebehavior was not altogether indicative of the ratees overall performance. Their argumentwas on a very specific level. However, this paper extended their work and tested thepossibility of anchor bias on a more general level. Specifically, previous research(Murphy & Constans, 1987) indicated that behavioral anchors could negatively affect theaccuracy of performance ratings. Our study provided mixed results for this idea. Formost accuracy measures, BARS did not produce a lowered level of rating accuracy. Yet,for stereotype accuracy, subjects using the BARS generated less accurate ratings.
Stereotype accuracy collapses across ratees to assess how a rater rates on eachdimension. It is possible that the specific nature of the behavioral anchors provided moreinformation about the performance dimension than was needed by the rater. This maycause the confusion to which Murphy & Constans (1987) refer. The specific nature ofthe anchor provides the rater with more information than is necessary to make an accuratejudge about ratees’ levels of performance on each dimension. This idea is not new.Barrett et al. (1958) noted that too much information could be contained in scale anchors.
The idea that BARS results in lower stereotype accuracy provides even moresupport for Murphy and Constans (1987) because stereotype accuracy collapses acrossratees, it indicates how accurately a raters judge each dimension. The results indicate thatraters, in general, have a tougher time of rating accurately on a dimension when usingBARS than when using the other types of scales. The more specific anchors appear tolead to more difficulty in correctly interpreting the nature of the performance dimensions.

33
This is the basic argument that Murphy & Constans (1987) made. Behavioral anchorscan have a biasing effect on performance ratings and, possibly, lead to more inaccurateratings.
The results for elevation measures of accuracy are more difficult to explain.Graphic scales with no anchors yielded more accurate ratings than graphic scales withnumerical anchors. At first blush, this appears to fall directly in line with our hypothesesand support Murphy & Constans’ (1987) idea that more specific anchors can have abiasing effect and, possibly, lead to decreased measures of accuracy. However, analysisalso showed that BARS had higher levels of accuracy, as measured by elevation, than didgraphic scales with numerical anchors. Murphy & Constans’ explanation clearly doesnot work here. Perhaps a suitable explanation can come from previous rating formatresearch. Elevation is simply a comparison of the mean of observed scores to the meanof the true scores. It essentially gives a measure of how lenient/severe a rater iscompared to the true score. Previous research (Borman & Dunnette, 1975; Campbell etal., 1973; Kingstrom & Bass, 1981) has noted that BARS can result in lowered levels ofleniency error compared to graphic rating scales. This could explain why the BARS inthis study resulted in higher accuracy measures of elevation compared to the graphicscales with numerical anchors. The superiority of BARS over graphical scales with noanchors could be due to a different reason, however. Previous research has clearlydocumented the reluctance of raters assigning low numbers for performance ratings.BARS may contain enough specific behavioral information within the scales that ratersmatch observed behavior with the anchors in the scales. In this way, the BARS mayprevent lenient ratings. However, graphics scales with no anchors provide so littleinformation and feedback to raters, they might not feel as if they are assigning lowratings. These combined factors could have led to the superiority of BARS over graphicscales with no anchors.
The results for measures of differential elevation are quite interesting as well.BARS were significantly more accurate than graphic scales with numerical anchors. Thiscould be due to the nature of the behavioral anchors. They could provide enoughinformation so that raters avoid their tendency to be lenient with their ratings and to notdistinguish among the ratees’ performance levels. However, the raters using graphicscales with numerical anchors fall prey to the well-documented tendency to be lenientwith their performance evaluations and to not distinguish between ratees and their levelsof performance. In contrast, graphic scales with no anchors were also superior to graphicscales with numerical anchors but for a slightly different reason. It’s possible that thegraphic scales with no anchors removes the rating tendency to use high numbers and torate leniently. The removal of this bias would lead to greater distinction among theperformance of the ratees compared to the graphic scales with numerical anchors. This,in turn, could have led to the increased level of differential elevation accuracy in graphicscales with no anchors compared to those with numerical anchors.
The interrater reliability hypothesis proposed was supported in that graphic scaleswith no anchors were more reliable than BARS and also more reliable than graphic scaleswith numerical anchors. In addition to increased reliability for subjects using graphic

34
scales with no anchors, there was also a lower standard deviation. Figures 1, 2, 3, and 4provide a graphic representation for the reliability results. As indicated by the frequencydistributions, not only does the mean of the reliability scores increase, but the “tightness”of the plot increases as well. This is indicative of more scores residing closer to the mean(i.e., a lower standard deviation). A reliability estimate of .6071 for graphic scales withno anchors is quite an interesting finding. Viswesvaran, Ones, & Schmidt (1996)conducted a meta-analysis on reliability estimates in performance appraisals. They foundthat reliabilities range from .50-.54. Based on these numbers, the findings of this studylend support to the idea that the graphic scale with no anchors can be a more reliable wayto measure performance than traditionally seen.
V a lu e o f C o rre la t io n s
.8 0 0.7 5 0
.7 0 0.6 5 0
.6 0 0.5 5 0
. 5 0 0.4 5 0
.4 0 0. 3 5 0
.3 0 0.2 5 0
. 2 0 0.1 5 0
.1 0 0.0 5 0
0 .0 0 0
F ig u r e 1
R e lia b il i t y f o r B A R S
Num
ber
of C
orre
latio
ns
5 0
4 0
3 0
2 0
1 0
0
V a lu e o f C o rre la t io n s
.8 2 5.7 7 5
. 7 2 5.6 7 5
.6 2 5. 5 7 5
.5 2 5.4 7 5
. 4 2 5.3 7 5
.3 2 5. 2 7 5
.2 2 5.1 7 5
. 1 2 5.0 7 5
.0 2 5
F ig u r e 2
R e lia b il i t y f o r G R S w / N u m e r ic a l A n c h o r s
Num
ber
of C
orre
latio
ns
5 0
4 0
3 0
2 0
1 0
0

35
At this point, we must be careful with any conclusions we make. It wasmentioned earlier in this paper that this study was not a comparison of rating formats. Itwould be unfair to make conclusions about the effectiveness of BARS or graphic ratingscales since these rating formats are not, traditionally, continuous rating scales. Rather,since all scales were continuous, this study was more a comparison of anchor specificity.Based on the results of this study, one could conclude that anchor specificity caninfluence measures of rating accuracy, but more specific anchors do not necessarily leadto more accurate performance ratings. It could be possible to then extend ageneralization to the traditional forms of the various rating scales. One could draw theconclusion that, based on the data presented here, rating format affect measures of ratingaccuracy with the caveat that this study modified the “traditional” versions of these ratingscales.
The data collected in this study do offer some support for the idea that ratingformat affects measures of rating accuracy. There was a general pattern to the data thatsuggested that graphic scales with no anchors might be valuable for evaluatingperformance. For differential elevation and differential accuracy, graphic scales with noanchors were the most accurate method of rating. For elevation and stereotype accuracy,they were the second most accurate. Also, graphic scales with no anchors proved to havethe highest measures of interrater reliability of the three rating formats. The reliabilityestimates were also higher than the “average” range established by previous research(Viswesvaran et al., 1996). In addition, the graphic scales with no anchors formatreceived good ratings on the follow-up questions. Subjects liked the graphic scaleswithout anchors just as much as the graphic scales with numerical anchors andsignificantly more than the BARS. Also, subjects felt significantly more comfortableusing the graphic scales with no anchors than both of the other formats. This is quite aninteresting finding given the lack of exposure subjects have had to this particular ratingformat. Taking all of these factors into consideration, a strong case can be made for theuse of graphic scales with no anchors for computer-based performance appraisal systems.
V a lu e o f C o rre la t io n s
1 . 0 0. 9 0
. 8 0. 7 0
. 6 0. 5 0
. 4 0. 3 0
. 2 0. 1 0
0 . 0 0
F ig u r e 3
R e lia b il i t y f o r G R S w / N o A n c h o r sN
umbe
r of
Cor
rela
tions
1 2 0
1 0 0
8 0
6 0
4 0
2 0
0

36
Conclusions
Clearly, the data showed that graphic scales with no anchors could be apotentially valuable tool for accurately and appropriately evaluating employeeperformance. However, it would be a mistake to draw a definite conclusion about ratingformat’s effect on accuracy on the basis of one study. As previously mentioned, thisstudy is delving into an old line of research but with a different perspective. There arefew, if any, studies in the literature that examine effects of rating format on ratingaccuracy. Subsequent research should also investigate this problem but try to correct forsome of the limitations of this study.
The first limitation is the general problem of using college students, with littlevested interest, as raters. Of the different rating formats, the BARS is the most complexand hardest to use. As such, an interaction between the BARS complexity and the lowmotivation level of subjects may account for the findings that the BARS were lessaccurate than expected and that reaction to the BARS scale was the least favorable.
A second limitation with this study is the manner in which true scores forbehavioral incidents were operationalized. The behavioral incidents were developed inaccordance to the procedures outlined by Smith & Kendall (1963) and summarized byLandy & Barnes (1979). The values for the behavioral incidents were used as the “truescores” of performance. When assigning values to these incidents in the BARSdevelopment procedure, these incidents are treated as independent. They are evaluatedand assigned values by themselves. However, these single behavioral incidents werecombined with other incidents in order to construct a comprehensive scenario that givesan overall picture of a fictional ratee’s performance-related behaviors. These observedvalues of these single behavioral incidents could possibly be affected or influenced by thesurrounding behavioral incidents. Although this may have some affect on the findings,the dimensions were not correlated as highly as typically seen in performance appraisalresearch (See Table 6).
Another limitation drawback to this particular study is its simple design. Becausethis topic was one that has received little attention, this study was designed, purposely, tobe a simple analysis of the influence of rating format on accuracy. Subsequent researchshould continue to investigate the nature of the format/accuracy relationship (or the lackthereof), but taking into account more factors. This means investigating potentialmoderators and/or mediators of the relationship. It also means that, if format doesinfluence rating accuracy, we should strive to discover why and how the process occurs.
Previously in the paper, it was mentioned that we need to help raters to do a betterjob of rating. It was assumed that one step in this direction would be to provide raterswith continuous scales so they could discriminate between levels of performance asfinely as they desired. However, there was not a test of continuous vs. forced-choiceformats. This is an area that should demand attention of researchers. Primary difficultywith such a task is to allow a methodologically fair comparison of the two different types

37
of scales. True scores that lie between anchors, or integers, “stack the deck” in favor ofcontinuous scales because a rater using forced-choice scales could never match the truescore with the proper observed score. Similarly, true scores that fall on an anchor, orinteger, favor forced-choice formats. Because their choices are very limited, a rater usinga forced-choice scale has a much better chance of recording an observed score that iscongruent with the true score. However, this line of research is necessary and shoulddemand greater attention.
In conclusion, this study has revisited an old line of research with a newperspective. Examining accuracy based on rating format is not simply “old wine in a newbottle.” The effects of rating format have been largely unexplored. Current research(Day & Sulsky, 1995; Stamoulis & Hauenstein, 1993) is focusing on rating accuracy asthe most important facet of performance ratings. This study follows in the footsteps ofprevious work conducted on rating format. However, the focus on accuracy is novelapproach and should be continued in the literature. This study could serve as aspringboard for future research in the area of rating accuracy.
This study has moved research forward by fully integrating current technology.By using modern computers and programs, we can explore new and different methods ofrating, rating procedures, and the entire rating process. This study showed that it ispossible to integrate traditional rating methods, such as BARS and graphic rating scales,into a form that can be accessed with current technology. By using computer, we werealso able to measure performance ratings to a level of precision that has not been reachedbefore. This study serves as a benchmark for future research. Not only can computersmove research ahead and allow scientists to study performance appraisals as neverbefore, but they also allow huge gains in our ability to precisely, and accurately, measurevariables of interest.
It appears that performance appraisal research has come full circle. This studyfollows the footsteps of the multitude of research prior to 1980 that examined the effectof rating format on the quality of performance appraisals. However, unlike past research,this particular study seems to have generated some clear results. In line with Murphy andConstans’ (1987) argument, it appears that decreased anchor specificity can affect theaccuracy of performance evaluations. Also, since BARS had the lowest estimates ofreliability and graphic scales with no anchors had the highest, one could conclude thatdecreased anchor specificity can also affect interrater reliability of performanceevaluations. From the data gathered in this study, a strong case can be made for thefuture importance of graphic scales with no anchors in computer-based performanceevaluations.
One implication from conclusions drawn along these lines is that organizationscan benefit from simpler, less involved rating procedures. Follow-up questions one andfour assessed how well the subjects liked the rating scale compared to other scales theyhave used in the past and also how comfortable the subjects felt using their particularrating scale. Subjects using the BARS liked their format significantly less than didsubjects using either form of the graphic rating scales, and they felt significantly less

38
comfortable in using the BARS than they did using either of the graphic rating scales. Ifpeople feel more comfort and preference for simpler rating scales, organizations can savemillions of dollars per year in development and administration of performancemanagement systems.
Another implication of the data is that some other variables significantly affect themanner in which we rate performance. Previous rating format research has beenconducted investigating the influence of variables such as education and job experience(Cascio & Valenzi, 1977), purpose for appraisal (Bernardin & Orban, 1990), sex, andrace (Hamner, Kim, Lloyd, & Bigoness, 1974; Schmitt & Hill, 1977). However, thesestudies did not focus on measures of rating accuracy as the primary criterion to determinethe “quality” of the rating formats. These variables should all be re-examined with acritical eye on measures of rating accuracy.
In conclusion, Landy & Farr (1980) were wrong to call for a moratorium on ratingformat research. Instead, they should have requested a shift in the variable of interest.No longer are we, as a field, interested in halo, or leniency. Instead, we are concernedwith rating accuracy as measured by elevation, differential elevation, stereotypeaccuracy, and differential accuracy. The goal is to increase rating reliability andaccuracy. This study supports the idea that rating format can potentially affect the levelof rating accuracy. At this point, graphic rating scales without anchors appear to holdpromise for computer-based performance appraisals. They can potentially promoteincreased levels of rating accuracy in raters. They can also yield more reliable results. Inaddition, raters appear to like these simple scales and appear to be comfortable in usingthem. Until enough data is accumulated to draw these conclusions, however, the effectsof rating format on the various measures of rating accuracy should occupy a large andimportant place in the literature.

39
Appendix A
BARS Scales
InstructionsGiven below are the instructions received by the subjects placed into the
experimental group that rated performance using BARS scales. Please note that the scalewas presented horizontally instead of vertically. Also, the behavioral anchors are notplaced along side the scale as they were in the experimental condition. Rather, theanchors and their corresponding values are, instead, listed below the scale. Both of thesedifferences are intended to conserve space in the Appendix.
Thank you for your participation in this experiment. Your involvement inthis project is critical to its success. This entire project will be completed on thiscomputer. However, if at any time you have questions, please feel free to ask theexperimenter. Your task is as follows: you will be presented with a series of 10vignettes, or scenarios, that depict a list of behaviors that a specific teacherexhibits in the classroom. Following each behavioral list is a series of 6questions. The questions will measure how effective you thought that particularteacher was in a specific area, or dimension, of teaching performance. Forexample, read the sample behavioral list below:
Teacher X is a math teacher here at Virginia Tech.Regardless of X’s personal conflicts and obligations, X is alwayspresent for class.Often times, X comes to class without the proper transparencies forthe overhead projector.On occasion, X has forgot to bring the lecture notes for the day.X has a tendency to speak in mean or overly harsh tones toward hisstudents.X often has difficulty explaining concepts to the class in terms thatthe students can easily understand and relate to.Even though X teaches a math class, X rarely reviews how toachieve the correct answers on homework problems.
If this was a real vignette instead of one for practice, you would then answer a setof questions that ask you rate X’s effectiveness on a particular dimension ofteaching performance. Take, for example, the following question:
On a scale of 1-9, how would you rate X’s teaching performance inthe area of classroom organization and preparation?
1 2 3 4 5 6 7 8 9

40
anchors: 2.11—teacher repeatedly forgets to bring necessarymaterials to class; 3.89—teacher deviates from preciously plannedactivity; 7.68—teacher arrives on-time for class
To answer this question, you would consider the information presented in thevignette about X’s teaching behaviors that are involved with classroomorganization and participation. You would then move the mouse and clickanywhere on the response line that best represents your evaluation of X’sperformance in the area of classroom organization and performance. A set ofsample behaviors and their values are placed next to the answer line. The valuesassociated with each behavior represent the correct, or ”true” score. Thesebehavioral anchors serve as a comparison, or guide, when making your evaluationabout the behaviors illustrated in the scenario. Remember, you can answeranywhere along the answer line you see fit, and your answers are not restricted toonly the anchors. A valid response can be given at any point between any of theanchors. Please note that “1” represents the lowest value of teaching performanceand “9” represents the highest teaching rating.
You would then proceed to the next question that asks for your judgementabout a different dimension of teaching performance. Answer all six questionsabout a particular teacher, and then please proceed to the next teaching vignettethat contains a behavioral list of a different teacher. Please note that whileevaluating a specific teacher, you can change your ratings for each teachingdimension as many times as you wish. However, once you proceed to the nextbehavioral list, you cannot return to a previous behavioral list to change youranswers.
You will read each behavioral list and answer each of the 6 questionsabout that particular teacher. Then, proceed to the following behavioral list anddo the same. Continue in this manner until all six questions have been answeredfor each of the 10 vignettes. At the end, there will be some questions for you toanswer about this experiment. Once all of those questions are answered, thecomputer will inform you that the experiment is over. At that time, please notifythe experimenter. If you have any questions about any part of this experiment,please ask the experimenter before proceeding. Should any questions arisethroughout the course of the experiment, please feel free to ask the experimenterfor assistance. At this time, please proceed to the first scenario.
Sample VignetteBelow, a sample vignette is given. Space prevents inclusion of all ten vignettes
from the appraisal instrument, so only one is included. In this manner, the reader can stillget a sense of the instrument used. The entire appraisal instrument can be obtained uponrequest. In this sample, the behavioral list, or vignette, is followed by the questionsregarding performance on the separate performance dimensions and by the scale torespond to each question. To conserve space in the appendix, the scales are presentedhorizontally rather than vertically. Also, the behavioral anchors and their respectivevalues are listed below the scale rather than placed in their proper place next to the scalecontinuum. Again, this was to conserve space for the appendix.

41
Behavior list for teacher “A”• “A’s” class is rather large. However, “A” always has the students’ tests gradedand returned to the students within a week of taking the exam.• Before every exam, “A” prepares a study guide that outlines the relevantmaterial for the test.• “A” is very knowledgeable about the current literature that pertains to the classand is able to answer questions about the material.• “A” sometimes forgets lecture notes and has to “wing it” in class lectures.• “A” speaks very quickly, making it difficult for students to keep pace whiletaking notes.• “A” often arrives late for class but expects the students to stay late after class.
On a scale of 1 to 9, how would you rate A’s performance in the area ofteacher dedication?
1 2 3 4 5 6 7 8 9anchors:1.64—teacher is frequently late to class and occasionally misses classwith no previous warning; 6.39—teacher informs students about their personalresearch interests; 7.68—even though the class is large, teacher tries to learn allstudents’ names so as to make the class more personal
On a scale of 1 to 9, how would you rate A’s performance in the area ofclassroom organization and preparation?
1 2 3 4 5 6 7 8 9anchors: 2.11—teacher repeatedly forgets to bring necessary materials to class;3.89—teacher deviates from preciously planned class activity; 7.68—teacherarrives on-time for class
On a scale of 1 to 9, how would you rate A’s performance in the area of teacherexpertise?
1 2 3 4 5 6 7 8 9anchors: 2.25—teacher has difficulty understanding the students’questions and has difficulty answering them in class; 7.86—teacherperforms experiments with the students in class to illustrate points; 8.39—teacher is well-versed and up to date on current research and literature thatrelates to the class
On a scale of 1 to 9, how would you rate A’s performance in the area ofcourtesy and respect for students?
1 2 3 4 5 6 7 8 9anchors: 1.21—teacher makes fun of a student’s appearance in front of the class;3.57—regardless of the excuse, teacher will not accept late papers/ assignments;

42
7.00—teacher praises students for class participation regardless of the quality ofthe comments
On a scale of 1 to 9, how would you rate A’s performance in the area ofadequately preparing students for exams?
1 2 3 4 5 6 7 8 9anchors:1.43—teacher designs the test to be so tough that teacher cannotadequately explain the rationale behind the correct test answers; 2.71—teacher has several trick questions on tests: there seem to be multiplecorrect answers on one question; 8.25—teacher conducts a review sessiona few days before the test
On a scale of 1 to 9, how would you rate A’s performance in the area ofclassroom delivery and presentation?
1 2 3 4 5 6 7 8 9anchors: 1.70—while lecturing, the teacher tolerates extraneousconversations among the students in class which, in turn, contributes to theoverall noise level in class, making it difficult to hear the teacher; 6.82—teacher always dresses “professionally” for class; 8.07—teacher uses real-life examples to clarify a point

43
Appendix B
Graphic Scales with Numerical Anchors
InstructionsBelow are the instructions given to the subjects who were assigned to the
experimental condition where ratings were made using a graphic scale with numericalanchors.
Thank you for your participation in this experiment. Your involvement inthis project is critical to its success. This entire project will be completed on thiscomputer. However, if at any time you have questions, please feel free to ask theexperimenter. Your task is as follows: you will be presented with a series of 10vignettes, or scenarios, that depict a list of behaviors that a specific teacherexhibits in the classroom. Following each behavioral list is a series of 6questions. The questions will measure how effective you thought that particularteacher was in a specific area, or dimension, of teaching performance. Forexample, read the sample behavioral list below:
Teacher X is a math teacher here at Virginia Tech.Regardless of X’s personal conflicts and obligations, X is alwayspresent for class.Often times, X comes to class without the proper transparencies forthe overhead projector.On occasion, X has forgot to bring the lecture notes for the day.X has a tendency to speak in mean or overly harsh tones toward hisstudents.X often has difficulty explaining concepts to the class in terms thatthe students can easily understand and relate to.Even though X teaches a math class, X rarely reviews how toachieve the correct answers on homework problems.
If this was a real vignette instead of one for practice, you would then answer a setof questions that ask you rate X’s effectiveness on a particular dimension ofteaching performance. Take, for example, the following question:
How would you rate X’s teaching performance in the area of classroomorganization and preparation?
1 2 3 4 5 6 7 8 9
To answer this question, you would consider the information presented in thevignette about X’s teaching behaviors that are involved with classroomorganization and participation. You would then move the mouse and clickanywhere on the response line that best represents your evaluation of X’sperformance in the area of classroom organization and performance. You can

44
refer to the numbers as guides, or anchors, but your answers are not restricted toonly the anchors. A valid response can be given at any point between any of theanchors. Please note that “1” represents the lowest value of teaching performanceand “9” represents the highest teaching rating.
You would then proceed to the next question that asks for your judgementabout a different dimension of teaching performance. Answer all six questionsabout a particular teacher, and then please proceed to the next teaching vignettethat contains a behavioral list of a different teacher. Please note that whileevaluating a specific teacher, you can change your ratings for each teachingdimension as many times as you wish. However, once you proceed to the nextbehavioral list, you cannot return to a previous behavioral list to change youranswers.
You will read each behavioral list and answer each of the 6 questionsabout that particular teacher. Then, proceed to the following behavioral list anddo the same. Continue in this manner until all six questions have been answeredfor each of the 10 vignettes. At the end, there will be some questions for you toanswer about this experiment. Once all of those questions are answered, thecomputer will inform you that the experiment is over. At that time, please notifythe experimenter. If you have any questions about any part of this experiment,please ask the experimenter before proceeding. Should any questions arisethroughout the course of the experiment, please feel free to ask the experimenterfor assistance. At this time, please proceed to the first scenario.
Sample VignetteBelow, a sample vignette is given. Space prevents inclusion of all ten vignettes
from the appraisal instrument, so only one is included. In this manner, the reader can stillget a sense of the instrument used. The entire appraisal instrument can be obtained uponrequest. In this sample, the behavioral list, or vignette, is followed by the questionsregarding performance on the separate performance dimensions and by the scale torespond to each question.
Behavior list for teacher “A”• “A’s” class is rather large. However, “A” always has the students’ testsgraded and returned to the students within a week of taking the exam.• Before every exam, “A” prepares a study guide that outlines the relevantmaterial for the test.• “A” is very knowledgeable about the current literature that pertains to theclass and is able to answer questions about the material.• “A” sometimes forgets lecture notes and has to “wing it” in class lectures.• “A” speaks very quickly, making it difficult for students to keep pace whiletaking notes.• “A” often arrives late for class but expects the students to stay late after class.
On a scale of 1 to 9, how would you rate A’s performance in the area ofteacher dedication?
1 2 3 4 5 6 7 8 9

45
On a scale of 1 to 9, how would you rate A’s performance in the area ofclassroom organization and preparation?
1 2 3 4 5 6 7 8 9
On a scale of 1 to 9, how would you rate A’s performance in the area of teacherexpertise?
1 2 3 4 5 6 7 8 9
On a scale of 1 to 9, how would you rate A’s performance in the area ofcourtesy and respect for students?
1 2 3 4 5 6 7 8 9
On a scale of 1 to 9, how would you rate A’s performance in the area ofadequately preparing students for exams?
1 2 3 4 5 6 7 8 9
On a scale of 1 to 9, how would you rate A’s performance in the area ofclassroom delivery and presentation?
1 2 3 4 5 6 7 8 9

46
Appendix C
Graphic Scales Without Anchors
Instructions
Below are the instructions given to the subjects who were assigned to theexperimental condition where ratings were made using a graphic scale without anchors.
Thank you for your participation in this experiment. Your involvement inthis project is critical to its success. This entire project will be completed on thiscomputer. However, if at any time you have questions, please feel free to ask theexperimenter. Your task is as follows: you will be presented with a series of 10vignettes, or scenarios, that depict a list of behaviors that a specific teacherexhibits in the classroom. Following each behavioral list is a series of 6questions. The questions will measure how effective you thought that particularteacher was in a specific area, or dimension, of teaching performance. Forexample, read the sample behavioral list below:
Teacher X is a math teacher here at Virginia Tech.Regardless of X’s personal conflicts and obligations, X is always presentfor class.Often times, X comes to class without the proper transparencies for theoverhead projector.On occasion, X has forgot to bring the lecture notes for the day.X has a tendency to speak in mean or overly harsh tones toward hisstudents.X often has difficulty explaining concepts to the class in terms that thestudents can easily understand and relate to.Even though X teaches a math class, X rarely reviews how to achieve thecorrect answers on homework problems.
If this was a real vignette instead of one for practice, you would then answer a setof questions that ask you rate X’s effectiveness on a particular dimension ofteaching performance. Take, for example, the following question:
How would you rate X’s teaching performance in the area of classroomorganization and preparation?
Low High
To answer this question, you would consider the information presented in thevignette about X’s teaching behaviors that are involved with classroomorganization and participation. You would then move the mouse and clickanywhere on the response line that best represents your evaluation of X’s

47
performance in the area of classroom organization and performance. A validresponse can be given at any point along the line. Please note that the extremeleft end of the scale represents the lowest value of teaching performance and theextreme right end of the scale represents the highest teaching rating. There are noanchors or guides to assist you in your judgement. Simply realize that the betterthe level of performance is, the farther right you should mark on the scale.Likewise, the poorer the level of performance, the farther left you should rateperformance on the scale.
You would then proceed to the next question that asks for your judgementabout a different dimension of teaching performance. Answer all six questionsabout a particular teacher, and then please proceed to the next teaching vignettethat contains a behavioral list of a different teacher. Please note that whileevaluating a specific teacher, you can change your ratings for each teachingdimension as many times as you wish. However, once you proceed to the nextbehavioral list, you cannot return to a previous behavioral list to change youranswers.
You will read each behavioral list and answer each of the 6 questionsabout that particular teacher. Then, proceed to the following behavioral list anddo the same. Continue in this manner until all six questions have been answeredfor each of the 10 vignettes. At the end, there will be some questions for you toanswer about this experiment. Once all of those questions are answered, thecomputer will inform you that the experiment is over. At that time, please notifythe experimenter. If you have any questions about any part of this experiment,please ask the experimenter before proceeding. Should any questions arisethroughout the course of the experiment, please feel free to ask the experimenterfor assistance. At this time, please proceed to the first scenario.
Sample VignetteBelow, a sample vignette is given. Space prevents inclusion of all ten vignettes
from the appraisal instrument, so only one is included. In this manner, the reader can stillget a sense of the instrument used. The entire appraisal instrument can be obtained uponrequest. In this sample, the behavioral list, or vignette, is followed by the questionsregarding performance on the separate performance dimensions and by the scale torespond to each question.
Behavior list for teacher “A”• “A’s” class is rather large. However, “A” always has the students’ testsgraded and returned to the students within a week of taking the exam.• Before every exam, “A” prepares a study guide that outlines the relevantmaterial for the test.• “A” is very knowledgeable about the current literature that pertains to theclass and is able to answer questions about the material.• “A” sometimes forgets lecture notes and has to “wing it” in class lectures.• “A” speaks very quickly, making it difficult for students to keep pace whiletaking notes.• “A” often arrives late for class but expects the students to stay late after class.

48
How would you rate A’s performance in the area of teacher dedication?
Low High
How would you rate A’s performance in the area of classroom organization andpreparation?
Low High
How would you rate A’s performance in the area of teacher expertise?
Low High
How would you rate A’s performance in the area of courtesy and respectfor students?
Low High
How would you rate A’s performance in the area of adequately preparing studentsfor exams?
Low High
How would you rate A’s performance in the area of classroom deliveryand presentation?
Low High

49
Appendix D
Follow-up Questions
Listed below are the six questions that are presented to the subjects following thelast vignette. These questions simply assess the subjects’ reactions to the vignettes andthe different rating formats. All questions are likert-type answers ranging from one toseven.
1. To what extent did you feel comfortable with the scales used to evaluatethe performance of the teachers?
1 2 3 4 5 6 7
2. To what extent do you think the scenarios were clear in their descriptionof the teachers’ behaviors?
1 2 3 4 5 6 7
3. To what extend did you feel that the scales allowed an accurate assessmentof the teachers’ different dimensions of teaching performance?
1 2 3 4 5 6 7
4. To what extent did you like the scales compared with other scales youhave used to judge a person’s performance in the past (i.e., in-class teacherevaluations)?
1 2 3 4 5 6 7
5. How realistic, or “true to life,” do you feel the teaching scenarios were?In other words, to what extent do you think that these scenarios could have beenmodeled after real teachers here on campus?
1 2 3 4 5 6 7
6. To what extent do you feel you had enough information to make anaccurate judgement about the teachers on each of the six performancedimensions?
1 2 3 4 5 6 7

50
Bibliography
Balzer, W. K., & Sulsky, L. M. (1992). Halo and performance appraisal research:A critical examination. Journal of Applied Psychology, 77 (6), 975-985
Barrett, R. S., Taylor, E. K., Parker, J. W., & Martens, L. (1958). Rating scalecontent: I. Scales information and supervisory ratings. Personnel Psychology, 11, 333-346.
Bendig, A. W. (1952). A statistical report on a revision of the Miami instructorrating sheet. The Journal of Educational Psychology, 43, 423-429. (a)
Bendig, A. W. (1952). The use of student rating scales in the evaluation ofinstructors in introductory psychology. The Journal of Educational Psychology, 43, 167-175. (b)
Benjamin, R. (1952). A survey of 130 merit rating plans. Personnel, 29, 289-294.Bernardin, H. J., & Buckley, M. R. (1981). Strategies in rater training. Academy
of Management Review, 6 (2), 205-212.Bernardin, H. J., & Cascio, W. F. (1988). Performance appraisal and the law. In
R. Schuler & S. Youngblood (eds.), Readings in Personnel/Human Resources (pp. 248-252). St. Paul, MN: West Publishing.
Bernardin, H. J., & Orban, J. A. (1990). Leniency effect as a function of ratingformat, purpose of appraisal, and rater individual differences. Journal of Business andPsychology, 5 (2), 197-211.
Bernardin, H. J., & Pence, E. C. (1980). Effects of rater training: Creating newresponse sets and decreasing accuracy. Journal of Applied Psychology, 65 (1), 60-66.
Bernardin, H. J., & Smith, P. C. (1981). A clarification on some issues regardingthe development and use of behaviorally anchored rating scales (BARS). Journal ofApplied Psychology, 66 (4), 458-463.
Borman, W. C. (1979). Format and training effects on rating accuracy and ratererrors. Journal of Applied Psychology, 64 (4), 410-421.
Borman, W. C. (1986). Behavior-based rating scales. In R. A. Berk (ed.),Performance Assessment: Methods and Applications (pp. 100-120). Baltimore, MD:Johns Hopkins University Press.
Borman, W. C., & Dunnette, M. D. (1975). Behavior-based traits versus trait-oriented performance ratings: An empirical study. Journal of Applied Psychology, 60 (5),561-565.
Campbell, J. P., Dunnette, M. D., Arvey, R. D., & Hellervik, L. V. (1973). Thedevelopment and evaluation of behaviorally based rating scales. Journal of AppliedPsychology, 57 (1), 15-22.
Cascio, W. F. (1998). Applied Psychology in Human Resource Management.Upper Saddle River, NJ: Prentice Hall.
Cascio, W. F. & Valenzi, E. R. (1977). Behaviorally anchored rating scales:Effects of education and job experience of raters. Journal of Applied Psychology, 62 (3),278-282.
Chiu, C. K., & Alliger, G. M. (1990). A proposed method to combine ranking andgraphic rating in performance appraisal: The quantitative ranking scale. Educational andPsychological Measurement, 50, 493-503.

51
Cleveland, J. N., Murphy, K. R., & Williams, R. E. (1989). Multiple uses ofperformance appraisal and correlates. Journal of Applied Psychology, 74 (1), 130-135.
Coren, S., Porac, C., & Ward, L. M. (1979). Sensation and Perception. New York,NY: Academic Press.
Cronbach, L. J., (1955). Processes affecting scores on “understanding of others”and “assumed similarity.” Psychological Bulletin, 52, 177-193.
Day, D. V., & Sulsky, L. M. (1995). Effects of frame-of reference training andinformation configuration on memory organization and rating accuracy. Journal ofApplied Psychology, 80 (1), 158-167.
DeNisi, A. S., Cafferty, T. P., & Meglino, B. M. (1984) A cognitive view of theperformance appraisal process: A model and research propositions. OrganizationalBehavior and Human Performance, 33, 360-396.
DeVries, D. L., Morrison, A. M., Schullman, S. L., & Gerlach, M. L. (1986).Performance Appraisal on the Line. Greensboro, NC: Center for Creative Leadership.
Doverspike, D., Cellar, D. F., & Hajek, M. (1987). Relative sensitivity toperformance cue effectiveness as a criterion for comparing rating scale formats.Educational and Psychological Measurement, 47, 1135-1139.
Feldman, J. M. (1986). A note on the statistical correction of halo error. Journal ofApplied Psychology, 71 (1), 173-176.
Finn, R. H. (1972). Effects of some variations in rating scale characteristics on themeans and reliabilities of ratings. Educational and Psychological Measurement, 32, 255-265.
Ford, A. (1931). A Scientific Approach to Labor Problems. New York, NY:McGraw Hill.
French-Lazovik, G., & Gibson, C. L. (1984) effects of verbally labeled anchorpoints on the distributional parameters of rating measures. Applied PsychologicalMeasurement, 8 (1), 49-57.
Friedman, B. A., & Cornelius, E. T. (1976). Effect of rater participation in scaleconstruction on the psychometric characteristics of two rating scale formats. Journal ofApplied Psychology, 61 (2), 210-216.
Hamner, W. C., Kim, J. S., Baird, L., & Bigoness, W. J. (1974). Race and sex asdeterminants of ratings by potential employers in a simulated work-sampling task.Journal of Applied Psychology, 59, (6), 705-711.
Hauenstein, N. M. A., Facteau, J. & Schmidt, J. A. (1999, April). RaterVariability Training: An Alternative to Rater Error Training and Frame-of-ReferenceTraining. Poster session presented at the annual meeting of the Society for Industrial andOrganizational Psychology, Atlanta, GA.
Hedge, J. W., & Kavanagh, M. J. (1988). Improving the accuracy of performanceevaluations: Comparison of three methods of performance appraiser training. Journal ofApplied Psychology, 73 (1), 68-73.
Heneman, R. L. (1986). The relationship between supervisory ratings and results-oriented measures of performance: A meta-analysis. Personnel Psychology, 39, 811-826.
Jackson, C. (1996), An individual differences approach to the halo-accuracyparadox. Personal Individual Differences, 21 (6), 947-957.
52
Jacobs, R. R. (1986). Numerical rating scales. In R. A. Berk (ed.), PerformanceAssessment: Methods and Applications (pp. 82-99). Baltimore, MD: Johns HopkinsUniversity Press
Kane, J. S., & Bernardin, H. J. (1982). Behavioral observation scales and theevaluation of performance appraisal effectiveness. Personnel Psychology, 35, 635-641.
Kay, B. R. (1959) The use of critical incidents in a forced-choice scale. Journal ofApplied Psychology, 60, 695-703.
Keaveny, T. J., & McGann, A. F. (1975). A comparison of behavioral expectationscales and graphic rating scales. Journal of Applied Psychology, 60 (6), 695-703.
Kingstrom, P. O., & Bass, A. R. (1981). A critical analysis of studies comparingbehaviorally anchored rating scales (BARS) and other rating formats. PersonnelPsychology, 34 (2), 263-289.
Landy, F. J., & Barnes, J. L. (1979). Scaling behavioral anchors. AppliedPsychological Measurement, 3 (2), 193-200.
Landy, F. J., & Farr, J. L. (1980). Performance rating. Psychological Bulletin,87 (1), 72-107.
Latham, G. P., Wexley, K. N., & Pursell, E. D. (1975). Training managers tominimize rating errors in the observation of behavior. Journal of Applied Psychology, 60(5), 550-555.
Lissitz, R. W., & Green, S. B. (1975). Effect of the number of scale points onreliability: A monte carlo approach. Journal of Applied Psychology, 60 (1), 10-13.
McKelvie, S. J. (1978). Graphic rating scales: How many categories? BritishJournal of Psychology, 69, 185-202.
Murphy, K. R., & Balzer, W. K. (1989). Rater errors and rating accuracy. Journalof Applied Psychology, 74 (4), 619-624.
Murphy, K. R., & Cleveland, J. N. (1995). Understanding Performance Appraisal:Social, Organizational, and Goal-Based Perspectives. Thousand Oaks, CA: SAGEPublications.
Murphy, K. R., & Constans, J. I. (1987). Behavioral anchors as a source of bias inrating. Journal of Applied Psychology, 72 (4), 573-577.
Murphy, K. R., Philbin, T. A., & Adams, S. R. (1989). Effect of purpose ofobservation on accuracy of immediate and delayed performance ratings. OrganizationalBehavior and Human Decision Processes, 43, 336-354.
Nathan, B. R., & Tippins, N. (1990). The consequences of halo error inperformance ratings: A field study of the moderating effect of halo test validation results.Journal of Applied Psychology, 75 (3), 290-296.
Neck, C. P., Stewart, G. L., & Manz, C. C. (1995). Thought self-leadership as aframework for enhancing the performance of performance appraisers. Journal of AppliedBehavioral Science, 31 (3), 278-302.
Paterson, D. G. (1922). The Scott Company graphic rating scale. The Journal ofPersonnel Research, 1, 361-376.
Ryan, F. J. (1958). Trait ratings of high school students by teachers. Journal ofEducational Psychology, 49 (3), 124-128.
Ryan, T. A. (1945). Merit rating Criticized. Personnel Journal, 24, 6-15.
53
Schmidt, N. & Hill, T. E. (1977). Sex and race composition of assessment centergroups as a determinant of peer and assessor ratings. Journal of Applied Psychology, 62(3), 261-264.
Schneier, C. E. (1977). Operational utility and psychometric characteristics ofbehavioral expectation scales: A cognitive reinterpretation. Journal of AppliedPsychology, 62 (5), 541-548.
Squires, P., & Adler, S. (1998). Linking appraisals to individual development andtraining. In J. W. Smith (ed.), Performance Appraisal: State of the Art in Practice (pp.132-162). San Francisco, CA: Jossey-Bass Publishers.
Smith, P. C., & Kendall, L. M. (1963). Retranslation of expectations: Anapproach to the construction of unambiguous anchors for rating scales. Journal ofApplied Psychology, 47 (2), 149-155.
Stamoulis, D. T., & Hauenstein, N. M. A. (1993). Rater training and ratingaccuracy: Training for dimensional accuracy versus training for ratee differentiation.Journal of Applied Psychology, 78 (6), 994-1003.
Taylor, E. K., & Hastman, R. (1956). Relation of format and administration tothe characteristics of graphic rating scales. Personnel Psychology, 9, 181-206.
Tziner, A. (1984). A fairer examination of rating scales when used forperformance appraisal in a real organizational setting. Journal of OccupationalBehaviour, 5, 103-112.
Tziner, A., Kopelman, R. E., & Livneh, N. (1993). Effects of performanceappraisal format on perceived goal characteristics, appraisal process satisfaction, andchanges in rated job performance: A field experiment. Journal of Psychology, 127 (3),281-291.
Viswesvaran, C., Ones, D. S., & Schmidt, F. L. (1996). Comparative analysis ofthe reliability of job performance ratings. Journal of Applied Psychology, 81 (5), 557-574.
Woehr, D. J., & Feldman, J. (1993). Processing objective and question ordereffects on the causal relation between memory and judgment in performance appraisal:The tip of the iceberg. Journal of Applied Psychology, 78 (2), 232-241.

54
VITA
EDUCATION
M.S. Industrial/Organizational Psychology, May 1999 Virginia Polytechnic Institute and State University, Blacksburg, VAB.A. Psychology, Magna cum Laude in Psychology, 1996 Texas Tech University, Lubbock, TX
PROFESSIONAL EXPERIENCE
Consultant, Virginia Polytechnic and State University Office of Admissions, Blacksburg,VA (September 98 to December 98)
Worked on a problem analysis team to investigate the effects of implementing anew computer technology on department production and information flow.Conducted job analyses for multiple positions, developed job descriptions, anddiagramed organizational work flow paths. Also conducted job observationsessions, employee brainstorming meetings, and mediated communicationbetween multiple organizational levels. Collaborated with team to review andevaluate current work procedures, communication lines, and training systems inorder to make recommendations concerning future job structuring, training, andstaff level technical support.
RESEARCH EXPERIENCE
Primary Investigator, Virginia Polytechnic Institute and State University, Blacksburg, VA (May 98 to May 99)
Conducted research to examine the effects of different rating formats on measuresof performance appraisal rating accuracy. Designed a new computer-based ratingscale to evaluate performance. Constructed a behaviorally-based rating scale toevaluate performance. Analyzed data using both analysis of variance andmultiple regression.
Primary Investigator, Virginia Polytechnic Institute and State University, Blacksburg, VA (Sept 98 to Dec 98)
Examined job analysis results of the common-metric questionnaire in predictingpay. Also, explored gender differences in job analysis results and pay prediction.Finally, using factor analytic methods, tested a path analysis model of therelationship between derived CMQ subscales and "pay construct" indicators.
Research Assistant, Virginia Polytechnic Institute and State University, Blacksburg, VA (Sept 97 to Dec 97)
Worked on team to develop and administer a survey instrument designed to assesscivilian voting attitudes and behavior. Used factor analytic methods to identifyvarious attitudinal constructs and convergent/divergent validation methods toassess scale validities.

55
Research Assistant, Texas Tech University (Sept 95 to Dec 96)Participated in study designed to test information processing as a function ofsubgroup membership, information quality, and computer-generated feedback.Designed situational scenarios containing information of varying quality.Designed and implemented a novel coding scheme used to assess quality ofsubjects’ verbal responses.
TEACHING EXPERIENCE
Teaching Assistant: Personality Psychology, Virginia Polytechnic Institute and StateUniversity, Blacksburg, VA (Jan 99 to May 99)
Advised and tutored students on course related topics. Assisted in testconstruction, administration and evaluation.
Teaching Assistant: Introductory Psychology Recitation, Virginia Polytechnic Instituteand State University, Blacksburg, VA (Sept 97 to Dec 98)
Full responsibility of teaching course. Topics covered included researchmethodology, sensation/perception, classical/operant conditioning, physiologicalpsychology, developmental psychology, abnormal psychology, andindustrial/organizational psychology.
Related Documents