MACTEC

Welcome message from author
This document is posted to help you gain knowledge. Please leave a comment to let me know what you think about it! Share it to your friends and learn new things together.
Transcript

MACTEC
Final ReportHydraulic Fracturing Pilot Test Results and
Preliminary Full Scale DesignUnited Nuclear Church Rock Facility
GALLUr, NEW MEXICO
Prepared for:
United Nuclear Corporation
December 23,2003
FINAL REPORTHYDRAULIC FRACTURING PILOT TEST RESULTS AND
PRELIMINARY FULL SCALE DESIGNUNITED NUCLEAR CHURCH ROCK FACILITY
GALLUP, NEW MEXICO
Prepared for:
UNITED NUCLEAR CORPORATION
LLL
L
Senior Principal Hydrogeologist
Pat PontorieroSenior Principal Geologist
MACTEC Engineering and Consulting, Inc.
Pittsburgh, Pennsylvania
December 23,2003
Project 3410030048
H�&aulic Fracturing Pilot Test Results and Preliminary Full Scale Design December 23, 2003MACTEC Engineering and Consulting. Inc Revision 0
TABLE OF CONTENTS
1.0 INTRODUCTION.1-1
2.0 PILOT TEST PROCEDURES...2-12.1 BOREHOLE GEOPHYSICAL IMAGING..2-32.2 SATURATED ZONE TESTING..2-3
2.2.1 Saturated Zone Testing Network.2-32.2.2 Procedures.2-4
2.3 HYDRAULIC FRACTURING..2-72.4 FRACTURE DIAGNOSTICS..2-7
3.0 PILOT TEST RESULTS.3-13.1 BOREHOLE GEOPHYSICAL IMAGING..3-13.2 SATURATED ZONE TESTING..3-2
3.2.1 Pre-Hydraulic Fracture Pumping Test.3-23.2.2 Falling Head Tests.3-53.2.3 Post Hydraulic Fracture Pumping Test.3-6
3.3 HYDRAULIC FRACTURING..3-73.4 FRACTURE DIAGNOSTICS..3-83.5 DISCUSSION OF PILOT TEST RESULTS AND CONCLUSIONS. . 3-9
4.0 FULL SCALE DESIGN..4-14.1 RECOVERY WELL SPACING..4-14.2 RECOVERY WELL INSTALLATION..4-34.3 RECOVERY SYSTEM COMPONENTS INSTALLATION. . 4-5
4.3.1 System Design Parameters.4-64.3.2 Design Criteria.4-84.3.3 Assumptions.4-104.3.4 Recommendations.4-11
4.4 WELL HYDRAULIC FRACTURING AND MONITORING. . 4-114.5 SYSTEM OPERATION..4-124.6 FEASIBILITY ANALYSIS..4-13
4.6.1 Effectiveness.4-134.6.2 Reliability.4-134.6.3 Implementability.4-134.6.4 Disruptiveness.4-134.6.5 Relative Time Required.4-134.6.6 Relative Cost.4-14
5.0 PROJECT HEALTH AND SAFETY.5-1
ii
Hydraulic Fracturing Pilot Test Results and Preliminary Full Scale Design December 23, 2003MACTEC Engineering and Consulting. Inc. Revision 0
APPENDICES
APPENDIX A: ADVANCED GEOLOGICAL SERVICES DIGITAL OPTICALTELEVIEWER
REPORT
APPENDIX B: PUMPING TEST DATA AND GRAPHS (CD ROM)
APPENDIX C: HALLIBURTON FRACTURING SERVICES TREATMENT REPORT
APPENDIX D: PINNACLE SURFACE TILT FRACTURE MAPPING REPORT
APPENDIX E: CALCULATIONS AND GRAPHS USED TO EVALUATE EXTRACTION
WELL SPACING
APPENDIX F: CALCULATION OF PROPOSED DEPTH OF RECOVERY WELLS
APPENDIX G: PUMP CURVES
iii
Hydraulic Fracturing Pilot Test Results and Preliminary Full Scale Design December 23, 2003MACTEC Engineering and Consulting. Inc. Revision 0
LIST OF TABLES
Table
3.1 HF-3 Step Drawdown, Pre-Frac Pumping Test3.2 HF-3 (Digital Data), Pre-Frac Pumping Test3.3 CHHF-2 Drawdown, Pre-Frac Pumping Test3.4 Well 402 Background Water Level Monitoring Data3.5 Air Temperature and Barometric Pressure Data4.1 Recovery Well Construction, Z-3 and Bottom of Casing Elevations4.2 Piping Pressure Drop Calculations4.3 Voltage Drop Calculations
iv
Hydraulic Fracturing Pilot Test Results and Preliminary Full Scale Design
MACTEC Engineering and Consulting. Inc.
LIST OF FIGURES
December 23. 2003Revision 0
Figure
Figure 2-1Figure 3-1Figure 3-2Figure 3-3Figure 3-4Figure 3-5Figure 3-6Figure 3-7Figure 3-8Figure 3-9Figure 3-10Figure 3-11Figure 3-12Figure 3-13Figure 3-14Figure 4-1Figure 4-2Figure 4-3Figure 4-4
Site PlanHF-3 Step Drawdown, Pre-Frac Pumping TestHF-3 Pre-Frac Pumping Test Drawdown DataCHHF-2 Pre-Frac Pumping Test Drawdown DataWell 402 Background Water Level Monitoring DataAir Temperature and Barometric PressureWater Level and Barometric Pressure (8/13/2003 to 8/15/2003)Water Level and Barometric Pressure (7/23/2003 to 8/17/2003)Pre- and Post-Frac Distance DrawdownFalling Head Tests, Lower ZoneFalling Head Tests, Upper ZonePumping Test Corrections (Based on water levels at Well 402)HF-3 Post-Frac Pumping Test Drawdown DataMWHF-3 Post-Frac Pumping Test Drawdown DataHF-3 Step Drawdown, Post-Frac Pumping TestSite Plan and Recovery Well SpacingGeneral Arrangement Recovery System ComponentsProcess and Instrumentation Diagram, Recovery \Vell Piping SystemSingle Line, Recovery Well System
v
Hydraulic Fracturing Pilot Test Results and Preliminary Full Scale Design December23, 2003MACTEC Engineering and consulting, Inc. Revision 0
1.0 INTRODUCTION
This report has been prepared by MACTEC Engineering and Consulting, Inc. (MACTEC) on
behalf of United Nuclear Corporation (UNG) to summarize the results of pilot testing completed at
the Church Rock Site near Gallup, New Mexico. The purpose of the pilot testing was to evaluate
the use of hydraulic fracturing to enhance permeability of the Gallup Sandstone Zone 3 (Z-3) to
maximize water recovery from the formation. This document also provides a preliminary design,
based on pilot test results, of the first phase of the full scale approach to stop migration of impacted
groundwater in the Z-3.
Hydraulic fracturing is a technology that has been widely used to increase production in oil and gas
wells since the early 1950's. The technology has also been used to increase production in water
supply wells and to provide a means for enhancing capture in environmental extraction wells. The
objective of hydraulic fracturing is to increase �vell productivity by creating a highly conductive
path some distance away from the well bore into the formation. A hydraulic fracture is
accomplished by pumping a suitable fluid (usually water) into the formation at a rate faster than the
fluid can flow into the rock. Fluid pressure (or stress) that is sufficient to overcome the earth's
compressive stress holding the rock material together is built uji. .Ci�jhe rock then parts or fractures
along a plane perpendicular to the minimum compressive stress in the formation matrix. The
conductivity is maintained by propping the fracture with sand to hold the fracture faces apart.
Rock mechanics greatly influences the propagation and resulting geometry of the induced fracture.
In general, hydraulic fracturing at shallow depth (less than 2,000 feet) usually results in the
propagation of fractures with more of a horizontal component, while fractures induced in deeper
zones usually have more of a vertical component. Because the Z-3 is present at depths less than
200 feet, it was expected that the predominant induced fractures would propagate horizontally.
However, because it was important to minimize the vertical component of an induced fracture (to
evaluate interconnection of different zones) it was decided to complete the pilot test in an area
where groundwater in the Z-3 is not impacted by constituents of concern. Fresh water was used for
fracturing operations (instead of another more aggressive fluid such as liquid nitrogen) and the
injection program was designed by Halliburton Energy Services (Halliburton) of Farmington, New
Mexico in a manner that would maximize control of the induced fracture. Fracturing operations
were monitored with surface tilt-meters by Pinnacle Technologies of Centennial, Colorado, a
company specializing in induced fracture diagnostics, and the geometry of the resulting induced
fractures were mapped.
1-1
Hydraulic Fracturing Pilot Test Results and Preliminary Full Scale Design December 23. 2003MACTEC Engineering and Consulting. inc. Revision 0
The pilot test was developed to test the effectiveness of 1) open hole and 2) cased and perforated
completions using well completion and stimulation methods that are commonly used in the area.
An open hole completion whs thought to give the best chance of evaluating the true potential for
enhanced water production (as opposed to water production through perforated casing), since it is
possible that casing and perforating operations can cause formation damage that could impede
water production. However, it was thought that if results were just as good for cased and
perforated completions, future wells would be easier to install and multiple zone stimulations could
be easily accomplished if needed.
The opinions presented in this report are based on the data obtained during completion of this
project and were developed using our professional judgment, training, and experience. We believe
that these opinions �bre reasonably supported by the results of the testing and application of
professional standards of care that are generally accepted for completion of hydrogeologic
investigations and pilot testing.
MACTEC's professional opinions, experience, and training are also the basis for preparing a
conceptual design to implement the findings of the pilot testing performed. The project design is
based on dat�Ierived from the limited testing and analysis described in this report, which was
performed by MACTEC and UNC. MACTEC has not undertaken a systematic investigation of
every part of the property and has limited its investigation to the scope agreed upon with UNG.
The results of the site characterization and substantive feedback from UNG have been included into
a design of a pumping system. This design has been prepared using the standard of care for similar
projects and relies on UNO for critical feed back and evaluation of this report prior to
implementation of the proposed scope of work contained herein. Hydraulic fracturing is a proven
technology; ho�vever, while MACTEC believes that fracturing operations will not adversely impact
the existing plume, there is no way to guarantee how the rock will fracture. MACTEC therefore
does not guarantee that the proposed remedy will not cause the existing plume to migrate beyond
its present limits.
This report has been prepared for the sole use of the UNC and the regulatory agencies directly
involved with the project. No other party shall rely on the information contained herein without
prior written consent of MACTEC.
1-2
Hydraulic Fracturing Pilot Test Results and Preliminary Full Scale Design December 23. 2003MACTEC Engineering and Consulting. Inc. Revision 0
2.0 PILOT TEST PROCEDURES
The pilot test consisted of the following tasks:
Task 1 - Borehole Geophysical ImagingTask 2- Saturated Zone TestingTask 3 - Fracture DiagnosticsTask 4-Hydraulic Fracturing
Implementation of these tasks is further described in a Work Plan dated June 26, 2003. The work
plan also addresses project quality control and health and safety.
Following is a general summary of the project progression. Further details regarding each step of
the pilot test are included in the subsequent sections of this report.
* UNG installed test boring CHHF-1 (Figure 2-1) and cored the Z-3 to obtain an accurate recordof stratigraphy and depth to various units. One goal was to determine the depth and thicknessof the coal seam that underlies the Z-3. The core extended approximately three feet into theaquitard beneath the Z-3 to allow observation of that unit. The boring was also geophysicallylogged. Data from core observation and geophysical logging indicated that the Z-3 hadsignificantly greater shale and silt content than expected and was not typical of the Z-3 in thearea to be remediated. Therefore, it was decided to plug the boring and drill at anotherlocation. Boring CIIIHF-2 was advanced north and east of Boring CT-hF-i. This boring wasmore typical of the Z-3 and it was decided to use this test boring as an observation �vell for thepre-hydraulic fracturing pumping test in the pilot test well.
* UNC installed pilot test well HF-3 , approximately 20 feet from boring CHIIF-2, using an 8 %inch bit to a depth of approximately five feet above the anticipated base of the Z-3 (based oninformation from CI-IHF-2).
* UNG set and cemented 7 inch J rated casing (20 pound) in HF-3. Cementing was completedby Halliburton. Cement was allowed to cure for 24 hours before drilling to the final depth of166 feet. The goal was to drill to a depth of approximately 1 foot above the base of the Z-3,thereby advancing the boring as close as possible to the base of the Z-3 �vithout encounteringthe coal. It was thought that encountering the coal may cause the induced fracture topreferentially propagate through the coal seem instead of the Z-3. The well was finished withan 8-inch round collar.
* MACTEC conducted a long term pumping test on HF-3, using boring CHI-IF-2 as anobservation well. Upon arriving at the site, MACTEC noted that the static water level inboring CHHF-2 was approximately 30 feet higher than in HF-3, which was located only 20 feetaway. It was discovered that an uncased water bearing zone was located at a depth ofapproximately 136 feet in boring CHHF-2. To seal off the upper water bearing zone, a shalebasket was run into the well on two-inch casing and bentonite pellets were poured down theannular space. The static water level in boring CI-IHF-2 dropped to approximately the samedepth as in HF-3, indicating that the leak was successfully repaired, and the pumping testcommenced the next day.
2-1
Hydraulic Fracturing Pilot Test Results and Preliminary Full Scale Design December 23. 2003MACTEC Engineering and Consulting. Inc. Revision 0
* MACTEC's subcontractor, Advanced Geological Services, Inc. (AGS) mobilized to the siteand attempted to run a Digital Optical Televiewer (DOPTV) log in CHHF-2 and the uncased(bottom) portion of HF-3. A log could not be run in CIII-IF-2 because residual solids from thebentonite pellets used to seal the upper zone made the water too turbid for the camera;however, HF-3 was successfully logged.
* After the pumping test was completed and prior to hydraulic fracturing operations, CHHF-2was cemented with neat Portland cement to avoid "leak-off' during hydraulic fracturingoperations in HF-3.
* MACTEC's subcontractor, Pinnacle Technologies, set up an array of 32 surface tilt meters tomonitor the growth and coverage of the induced hydraulic fractures. Pinnacle Technologies isa company that specializes in induced fracture diagnostics.
* Prior to the first stage of hydraulic fracturing, MACTEC conducted a two hour falling head testin HF-3, on the lower portion of the Z-3, to establish a baseline for comparing results from afalling head test to be conducted after hydraulic fracturing operations.
* Halliburton conducted hydraulic fracturing operations in HF-3, on the lower portion of the 13(through the non-cased portion of �vell). MACTEC personnel and a representative from theState of New Mexico were on-site to witness hydraulic fracturing operations.
* After the first stage of hydraulic fracturing, MACTEC conducted a two hour falling head test inHF-3, on the lower portion of the Z-3, to determine if hydraulic fracturing operations improvedflow. Significant improvement was noted and the pilot test continued.
* Halliburton set a composite plug by wireline in the 7-inch casing at an approximate depth of155 to 158 feet to isolate the open hole portion of the well from the cased portion. After theplug was set, Halliburton perforated the casing at a density of 4 shot�per foot over a two footinterval from 148.5 to 150.5 feet. The shots were set up with a 180 degree phase.
* After perforating was completed, MACTEC conducted a two hour falling head test in HF-3, onthe perforated and cased portion of the Z-3.
* Halliburton conducted the second stage of hydraulic fracturing operations through perforationsin the cased portion of the Z-3.
* After hydraulic fracturing operations were completed through the perforated and cased portionof the Z-3, MACTEC conducted a two hour falling head test in HF-3 on the fractured, casedportion of the Z-3, to determine if hydraulic fracturing operations improved flow. A significantimprovement was noted.
* UNG installed a new test boring, MWIIF-3, to act as an observation �vell for the secondpumping test and drilled out the composite plug in the HF-3.
* MACTEC repeated the long term pumping test (combined zones).
* AGS again mobilized to the site and ran the DOPTV log in the new test boring (MWHIF-3) andthe bottom portion of HF-3 to observe induced fractures.
* MACTEC, Pinnacle, and AGS reduced the tilt meter data, DOPTV data, and aquifer test data.
The following subsections provide more details on each phase of the pilot test.
2-2
Hydraulic Fracturing Pilot Test Results and Preliminary Full Scale Design December 23. 2003MACTEC Engineering and Consulting. Inc. Revision 0
2.1 BOREHOLE GEOPHYSICAL IMAGING
Prior to hydraulic fracturing operations, a DOPTV log was run by AGS in the open hole portion of
HF-3 to establish a baseline with respect to the strike, dip, frequency and aperture of natural
fractures in the Z-3. As previously noted, AGS also attempted to run the DOPTV log in test boring
CHHF-2, but a log could not be run because residual solids from the bentonite pellets used to seal
the upper zone made the water too turbid for the camera. Borehole imaging was repeated after
fracturing operations to note differences and attempt to observe the induced fracture. AGS's report
has been included in Appendix A.
2.2 SATURATED ZONE TESTING
The objective of the saturated zone testing program was to obtain hydrologic data from the Z-3
before and after hydraulic fracturing of the unit occurred. Initially, HF-3 was pumped at a rate that
had been determined by completing a step-drawdown test. A long term pumping test was
conducted. During that test, an observation ivell (CHI{F-2), located 20 feet from HiF-3, was
monitored and hydrologic properties of the Z-3 were evaluated. The observation well was then
plugged to eii�abl� hydraulic fracturing of HF-3. A falling-head permeability test was performed
pre- and post-fracturing to assess the relative change in permeability of the fractured zone. After
fracturing was completed, a new observation well (MWHF-3) was installed 20 feet from IIF-3 and
the initial pumping test was duplicated. The monitoring network and aquifer testing procedures are
described in the following subsections.
2.2.1 Saturated Zone Testing Network
Saturated zone testing was performed in an area to the �vest of the impacted Z-3 plume (Figure 2-
1). The saturated thickness of the formation was approximately 35 feet in the test area.
Prior to initiating aquifer testing, a water level transducer was installed in an existing monitoring
well to record fluctuations in groundwater levels. The transducer was installed in Well 714 on June
3, 2003 and was used to record water level data through June 17, 2003. The transducer was then
placed into another existing well, Well 402, from July23 through August 15, 2003 to collect long-
term water level data. Well 714 is located approximately 1,400 feet south of HF-3 and Well 402 is
located approximately 520 feet south of HF-3 (Figure 2-1).
2-3
Hydraulic Fracturing Pilot Test Results and Preliminary Full Scale Design December 23, 2003MACTEC Engineering and Consulting, Inc. Revision 0
During the pumping tests, HF-3 and observation xvells CHHF-2 (during the pre-fracturing test) or
MWHF-3 (during the post-fracturing test) were outfitted with transducers to record water levels
during the test. Appendix B of this report contains the water level data recorded during each test
from each ;vell.
2.2.2 Procedures
Pre-hydraulic fracture testing of HF-3 consisted of a step-down test, a constant rate pumping test,
and a falling head permeability test. The step drawdown test was used to determine a safe yield for
the pumping test. The pumping test was conducted for 1500 minutes to estimate the transmissivity
and storativity of Z-3. The falling head tests were performed to provide a baseline of well
performance prior to hydrologic fracturing. Field data for each test were recorded into a bound
project note book and/or onto pre-printed field data forms. Data were also recorded electronically
using pressure transducers. Each test is described individually in the sections below.
Following hydraulic fracturing of HF-3, falling head permeability tests were again performed to
assess changes in the hydraulic conductivity of HF-3. A second constant rate pumping test was
then performed that was as identical as practical to the first test. After the pumping test was
complete and after recovery was monitored for approximately 300 minutes, the pumping rate was
then increased to the total pump capacity to estimate the well's maximum pumping rate.
2.2.2.1 Step Drawdown Test
A step drawdown test was conducted on July 23, 2003 at well HF-3. During the test, water levels
were monitored in HF-3 and in CHHF-2, which was located 20 feet away. Appendix B of this
report contains the water level data from each well.
During the step drawdown test, MACTEC realized that the water level in the observation well
(CHHF-2) was approximately 30 feet higher than the water level in the pumping �vell (HF-3).
Following the step test, it was determined that the casing in CHHF-2 had not sealed an
unconsolidated, saturated formation located immediately below the bottom of the casing. In order
to seal off the water, MACTEC installed a two-inch diameter well casing with a shale basket. The
shale basket was positioned at a depth approximately two feet belo�v the bottom of the outer casing
for CHHF-2. Bentonite pellets were then placed into the annular space between the outer well
casing and the two-inch casing to seal the well. Immediately following placement of the bentonite
pellets, the water level inside the two-inch casing began to fall, indicating an effective seal had
been emplaced. When the water level began to decline, a pump was used to lower the water level
2-4
Hydraulic Fracturing Pilot Test Results and Preliminary Full &ale Design December 23. 2003MACTEC Engineering and Conrulting, Inc. Revision 0
in CHHF-2 to a depth of approximately 125 to 130 feet below the measuring point. This level was
selected based on the depth to water measured in HF-3 at that time. The next day, a water level
measurement indicated that the water level in CHHF-2 had stabilized at 125.02 feei below the
established measuring point for the well. Based on this information, measurements from well
CHIHF-2 were not used to evaluate the step drawdown test but the �vell was used to evaluate the
pumping test conducted after the well casing was properly sealed.
The step drawdown test was performed in a series of three pumping steps. Each pumping step was
performed for a period of 60 minutes and drawdown was recorded in the pumping well. Pumping
rates of 0.5, 1.0, and 1.5 gallons per minute gpm were used.
Evaluation of the drawdown data indicated that well HF-3 could not continue t6�produce water at a
flow rate of 1.5 gpm throughout the 24 hour pumping test. Similarly, a review of the drawdown for
1.0 gpm indicated that the ivell might not sustain 24 hours of pumping at this rate. The total
drawdown observed for the 0.5 gpm pumping rate indicated an anticipated drawdown of
approximately 18 feet after 1500 minutes of pumping. Based on this evaluation, a pumping rate of
0.8 gpm was selected for the constant rate pumping test with.. a drawdown objective of
approximately 50 to 60 percent of the saturated thickness in a 24 hour test.
2.2.2.2 Constant Rate Pumping Test
The recovery period between the step drawdown test and the constant rate pumping test exceeded
24 hours due to sealing of the upper water producing zone �vell CHHF-2. The constant rate
pumping test commenced on July 25, 2003 at 0728 and continued for a total of 1500 minutes.
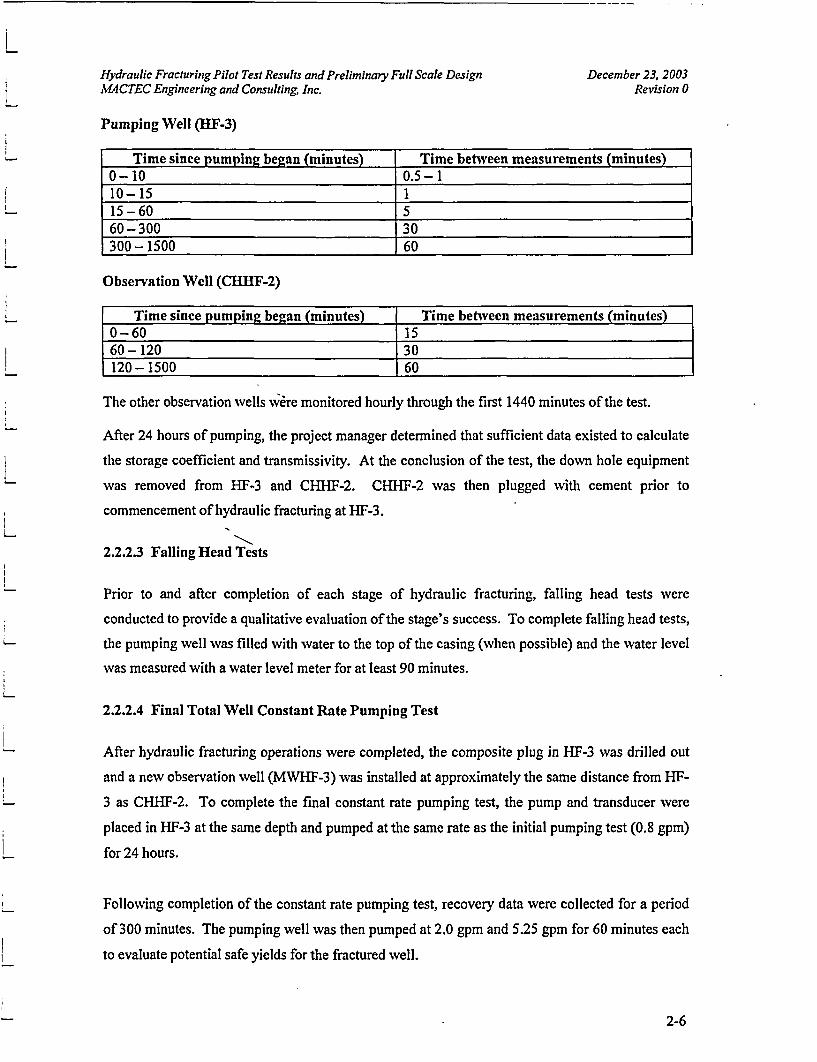
Water levels were monitored in the pumping well and observation well, using a data logging
pressure transducer, during the test and for a period of 300 minutes after pumping ceased. Manual
measurements of water levels were also made in each well throughout the test. The data collected
during the pre-hydraulic fracture pumping test are included in Appendix B of this report. Manual
data were collected in general accordance with the following schedule throughout the pumping test:
2-5
Hydraulic Fracturing Pilot Test Results and Preliminary Full Scale DesignMACTEC Engineering and Consulting, Inc.
Pumping Well (HiF-3)
December 23, 2003Revision 0
Time since p urn in began (minutes) Time between measurements (minutes)0-10 0.5-110-15 115-60 560-300 30300-1500 60
Observation Well (C.HIIF-2)
Time since pumping began (minutes) Time between measurements (minutes)0-60 1560-120 30120-1500 60
The other observation �vells ��re monitored hourly through the first 1440 minutes of the test.
After 24 hours of pumping, the project manager determined that sufficient data existed to calculate
the storage coefficient and transmissivity. At the conclusion of the test, the do�vn hole equipment
was removed from HF-3 and CHHF-2. CHHF-2 was then plugged with cement prior to
commencement of hydraulic fracturing at LIF-3.
2.2.2.3 Falling Head Tests
Prior to and after completion of each stage of hydraulic fracturing, falling head tests were
conducted to provide a qualitative evaluation of the stage's success. To complete falling head tests,
the pumping well was filled with 'water to the top of the casing (when possible) and the water level
was measured with a water level meter for at least 90 minutes.
2.2.2.4 Final Total Well Constant Rate Pumping Test
After hydraulic fracturing operations were completed, the composite plug in HF-3 was drilled out
and a new observation well (MW.HF-3) was installed at approximately the same distance from HF-
3 as CHIHF-2. To complete the final constant rate pumping test, the pump and transducer were
placed in HF-3 at the same depth and pumped at the same rate as the initial pumping test (0.8 gpm)
for 24 hours.
Following completion of the constant rate pumping test, recovery data were collected for a period
of 300 minutes. The pumping well was then pumped at 2.0 gpm and 5.25 gpm for 60 minutes each
to evaluate potential safe yields for the fractured well.
2-6
Hydraulic Fracturing Pilot Test Results and Preliminary Full Scale DesignMACTEC Engineering and Consulting, Inc.
December 23, 2003Revision 0
2.3 HYDRAULIC FRACTURING
UNG subcontracted Halliburton Energy Services (Halliburton) to provide hydraulic fracture design
and implementation services. Halliburton's report, which outlines procedures and methods used
for hydraulic fracturing, is included in Appendix C.
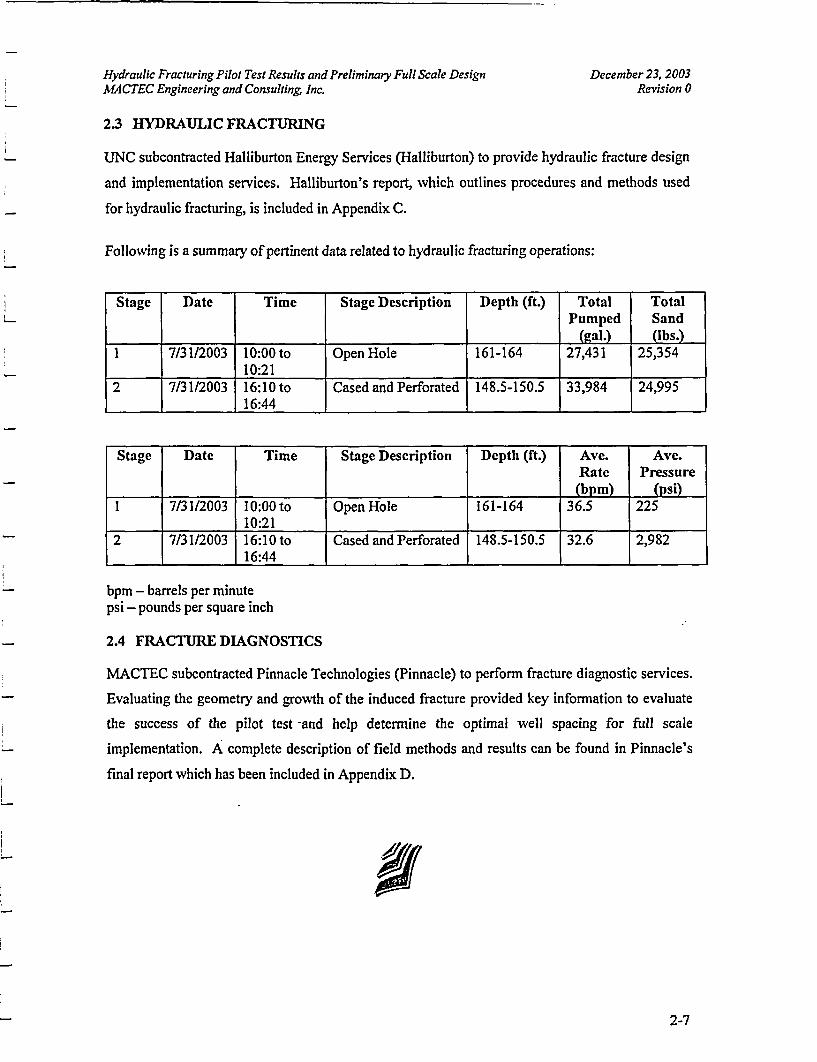
Following is a summary of pertinent data related to hydraulic fracturing operations:
Stage Date Time Stage Description Depth (ft.) Total TotalPumped Sand
_______ ___________ (gal.) (lbs.)1 7/31/2003 10:00 to Open Hole 161-164 27,431 25,354
______ 10:2 1 _________________ _________
2 7/31/2003 16:10 to Cased and Perforated 148.5-150.5 33,984 24,995
_______ _________ 16:44 __________________ ___________ _________ _________
Stage Date Time Stage Description Depth (ft.) Ave. Ave.Rate Pressure
______ _________ ___________ ___________ (bpm) (psi)1 7/31/2003 10:OOto OpenHole 161-164 36.5 225
______ _________ 10:2 1 ___________ ________
2 7/31/2003 16:10 to Cased and Perforated 148.5-150.5 32.6 2,98216:44 _________________ ___________ ________
bpm - barrels per minute
psi - pounds per square inch
2.4 FRACTURE DIAGNOSTICS
MACTEC subcontracted Pinnacle Technologies (Pinnacle) to perform fracture diagnostic services.
Evaluating the geometry and growth of the induced fracture provided key information to evaluate
the success of the pilot test -and help determine the optimal well spacing for full scale
implementation. A complete description of field methods and results can be found in Pinnacle's
final report which has been included in Appendix D.
2-7
Hydraulic Fracturing Pilot Test Results and Preliminary Full Scale Design December 23, 2003MACTEC Engineering and Consulting, Inc. Revision 0
3.0 PILOT TEST RESULTS
3.1 BOREHOLE GEOPHYSICAL IMAGING
A copy of the AGS report has been included in Appendix A. The report includes high resolution
imageiy of EIF-3 (both prior to and after hydraulic fracturing operations) and MWHF-3 (the
observation well installed after hydraulic fracturing operations).
DOPTV logging in HF-3 conducted prior to hydraulic fracturing revealed no discernable natural
fractures in the uncased interval of the Z-3 (approximately 161 to 166 feet) (Appendix A, Figure
1). DOPTV logging after hydraulic fracturing operations were completed revealed a large,
relatively horizontal, open fracture at 164.1 feet, approximately 2 inches in width (Appendix A,
Figure 1).
As previously noted, DOPTV logging could not be completed prior to hydraulic fracturing
operations in the original observation well CHHF-2 (which was plugged prior to fracturing
operations). However, the observation well installed after fracturing�was completed, MWHF-3,
was logged with the DOPTV. Ten fractures were noted on the DOPTV log from MWHF-3
(Appendix A, Figure 3 and DOPTV logs attached at end of AGS report). Because there was no
pre-fracturing DOPTV log of MWHF-3, no conclusions can be made with certainty as to whether
or not any of the 10 observed fractures were induced by hydraulic fracturing operations. However,
it is MACTEC's and AGS's belief that some of the fractures appear to be induced based on their
fresh appearance and the fact that proppant may be visible in some of the fractures.
The DOPTV was also run in the cased portion of HF-3 after fracturing to observe the casing
perforations. Although 8 perforations were noted, two were immediately adjacent to each other
and one was smaller than desired (Appendix A, Figure 2). This may have contributed to the high
breaking and treating pressures observed during the cased-hole frac (Stage 2) by increasing friction
loss.
3-1
Hydraulic Fracturing Pilot Test Results and Preliminary Full Scale Design December 23, 2003MACTEC Engineering and Consulting, Inc. Revision 0
3.2 SATURATED ZONE TESTING
Saturated zone testing was conducted at various stages of this project to assess the extent to which
the hydraulic fracturing activities increased the hydraulic conductivity of the Z-3. The following
testing was completed:
Pre-Hydraulic Fracture
* Step Drawdown Pumping Test* Constant Rate Pumping Test* Falling Head Test
Post-Hydraulic Fracture Falling Head Tests
Post-Hydraulic Fracture Constant Rate Pumping Test
The results of the tests are discussed below and the raw data and calculations are provided in
Appendix B.
3.2.1 Pre-Hydraulic Fracture Pumping Test
A step drawdown pumping test was completed initially to determine the most appropriate pumping
rate to be used during the 24 constant rate pumping tests. The objective was to select a pumping
rate that sufficiently stressed the aquifer but that did not result in excessive drawdown (i.e.,
drawdown that exceeds 90% of the aquifer thickness after 24 hours). Results from previous
investigations indicated that pumping wells in the formation could safely produce approximately I
gpm. Therefore, the step drawdown test was completed by pumping HF-3 at rates of 0.5 gpm, 1
gpm, and 1.5 gpm for periods of 60 minutes each.
Figure 3-1 graphically illustrates the drawdown in HF-3 as result of the step test. The projected
drawdown after 24 hours (1440 minutes) at the 0.5 gpm pumping rate was approximately 24 fi,
whereas the projected drawdown at 1 gpm and 1.5 gpm was approximately 36 ft and greater than
50 ft. respectively. Based on these results the pumping rate selected for the constant rate pumping
test was 0.8 gpm.
Based on the results of the step drawdown test, the pre-hydraulic fracture pumping test was
completed for a period of 1500 minutes (25 hours) at a pumping rate of 0.8 gpm. Water levels
were collected both manually and using pressure transducers in pumping well HF-3 and CHHF-2
�vhich was located at a distance of 20 feet from HF-3. In addition, water levels were measured in
3-2
Hydraulic Fracturing Pilot Test Results and Preliminary Full Scale Design December 23, 2003MACTEC Engineering and Consulting. Inc. Revision 0
Well 402 during the period of the test. Well 402 is outside of the influence of IIF-3 and the data
were used to monitor fluctuations in water levels unrelated to pumping.
The time drawdown data for collected from HF-3 and CHLIF-2 during the pre-hydraulic fracture
constant rate pumping test is illustrated graphically on Figures 3-2 and 3-3, respectively.
The hydrograph from Well 402 is shown graphically on Figure 3-4. Data illustrated on this graph
clearly indicate diurnal fluctuations in water levels. The amplitude of the changes in water levels
ranges from 0.05 to over 0.10 feet per day. The fluctuations are also distinctive in time. The
highest water levels are observed during the early evening and the lowest water levels are observed
during the mid morning each day.
Potential reasons for these fluctuations were evaluated to determine their significance. Influence
by other groundwater pumping was eliminated because there are no wells in the vicinity of Well
402 that are pumped. The review of the data led to assessment of daily fluctuations of barometric
pressure as a result of daily heating and cooling of air. Climatological data were obtained for a
weather station located in Albuquerque, New Mexico. Figure 3-5 illustrates the relationship
between the daily air temperature and barometric pressure and illustrates as air temperature
increases throughout the day, the barometric pressure decreases due to convectional thinning of the
air. A strong correlation was identified between barometric pressure changes and air temperature.
The barometric pressure changes were then compared to the water level fluctuations recorded in
Well 402. Figure 3-6 illustrates the relationships between change in barometric pressure and water
level in Well 402 over a period of approximately two days. The correlation between the data is
very strong, indicating that when the barometric pressure increases, the water level in the well
decreases. Additional data were reviewed to ensure that this relationship is persistent. Those data
are included in Appendix B of this report in a file entitled "well 402 & estimatedata.xls". Figure 3-
7 illustrates the relationship over a period of approximately three weeks.
Review of as measured (raw) time-drawdown data for the observation well (Figure 3-3) indicated
that the water level rose during the pumping test to a level that was above the pre-test static level.
The hydrograph for Well 402 was used to develop a correction that was applied to the pumping test
data from the pumping and observation wells. This correction is not immediately noticeable in the
HF-3 data (Figure 3-2) because the drawdown caused by pumping is so great relative to the diurnal
fluctuations that they are masked. However, the correction is quite noticeable on Figure 3-3 where
3-3
Hydraulic Fracturing Pilot Test Results and Preliminazy Full Scale Design December 23, 2003MACTEC Engineering and Consulting, Inc. Revision 0
the total measured drawdown in the well was only 0.19 ft. Therefore, in order to make the CHHF-
2 data usable, the measured data were corrected to account for the diurnal fluctuations. This
correction was calculated by calculating changes in water levels at Well 402 relative to a baseline
static water level. The calculated changes were then applied to the recorded water levels from the
pumping and observation �vells. The correction factors from Well 402 are applied to the CI-IHF-2
data and are shown graphically on Figure 3-3.
The drawdown data from HF-3 also had to be corrected to account for well inefficiency. Although
the well is completed as an open borehole, it is only open to the bottom 4 ft of the saturated zone,
�vhich results in excessive drawdown in the well during pumping. Well efficiency was calculated
to be approximately 3 percent using Driscoll, 1986, by comparing the theoretic 24-hour specific
capacity calculated using the transmissivity of CHHF-2, to the measured 24-hour specific capacity
of the pumping well.
Once the CHLIF-2 and HF-3 data were corrected, transmissivity (T) was calculated by both the
Cooper-Jacob and distance drawdown methods. The storage coefficient (S) was calculated using
both the time drawdown and distance drawdown data. Hydraulic conductivity (K) was calculated
using the values for T and the aquifer thickness of 41 ft. The calculated T and K values, respective
equations, variables, and calculations based on the efficiency calculated drawdown for well HF-3
are summarized on Table 3-1. The calculated T, S, and K values, respective equations, variables
and calculations used to determine the parameters at CI-IHF-2 are shown on Table 3-2.
As a secondary means of estimating hydrologic parameters, a distance drawdown evaluation was
conducted. The distance drawdown graph was developed for water levels measured after 1500
minutes (Figure 3-8). This plot also includes distance drawdown data for the post-fracture
pumping test. Table 3-3 includes the calculation of T, S, and K for these evaluations.
3-4
Hydraulic Fracturing Pilot Test Results and Preliminary Full Scale Design December 23. 2003MACTEC Engineering and Consulting. Inc. Revision 0
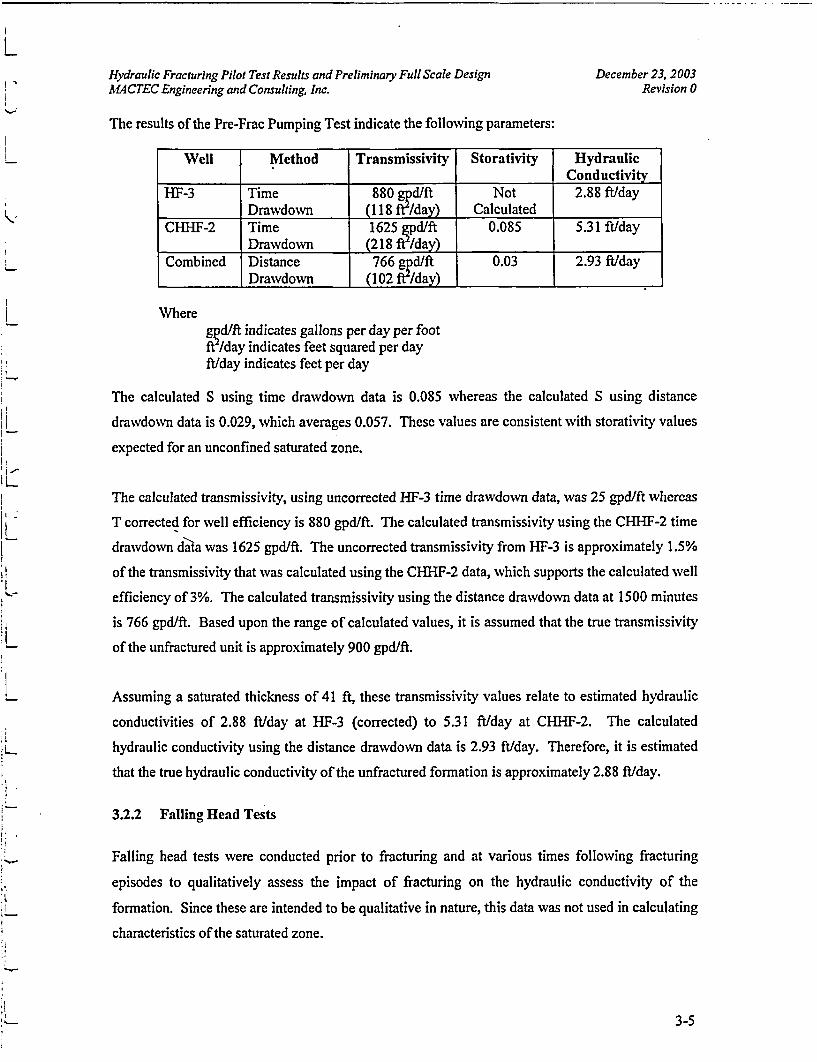
The results of the Pre-Frac Pumping Test indicate the following parameters:
Well Method Transmissivity Storativity Hydraulic_____________ ____________ Conducti'vi
HT-3 Time 880 gpd/ft Not 2.88 ft/dayDrawdown (118W/day) Calculated _____________
CHHF-2 Time 1625 .gpd/ft 0.085 5.31 ft/day___________ Drawdown (218 W/day)Combined Distance 766 gpd/ft 0.03 2.93 ft/day__________ Drawdown (102 W/day) ____________ ______________
Wheregp d/ft indicates gallons per day per footW/day indicates feet squ�ed per dayft/day indicates feet per day
The calculated S using time drawdown data is 0.085 whereas the calculated S using distance
drawdown data is 0.029, which averages 0.057. These values are consistent with storativity values
expected for an unconfined saturated zone.
The calculated transmissivity, using uncorrected HF-3 time drawdown data, was 25 gpd/ft whereas
T corrected for �vell efficiency is 880 gpd/ft. The calculated transmissivity using the CHHF-2 time
drawdown d�ta was 1625 gpd/ft. The uncorrected transmissivity from I-]F-3 is approximately 1.5%
of the transmissivity that was calculated using the CHHF-2 data, which supports the calculated well
efficiency of 3%. The calculated transmissivity using the distance drawdown data at 1500 minutes
is 766 gpd/ft. Based upon the range of calculated values, it is assumed that the true transmissivity
of the unfractured unit is approximately 900 gpd/ft.
Assuming a saturated thickness of 41 fi, these transmissivity values relate to estimated hydraulic
conductivities of 2.88 fl/day at HF-3 (corrected) to 5.31 ft/day at CIIHF-2. The calculated
hydraulic conductivity using the distance drawdown data is 2.93 ft/day. Therefore, it is estimated
that the true hydraulic conductivity of the unfractured formation is approximately 2.88 ft/day.
3.2.2 FaIliDg Head Tests
Falling head tests were conducted prior to fracturing and at various times following fracturing
episodes to qualitatively assess the impact of fracturing on the hydraulic conductivity of the
formation. Since these are intended to be qualitative in nature, this data was not used in calculating
characteristics of the saturated zone.
3-5
Hydraulic Fracturing Pilot Test Results and Preliminary Full Scale Design December 23, 2003MACTEC Engineering and Consulting. Inc. Revision 0
In the initial test (prior to any hydraulic fracturing), Well 1-IF-3 was filled to the top of the casing
with water and the decline in the water level was monitored over a period of 240 minutes.
Following this time period, the water level had declined to approximately 110 feet below the top of
casing. Immediately following the completion of the fracturing, the well was expected to be filled
with water from the fracturing operation and the decline of the water level was to be monitored for
90 minutes. However, the water level from injecting fracturing fluid had already declined by the
time the fracturing pipe string could be opened. Consequently, water was pumped into HF-3, in an
effort to fill the well with water for the falling head test, at a rate of approximately 170 gpm. The
well could not be filled at this pumping rate and the test was begun with a water level at
approximately 80 feet below the top of casing. The water level declined to a level of
approximately 110 feet below the top of casing in approximately 90 minutes. The results of the
pre-fracture and post-fracture open borehole falling head tests are shown graphically on Figure 3-9.
After fracturing the lower zone of the formation, the fractured zone was isolated with a wireline
plug and the casing was perforated to fracture a second, higher zone. The well was filled with
water and only a very small decline in water level was observed. Following the second fracturing
event, the water level in the well again declined before the piping could be opened. Introduction of
water at a pumping rate of approximately 170 gpm resulted in an initial water level of
approximately 41 feet below the top of casing. The falling head test indicated the water level
declined to approximately 110 feet below the top of casing within 90 minutes. The results of the
pre-fracture and post-fracture fracture cased and perforated borehole falling head tests are shown
graphically on Figure 3-10.
These results were interpreted to indicate that both fracturing events had significantly enhanced the
hydraulic conductivity of the formation around the pumping well.
3.2.3 Post Hydraulic Fracture Pumping Test
Following completion of the hydraulic fracturing of the pumping well, the observation well was
redrilled. The new well was identified as MWHIF-3. The post-fracturing constant rate pumping
test was completed at a rate of 0.8 gpm. As in the initial test, water levels at the observation well
were corrected based on diumal fluctuations observed in Well 402 during the pumping test. Figure
3-1 1 illustrates the corrections from Well 402 that were applied to the drawdown observed in Well
MWHF-3.
3-6
Hydraulic Fracturing Pilot Test Results and Preliminary Full Scale Design December 23, 2003MACTEC Engineering and Consulting, Inc. Revision 0
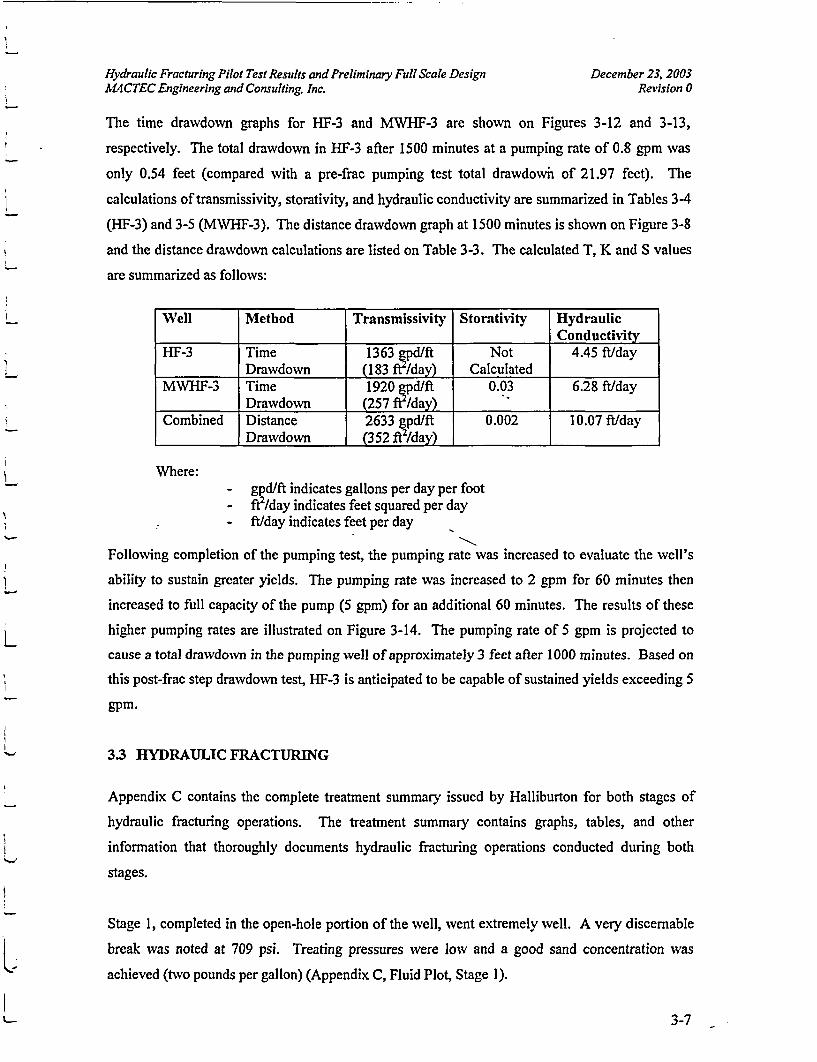
The time drawdown graphs for HF-3 and MW.HF-3 are shown on Figures 3-12 and 3-13,
respectively. The total drawdown in HF-3 after 1500 minutes at a pumping rate of 0.8 gpm was
only 0.54 feet (compared with a pre-frac pumping test total drawdowii of 21.97 feet). The
calculations of transmissivity, storativity, and hydraulic conductivity are summarized in Tables 3-4
(l-IF-3) and 3-5 (MWHF-3). The distance drawdown graph at 1500 minutes is shown on Figure 3-8
and the distance drawdown calculations are listed on Table 3-3. The calculated T, K and S values
are summarized as follows:
Well Method Trausmissivity Storativity Hydraulic______________ ______________ ____________ Conductivity
HF-3 Time 1363 gpd/ft Not 4.45 ft/dayDrawdown (183 ft2/day) Calculated
MWHF-3 Time 1920 �pd/ft 0.03 6.28 ft/dayDrawdown (257 W/day) ____________
Combined Distance 2633 gpd/ft 0.002 10.07 ft/day__________ Drawdown (352 ft2 /day) ____________ ______________
Where:- ��ftindicatesgallonsperdayperfoot- fe/day indicates feet squared per day- ft/day indicates feet per day
Following completion of the pumping test, the pumping rate was increased to evaluate the well's
ability to sustain greater yields. The pumping rate was increased to 2 gpm for 60 minutes then
increased to full capacity of the pump (5 gpm) for an additional 60 minutes. The results of these
higher pumping rates are illustrated on Figure 3-14. The pumping rate of 5 gpm is projected to
cause a total drawdown in the pumping ivell of approximately 3 feet after 1000 minutes. Based on
this post-frac step drawdown test, HF-3 is anticipated to be capable of sustained yields exceeding 5
gpm.
3.3 HYDRAULIC FRACTURING
Appendix C contains the complete treatment summaly issued by Halliburton for both stages of
hydraulic fracturing operations. The treatment summary contains graphs, tables, and other
information that thoroughly documents hydraulic fracturing operations conducted during both
stages.
Stage 1, completed in the open-hole portion of the well, �vent extremely ;vell. A very discernable
break was noted at 709 psi. Treating pressures were low and a good sand concentration was
achieved (two pounds per gallon) (Appendix C, Fluid Plot, Stage 1).
3-7
Hydraulic Fracturing Pilot Test Results and Preliminary Full Scale Design December 23, 2003MACTEC Engineering and Consulting. Inc. Revision 0
Stage 2, completed at a shallower depth in the cased and perforated portion of the �vell, did not go
as smoothly. Multiple breaks were noted at significantly higher pressures than Stage I (as high as
3,750 psi) and treating pressures were also much higher. Although sand concentrations of two
pounds per gallon were ultimately achieved during Stage 2, there was concern during the treatment
that the formation would "screen off" so sand concentrations were increased at a slower rate than
during Stage 1. Because sand concentrations had to be increased more slowly, more water was
needed to pump the desired amount of sand, which was approximately 25,000 pounds.
3.4 FRACTURE DIAGNOSTICS
Pinnacl�Technologies conducted surface tilt meter fracture mapping of both stages of hydraulic
fracturing operations to help evaluate the growth and extent of induced hydraulic fractures. A copy
of the Pinnacle report has been included in Appendix D.
Results from analysis of surface tilt meter data collected during Stage 1 (open borehole) hydraulic
4'racturing operations indicate that a horizontal fracture was created with no detected vertical
component. The resulting propped fracture was centered slightly southwest of HF-3 at an
approximate depth of 160 feet from the surface and was essentially circular in shape with a radius
of35 to 45 feet. The horizontal fracture dipped to the north approximately 12 degrees.
Results from analysis of surface tilt meter data collected during Stage 2 (cased and perforated
borehole) hydraulic fracturing operations indicate that a horizontal fracture was created with no
vertical component early in the fracture treatment. The vertical fracture was dipping 9 degrees to
the east. At approximately the mid-point of the treatment (16 minutes into the 34 minute job), the
induced hydraulic fracture moved up vertically approximately 50 feet, and continued to grow
horizontally. The center of growth was approximately 150 feet southwest of HF-3. The resulting
propped fracture was centered at an approximate depth of 100 feet from the surface and was
essentially oval in shape with a radius of approximately 100 feet. The horizontal fracture dipped to
the west approximately 18 degrees after the vertical jump. No vertical component was detected by
the tilt meter array at any time during the hydraulic fracture treatment, suggesting some high
conductivity conduit (either man-made, or natural) was encountered by the propagating fracture,
allowing the fracture treatment to move to another level without causing any deformation in the
vertical direction.
3-8
Hydraulic Fracturing Pilot Test Results and Preliminary Full Scale Design December 23, 2003MACTEC Engineering and Consulting, Inc. Revision 0
3.5 DISCUSSION OF PILOT TEST RESULTS AND CONCLUSIONS
The results of the pilot test indicate that hydraulic fracturing is a feasible technology that will
significantly enhance the permeability of the Z-3 to minimize the number of vertical wells needed
to dewater the formation. An open borehole completion appears to be the preferred approach.
These conclusions are based on the following pilot test results:
* An induced fracture was successfully propagated in both stages; however, Stage 1,
completed in the open-hole portion of the well, produced the most desirable results. A
very discernable break was noted at 709 psi. Treating pressures were low and a good sand
concentration was achieved (two pounds per gallon). Stage 2, completed at a shallower
depth in the cased and perforated portion of the well, did not go as well. Multiple breaks
were noted at significantly higher pressures than Stage I and treating pressures were also
much higher. Although sand concentrations of two pounds per gallon were ultimately
achieved, there was concern during the treatment that the formation would "screen off" so
sand concentrations were increased at a slower rate than during Stage 1.
* DOPTV logging in HF-3 conducted prior to hydraulic fracturing revealed no discernable
natural fractures in the uncased interval of the Z-3 (approximately 161 to 166 feet).
DOPTV logging in HF-3 conducted after hydraulic fracturing operations were completed
revealed a large, relatively horizontal, open fracture at 164.1 feet, approximately 2 inches
in �vidth. Ten fractures were noted on the DOPTV log from CHHF-3 (observation �vell
located approximately 20 feet from HF-3). Because there was no pre-fracturing DOPTV
log of MWHF-3, no conclusions can be made with certainty as to whether or not any of the
10 observed fractures were induced by hydraulic fracturing operations. However, it is
MACTEC's and AGS's belief that some of the fractures appear to be induced based on
their fresh appearance and the fact that proppant may be visible in some of the fractures.
* Results from analysis of surface tilt meter data collected during Stage 1 (open borehole)
hydraulic fracturing operations indicate that a horizontal fracture was created with no
detected vertical component. The resulting propped fracture was centered slightly
southwest of HF-3 at an approximate depth of 160 from the surface and essentially circular
in shape with a radius of 35 to 45 feet. Results from analysis of surface tilt meter data
collected during Stage 2 (cased and perforated borehole) hydraulic fracturing operations
indicate that a horizontal fracture was created with no vertical component early in the
fracture treatment. At approximately the mid-point of the treatment, the induced hydraulic
3-9
Hydraulic Fracturing Pilot Test Results and Preliminary Full Scale Design December 23, 2003MACTEC Engineering and Consulting. Inc. Revision 0
fracture moved up vertically approximately 50 feet, and continued to grow horizontally.
The center of growth was approximately 150 feet southwest of HF-3. The resulting
propped fracture was centered at an approximate depth of 100 febt from the surface and
was essentially oval in shape �vith a radius of approximately 100 feet. No vertical
component was detected at any time during the hydraulic fracture treatment, suggesting
some high conductivity conduit (either man-made, or natural) was encountered, allowing
the fracture treatment to move to another level without causing any deformation in the
vertical direction.
* Results from pre- and post-frac aquifer testing indicate a significant improvement in
aquifer characteristics as follows:
- There was a significant increase in well efficiency**
- Hydraulic conductivity increased by a factor of two at HF-3
- There was a significant increase in safe yield in HF-3
- Distance drawdown evaluation indicates almost an order of magnitude increase of
the cone of depression after hydraulic fracturing
Based on the success of the pilot test, it was decided to more forward with design of the first phase
of full scale implementation. The subsequent sections of this report provide the design details of
the next phase of field activities.
I
3-10
Hydraulic Fracturing Pilot Test Results and Preliminwy Full Scale Design December 23, 2003MACTEC Engineering and Consulting, Inc. Revision 0
4.0 FULL SCALE DESIGN
The primary objective of the selected remedy is to prevent migration of impacted groundwater past
the UNG property boundary. A secondary objective is to dewater the impacted portion of the Z-3,
to the extent possible, realizing that it is unlikely all impacted groundwater can be removed by any
technology. The project will be phased. The objectives of the first phase, �vhich this design
addresses, are as follows:
* Provide hydrodynamic control to retard/halt advancement of the main body of the plume tothe north through installation of extraction wells near the leading edge of the plume.
* Allow the formation's remaining buffering capacity to naturally attenuate impactedgroundwater that is not captured by the extraction wells.
* Initiate dewatering in the main body of the plume in an area of good saturated thicknessthough installation of additional extraction wells.
The need for subsequent phases to install more extraction wells will be evaluated based on
monitoring data collected for up to a one year period after system operation is initiated.
4.1 -RECOVERY WELL SPACING
Four recovery wells will be installed near the northern limits of the plume (Figure 4-1). Three
additional recovery wells will be installed south of an area within the plume where a significant
number of existing monitoring �vells are present. Groundwater pumping effectiveness will be
enhanced by hydraulically fracturing the lower four feet of each well. The following design
criteria were taken into account during extraction well design and selection of extraction well
locations:
* Reduce the potential for "short circuiting" during hydraulic fracturing due to the presenceof numerous existing monitoring �vells in the area that penetrate the Z-3 (wells locatedwithin the fracture radius can adversely impact propagation of the induced fracture).
* Develop overlapping zones of influence of adjacent pumping wells to maximizegroundwater capture.
* Maximize long-term usefulness of the wells by locating each in a zone of significantsaturated thickness.
* Locate extraction wells back from the leading edge of the plume to reduce the potential formobilizing the plume by hydraulic fracturing operations.
The Jacobs distance-drawdown equation was used to estimate drawdown resulting from pumping a
well where hydraulic fracturing has been completed. Appendix E of this report includes the
4-I
Hydraulic Fracturing Pilot Test Results and Preliminary Full Scale Design December 23, 2003MACTEC Engineering and Consulting. Inc. Revision 0
calculations and graphs used to evaluate well spacing. The Jacobs equation models a �vell where
the radius of fracturing is 40 feet and, within that zone, the hydraulic conductivity is estimated to
be 10.07 feet per day (fLld) and the storativity is estimated to be 0.0017. In the unfractured zone,
beyond the radius of hydraulic fracturing, the hydraulic conductivity is estimated to be 2.91 ft/d
and storativity is estimated to be 0.03. By varying the saturated thickness based on information
provided in the October 2002 Annual Report, the transmissivity of the Z-3 is recalculated to reflect
conditions at the proposed location of the recovery well.
The model was calibrated to the results of the two pumping tests. Predicted drawdown matched
within 0.02 feet of observed drawdown values for fractured and unfractured tests. Based on the
predicted drawdown in the fractured and un-fractured zones, the radius of drawdown after one day
of pumping was conservatively estimated to be 100 feet. The theoretical radius of the fracture zone
is 40 to 50 feet. This estimate provides the basis for evaluating the hydraulic effect of pumping the
fractured wells.
The model was then set to evaluate pumping in a fractured well located at a saturated thickness of
25 feet. The pumping rate for the model was then set at 5.0 gpm. This pumping rate was selected
because it produced a dra�vdown in the pumping �vell that was not more than 12.5 feet or 50% of
the initial saturated thickness. The model results indicated a drawdown of approximately 0.40 feet,
at a radial distance of 100 feet after 10 days. Assuming negligible recharge, the drawdown at 100
feet is estimated to be approximately 1 foot after 90 days (Appendix E).
The model was then changed to calculate the drawdown in a well located where the initial saturated
thickness is 10 feet. In order to refrain from creating too large a drawdown in the well, the
maximum pumping rate was estimated to be 2 gpm. This rate produced 0.12 feet of drawdown 100
feet from the pumping well after 10 days and 0.79 feet of drawdown after 90 days (Appendix E).
The lateral capture zone was also calculated for the wells using the steady-state equation by Todd.
The results of this calculation indicate that the capture zone for a well installed into an unfractured
Z-3 aquifer where pumping rates of 2 to 5 gpm can be sustained extends approximately 300 feet to
either side of a flow line through the pumping well. The downgradient distance to the null point is
estimated to be approximately 100 feet (Appendix E).
4-2
Hydraulic Fracturing Pilot Test Results and Preliminary Full Scale Design December 23, 2003MACTEC Engineering and Consulting, Inc. Revision 0
Based on the above evaluations, �vells located at the northern limits of the plume (Figure 4-1) are
spaced on approximate 200 foot centers where the xvells are located in a saturated formation
approximately 25 feet thick. To the east, where the saturated thickness is ohly 10 feet, the spacing
between the wells is approximately 150 feet. Appendix E of this report includes the printouts from
the Jacobs calculations to evaluate well spacing and pumping rates.
4.2 RECOVERY WELL INSTALLATION
A total of seven recovery wells will be installed within the impacted plume at the site (Figure 4-2).
These �vells will be arranged in two well field lines approximately 700 feet apart. The northern
line will be located approximately 200 feet south of the leading edge of the plume and will consist
of four wells. The wells have been designated as RW-1 1, RW-12, RW-13, and RW-14. Three of
the wells will be installed along the 25-feet isopach line of saturation. The fourth well will be
installed where the saturated thickness is approximately 10 feet in order to provide hydrodynamic
control along the eastern edge of the plume. The southern line of recovery wells has been
designated as RW-15, RW-16, and RW-17. These wells will be installed in the western half of the
plume in an area where the saturated thickness ranges from approximately 20 to 35 feet. It is
anticipated that operation of these wells will assist in dewatering the saturated zone as the northern
line of wells decreases the saturated thickness over time.
To maximize dewatering of the Z-3, it is important to fracture the extraction wells as close to the
base of the Z-3 as feasible. However, a coal seam exists immediately below the base of the Z-3
and if the extraction well penetrates the coal seam, there is a chance that the induced fracture could
propagate through the coal instead of the Z-3. While it is possible that fracturing the coal could
allow for dewatering of the Z-3, the effectiveness of fracturing the coal underlying the Z-3 has not
been tested; therefore, drilling procedures were developed to maximize the accuracy of determining
the depth of the base of the Z-3 while minimizing the chances of fracturing the coal. The
remainder of this section outlines the drilling and well completion procedures developed to address
the above issues.
Data provided by UNC were used to estimate the elevation of the base of the 1.3 at the proposed
location of each recovery well. Appendix F of this report provides a summary table, calculation
sheets for each well, and a figure used to estimate the depth of the formation at each proposed well.
Based on triangulation of the strike and dip of the base of the Z-3 within triangles constructed with
4-3
Hydraulic Fracturing Pilot Test Results and Preliminary Full Scale Design December 23, 2003MACTEC Engineering and Consulting, Inc. Revision 0
monitoring �vells that encountered this formation, the elevations of the base of Z-3 were estimated.
Table 4-1 includes a summary of those estimated elevations.
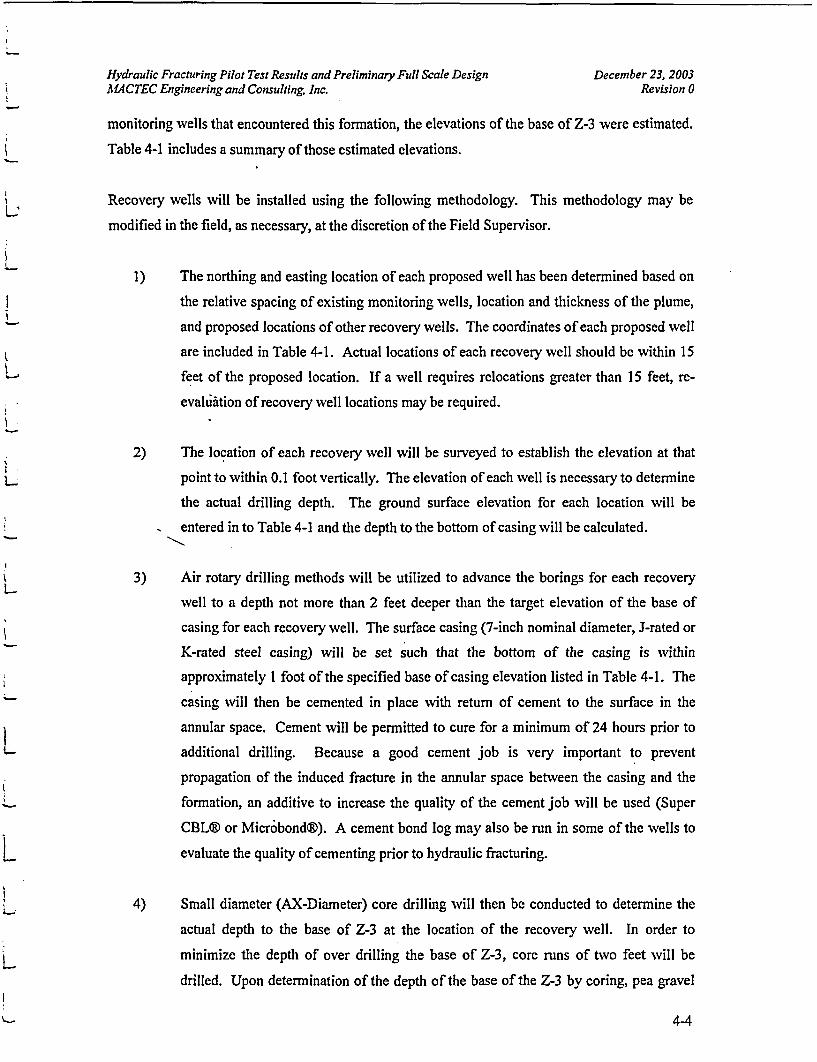
Recovery xvells will be installed using the following methodology. This methodology may be
modified in the field, as necessary, at the discretion of the Field Supervisor.
1) The northing and easting location of each proposed �vell has been determined based on
the relative spacing of existing monitoring wells, location and thickness of the plume,
and proposed locations of other recovery wells. The coordinates of each proposed well
are included in Table 4-1. Actual locations of each recovery well should be within 15
feet of the proposed location. If a well requires relocations greater than 15 feet, re-
evaliirtion of recovery well locations may be required.
2) The location of each recovery well will be surveyed to establish the elevation at that
point to within 0.1 foot vertically. The elevation of each well is necessary to determine
the actual drilling depth. The ground surface elevation for each location will be
entered in to Table 4-I and the depth to the bottom of casing will be calculated.
3) Air rotary drilling methods will be utilized to advance the borings for each recovery
well to a depth not more than 2 feet deeper than the target elevation of the base of
casing for each recovery well. The surface casing (7-inch nominal diameter, J-rated or
K-rated steel casing) will be set such that the bottom of the casing is within
approximately 1 foot of the specified base of casing elevation listed in Table 4-1. The
casing will then be cemented in place with retum of cement to the surface in the
annular space. Cement will be permitted to cure for a minimum of 24 hours prior to
additional drilling. Because a good cement job is very important to prevent
propagation of the induced fracture in the annular space between the casing and the
formation, an additive to increase the quality of the cement job will be used (Super
CBL® or Microbond®). A cement bond log may also be run in some of the wells to
evaluate the quality of cementing prior to hydraulic fracturing.
4) Small diameter (AX-Diameter) core drilling will then be conducted to determine the
actual depth to the base of Z-3 at the location of the recovery well. In order to
minimize the depth of over drilling the base of Z-3, core runs of Iwo feet will be
drilled. Upon determination of the depth of the base of the Z-3 by coring, pea gravel
4-4
Hydraulic Fracturing Pilot Test Results and Preliminary Full Scale Design December 23, 2003MACTEC Engineering and Consulting. Inc. Revision 0
will be placed into the well to fill the core hole to a level above the base of Z-3. It is
anticipated that less than two feet of pea gravel would be placed to accomplish this.
5) The well will then be reamed to a final depth approximately 0.5 to 1 foot above the
base of Z-3. The diameter of the open hole will be as large as practical, given the 7-
inch diameter casing above the open hole. A mixture of pea gravel and medium sand
will be placed at the bottom of the well to fill the remaining small diameter portion of
the boring. This layer will be topped with approximately 0.2 feet of fine sand. This
should reduce the chances of the fracture propagating down the well and into the coal.
6) Hydraulic fracturing will be completed immediately after the recovery wells have been
pumped for a period of at least one week at a pumping rate of 0.5 to 1.0 gpm for
development purposes. Well development will also depress the water table in the areas
where hydraulic fracturing operations will occur to minimize the potential impact of
water pumped into the formation during fracturing operations. Development water
will be pumping into temporary tanks and disposed in the existing spray aeration
ponds.
If feasible based on encountered subsurface conditions, all wells may be drilled to the casing depth
before casing is set and cemented to minimize mobilization expenses by Halliburton. Hydraulic
fracturing operations may also be completed in one mobilization; this will also allow for efficient
monitoring of induced fractures by Pinnacle Technologies.
4.3 RECOVERY SYSTEM COMPONENTS INSTALLATION
A water extraction and conveyance system was designed to handle water from the seven wells to
be installed during the first phase of the project as well as additional extraction wells that may be
installed during subsequent phases of remediation. Wherever feasible, equipment and systems
already existing onsite were used. Operational and maintenance experience of current site
personnel was also considered as one of the criteria for equipment selection. Substitutions of
equivalent materials and equipment may be made to the materials and equipment outlined in this
design based on availability and actual field conditions encountered.
4-5
Hydraulic Fracturing Pilot Test Results and Preliminary Full Scale Design December 23. 2003MACTEC Engineering and Consulting, Inc. Revision 0
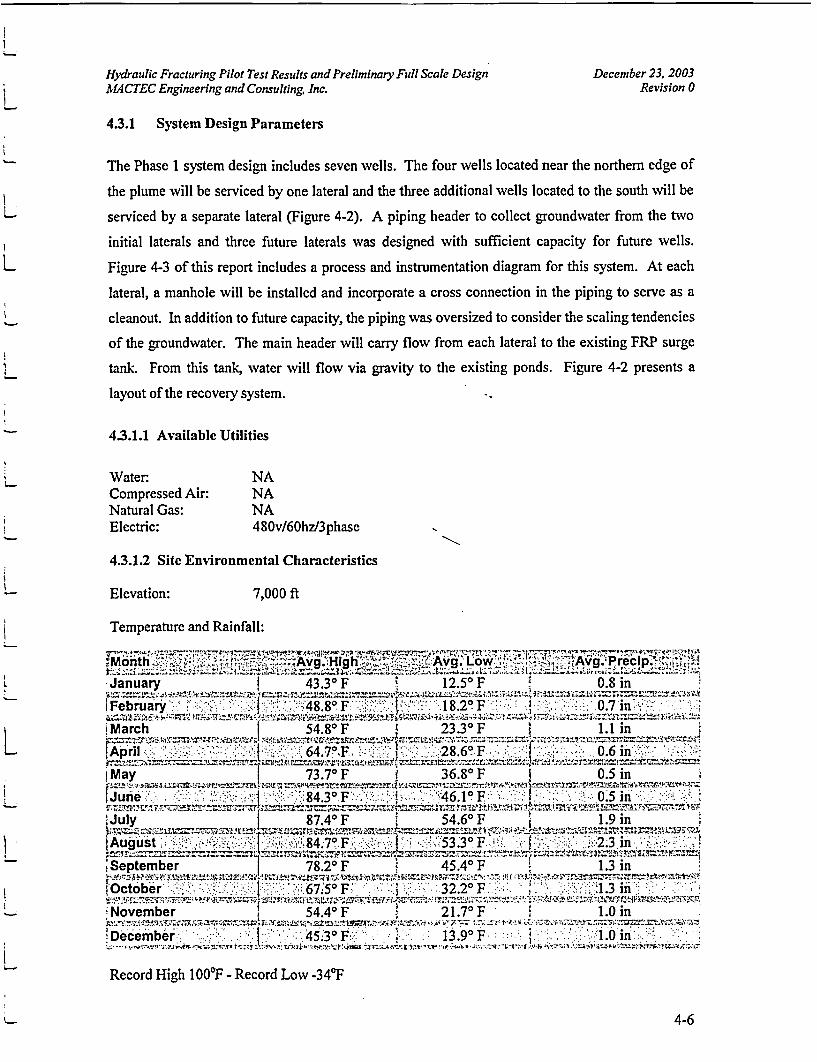
4.3.1 System Design Parameters
The Phase I system design includes seven wells. The four wells located near the northern edge of
the plume �vill be serviced by one lateral and the three additional wells located to the south will be
serviced by a separate lateral (Figure 4-2). A piping header to collect groundwater from the two
initial laterals and three future laterals was designed with sufficient capacity for future wells.
Figure 4-3 of this report includes a process and instrumentation diagram for this system. At each
lateral, a manhole �vill be installed and incorporate a cross connection in the piping to serve as a
cleanout. In addition to future capacity, the piping was oversized to consider the scaling tendencies
of the groundwater. The main header will carry flow from each lateral to the existing FRP surge
tank. From this tank, water will flow via gravity to the existing ponds. Figure 4-2 presents a
layout of the recovery system.
4.3.1.1 Available Utilities
Water: NACompressed Air: NANatural Gas: NAElectric: 480v/6ohzl3phase -.
4.3.1.2 Site Environmental Characteristics
Elevation: 7,000 ft
Temperature and Rainfall:
�Month �2AVg'�4.
January 43*30 F 12.50 F 0.8 in.:'*��
February ' I 48.80 F [ 18.20 FJ7 ' 07rnV �*
March 1 54.80 F 23.30 F 11 in
rApril <. 1W 64.70.F. >K'4' 28.60 Fi i 06 intMay 73.70 F 36.80 F I _ OSin
[June t 84.30.F vijij.L 46.1� F.' Y. i 0 5 in
July 87.40 F 54.60F 1 9in
� August 2 �84.7� FK 5330 F.§. 23 in
September 178.20F 45�4o F 13 inr.fl� �
October; __ 1 67.50 F 32.20 F:.>; 13 in,�
* November . .. �.4 I Oin�"�-�Z � inK.
.. .1< ... j� *.December .�. . 4530 F K. 13.90 F ..w.: . .*.
Record High I 000F - Record Low -340F
4-6
Hydraulic Fracturing Pilot Test Results and Preliminary Full Scale DesignMACTEC Engineering and Consulting, Inc.
December 23. 2003Revision 0
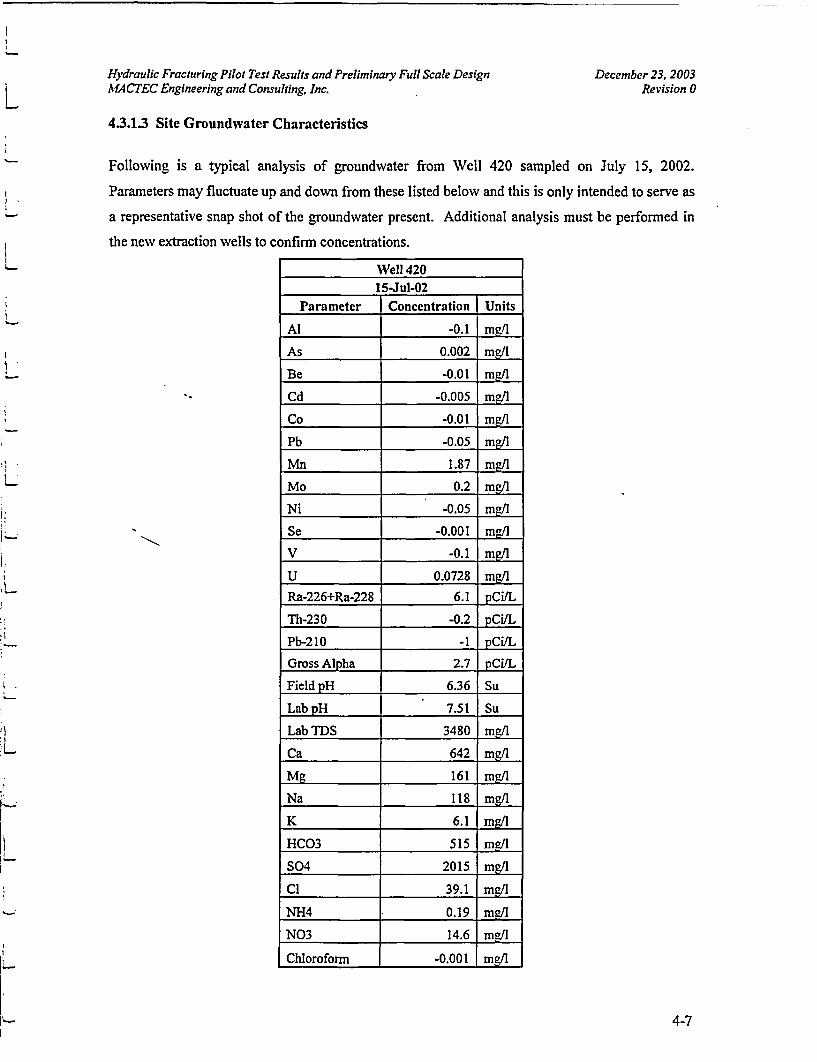
4.3.1.3 Site Groundwater Characteristics
Following is a typical analysis of groundwater from Well 420 sampled on July 15, 2002.
Parameters may fluctuate up and down from these listed below and this is only intended to serve as
a representative snap shot of the groundwater present. Additional analysis must be performed in
the new extraction wells to confirm concentrations.
Well 42015-Jul-02 ______
Parameter Concentration Units
Al -0.1 �g�LAs 0.002 malI
Be -0.01 ma/i
Cd -0.005 ma/I
Co -0.01 �Pb -0.05 .�LLMn 1.87 n�LMo 0.2 �LNi -0.05 mg/I
Se -0.001 j�g�
V -0.1 .n�LU 0.0728 .�&�1LRa-226+Ra-228 6.1 pCiIL
Th-230 -0.2 pCiIL
Pb-210 -1 pCi/L
Gross Alpha 2.7 pCifL
6.36 Su
Lab pH 7.51 Su
LabTDS 3480 �Ca 642 �Mg 161 �
Na 118 �K 6.1 �
HCO3 515 mall
S04 2015 .i�LLCl 39.1 .jn&�LNH4 0.19 ma/I
N03 14.6 ma/I
Chloroform -0.001 �
4-7
Hydraulic Fracturing Pilot Test Results and Preliminary Full Scale DesignMACTEC Engineering and Consulting. Inc.
December 23, 2003Revision 0
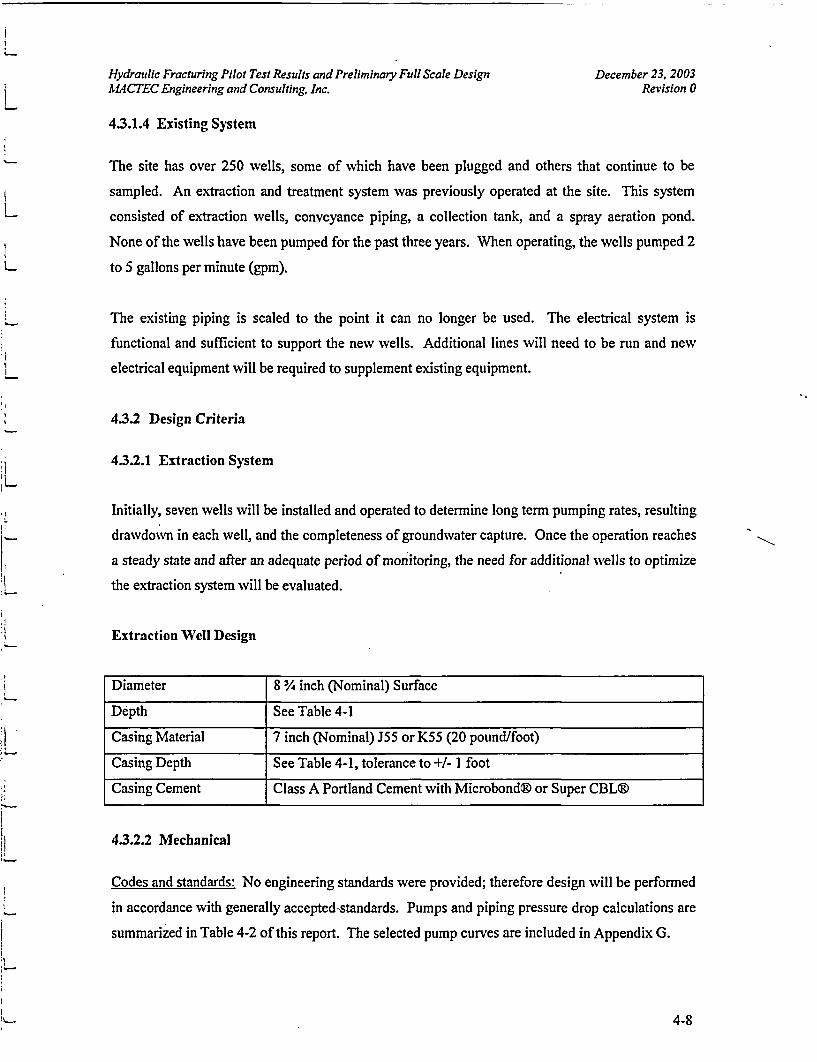
4.3.1.4 Existing System
The site has over 250 wells, some of which have been plugged and others that continue to be
sampled. An extraction and treatment system was previously operated at the site. This system
consisted of extraction �vells, conveyance piping, a collection tank, and a spray aeration pond.
None of the wells have been pumped for the past three years. When operating, the wells pumped 2
to 5 gallons per minute (gpm).
The existing piping is scaled to the point it can no longer be used. The electrical system is
functional and sufficient to support the new ;vells. Additional lines will need to be run and new
electrical equipment will be required to supplement existing equipment.
4.3.2 Design Criteria
4.3.2.1 Extraction System
Initially, seven wells will be installed and operated to determine long term pumping rates, resulting
drawdown in each well, and the completeness of groundwater capture. Once the operation reaches
a steady state and after an adequate period of monitoring, the need for additional ivells to optimize
the extraction system will be evaluated.
Extraction Well Design
Diameter 8 % inch (Nominal) Surface
Depth See Table 4-1
Casing Material 7 inch (Nominal) J55 or 1(55 (20 pound/foot)
Casing Depth See Table 4-1, tolerance to +1- 1 foot
Casing Cement Class A Portland Cement with Microbond® or Super CBL®
4.3.2.2 Mechanical
Codes and standards: No engineering standards were provided; therefore design will be performed
in accordance with generally accepted-standards. Pumps and piping pressure drop calculations are
summarized in Table 4-2 of this report. The selected pump curves are included in Appendix G.
4-8
Hydraulic Fracturing Pilot Test Results and Preliminary Full Scale DesignMACTEC Engineering and Consulting. Inc.
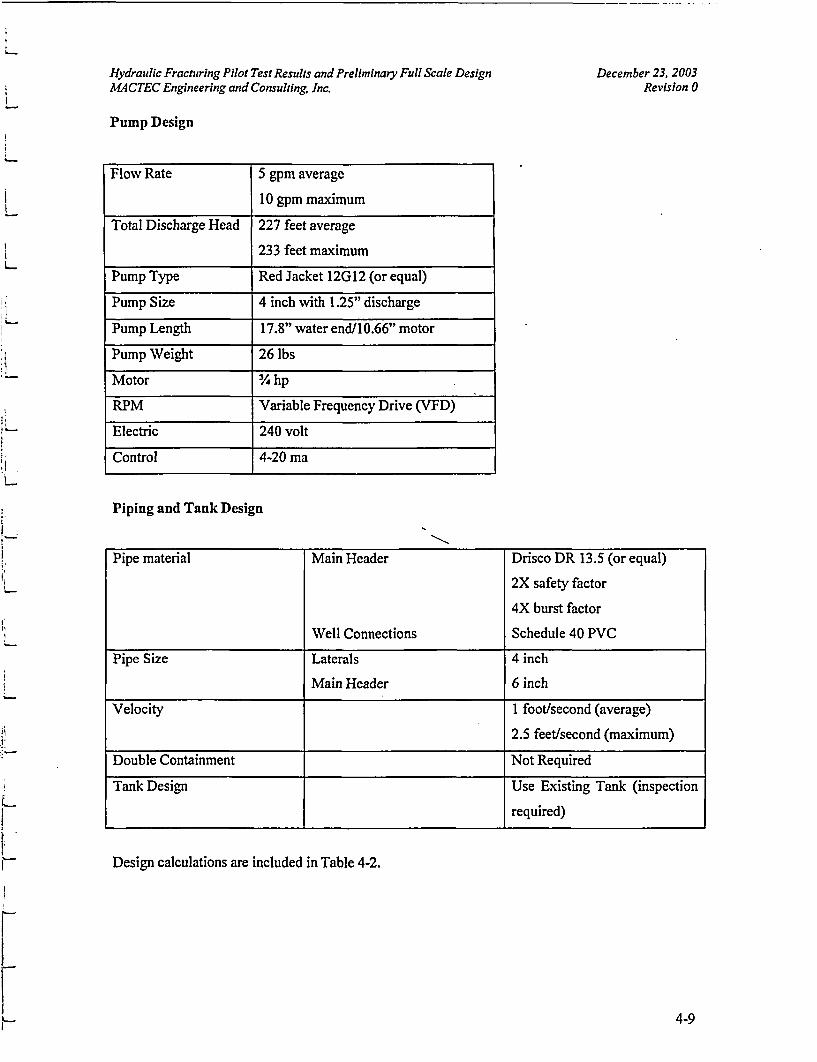
Pump Design
December 23, 2003Revision 0
Flow Rate 5 gpm average
10 gpm maximum
Total Discharge Head 227 feet average
233 feet maximum
Pump Type Red Jacket 12G12 (or equal)
Pump Size 4 inch with 1.25" discharge
Pump Length 17.8" water end/1O.66" motor
Pump Weight 26 lbs
Motor %hp
RPM Variable Frequency Drive (VFD)
Electric 240 volt
Control 4-20 ma
Piping and Tank Design
Pipe material Main Header Drisco DR 13.5 (or equal)
2X safety factor
4X burst factor
Well Connections Schedule 40 PVC
Pipe Size Laterals 4 inch
Main Header 6 inch
Velocity 1 foot/second (average)
2.5 feet/second (maximum)
Double Containment Not Required
Tank Design Use Existing Tank (inspection
required)
Design calculations are included in Table 4-2.
4-9
Hydraulic Fracturing Pilot Test Results and Preliminary Full Scale Design December 23. 2003MACTEC Engineering and Consulting. Inc. Revision 0
4.3.2.3 Electrical
Codes and sfandards: No engineering standards were provided; therefore design �vill be performed
in accordance with generally accepted standards.
Power source: 480 volt power is available onsite. Po�ver �vill be delivered to the general area of
the new wells via a pole line. A pole will be strategically placed at each set of wells. A 240 volt
transformer will be mounted on each of these poles and wired to a junction box on the pole. From
the junction box, 240 single phase, 4 conductor power will be placed in a trench and routed to each
well head. A ground wire from the transformer will also be run in the trench to each well. The 240
volt power will be wired into a junction box at the well where it can then be tapped for the Variable
Freqjdency Drive (VFD), control power, and heat trace. The ground wire is required for heat trace
and lightning protection. Single line, sections and voltage drop calculations are provided on Figure
4-4 and Table 4-3.
Control Philosophy: Control of water levels in each well will be accomplished using a
combination of level controls and VEDs. A level element will be placed in each well. The level
signal will sent to a level controller, which in turn will send the signal to the VED capable of
Proportional, Integral, and Differential (PIlE)) control. Based on programmed set points, the level
of water measured in the well will be maintained by speeding up and slowing down the pump
motor. At the high level, the pump speed will be increased until the desired set point is met. At the
low level, the pump speed will be decreased until the desired set point is reached.
4.3.3 Assumptions
* Sufficient power exists on the site to operate the new wells.* The existing storage tank will be used to transfer water from wells via gravity to existing
ponds.
* All piping from existing tank to the ponds will be reused.
* Systems will be designed using generally accepted engineering practices.
4-10
Hydraulic Fracturing Pilot Test Results and Preliminary Full Scale Design December 23, 2003MACTEC Engineering and Consulting. Inc. Revision 0
4.3.4 Recommendations
* The existing equalization tank should be inspected for integrity.
* Existing piping from equalization tank to the ponds should be pressure tested prior to use.
* Existing piping around ponds should be rerouted and supported to eliminate sags. Valvesand instruments in the existing line between the tank and ponds will need to be checkedand replaced, if necessary.
4.4 WELL HYDRAULIC FRACTURING AND MONITORING
Prior to the completion of hydraulic fracturing of recovery wells, certain existing monitoring �vells
will require closure. Specifically, any existing monitoring �vells located within 100 feet of a
recovery well will be sealed with a high quality cement job. Based on review of available
information, existing monitoring well PB-0l will require closure. If any other wells that intersect
the Z-3 are located within 100 feet of a recovery well, they may also require sealing.
Open-hole hydraulic fracturing will be completed at each well in a similar fashion to the Stage I
treatment conducted during the pilot test. Prior to final design of the fracturing program,
discussions will be held with Halliburton to determine if there are any adjustments that can be
made to the procedures used during the pilot test to increase the ultimate performance of the
extraction �vells. Items that will be considered will include, but not be limited to, water volume,
sand volume, sand size, sand density, and pumping rate.
To monitor the growth and coverage of the induced hydraulic fractures, Pinnacle Technologies will
be contracted to set up an array of surface tilt meters, similar to the pilot test. Tilt meter data will
be used to help design future phases of the dewatering program.
Pre- and post-hydraulic fracture logging of each well with the DOPTV will also be conducted. The
data collected by DOPTV logging will provide good indications of the effectiveness of fracturing
and will a determination of the depth, width, and orientation of the induced fracture at each well.
4-11
Hydraulic Fracturing Pilot Test Results and Preliminary Full Scale Design December 23, 2003MACTEC Engineering and Consulting, Inc. Revision 0
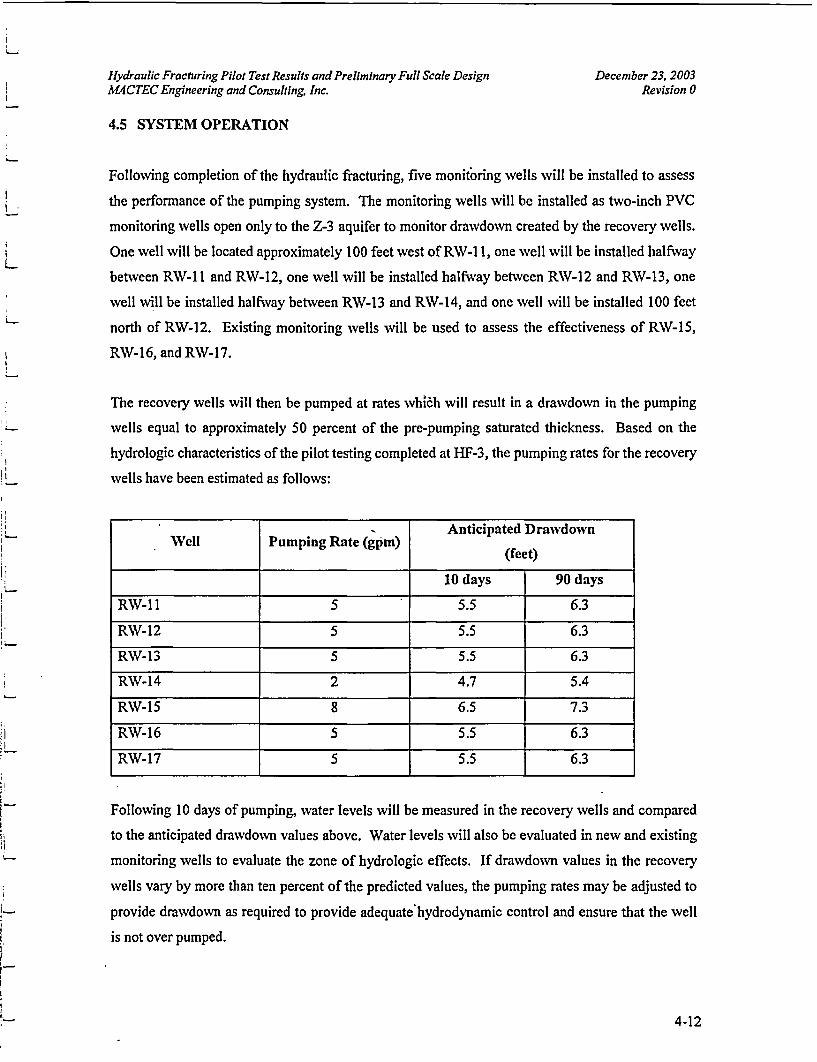
4.5 SYSTEM OPERATION
Following completion of the hydraulic fracturing, five monitoring xveils xviii be installed to assess
the performance of the pumping system. The monitoring xvells xviii be installed as two-inch PVC
monitoring xvells open only to the Z-3 aquifer to monitor drawdown created by the recovery xvells.
One well xviii be located approximately 100 feet xvest of RW-1 1, one xvell will be installed halfway
between RW-1 1 and RW-12, one well will be installed halfway between RW-12 and RW-13, one
well xviii be installed halfWay between RW-13 and RW-14, and one xvell xviii be installed 100 feet
north of RW-12. Existing monitoring xvelis will be used to assess the effectiveness of RW-15,
RW-16, and RW-17.
The recovery wells will then be pumped at rates wh�h xvill result in a drawdown in the pumping
xvells equal to approximately 50 percent of the pre-pumping saturated thickness. Based on the
hydrologic characteristics of the pilot testing completed at HF-3, the pumping rates for the recovery
xvells have been estimated as follows:
Well Pumping Rate (gpm) Anticipated Drawdown
(feet)
10 days 90 days
RW-l1 5 5.5 6.3
RW-12 5 5.5 6.3
RW-13 5 5.5 6.3
RW-14 2 4.7 5.4
RW-15 8 6.5 7.3
RW-16 5 5.5 6.3
RW-17 5 5.5 6.3
Folioxving 10 days of pumping, water levels xviii be measured in the recovery wells and compared
to the anticipated drawdown values above. Water levels will also be evaluated in new and existing
monitoring xvells to evaluate the zone of hydrologic effects. If drawdown values in the recovery
wells vary by more than ten percent of the predicted values, the pumping rates may be adjusted to
provide drawdown as required to provide adequate hydrodynamic control and ensure that the well
is not over pumped.
4-12
Hydraulic Fracturing Pilot Test Results and Preliminary Full Scale Design December 23, 2003MACTEC Engineering and Consulting, Inc. Revision 0
The performance of the recovery system will also be evaluated based on 30, 60, and 90 days of
operation.
4.6 FEASIBILITY ANALYSIS
4.6.1 Effectiveness
Use of extraction wells is a proven method of dewatering a saturated unit, provided the porosity
and permeability of the formation are adequate to allow for a reasonable well spacing. Hydraulic
fracturing to enhance the conductivity of the formation will allow the selected remedy to be
adequately effective.
* .4.6.2 Reliability
The system has been designed to for good reliability and low maintenance. Because scaling may
be an issue, conveyance piping has been over sized and clean out provisions have been made.
Existing site personnel are familiar with operating and maintaining most of the equipment
specified.
� 4.6.3 Implenientability
Construction of the system will be relatively easy. No unusual construction issues are anticipated.
Standard construction, well installation, and well stimulation procedures have been used in the
design.
4.6.4 Disruptiveness
The only disruptiveness anticipated is the need to close a road located on UNG property for limited
periods during hydraulic fracturing operations so that vibrations from traffic do not impact surface
tilt meter results
4.6.5 Relative Time Required
The estimated time required for extraction well installation is approximately 2 weeks. Hydraulic
fracturing operations can be completed over a Iwo or three day period. Well development,
preliminary evaluation of the pumping system, and construction of the extraction and conveyance
systems can be completed within two month of completion of hydraulic fracturing. Assessment of
system effectiveness can be completed within a year of initiation of extraction. Overall, the time
required for system installation and evaluation is relatively short.
4-13
Hydraulic Fracturing Pilot Test Results and Preliminary Full Scale DesignMACTEC Engineering and Consulting, Inc.
December 23, 2003Revision 0
4.6.6 Relative Cost
Costs for implementation of the system are currently being developed. It is believe that the system
will be more cost effective than other feasible technologies that have been evaluated.
I
4-14
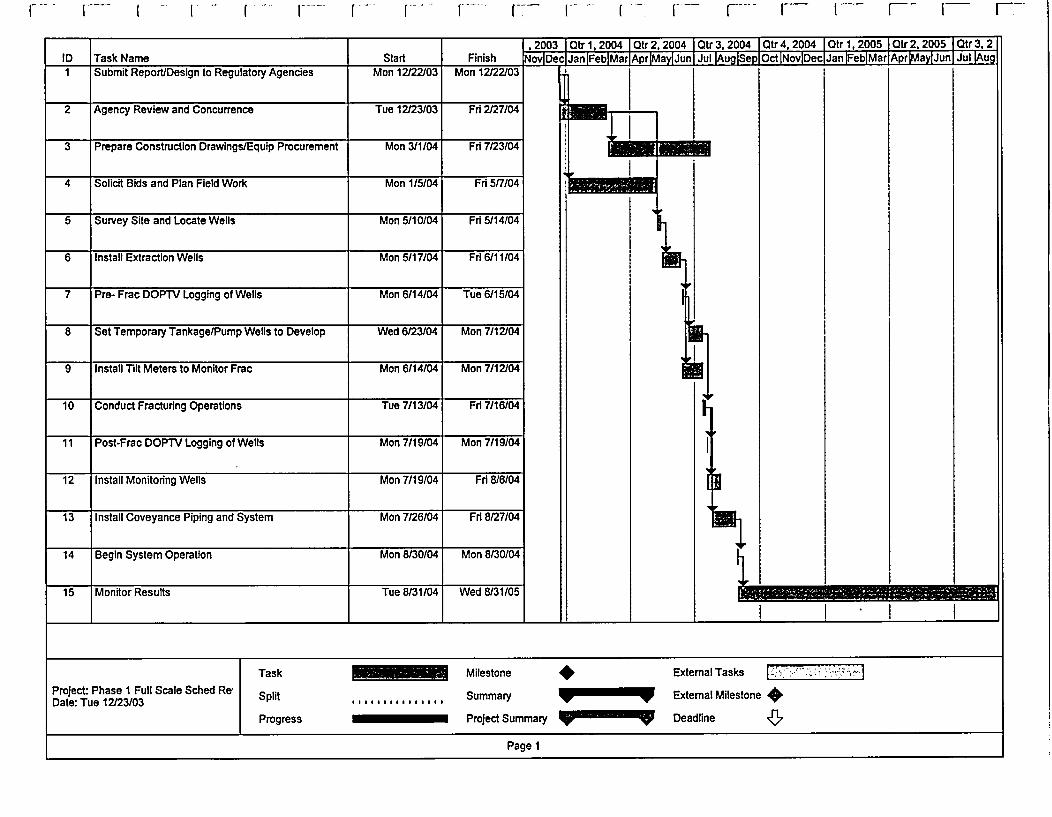
-- - L� ( I F7 - 7 V F I I F I� F�
T lj, 2003 Qtr 1,2004 Qtr 2,2004 Ott 3,2004 Ott 4,2004 Ott 1, 2005 Ott 2,2005 Ott 3,21ID lTaskName Start Finish Nov Dec Jan Feb Mar Ar Ma Jun Jul u Se Oct Nov Dec Jan Feb Mat Ar Ma Jun Jul u
Submit Report/Design to Regulatory Agencies Mon 12122103 Mon 12/22/03
2 Agency Review and Concurrence Tue 12123103 Fri 2/27/04
3 Prepare Construction Drawings/Equip Procurement Mon 3/1/04 Fri 7/23/04
4 Solicit Bids and Plan Field Work Mon 1/5/04 Fri 5/7/04
5 Survey Site and Locate Wells Mon 5/10/04 Fri 5/14/04
6 Install Extraction Wells Mon 5/17/04 Fri 6/11/04
7 Pre- Frac DOPTV Logging of Wells Mon 6/14/04 Tue 6/15/04
8 Set Temporary Tankage/Pump Wells to Develop Wed 6123/04 Mon 7/1 2104
9 Install Tilt Meters to Monitor Frac Mon 6/14/04 Mon 7/1 2104
10 Conduct Fracturing Operations Tue 7/13/04 Fri 7/16/04
11 Post-Frac DOPTV Logging of Wells Mon 7/19/04 Mon 7/19/04
12 Install Monitoring Wells Mon 7/19/04 Fri 8/6/04
13 Install Coveyance Piping and System Mon 7126/04 Fri 8127/04
14 Begin System Operation Mon 8/30/04 Mon 8/30/04
15 Monitor Results Tue 8�31IO4 Wed B131105
J A L L 1... _____________ _____________ _____________ ______________ - -
Page 1
Hydraulic Fracturing Pilot Test Results and Preliminary Full Scale Design December 23, 2003MACTEC Engineering and Consulting. Inc. Revision 0
5.0 PROJECT HEALTH AN]) SAFETY
Prior to initiation of field work, MACTEC will prepared a bite-specific Health and Safety Plan
(HASP) for MACTEC employees that address the potential hazards associated with the proposed
work. The HASP �vill be prepared in accordance with OSHA standards and �vill includes an
identification of the anticipated site hazards, requirements for personal protective equipment (PPE)
and air monitoring, action levels for upgrading PPE levels, and emergency procedures. MACTEC
will require subcontractors to comply with MACTEC's HASP or provide their own HASP that will
meet or exceed the requirements of MACTEC's HASP. Any visitors to the site will be required to
comply with MACTEC's HASP.
MACTEC and subcontractor personnel will have�ppropdate training. Prior to the start of field
work or any new field activity, MACTEC's Site Safety Officer (SSO) will conduct a tailgate health
and safety meeting for all field personnel. These meetings will be documented in MACTEC's
master copy of the HASP kept on site and in the field notebook.
5-1
Hydraulic Fracturing Pilot Test Results and Preliminary Full Scale DesignMACTEC Engineering and Consulting. Inc.
December23. 2003Revision 0
TABLES
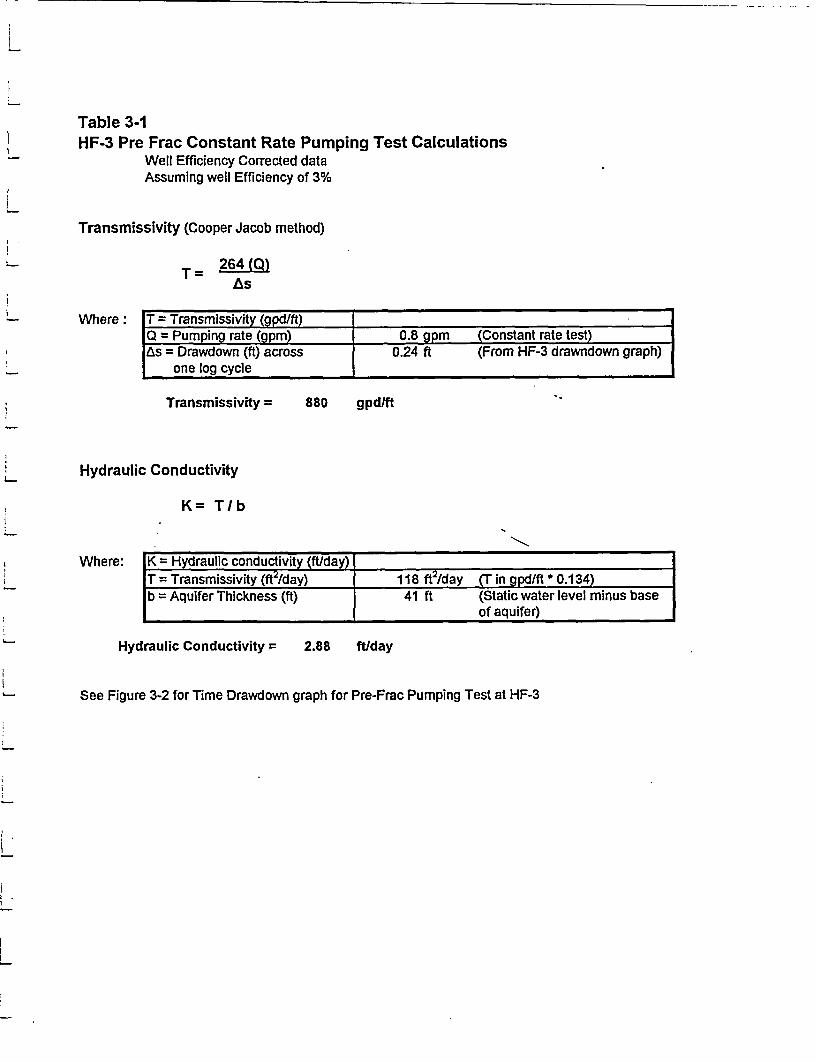
Table 3-1HF-3 Pre Frac Constant Rate Pumping Test Calculations
Well Efficiency Corrected dataAssuming well Efficiency of 3%
Transmissivity (Cooper Jacob method)
T= 264 (Q)As
Where: T Transmissivit ( ittI = Pumping rate (gpm) 0.8 gpm (Constant rate test)
As = Drawdown (ft) across 0.24 ft (From HF-3 drawndown graph)
Transmissivity = 880 gpdlft
Hydraulic Conductivity
K= TIb
Where: 1K = Hydraulic conductivity (ft/day)
Aquifer Thickness (ft)
I118ft2/day (Tingpd/ft*0.134)41 ft (Static water level minus base
of aquifer) I
Hydraulic Conductivity = 2.88 ft/day
See Figure 3-2 for Time Drawdown graph for Pre-Frac Pumping Test at HF-3
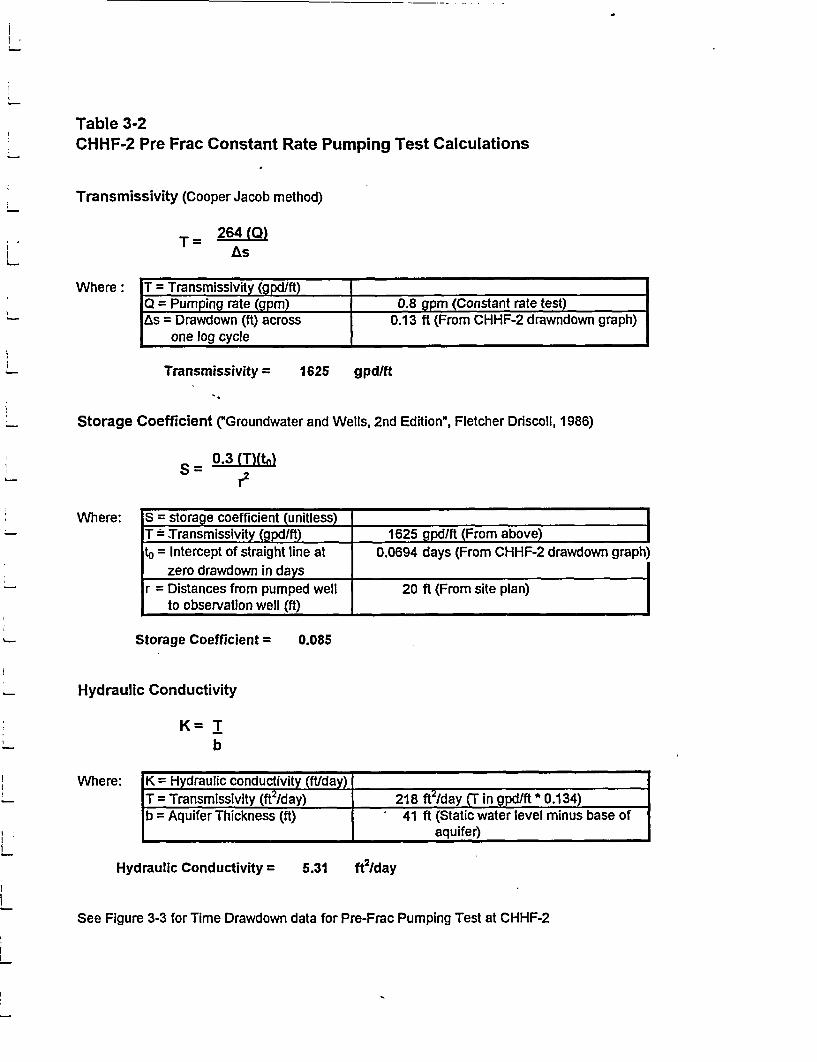
Table 3-2CHHF-2 Pre Frac Constant Rate Pumping Test Calculations
Transmissivity (Cooper Jacob method)
264(Q)As
Where: T = Transmissivit ( 1ffQ = Pum in rate m 0.8 m Constant rate test
= Drawdown (if) across 0.13 ft (From CHHF-2 drawndown graph)one log cycle
Transmissivity = 1625 gpdltt
Storage Coefficient ("Groundwater and Wells, 2nd Edition", Fletcher Driscoll, 1986)
_ 0.3 (T)(t�)
Where: S = storage coefficient (unitless)T = Transmissivity (gpdlft) 1625 1ff From above
= Intercept of straight line at 0.0694 days (From CHHF-2 drawdown graph)zero drawdown in days
r = Distances from pumped well 20 ft (From site plan)to observation well Ut)
Storage Coefficient = 0.085
Hydraulic Conductivity
K=Tb
Where: 1K = Hydraulic conductivity (ftlday) IT = Transmissivity (ft Iday) 218 ft /day CT in gpd/ft * 0.134)
(Static water level minus base ofjb = Aquifer Thickness (if) 41 ft aquifer) I
Hydraulic Conductivity =25.31 ft Iday
See Figure 3-3 for Time Drawdown data for Pre-Frac Pumping Test at CHHF-2
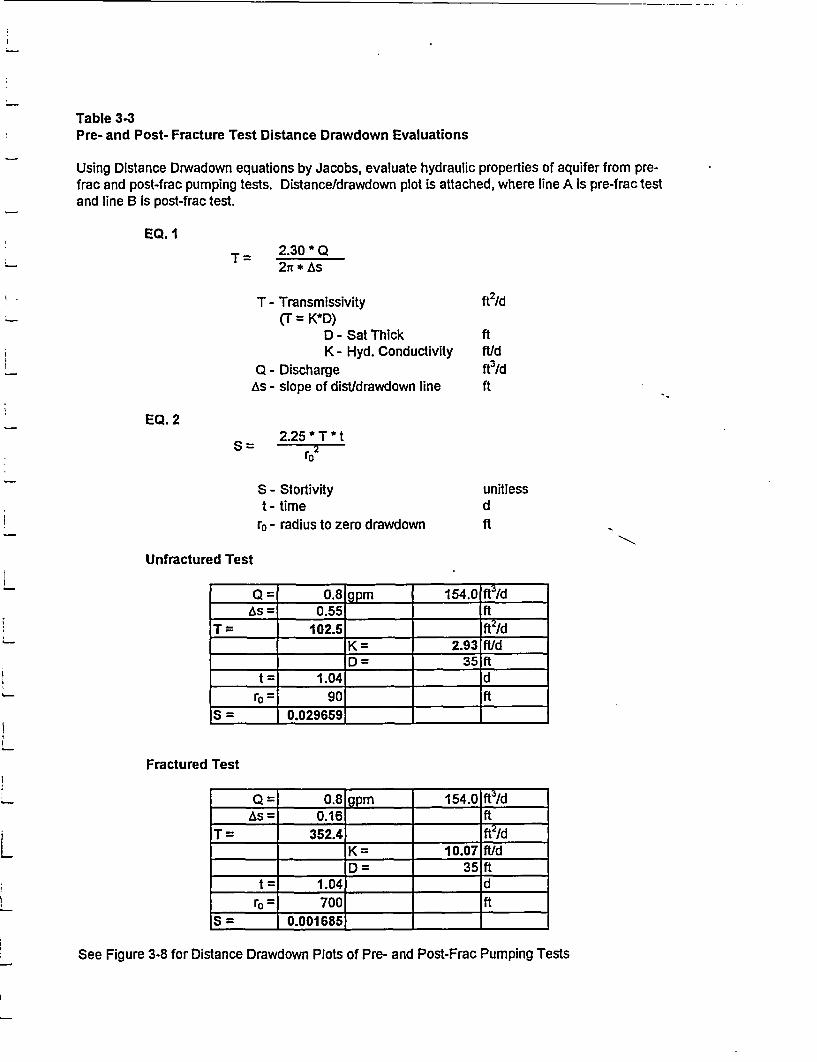
Table 3-3Pre- and Post- Fracture Test Distance Drawdown Evaluations
Using Distance Drwadown equations by Jacobs, evaluate hydraulic properties of aquifer from pre-frac and post-frac pumping tests. Distanceldrawdown plot is attached, where line A is pre-frac testand line B is post-frac test.
EQ.12.30*QT= 2it*As
T - TransmissivityC1 = K*D)
0 - Sat ThickK - Hyd. Conductivity
Q - DischargeAs - slope of dist/drawdown line
ft2/d
ftftld
3ft /dft
EQ.2
2.25* T * t
S - Stortivityt- timer0 - radius to zero drawdown
unitlessdft
Unfractured Test
______ ______ 154.0i�A5 0.55 ______ ft
______ 102.5 ______ ______
______ ______ 2.93 ft/d_____ _____ 35ft_______ 1.04 _______ d
r0= 90 _______ ftS = 0.029659 ________ ________ ________
Fractured Test
_______ 154.0�7A5 0.16 ______ ft
_______ 352.4 _______ _______ _______
______ K= 10.07 ftld______ 35ft_______ 1.04 _______ d
r0 700 ______ ft5= 0.001685 _______ _______ _______
See Figure 3-8 for Distance Drawdown Plots of Pre- and Post-Frac Pumping Tests

Table 3-4HF-3 Post Frac Constant Rate Pumping Test Calculations
Transmissivity (Cooper Jacob method)
264(Q)As
Where: IT = Transmissivity (gpd/ft)QPumin rate mI = Drawdown (fi) across
one log cycle
__ 0.8 gpm (Constant rate test)0.155 ft (From HF-3 drawdown graph) I
Transmissivity = 1363 gpd/ft
Hydraulic Conductivity
K= TIb
Where: K = Hydraulic conductivity (ftlday)
I = Transmissivity (ft2lday) I
b Aquifer Thickness (f�
183 ft Iday Cr in gpdltt * 0.134)41 ft (Static water level minus base of
aquifer)
Hydraulic Conductivity = 4.45 ft2 lday
See Figure 3-12 for Time Drawdown plot graph for Post-Frac Pumping Test at HF-3
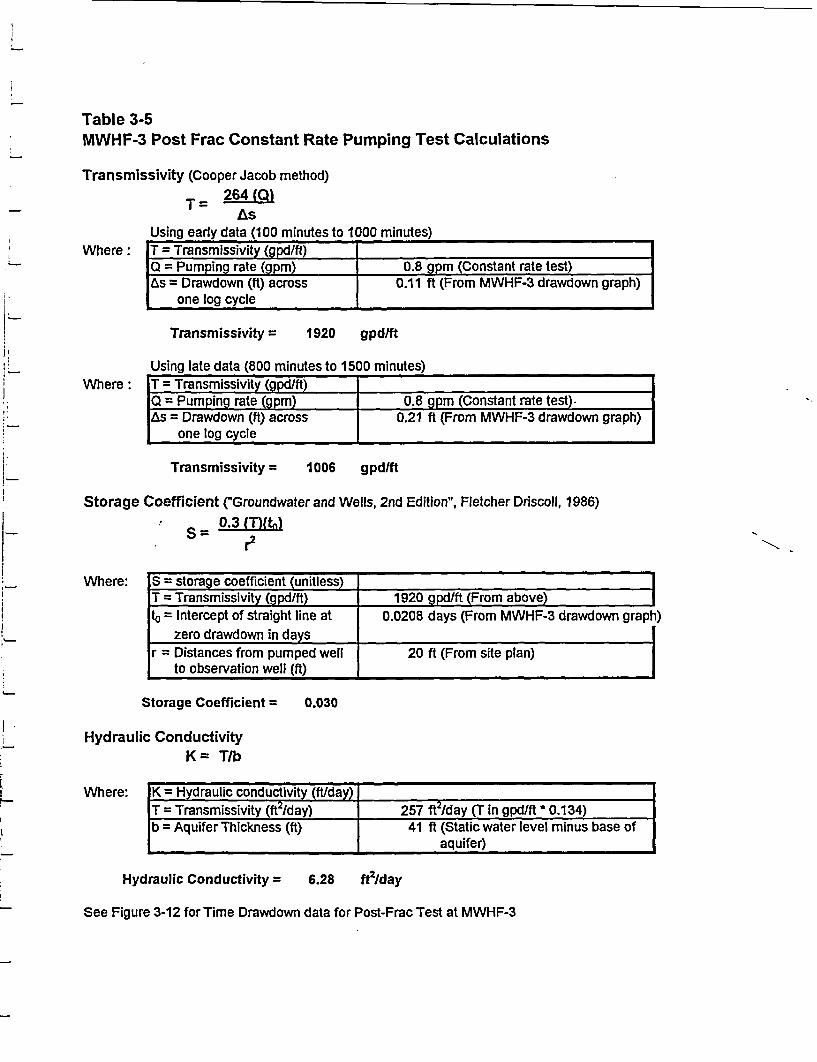
Table 3-5MWHF-3 Post Frac Constant Rate Pumping Test Calculations
Transmissivity (Cooper Jacob method)264 (0)
As
Where:
Where:
Using early data (100 minutes to 1000 minutes)I T = Transmissivity (gpd/tt)I _________________________________________
Q = Pumping rate (gpm) 1 0.8 gpm (Constant rate test)Drawdown (if) across 1 0.11 ft (From MWHF-3 drawdown graph)
one log cycle I_________________________________________Transmissivity = 1920 gpd/ft
Using late data (800 minutes to 1500 minutes)� T = Transmissivity (gpdlft) IQ = Pumping rate (gpm) 1 0.8 gpm (Constant rate test)-
= Drawdown (It) across 1 0.21 ft (From MWHF-3 drawdown graph)one log cycle I ____________________________________________________________
Transmissivity = 1006 gpdlft
Storage Coefficient ("Groundwater and Wells, 2nd Edition", Fletcher Driscoll, 1988)
s - 0.3 (T)(t0)
Where: S storage coefficient (unitless)T = Transmissivity (gpd/ft) 1920 lIt From aboveta = Intercept of straight line at 0.0208 days (From MWHF-3 drawdown graph)
zero drawdown in days_�iteplan�r = Distances from pumped well 20 ft
to observation well (ft)
Storage Coefficient = 0.030
Hydraulic ConductivityK Tib
Where: draulic conductivit ftlda
I ansmissivity (ft2/day) 257 ft2lday (T in gpd/ft * 0.134) II Thickness(s) 41 ft (Static water level minus base ofaquifer)
Hydraulic Conductivity = 6.28 U2Iday
See Figure 3-12 for Time Drawdown data for Post-Frac Test at MWHF-3
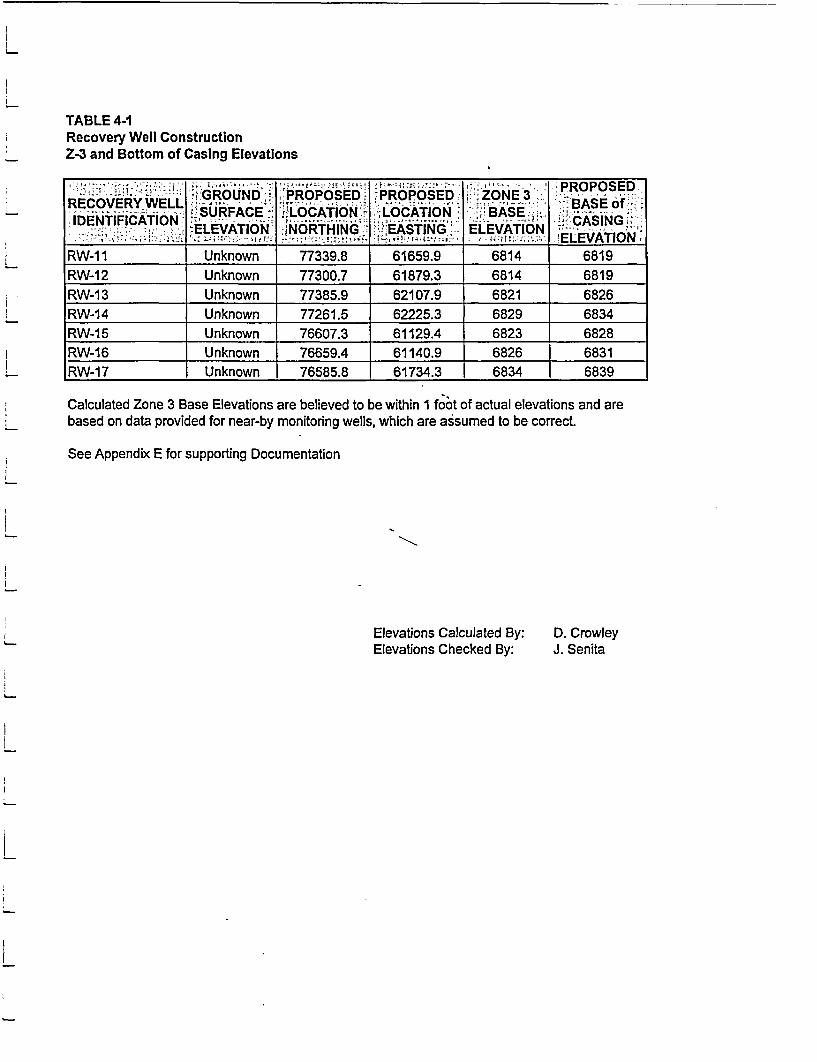
TABLE 4-1Recovery Well ConstructionZ-3 and Bottom of Casing Elevations
PROPOSEDRFCAVFRYWFII PROPOSED�
GROUND:: �2LOCATION PROPOSED �ZONE3 4BASE of'IDENTIFICATION LSURFACE _ �LOCATION, BASE CASING
ELEVATION �NORTHING 'KEASTING. ELEVATION____________ � ________ 'ELEVATlON�RW-11 Unknown 77339.8 61659.9 6814 6819RW-12 Unknown 77300.7 61879.3 6814 6819RW-13 Unknown 77385.9 62107.9 6821 6826RW-14 Unknown 77261.5 62225.3 6829 6834RW-15 Unknown 76607.3 61129.4 6823 6828RW-16 Unknown 76659.4 61140.9 6826 6831RW-17 Unknown 76585.8 - 61734.3 - 6834 j 6839
Calculated Zone 3 Base Elevations are believed to be within I fo�t of actual elevations and are
based on data provided for near-by monitoring wells, which are assumed to be correct
See Appendix E for supporting Documentation
Elevations Calculated By:Elevations Checked By:
D. CrowleyJ. Senita
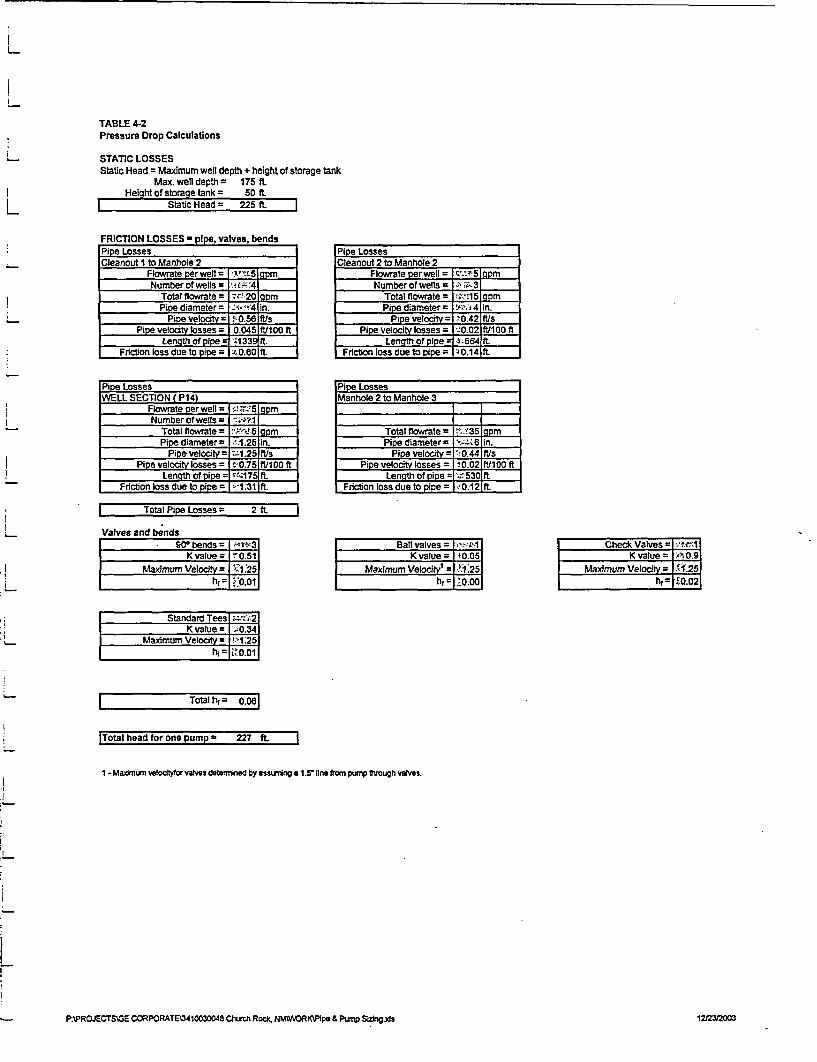
TABLE 4-2Pressure Drop Calculations
STATIC LOSSESStatic Head Maximum welt depth + height of storage tank
Max. well depth 175 ft.Height of storage tank = 50 ft.
Static Head = 225 ft.
FRICTiON LOSSES * pIpe, valves, bendsPipe Lossesr�i�nnt I fri M2nheila 9
Flowrateperwell 1��-5 mNumberofwells � 4
Total flawrate = �9J�p�Pipediameter �
Pipe velocity �Q�1fl�!�Pipevelocitylosses=
Lenath of pipe �133Filctionlossdueto I = rOOO
Pipe LossesWELL SECTION (P14)
Flowrateperwell 5 mNumberofwetls '�1
Totalflowrate �Pipe diameter :J�n��
Pipevelocjly JPipevelocltylosses= ���j�lOOft
Lenqti, of pipe = �175Friction loss due to pIpe = I �31
( TotalPi Losses 2 ft.
Valves and bendsGobends I �
K value =] �0.51Maximum VelJ�5�:�
Standard Tees �z �2JKvalue ;0.34
Maximum Velocity = �zi :251h� �0.oi
Totalh� 0.08
Pipe LossesCleanout 2 to Manhole 2
Flowrate per well = �'5 mNumberofwells
Totalflowrate j�jgpPipe diameter = in
Pipe velocity =Pipe Velocity losses = 002 W100 ft
Lenqth of pipe � 664 ftFriction loss due to pipe = 0 14 ft.
0 ipe LossesManhole 2 to Manhole 3
Total llowrate =Pipe diameter
Pi veloci = 9±J.�LL.Pipe velocity losses = L2�j�10Oft
Length of pipe =Friction loss due to pipe =
Ball valvesK value = �0.05
Maximum VelocIty' =� 1.25h�j �0.00
L�e�4�0.9
Ii;�0.c�I
ITotal head for one pump 227 ft.
1- Madmwn velodlyfor valves detemiined by assi�xrdng a I.5 lIne ftoin puw tirough valves.
RtPR0JECTS�GE CORPORATE'3410030048 Clixci� Rock. NMWiORK�Pipo & Pump Sizing ids 12123P2003
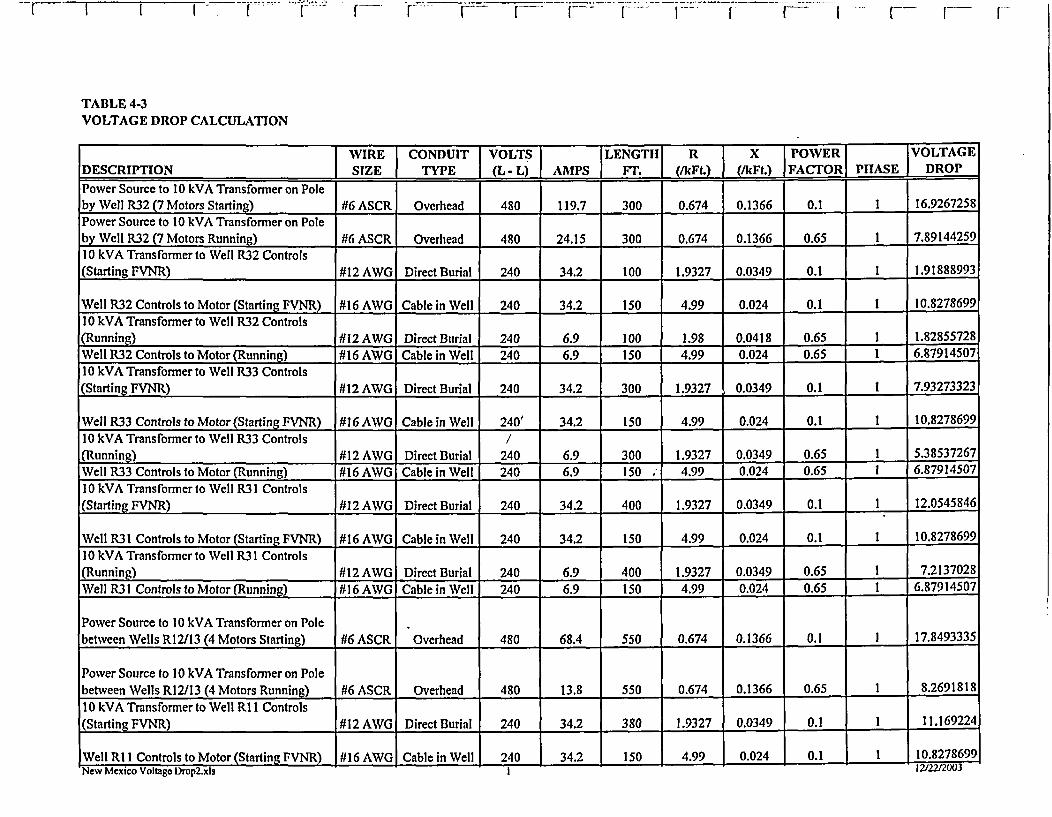
r 1 r� [r� V I--* F I fl V F
TABLE 4-3VOLTAGE DROP CALCULATION
WIRE j CONDUIT JVOLTSj ILENGTI! R X POWER jVOLTAGEDESCRIPTION SIZE TYPE AMPS Jj�t� � FACTOR PHASE DROPPower Source to 10 kVA Transformer on Poleby Well P22 (7 Motors Starting) #6ASCR Overhead 480 119.7 300 0.674 0.1366 0.1 1 16.9267258Power Source to 10 kVA Transformer on Poleby Well P.32 (7 Motors Running) #6 ASCR Overhead 480 24.15 300 0.674 0.1366 0.65 1 7.8914425910 kVA Transformer to Well P.32 Controls(Starting FVNR) #12AWG Direct Burial 240 34.2 100 1.9327 0.0349 0.1 1 1.91888993
Well P.32 Controls to Motor (Starting FVNR) #16 AWG Cable in Well 240 34.2 150 4.99 0.024 0.1 1 10.827869910 kVA Transformer to Well P.32 Controls(Running) #I2AWG DirectBurial 240 6.9 100 1.98 0.0418 0.65 1 1.82855728Well R32 Controls to Motor (Running) #16 AWG Cable in Well 240 6.9 150 4.99 0.024 0.65 1 6.8791450710 kVA Transformer to Well P.33 Controls(Starting FVNR) #12 AWG Direct Burial 240 34.2 300 1.9327 0.0349 0.1 1 7.93273323
XVeII P.33 Controls toMotor(StartingFVNR) #16 AWO Cable in Well 240' 34.2 150 4.99 0.024 0.1 1 10.827869910 kVA Transformer to Well P.33 Controls /(Running) #12 AWG Direct Burial 240 6.9 300 1.9327 0.0349 0.65 1 5.38537267Well P23 Controls to Motor (Running) #16 AWG Cable in Well 240 6.9 150 .' 4.99 0.024 0.65 1 6.8791450710 kVA Transformer to Well P21 Controls(Starting FVNR) #12 AWG Direct Burial 240 34.2 400 1.9327 0.0349 0.1 1 12.0545846
�Vell P21 Controls to Motor (Starting FVNR) #16 AWG Cable in Well 240 34.2 150 4.99 0.024 0.1 1 10.827869910 kVA Transformer to �Vell P21 Controls(Running) #12 AWG Direct Burial 240 6.9 400 1.9327 0.0349 0.65 1 7.2137028Well P21 Controls to Motor (Running) #I6AWG Cable in Well 240 6.9 150 4.99 0.024 0.65 1 6.87914507
Power Source to 10 kVA Transformer on Polebetween �Vells R12113 (4 Motors Starting) #6 ASCR Overhead 480 68.4 550 0.674 0.1366 0.1 1 17.8493335
Power Source to 10 kVA Transformer on Polebetween �Vells R12113 (4 Motors Running) #6 ASCR Overhead 480 13.8 550 0.674 0.1366 0.65 1 8.26918 1810 kVA Transformer to Well Ri 1 Controls(StartingFVNR) #I2AWG DirectBurial 240 34.2 380 1.9327 0.0349 0.1 1 11.169224
Well RI 1 Controls to Motor (Starting FVNR) #16 AWG Cable in Well 240 34.2 150 4.99 0.024 0.1 1 10.8278699I -,n9I2nrn
P4GW JvIcXK�a voiiagc LJruph.x13
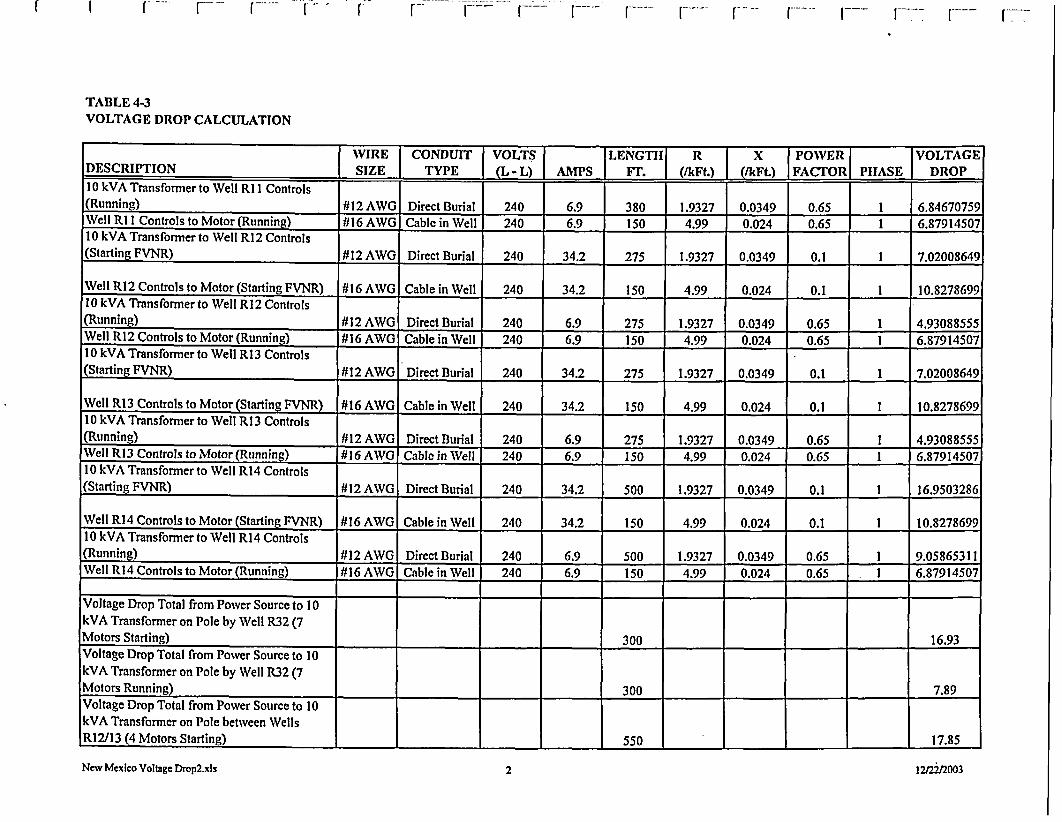
r r- � - F-- 1--- 1777 [-�� [7�7
TABLE 4-3VOLTAGE DROP CALCULATION
WIRE 1 CONDUIT VOLTS JLENGTII R 1 X 1 POWER VOLTAGEDESCRIPTION j SIZE j TYPE � (L - L) AMPS yr. (IkFt.) j� ) J FACTOR PHASE DROP10 kVA Transformer to Well RI 1 Controls(Running) 1112 AWG Direct Burial 240 6.9 380 1.9327 0.0349 0.65 1 6.84670759Well RI I Controls to Motor (Running) 1116 AWG Cable in Well 240 6.9 150 4.99 0.024 0.65 1 6.8791450710 kVA Transformer to Well R12 Controls(Starting FVNR) 1112 AWG Direct Burial 240 34.2 275 1.9327 0.0349 0.1 1 7.02008649
Well R12 Controls to Motor (Starting PVNR) 1116 AWG Cable in Well 240 34.2 150 4.99 0.024 0.1 1 10.827869910 kVA Transformer to Well R12 Controls(Running) 1112 AWG Direct Burial 240 6.9 275 1.9327 0.0349 0.65 1 4.93088555Well R12 Controls to Motor (Running) #16 AWG Cable in Well 240 6.9 150 4.99 0.024 0.65 1 6.879 1450710 kVA Transformer to Well R13 Controls(Starting FVNR) 1112 AWG Direct Burial 240 34.2 275 1.9327 0.0349 0.1 1 7.02008649
Well R13 Controls to Motor (Starting FVNR) 1116 AWG Cable in Well 240 34.2 150 4.99 0.024 0.1 1 10.827869910 kVA Transformer to Well R13 Controls(Running) 1112 AWG Direct Burial 240 6.9 275 1.9327 0.0349 0.65 1 4.93088555Well R13 Controls to Motor (Running) #16 AWG Cable in Well 240 6.9 150 4.99 0.024 0.65 1 6.8791450710 kVA Transformer to �Vell R14 Controls(StartingFVNR) 11I2AWG DirectBurial 240 34.2 500 1.9327 0.0349 0.1 1 16.9503286
Well R14 Controls to Motor (Starting PVNR) 1116 AWG Cable in Well 240 34.2 150 4.99 0.024 0.1 1 10.827869910 kVA Transformer to Well R14 Controls(Running) 1112 AWG Direct Burial 240 6.9 500 1.9327 0.0349 0.65 1 9.05865311Well R14 Controls to Motor (Running) 1116 AWG Cable in Well 240 6.9 150 4.99 0.024 0.65 1 6.87914507
Voltage Drop Total from Power Source to 10kVA Transformer on Pole by Well R32 (7Motors Starting) ________ ____________ 300 ________ ________ ________ 16.93Voltage Drop Total from Power Source to 10kVA Transformer on Pole by �Vell R.32 (7Motors Running) ________ ___________ 300 ________ ________ ________ ________ 7.89Voltage Drop Total from Power Source to 10kVA Transformer on Pole between WellsRI 2/13 (4 Motors Starting) ________ ___________ ________ ________ sso ________ ________ ________ ________ 17.85
New Mexico Voltage Drop2.xls 2
12/22/2003
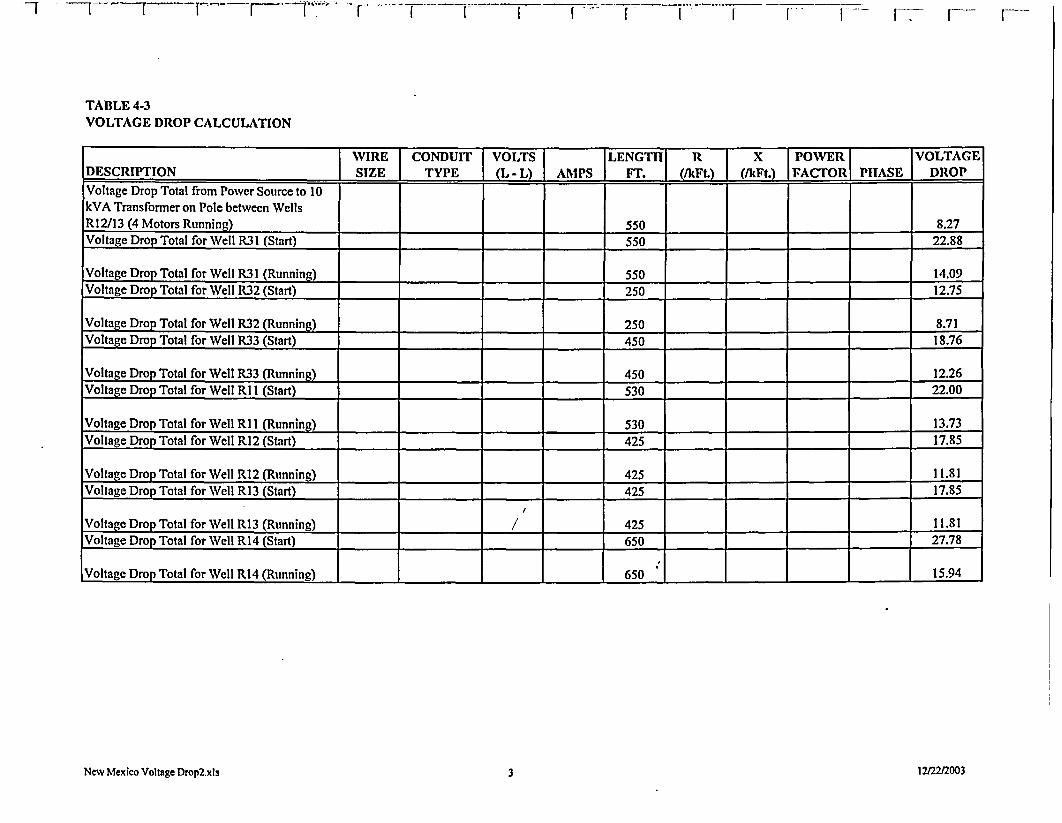
1 I�f F�'T��1T� [ I F I L� V I [ K L F7 K- fl
TABLE 4-3VOLTAGE DROP CALCULATION
J WIRE 1 CONDUIT j VOLTS �LENGTHI R 1 x POWERJ VOLTAGEDESCRIPTION I SIZE TYPE j�J� J AMPS FT.(�j� J (IkFt.) J FAcTORI PHASE DROP
Voltage Drop Total from Power Source to 10kVA Transformer on Pole between WellsRI 2/13 (4 Motors Running) ________ 550 ________ ________ 8.27Voltage Drop Total for Well R31 (Start) ________ 550 ________ ________ 22.88
Voltage Drop Total for Well R31 (Running) ___________ 550 ________ ________ ________ 14.09Voltage Drop Total for Well R32 (Start) ________ 250 ________ ________ ________ 12.75
Voltage Drop Total for Well 102 (Runnin ________ ___________ 250 ________ ________ ________ ________ 8.71Voltage Drop Total for Well 103 (Start) ___________ 450 ________ ________ ________ ________ 18.76
Voltage Drop Total for Well 103 (Running) ___________ ________ 450 ________ ________ ________ ________ 12.26Voltage Drop Total for Well RI I (Start) ________ ____________ ________ 530 ________ ________ ________ ________ 22.00
Voltage Drop Total for Well RI I (Running) ____________ ________ 530 ________ ________ ________ ________ 13.73Voltage Drop Total for Well R12 (Start) ___________ ________ ________ 425 ________ ________ ________ ________ 17.85
Voltage Drop Total for Well R12 (Running) __________ _______ 425 ________ _______ _______ _______ 11.81Voltage Drop Total for Well R13 (Start) ________ ____________ _________ _________ 425 _________ 17.85
Voltage Drop Total for Well R13 (Running) _______ __________ / _______ 425 _______ _______ _______ _______ 11.81
Voltage Drop Total for Well R14 (Start) ________ ___________ ________ ________ 650 ________ ________ 27.78
Voltage Drop Total for Well R14 (Running) _______ __________ _______ _______ 650 _______ _______ _______ _______ 15.94
New Mexico Voltage Drop2.xls 12/2212003 3

Hydraulic Fracturing Pilot Test Results and Preliminary Full Scale DesignMACTEC Engineering and Consulting. Inc.
December 23, 2003Revision 0
FIGURES
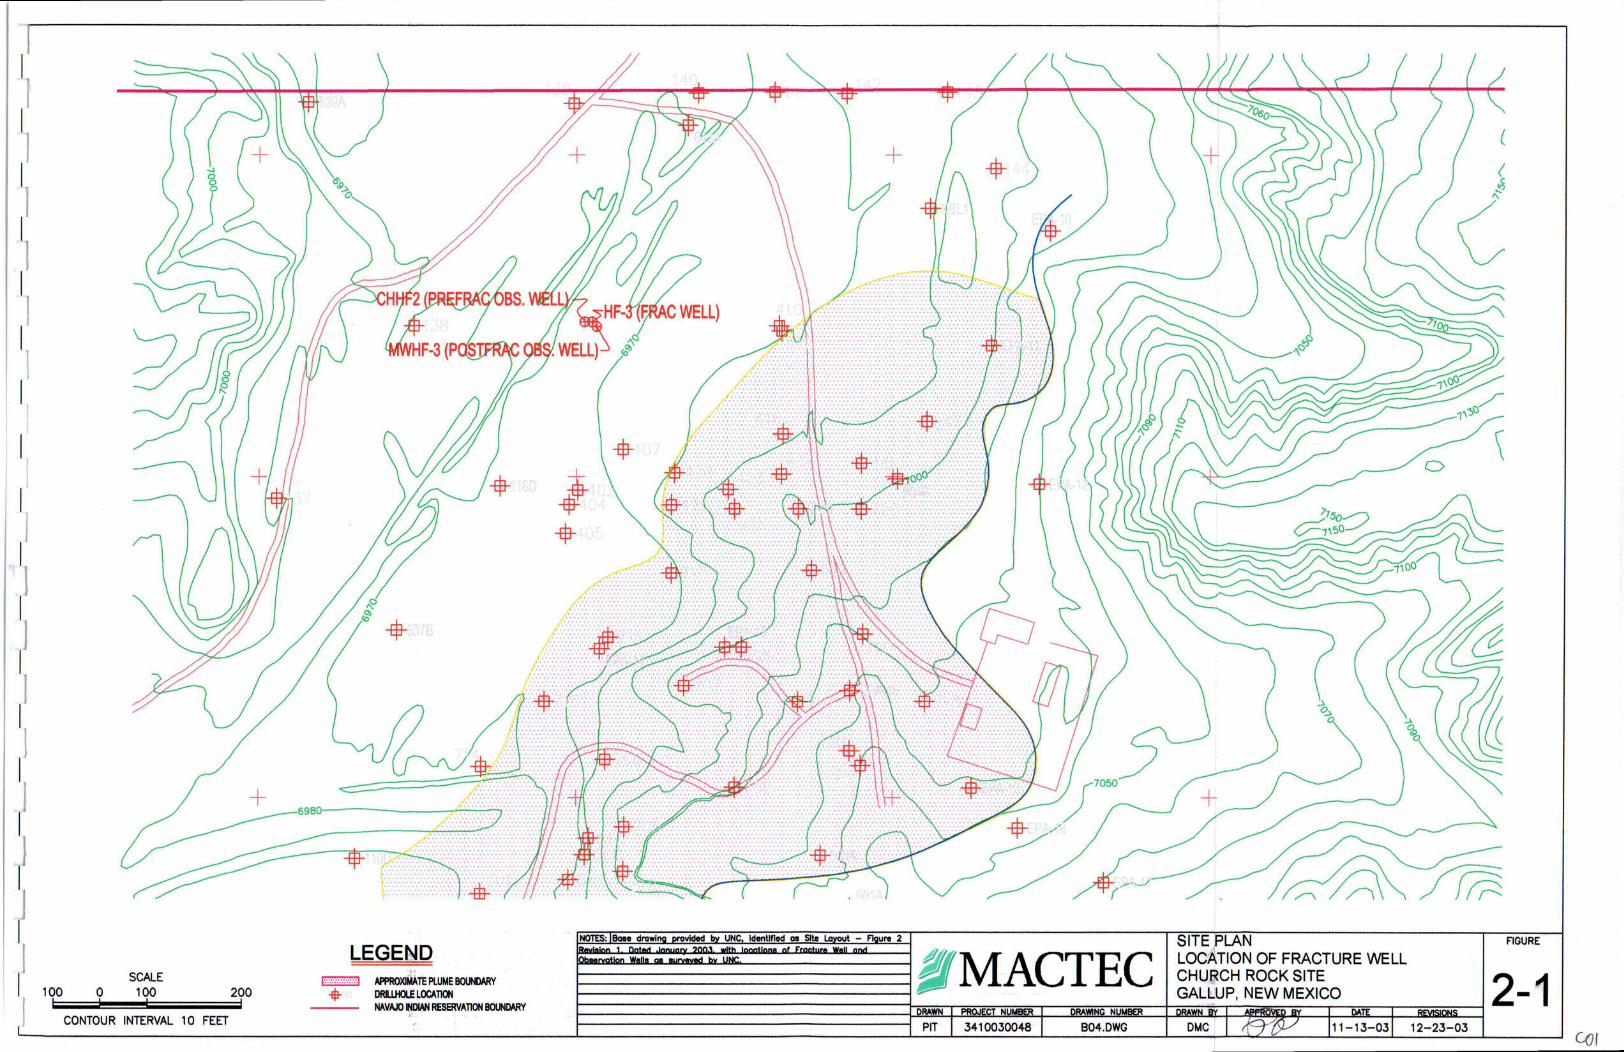
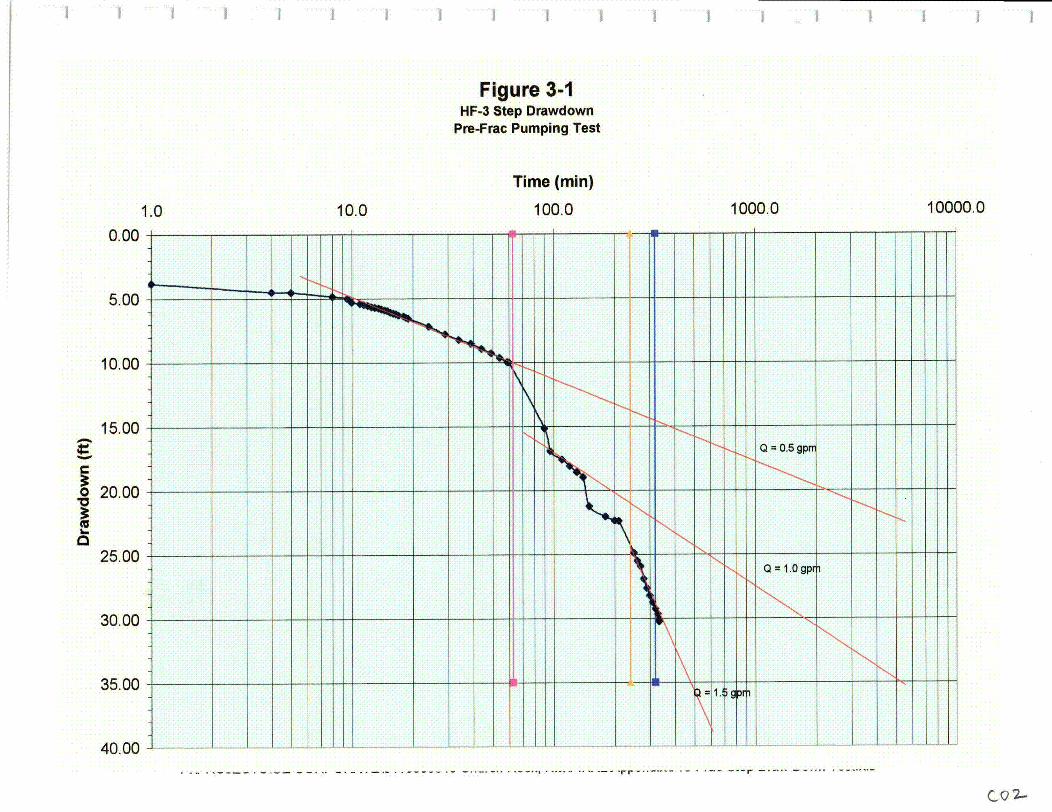
Figure 3-1HF-3 Step Drawdown
Pre-Frac Pumping Test
Time (mm)
1.0 10.0 100.0 1000.0 10000.0
1o.00� -- __ ____
15.00
o 20.00�
'UI-0
25.00 __
30.00�
35.00
40.00
002-
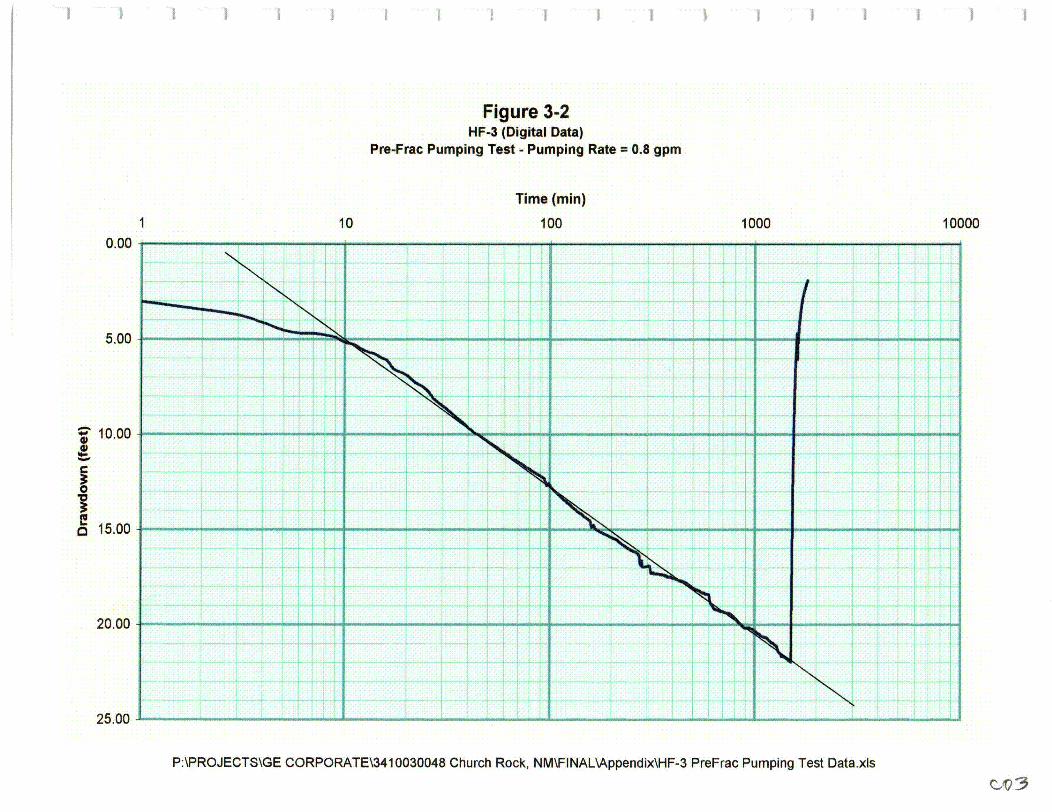
Figure 3-2HF-3 (Digital Data)
Pre-Frac Pumping Test - Pumping Rate = 0.8 gpm
Time (mm)
1001 10 1000 100000.00
5.00
Z� 1000Sa,
II-
o 15.00
20.00
25.00
P:\PROJECTS\GE CORPORATE\341 0030048 Church Rock, NM\FINAL\Appendix\HF-3 PreFrac Pumping Test Data.xls
CA23
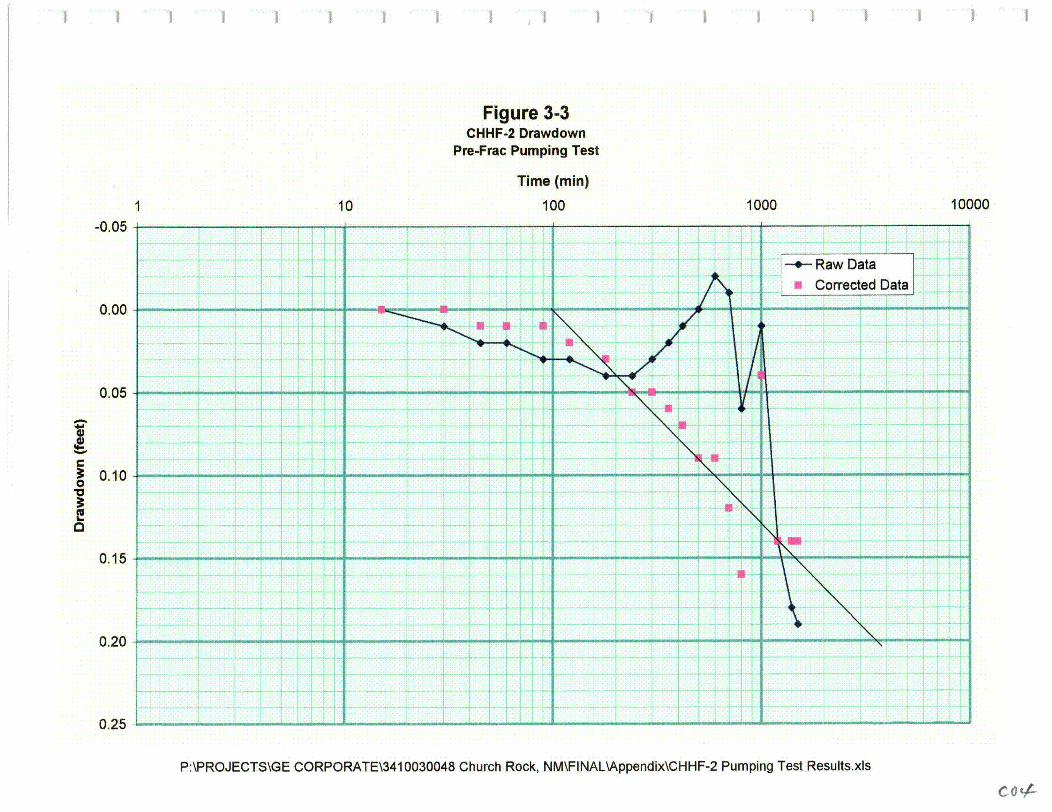
Figure 3-3CHHF-2 Drawdown
Pre-Frac Pumping Test
Time (mm)
100I 10 1000 10000-0.05
0.00
0.05
0
a
0.10
0.15
0.20
0.25
P:\PROJECTS\GE CORPORATE\341 0030048 Church Rock, NM\FI NAL\Appendix\CHHF-2 Pumping Test Results.xls
COt7t
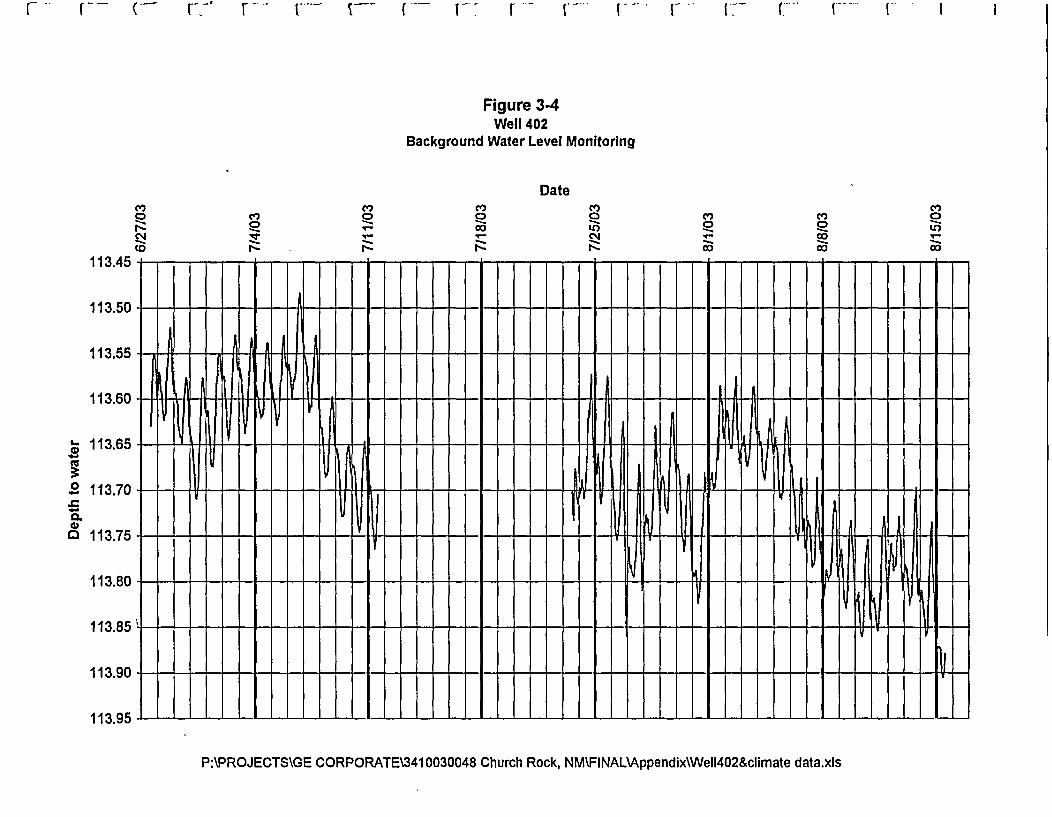
r r� ( U--' � V� F� { V7 F� V.�
Figure 3-4Well 402
Background Water Level Monitoring
Date
0 0 0-. a� U) -� 0
[7�� (>* f��-�* V
0oC,,0
c�4-S
Co
I..a,(U
0
0.
0
113.45
113.50
113.55
113.60
113.65
113.70
113.75
113.80
113.85
113.90
113.95
P:\PROJECTS\GE CORPORATE\341 0030048 Church Rock, NM\FI NAL�Appendix\Well402&cIimate data.xls
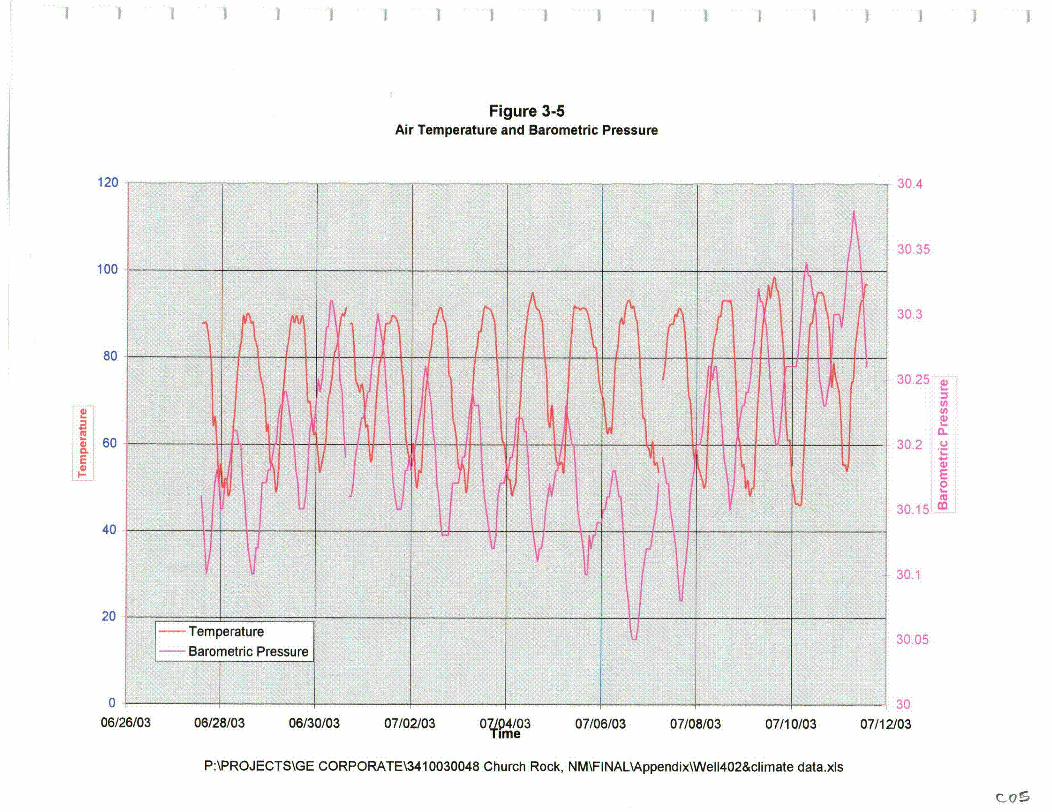
Figure 3-5Air Temperature and Barometric Pressure
120 30.4
100
80
.260
EI-
40
20
N
TemperatureBarometric Pressure
__ __ __ __ __ __ __ __ .4
30.35
30.3
3025
U)U)
a-302 .�
I-4-4�E01�
'U3015 �
30.1
30.05
ot06/2E
30W03 06/28/03 06/30/03 07/02/03 0?104/03 07/06/03 07/08/03 07/10/03
P:\PROJECTS\GE CORPORATE\341 0030048 Church Rock, NM\FINAL\Appendix\WeII402&climate data .xls
07/12/03
c�o�
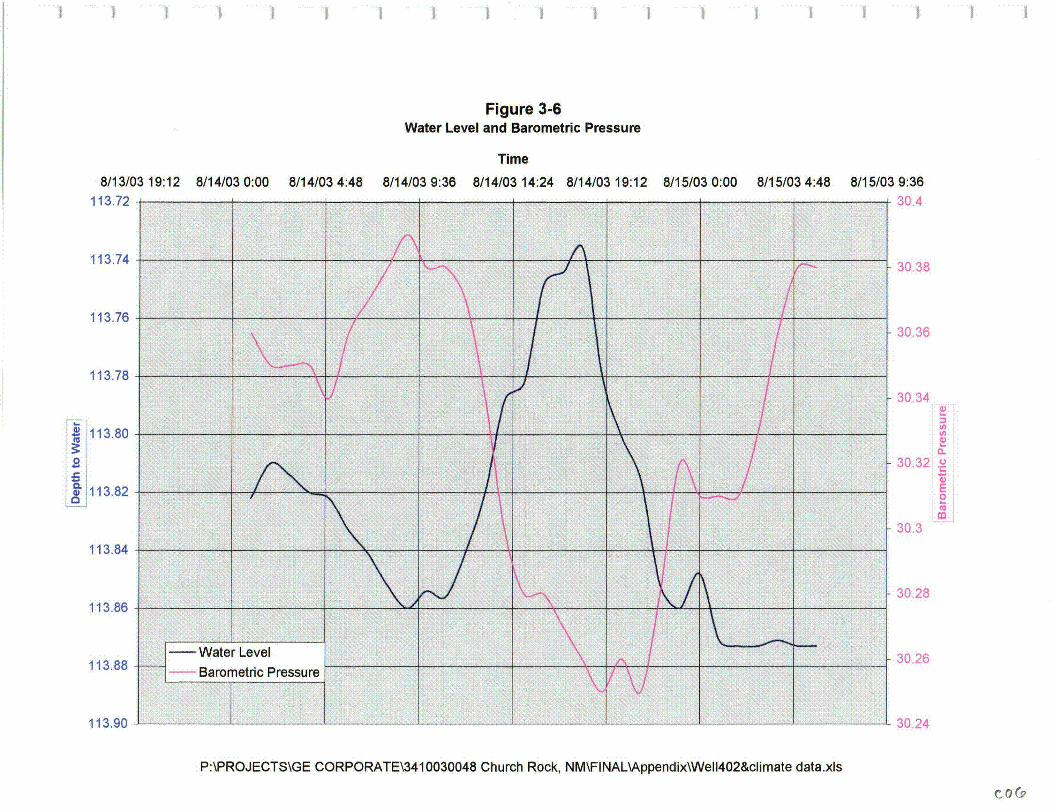
Figure 3-6Water Level and Barometric Pressure
Time8/13/03 19:12 8/14/03 0:00 8/14/03 4:48 8/14/03 9:36 8/14/03 14:24 8/14/03 19:12 8/15/03 0:00 8/15/03 4:48 8/15/03 9:36
113.72
113.74
113.76
113.78
� 113.80
0
a.0 113.82
0
113.84
113.86
113.88
113.90
30.4
30.38
30.36
30.340
a)0�
3032 .�
0E0
30.3
30.28
3026I _______________________________________
- Water LevelBarometric Pressure
______p. ____���.
I.'!
- 30.24
P:\PROJECTS\GE CORPORATE\341 0030048 Church Rock, NM\FINAL�Appendix\Well402&cIimate data.xls
co&
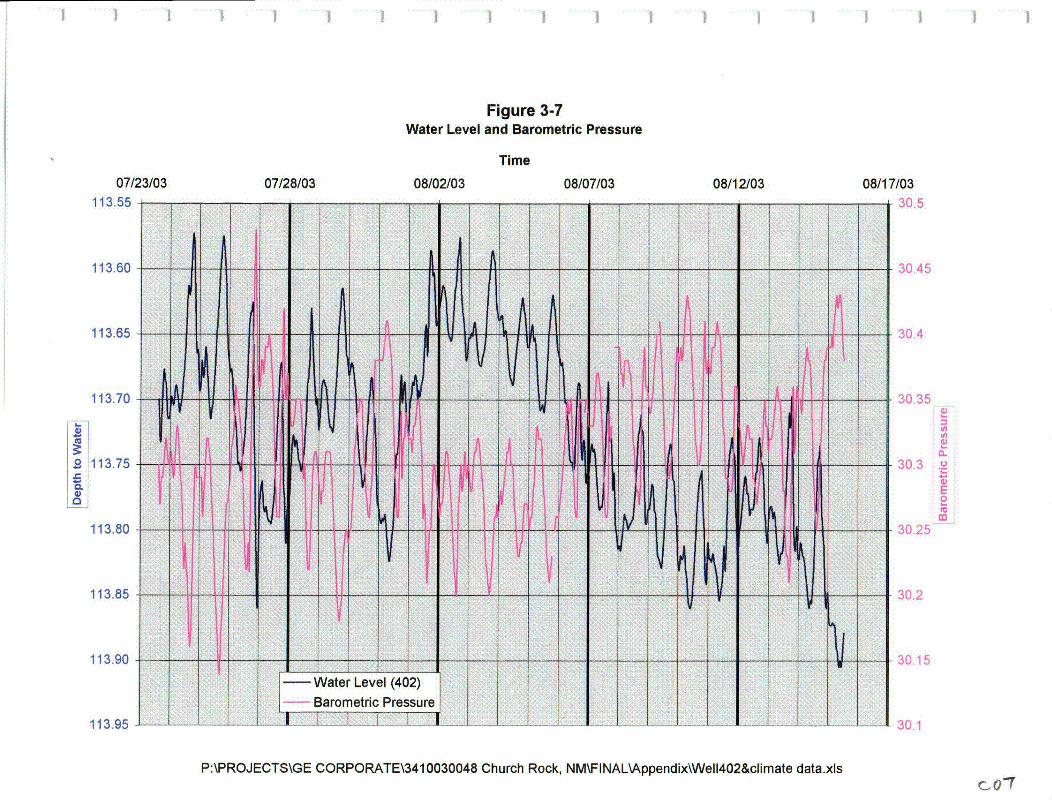
Figure 3-7Water Level and Barometric Pressure
Time07/23/03 07/28/03 08/02/03 08/07/03 08/12/03 08/17/03
11�3.55
113.60
113.65
113.70
00
.2 113.750.0)C
113.80
113.85
113.90
113.95
A-y
30.5
30.45
30.4
30350
In0
0.
30.3 .20E00
30.25
30.2
30.15
30.1
Water Level (402) 1 I I-� IJLL __ -� .. �
arometric Pressure j IP:\PROJECTS\GE CORPORATE\341 0030048 Church Rock, NM\FINAL\Appendix\Well402&climate data.xls
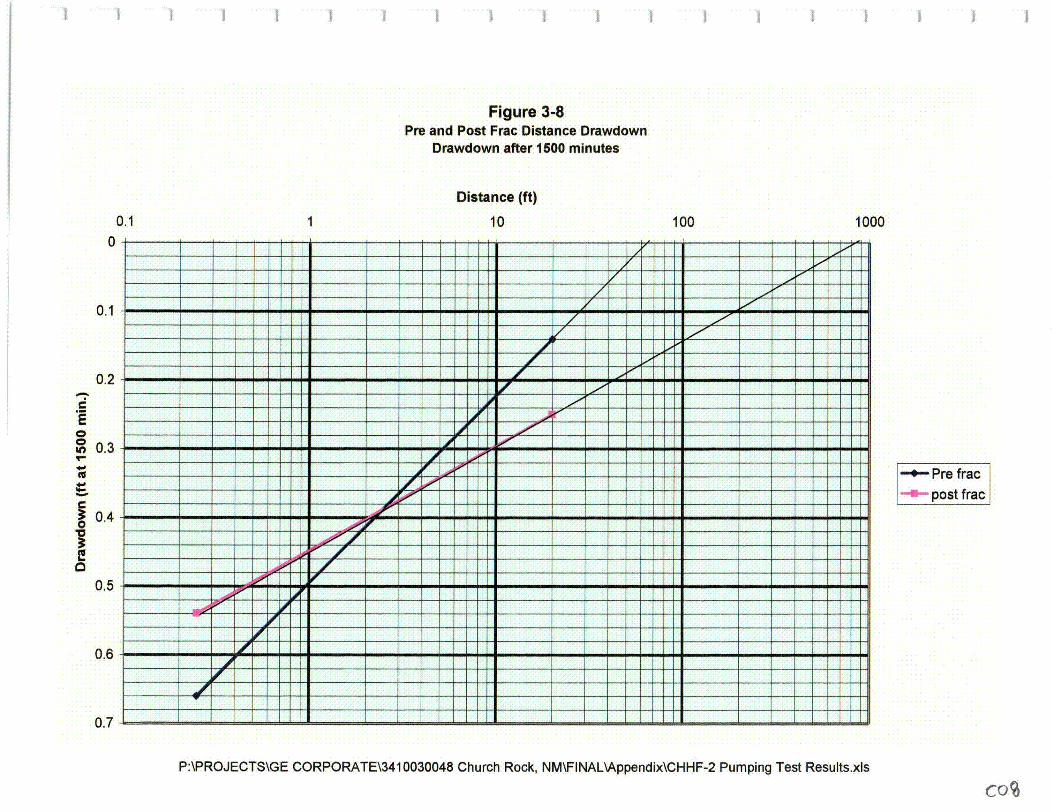
Figure 3-8Pm and Post Frac Distance Drawdown
Drawdown after 1500 minutes
Distance (ft)
100.1 1 100 10000
0.1
0.2
E00in 0.34-'U
0.4
C0.5
0.6
0.7
a - - - - - -
-4-Pre fracU post frac
P:\PROJECTS\GE CORPORATE\341 0030048 Church Rock, NM\FI NAL\Appendix\CHHF-2 Pumping Test Results.xls
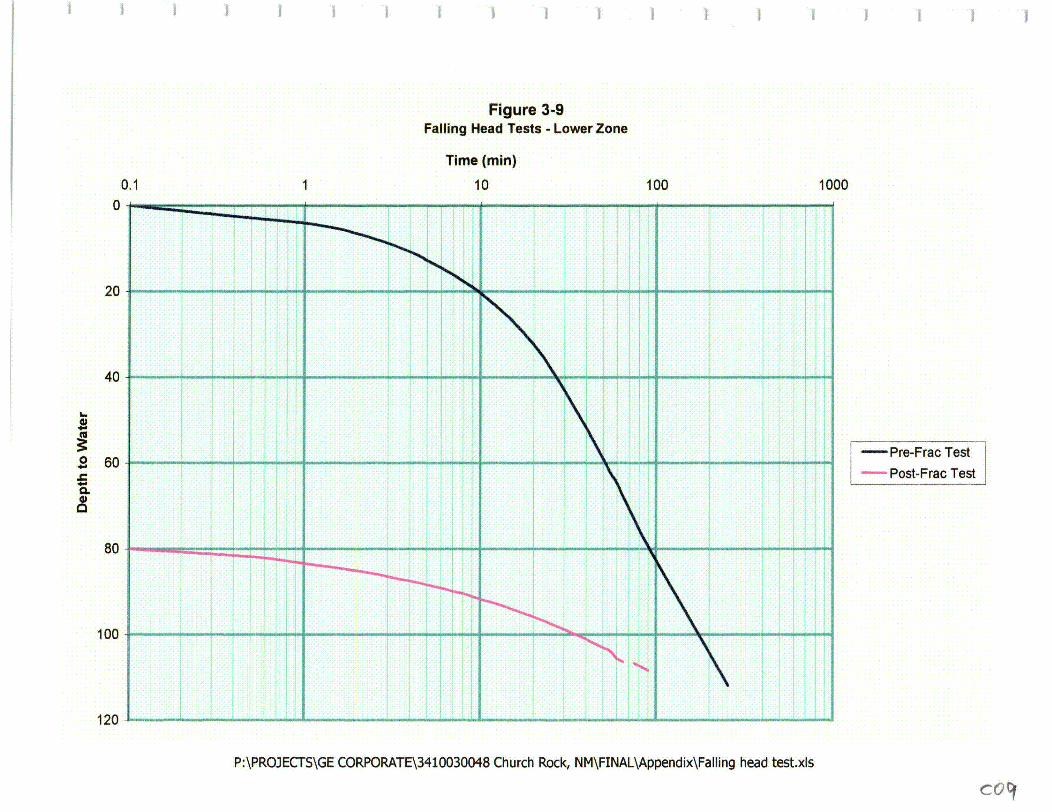
Figure 3-9Falling Head Tests - Lower Zone
Time (mm)
100.10.
20
40
I 100 1000
-Pre-Frac Test- Post-Frac Test
0
0.S0
60
80
100
120
P:\PROJECTS\GE CORPORATE\3410030048 Church Rock, NM\FINAL\Appendix\Falling head test.xls
CQt�
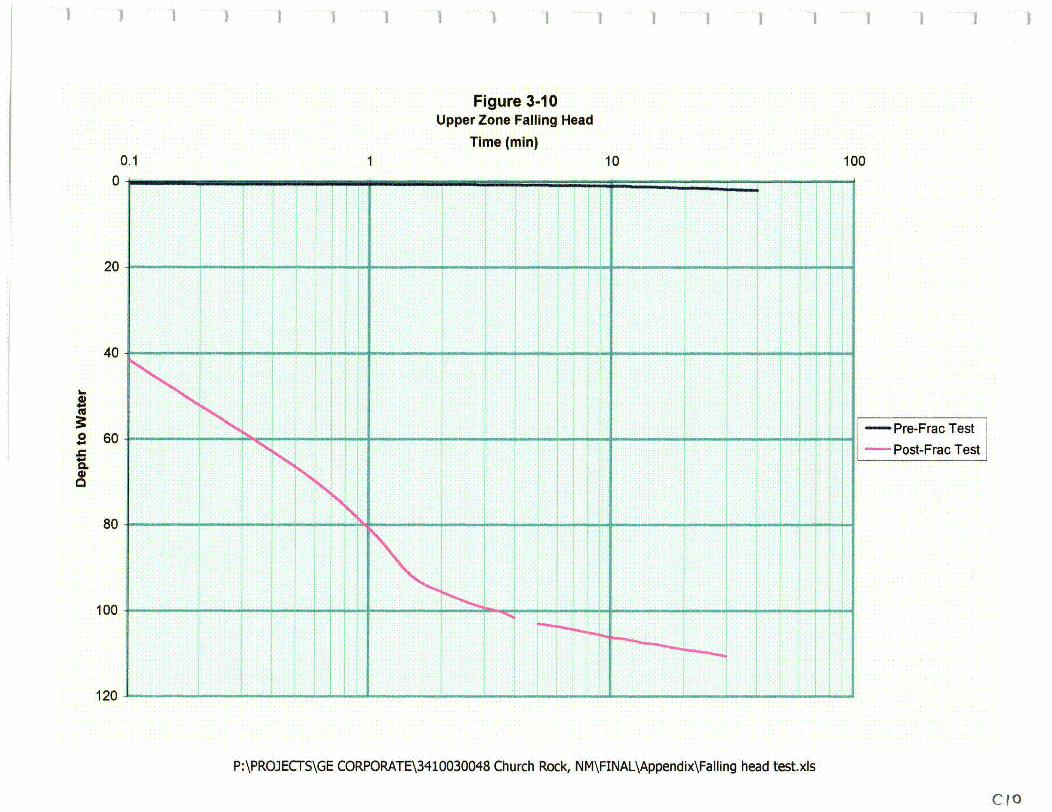
Figure 3-10Upper Zone Falling Head
Time (mm)0.1 1 10 100
0
20
40 - -- _____________
'U
__________ ________________ K.� 60
0.S0
80
100
120 ___________ ______
P:\PROJECTS\GE CORPORATE\3410030048 Church Rock, NM\FINAL\Appendix\Falling head test.xls
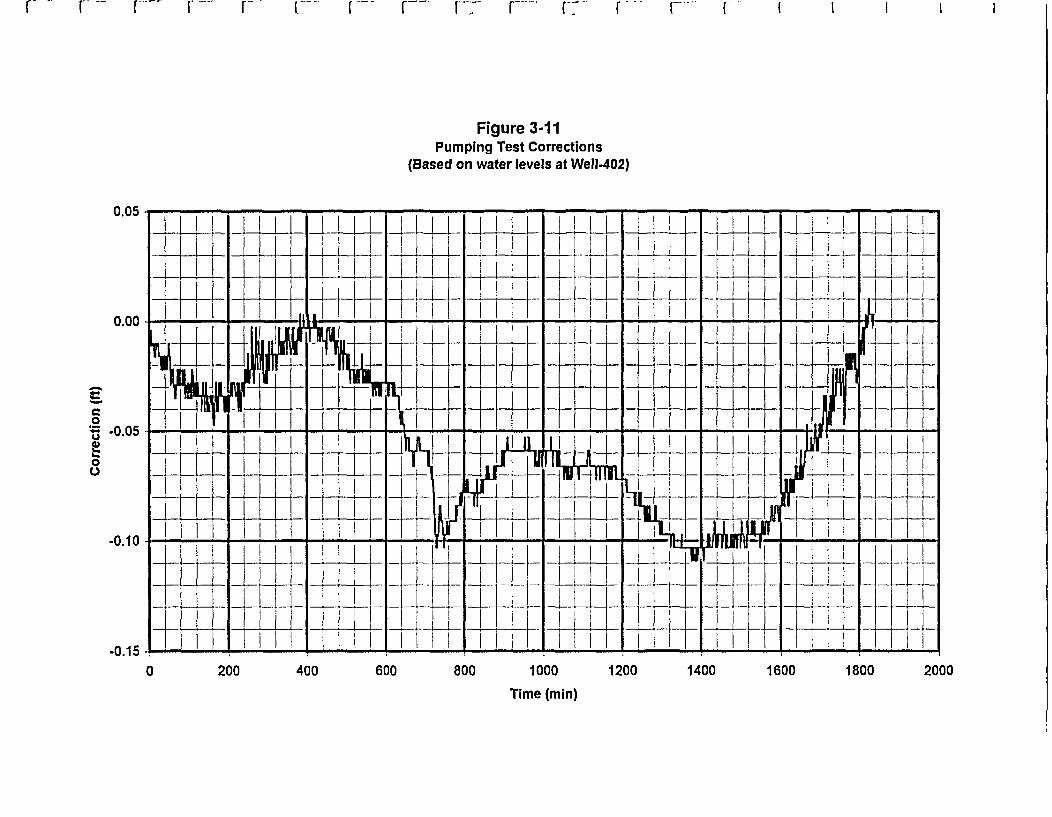
r r -- � r 17 V� r F7� r� FY V
Figure 3-11Pumping Test Corrections
(Based on water levels at WeIl-402)
- [�**�**� I- I I 1 I
0.05
0.00
0*.� -0.05UC)
0U
-0.10
-0.15
- . - S - * a S - S - - S - - S - * - - . - . - . a p - - . S p - - - - S .
I I 'I I j� __ ii
I' II
- -I _ __ _ I,
* IL.I.I.I 1.1 ILL ±.±i 1±. . ILHI.I LiI�I �L K I K!
_____ _ __ 1111 1 __I, ___ ___ I'I
III 111111 IIIIIII I III II0 200 400 600 800 1000
Time (mm)1200 1400 1600 1800 2000
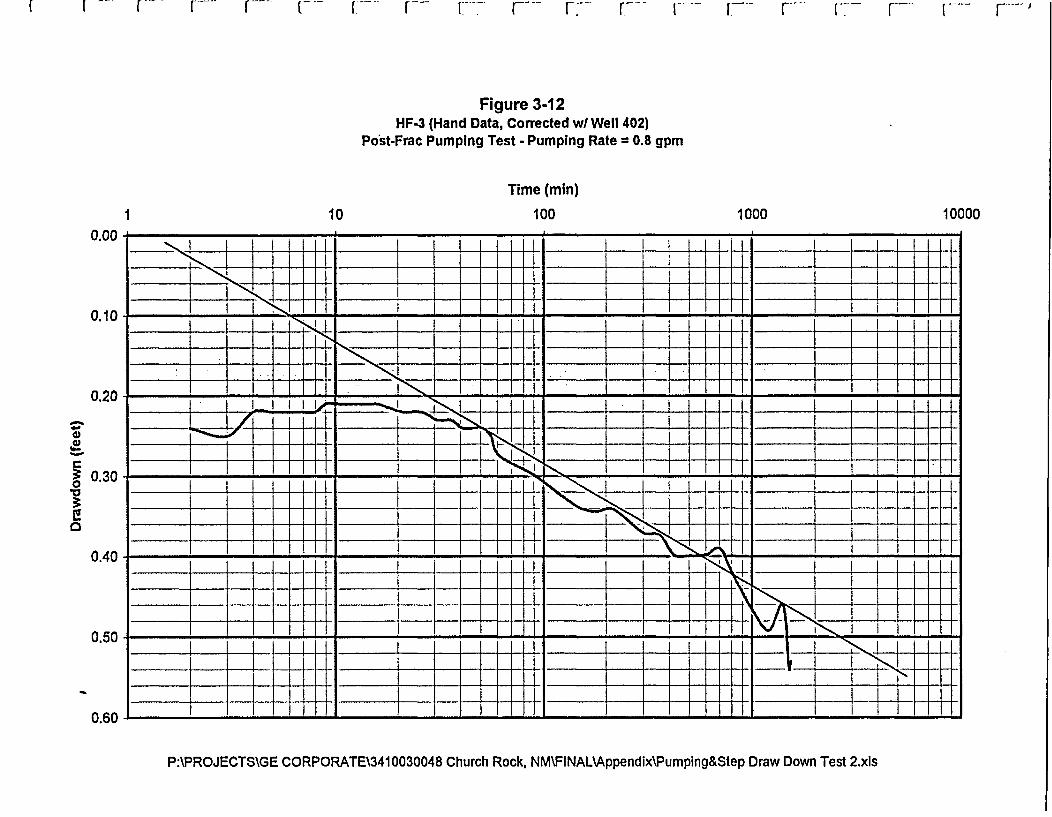
r r [� r�'
Figure 3-12HF-3 (Hand Data, Corrected W/ Well 402)
Post-Frac Pumping Test - Pumping Rate 0.8 gpm
Time (mm)
100I 10 1000 100000.00
0.10
0.20
4..00
'I.-
0.30
0
0.40
0.50
0.60
____t17t{I�I� ±14 _____ _____ _____�z�zz __
_____ _____ - -. ________ _____
II �-III�II� S 5.h5 ...
____ 4'14 _____ liz ____
--1-.-�. _____ _____
____ ____ � "7' ____ -. -�
- � � ____ _____ -Lb ___ - -
P:\PROJECTS\GE CORPORATE�341 0030048 Church Rock, NM\FINAL�Appendix\Pumping&Step Draw Down Test 2.xis
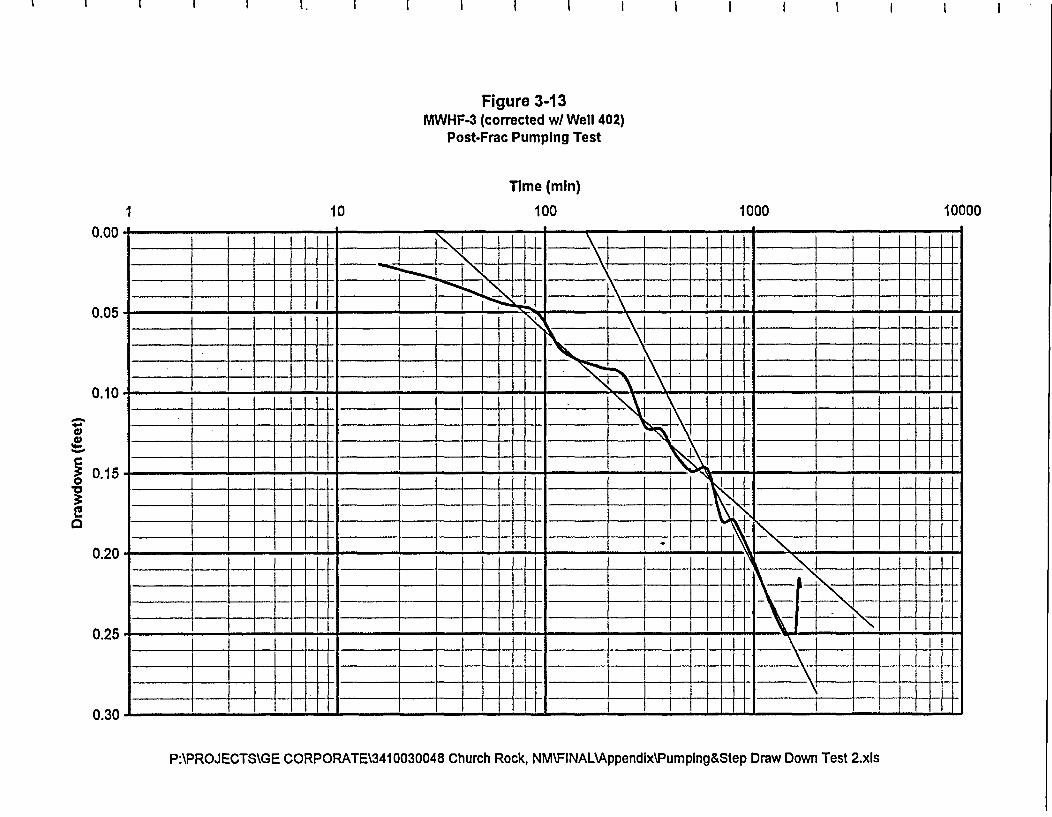
I I I I 1. 1 I I I I I I I I I I 1 I
Figure 3-13MWHF-3 (corrected wI Well 402)
Post-Frac Pumping Test
Time (mm)
100I 10 1000 100000.00
0.05
0.10
4..a,0
tg�
� 0.15
0
0.20
0.25
0.30
____ ____ V ____ ____ _
_____ +__ __I - - __ __ -. =.
______ jzi��xz ______ j-K
____ ____ ____tLK 7 iit::� ____ zizzz�
____ -. __ ____ ____ ___ __ ILII:
____ zHzz __
- �zztz:z�z ____ __ - �1r -I-
P:\PROJECTS\GE CORPORATE\341 0030048 Church Rock, NM�FiNAL�Appendix\Pumping&Step Draw Down Test 2.xis
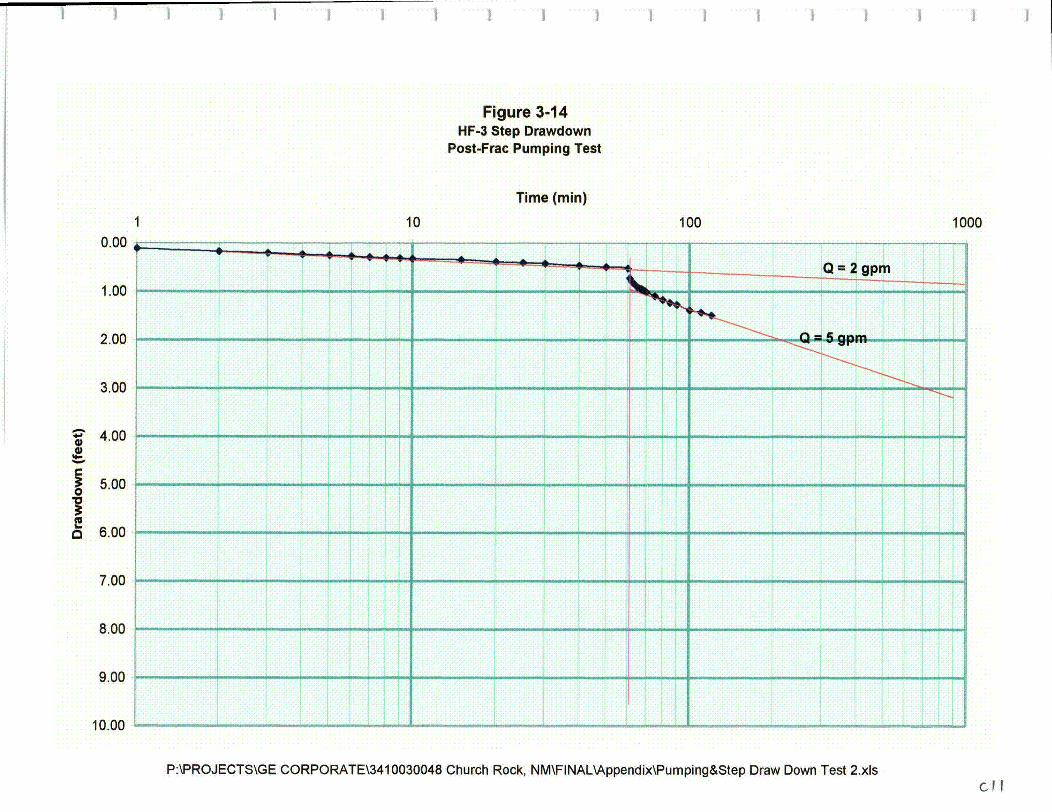
Figure 3-14HF-3 Step Drawdown
Post-Frac Pumping Test
Time (mm)1 10 100 1000
0.00 _____________________________________
1.00
2.00
3.00
� 40000
II-
5.00
� 6.00
7.00
8.00
9.00
P:\PROJECTS\GE CORPORATE\341 0030048 Church Rock, NM\FINAL\Appendix\Pumping&Step Draw Down Test 2.xlsdi
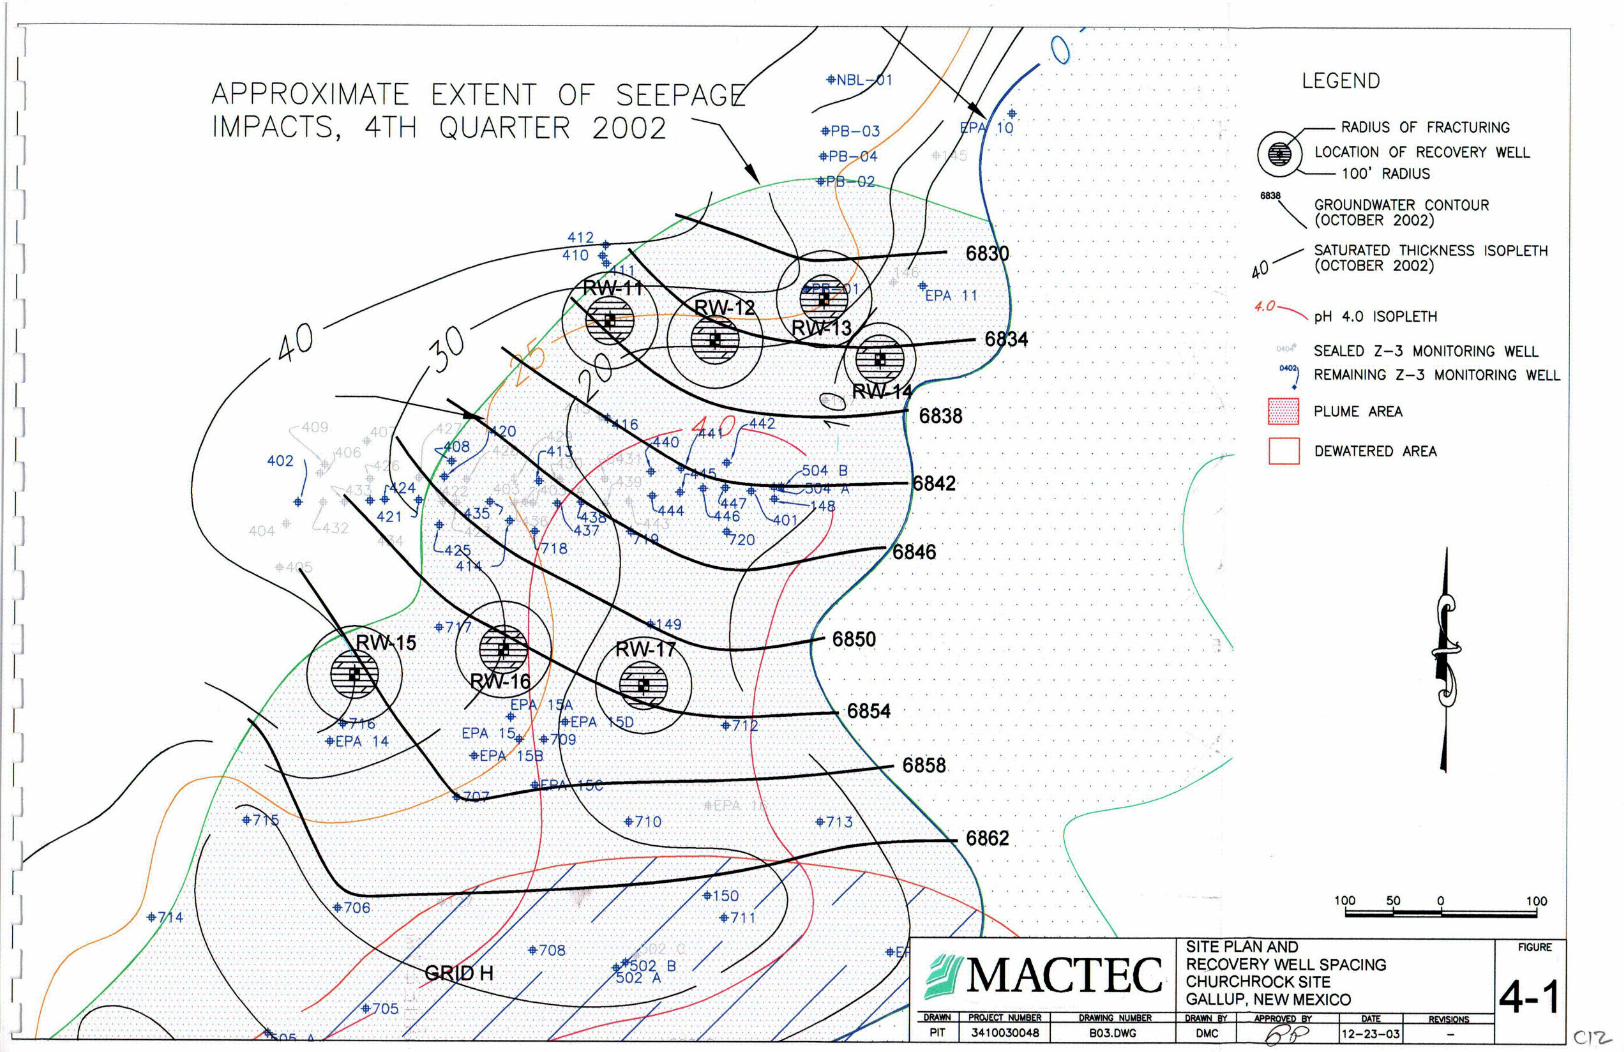
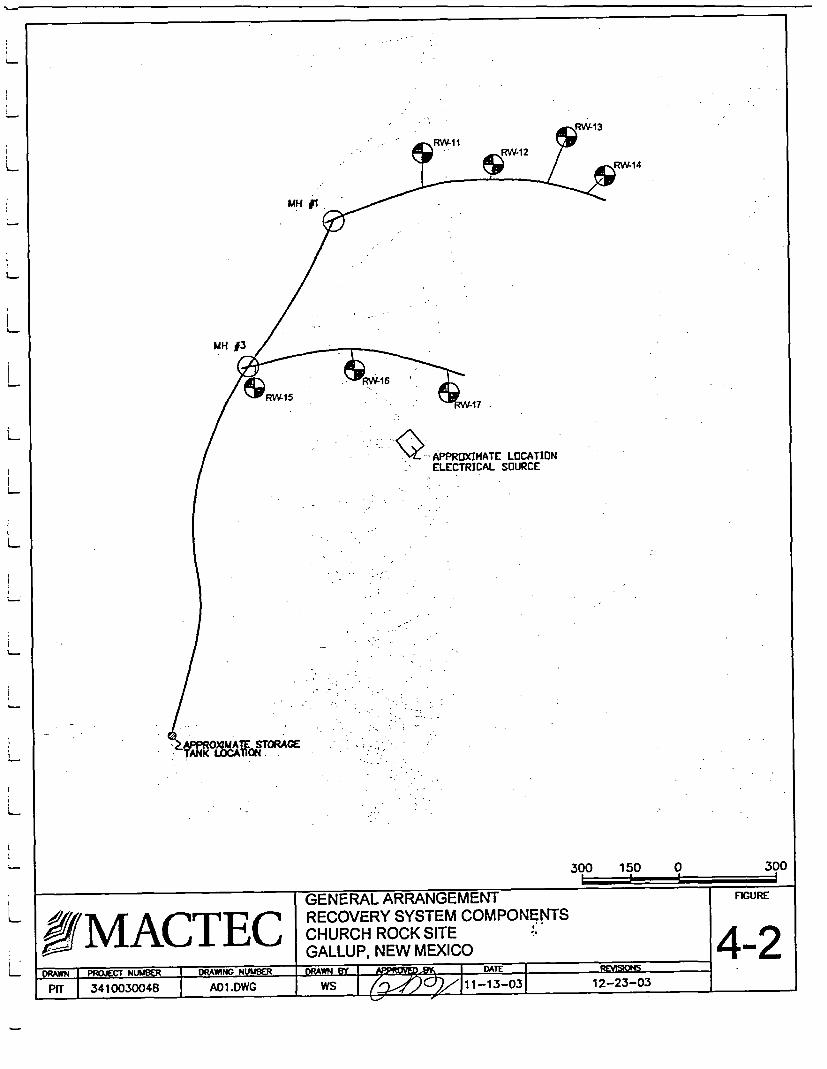
MIffI
MH f3
RW-15
K�> APPROXIMATE LOCATIONELECTRICAL SOURCE
300 150 Q 390i.
GENERAL ARRANGEMENT ncu�RECOVERY SYSTEM COMPONE!�JTS� MACTEL ____________GALLUP, ROCK SITE -. 4-2NEW MEXICO
flRA�N PROJECT NUMBER I DRAWING NUMBER DRAW�4 BT I � I DATE I AEV�S3ONS
�rr 3410030048 A01.DWG WS � 11-13-03 12-23-03 __________
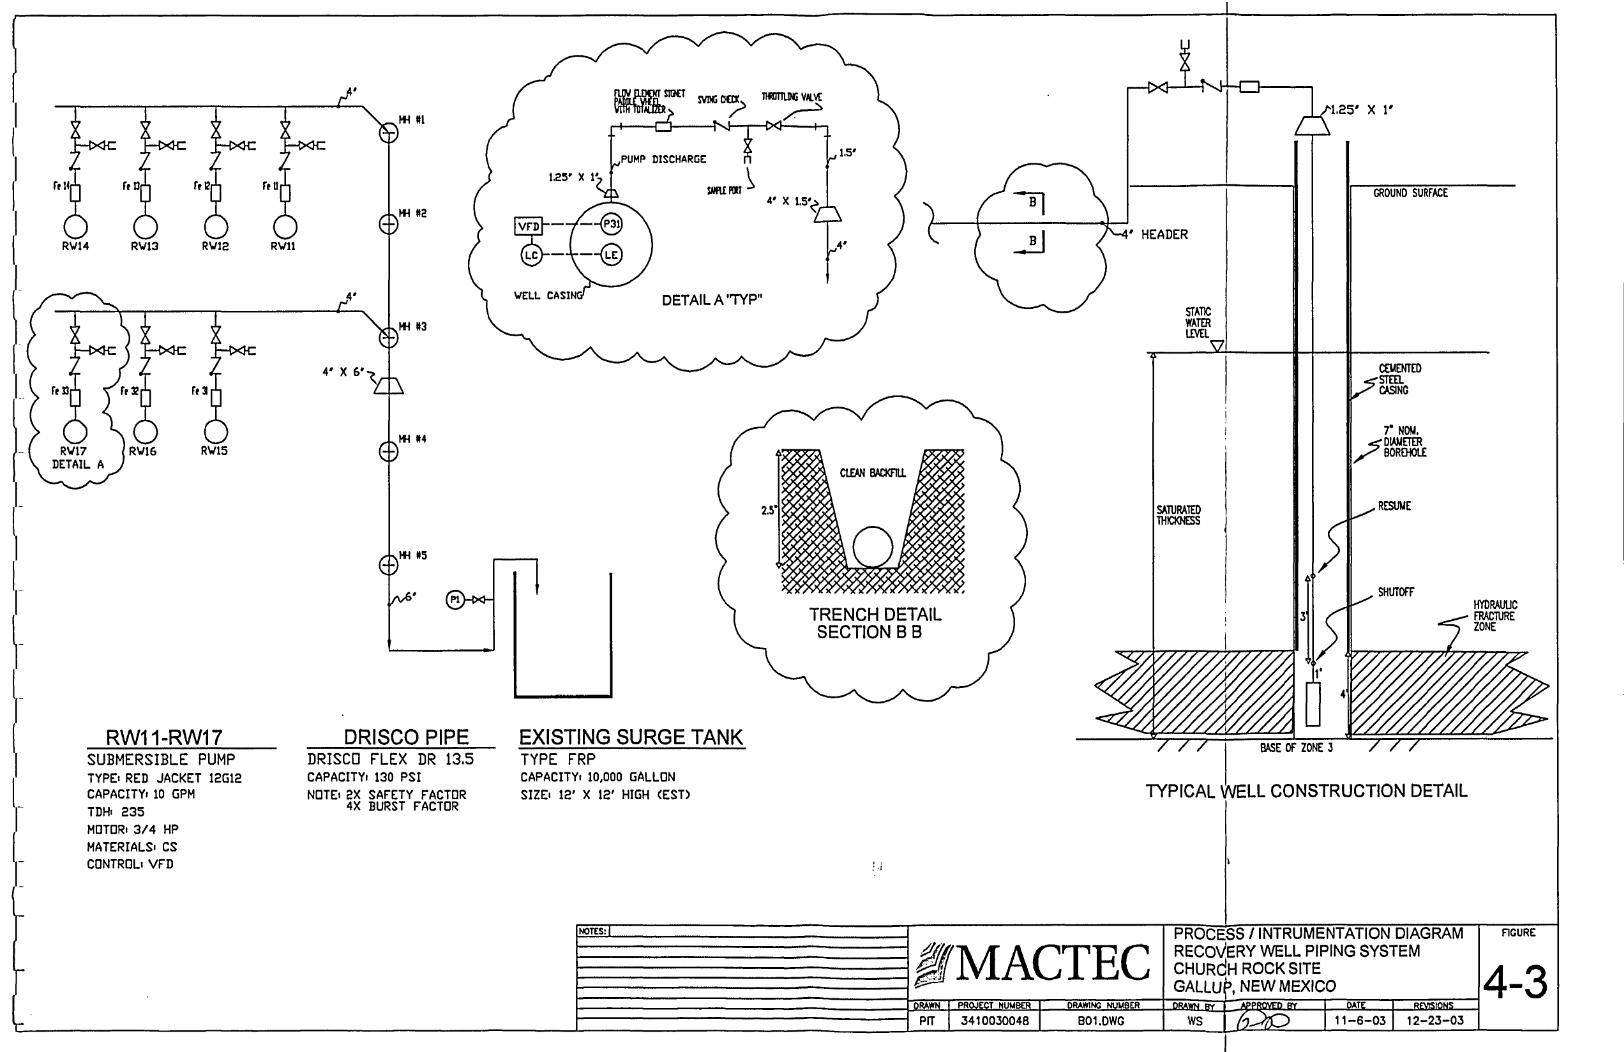
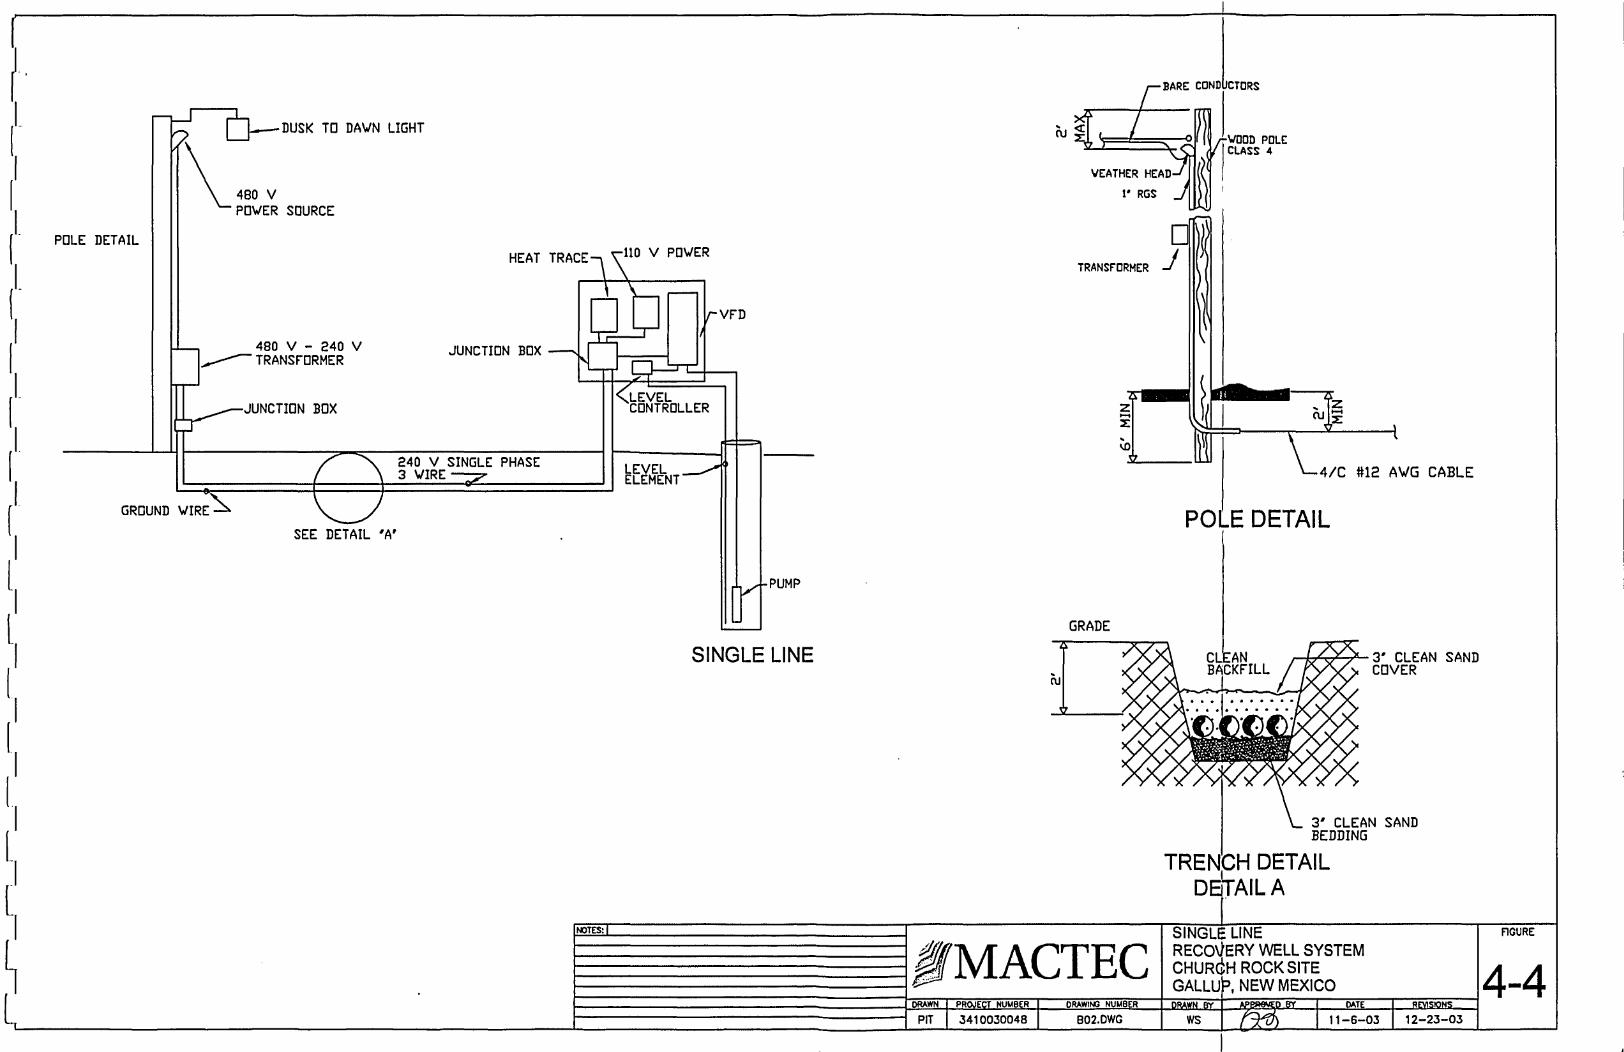
Related Documents