Welcome message from author
This document is posted to help you gain knowledge. Please leave a comment to let me know what you think about it! Share it to your friends and learn new things together.
Transcript
February 2011 Carone DPP Revisions
REVISED FEBRUARY 2011
SECTION 1.0
INTRODUCTION
Revision to Development and Production Plan – Platform Hogan Carpinteria Offshore Field
1-1
Section 1
Introduction
1.0 Introduction and Project Overview
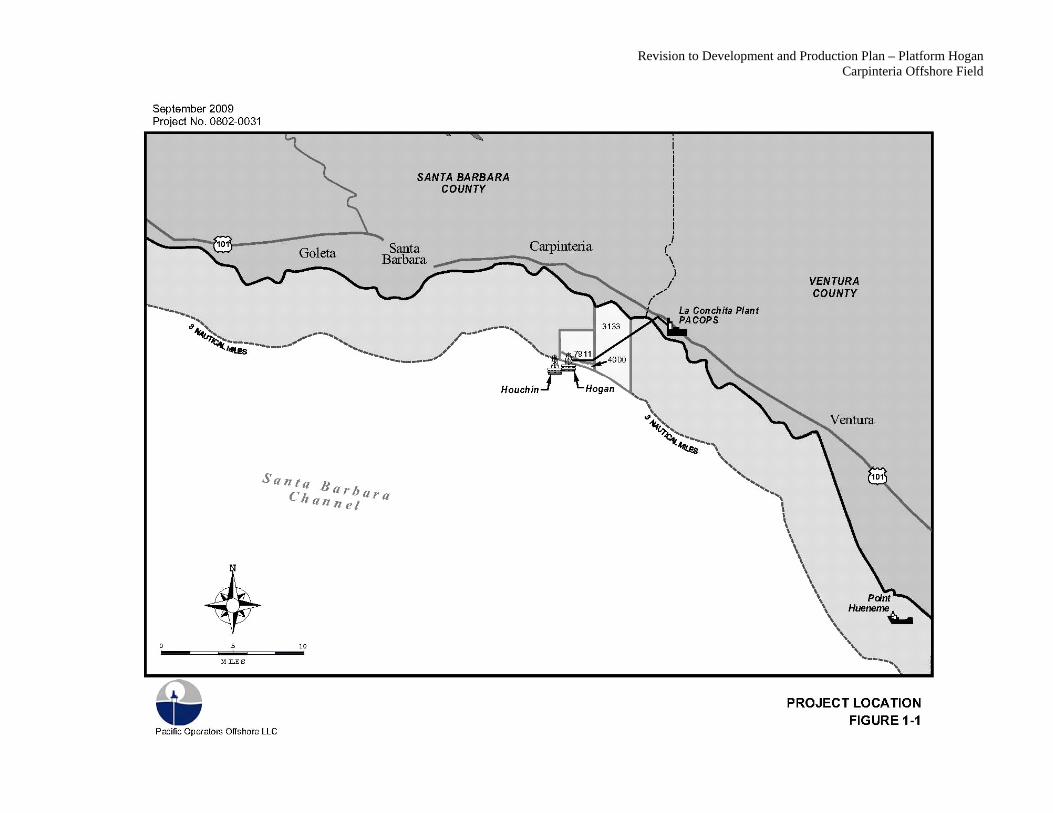
This document presents proposed revisions to the Platform Hogan Development and Production Plan (DPP). The proposed revisions to the DPP address the development and production of oil and gas from the Carpinteria Field, including State Leases PRC-400, PRC-7911, and PRC-3133. Drilling, completing, equipping, and operating State Lease wells would be accomplished from Platform Hogan. (See Figure 1-1)
Revisions to the DPP have been developed to address all of the requirements specified in 30 CFR 250.241. Supporting information for the DPP, as required by 30 CFR 250.242 through 250.262, is provided in the supporting information document, which has been submitted with this DPP revision document.
The proposed project concerns redevelopment of the Carpinteria Field oil and gas reserves which are located in State waters from Platform Hogan which is in Federal waters within Federal lease OCS P0166. The project will be executed by Carone Petroleum Corporation (CPC) and CPC’s designated Carpinteria Field operator, Pacific Operators Offshore, LLC (PACOPS), previously Pacific Operators Offshore, Inc. (POOI).
The proposal is to drill as many as twenty-five (25) new operational wells (production or injection) from existing Platform Hogan. Conductors currently used for Federal wells on Hogan will be transitioned for use by State wells over time, as Federal wells become uneconomic. Therefore, there are sufficient well slots from the existing platforms to implement the State Leases POD drilling program without impacting Federal production. The exact number of wells needed to develop the field will not be known until sufficient wells have been completed and evaluated. The various geologic targets are expected to evolve and change as technical work continues and drilling results cause the program to be adjusted to fit within the infrastructure capacity, well slot availability, and potential “reallocation” of wells into possible plays that prove out more prolific at less risk than alternative plays. However, the overall “umbrella” State Leases POD is constant, that being to make as full of use out of the existing hardware infrastructure to develop the most economic reserve base possible given the geologic opportunities that are present. Proper oil field operation and management is an integral part of the State Lease POD.
State Leases will be developed using extended reach drilling technology with wells drilled from the existing Platform Hogan in Federal waters. By utilizing a Federal platform, the only physical drilling and production activity on State leases will be subsurface well bores located several thousand feet below the ocean floor. No new platforms are necessary nor proposed using this “subsurface” approach for the DPP.
The proposal is based upon placement of directional extended reach well bores extending approximately 1,400 to 13,000 feet “eastward” from Platform Hogan. These horizontal distances are well within existing technological capacity and are routinely accomplished within the industry. Drilling of new wells at the Carpinteria oil field is expected to last up to seven (7) years with production lasting through to the year 2040.
Revision to Development and Production Plan – Platform Hogan Carpinteria Offshore Field
Revision to Development and Production Plan – Platform Hogan Carpinteria Offshore Field
1-3
Produced fluids from the State Leases will undergo partial processing and measurement within existing and new processing facilities located on Platform Hogan (see Section 5 - Platform Facilities and Production Measurement and Allocation Plan). From the platform, the produced fluids will be transported to shore through existing pipelines to the existing La Conchita onshore facility for processing. State and Federal Lease production will be measured and partially processed on Platform Hogan, and will be transported to shore in the same pipeline.
In order to accommodate the oil and gas production from the new State Leases in the Carpinteria Oil Field a 1,000 horsepower (bhp) drilling rig will be used. The drill rig is an all-electric rig and will have a 13,000 foot drilling range. In addition, the rig will utilize two 1,000 bhp triplex pumps, each equipped with centrifugal charge pumps. Current oil production from Platform Hogan is approximately 600 bbl/day). The expected average rate of oil and gas production from the proposed wells would be 150 barrels oil per day per well.
To summarize, the development and production of the Pico Sands within the Carpinteria Field will be accomplished by drilling extended reach wells from the existing Platform Hogan. Existing well slots, pipelines, equipment and other infrastructure will be used. Only minor modifications to existing equipment and facilities will be necessary to complete the proposed expansion of production.
This DPP revision document has been split into six (6) sections, which include the following:
1) Introduction – a brief summary of the proposed DPP revisions and a guide to the DPP revision document content and structure.
2) Proposed Development Schedule – Presents the proposed development and production schedule for the Carpinteria Oil Field.
3) Platform Site and Construction – Explains that there will be no new platform sites or construction, besides development wells associated with the development of the Carpinteria Oil Field.
4) Drilling Facilities – Provides an overview of the drilling facilities that will be necessary to develop the Carpinteria Oil Field.
5) Platform Facilities – Describes the existing oil and gas facilities in place on Platform Hogan. This section also explains the alterations that would be needed in order to develop oil and gas from the Carpinteria Oil Field. Oil and gas produced from the Carpinteria Oil field will use existing pipelines and facilities associated with and on Platform Hogan. The only changes will be the installation of one 1,000 bhp electrical drilling rig, and the two 1,000 bhp pumps associated with the drill rig. Maintenance and upgrades will occur as needed.
6) Pipeline System – Discusses that the existing oil and gas pipeline systems at the La Conchita processing facility can handle production from the Carpinteria Oil Field.
The applicant agrees that the development activities proposed for State of California leases PRC 4000, PRC7911 and PRC3133 which are the subject of this DPP revision will be covered by an appropriate bond under 30 CFR part 256, subpart I. To be clear, this bonding requirements under this subpart are strictly to cover the development activities proposed for the state leases mentioned above and in no way does the applicant agree that the requirements under 30 CFR part 256, subpart I modify in anyway the current bonding requirements or bonding agreements for Federal lease OCS P-0166.
February 2011 Carone DPP Revisions
SECTION 2.0
PROPOSED DEVELOPMENT SCHEDULE
Revision to Development and Production Plan – Platform Hogan Carpinteria Offshore Field
2-1
Section 2
Proposed Development Schedule
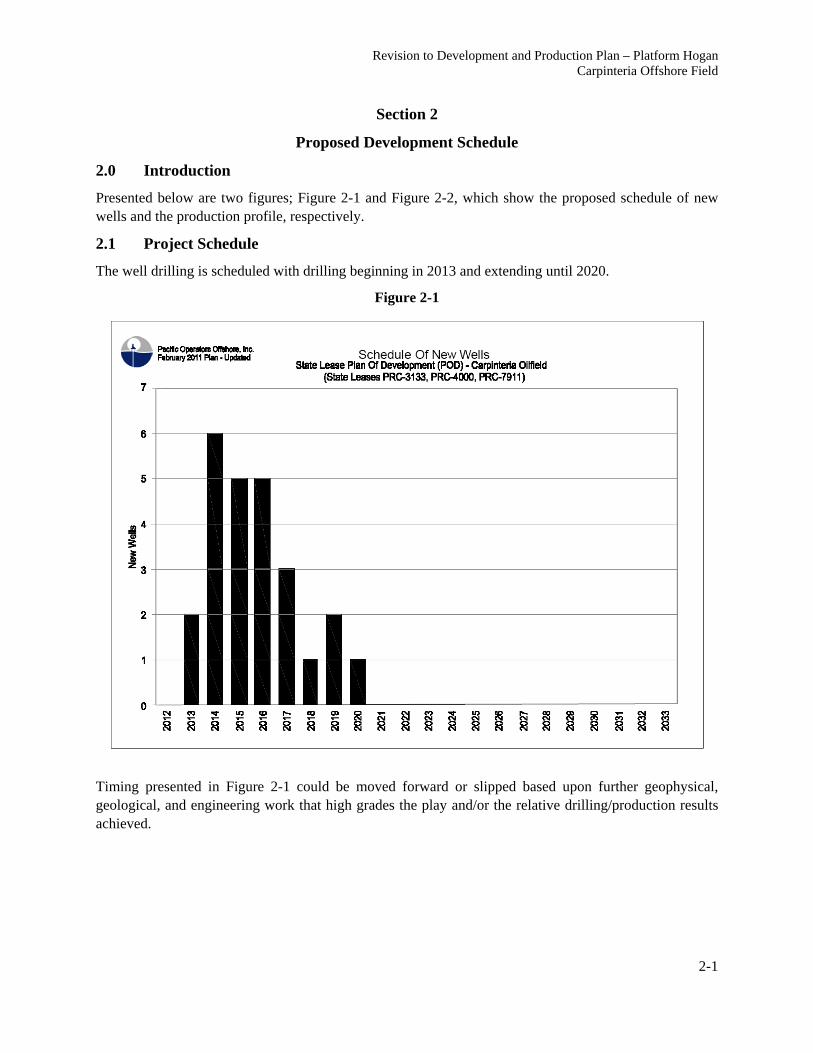
2.0 Introduction
Presented below are two figures; Figure 2-1 and Figure 2-2, which show the proposed schedule of new wells and the production profile, respectively.
2.1 Project Schedule
The well drilling is scheduled with drilling beginning in 2013 and extending until 2020.
Figure 2-1
Timing presented in Figure 2-1 could be moved forward or slipped based upon further geophysical, geological, and engineering work that high grades the play and/or the relative drilling/production results achieved.
Revision to Development and Production Plan – Platform Hogan Carpinteria Offshore Field
2-2
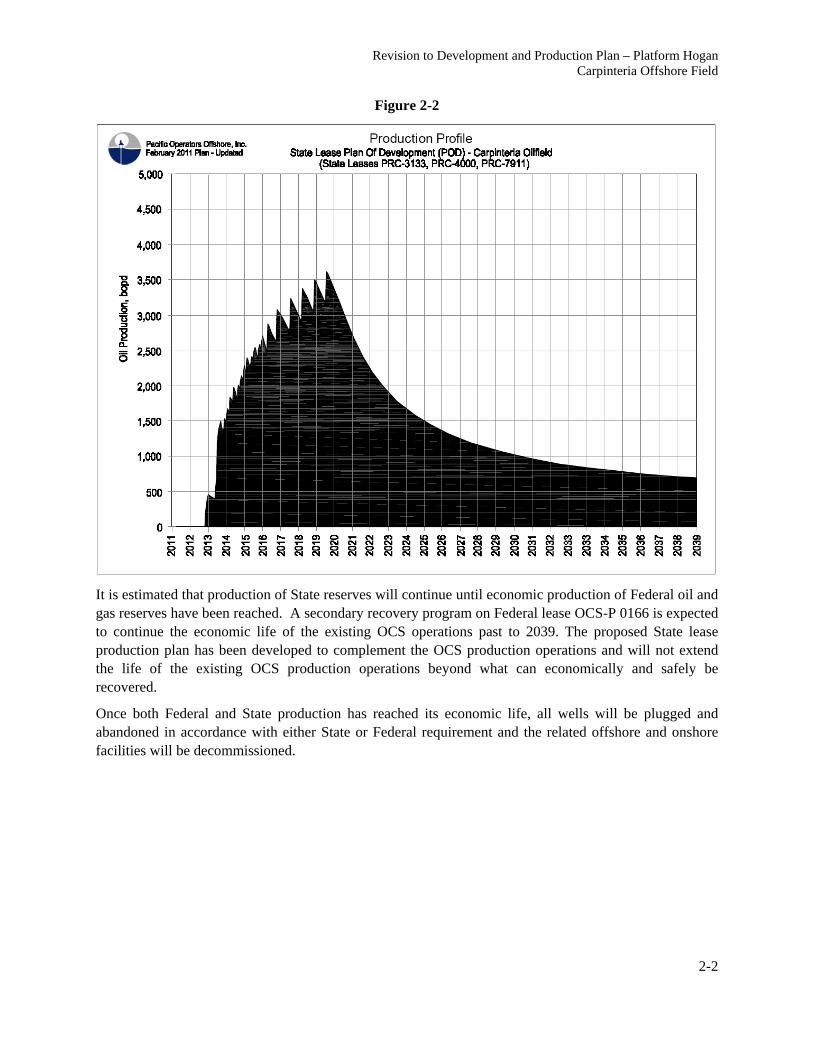
Figure 2-2
It is estimated that production of State reserves will continue until economic production of Federal oil and gas reserves have been reached. A secondary recovery program on Federal lease OCS-P 0166 is expected to continue the economic life of the existing OCS operations past to 2039. The proposed State lease production plan has been developed to complement the OCS production operations and will not extend the life of the existing OCS production operations beyond what can economically and safely be recovered.
Once both Federal and State production has reached its economic life, all wells will be plugged and abandoned in accordance with either State or Federal requirement and the related offshore and onshore facilities will be decommissioned.

February 2011 Carone DPP Revisions
SECTION 3.0
PLATFORM SITE AND CONSTRUCTION
Revision to Development and Production Plan – Platform Hogan Carpinteria Offshore Field
3-1
Section 3
Platform Site and Construction
3.1 Platform Site
No new platforms will be built to develop the reserves in the Carpinteria Field, therefore no revisions are needed to this section of the existing DPP. All of the development will occur from existing Platform Hogan using existing well slots and oil and gas handling equipment on the Platform. Minor equipment modifications will be needed, and these are described in detail in Section 5 - Platform Facilities and Production Measurement and Allocation Plan.
3.2 Platform Modifications
Additionally, during construction, a drilling rig of the type and configuration listed in Section 4.2 of the Revised DPP document will be temporarily installed on Platform Hogan. This rig will be transported and lifted onto the platform using a derrick barge similar to what has recently been used to install the drilling rig on Platform Houchin. During this same visit by the derrick barge, the existing platform workover rig will be de-mobilized. The derrick barge will not be anchored or moored during this lifting operation. It is typically tied to a platform leg on one end with tug boats pulling and maintaining its position from the opposite end. Once the drilling program has been completed, the drilling rig will be demobilized and a workover rig will be re-installed on the platform. The demobilization of the drilling rig and remobilization of the workover rig will also be performed by the derrick barge.
Once activities are complete, the wells would be decommissioned using a workover rig that is installed on the platform in accordance with standard well plug and abandonment requirements. Cement plugs would be set across the completion zone and at other locations to satisfy the regulatory requirements in place at the time of abandonment. The conductors would be removed using abrasive water jet technology and then cut and pulled in approximately 30’ sections.
3.3 New or Unusual Technology
It is important to note that no new or unusual technology will be required to carry out the proposed development activity.
February 2011 Carone DPP Revisions
REVISED FEBRUARY 2011
SECTION 4.0
DRILLING FACILITIES
Revision to Development and Production Plan – Platform Hogan Carpinteria Offshore Field
Revision No. 4 4-1
Section 4
Drilling Facilities
4.1 Introduction
This section addresses the drilling facilities that are proposed for the development of the Carpinteria Field reserves. It is anticipated that 25 new wells will be drilled over a seven (7) year time span. Contents of this section have been taken from Section 7 of the Updated Application to Develop State Leases, Carpinteria Field Area.
Drilling duration will depend on the mechanical condition of the hole and the objective of the directional well. The planned drilling program is expected to take seven (7) years. Only one drill rig will be used, and the drilling program is only planned to take place on Platform Hogan. Current oil production from Platform Hogan is approximately 600 bbl/day). The expected average rate of oil and gas production from the proposed wells would be 150 barrels oil per day per well.
With respect to 30 CFR 250.257(c) regarding transportation methods and quantities; the existing crew boat has the capability to transport up to 30,000 lbs of load from Venoco’s Carpinteria pier. Heavier loads are transported from Port Hueneme via work boat. This is the method of transport that currently being utilized for Platform Hogan drilling operations. The quantities of drilling fluids and chemical products are included in the attached well models.
The remainder of this section provides information on the drilling rig, well construction, and drilling safety.
4.2 Drilling Rig
The following table is a description of a generic drilling rig sized to drill the State Leases Plan of Development (POD) Pico Sand and Northern Thrust Fault play wells.
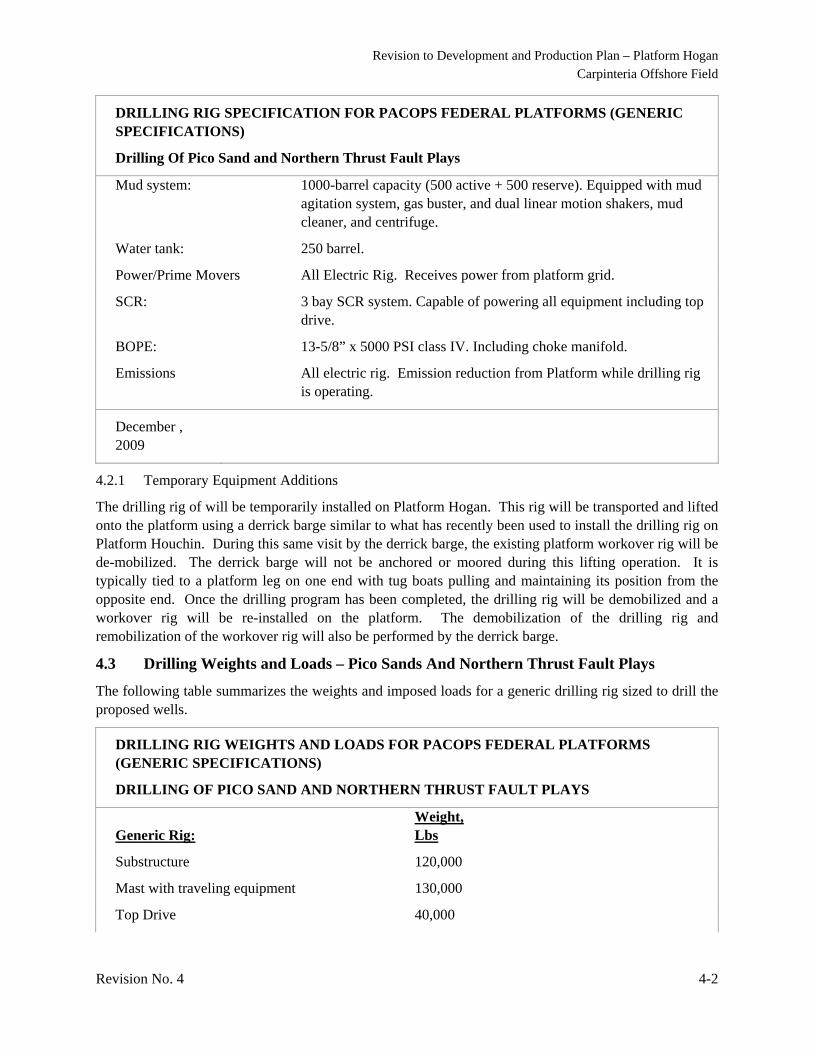
DRILLING RIG SPECIFICATION FOR PACOPS FEDERAL PLATFORMS (GENERIC SPECIFICATIONS)
Drilling Of Pico Sand and Northern Thrust Fault Plays
Drilling Range: 13,000’ with 4-1/2” drill pipe
Drawworks: 1000 horsepower electrically powered with D.C. motor(s)
Top Drive: 350 ton D.C. or A.C. driven electric top drive
Rotary table: 27-1/2” lockable rotary
Mast: 142’ triple mast rated 500,000#. Static hook load of 700,000# with 10 (1-1/4”) lines.
Traveling Assembly: 350-ton block hook. 350-ton swivel. 350 ton crown block
Substructure: Box on Box substructure, 700,000# capacity.
Mud pumps: Two 1000 horsepower triplex pumps driven by D.C. motors. Each equipped with centrifugal charge pumps.
Revision to Development and Production Plan – Platform Hogan Carpinteria Offshore Field
Revision No. 4 4-2
DRILLING RIG SPECIFICATION FOR PACOPS FEDERAL PLATFORMS (GENERIC SPECIFICATIONS)
Drilling Of Pico Sand and Northern Thrust Fault Plays
Mud system: 1000-barrel capacity (500 active + 500 reserve). Equipped with mud agitation system, gas buster, and dual linear motion shakers, mud cleaner, and centrifuge.
Water tank: 250 barrel.
Power/Prime Movers All Electric Rig. Receives power from platform grid.
SCR: 3 bay SCR system. Capable of powering all equipment including top drive.
BOPE: 13-5/8” x 5000 PSI class IV. Including choke manifold.
Emissions All electric rig. Emission reduction from Platform while drilling rig is operating.
December , 2009
4.2.1 Temporary Equipment Additions
The drilling rig of will be temporarily installed on Platform Hogan. This rig will be transported and lifted onto the platform using a derrick barge similar to what has recently been used to install the drilling rig on Platform Houchin. During this same visit by the derrick barge, the existing platform workover rig will be de-mobilized. The derrick barge will not be anchored or moored during this lifting operation. It is typically tied to a platform leg on one end with tug boats pulling and maintaining its position from the opposite end. Once the drilling program has been completed, the drilling rig will be demobilized and a workover rig will be re-installed on the platform. The demobilization of the drilling rig and remobilization of the workover rig will also be performed by the derrick barge.
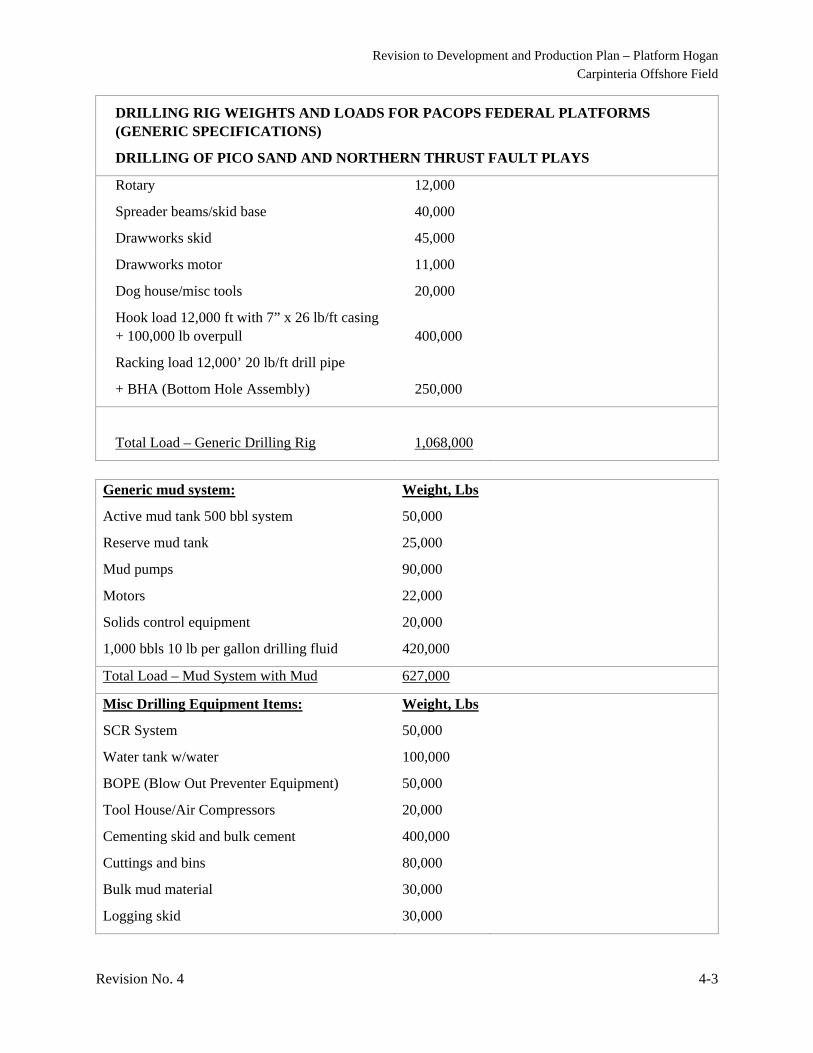
4.3 Drilling Weights and Loads – Pico Sands And Northern Thrust Fault Plays
The following table summarizes the weights and imposed loads for a generic drilling rig sized to drill the proposed wells.
DRILLING RIG WEIGHTS AND LOADS FOR PACOPS FEDERAL PLATFORMS (GENERIC SPECIFICATIONS)
DRILLING OF PICO SAND AND NORTHERN THRUST FAULT PLAYS
Generic Rig: Weight, Lbs
Substructure 120,000
Mast with traveling equipment 130,000
Top Drive 40,000
Revision to Development and Production Plan – Platform Hogan Carpinteria Offshore Field
Revision No. 4 4-3
DRILLING RIG WEIGHTS AND LOADS FOR PACOPS FEDERAL PLATFORMS (GENERIC SPECIFICATIONS)
DRILLING OF PICO SAND AND NORTHERN THRUST FAULT PLAYS
Rotary 12,000
Spreader beams/skid base 40,000
Drawworks skid 45,000
Drawworks motor 11,000
Dog house/misc tools 20,000
Hook load 12,000 ft with 7” x 26 lb/ft casing + 100,000 lb overpull 400,000
Racking load 12,000’ 20 lb/ft drill pipe
+ BHA (Bottom Hole Assembly) 250,000
Total Load – Generic Drilling Rig
1,068,000
Generic mud system: Weight, Lbs
Active mud tank 500 bbl system 50,000
Reserve mud tank 25,000
Mud pumps 90,000
Motors 22,000
Solids control equipment 20,000
1,000 bbls 10 lb per gallon drilling fluid 420,000
Total Load – Mud System with Mud 627,000
Misc Drilling Equipment Items: Weight, Lbs
SCR System 50,000
Water tank w/water 100,000
BOPE (Blow Out Preventer Equipment) 50,000
Tool House/Air Compressors 20,000
Cementing skid and bulk cement 400,000
Cuttings and bins 80,000
Bulk mud material 30,000
Logging skid 30,000
Revision to Development and Production Plan – Platform Hogan Carpinteria Offshore Field
Revision No. 4 4-4
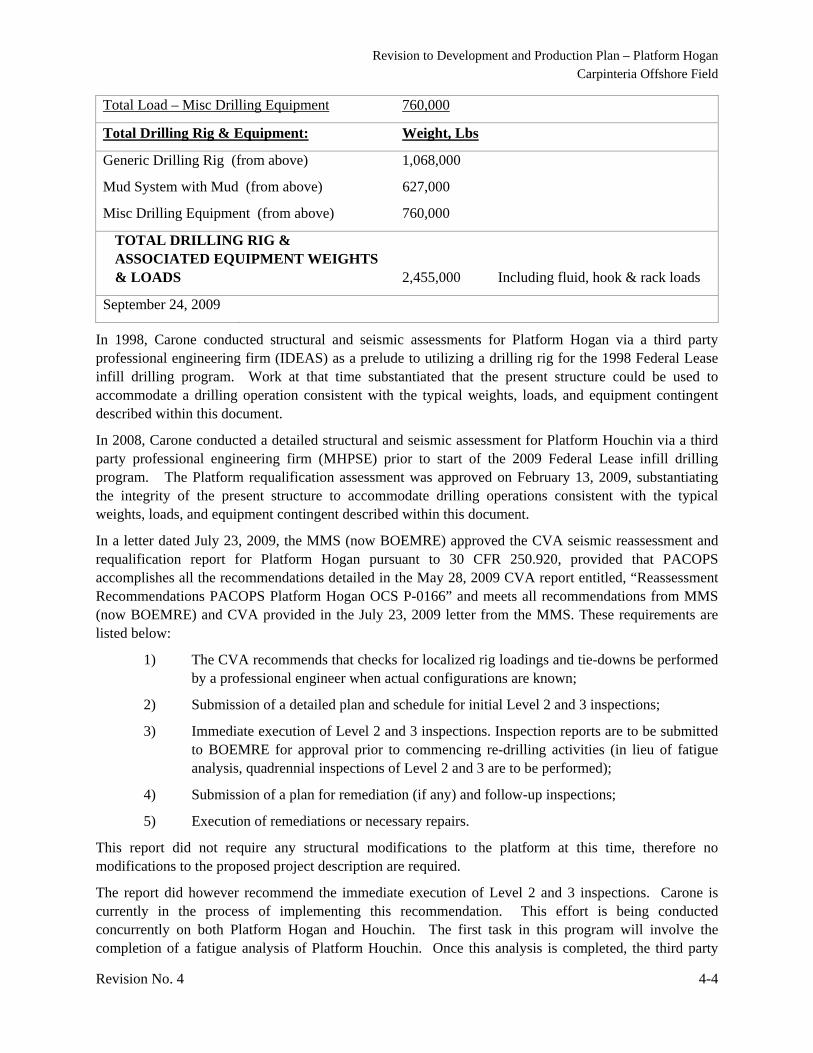
Total Load – Misc Drilling Equipment 760,000
Total Drilling Rig & Equipment: Weight, Lbs
Generic Drilling Rig (from above) 1,068,000
Mud System with Mud (from above) 627,000
Misc Drilling Equipment (from above) 760,000
TOTAL DRILLING RIG & ASSOCIATED EQUIPMENT WEIGHTS & LOADS 2,455,000 Including fluid, hook & rack loads
September 24, 2009
In 1998, Carone conducted structural and seismic assessments for Platform Hogan via a third party professional engineering firm (IDEAS) as a prelude to utilizing a drilling rig for the 1998 Federal Lease infill drilling program. Work at that time substantiated that the present structure could be used to accommodate a drilling operation consistent with the typical weights, loads, and equipment contingent described within this document.
In 2008, Carone conducted a detailed structural and seismic assessment for Platform Houchin via a third party professional engineering firm (MHPSE) prior to start of the 2009 Federal Lease infill drilling program. The Platform requalification assessment was approved on February 13, 2009, substantiating the integrity of the present structure to accommodate drilling operations consistent with the typical weights, loads, and equipment contingent described within this document.
In a letter dated July 23, 2009, the MMS (now BOEMRE) approved the CVA seismic reassessment and requalification report for Platform Hogan pursuant to 30 CFR 250.920, provided that PACOPS accomplishes all the recommendations detailed in the May 28, 2009 CVA report entitled, “Reassessment Recommendations PACOPS Platform Hogan OCS P-0166” and meets all recommendations from MMS (now BOEMRE) and CVA provided in the July 23, 2009 letter from the MMS. These requirements are listed below:
1) The CVA recommends that checks for localized rig loadings and tie-downs be performed by a professional engineer when actual configurations are known;
2) Submission of a detailed plan and schedule for initial Level 2 and 3 inspections;
3) Immediate execution of Level 2 and 3 inspections. Inspection reports are to be submitted to BOEMRE for approval prior to commencing re-drilling activities (in lieu of fatigue analysis, quadrennial inspections of Level 2 and 3 are to be performed);
4) Submission of a plan for remediation (if any) and follow-up inspections;
5) Execution of remediations or necessary repairs.
This report did not require any structural modifications to the platform at this time, therefore no modifications to the proposed project description are required.
The report did however recommend the immediate execution of Level 2 and 3 inspections. Carone is currently in the process of implementing this recommendation. This effort is being conducted concurrently on both Platform Hogan and Houchin. The first task in this program will involve the completion of a fatigue analysis of Platform Houchin. Once this analysis is completed, the third party
Revision to Development and Production Plan – Platform Hogan Carpinteria Offshore Field
Revision No. 4 4-5
engineer will develop the Level 2 and 3 survey protocol for both platforms for submission and approval by the BOEMRE. Once approved by the BOEMRE, Carone will conduct the jacket inspections in accordance with the approved protocol. Carone will continue to update CSLC and BOEMRE staff on the progress of these activities.
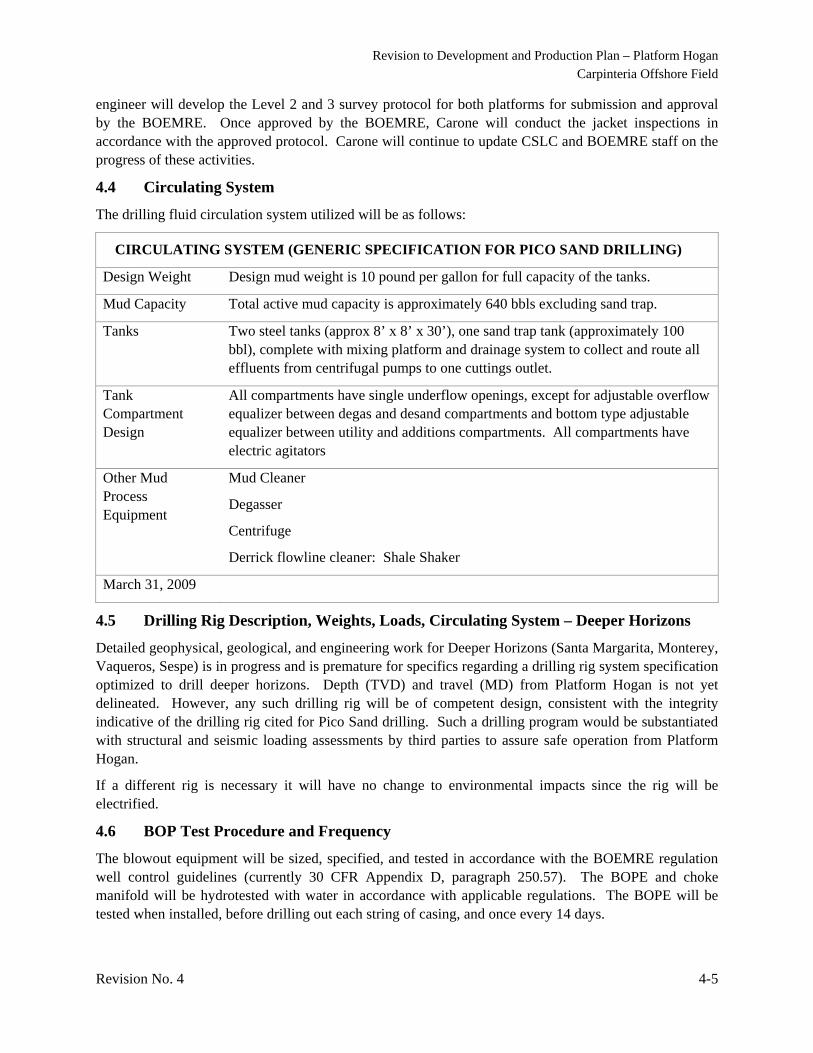
4.4 Circulating System
The drilling fluid circulation system utilized will be as follows:
CIRCULATING SYSTEM (GENERIC SPECIFICATION FOR PICO SAND DRILLING)
Design Weight Design mud weight is 10 pound per gallon for full capacity of the tanks.
Mud Capacity Total active mud capacity is approximately 640 bbls excluding sand trap.
Tanks Two steel tanks (approx 8’ x 8’ x 30’), one sand trap tank (approximately 100 bbl), complete with mixing platform and drainage system to collect and route all effluents from centrifugal pumps to one cuttings outlet.
Tank Compartment Design
All compartments have single underflow openings, except for adjustable overflow equalizer between degas and desand compartments and bottom type adjustable equalizer between utility and additions compartments. All compartments have electric agitators
Other Mud Process Equipment
Mud Cleaner
Degasser
Centrifuge
Derrick flowline cleaner: Shale Shaker
March 31, 2009
4.5 Drilling Rig Description, Weights, Loads, Circulating System – Deeper Horizons
Detailed geophysical, geological, and engineering work for Deeper Horizons (Santa Margarita, Monterey, Vaqueros, Sespe) is in progress and is premature for specifics regarding a drilling rig system specification optimized to drill deeper horizons. Depth (TVD) and travel (MD) from Platform Hogan is not yet delineated. However, any such drilling rig will be of competent design, consistent with the integrity indicative of the drilling rig cited for Pico Sand drilling. Such a drilling program would be substantiated with structural and seismic loading assessments by third parties to assure safe operation from Platform Hogan.
If a different rig is necessary it will have no change to environmental impacts since the rig will be electrified.
4.6 BOP Test Procedure and Frequency
The blowout equipment will be sized, specified, and tested in accordance with the BOEMRE regulation well control guidelines (currently 30 CFR Appendix D, paragraph 250.57). The BOPE and choke manifold will be hydrotested with water in accordance with applicable regulations. The BOPE will be tested when installed, before drilling out each string of casing, and once every 14 days.
Revision to Development and Production Plan – Platform Hogan Carpinteria Offshore Field
Revision No. 4 4-6
4.7 Directional Drilling Method
A Geo-Steerable Measurement While Drilling (MWD) drilling system will be used to drill and steer the directional well bores to the targets. MWD system will provide both inclination and azimuth during the course of the directional portion of the well bore. Mud motors will be used for normal directional drilling. A rotary steerable system will be used as a contingency if “sliding” becomes difficult at extended reaches when using a mud motor system.
4.8 Mud System
The most probable mud system that will be utilized to drill these wells will be a low solids non-dispersed Cypan-type polymer mud. This system can be weighted up using barite although high mud weights are not anticipated. Bentonite will be used for viscosity and fluid loss control.
4.9 Drill Cuttings and Mud Disposition
Zero discharge of drilling mud and drill cuttings will be accomplished by utilizing the following methods that incorporate slurrification equipment in conjunction with the onboard drilling fluid and drill cuttings processing system.
Drill cuttings will be collected from the shale shakers, and other solids control equipment, and brought to a unit where they are ground to micron size. Drill water from the rig floor and other liquid waste generated in the drilling operation are blended with the drill cuttings into a slurry. This blended slurry will be pumped down a dedicated injection well (A-16A and A-36 following workover) or a dedicated well annulus into subsurface rock strata. Well A-16A is currently available for this purpose. Well A-36 will require a workover to remove the cement plugs and return the well to active status for this purpose. A generic equipment description is as follows:
Two ~50 barrel grinding tanks
Manifold connecting the grinding tanks
One ~70 barrel catch tank
Two 5”x6” centrifugal pumps
One triplex injection pump
One auger system
Probable slurry injection zones will be in the Pico formation. Similar slurry injections have been successfully used on the Pacific OCS and within State Waters.
Remaining Solid Waste: All other solid waste is transported from offshore and picked up by Consolidated Disposal Services and taken to the Oxnard dump site under the management of Del Norte Division, City of Oxnard. During routine non-drilling operations, average monthly disposal is 4 tons per month; during drilling operations, the average is 6.3 tons per month.
4.10 Drilling Well Procedures
Please refer to information included following Section 4.0 (State Lease Model Well Design).
* proprietary copies only.
Revision to Development and Production Plan – Platform Hogan Carpinteria Offshore Field
Revision No. 4 4-7
4.11 Uncontrolled Well Release (Blowout Scenarios)
The Carpinteria field is a mature field that currently is in an advanced state of depletion. The State portion of the field was initially developed in 1965 and produced continuously until 1993. In this regard, similar to the portion of the field that resides in Federal waters, the State portion of the field is not capable of flowing fluids to the surface from the target reservoir (the Pico or Repetto sands). Fully compliant BOP equipment will be used during the drilling of the wells, so if a kick was to occur, the well can be brought under control quickly using standard engineering and drilling practices.
The following information summarizes the potential worst-case discharge that could occur during drilling operations within the Carpinteria Field. The analysis is based on information provided by PACOPS for Platforms Hogan and Houchin within their existing Oil Spill Response Plan (OSRP) which has been summarized in Attachment 9 (Oil Spill Risk Assessment). It should be noted that per the requirements of 30 CFR 250.243(h) and the associated National Notice to Lessees and Operators (NTL) 2010-N06, PACOPS has provided an estimate of potential spill volumes associated with the unlikely event of an uncontrolled well release (blowout). In response to this requirement, PACOPS contracted with Gemini Solutions, Inc. (Gemini) of Richmond, Texas to conduct studies and model a worst-case discharge (WCD) scenario for the Carpinteria Field. Gemini completed studies for both Sub-Thrust and Supra-Thrust reservoirs in the Carpinteria Field project area. According to Gemini, “the models for each of these reservoirs show that the current reservoir pressures are lower than the pressure required for the wells to flow under a WCD scenario…. All models showed that the current reservoir pressures are too low to flow the wells in a WCD scenario.” As such, Gemini determined that the worst case discharge rates for the Carpinteria Field are zero (0) bbls from an uncontrolled well release (blowout). (Please refer to the Comment Letter attached to this submittal for a copy of all Gemini documents including the February 14th 2011 Summary Letter as well as three (3) PowerPoint presentations by Gemini discussing the Final Report dated 1/25/2011). For further information including detail regarding each of these potential spill scenarios based on the guidance provided by the BOEMRE (formerly MMS) Oil Spill Risk Analysis, please refer to Attachment 9.
February 2011 Carone DPP Revisions
REVISED FEBRUARY 2011
SECTION 5.0
PLATFORM FACILITIES AND PRODUCTION MEASUREMENT AND ALLOCATION PLAN
Revision to Development and Production Plan – Platform Hogan Carpinteria Offshore Field
5-1
Section 5
Platform Facilities and Production Measurement and Allocation Plan
5.1 Introduction
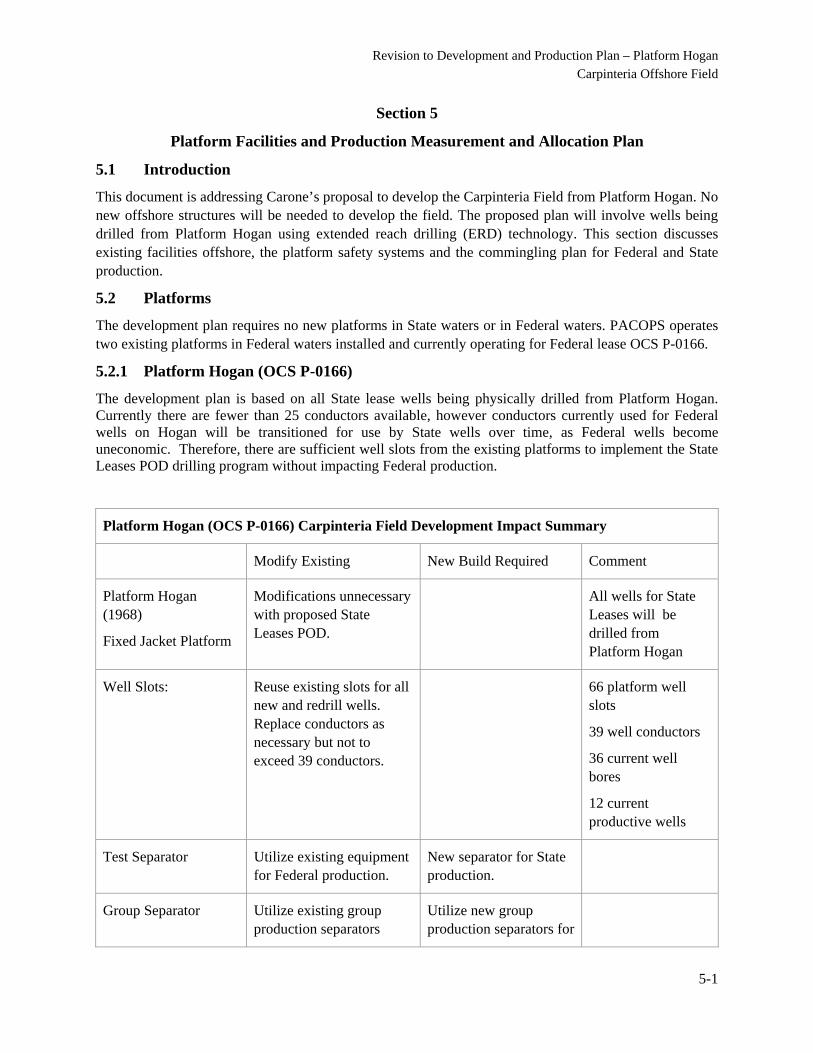
This document is addressing Carone’s proposal to develop the Carpinteria Field from Platform Hogan. No new offshore structures will be needed to develop the field. The proposed plan will involve wells being drilled from Platform Hogan using extended reach drilling (ERD) technology. This section discusses existing facilities offshore, the platform safety systems and the commingling plan for Federal and State production.
5.2 Platforms
The development plan requires no new platforms in State waters or in Federal waters. PACOPS operates two existing platforms in Federal waters installed and currently operating for Federal lease OCS P-0166.
5.2.1 Platform Hogan (OCS P-0166)
The development plan is based on all State lease wells being physically drilled from Platform Hogan. Currently there are fewer than 25 conductors available, however conductors currently used for Federal wells on Hogan will be transitioned for use by State wells over time, as Federal wells become uneconomic. Therefore, there are sufficient well slots from the existing platforms to implement the State Leases POD drilling program without impacting Federal production.
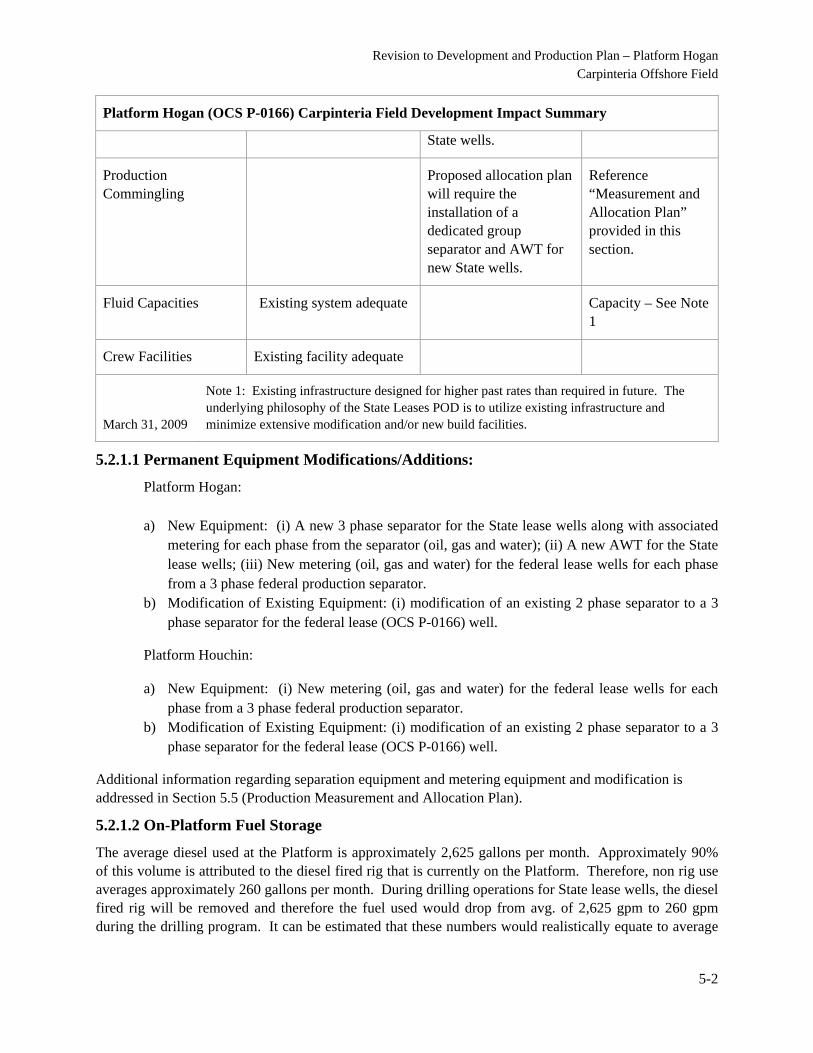
Platform Hogan (OCS P-0166) Carpinteria Field Development Impact Summary
Modify Existing New Build Required Comment
Platform Hogan (1968)
Fixed Jacket Platform
Modifications unnecessary with proposed State Leases POD.
All wells for State Leases will be drilled from Platform Hogan
Well Slots:
Reuse existing slots for all new and redrill wells. Replace conductors as necessary but not to exceed 39 conductors.
66 platform well slots
39 well conductors
36 current well bores
12 current productive wells
Test Separator Utilize existing equipment for Federal production.
New separator for State production.
Group Separator Utilize existing group production separators
Utilize new group production separators for
Revision to Development and Production Plan – Platform Hogan Carpinteria Offshore Field
5-2
Platform Hogan (OCS P-0166) Carpinteria Field Development Impact Summary
State wells.
Production Commingling
Proposed allocation plan will require the installation of a dedicated group separator and AWT for new State wells.
Reference “Measurement and Allocation Plan” provided in this section.
Fluid Capacities Existing system adequate Capacity – See Note 1
Crew Facilities Existing facility adequate
March 31, 2009
Note 1: Existing infrastructure designed for higher past rates than required in future. The underlying philosophy of the State Leases POD is to utilize existing infrastructure and minimize extensive modification and/or new build facilities.
5.2.1.1 Permanent Equipment Modifications/Additions:
Platform Hogan:
a) New Equipment: (i) A new 3 phase separator for the State lease wells along with associated metering for each phase from the separator (oil, gas and water); (ii) A new AWT for the State lease wells; (iii) New metering (oil, gas and water) for the federal lease wells for each phase from a 3 phase federal production separator.
b) Modification of Existing Equipment: (i) modification of an existing 2 phase separator to a 3 phase separator for the federal lease (OCS P-0166) well.
Platform Houchin: a) New Equipment: (i) New metering (oil, gas and water) for the federal lease wells for each
phase from a 3 phase federal production separator. b) Modification of Existing Equipment: (i) modification of an existing 2 phase separator to a 3
phase separator for the federal lease (OCS P-0166) well.
Additional information regarding separation equipment and metering equipment and modification is addressed in Section 5.5 (Production Measurement and Allocation Plan).
5.2.1.2 On-Platform Fuel Storage
The average diesel used at the Platform is approximately 2,625 gallons per month. Approximately 90% of this volume is attributed to the diesel fired rig that is currently on the Platform. Therefore, non rig use averages approximately 260 gallons per month. During drilling operations for State lease wells, the diesel fired rig will be removed and therefore the fuel used would drop from avg. of 2,625 gpm to 260 gpm during the drilling program. It can be estimated that these numbers would realistically equate to average
Revision to Development and Production Plan – Platform Hogan Carpinteria Offshore Field
5-3
storage quantities. Additionally, based on existing fuel usage offshore, the average fuel stored onboard should be approximately 1,500 to 2,000 gallons during the State Lease drilling.
5.3 Platform Safety Systems
Platform Hogan is operated in conformance with all BOEMRE safety system requirements. A copy of the facility safety plan has been previously submitted to the BOEMRE.
5.4 Pollution Prevention Systems
Platform Hogan has been designed to eliminate sources of water pollution during drilling and production operations. All platform discharges are conducted in conformance with General Permit No. CAG 28000 (Authorization to Discharge under the NPDES for Oil and Gas Exploration, Development and Production Facilities).
Both the drilling and production decks are equipped with curbing to prevent direct runoff to the ocean. All water used for deck wash down, cuttings wash, natural rainfall, and well cleanup fluids is collected in a skimming tank where all contaminants are separated from water. Sanitary facilities for the drilling and production crew are installed on Platform Hogan. These facilities discharge into a sewage treatment system, effluent is treated and discharged at 130 feet below MLLW level. All produced fluids and oil contaminated waste water are transported through pipelines to shore.
Production equipment and pipelines to shore are designed to operate automatically, however the platform is manned 24 hours a day. There are numerous alarm and shut in detectors located at various points on the platform. This automatic alarm and shut in system will close the wells below the ocean floor to prevent oil or gas leakage. A summary of these alarm and shut in functions are listed below;
Shut in All Wells
1. High separator pressure
2. Low separator pressure
3. High separator level
4. Manual Local – Can be manually shut in from four locations on Platform Hogan
5. Manual Remote – Can be manually shut in from shore via a communications cable.
6. Auto Remote – Automatic shut in is caused by a malfunction of onshore equipment.
7. Fire – Automatic shut in is activated by fusible plugs from various locations at well and separator areas.
Alarm – Air Horn and Visual Indications
1. Intermedial high and low levels in separators and surge tanks
2. Low Pressure – Instrument air
3. Derrick light off
4. Gas leakage – Gas sensors will be mounted at various points on production and drilling deck.
5. Loss of purge air pressure.
Revision to Development and Production Plan – Platform Hogan Carpinteria Offshore Field
5-4
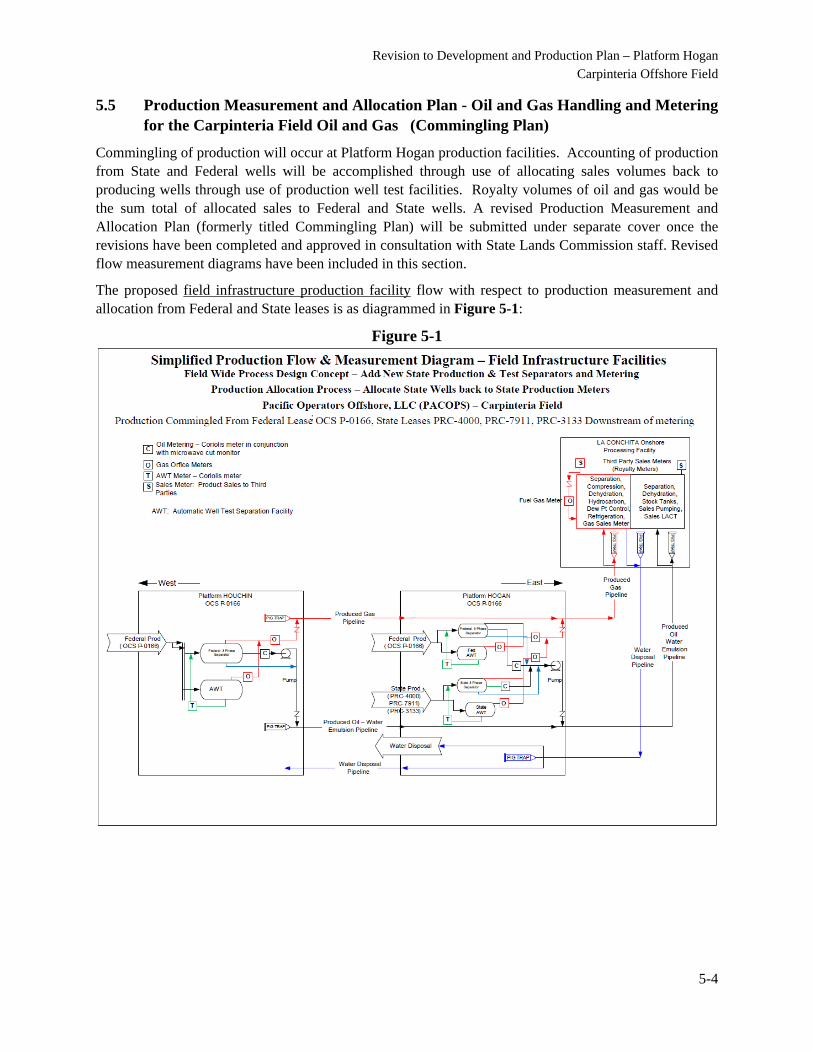
5.5 Production Measurement and Allocation Plan - Oil and Gas Handling and Metering for the Carpinteria Field Oil and Gas (Commingling Plan)
Commingling of production will occur at Platform Hogan production facilities. Accounting of production from State and Federal wells will be accomplished through use of allocating sales volumes back to producing wells through use of production well test facilities. Royalty volumes of oil and gas would be the sum total of allocated sales to Federal and State wells. A revised Production Measurement and Allocation Plan (formerly titled Commingling Plan) will be submitted under separate cover once the revisions have been completed and approved in consultation with State Lands Commission staff. Revised flow measurement diagrams have been included in this section.
The proposed field infrastructure production facility flow with respect to production measurement and allocation from Federal and State leases is as diagrammed in Figure 5-1:
Figure 5-1
Revision to Development and Production Plan – Platform Hogan Carpinteria Offshore Field
5-5
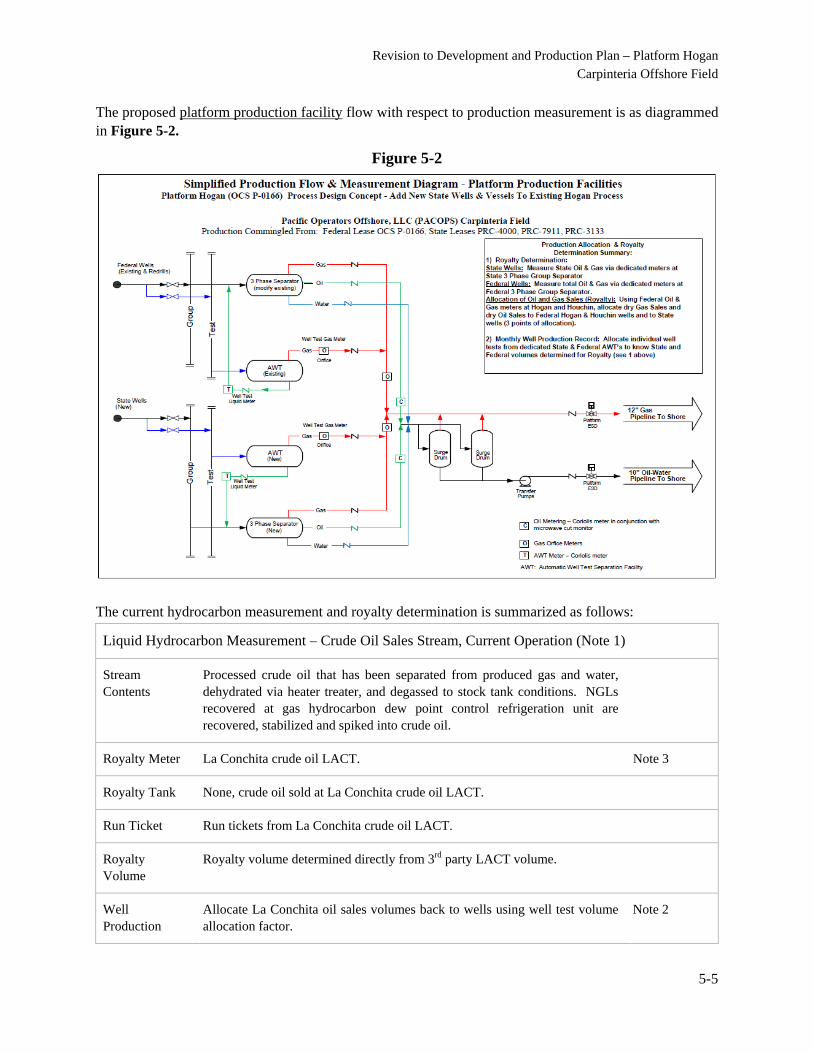
The proposed platform production facility flow with respect to production measurement is as diagrammed in Figure 5-2.
Figure 5-2
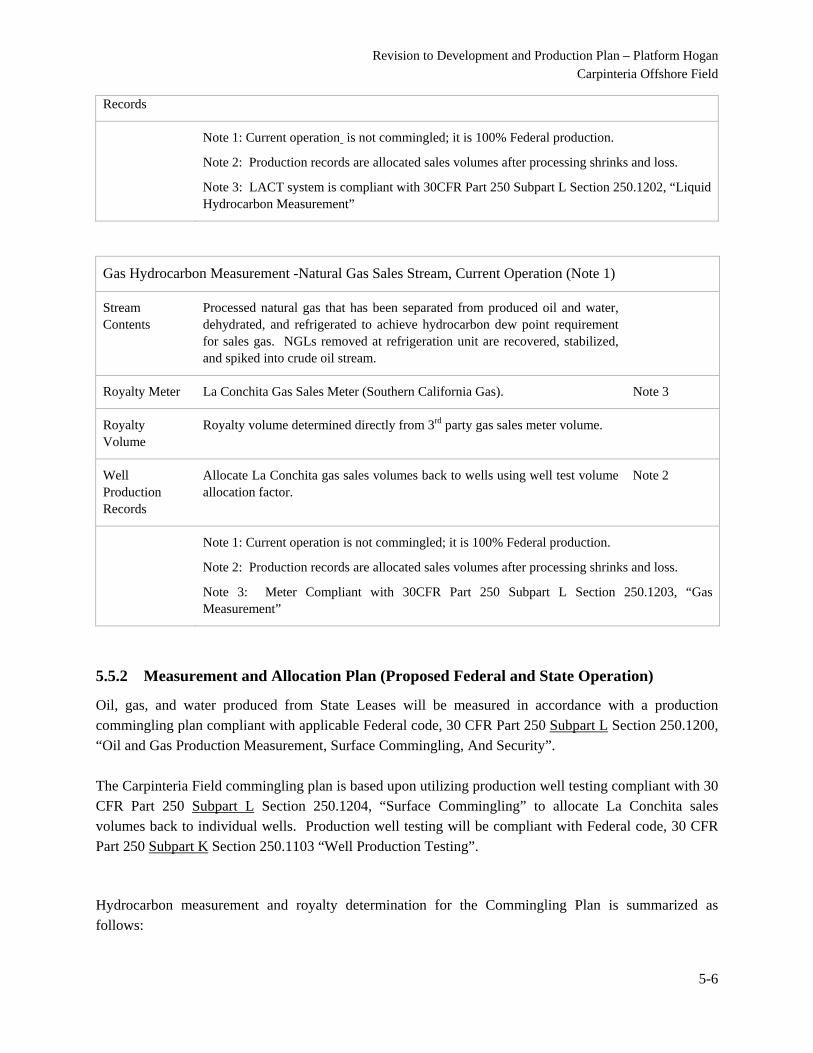
The current hydrocarbon measurement and royalty determination is summarized as follows:
Liquid Hydrocarbon Measurement – Crude Oil Sales Stream, Current Operation (Note 1)
Stream Contents
Processed crude oil that has been separated from produced gas and water, dehydrated via heater treater, and degassed to stock tank conditions. NGLs recovered at gas hydrocarbon dew point control refrigeration unit are recovered, stabilized and spiked into crude oil.
Royalty Meter La Conchita crude oil LACT. Note 3
Royalty Tank None, crude oil sold at La Conchita crude oil LACT.
Run Ticket Run tickets from La Conchita crude oil LACT.
Royalty Volume
Royalty volume determined directly from 3rd party LACT volume.
Well Production
Allocate La Conchita oil sales volumes back to wells using well test volume allocation factor.
Note 2
Revision to Development and Production Plan – Platform Hogan Carpinteria Offshore Field
5-6
Records
Note 1: Current operation is not commingled; it is 100% Federal production.
Note 2: Production records are allocated sales volumes after processing shrinks and loss.
Note 3: LACT system is compliant with 30CFR Part 250 Subpart L Section 250.1202, “Liquid Hydrocarbon Measurement”
Gas Hydrocarbon Measurement -Natural Gas Sales Stream, Current Operation (Note 1)
Stream Contents
Processed natural gas that has been separated from produced oil and water, dehydrated, and refrigerated to achieve hydrocarbon dew point requirement for sales gas. NGLs removed at refrigeration unit are recovered, stabilized, and spiked into crude oil stream.
Royalty Meter La Conchita Gas Sales Meter (Southern California Gas). Note 3
Royalty Volume
Royalty volume determined directly from 3rd party gas sales meter volume.
Well Production Records
Allocate La Conchita gas sales volumes back to wells using well test volume allocation factor.
Note 2
Note 1: Current operation is not commingled; it is 100% Federal production.
Note 2: Production records are allocated sales volumes after processing shrinks and loss.
Note 3: Meter Compliant with 30CFR Part 250 Subpart L Section 250.1203, “Gas Measurement”
5.5.2 Measurement and Allocation Plan (Proposed Federal and State Operation)
Oil, gas, and water produced from State Leases will be measured in accordance with a production commingling plan compliant with applicable Federal code, 30 CFR Part 250 Subpart L Section 250.1200, “Oil and Gas Production Measurement, Surface Commingling, And Security”. The Carpinteria Field commingling plan is based upon utilizing production well testing compliant with 30 CFR Part 250 Subpart L Section 250.1204, “Surface Commingling” to allocate La Conchita sales volumes back to individual wells. Production well testing will be compliant with Federal code, 30 CFR Part 250 Subpart K Section 250.1103 “Well Production Testing”.
Hydrocarbon measurement and royalty determination for the Commingling Plan is summarized as follows:
Revision to Development and Production Plan – Platform Hogan Carpinteria Offshore Field
5-7
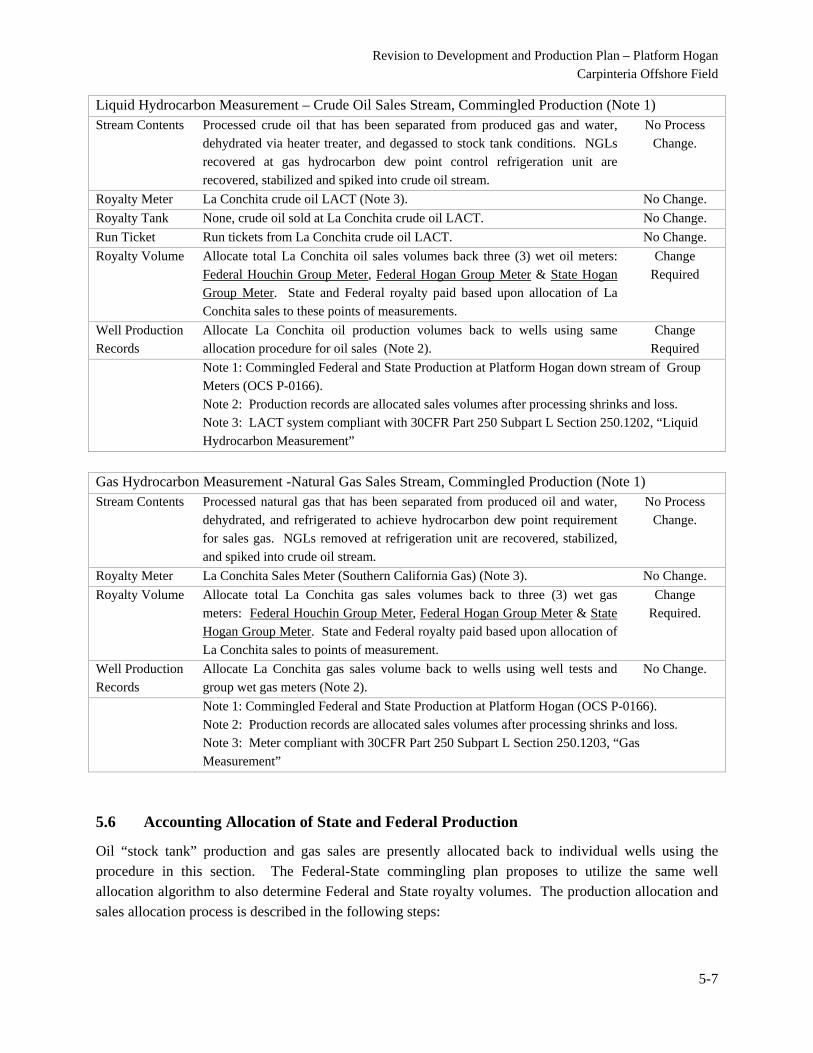
Liquid Hydrocarbon Measurement – Crude Oil Sales Stream, Commingled Production (Note 1) Stream Contents Processed crude oil that has been separated from produced gas and water,
dehydrated via heater treater, and degassed to stock tank conditions. NGLs recovered at gas hydrocarbon dew point control refrigeration unit are recovered, stabilized and spiked into crude oil stream.
No Process Change.
Royalty Meter La Conchita crude oil LACT (Note 3). No Change.
Royalty Tank None, crude oil sold at La Conchita crude oil LACT. No Change.
Run Ticket Run tickets from La Conchita crude oil LACT. No Change.
Royalty Volume Allocate total La Conchita oil sales volumes back three (3) wet oil meters: Federal Houchin Group Meter, Federal Hogan Group Meter & State Hogan Group Meter. State and Federal royalty paid based upon allocation of La Conchita sales to these points of measurements.
Change Required
Well Production Records
Allocate La Conchita oil production volumes back to wells using same allocation procedure for oil sales (Note 2).
Change Required
Note 1: Commingled Federal and State Production at Platform Hogan down stream of Group Meters (OCS P-0166). Note 2: Production records are allocated sales volumes after processing shrinks and loss. Note 3: LACT system compliant with 30CFR Part 250 Subpart L Section 250.1202, “Liquid Hydrocarbon Measurement”
Gas Hydrocarbon Measurement -Natural Gas Sales Stream, Commingled Production (Note 1) Stream Contents Processed natural gas that has been separated from produced oil and water,
dehydrated, and refrigerated to achieve hydrocarbon dew point requirement for sales gas. NGLs removed at refrigeration unit are recovered, stabilized, and spiked into crude oil stream.
No Process Change.
Royalty Meter La Conchita Sales Meter (Southern California Gas) (Note 3). No Change.
Royalty Volume Allocate total La Conchita gas sales volumes back to three (3) wet gas meters: Federal Houchin Group Meter, Federal Hogan Group Meter & State Hogan Group Meter. State and Federal royalty paid based upon allocation of La Conchita sales to points of measurement.
Change Required.
Well Production Records
Allocate La Conchita gas sales volume back to wells using well tests and group wet gas meters (Note 2).
No Change.
Note 1: Commingled Federal and State Production at Platform Hogan (OCS P-0166). Note 2: Production records are allocated sales volumes after processing shrinks and loss. Note 3: Meter compliant with 30CFR Part 250 Subpart L Section 250.1203, “Gas Measurement”
5.6 Accounting Allocation of State and Federal Production
Oil “stock tank” production and gas sales are presently allocated back to individual wells using the procedure in this section. The Federal-State commingling plan proposes to utilize the same well allocation algorithm to also determine Federal and State royalty volumes. The production allocation and sales allocation process is described in the following steps:
Revision to Development and Production Plan – Platform Hogan Carpinteria Offshore Field
5-8
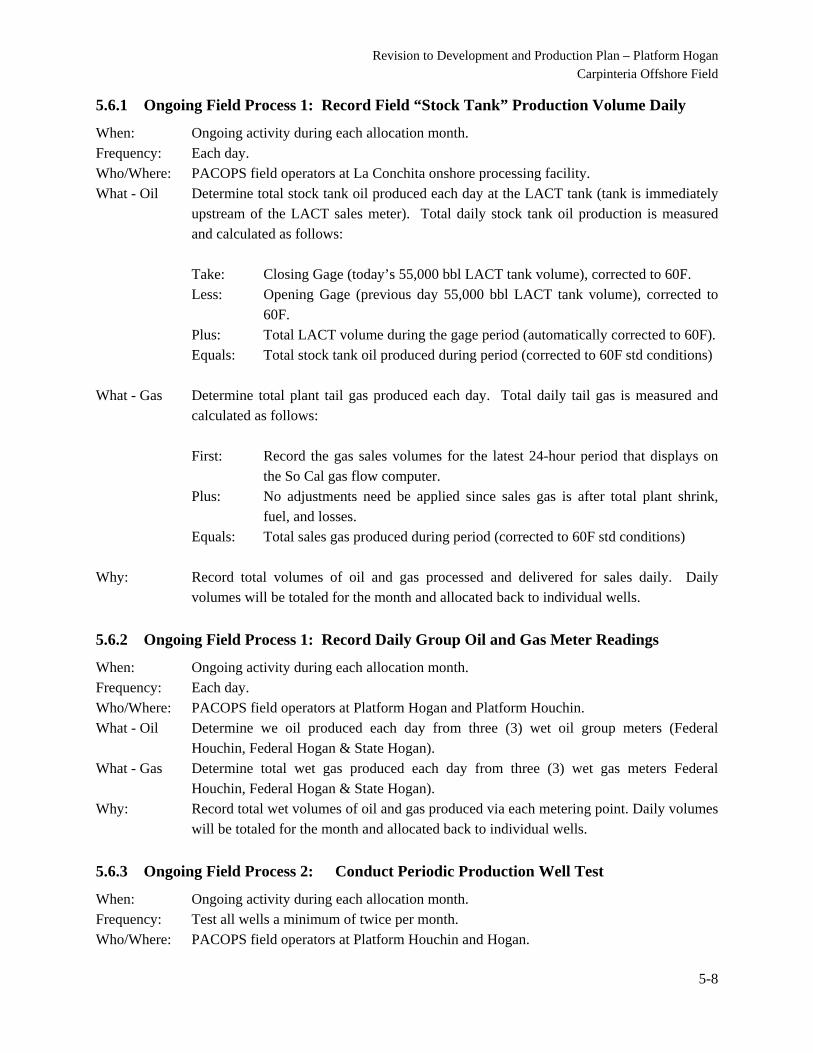
5.6.1 Ongoing Field Process 1: Record Field “Stock Tank” Production Volume Daily
When: Ongoing activity during each allocation month. Frequency: Each day. Who/Where: PACOPS field operators at La Conchita onshore processing facility. What - Oil Determine total stock tank oil produced each day at the LACT tank (tank is immediately
upstream of the LACT sales meter). Total daily stock tank oil production is measured and calculated as follows: Take: Closing Gage (today’s 55,000 bbl LACT tank volume), corrected to 60F. Less: Opening Gage (previous day 55,000 bbl LACT tank volume), corrected to
60F. Plus: Total LACT volume during the gage period (automatically corrected to 60F). Equals: Total stock tank oil produced during period (corrected to 60F std conditions)
What - Gas Determine total plant tail gas produced each day. Total daily tail gas is measured and calculated as follows:
First: Record the gas sales volumes for the latest 24-hour period that displays on
the So Cal gas flow computer. Plus: No adjustments need be applied since sales gas is after total plant shrink,
fuel, and losses. Equals: Total sales gas produced during period (corrected to 60F std conditions)
Why: Record total volumes of oil and gas processed and delivered for sales daily. Daily volumes will be totaled for the month and allocated back to individual wells.
5.6.2 Ongoing Field Process 1: Record Daily Group Oil and Gas Meter Readings
When: Ongoing activity during each allocation month. Frequency: Each day. Who/Where: PACOPS field operators at Platform Hogan and Platform Houchin. What - Oil Determine we oil produced each day from three (3) wet oil group meters (Federal
Houchin, Federal Hogan & State Hogan). What - Gas Determine total wet gas produced each day from three (3) wet gas meters Federal
Houchin, Federal Hogan & State Hogan). Why: Record total wet volumes of oil and gas produced via each metering point. Daily volumes
will be totaled for the month and allocated back to individual wells.
5.6.3 Ongoing Field Process 2: Conduct Periodic Production Well Test
When: Ongoing activity during each allocation month. Frequency: Test all wells a minimum of twice per month. Who/Where: PACOPS field operators at Platform Houchin and Hogan.
Revision to Development and Production Plan – Platform Hogan Carpinteria Offshore Field
5-9
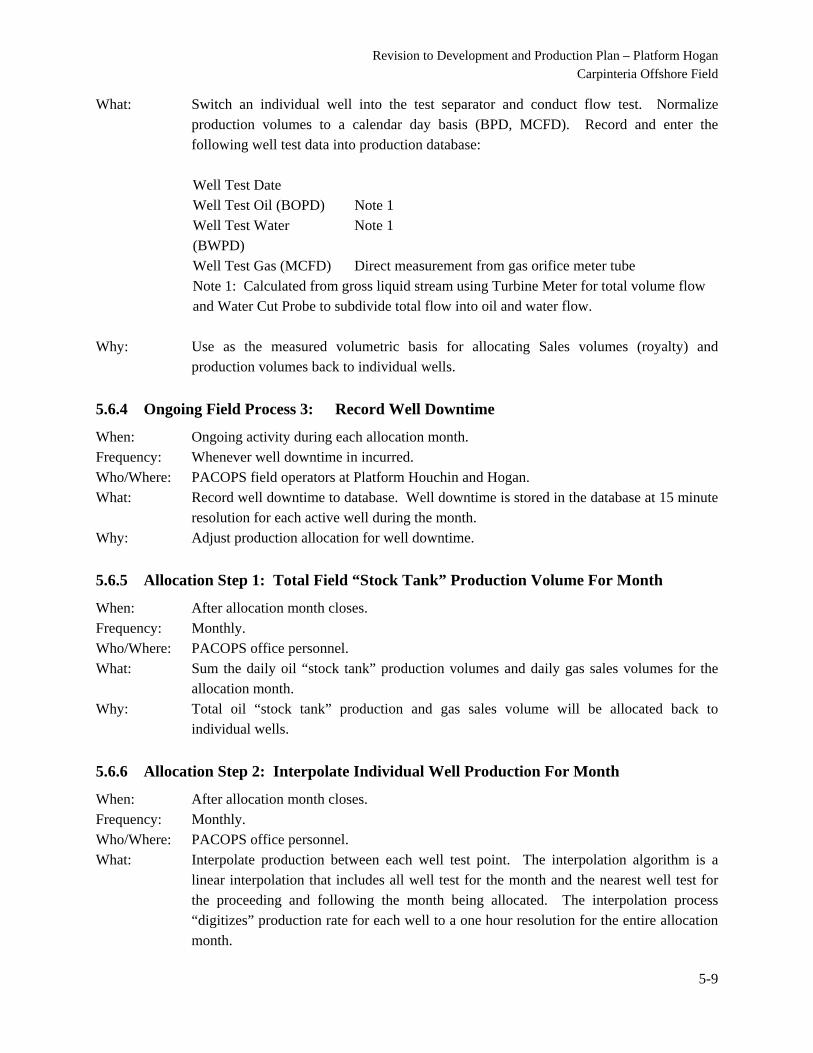
What: Switch an individual well into the test separator and conduct flow test. Normalize production volumes to a calendar day basis (BPD, MCFD). Record and enter the following well test data into production database:
Well Test Date Well Test Oil (BOPD) Note 1 Well Test Water (BWPD)
Note 1
Well Test Gas (MCFD) Direct measurement from gas orifice meter tube Note 1: Calculated from gross liquid stream using Turbine Meter for total volume flow and Water Cut Probe to subdivide total flow into oil and water flow.
Why: Use as the measured volumetric basis for allocating Sales volumes (royalty) and
production volumes back to individual wells.
5.6.4 Ongoing Field Process 3: Record Well Downtime
When: Ongoing activity during each allocation month. Frequency: Whenever well downtime in incurred. Who/Where: PACOPS field operators at Platform Houchin and Hogan. What: Record well downtime to database. Well downtime is stored in the database at 15 minute
resolution for each active well during the month. Why: Adjust production allocation for well downtime.
5.6.5 Allocation Step 1: Total Field “Stock Tank” Production Volume For Month
When: After allocation month closes. Frequency: Monthly. Who/Where: PACOPS office personnel. What: Sum the daily oil “stock tank” production volumes and daily gas sales volumes for the
allocation month. Why: Total oil “stock tank” production and gas sales volume will be allocated back to
individual wells.
5.6.6 Allocation Step 2: Interpolate Individual Well Production For Month
When: After allocation month closes. Frequency: Monthly. Who/Where: PACOPS office personnel. What: Interpolate production between each well test point. The interpolation algorithm is a
linear interpolation that includes all well test for the month and the nearest well test for the proceeding and following the month being allocated. The interpolation process “digitizes” production rate for each well to a one hour resolution for the entire allocation month.
Revision to Development and Production Plan – Platform Hogan Carpinteria Offshore Field
5-10
Why: Convert periodic instantaneous production rates from well testing into a continuous theoretical well production rate. The theoretical well test streams are used as the “prorate” basis for allocating “stock tank” production volumes back to individual wells.
5.6.7 Allocation Step 3: Individual Well Downtime
When: After allocation month closes. Frequency: Monthly. Who/Where: PACOPS office personnel. What: Well downtime is stored in the production record database at 15 minute resolution for
each well. This step digitizes downtime on an hourly resolution. An entire hour is flagged as down for allocation purposes when any portion of an hour is recorded as down.
Why: Adjust continuous well production stream for well downtime.
5.6.8 Allocation Step 4: Allocation of Dry Oil Volumes and Dry Gas Volumes to Wet Meters
When: After allocation month closes. Frequency: Monthly. Who/Where: PACOPS office personnel. What: Allocate the total produced oil volumes and total produced gas volumes measured at
LaConchita back to the Wet Meters to determine Dry Oil production and Dry Gas production at each wet meter allocation point.
Why: To determine production at each point of well allocation (Federal Hogan wells, Federal Houchin wells and State Hogan wells).
5.6.9 Allocation Step 5: Well And Field Theoretical Volume (Using Well Tests)
When: After allocation month closes. Frequency: Monthly. Who/Where: PACOPS office personnel. What: Sum the hourly theoretical production rates (based upon well tests) for each active well to
obtain a total theoretical volume for each well for the allocation month. Sum the total theoretical monthly volumes for all wells to obtain a total theoretical volume for attributable to each wet meter (in other words, each wet meter for both oil and gas become points of allocation).
Why: Total theoretical volume is used to quantify the adjustment necessary to be applied to allocated volumes so total allocated volume equals total field “stock tank” production.
5.6.10 Allocation Step 6: Determine Total Field Adjustment Volume For Month
When: After allocation month closes. Frequency: Monthly.
Revision to Development and Production Plan – Platform Hogan Carpinteria Offshore Field
5-11
Who/Where: PACOPS office personnel. What - Oil: Determine how much difference there is between the total field theoretical volume (based
upon well tests) and the total field oil “stock tank” production volume, calculated as follows:
Take: Total Field “Stock Tank” Production Volume For Month (Allocation Step 1). Subtract: Total Field Theoretical Volume (from well test rates) (Allocation Step 5). Equals: Total Field Adjustment Volume (amount theoretical volume differs from
“stock tank” production) What - Gas: Determine how much difference there is between the total field theoretical volume (based
upon well tests) and the total field gas sales volume, calculated as follows:
Take: Total Field Gas Sales Volume For Month (Allocation Step 1). Subtract: Total Field Theoretical Volume (from well test rates) (Allocation Step 5). Equals: Total Field Adjustment Volume (amount theoretical volume differs from gas
sales) Why: Individual well theoretical volumes (based upon well test) for the month must be
uniformly adjusted to achieve field total “stock tank” production volume for oil and field total gas sales volume for gas.
5.6.11 Allocation Step 7: Allocate Corrected Group Meter Production To Individual Wells
When: After allocation month closes. Frequency: Monthly. Who/Where: PACOPS office personnel. What: Allocate total field group meter production volumes back to individual wells. This
process reconciles the difference between total theoretical volume (based upon well tests) and total oil “stock tank” production and gas sales volumes that are allocated back to the group meters from total production measured at La Conchita. Allocation to individual wells is based upon the relative volume contribution towards the group meter total that each well has contributed. The allocation calculation is performed by the following formula:
Oil:
Take: Well Theoretical Volume (1st part of Allocation Step 5). Divide By Group Meter Theoretical Volume (2nd part of Allocation Step 5) Multiply By Group Meter Adjustment Volume (Allocation Step 6) Add: Well Theoretical Volume (1st part of Allocation Step 5). Equals: Allocation Of Group Meter Production Back To A Given Well
Revision to Development and Production Plan – Platform Hogan Carpinteria Offshore Field
5-12
Or in equation form, allocated “stock tank” volume back to and individual well equals:
VolumeAdjustmentTotalFieldlVolumeTheoreticaTotalField
eticalVolumWellTheoreeticalVolumWellTheore
Gas:
Take: Well Theoretical Volume (1st part of Allocation Step 5). Divide By Group Meter Theoretical Volume (2nd part of Allocation Step 5) Multiply By Group Meter Adjustment Volume (Allocation Step 6) Add: Well Theoretical Volume (1st part of Allocation Step 5). Equals: Allocation Of Gas Sales Back To A Given Well Or in equation form, allocated gas sales volume back to and individual well equals:
VolumeAdjustmentTotalFieldlVolumeTheoreticaTotalField
eticalVolumWellTheoreeticalVolumWellTheore
Why: Total field oil “stock tank” volume and gas sales volume must be allocated back to
individual wells for both official production records and to determine Federal and State royalties. The allocation logic honors the concept that allocation to individual wells must be on the prorated basis that each well has contributed to total monthly “stock tank” production.
5.6.12 Allocation Step 7: Sum Well Allocated Volumes To Obtain Federal And State Volume
When: After allocation month closes. Frequency: Monthly. Who/Where: PACOPS office personnel. What - Oil: Sum allocated volumes of oil for every Federal lease well to determine total Federal oil
“stock tank” production volume. Sum allocated volumes for every State lease well to determine total State oil “stock tank” production volume.
What - Gas: Sum allocated volumes for every Federal lease well to determine total Federal gas sales
volume. Sum allocated volumes for every State lease well to determine total State gas sales volume.
Why: Determine total oil “stock tank” production volume and gas sales volume attributable to
Federal and State wells.
Revision to Development and Production Plan – Platform Hogan Carpinteria Offshore Field
5-13
5.7 Meter Proving Accounting Allocation of State and Federal Production PACOPS anticipates regularly scheduled meter provings for the new wet oil meters and calibrations of the wet gas meters located at Platforms Hogan and Houchin. The existing LACT unit for dry oil sales is proven on a monthly basis at La Conchita plant. The existing gas sales meter is also calibrated on a monthly basis.
February 2011 Carone DPP Revisions
REVISED FEBRUARY 2011
SECTION 6.0
PIPELINE SYSTEM AND ONSHORE FACILITIES
Revision to Development and Production Plan – Platform Hogan Carpinteria Offshore Field
6-1
Section 6
Pipeline System and Onshore Facilities
6.1 Introduction
No new pipelines or onshore facilities will need to be built to develop the field. The existing pipelines from Platform Hogan to the La Conchita onshore processing facility will be used to move the production of the Carpinteria Field. The La Conchita Facility is capable of handing oil and gas produced from the Carpinteria Field, and therefore no new facilities will be needed. The following discussion of the pipelines and onshore processing facilities were provided in the Updated Application to Develop State Leases in the Carpinteria Field Area from March 2009.
6.2 Pipelines
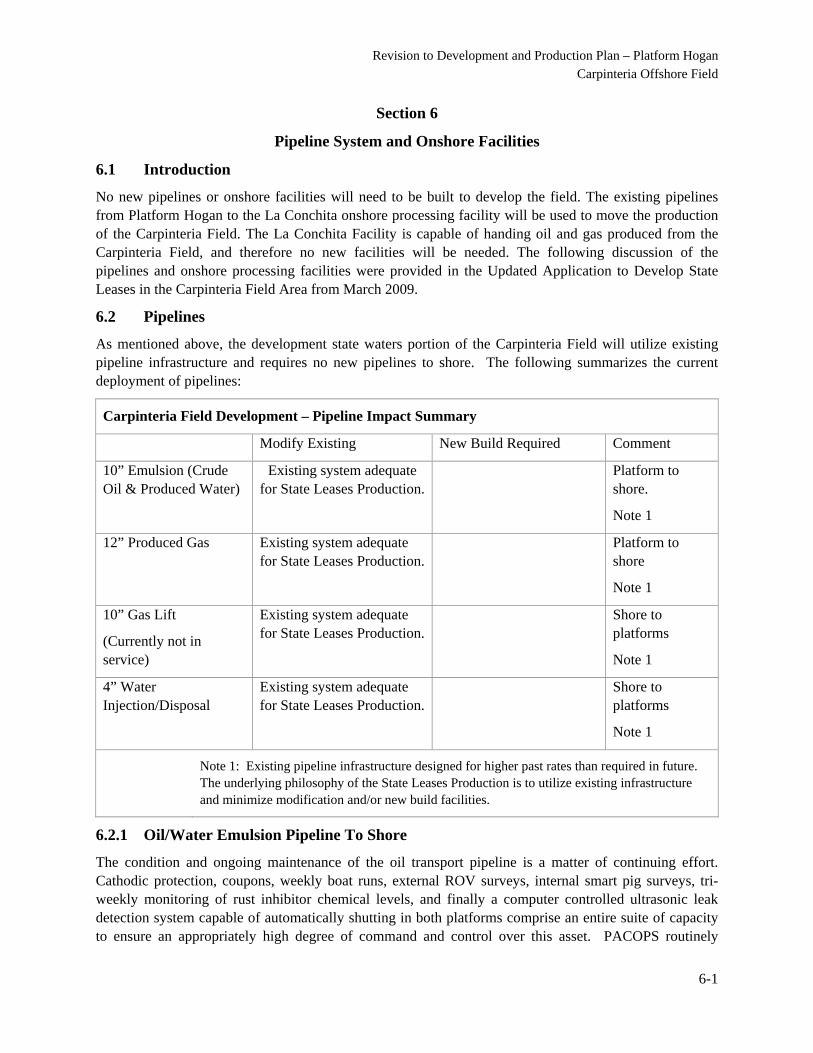
As mentioned above, the development state waters portion of the Carpinteria Field will utilize existing pipeline infrastructure and requires no new pipelines to shore. The following summarizes the current deployment of pipelines:
Carpinteria Field Development – Pipeline Impact Summary
Modify Existing New Build Required Comment
10” Emulsion (Crude Oil & Produced Water)
Existing system adequate for State Leases Production.
Platform to shore.
Note 1
12” Produced Gas Existing system adequate for State Leases Production.
Platform to shore
Note 1
10” Gas Lift
(Currently not in service)
Existing system adequate for State Leases Production.
Shore to platforms
Note 1
4” Water Injection/Disposal
Existing system adequate for State Leases Production.
Shore to platforms
Note 1
Note 1: Existing pipeline infrastructure designed for higher past rates than required in future. The underlying philosophy of the State Leases Production is to utilize existing infrastructure and minimize modification and/or new build facilities.
6.2.1 Oil/Water Emulsion Pipeline To Shore
The condition and ongoing maintenance of the oil transport pipeline is a matter of continuing effort. Cathodic protection, coupons, weekly boat runs, external ROV surveys, internal smart pig surveys, tri-weekly monitoring of rust inhibitor chemical levels, and finally a computer controlled ultrasonic leak detection system capable of automatically shutting in both platforms comprise an entire suite of capacity to ensure an appropriately high degree of command and control over this asset. PACOPS routinely
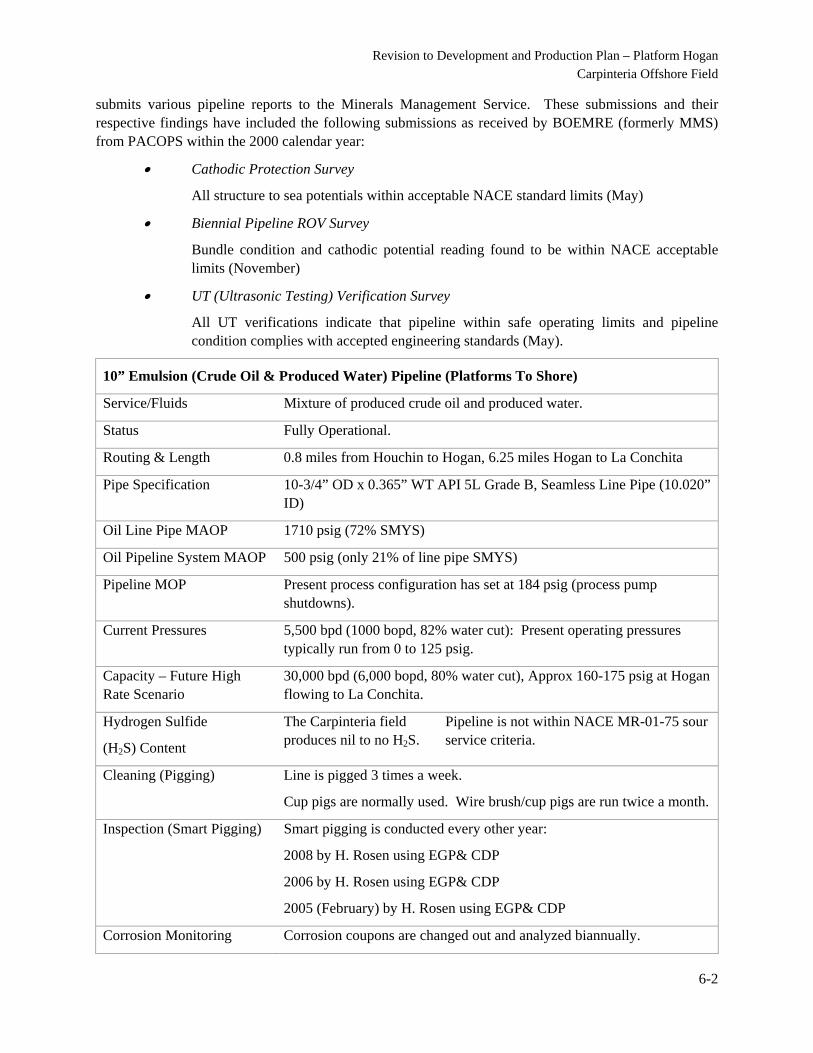
Revision to Development and Production Plan – Platform Hogan Carpinteria Offshore Field
6-2
submits various pipeline reports to the Minerals Management Service. These submissions and their respective findings have included the following submissions as received by BOEMRE (formerly MMS) from PACOPS within the 2000 calendar year:
Cathodic Protection Survey
All structure to sea potentials within acceptable NACE standard limits (May)
Biennial Pipeline ROV Survey
Bundle condition and cathodic potential reading found to be within NACE acceptable limits (November)
UT (Ultrasonic Testing) Verification Survey
All UT verifications indicate that pipeline within safe operating limits and pipeline condition complies with accepted engineering standards (May).
10” Emulsion (Crude Oil & Produced Water) Pipeline (Platforms To Shore)
Service/Fluids Mixture of produced crude oil and produced water.
Status Fully Operational.
Routing & Length 0.8 miles from Houchin to Hogan, 6.25 miles Hogan to La Conchita
Pipe Specification 10-3/4” OD x 0.365” WT API 5L Grade B, Seamless Line Pipe (10.020” ID)
Oil Line Pipe MAOP 1710 psig (72% SMYS)
Oil Pipeline System MAOP 500 psig (only 21% of line pipe SMYS)
Pipeline MOP Present process configuration has set at 184 psig (process pump shutdowns).
Current Pressures 5,500 bpd (1000 bopd, 82% water cut): Present operating pressures typically run from 0 to 125 psig.
Capacity – Future High Rate Scenario
30,000 bpd (6,000 bopd, 80% water cut), Approx 160-175 psig at Hogan flowing to La Conchita.
Hydrogen Sulfide
(H2S) Content
The Carpinteria field produces nil to no H2S.
Pipeline is not within NACE MR-01-75 sour service criteria.
Cleaning (Pigging) Line is pigged 3 times a week.
Cup pigs are normally used. Wire brush/cup pigs are run twice a month.
Inspection (Smart Pigging) Smart pigging is conducted every other year:
2008 by H. Rosen using EGP& CDP
2006 by H. Rosen using EGP& CDP
2005 (February) by H. Rosen using EGP& CDP
Corrosion Monitoring Corrosion coupons are changed out and analyzed biannually.
Revision to Development and Production Plan – Platform Hogan Carpinteria Offshore Field
6-3
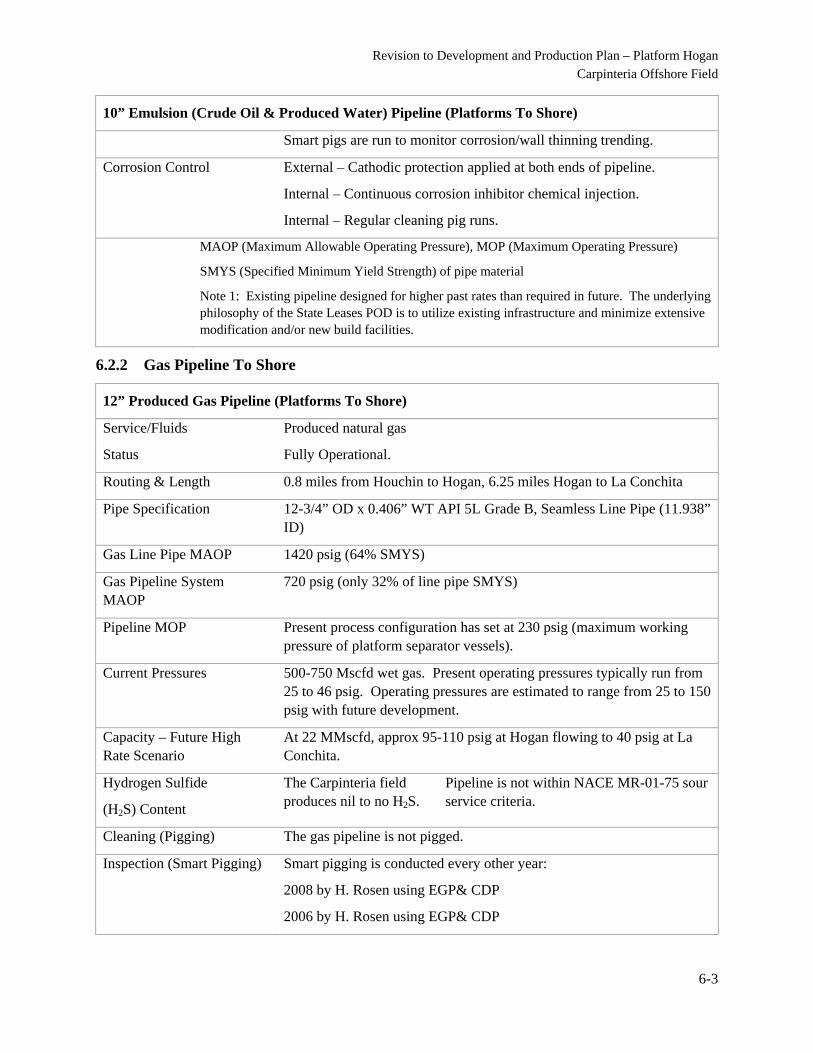
10” Emulsion (Crude Oil & Produced Water) Pipeline (Platforms To Shore)
Smart pigs are run to monitor corrosion/wall thinning trending.
Corrosion Control External – Cathodic protection applied at both ends of pipeline.
Internal – Continuous corrosion inhibitor chemical injection.
Internal – Regular cleaning pig runs.
MAOP (Maximum Allowable Operating Pressure), MOP (Maximum Operating Pressure)
SMYS (Specified Minimum Yield Strength) of pipe material
Note 1: Existing pipeline designed for higher past rates than required in future. The underlying philosophy of the State Leases POD is to utilize existing infrastructure and minimize extensive modification and/or new build facilities.
6.2.2 Gas Pipeline To Shore
12” Produced Gas Pipeline (Platforms To Shore)
Service/Fluids Produced natural gas
Status Fully Operational.
Routing & Length 0.8 miles from Houchin to Hogan, 6.25 miles Hogan to La Conchita
Pipe Specification 12-3/4” OD x 0.406” WT API 5L Grade B, Seamless Line Pipe (11.938” ID)
Gas Line Pipe MAOP 1420 psig (64% SMYS)
Gas Pipeline System MAOP
720 psig (only 32% of line pipe SMYS)
Pipeline MOP Present process configuration has set at 230 psig (maximum working pressure of platform separator vessels).
Current Pressures 500-750 Mscfd wet gas. Present operating pressures typically run from 25 to 46 psig. Operating pressures are estimated to range from 25 to 150 psig with future development.
Capacity – Future High Rate Scenario
At 22 MMscfd, approx 95-110 psig at Hogan flowing to 40 psig at La Conchita.
Hydrogen Sulfide
(H2S) Content
The Carpinteria field produces nil to no H2S.
Pipeline is not within NACE MR-01-75 sour service criteria.
Cleaning (Pigging) The gas pipeline is not pigged.
Inspection (Smart Pigging) Smart pigging is conducted every other year:
2008 by H. Rosen using EGP& CDP
2006 by H. Rosen using EGP& CDP
Revision to Development and Production Plan – Platform Hogan Carpinteria Offshore Field
6-4
12” Produced Gas Pipeline (Platforms To Shore)
2005 (February) by H. Rosen using EGP& CDP
Corrosion Monitoring Corrosion coupons are changed out and analyzed biannually.
Corrosion Control External – Cathodic protection applied at both ends of pipeline.
Internal – Continuous corrosion inhibitor chemical injection.
MAOP (Maximum Allowable Operating Pressure), MOP (Maximum Operating Pressure)
SMYS (Specified Minimum Yield Strength) of pipe material.
Note 1: Existing pipeline designed for higher past rates than required in future. The underlying philosophy of the State Leases POD is to utilize existing infrastructure and minimize extensive modification and/or new build facilities.
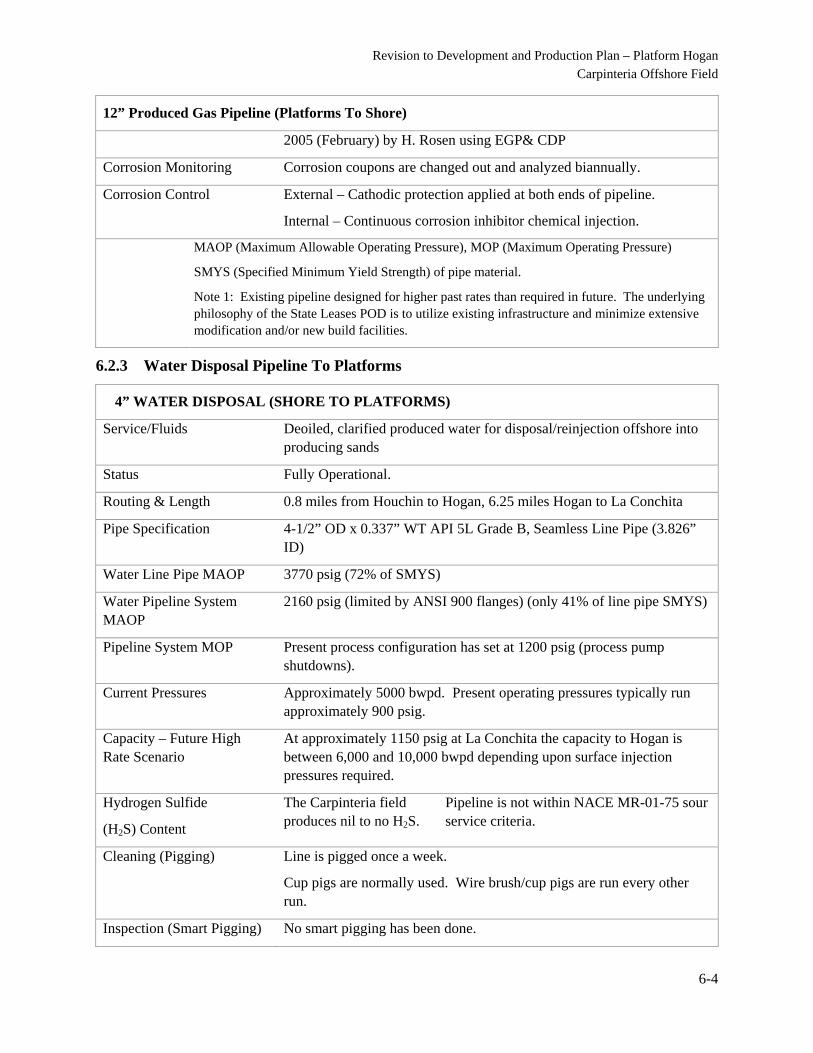
6.2.3 Water Disposal Pipeline To Platforms
4” WATER DISPOSAL (SHORE TO PLATFORMS)
Service/Fluids Deoiled, clarified produced water for disposal/reinjection offshore into producing sands
Status Fully Operational.
Routing & Length 0.8 miles from Houchin to Hogan, 6.25 miles Hogan to La Conchita
Pipe Specification 4-1/2” OD x 0.337” WT API 5L Grade B, Seamless Line Pipe (3.826” ID)
Water Line Pipe MAOP 3770 psig (72% of SMYS)
Water Pipeline System MAOP
2160 psig (limited by ANSI 900 flanges) (only 41% of line pipe SMYS)
Pipeline System MOP Present process configuration has set at 1200 psig (process pump shutdowns).
Current Pressures Approximately 5000 bwpd. Present operating pressures typically run approximately 900 psig.
Capacity – Future High Rate Scenario
At approximately 1150 psig at La Conchita the capacity to Hogan is between 6,000 and 10,000 bwpd depending upon surface injection pressures required.
Hydrogen Sulfide
(H2S) Content
The Carpinteria field produces nil to no H2S.
Pipeline is not within NACE MR-01-75 sour service criteria.
Cleaning (Pigging) Line is pigged once a week.
Cup pigs are normally used. Wire brush/cup pigs are run every other run.
Inspection (Smart Pigging) No smart pigging has been done.
Revision to Development and Production Plan – Platform Hogan Carpinteria Offshore Field
6-5
4” WATER DISPOSAL (SHORE TO PLATFORMS)
Corrosion Monitoring Corrosion coupons are changed out and analyzed biannually.
Corrosion Control External – Cathodic protection applied at both ends of pipeline.
Internal – Continuous corrosion inhibitor chemical injection.
Internal – Regular cleaning pig runs.
MAOP (Maximum Allowable Operating Pressure), MOP (Maximum Operating Pressure)
SMYS (Specified Minimum Yield Strength) of pipe material.
Note 1: Existing pipeline designed for higher past rates than required in future. The underlying philosophy of the State Leases POD is to utilize existing infrastructure and minimize extensive modification and/or new build facilities.
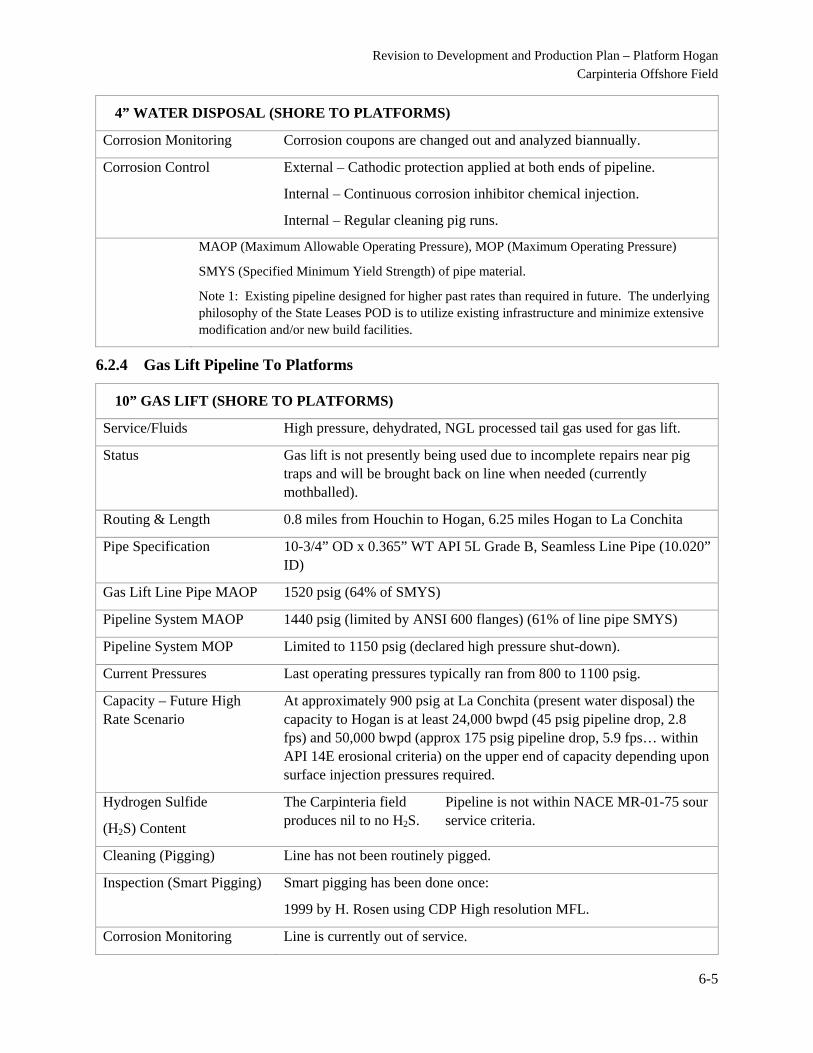
6.2.4 Gas Lift Pipeline To Platforms
10” GAS LIFT (SHORE TO PLATFORMS)
Service/Fluids High pressure, dehydrated, NGL processed tail gas used for gas lift.
Status Gas lift is not presently being used due to incomplete repairs near pig traps and will be brought back on line when needed (currently mothballed).
Routing & Length 0.8 miles from Houchin to Hogan, 6.25 miles Hogan to La Conchita
Pipe Specification 10-3/4” OD x 0.365” WT API 5L Grade B, Seamless Line Pipe (10.020” ID)
Gas Lift Line Pipe MAOP 1520 psig (64% of SMYS)
Pipeline System MAOP 1440 psig (limited by ANSI 600 flanges) (61% of line pipe SMYS)
Pipeline System MOP Limited to 1150 psig (declared high pressure shut-down).
Current Pressures Last operating pressures typically ran from 800 to 1100 psig.
Capacity – Future High Rate Scenario
At approximately 900 psig at La Conchita (present water disposal) the capacity to Hogan is at least 24,000 bwpd (45 psig pipeline drop, 2.8 fps) and 50,000 bwpd (approx 175 psig pipeline drop, 5.9 fps… within API 14E erosional criteria) on the upper end of capacity depending upon surface injection pressures required.
Hydrogen Sulfide
(H2S) Content
The Carpinteria field produces nil to no H2S.
Pipeline is not within NACE MR-01-75 sour service criteria.
Cleaning (Pigging) Line has not been routinely pigged.
Inspection (Smart Pigging) Smart pigging has been done once:
1999 by H. Rosen using CDP High resolution MFL.
Corrosion Monitoring Line is currently out of service.
Revision to Development and Production Plan – Platform Hogan Carpinteria Offshore Field
6-6
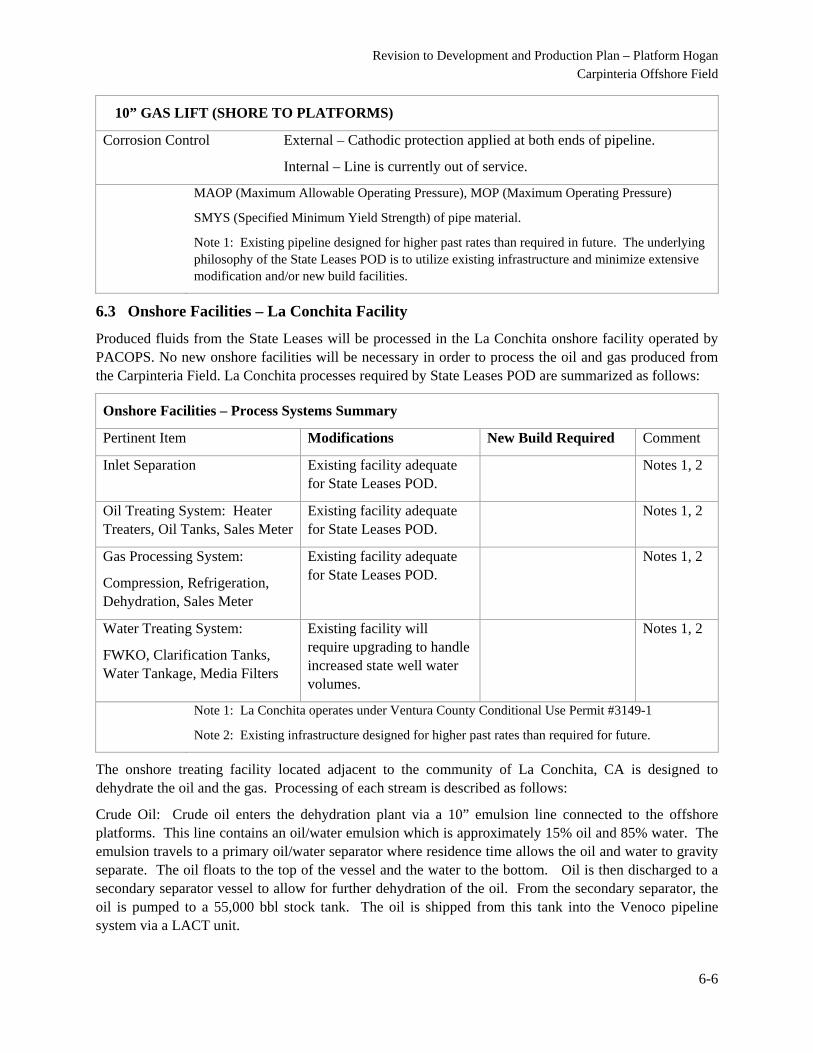
10” GAS LIFT (SHORE TO PLATFORMS)
Corrosion Control External – Cathodic protection applied at both ends of pipeline.
Internal – Line is currently out of service.
MAOP (Maximum Allowable Operating Pressure), MOP (Maximum Operating Pressure)
SMYS (Specified Minimum Yield Strength) of pipe material.
Note 1: Existing pipeline designed for higher past rates than required in future. The underlying philosophy of the State Leases POD is to utilize existing infrastructure and minimize extensive modification and/or new build facilities.
6.3 Onshore Facilities – La Conchita Facility
Produced fluids from the State Leases will be processed in the La Conchita onshore facility operated by PACOPS. No new onshore facilities will be necessary in order to process the oil and gas produced from the Carpinteria Field. La Conchita processes required by State Leases POD are summarized as follows:
Onshore Facilities – Process Systems Summary
Pertinent Item Modifications New Build Required Comment
Inlet Separation Existing facility adequate for State Leases POD.
Notes 1, 2
Oil Treating System: Heater Treaters, Oil Tanks, Sales Meter
Existing facility adequate for State Leases POD.
Notes 1, 2
Gas Processing System:
Compression, Refrigeration, Dehydration, Sales Meter
Existing facility adequate for State Leases POD.
Notes 1, 2
Water Treating System:
FWKO, Clarification Tanks, Water Tankage, Media Filters
Existing facility will require upgrading to handle increased state well water volumes.
Notes 1, 2
Note 1: La Conchita operates under Ventura County Conditional Use Permit #3149-1
Note 2: Existing infrastructure designed for higher past rates than required for future.
The onshore treating facility located adjacent to the community of La Conchita, CA is designed to dehydrate the oil and the gas. Processing of each stream is described as follows:
Crude Oil: Crude oil enters the dehydration plant via a 10” emulsion line connected to the offshore platforms. This line contains an oil/water emulsion which is approximately 15% oil and 85% water. The emulsion travels to a primary oil/water separator where residence time allows the oil and water to gravity separate. The oil floats to the top of the vessel and the water to the bottom. Oil is then discharged to a secondary separator vessel to allow for further dehydration of the oil. From the secondary separator, the oil is pumped to a 55,000 bbl stock tank. The oil is shipped from this tank into the Venoco pipeline system via a LACT unit.
Revision to Development and Production Plan – Platform Hogan Carpinteria Offshore Field
6-7
Natural Gas: Associated gas produced from the offshore platforms are sent to shore via a 12” natural gas pipeline. Once the gas arrives at the La Conchita plant it sent to stage 1 of a 3 stage compressor. After exiting the 1st stage of compression, the gas flows to a hydrocarbon chilling unit to drop out the hydrocarbon liquids. The dry gas then enters the 2nd and 3rd stages of compression. After exiting the 3rd stage of compression, the gas is sent to a gas membrane unit which removes excess C02. The low BTU waste gas (or permeate) from the membrane unit is sent to a flare to be burned. The processed gas is sent to a SoCal Gas sales unit for measurement and sales into the SoCal pipeline system.
Produced Water: Water enters the plant mixed with crude oil via the 10” emulsion line and travels to a primary oil / water separator (as discussed above under crude oil processing). The water leaves the bottom of the separator and travels to a flotation unit, where any remaining oil is removed. The clean water then ships to a series of sand filter units for final polishing and clarification prior to being sent to a storage vessel. From the storage vessel, the water is shipped back offshore for disposal via a 4” water line.
The produced water from the Federal wells are adequately treated and properly disposed of at this time. When water injection commences in 2012, the additional water volume is expected to be handled by the existing equipment. Water injection on the State Leases is envisioned to start on a limited basis and expanded as additional sections of the reservoir are developed. The existing FWKO will have to be modified, 2 retention tanks will need to be returned to service, the flotation tanks will need to be replaced with efficient WEMCO units, 2 additional media filters will need to be added, a smaller SWD vessel might be required to add to the retention time and finally the injection pumps will have to be modified. The above changes might be accomplished over time as water disposal/injection demand dictates. Prior to initiation of a waterflood, all produced water will be discharged into the ocean. Once water injection wells are completed, the produced water will be injected back into strata. An engineering firm will be contracted to properly design the above equipment in order to handle the additional water.
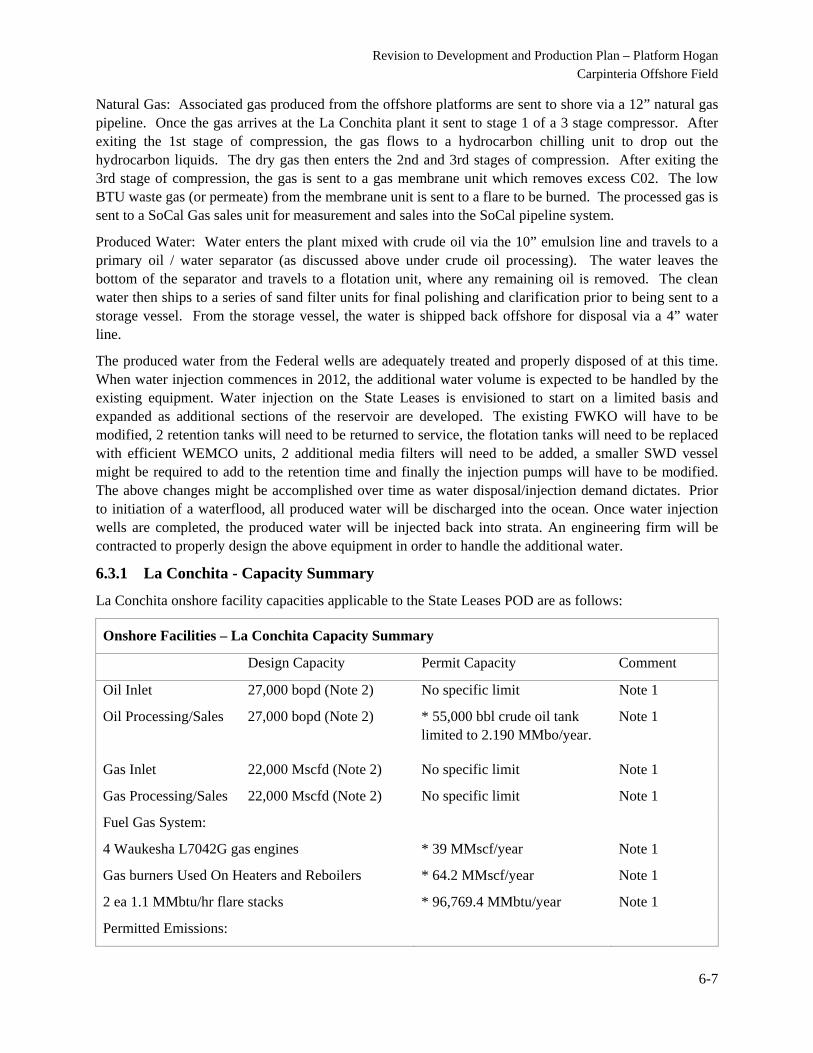
6.3.1 La Conchita - Capacity Summary
La Conchita onshore facility capacities applicable to the State Leases POD are as follows:
Onshore Facilities – La Conchita Capacity Summary
Design Capacity Permit Capacity Comment
Oil Inlet 27,000 bopd (Note 2) No specific limit Note 1
Oil Processing/Sales
27,000 bopd (Note 2)
* 55,000 bbl crude oil tank limited to 2.190 MMbo/year.
Note 1
Gas Inlet 22,000 Mscfd (Note 2) No specific limit Note 1
Gas Processing/Sales 22,000 Mscfd (Note 2) No specific limit Note 1
Fuel Gas System:
4 Waukesha L7042G gas engines
Gas burners Used On Heaters and Reboilers
2 ea 1.1 MMbtu/hr flare stacks
* 39 MMscf/year
* 64.2 MMscf/year
* 96,769.4 MMbtu/year
Note 1
Note 1
Note 1
Permitted Emissions:
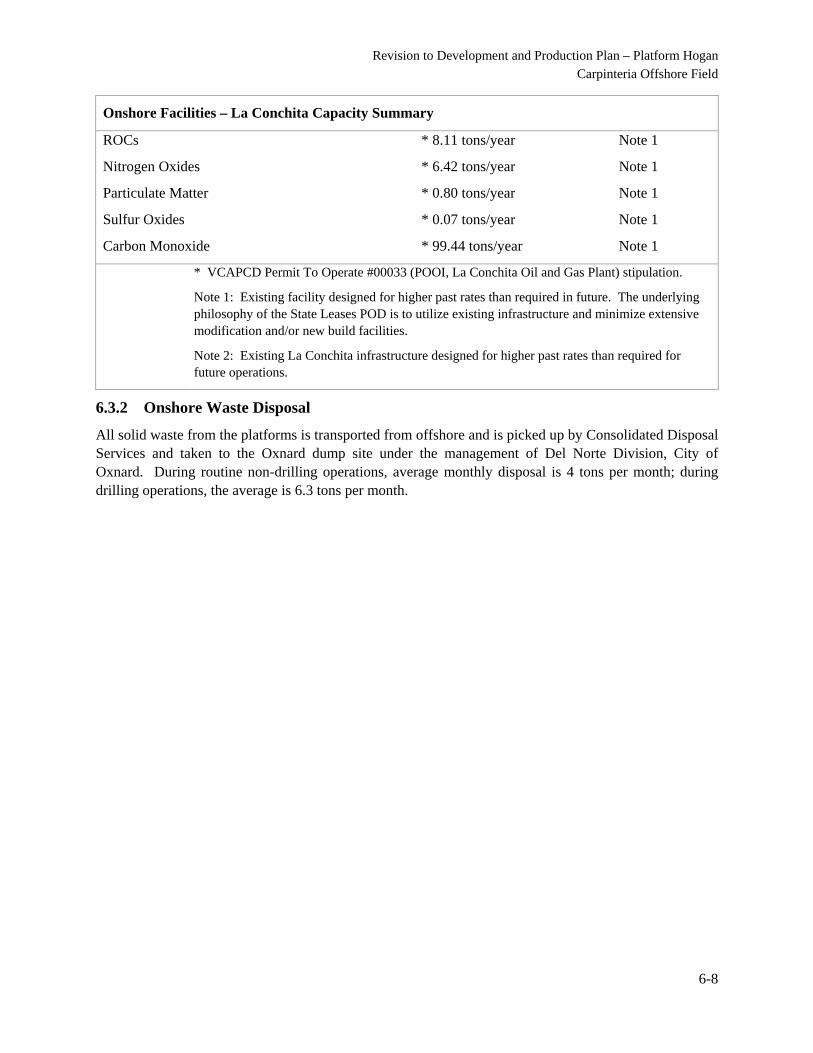
Revision to Development and Production Plan – Platform Hogan Carpinteria Offshore Field
6-8
Onshore Facilities – La Conchita Capacity Summary
ROCs
Nitrogen Oxides
Particulate Matter
Sulfur Oxides
Carbon Monoxide
* 8.11 tons/year
* 6.42 tons/year
* 0.80 tons/year
* 0.07 tons/year
* 99.44 tons/year
Note 1
Note 1
Note 1
Note 1
Note 1
* VCAPCD Permit To Operate #00033 (POOI, La Conchita Oil and Gas Plant) stipulation.
Note 1: Existing facility designed for higher past rates than required in future. The underlying philosophy of the State Leases POD is to utilize existing infrastructure and minimize extensive modification and/or new build facilities.
Note 2: Existing La Conchita infrastructure designed for higher past rates than required for future operations.
6.3.2 Onshore Waste Disposal
All solid waste from the platforms is transported from offshore and is picked up by Consolidated Disposal Services and taken to the Oxnard dump site under the management of Del Norte Division, City of Oxnard. During routine non-drilling operations, average monthly disposal is 4 tons per month; during drilling operations, the average is 6.3 tons per month.
February 2011 Carone DPP Revisions
ATTACHMENT 1.0
GEOLOGY
February 2011 Carone DPP Revisions
1-1
ATTACHMENT 1.0 - GEOLOGY
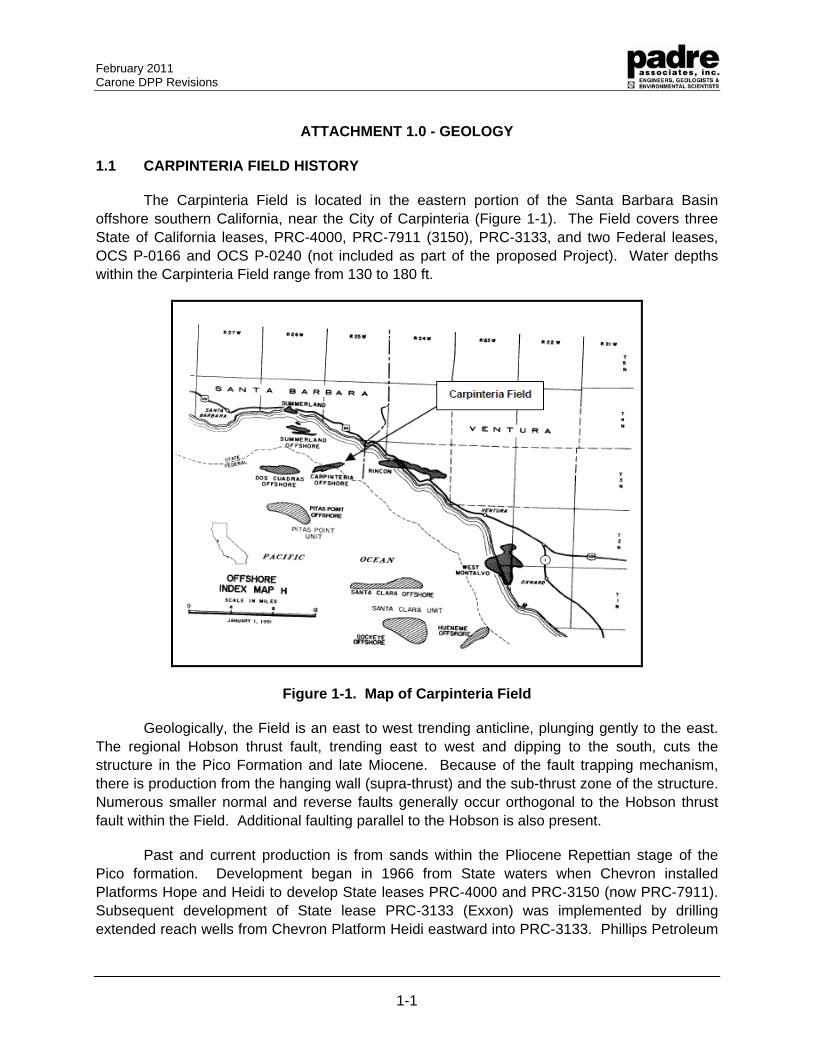
1.1 CARPINTERIA FIELD HISTORY
The Carpinteria Field is located in the eastern portion of the Santa Barbara Basin offshore southern California, near the City of Carpinteria (Figure 1-1). The Field covers three State of California leases, PRC-4000, PRC-7911 (3150), PRC-3133, and two Federal leases, OCS P-0166 and OCS P-0240 (not included as part of the proposed Project). Water depths within the Carpinteria Field range from 130 to 180 ft.
Figure 1-1. Map of Carpinteria Field
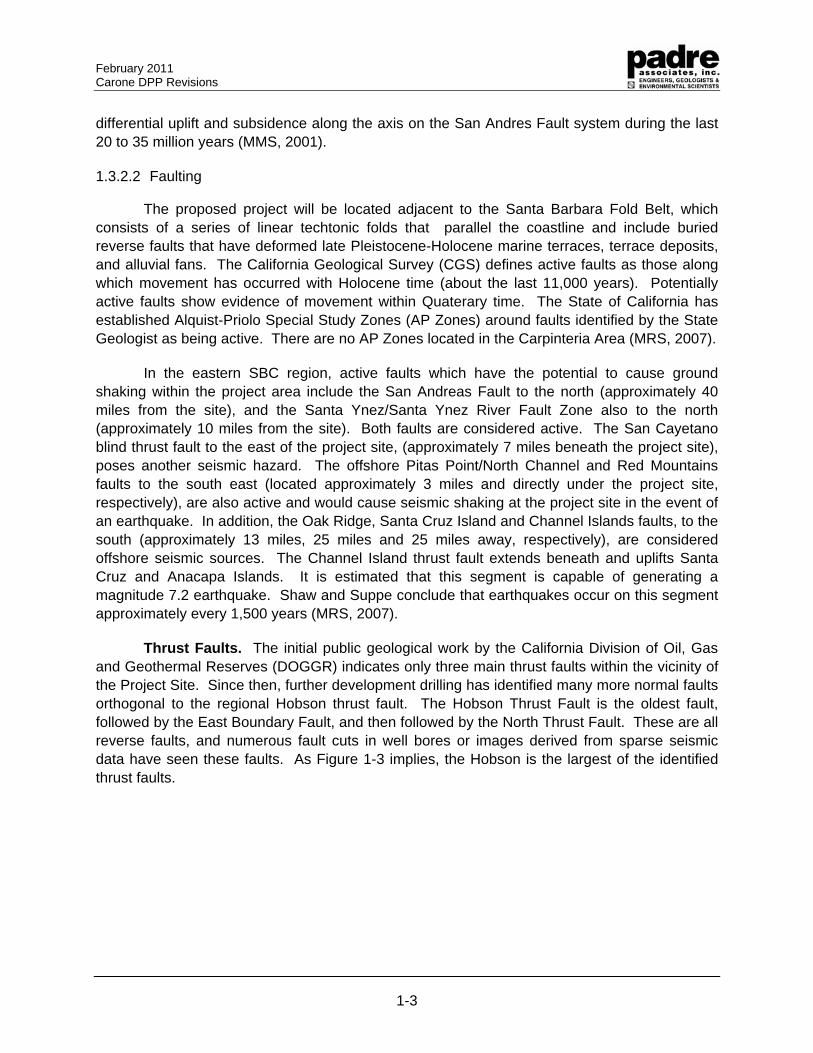
Geologically, the Field is an east to west trending anticline, plunging gently to the east. The regional Hobson thrust fault, trending east to west and dipping to the south, cuts the structure in the Pico Formation and late Miocene. Because of the fault trapping mechanism, there is production from the hanging wall (supra-thrust) and the sub-thrust zone of the structure. Numerous smaller normal and reverse faults generally occur orthogonal to the Hobson thrust fault within the Field. Additional faulting parallel to the Hobson is also present.
Past and current production is from sands within the Pliocene Repettian stage of the Pico formation. Development began in 1966 from State waters when Chevron installed Platforms Hope and Heidi to develop State leases PRC-4000 and PRC-3150 (now PRC-7911). Subsequent development of State lease PRC-3133 (Exxon) was implemented by drilling extended reach wells from Chevron Platform Heidi eastward into PRC-3133. Phillips Petroleum
February 2011 Carone DPP Revisions
1-2
installed platforms Hogan and Houchin in 1968 to develop Federal lease OCS P-0166. Sun Oil installed Platform Henry in 1980 to develop Federal lease OCS P-0240 (western edge of field).
Carpinteria Field production peaked in 1968 at a rate of 38,000 barrels of oil per day (BOPD). Chevron shut-in production from Platforms Hope and Heidi during 1992. Both platforms and associated wells were subsequently abandoned in 1996. Three platforms (Hogan, Houchin, and Henry) located in two Federal OCS leases are currently active. Currently, PACOPS offshore Carpinteria Field production is approximately 1,000 BOPD (barrels of oil per day) from Federal lease OCS P-0166 utilizing Platforms Houchin and Hogan.
1.2 BATHYMETRY
The site is located near the Central Santa Barbara Channel (SBC), which is part of the larger Transverse Ranges geologic/geomorphic province. The area is characterized as a gradual sloping bottom. The only prominent bathymetric features near the project area are the Carpinteria Reef located approximately 3 miles southeast of the Project Site.
1.3 REGIONAL SURFICIAL GEOLOGY
1.3.1 Marine Geology
The Santa Barbara Channel is the submerged western extension of the Ventura basin, a topographic and structural depression that contains more than 15,000 m (50,000 ft) of Cretaceous and Tertiary sedimentary strata (Vedder et al., 1969). The Ventura basin is bordered on the north by the Santa Ynez Mountains and on the south by the western Santa Monica Mountains and the northern Channel Islands; it is part of the Transverse Range province, which is characterized by west trending topographic and structural features.
The eastern Santa Barbara Basin and the Ventura Shelf are underlain by essentially conformable post-Miocene sedimentary strata of the Pliocene Pico Formation, the upper Pliocene to lower Pleistocene Santa Barbara Formation, and the lower to middle Pleistocene San Pedro Formation. Regional geologic studies by the United States Geologic Survey (USGS) indicate that the near-surface stratigraphy in the SBC in the vicinity of the Project Site consists of a fairly thin layer of fine-grained silt/clay interlayered with sand, which is classified as Marine Shelf Deposits (Dibblee, 1986). The Marine Shelf Deposits are typically tens of feet thick and consist of variable amounts of soft to medium stiff clay with interlayered fine- to medium-grained sand. The underlying Pico Formation strata grades from a very stiff to hard clay, to a soft to medium hard claystone rock with depth.
1.3.2 Submarine Geologic Hazards
1.3.2.1 Regional Seismicity
The region is seismically active, as several earthquakes in the past 100 to 150 years have been traced to faults that extend into the Santa Barbara-Ventura Basin. High rates of uplift along the coastline are juxtaposed with continuing subsidence of the basins. The Santa Barbara-Ventura Basin is one of several east-west trending tectonic basins formed by
February 2011 Carone DPP Revisions
1-3
differential uplift and subsidence along the axis on the San Andres Fault system during the last 20 to 35 million years (MMS, 2001).
1.3.2.2 Faulting
The proposed project will be located adjacent to the Santa Barbara Fold Belt, which consists of a series of linear techtonic folds that parallel the coastline and include buried reverse faults that have deformed late Pleistocene-Holocene marine terraces, terrace deposits, and alluvial fans. The California Geological Survey (CGS) defines active faults as those along which movement has occurred with Holocene time (about the last 11,000 years). Potentially active faults show evidence of movement within Quaterary time. The State of California has established Alquist-Priolo Special Study Zones (AP Zones) around faults identified by the State Geologist as being active. There are no AP Zones located in the Carpinteria Area (MRS, 2007).
In the eastern SBC region, active faults which have the potential to cause ground shaking within the project area include the San Andreas Fault to the north (approximately 40 miles from the site), and the Santa Ynez/Santa Ynez River Fault Zone also to the north (approximately 10 miles from the site). Both faults are considered active. The San Cayetano blind thrust fault to the east of the project site, (approximately 7 miles beneath the project site), poses another seismic hazard. The offshore Pitas Point/North Channel and Red Mountains faults to the south east (located approximately 3 miles and directly under the project site, respectively), are also active and would cause seismic shaking at the project site in the event of an earthquake. In addition, the Oak Ridge, Santa Cruz Island and Channel Islands faults, to the south (approximately 13 miles, 25 miles and 25 miles away, respectively), are considered offshore seismic sources. The Channel Island thrust fault extends beneath and uplifts Santa Cruz and Anacapa Islands. It is estimated that this segment is capable of generating a magnitude 7.2 earthquake. Shaw and Suppe conclude that earthquakes occur on this segment approximately every 1,500 years (MRS, 2007).
Thrust Faults. The initial public geological work by the California Division of Oil, Gas and Geothermal Reserves (DOGGR) indicates only three main thrust faults within the vicinity of the Project Site. Since then, further development drilling has identified many more normal faults orthogonal to the regional Hobson thrust fault. The Hobson Thrust Fault is the oldest fault, followed by the East Boundary Fault, and then followed by the North Thrust Fault. These are all reverse faults, and numerous fault cuts in well bores or images derived from sparse seismic data have seen these faults. As Figure 1-3 implies, the Hobson is the largest of the identified thrust faults.
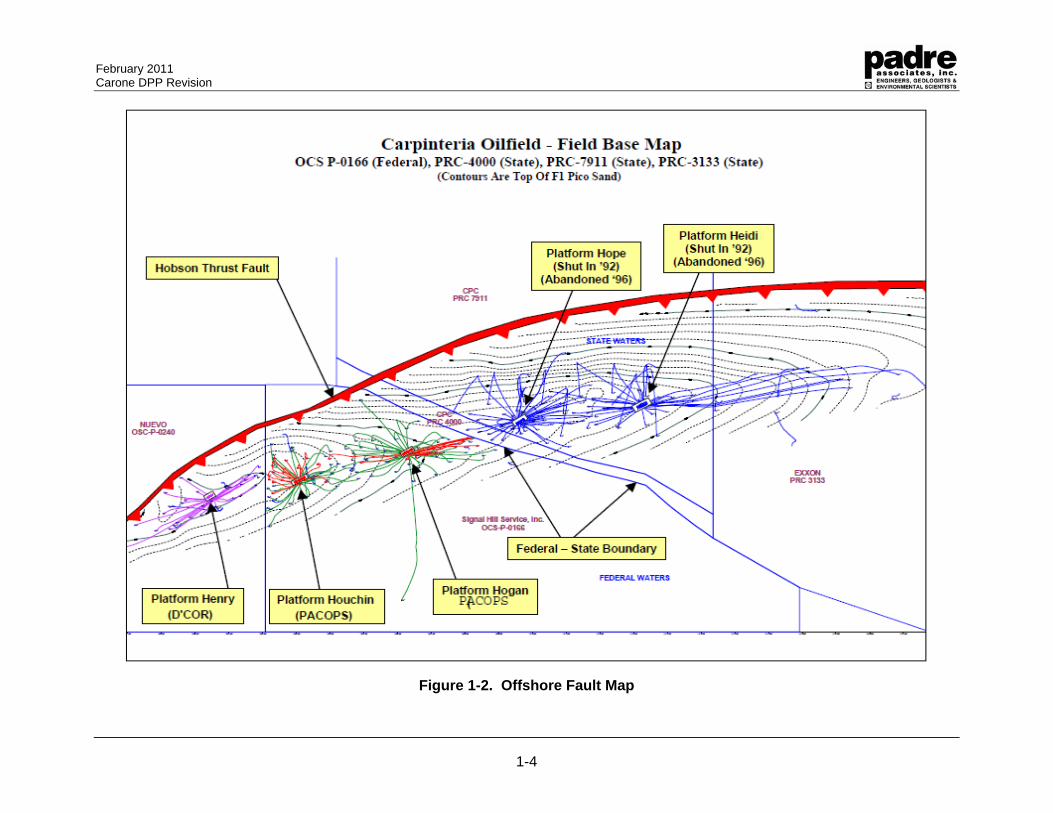
February 2011 Carone DPP Revision
1-4
Figure 1-2. Offshore Fault Map
February 2011 Carone DPP Revision
1-5
Figure 1-3. Thrust Fault Map
February 2011 Carone DPP Revisions
1-6
1.2.2.3 Tsunamis
A tsunami is a wave or series of waves generated in a body of water (usually the ocean) by a large scale or magnitude disturbance that vertically displaces the water column. Tsunamis can be generated by earthquake, submarine or terrestrial landslide, volcanic eruptions, or impacts from meteorites. Regardless of their origin, tsunamis evolve through three overlapping but quite distinct physical processes: 1) generation by a force that disturbs the water column; 2) propagation from deeper water near the source to shallow coastal areas; and 3) inundation of dry land. As the tsunami crosses the deep ocean, its length from crest to crest may be a hundred miles or more, and its height from crest to trough will only be a couple feet or less. They cannot be felt aboard ships nor can they be seen from the air in the open ocean. In the deep ocean the waves travel at high rates of speed up to a velocity of a few hundred miles per hour. When the tsunami enters the shallower waters of the coastlines in its path, the velocity of its waves diminishes and the wave height increases. It is in these shallow waters that a large tsunami can crest to heights up to 100 ft and strike coastal land with devastating force.
In general it takes an earthquake of 6.5 (Richter scale) or larger to generate a tsunami (University of Tennessee, 2005) (Norson et al., 1988). In fact, the tsunami Pacific warning center located in Hawaii activates the tsunami warning systems around the Pacific when an earthquake of 6.5 or greater occurs. Not all earthquakes 6.5 or greater generate tsunamis and not all tsunamis are destructive or even reach inhabited land (Folger, 2005). Tsunamis generated by local causes/forces are generally more destructive than tsunamis originating from far away.
The only large tsunami that has taken place in the Santa Barbara coastal region in recorded history occurred in late December of 1812. Reports of damage due to the 1812 tsunami range from minimal to extensive and are undoubtedly confounded by and mixed together with damage that was caused by the strong earthquake that generated the tsunami (Pararas-Carayannis, 1969). In addition, recent studies have found no tsunami deposits in low-lying areas of the Santa Barbara coastal region so there is no tangible evidence of historical coastal inundation by tsunamis (Fisher et al., 2005).
The relative threat of a local tsunami in the Santa Barbara coastal region is considered by scientists as being relatively low because of a low estimated recurrence frequency of one large locally generated tsunami once every 100 years. In addition, the annual probability of an earthquake of magnitude 6.5 (minimum magnitude for generation of a tsunami) in the area of the shell mounds is 0.5%. Therefore, the probability of an earthquake-generated tsunami would be equally as low (remote probability).
A recent study identified the presence of historical submarine landslides in the Santa Barbara coastal region and those landslides may have the potential to generate local tsunamis (USGS, 2005). However, as noted above, the lack of tangible evidence of historical coastal inundation by tsunamis indicates that the threat of a tsunami caused by a landslide is relatively low.
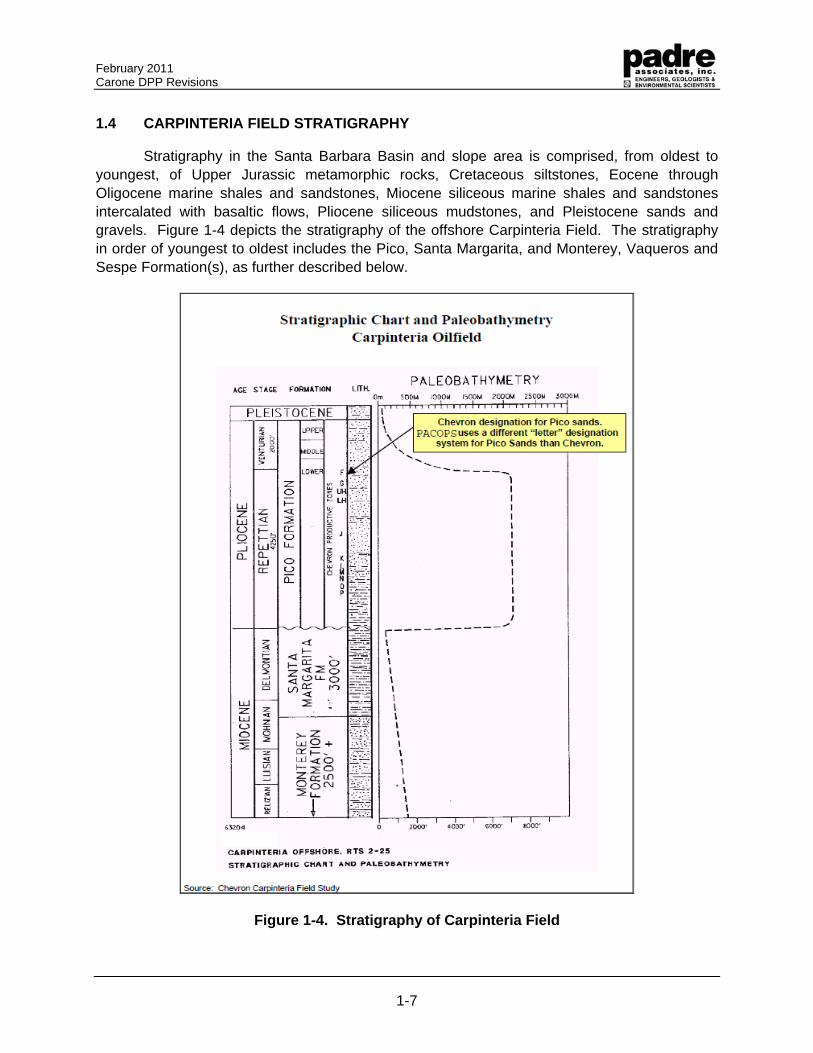
February 2011 Carone DPP Revisions
1-7
1.4 CARPINTERIA FIELD STRATIGRAPHY
Stratigraphy in the Santa Barbara Basin and slope area is comprised, from oldest to youngest, of Upper Jurassic metamorphic rocks, Cretaceous siltstones, Eocene through Oligocene marine shales and sandstones, Miocene siliceous marine shales and sandstones intercalated with basaltic flows, Pliocene siliceous mudstones, and Pleistocene sands and gravels. Figure 1-4 depicts the stratigraphy of the offshore Carpinteria Field. The stratigraphy in order of youngest to oldest includes the Pico, Santa Margarita, and Monterey, Vaqueros and Sespe Formation(s), as further described below.
Figure 1-4. Stratigraphy of Carpinteria Field
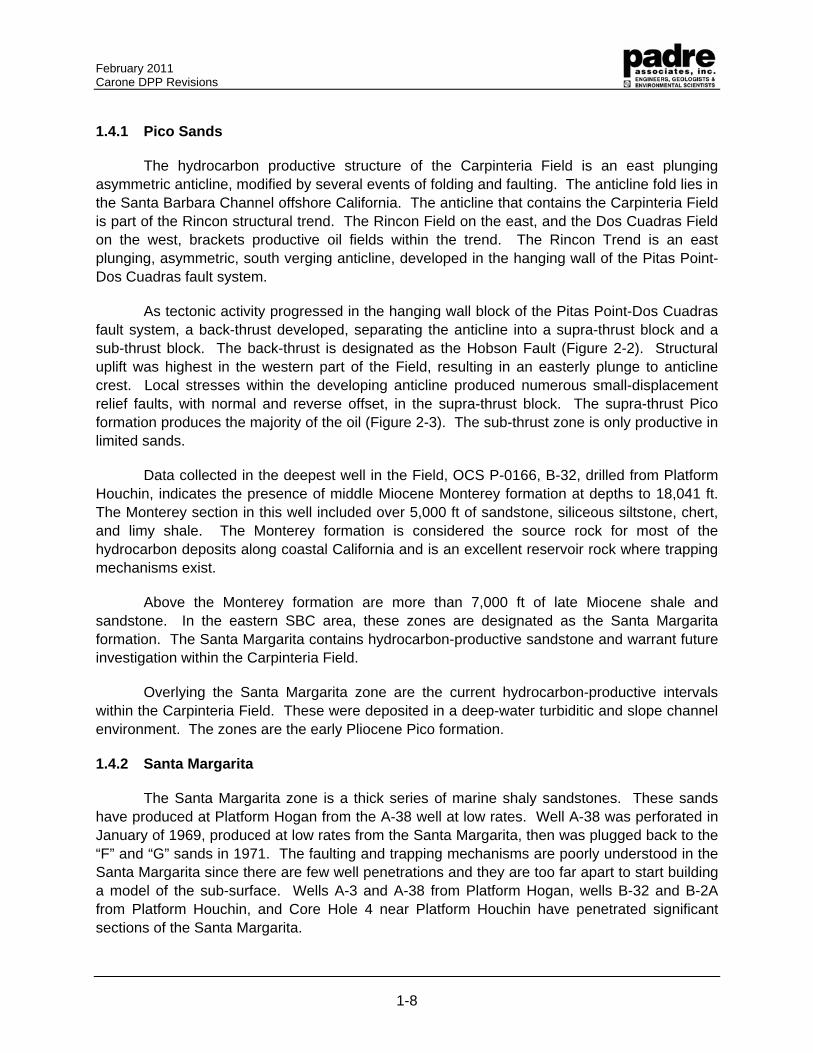
February 2011 Carone DPP Revisions
1-8
1.4.1 Pico Sands
The hydrocarbon productive structure of the Carpinteria Field is an east plunging asymmetric anticline, modified by several events of folding and faulting. The anticline fold lies in the Santa Barbara Channel offshore California. The anticline that contains the Carpinteria Field is part of the Rincon structural trend. The Rincon Field on the east, and the Dos Cuadras Field on the west, brackets productive oil fields within the trend. The Rincon Trend is an east plunging, asymmetric, south verging anticline, developed in the hanging wall of the Pitas Point-Dos Cuadras fault system.
As tectonic activity progressed in the hanging wall block of the Pitas Point-Dos Cuadras fault system, a back-thrust developed, separating the anticline into a supra-thrust block and a sub-thrust block. The back-thrust is designated as the Hobson Fault (Figure 2-2). Structural uplift was highest in the western part of the Field, resulting in an easterly plunge to anticline crest. Local stresses within the developing anticline produced numerous small-displacement relief faults, with normal and reverse offset, in the supra-thrust block. The supra-thrust Pico formation produces the majority of the oil (Figure 2-3). The sub-thrust zone is only productive in limited sands.
Data collected in the deepest well in the Field, OCS P-0166, B-32, drilled from Platform Houchin, indicates the presence of middle Miocene Monterey formation at depths to 18,041 ft. The Monterey section in this well included over 5,000 ft of sandstone, siliceous siltstone, chert, and limy shale. The Monterey formation is considered the source rock for most of the hydrocarbon deposits along coastal California and is an excellent reservoir rock where trapping mechanisms exist.
Above the Monterey formation are more than 7,000 ft of late Miocene shale and sandstone. In the eastern SBC area, these zones are designated as the Santa Margarita formation. The Santa Margarita contains hydrocarbon-productive sandstone and warrant future investigation within the Carpinteria Field.
Overlying the Santa Margarita zone are the current hydrocarbon-productive intervals within the Carpinteria Field. These were deposited in a deep-water turbiditic and slope channel environment. The zones are the early Pliocene Pico formation.
1.4.2 Santa Margarita
The Santa Margarita zone is a thick series of marine shaly sandstones. These sands have produced at Platform Hogan from the A-38 well at low rates. Well A-38 was perforated in January of 1969, produced at low rates from the Santa Margarita, then was plugged back to the “F” and “G” sands in 1971. The faulting and trapping mechanisms are poorly understood in the Santa Margarita since there are few well penetrations and they are too far apart to start building a model of the sub-surface. Wells A-3 and A-38 from Platform Hogan, wells B-32 and B-2A from Platform Houchin, and Core Hole 4 near Platform Houchin have penetrated significant sections of the Santa Margarita.
February 2011 Carone DPP Revisions
1-9
1.4.3 Monterey
The Monterey zone consists of a series of siliceous shales, cherty limestone, and sands. The B-32 well from Platform Houchin tested the lower part of the Monterey zone. Phillips justified this planned Vaqueros-Sespe test on the basis of seismic data. The well had a total depth of 18,041 ft in the lower Monterey and did not reach its primary target of the Vaqueros or Sespe formations.
Dipmeter results show that the B-32 well was not optimally located on the Monterey structure. Nonetheless, oil and gas shows were recorded on the mudlog and the well was drillstem tested in several intervals. These tests recovered only traces of oil but demonstrated the ability of the formation to give up significant flow rates and are encouraging for the prospects of a future, better located, well. Elsewhere on the State leases, Chevron has reported Monterey test rates of 650 BOPD. To date there has been no sustained Monterey zone production.
Productivity in the Monterey is a function of lithology and fracturing. A re-drill from well B-32 (OCS P-0166) is the least expensive way to test the Upper Monterey. Based on a dipmeter log from well B-32, a significant structural advantage might be achieved. Following the success of this test, integration of seismic information and geological information State lease development may be possible. The deep structural elements of the Monterey are the subject of ongoing geophysical and geological studies.
1.4.4 Vaqueros and Sespe
Carpinteria field drilling has not penetrated the Vaqueros or Sespe. The Vaqueros is much deeper than existing Carpinteria Field well penetrations and the Sespe is below the Vaqueros. The Vaqueros may lie at approximately 20,000 ft depth.
As discussed in the sections immediately above, the initial targets in B-32 well were the Vaqueros and Sespe zones. Prior investigators have estimated the reserves in the Vaqueros to be approximately 21 million barrels of oil and 50 billion cubic ft of gas. This estimate was based on a 200 ft thick zone in the Vaqueros and 50 ft thick zone in the Sespe.
The B-32 well never reached the Vaqueros, and the depth of the formation is unknown but is probably greater than 20,000 ft subsurface. The Vaqueros formation has produced in the adjacent offshore portion of the Summerland Oil Field, northwest of the Carpinteria field. Discovered in 1957, Summerland offshore production was developed later with the installation of Platforms Hazel and Hilda. The peak oil production rate was 3,792,551 barrels in 1964 (10,383 BOPD) with a solution GOR of 665 SCF/STB. The offshore portion of the Summerland Field also contains two small gas accumulations in the Sespe.
February 2011 Carone DPP Revisions
1-10
Significant volumes of oil were produced from the Vaqueros at Summerland, and by correlation productive Vaqueros could underlie Federal Lease OCS P-0166, or State Leases PRC-3133, PRC-4000, or PRC-7911 in the Carpinteria Field. While the Summerland offshore field is the closest field with significant Vaqueros production history and a reasonable analogy for possible Vaqueros zone production at Carpinteria, it should be noted that the Vaqueros is much shallower at the Summerland Field than at Carpinteria.
February 2011 Carone DPP Revisions
ATTACHMENT 2.0
RESERVOIR EVALUATION
February 2011 Carone DPP Revisions
2-1
ATTACHMENT 2.0 - RESERVOIR EVALUATION
2.1 PETROPHYSICAL ANALYSIS - PICO SANDS
The Carpinteria Field produces from the Repettian-Pliocene Pico Sands. As such, discussion of actual petrophysical information is limited to the Pico Formation (Figure 2.1-1). Pico sands are deep water turbidites deposited in a sub-sea fan environment. Walker and Mutti (1973) have described the depositional environment of such sub-sea fans. These sub-sea fans can form massive beds such as the “F1” sand. In addition to massive sands, the fans also can produce thinner sand packages. Both the massive and thin sand beds contain many thin sand laminae.
The lithology is quartz-arkosic sandstone. Core information is sparse in the Pico Formation and four primary core wells were identified in various reports. The core wells are the OCS P-0166 B-7, B-15, B-45, and A-9. When compared to log data, the core data have considerable scatter, consistent with turbidite sands having thin laminae of sand and shale. The calculations were done using a process similar to the LOGCALC program originally written by Scientific Software, Inc. The log analysis calculation process is briefly discussed below.
2.2 ENGINEERING BASIS
2.2.1 Pico Sands - Engineering Basis - Vertical Pilots And Horizontal Wells
The State Lease Plan of Development (POD) for Carpinteria field Pico Sands primarily utilizes horizontal wells so the completed interval of the well is configured to better take advantage of sand depositions that have relatively limited extent vertically, but areally cover a large distance along the crest of the anticline.
True horizontal well technology did not exist during the original development of Carpinteria nor for much of the field life to date. The horizontal wells will be generally placed in the upper portions of sands with attractive hydrocarbon saturations and within a crestal structural position. The idea is to place the wells to take advantage of gravity segregation, aquifer pressure support, and any natural water sweeping that occur which in total tends to drive oil into the upper portion of sands located within crestal structural position.
Vertical pilot wells are first used to seek out and identify specific sands with attractive hydrocarbon saturations. Horizontal wells are then placed within the specific target sands that have attractive hydrocarbon saturations. Recent PACOPS experience utilizing such a “vertical pilot / horizontal well” program during 1998 have resulted in commercial wells in Federal OCS P-1066. The location of the 1998 wells is East of Platform Hogan and just West of State Lease PRC-4000. The 1998 wells have proved commercial given PACOPS’s cost structure.
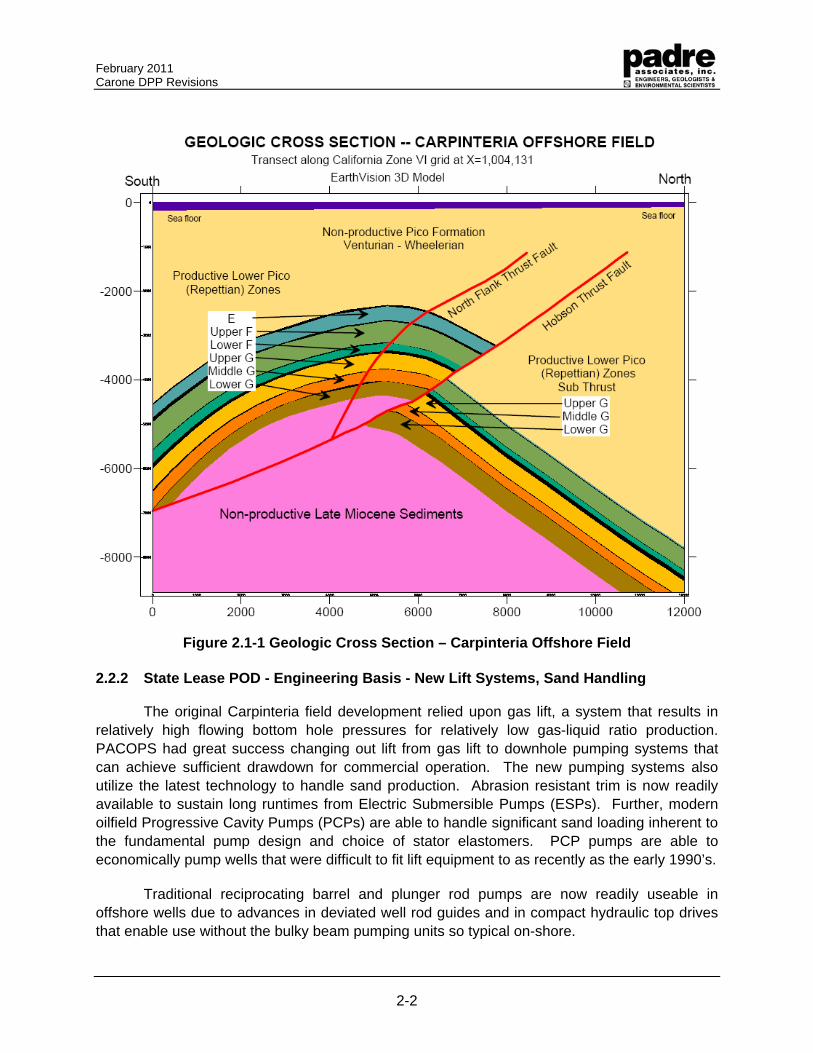
February 2011 Carone DPP Revisions
2-2
Figure 2.1-1 Geologic Cross Section – Carpinteria Offshore Field
2.2.2 State Lease POD - Engineering Basis - New Lift Systems, Sand Handling
The original Carpinteria field development relied upon gas lift, a system that results in relatively high flowing bottom hole pressures for relatively low gas-liquid ratio production. PACOPS had great success changing out lift from gas lift to downhole pumping systems that can achieve sufficient drawdown for commercial operation. The new pumping systems also utilize the latest technology to handle sand production. Abrasion resistant trim is now readily available to sustain long runtimes from Electric Submersible Pumps (ESPs). Further, modern oilfield Progressive Cavity Pumps (PCPs) are able to handle significant sand loading inherent to the fundamental pump design and choice of stator elastomers. PCP pumps are able to economically pump wells that were difficult to fit lift equipment to as recently as the early 1990’s.
Traditional reciprocating barrel and plunger rod pumps are now readily useable in offshore wells due to advances in deviated well rod guides and in compact hydraulic top drives that enable use without the bulky beam pumping units so typical on-shore.
February 2011 Carone DPP Revisions
2-3
PACOPS had great success in utilizing downhole pumping systems to increase production over what gas lift could deliver and also achieve extended lift equipment runtime through utilization of modern technological advances. The advent of modern lift equipment specifically tailored for low gas-liquid production (such as Pico production) enables low cost operation of pumping wells offshore.
2.2.3 State Lease POD - Engineering Basis - Why Redevelop Previously Produced Sands?
The Carpinteria field natural reservoir drive mechanisms are primarily solution gas drive and aquifer influx support. A previous operator (Chevron) concluded that certain sands were subjected to modest to strong aquifer support and edge water influx, resulting in significant sweep efficiency and significant recovery based upon original oil in place estimates. PACOPS’s Carpinteria field experience indicates:
• Consistently uniform and high sweep efficiency from water influx in turbidite sands is questionable since the sands are often not internally homogeneous over a large aerial extent.
• Original oil in place calculations had a high potential for error since tight structural control over the peripheral edges of the field was not possible due to few if any wells penetrating the flank areas. Development was mainly crestal.
• Past policies of determining porosity, and saturation cut-offs were often overly conservative focusing upon identifying main pay zones and not necessarily all areas that contained moveable oil. This is aggravated by the fact that past log resolution did not enable easy identification and evaluation of less prolific sands.
• Formation evaluation logs during the mid to late 1960s muted the resistivity response to thin beds of low resistivity pay. Induction tools actually measure conductance and resistivity is calculated from conductance. The conductance seeking nature of induction tools results in a very muted smoothing over of thin resistivity beds. Modern formation evaluation logs and petrophysical evaluation is able to identify thin beds of high resistivity pay that would have been eliminated from past net to gross determinations, thus under estimating oil in place calculations.
• Infill wells drilled from Platform Hogan during 1998 and 2005 in the area East of Hogan and West of State Lease PRC-4000 found commercial rates of oil in selected F sands that have been producing since 1968.
The objective of redevelopment wells is to find sands that did not sweep efficiently due to being hydraulically disconnected from the strong influx sands, sand discontinuities, reservoir heterogeneities, and/or structural niches enabling trapped attic oil.
PACOPS notes that many of the Chevron wells were producing at attractive rates at the time of the 1992 shut-in. In addition, producing multiple sands within a single well bore could enable sands with strong aquifer drive to overwhelm and effectively snub-out fluid influx from
February 2011 Carone DPP Revisions
2-4
sands not stimulated with strong water drive. This effect is especially aggravated when many of the wells were being lifted by gas lift (relatively high flowing bottom hole pressures) and thereby did not have a lift system capable of achieving sufficiently high draw downs necessary to produce from partially pressure depleted sand intervals not supported by strong aquifer influx. These effects have been demonstrated by our re-development experience on our Federal lease.
2.2.4 State Lease POD - Engineering Basis - Earth Vision 3D Model
PACOPS has developed three dimensional (3D) models of the Carpinteria field anticline using Earth Vision software. The sophisticated modeling approach integrates seismic, geological, petrophysical, and well bore data into an integrated visualization that greatly enhances ability to analyze and make effective decisions. A 3D visualization is especially vital when dealing with fields like Carpinteria that have complex geological sequences of multiple sands, extensive folding, multiple faults of several different types, within a basin that has experienced extreme tectonic forces. 3D modeling is also important for planning more highly deviated or horizontal wells to make sure well paths can be drilled in the real world and effectively placed where they need to be placed.
Currently available seismic has been interpreted and integrated with geological and established petrophysical knowledge to serve as the basis for constructing the models which will be the primary tool for further development of the field. The Earth Vision models will be a “living” constructions in that they will be kept current with the latest developments.
2.3 STATE LEASE POD - RESERVOIR PRESSURE
2.3.1 Reservoir Pressure - Pico Sands & Northern Thrust Fault Plays
Initial, unproduced reservoir pressure of Pico Sands resides within a normal hydrostatic gradient for reservoir pressure. It is expected that untapped initial reservoir pressures for Northern Thrust Fault plays will correspond with a normal hydrostatic gradient for the specific depth of each reservoir.
As described within the Carpinteria Field History section above, the Pico Sands within the defined limits of the present Carpinteria field were previously produced in the State Leases from 1966 to 1992 by Chevron. Prior investigators have indicated the following with regards to Pico Sands within State Leases:
• A number of the Pico sands had varying degrees of aquifer support.
• The F1 sand had evidence of a strong water drive.
• Some of the F3 sands were observed to not have “active” aquifers.
• Generally, average reservoir pressure in the F1-F3 sands were observed to have “declined” slowly due to water drive.
• Initial reservoir pressure in 1966 of the F1-F3 zone was approximately 1,410 psig. By 1985 it had declined to approximately 850 psig in State Lease crestal areas closest to
February 2011 Carone DPP Revisions
2-5
PACOPS Platform Hogan. This reservoir pressure had declined very little during the 1972 to 1985 interval indicating production voidage was in proximity to water influx.
• G Sands were observed to be “aided by a strong flank water drive” and had water cuts in the upper ninety percent range. Reservoir pressure had dropped from an initial 1,900 psig in 1966 to 1,190 psig by 1985. Pico G sands in the State Leases were assessed to have high recovery efficiencies due to a fairly efficient natural water influx sweep.
PACOPS’s experience in the Federal side of the Carpinteria field indicates that the Pico G sands have generally been subjected to a fairly strong aquifer and that water saturations are generally high. However, some of the F sands have not been subjected to strong aquifer action and do still contain sufficient oil to be commercial with PACOPS’s low cost structure.
Chevron State Lease wells were shut-in during 1992. Pressures within the F sands were known to be approximately 850 psig in 1985 and had declined at a low rate for many years. Due to lower structural position than PACOPS’s Federal operation and curtailment of production in 1992 it is estimated that State Lease F sand reservoir pressure is at least 850 psig and likely significantly higher. PACOPS’s experience is that these pressures coupled with 1) targeting areas with advantaged crestal structural position, 2) use of horizontal wells designed for exploiting crestal oil, and 3) use of downhole pumping systems optimized for achieving significant drawdown on low gas-liquid ratio fluids make for commercial production for an operator with existing infrastructure that can be readily leveraged for low cost State Lease operation.
2.3.2 Reservoir Pressure - Santa Margarita, Monterey
As discussed in the Geological Basis section above, there has been very limited drilling or testing of the Santa Margarita and Monterey in the Carpinteria field area. Detailed geophysical, geological, and engineering work associated with Santa Margarita and Monterey plays is in the initial stages of work therefore it is premature to specifically address reservoir pressure. However, in general, the Santa Margarita and Monterey reservoirs are estimated to reside within a normal hydrostatic gradient for reservoir pressure.
2.3.3 Reservoir Pressure - Vaqueros-Sespe
As discussed in the Geological Basis section above, there has been no drilling or testing of the Vaqueros or Sespe in the Carpinteria field area. The Vaqueros and Sespe are known to be deep in the Carpinteria field area. The Vaqueros is estimated to be approximately 20,000 feet deep. Detailed geophysical, geological, and engineering work associated with Vaqueros-Sespe plays is in the initial stages of work therefore it is premature to specifically address reservoir pressure.
February 2011 Carone DPP Revisions
2-6
2.4 STATE LEASE POD - FLUID CONTACTS (OIL-WATER, GAS-OIL, GAS-WATER)
2.4.1 Fluid Contacts - Pico Sands
The original Carpinteria field Pico Sands did not have a gas cap and none developed due to the confluence of a relatively low gas-oil ratio crude and limited pressure depletion due to varying degrees of aquifer support on a sand-by-sand basis and modest overall drawdown rates achieved in wells with multiple commingled sands produced via the limitations of gas lift. The original Carpinteria field development observed that tilting oil-water contacts seemed to be evident. The “tilting” phenomenon was never exactly understood nor completely rationalized. The last State Lease Pico Sand comprehensive snapshot of fluid saturations occurred in the late 1960’s when development originally took place. A lot of fluid has been withdrawn since then and varying degrees of water influx has no doubt significantly changed the original fluid contacts. However, some sands are known to have gone to high water cuts in certain wells.
In general, the State Lease side of the field has not seen sufficient new drilling nor through casing formation evaluation logs to assess the exact configuration of oil-water contacts as they were when last produced. Production stopped on the State Leases in 1992. Some degree of gravity segregation has likely occurred in the more permeable sands with significant structural relief. Further, some degree of migration may have occurred into Federal lease areas that are higher structurally and continue to have fluid voidage via production. However, compartmentalizing faults may preclude significant fluid migration up-structure from State into Federal lease to the degree the faults truly seal.
The PACOPS State Lease POD for the Pico Sands will concentrate on sands that are estimated to have attractive hydrocarbon saturations based upon experience with F sands within the adjoining Federal lease and the observation that aquifer influx sweep has been relatively weak and incomplete in some F sands. Vertical pilot wells will be used to identify sands with attractive saturations. Horizontal wells will be placed within the targeted sands in crestal positions and within the upper portion of a sand to provide standoff from lower areas of sand where water would first accumulate if and when influx approaches well proximity. Consequently, many horizontal wells will likely not see a true oil-water contact when placed in crestal positions within sands that otherwise have not been swept with in-fluxing water.
2.4.2 Fluid Contacts - Northern Thrust Fault Plays
Detailed geophysical, geological, and engineering work for Northern Thrust Fault plays is in progress and is premature for specifics with regards to fluid contacts.
2.4.3 Fluid Contacts - Santa Margarita, Monterey
Detailed geophysical, geological, and engineering work for the Santa Margarita and Monterey is in progress and is premature for specifics with regards to fluid contacts.
February 2011 Carone DPP Revisions
2-7
2.4.4 Fluid Contacts - Vaqueros-Sespe
Detailed geophysical, geological, and engineering work for the Vaqueros and Sespe is in the initial stages of development and is premature for specifics with regards to fluid contacts.
2.5 STATE LEASE POD - WELL PLACEMENT, WELL DESIGNS, DEPTH
The 3D Earth Vision models have been discussed in some detail within the Earth Vision section above. Well placement, well designs, well paths, and ultimate depth will be developed using the Earth Vision 3D model. Earth Vision offers the ultimate ability to integrate real time MWD drilling information with Earth Vision model to make rig floor assessments and fine tuning steering decisions to place the well completed interval in the spot intended.
Detailed geophysical, geological, and engineering work for the State Leases is in progress. It is likely that many of the generalized bottom hole locations will be revised as further geological and engineering work proceeds and actual drilling results are incorporated into the “living” State Lease POD.
Specific comments related to well placement, well designs, and depths for the geologic plays are as follows:
2.5.1 Well Placement, Well Designs, Depth - Pico Sands
Generalized well placement for Pico Sand wells are identified on Attachment 9 of the POD. Pico sand well designs are identified in the generic drilling procedure for Pico Sands (reference drilling section). Vertical Pilot well depths will be drilled to the base of the G sands and completed in specific sands with attractive saturations. Horizontal wells will be drilled into a single or multiple (depending upon completion design) Pico sands.
2.5.2 Well Placement, Well Designs, Depth - Northern Thrust Fault Plays
Detailed geophysical, geological, and engineering work for Northern Thrust Fault plays is in progress and is premature for specifics with regards to well placement, well designs, and depth targets.
2.5.3 Well Placement, Well Designs, Depth - Santa Margarita, Monterey
Detailed geophysical, geological, and engineering work for the Santa Margarita and Monterey is in progress and is premature for specifics with regards to well placement, well designs, and depth targets.
2.5.4 Well Placement, Well Designs, Depth - Vaqueros-Sespe
Detailed geophysical, geological, and engineering work for the Vaqueros-Sespe is in the initial stages of development and is premature for specifics with regards to well placement, well designs, and depth targets.
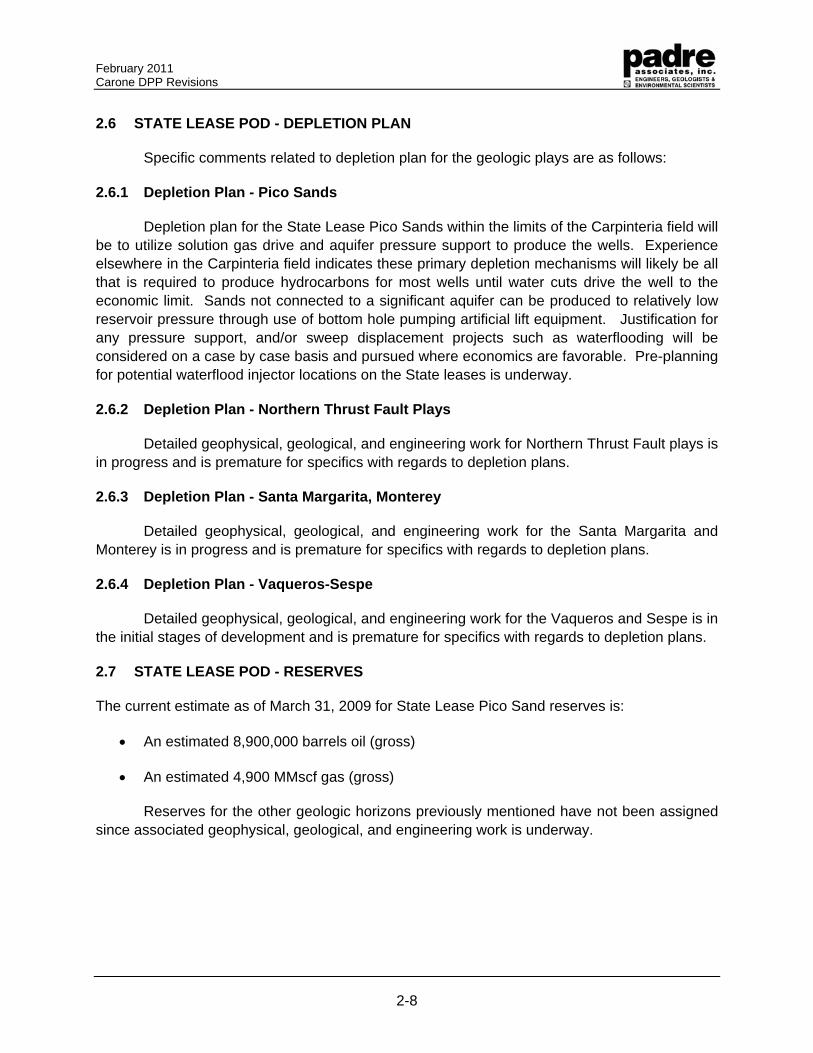
February 2011 Carone DPP Revisions
2-8
2.6 STATE LEASE POD - DEPLETION PLAN
Specific comments related to depletion plan for the geologic plays are as follows:
2.6.1 Depletion Plan - Pico Sands
Depletion plan for the State Lease Pico Sands within the limits of the Carpinteria field will be to utilize solution gas drive and aquifer pressure support to produce the wells. Experience elsewhere in the Carpinteria field indicates these primary depletion mechanisms will likely be all that is required to produce hydrocarbons for most wells until water cuts drive the well to the economic limit. Sands not connected to a significant aquifer can be produced to relatively low reservoir pressure through use of bottom hole pumping artificial lift equipment. Justification for any pressure support, and/or sweep displacement projects such as waterflooding will be considered on a case by case basis and pursued where economics are favorable. Pre-planning for potential waterflood injector locations on the State leases is underway.
2.6.2 Depletion Plan - Northern Thrust Fault Plays
Detailed geophysical, geological, and engineering work for Northern Thrust Fault plays is in progress and is premature for specifics with regards to depletion plans.
2.6.3 Depletion Plan - Santa Margarita, Monterey
Detailed geophysical, geological, and engineering work for the Santa Margarita and Monterey is in progress and is premature for specifics with regards to depletion plans.
2.6.4 Depletion Plan - Vaqueros-Sespe
Detailed geophysical, geological, and engineering work for the Vaqueros and Sespe is in the initial stages of development and is premature for specifics with regards to depletion plans.
2.7 STATE LEASE POD - RESERVES
The current estimate as of March 31, 2009 for State Lease Pico Sand reserves is:
• An estimated 8,900,000 barrels oil (gross)
• An estimated 4,900 MMscf gas (gross)
Reserves for the other geologic horizons previously mentioned have not been assigned since associated geophysical, geological, and engineering work is underway.
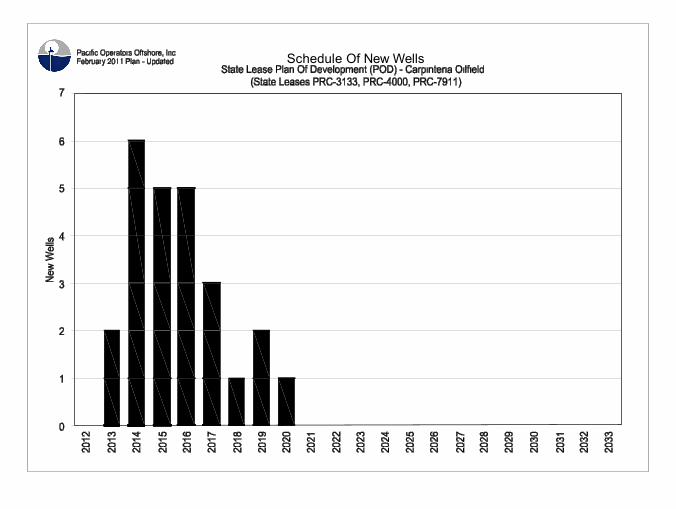
Schedule Of New Wells
Production Profile

February 2011 Carone DPP Revisions
ATTACHMENT 3.0
SOLIDS AND LIQUID WASTES
February 2011 Carone DPP Revisions
3-1
ATTACHMENT 3.0 - SOLID AND LIQUID WASTES
3.1 WASTE STREAMS
Discharges of wastes and pollutants into the marine environment associated with the proposed exploration activities fall into three categories: (1) solid wastes; (2) liquid wastes; and, (3) air emissions. The quantity, composition and method of disposal of each of these categories are discussed below.
3.2 SOLID WASTES
Solid wastes consist of trash, garbage, scrap metal and other general refuse. The additional increment of solid wastes generated by the proposed exploratory activities over and above that generated by ongoing platform operations will be minimal. All such solid waste is currently collected in appropriate containers and hauled to shore for disposal.
3.3 LIQUID WASTES AND PRODUCED WATER
Platform Hogan has been designed to eliminate sources of water pollution during drilling and production operations. All platform discharges are conducted in conformance with General Permit No. CAG 28000 (Authorization to Discharge under the NPDES for Oil and Gas Exploration, Development and Production Facilities).
Both the drilling and production decks are equipped with curbing to prevent direct runoff to the ocean. All water used for deck wash down, cuttings wash, natural rainfall, and well cleanup fluids is collected in a skimming tank where all contaminants are separated from water. Sanitary facilities for the drilling and production crew are installed on Platform Hogan. These facilities discharge into a sewage treatment system, effluent is treated and discharged at 130 ft below MLLW level.
All produced fluids and oil contaminated waste water are transported through pipelines to shore. Treated waste water is discharged from Platform Hogan via a 4" diameter pipeline that extends from the platform into the ocean and discharges treated waste water below the ocean surface. The pipeline currently discharges 4,000 barrels of water per day (bwpd), but has the capacity to discharge between 6,000 and 10,000 bwpd, depending upon surface injection pressures.
3.4 DRILLING FLUIDS (MUDS) AND DRILL CUTTINGS
Drilling mud is used in the well bore to move drill cuttings to the surface, control formation pressure, maintain borehole stability, prevent formation damage, and cool and lubricate the drill bit and drill pipe. In normal drilling operation the mud includes materials such as barite, bentonite, drispac and other additives. The materials used are non-toxic.
February 2011 Carone DPP Revisions
3-2
During drilling operations, zero discharge of drilling mud and drill cuttings will be accomplished by utilizing methods that incorporate slurrification equipment in conjunction with the onboard drilling fluid and drill cuttings processing system.
Drill cuttings will be collected from the shale shakers, and other solids control equipment, and brought to a unit where they are ground to micron size. Drill water from the rig floor and other liquid waste generated in the drilling operation are blended with the drill cuttings into a slurry. This blended slurry will be pumped down a dedicated injection well or a dedicated well annulus into subsurface rock strata.
3.4.1 Summary Table
Table 3-1 summarizes the origin, estimated amount and disposal method of each component of liquid waste discharges that are associated with the proposed exploratory activities through the life of the project.
Table 3-1. Summary of Liquid Wastes and Disposal Methods
Liquid Waste Estimated Amount Disposal Method
Sanitary/domestic wastes
640 gpd Treated to existing NPDES Permit standard and discharged to ocean
Drilling fluids (muds)
2,000 - 3,000 bbl/well
(30 to 100 bbl/disposal event) Will be slurried with drill cuttings and injected back into strata.
Drill Cuttings 3,515 bbls (Well CP-1)
3,592 bbls (Well CP-2) Will be slurried with drill muds and injected back into strata.
Deck drainage 48 to 71 bbl/day (total for
platform) Treated to existing NPDES Permit standard and discharged to ocean.
Produced water 15,000 - 20,000 gal/well Transported to shore, treated to existing NPDES Permit standard, transported back to Platform Hogan and discharged to ocean.
February 2011 Carone DPP Revisions
REVISED FEBRUARY 2011
ATTACHMENT 4.0
ONSHORE FACILITIES
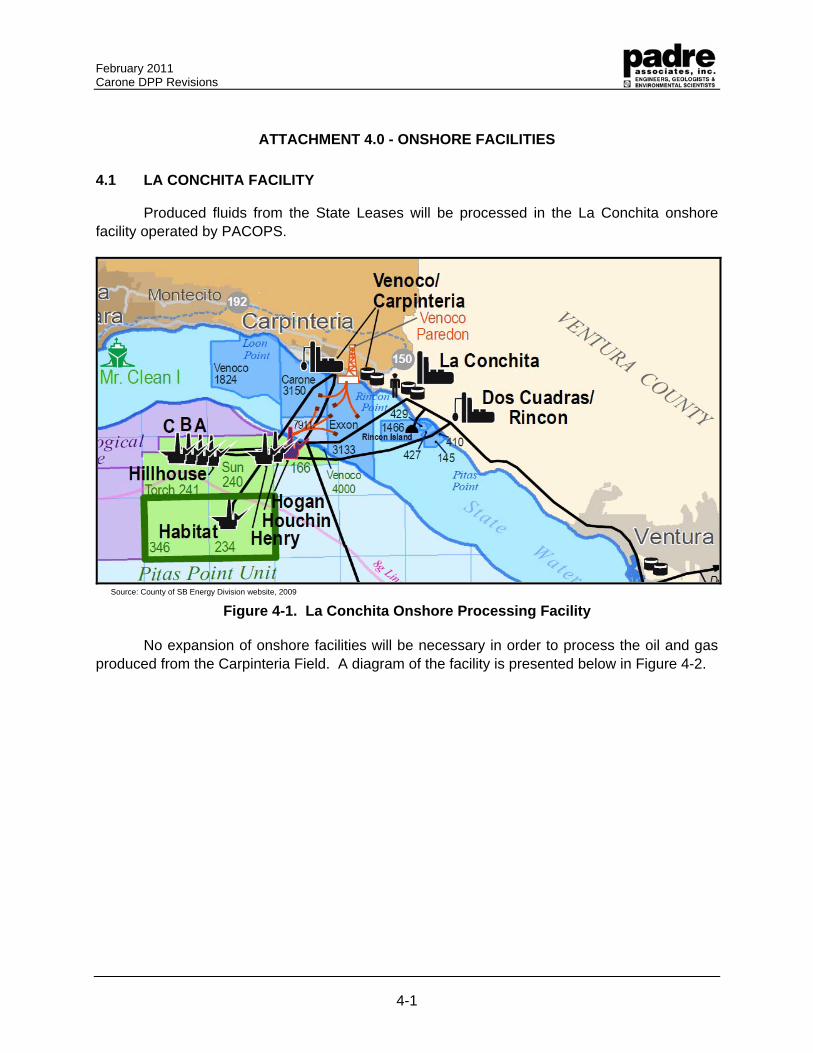
February 2011 Carone DPP Revisions
4-1
ATTACHMENT 4.0 - ONSHORE FACILITIES
4.1 LA CONCHITA FACILITY
Produced fluids from the State Leases will be processed in the La Conchita onshore facility operated by PACOPS.
Figure 4-1. La Conchita Onshore Processing Facility
No expansion of onshore facilities will be necessary in order to process the oil and gas produced from the Carpinteria Field. A diagram of the facility is presented below in Figure 4-2.
Source: County of SB Energy Division website, 2009
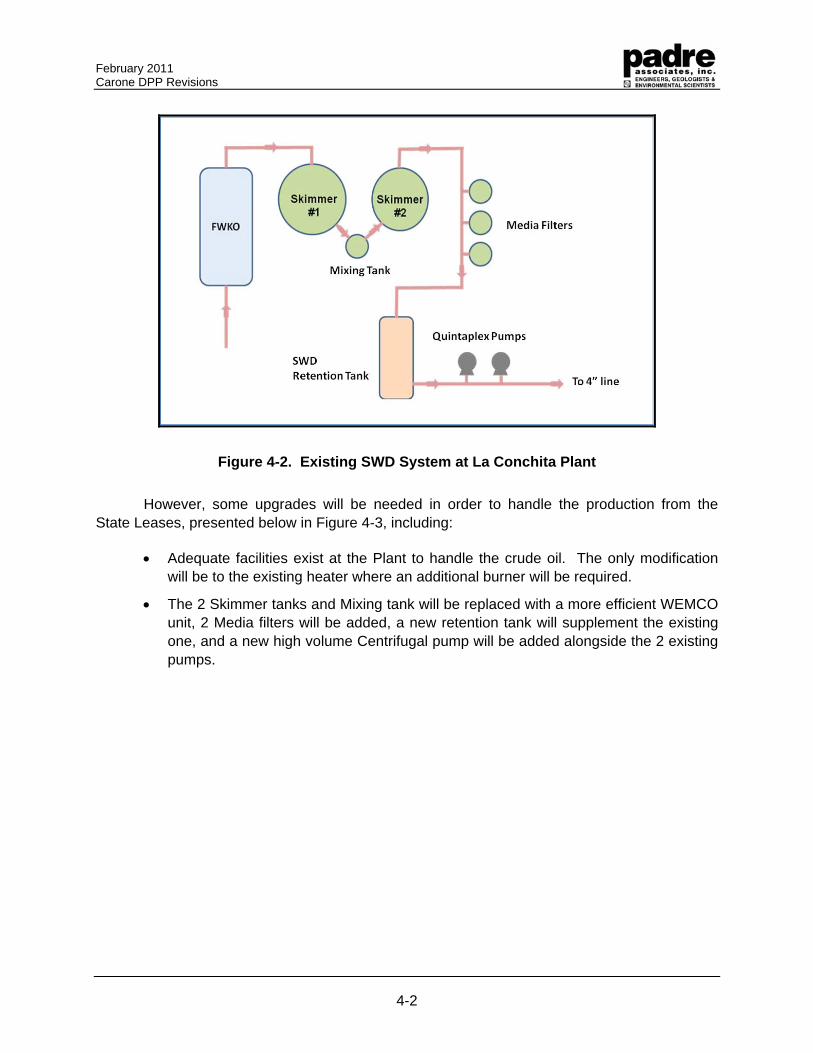
February 2011 Carone DPP Revisions
4-2
Figure 4-2. Existing SWD System at La Conchita Plant
However, some upgrades will be needed in order to handle the production from the State Leases, presented below in Figure 4-3, including:
• Adequate facilities exist at the Plant to handle the crude oil. The only modification will be to the existing heater where an additional burner will be required.
• The 2 Skimmer tanks and Mixing tank will be replaced with a more efficient WEMCO unit, 2 Media filters will be added, a new retention tank will supplement the existing one, and a new high volume Centrifugal pump will be added alongside the 2 existing pumps.
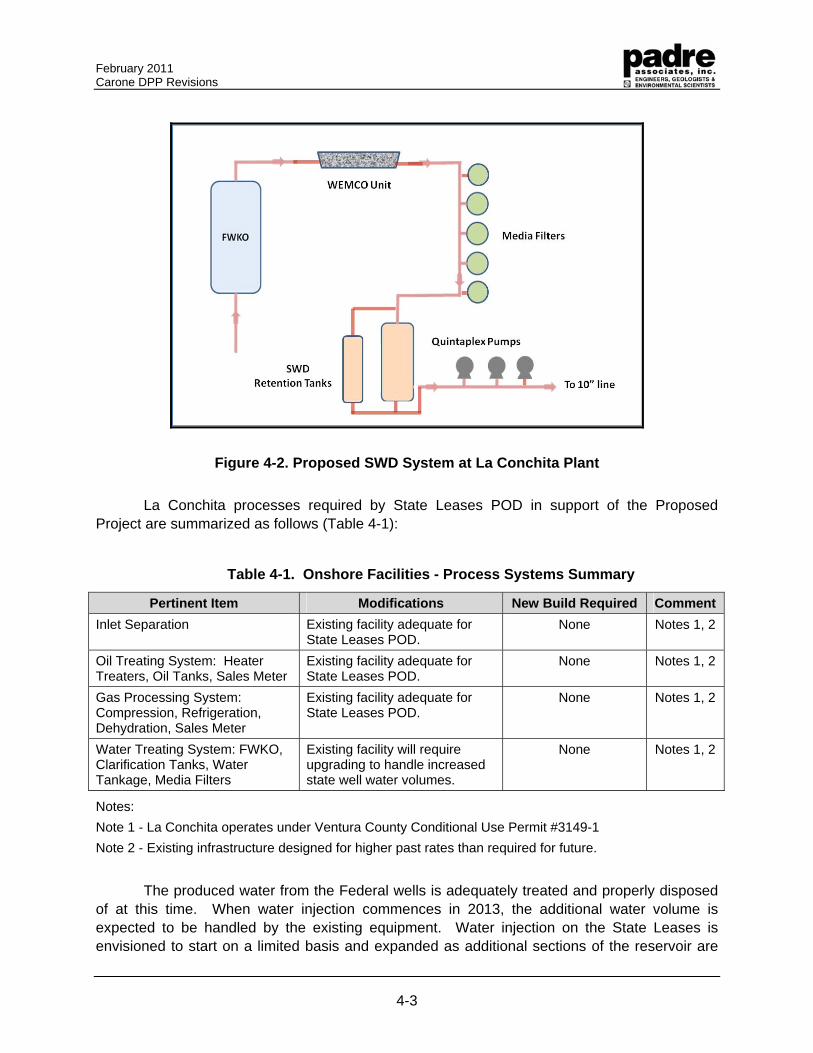
February 2011 Carone DPP Revisions
4-3
Figure 4-2. Proposed SWD System at La Conchita Plant
La Conchita processes required by State Leases POD in support of the Proposed Project are summarized as follows (Table 4-1):
Table 4-1. Onshore Facilities - Process Systems Summary
Pertinent Item Modifications New Build Required Comment
Inlet Separation Existing facility adequate for State Leases POD.
None Notes 1, 2
Oil Treating System: Heater Treaters, Oil Tanks, Sales Meter
Existing facility adequate for State Leases POD.
None Notes 1, 2
Gas Processing System: Compression, Refrigeration, Dehydration, Sales Meter
Existing facility adequate for State Leases POD.
None Notes 1, 2
Water Treating System: FWKO, Clarification Tanks, Water Tankage, Media Filters
Existing facility will require upgrading to handle increased state well water volumes.
None Notes 1, 2
Notes:
Note 1 - La Conchita operates under Ventura County Conditional Use Permit #3149-1
Note 2 - Existing infrastructure designed for higher past rates than required for future.
The produced water from the Federal wells is adequately treated and properly disposed of at this time. When water injection commences in 2013, the additional water volume is expected to be handled by the existing equipment. Water injection on the State Leases is envisioned to start on a limited basis and expanded as additional sections of the reservoir are
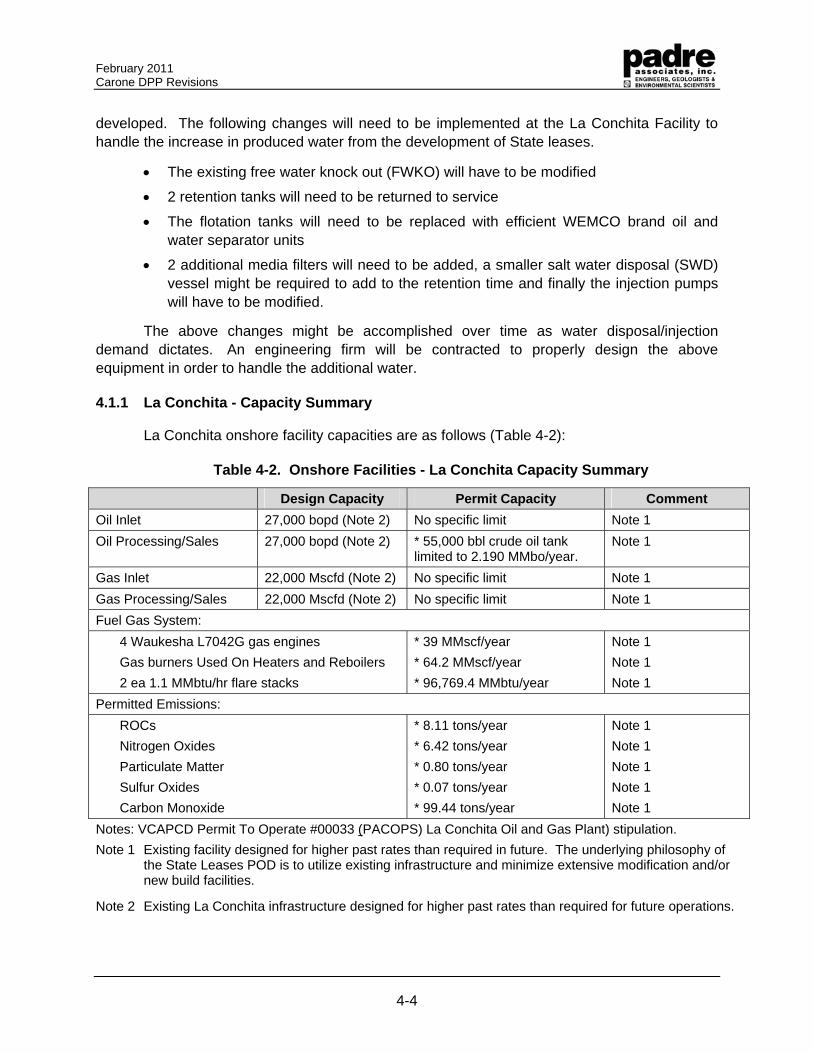
February 2011 Carone DPP Revisions
4-4
developed. The following changes will need to be implemented at the La Conchita Facility to handle the increase in produced water from the development of State leases.
• The existing free water knock out (FWKO) will have to be modified
• 2 retention tanks will need to be returned to service
• The flotation tanks will need to be replaced with efficient WEMCO brand oil and water separator units
• 2 additional media filters will need to be added, a smaller salt water disposal (SWD) vessel might be required to add to the retention time and finally the injection pumps will have to be modified.
The above changes might be accomplished over time as water disposal/injection demand dictates. An engineering firm will be contracted to properly design the above equipment in order to handle the additional water.
4.1.1 La Conchita - Capacity Summary
La Conchita onshore facility capacities are as follows (Table 4-2):
Table 4-2. Onshore Facilities - La Conchita Capacity Summary
Design Capacity Permit Capacity Comment
Oil Inlet 27,000 bopd (Note 2) No specific limit Note 1
Oil Processing/Sales 27,000 bopd (Note 2) * 55,000 bbl crude oil tank limited to 2.190 MMbo/year.
Note 1
Gas Inlet 22,000 Mscfd (Note 2) No specific limit Note 1
Gas Processing/Sales 22,000 Mscfd (Note 2) No specific limit Note 1
Fuel Gas System:
4 Waukesha L7042G gas engines
Gas burners Used On Heaters and Reboilers
2 ea 1.1 MMbtu/hr flare stacks
* 39 MMscf/year
* 64.2 MMscf/year
* 96,769.4 MMbtu/year
Note 1
Note 1
Note 1
Permitted Emissions:
ROCs
Nitrogen Oxides
Particulate Matter
Sulfur Oxides
Carbon Monoxide
* 8.11 tons/year
* 6.42 tons/year
* 0.80 tons/year
* 0.07 tons/year
* 99.44 tons/year
Note 1
Note 1
Note 1
Note 1
Note 1
Notes: VCAPCD Permit To Operate #00033 (PACOPS) La Conchita Oil and Gas Plant) stipulation.
Note 1 Existing facility designed for higher past rates than required in future. The underlying philosophy of the State Leases POD is to utilize existing infrastructure and minimize extensive modification and/or new build facilities.
Note 2 Existing La Conchita infrastructure designed for higher past rates than required for future operations.
February 2011 Carone DPP Revisions
4-5
4.2 SUPPORT PERSONNEL
4.2.1 Operating Crews
The proposed project will not require any additional crew to operate the onshore La Conchita Facility compared to current requirements.
4.3 TRANSPORTATION
Ground transportation refers to the movement of vehicles through a road or highway network. The primary means of transportation for Santa Barbara and Ventura Counties are via U.S. Highway 101. Highway 101 is the most heavily traveled route in the coastal plain and follows the shoreline from Santa Barbara, turning inland at Gaviota. The majority of traffic on Highway 101 is considered to be through traffic and increases almost 50 percent on the weekend, suggesting it is recreation-oriented. State Highway 1 is the primary coastal route between Oxnard and western Los Angeles County. State Highway 126 links the Oxnard-Ventura metropolitan area with Santa Paula and the northern portion of Los Angeles County through the Santa Clara Valley. A Southern Pacific Railroad line runs roughly parallel to the coastline and connects the cities of Santa Barbara, Ventura and Oxnard with San Francisco and Los Angeles.
The only effect on transportation as a result of the Proposed Project will be from a small number of truck deliveries of equipment needed to complete the minor upgrades required to onshore and offshore facilities by the Proposed Project. Since no additional crew will be needed onshore or offshore to complete proposed drilling in State leases, there will be no impact to local transportation from additional crew as a result of this Project.
4.4 SUPPLIES AND SERVICES
No new suppliers or services are currently anticipated to support the proposed project. All supplies and services will be obtained from existing providers.
February 2011 Carone DPP Revisions
REVISED FEBRUARY 2011
ATTACHMENT 5.0
ENVIRONMENTAL EVALUATION
February 2011 Carone DPP Revisions
5-1
ATTACHMENT 5.0 - ENVIRONMENTAL EVALUATION
5.1 INTRODUCTION
The following Environmental Assessment (EA) is being prepared in support of the Revised Development and Production Plan (DPP) submitted to the Minerals Management Service (MMS) (now BOEMRE) on September 28, 2009 and State Leases Plan of Development (POD) submitted to CSLC in October 2009. The EA includes information regarding the Proposed Action (Project) including design features and preventative measures, a site characterization, and the proposed Project’s potential effects on environmental resource areas within the vicinity of the Project site.
5.2 CONTACT INFORMATION
Questions regarding the EA or the supporting information and requests for referenced materials may be directed to the following people according to the subject matter indicated:
Owner: Operator:
Carone Petroleum Company (Carone) Pacific Operators Offshore (PACOPS)
Supporting Information/Environmental Analysis:
DPP/POD
Padre Associates, Inc. Simon A. Poulter (805) 683-1233, ext. 4 [email protected]
PACOPS Steve Coombs (805) 947-7819 [email protected]
5.3 PROPOSED ACTION (PROJECT)
Carone Petroleum Corporation (Carone) and Carone’s dedicated offshore operator, Pacific Operators Offshore, LLC (PACOPS) propose to drill subsurface wells from Platform Hogan, an existing oil and gas production platform located within Pacific Outer Continental Shelf Lease P-0166 within the Santa Barbara Channel offshore Carpinteria, California (Figure 5.1-1). The objective of the Project is to develop oil and gas reserves within the State waters portion of the Carpinteria Field which consists of three contiguous California state leases: PRC-3133, -4000, and -7911 from Platform Hogan located in Federal waters. The proposed drilling will be accomplished with a 1,000 horsepower electric drill and will not require any seafloor activities within state leased areas. All drilling will be conducted through subsurface operations from the existing Platform Hogan, located within Lease P-0166. With the exception of the new wellhead equipment and associated piping, no additional platform-based oil and gas handling and processing equipment is required for the proposed Project.
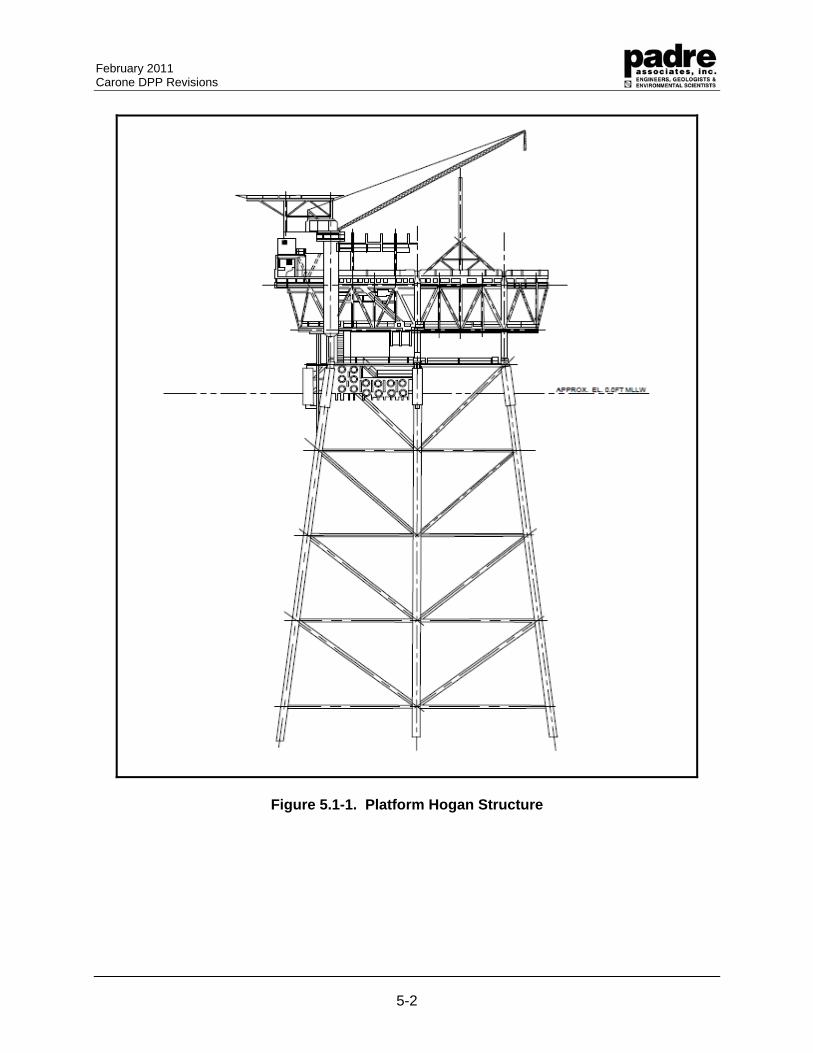
February 2011 Carone DPP Revisions
5-2
Figure 5.1-1. Platform Hogan Structure
February 2011 Carone DPP Revisions
5-3
Up to 25 wells, consisting of vertical pilot wells (to determine field characteristics), horizontal directional wells (to develop existing reserves), and salt water disposal/water injection wells (to maintain subsurface pressures) will be completed. The wells will be drilled using extended reach drilling technology and will extend from 1,400 to 12,000 ft eastward from Platform Hogan and several thousand feet below the seafloor. These horizontal distances are well within existing technology and are routinely accomplished within the industry. Platform Hogan has a total of 66 wells slots and as current Federal production decreases, a sufficient number of slots will become available for the proposed State waters drilling program. No new platforms or additional well slots will be required for the proposed development, and proposed drilling will not affect production from the federal leases
Carone proposes to use a low-solids, Cypan-type polymer drilling fluid, barite will be used to increase fluid weight and bentonite will be used for viscosity and fluid loss control. No cuttings or drilling fluids will be discharged into the marine waters. Drill cuttings will be collected from the shale shakers, and other solids control equipment, and brought to a unit where they are ground to micron size. Drill water from the rig floor and other liquid waste generated in the drilling operation are blended into a slurry with the drill cuttings. This blended slurry will be pumped down a dedicated injection well or a dedicated well annulus into subsurface rock strata.
Initial oil/gas separation will occur on Platform Hogan then produced fluids and gas will be transported to the La Conchita onshore processing facility via existing submarine pipelines from Platform Hogan (Figure 1). Oil and produced water will be pumped via an existing 12-inch pipeline and wet gas will be pumped to shore via an existing 10-inch pipeline. At the La Conchita facility:
Oil is separated from gas and water and processed to achieve sales specification, then sold to an oil purchaser via an existing pipeline connection.
Gas is separated from crude oil and water and processed to achieve sales specification, then sold to Southern California Gas via pipeline connection.
Produced water is separated from oil and gas and processed to clarify sufficiently to be pumped back offshore through an existing 4-inch pipeline and injected back into the reservoir, or disposed of overboard under an existing EPA-issued NPDES permit.
Produce solids (small quantities of small silica particles) are separated from oil and water, and periodically hauled to a disposal site.
Drilling is expected to commence following completion environmental review, and acquisition of all required permits, and will continue for up to seven years. Production is expected to begin in 2013 and continue through 2039. Maximum oil production of 3,500 barrels per day (BOPD) is expected to be reached in 2020. When production is no longer economically viable, all wells will be plugged and abandoned in accordance with either state or federal requirements and the related offshore and onshore facilities will be decommissioned.
Platform support will be provided via crew and supply boats from the existing pier facilities at Carpinteria. No long term increase in crew or supply boats is expected, however up
February 2011 Carone DPP Revisions
5-4
to one additional workboat trip per week is expected during drilling operations. All vessels will use existing voluntary on-water corridors between the pier and Platform Hogan.
5.4 EXTENDED-REACH DRILLING TECHNOLOGY AND ENVIRONMENTAL BENEFITS
Platform Hogan (Federal OCS P-0166) will be utilized to drill extended reach wells into State Leases PRC-4000, PRC-7911, and PRC-3133. State Leases will be developed using extended reach drilling (ERD) (sometimes referred to as horizontal directional drilling or HDD) technology with wells drilled approximately 1,400 to 12,000 feet “eastward” from the existing Platform Hogan in Federal waters. These horizontal distances are well within existing technological capacity and are routinely accomplished within the industry.
Utilizing a Federal platform means the only physical drilling or production activity on State leases will be subsurface well bores located several thousand feet below the ocean floor. No new platforms are necessary nor proposed using this “subsurface” approach. Additionally, the proposed State Lease development will not extend the life of the existing Federal platforms due to ongoing and concurrent development opportunities on the Federal Lease or OCS P-0166). Additionally, existing well slots, pipelines, equipment and other infrastructure will be used. Only minor modifications to existing equipment and facilities will be necessary to complete the proposed expansion of production.
Due to the lack of new infrastructure and minor upgrades necessary to complete the Project, the proposed ERD technology results in significant environmental benefits as opposed to other traditional/alternative drilling scenarios. Specifically, no new Platform or major equipment would be required. Avoidance of constructing a new Platform or processing facilities will eliminate potential impacts to aesthetics, air quality, marine biological resources, fisheries, marine traffic, and resulting waste streams. Essentially no significant physical changes will result from the proposed Project.
The resulting addition of oil and gas reserves to be processed from a formerly utilized reservoir would offset the need to produce new energy sources that may also have the potential for environmental impacts.
5.5 PURPOSE AND NEED
The purpose of the Project is to re-establish oil and gas production within the offshore Carpinteria Field located in state waters. It is estimated that production of State reserves will continue until economic production of Federal oil and gas reserves have been reached. A secondary recovery program on Federal lease OCS-P 0166 is expected to continue the economic life of the existing OCS operations past to 2039. The proposed State lease production plan has been developed to compliment the OCS production operations and will not extend the life of the existing OCS production operations beyond what can economically and safely be recovered.
The benefits include economic recovery of hydrocarbons that will otherwise go unrecovered if the existing PACOPS Federal infrastructure is not leveraged for further
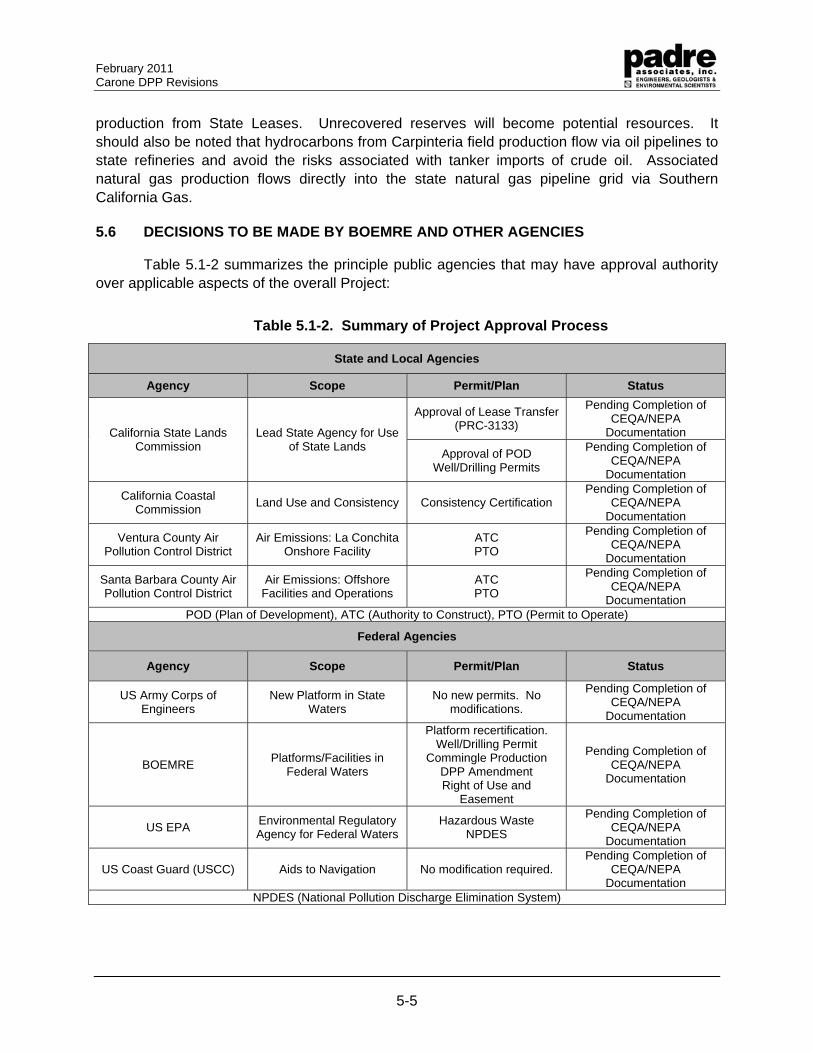
February 2011 Carone DPP Revisions
5-5
production from State Leases. Unrecovered reserves will become potential resources. It should also be noted that hydrocarbons from Carpinteria field production flow via oil pipelines to state refineries and avoid the risks associated with tanker imports of crude oil. Associated natural gas production flows directly into the state natural gas pipeline grid via Southern California Gas.
5.6 DECISIONS TO BE MADE BY BOEMRE AND OTHER AGENCIES
Table 5.1-2 summarizes the principle public agencies that may have approval authority over applicable aspects of the overall Project:
Table 5.1-2. Summary of Project Approval Process
State and Local Agencies
Agency Scope Permit/Plan Status
California State Lands Commission
Lead State Agency for Use of State Lands
Approval of Lease Transfer (PRC-3133)
Pending Completion of CEQA/NEPA
Documentation
Approval of POD Well/Drilling Permits
Pending Completion of CEQA/NEPA
Documentation
California Coastal Commission
Land Use and Consistency Consistency Certification Pending Completion of
CEQA/NEPA Documentation
Ventura County Air Pollution Control District
Air Emissions: La Conchita Onshore Facility
ATC PTO
Pending Completion of CEQA/NEPA
Documentation
Santa Barbara County Air Pollution Control District
Air Emissions: Offshore Facilities and Operations
ATC PTO
Pending Completion of CEQA/NEPA
Documentation POD (Plan of Development), ATC (Authority to Construct), PTO (Permit to Operate)
Federal Agencies
Agency Scope Permit/Plan Status
US Army Corps of Engineers
New Platform in State Waters
No new permits. No modifications.
Pending Completion of CEQA/NEPA
Documentation
BOEMRE Platforms/Facilities in
Federal Waters
Platform recertification. Well/Drilling Permit
Commingle Production DPP Amendment Right of Use and
Easement
Pending Completion of CEQA/NEPA
Documentation
US EPA Environmental Regulatory Agency for Federal Waters
Hazardous Waste NPDES
Pending Completion of CEQA/NEPA
Documentation
US Coast Guard (USCC) Aids to Navigation No modification required. Pending Completion of
CEQA/NEPA Documentation
NPDES (National Pollution Discharge Elimination System)
February 2011 Carone DPP Revisions
5.7-1
5.7 WEATHER AND METEOROLOGY
5.7.1 General Weather Patterns
The proposed Project is located within the marine waters between the shoreline and Platform Hogan in the Santa Barbara Channel (Channel) offshore of Carpinteria, in the Southern California Bight (SCB). Weather patterns in the Channel and the SCB are dominated by the Pacific high-pressure system (generally referred to as the Pacific High). The Pacific High shifts northward or southward in response to seasonal changes or the presence of cyclonic storms. During the summer season, this high-pressure system strengthens and moves to the North Pacific creating prevailing west-to-northwesterly winds along the coast. The system generally weakens during the winter, moving south, and allows the Aleutian low-pressure system to spawn storm events, which occasionally migrate through the southern California area. The Pacific High pressure system, the temperature differential between land and sea, and local geography combine to produce a Mediterranean climate characterized by partly cloudy, cool summers with little precipitation, and mid winters during which precipitation is more likely.
Generally, weather patterns within the offshore portion of the Project area are strongly affected by surrounding topographical features. The Santa Barbara Channel is approximately 60 nautical miles long and 20 nautical miles wide, oriented west-northwest (WNW) to east-southeast (ESE). At the western end of the Channel, the coastline turns abruptly from a north-south orientation to east-west near Point Arguello and Point Conception. Mountain ranges parallel the shores of the Channel both to the north and to the south. The Channel Islands rise from about 800 feet on San Miguel Island to 2,400 feet on Santa Cruz Island and descending to about 100 feet at Anacapa Island. The coastal ranges are marked by passes and canyons along the southern slopes. The Channel Islands have narrow ocean passages between them.
5.7.2 Temperature
Figure 5.7-1 displays the average offshore air temperatures recorded at the Santa Barbara Channel Buoy (No. 46053) from 1994 to 2001. The buoy is located at 34.248 N 119.841 W (34°14'52" N 119°50'28" W). The data record in this table shows the typical temperature regime within the offshore portion of the Project area including Platform Hogan. Information from other Buoys within the Santa Barbara Channel may be found online can be found at http://www.ndbc.noaa.gov/images/climplot/46053_at.jpg.
Temperature data for the onshore portion of the Project area show that the region is characterized by a low seasonal range in temperature (Ferren, 1985). The moderating influence of the ocean makes the occurrence of temperature extremes rare if not non-existent in the SCB. Temperatures over land in the Project area generally range from approximately 50°F - 70°F, although temperatures below freezing and up to 100°F occasionally occur. Air temperatures offshore are strongly influenced by sea surface temperature and range between 56°F - 65°F over the entire year. Table 5.7-1 below provides a summary of weather conditions within the Santa Barbara County Project area.
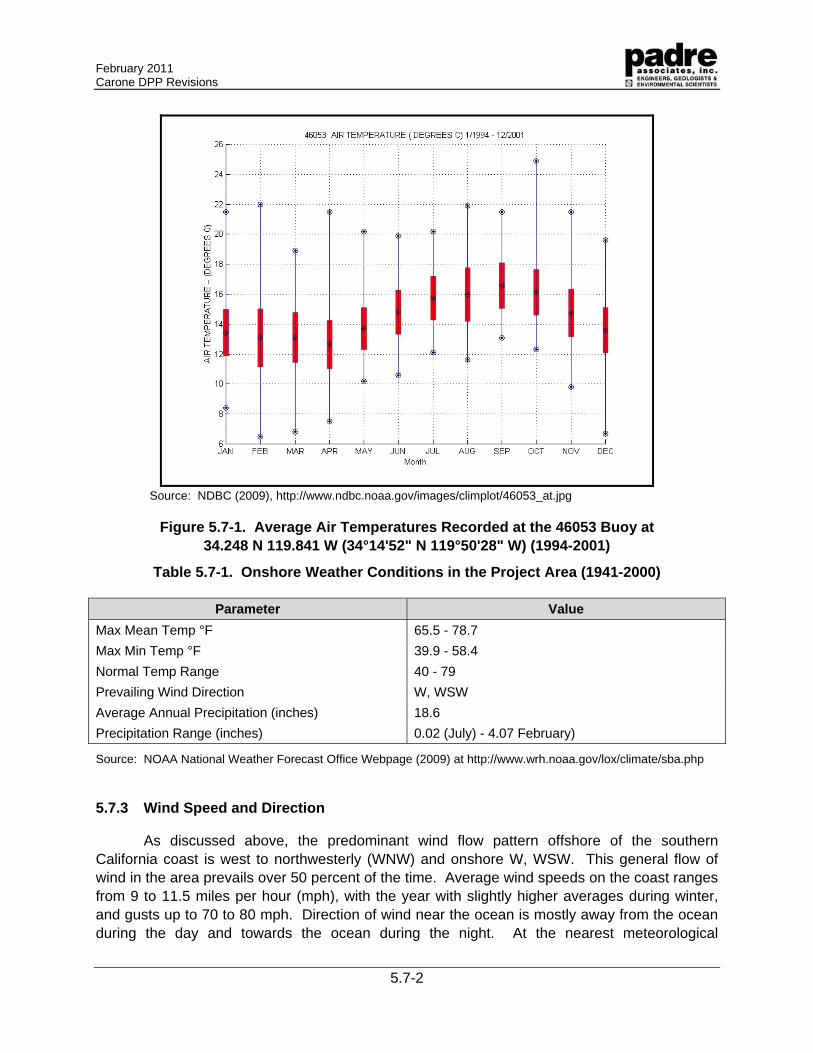
February 2011 Carone DPP Revisions
5.7-2
Source: NDBC (2009), http://www.ndbc.noaa.gov/images/climplot/46053_at.jpg
Figure 5.7-1. Average Air Temperatures Recorded at the 46053 Buoy at 34.248 N 119.841 W (34°14'52" N 119°50'28" W) (1994-2001)
Table 5.7-1. Onshore Weather Conditions in the Project Area (1941-2000)
Parameter Value
Max Mean Temp °F 65.5 - 78.7
Max Min Temp °F 39.9 - 58.4
Normal Temp Range 40 - 79
Prevailing Wind Direction W, WSW
Average Annual Precipitation (inches) 18.6
Precipitation Range (inches) 0.02 (July) - 4.07 February)
Source: NOAA National Weather Forecast Office Webpage (2009) at http://www.wrh.noaa.gov/lox/climate/sba.php
5.7.3 Wind Speed and Direction
As discussed above, the predominant wind flow pattern offshore of the southern California coast is west to northwesterly (WNW) and onshore W, WSW. This general flow of wind in the area prevails over 50 percent of the time. Average wind speeds on the coast ranges from 9 to 11.5 miles per hour (mph), with the year with slightly higher averages during winter, and gusts up to 70 to 80 mph. Direction of wind near the ocean is mostly away from the ocean during the day and towards the ocean during the night. At the nearest meteorological
February 2011 Carone DPP Revisions
5.7-3
monitoring station to the Carpinteria Field, the Santa Barbara County Air Pollution Control District Ellwood Station, prevailing wind is from the southwest (23 percent) or west-southwest (7 percent) during the day, and from the north-northeast (19 percent) or north or northeast (9 percent) during the night (Marine Research Services, 2008).
Gale force winds, i.e., 40 mph, occur occasionally as cold fronts pass or during Santa Ana winds. Santa Ana winds are a foehn-type, katabatic wind flowing from the high desert northeast of the Project area down through the passes between the Santa Ynez and Santa Monica Mountains and out to sea south of Ventura. Although the Santa Ana winds are typically 17 to 29 mph, speeds of over 100 mph have been observed. These winds are usually dry with relative humidity of 30 percent or less, and temperatures at least 5°F warmer than average (Marine Research Services, 2008).
5.7.4 Precipitation
Precipitation in the Project region has a Mediterranean pattern of winter rain and summer drought. Rainfall records for the region reveal that nearly 90 percent of the average monthly precipitation falls during the six-month period of November through April. The average annual precipitation at Santa Barbara for the period 1967 to 1979 was 17.8 inches (45.6 cm); however, fluctuations in annual precipitation are considerable as illustrated by 7.83 inches (19.9 cm) in 1975-76, and 36.67 inches (93.1 cm) in 1982-83 (Ferren 1985 as cited by UCSB, 2009). Most rain-bearing storm systems come from the northwest in winter; however, infrequent summer rains may occur from tropical air masses (UCSB, 2009). Table 5.7-2 below shows the average monthly precipitation as recorded in Santa Barbara; however, real-time data regarding precipitation and other meteorological parameters is available online at the Southern California Coastal Ocean Observing System at http://sccoos.ucsd.edu/interactive-map/.
Table 5.7-2. Average Monthly Precipitation Recorded at Santa Barbara (12/1927 - 7/2005)
Precipitation Jan Feb Mar Apr May June July Aug Sep Oct Nov Dec Total
Inches 3.78 4.09 2.81 1.19 0.31 0.09 0.02 0.03 0.15 0.53 1.71 3.08 17.79
Source: WRCC (2009), http://www.wrcc.dri.edu/summary/climsmsca.html
5.7.5 Severe Weather
Severe weather events in the Project area may occur due to frontal storms, tropical storms, thunder storms and the foehn-type Santa Ana winds. During the winter months, storms primarily originate in the vicinity of low pressure centers in the Gulf of Alaska. These storm events primarily move eastward from the Gulf of Alaska eastward, north of Point Conception, resulting in relatively mild weather in southern California. During winter storms, winds of 29 to 40 mph, accompanied by local gusts of 46 to 52 mph, may be experienced. As a front approaches, the area typically experiences southeasterly winds of about 35 mph with locally higher gusts which may persist for up to 12 hours. Following frontal passage, winds may be expected to become westerly or northwesterly and as strong as the prefrontal winds. The occasional thunderstorm, while spectacular, causes little damage. Only the fringes of tropical storms have appeared in the Southern California Bight. Increased humidity, rain showers, and
February 2011 Carone DPP Revisions
5.7-4
moderately higher surf are noted at such times. Some wind and wave damage to unprotected coastal facilities has occurred historically. Offshore structures experienced high winds and waves from the winter storm events, but have been constructed to withstand the maximum expected currents that are less than 50 cm/second and the 100 year storm waves which are less than 12 meters in height (API, 1987). The occasional thunderstorm, while spectacular, causes little damage. Only the fringes of tropical storms have appeared in the Southern California Bight. Increased humidity, rain showers, and moderately higher surf are noted at such times.
In addition to storms, the Project area is subject to Santa Ana winds which generally occur during the fall and sinter seasons and persist for up to three days. Santa Ana Winds of 40 to 50 knots are not uncommon near the Project area, and winds of 90 knots have been reported.
5.7.6 Potential Environmental Impacts
As discussed within the proposed Project POD, the Project will utilize an existing platform, (Platform Hogan) and existing infrastructure facilities installed and currently operated for Federal OCS P-0166 production. In accordance with Federal BOEMRE requirements, Platform Hogan completed a recertification of the Platform to verify that the facility meets all standards for a new facility. Offshore structures such as Platforms experience high winds and waves from the winter storm events, but have been constructed to withstand the maximum expected currents that are less than 50 cm/second and the 100 year storm waves which are less than 12 meters in height (API, 1987). No structural changes to the submerged portion of the Platform are proposed. As such, potential impacts caused by weather or other meteorological events would not result.
Although some onshore upgrades will be needed within the existing La Conchita Oil and Gas Facility in order to handle the production from the State Leases, no new onshore facilities will be necessary. As such, no additional impacts caused by weather or meteorological phenomenon would result.
February 2011 Carone DPP Revisions
5.7-5
5.7.7 References
American Petroleum Institute (API). 1987. Recommended Practice for Planning, Designing, and Constructing Fixed Offshore Platforms – API Recommended Practice 2A 17th Edition.
California Geological Survey. Tsunami website accessed on March 25, 2010 at http://www.consrv.ca.gov/cgs/geologic_hazards/Tsunami/Pages/About_Tsunamis.aspx#what is a tsunami
Clearwater Port. 2007. Revised Project Application Package, Oceanography and Meteorology Sections.
Ferren, W. R., Jr. 1985a. Carpinteria Salt Marsh: Environment, history, and botanical resources of a southern California estuary. The Herbarium, Department of Biological Sciences, University of California, Santa Barbara. Publication No. 4.
Ferren, W. R., Jr. 1985b. Written to William R. Spencer regarding the proposed public recreation pier draft EIR. 20 May 1985.
Marine Research Services (MRS), 2008. Proposed Final Environmental Impact Report (FEIR) for the Venoco Paredon Project. SCH# 2006051126.
National Data Buoy Center (2009), Buoy No. 46053 accessed online at http://www.ndbc.noaa.gov/images/climplot/46053_ws.gif
National Oceanic and Atmospheric Administration. 2000. National Weather Service Forecast Office Website – Santa Barbara Climate Page accessed online on March 25, 2010 at http://www.wrh.noaa.gov/lox/climate/sba.php.
Pacific Operators Offshore. 2009. Website. Accessed online December 2009
2008. Oil Spill Response Plan - La Conchita Onshore Facilities. Goldberg Environmental Services.
2008. Oil Spill Response Plan - Platforms Hogan and Houchin and Associated Subsea Pipelines, Lease OCS-P 0166. Goldberg Environmental Services. August 2008.
2009. Application to California State Lands Commission to Develop Oil and Gas Leases.
Santa Barbara County. 2009. Planning and Development, Energy Division Map accessed online December 2009 at http://ocsenergy.anl.gov/documents/maps/Southern_California_Plan_Area.pdf
Southern California Coastal Ocean Observing System (SCCOOS) Website accessed online on March 34, 2010 at http://sccoos.ucsd.edu/interactive-map/.
February 2011 Carone DPP Revisions
5.7-6
University of California Santa Barbara. 2009. Carpinteria Salt Marsh Reserve System website accessed December 2009 at http://carpinteria.ucnrs.org/introduction.html
University of California Santa Barbara (UCSB). 2010. Ocean Surface Currents Mapping Project website located at http://www.icess.ucsb.edu/iog/realtime/72hr.php
Venoco, Inc. 2005. Cavern Point Unit Environmental Analysis (Final).
Western Regional Climate Center. 2009. Website. Accessed online December 2009 at http://www.wrcc.dri.edu/summary/climsmsca.htm
February 2011 Carone DPP Revisions
5.8-1
5.8 OCEANOGRAPHY
This section describes the physical oceanography and water quality parameter within the Santa Barbara Channel (Channel) where the offshore activities of the proposed Project would take place. The Channel is an elongated basin (approximately 100 km by 40 km) lying between the California Coast, where it trends westward from greater Los Angeles to Point Conception, and the east-west trending Channel Island Chain. Although the Channel itself is generally sheltered, conditions within the Channel and adjoining regions are considered more complex that other study areas of the United States (Hendershott, 1996). As such, the following section describes both the general and historic data for the offshore Santa Barbara Channel as an overview of existing regional environmental conditions. Site-specific and real-time data regarding oceanography within the Project region is discussed further in Attachment 9.0 (Oil Spill Risk Assessment).
5.8.1 Physical Oceanography
5.8.1.1 Sea Temperatures
Surface water temperatures in the Santa Barbara Channel vary from approximately 13.5C in winter to 18C in summer; waters are slightly warmer in the eastern end of the channel. Water temperatures generally decrease with depths, to a minimum of 6 in the deepest part of the Santa Barbara basin. A strong vertical temperature gradient exists in the channel and is pronounced and shallowest in summer (at depths of 5-15 m) and is weakest and deeper in winter (30-45 m). Seasonal variations in temperature are not noticeable below a depth of 100-200 m (Venoco, 2005). Figure 5.8-1 below shows average sea temperatures as recorded by Buoy No. 46053 from 1994 through 2001. The coldest temperatures primarily occur during the winter and early spring months. For additional information regarding site-specific and real-time data (including sea temperature, air temperature and wave data), please refer to the Southern California Coastal Ocean Observing Meteorological Station webpage at http://www.sccoos.org/data/mets/fullscreen.php?sta=&chan=T&dist=5&units=1&info=0&ll=34.4,-120&zz=9®s=mb,vc,sci,lac,oc,nsd,sd,all&provs=ASOS,MARITIME,SCCOOS,OCSD,MesoWest,RAWS,APRSWXNET,OTHER-MTR,XWforYou,NOS-PORTS&legend=0&inactive=1&type=1.
5.8.2 Ocean Currents
The offshore Project area is located in the northern portion of the Santa Barbara Channel. The Santa Barbara Channel is located at the northern edge of the Southern California Bight with an east to west orientation. The Channel is approximately 63 miles (100 km) long and 25 miles (40 km) wide with a maximum depth of more than 1,800 feet (300 fathoms) in its central basin. Currents in the Channel are a superposition of large-scale flow and a cyclonic circulation characteristic to the Channel’s interior. Current observations at the eastern Channel entrance indicate close agreement between direct measurements and geostrophic calculations of the flow in these areas. The large-scale surface flow is equatorward in the spring due to strong equatorward wind stress. Surface current flows reverse to the poleward direction for the remainder of the year, due to strengthening of the alongshore surface pressure gradient. Monthly averaged currents on the southern Channel shelf are eastward year-round: they reach
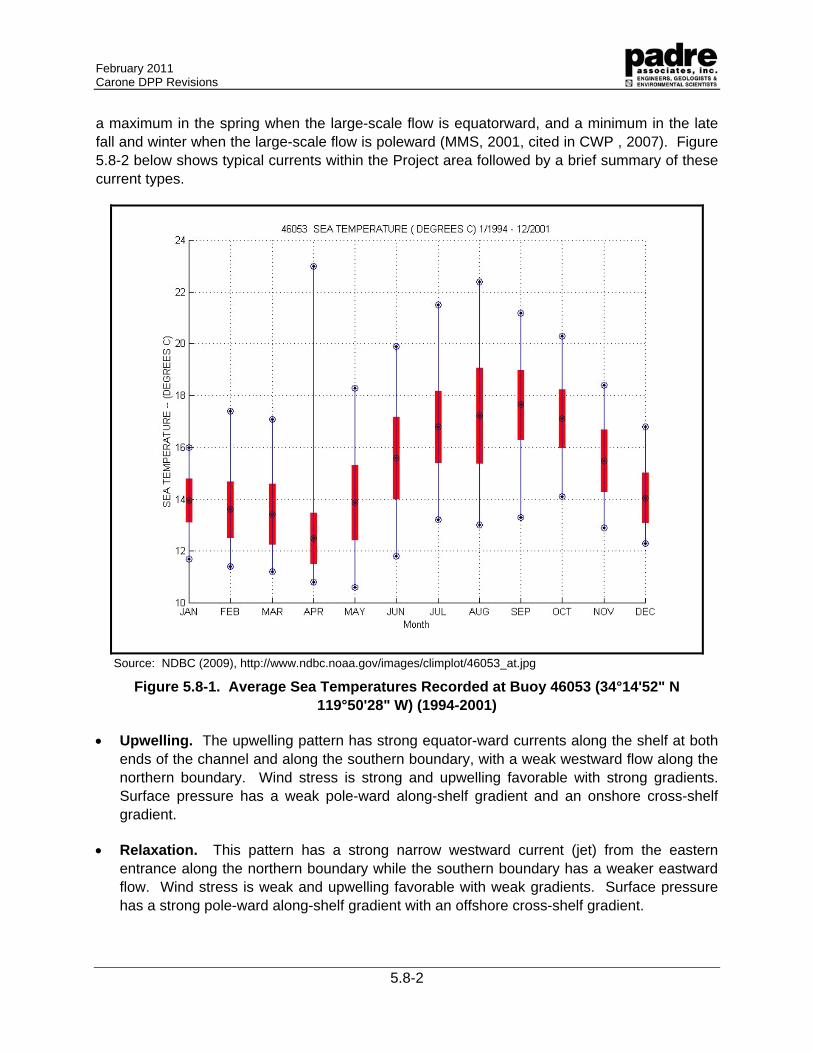
February 2011 Carone DPP Revisions
5.8-2
a maximum in the spring when the large-scale flow is equatorward, and a minimum in the late fall and winter when the large-scale flow is poleward (MMS, 2001, cited in CWP , 2007). Figure 5.8-2 below shows typical currents within the Project area followed by a brief summary of these current types.
Source: NDBC (2009), http://www.ndbc.noaa.gov/images/climplot/46053_at.jpg
Figure 5.8-1. Average Sea Temperatures Recorded at Buoy 46053 (34°14'52" N 119°50'28" W) (1994-2001)
Upwelling. The upwelling pattern has strong equator-ward currents along the shelf at both ends of the channel and along the southern boundary, with a weak westward flow along the northern boundary. Wind stress is strong and upwelling favorable with strong gradients. Surface pressure has a weak pole-ward along-shelf gradient and an onshore cross-shelf gradient.
Relaxation. This pattern has a strong narrow westward current (jet) from the eastern entrance along the northern boundary while the southern boundary has a weaker eastward flow. Wind stress is weak and upwelling favorable with weak gradients. Surface pressure has a strong pole-ward along-shelf gradient with an offshore cross-shelf gradient.
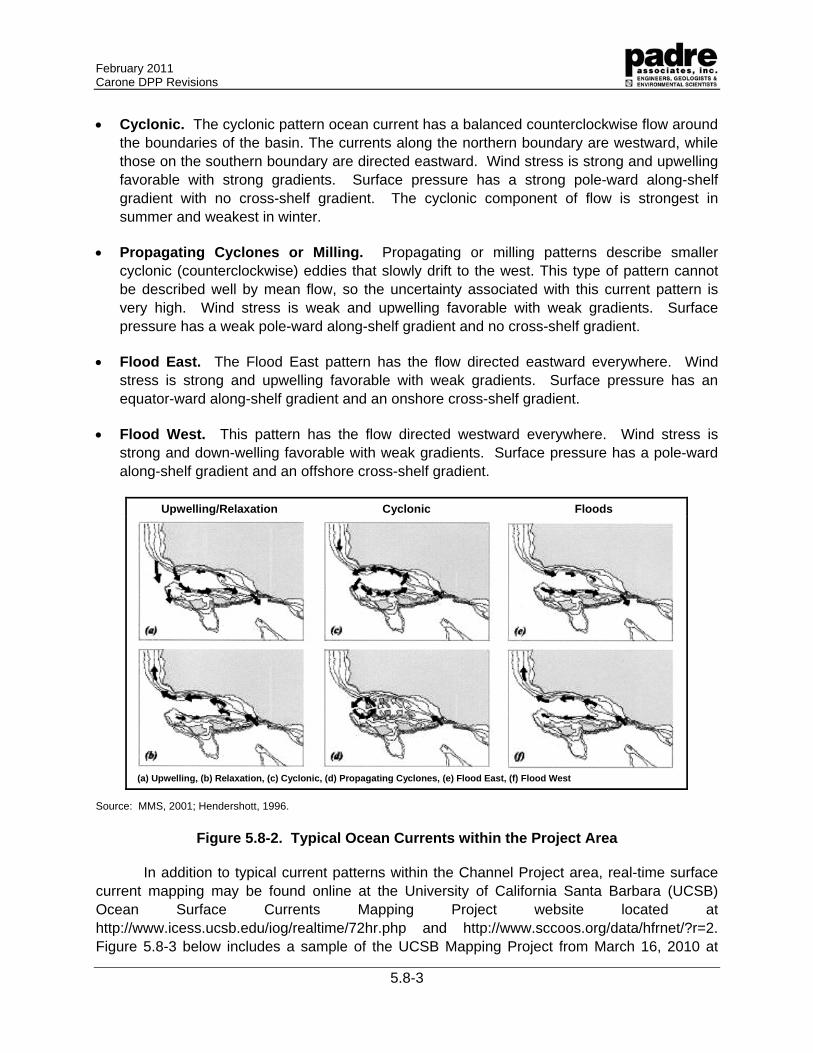
February 2011 Carone DPP Revisions
5.8-3
Cyclonic. The cyclonic pattern ocean current has a balanced counterclockwise flow around the boundaries of the basin. The currents along the northern boundary are westward, while those on the southern boundary are directed eastward. Wind stress is strong and upwelling favorable with strong gradients. Surface pressure has a strong pole-ward along-shelf gradient with no cross-shelf gradient. The cyclonic component of flow is strongest in summer and weakest in winter.
Propagating Cyclones or Milling. Propagating or milling patterns describe smaller cyclonic (counterclockwise) eddies that slowly drift to the west. This type of pattern cannot be described well by mean flow, so the uncertainty associated with this current pattern is very high. Wind stress is weak and upwelling favorable with weak gradients. Surface pressure has a weak pole-ward along-shelf gradient and no cross-shelf gradient.
Flood East. The Flood East pattern has the flow directed eastward everywhere. Wind stress is strong and upwelling favorable with weak gradients. Surface pressure has an equator-ward along-shelf gradient and an onshore cross-shelf gradient.
Flood West. This pattern has the flow directed westward everywhere. Wind stress is strong and down-welling favorable with weak gradients. Surface pressure has a pole-ward along-shelf gradient and an offshore cross-shelf gradient.
Upwelling/Relaxation Cyclonic Floods
(a) Upwelling, (b) Relaxation, (c) Cyclonic, (d) Propagating Cyclones, (e) Flood East, (f) Flood West
Source: MMS, 2001; Hendershott, 1996.
Figure 5.8-2. Typical Ocean Currents within the Project Area
In addition to typical current patterns within the Channel Project area, real-time surface current mapping may be found online at the University of California Santa Barbara (UCSB) Ocean Surface Currents Mapping Project website located at http://www.icess.ucsb.edu/iog/realtime/72hr.php and http://www.sccoos.org/data/hfrnet/?r=2. Figure 5.8-3 below includes a sample of the UCSB Mapping Project from March 16, 2010 at
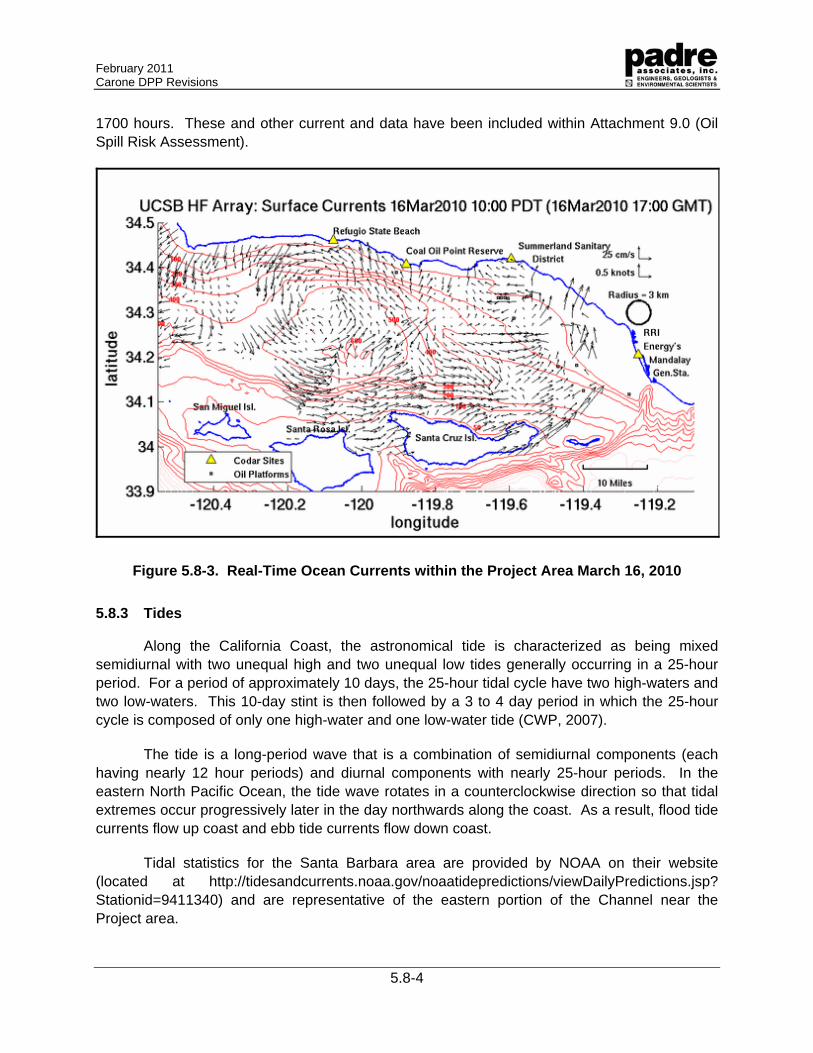
February 2011 Carone DPP Revisions
5.8-4
1700 hours. These and other current and data have been included within Attachment 9.0 (Oil Spill Risk Assessment).
Figure 5.8-3. Real-Time Ocean Currents within the Project Area March 16, 2010
5.8.3 Tides
Along the California Coast, the astronomical tide is characterized as being mixed semidiurnal with two unequal high and two unequal low tides generally occurring in a 25-hour period. For a period of approximately 10 days, the 25-hour tidal cycle have two high-waters and two low-waters. This 10-day stint is then followed by a 3 to 4 day period in which the 25-hour cycle is composed of only one high-water and one low-water tide (CWP, 2007).
The tide is a long-period wave that is a combination of semidiurnal components (each having nearly 12 hour periods) and diurnal components with nearly 25-hour periods. In the eastern North Pacific Ocean, the tide wave rotates in a counterclockwise direction so that tidal extremes occur progressively later in the day northwards along the coast. As a result, flood tide currents flow up coast and ebb tide currents flow down coast.
Tidal statistics for the Santa Barbara area are provided by NOAA on their website (located at http://tidesandcurrents.noaa.gov/noaatidepredictions/viewDailyPredictions.jsp? Stationid=9411340) and are representative of the eastern portion of the Channel near the Project area.
February 2011 Carone DPP Revisions
5.8-5
5.8.4 Sea State
In southern California, wind waves generally predominate from the northwest, although swell may originate from any direction. However, the Channel Islands act as an effective barrier against swells coming into the Santa Barbara Channel. From Ventura to Port Hueneme, swell cannot reach the area without considerable reduction by the Channel Islands or extreme refraction over the mainland shelf (MMS, 2001, CWP, 2007). Surface wave conditions inside the channel are usually mild to moderate, averaging 1 to 3 feet (0.3 to 0.9 m) in height (USGS, 1976, CWP, 2007). The eastern portion of the Channel is less sheltered by the islands and comparatively experiences higher sea states, which are generally less than 6 feet (1.8 m) (California Coastal Commission, 1981, CWP 2007).
Extreme wave conditions within the Project area may be caused by weather conditions including hurricanes, tropical storms, and tsunamis. Generally, hurricanes, originating from the Central Pacific off South America, degrade to tropical storms by the time they reach the coastal areas of California. The result is usually above average swell and high surf along south-facing exposed beaches.
Tsunamis are characterized as seisimic sea waves generated by an earthquake, landslide, volcanic eruption, or even by a large meteor hitting the ocean (CGS, 2010). Tsunami events, although infrequent, are capable of causing severe damage in embayments and harbors. In offshore waters, tsunamis are characterized by low relief, long-period waves. In such conditions, little or no damaging effects of tsunamis have been noted. Several tsunami events have been recorded within the Channel. According to the USGS, the Santa Barbara coastline has seen significant tsunamis in 1812 (2 meters in height) and 1896 (2 meters in height). Additional records of tsunami events are available online at http://www.ngdc.noaa.gov/nndc/servlet/ShowDatasets.
Table 5.8-1 below shows statistical data of the average significant wave heights and wave periods recorded at the NOAA Buoy Station 46053. These data represent the typical wave patterns likely to be encountered in the offshore Project area. In addition to average patterns within the Project area, real-time wind and wave heights for Buoy No. 46053 may be found online at the University of California Santa Barbara (UCSB) Ocean Surface Currents Mapping Project website located at http://www.icess.ucsb.edu/iog/realtime/72hr.php and http://www.sccoos.org/data/hfrnet/?r=2.
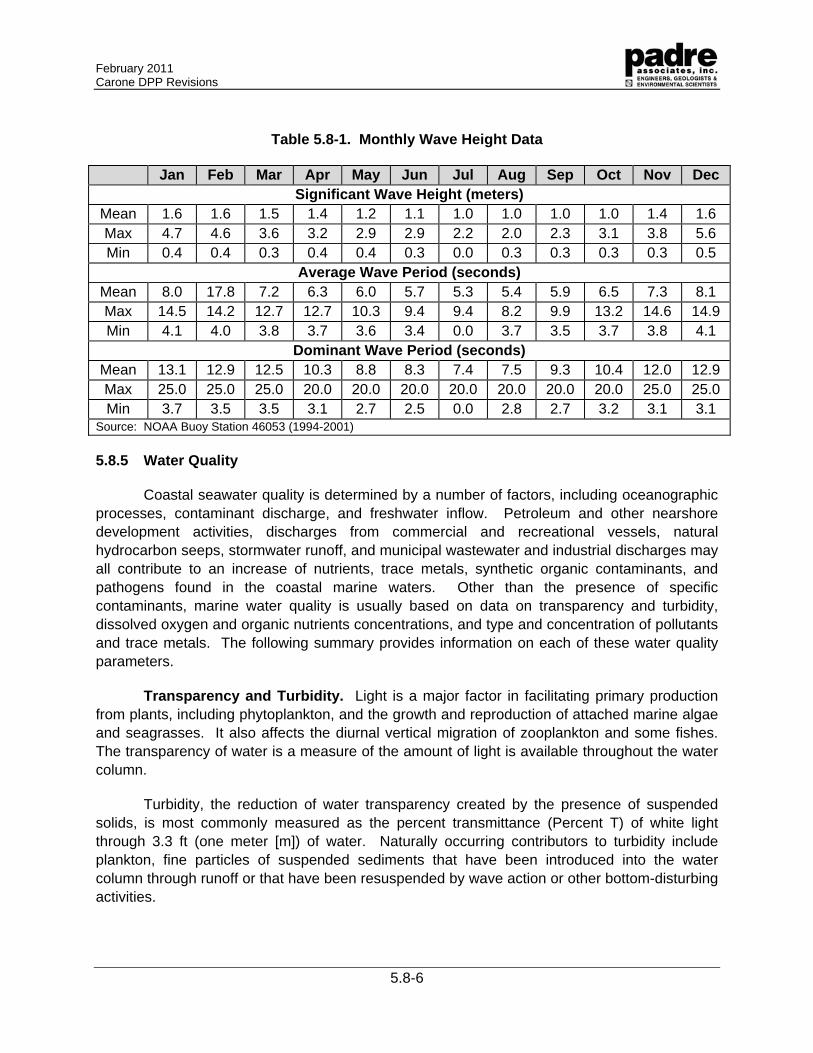
February 2011 Carone DPP Revisions
5.8-6
Table 5.8-1. Monthly Wave Height Data
Jan Feb Mar Apr May Jun Jul Aug Sep Oct Nov Dec Significant Wave Height (meters)
Mean 1.6 1.6 1.5 1.4 1.2 1.1 1.0 1.0 1.0 1.0 1.4 1.6 Max 4.7 4.6 3.6 3.2 2.9 2.9 2.2 2.0 2.3 3.1 3.8 5.6 Min 0.4 0.4 0.3 0.4 0.4 0.3 0.0 0.3 0.3 0.3 0.3 0.5
Average Wave Period (seconds) Mean 8.0 17.8 7.2 6.3 6.0 5.7 5.3 5.4 5.9 6.5 7.3 8.1 Max 14.5 14.2 12.7 12.7 10.3 9.4 9.4 8.2 9.9 13.2 14.6 14.9 Min 4.1 4.0 3.8 3.7 3.6 3.4 0.0 3.7 3.5 3.7 3.8 4.1
Dominant Wave Period (seconds) Mean 13.1 12.9 12.5 10.3 8.8 8.3 7.4 7.5 9.3 10.4 12.0 12.9 Max 25.0 25.0 25.0 20.0 20.0 20.0 20.0 20.0 20.0 20.0 25.0 25.0 Min 3.7 3.5 3.5 3.1 2.7 2.5 0.0 2.8 2.7 3.2 3.1 3.1
Source: NOAA Buoy Station 46053 (1994-2001)
5.8.5 Water Quality
Coastal seawater quality is determined by a number of factors, including oceanographic processes, contaminant discharge, and freshwater inflow. Petroleum and other nearshore development activities, discharges from commercial and recreational vessels, natural hydrocarbon seeps, stormwater runoff, and municipal wastewater and industrial discharges may all contribute to an increase of nutrients, trace metals, synthetic organic contaminants, and pathogens found in the coastal marine waters. Other than the presence of specific contaminants, marine water quality is usually based on data on transparency and turbidity, dissolved oxygen and organic nutrients concentrations, and type and concentration of pollutants and trace metals. The following summary provides information on each of these water quality parameters.
Transparency and Turbidity. Light is a major factor in facilitating primary production from plants, including phytoplankton, and the growth and reproduction of attached marine algae and seagrasses. It also affects the diurnal vertical migration of zooplankton and some fishes. The transparency of water is a measure of the amount of light is available throughout the water column.
Turbidity, the reduction of water transparency created by the presence of suspended solids, is most commonly measured as the percent transmittance (Percent T) of white light through 3.3 ft (one meter [m]) of water. Naturally occurring contributors to turbidity include plankton, fine particles of suspended sediments that have been introduced into the water column through runoff or that have been resuspended by wave action or other bottom-disturbing activities.
February 2011 Carone DPP Revisions
5.8-7
Transparency is generally lower in the spring than in the fall, particularly in the vicinity of the alluvial plains along the coastline south of Santa Barbara. A band of low transparency water within a mile or so of the beach is characteristic of the southern California Coast. Surface water circulation in the region of the Channel Islands tends to move fine suspended sediment into the Santa Barbara Basin from the west via the California Current System and from the southeast through the Anacapa Passage. As a result, the rate of silt and clay deposition in the Santa Barbara Basin is high (Dailey et al. 1993, as cited in CWP, 2007).
Oxygen and Organic Nutrients. The Southern California Coastal Water Research Project reports that surface waters of the Southern California Bight (SCB) are usually saturated or supersaturated with dissolved oxygen on the mainland shelf with the highest concentrations occurring during the summer months when oxygen saturation may reach as high as 140 percent of saturation. Coastal water concentrations of dissolved oxygen are more variable than those offshore, reaching as high as 10 to 14 milligrams per liter (mg/l) or parts per million (ppm). Highest dissolved oxygen concentrations are characteristic of nutrient-rich water that supports productive phytoplankton populations that release oxygen during photosynthesis. Dissolved oxygen is be depleted by respiration of marine organisms and through chemical and/or biochemical reactions.
Concentrations of dissolved oxygen are a function of photosynthetic processes, respiration, atmospheric exchange of gases, ocean temperature, salinity, currents, density, and wind-mixing. There is little horizontal, but relatively large vertical variations in dissolved oxygen concentration. Dissolved oxygen concentrations are usually highest in spring and summer because of an increase in upwelling and the resulting increase in nutrients and photosynthetic activity; they also vary with depth because photosynthesis is concentrated within the photic zone usually located in the upper 200 ft (60 m) of the ocean within the project region. Dissolved oxygen concentrations below 200 ft. (60 m) usually do not fall below 4 mg/l in shelf waters, which is about 50 percent of saturation and is sufficient to support most marine life. Dissolved oxygen concentrations generally drop rapidly below 330 ft (100 m) to below 2.0 ppm. Organisms living in the deeper waters have adapted physiologically to the effects of low water temperature, increase pressure, low dissolved oxygen, and higher salinity.
Nutrients may be defined as the chemicals that are required to sustain living organisms. Nutrients are considered to be one of the most important limiting factors in primary production (Hutchinson, 1957). In the marine environment, autotrophic organisms assimilate nutrients from seawater and transfer the nutrients along the food web to heterotrophic organisms. Three of the more important nutrients are nitrogen, phosphorus, and silica. Silica is an important nutrient to diatoms, which comprise much of the phytoplankton community along the SCB.
Upwelling of nutrient-rich deep waters to the near-surface waters is an important source of nutrients, however advections, and discharges from land sources such as rivers, rainwater runoff, industrial and domestic wastewater also provide those chemicals. The primary process depleting the concentration of nutrients in the surface waters is uptake by phytoplankton. Other processes nutrient-depleting actions are advection of nutrient-rich waters into other areas via currents, and the mixing with nutrient depleted water masses. Low concentrations of nutrients are normally found in surface waters except in local source areas (BLM, 1975).
February 2011 Carone DPP Revisions
5.8-8
Nitrogen and phosphorus are the two elements generally found to be limiting in natural marine ecosystems; however, nitrogen is considered to be the more important of the two. In the open ocean, it has been commonly observed that total nitrogen and total phosphorus are found in a relatively constant ratio of about 15 atoms of nitrogen to 1 atom of phosphorus (Redfield, 1958, as cited by CWP, 2007). This relationship is not nearly so constant in coastal waters, which are affected by higher rates of organic production and are subject to influences from land-based nutrient sources.
Phosphorus exists in a great number of forms, the most prevalent of which is the phosphate group (PO4). The slightly soluble inorganic phosphorus of the earth’s crust is a relatively unlimited reservoir that slowly leaches into aquatic systems through the weathering of rock. These soluble orthophosphates are assimilated by phytoplankton and transformed into particulate organic phosphorus. Dissolved inorganic phosphorus compounds are released into solution by excretion or decomposition and are transformed into particulate organic phosphorus or, through degradation, are converted back into inorganic orthophosphates. As in nitrogenous forms, some of the organic products result in refractory compounds, unavailable for biological use, which are incorporated into the sediments.
In the SCB, average nitrate and phosphate concentrations in the surface water 0 to 50 ft. (0 to15 m), are usually low (NO3 5 g/l; PO4 0.5 g/l). From a depth of 50 to about 330 ft. (15 to100 m) concentrations increase (NO3 = 8 to 12 g/l and PO4 = 1 to 2 g/l). Below the 330 ft (100 m) isobath, the concentrations increase steadily but at slower rates than near surface. Below 740 ft (225 m), nitrate concentrations are consistently greater than 20 g/l and phosphate greater than 2 g/l. Nutrient concentrations in the coastal near-surface waters also vary with season with higher nitrate and phosphate concentrations evident during spring upwelling and stormwater runoff periods. This seasonal change is less evident farther from shore and is usually not evident in water depths greater than 330 ft (100 m). Nitrate concentrations at depth within the marine waters of the SCB vary little, although upwelling and stormwater runoff can result in localized differences in concentrations.
Trace Metals. Trace metals such as cadmium, copper, zinc, mercury, and lead are relatively common constituents of seawater and marine sediments. In the SCB, trace metals within the water column and sediments are derived from natural sources such as weathering of pre-existing rock material and also from anthropogenic sources.
Metals can exist in ionic form, or they can be associated with particulates, organically bound, or as chemical complexes; chemical and biological processes shift the equilibrium between these states. The form and concentration of trace metals vary significantly between coastal and offshore marine waters and by depth. Other factors such as heavy rains, storm runoff to coastal waters, upwelling of subsurface water, or changes in plankton population can also alter metals concentration (CWP, 2007).
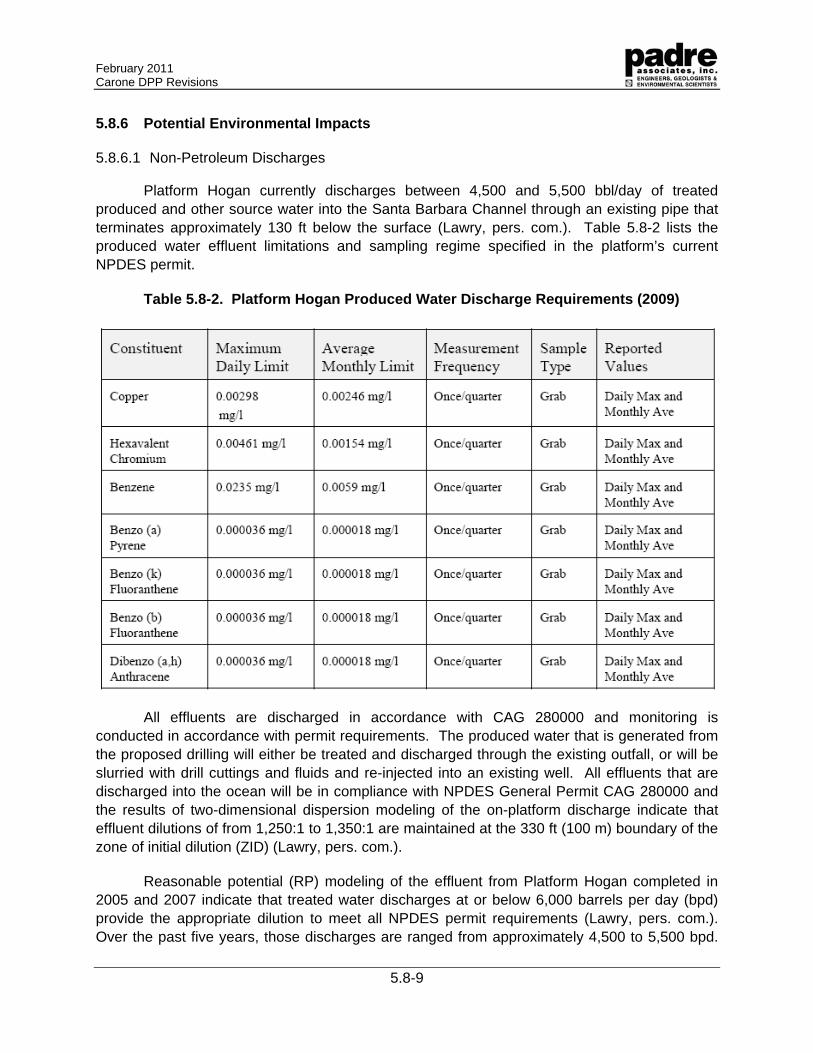
February 2011 Carone DPP Revisions
5.8-9
5.8.6 Potential Environmental Impacts
5.8.6.1 Non-Petroleum Discharges
Platform Hogan currently discharges between 4,500 and 5,500 bbl/day of treated produced and other source water into the Santa Barbara Channel through an existing pipe that terminates approximately 130 ft below the surface (Lawry, pers. com.). Table 5.8-2 lists the produced water effluent limitations and sampling regime specified in the platform’s current NPDES permit.
Table 5.8-2. Platform Hogan Produced Water Discharge Requirements (2009)
All effluents are discharged in accordance with CAG 280000 and monitoring is conducted in accordance with permit requirements. The produced water that is generated from the proposed drilling will either be treated and discharged through the existing outfall, or will be slurried with drill cuttings and fluids and re-injected into an existing well. All effluents that are discharged into the ocean will be in compliance with NPDES General Permit CAG 280000 and the results of two-dimensional dispersion modeling of the on-platform discharge indicate that effluent dilutions of from 1,250:1 to 1,350:1 are maintained at the 330 ft (100 m) boundary of the zone of initial dilution (ZID) (Lawry, pers. com.).
Reasonable potential (RP) modeling of the effluent from Platform Hogan completed in 2005 and 2007 indicate that treated water discharges at or below 6,000 barrels per day (bpd) provide the appropriate dilution to meet all NPDES permit requirements (Lawry, pers. com.). Over the past five years, those discharges are ranged from approximately 4,500 to 5,500 bpd.
February 2011 Carone DPP Revisions
5.8-10
While some degradation of the marine water quality could occur immediately adjacent to the discharge and inside the ZID, the effluent meets NPDES requirements at the ZID boundary and therefore is not expected to significantly affect the marine water quality within the project area or region.
5.8.6.2 Petroleum and Drilling Fluid Discharges
The release of petroleum into the marine environment during Project activities could result in potentially significant impacts to the marine water quality. Refined products (i.e., diesel, gasoline.) are more toxic than heavier crude or Bunker-type products, and the loss of a substantial amount of fuel, lubricating oil or petroleum products could affect the water column resulting in alteration of the existing water quality. As such, a release of petroleum into the marine environment is considered a potentially significant impact. However, with the exception of the new wellhead equipment and associated piping, no additional platform-based oil and gas handling and processing equipment is required for the proposed Project. No expansion of onshore facilities will be necessary in order to process the oil and gas produced from the Carpinteria Field. As such, the potential for water quality impacts associated with spills would be limited to discharges during upset conditions (i.e. pipeline rupture or drilling fluid loss) or from platform effluents that exceed permitted concentration of constituents. The following discusses the potential effects of those events.
Existing Spill Prevention Plan. The current Pacific Operators Offshore, Oil Spill Response Plan (OSRP) for Platforms Hogan and Houchin and Associated Subsea Pipelines (2008) will be used to respond to any release of oil based products into the marine environment. The following measures have been incorporated into the proposed plan of operation and will result in reducing the chances of a spill occurring during construction and vessel activities:
All vessels will be USCG-inspected and will have the appropriate spill response equipment onboard.
Carone will maintain an approved oil spill response plan and the appropriate spill response equipment on the platform. Response drills will be in accordance with federal and state requirements. Contracts with off-site spill response companies will be in-place and will provide additional containment and clean-up resources as needed.
Pipelines will be maintained and inspected in accordance with BOEMRE regulations.
Petroleum-fueled equipment on the platform will have drip pans or other means of collecting dripped oil which will be collected and treated with onboard equipment. No petroleum will be allowed to enter the marine waters from the platform.
Drilling Fluid Release. The drilling fluid that is proposed is a barite-based, non-toxic fluid that, if accidentally discharged, could result in local increase in turbidity and the resulting degradation of water clarity and possible short-term decrease in dissolved oxygen. The turbidity would be expected to quickly dissipate and the particulate material would be expected to settle to the seafloor and to be incorporated into the sediments. Because of its non-toxic composition
February 2011 Carone DPP Revisions
5.8-11
and tendency to settle out of the water column, no long-term water quality effects from an accidental discharge of the drilling fluid are expected.
As with other drilling standard drilling equipment, the drilling rig will be fitted with blowout preventing equipment (BOPE). The blowout equipment will be sized, specified, and tested in accordance with the BOEMRE regulation well control guidelines. The BOPE and choke manifold will be hydrotested with water in accordance with applicable regulations. The BOPE will be tested when installed, before drilling out each string of casing, and once every 14 days.
Onshore and Nearshore Resources. The accidental discharge of oil from a rupture of the pipeline that transports the produced oil from the platform to the La Conchita onshore facility could result in degradation of the marine water quality. Studies have shown that the physical and chemical properties of spilled petroleum begins to change due to weathering relatively soon after discharge. National Academy of Sciences, 1975, cited in Continental Shelf Associates [CSA], 1995) indicate that surface oil slicks produce reductions in light penetration and gas exchange, reduce water column dissolved oxygen concentrations, and increase turbidity, chemical and biological oxygen demand. Dailey, et al., 1993 (cited in CSA, 1995) suggests that the general trend in acute toxicity increases as the molecular weight of the petroleum product increases. The aromatic compounds, which comprise 20 to 50 percent of most crude oils, 75 percent or more of refined petroleum products, and 10 percent or less of residual oils such as Bunker C, are the most toxic components. These components tend to be water soluble but due to their volatility, tend to evaporate rapidly (Jordan and Payne, 1980 [cited in CSA, 1995]).
As with offshore discharges, an oil spill in the near shore waters, resulting from the proposed actions would be expected to degrade the existing water quality by increasing the concentration of petroleum hydrocarbon compounds (PHC) and other contaminants (i.e. sulfur) usually associated with Santa Barbara crude oil. Those effects are, however, expected to be relatively short-term, lasting only during cleanup operations and rapidly decrease due to natural dispersion and evaporation that decreases the volume of oil in the water column. The presence of oil in protected areas such as wetlands or coastal estuaries would be expected to increase the severity and duration of water quality effects. Assuming existing spill prevention measures and cleanup operations are in-place, the effects of an accidental discharge of petroleum on the regional and project area water quality are not expected to be significant or long-term. Further, based on the preventative measures that are in-place, the integrity of the existing pipeline, and the design of the proposed drilling operations, the likelihood of an oil spill occurring is expected to be low.
February 2011 Carone DPP Revisions
5.8-12
5.8.7 References
California Geological Survey. Tsunami website accessed on March 25, 2010 at http://www.consrv.ca.gov/cgs/geologic_hazards/Tsunami/Pages/About_Tsunamis.aspx#what is a tsunami
Clearwater Port. 2007. Revised Project Application Package, Oceanography and Meteorology Sections.
Continental Shelf Associates, 1995. Final Environmental Impact Report. Subsea Well Abandonment and Flowline Abandonment/Removal Program. California State Lands Commission EIR No. 663; SCH No. 94121042.
Dailey, M.D., D.J. Reish, and J.W. Anderson (eds.). 1993. Ecology of the Southern California Bight: A Synthesis and Interpretation.
Hendershott, M.C, and C.D. Winant (1996). Surface Circulation in the Santa Barbara Channel.
Hutchinson, G.E. "Concluding Remarks," Cold Spring Harbor Symposia on Quantitative Biology 22 (1957), pp. 415–27.
Lawry, Steve (personal communication). LTS Environmental, Ventura, CA. Telephone conversations with Ray de Wit, Padre Associates, Inc. March 4 and 8, 2010.
Minerals Management Service (MMS). 2001. Draft Environmental Impact Statement - Delineation Drilling Activities in Federal Waters Offshore Santa Barbara County, California. Prepared by Pacific OCS Region, Camarillo, California. June.
National Data Buoy Center (2009), Buoy No. 46053 accessed online at http://www.ndbc.noaa.gov/images/climplot/46053_ws.gif
National Oceanic and Atmospheric Administration. 2000. National Weather Service Forecast Office Website – Santa Barbara Climate Page accessed online on March 25, 2010 at http://www.wrh.noaa.gov/lox/climate/sba.php.
2010. Tides and Currents Webpage accessed online March 31, 2010 at http://tidesandcurrents.noaa.gov/
2010. Natural Hazards Website (Tsunami data sets) Accessed March 31, 2010 at http://www.ngdc.noaa.gov/hazard/hazards.shtml
Pacific Operators Offshore. 2009. Website. Accessed online December 2009
2008. Oil Spill Resonse Plan - La Conchita Onshore Facilities. Goldberg Environmental Services.
February 2011 Carone DPP Revisions
5.8-13
2008. Oil Spill Response Plan - Platforms Hogan and Houchin and Associated Subsea Pipelines, Lease OCS-P 0166. Goldberg Environmental Services. August 2008.
2009. Application to California State Lands Commission to Develop Oil and Gas Leases.
Redfield, A. C. 1958. The Biological Control of Chemical Factors in the Environment
Santa Barbara County. 2009. Planning and Development, Energy Division Map accessed online December 2009 at http://ocsenergy.anl.gov/documents/maps/Southern_California_Plan_Area.pdf
Southern California Coastal Ocean Observing System (SCCOOS) Website accessed online on March 34, 2010 at http://sccoos.ucsd.edu/interactive-map/.
University of California Santa Barbara (UCSB). 2010. Ocean Surface Currents Mapping Project website located at http://www.icess.ucsb.edu/iog/realtime/72hr.php
United States Geological Survey. 1976. Final Environmental Impact Statement Oil and Gas Development in the Santa Barbara Channel Outer Continental Shelf Off California.
Venoco, Inc. 2005. Cavern Point Unit Environmental Analysis (Final).
February 2011 Carone DPP Revisions
5.9-1
5.9 AIR QUALITY
This section describes the environmental and regulatory settings related to air quality in the Project area, identifies air quality impacts and provides possible measures to reduce any potential impact.
5.9.1 Regional Overview
The proposed project is located within the South Central Coast Air Basin in southeastern Santa Barbara County (Platform Hogan and Houchin) and northwestern Ventura County (La Conchita processing facility), and therefore falls under the jurisdiction both the Santa Barbara County Air Pollution Control District (SBAPCD) and the Ventura County Air Pollution Control District (VCAPCD). The project area has a Mediterranean climate characterized by mild winters, when most rainfall occurs, and warm, dry summers. The influence of the Pacific Ocean causes mild temperatures year-round along the coast, while inland areas experience a wider range of temperatures. Table 5.9-1 summarizes the weather data collected at the Santa Barbara weather station that keeps weather data collected since 1971 and is the closest station to the project area.
Table 5.9-1. Weather Conditions in the Project Area (1971-2000)
Parameter Value
Mean max Temperature, ºF 65.5-76.7
Mean min Temperature, ºF 42.9-57.9
Prevailing Wind Direction W, WSW
Average Annual Precipitation, Inches 18.6
Precipitation Range, inches 0.02 (July) - 4.00 (January) Source: Western Regional Climate Center 2004
Precipitation is confined primarily to winter months. Occasionally, tropical air masses result in rainfall during the summer months. Annual precipitation in the region varies widely over relatively short distances mainly because of topographical effects. The long-term annual total precipitation along the coast is approximately 17.7 inches, but totals on mountain tops can be significantly higher.
The regional climate is dominated by a strong and persistent high-pressure system, the Pacific High, which frequently lies off the Pacific Coast. The Pacific High shifts northward or southward in response to seasonal changes or the presence of cyclonic storms. In its usual position to the west, the Pacific High produces an elevated temperature inversion. An inversion is characterized by a layer of warmer air above cooler air near the ground surface. Normally, air temperatures decrease with altitude. In an inversion, the temperature of the air increases with altitude. The inversion acts like a lid on the cooler air mass near the ground, preventing
February 2011 Carone DPP Revisions
5.9-2
pollutants in the lower air mass from dispersing upward beyond the inversion “lid.” This phenomenon results in higher concentrations of pollutants trapped below the inversion.
Airflow plays a significant role in the dispersal of pollutants. Local winds are normally controlled by the location of the Pacific High. Typical wind speeds in the area are generally light, which is another factor that contributes to higher concentrations of pollutants because low wind speeds minimize dispersion of pollutants. The sea breeze is typically from the northwest throughout the year; however, local topography causes variations. During summer months, these northwesterly winds are stronger and persist later into the night. When the Pacific High weakens, a Santa Ana condition can develop with air traveling westward toward the coast from the warmer desert regions eastward. Stagnant air often occurs following a Santa Ana condition, causing a buildup of pollutants offshore. A more detailed discussion of wind and weather is presented in Section 5.7 - Weather and Meteorology.
5.9.2 Air Quality
Air quality is determined by measuring ambient concentrations of air pollutants that are known to have adverse health effects. For regulatory purposes, standards have been established for some of these air pollutants, and they are referred to as “criteria pollutants.” For most criteria pollutants, regulations and standards have been in effect in varying degrees, for more than 25 years, and control strategies are designed to ensure that the ambient concentrations do not exceed certain thresholds. Regulatory air quality standards are based on scientific and medical research. These standards establish minimum concentration of an air pollutant in the ambient air that result in adverse health effects.
Another class of air pollutants that is subject to regulatory requirements is called hazardous air pollutants (HAPs) or air toxics. Substances that are especially harmful to health, such as those considered under the United States Environmental Protection Agency’s (EPA) hazardous air pollutant program or California’s AB 1807 and/or AB 2588 air toxics programs, are considered to be air toxics. The regulatory process for air toxic emissions usually assesses the potential impacts to public health in terms of “risk,” such as the Air Toxics “Hot Spots” Program in California, or the emissions may be controlled by prescribed technologies, as in the new Federal approach for controlling hazardous air pollutants.
The degree of air quality degradation for criteria pollutants is determined by comparing the ambient pollutant concentrations to health-based standards developed by government agencies. The current National Ambient Air Quality Standards (NAAQS) and the California Ambient Air Quality Standards (CAAQS) for “criteria pollutants” are listed in Table 5.9-2.
February 2011 Carone DPP Revisions
5.9-3
Table 5.9-2 Ambient Air Quality Standards for Criteria Pollutants
Pollutant Averaging Time State Standard Federal Standard
Ozone (O3) 1-Hour
8-Hour
0.09 ppm (180 µg/m3)
0.070 ppm* (137 µg/m3)
---
0.075 ppm (147 µg/m3)
Carbon Monoxide (CO) 1-Hour
8-Hour
20 ppm (23 mg/m3)
9.0 ppm (10 mg/m3)
35 ppm (40 mg/m3)
9.0 ppm (10 mg/m3)
Nitrogen Dioxide (NO2) 1-Hour
Annual Arithmetic Mean
0.18 ppm (339 µg/m3)
0.03 ppm (57 µg/m3)
---
0.053 ppm (100 µg/m3)
Inhalable Particulate Matter (PM2.5)
24-Hour
Annual Arithmetic Mean
No separate state standard
12 µg/m3
35 µg/m3
15 µg/m3
Inhalable Particulate Matter (PM10)
24-Hour
Annual Arithmetic Mean
50 µg/m3
20 µg/m3
150 µg/m3
--
Sulfur Dioxide (SO2)
Annual Arithmetic Mean
24-Hour
1-Hour
---
0.04 ppm (105 µg/m3)
0.25 ppm (655 µg/m3)
.03 ppm (80 µg/m3)
0.14 ppm (365 µg/m3)
---
Sulfates 24-Hour 25 µg/m3 ---
Lead (Pb) 30-Day Average
Quarterly
1.5 µg/m3
---
---
1.5 µg/m3
Hydrogen Sulfide (H2S) 1-Hour 0.03 ppm (42 µg/m3) ---
Vinyl Chloride 24-Hour 0.01 ppm (26 µg/m3) ---
Visibility Reducing Particles 8-Hour
Extinction Coefficient of .23 per kilometer- visibility of 10 miles or more due to particles when relative humidity is less than 70
percent.
---
Notes: ppm = parts per million, µg/m3 = micrograms per cubic meter California 8-hour ozone standard adopted on April 28, 2005 but not in effect
Criteria pollutants are also categorized as inert or photochemically reactive, depending on their subsequent behavior in the atmosphere. By definition, inert pollutants are relatively stable, and their chemical composition remains stable as they move and diffuse through the atmosphere. However, primary photochemical pollutants may react to form secondary pollutants. For these pollutants, adverse health effects may be caused directly by the emitted pollutant or by the secondary pollutants.
5.9.2.1 Criteria Pollutants
Criteria air pollutants are those contaminants for which State and Federal ambient air quality standards have been established for the protection of public health and welfare. Criteria pollutants include: ozone (O3) carbon monoxide (CO), oxides of nitrogen (NOX), sulfur dioxide (SO2), particulate matter with a diameter of 10 microns or less (PM10) and particulate matter with a diameter of 2.5 microns or less (PM2.5).
February 2011 Carone DPP Revisions
5.9-4
Ozone (O3). Ozone (O3) is formed in the atmosphere through a series of complex photochemical reactions involving oxides of nitrogen (NOX), reactive organic gases (ROG) (also known as ROCs or reactive organic compounds), and sunlight occurring over several hours. Since ozone is not emitted directly into the atmosphere, but is formed as a result of photochemical reactions, it is classified as a secondary or regional pollutant. Because these ozone-forming reactions take time, peak ozone levels are often found downwind of major source areas. Ozone is considered a respiratory irritant and prolonged exposure can reduce lung function, aggravate asthma, and increase susceptibility to respiratory infections. Children and those with existing respiratory diseases are at greatest risk from exposure to ozone.
Carbon Monoxide (CO). Carbon monoxide (CO) is primarily formed through the incomplete combustion of organic fuels. Higher CO values are generally measured during winter when dispersion is limited by morning surface inversions. Seasonal and diurnal variations in meteorological conditions lead to lower values in summer and in the afternoon. CO is an odorless, colorless gas. CO affects red blood cells in the body by binding to hemoglobin and reducing the amount of oxygen that can be carried to the body’s organs and tissues. CO can cause health effects to those with cardiovascular disease, and also can affect mental alertness and vision.
Nitric Oxide (NO). Nitric oxide (NO) is a colorless gas formed during combustion processes which rapidly oxidize to form NO2, a brownish gas. The highest nitrogen dioxide values are generally measured in urbanized areas with heavy traffic. Exposure to NO2 may increase the potential for respiratory infections in children and cause difficulty in breathing even among healthy persons and especially among asthmatics.
Sulfur Dioxide (SO2). Sulfur dioxide (SO2) is a colorless, reactive gas that is produced from the burning of sulfur-containing fuels such as coal and oil, and by other industrial processes. Generally, the highest concentrations of SO2 are found near large industrial sources. SO2 is a respiratory irritant that can cause narrowing of the airways, leading to wheezing and shortness of breath. Long-term exposure to SO2 can cause respiratory illness and aggravate existing cardiovascular disease.
Particulate Matter (PM). Ambient air quality standards have been set for two classes of particulate matter: PM10 (coarse particulate matter less than 10 microns in aerodynamic diameter) and PM2.5 (fine particulate matter 2.5 microns or less in aerodynamic diameter). Both consist of different types of particles suspended in the air, such as: metal, soot, smoke, dust and fine mineral particles. Depending on the source of particulates, toxicity and chemical activity can vary. Particulate matter is a health concern because when inhaled it can cause permanent damage the lungs. The primary source of PM10 emissions appears to be soil via roads, construction, agriculture, and natural windblown dust. Other sources of PM10 include sea salt, particulate matter released during combustion processes, such as those in gasoline or diesel vehicles, and wood burning. Fugitive emissions from construction sites, wood stoves, fireplaces and diesel truck exhaust are primary sources of PM2.5. Both sizes of particulates can be dangerous when inhaled, however PM2.5 tends to be more damaging because it remains in the lungs once it is inhaled.
February 2011 Carone DPP Revisions
5.9-5
5.9.2.2 Toxic Air Contaminants
A toxic air contaminant (TAC) is an air pollutant, identified in regulation by the California Air Resources Board (CARB), which may cause or contribute to an increase in deaths or in serious illness, or which may pose a present or potential hazard to human health. TACs are considered under a different regulatory process (California Health and Safety Code Section 39650 et seq.) than pollutants subject to CAAQSs. Health effects to TACs may occur at extremely low levels, and it is typically difficult to identify levels of exposure which do not produce adverse health effects (CARB, 2010).
5.9.2.3 Greenhouse Gases
Greenhouse gases (GHGs) are defined as any gas that absorbs infrared radiation in the atmosphere. Greenhouse gases include, but are not limited to, water vapor, carbon dioxide (CO2), methane (CH4), and nitrous oxide (N2O). These GHGs lead to the trapping and buildup of heat in the atmosphere near the earth’s surface, commonly known as the Greenhouse Effect. There is increasing evidence that the Greenhouse Effect is leading to global climate change.
The primary source of GHGs in the United States are energy-use related activities, which include fuel combustion, as well as energy production, transmission, storage and distribution. These energy related activities generated 85 percent of the total U.S. emissions on a carbon equivalent basis in 1998 and 86 percent in 2004. Fossil fuel combustion represents the vast majority of the energy related GHG emissions, with CO2 being the primary GHG. Both the legislation and California Climate Action Team (CCAT) currently estimate that the solid waste industry, particularly landfills, is a significant source of the total net GHG emissions in California and should be a major focus of any efforts to reduce GHG emissions.
5.9.3 Regulatory Overview
Section 328 of the Clean Air Act Amendments (CAAA) of 1990 transferred authority to regulate stationary sources of air pollution on the Pacific OCS from the Minerals Management Service (MMS) (now BOEMRE) to the Environmental Protection Agency (EPA). Section 328 of the Act requires that the EPA establish requirements to control air pollution from Pacific OCS sources located within 25 miles of state’s seaward boundaries that are the same as onshore requirements. The EPA promulgated 40 CFR Part 55 requiring Pacific OCS sources to be in full compliance with provisions of the OCS Air Regulations. EPA designated applicable onshore air agencies as the Corresponding Onshore Area (COA) for purposes of establishing requirements to control air pollution from POCS sources in order to attain and maintain federal and state ambient air quality standards.
Ventura County is presently in attainment of most ambient air quality standards, but does not attain the national and state standards for ozone and the state standard for particulate matter (PM10). The Ventura County Air Pollution Control District (VCAPCD) is responsible for regulating stationary air emission sources within the County jurisdiction. The VCAPCD does not consider construction emissions to be significant for the purposes of CEQA review, as these emissions have already been considered in the ozone attainment planning process.
February 2011 Carone DPP Revisions
5.9-6
Santa Barbara County is located within the South Central Coast Air Basin (SCCAB). In addition to Santa Barbara County, the SCCAB includes San Luis Obispo County and Ventura County. Regulation of air quality within the Project area is presided over by the Santa Barbara County Air Pollution Control District (SBCAPCD). The SBCAPCD is responsible for monitoring air quality levels in compliance with Federal and State regulations. According to the SBCAPCD (2009), Santa Barbara County is currently in attainment of Federal 8-hour ozone standards as well as State 1-hour ozone standards. However, Santa Barbara County is designated as a non-attainment for State 8-hour ozone standard and State Particulate matter (PM10). Please refer to Table 5.9-1 for a summary of Federal and State air quality standards.
5.9.3.1 Federal Regulations
Federal Clean Air Act (CAA). The Clean Air Act (CAA) was first enacted in 1955 and has been amended numerous times in subsequent years (1963, 1965, 1967, 1970, 1977, and 1990). The CAA establishes Federal air quality standards, known as National Ambient Air Quality Standards (NAAQS), and specifies future dates for achieving compliance. The CAA also mandates that the state submit and implement a State Implementation Plan (SIP) for local areas not meeting those standards. The plans must include pollution control measures that demonstrate how the standards will be met.
The 1990 amendments to the CAA identify specific emission-reduction goals for areas not meeting the NAAQS. These amendments require both a demonstration of reasonable further progress toward attainment and incorporation of additional sanctions for failure to attain or meet interim milestones. The sections of the CAA that would most substantially affect the development of the proposed Project include Title I (Nonattainment Provisions) and Title II (Mobile-Source Provisions).
Title I provisions were established with the goal of attaining the NAAQS for criteria pollutants. The NAAQS were amended in July 1997 to include an 8-hour standard for O3 and adopt a NAAQS for fine particulate matter (PM2.5). Refer to Table 5.2-1 for a summary of Federal air quality standards.
In January 2010, the EPA proposed strengthening the 8-hour “primary” ozone standard, designed to protect public health, to a level within the range of 0.060-0.070 parts per million (ppm). The EPA is also proposing to establish a distinct cumulative, seasonal “secondary” standard, designed to protect sensitive vegetation and ecosystems. The proposed level for this secondary standard is between 7-15 ppm-hours. In December 2010, The Clean Air Scientific Advisory Committee (CASAC) was asked for further interpretation of the studies they used to make their recommendation. The EPA intends to set a final standard in the range recommended by the CASAC by the end of July, 2011.
Mandatory Reporting of Greenhouse Gases Rule. In response to the FY2008 Consolidated Appropriations Act (H.R. 2764; Public Law 110–161), EPA promulgated the Mandatory Reporting of Greenhouse Gases Rule. The rule requires reporting of greenhouse gas (GHG) emissions from large sources and suppliers in the United States, and is intended to collect accurate and timely emissions data to inform future policy decisions. Under the rule,
February 2011 Carone DPP Revisions
5.9-7
suppliers of fossil fuels or industrial greenhouse gases, manufacturers of vehicles and engines, and facilities that emit 25,000 metric tons or more per year of GHG emissions are required to submit annual reports to Environmental Protection Agency (EPA, 2010). The rule does not require control of greenhouse gases, rather it requires only that sources above certain threshold levels monitor and report emissions. The purpose of this rule is to insure accurate and timely information on GHG emissions, because accurate reporting is essential for informing many future climate change policy decisions.
Greenhouse gases (GHGs) are defined as any gas that absorbs infrared radiation in the atmosphere. Greenhouse gases include, but are not limited to, water vapor, carbon dioxide (CO2), methane (CH4), and nitrous oxide (N2O). These greenhouse gases lead to the trapping and buildup of heat in the atmosphere near the earth’s surface, commonly known as the Greenhouse Effect. There is increasing evidence that the Greenhouse Effect is leading to global climate change. The primary source of GHG in the United States is energy-use related activities, which include fuel combustion, as well as energy production, transmission, storage and distribution. These energy related activities generated 85 percent of the total U.S. emissions on a carbon equivalent basis in 1998 and 86 percent in 2004. Fossil fuel combustion represents the vast majority of the energy related GHG emissions, with CO2 being the primary GHG. Both the legislation and California Climate Action Team (CCAT) currently estimate that the solid waste industry, particularly landfills, is a significant source of the total net GHG emissions in California and should be a major focus of any efforts to reduce GHG emissions.
5.9.3.2 State Regulations
California Air Resources Control Board (CARB). The CARB established the CAAQS. Comparison of the criteria pollutant concentrations in ambient air to the CAAQS determines State attainment status for criteria pollutants in a given region. CARB has jurisdiction over all air pollutant sources in the State; it has delegated to local air districts the responsibility for stationary sources and has retained authority over emissions from mobile sources. The CARB, in partnership with the local air quality management districts within California, has developed a pollutant monitoring network to aid in the attainment of the CAAQS. The network consists of numerous monitoring stations located throughout California that monitor and report various pollutants’ concentrations in ambient air.
California Health and Safety Code, Division 26. This division went into effect on January 1, 1989, and mandates achieving the health-based CAAQS at the earliest practical date.
California Health and Safety Code, Division 26, Part 6. This division requires an inventory of air toxics from individual facilities, and assessment of health risk, and notification of potential significant health risk.
California Health and Safety Code Sections 25531-25543. These sections set forth changes in the following four areas: (1) provides guidelines to identify more realistic health risk; (2) requires high-risk facilities to submit an air toxic emission reduction plan; (3) holds air
February 2011 Carone DPP Revisions
5.9-8
pollution control districts accountable for ensuring that the plans will achieve their objectives; and (4) requires high-risk facilities to achieve their planned emission reductions.
Statewide Portable Equipment Registration Program (PERP). The Portable Equipment Registration Program (PERP) establishes a uniform program to regulate portable engines and portable engine-driven equipment units (CARB, 2005). Once registered in the PERP, engines and equipment units may operate throughout California without the need to obtain individual permits from local air districts. The PERP generally would apply to shore end and land-based construction equipment such as generators, compressors and power winches. Refer to Table 5.2-1 above for a summary of State air quality standards.
Climate Change Concerns
California Global Warming Solutions Act of 2006 (AB-32). The California Global Warming Solutions Act (AB-32) requires that the State cap GHG emissions at 1990 levels by the year 2020. AB-32 requires that the CARB establish a program for State-wide GHG emission reporting and to monitor and enforce compliance with the program. The regulatory steps established by AB-32 required the CARB to:
Adopt early action measures to reduce GHG emissions;
Establish a state-wide GHG emissions cap for the year 2020 based on 1990 missions levels;
Develop mandatory reporting rules for significant sources of GHG emissions;
Adopt a scoping plan indicating how emissions reductions will be achieved via regulations, market mechanisms and other actions; and
Adopt the regulations needed to achieve the maximum technologically feasible and cost-effective reductions in GHGs.
Following Executive Order S-3-05 in June 2005, which declared California’s particular vulnerability to climate change, the California Global Warming Solutions Act of 2006 (AB-32) was signed by Governor Arnold Schwarzenegger on September 27, 2006. In passing the bill, the California Legislature found that global climate change “poses a serious threat to the economic well-being, public health, natural resources, and the environment of California. The potential adverse impacts of global warming include the exacerbation of air quality problems, a reduction in the quality and supply of water to the state from the Sierra snowpack, a rise in sea levels resulting in the displacement of thousands of coastal businesses and residences, damage to marine ecosystems and the natural environment, and an increase in the incidences of infectious diseases, asthma, and other human health-related problems” (California Health & Safety Code, Division 25.5, Part 1).
In response to global climate change, AB-32 requires the CARB to adopt a statewide GHG emissions limit equivalent to the statewide GHG emissions levels in 1990 to be achieved by 2020 and requires the CARB to adopt rules and regulations to achieve the maximum technologically feasible and cost-effective GHG emission reductions.
February 2011 Carone DPP Revisions
5.9-9
In June 2008, CARB developed a Draft Scoping Plan for Climate Change, pursuant to AB-32. This Draft Scoping Plan proposes a comprehensive set of actions designed to reduce overall carbon emissions in California, improve our environment, reduce our dependence on oil, diversify our energy sources, save energy, and enhance public health while creating new jobs and enhancing the growth in California’s economy. Key elements of the Scoping Plan for reducing California’s greenhouse gas emissions to 1990 levels by 2020 include:
Expansion and strengthening of existing energy efficiency programs and building and appliance standards;
Expansion of the Renewables Portfolio Standard to 33 percent;
Development of a California cap-and-trade program that links with other Western climate Initiative Partner programs to create a regional market system;
Implementation of existing State laws and policies, including California’s clean car standards, goods movement measures, and the Low Carbon Fuel Standard; and
Targeted fees to fund the State’s long-term commitment to AB 32 administration.
Senate Bill 97, enacted in 2007, amends the CEQA statute to clearly establish that greenhouse gas emissions and the effects of GHG emissions are appropriate for CEQA analysis. It directs the California Office of Planning and Research (OPR) to develop guidelines addressing the analysis and mitigation of greenhouse gas emissions by July 1, 2009 and for the California Resources Agency to certify and adopt the CEQA Guidelines by January 1, 2010.
In October 2008, the CARB created a Preliminary Draft Staff Proposal - Recommended Approaches for Setting Interim Significance Thresholds for Greenhouse Gases under the California Environmental Quality Act. In this document the CARB discusses the dangers of global climate change and the need for a defined set of significance thresholds for operations, construction and transportation; and provides a preliminary proposal for a threshold of significance for GHG emissions. The threshold consists of a quantitative threshold of 7,000 metric tons of CO2 equivalent per year (MTCO2E/year) for operational emissions (excluding transportation), and performance standards for construction and transportation emissions. The goal of this effort is to provide for the mitigation of GHG emissions from industrial projects on a statewide level. Over time, implementation of AB-32 will reduce or mitigate GHG emissions from industrial sources.
5.9.3.3 Local Regulations
Ventura County
The VCAPCD has jurisdiction over air quality attainment in the Ventura County portion of the South Central Coast Air Basin (SCCAB). All aspects of the project occurring in Ventura County must obtain a VCAPCD permit, if applicable. The most important applicable rules are summarized below.
February 2011 Carone DPP Revisions
5.9-10
Rule 10, Permits Required – Specifies that permits required for construction or operation of equipment that emits air contaminants.
Rule 23, Exemptions from Permit – Specifies what equipment is exempt from obtaining an air permit. Listed below are some exempt equipment/emission sources that do not require a permit and are applicable to the La Conchita Facility.
Emergency internal combustion engines, as follows; spark-ignited internal combustion engines used exclusively for the emergency pumping of water for fire protection.
Organic compounds emissions from:
o Products used for facility, grounds, and building maintenance and repair, including solvents, coatings, adhesives, lubricants and sealants;
o Oilfield wastewater sumps, pits or ponds, where the ROC content of the wastewater entering the sump, pit or pond is less than 5 milligrams per liter; and
o Valves and flanges.
Rule 33-10, Part 70 Permits – Specifies sources that require the issuance of a Federal Part 70 permit.
Rule 35, Elective Emissions Limits – Pursuant to this rule, in order to avoid the applicability of Rule 33-10, and owner or operator may elect to request federally enforceable permit conditions that result in specific emission limits.
The Ventura County General Plan (Ventura County, 2005) contains the following policies that pertain to air quality:
Discretionary development that is inconsistent with the Air Quality Management Plan (2007) shall be prohibited, unless overriding considerations are cited by the decisions making body.
The air quality impacts of a discretionary development shall be evaluated by use of the Guidelines for the Preparation of Air Quality Impact Analysis.
Discretionary development that would have a significant adverse air quality impact shall be approved only if it is conditioned with all reasonable mitigation measures to avoid, minimize, offset or compensate for the air quality impact. Developers shall be encouraged to employ innovative methods and technologies to minimize air pollution impacts.
Where deemed necessary by the APCD, discretionary development shall be conditioned to develop, implement, and maintain over time Transportation Demand Management (TDM) programs consistent with the APCD’s trip reduction rule (210). TDM programs shall include a requirement for annual performance reporting to and approval by the APCD.
February 2011 Carone DPP Revisions
5.9-11
Development subject to APCD permit authority shall comply with all applicable APCD rules and permit requirements, including the use of BACT, as determined by the APCD.
Santa Barbara County
The SBCAPCD has jurisdiction over air quality attainment in the Santa Barbara County portion of the SCCAB. All aspects of the proposed project occurring in Santa Barbara County must obtain a SBCAPCD permit, if applicable. The SBCAPCD also has jurisdiction over Outer Continental Shelf (OCS) sources located within 25 miles of the seaward boundaries of the State of California (Rule 903). Increases in emissions of any non-attainment pollutant or is precursor from a new or modified project that exceed the thresholds identified in the 2007 Clean Air Plan are required to be mitigated. Discussion of the Clean Air Plan and other applicable rules are summarized below.
The 2010 Clean Air Plan (SBCAPCD, 2011) was approved by the APCD Board in January 2011 and has been submitted to CARB for approval. The 2010 Clean Air Plan was being prepared to address both federal and state requirements. The federal requirements pertain to provisions of the Federal Clean Air Act that apply to the current Santa Barbara County designation as an attainment area for the federal 8-hour ozone standard. Areas that are designated as attainment for the federal 8-hour ozone standard and attainment for the previous federal 1-hour ozone standard with an approved maintenance plan must submit an 8-hour maintenance plan under section 110(a)(1).
The California Clean Air Act mandates under Health and Safety Code sections 40924 and 40925 require that every three years areas update their clean air plans to attain the state 1-hour ozone standard. More specifically, the 2010 Clean Air Plan provides and three-year update to the APCD’s 2007 Clean Air Plan. Recently, Santa Barbara County was declared by the CARB to be in attainment for the state 1-hour ozone standard which is more protective of public health.
Rule 201, Permits Required – Specifies the permits required for construction or operation of equipment that emits air contaminants.
Rule 202, Exemptions to Rule 201 – Lists equipment categories that are exempt from the requirements to obtain an APCD permit (exempt from Rule 201). Listed below are some equipment categories listed in Rule 201 that are applicable to Platform Hogan:
A permit shall not be required for piston-type internal combustion engines used exclusively for emergency electrical power generation or emergency pumping of water for [...] firefighting if the engine operates no more than 200 hours per calendar year, and where a record is maintained and is available to the SBCAPCD upon request; the record shall list the identification number of the equipment, the number of operating hours on each day the engine is operated, and the cumulative total hours.
February 2011 Carone DPP Revisions
5.9-12
A permit shall not be required for piston-type internal combustion engines with a manufacturer’s maximum rating of 100 brake horse power (bhp) or less.
A permit shall not be required for drilling equipment used in State waters or in the OCS provided the emissions from such equipment are less than 25 tons per stationary source of any affected pollutant during any consecutive 12-month period.
Rule 802, Nonattainment Review – For new or modified emission sources, this rule specifies emission limits that would trigger offsets and Best Available Control Technology (BACT) requirements.
5.9.4 Potential Environmental Impacts
5.9.4.1 Thresholds of Significance
Ventura County
In October 2003, the Ventura County APCD revised the Ventura County Air Quality Assessment Guidelines (Guidelines), which include project-specific thresholds that should not be exceeded to ensure consistency with the AQMP and minimize public exposure to pollutants:
Conflict with or obstruct implementation of the Air Quality Management Plan (AQMP);
Violate any air quality standard or contribute to an existing or projected air quality violation;
Result in a cumulatively considerable net increase of any criteria non-attainment pollutant;
Expose the public (especially schools, day care centers, hospitals, retirement homes, convalescent facilities and residences) to substantial pollutant concentrations; and
Create objectionable odors affecting a substantial number of people.
A considerable net increase of ozone precursors (a non-attainment pollutant) is considered 25 pounds per day of reactive organic gases (ROG) and oxides of nitrogen (NOX).
Santa Barbara County
As stipulated in the Santa Barbara County Environmental Thresholds and Guidelines Manual: Air Quality Thresholds, a significant adverse air quality impact may occur when a project, individually or cumulatively, triggers any one of the following:
Interferes with progress toward the attainment of the ozone standard by releasing emissions which equal or exceed the established long-term quantitative thresholds for NOX and ROC;
Equals or exceeds the state or federal ambient air quality standards for any criteria pollutant (as determined by modeling);
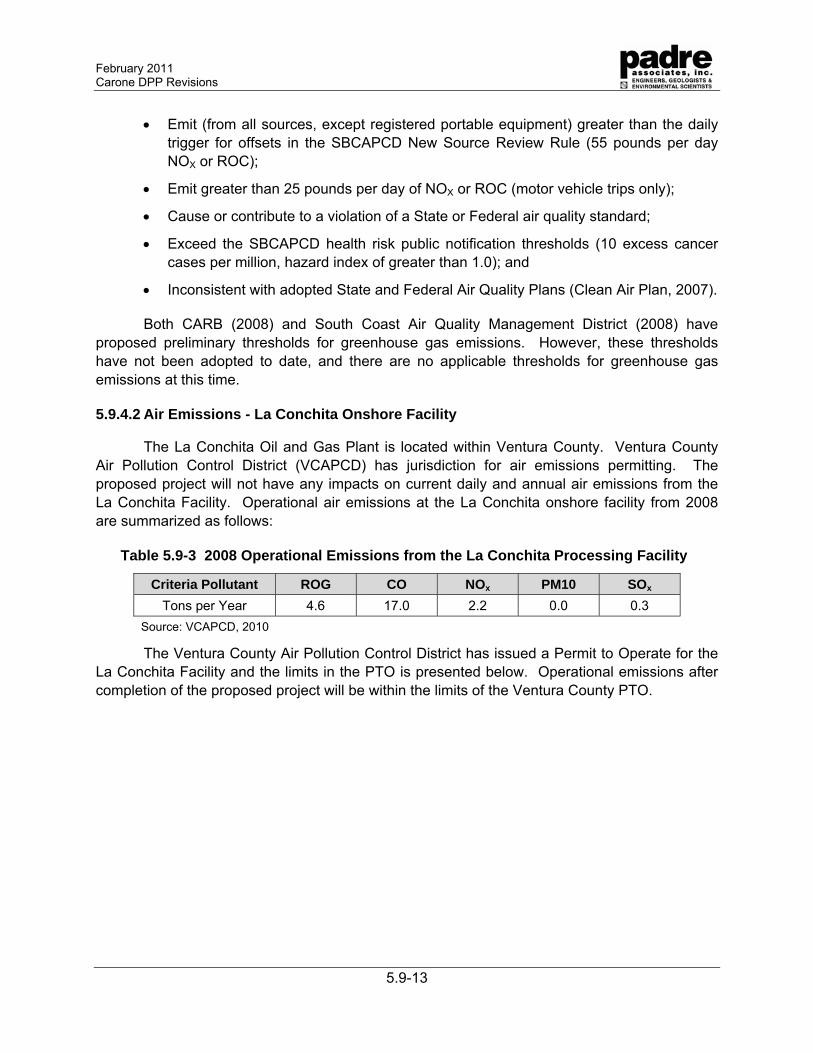
February 2011 Carone DPP Revisions
5.9-13
Emit (from all sources, except registered portable equipment) greater than the daily trigger for offsets in the SBCAPCD New Source Review Rule (55 pounds per day NOX or ROC);
Emit greater than 25 pounds per day of NOX or ROC (motor vehicle trips only);
Cause or contribute to a violation of a State or Federal air quality standard;
Exceed the SBCAPCD health risk public notification thresholds (10 excess cancer cases per million, hazard index of greater than 1.0); and
Inconsistent with adopted State and Federal Air Quality Plans (Clean Air Plan, 2007).
Both CARB (2008) and South Coast Air Quality Management District (2008) have proposed preliminary thresholds for greenhouse gas emissions. However, these thresholds have not been adopted to date, and there are no applicable thresholds for greenhouse gas emissions at this time.
5.9.4.2 Air Emissions - La Conchita Onshore Facility
The La Conchita Oil and Gas Plant is located within Ventura County. Ventura County Air Pollution Control District (VCAPCD) has jurisdiction for air emissions permitting. The proposed project will not have any impacts on current daily and annual air emissions from the La Conchita Facility. Operational air emissions at the La Conchita onshore facility from 2008 are summarized as follows:
Table 5.9-3 2008 Operational Emissions from the La Conchita Processing Facility
Criteria Pollutant ROG CO NOx PM10 SOx
Tons per Year 4.6 17.0 2.2 0.0 0.3
Source: VCAPCD, 2010
The Ventura County Air Pollution Control District has issued a Permit to Operate for the La Conchita Facility and the limits in the PTO is presented below. Operational emissions after completion of the proposed project will be within the limits of the Ventura County PTO.
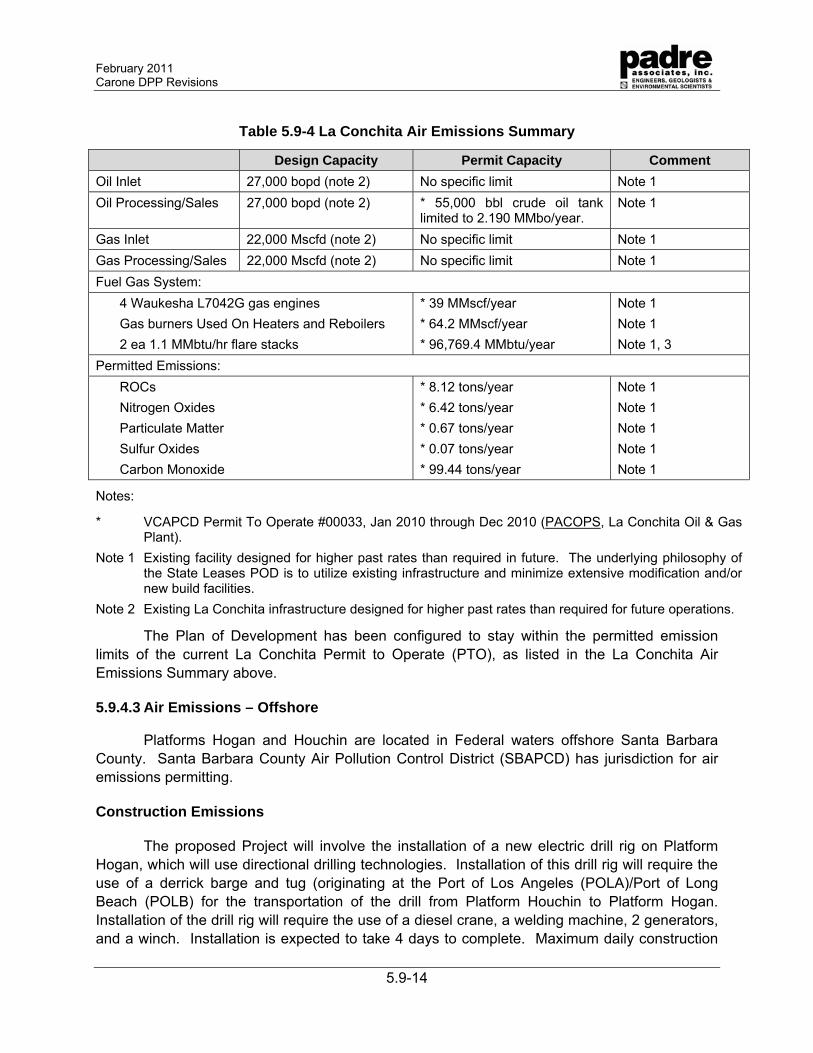
February 2011 Carone DPP Revisions
5.9-14
Table 5.9-4 La Conchita Air Emissions Summary
Design Capacity Permit Capacity Comment
Oil Inlet 27,000 bopd (note 2) No specific limit Note 1
Oil Processing/Sales 27,000 bopd (note 2) * 55,000 bbl crude oil tank limited to 2.190 MMbo/year.
Note 1
Gas Inlet 22,000 Mscfd (note 2) No specific limit Note 1
Gas Processing/Sales 22,000 Mscfd (note 2) No specific limit Note 1
Fuel Gas System:
4 Waukesha L7042G gas engines
Gas burners Used On Heaters and Reboilers
2 ea 1.1 MMbtu/hr flare stacks
* 39 MMscf/year
* 64.2 MMscf/year
* 96,769.4 MMbtu/year
Note 1
Note 1
Note 1, 3
Permitted Emissions:
ROCs
Nitrogen Oxides
Particulate Matter
Sulfur Oxides
Carbon Monoxide
* 8.12 tons/year
* 6.42 tons/year
* 0.67 tons/year
* 0.07 tons/year
* 99.44 tons/year
Note 1
Note 1
Note 1
Note 1
Note 1
Notes:
* VCAPCD Permit To Operate #00033, Jan 2010 through Dec 2010 (PACOPS, La Conchita Oil & Gas Plant).
Note 1 Existing facility designed for higher past rates than required in future. The underlying philosophy of the State Leases POD is to utilize existing infrastructure and minimize extensive modification and/or new build facilities.
Note 2 Existing La Conchita infrastructure designed for higher past rates than required for future operations.
The Plan of Development has been configured to stay within the permitted emission limits of the current La Conchita Permit to Operate (PTO), as listed in the La Conchita Air Emissions Summary above.
5.9.4.3 Air Emissions – Offshore
Platforms Hogan and Houchin are located in Federal waters offshore Santa Barbara County. Santa Barbara County Air Pollution Control District (SBAPCD) has jurisdiction for air emissions permitting.
Construction Emissions
The proposed Project will involve the installation of a new electric drill rig on Platform Hogan, which will use directional drilling technologies. Installation of this drill rig will require the use of a derrick barge and tug (originating at the Port of Los Angeles (POLA)/Port of Long Beach (POLB) for the transportation of the drill from Platform Houchin to Platform Hogan. Installation of the drill rig will require the use of a diesel crane, a welding machine, 2 generators, and a winch. Installation is expected to take 4 days to complete. Maximum daily construction
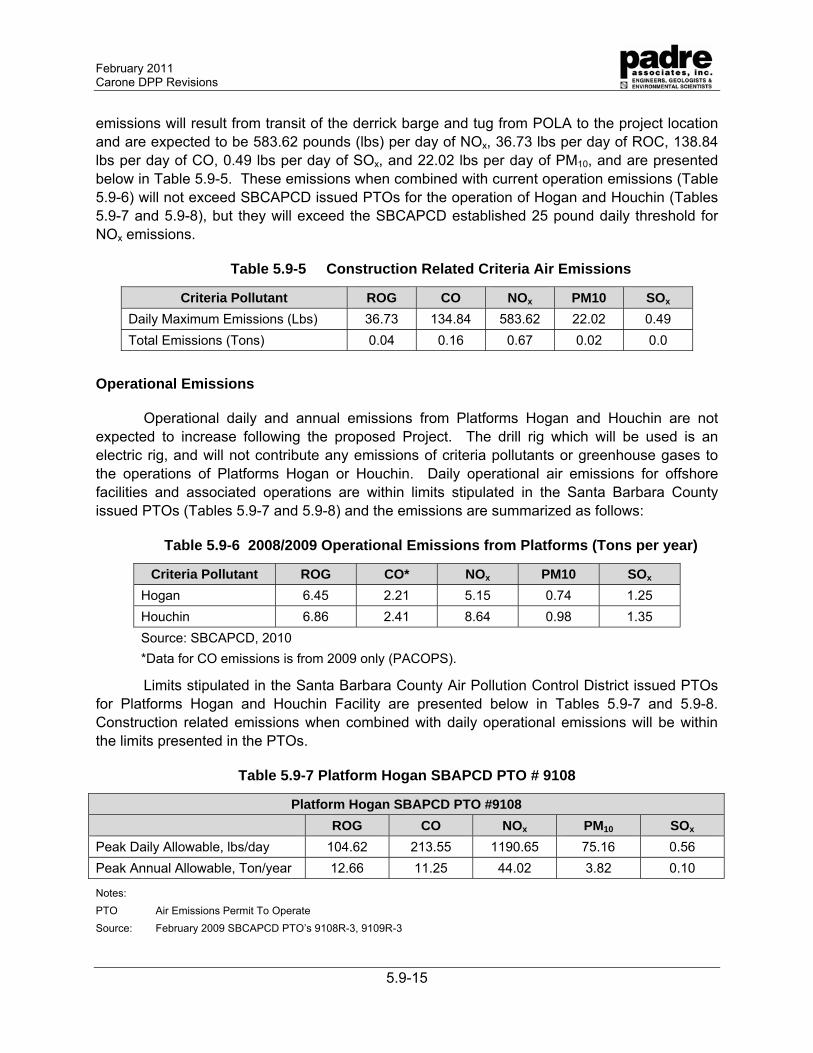
February 2011 Carone DPP Revisions
5.9-15
emissions will result from transit of the derrick barge and tug from POLA to the project location and are expected to be 583.62 pounds (lbs) per day of NOx, 36.73 lbs per day of ROC, 138.84 lbs per day of CO, 0.49 lbs per day of SOx, and 22.02 lbs per day of PM10, and are presented below in Table 5.9-5. These emissions when combined with current operation emissions (Table 5.9-6) will not exceed SBCAPCD issued PTOs for the operation of Hogan and Houchin (Tables 5.9-7 and 5.9-8), but they will exceed the SBCAPCD established 25 pound daily threshold for NOx emissions.
Table 5.9-5 Construction Related Criteria Air Emissions
Criteria Pollutant ROG CO NOx PM10 SOx
Daily Maximum Emissions (Lbs) 36.73 134.84 583.62 22.02 0.49
Total Emissions (Tons) 0.04 0.16 0.67 0.02 0.0
Operational Emissions
Operational daily and annual emissions from Platforms Hogan and Houchin are not expected to increase following the proposed Project. The drill rig which will be used is an electric rig, and will not contribute any emissions of criteria pollutants or greenhouse gases to the operations of Platforms Hogan or Houchin. Daily operational air emissions for offshore facilities and associated operations are within limits stipulated in the Santa Barbara County issued PTOs (Tables 5.9-7 and 5.9-8) and the emissions are summarized as follows:
Table 5.9-6 2008/2009 Operational Emissions from Platforms (Tons per year)
Criteria Pollutant ROG CO* NOx PM10 SOx
Hogan 6.45 2.21 5.15 0.74 1.25
Houchin 6.86 2.41 8.64 0.98 1.35
Source: SBCAPCD, 2010
*Data for CO emissions is from 2009 only (PACOPS).
Limits stipulated in the Santa Barbara County Air Pollution Control District issued PTOs for Platforms Hogan and Houchin Facility are presented below in Tables 5.9-7 and 5.9-8. Construction related emissions when combined with daily operational emissions will be within the limits presented in the PTOs.
Table 5.9-7 Platform Hogan SBAPCD PTO # 9108
Platform Hogan SBAPCD PTO #9108
ROG CO NOx PM10 SOx
Peak Daily Allowable, lbs/day 104.62 213.55 1190.65 75.16 0.56
Peak Annual Allowable, Ton/year 12.66 11.25 44.02 3.82 0.10
Notes:
PTO Air Emissions Permit To Operate
Source: February 2009 SBCAPCD PTO’s 9108R-3, 9109R-3
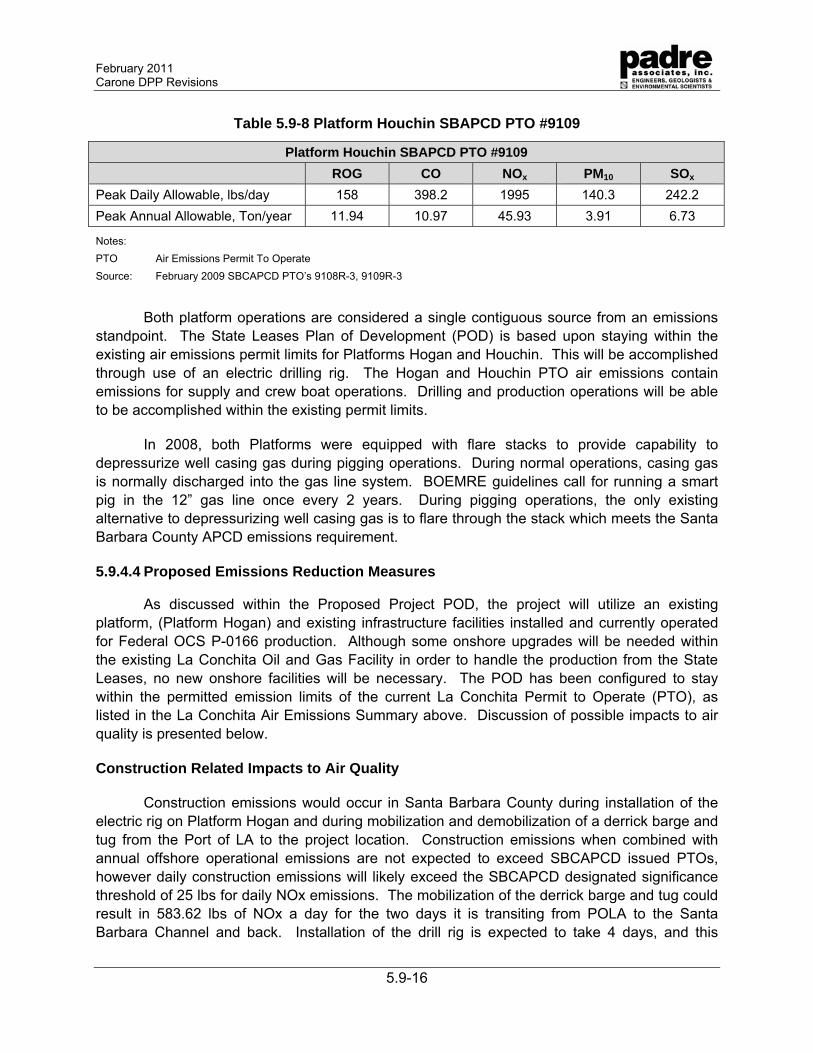
February 2011 Carone DPP Revisions
5.9-16
Table 5.9-8 Platform Houchin SBAPCD PTO #9109
Platform Houchin SBAPCD PTO #9109
ROG CO NOx PM10 SOx
Peak Daily Allowable, lbs/day 158 398.2 1995 140.3 242.2
Peak Annual Allowable, Ton/year 11.94 10.97 45.93 3.91 6.73
Notes:
PTO Air Emissions Permit To Operate
Source: February 2009 SBCAPCD PTO’s 9108R-3, 9109R-3
Both platform operations are considered a single contiguous source from an emissions standpoint. The State Leases Plan of Development (POD) is based upon staying within the existing air emissions permit limits for Platforms Hogan and Houchin. This will be accomplished through use of an electric drilling rig. The Hogan and Houchin PTO air emissions contain emissions for supply and crew boat operations. Drilling and production operations will be able to be accomplished within the existing permit limits.
In 2008, both Platforms were equipped with flare stacks to provide capability to depressurize well casing gas during pigging operations. During normal operations, casing gas is normally discharged into the gas line system. BOEMRE guidelines call for running a smart pig in the 12” gas line once every 2 years. During pigging operations, the only existing alternative to depressurizing well casing gas is to flare through the stack which meets the Santa Barbara County APCD emissions requirement.
5.9.4.4 Proposed Emissions Reduction Measures
As discussed within the Proposed Project POD, the project will utilize an existing platform, (Platform Hogan) and existing infrastructure facilities installed and currently operated for Federal OCS P-0166 production. Although some onshore upgrades will be needed within the existing La Conchita Oil and Gas Facility in order to handle the production from the State Leases, no new onshore facilities will be necessary. The POD has been configured to stay within the permitted emission limits of the current La Conchita Permit to Operate (PTO), as listed in the La Conchita Air Emissions Summary above. Discussion of possible impacts to air quality is presented below.
Construction Related Impacts to Air Quality
Construction emissions would occur in Santa Barbara County during installation of the electric rig on Platform Hogan and during mobilization and demobilization of a derrick barge and tug from the Port of LA to the project location. Construction emissions when combined with annual offshore operational emissions are not expected to exceed SBCAPCD issued PTOs, however daily construction emissions will likely exceed the SBCAPCD designated significance threshold of 25 lbs for daily NOx emissions. The mobilization of the derrick barge and tug could result in 583.62 lbs of NOx a day for the two days it is transiting from POLA to the Santa Barbara Channel and back. Installation of the drill rig is expected to take 4 days, and this
February 2011 Carone DPP Revisions
5.9-17
activity will result in approximately 164.4 lbs of NOx per day, which will also exceed the daily SBCAPCD threshold of significance for NOx. The proposed project will not exceed any annual emission thresholds of significance set by the SBCAPCD. The construction activity, and therefore impacts to air quality will be brief but could potentially have a significant impact on local air quality.
The following measures will be implemented for the proposed Project to reduce air quality impacts were possible.
Prior to and during project activity, equipment will be maintained in proper tune according to manufacturer’s specifications.
When feasible, the number of pieces of heavy-duty diesel-fueled equipment operating simultaneously during the project shall be minimized.
Catalytic converters shall be installed on gasoline-powered equipment when feasible.
Equipment meeting Tier 2 or higher emission standards will be used to the maximum extent feasible.
Engine size of equipment shall be the minimum practical size.
All portable construction equipment shall be registered with the state’s portable equipment registration program or permitted by the District by September 18, 2008.
All diesel powered equipment used during the project will be fueled with ≤15 ppm sulfur diesel fuel.
If any heavy-duty diesel-powered equipment is purchased for the project it shall comply with federal and California diesel standards that are in force at the time of purchase.
Operational Impacts to Air Quality
Both platform operations are considered a single contiguous source from an emissions standpoint. The State Leases Plan of Development (POD) is based upon staying within the existing air emissions permit limits for Hogan and Houchin. This will be accomplished through use of an electric drilling rig. The Hogan and Houchin PTO air emissions contain emissions for Supply and Crew boat operations. Drilling and production operations will be able to be accomplished within the existing permit limits. No new impacts to air quality would result, and therefore no impacts to air quality are expected as a result of changes to operations.
5.9.5 Greenhouse Gas Emissions
Currently there are no formal regulations for establishing construction thresholds for greenhouse gas emissions at the local level in the South Central Coast Air Basin. However, the California Office of Planning and Research (OPR) have prepared a technical advisory for addressing climate change issues in CEQA. The technical advisory, “CEQA and Climate Change: Addressing Climate Change through California Environmental Quality Act Review”
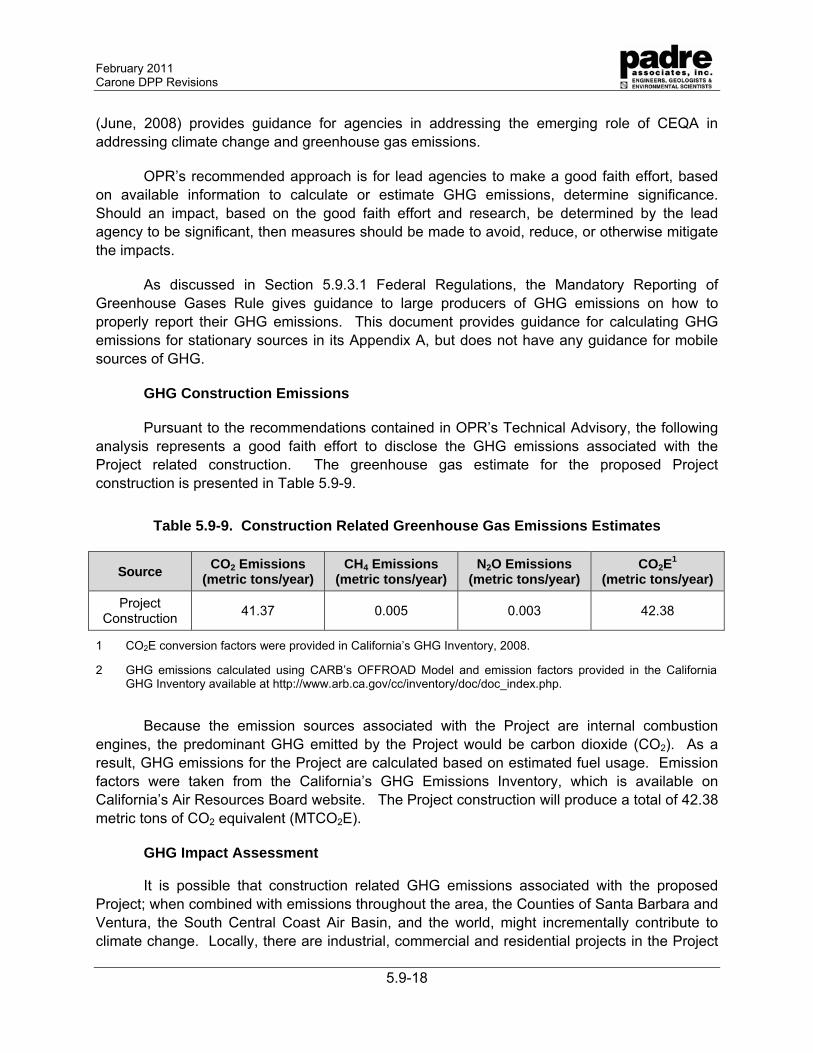
February 2011 Carone DPP Revisions
5.9-18
(June, 2008) provides guidance for agencies in addressing the emerging role of CEQA in addressing climate change and greenhouse gas emissions.
OPR’s recommended approach is for lead agencies to make a good faith effort, based on available information to calculate or estimate GHG emissions, determine significance. Should an impact, based on the good faith effort and research, be determined by the lead agency to be significant, then measures should be made to avoid, reduce, or otherwise mitigate the impacts.
As discussed in Section 5.9.3.1 Federal Regulations, the Mandatory Reporting of Greenhouse Gases Rule gives guidance to large producers of GHG emissions on how to properly report their GHG emissions. This document provides guidance for calculating GHG emissions for stationary sources in its Appendix A, but does not have any guidance for mobile sources of GHG.
GHG Construction Emissions
Pursuant to the recommendations contained in OPR’s Technical Advisory, the following analysis represents a good faith effort to disclose the GHG emissions associated with the Project related construction. The greenhouse gas estimate for the proposed Project construction is presented in Table 5.9-9.
Table 5.9-9. Construction Related Greenhouse Gas Emissions Estimates
Source CO2 Emissions
(metric tons/year) CH4 Emissions
(metric tons/year) N2O Emissions
(metric tons/year) CO2E
1 (metric tons/year)
Project Construction
41.37 0.005 0.003 42.38
1 CO2E conversion factors were provided in California’s GHG Inventory, 2008.
2 GHG emissions calculated using CARB’s OFFROAD Model and emission factors provided in the California GHG Inventory available at http://www.arb.ca.gov/cc/inventory/doc/doc_index.php.
Because the emission sources associated with the Project are internal combustion engines, the predominant GHG emitted by the Project would be carbon dioxide (CO2). As a result, GHG emissions for the Project are calculated based on estimated fuel usage. Emission factors were taken from the California’s GHG Emissions Inventory, which is available on California’s Air Resources Board website. The Project construction will produce a total of 42.38 metric tons of CO2 equivalent (MTCO2E).
GHG Impact Assessment
It is possible that construction related GHG emissions associated with the proposed Project; when combined with emissions throughout the area, the Counties of Santa Barbara and Ventura, the South Central Coast Air Basin, and the world, might incrementally contribute to climate change. Locally, there are industrial, commercial and residential projects in the Project
February 2011 Carone DPP Revisions
5.9-19
area that contribute to cumulative impacts due to the release of GHG emissions. The Draft GHG Emissions Inventory (CARB, 2008b), estimates that the annual CO2E for all GHGs produced in California in 2004 was 468.8 million metric tons. Therefore, the GHG associated with construction related emissions (29.14 MTCO2E) would represent a negligible percentage of the annual GHG emissions produced statewide.
While global climate change is, by definition, a significant cumulative environmental impact there is currently no agreed upon methodology to adequately identify, under CEQA. However, based on the small percentage of GHG emissions associated with the proposed Project when compared to annual GHG emissions produced statewide, and the significant reduction in GHG emissions that will result, construction related emissions are not expected to cause a negative impact.
February 2011 Carone DPP Revisions
5.9-20
5.9.8 References
California Air Resources Board. 2004a. California Diesel Fuel Regulations. Title 13, California Code of Regulations, Sections 2281-2285 and Title 17, California Code of Regulations, Section 93114. August 14, 2004.
California Air Resources Board. 2004b. Staff Report: Proposed Regulatory Amendments Extending the California Standards for Motor Vehicle Diesel Fuel to Diesel Fuel Used in Harbor Craft and Interstate Locomotives. Available:<http://www.arb.ca.gov/regact/carblohc/isor.pdf>
California Air Resources Board. 2007a. OFFROAD2007 Emissions Model. Available at http://www.arb.ca.gov/msei/offroad/offroad.htm.
California Air Resources Board. 2007b. Accessed February 20, 2007.
California Air Resources Board. 2008a. Documentation of California’s Greenhouse Gas Inventory. Last modified: November 26, 2008. Available at http://www.arb.ca.gov/cc/inventory/doc/doc_index.php Accessed May 19, 2008.
California Air Resources Board. 2008b. Greenhouse Gas Inventory Data - Draft 2020 Forecast. http://www.arb.ca.gov/cc/inventory/data/forecast.htm. July 2008.
California Air Resources Board. 2008c. Motor Vehicle Emissions Inventory Model (EMFAC2007).http://www.arb.ca.gov/msei/onroad/latest_version.htm. Downloaded October 2008
California Air Resources Board. 2008d. Preliminary Draft Staff Proposal, Recommended Approaches for Setting Interim Significance Thresholds for Greenhouse Gases under the California Environmental Quality Act.
California Air Resources Board. 2010. Regulation for the Mandatory Reporting of Greenhouse Gas Emissions.
California Climate Action Registry. 2008. General Reporting Protocol.
California Environmental Resources Evaluation System (CERES). 2007. CEQA Guidelines.
California State Office of Planning and Research. 2008. Technical Advisory, CEQA and Climate Change: Addressing Climate Change through California Environmental Quality Act (CEQA) Review.
SBAPCD. 2011. 2010 Clean Air Plan. http://www.sbcapcd.org/cap/Final2010CleanAirPlan.pdf
U.S. EPA. 2007. Federal Register, June 11, 2007. 72 FR Page 26718.
U.S. EPA. 2009. Mandatory Reporting of Greenhouse Gases Rule.
February 2011 Carone DPP Revisions
5.9-21
United States Environmental Protection Agency. 2009. Greenhouse Gas Emissions Website. Accessed online at http://www.epa.gov/climatechange/emissions/index.html on March 17, 2009.
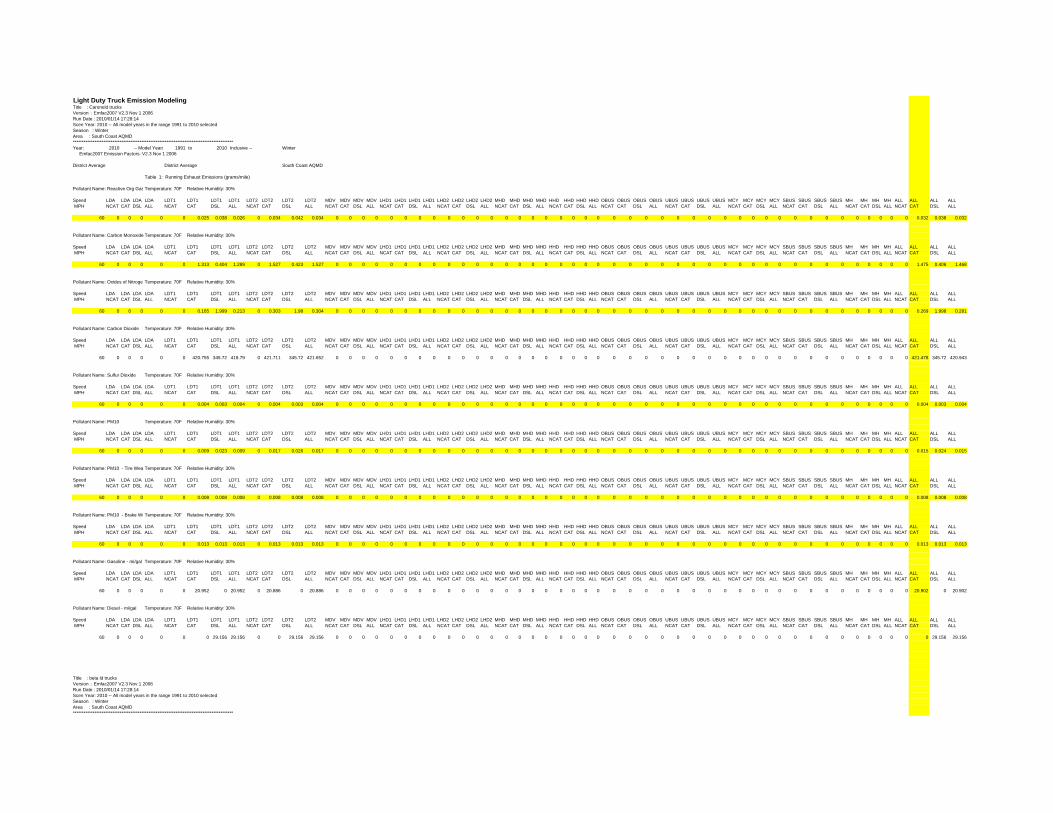
Light Duty Truck Emission ModelingTitle : Caroneld trucksVersion : Emfac2007 V2.3 Nov 1 2006Run Date : 2010/01/14 17:28:14Scen Year: 2010 -- All model years in the range 1991 to 2010 selectedSeason : WinterArea : South Coast AQMD*****************************************************************************************Year: 2010 -- Model Years 1991 to 2010 Inclusive -- Winter Emfac2007 Emission Factors: V2.3 Nov 1 2006
District Average District Average South Coast AQMD
Table 1: Running Exhaust Emissions (grams/mile)
Pollutant Name: Reactive Org Gas Temperature: 70F Relative Humidity: 30%
Speed LDA LDA LDA LDA LDT1 LDT1 LDT1 LDT1 LDT2 LDT2 LDT2 LDT2 MDV MDV MDV MDV LHD1 LHD1 LHD1 LHD1 LHD2 LHD2 LHD2 LHD2 MHD MHD MHD MHD HHD HHD HHD HHD OBUS OBUS OBUS OBUS UBUS UBUS UBUS UBUS MCY MCY MCY MCY SBUS SBUS SBUS SBUS MH MH MH MH ALL ALL ALL ALL MPH NCAT CAT DSL ALL NCAT CAT DSL ALL NCAT CAT DSL ALL NCAT CAT DSL ALL NCAT CAT DSL ALL NCAT CAT DSL ALL NCAT CAT DSL ALL NCAT CAT DSL ALL NCAT CAT DSL ALL NCAT CAT DSL ALL NCAT CAT DSL ALL NCAT CAT DSL ALL NCAT CAT DSL ALL NCAT CAT DSL ALL
60 0 0 0 0 0 0.025 0.038 0.026 0 0.034 0.042 0.034 0 0 0 0 0 0 0 0 0 0 0 0 0 0 0 0 0 0 0 0 0 0 0 0 0 0 0 0 0 0 0 0 0 0 0 0 0 0 0 0 0 0.032 0.038 0.032
Pollutant Name: Carbon Monoxide Temperature: 70F Relative Humidity: 30%
Speed LDA LDA LDA LDA LDT1 LDT1 LDT1 LDT1 LDT2 LDT2 LDT2 LDT2 MDV MDV MDV MDV LHD1 LHD1 LHD1 LHD1 LHD2 LHD2 LHD2 LHD2 MHD MHD MHD MHD HHD HHD HHD HHD OBUS OBUS OBUS OBUS UBUS UBUS UBUS UBUS MCY MCY MCY MCY SBUS SBUS SBUS SBUS MH MH MH MH ALL ALL ALL ALL MPH NCAT CAT DSL ALL NCAT CAT DSL ALL NCAT CAT DSL ALL NCAT CAT DSL ALL NCAT CAT DSL ALL NCAT CAT DSL ALL NCAT CAT DSL ALL NCAT CAT DSL ALL NCAT CAT DSL ALL NCAT CAT DSL ALL NCAT CAT DSL ALL NCAT CAT DSL ALL NCAT CAT DSL ALL NCAT CAT DSL ALL
60 0 0 0 0 0 1.313 0.404 1.289 0 1.527 0.423 1.527 0 0 0 0 0 0 0 0 0 0 0 0 0 0 0 0 0 0 0 0 0 0 0 0 0 0 0 0 0 0 0 0 0 0 0 0 0 0 0 0 0 1.475 0.406 1.468
Pollutant Name: Oxides of NitrogenTemperature: 70F Relative Humidity: 30%
Speed LDA LDA LDA LDA LDT1 LDT1 LDT1 LDT1 LDT2 LDT2 LDT2 LDT2 MDV MDV MDV MDV LHD1 LHD1 LHD1 LHD1 LHD2 LHD2 LHD2 LHD2 MHD MHD MHD MHD HHD HHD HHD HHD OBUS OBUS OBUS OBUS UBUS UBUS UBUS UBUS MCY MCY MCY MCY SBUS SBUS SBUS SBUS MH MH MH MH ALL ALL ALL ALL MPH NCAT CAT DSL ALL NCAT CAT DSL ALL NCAT CAT DSL ALL NCAT CAT DSL ALL NCAT CAT DSL ALL NCAT CAT DSL ALL NCAT CAT DSL ALL NCAT CAT DSL ALL NCAT CAT DSL ALL NCAT CAT DSL ALL NCAT CAT DSL ALL NCAT CAT DSL ALL NCAT CAT DSL ALL NCAT CAT DSL ALL
60 0 0 0 0 0 0.165 1.999 0.213 0 0.303 1.98 0.304 0 0 0 0 0 0 0 0 0 0 0 0 0 0 0 0 0 0 0 0 0 0 0 0 0 0 0 0 0 0 0 0 0 0 0 0 0 0 0 0 0 0.269 1.998 0.281
Pollutant Name: Carbon Dioxide Temperature: 70F Relative Humidity: 30%
Speed LDA LDA LDA LDA LDT1 LDT1 LDT1 LDT1 LDT2 LDT2 LDT2 LDT2 MDV MDV MDV MDV LHD1 LHD1 LHD1 LHD1 LHD2 LHD2 LHD2 LHD2 MHD MHD MHD MHD HHD HHD HHD HHD OBUS OBUS OBUS OBUS UBUS UBUS UBUS UBUS MCY MCY MCY MCY SBUS SBUS SBUS SBUS MH MH MH MH ALL ALL ALL ALL MPH NCAT CAT DSL ALL NCAT CAT DSL ALL NCAT CAT DSL ALL NCAT CAT DSL ALL NCAT CAT DSL ALL NCAT CAT DSL ALL NCAT CAT DSL ALL NCAT CAT DSL ALL NCAT CAT DSL ALL NCAT CAT DSL ALL NCAT CAT DSL ALL NCAT CAT DSL ALL NCAT CAT DSL ALL NCAT CAT DSL ALL
60 0 0 0 0 0 420.755 345.72 418.79 0 421.711 345.72 421.652 0 0 0 0 0 0 0 0 0 0 0 0 0 0 0 0 0 0 0 0 0 0 0 0 0 0 0 0 0 0 0 0 0 0 0 0 0 0 0 0 0 421.478 345.72 420.943
Pollutant Name: Sulfur Dioxide Temperature: 70F Relative Humidity: 30%
Speed LDA LDA LDA LDA LDT1 LDT1 LDT1 LDT1 LDT2 LDT2 LDT2 LDT2 MDV MDV MDV MDV LHD1 LHD1 LHD1 LHD1 LHD2 LHD2 LHD2 LHD2 MHD MHD MHD MHD HHD HHD HHD HHD OBUS OBUS OBUS OBUS UBUS UBUS UBUS UBUS MCY MCY MCY MCY SBUS SBUS SBUS SBUS MH MH MH MH ALL ALL ALL ALL MPH NCAT CAT DSL ALL NCAT CAT DSL ALL NCAT CAT DSL ALL NCAT CAT DSL ALL NCAT CAT DSL ALL NCAT CAT DSL ALL NCAT CAT DSL ALL NCAT CAT DSL ALL NCAT CAT DSL ALL NCAT CAT DSL ALL NCAT CAT DSL ALL NCAT CAT DSL ALL NCAT CAT DSL ALL NCAT CAT DSL ALL
60 0 0 0 0 0 0.004 0.003 0.004 0 0.004 0.003 0.004 0 0 0 0 0 0 0 0 0 0 0 0 0 0 0 0 0 0 0 0 0 0 0 0 0 0 0 0 0 0 0 0 0 0 0 0 0 0 0 0 0 0.004 0.003 0.004
Pollutant Name: PM10 Temperature: 70F Relative Humidity: 30%
Speed LDA LDA LDA LDA LDT1 LDT1 LDT1 LDT1 LDT2 LDT2 LDT2 LDT2 MDV MDV MDV MDV LHD1 LHD1 LHD1 LHD1 LHD2 LHD2 LHD2 LHD2 MHD MHD MHD MHD HHD HHD HHD HHD OBUS OBUS OBUS OBUS UBUS UBUS UBUS UBUS MCY MCY MCY MCY SBUS SBUS SBUS SBUS MH MH MH MH ALL ALL ALL ALL MPH NCAT CAT DSL ALL NCAT CAT DSL ALL NCAT CAT DSL ALL NCAT CAT DSL ALL NCAT CAT DSL ALL NCAT CAT DSL ALL NCAT CAT DSL ALL NCAT CAT DSL ALL NCAT CAT DSL ALL NCAT CAT DSL ALL NCAT CAT DSL ALL NCAT CAT DSL ALL NCAT CAT DSL ALL NCAT CAT DSL ALL
60 0 0 0 0 0 0.009 0.023 0.009 0 0.017 0.026 0.017 0 0 0 0 0 0 0 0 0 0 0 0 0 0 0 0 0 0 0 0 0 0 0 0 0 0 0 0 0 0 0 0 0 0 0 0 0 0 0 0 0 0.015 0.024 0.015
Pollutant Name: PM10 - Tire WearTemperature: 70F Relative Humidity: 30%
Speed LDA LDA LDA LDA LDT1 LDT1 LDT1 LDT1 LDT2 LDT2 LDT2 LDT2 MDV MDV MDV MDV LHD1 LHD1 LHD1 LHD1 LHD2 LHD2 LHD2 LHD2 MHD MHD MHD MHD HHD HHD HHD HHD OBUS OBUS OBUS OBUS UBUS UBUS UBUS UBUS MCY MCY MCY MCY SBUS SBUS SBUS SBUS MH MH MH MH ALL ALL ALL ALL MPH NCAT CAT DSL ALL NCAT CAT DSL ALL NCAT CAT DSL ALL NCAT CAT DSL ALL NCAT CAT DSL ALL NCAT CAT DSL ALL NCAT CAT DSL ALL NCAT CAT DSL ALL NCAT CAT DSL ALL NCAT CAT DSL ALL NCAT CAT DSL ALL NCAT CAT DSL ALL NCAT CAT DSL ALL NCAT CAT DSL ALL
60 0 0 0 0 0 0.008 0.008 0.008 0 0.008 0.008 0.008 0 0 0 0 0 0 0 0 0 0 0 0 0 0 0 0 0 0 0 0 0 0 0 0 0 0 0 0 0 0 0 0 0 0 0 0 0 0 0 0 0 0.008 0.008 0.008
Pollutant Name: PM10 - Brake WeTemperature: 70F Relative Humidity: 30%
Speed LDA LDA LDA LDA LDT1 LDT1 LDT1 LDT1 LDT2 LDT2 LDT2 LDT2 MDV MDV MDV MDV LHD1 LHD1 LHD1 LHD1 LHD2 LHD2 LHD2 LHD2 MHD MHD MHD MHD HHD HHD HHD HHD OBUS OBUS OBUS OBUS UBUS UBUS UBUS UBUS MCY MCY MCY MCY SBUS SBUS SBUS SBUS MH MH MH MH ALL ALL ALL ALL MPH NCAT CAT DSL ALL NCAT CAT DSL ALL NCAT CAT DSL ALL NCAT CAT DSL ALL NCAT CAT DSL ALL NCAT CAT DSL ALL NCAT CAT DSL ALL NCAT CAT DSL ALL NCAT CAT DSL ALL NCAT CAT DSL ALL NCAT CAT DSL ALL NCAT CAT DSL ALL NCAT CAT DSL ALL NCAT CAT DSL ALL
60 0 0 0 0 0 0.013 0.013 0.013 0 0.013 0.013 0.013 0 0 0 0 0 0 0 0 0 0 0 0 0 0 0 0 0 0 0 0 0 0 0 0 0 0 0 0 0 0 0 0 0 0 0 0 0 0 0 0 0 0.013 0.013 0.013
Pollutant Name: Gasoline - mi/gal Temperature: 70F Relative Humidity: 30%
Speed LDA LDA LDA LDA LDT1 LDT1 LDT1 LDT1 LDT2 LDT2 LDT2 LDT2 MDV MDV MDV MDV LHD1 LHD1 LHD1 LHD1 LHD2 LHD2 LHD2 LHD2 MHD MHD MHD MHD HHD HHD HHD HHD OBUS OBUS OBUS OBUS UBUS UBUS UBUS UBUS MCY MCY MCY MCY SBUS SBUS SBUS SBUS MH MH MH MH ALL ALL ALL ALL MPH NCAT CAT DSL ALL NCAT CAT DSL ALL NCAT CAT DSL ALL NCAT CAT DSL ALL NCAT CAT DSL ALL NCAT CAT DSL ALL NCAT CAT DSL ALL NCAT CAT DSL ALL NCAT CAT DSL ALL NCAT CAT DSL ALL NCAT CAT DSL ALL NCAT CAT DSL ALL NCAT CAT DSL ALL NCAT CAT DSL ALL
60 0 0 0 0 0 20.952 0 20.952 0 20.886 0 20.886 0 0 0 0 0 0 0 0 0 0 0 0 0 0 0 0 0 0 0 0 0 0 0 0 0 0 0 0 0 0 0 0 0 0 0 0 0 0 0 0 0 20.902 0 20.902
Pollutant Name: Diesel - mi/gal Temperature: 70F Relative Humidity: 30%
Speed LDA LDA LDA LDA LDT1 LDT1 LDT1 LDT1 LDT2 LDT2 LDT2 LDT2 MDV MDV MDV MDV LHD1 LHD1 LHD1 LHD1 LHD2 LHD2 LHD2 LHD2 MHD MHD MHD MHD HHD HHD HHD HHD OBUS OBUS OBUS OBUS UBUS UBUS UBUS UBUS MCY MCY MCY MCY SBUS SBUS SBUS SBUS MH MH MH MH ALL ALL ALL ALL MPH NCAT CAT DSL ALL NCAT CAT DSL ALL NCAT CAT DSL ALL NCAT CAT DSL ALL NCAT CAT DSL ALL NCAT CAT DSL ALL NCAT CAT DSL ALL NCAT CAT DSL ALL NCAT CAT DSL ALL NCAT CAT DSL ALL NCAT CAT DSL ALL NCAT CAT DSL ALL NCAT CAT DSL ALL NCAT CAT DSL ALL
60 0 0 0 0 0 0 29.156 29.156 0 0 29.156 29.156 0 0 0 0 0 0 0 0 0 0 0 0 0 0 0 0 0 0 0 0 0 0 0 0 0 0 0 0 0 0 0 0 0 0 0 0 0 0 0 0 0 0 29.156 29.156
Title : beta ld trucksVersion : Emfac2007 V2.3 Nov 1 2006Run Date : 2010/01/14 17:28:14Scen Year: 2010 -- All model years in the range 1991 to 2010 selectedSeason : WinterArea : South Coast AQMD*****************************************************************************************
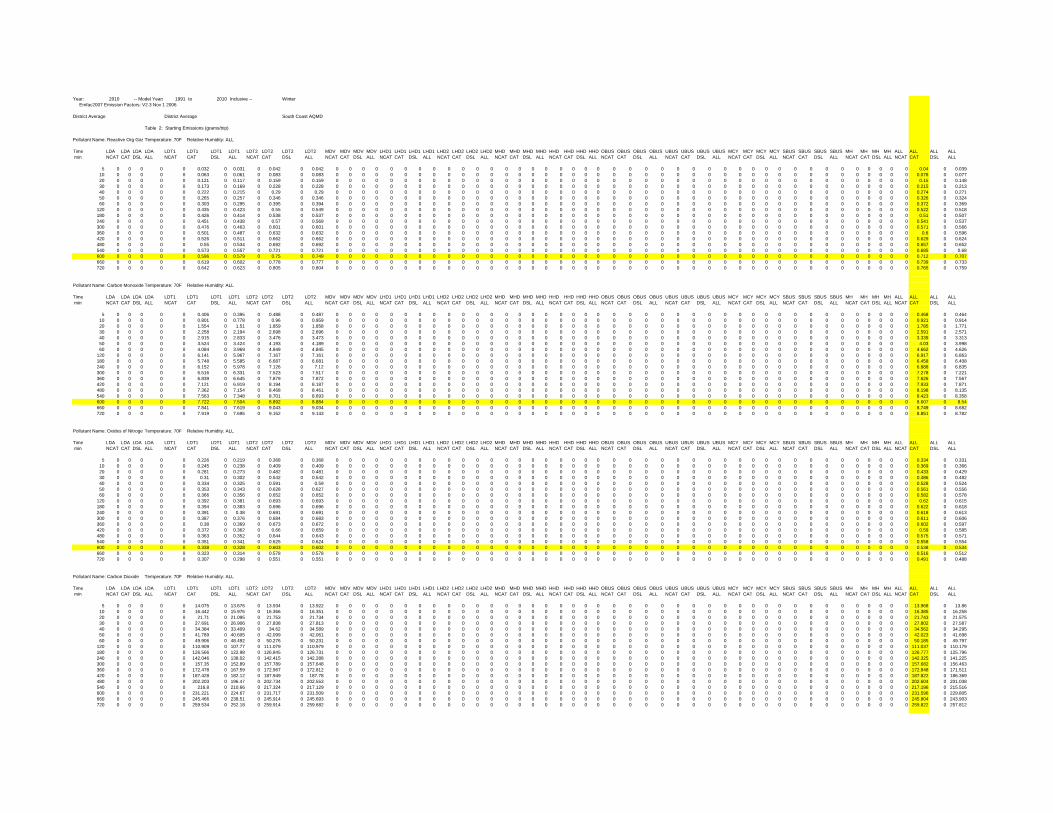
Year: 2010 -- Model Years 1991 to 2010 Inclusive -- Winter Emfac2007 Emission Factors: V2.3 Nov 1 2006
District Average District Average South Coast AQMD
Table 2: Starting Emissions (grams/trip)
Pollutant Name: Reactive Org Gas Temperature: 70F Relative Humidity: ALL
Time LDA LDA LDA LDA LDT1 LDT1 LDT1 LDT1 LDT2 LDT2 LDT2 LDT2 MDV MDV MDV MDV LHD1 LHD1 LHD1 LHD1 LHD2 LHD2 LHD2 LHD2 MHD MHD MHD MHD HHD HHD HHD HHD OBUS OBUS OBUS OBUS UBUS UBUS UBUS UBUS MCY MCY MCY MCY SBUS SBUS SBUS SBUS MH MH MH MH ALL ALL ALL ALL min NCAT CAT DSL ALL NCAT CAT DSL ALL NCAT CAT DSL ALL NCAT CAT DSL ALL NCAT CAT DSL ALL NCAT CAT DSL ALL NCAT CAT DSL ALL NCAT CAT DSL ALL NCAT CAT DSL ALL NCAT CAT DSL ALL NCAT CAT DSL ALL NCAT CAT DSL ALL NCAT CAT DSL ALL NCAT CAT DSL ALL
5 0 0 0 0 0 0.032 0 0.031 0 0.042 0 0.042 0 0 0 0 0 0 0 0 0 0 0 0 0 0 0 0 0 0 0 0 0 0 0 0 0 0 0 0 0 0 0 0 0 0 0 0 0 0 0 0 0 0.04 0 0.03910 0 0 0 0 0 0.063 0 0.061 0 0.083 0 0.083 0 0 0 0 0 0 0 0 0 0 0 0 0 0 0 0 0 0 0 0 0 0 0 0 0 0 0 0 0 0 0 0 0 0 0 0 0 0 0 0 0 0.078 0 0.07720 0 0 0 0 0 0.121 0 0.117 0 0.159 0 0.159 0 0 0 0 0 0 0 0 0 0 0 0 0 0 0 0 0 0 0 0 0 0 0 0 0 0 0 0 0 0 0 0 0 0 0 0 0 0 0 0 0 0.15 0 0.14830 0 0 0 0 0 0.173 0 0.169 0 0.228 0 0.228 0 0 0 0 0 0 0 0 0 0 0 0 0 0 0 0 0 0 0 0 0 0 0 0 0 0 0 0 0 0 0 0 0 0 0 0 0 0 0 0 0 0.215 0 0.21340 0 0 0 0 0 0.222 0 0.215 0 0.29 0 0.29 0 0 0 0 0 0 0 0 0 0 0 0 0 0 0 0 0 0 0 0 0 0 0 0 0 0 0 0 0 0 0 0 0 0 0 0 0 0 0 0 0 0.274 0 0.27150 0 0 0 0 0 0.265 0 0.257 0 0.346 0 0.346 0 0 0 0 0 0 0 0 0 0 0 0 0 0 0 0 0 0 0 0 0 0 0 0 0 0 0 0 0 0 0 0 0 0 0 0 0 0 0 0 0 0.326 0 0.32460 0 0 0 0 0 0.303 0 0.295 0 0.395 0 0.394 0 0 0 0 0 0 0 0 0 0 0 0 0 0 0 0 0 0 0 0 0 0 0 0 0 0 0 0 0 0 0 0 0 0 0 0 0 0 0 0 0 0.372 0 0.369
120 0 0 0 0 0 0.435 0 0.423 0 0.55 0 0.549 0 0 0 0 0 0 0 0 0 0 0 0 0 0 0 0 0 0 0 0 0 0 0 0 0 0 0 0 0 0 0 0 0 0 0 0 0 0 0 0 0 0.522 0 0.518180 0 0 0 0 0 0.426 0 0.414 0 0.538 0 0.537 0 0 0 0 0 0 0 0 0 0 0 0 0 0 0 0 0 0 0 0 0 0 0 0 0 0 0 0 0 0 0 0 0 0 0 0 0 0 0 0 0 0.51 0 0.507240 0 0 0 0 0 0.451 0 0.438 0 0.57 0 0.569 0 0 0 0 0 0 0 0 0 0 0 0 0 0 0 0 0 0 0 0 0 0 0 0 0 0 0 0 0 0 0 0 0 0 0 0 0 0 0 0 0 0.541 0 0.537300 0 0 0 0 0 0.476 0 0.463 0 0.601 0 0.601 0 0 0 0 0 0 0 0 0 0 0 0 0 0 0 0 0 0 0 0 0 0 0 0 0 0 0 0 0 0 0 0 0 0 0 0 0 0 0 0 0 0.571 0 0.566360 0 0 0 0 0 0.501 0 0.487 0 0.632 0 0.632 0 0 0 0 0 0 0 0 0 0 0 0 0 0 0 0 0 0 0 0 0 0 0 0 0 0 0 0 0 0 0 0 0 0 0 0 0 0 0 0 0 0.6 0 0.596420 0 0 0 0 0 0.526 0 0.511 0 0.662 0 0.662 0 0 0 0 0 0 0 0 0 0 0 0 0 0 0 0 0 0 0 0 0 0 0 0 0 0 0 0 0 0 0 0 0 0 0 0 0 0 0 0 0 0.629 0 0.624480 0 0 0 0 0 0.55 0 0.534 0 0.692 0 0.692 0 0 0 0 0 0 0 0 0 0 0 0 0 0 0 0 0 0 0 0 0 0 0 0 0 0 0 0 0 0 0 0 0 0 0 0 0 0 0 0 0 0.657 0 0.652540 0 0 0 0 0 0.573 0 0.557 0 0.721 0 0.721 0 0 0 0 0 0 0 0 0 0 0 0 0 0 0 0 0 0 0 0 0 0 0 0 0 0 0 0 0 0 0 0 0 0 0 0 0 0 0 0 0 0.685 0 0.68600 0 0 0 0 0 0.596 0 0.579 0 0.75 0 0.749 0 0 0 0 0 0 0 0 0 0 0 0 0 0 0 0 0 0 0 0 0 0 0 0 0 0 0 0 0 0 0 0 0 0 0 0 0 0 0 0 0 0.712 0 0.707660 0 0 0 0 0 0.619 0 0.602 0 0.778 0 0.777 0 0 0 0 0 0 0 0 0 0 0 0 0 0 0 0 0 0 0 0 0 0 0 0 0 0 0 0 0 0 0 0 0 0 0 0 0 0 0 0 0 0.739 0 0.733720 0 0 0 0 0 0.642 0 0.623 0 0.805 0 0.804 0 0 0 0 0 0 0 0 0 0 0 0 0 0 0 0 0 0 0 0 0 0 0 0 0 0 0 0 0 0 0 0 0 0 0 0 0 0 0 0 0 0.765 0 0.759
Pollutant Name: Carbon Monoxide Temperature: 70F Relative Humidity: ALL
Time LDA LDA LDA LDA LDT1 LDT1 LDT1 LDT1 LDT2 LDT2 LDT2 LDT2 MDV MDV MDV MDV LHD1 LHD1 LHD1 LHD1 LHD2 LHD2 LHD2 LHD2 MHD MHD MHD MHD HHD HHD HHD HHD OBUS OBUS OBUS OBUS UBUS UBUS UBUS UBUS MCY MCY MCY MCY SBUS SBUS SBUS SBUS MH MH MH MH ALL ALL ALL ALL min NCAT CAT DSL ALL NCAT CAT DSL ALL NCAT CAT DSL ALL NCAT CAT DSL ALL NCAT CAT DSL ALL NCAT CAT DSL ALL NCAT CAT DSL ALL NCAT CAT DSL ALL NCAT CAT DSL ALL NCAT CAT DSL ALL NCAT CAT DSL ALL NCAT CAT DSL ALL NCAT CAT DSL ALL NCAT CAT DSL ALL
5 0 0 0 0 0 0.406 0 0.395 0 0.488 0 0.487 0 0 0 0 0 0 0 0 0 0 0 0 0 0 0 0 0 0 0 0 0 0 0 0 0 0 0 0 0 0 0 0 0 0 0 0 0 0 0 0 0 0.468 0 0.46410 0 0 0 0 0 0.801 0 0.778 0 0.96 0 0.959 0 0 0 0 0 0 0 0 0 0 0 0 0 0 0 0 0 0 0 0 0 0 0 0 0 0 0 0 0 0 0 0 0 0 0 0 0 0 0 0 0 0.921 0 0.91420 0 0 0 0 0 1.554 0 1.51 0 1.859 0 1.858 0 0 0 0 0 0 0 0 0 0 0 0 0 0 0 0 0 0 0 0 0 0 0 0 0 0 0 0 0 0 0 0 0 0 0 0 0 0 0 0 0 1.785 0 1.77130 0 0 0 0 0 2.258 0 2.194 0 2.698 0 2.696 0 0 0 0 0 0 0 0 0 0 0 0 0 0 0 0 0 0 0 0 0 0 0 0 0 0 0 0 0 0 0 0 0 0 0 0 0 0 0 0 0 2.591 0 2.57140 0 0 0 0 0 2.915 0 2.833 0 3.476 0 3.473 0 0 0 0 0 0 0 0 0 0 0 0 0 0 0 0 0 0 0 0 0 0 0 0 0 0 0 0 0 0 0 0 0 0 0 0 0 0 0 0 0 3.339 0 3.31350 0 0 0 0 0 3.524 0 3.424 0 4.193 0 4.189 0 0 0 0 0 0 0 0 0 0 0 0 0 0 0 0 0 0 0 0 0 0 0 0 0 0 0 0 0 0 0 0 0 0 0 0 0 0 0 0 0 4.03 0 3.99860 0 0 0 0 0 4.084 0 3.969 0 4.849 0 4.845 0 0 0 0 0 0 0 0 0 0 0 0 0 0 0 0 0 0 0 0 0 0 0 0 0 0 0 0 0 0 0 0 0 0 0 0 0 0 0 0 0 4.662 0 4.626
120 0 0 0 0 0 6.141 0 5.967 0 7.167 0 7.161 0 0 0 0 0 0 0 0 0 0 0 0 0 0 0 0 0 0 0 0 0 0 0 0 0 0 0 0 0 0 0 0 0 0 0 0 0 0 0 0 0 6.917 0 6.863180 0 0 0 0 0 5.748 0 5.585 0 6.687 0 6.681 0 0 0 0 0 0 0 0 0 0 0 0 0 0 0 0 0 0 0 0 0 0 0 0 0 0 0 0 0 0 0 0 0 0 0 0 0 0 0 0 0 6.458 0 6.408240 0 0 0 0 0 6.152 0 5.978 0 7.126 0 7.12 0 0 0 0 0 0 0 0 0 0 0 0 0 0 0 0 0 0 0 0 0 0 0 0 0 0 0 0 0 0 0 0 0 0 0 0 0 0 0 0 0 6.888 0 6.835300 0 0 0 0 0 6.516 0 6.331 0 7.523 0 7.517 0 0 0 0 0 0 0 0 0 0 0 0 0 0 0 0 0 0 0 0 0 0 0 0 0 0 0 0 0 0 0 0 0 0 0 0 0 0 0 0 0 7.278 0 7.221360 0 0 0 0 0 6.839 0 6.645 0 7.879 0 7.872 0 0 0 0 0 0 0 0 0 0 0 0 0 0 0 0 0 0 0 0 0 0 0 0 0 0 0 0 0 0 0 0 0 0 0 0 0 0 0 0 0 7.626 0 7.567420 0 0 0 0 0 7.121 0 6.919 0 8.194 0 8.187 0 0 0 0 0 0 0 0 0 0 0 0 0 0 0 0 0 0 0 0 0 0 0 0 0 0 0 0 0 0 0 0 0 0 0 0 0 0 0 0 0 7.933 0 7.871480 0 0 0 0 0 7.362 0 7.154 0 8.468 0 8.461 0 0 0 0 0 0 0 0 0 0 0 0 0 0 0 0 0 0 0 0 0 0 0 0 0 0 0 0 0 0 0 0 0 0 0 0 0 0 0 0 0 8.198 0 8.135540 0 0 0 0 0 7.563 0 7.348 0 8.701 0 8.693 0 0 0 0 0 0 0 0 0 0 0 0 0 0 0 0 0 0 0 0 0 0 0 0 0 0 0 0 0 0 0 0 0 0 0 0 0 0 0 0 0 8.423 0 8.358600 0 0 0 0 0 7.722 0 7.504 0 8.892 0 8.884 0 0 0 0 0 0 0 0 0 0 0 0 0 0 0 0 0 0 0 0 0 0 0 0 0 0 0 0 0 0 0 0 0 0 0 0 0 0 0 0 0 8.607 0 8.54660 0 0 0 0 0 7.841 0 7.619 0 9.043 0 9.034 0 0 0 0 0 0 0 0 0 0 0 0 0 0 0 0 0 0 0 0 0 0 0 0 0 0 0 0 0 0 0 0 0 0 0 0 0 0 0 0 0 8.749 0 8.682720 0 0 0 0 0 7.919 0 7.695 0 9.152 0 9.143 0 0 0 0 0 0 0 0 0 0 0 0 0 0 0 0 0 0 0 0 0 0 0 0 0 0 0 0 0 0 0 0 0 0 0 0 0 0 0 0 0 8.851 0 8.782
Pollutant Name: Oxides of NitrogenTemperature: 70F Relative Humidity: ALL
Time LDA LDA LDA LDA LDT1 LDT1 LDT1 LDT1 LDT2 LDT2 LDT2 LDT2 MDV MDV MDV MDV LHD1 LHD1 LHD1 LHD1 LHD2 LHD2 LHD2 LHD2 MHD MHD MHD MHD HHD HHD HHD HHD OBUS OBUS OBUS OBUS UBUS UBUS UBUS UBUS MCY MCY MCY MCY SBUS SBUS SBUS SBUS MH MH MH MH ALL ALL ALL ALL min NCAT CAT DSL ALL NCAT CAT DSL ALL NCAT CAT DSL ALL NCAT CAT DSL ALL NCAT CAT DSL ALL NCAT CAT DSL ALL NCAT CAT DSL ALL NCAT CAT DSL ALL NCAT CAT DSL ALL NCAT CAT DSL ALL NCAT CAT DSL ALL NCAT CAT DSL ALL NCAT CAT DSL ALL NCAT CAT DSL ALL
5 0 0 0 0 0 0.226 0 0.219 0 0.368 0 0.368 0 0 0 0 0 0 0 0 0 0 0 0 0 0 0 0 0 0 0 0 0 0 0 0 0 0 0 0 0 0 0 0 0 0 0 0 0 0 0 0 0 0.334 0 0.33110 0 0 0 0 0 0.245 0 0.238 0 0.409 0 0.409 0 0 0 0 0 0 0 0 0 0 0 0 0 0 0 0 0 0 0 0 0 0 0 0 0 0 0 0 0 0 0 0 0 0 0 0 0 0 0 0 0 0.369 0 0.36620 0 0 0 0 0 0.281 0 0.273 0 0.482 0 0.481 0 0 0 0 0 0 0 0 0 0 0 0 0 0 0 0 0 0 0 0 0 0 0 0 0 0 0 0 0 0 0 0 0 0 0 0 0 0 0 0 0 0.433 0 0.42930 0 0 0 0 0 0.31 0 0.302 0 0.542 0 0.542 0 0 0 0 0 0 0 0 0 0 0 0 0 0 0 0 0 0 0 0 0 0 0 0 0 0 0 0 0 0 0 0 0 0 0 0 0 0 0 0 0 0.486 0 0.48240 0 0 0 0 0 0.334 0 0.325 0 0.591 0 0.59 0 0 0 0 0 0 0 0 0 0 0 0 0 0 0 0 0 0 0 0 0 0 0 0 0 0 0 0 0 0 0 0 0 0 0 0 0 0 0 0 0 0.528 0 0.52450 0 0 0 0 0 0.353 0 0.343 0 0.628 0 0.627 0 0 0 0 0 0 0 0 0 0 0 0 0 0 0 0 0 0 0 0 0 0 0 0 0 0 0 0 0 0 0 0 0 0 0 0 0 0 0 0 0 0.561 0 0.55660 0 0 0 0 0 0.366 0 0.356 0 0.652 0 0.652 0 0 0 0 0 0 0 0 0 0 0 0 0 0 0 0 0 0 0 0 0 0 0 0 0 0 0 0 0 0 0 0 0 0 0 0 0 0 0 0 0 0.582 0 0.578
120 0 0 0 0 0 0.392 0 0.381 0 0.693 0 0.693 0 0 0 0 0 0 0 0 0 0 0 0 0 0 0 0 0 0 0 0 0 0 0 0 0 0 0 0 0 0 0 0 0 0 0 0 0 0 0 0 0 0.62 0 0.615180 0 0 0 0 0 0.394 0 0.383 0 0.696 0 0.696 0 0 0 0 0 0 0 0 0 0 0 0 0 0 0 0 0 0 0 0 0 0 0 0 0 0 0 0 0 0 0 0 0 0 0 0 0 0 0 0 0 0.622 0 0.618240 0 0 0 0 0 0.391 0 0.38 0 0.691 0 0.691 0 0 0 0 0 0 0 0 0 0 0 0 0 0 0 0 0 0 0 0 0 0 0 0 0 0 0 0 0 0 0 0 0 0 0 0 0 0 0 0 0 0.618 0 0.613300 0 0 0 0 0 0.387 0 0.376 0 0.684 0 0.683 0 0 0 0 0 0 0 0 0 0 0 0 0 0 0 0 0 0 0 0 0 0 0 0 0 0 0 0 0 0 0 0 0 0 0 0 0 0 0 0 0 0.611 0 0.606360 0 0 0 0 0 0.38 0 0.369 0 0.673 0 0.672 0 0 0 0 0 0 0 0 0 0 0 0 0 0 0 0 0 0 0 0 0 0 0 0 0 0 0 0 0 0 0 0 0 0 0 0 0 0 0 0 0 0.602 0 0.597420 0 0 0 0 0 0.372 0 0.362 0 0.66 0 0.659 0 0 0 0 0 0 0 0 0 0 0 0 0 0 0 0 0 0 0 0 0 0 0 0 0 0 0 0 0 0 0 0 0 0 0 0 0 0 0 0 0 0.59 0 0.585480 0 0 0 0 0 0.363 0 0.352 0 0.644 0 0.643 0 0 0 0 0 0 0 0 0 0 0 0 0 0 0 0 0 0 0 0 0 0 0 0 0 0 0 0 0 0 0 0 0 0 0 0 0 0 0 0 0 0.575 0 0.571540 0 0 0 0 0 0.351 0 0.341 0 0.625 0 0.624 0 0 0 0 0 0 0 0 0 0 0 0 0 0 0 0 0 0 0 0 0 0 0 0 0 0 0 0 0 0 0 0 0 0 0 0 0 0 0 0 0 0.558 0 0.554600 0 0 0 0 0 0.338 0 0.328 0 0.603 0 0.602 0 0 0 0 0 0 0 0 0 0 0 0 0 0 0 0 0 0 0 0 0 0 0 0 0 0 0 0 0 0 0 0 0 0 0 0 0 0 0 0 0 0.538 0 0.534660 0 0 0 0 0 0.323 0 0.314 0 0.578 0 0.578 0 0 0 0 0 0 0 0 0 0 0 0 0 0 0 0 0 0 0 0 0 0 0 0 0 0 0 0 0 0 0 0 0 0 0 0 0 0 0 0 0 0.516 0 0.512720 0 0 0 0 0 0.307 0 0.298 0 0.551 0 0.551 0 0 0 0 0 0 0 0 0 0 0 0 0 0 0 0 0 0 0 0 0 0 0 0 0 0 0 0 0 0 0 0 0 0 0 0 0 0 0 0 0 0.491 0 0.488
Pollutant Name: Carbon Dioxide Temperature: 70F Relative Humidity: ALL
Time LDA LDA LDA LDA LDT1 LDT1 LDT1 LDT1 LDT2 LDT2 LDT2 LDT2 MDV MDV MDV MDV LHD1 LHD1 LHD1 LHD1 LHD2 LHD2 LHD2 LHD2 MHD MHD MHD MHD HHD HHD HHD HHD OBUS OBUS OBUS OBUS UBUS UBUS UBUS UBUS MCY MCY MCY MCY SBUS SBUS SBUS SBUS MH MH MH MH ALL ALL ALL ALL min NCAT CAT DSL ALL NCAT CAT DSL ALL NCAT CAT DSL ALL NCAT CAT DSL ALL NCAT CAT DSL ALL NCAT CAT DSL ALL NCAT CAT DSL ALL NCAT CAT DSL ALL NCAT CAT DSL ALL NCAT CAT DSL ALL NCAT CAT DSL ALL NCAT CAT DSL ALL NCAT CAT DSL ALL NCAT CAT DSL ALL
5 0 0 0 0 0 14.075 0 13.676 0 13.934 0 13.922 0 0 0 0 0 0 0 0 0 0 0 0 0 0 0 0 0 0 0 0 0 0 0 0 0 0 0 0 0 0 0 0 0 0 0 0 0 0 0 0 0 13.968 0 13.8610 0 0 0 0 0 16.442 0 15.976 0 16.366 0 16.351 0 0 0 0 0 0 0 0 0 0 0 0 0 0 0 0 0 0 0 0 0 0 0 0 0 0 0 0 0 0 0 0 0 0 0 0 0 0 0 0 0 16.385 0 16.25820 0 0 0 0 0 21.71 0 21.095 0 21.753 0 21.734 0 0 0 0 0 0 0 0 0 0 0 0 0 0 0 0 0 0 0 0 0 0 0 0 0 0 0 0 0 0 0 0 0 0 0 0 0 0 0 0 0 21.743 0 21.57530 0 0 0 0 0 27.691 0 26.906 0 27.838 0 27.813 0 0 0 0 0 0 0 0 0 0 0 0 0 0 0 0 0 0 0 0 0 0 0 0 0 0 0 0 0 0 0 0 0 0 0 0 0 0 0 0 0 27.802 0 27.58740 0 0 0 0 0 34.384 0 33.409 0 34.62 0 34.589 0 0 0 0 0 0 0 0 0 0 0 0 0 0 0 0 0 0 0 0 0 0 0 0 0 0 0 0 0 0 0 0 0 0 0 0 0 0 0 0 0 34.562 0 34.29550 0 0 0 0 0 41.789 0 40.605 0 42.099 0 42.061 0 0 0 0 0 0 0 0 0 0 0 0 0 0 0 0 0 0 0 0 0 0 0 0 0 0 0 0 0 0 0 0 0 0 0 0 0 0 0 0 0 42.023 0 41.69860 0 0 0 0 0 49.906 0 48.492 0 50.276 0 50.231 0 0 0 0 0 0 0 0 0 0 0 0 0 0 0 0 0 0 0 0 0 0 0 0 0 0 0 0 0 0 0 0 0 0 0 0 0 0 0 0 0 50.185 0 49.797
120 0 0 0 0 0 110.909 0 107.77 0 111.079 0 110.979 0 0 0 0 0 0 0 0 0 0 0 0 0 0 0 0 0 0 0 0 0 0 0 0 0 0 0 0 0 0 0 0 0 0 0 0 0 0 0 0 0 111.037 0 110.179180 0 0 0 0 0 126.566 0 122.98 0 126.845 0 126.731 0 0 0 0 0 0 0 0 0 0 0 0 0 0 0 0 0 0 0 0 0 0 0 0 0 0 0 0 0 0 0 0 0 0 0 0 0 0 0 0 0 126.777 0 125.796240 0 0 0 0 0 142.046 0 138.02 0 142.415 0 142.288 0 0 0 0 0 0 0 0 0 0 0 0 0 0 0 0 0 0 0 0 0 0 0 0 0 0 0 0 0 0 0 0 0 0 0 0 0 0 0 0 0 142.325 0 141.225300 0 0 0 0 0 157.35 0 152.89 0 157.789 0 157.648 0 0 0 0 0 0 0 0 0 0 0 0 0 0 0 0 0 0 0 0 0 0 0 0 0 0 0 0 0 0 0 0 0 0 0 0 0 0 0 0 0 157.682 0 156.463360 0 0 0 0 0 172.478 0 167.59 0 172.967 0 172.812 0 0 0 0 0 0 0 0 0 0 0 0 0 0 0 0 0 0 0 0 0 0 0 0 0 0 0 0 0 0 0 0 0 0 0 0 0 0 0 0 0 172.848 0 171.511420 0 0 0 0 0 187.428 0 182.12 0 187.949 0 187.78 0 0 0 0 0 0 0 0 0 0 0 0 0 0 0 0 0 0 0 0 0 0 0 0 0 0 0 0 0 0 0 0 0 0 0 0 0 0 0 0 0 187.822 0 186.369480 0 0 0 0 0 202.203 0 196.47 0 202.734 0 202.553 0 0 0 0 0 0 0 0 0 0 0 0 0 0 0 0 0 0 0 0 0 0 0 0 0 0 0 0 0 0 0 0 0 0 0 0 0 0 0 0 0 202.604 0 201.038540 0 0 0 0 0 216.8 0 210.66 0 217.324 0 217.129 0 0 0 0 0 0 0 0 0 0 0 0 0 0 0 0 0 0 0 0 0 0 0 0 0 0 0 0 0 0 0 0 0 0 0 0 0 0 0 0 0 217.196 0 215.516600 0 0 0 0 0 231.221 0 224.67 0 231.717 0 231.509 0 0 0 0 0 0 0 0 0 0 0 0 0 0 0 0 0 0 0 0 0 0 0 0 0 0 0 0 0 0 0 0 0 0 0 0 0 0 0 0 0 231.596 0 229.805660 0 0 0 0 0 245.466 0 238.51 0 245.914 0 245.693 0 0 0 0 0 0 0 0 0 0 0 0 0 0 0 0 0 0 0 0 0 0 0 0 0 0 0 0 0 0 0 0 0 0 0 0 0 0 0 0 0 245.804 0 243.903720 0 0 0 0 0 259.534 0 252.18 0 259.914 0 259.682 0 0 0 0 0 0 0 0 0 0 0 0 0 0 0 0 0 0 0 0 0 0 0 0 0 0 0 0 0 0 0 0 0 0 0 0 0 0 0 0 0 259.822 0 257.812
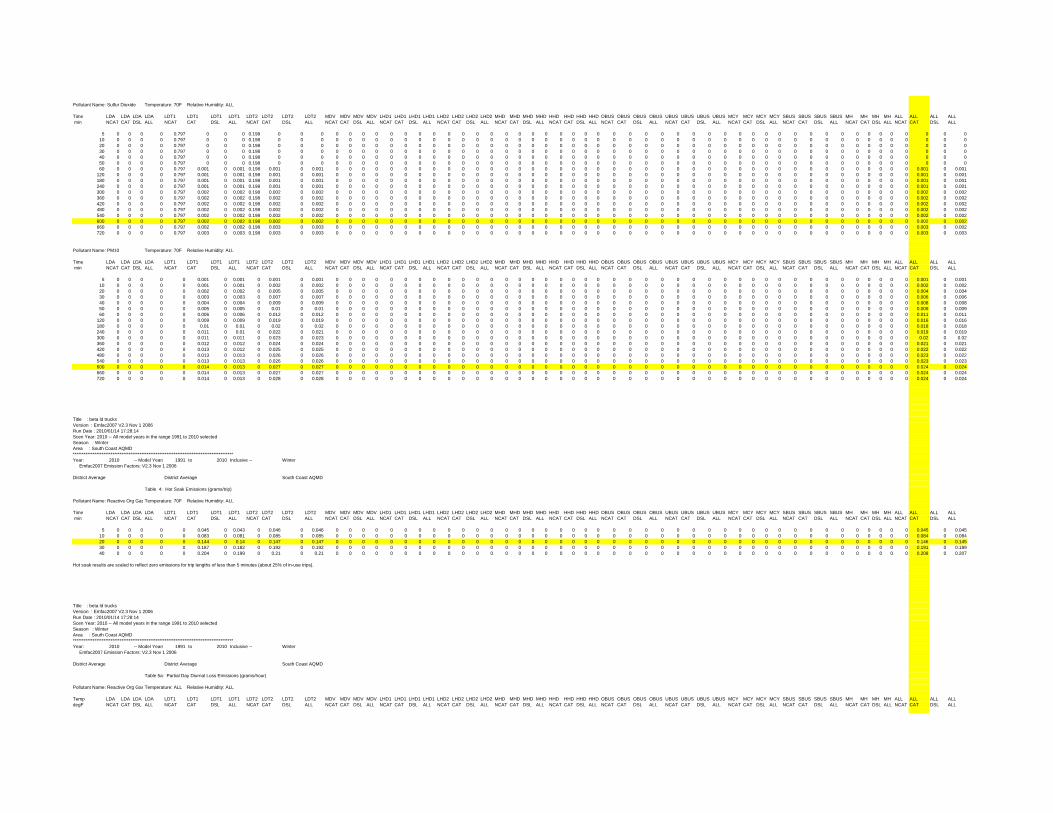
Pollutant Name: Sulfur Dioxide Temperature: 70F Relative Humidity: ALL
Time LDA LDA LDA LDA LDT1 LDT1 LDT1 LDT1 LDT2 LDT2 LDT2 LDT2 MDV MDV MDV MDV LHD1 LHD1 LHD1 LHD1 LHD2 LHD2 LHD2 LHD2 MHD MHD MHD MHD HHD HHD HHD HHD OBUS OBUS OBUS OBUS UBUS UBUS UBUS UBUS MCY MCY MCY MCY SBUS SBUS SBUS SBUS MH MH MH MH ALL ALL ALL ALL min NCAT CAT DSL ALL NCAT CAT DSL ALL NCAT CAT DSL ALL NCAT CAT DSL ALL NCAT CAT DSL ALL NCAT CAT DSL ALL NCAT CAT DSL ALL NCAT CAT DSL ALL NCAT CAT DSL ALL NCAT CAT DSL ALL NCAT CAT DSL ALL NCAT CAT DSL ALL NCAT CAT DSL ALL NCAT CAT DSL ALL
5 0 0 0 0 0.797 0 0 0 0.198 0 0 0 0 0 0 0 0 0 0 0 0 0 0 0 0 0 0 0 0 0 0 0 0 0 0 0 0 0 0 0 0 0 0 0 0 0 0 0 0 0 0 0 0 0 0 010 0 0 0 0 0.797 0 0 0 0.198 0 0 0 0 0 0 0 0 0 0 0 0 0 0 0 0 0 0 0 0 0 0 0 0 0 0 0 0 0 0 0 0 0 0 0 0 0 0 0 0 0 0 0 0 0 0 020 0 0 0 0 0.797 0 0 0 0.198 0 0 0 0 0 0 0 0 0 0 0 0 0 0 0 0 0 0 0 0 0 0 0 0 0 0 0 0 0 0 0 0 0 0 0 0 0 0 0 0 0 0 0 0 0 0 030 0 0 0 0 0.797 0 0 0 0.198 0 0 0 0 0 0 0 0 0 0 0 0 0 0 0 0 0 0 0 0 0 0 0 0 0 0 0 0 0 0 0 0 0 0 0 0 0 0 0 0 0 0 0 0 0 0 040 0 0 0 0 0.797 0 0 0 0.198 0 0 0 0 0 0 0 0 0 0 0 0 0 0 0 0 0 0 0 0 0 0 0 0 0 0 0 0 0 0 0 0 0 0 0 0 0 0 0 0 0 0 0 0 0 0 050 0 0 0 0 0.797 0 0 0 0.198 0 0 0 0 0 0 0 0 0 0 0 0 0 0 0 0 0 0 0 0 0 0 0 0 0 0 0 0 0 0 0 0 0 0 0 0 0 0 0 0 0 0 0 0 0 0 060 0 0 0 0 0.797 0.001 0 0.001 0.198 0.001 0 0.001 0 0 0 0 0 0 0 0 0 0 0 0 0 0 0 0 0 0 0 0 0 0 0 0 0 0 0 0 0 0 0 0 0 0 0 0 0 0 0 0 0 0.001 0 0.001
120 0 0 0 0 0.797 0.001 0 0.001 0.198 0.001 0 0.001 0 0 0 0 0 0 0 0 0 0 0 0 0 0 0 0 0 0 0 0 0 0 0 0 0 0 0 0 0 0 0 0 0 0 0 0 0 0 0 0 0 0.001 0 0.001180 0 0 0 0 0.797 0.001 0 0.001 0.198 0.001 0 0.001 0 0 0 0 0 0 0 0 0 0 0 0 0 0 0 0 0 0 0 0 0 0 0 0 0 0 0 0 0 0 0 0 0 0 0 0 0 0 0 0 0 0.001 0 0.001240 0 0 0 0 0.797 0.001 0 0.001 0.198 0.001 0 0.001 0 0 0 0 0 0 0 0 0 0 0 0 0 0 0 0 0 0 0 0 0 0 0 0 0 0 0 0 0 0 0 0 0 0 0 0 0 0 0 0 0 0.001 0 0.001300 0 0 0 0 0.797 0.002 0 0.002 0.198 0.002 0 0.002 0 0 0 0 0 0 0 0 0 0 0 0 0 0 0 0 0 0 0 0 0 0 0 0 0 0 0 0 0 0 0 0 0 0 0 0 0 0 0 0 0 0.002 0 0.002360 0 0 0 0 0.797 0.002 0 0.002 0.198 0.002 0 0.002 0 0 0 0 0 0 0 0 0 0 0 0 0 0 0 0 0 0 0 0 0 0 0 0 0 0 0 0 0 0 0 0 0 0 0 0 0 0 0 0 0 0.002 0 0.002420 0 0 0 0 0.797 0.002 0 0.002 0.198 0.002 0 0.002 0 0 0 0 0 0 0 0 0 0 0 0 0 0 0 0 0 0 0 0 0 0 0 0 0 0 0 0 0 0 0 0 0 0 0 0 0 0 0 0 0 0.002 0 0.002480 0 0 0 0 0.797 0.002 0 0.002 0.198 0.002 0 0.002 0 0 0 0 0 0 0 0 0 0 0 0 0 0 0 0 0 0 0 0 0 0 0 0 0 0 0 0 0 0 0 0 0 0 0 0 0 0 0 0 0 0.002 0 0.002540 0 0 0 0 0.797 0.002 0 0.002 0.198 0.002 0 0.002 0 0 0 0 0 0 0 0 0 0 0 0 0 0 0 0 0 0 0 0 0 0 0 0 0 0 0 0 0 0 0 0 0 0 0 0 0 0 0 0 0 0.002 0 0.002600 0 0 0 0 0.797 0.002 0 0.002 0.198 0.002 0 0.002 0 0 0 0 0 0 0 0 0 0 0 0 0 0 0 0 0 0 0 0 0 0 0 0 0 0 0 0 0 0 0 0 0 0 0 0 0 0 0 0 0 0.002 0 0.002660 0 0 0 0 0.797 0.002 0 0.002 0.198 0.003 0 0.003 0 0 0 0 0 0 0 0 0 0 0 0 0 0 0 0 0 0 0 0 0 0 0 0 0 0 0 0 0 0 0 0 0 0 0 0 0 0 0 0 0 0.003 0 0.002720 0 0 0 0 0.797 0.003 0 0.003 0.198 0.003 0 0.003 0 0 0 0 0 0 0 0 0 0 0 0 0 0 0 0 0 0 0 0 0 0 0 0 0 0 0 0 0 0 0 0 0 0 0 0 0 0 0 0 0 0.003 0 0.003
Pollutant Name: PM10 Temperature: 70F Relative Humidity: ALL
Time LDA LDA LDA LDA LDT1 LDT1 LDT1 LDT1 LDT2 LDT2 LDT2 LDT2 MDV MDV MDV MDV LHD1 LHD1 LHD1 LHD1 LHD2 LHD2 LHD2 LHD2 MHD MHD MHD MHD HHD HHD HHD HHD OBUS OBUS OBUS OBUS UBUS UBUS UBUS UBUS MCY MCY MCY MCY SBUS SBUS SBUS SBUS MH MH MH MH ALL ALL ALL ALL min NCAT CAT DSL ALL NCAT CAT DSL ALL NCAT CAT DSL ALL NCAT CAT DSL ALL NCAT CAT DSL ALL NCAT CAT DSL ALL NCAT CAT DSL ALL NCAT CAT DSL ALL NCAT CAT DSL ALL NCAT CAT DSL ALL NCAT CAT DSL ALL NCAT CAT DSL ALL NCAT CAT DSL ALL NCAT CAT DSL ALL
5 0 0 0 0 0 0.001 0 0.001 0 0.001 0 0.001 0 0 0 0 0 0 0 0 0 0 0 0 0 0 0 0 0 0 0 0 0 0 0 0 0 0 0 0 0 0 0 0 0 0 0 0 0 0 0 0 0 0.001 0 0.00110 0 0 0 0 0 0.001 0 0.001 0 0.002 0 0.002 0 0 0 0 0 0 0 0 0 0 0 0 0 0 0 0 0 0 0 0 0 0 0 0 0 0 0 0 0 0 0 0 0 0 0 0 0 0 0 0 0 0.002 0 0.00220 0 0 0 0 0 0.002 0 0.002 0 0.005 0 0.005 0 0 0 0 0 0 0 0 0 0 0 0 0 0 0 0 0 0 0 0 0 0 0 0 0 0 0 0 0 0 0 0 0 0 0 0 0 0 0 0 0 0.004 0 0.00430 0 0 0 0 0 0.003 0 0.003 0 0.007 0 0.007 0 0 0 0 0 0 0 0 0 0 0 0 0 0 0 0 0 0 0 0 0 0 0 0 0 0 0 0 0 0 0 0 0 0 0 0 0 0 0 0 0 0.006 0 0.00640 0 0 0 0 0 0.004 0 0.004 0 0.009 0 0.009 0 0 0 0 0 0 0 0 0 0 0 0 0 0 0 0 0 0 0 0 0 0 0 0 0 0 0 0 0 0 0 0 0 0 0 0 0 0 0 0 0 0.008 0 0.00850 0 0 0 0 0 0.005 0 0.005 0 0.01 0 0.01 0 0 0 0 0 0 0 0 0 0 0 0 0 0 0 0 0 0 0 0 0 0 0 0 0 0 0 0 0 0 0 0 0 0 0 0 0 0 0 0 0 0.009 0 0.00960 0 0 0 0 0 0.006 0 0.006 0 0.012 0 0.012 0 0 0 0 0 0 0 0 0 0 0 0 0 0 0 0 0 0 0 0 0 0 0 0 0 0 0 0 0 0 0 0 0 0 0 0 0 0 0 0 0 0.011 0 0.011
120 0 0 0 0 0 0.009 0 0.009 0 0.019 0 0.019 0 0 0 0 0 0 0 0 0 0 0 0 0 0 0 0 0 0 0 0 0 0 0 0 0 0 0 0 0 0 0 0 0 0 0 0 0 0 0 0 0 0.016 0 0.016180 0 0 0 0 0 0.01 0 0.01 0 0.02 0 0.02 0 0 0 0 0 0 0 0 0 0 0 0 0 0 0 0 0 0 0 0 0 0 0 0 0 0 0 0 0 0 0 0 0 0 0 0 0 0 0 0 0 0.018 0 0.018240 0 0 0 0 0 0.011 0 0.01 0 0.022 0 0.021 0 0 0 0 0 0 0 0 0 0 0 0 0 0 0 0 0 0 0 0 0 0 0 0 0 0 0 0 0 0 0 0 0 0 0 0 0 0 0 0 0 0.019 0 0.019300 0 0 0 0 0 0.011 0 0.011 0 0.023 0 0.023 0 0 0 0 0 0 0 0 0 0 0 0 0 0 0 0 0 0 0 0 0 0 0 0 0 0 0 0 0 0 0 0 0 0 0 0 0 0 0 0 0 0.02 0 0.02360 0 0 0 0 0 0.012 0 0.012 0 0.024 0 0.024 0 0 0 0 0 0 0 0 0 0 0 0 0 0 0 0 0 0 0 0 0 0 0 0 0 0 0 0 0 0 0 0 0 0 0 0 0 0 0 0 0 0.021 0 0.021420 0 0 0 0 0 0.013 0 0.012 0 0.025 0 0.025 0 0 0 0 0 0 0 0 0 0 0 0 0 0 0 0 0 0 0 0 0 0 0 0 0 0 0 0 0 0 0 0 0 0 0 0 0 0 0 0 0 0.022 0 0.022480 0 0 0 0 0 0.013 0 0.013 0 0.026 0 0.026 0 0 0 0 0 0 0 0 0 0 0 0 0 0 0 0 0 0 0 0 0 0 0 0 0 0 0 0 0 0 0 0 0 0 0 0 0 0 0 0 0 0.023 0 0.022540 0 0 0 0 0 0.013 0 0.013 0 0.026 0 0.026 0 0 0 0 0 0 0 0 0 0 0 0 0 0 0 0 0 0 0 0 0 0 0 0 0 0 0 0 0 0 0 0 0 0 0 0 0 0 0 0 0 0.023 0 0.023600 0 0 0 0 0 0.014 0 0.013 0 0.027 0 0.027 0 0 0 0 0 0 0 0 0 0 0 0 0 0 0 0 0 0 0 0 0 0 0 0 0 0 0 0 0 0 0 0 0 0 0 0 0 0 0 0 0 0.024 0 0.024660 0 0 0 0 0 0.014 0 0.013 0 0.027 0 0.027 0 0 0 0 0 0 0 0 0 0 0 0 0 0 0 0 0 0 0 0 0 0 0 0 0 0 0 0 0 0 0 0 0 0 0 0 0 0 0 0 0 0.024 0 0.024720 0 0 0 0 0 0.014 0 0.013 0 0.028 0 0.028 0 0 0 0 0 0 0 0 0 0 0 0 0 0 0 0 0 0 0 0 0 0 0 0 0 0 0 0 0 0 0 0 0 0 0 0 0 0 0 0 0 0.024 0 0.024
Title : beta ld trucksVersion : Emfac2007 V2.3 Nov 1 2006Run Date : 2010/01/14 17:28:14Scen Year: 2010 -- All model years in the range 1991 to 2010 selectedSeason : WinterArea : South Coast AQMD*****************************************************************************************Year: 2010 -- Model Years 1991 to 2010 Inclusive -- Winter Emfac2007 Emission Factors: V2.3 Nov 1 2006
District Average District Average South Coast AQMD
Table 4: Hot Soak Emissions (grams/trip)
Pollutant Name: Reactive Org Gas Temperature: 70F Relative Humidity: ALL
Time LDA LDA LDA LDA LDT1 LDT1 LDT1 LDT1 LDT2 LDT2 LDT2 LDT2 MDV MDV MDV MDV LHD1 LHD1 LHD1 LHD1 LHD2 LHD2 LHD2 LHD2 MHD MHD MHD MHD HHD HHD HHD HHD OBUS OBUS OBUS OBUS UBUS UBUS UBUS UBUS MCY MCY MCY MCY SBUS SBUS SBUS SBUS MH MH MH MH ALL ALL ALL ALL min NCAT CAT DSL ALL NCAT CAT DSL ALL NCAT CAT DSL ALL NCAT CAT DSL ALL NCAT CAT DSL ALL NCAT CAT DSL ALL NCAT CAT DSL ALL NCAT CAT DSL ALL NCAT CAT DSL ALL NCAT CAT DSL ALL NCAT CAT DSL ALL NCAT CAT DSL ALL NCAT CAT DSL ALL NCAT CAT DSL ALL
5 0 0 0 0 0 0.045 0 0.043 0 0.046 0 0.046 0 0 0 0 0 0 0 0 0 0 0 0 0 0 0 0 0 0 0 0 0 0 0 0 0 0 0 0 0 0 0 0 0 0 0 0 0 0 0 0 0 0.045 0 0.04510 0 0 0 0 0 0.083 0 0.081 0 0.085 0 0.085 0 0 0 0 0 0 0 0 0 0 0 0 0 0 0 0 0 0 0 0 0 0 0 0 0 0 0 0 0 0 0 0 0 0 0 0 0 0 0 0 0 0.084 0 0.08420 0 0 0 0 0 0.144 0 0.14 0 0.147 0 0.147 0 0 0 0 0 0 0 0 0 0 0 0 0 0 0 0 0 0 0 0 0 0 0 0 0 0 0 0 0 0 0 0 0 0 0 0 0 0 0 0 0 0.146 0 0.14530 0 0 0 0 0 0.187 0 0.182 0 0.192 0 0.192 0 0 0 0 0 0 0 0 0 0 0 0 0 0 0 0 0 0 0 0 0 0 0 0 0 0 0 0 0 0 0 0 0 0 0 0 0 0 0 0 0 0.191 0 0.18940 0 0 0 0 0 0.204 0 0.199 0 0.21 0 0.21 0 0 0 0 0 0 0 0 0 0 0 0 0 0 0 0 0 0 0 0 0 0 0 0 0 0 0 0 0 0 0 0 0 0 0 0 0 0 0 0 0 0.208 0 0.207
Hot soak results are scaled to reflect zero emissions for trip lengths of less than 5 minutes (about 25% of in-use trips).
Title : beta ld trucksVersion : Emfac2007 V2.3 Nov 1 2006Run Date : 2010/01/14 17:28:14Scen Year: 2010 -- All model years in the range 1991 to 2010 selectedSeason : WinterArea : South Coast AQMD*****************************************************************************************Year: 2010 -- Model Years 1991 to 2010 Inclusive -- Winter Emfac2007 Emission Factors: V2.3 Nov 1 2006
District Average District Average South Coast AQMD
Table 5a: Partial Day Diurnal Loss Emissions (grams/hour)
Pollutant Name: Reactive Org Gas Temperature: ALL Relative Humidity: ALL
Temp LDA LDA LDA LDA LDT1 LDT1 LDT1 LDT1 LDT2 LDT2 LDT2 LDT2 MDV MDV MDV MDV LHD1 LHD1 LHD1 LHD1 LHD2 LHD2 LHD2 LHD2 MHD MHD MHD MHD HHD HHD HHD HHD OBUS OBUS OBUS OBUS UBUS UBUS UBUS UBUS MCY MCY MCY MCY SBUS SBUS SBUS SBUS MH MH MH MH ALL ALL ALL ALLdegF NCAT CAT DSL ALL NCAT CAT DSL ALL NCAT CAT DSL ALL NCAT CAT DSL ALL NCAT CAT DSL ALL NCAT CAT DSL ALL NCAT CAT DSL ALL NCAT CAT DSL ALL NCAT CAT DSL ALL NCAT CAT DSL ALL NCAT CAT DSL ALL NCAT CAT DSL ALL NCAT CAT DSL ALL NCAT CAT DSL ALL
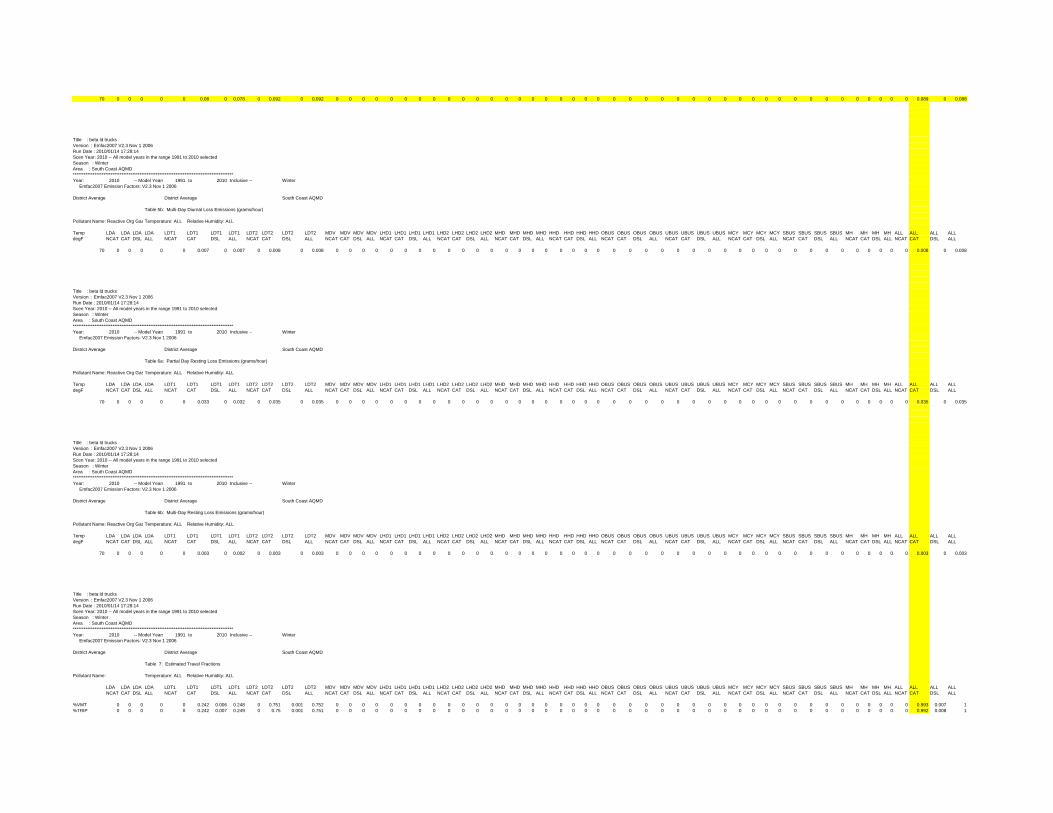
70 0 0 0 0 0 0.08 0 0.078 0 0.092 0 0.092 0 0 0 0 0 0 0 0 0 0 0 0 0 0 0 0 0 0 0 0 0 0 0 0 0 0 0 0 0 0 0 0 0 0 0 0 0 0 0 0 0 0.089 0 0.088
Title : beta ld trucksVersion : Emfac2007 V2.3 Nov 1 2006Run Date : 2010/01/14 17:28:14Scen Year: 2010 -- All model years in the range 1991 to 2010 selectedSeason : WinterArea : South Coast AQMD*****************************************************************************************Year: 2010 -- Model Years 1991 to 2010 Inclusive -- Winter Emfac2007 Emission Factors: V2.3 Nov 1 2006
District Average District Average South Coast AQMD
Table 5b: Multi-Day Diurnal Loss Emissions (grams/hour)
Pollutant Name: Reactive Org Gas Temperature: ALL Relative Humidity: ALL
Temp LDA LDA LDA LDA LDT1 LDT1 LDT1 LDT1 LDT2 LDT2 LDT2 LDT2 MDV MDV MDV MDV LHD1 LHD1 LHD1 LHD1 LHD2 LHD2 LHD2 LHD2 MHD MHD MHD MHD HHD HHD HHD HHD OBUS OBUS OBUS OBUS UBUS UBUS UBUS UBUS MCY MCY MCY MCY SBUS SBUS SBUS SBUS MH MH MH MH ALL ALL ALL ALLdegF NCAT CAT DSL ALL NCAT CAT DSL ALL NCAT CAT DSL ALL NCAT CAT DSL ALL NCAT CAT DSL ALL NCAT CAT DSL ALL NCAT CAT DSL ALL NCAT CAT DSL ALL NCAT CAT DSL ALL NCAT CAT DSL ALL NCAT CAT DSL ALL NCAT CAT DSL ALL NCAT CAT DSL ALL NCAT CAT DSL ALL
70 0 0 0 0 0 0.007 0 0.007 0 0.008 0 0.008 0 0 0 0 0 0 0 0 0 0 0 0 0 0 0 0 0 0 0 0 0 0 0 0 0 0 0 0 0 0 0 0 0 0 0 0 0 0 0 0 0 0.008 0 0.008
Title : beta ld trucksVersion : Emfac2007 V2.3 Nov 1 2006Run Date : 2010/01/14 17:28:14Scen Year: 2010 -- All model years in the range 1991 to 2010 selectedSeason : WinterArea : South Coast AQMD*****************************************************************************************Year: 2010 -- Model Years 1991 to 2010 Inclusive -- Winter Emfac2007 Emission Factors: V2.3 Nov 1 2006
District Average District Average South Coast AQMD
Table 6a: Partial Day Resting Loss Emissions (grams/hour)
Pollutant Name: Reactive Org Gas Temperature: ALL Relative Humidity: ALL
Temp LDA LDA LDA LDA LDT1 LDT1 LDT1 LDT1 LDT2 LDT2 LDT2 LDT2 MDV MDV MDV MDV LHD1 LHD1 LHD1 LHD1 LHD2 LHD2 LHD2 LHD2 MHD MHD MHD MHD HHD HHD HHD HHD OBUS OBUS OBUS OBUS UBUS UBUS UBUS UBUS MCY MCY MCY MCY SBUS SBUS SBUS SBUS MH MH MH MH ALL ALL ALL ALLdegF NCAT CAT DSL ALL NCAT CAT DSL ALL NCAT CAT DSL ALL NCAT CAT DSL ALL NCAT CAT DSL ALL NCAT CAT DSL ALL NCAT CAT DSL ALL NCAT CAT DSL ALL NCAT CAT DSL ALL NCAT CAT DSL ALL NCAT CAT DSL ALL NCAT CAT DSL ALL NCAT CAT DSL ALL NCAT CAT DSL ALL
70 0 0 0 0 0 0.033 0 0.032 0 0.035 0 0.035 0 0 0 0 0 0 0 0 0 0 0 0 0 0 0 0 0 0 0 0 0 0 0 0 0 0 0 0 0 0 0 0 0 0 0 0 0 0 0 0 0 0.035 0 0.035
Title : beta ld trucksVersion : Emfac2007 V2.3 Nov 1 2006Run Date : 2010/01/14 17:28:14Scen Year: 2010 -- All model years in the range 1991 to 2010 selectedSeason : WinterArea : South Coast AQMD*****************************************************************************************Year: 2010 -- Model Years 1991 to 2010 Inclusive -- Winter Emfac2007 Emission Factors: V2.3 Nov 1 2006
District Average District Average South Coast AQMD
Table 6b: Multi-Day Resting Loss Emissions (grams/hour)
Pollutant Name: Reactive Org Gas Temperature: ALL Relative Humidity: ALL
Temp LDA LDA LDA LDA LDT1 LDT1 LDT1 LDT1 LDT2 LDT2 LDT2 LDT2 MDV MDV MDV MDV LHD1 LHD1 LHD1 LHD1 LHD2 LHD2 LHD2 LHD2 MHD MHD MHD MHD HHD HHD HHD HHD OBUS OBUS OBUS OBUS UBUS UBUS UBUS UBUS MCY MCY MCY MCY SBUS SBUS SBUS SBUS MH MH MH MH ALL ALL ALL ALLdegF NCAT CAT DSL ALL NCAT CAT DSL ALL NCAT CAT DSL ALL NCAT CAT DSL ALL NCAT CAT DSL ALL NCAT CAT DSL ALL NCAT CAT DSL ALL NCAT CAT DSL ALL NCAT CAT DSL ALL NCAT CAT DSL ALL NCAT CAT DSL ALL NCAT CAT DSL ALL NCAT CAT DSL ALL NCAT CAT DSL ALL
70 0 0 0 0 0 0.003 0 0.002 0 0.003 0 0.003 0 0 0 0 0 0 0 0 0 0 0 0 0 0 0 0 0 0 0 0 0 0 0 0 0 0 0 0 0 0 0 0 0 0 0 0 0 0 0 0 0 0.003 0 0.003
Title : beta ld trucksVersion : Emfac2007 V2.3 Nov 1 2006Run Date : 2010/01/14 17:28:14Scen Year: 2010 -- All model years in the range 1991 to 2010 selectedSeason : WinterArea : South Coast AQMD*****************************************************************************************Year: 2010 -- Model Years 1991 to 2010 Inclusive -- Winter Emfac2007 Emission Factors: V2.3 Nov 1 2006
District Average District Average South Coast AQMD
Table 7: Estimated Travel Fractions
Pollutant Name: Temperature: ALL Relative Humidity: ALL
LDA LDA LDA LDA LDT1 LDT1 LDT1 LDT1 LDT2 LDT2 LDT2 LDT2 MDV MDV MDV MDV LHD1 LHD1 LHD1 LHD1 LHD2 LHD2 LHD2 LHD2 MHD MHD MHD MHD HHD HHD HHD HHD OBUS OBUS OBUS OBUS UBUS UBUS UBUS UBUS MCY MCY MCY MCY SBUS SBUS SBUS SBUS MH MH MH MH ALL ALL ALL ALLNCAT CAT DSL ALL NCAT CAT DSL ALL NCAT CAT DSL ALL NCAT CAT DSL ALL NCAT CAT DSL ALL NCAT CAT DSL ALL NCAT CAT DSL ALL NCAT CAT DSL ALL NCAT CAT DSL ALL NCAT CAT DSL ALL NCAT CAT DSL ALL NCAT CAT DSL ALL NCAT CAT DSL ALL NCAT CAT DSL ALL
%VMT 0 0 0 0 0 0.242 0.006 0.248 0 0.751 0.001 0.752 0 0 0 0 0 0 0 0 0 0 0 0 0 0 0 0 0 0 0 0 0 0 0 0 0 0 0 0 0 0 0 0 0 0 0 0 0 0 0 0 0 0.993 0.007 1%TRIP 0 0 0 0 0 0.242 0.007 0.249 0 0.75 0.001 0.751 0 0 0 0 0 0 0 0 0 0 0 0 0 0 0 0 0 0 0 0 0 0 0 0 0 0 0 0 0 0 0 0 0 0 0 0 0 0 0 0 0 0.992 0.008 1
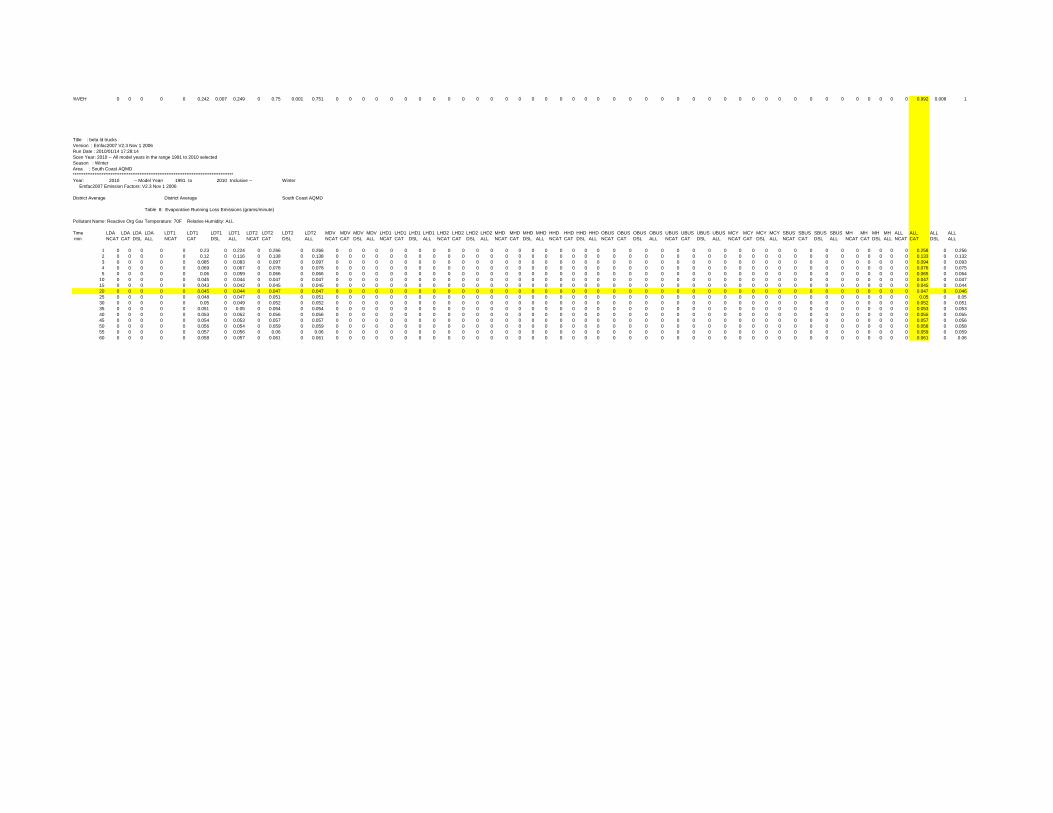
%VEH 0 0 0 0 0 0.242 0.007 0.249 0 0.75 0.001 0.751 0 0 0 0 0 0 0 0 0 0 0 0 0 0 0 0 0 0 0 0 0 0 0 0 0 0 0 0 0 0 0 0 0 0 0 0 0 0 0 0 0 0.992 0.008 1
Title : beta ld trucksVersion : Emfac2007 V2.3 Nov 1 2006Run Date : 2010/01/14 17:28:14Scen Year: 2010 -- All model years in the range 1991 to 2010 selectedSeason : WinterArea : South Coast AQMD*****************************************************************************************Year: 2010 -- Model Years 1991 to 2010 Inclusive -- Winter Emfac2007 Emission Factors: V2.3 Nov 1 2006
District Average District Average South Coast AQMD
Table 8: Evaporative Running Loss Emissions (grams/minute)
Pollutant Name: Reactive Org Gas Temperature: 70F Relative Humidity: ALL
Time LDA LDA LDA LDA LDT1 LDT1 LDT1 LDT1 LDT2 LDT2 LDT2 LDT2 MDV MDV MDV MDV LHD1 LHD1 LHD1 LHD1 LHD2 LHD2 LHD2 LHD2 MHD MHD MHD MHD HHD HHD HHD HHD OBUS OBUS OBUS OBUS UBUS UBUS UBUS UBUS MCY MCY MCY MCY SBUS SBUS SBUS SBUS MH MH MH MH ALL ALL ALL ALL min NCAT CAT DSL ALL NCAT CAT DSL ALL NCAT CAT DSL ALL NCAT CAT DSL ALL NCAT CAT DSL ALL NCAT CAT DSL ALL NCAT CAT DSL ALL NCAT CAT DSL ALL NCAT CAT DSL ALL NCAT CAT DSL ALL NCAT CAT DSL ALL NCAT CAT DSL ALL NCAT CAT DSL ALL NCAT CAT DSL ALL
1 0 0 0 0 0 0.23 0 0.224 0 0.266 0 0.266 0 0 0 0 0 0 0 0 0 0 0 0 0 0 0 0 0 0 0 0 0 0 0 0 0 0 0 0 0 0 0 0 0 0 0 0 0 0 0 0 0 0.258 0 0.2562 0 0 0 0 0 0.12 0 0.116 0 0.138 0 0.138 0 0 0 0 0 0 0 0 0 0 0 0 0 0 0 0 0 0 0 0 0 0 0 0 0 0 0 0 0 0 0 0 0 0 0 0 0 0 0 0 0 0.133 0 0.1323 0 0 0 0 0 0.085 0 0.083 0 0.097 0 0.097 0 0 0 0 0 0 0 0 0 0 0 0 0 0 0 0 0 0 0 0 0 0 0 0 0 0 0 0 0 0 0 0 0 0 0 0 0 0 0 0 0 0.094 0 0.0934 0 0 0 0 0 0.069 0 0.067 0 0.078 0 0.078 0 0 0 0 0 0 0 0 0 0 0 0 0 0 0 0 0 0 0 0 0 0 0 0 0 0 0 0 0 0 0 0 0 0 0 0 0 0 0 0 0 0.076 0 0.0755 0 0 0 0 0 0.06 0 0.059 0 0.066 0 0.066 0 0 0 0 0 0 0 0 0 0 0 0 0 0 0 0 0 0 0 0 0 0 0 0 0 0 0 0 0 0 0 0 0 0 0 0 0 0 0 0 0 0.065 0 0.064
10 0 0 0 0 0 0.045 0 0.044 0 0.047 0 0.047 0 0 0 0 0 0 0 0 0 0 0 0 0 0 0 0 0 0 0 0 0 0 0 0 0 0 0 0 0 0 0 0 0 0 0 0 0 0 0 0 0 0.047 0 0.04715 0 0 0 0 0 0.043 0 0.042 0 0.045 0 0.045 0 0 0 0 0 0 0 0 0 0 0 0 0 0 0 0 0 0 0 0 0 0 0 0 0 0 0 0 0 0 0 0 0 0 0 0 0 0 0 0 0 0.045 0 0.04420 0 0 0 0 0 0.045 0 0.044 0 0.047 0 0.047 0 0 0 0 0 0 0 0 0 0 0 0 0 0 0 0 0 0 0 0 0 0 0 0 0 0 0 0 0 0 0 0 0 0 0 0 0 0 0 0 0 0.047 0 0.04625 0 0 0 0 0 0.048 0 0.047 0 0.051 0 0.051 0 0 0 0 0 0 0 0 0 0 0 0 0 0 0 0 0 0 0 0 0 0 0 0 0 0 0 0 0 0 0 0 0 0 0 0 0 0 0 0 0 0.05 0 0.0530 0 0 0 0 0 0.05 0 0.049 0 0.052 0 0.052 0 0 0 0 0 0 0 0 0 0 0 0 0 0 0 0 0 0 0 0 0 0 0 0 0 0 0 0 0 0 0 0 0 0 0 0 0 0 0 0 0 0.052 0 0.05135 0 0 0 0 0 0.051 0 0.05 0 0.054 0 0.054 0 0 0 0 0 0 0 0 0 0 0 0 0 0 0 0 0 0 0 0 0 0 0 0 0 0 0 0 0 0 0 0 0 0 0 0 0 0 0 0 0 0.053 0 0.05340 0 0 0 0 0 0.053 0 0.052 0 0.056 0 0.056 0 0 0 0 0 0 0 0 0 0 0 0 0 0 0 0 0 0 0 0 0 0 0 0 0 0 0 0 0 0 0 0 0 0 0 0 0 0 0 0 0 0.055 0 0.05545 0 0 0 0 0 0.054 0 0.053 0 0.057 0 0.057 0 0 0 0 0 0 0 0 0 0 0 0 0 0 0 0 0 0 0 0 0 0 0 0 0 0 0 0 0 0 0 0 0 0 0 0 0 0 0 0 0 0.057 0 0.05650 0 0 0 0 0 0.056 0 0.054 0 0.059 0 0.059 0 0 0 0 0 0 0 0 0 0 0 0 0 0 0 0 0 0 0 0 0 0 0 0 0 0 0 0 0 0 0 0 0 0 0 0 0 0 0 0 0 0.058 0 0.05855 0 0 0 0 0 0.057 0 0.056 0 0.06 0 0.06 0 0 0 0 0 0 0 0 0 0 0 0 0 0 0 0 0 0 0 0 0 0 0 0 0 0 0 0 0 0 0 0 0 0 0 0 0 0 0 0 0 0.059 0 0.05960 0 0 0 0 0 0.058 0 0.057 0 0.061 0 0.061 0 0 0 0 0 0 0 0 0 0 0 0 0 0 0 0 0 0 0 0 0 0 0 0 0 0 0 0 0 0 0 0 0 0 0 0 0 0 0 0 0 0.061 0 0.06
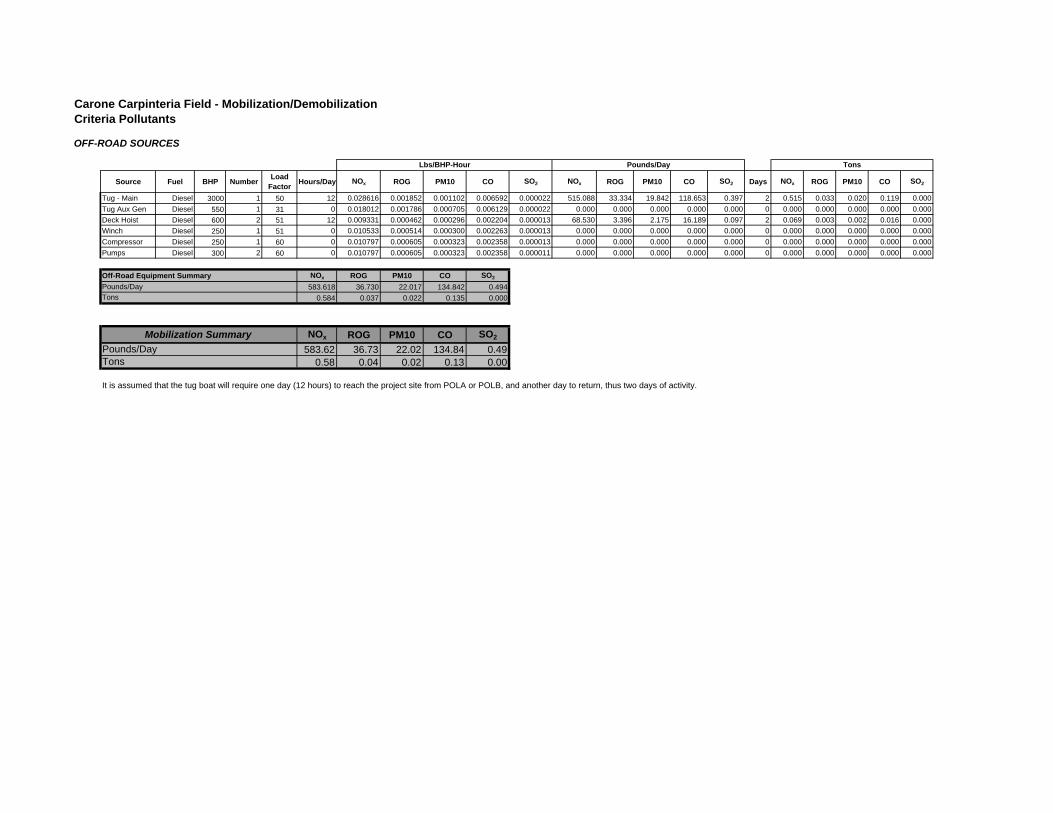
Carone Carpinteria Field - Mobilization/DemobilizationCriteria Pollutants
OFF-ROAD SOURCES
Source Fuel BHP NumberLoad
FactorHours/Day NOx ROG PM10 CO SO2 NOx ROG PM10 CO SO2 Days NOx ROG PM10 CO SO2
Tug - Main Diesel 3000 1 50 12 0.028616 0.001852 0.001102 0.006592 0.000022 515.088 33.334 19.842 118.653 0.397 2 0.515 0.033 0.020 0.119 0.000
Tug Aux Gen Diesel 550 1 31 0 0.018012 0.001786 0.000705 0.006129 0.000022 0.000 0.000 0.000 0.000 0.000 0 0.000 0.000 0.000 0.000 0.000
Deck Hoist Diesel 600 2 51 12 0.009331 0.000462 0.000296 0.002204 0.000013 68.530 3.396 2.175 16.189 0.097 2 0.069 0.003 0.002 0.016 0.000
Winch Diesel 250 1 51 0 0.010533 0.000514 0.000300 0.002263 0.000013 0.000 0.000 0.000 0.000 0.000 0 0.000 0.000 0.000 0.000 0.000
Compressor Diesel 250 1 60 0 0.010797 0.000605 0.000323 0.002358 0.000013 0.000 0.000 0.000 0.000 0.000 0 0.000 0.000 0.000 0.000 0.000
Pumps Diesel 300 2 60 0 0.010797 0.000605 0.000323 0.002358 0.000011 0.000 0.000 0.000 0.000 0.000 0 0.000 0.000 0.000 0.000 0.000
NOx ROG PM10 CO SO2
583.618 36.730 22.017 134.842 0.494
0.584 0.037 0.022 0.135 0.000
NOx ROG PM10 CO SO2
583.62 36.73 22.02 134.84 0.490.58 0.04 0.02 0.13 0.00
It is assumed that the tug boat will require one day (12 hours) to reach the project site from POLA or POLB, and another day to return, thus two days of activity.
Pounds/Day Tons
Pounds/DayTons
Off-Road Equipment Summary
Pounds/Day
Tons
Mobilization Summary
Lbs/BHP-Hour
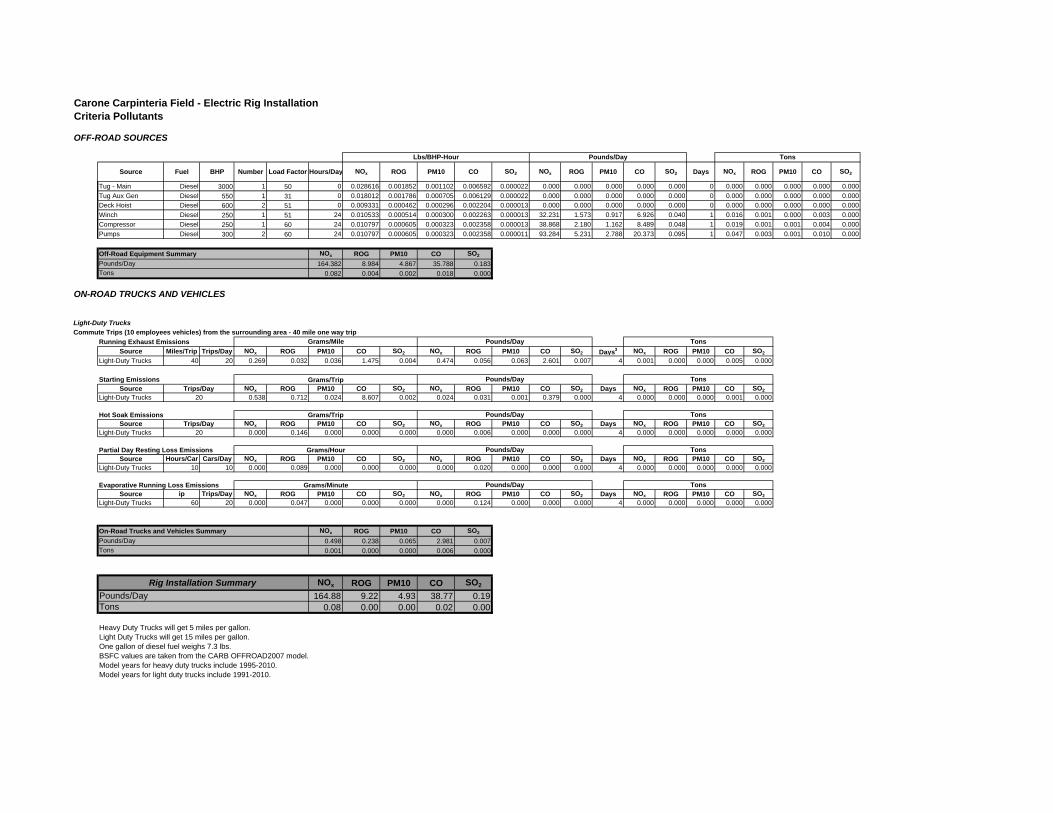
Carone Carpinteria Field - Electric Rig InstallationCriteria Pollutants
OFF-ROAD SOURCES
Source Fuel BHP Number Load Factor Hours/Day NOx ROG PM10 CO SO2 NOx ROG PM10 CO SO2 Days NOx ROG PM10 CO SO2
Tug - Main Diesel 3000 1 50 0 0.028616 0.001852 0.001102 0.006592 0.000022 0.000 0.000 0.000 0.000 0.000 0 0.000 0.000 0.000 0.000 0.000
Tug Aux Gen Diesel 550 1 31 0 0.018012 0.001786 0.000705 0.006129 0.000022 0.000 0.000 0.000 0.000 0.000 0 0.000 0.000 0.000 0.000 0.000
Deck Hoist Diesel 600 2 51 0 0.009331 0.000462 0.000296 0.002204 0.000013 0.000 0.000 0.000 0.000 0.000 0 0.000 0.000 0.000 0.000 0.000
Winch Diesel 250 1 51 24 0.010533 0.000514 0.000300 0.002263 0.000013 32.231 1.573 0.917 6.926 0.040 1 0.016 0.001 0.000 0.003 0.000
Compressor Diesel 250 1 60 24 0.010797 0.000605 0.000323 0.002358 0.000013 38.868 2.180 1.162 8.489 0.048 1 0.019 0.001 0.001 0.004 0.000
Pumps Diesel 300 2 60 24 0.010797 0.000605 0.000323 0.002358 0.000011 93.284 5.231 2.788 20.373 0.095 1 0.047 0.003 0.001 0.010 0.000
NOx ROG PM10 CO SO2
164.382 8.984 4.867 35.788 0.183
0.082 0.004 0.002 0.018 0.000
ON-ROAD TRUCKS AND VEHICLES
Light-Duty Trucks
Commute Trips (10 employees vehicles) from the surrounding area - 40 mile one way trip
Running Exhaust Emissions
Source Miles/Trip Trips/Day NOx ROG PM10 CO SO2 NOx ROG PM10 CO SO2 Days3 NOx ROG PM10 CO SO2
Light-Duty Trucks 40 20 0.269 0.032 0.036 1.475 0.004 0.474 0.056 0.063 2.601 0.007 4 0.001 0.000 0.000 0.005 0.000
Starting EmissionsSource NOx ROG PM10 CO SO2 NOx ROG PM10 CO SO2 Days NOx ROG PM10 CO SO2
Light-Duty Trucks 0.538 0.712 0.024 8.607 0.002 0.024 0.031 0.001 0.379 0.000 4 0.000 0.000 0.000 0.001 0.000
Hot Soak EmissionsSource NOx ROG PM10 CO SO2 NOx ROG PM10 CO SO2 Days NOx ROG PM10 CO SO2
Light-Duty Trucks 0.000 0.146 0.000 0.000 0.000 0.000 0.006 0.000 0.000 0.000 4 0.000 0.000 0.000 0.000 0.000
Partial Day Resting Loss EmissionsSource Hours/Car Cars/Day NOx ROG PM10 CO SO2 NOx ROG PM10 CO SO2 Days NOx ROG PM10 CO SO2
Light-Duty Trucks 10 10 0.000 0.089 0.000 0.000 0.000 0.000 0.020 0.000 0.000 0.000 4 0.000 0.000 0.000 0.000 0.000
Evaporative Running Loss EmissionsSource ip Trips/Day NOx ROG PM10 CO SO2 NOx ROG PM10 CO SO2 Days NOx ROG PM10 CO SO2
Light-Duty Trucks 60 20 0.000 0.047 0.000 0.000 0.000 0.000 0.124 0.000 0.000 0.000 4 0.000 0.000 0.000 0.000 0.000
NOx ROG PM10 CO SO2
0.498 0.238 0.065 2.981 0.007
0.001 0.000 0.000 0.006 0.000
NOx ROG PM10 CO SO2
164.88 9.22 4.93 38.77 0.190.08 0.00 0.00 0.02 0.00
Heavy Duty Trucks will get 5 miles per gallon.Light Duty Trucks will get 15 miles per gallon. One gallon of diesel fuel weighs 7.3 lbs. BSFC values are taken from the CARB OFFROAD2007 model. Model years for heavy duty trucks include 1995-2010. Model years for light duty trucks include 1991-2010.
Tons
Lbs/BHP-Hour
Grams/Mile Pounds/Day
Off-Road Equipment Summary
Grams/Trip
Pounds/Day
Trips/Day
Tons
On-Road Trucks and Vehicles Summary
Pounds/Day
20
Pounds/Day TonsTrips/Day
Grams/Hour Pounds/Day
20
Pounds/Day
Tons
Rig Installation Summary
Tons
Tons
Tons
Tons
Grams/Trip Pounds/Day
Pounds/Day
Grams/Minute Pounds/Day Tons
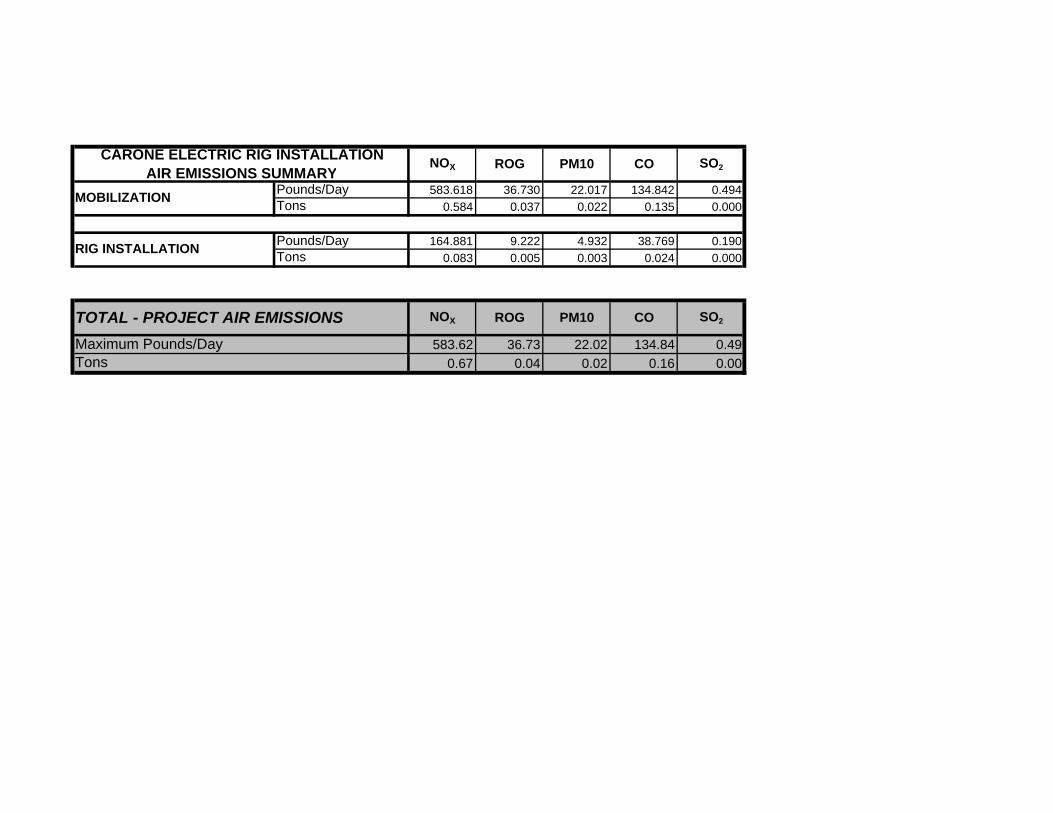
583.618 36.730 22.017 134.842 0.494
0.584 0.037 0.022 0.135 0.000
164.881 9.222 4.932 38.769 0.190
0.083 0.005 0.003 0.024 0.000
583.62 36.73 22.02 134.84 0.49
0.67 0.04 0.02 0.16 0.00
CARONE ELECTRIC RIG INSTALLATION AIR EMISSIONS SUMMARY
MOBILIZATIONPounds/DayTons
SO2
NOX ROG PM10 CO SO2
Tons
RIG INSTALLATIONPounds/DayTons
TOTAL - PROJECT AIR EMISSIONS
Maximum Pounds/Day
NOX ROG PM10 CO
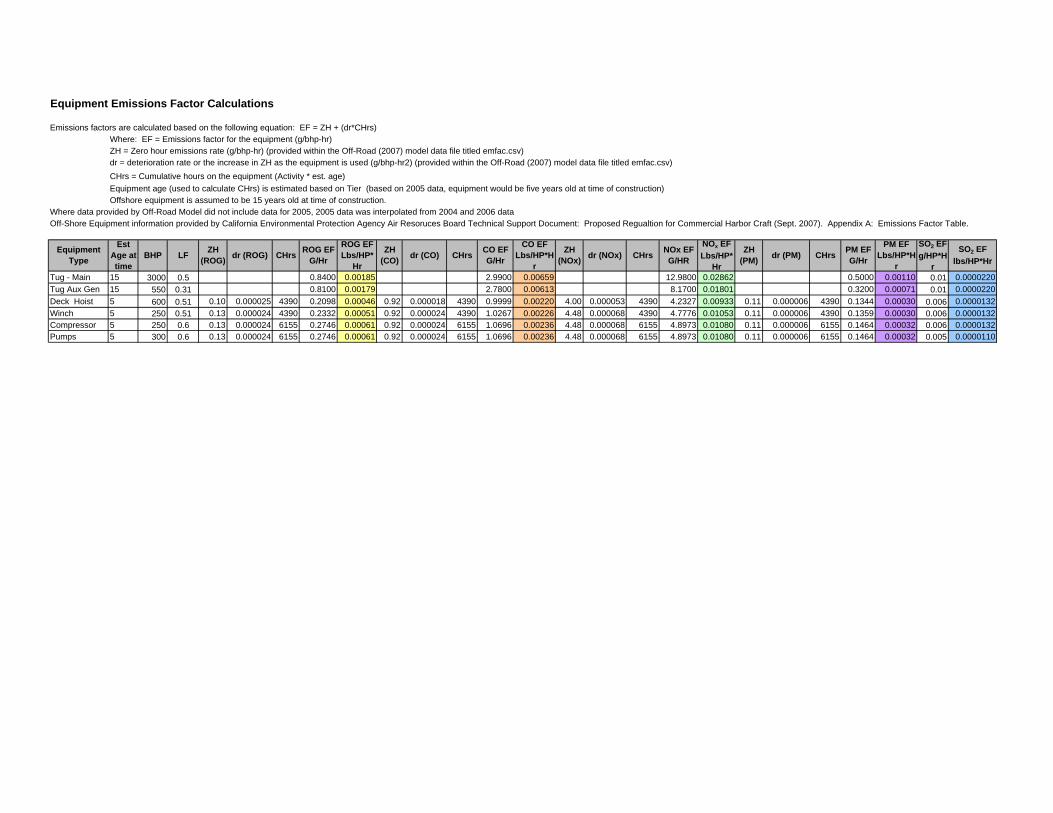
Equipment Emissions Factor Calculations
Emissions factors are calculated based on the following equation: EF = ZH + (dr*CHrs)Where: EF = Emissions factor for the equipment (g/bhp-hr)ZH = Zero hour emissions rate (g/bhp-hr) (provided within the Off-Road (2007) model data file titled emfac.csv) dr = deterioration rate or the increase in ZH as the equipment is used (g/bhp-hr2) (provided within the Off-Road (2007) model data file titled emfac.csv)
CHrs = Cumulative hours on the equipment (Activity * est. age)
Equipment age (used to calculate CHrs) is estimated based on Tier (based on 2005 data, equipment would be five years old at time of construction) Offshore equipment is assumed to be 15 years old at time of construction.
Where data provided by Off-Road Model did not include data for 2005, 2005 data was interpolated from 2004 and 2006 dataOff-Shore Equipment information provided by California Environmental Protection Agency Air Resoruces Board Technical Support Document: Proposed Regualtion for Commercial Harbor Craft (Sept. 2007). Appendix A: Emissions Factor Table.
Tug - Main 15 3000 0.5 0.8400 0.00185 2.9900 0.00659 12.9800 0.02862 0.5000 0.00110 0.01 0.0000220
Tug Aux Gen 15 550 0.31 0.8100 0.00179 2.7800 0.00613 8.1700 0.01801 0.3200 0.00071 0.01 0.0000220
Deck Hoist 5 600 0.51 0.10 0.000025 4390 0.2098 0.00046 0.92 0.000018 4390 0.9999 0.00220 4.00 0.000053 4390 4.2327 0.00933 0.11 0.000006 4390 0.1344 0.00030 0.006 0.0000132
Winch 5 250 0.51 0.13 0.000024 4390 0.2332 0.00051 0.92 0.000024 4390 1.0267 0.00226 4.48 0.000068 4390 4.7776 0.01053 0.11 0.000006 4390 0.1359 0.00030 0.006 0.0000132Compressor 5 250 0.6 0.13 0.000024 6155 0.2746 0.00061 0.92 0.000024 6155 1.0696 0.00236 4.48 0.000068 6155 4.8973 0.01080 0.11 0.000006 6155 0.1464 0.00032 0.006 0.0000132Pumps 5 300 0.6 0.13 0.000024 6155 0.2746 0.00061 0.92 0.000024 6155 1.0696 0.00236 4.48 0.000068 6155 4.8973 0.01080 0.11 0.000006 6155 0.1464 0.00032 0.005 0.0000110
dr (NOx) CHrsdr (ROG)Equipment
TypeBHP LF
ZH (ROG)
Est Age at time
NOx EF G/HR
CHrs ROG EF
G/Hr
ROG EF Lbs/HP*
Hr
ZH (CO)
dr (CO) CHrsCO EF G/Hr
CO EF Lbs/HP*H
r
ZH (NOx)
NOx EF
Lbs/HP*Hr
ZH (PM)
dr (PM)SO2 EF
lbs/HP*HrCHrs
PM EF G/Hr
PM EF Lbs/HP*H
r
SO2 EF
g/HP*Hr
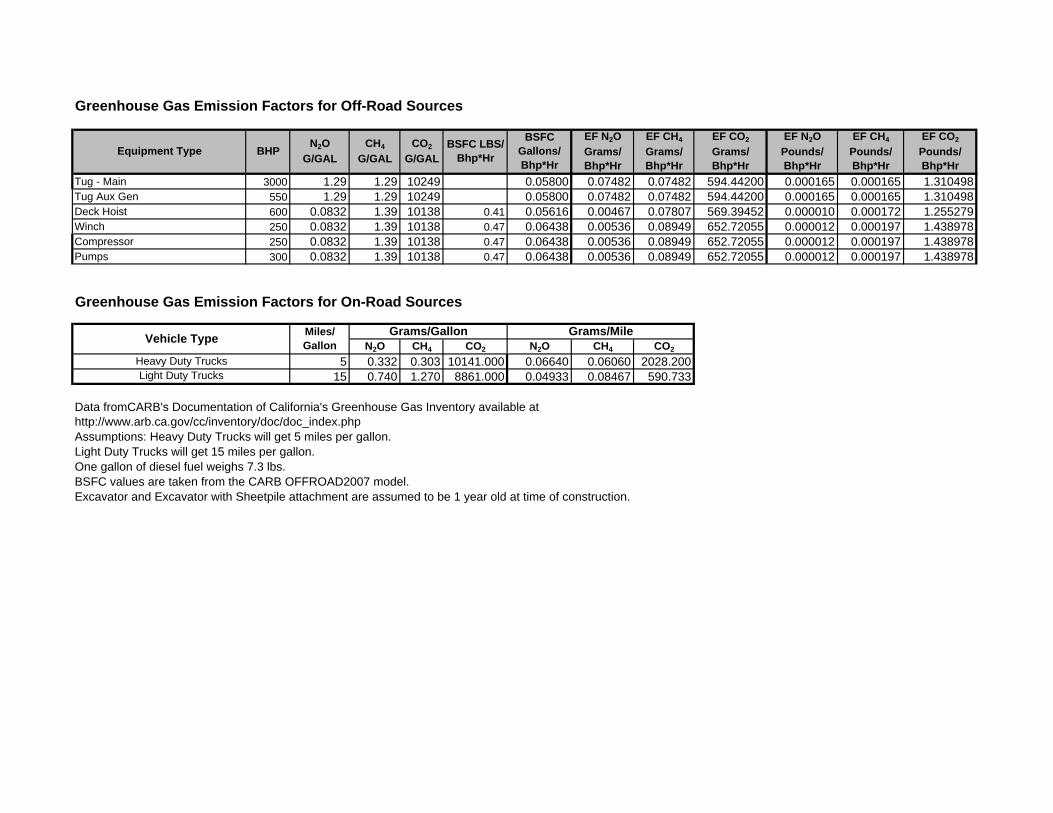
Greenhouse Gas Emission Factors for Off-Road Sources
Tug - Main 3000 1.29 1.29 10249 0.05800 0.07482 0.07482 594.44200 0.000165 0.000165 1.310498Tug Aux Gen 550 1.29 1.29 10249 0.05800 0.07482 0.07482 594.44200 0.000165 0.000165 1.310498Deck Hoist 600 0.0832 1.39 10138 0.41 0.05616 0.00467 0.07807 569.39452 0.000010 0.000172 1.255279Winch 250 0.0832 1.39 10138 0.47 0.06438 0.00536 0.08949 652.72055 0.000012 0.000197 1.438978Compressor 250 0.0832 1.39 10138 0.47 0.06438 0.00536 0.08949 652.72055 0.000012 0.000197 1.438978Pumps 300 0.0832 1.39 10138 0.47 0.06438 0.00536 0.08949 652.72055 0.000012 0.000197 1.438978
Greenhouse Gas Emission Factors for On-Road Sources
N2O CH4 CO2 N2O CH4 CO2
5 0.332 0.303 10141.000 0.06640 0.06060 2028.20015 0.740 1.270 8861.000 0.04933 0.08467 590.733
Assumptions: Heavy Duty Trucks will get 5 miles per gallon.Light Duty Trucks will get 15 miles per gallon. One gallon of diesel fuel weighs 7.3 lbs. BSFC values are taken from the CARB OFFROAD2007 model. Excavator and Excavator with Sheetpile attachment are assumed to be 1 year old at time of construction.
Equipment Type BHPN2O
G/GAL
CH4
G/GAL
EF CO2
Grams/ Bhp*Hr
EF N2O
Pounds/ Bhp*Hr
EF CH4
Pounds/ Bhp*Hr
CO2
G/GAL
EF N2O
Grams/ Bhp*Hr
BSFC LBS/ Bhp*Hr
Data fromCARB's Documentation of California's Greenhouse Gas Inventory available at http://www.arb.ca.gov/cc/inventory/doc/doc_index.php
Heavy Duty TrucksLight Duty Trucks
EF CO2
Pounds/ Bhp*Hr
Vehicle TypeMiles/ Gallon
Grams/Gallon Grams/Mile
EF CH4
Grams/ Bhp*Hr
BSFC Gallons/ Bhp*Hr
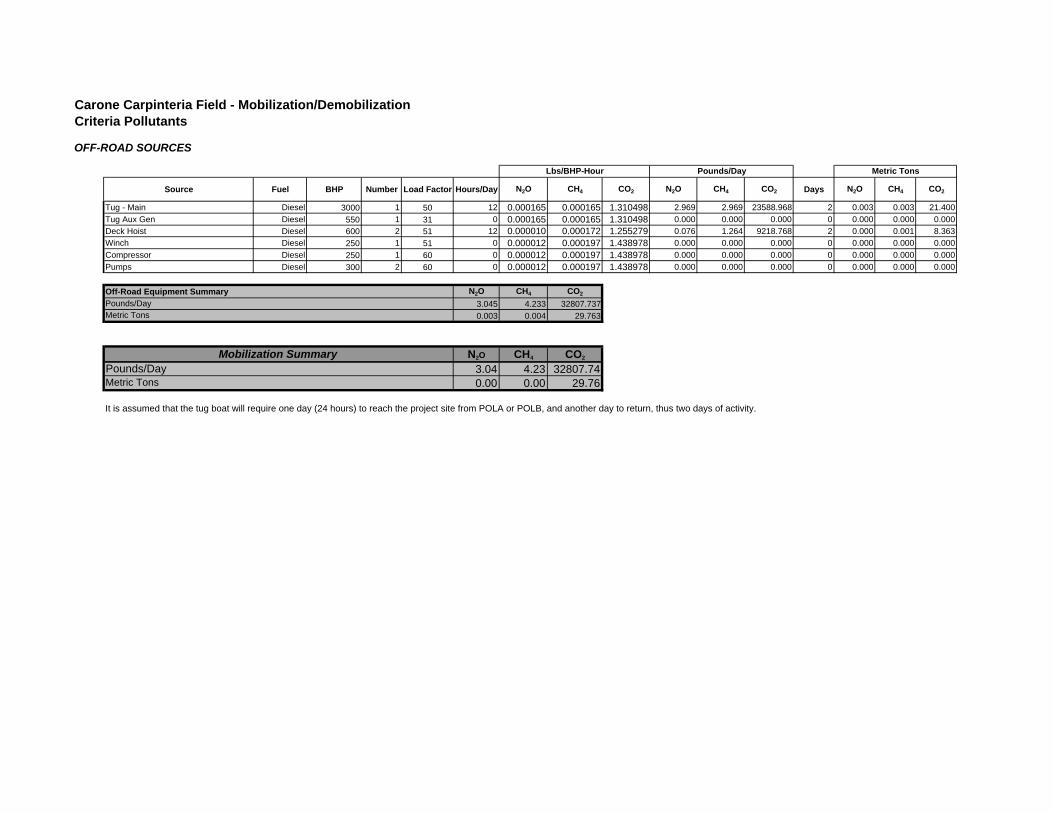
Carone Carpinteria Field - Mobilization/DemobilizationCriteria Pollutants
OFF-ROAD SOURCES
Source Fuel BHP Number Load Factor Hours/Day N2O CH4 CO2 N2O CH4 CO2 Days N2O CH4 CO2
Tug - Main Diesel 3000 1 50 12 0.000165 0.000165 1.310498 2.969 2.969 23588.968 2 0.003 0.003 21.400
Tug Aux Gen Diesel 550 1 31 0 0.000165 0.000165 1.310498 0.000 0.000 0.000 0 0.000 0.000 0.000
Deck Hoist Diesel 600 2 51 12 0.000010 0.000172 1.255279 0.076 1.264 9218.768 2 0.000 0.001 8.363
Winch Diesel 250 1 51 0 0.000012 0.000197 1.438978 0.000 0.000 0.000 0 0.000 0.000 0.000
Compressor Diesel 250 1 60 0 0.000012 0.000197 1.438978 0.000 0.000 0.000 0 0.000 0.000 0.000
Pumps Diesel 300 2 60 0 0.000012 0.000197 1.438978 0.000 0.000 0.000 0 0.000 0.000 0.000
N2O CH4 CO2
3.045 4.233 32807.737
0.003 0.004 29.763
N2O CH4 CO2
3.04 4.23 32807.740.00 0.00 29.76
It is assumed that the tug boat will require one day (24 hours) to reach the project site from POLA or POLB, and another day to return, thus two days of activity.
Metric Tons
Off-Road Equipment Summary
Pounds/DayMetric Tons
Mobilization Summary
Lbs/BHP-Hour Pounds/Day Metric Tons
Pounds/Day
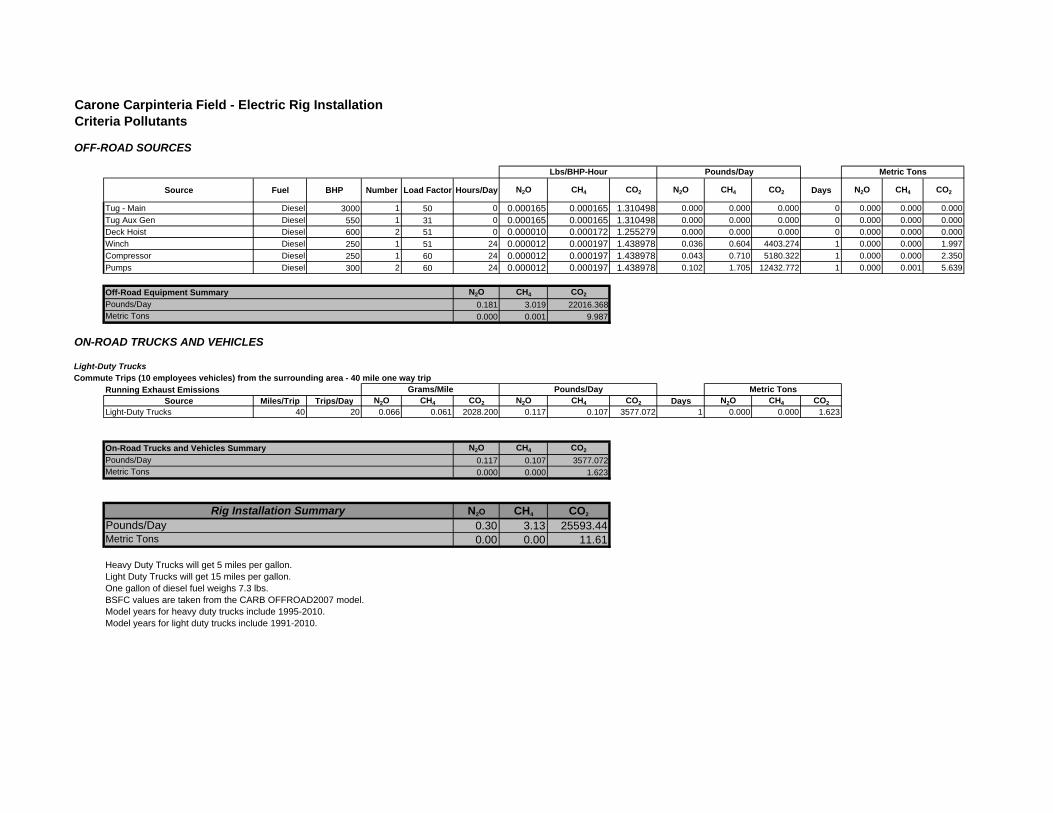
Carone Carpinteria Field - Electric Rig InstallationCriteria Pollutants
OFF-ROAD SOURCES
Source Fuel BHP Number Load Factor Hours/Day N2O CH4 CO2 N2O CH4 CO2 Days N2O CH4 CO2
Tug - Main Diesel 3000 1 50 0 0.000165 0.000165 1.310498 0.000 0.000 0.000 0 0.000 0.000 0.000
Tug Aux Gen Diesel 550 1 31 0 0.000165 0.000165 1.310498 0.000 0.000 0.000 0 0.000 0.000 0.000
Deck Hoist Diesel 600 2 51 0 0.000010 0.000172 1.255279 0.000 0.000 0.000 0 0.000 0.000 0.000
Winch Diesel 250 1 51 24 0.000012 0.000197 1.438978 0.036 0.604 4403.274 1 0.000 0.000 1.997
Compressor Diesel 250 1 60 24 0.000012 0.000197 1.438978 0.043 0.710 5180.322 1 0.000 0.000 2.350
Pumps Diesel 300 2 60 24 0.000012 0.000197 1.438978 0.102 1.705 12432.772 1 0.000 0.001 5.639
N2O CH4 CO2
0.181 3.019 22016.368
0.000 0.001 9.987
ON-ROAD TRUCKS AND VEHICLES
Light-Duty TrucksCommute Trips (10 employees vehicles) from the surrounding area - 40 mile one way trip
Running Exhaust EmissionsSource Miles/Trip Trips/Day N2O CH4 CO2 N2O CH4 CO2 Days N2O CH4 CO2
Light-Duty Trucks 40 20 0.066 0.061 2028.200 0.117 0.107 3577.072 1 0.000 0.000 1.623
N2O CH4 CO2
0.117 0.107 3577.072
0.000 0.000 1.623
N2O CH4 CO2
0.30 3.13 25593.440.00 0.00 11.61
Heavy Duty Trucks will get 5 miles per gallon.Light Duty Trucks will get 15 miles per gallon. One gallon of diesel fuel weighs 7.3 lbs. BSFC values are taken from the CARB OFFROAD2007 model. Model years for heavy duty trucks include 1995-2010. Model years for light duty trucks include 1991-2010.
On-Road Trucks and Vehicles Summary
Pounds/Day
Metric Tons
Lbs/BHP-Hour Pounds/Day Metric Tons
Rig Installation SummaryPounds/DayMetric Tons
Off-Road Equipment Summary
Grams/Mile Pounds/Day
Metric Tons
Pounds/DayMetric Tons
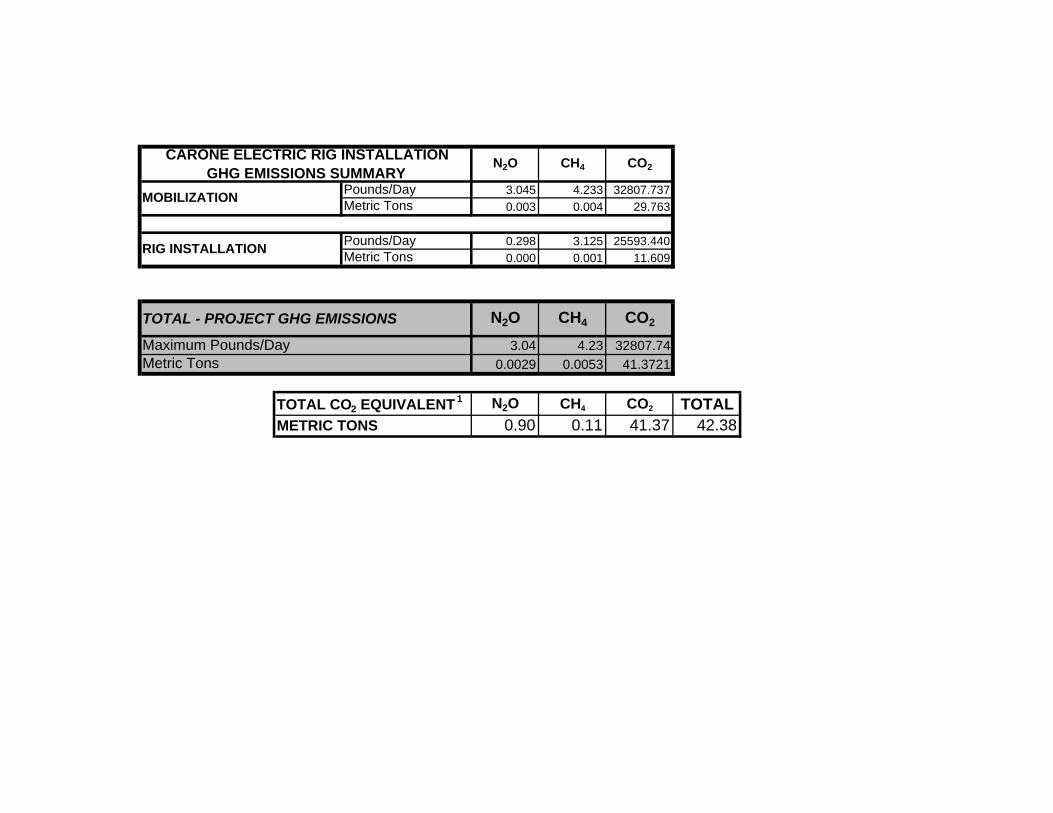
3.045 4.233 32807.737
0.003 0.004 29.763
0.298 3.125 25593.440
0.000 0.001 11.609
3.04 4.23 32807.74
0.0029 0.0053 41.3721
N2O CH4 CO2 TOTAL0.90 0.11 41.37 42.38
N2O CH4 CO2
N2O CH4 CO2
RIG INSTALLATIONPounds/DayMetric Tons
METRIC TONS
TOTAL - PROJECT GHG EMISSIONS
Maximum Pounds/DayMetric Tons
TOTAL CO2 EQUIVALENT 1
CARONE ELECTRIC RIG INSTALLATION GHG EMISSIONS SUMMARY
MOBILIZATIONPounds/DayMetric Tons
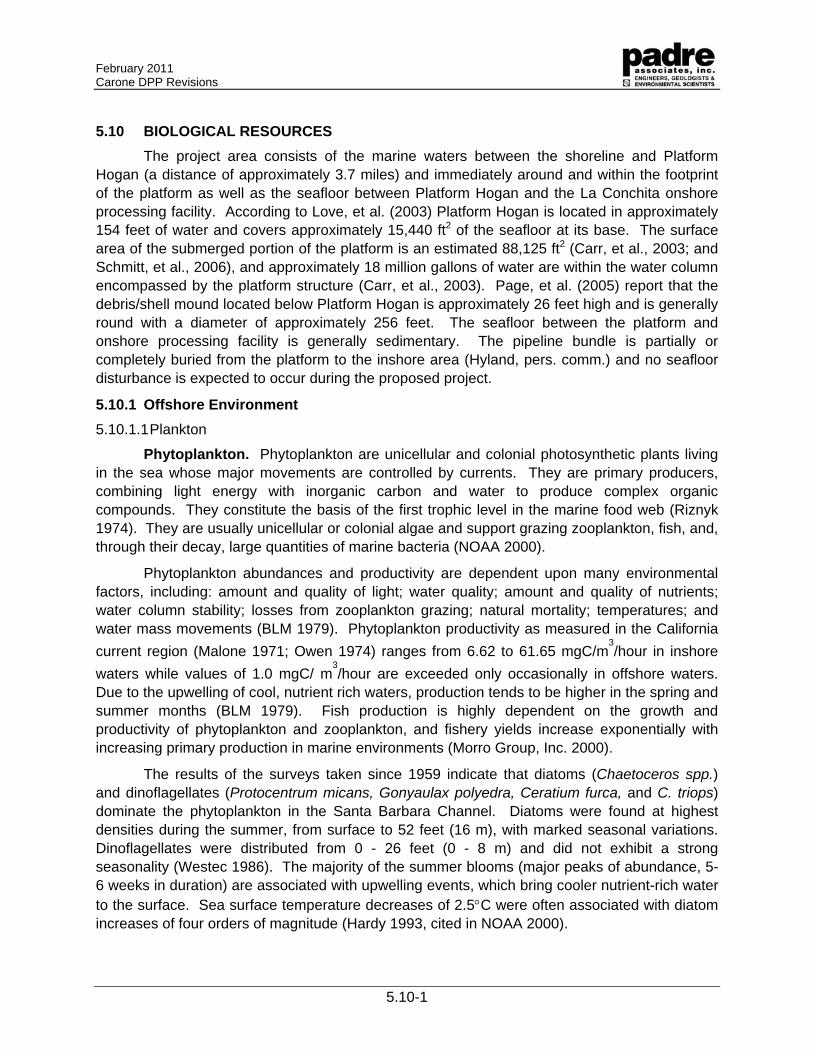
February 2011 Carone DPP Revisions
5.10-1
5.10 BIOLOGICAL RESOURCES
The project area consists of the marine waters between the shoreline and Platform Hogan (a distance of approximately 3.7 miles) and immediately around and within the footprint of the platform as well as the seafloor between Platform Hogan and the La Conchita onshore processing facility. According to Love, et al. (2003) Platform Hogan is located in approximately 154 feet of water and covers approximately 15,440 ft2 of the seafloor at its base. The surface area of the submerged portion of the platform is an estimated 88,125 ft2 (Carr, et al., 2003; and Schmitt, et al., 2006), and approximately 18 million gallons of water are within the water column encompassed by the platform structure (Carr, et al., 2003). Page, et al. (2005) report that the debris/shell mound located below Platform Hogan is approximately 26 feet high and is generally round with a diameter of approximately 256 feet. The seafloor between the platform and onshore processing facility is generally sedimentary. The pipeline bundle is partially or completely buried from the platform to the inshore area (Hyland, pers. comm.) and no seafloor disturbance is expected to occur during the proposed project.
5.10.1 Offshore Environment
5.10.1.1 Plankton
Phytoplankton. Phytoplankton are unicellular and colonial photosynthetic plants living in the sea whose major movements are controlled by currents. They are primary producers, combining light energy with inorganic carbon and water to produce complex organic compounds. They constitute the basis of the first trophic level in the marine food web (Riznyk 1974). They are usually unicellular or colonial algae and support grazing zooplankton, fish, and, through their decay, large quantities of marine bacteria (NOAA 2000).
Phytoplankton abundances and productivity are dependent upon many environmental factors, including: amount and quality of light; water quality; amount and quality of nutrients; water column stability; losses from zooplankton grazing; natural mortality; temperatures; and water mass movements (BLM 1979). Phytoplankton productivity as measured in the California
current region (Malone 1971; Owen 1974) ranges from 6.62 to 61.65 mgC/m3/hour in inshore
waters while values of 1.0 mgC/ m3/hour are exceeded only occasionally in offshore waters.
Due to the upwelling of cool, nutrient rich waters, production tends to be higher in the spring and summer months (BLM 1979). Fish production is highly dependent on the growth and productivity of phytoplankton and zooplankton, and fishery yields increase exponentially with increasing primary production in marine environments (Morro Group, Inc. 2000).
The results of the surveys taken since 1959 indicate that diatoms (Chaetoceros spp.) and dinoflagellates (Protocentrum micans, Gonyaulax polyedra, Ceratium furca, and C. triops) dominate the phytoplankton in the Santa Barbara Channel. Diatoms were found at highest densities during the summer, from surface to 52 feet (16 m), with marked seasonal variations. Dinoflagellates were distributed from 0 - 26 feet (0 - 8 m) and did not exhibit a strong seasonality (Westec 1986). The majority of the summer blooms (major peaks of abundance, 5-6 weeks in duration) are associated with upwelling events, which bring cooler nutrient-rich water to the surface. Sea surface temperature decreases of 2.5C were often associated with diatom increases of four orders of magnitude (Hardy 1993, cited in NOAA 2000).
February 2011 Carone DPP Revisions
5.10-2
Zooplankton. Zooplankton are animal plankton which are incapable of swimming against the current. They represent the trophic level above phytoplankton (primary consumers) and perform the vital function of transferring energy, in a trophic sense, from the phytoplankton to the higher forms of marine life in the food chain (BLM 1979).
The zooplankton community includes the permanent members (holoplankton) such as chaetognaths, copepods, euphausids, and larvaceans, and temporary members (meroplankton) such as hydromedusae, fish eggs and larvae, and the larvae of many invertebrates that spend only a portion of their life cycle in the water column. In the California Current system, there are estimated to be at least 546 invertebrate zooplankton and 1,000 ichthyoplankton (fish) species (BLM 1979). A list of the dominant species, which fluctuate by season, may be found in Holton, et al. (1977).
Zooplankton data are available for the CalCOFI reports, Holton, et al. (1977) and McGowan (1974). Much of this information has been summarized by BLM (1979). Roseler and Chelton, 1987 (cited in NOAA 2000) summarized CalCOFI zooplankton displacement volume data over a 32-year period (1951 to 1982) and found non-seasonal patterns in abundance associated with the California Current: low frequency periods (three to five years) related to variations in equatorward transport of the Current; three to four month periods related to higher Current flow. Chelton et al. (1982, cited in NOAA 2000) conclude that large fluctuations in zooplankton abundance are not related to upwelling but rather to changes in the transport of the California Current.
Data collected in midwater ichthyoplankton trawls completed at several locations within the Santa Barbara Channel (SBC) in the mid-1990s (Love, et al., 1999) suggest that this component of the zooplankton varies with location and distance from shore. The samples taken around the “Carpinteria Inshore” platforms, which included Hogan, Houchin, and Hillhouse, were dominated by juvenile Pacific argentine (Argentina sialis), speckled sanddab (Citharichthys stigmaeus) and adult northern anchovy (Engraulis mordax), Pacific butterfish (Peprilus simillimus), and Pacific sardine (Sardinops sagax caeruleas); species that are common inshore (water depths less than 295 ft [90 m]), warmer water marine fishes (Love, et al., 1999). Few rockfish larvae or juveniles were collected around the Carpinteria Inshore platforms during this two-year survey.
Nishimoto and Washburn, (2002) cite several sources that indicate that many temperate and tropical nearshore fishes have planktonic phases lasting weeks or months in their early life histories, and mortality during this period is high and variable. Typically, less than one percent of the offspring survive through metamorphosis to settle in nursery or adult habitats. Northwest Wildlife (2010), provides an overview of the lifecycle of rockfish and indicate that most species give birth to live young (parturate) instead of spawn (releasing sperm and eggs into the water). The larval rockfish tend to stay in “shallow water” until the settle at three to six months of age and at lengths of from three to six centimeters (cm). Invertebrate larvae types vary with Class and include nauplii (arthropods), veliger (mollusks), and auricularia, bipinnaria, and pluteus (echinoderms), which also vary in the time they remain in the plankton (Borradaile and Potts, 1963). Larval fish and invertebrates would be expected to be in the plankton in varying densities throughout the year, however spring and autumn would likely support highest
February 2011 Carone DPP Revisions
5.10-3
numbers; holoplankton concentrations will also vary with depth, season, and distance from shore.
5.10.1.2 Fish
Carr, et al. (2003) studied the fish associated with six platforms (A, B, C, Hogan, Houchin, and Henry) and nearby natural reefs within the Santa Barbara Channel. The results of that study suggest that while the ichthyofauna of each platform differs, all of the studied platforms tended to support a relatively high density of young-of-the-year rockfish (Sebastes spp), blacksmith (Chromis punctipinnis), and California sheephead (Semicossyphus pulcher). Love, et al. (2003) using a single observation of the midwater area around Platform Hogan found that habitat was important for a diverse fish assemblage, that included blacksmith, blue and olive rockfishes (Sebastes mystinus and S. serranoides), painted greenling (Oxylebius pictus), sharpnose seaperch (Phanerodon atripes), pile perch (Damalichthys vacca) and California sheephead.
Extracting relevant information from California Resources Agency (2008), more common fish species that would be expected to be associated with the sedimentary seafloor habitat within the water depths between the platform and shore include California halibut (Paralichthys californicus), the angel shark (Squatina californica), barred sandbass (Paralabrax nebulifer), and several species of surfperches. Smaller flatfish (i.e. speckled and Pacific sanddabs, Citharichthys stigmaeus and C. sordidus, respectively) would also be expected to be common within this habitat and water depth (Miller and Lea, 1972). Pelagic and epipelagic (water column and near-surface) species that would be expected within the project region would include northern anchovies (Engraulis mordax), Pacific sardine, and at least two species of atherinids (topsmelt [Atherinis affinis] and jacksmelt [Atherinopsis californiensis]). Grunion (Leuresthes tenuis) would also be expected in the nearshore waters and on sandy beaches of the region during the spring-summer spawning periods.
5.10.1.3 Seafloor and Structure Habitats and Biota
The surface area of the submerged portion of the platform is estimated to be 88,125 ft2 (Carr, et al., 2003, Schmitt, et al., 2006) and approximately 18 million gallons of water are within the water column encompassed by the platform structure (Carr, et al., 2003). Page, et al. (2005) report that the debris/shell mound located below Platform Hogan is approximately 26 ft high and is generally round with a diameter of approximately 256 ft.
The distance between the platform and the onshore processing plant is approximately four miles, and the seafloor along that pipeline corridor is generally sedimentary. The pipeline bundle is partially or completely buried from the platform to the inshore area (Hyland, pers. comm.) and no seafloor disturbance is expected to occur during the proposed project. The seafloor along the existing power cable between Platform Hogan and Casitas Pier (Carpinteria) is also sedimentary. Seafloor-disturbing activities along that corridor include commercial trawling (the area is within the California Halibut Trawling Area between Pt. Dume and Pt. Arguello and inside the state three-mile limit) which was the possible cause of damage to the power cable in water depths between 110 and 120 ft and at an inshore location in approximately 45 ft of water in 2008. Trawling usually occurs along isobaths (e.g. shore-parallel) and would be expected to result in alteration of the surficial sediments where the net is in direct contact with the seafloor.
February 2011 Carone DPP Revisions
5.10-4
The results of historical infauna sampling by State of California (1965) in water depths of 22 to 164 ft within the sedimentary habitat between Platform Hogan and the shoreline indicate that the surficial sediments inshore of the 30 ft isobath are sandy and supported a less diverse community (dominants included gastropod mollusks [Olivella baetica and Nitidella carinata] and polychaete worms [Prionospio malmgreni and Nephtys sp.). Very fine grey sand characterized the mid-depth (30 to 55 ft) range where polychaetes Nephtys sp. And Goniada brunnea, and an amphipod (Ampelisca cristata) characterized the infauna. Surficial sediments in water depths further offshore were described as “green silty mud to green mud” and dominant (most numerous) infaunal taxa within water depths of 55 to 164 ft included polychaete worms (Ceratocephala americana, Cossura candida, and Prionospio pinnata), an amphipod (Heterophoxus oculatus), and a brittle star (Amphiodia urtica). The echiuran worm Listriolobus pelodes, usually found in aggregations in fine sediments, was also common in samples from this depth range (State of California, 1965).
Schmitt, et al. (2006) included Platform Hogan in a seven-platform study of the algae and invertebrates associated with the structures. The results of that study suggest that for all seven platforms (Gina, Gail, Grace, Gilda, Houchin, Hogan, and Holly), the most widely distributed and abundant higher taxi, were anemones (e.g., Corynactis californium, Meridian sp.), tubiculous amphipods, hydroids (Plumaria sp and Agalophenia sp), and sponges (e.g., Halichondria panicea, Sphaeciospongia confoederata). Together, these taxa accounted for over 83% of the attached epibiota. Platform Hogan supported the highest percent cover of hydroids, but the lowest cover of the powder-puff anemone, Metridium senile. Other widespread taxa included mussels, (Mytilus californianus, M. galloprovincialis), barnacles (Megabalanus californicus, Balanus spp), and tunicates (e.g., Styela montereyensis). Schmitt, et al. (2006) also found that filamentous red algae were the most widely distributed algal taxa. However, in general the cover of algae was low (~5%).
5.10.1.4 Marine Mammals
Cetaceans (whales, dolphins, and porpoises)
Cetaceans consist of two suborders; the Ondontoceti (toothed whales, which include the sperm whale (Physeter macrocephalus), dolphins, porpoises, and lesser known species such as the beaked whales) and the Mysticeti (baleen whales, which feed by filtering their food through long, fringed plates). The species with the highest potential to be encountered during project activities are discussed in the following paragraphs. A discussion of other cetaceans with the potential to be found in the Project area is provided in Attachment 6, Biological Assessment.
Gray whale. The gray whale population breeds and calves in lagoons along the west coast of Baja California and in the Gulf of California in the winter. At the end of the season, the population begins a 4,800-mile coastal migration to summer feeding grounds to the north. Migrating gray whales generally travel within 1.5 miles of the shoreline over most of the route, unless crossing mouths of rivers and straits (Dohl et al., 1983). Off southern California, where gray whales often travel through the Channel Islands, offshore movements of up to 50 miles have been observed (Jones and Swartz, 1987; Dohl et al., 1981; Bonnell and Dailey, 1993) due to the dispersal of the population through the islands.
The most recent estimates of eastern North Pacific gray whale (taken from the 2006/2007 surveys) indicated that approximately 17,752 individuals are known to occur (NOAA
February 2011 Carone DPP Revisions
5.10-5
Fisheries, 2008), exceeding historic (1846) population estimates of 15,000 to 20,000 (NOAA; 1993, 1996). The gray whale population growth rate was about 3.3 percent per year between 1968 and 1988 (NOAA, 1993), and following three years of review, was removed from the endangered species list on June 15, 1994.
Generally, gray whales are sighted in the project area beginning in December and continuing through May. Due to the tendency for females with calves to stay closer to shore during the northern migration period, there is a higher probability of whales being observed in the project area in April and May.
Minke whale. Minke whales are a coastal species that are widely distributed on the continental shelf throughout the eastern North Pacific (Green et al., 1989) and occur year-round off the coast of California. This species favors shallow water and venture near shore more often than other baleen whales (Watson, 1981), and they seem to be curious about shipping and approach moving vessels.
Southern California waters appear to be relatively central to the North Pacific distribution of minke whales (Bonnell and Dailey, 1993). Minke whales are most abundant along the Santa Rosa-Cortes Ridge near San Miguel and Santa Rosa islands and in waters between Santa Catalina Island and Forty-Mile Bank southeast of San Clemente Island. From May through July, minke whales are seen most frequently in the region of Lasuen Knoll, east of Santa Catalina Island in the San Pedro Channel. The most recent estimates of minke whales indicate that at least 495 individuals are known to occur off California, Oregon, and Washington (NMFS, 2008). No long-term trend for the population has been identified at this time (NMFS, 2008).
Northern right whale. The northern right whale is considered federally endangered due to intensive historical commercial whaling. Like other baleen whales, right whales appear to migrate from high-latitude feeding grounds toward more temperate waters in the fall and winter, although the location of seasonal migration routes is unknown (Scarff, 1986). Reeves and Brownell (1982) concluded that the usual wintering ground of northern right whales extended from northern California to Washington, although sightings have been recorded as far south as Baja California and near the Hawaiian Islands (Scarff, 1986; NMFS, 1991b; Gendron et al., 1999).
Since 1955, only five sightings of right whales have been recorded in waters off southern California, all these sightings were of individuals and were recorded between February and May (Scarff, 1991; Carretta et al., 1994). It is believed that the population is between 100-200 individuals (Braham, 1984b). Due to the low population numbers and lack of data, no long-term population trends have been determined.
Common dolphins. Common dolphins are found worldwide and are the most abundant cetaceans in California waters (Bonnell and Dailey, 1993). Common dolphins account for 57 to 84% of the total seasonal cetacean population in the Southern California Bight (SCB) (Dohl et al., 1981). Two species of common dolphin are found in central and southern California waters. The long-beaked common dolphin (Delphinus capensis) is commonly found within about 55 miles from the coastline. Its relative abundance changes both seasonally and inter-annually, with the highest densities observed during warm water events (Heyning and Perrin, 1994). A recent population estimate for this species is about 9,880 for Washington, Oregon, and California (NOAA Fisheries, 2008). The more numerous short-beaked common dolphin (D.
February 2011 Carone DPP Revisions
5.10-6
delphis) ranges from the coast to 340 miles offshore. The most recent estimates indicate the California-Washington population of this species to be 338,708 individuals making it the most abundant cetacean off California (NOAA Fisheries, 2008). California common dolphins are very gregarious and are frequently encountered in herds of 1,000 or more. Because populations tend to vary with water temperature, no long-term population trends have been determined at this time (NOAA Fisheries, 2008).
Bottlenose dolphin. The bottlenose dolphin is probably more widely distributed than any other species of small cetacean in the eastern North Pacific (Leatherwood et al., 1982). This species occurring off the coast of California has been tentatively separated into a coastal form and offshore form.
The coastal bottlenose dolphin is generally found within 0.6 mile of shore and often enters the surf zone, bays, inlets and river mouths (Leatherwood et al., 1987). The coastal population appears to form small resident groups that range along the coastline, especially off Orange and San Diego counties (Weller and Defran, 1989). The most recent estimates of coastal bottlenose dolphin populations suggest that the species is stable at a minimum population size of 290 individuals off California (NMFS, 2008).
Pacific white-sided dolphin. Pacific coast white-sided dolphins primarily range along the coasts of California, Oregon, and Washington. This species frequents deep water foraging areas, but may move into nearshore areas in search of prey. Analysis of sighting patterns suggest that Pacific coast white-sided dolphins make north-to-south movements, occurring primarily off California in cold water months and moving northward to Oregon and Washington as waters warm in the late spring in summer (Leatherwood et al., 1992; Forney et al., 2000). Pacific coast white-sided dolphin populations are not showing any long-term trend in terms of abundance, but have a current minimum population size of 17,201 off California, Oregon, and Washington (NOAA Fisheries, 2008).
Risso’s dolphin. Risso’s dolphins are present off central and southern California year-round (Dohl et al., 1981, 1983; Bonnell and Dailey, 1993). Risso’s dolphins are found off California during the colder water months and are extending their range northward as water temperatures increase (Leatherwood et al, 1980, 1982). Through the summer and autumn months, Risso’s dolphins in the southern California bight (SCB) are distributed inshore of the Santa Rosa-Cortes Ridge. Through winter and spring, the population shifts offshore except in the vicinity of the northern chain of Channel Islands. The most recent population estimates of Risso’s dolphin indicate that at least 10,054 individuals are known to occur off California, Oregon, and Washington (NOAA Fisheries, 2008). No long-term population trends have been determined, at this time.
Pinnipeds (seals, sea lions, and walruses)
Six of the 36 species of pinnipeds known worldwide occur off the Southern California coast. Four are eared seals (family Otariidae) and two are earless seals (family Phocidae). The species most likely to be encountered within the vicinity of the project include the California sea lion (Zalophus californianus), northern fur seal (Callorhinus uranius), northern elephant seal (Mirounga angustirostis), and the Pacific harbor seal (Phoca vitulina richardsi) (Bonnell et al., 1980). Less common species include the Guadalupe fur seal (Arctocephalus townsendi), northern fur seal (Callorhinus ursinus), and Steller sea lion (Eumetopias jubatus).
February 2011 Carone DPP Revisions
5.10-7
California sea lion. The California sea lion is the most abundant pinniped in the SCB, representing 50 to 93% of all pinnipeds on land and about 95% of all sightings at sea (Bonnell and Ford, 1987). This species ranges from Baja California to British Columbia. In the SCB, California sea lions currently breed on four islands: San Miguel, San Nicolas, Santa Barbara and San Clemente. During the winter, the distribution in the SCB shifts eastward to the waters around Santa Catalina and San Clemente islands and southward to Tanner and Cortes banks (Bonnell and Dailey, 1993). The most recent U.S population estimates for the California sea lion stock indicate that at least 141,842 individuals (NOAA Fisheries, 2008).
Guadalupe fur seal. The Guadalupe fur seal is considered a federally threatened species due to the near extinction by commercial sealing in the 19th century. Historically, the Guadalupe fur seal apparently ranged northward from Islas Revillagigedo off the coast of Mexico to at least Point Conception (Repenning et al., 1971; Fleischer, 1978; Walker and Craig, 1979). Presently, the species breed only on Isla de Guadalupe off the coast of Baja California, Mexico, although individual animals appear regularly in the Channel Islands (Stewart et al., 1987; Bonnell and Dailey, 1993), and a single pup was born on San Miguel Island in 1997 (DeLong and Melin, 2000). The most recent population estimates for the Guadalupe fur seal are unknown; however, recent studies indicate that the population is increasing.
Northern elephant seal. Northern elephant seals breed along the coast from Baja California north to Point Reyes, California. San Miguel and San Nicolas Islands are the major California rookeries (85 percent of 1990 production); a few are also born on Santa Rosa, Santa Barbara, and San Clemente Islands (Bonnell and Dailey, 1993). Northern elephant seals typically haul out on land only to breed and molt and then disperse widely at sea. The most recent population estimates for the California breeding stock of Northern elephant seals indicated that at least 74,913 individuals are known to occur in California (NOAA Fisheries, 2008).
Northern fur seal. The northern fur seal is the most abundant otarid in the Northern Hemisphere. Most of the population is associated with rookery islands in the Bering Sea and the Sea of Okhotsk although a small population of northern fur seals has existed on San Miguel Island since the late 1950s or early 1960s (NMFS, 2003). A small percentage of the fur seal population from the Bering Sea arrive offshore California in late November (Bonnell and Dailey, 1993). Most of these animals are gone by early June (Bonnell and Dailey, 1993; Koski et al., 1998). Generally, individuals are been observed over the Santa Rosa-Cortes Ridge, the San Nicolas Basin, and the Tanner and Cortes banks (Bonnell and Dailey, 1993). The most recent population estimates for San Miguel stock indicate that at least 5,096 individuals are known to occur (NOAA Fisheries, 2008). No long-term population trends have been determined at this time (NOAA Fisheries, 2008).
Pacific harbor seal. Pacific harbor seals range from Mexico to the Aleutian Islands, with the North Pacific population centered in Alaska. In the SCB, 71% of all harbor seals seen at sea have been within six miles of land; the greatest number of sightings during autumn months, following the breeding and molting seasons. Unlike most pinnipeds occurring off Southern California, Pacific harbor seal maintain haul-out sites on the mainland on which they pup and breed. The most recent minimum population estimates of the California stock indicate that at least 31,600 individuals are known to occur (NOAA Fisheries, 2008). After increases in the
February 2011 Carone DPP Revisions
5.10-8
1990s, this population is believed to be stable and possibly reaching its carrying capacity (NOAA Fisheries, 2008).
A Pacific harbor seal rookery is located at the base of Carpinteria Pier. The Carpinteria Seal Watch has counted seals from January through May every year since 1991. High counts from the Carpinteria Seal Watch include 390 seals hauled out during the pupping season in 2006. In 1993, seal watcher Susan Allen counted 364 seals hauled out in September, outside of the usual seal watch season. In May 2006, 324 adults and 66 pups were counted, for a total of 390 animals (Paredon, 2008).
Steller sea lion. The Steller, or northern sea lion is considered a federally threatened species. Historically, this species was one of the most abundant pinnipeds in the SCB. Numbers have declined precipitously in the last several decades, but the causes of the decline are not well understood (Bartholomew 1967; Le Boeuf and Bonnell 1980). The SCB is at the southern extreme of the historical breeding range of the species and presently, 96 percent of the world population is found in Alaska or Siberian waters (Loughlin et al., 1980). A few adult or sub-adult males occasionally may occupy territories on relict rookeries at the west end of San Miguel Island and adjacent rocks in the summer months, but the last reported pups on San Miguel Island were seen in the summer of 1980 (Bonnel and Dailey, 1993; DeLong and Melin, 2000). The most recent population estimate for the Steller sea lion indicate that at least 44,404 individuals are known to occur with 2,396 Stellar sea lions observed in California (NOAA Fisheries, 2008). This population is believed to be decreasing (NOAA Fisheries, 2008).
Fissipeds (otters)
Southern sea otter. Historically the range of sea otters extended from the northern islands of the Japanese Archipelago northeast along Alaska and southward along North America to Baja California. The sea otter was nearly extirpated by the fur trade during the 18th and 19th centuries. The current range is restricted to the waters of the coast of Alaska and California. Currently, the sea otter is expanding its range southward along the coast, including a recent expansion south of Point Conception into the Santa Barbara area. This species prefers rocky shoreline with water depth less than 50 feet, which support kelp beds where they feed on benthic macroinvertebrates including clams, crabs, abalone, sea urchins, and sea stars. The most recent minimum population estimates for southern sea otters in California indicate that 2,760 individuals were counted during the 2008 census (USGS, 2008).
5.10.1.5 Sea Turtles
In addition to the marine mammal populations, four species of sea turtle are known to occur off the coast of California. These species include: Pacific Ridley sea turtle (Lepidochelys olivacea), leatherback sea turtle (Dermochelys coriacea), green sea turtle (Chelonia mydas), and the loggerhead sea turtle (Caretta caretta). Most of these turtles nest along the coasts of Mexico and Central America. Overall, the populations of marine turtles have been greatly reduced due to over-harvesting and loss of nesting sites in coastal areas (Ross, 1982). Of the four species, three of them (Pacific Ridley, leatherback, and green) are listed as endangered and one (loggerhead) is listed as threatened under the Federal ESA. All of these species have the potential to occur within the project area.
February 2011 Carone DPP Revisions
5.10-9
Green sea turtle. Green sea turtles generally occur worldwide in waters above 20° C (MFS Globenet Corp/WorldCom Network Services, 2000). Green sea turtles have been reported as far north as Redwood Creek in Humboldt County and off the coasts of Washington, Oregon, and British Columbia (Channel Islands National Marine Sanctuary, 2000; MFS Globenet Corp/WorldCom Network Services, 2000). The green sea turtle is thought to nest on the Pacific coasts of Mexico, Central America, South America, and the Galapagos Islands. There are no known nesting sites along the west coast of the U.S., and the only known nesting location in the continental U.S. is on the east coast of Florida (MFS Globenet Corp/WorldCom Network Services, 2000). Green sea turtles are sighted year-round in marine waters off the southern California coast, with the highest concentrations occurring during July through September. Green sea turtles are omnivores, feeding on algae and sea grasses (MFS Globenet Corp/WorldCom Network Services, 2000), but also eat fish and invertebrates (MFS Globenet Corp/WorldCom Network Services, 2000). The most recent minimum population estimates for green sea turtles indicate that at least 1,000 individuals are known to occur, and this population is believed to be increasing (NOAA, 1999).
Pacific Ridley sea turtle. The Pacific Ridley, or olive sea turtle, is distributed circumglobally and is regarded as the most abundant sea turtle in the world. Within the eastern Pacific, the normal range of Pacific Ridley sea turtles is mainly from Baja California to Peru (Channel Islands National Marine Sanctuary, 2000; MFS Globenet Corp/WorldCom Network Services, 2000). However, they have been reported as far north as Washington, Oregon, and are a rare visitor to the California coast (MFS Globenet Corp/WorldCom Network Services, 2000). Major nesting beaches are located on the Pacific coasts of Mexico and Costa Rica (MFS Globenet Corp/WorldCom Network Services, 2000). The population on Pacific beaches in Mexico has declined from an estimated 10 million adults in 1950 to less than 80,000 in 1983 due to excessive harvesting (Channel Islands National Marine Sanctuary, 2000; MFS Globenet Corp/WorldCom Network Services, 2000). The Pacific Ridley sea turtle is omnivorous, feeding on fish, crabs, shellfish, jellyfish, sea grasses and algae (Channel Islands National Marine Sanctuary, 2000; MFS Globenet Corp/WorldCom Network Services, 2000), and may dive to depths of up to 980 feet (MFS Globenet Corp/WorldCom Network Services, 2000). The most recent minimum population estimates for Pacific Ridley sea turtle indicate that at least 350,000 individuals and this population is believed to increasing (NOAA, 1999).
Leatherback sea turtle. Leatherback sea turtles are the most common sea turtle off the west coast of the U.S. (Channel Islands National Marine Sanctuary, 2000). Leatherback sea turtles have been sighted as far north as Alaska and as far south as Chile (Channel Islands National Marine Sanctuary, 2000; MFS Globenet Corp/WorldCom Network Services, 2000). Their extensive latitudinal range is due to their ability to maintain warmer body temperatures in colder waters (MFS Globenet Corp/WorldCom Network Services, 2000). Off the U.S. west coast, leatherback turtles are most abundant from July to September. It has been noticed that their appearance off the U.S. west coast is "two-pronged" with sightings occurring in northern California, Oregon, Washington, and southern California, with few sighting occurring along the intermediate coastline. In southern California waters, leatherback turtles are most common during the months of July through September, and in years when water temperatures are above normal (MFS Globenet Corp/WorldCom Network Services, 2000).
February 2011 Carone DPP Revisions
5.10-10
Leatherback sea turtles are omnivores, but feed principally on soft prey items such as jellyfish and planktonic chordates (e.g., salps) (Channel Islands National Marine Sanctuary, 2000; MFS Globenet Corp/WorldCom Network Services). No nesting occurs within U.S. beaches (MFS Globenet Corp/WorldCom Network Services, 2000). The most recent population estimates for the eastern Pacific leatherback sea turtles indicates that at least 985 individuals are known to occur, and this population is believed to be decreasing (NOAA, 1999).
Loggerhead sea turtle. Loggerhead sea turtles primarily occur in subtropical to temperate waters, and are generally found over the continental shelf (MFS Globenet Corp/WorldCom Network Services, 2000). Loggerhead sea turtles are omnivorous and feed on a wide variety of marine life including shellfish, jellyfish, squid, sea urchins, fish, and algae (MFS Globenet Corp/WorldCom Network Services; Channel Islands National Marine Sanctuary).
The eastern Pacific population of loggerhead sea turtles breeds on beaches in Central and South America. Southern California is considered to be the northern limit of loggerhead sea turtle distribution (MFS Globenet Corp/WorldCom Network Services, 2000). However, loggerhead sea turtles have stranded on beaches as far north as Washington and Oregon (Channel Islands National Marine Sanctuary, 2000; MFS Globenet Corp/WorldCom Network Services, 2000). In addition, in 1978, a loggerhead sea turtle was captured near Santa Cruz Island in southern California (MFS Globenet Corp/WorldCom Network Services, 2000). Loggerhead sea turtle abundance in southern California waters is higher in the winter during warm years than cold years. However, during the summer months (July through September), abundance is similar in warm and cold years. The most recent minimum population estimates for loggerhead indicate that at least 1,000 individuals are known to occur, and this population is believed to be stable (NOAA, 1999)
5.10.1.6 Sea Birds
There is a large variety of marine bird species that inhabit or migrate through the Santa Barbara Channel. Common species include loons, grebes, shearwaters, petrels, cormorants, ducks, gulls, terns, and murrelets. Several bird species that have the potential to occur within the project area have been afforded protected status by the State and/or federal governments due to declining populations and/or habitats.
BLM (1981) summarized the data on marine birds within this region as compiled by U.C. Santa Cruz (1978). Over 2.5 million seabirds may pass through or reside in the Southern California Bight at any one time. Based on aerial and ship surveys, average seabird densities in the open water areas near the Project area may be between 20 and 200 birds per square mile (MMS 1993, cited in USN 2000).
Information regarding abundance, seasonal distributions, and habitat usage for the birds that use this area is available from the Channel Islands National Marine Sanctuary draft EIS (NOAA 2000). The seasonal distribution and abundance of coastal birds is summarized in Table 5.10-2. “x” in the table below indicates when the species could be observed within or near the project site. A highlighted “x” indicates the season when the species is likely to occur at the highest abundance within or near the project site (Aspen, 2008; Briggs et al. 1987; Dept. of Navy, 2008; Mason et al. 2007).
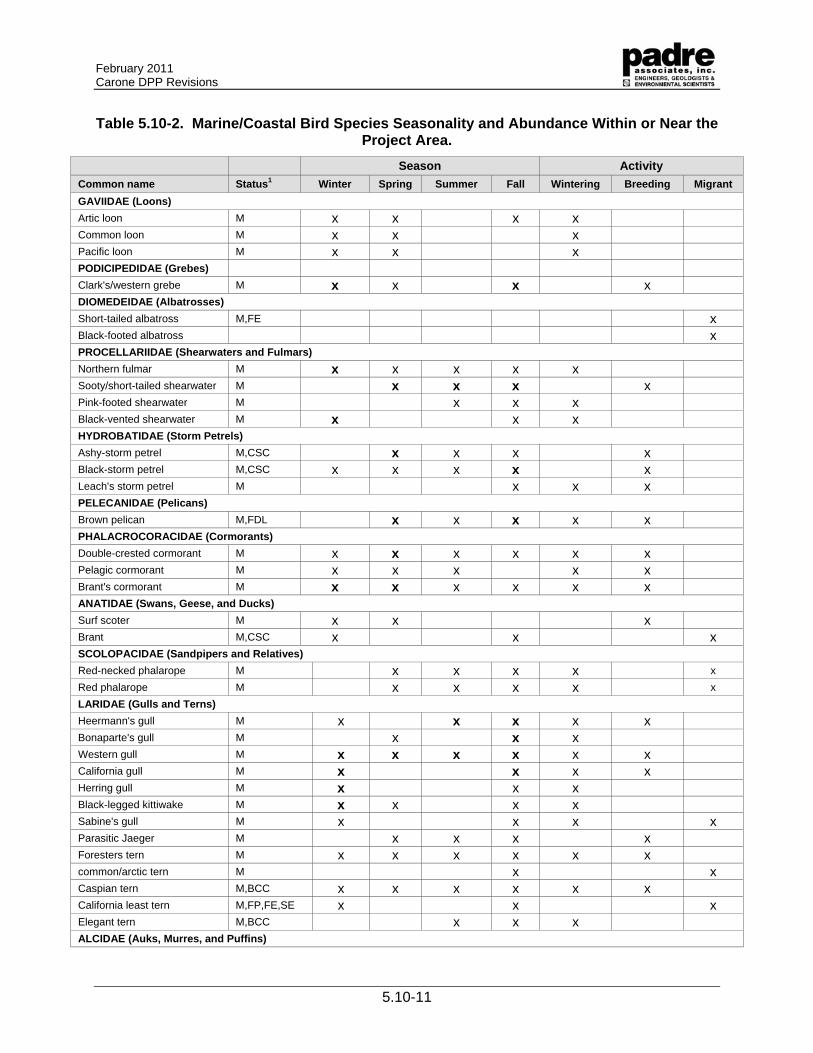
February 2011 Carone DPP Revisions
5.10-11
Table 5.10-2. Marine/Coastal Bird Species Seasonality and Abundance Within or Near the Project Area.
Season Activity
Common name Status1 Winter Spring Summer Fall Wintering Breeding Migrant
GAVIIDAE (Loons)
Artic loon M x x x x Common loon M x x x Pacific loon M x x x PODICIPEDIDAE (Grebes) Clark's/western grebe M x x x x DIOMEDEIDAE (Albatrosses) Short-tailed albatross M,FE x Black-footed albatross x PROCELLARIIDAE (Shearwaters and Fulmars)
Northern fulmar M x x x x x Sooty/short-tailed shearwater M x x x x Pink-footed shearwater M x x x Black-vented shearwater M x x x HYDROBATIDAE (Storm Petrels) Ashy-storm petrel M,CSC x x x x Black-storm petrel M,CSC x x x x x Leach's storm petrel M x x x PELECANIDAE (Pelicans) Brown pelican M,FDL x x x x x PHALACROCORACIDAE (Cormorants) Double-crested cormorant M x x x x x x Pelagic cormorant M x x x x x Brant's cormorant M x x x x x x ANATIDAE (Swans, Geese, and Ducks) Surf scoter M x x x Brant M,CSC x x x SCOLOPACIDAE (Sandpipers and Relatives)
Red-necked phalarope M x x x x x
Red phalarope M x x x x x
LARIDAE (Gulls and Terns)
Heermann's gull M x x x x x Bonaparte's gull M x x x Western gull M x x x x x x California gull M x x x x Herring gull M x x x Black-legged kittiwake M x x x x Sabine's gull M x x x x Parasitic Jaeger M x x x x Foresters tern M x x x x x x common/arctic tern M x x Caspian tern M,BCC x x x x x x California least tern M,FP,FE,SE x x x Elegant tern M,BCC x x x ALCIDAE (Auks, Murres, and Puffins)
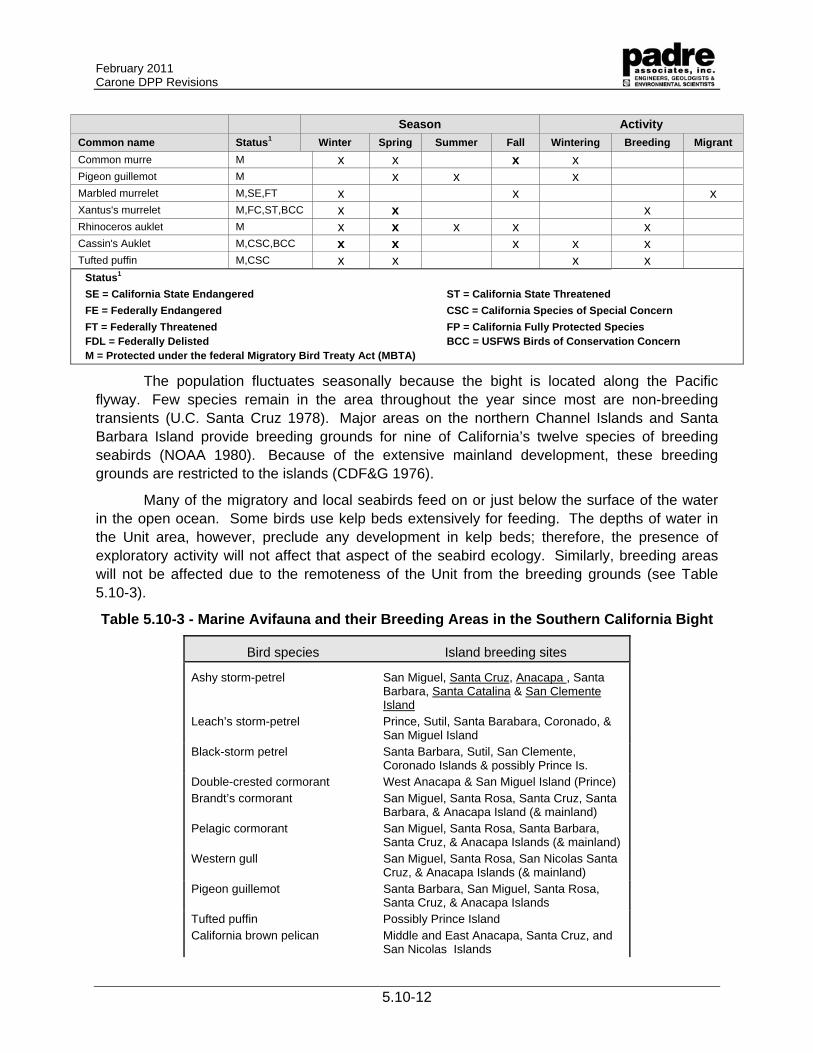
February 2011 Carone DPP Revisions
5.10-12
Season Activity
Common name Status1 Winter Spring Summer Fall Wintering Breeding Migrant
Common murre M x x x x Pigeon guillemot M x x x Marbled murrelet M,SE,FT x x x Xantus's murrelet M,FC,ST,BCC x x x Rhinoceros auklet M x x x x x Cassin's Auklet M,CSC,BCC x x x x x Tufted puffin M,CSC x x x x
Status1 SE = California State Endangered ST = California State Threatened
FE = Federally Endangered CSC = California Species of Special Concern
FT = Federally Threatened FP = California Fully Protected Species FDL = Federally Delisted BCC = USFWS Birds of Conservation Concern M = Protected under the federal Migratory Bird Treaty Act (MBTA)
The population fluctuates seasonally because the bight is located along the Pacific flyway. Few species remain in the area throughout the year since most are non-breeding transients (U.C. Santa Cruz 1978). Major areas on the northern Channel Islands and Santa Barbara Island provide breeding grounds for nine of California’s twelve species of breeding seabirds (NOAA 1980). Because of the extensive mainland development, these breeding grounds are restricted to the islands (CDF&G 1976).
Many of the migratory and local seabirds feed on or just below the surface of the water in the open ocean. Some birds use kelp beds extensively for feeding. The depths of water in the Unit area, however, preclude any development in kelp beds; therefore, the presence of exploratory activity will not affect that aspect of the seabird ecology. Similarly, breeding areas will not be affected due to the remoteness of the Unit from the breeding grounds (see Table 5.10-3).
Table 5.10-3 - Marine Avifauna and their Breeding Areas in the Southern California Bight
Bird species Island breeding sites
Ashy storm-petrel San Miguel, Santa Cruz, Anacapa , Santa Barbara, Santa Catalina & San Clemente Island
Leach’s storm-petrel Prince, Sutil, Santa Barabara, Coronado, & San Miguel Island
Black-storm petrel Santa Barbara, Sutil, San Clemente, Coronado Islands & possibly Prince Is.
Double-crested cormorant West Anacapa & San Miguel Island (Prince) Brandt’s cormorant San Miguel, Santa Rosa, Santa Cruz, Santa
Barbara, & Anacapa Island (& mainland) Pelagic cormorant San Miguel, Santa Rosa, Santa Barbara,
Santa Cruz, & Anacapa Islands (& mainland) Western gull San Miguel, Santa Rosa, San Nicolas Santa
Cruz, & Anacapa Islands (& mainland) Pigeon guillemot Santa Barbara, San Miguel, Santa Rosa,
Santa Cruz, & Anacapa Islands Tufted puffin Possibly Prince Island California brown pelican Middle and East Anacapa, Santa Cruz, and
San Nicolas Islands
February 2011 Carone DPP Revisions
5.10-13
Bird species Island breeding sites Cassin’s auklet Santa Barbara, San Miguel, and Santa Cruz, Rhinoceros auklet San Miguel Island Xantus’s murrelet Santa Barbara, Santa Catalina, San
Clemente, San Miguel, Santa Cruz, & Anacapa Islands
Caspian tern (mainland only) California least tern (mainland only) Source: Dept of Navy, 2008; Mason et al. 2007; NOAA 2000
The following special-status marine bird species could be found within the vicinity of the proposed activities. For additional information on seasonality, please see Table 5.10-2.
Xantus’s murrelet: The Xantus’s murrelet is listed as California state endangered and a candidate for listing as a Federal endangered species. This small black and white seabird nests on fewer than 10 islands in southern California and Baja Mexico. The estimated remaining global population of 5,600 birds is concentrated during the breeding season in four major colonies all in the Channel Islands and Baja California. The species typically nests in crevices, caves, under large rocks, on steep cliffs and canyons of offshore islands. The nesting period extends from February through July, but may vary depending on food supplies (Audubon Watchlist, 2007).
Marbled murrelet is a federally listed Threatened species and a California listed Endangered species that occurs in Washington, Oregon, and California. It is a small sea bird that spends most of its life in the nearshore marine environment, but nests and roosts inland in low-elevation old growth forests, or other forests with remnant large trees. It is generally confined to the marine fog belt near the coast. Nesting generally occurs in the marine fog belt within 25 miles of the coast in coast redwood, Douglas fir, western red cedar, western hemlock, and Sitka spruce. The species nests from Washington to central California in the Monterey Bay area. This bird is rare in southern California and is only found in the non-breeding season (late fall, winter, and early spring) in Santa Barbara County (Dept. of the Navy, 2008). The marbled murrelet would only occur as a fall/winter migrant within or near the area of project site.
California brown pelican: The California brown pelican was formerly listed as "Federal Endangered", "California Endangered", and "California Fully-Protected", but has recently been taken off of the endangered species list due to recovered population numbers. This species forages within estuarine, subtidal, and pelagic waters and feeds almost entirely on fish that are caught by diving from a distance of 20 to 40 feet above the water surface. They are common along the Southern California Coast from June to October and can be regularly seen feeding within the offshore and nearshore portions of the project site. This species breeds on three of the Northern Channel Islands (Anacapa, Santa Barbara, and Santa Cruz) from March to early August, where it builds nests of sticks on the ground. Following the breeding season, individuals leave the breeding colonies and disperse along the California and Mexico coastlines, with some small numbers visiting the Salton Sea and Colorado River reservoirs (Zeiner, et al., 1990).
Ashy storm-petrel. The ashy storm-petrel is designated as a "California Species of Special Concern". The Ashy storm petrel is a small smoke-gray seabird with a forked tail that is
February 2011 Carone DPP Revisions
5.10-14
only be found on the islands off California and in the adjacent waters of the continental slope. This species nest in cavities on offshore islands and move to and from their colonies at night. Ashy storm-petrels do not travel significantly far from their colonies after breeding, and many birds remain offshore from their breeding grounds. However, many individuals can make short seasonal migrations. The breeding season for this species is spread out over most of the year (Shuford and Gardali, 2008). This species breeds on six California Channel Islands (except Santa Rosa and San Nicolas). According to Mason et al. (2007), depending on the survey year and time of year, this species was found around most of the Channel Islands with the greatest abundance at Santa Catalina after October. Therefore, this species could occur within the project site year-round but has the highest potential of occurrence during the winter months. According to Briggs et al. (1987) this species was at the greatest abundance near San Miguel Island from April-June and occurred near San Clemente and Santa Catalina Islands and the western Santa Barbara channel after October.
Black storm-petrel. The black storm-petrel is designated as a "California Species of Special Concern". This petrel is the largest California storm-petrel, and has a dark rump, pointed wings, and a notched tail. The black storm-petrel can be found the closest to shore of the storm-petrels. While at sea, this species feeds on squid, small fish, and crustaceans that occur near the surface. Black storm petrels arrive at their nesting colonies in mid April and breeding occurs from May through October (Shuford and Gardali, 2008). Black storm-petrels nest in desert habitat on small rocky islands or the talus slopes of non-mountainous larger islands that are not large enough to sustain enough prey to satisfy predatory mammals year-round. Black storm petrels arrive at their nesting colonies in mid April and breeding occurs from May through October (Shuford and Gardali, 2008). In the SCB, storm-petrels breed on Santa Barbara, Sutil, and Coronado Islands, and possibly on Prince Rock (approximately one km north of San Miguel Island) and San Clemente Island. According to range maps from Mason et al. (2007) is rare in the vicinity of the project site; however, the black-storm petrel has been observed throughout the year offshore southern California. This species was seen in equal abundance during May and September surveys but was virtually absent during January surveys (Mason et al.2007).
Black-vented shearwater. The black-vented shearwater is designated as a “Bird of Conservation Concern” by USFWS. This species is pelagic, occurring in the Pacific Ocean and the Gulf of California. The black-vented shearwater is nocturnal when visiting land. This species breeds on desert islands along the west coast of Baja California, Mexico. It will nest within burrows in sandy substrate or it will drop a single egg in natural rock crevices. This shearwater feeds by plunging from just above the sea surface or submerges from afloat and dives to depths of greater than 60 feet to catch schooling fish and squid. This species is considered a coastal bird, usually found within 12 miles from shore. This species visits southern California during the non-breeding season. According to at-sea range maps from Mason et al. (2007) the black-vented shearwater has been observed in the months of January and September in the vicinity of the project site and in southern California. Post-breeding birds were most abundant in the months of November-January within 15 miles from shore.
Pink-footed shearwater. The pink-footed shearwater is designated as a “Bird of Conservation Concern” by USFWS. The pink-footed shearwater is endemic to Chile, breeding on only three known islands. After chicks fledge (from approximately April to May), the parents
February 2011 Carone DPP Revisions
5.10-15
migrate northward to spend the non-breeding season in waters off the coasts of Peru and North America, specifically southern California. This species feeds primarily on fish and squid in offshore waters over the continental shelf but also in pelagic waters. This shearwater catches its prey from short dives of less than 10 feet; however, it has the ability to dive up to 60 feet in depth (Pink-footed shearwater, 2010). According to at-sea range maps from Mason et al. (2007) the pink-footed shearwater has been observed in southern California in the months of January, May, and September and therefore could also occur in the vicinity of the project site during those months. However, this species was observed at the highest densities during the September survey periods, both near shore and at sea locations.
Black-footed albatross. The black-footed albatross is designated as a “Bird of Conservation Concern” by USFWS. This albatross is the most abundant albatross along the eastern Pacific coast and occurs off California in all months of the year. It nests on the northern Hawaiian Islands, on the U.S. Minor Outlying Islands (Midway, Wake, etc.), and on three outlying islands of Japan and can be seen on those breeding grounds in winter and spring. After breeding, individuals fly across the North Pacific to Alaska, California, Taiwan, and the Bering Sea. This species breeds on beaches and slopes with little or no vegetation. This albatross feeds mainly on squid and on the eggs of flying fish, although it often follows ships and trawlers, picking up debris left in their wake. According to Mason et al. (2007) the black-footed albatross has been observed in the months of May and September in southern California. Briggs et al. (1987) observed the black-footed albatross within 15 miles from shore near the Santa Rosa-Cortez Ridge, near San Miguel Island in the months of May and June.
Short-tailed albatross. The short-tailed albatross is a federally listed endangered species. This species is a large pelagic bird with long narrow wings adapted for soaring just above the water surface. As of 2008, 80-85% of the known breeding short-tailed albatross use a single colony, Tsubamezaki, on Torishima Island. The remaining population nests on other islands surrounding Japan. During the non-breeding season, short-tailed albatross range along the Pacific Rim from southern Japan to northern California, primarily along continental shelf margins. Nests consist of a divot on the ground lined with sand and vegetation with eggs hatch in late December and January. The diet of this species is not well studied; however, research suggests at sea during the non-breeding season that squid, crustaceans, and fish are important prey (USFWS, 2008). This species is not expected to occur in the vicinity of the project site; however, it could be in California in the non-breeding season of fall and early winter.
Cassin’s auklet. Cassin’s auklet is designated as a “Bird of Conservation Concern” by USFWS. Cassin’s auklets are widely distributed in the Pacific Ocean, breeding from the Aleutian Islands, Alaska, to central Baja California, Mexico. When its prey (small crustaceans, squid, and fish) is abundant, these birds often gather in large flocks, using their short, stubby wings to “swim” after prey. The breeding season varies from late fall through winter in Baja California, but in early to mid-summer in Alaska. In May, birds were concentrated in northwest Santa Barbara Channel and north of Point Conception, reflecting a northward dispersal of SCB breeders (Adams et al. 2004). In September, most Cassin’s auklets were observed north of Point Conception. They were widely distributed across the SCB in January, primarily west of San Nicolas Island. According to at-sea range maps from Mason et al. (2007), Cassin’s auklets have been observed in the months of January, May, and September in the vicinity of the project site. This species can be observed year-round in the vicinity of the project site.
February 2011 Carone DPP Revisions
5.10-16
Tufted puffin. The tufted puffin is designated as a "California Species of Special Concern". Tufted puffins can be found throughout the northern Pacific Ocean and they have recently recolonized southern California where they had not nested since the early 1900s. The largest tufted puffin populations occur along the west coast of the Olympic Peninsula, Washington, but their status there is not well known. They nest in burrows at the edges of cliffs, on grassy slopes, or in natural crevices in rocks. Migratory patterns are not well known, but tufted puffins are less likely to be seen near shore in winter months than in the breeding season. They are probably the most pelagic of the alcids during their non-breeding season, with many birds wintering 60-120 miles offshore. This species was discovered breeding on Prince Island (northern Channel Islands) in 1991. This species could be in the area of the project site year-round; however, its at-sea abundance is more likely to occur in the non-breeding season of late fall, winter and early spring (Shuford and Gardali, 2008, Mason et.al 2007).
5.10.2 Special Status and Protected Species
The marine mammal population off California includes eight baleen whale species; more than a dozen species of porpoises, dolphins, and other toothed whales; six species of pinnipeds; and, the southern sea otter. Some species are purely migrants that pass through central and southern California waters on their way to calving or feeding grounds elsewhere, some are seasonal visitors that remain for a few weeks or months, and, others are resident for much or all of the year. At certain times of the year, hundreds of thousands of marine mammals may be present along the coast of central and southern California (Bonnell and Dailey, 1993). There are also four species of turtles that occur in marine waters of California and there are several bird species that occur offshore of southern California. The special status species that could occur within the project region (generally within the Santa Barbara Channel) are included in Table 5.10-4.
Table 5.10-4 Special Status and Protected Species Within or Near the Project Area
Common Name Scientific Name Status
Invertebrates
White abalone Haliotis sorenseni Endangered
Black abalone Haliotis cracherodii Endangered
Fish
Steelhead (southern California ESU)
Oncorhynchus mykiss Endangered
Tidewater goby Eucyclogobius newberryi Endangered
Cetaceans
California gray whale Eshchrichtius robustus Protected
Minke whale Balaenoptera acutorostrata Protected
Humpback whale Megaptera novaeangliae Endangered
Blue whale Balaenoptera musculus Endangered
Fin whale Balaenoptera physalus Endangered
Northern right whale Eubalaena glacialis Endangered
Common dolphin Delphinus spp Protected
Pacific white-sided dolphin Lagenorhynchus obliquidens Protected
February 2011 Carone DPP Revisions
5.10-17
Common Name Scientific Name Status
Risso’s dolphin Grampus griseus Protected
Pacific bottlenose dolphin Tursiops truncatus Protected
Dall’s porpoise Phocoenoides dalli Protected
Northern right whale dolphin Lissodelphis borealis Protected
Killer whale Orcinus orca Protected
Pinnipeds
Pacific harbor seal Phoca vitulina Protected
Northern fur seal Callorhinus ursinus Protected
Guadalupe fur seal Arctocephalus townsendi Threatened
Northern elephant seal Mirounga angustirostris Protected
California sea lion Zalophus californicus Protected
Stellar (northern) sea lion Eumetopias jubatus Threatened (eastern stock)
Fissipeds
Southern sea otter Enhydra lutris nereis Threatened
Turtles
Pacific olive Ridley turtle Lepidochelys olivacea Endangered
Green turtle Chelonia mydas Endangered
Loggerhead turtle Caretta caretta Threatened
Leatherback turtle Dermochelys coriacea Endangered
Birds
Xantus’s murrelet Synthliboramphus hypoleucus Federal Candidate, California Threatened, and USFWS Bird of Conservation Concern
Marbled murrelet Brachyramphus marmoratus California Endangered, Federal Threatened
California least tern Sterna antillarum browni Federally and California Endangered
Ashy storm petrel Oceanodroma homochroa California Species of Special Concern
Black storm petrel Oceanodroma melania California Species of Special Concern
Black-vented shearwater Puffinus opisthomelas USFWS Bird of Conservation Concern
Pink-footed shearwater Puffinus creatopus USFWS Bird of Conservation Concern
Black-footed albatross Phoebastria nigripes USFWS Bird of Conservation Concern
Short-tailed albatross Phoebastria albatrus Federally Endangered
Tufted puffin Fratercula cirrhata California Species of Special Concern
Cassin’s auklet Ptychoramphus aleuticus California Species of Special Concern and USFWS Bird of Conservation Concern
February 2011 Carone DPP Revisions
5.10-18
5.10.3 Onshore Environment
5.10.3.1 Intertidal Habitats
Information provided in NOAA (2007) indicates that the intertidal habitats within the project region (defined for this section as the shoreline between Ellwood [west of Coal Oil Pt] to Pt. Mugu and the Channel Islands) include sand beaches, some of which are backed by riprap armor rock, natural rock reef and cobbles, and manmade structures such as breakwaters. Sand beaches are most common within this region, comprising approximately 90 per cent of the approximately 70 miles of the regional coastline. Larger natural rock habitats within the region include those inshore of Carpinteria Reef and cobble habitats at the mouth of the Ventura River and at Rincon Pt. Smaller rocky intertidal habitats are present at Punta Gorda and at Emma Wood State Beach.
The Channel Islands beaches on the ocean facing side are subjected to strong wave action, while beaches along the Santa Barbara Channel side are calmer providing for a more diverse range of intertidal species. Most of the islands are characterized by rocky substrate, however Santa Rosa and San Miguel Islands have large expanses of sandy beaches.
5.10.4 Regulatory Overview
The Endangered Species Act of 1973 (Section 9 and implementing regulations 50 CFR Part 17) protects marine wildlife species found off the coast of California. The Endangered Species Act (ESA) makes it unlawful to harass, harm, pursue, hunt, shoot, wound, kill, trap, capture, or collect an endangered species, or to attempt to engage in any such conduct. Violations of the ESA and regulations are subject to a fine and imprisonment. An “endangered species” is defined by the Secretaries of the Department of the Interior and/or the Department of Commerce as any species that is in danger of extinction throughout all or a portion of its range. A “threatened species” is defined as any species, likely to become an endangered species within the foreseeable future throughout all or a significant portion of its range. The United States Fish and Wildlife Service (USFWS) and NOAA Fisheries (previously called National Marine Fisheries Service) are responsible for implementation of the federal ESA.
In addition to the Federal ESA, NOAA Fisheries is also responsible for enforcing the Marine Mammal Protection Act of 1972 (MMPA), which protects all marine mammals within U.S. waters. Specifically, the MMPA prohibits the intentional killing or harassment of these marine mammals; however, incidental harassment, with authorization from the appropriate federal agency, may be permitted.
The USFWS also administers the federal Migratory Bird Treaty Act (MBTA) of 1918 (16 USC 703-711). The focus of the MBTA was the “Establishment of a federal prohibition, unless permitted by regulations, to pursue, hunt, take, capture, kill, attempt to take, capture or kill, possess, offer for sale, sell, offer to purchase, purchase, deliver for shipment, ship, cause to be shipped, deliver for transportation, transport, cause to be transported, carry or cause to be carried by any means whatever, receive for shipment, transportation or carriage, or export, at any time, or in any manner, any migratory bird, included in the terms of this Convention for the protection of migratory birds, or any part, nest or egg of any such bird.” (16 USC 703). Implementing regulations at 50 CFR 10 list the migratory birds covered under the MBTA and the
February 2011 Carone DPP Revisions
5.10-19
MBTA prevents the removal or harassment of active nests of migratory bird species that may result in the loss of eggs or nestlings.
5.10.5 Potential Environmental Impacts
The proposed Project will not result in any structural changes to Platform Hogan or in the ongoing operational activities at the La Conchita facility. Therefore, proposed drilling operations are not expected to result in adverse impacts to the surrounding marine habitat. The following discussions outline potential impacts to marine biological resources and the measures that will be implemented to avoid or reduce these impacts.
5.10.5.1 Noise Impacts
Although not regulated by law, NOAA Fisheries has established guidelines for noise levels that could affect marine mammals. While some studies have shown behavioral changes in marine mammals occur when an impulse sound pressure level (SPL) of 160 dB re 1Pa rms, mitigation is usually required within an area within which SPLs between of180 dB and 190 dB (both re 1Pa rms) are predicted. The 180 dB level is generally applicable within areas where cetaceans (whales and dolphins) are present, and the 190 dB distance applies to areas supporting otarids and pinnipeds (seals and sea lions). Available scientific evidence suggests that harassment of these marine mammals could occur from SPLs at or above these levels and mitigations are developed on a case-by-case basis through consultation with the NOAA Fisheries office within the region.
Underwater noise levels associated with project construction are not expected to exceed the 160 and 180 dB Level A take limits. Primary project-related underwater noise sources are expected to be from platform operations. According to Malme and LGL (2001), the normal underwater noise level output from oil platform production is approximately 140 dB, which does not exceed Level A take limits. During drilling operations, in-water noise levels are expected to be below those limits and are not expected to result in a “take” of marine mammals. With the proposed operation, no increases above the current noise levels are expected. The current noise levels at the operating platform do not appear to be producing significant negative effects to marine wildlife that occur in the vicinity of the operations.
Data presented in Entrix (2004), which cites various published sources, indicate that underwater noise levels generated by tugs and supply boats range from 147 to 156 dB at 33 ft (10 m) from the source; those levels decrease to 107 to 116 dB within 0.6 mile (one kilometer). There will be no additional crew boats and up to one additional workboat arriving and departing from the platform per week. Noise generated by the additional vessel is not expected to result in significant effects to the marine wildlife at and around the platform.
5.10.5.2 Oil Spill Potential
Routine platform discharges will be conducted in accordance with existing NPDES permits and will, therefore, not degrade the existing quality of the marine waters around the platform. The unintentional release of petroleum into the marine environment from proposed drilling and production operations could result in potentially significant impacts to the marine biota, particularly avifauna and early life stage forms of fish and invertebrates, which are sensitive to those chemicals. Refined products (i.e., diesel, gasoline.) are more toxic than heavier crude or Bunker-type products, and the loss of a substantial amount of fuel or
February 2011 Carone DPP Revisions
5.10-20
lubricating oil during construction operations could affect the water column, seafloor, and intertidal habitats and associated biota, resulting in their mortality or substantial injury, and in alteration of the existing habitat quality. The release of petroleum into the marine environment is considered a potentially significant impact.
Although many marine organisms have created adaptive strategies to survive in their environment, when these marine organisms are introduced to oil it adversely affects them both physiologically and/ or chemically. For example, physiological effects from oil spills on marine life could include the contamination of protective layers of fur or feather, loss of buoyancy, and loss of locomotive capabilities. Direct lethal toxicity or sub-lethal irritation and temporary alteration of the chemical make-up of the ecosystem are examples of chemical effects of oil within marine wildlife. Oil spills have many variables to consider when dealing with the impact of the spill including: oil type, season of occurrence, animal behavior, oceanographic and meteorological conditions, and the cleanup methods employed (MMS, 1983a).
The possible effects of oil on marine wildlife has been studied and discussed by federal and state agencies such as the National Oceanic and Atmospheric Administration (NOAA) and the California and the Department of Fish and Game (CDFG). In 1995, the Office of Oil Spill Prevention and Response (OSPR) organized California’s existing oiled wildlife centers into the Oiled Wildlife Care Network (OWCN). OSPR is an office within the Department of Fish and Game charged with oil spill prevention and response. The office directs spill response, cleanup, and natural resource damage assessment activities (SBWCN, 2010). The research and experiments conducted by these agencies is a cumulative ongoing effort to better understand what potential effects an oil spill of any magnitude will or may have on marine wildlife that includes cetaceans, pinnipeds, fissipeds and marine birds. The following text summarizes the potential impacts from exposure to oil spills.
Benthic Communities. Oil can reach the benthos (or ocean floor) by the formation of non-buoyant residues, adsorption onto particulate matter or through incorporation in the food chain by ingestion and subsequent sinking of fecal pellets (Jordan and Payne 1980). Contrary to oil in water, which can dilute and disperse, oil that is incorporated into sediments can become a chronic pollutant source. It can be ingested by benthic organisms or incorporated into organism by contact with gill membranes. For example, the large amounts of oil that settled to the benthic environment following the Santa Barbara Channel oil spill in 1969 were attributed to the mixing and adsorption of oil into sediments (Kolpack 1971; McAuliffe et al. 1975). The severity of oil spill impacts to benthic organisms can vary according to the degree of weathering of the oil. Oil that sinks quickly before it has weathered would contain appreciable amounts of toxic hydrocarbons that may be accumulated by benthic organisms, resulting in mortalities. Weathered oil, although not as toxic, could potentially smother sessile organisms associated with hard substances. Hence, the potential impacts of spilled oil to benthic communities are considered to be significant.
Intertidal. When spilled oil contacts the shoreline or intertidal zone, it becomes concentrated in a narrow zone. Because of the shallow water depth, hydrocarbon concentrations can quickly reach toxic levels. Thus, intertidal biota are exposed to higher concentrations of oil for a longer period of time than most other marine organisms. Impacts to the intertidal biota can be caused by physical smothering and hydrocarbon toxicity. Shoreline
February 2011 Carone DPP Revisions
5.10-21
types in the project area consist primarily of sandy beaches and rocky intertidal habitat. Following the Torch pipeline spill of September 28, 1997, certain beaches and rocky areas were not cleaned due to inaccessibility (Santa Barbara County 1997, 2001a). After the spill two intertidal sites (Boat House and Stairs) within the exposure zone were surveyed by Raimondi et al. (1999) for the MMS. There was no confirmation that spilled oil had reached the two intertidal sites and no confirmation that spilled oil had caused significant biological changes at either site. At Point Arguello, just north of the Boat House, large amounts of fresh oil and tar were observed on rocks throughout the middle and lower intertidal zone. Raimondi et al. (1999) and OSPR (1999) noted that “Sticky globs of tar were seen on black abalone and seastars. Tar covered the respiratory pores of some abalone. Based on these observations, some mortality may have occurred.” After the 1969 Santa Barbara Channel oil spill, effects to several intertidal species were also recorded. Impacts included smothering of barnacles (Chthalamus fissus), mortality of surfgrass (Phyllospadix torreyi) and algae (such as Hesperophycus harveuanus), and reduced reproduction in the stalked (gooseneck) barnacle (Pollicipes polymerus) (Straughan 1971).
Plankton. Laboratory studies, field enclosure studies, and field studies conducted during oil spill have shown that oil spills have measurable effects upon marine phytoplankton and zooplankton. Impacts to phytoplankton include mortality, reduced growth, and reduced photosynthesis. Impacts to zooplankton include mortality and sublethal effects, such as lowered feeding and reproductive rates and altered metabolism. Early life stages, such as eggs, embryos, and larvae of zooplankton, are considered to more susceptible than adults to oil spills because of their higher sensitivity to toxicants and higher likelihood of exposure to oil at the surface of the ocean. The lethal and sublethal effects of oil on plankton depend on the persistence of sufficiently high concentrations of petroleum hydrocarbons in the water column. Therefore, the effects would most likely be short-lived because of the limited residence time of oil in the water column in an open-ocean environment. The release of petroleum into the marine environment is considered a potentially significant impact.
Fish Resources. The effects of oil on fish have been well documented both in the field and within a laboratory. This research shows that fish that are unable to avoid hydrocarbons with take them up from food, sediments and surrounding waters. Once these hydrocarbons are in the organism’s tissues they will affect the life span through a variety of behavioral, physiological, or biochemical changes. Also, exposure to oil will affect a species’ ability to search, find and capture food, which will affect its nutritional requirements. Early development life stages such as larvae will be especially impacted by this (Jarvela et al., 1984). Small amount of oil can impact fish embryos by causing physical deformities, damage to genetic material and mortality (Carls, 1999). Fish species experience the highest mortalities due to oil exposure when they are eggs or larvae. However, these deaths would not be significant in terms of the species total population in offshore water (Jarvela et al., 1984). Brief encounters with oil with juvenile and adult fish species would be unlikely to be fatal.
Cetaceans. The documentation on the effects on oil with whales, dolphins and porpoises is hard to find due to the difficult reclusive nature and migratory behavior (Australian Maritime Safety Authority, 2010). The impact of direct contact with oil on the animal’s skin varies depending on the species. Cetaceans have no fur, which can be oiled and do not depend on fur for insulation. Therefore, they are not susceptible to the insulation effects such as hypothermia in other mammals. However, external impacts to cetaceans from direct skin contract with oil
February 2011 Carone DPP Revisions
5.10-22
could include: eye irritation, burns to mucous membranes of eyes and mouth and can increase vulnerability to infection (Office of Protected Resources - NOAA Fisheries, 2010).
Baleen whales (e.g. Pacific right whale) skim the surface of water for feeding and are particularly vulnerable to ingesting oil and baleen fouling. Adult cetacean would most likely not suffer from oil fouling of their blowholes because they spout before inhalation and therefore clearing the blowhole. Younger cetaceans are more vulnerable to inhale oil. It has been suggested that some pelagic species can detect and avoid contact with oil (Australian Maritime Safety Authority, 2010). This still presents a problem for those animals that must come up to the surface to breathe and to feed (MMS, 1983).
Internal injury is more probably for cetaceans due to oil. Oil inhaled could result in respiratory irritation, inflammation, emphysema, or pneumonia. Ingestion of oil could cause ulcers, bleeding, and disrupt digestive functions. Both inhalation and ingested chemicals could cause damage in the liver, kidney, lead to reproductive failure, death, or result in anemia and immune suppression.
Pinnipeds. Seals and sea lions that come in contact with oil could experience a wide range of adverse impacts including; thermoregulatory problems: disruption of respiratory functions; ingestions of oil as a result of grooming or eating contaminated food; external irritation (eyes); mechanical effects; sensory disruption; abnormal behavioral responses; loss of food and avoidance of contaminated areas.
Guadalupe fur seals and Northern fur seals could experience thermoregulatory problems if they come into contact with oil (Geraci and Smith, 1977). Oil makes hair of a fur seal lose its insulating qualities. Once this happens the animal’s core body temperature may drop and increases its metabolism to prevent hypothermia. This could potentially be fatal to a distressed or diseased animal and highly stressful for a healthy animal (Engelhardt, 1983).
Pinnipeds that use blubber for insulation (California sea lion, harbor seal, northern elephant seal, and Stellar sea lion) do not experience long term effects to exposure to oil (Geraci and St. Aubin, 1982). Newborn harbor seal pups, which rely on a dense fur for insulation, would be subject to similar thermoregulatory problems of the previously discussed fur seal species. (Engelhardt and Ferguson, 1980, Oritsland and Ronald, 1973; and Blix et al., 1979).
When pinnipeds are coated with viscous oil it may cause problems in locomotion and breathing. Pinnipeds that are exposed to heavy coating from oil will experience swimming difficulties, which may lead to exhaustion (Engelhardt, 1983; David and Anderson, 1976) and possible suffocation from breathing orifices that are clogged. The viscosity of the oil is a major factor in determining the effects on pinnipeds. Severe eye irritation is caused by direct contact with oil but non-lethal (Engelhardt, 1983). Skin absorption, inhalation and swallowing of oil while grooming are all possible ways pinnipeds may ingest oil. However, there have not been enough studies done on the long-term effects of chronic exposure to oil on pinnipeds.
Sea Otters. Sea otters, although not expected to be found in the immediate project area, are highly impacted to the adverse impacts of exposure to spilled oil due to the large amount of time spent on the ocean’s surface. Contact with spilled oil could result in reducing or eliminating the layer of air trapped in sea otters fur. Matting their fur could cause hypothermia,
February 2011 Carone DPP Revisions
5.10-23
elevated metabolism, cessation of feeding, weight loss (Environment Canada, 1982; Engelhardt, 1983; Kooyman et al., 1997; Siniff et al., 1982) because the layer of air in their fur provides both insulation and buoyancy for the sea otters (Davis and Anderson, 1976; Geraci and Smith, 1977). Hypothermia could prove to be fatal as the result of contamination of greater than 30 percent of a sea otter’s body (Costa and Kooyman, 1980).
Sea otters are especially vulnerable to oil spills might ingest oil while feeding of oil-contaminated prey, grooming or inhalation. (Bodkin et al. 2002; Ridoux et al. 2004). Ingestion of oil is considered potentially toxic depending on the type and quantity consumed. Oil spills could affect a sea otter’s caloric intake by oil spill-induced mortality of their prey, such as crabs and sea urchins (Cimberg and Costa, 1985).
Sea Turtles. Oil spills are not considered a high cause for morality for sea turtles, although recent reports from the Gulf of Mexico Deepwater Horizon spill indicate a possible increase in strandings of oil impacted turtles. Since sea turtles species have been listed as threatened or endangered under the 1973 U.S. Endangered Species Act there is very little direct experimental evidence about the toxicity of oil to sea turtles. Sea turtles are negatively affected by oil at all life stages: eggs on the beach, post hatchings, young sea turtles in nearshore habitats, migrating adults and foraging grounds. Each life stage varies depending on the rate, severity and effects of exposure.
Sea turtles are more vulnerable to oil impacts due to the lack of to their biological and behavior characteristics including indiscriminate feeding in convergence zones, long pre-dive inhalations, and lack of avoidance behavior (Milton et al., 2004). The type of diving behavior puts sea turtles at risk because they inhale a large amount of air before diving and will resurface over time. During an oil spill this would expose sea turtles to long periods of both physical exposure and petroleum vapors, which can be the most harmful during an oil spill.
Marine Birds. Marine birds can be affected by direct contact with oil in three ways: thermal effects due to external oiling of plumage; toxic effects of ingested oil as adults; and effects on eggs, chicks, and reproductive abilities.
The loss of waterproofing is the primary external effect of oil on marine birds. Buoyancy is lost if the oiling is severe. A main issue with oil on marine birds is the damage oil does to the arrangement of feathers, which is responsible of water repellency (Fabricius, 1959). When this happens the water can go through the dense layers of feathers to the skin causing a loss of body heat (Hartung, 1964). To survive the bird must metabolize fat, sugar and eventual skeletal muscle proteins to main body heat. The cause of oiled birds death can be the result from exposure and loss of these energy reserves as it is to the toxic effects of ingested oil (Schultz et al., 1983).
The internal effect of oil on marine birds varies. Anemia can be the result of bleeding from inflamed intestinal walls. Oil passing into the trachea and bronchi could result in the development of pneumonia. A bird’s liver, kidney and pancreatic functions can be disturbed due to internal oil exposure. Ingested oil can inhibit a bird’s mechanism for salt excretion that enables seabirds to obtain fresh water from salt water and could result in dehydration (Holmes and Cronshaw, 1975). Studies have shown that ingested oil may alter egg yolk structure, reduce egg hatchability, and reduce egg-laying rate for seabirds (Grau et al., 1977; Hartung, 1965). When oil contacts the
February 2011 Carone DPP Revisions
5.10-24
exterior of eggs it could reduce the hatching success (Hartung, 1965; Albers and Szaro, 1978; King and Lefever, 1979; Patten and Patten, 1979; Coon et al., 1979; McGill and Richmond, 1979).
A bird’s vulnerability to an oil spill depends on each individual species’ behavioral and other attributes. The some of the more vulnerable species are alcids and sea ducks due to the large amount of time they spend on the ocean surface, dive when disturbed and they are gregarious. Also, alcids and other birds have low reproductive rates which result in a lengthen population recovery time. Birds’ vulnerability depends on the season as well. For example, colonial seabirds are most vulnerable between early spring through autumn because they are tied to breeding colonies.
The current oil spill prevention plan will be used to avoid any release of oil-based products into the marine environment. The following operational measures have been incorporated into the proposed plan of operation and will result in reducing the chances of a spill occurring:
All vessels will be USCG-inspected and will have the appropriate spill response equipment onboard.
Carone will maintain an approved oil spill response plan and the appropriate spill response equipment on the platform. Response drills will be in accordance with federal and state requirements. Contracts with off-site spill response companies will be in-place and will provide additional containment and clean-up resources as needed.
Pipelines will be maintained and inspected in accordance with BOEMRE regulations.
Petroleum-fueled equipment on the platform will have drip pans or other means of collecting dripped oil, which will be collected and treated with onboard equipment. No petroleum will be allowed to enter the marine waters from the platform.
The drilling rig will be fitted with blowout preventing equipment (BOPE). The blowout equipment will be sized, specified, and tested in accordance with the BOEMRE regulation well control guidelines. The BOPE and choke manifold will be hydrotested with water in accordance with applicable regulations. The BOPE will be tested when installed, before drilling out each string of casing, and once every 14 days. Potential impacts to marine resources are discussed further in Attachment 7.0 and Attachment 9.0.
5.10.5.3 Drilling Fluid Release
An accidental release of drilling fluid could result in increased turbidity and water quality degradation. If a release of drilling fluid occurs, prevailing wave activity and resulting dispersion at the site is expected to result in short-term, less than significant impacts to the marine biota and habitats. The use of a non-toxic, Cypan polymer mud and bentonite-based fluid will further reduce the likelihood of substantial marine-related impacts due to a spill. Bentonite may contain elevated concentrations of barium and other metals that could be present as trace impurities in the clay. However, these metals are present in an insoluble form and do not readily dissolve in seawater and are not bio-available (SAIC, 1999). Nevertheless, deposition resulting from large releases of drill fluid over an extended period could result in those fluids being incorporated into the sediment. As such, the unrestricted release of drill fluid could violate one or more water
February 2011 Carone DPP Revisions
5.10-25
quality standards including reduction of light transmission, creation of a visible sheen or turbidity layer.
5.10.5.4 Migratory Bird Treaty Act (MBTA)
The Migratory Bird Treaty Act (MBTA) and CDFG codes (Sections 3503, 3503.5, and 3800) prohibit the take, possession, or destruction of birds, their nests, or eggs. Disturbance that causes nest abandonment and/or loss of reproductive effort could be considered a “take”.
If an active bird nest is observed on the platform, the USFWS will be contacted for recommendations on nest buffer size. Project activities or disturbance surrounding the nest area will be minimized until the young have fledged or USFWS has determined otherwise. If a dead special-status bird species is discovered, USFWS will be contacted immediately. These measures will reduce project impacts to less than significant levels.
5.10.5.5 Vessel Collisions
Species Seasonality. Knowing the seasonality of marine mammal occurrences is important in analyzing potential impacts. While some species are present in the region year-round, others are transients, migrating through these waters, following movements of prey, or appearing with masses of warm or cold water that may or may not coincide with the seasons. Although some researchers indicate the seasonality of marine mammal occurrences by calendar seasons, such as spring or winter (U.S. Navy, 2002), others prefer to use “oceanographic seasons,” which consist of the cold-water months from November through April and the warm-water months of May through October (Carretta et al., 2000). The intrusion of unusually warm (El Niño) or cold-water (La Niña) masses, however, complicates these categorizations. Some species, including the California gray whales (Eschrichtius robustus), are present at about the same times every year regardless of water temperatures. Others, such as the northern right whale dolphins (Lissodelphis borealis), are associated with cold-water masses and do not appear when the water is warm. Thus, that species usually is recorded only in late winter or spring, when the water is coldest, unless a warm-water event is taking place. Still other species are associated only with warm water.
Table 5.10-3 provides a graphic of the seasonal occurrences of the various species of marine mammals that could be present within the project area. It is important to note that, where seasonal differences occur, individuals may also be found within the area during the “off” season. The “presence/absence” range shown in Table 5.10-5 reflects a general characterization of seasonal abundance that has been developed over several decades of data collection.
Collisions of project-related vessels with marine mammals and sea turtles are typically the greatest concern raised regarding potential impacts from marine operations. Such collisions have been documented in Santa Barbara Channel; however, such collisions are typically associated with large ships rather than smaller work vessels. Impacts from vessel operations can range from a change in the animal’s travel route or surface time to direct mortality associated with a high-speed collision with a large ship.
During the proposed drilling, there will be no additional crew boats and up to one additional workboat arriving and departing from the platform per week. This level of activity is not expected to result in a significant increase in the chances of a mammal-vessel collision. On-
February 2011 Carone DPP Revisions
5.10-26
board personnel will be watchful as the vessel crosses this path or anytime whales are observed in the area. All vessel operators shall observe the following guidelines:
Make every effort to maintain a distance of 500 feet from sighted whales and other marine wildlife (e.g., sea turtles);
Do not cross directly in front of (perpendicular to) migrating whales or any other marine mammal or turtle;
When paralleling whales, vessels will operate at a constant speed that is not faster than that of the whales;
Care will be taken to ensure that female whales are not be separated from their calves; and
If a whale engages in evasive or defensive action, vessels will reduce speed or stop until the animal calms or moves out of the area.
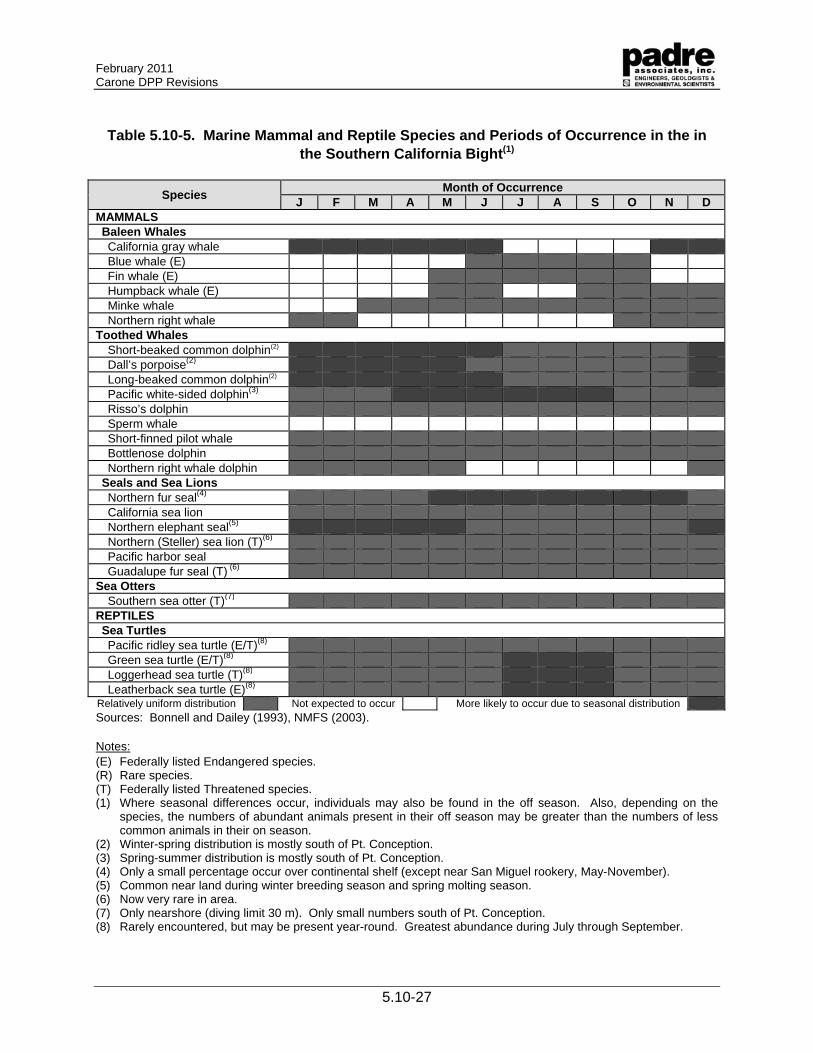
February 2011 Carone DPP Revisions
5.10-27
Table 5.10-5. Marine Mammal and Reptile Species and Periods of Occurrence in the in the Southern California Bight(1)
Species Month of Occurrence
J F M A M J J A S O N DMAMMALS Baleen Whales California gray whale Blue whale (E) Fin whale (E) Humpback whale (E) Minke whale Northern right whale
Toothed Whales Short-beaked common dolphin(2) Dall’s porpoise(2) Long-beaked common dolphin(2) Pacific white-sided dolphin(3) Risso’s dolphin Sperm whale Short-finned pilot whale Bottlenose dolphin Northern right whale dolphin
Seals and Sea Lions Northern fur seal(4) California sea lion Northern elephant seal(5) Northern (Steller) sea lion (T)(6) Pacific harbor seal Guadalupe fur seal (T) (6)
Sea Otters Southern sea otter (T)(7)
REPTILES Sea Turtles Pacific ridley sea turtle (E/T)(8) Green sea turtle (E/T)(8) Loggerhead sea turtle (T)(8) Leatherback sea turtle (E)(8)
Relatively uniform distribution Not expected to occur More likely to occur due to seasonal distribution Sources: Bonnell and Dailey (1993), NMFS (2003). Notes: (E) Federally listed Endangered species. (R) Rare species. (T) Federally listed Threatened species. (1) Where seasonal differences occur, individuals may also be found in the off season. Also, depending on the
species, the numbers of abundant animals present in their off season may be greater than the numbers of less common animals in their on season.
(2) Winter-spring distribution is mostly south of Pt. Conception. (3) Spring-summer distribution is mostly south of Pt. Conception. (4) Only a small percentage occur over continental shelf (except near San Miguel rookery, May-November). (5) Common near land during winter breeding season and spring molting season. (6) Now very rare in area. (7) Only nearshore (diving limit 30 m). Only small numbers south of Pt. Conception. (8) Rarely encountered, but may be present year-round. Greatest abundance during July through September.
February 2011 Carone DPP Revisions
5.10-28
If a collision with a marine mammal or turtle occurs, the vessel operator must document the conditions under which the accident occurred, including the following:
location of the vessel when the collision occurred (latitude and longitude);
date and time;
speed and heading of the vessel;
observation conditions (e.g., wind speed and direction, swell height, visibility in miles or kilometers, and presence of rain or fog);
species of marine wildlife contacted;
whether an observer was standing watch for the presence of marine wildlife; and,
name of vessel, operator (the company), and captain or officer in charge of the vessel at time of accident.
Following an unanticipated strike, the vessel will stop, if safe to do so. The vessel is not obligated to stand by and may proceed after confirming that it will not further damage the animal by doing so. The vessel will then communicate by radio or telephone all details to the vessel’s base of operations. From the vessel’s base of operations, a telephone call will be placed to the Stranding Coordinator, NOAA Fisheries, Southwest Region, and Long Beach to obtain instructions.
5.10.5.6 Commercial and Recreational Fishing
Existing Commercial Fisheries. The California Resources Agency (2008) indicates that a variety of gear types are deployed by commercial fishers within the marine waters of the Santa Barbara Channel (SBC). Some of the gear types utilized in the region include various forms of round haul nets, hook-and-line, trawl, trap, entangling nets (including gill net), and hand capture by divers. Round haul nets are used to encircle coastal pelagic species (i.e. sardines, anchovy, and mackerel) along the mainland coast and around the Channel Islands. Hook-and-line gear is used extensively in the nearshore finfish fisheries, and trawl gear is used to capture various bottom species such as California halibut, ridgeback prawn, and sea cucumbers. Traps are utilized to capture invertebrates (spiny lobster, rock crabs, spot prawn) and in the live-fish fishery for species such as the California sheephead. Entangling nets are used to take species such as California halibut and white seabass, while commercial divers using air supplied via hose directly from a compressor system on the boat (“hookah”) to capture red sea urchins. The divers use hand-held rakes to collect the sea urchins into mesh bags.
Commercial fishing occurs throughout the marine waters of the project region with target species based on season, gear type, water depth, and seafloor type. Generally, commercial trawling is not allowed inshore of the California state three-nautical mile limit, however commercial trawling is allowed within the California Halibut Trawl Grounds (CHTG), defined as the ocean waters between one and three nautical miles from the mainland shore between Laguna Point and Gaviota and from Point Conception to Point Arguello. Because of deep water and military vessel traffic, a small area immediately offshore the entrance to Port Hueneme is also precluded from CHTG. Trawling for halibut within the CHTG is allowed from June 16th through March 14th only and access is limited to commercial fishers who have obtained a specific license for use of this area. Although Platform Hogan is outside of the CHTG,
February 2011 Carone DPP Revisions
5.10-29
nearshore halibut trawling is allowed within that portion of the project area between one and three miles offshore of shoreline that is transited by support vessel traffic between the Casitas Pier, Port Hueneme, and Platform Hogan.
Nearshore (to water depths of approximately 300 ft) commercial fishing with the SBC generally targets on crab, halibut, lobster, sea cucumbers, urchins, and epipelagic species such as squid, anchovies, and sardines. Deeper water operations using drift nets usually target surface species such as sharks and swordfish, as well as trawl-caught demersal species such as flatfish. The California Department of Fish and Game (CDFG) maintains catch records from a series of areas of the ocean known as Fish Blocks. Due to the irregular coastline, nearshore Fish Blocks vary in size, however open water Fish Blocks encompass a 100 square nautical mile area (10 nautical miles on a side). Catch data, recorded by the commercial fisher at the time the catch is sold, is recorded by species and pounds. These data are available to the public upon request from the CDFG fish statistics unit and are routinely used to characterize the commercial catch from an area of the marine waters offshore California.
CDFG also records and reports annual commercial landings by region; the Santa Barbara Region includes the ports of Santa Barbara, Ventura, Port Hueneme, and Channel Islands. The total commercial landings for all species taken from the marine waters within the Santa Barbara Region in 2008, the latest available year, was 55.27 million pounds; an additional 34,000 pounds of fish taken from the marine waters outside of the region were also landed in the Santa Barbara regional ports. Species that contributed the most pounds to the landings included squid (44.7 million pounds), red urchins (5.9 million pounds), and ridgeback shrimp (0.5 million pounds) (California Department of Fish and Game, 2010).
The project is located within Fish Block 652, which includes the ocean waters from Santa Barbara Harbor to just east of the Casitas Pier and from the shoreline offshore approximately 4.5 nautical miles. Water depths within Fish Block 652 range from 0 to approximately 180 ft. From 2005 through 2009, commercial catch data indicates that approximately 1.1 million pounds of fish and invertebrates have been caught within Fish Block 652 (CDFG, unpublished). The six species or species group that contributed the highest percentage of that total for the five most recent years were: crabs, caught by trap (625,200 pounds); Kellet’s whelk, caught in lobster and crab traps (154,300 pounds); halibut, caught in set nets and trawls (52,100 pounds); lobster, caught in traps (46,100 pounds); red urchins, collected by divers (20,500 pounds); and sea cucumbers, caught in trawls (12,400 pounds). Combined, these six species or species groups accounted for over 910,000 of the 1.1 million pounds (~90 per cent) caught within Fish Block 652. Based on the catch data and on the sedimentary seafloor habitat within the project area, trawling, set nets, and traps would be expected to be the most commonly used gear there. The lack of rocky substrate within the project area suggests that the red urchins reported from that fish block are probably not targeted within the project site.
Existing Recreational Fisheries. The SBC also supports an active recreational fishing resource which fishers use commercial party boats, piers, private vessels, kayaks, and the shoreline to access. Information provided by Recreational Fisheries Information Network (RecFIN) (2010) indicates that the most popular regional recreational fish species over the four most recent years (January 2007 to January 2010) caught by nearshore recreational fishers
February 2011 Carone DPP Revisions
5.10-30
(within three miles of the shoreline) were Pacific mackerel (Scomber japonicus), barred surfperch (Amphistichus argenteus), jacksmelt (Atherinops affinis), several species of rockfish (Sebastes spp.), and kelp bass (Paralabrax clathratus).
CDFG (2008) reports that within “The Channel District” which includes Santa Barbara and Ventura Counties, approximately 412,000 “angler trips” were taken in 2007 (the latest available data). Of those, over 197,000 (48 per cent) were trips to manmade structures (pier, jetties, etc.), with “beaches and banks” being the second most popular fishing locations (155,000 or 38 per cent), followed by almost 35,000 trips on commercial passenger vessels (party boats), and approximately 24,500 trips on private and rental boats.
Squire and Smith (1977) characterize the recreational fisheries of the west coast within different “areas.” The project is located within the Squire and Smith’s “Santa Barbara Area” which includes the marine waters from Rincon Point to Point Conception and offshore to the Channel Islands. Due to the varied shoreline and seafloor within this area, the nearshore recreational resources include several locations to target kelp bed and rocky habitat-associated species, including lingcod and rockfish as well as sedimentary habitat species such as halibut and seabass. Popular recreational fishing areas within the Santa Barbara Area include Canby Reef (offshore Santa Barbara Harbor), Naples Reef (west of Coal Oil Point) and rocky reefs near Gaviota (Squire and Smith, 1977).
Potential Effects. The proposed actions could impact commercial and recreational fisheries by either directly affecting the resources (fish and invertebrates) or resulting in damage to, loss of, or preclusion of the equipment used to capture those resources. The biological resources could be impacted from the effects of discharged contaminants, including produced water, platform wastes, and/or petroleum and the resulting degradation of habitat quality or direct toxicity to the organisms. Most likely impacts to fisheries equipment include damage to stationary gear (i.e. set nets and traps) from interactions with project-related vessels or trawl net damage from debris or other seafloor alterations. Closure of harbors or preclusion of areas to fishing during oil spill response and cleanup operations are also potential, project-related impacts to commercial and recreational fishing.
While expanding production activities, the proposed project will not introduce any new operations within the area around Platform Hogan as the proposed drilling, transport, and distribution of produced oil and gas currently occur at the site. Expanded drilling will require some modification of equipment on the platform and an increase in the amount of drilling fluid used and produced water generated. One additional crew/supply vessel per week is anticipated with the proposed activities.
Without mitigation, the potential effects could be considered potentially significant; however the measures that have been incorporated into the drilling and production plan reduce or eliminate those potentially significant impacts. In addition, no significant increase in vessel traffic, additional anchoring or other seafloor disturbing activities, or discharge of untreated fluids are anticipated. With the incorporation of the measures listed below, the proposed Project will not adversely impact commercial and recreational fishing resources.
The following mitigations have been incorporated into the proposed action to reduce or eliminate potential impacts on commercial and recreational fishing within the project area:
February 2011 Carone DPP Revisions
5.10-31
BOEMRE-approved blowout preventers will be installed on the new wells.
All vessels will be USCG-inspected and will have the appropriate spill response equipment onboard.
Supply and crew vessels will adhere to the voluntary vessel traffic lanes established by the Joint Oil/Fisheries Liaison Office for trips between Casitas Pier/Port Hueneme and Platform Hogan.
To minimize the potential area of effect and reduce the chance that fishing ports will be directly affected, Carone will maintain an approved oil spill response plan and the appropriate spill response equipment on the platform. Response drills will be in accordance with federal and state requirements. Contracts with off-site spill response companies will be in-place and will provide additional containment and clean-up resources as needed.
Pipelines will be maintained and inspected in accordance with BOEMRE regulations.
Petroleum-fueled equipment on the platform will have drip pans or other means of collecting dripped oil, which will be collected and treated with onboard equipment. No petroleum will be allowed to enter the marine waters from the platform.
Petroleum-fueled equipment on the platform will have drip pans or other means of collecting dripped oil, which will be collected and treated with onboard equipment or sent to the onshore La Conchita facility for treatment. No petroleum will be allowed to enter the marine waters from the platform.
Sampling and reporting of the open-ocean effluent will be in accordance with General NPDES requirements and treatment of produced water and platform wastewater will continue as previously approved.
To preclude seafloor debris, Carone will maintain a Zero-Discharge policy from Platform Hogan and from vessels that support platform operations.
February 2011 Carone DPP Revisions
5.10-32
5.10.6 References
Adams, J., J. Y. Takekawa, And H. R. Carter. 2004. Foraging Distance and Home range of Cassin’s Auklets Nesting at Two Colonies in the California Channel Islands. Condor 106:618–637.
Albers, P.H. and Szaro, R.C. 1978. Effects of No. 2 Fuel Oil on Common Eider Eggs. Marine Pollution Bulletin. Vol.9.
Aspen Environmental Group. 2008. Tranquillon Ridge Oil and Gas Development
Project. Prepared for the County of Santa Barbara Planning & Development Department. Santa Barbara County.
Audobon Society Watchlist. 2007. Birds and Science: State of the Birds. Website: http://web1.audubon.org/science/species/watchlist/profile.php?speciesCode=xanmur
Baker, J. R, Jones, A. M, Jones, T. P., and Watson, H.C. 1981. Otter Lutra lutra L. Mortality and Marine Oil Pollution. Biol. Conserv. 20, 311-321.
Bartholomew, G.A., 1967. Seal and sea lion populations of the California Islands. In: R.N. Philbrick (ed.) Proceedings, Syposium on the Biology of the California Islands. Santa Barbara Botanic Garden, Santa Barbara, CA. pp. 229-244.
Blix, A. S., Grav, H. J., and Ronald, K. 1979. Some Aspects of Temperature Regulation in Newborn Harp Seal Pups. Am. J. Physiol., V. 236.
Bodkin, J.L., B.E. Ballachey, T.A. Dean, A.K. Fukuyama, S.C. Jewett, L. McDonald, D.H. Monson, C.E. O’Clair, and G.R. VanBlaricom.2002 Sea Otter Population Status and the Process of Recovery from the 1989 Exxon Valdez Oil Spill. Marine Ecology Progress Series 241: 237-253.
Bonnell, M.L., and M.D. Dailey. 1993. Ecology of the Southern California Bight: A Synthesis and Interpretation. Berkeley, CA: University of California Press.
Bonnell, M.L., R.G. Ford. 1987. California sea lion distribution: A statistical analysis of aerial transect data, J. Wildl. Manage, 51(1):13-20.
Borradaile, L. A. and F. A. Potts. 1963. The Invertebrata. Cambridge University Press, London, England.
Braham, H.W., 1984. The status of endangered whales: An overview. Marine Fisheries Review 46:2-6.
Briggs, K. T., W. B. Tyler, D. B. Lewis, and D. R. Carlson. 1987. Bird Communities at Sea of California, 1975– 1983. Studies in Avian Biology 11:1–74.
Bureau of Land Management (BLM). 1979. Final environmental statement, OCS Sale 48, proposed 1979 OCS Oil and Gas Lease Sale, Offshore Southern California.Bur. Land Mgmt.,USDI.
Bureau of Land Management (BLM). 1981. Draft Environmental Impact Statement, Proposed 1982 Outer Continental Shelf Oil and Gas Lease Sale Offshore Southern California, OCS Sale No. 68. U.S. Department of the Interior.
February 2011 Carone DPP Revisions
5.10-33
California Department of Fish and Game (CDF&G). 1976. At the Crossroads, a Report on California’s Endangered and Rare Fish and Wildlife. Sacramento, CA.
California Department of Fish and Game. 2006. Fish and Game Code Section 8841(h) as amended by Assembly Bill 1431. September 2005.
California Department of Fish and Game. 2008. California Recreational Fisheries Survey 2007 Annual Review. A report to the California Fish and Game Commission, September 2008. From website: http://www.dfg.ca.gov/marine/pdfs/crfs2007review.pdf
California Department of Fish and Game. 2010. Monthly Landings in Pounds in the Santa Barbara Area During 2008. http://www.dfg.ca.gov/marine/landings06/table12.pdf
California Department of Fish and Game, unpublished. Commercial catch data from Fish Block 652, provided to Ray de Wit, Padre Associates, Inc. via e-mail by Jana Robertson, CDFG Statistics Branch, Los Alamitos, CA. April 6, 2010.
California Resources Agency. 2008. Draft Regional Profile of the MLPA South Coast Study Region (Point Conception to the California/Mexico border). California Resources Agency, Sacramento, CA. September 15, 2008 (draft).
Carls, M.G., S.D. Rice, and J.E. Hose.1999. Sensitivity of fish embryos to weathered crude oil: Part I. low level exposure during incubation causes malformations, genetic damage, and mortality in larval Pacific herring (Clupea pallasi). Environ. Toxicol. Chem. 18: 481-493.
Carr, M. H., M. V. McGinnis, G.E. Forrester, J. Harding, and P. T. Raimondi. 2003. Consequences of Alternative Decommissioning Options to Reef Fish Assemblages and Implications for Decommissioning Policy. MMS OCS Study 2003-053. Coastal Research Center, Marine Science Institute, University of California, Santa Barbara, California. MMS Cooperative Agreement Number 14-35-0001-30758.
Carretta, J.V., et al., 1994. Right whale sighting off San Clemente Island, California. Marine Mammal Science 10(1):101-105.
Cimberg, R. L. and Costa, D. P. 1985. North Aleutian Shelf Sea Otters and Their Vulnerability to Oil. In: Proceedings 1985 Oil Spill Conference (Prevention, Behavior, Control, Cleanup). February 24-28, 1985, Los Angeles, CA. American Petroleum Institute Pub. No. 4385.
Coon, N.C., Albers, P. H., and Szaro, R.C. 1979. No.2 Fuel Oil Decreases Embryonic Survival of Great Black-backed Gulls. Bulletin of Environmental Contamination and Toxicology. Vol. 21.
Costa, D.P. and Kooyman, G. L. 1980, Effects of Oil Contamination in the Sea Otter, Enhydra lutris. Report, Outer Continental Shelf Environmental Assessment Program, NOAA, Alaska.
Cox, K. W., 1960. Review of the Abalone in California. Reprint from California Dept. of Fish and Game Vol. 46 (4). October 1960
Dailey, M.D., D.J. Reish, and J.W. Anderson (eds.). 1993. Ecology of the Southern California Bight: A Synthesis and Interpretation.
February 2011 Carone DPP Revisions
5.10-34
Davis, J. E. and Anderson, S.S. 1976. Effects of Oil Pollution on Breeding Gray Seals. Marine Poullution Bulletin, V. 7 (6).
DeLong, R.L., and S.R. Melin, 2000. Thirty Years of Pinniped Research at San Miguel Island, pp. 401-406 in: D.R. Browne, K.L. Mitchell and H.W. Chaney (eds.), Proceedings of the Fifth California Islands Symposium, 29 March to 1 April 1999, Santa Barbara, CA, Sponsored by the U.S. Minerals Management Service, Pacific OCS Region, 770 Paseo Camarillo, Camarillo, CA 93010, OCS Study No. 99-0038.
Department of the Navy. 2008. Southern California Range Complex Final EIS/OEIS. December 2008
de Wit, L. A., Consultant. 2001. Pre-Installation Marine Biological Survey and Preliminary Impact Assessment. Santa Ynez Unit Power Cable C Replacement Project. September 2001. LAD Job No. 01-09. Prepared for ExxonMobil Co.
Dohl, T.P., R.C. Guess, M.L. Duman, and R.C. Helm, 1983. Cetaceans of central and northern California, 1980-1983: Status, abundance, and distribution, prepared for U.S. Department of the Interior, Minerals Management Service, Pacific OCS Region, OCS Study MMS 84-0045, 284 pp.
Dohl, T.P., K.S. Norris, R.C. Guess, J.D. Bryant, and M.W. Honig, 1981. Cetacea of the Southern California Bight, Part II of Investigators’ reports: In: Summary of marine mammal and seabird surveys of the Southern California Bight Area, 1975-1978, prepared for U.S. Department of the Interior, Bureau of Land Management, Pacific OCS Region, NTIS #PB 81-248-189, 414 pp.
"Effects of Maritime Oil Spills on Wildlife." Australian Maritime Safety Authority. Web. 13 July 2010. http://www.amsa.gov.au/Marine_Environment_Protection/National_Plan/General_Information/Oiled_Wildlife/Oil_Spill_Effects_on_Wildlife_and_Non-Avian_Marine_Life.asp.
Engelhart, F.R. 1983. Petroleum Effects on Marine Mammals. Aquatic Toxicology, 4(1983).
Engelhart, F.R. 1981. Oil Production in Polar Bears: Exposure and Clinical Effects. In: Proc. of the 4th Arctic Marine Oil spill Program Technical Seminar June 16-18, Edmonton, Alberta.
Engelhart, F.R. 1978. Petroleum Hydrocarbons in Arctic Ringed Seals, Phoca hispida, Following Experimental Oil Exposure. Proc. Conf. on Assessment of Ecological Impacts of Oil Spills, Keystone, Colorado, American Institute of Biological Sciences.
Engelhart, F.R. and Ferguson, J.M. 1980. Adaptive Hormone Changes in Harp Seals, Phoca groenlandica, and Gray seals, Halichoerus grypus, During the Post-natal Period. Gen. Comp. Endocrinol. V. 40.
Environment Canada, Environmental Protection Service. 1982. Oil and Dispersants in Canada Seas – Research Appraisals and Recommendations, Economic and Technical Review, Report EPS 3-EC-82-2.
Fabricious, E. 1959. What Makes Plumage Waterproof? Tenth Annual Report of the Wildfowl Trust.
February 2011 Carone DPP Revisions
5.10-35
Forney, K.A., et al., 2000. U.S. Pacific marine mammal stock assessments, U.S. Department of Commerce, NOAA Technical Memorandum NMFS-SWFSC-300, 276 pp.
Gales, R. S. (1982). Effects of noise of offshore oil and gas operations on marine mammals - An introductory assessment. NOSC TR 844, 2 vol. U.S. Naval Ocean Systems Cent., San Diego, CA. 79 + 300 p. NTIS AD-A123699 + AD- A123700.
Geraci, J. R. and Smith, T. G. 1976. Direct and Indirect Effects of Oil on Ringed Seals (Phoca hispida) of the Beaufort Sea. J. Fish, Res. Bd. Can. 33: 1976-1984.
Geraci, J. R. and Smith, T. G. 1976. Direct and Indirect Effects of Oil on Ringed Seals ( Phoca hispida) of the Beaufort Sea. J. Fish, Res. Bd. Can. 33: 1976-1984.
Geraci, J.R. and St. Aubin, D.J. 1982. Study of Effects on Oil on Cetaceans. For Bureau of Land Management, U.S. Department of Interior, Contact No. AA551-CT9-29.
Geraci, J.R. and St. Aubin, D.J. 1980. Offshore Petroleum Resource Development and Marine Mammals: A Review and Research Recommendations. Marine Fisheries Review, November.
Grau, C. R., Roudybush, T., Dobbs, J., and Wathen, J. 1977. Altered Yolk Structure and Reduced Hatchablility of Eggs From Birds Fed Singles Does of Petroleum Oils. Science, V. 195.
Green, G.A. et al., 1989. Synthesis of information on marine mammals of the eastern North Pacific, with emphasis on the Oregon and Washington OCS area, In: Information synthesis and hypothesis formulation for Oregon and Washington marine mammal and seabird surveys, final report prepared for U.S. Department of the Interior, Minerals Management Service, Pacific OCS Region, Bellevue, WA: Envirosphere Company, and Portland, OR: Ecological Consulting, Inc., OCS Study MMS 89-0030, pp. 1-116.
Hartung, R. 1965. Some Effects of Oiling on Reproduction in Ducks. Journal of Wildife Management. Vol. 29.
Hartung, R. 1964. Some Effects of Oiling on Waterfowl. Doctoral Dissertation, University of Michigan.
Heyning, J.E., and W.F. Perrin, 1994. Evidence for two species of common dolphins from the eastern North Pacific, contributions in Science Natural History Museum of Los Angeles County 442:1-35.
Holmes, W. N. and Cronshaw, J. 1975. Final Progress Report on Studies Completed During 1972 and 1975 on the Effects of Petroleum on Marine Birds. Submitted to the American Petroleum Institute, Washington, D. C.
Holton, R.L., R.D. Leatham, and G.F. Crandell. 1977. Zooplankton. Chapter IV In: Winzler & Kelly Consultants (eds). A Summary of Knowledge of the Central and Northern California Coastal Zone and Offshore Areas; Vol.II: Biological Conditions. NTIS PB-274 212.
Hyland, T., personal communication. Hyland Diving Inc., Santa Barbara, CA. Telephone discussion with Ray de Wit, Padre Associates, Inc. October 27, 2009.
February 2011 Carone DPP Revisions
5.10-36
Jarvela, L. E., Thorsteinson, L. K., and Pelto, M.J. 1984. Oil and Gas Development and Related Issues. In: The Navarin Basin Environment and Possible Consequences of Planned Offshore Oil and Gas Development. Edited by Jarvela, L. E. OCSEAP. Juneau, AK.
Johnson, W. R., C. F. Marshall, and E. M. Lear (eds), 2000. Oil-Spill Risk Analysis: Pacific Outer Continental Shelf Program. OCS Report MMS 2000-057.
Jordan, R.E. and J.R. Payne. 1980. Fate and weathering of petroleum spills in the marine environment. Ann Arbor Science Publ. Inc., Ann Arbor, MI. 174 pp.
Jones, M.L., and S.L. Swartz, 1984. Demography and phenology of gray whales and evaluation of whale-watching activities at Laguna San Ignacio, Baja California Sur, Mexico.
King, K. A. and Leferer, C. A. 1979. Effects of Oil Transferred from Incubating Gulls to their Eggs. Marine Pollution Bullentin, V. 10.
Kolpack, R.L. 1971. Biological and oceanographical survey of the Santa Barbara Channel oil spill, 1969-1970. Vol II. Physical, chemical and geological studies. Allan Hancock Foundation, USC, Los Angeles, CA.
Kooyman, G. L. Davis, R. W., and Castellini, M. A. 1977. Thermal Conductance of Immersed Pinniped and Sea Otter Pelts Before and After Oiling with Prudhoe Bay Crude. In: Fate and Effects of Petroleum Hydrocarbons in Marine Ecosystems and Organisms, edited by D.A. Wolfe, Pergman Press, New York.
Leatherwood, S., R.R. Reeves, W.F. Perrin, and W.E. Evans, 1982. Whales, dolphins, and porpoises of the eastern North Pacific and adjacent Arctic waters, A guide to their identification, NOAA Tech. Rept., NMFS Circular 444, 245 pp.
Leatherwood, S., et al., 1987. Cetaceans of the Channel Islands National Marine Sanctuary. NOAA, Channel Islands National Marine Sanctuary and NMFS. 66 pp.Malme, C.I. and LGL LeBouef, B.J., and M.L. Bonnell, 1980. Pinnipeds of the California islands: Abundance and distribution. In: D.M. Power, ed. The California Islands: Proceedings of a Multidisciplinary Symposium. Haagen Printing, Santa Barbara, CA. pp. 475-493
Leet, W. S., C. M. Dewees, R. Klingbeil, and E. J. Johnson (eds.), 2001. California’s Living Marine Resources: A Status Report. California Dept. of Fish & Game, University of California Agriculture and Natural Resources Publication SB01-11.
Loughlin, T.R., et al., 1984. Northern sea lion distribution and abundance: 1956-80. J. Wildl. Manage. 48(3):729-740. Environmental Research Associates, 2001. Assessment of Noise Issues Relevant to Marine Mammals near the BP Clair Development. LGL Report No. TA2565-2.
Love, M., M. Nishimoto, D. Schroeder, and J. Caselle, 1999. The ecological role of natural reefs and oil and gas production platforms on rock reef fishes in southern California. Final Interim Report. USGS, UC Santa Barbara, and U.S. MMS Cooperative Agreement #1445-CA09-95-0836.
Love, M. S., D. M. Schroeder, and M. M. Nishimoto, 2003. The ecological role of oil and gas production platforms and natural outcrops on fishes in southern and central California: a
February 2011 Carone DPP Revisions
5.10-37
synthesis of information. U. S. Department of the Interior, U. S. Geological Survey, Biological Resources Division, Seattle, Washington, 98104, OCS Study MMS 2003-032.
"Marine Mammal Health and Stranding Response Program - Office of Protected Resources - NOAA Fisheries." NOAA :: National Marine Fisheries Service. Web. 14 July 2010. <http://www.nmfs.noaa.gov/pr/health/>.
Malme, C.I., Miles, P.I., Clark, C.W., Tyack, P. and Bird, J.E. 1984. Investigations of the potential effects of underwater noise from petroleum industry activities on migrating gray whale behavior - Phase 2: January 1984 migration. Final Report No. 5586 report prepared by Bolt, Beranek and Newman Inc., Cambridge, MA for the US Minerals Management Service, Anchorage, AK. BBN, Inc. NTIS PB-86-218377. 297pp. [Available from http://www.mms.gov].Mason, J. W., G. J. McChesney, W. R. McIver, H. R. Carter, J. Y. Takekawa, R. T. Golightly, J. T. Ackerman, D. L. Orthmeyer, W. M. Perry, J. L. Yee, M. O. Pierson, and M. D. McCrary, 2007. At-sea distribution and abundance of seabirds off southern California: a 20-year comparison. Studies in Avian Biology, No. 33. 95 pp
Malone, T. C. 1971. The relative importance of nannoplankton and netplankton as primary producers in the California Current system. Fish. Bull. 69: 799-820.
McAuliffe, C.D., A.E. Smalley, R.D. Grover, W.M. Welsh, W.S. Pickle, and G.E. Jones. 1975. Chevron Main Pass Block 41 oil spill. Chemical and biological investigations, pp. 555-566. In: Proceedings, 1981 oil spill conference: prevention, behavior, control, cleanup. Amer. Petrol. Inst., Washington, DC.
McGill, P. A. and Richmond, M. E. 1979. Hatching Success of Great Black-backed Gull Eggs Treated with Oil. Bird-banding. Vol. 50.
Mcgowan, J. A. 1974. The nature of oceanic ecosystems, p. 9-28. In C. B. Miller [ed.], The biology of the Oceanic Pacific. Oregon State University Press.
MFS Globenet Corp./WorldCom Network Services. 2000. MFS Globenet Corp./WorldCom Network Services Fiber Optic Cable Project Final Environmental Impact Report, Volume I.
Miller, D. J., and R. N. Lea., 1972. Guide to the Coastal Marine Fishes of California. California Department of Fish and Game. Fish Bulletin No. 157. 249 pp.
Milton, Sarah, Peter Lutz, and Gary Shigenaka. "Oil and Sea Turtles: Biology, Planning, and Response | Planning for Environmental Emergencies | Publications | NOAA's National Ocean Service Office of Response and Restoration." NOAA's Ocean Service Office of Response and Restoration. 23 Aug. 2004. Web. 14 July 2010. <http://response.restoration.noaa.gov/type_subtopic_entry.php?RECORD_KEY(entry_subtopic_type)=entry_id,subtopic_id,type_id&entry_id(entry_subtopic_type)=9&subtopic_id(entry_subtopic_type)=3&type_id(entry_subtopic_type)=2>Minerals Management Service (MMS). 1983a. Final Environmental Impact Statement Proposed 1983 Outer Continental Shelf Oil and Gas lease Sale Offshore Central California OCS Sale No. 73. Volumes I and II. U.S Department of the Interior.
February 2011 Carone DPP Revisions
5.10-38
Minerals Management Service (MMS). 1993. MMS-CDAS User's Guide and Database Documentation. Marine Mammal and Seabird Computer Database Analysis System California OCS 1975-1985. Prepared by Ecological Consulting, Inc.
Nishimoto, M. M. and L. Washburn, 2002. Patterns of coastal eddy circulation and abundance of pelagic juvenile fish in the Santa Barbara Channel, California, USA. Marine Ecological Progress Series, Vol. 241: 183–199.
National Oceanic and Atmospheric Administration (NOAA) -National Marine Fisheries Service (NMFS), 1991. Recovery plan for the humpback whale (Megaptera novaeangliae), prepared by the Humpback Whale Recovery Team for the National Marine Fisheries Service, Silver Spring, MD, 105 pp.
,2003. 1975 to 2003 Marine Mammal Stranding Records. Marine Mammal Stranding Network. Unpublished data.
,2004. Endangered Species Act Section 7 Consultation Biological Opinion. National Marine Fisheries Service, Southwest Region, Sustainable Fisheries Division And Protected Resources Division
(2007). California Marine Mammal Stranding Network (CMMSN) human interaction reports 2000-2005 provided by e-mail from Joe Cordaro, wildlife biologist, on August 21, 2007.
(2008). Marine Mammal Stock Assessment Reports by Species. Website: http://www.nmfs.noaa.gov/pr/sars/species.htm accessed on September 16, 2008.
(2008b). Status of Marine Turtles Website: http://www.nmfs.noaa.gov/pr/species/turtles/ accessed on September 18, 2008.
National Oceanic and Atmospheric Administration, 1993. Our Living Oceans, Report on the Status of U.S. Living Marine Resources, 1993.
(1996), Our Living Oceans, Report on the Status of U.S. Living Marine Resources, 1995.
NOAA, 1998. A Primer for Federal Agencies, Essential Fish Habitat: New Marine Fish Habitat Conservation Mandate for Federal Agencies. National Marine Fisheries Service, Southwest Regional Office, Long Beach, CA. November 1998.
NOAA. 1999. Our Living Oceans, Report on the Status of U.S. Living Marine Resources, 1999.
NOAA. 2000. Working Draft Environmental Impact Statement for Channel Islands National Marine Sanctuary. April 29, 2000.
NOAA Fisheries, 2002. White Abalone (Haliotis sorenseni). Fact Sheet. Office of Protected Resources website document www.nmfs.noaa.gov/prot_res/species/inverts/White/AB.html.
NOAA. 2007. Environmental Sensitivity Index (ESI) Atlas, Southern California-1995. Digital data release, March 2007. Emergency Response Division, Office of Response and Restoration, Seattle, WA.
February 2011 Carone DPP Revisions
5.10-39
NOAA Fisheries, 2008. Marine Mammal Stock Assessment Reports by Species. Website: http://www.nmfs.noaa.gov/pr/sars/species.htm
Northwest Wildlife. 2010. Rockfishes. From website: http://www.northwestwildlife.com/articles/Rockfish.pdf
NMFS. National Marine Fisheries Service. 1980. Biological Opinion on the Impact of Oil and Gas Operations on the Bowhead Whales. Endangered Species Act, Section 7.
Oritsland, N. A. and Ronald, K. 1973. Effects of Solar Radiation and Windchill on Skin temperature of the Harp Seal, Pagohilus groenlandicus, Comp. Biochem. Physiol., V. 44.
Owen, R.W., Jr. 1974. Distribution of primary production, plant pigments, and Secchi depth in the Cali-fornia current region, 1969. California Cooperative Fisheries Investigation (CalCOFI) Atlas No. 20.
Patten, S. M. and Patten, L. R. 1977 Effects of Petroleum Exposure on Hatching Success and Incubation Behavior of Glaucous- winged Gulls ( Larus Glaucescens) in the Northeast Gulf of Alaska. In: Environmental Assessment of the Alaskan Continental Shelf. Annual Reports of Principal Investigators Vol. III. National Oceanic and Atmospheric Administration Environmental Research Laboratory, Boulder, Co.
Pink-footed Shearwater. 2010. Life History of Pink-footed Shearwater. Website: http://www.pinkfootedshearwater.org/index.html . Accessed on June 3, 2010.
Raimondi, P.T., R.F. Ambrose, J.M. Engle, S.N. Murray, and M. Wilson. 1999. Monitoring of rocky intertidal resources along the central and southern California coastline. Three-year report for San Luis Obispo, Santa Barbara, and Orange Counties (Fall 1995-Spring 1998). Report to the US Department of the Interior, Minerals Management Service, Camarillo, CA. MMS 99-0032.
Recreational Fishing Information Network. 2010. Recreational fishing statistics, Santa Barbara Channel, Jan 2007 through Jan. 2010. http://www.recfin.org/forms/est2004.html
Repenning, C.A., R.S. Peterson, and C.L. Hubbs, 1971. Contributions to the systematics of the southern fur seals, with particular reference to the Juan Fernandez and Guadalupe species, In: Antarctic Pinnipedia, W.H. Burt (ed.), Washington, D.C.: Geophysical Union. Antarctic Research Series, Vol. 18, pp. 1-34.
Richardson, W.J., C.R. Greene, Jr., C.I. Malme, and D.H. Thomson. 1995. Marine Mammals and Noise. Academic Press, San Diego, CA.
Richardson, W.J., C.R. Greene, Jr., C.I. Malme, and D.H. Thomson. 1991. Effects of noise on marine mammals. Report No. TA834-1 prepared for the U.S. Department of the Interior, Minerals Management Service, Atlantic OCS Region.
Ridoux, V., L. LaFontaine, P. Bustamante, F. Caurant, W. Dabin, C. Delacroix, S. Hassani, L. Meynier, V.P. da Silva, S. Simonin, M. Robert, J. Spitz, and O. Van Canneyt. 2004 The impact of the Erika oil spill on pelagic and coastal marine mammals: Combining demographic, ecological, trace metals and biomarker evidences. Aquat. Living Resour. 17: 379-387.
February 2011 Carone DPP Revisions
5.10-40
Riznyk, R. 1974. Phytoplankton of the Southern California Bight area and literature review. In: M.D. Dailey, B. Hill, and N. Lansing (eds.). A summary of knowledge of the southern California coastal zone and offshore areas, southern California ocean studies conservation. A report to the U.S. Department of the Interior, Bureau of Land Management, Los Angeles, CA.
Ross, J.P., 1982. Historical decline of loggerhead, ridley, and leatherback sea turtles. Biology and conservation of sea turtles, K.A. Bjorndal (ed.) Washington, D.C.: Smithsonian Institution Press. pp. 189-195.
SBWCN, 2010. Oiled wildlife care facilities. Website: http://sbwcn.org/wildlife-education/oil-wildlife/oiled-wildlife-care-facilities/.
Scarff, J.E., 1986. Historic and present distribution of the right whale in the eastern North Pacific south of 50 N and east of 180 W. Pp. 43-63, in: R.L. Brownell, Jr., P.B. Best, and J.H. Prescott (eds.), Right whales: Past and present status. International Whaling Commission, Cambridge, UK.
Schmitt, R.J., R.S. Jacobs, H.M. Page, J.E. Dugan, L. Wilson, S.D. Gaines and S.A. Hodges. 2006. Advancing marine biotechnology: use of OCS oil platforms as sustainable sources of marine natural products. MMS OCS Study 2006-054. Coastal Research Center, Marine Science Institute, University of California, Santa Barbara, California. MMS Cooperative Agreement Number 14-35-0001-31063.
Schultz, D. P.< Johnson, W.W., and Berkner, A. B. 1983. A Unique Oiled Bird Rehabilitation Operation – Myrtle Beach, South Carolina, February, 1981. In: Proceedings 1983 Oil Spill Conference ( Prevention< Behavior, Control, Cleanup). February 29 March 3, 1983, San Antonio, TX. American Petroleum Institute. Pub. No. 4356.
Shuford, W. D., and Gardali, T.(eds), 2008. California Bird Species of Special Concern: A ranked assessment of species, subspecies, and distinct populations of birds of immediate conservation concern in California. Studies of Western Birds 1. Western Field Ornithologists, Camarillo, California, and California Department of Fish and Game, Sacramento.
Siniff, D. B., Williams, T. D., Johnson, A. M., and Garshelis, D.L. 1982. Experiments on the Response of Sea Otters (Enhydra lutris) to Oil Contamination. Biological Conservation.
Squire, J. L. and S. E. Smith. 1977. Angler’s Guide to the United States Pacific Coast. Marine Fish, Fishing Grounds and Facilities. NOAA Publication, Seattle, WA. November 1977.
State of California. 1965. An Oceanographic and Biological Survey of the Southern California Mainland Shelf. State Water Quality Control Board Publication No 27; two volumes.
Straughan, D. 1971. “What has been the effect of the spill on the ecology of the Santa Barbara Channel?” In: D. Straughan (ed.). Biological and oceanographical survey of the Santa Barbara Channel oil spill, 1969-1970. Vol. 1. Biology and bacteriology. Los Angeles, CA: Allan Hancock Foundation, USC.
February 2011 Carone DPP Revisions
5.10-41
University of California at Santa Cruz (UCSC). 1978. Draft final report. 1975-1976 Marine Mammal and Seabird Survey of Southern California Bight Area. Volume II, Detailed Synthesis. The Requests of the Univ. Calif. Santa Cruz. Prepared for BLM.
U.S. Coast Pilot #7, 1976
U.S. Department of the Navy (USN). 2000. Point Mugu Sea Range Draft Environmental Impact Statement. July 2000.
U.S. Fish and Wildlife Service. 2008. Short-tailed Albatross Recovery Plan. Anchorage, AK, 105 pp.
Walker, P.L., and S. Craig, 1979. Archeological evidence concerning the prehistoric occurrence of sea mammals at Point Bennett, San Miguel Island, California Fish and Game 65(1):50-54.
Watson, L., 1981. Sea Guide to the Whales of the World. E.P. Dutton, New York, N.Y
Weller, D.W., and R.H. Defran. 1989. Coastal bottlenose dolphins in Santa Barbara: An analysis of home range and social affiliation. Abstr. Eighth Biennial Conf. on the Biology of Marine Mammals, Pacific Grove, California, December 7-11, 1989.
Woodward-Clyde Consultants. 1982. Central and Northern California Coastal Marine habitats: Oil Residence and Biological Sensitive Indices.
Zeiner, D., W. Laudenslayer, Jr., K. Mayer, and M. White (1990). California's Wildlife, Volume II, Birds, California Department of Fish and Game, Sacramento, CA.
February 2011 Carone DPP Revisions
5.11-1
5.11 ENVIRONMENTALLY SENSITIVE AREAS
Environmentally sensitive areas exist all along the coastline of southern California in State and Federal waters. These include Marine Protected Areas, Areas of Special Biological Significance (ASBS), the State Oil and Gas Sanctuary, Santa Barbara Ecological Preserve and Buffer Zone, the California National Monument, the Channel Islands National Park (CINP) and Channel Islands National Marine Sanctuary (CINMS), artificial reefs and areas of special biological concern. A summary of some of the proximal environmentally sensitive areas is provided below.
Marine Life Protection Act Areas (MLPA). The California Marine Life Protection Act (MLPA) was passed in 1999 and requires California to reevaluate all existing marine protected areas (MPAs) and design new MPAs that together function as a statewide network. MPAs are broadly defined as "any area of the marine environment that has been reserved by Federal, State, territorial, tribal or local laws or regulations to provide lasting protection for part or all of the natural and cultural resources therein" (Executive Order 13158, 2000). These include coral reefs, kelp forests, whales, shipwrecks, and a wide variety of marine life in the oceans, and coastal shorelines.
Existing coastal protected areas within the region include the Goleta Slough State Marine Park (SMP) and the Big Sycamore Canyon State Marine Reserve (SMR), the later is located immediately south of Point Mugu but is included here due to its proximity to the Project region. Anacapa Island State Marine Conservation Area (SMCA) and SMR are the closest existing protected habitats on the Northern Channel Islands (California Resources Agency, 2008). Although not yet completed, the creation of several new MPAs and the re-categorizing of some existing areas within the Project region are currently being considered. These include: Devereux Slough SMCA, Goleta Slough SMR, Carpinteria Marsh SMR, Ventura and Santa Clara River Mouth SMRs, and Magu/Muwu Lagoon State Marine Recreational Managed Area (SMRMA). Restriction activities within each of these proposed MPAs vary with the location and resources supported therein, however each would be considered a sensitive resource if subjected to impacts associated with an oil spill or other action that would degrade the habitat or water quality.
In addition to existing MPAs, the California Department of Fish and Game recently hosted a Blue Ribbon Task Force for proposal of new and extended MPAs for the South Coast Region. The South Coast Region (Point Conception to the California/Mexico border, including offshore islands) is the third Marine Life Protection Act study region to undergo the regional MPA planning and design process. Table 5.11-1 includes proposed MPAs proximal to the Project area included within those proposals. Of these, the Carpinteria Salt Marsh is the nearest onshore MPA to the proposed Project at approximately four (4) miles to the north.
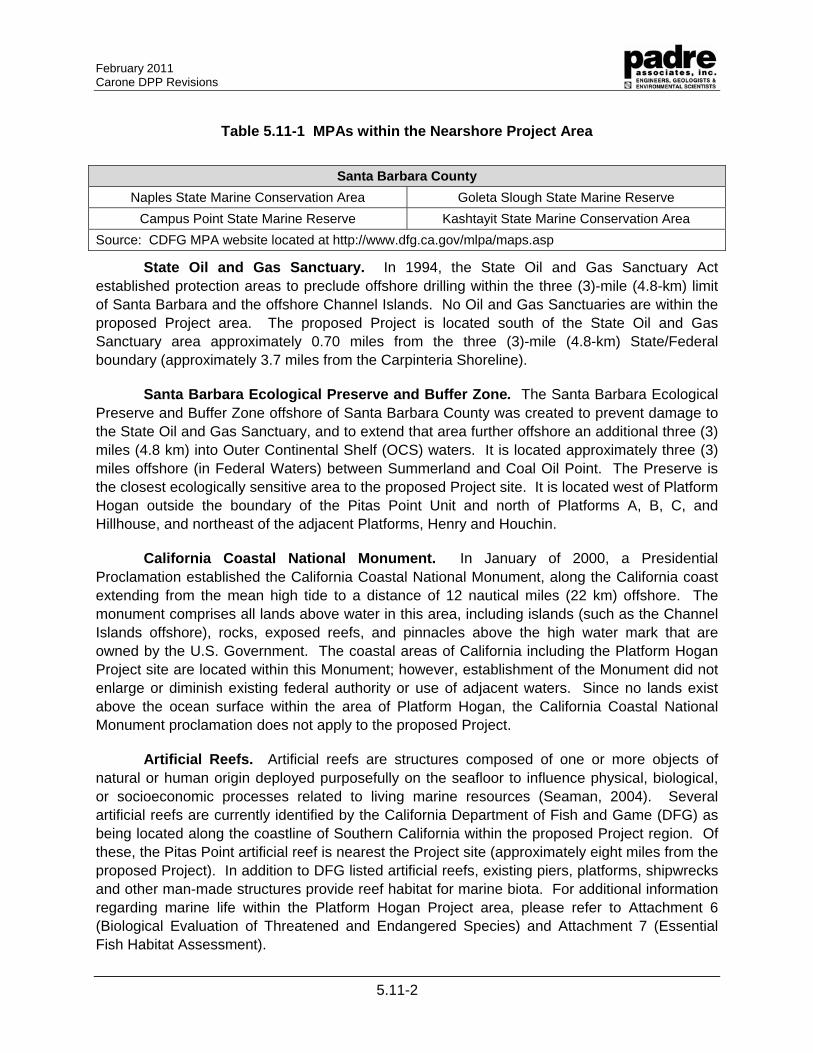
February 2011 Carone DPP Revisions
5.11-2
Table 5.11-1 MPAs within the Nearshore Project Area
Santa Barbara County
Naples State Marine Conservation Area Goleta Slough State Marine Reserve
Campus Point State Marine Reserve Kashtayit State Marine Conservation Area
Source: CDFG MPA website located at http://www.dfg.ca.gov/mlpa/maps.asp
State Oil and Gas Sanctuary. In 1994, the State Oil and Gas Sanctuary Act established protection areas to preclude offshore drilling within the three (3)-mile (4.8-km) limit of Santa Barbara and the offshore Channel Islands. No Oil and Gas Sanctuaries are within the proposed Project area. The proposed Project is located south of the State Oil and Gas Sanctuary area approximately 0.70 miles from the three (3)-mile (4.8-km) State/Federal boundary (approximately 3.7 miles from the Carpinteria Shoreline).
Santa Barbara Ecological Preserve and Buffer Zone. The Santa Barbara Ecological Preserve and Buffer Zone offshore of Santa Barbara County was created to prevent damage to the State Oil and Gas Sanctuary, and to extend that area further offshore an additional three (3) miles (4.8 km) into Outer Continental Shelf (OCS) waters. It is located approximately three (3) miles offshore (in Federal Waters) between Summerland and Coal Oil Point. The Preserve is the closest ecologically sensitive area to the proposed Project site. It is located west of Platform Hogan outside the boundary of the Pitas Point Unit and north of Platforms A, B, C, and Hillhouse, and northeast of the adjacent Platforms, Henry and Houchin.
California Coastal National Monument. In January of 2000, a Presidential Proclamation established the California Coastal National Monument, along the California coast extending from the mean high tide to a distance of 12 nautical miles (22 km) offshore. The monument comprises all lands above water in this area, including islands (such as the Channel Islands offshore), rocks, exposed reefs, and pinnacles above the high water mark that are owned by the U.S. Government. The coastal areas of California including the Platform Hogan Project site are located within this Monument; however, establishment of the Monument did not enlarge or diminish existing federal authority or use of adjacent waters. Since no lands exist above the ocean surface within the area of Platform Hogan, the California Coastal National Monument proclamation does not apply to the proposed Project.
Artificial Reefs. Artificial reefs are structures composed of one or more objects of natural or human origin deployed purposefully on the seafloor to influence physical, biological, or socioeconomic processes related to living marine resources (Seaman, 2004). Several artificial reefs are currently identified by the California Department of Fish and Game (DFG) as being located along the coastline of Southern California within the proposed Project region. Of these, the Pitas Point artificial reef is nearest the Project site (approximately eight miles from the proposed Project). In addition to DFG listed artificial reefs, existing piers, platforms, shipwrecks and other man-made structures provide reef habitat for marine biota. For additional information regarding marine life within the Platform Hogan Project area, please refer to Attachment 6 (Biological Evaluation of Threatened and Endangered Species) and Attachment 7 (Essential Fish Habitat Assessment).
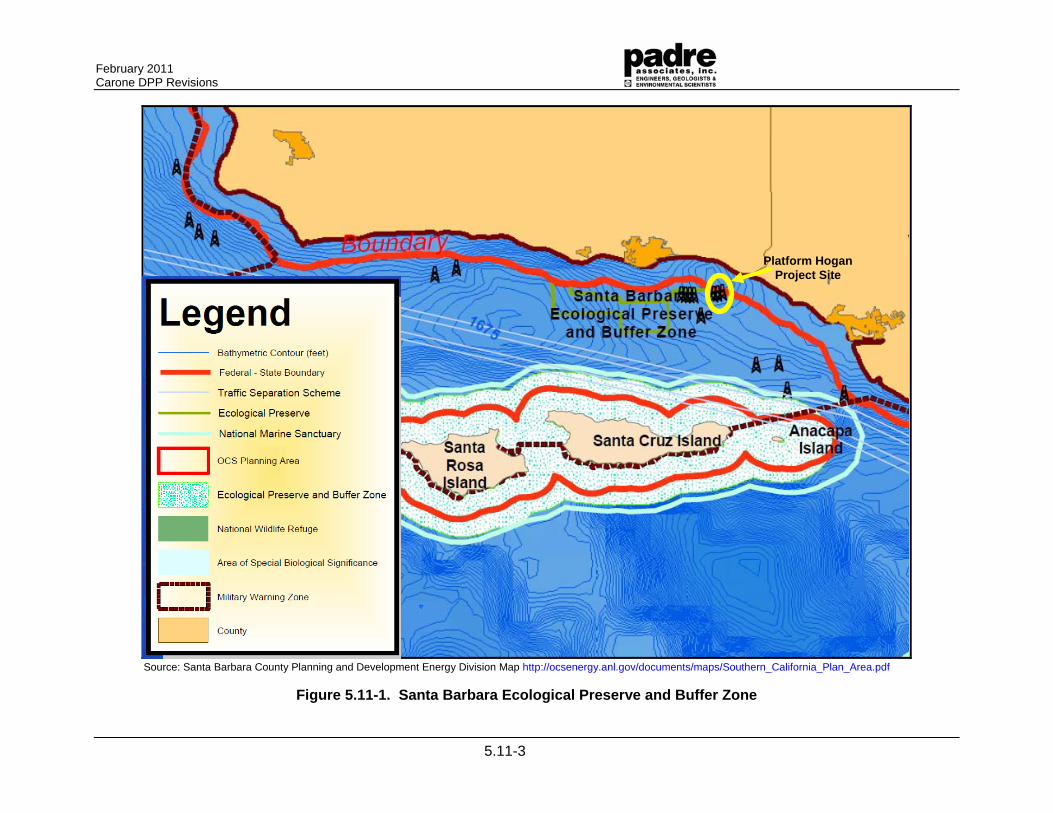
February 2011 Carone DPP Revisions
5.11-3
Source: Santa Barbara County Planning and Development Energy Division Map http://ocsenergy.anl.gov/documents/maps/Southern_California_Plan_Area.pdf
Figure 5.11-1. Santa Barbara Ecological Preserve and Buffer Zone
Platform Hogan Project Site
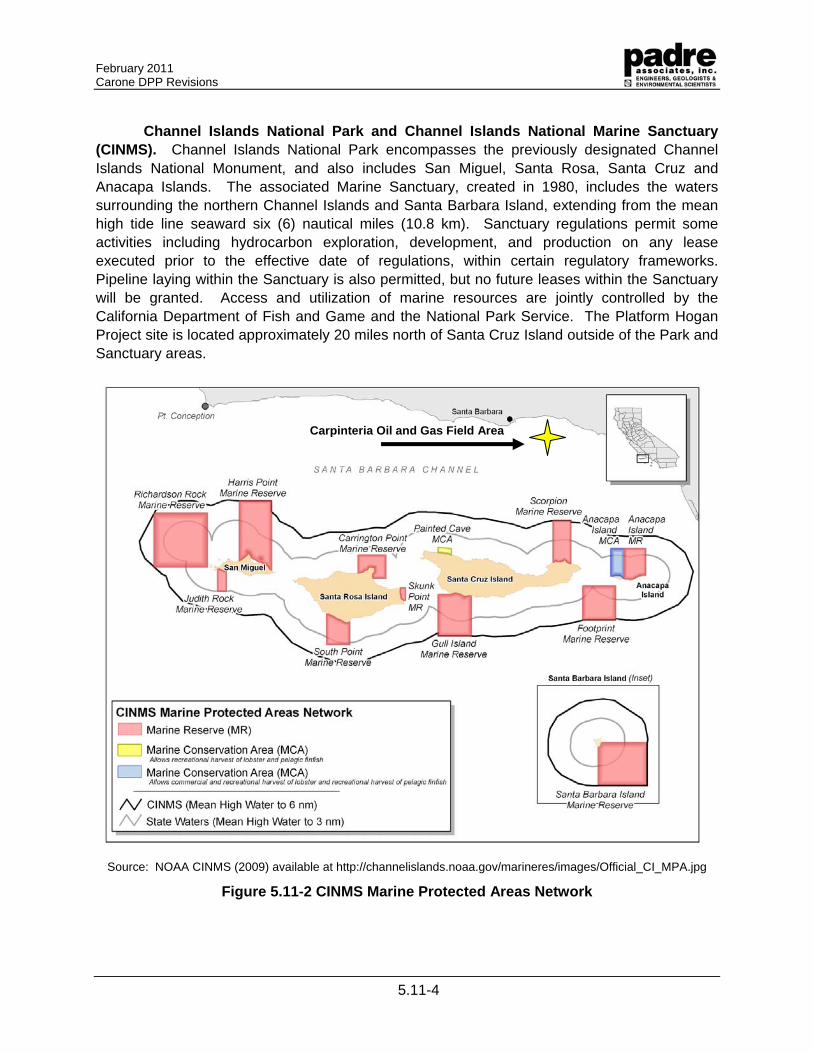
February 2011 Carone DPP Revisions
5.11-4
Channel Islands National Park and Channel Islands National Marine Sanctuary (CINMS). Channel Islands National Park encompasses the previously designated Channel Islands National Monument, and also includes San Miguel, Santa Rosa, Santa Cruz and Anacapa Islands. The associated Marine Sanctuary, created in 1980, includes the waters surrounding the northern Channel Islands and Santa Barbara Island, extending from the mean high tide line seaward six (6) nautical miles (10.8 km). Sanctuary regulations permit some activities including hydrocarbon exploration, development, and production on any lease executed prior to the effective date of regulations, within certain regulatory frameworks. Pipeline laying within the Sanctuary is also permitted, but no future leases within the Sanctuary will be granted. Access and utilization of marine resources are jointly controlled by the California Department of Fish and Game and the National Park Service. The Platform Hogan Project site is located approximately 20 miles north of Santa Cruz Island outside of the Park and Sanctuary areas.
Source: NOAA CINMS (2009) available at http://channelislands.noaa.gov/marineres/images/Official_CI_MPA.jpg
Figure 5.11-2 CINMS Marine Protected Areas Network
Carpinteria Oil and Gas Field Area
February 2011 Carone DPP Revisions
5.11-5
Other Biologically Sensitive Areas. In addition to the protected areas above, the State has designated several ecological reserves and marine life refuges as well as multiple biological sensitive areas (BSAs) along the coastal and offshore areas of California. Although refuges and reserves are designated for similar reasons, the ecological reserve designation carries more restrictions and controls. These areas generally have one or more of the following characteristics; high biological productivity, high ecological significance, unique features or areas vulnerable to pollution. These areas include the rocky intertidal zones, kelp beds and subtidal reefs at the Channel Islands outside of the Project area.
The northern boundary of the Point Mugu to Latigo Point Area of Special Biological Significance (ASBS), areas specified by the State Water Resources Control Board as locations where water quality is not to be substantially modified or degraded, is at the southern edge of the Project region.
Sensitive resources found along the shoreline and in the few coastal lagoons within the region include sand beaches utilized by the endangered snowy plover (Charadrius alexandrinus nivosus) near Santa Barbara Harbor, west of Rincon Point, and along the beach between Ventura Harbor and McGrath Lake; least tern (Sterna antillarum browni) and other marine avifauna that frequent the beaches and nearshore waters throughout the region; and tidewater goby (Eucyclogobius newberryi) habitat in coastal stream mouths within Santa Barbara Harbor, at Carpinteria Creek, at the Ventura and Santa Clara Rivers. Other sensitive intertidal habitats and resources include sand beaches that are utilized by grunion and marsh/wetland habitats west of Coal Oil Pt (Devereux and Goleta Sloughs), near Fernald and Loon Pts. east of Santa Barbara, at the Ventura and Santa Clara Rivers (the Ventura River also supports occasional spawning runs of the endangered steelhead [Oncorhynchus mykiss]), and at Carpinteria Marsh and Mugu Lagoon. Documented harbor seal (Phoca vitulina) haulout and/or rookery sites within the region include sand and rock beaches east and west of Goleta Point, west of Rincon Point (a rookery is located immediately adjacent to Casitas Pier, in Carpinteria), and within and adjacent to Mugu Lagoon (a rookery is within Mugu Lagoon).
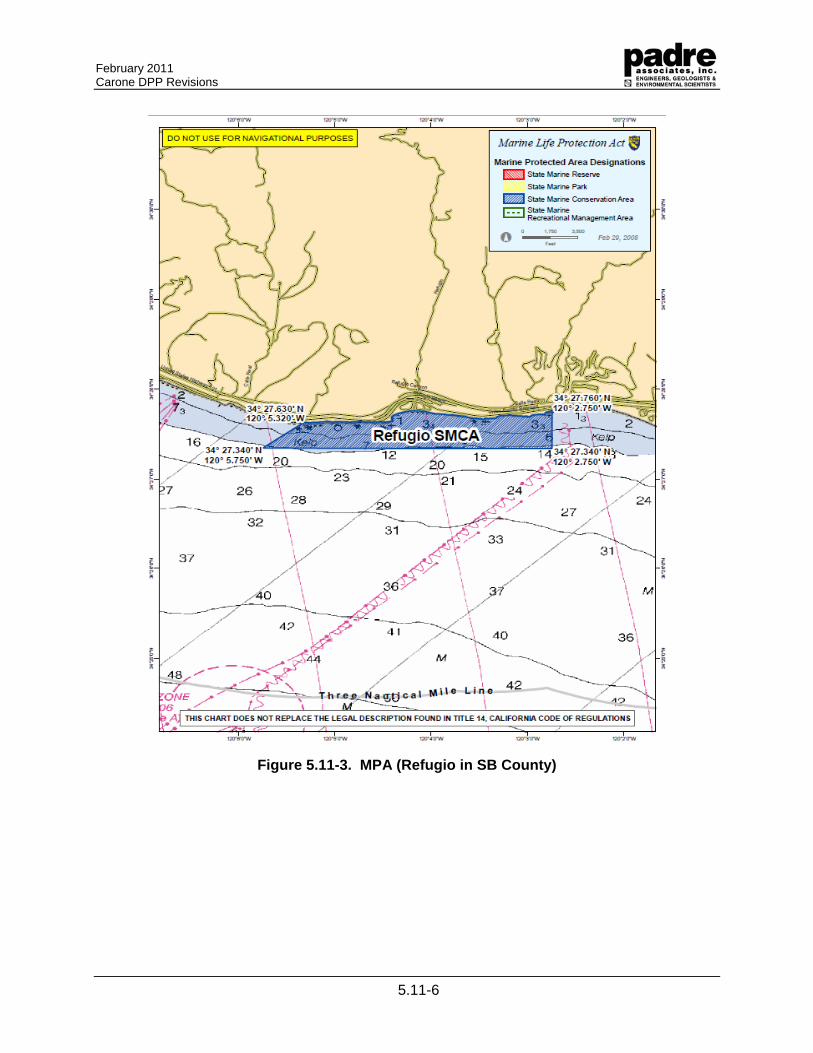
February 2011 Carone DPP Revisions
5.11-6
Figure 5.11-3. MPA (Refugio in SB County)
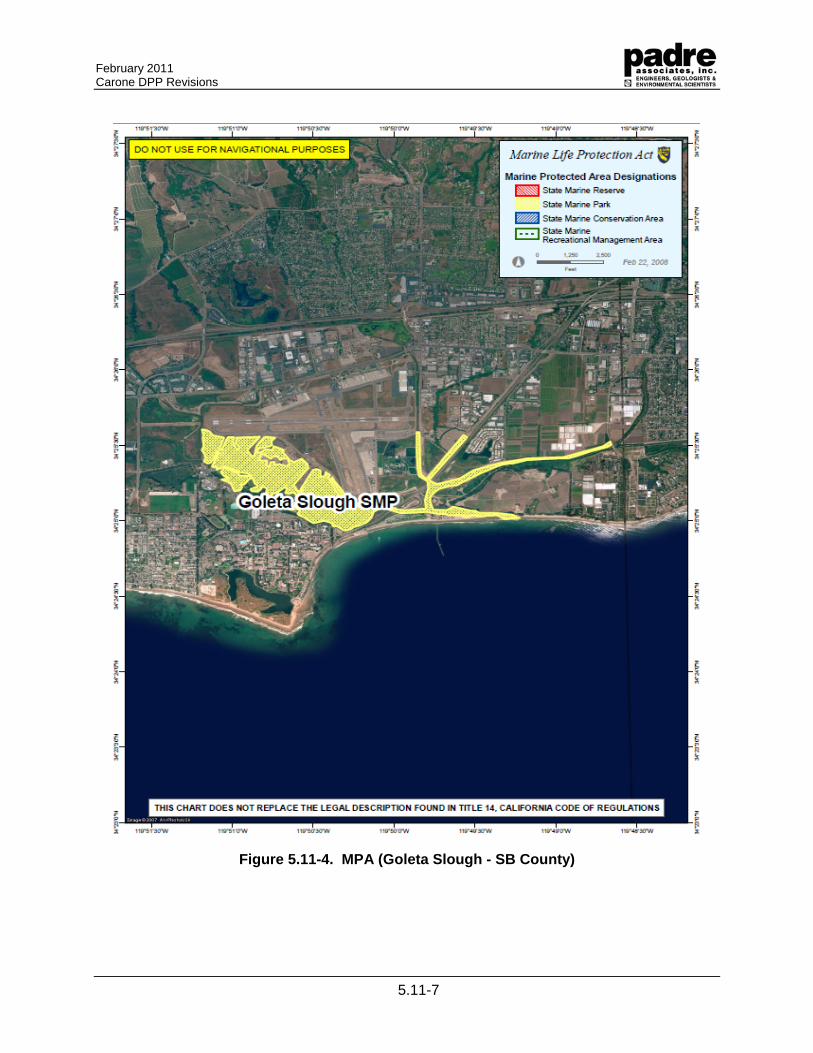
February 2011 Carone DPP Revisions
5.11-7
Figure 5.11-4. MPA (Goleta Slough - SB County)
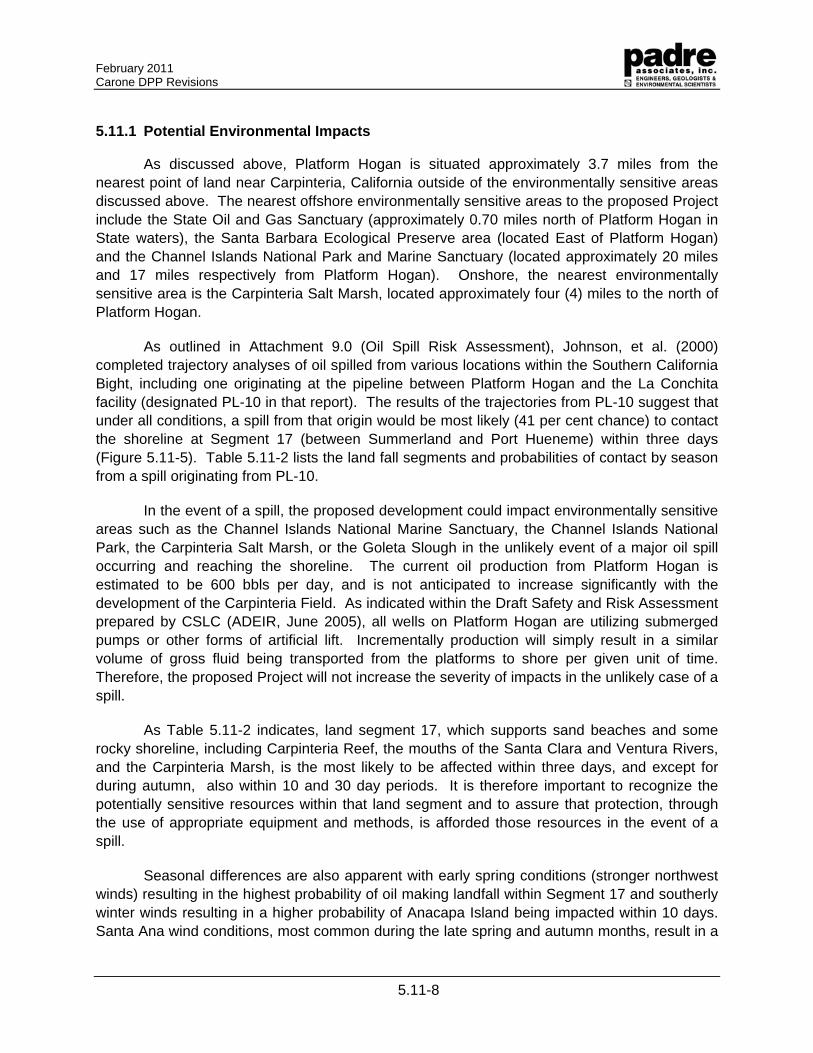
February 2011 Carone DPP Revisions
5.11-8
5.11.1 Potential Environmental Impacts
As discussed above, Platform Hogan is situated approximately 3.7 miles from the nearest point of land near Carpinteria, California outside of the environmentally sensitive areas discussed above. The nearest offshore environmentally sensitive areas to the proposed Project include the State Oil and Gas Sanctuary (approximately 0.70 miles north of Platform Hogan in State waters), the Santa Barbara Ecological Preserve area (located East of Platform Hogan) and the Channel Islands National Park and Marine Sanctuary (located approximately 20 miles and 17 miles respectively from Platform Hogan). Onshore, the nearest environmentally sensitive area is the Carpinteria Salt Marsh, located approximately four (4) miles to the north of Platform Hogan.
As outlined in Attachment 9.0 (Oil Spill Risk Assessment), Johnson, et al. (2000) completed trajectory analyses of oil spilled from various locations within the Southern California Bight, including one originating at the pipeline between Platform Hogan and the La Conchita facility (designated PL-10 in that report). The results of the trajectories from PL-10 suggest that under all conditions, a spill from that origin would be most likely (41 per cent chance) to contact the shoreline at Segment 17 (between Summerland and Port Hueneme) within three days (Figure 5.11-5). Table 5.11-2 lists the land fall segments and probabilities of contact by season from a spill originating from PL-10.
In the event of a spill, the proposed development could impact environmentally sensitive areas such as the Channel Islands National Marine Sanctuary, the Channel Islands National Park, the Carpinteria Salt Marsh, or the Goleta Slough in the unlikely event of a major oil spill occurring and reaching the shoreline. The current oil production from Platform Hogan is estimated to be 600 bbls per day, and is not anticipated to increase significantly with the development of the Carpinteria Field. As indicated within the Draft Safety and Risk Assessment prepared by CSLC (ADEIR, June 2005), all wells on Platform Hogan are utilizing submerged pumps or other forms of artificial lift. Incrementally production will simply result in a similar volume of gross fluid being transported from the platforms to shore per given unit of time. Therefore, the proposed Project will not increase the severity of impacts in the unlikely case of a spill.
As Table 5.11-2 indicates, land segment 17, which supports sand beaches and some rocky shoreline, including Carpinteria Reef, the mouths of the Santa Clara and Ventura Rivers, and the Carpinteria Marsh, is the most likely to be affected within three days, and except for during autumn, also within 10 and 30 day periods. It is therefore important to recognize the potentially sensitive resources within that land segment and to assure that protection, through the use of appropriate equipment and methods, is afforded those resources in the event of a spill.
Seasonal differences are also apparent with early spring conditions (stronger northwest winds) resulting in the highest probability of oil making landfall within Segment 17 and southerly winter winds resulting in a higher probability of Anacapa Island being impacted within 10 days. Santa Ana wind conditions, most common during the late spring and autumn months, result in a
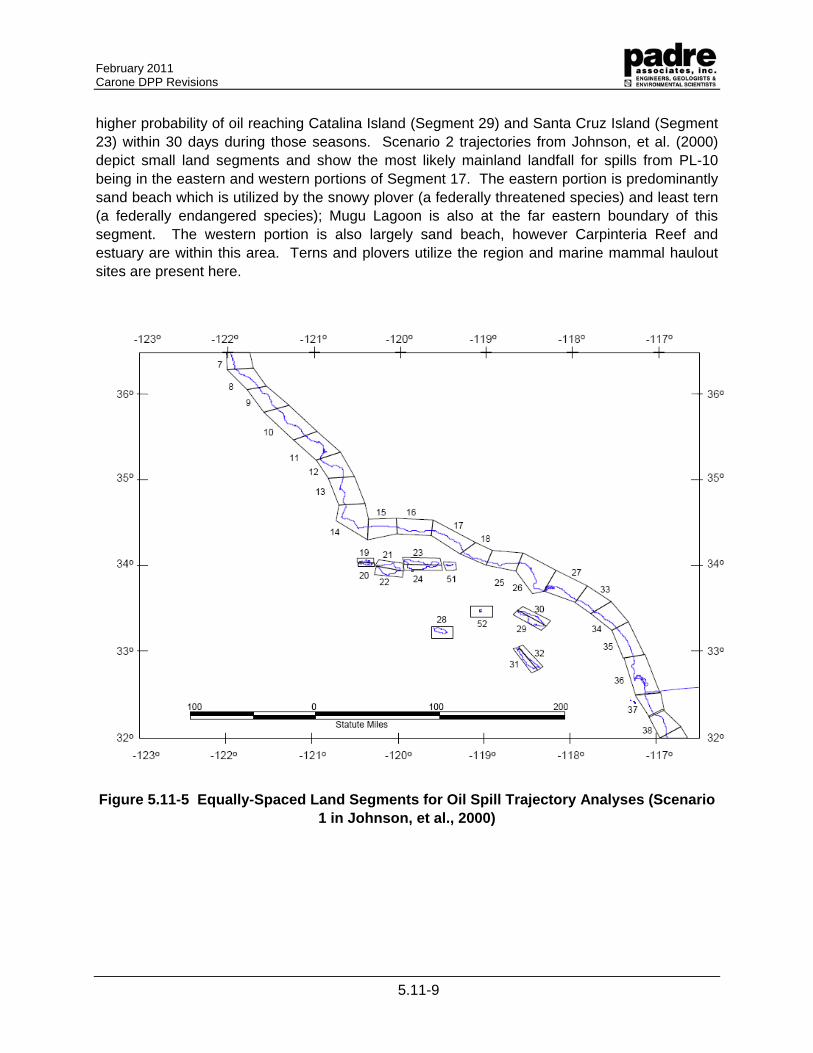
February 2011 Carone DPP Revisions
5.11-9
higher probability of oil reaching Catalina Island (Segment 29) and Santa Cruz Island (Segment 23) within 30 days during those seasons. Scenario 2 trajectories from Johnson, et al. (2000) depict small land segments and show the most likely mainland landfall for spills from PL-10 being in the eastern and western portions of Segment 17. The eastern portion is predominantly sand beach which is utilized by the snowy plover (a federally threatened species) and least tern (a federally endangered species); Mugu Lagoon is also at the far eastern boundary of this segment. The western portion is also largely sand beach, however Carpinteria Reef and estuary are within this area. Terns and plovers utilize the region and marine mammal haulout sites are present here.
Figure 5.11-5 Equally-Spaced Land Segments for Oil Spill Trajectory Analyses (Scenario 1 in Johnson, et al., 2000)
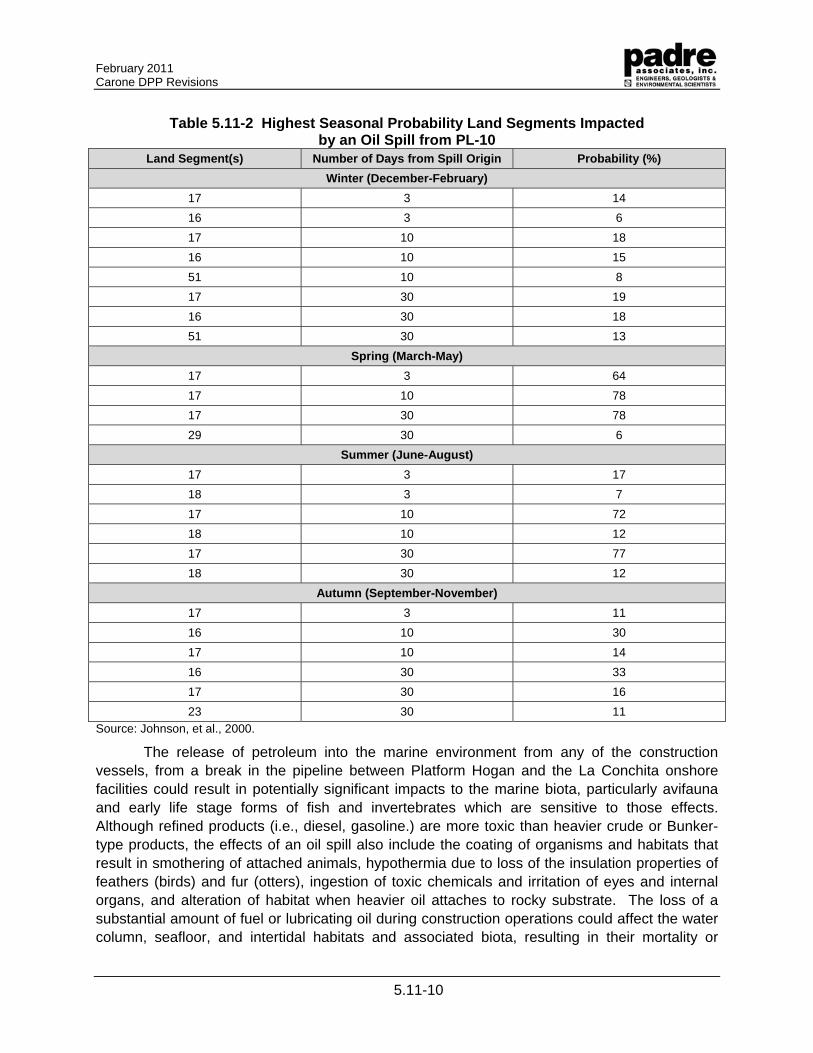
February 2011 Carone DPP Revisions
5.11-10
Table 5.11-2 Highest Seasonal Probability Land Segments Impacted by an Oil Spill from PL-10
Land Segment(s) Number of Days from Spill Origin Probability (%)
Winter (December-February)
17 3 14
16 3 6
17 10 18
16 10 15
51 10 8
17 30 19
16 30 18
51 30 13
Spring (March-May)
17 3 64
17 10 78
17 30 78
29 30 6
Summer (June-August)
17 3 17
18 3 7
17 10 72
18 10 12
17 30 77
18 30 12
Autumn (September-November)
17 3 11
16 10 30
17 10 14
16 30 33
17 30 16
23 30 11
Source: Johnson, et al., 2000.
The release of petroleum into the marine environment from any of the construction vessels, from a break in the pipeline between Platform Hogan and the La Conchita onshore facilities could result in potentially significant impacts to the marine biota, particularly avifauna and early life stage forms of fish and invertebrates which are sensitive to those effects. Although refined products (i.e., diesel, gasoline.) are more toxic than heavier crude or Bunker-type products, the effects of an oil spill also include the coating of organisms and habitats that result in smothering of attached animals, hypothermia due to loss of the insulation properties of feathers (birds) and fur (otters), ingestion of toxic chemicals and irritation of eyes and internal organs, and alteration of habitat when heavier oil attaches to rocky substrate. The loss of a substantial amount of fuel or lubricating oil during construction operations could affect the water column, seafloor, and intertidal habitats and associated biota, resulting in their mortality or
February 2011 Carone DPP Revisions
5.11-11
substantial injury, and in alteration of the existing habitat quality. The release of petroleum into the marine environment is considered a potentially significant impact.
The Oil Spill Response Plan, for Platform Hogan and associated pipelines, defines the sensitive ecological areas within possible oil spill paths and delineates procedures to protect these areas from contamination. Normal operation of seafloor pipelines will not impact sensitive habitation areas. In the unlikely chance of an accidental spill, offshore kelp beds, rocky intertidal habitats, sensitive salt marshes and estuaries, and many of Santa Barbara, Goleta and Carpinteria’s beaches could be adversely affected. PACOPS’s OSRP includes specific reference to these areas to help minimize impacts in the event of an accidental spill.
In general, the effects of oil will be minimized through the incorporation of mitigations listed in Section 5.10 and include containment of spilled oil within the open water, and by minimizing shoreline contact. Based on the trajectory analyses and the sensitive resources that exist within the land segments most likely to affected, the protection of seabird rookeries, semi-protected rocky intertidal habitats, and coastal lagoons within those areas should be the priority in responding to spills from PL-10 and/or Platform Hogan.
February 2011 Carone DPP Revisions
5.11-12
5.11.2 References
California Coastal Commission. 1981. Oil Spill Response Capability Study, Phase I: Clean Seas (Preliminary Report).
California Department of Frish and Game. 2009. Office of Spill Prevention and response – Response Tools Area Contingency Plans website accessed online on March 31, 2010 at http://www.dfg.ca.gov/ospr/response/acp/marine/2005ACPs/2005LAACPs/lalb_acp_index.html.
California Department of Fish and Game. 2010. Marine Protection Areas Website accessed online at http://www.dfg.ca.gov/marine/.
Channel Islands National Marine Sanctuary. 2000. Working Draft Environmental Impact Statement for Channel Islands National Marine Sanctuary.
Dailey, M.D., D.J. Reish, and J.W. Anderson (eds.). 1993. Ecology of the Southern California Bight: A Synthesis and Interpretation.
Federal Register (2000). Executive Order No. 13158 - Marine Protected Areas. Vol. 65 No. 105.
Johnson, W. R., C. F. Marshall, and E. M. Lear (eds), 2000. Oil-Spill Risk Analysis: Pacific Outer Continental Shelf Program. OCS Report MMS 2000-057.
Marine Protected Areas Blue Ribbon Task Force. (2009). California Marine Life Protection Act Initiative South Coast Project - Staff Summary of Area and Habitats in MLPA South Coast Integrated Preferred Alternative (IPA) MPA Proposal. Accessed online March, 2010 at http://www.dfg.ca.gov/mlpa/southcoastipa.asp.
National Oceanic and Atmospheric Administration. 2000. National Weather Service Forecast Office Website – Santa Barbara Climate Page accessed online on March 25, 2010 at http://www.wrh.noaa.gov/lox/climate/sba.php.
National Ocean Service (NOS). 1998. NOAA Chart No. 18725: Port Hueneme to Point Conception.
Pacific Operators Offshore. 2009. Website. Accessed online December 2009
2008. Oil Spill Response Plan - La Conchita Onshore Facilities. Goldberg Environmental Services.
2008. Oil Spill Response Plan - Platforms Hogan and Houchin and Associated Subsea Pipelines, Lease OCS-P 0166. Goldberg Environmental Services. August 2008.
February 2011 Carone DPP Revisions
5.11-13
2009. Application to California State Lands Commission to Develop Oil and Gas Leases.
Seaman, William (2004). Artificial Reef Monitoring in Florida Coastal Counties.
Santa Barbara County. 2009. Planning and Development, Energy Division Map accessed online December 2009 at http://ocsenergy.anl.gov/documents/maps/Southern_California_Plan_Area.pdf
University of California Santa Barbara. 2009. Carpinteria Salt Marsh Reserve System website accessed December 2009 at http://carpinteria.ucnrs.org/introduction.html
Venoco, Inc. 2005. Cavern Point Unit Environmental Analysis (Final).
February 2011 Carone DPP Revisions
5.12-1
5.12 ARCHAEOLOGY
5.12.1 Setting
Offshore. Platform Hogan is located in the marine waters of the Pacific Ocean, in the Santa Barbara Channel (Channel) within the Southern California Bight (SCB). The Platform is situated approximately 3.7 miles from the nearest point of land near Carpinteria, California in a water depth of approximately 154 feet. As such, cultural resources associated with the proposed Project would primarily be limited to underwater archaeological resources. Underwater archaeological resources are generally defined as submerged sites which may take the form of isolated prehistoric artifacts, submerged historic shipwrecks, or pieces of ship components (such as cannons or guns).
Early coastal archaeological sites have become submerged by modern sea levels and comprise a comparatively understudied area of archaeology due to their lack of visibility and accessibility. Although marine resources are not represented abundantly in archaeological sites until the Middle Holocene, Early Holocene Native Americans still recognized coastal habitats and littoral zones as regions that produced desirable resources, either for subsistence or for craft. Thus, prehistoric groups would have settled these now-submerged coastal regions. Additionally, since prehistoric Native Americans frequently sailed the waters between the offshore islands and the mainland, it is likely that several isolated artifacts may exist on the seafloor. There are approximately 60 known and recorded marine prehistoric sites in the area. Researchers believe that the Channel Islands National Marine Sanctuary (CINMS) may contain evidence of prehistoric cultures due to considerably lower sea levels of past geologic eras and erosion of the islands since then.
Offshore cultural resources in the region are primarily historic shipwrecks. More than 500 sunken vessels have been reported within the coastal waters of southern California. Precise locations are usually unknown, with vague descriptive narratives of the area in which the ship was last known, or thought to have sunk, being provided. The listed shipwrecks include fishing boats, barges, yachts, cargo carriers, passenger ships, freighters, and target ships. Reasons for their demise include mechanical failure, fire, collision, grounding, or capsizing. The most common reasons for shipwrecks were either running aground on natural hazards such as prominent rocks or colliding in harbors during stormy weather. As such, the most sensitive areas for shipwrecks along the California coast occur where concentrated shipping traffic coincides with navigational hazards such as reefs, headlands, and prevailing bad weather or fog. Some sensitive areas include offshore islands, seaports, and obstructions such as Point Conception. Less sensitive areas include open sea and coastline away from established shipping routes. Shipwrecks are common along much of the southern California coastline, but are especially concentrated in the Goleta, Santa Barbara, and Ventura areas. Shipwrecks identified within the vicinity of the offshore Project site are summarized in Table 5.12-1.
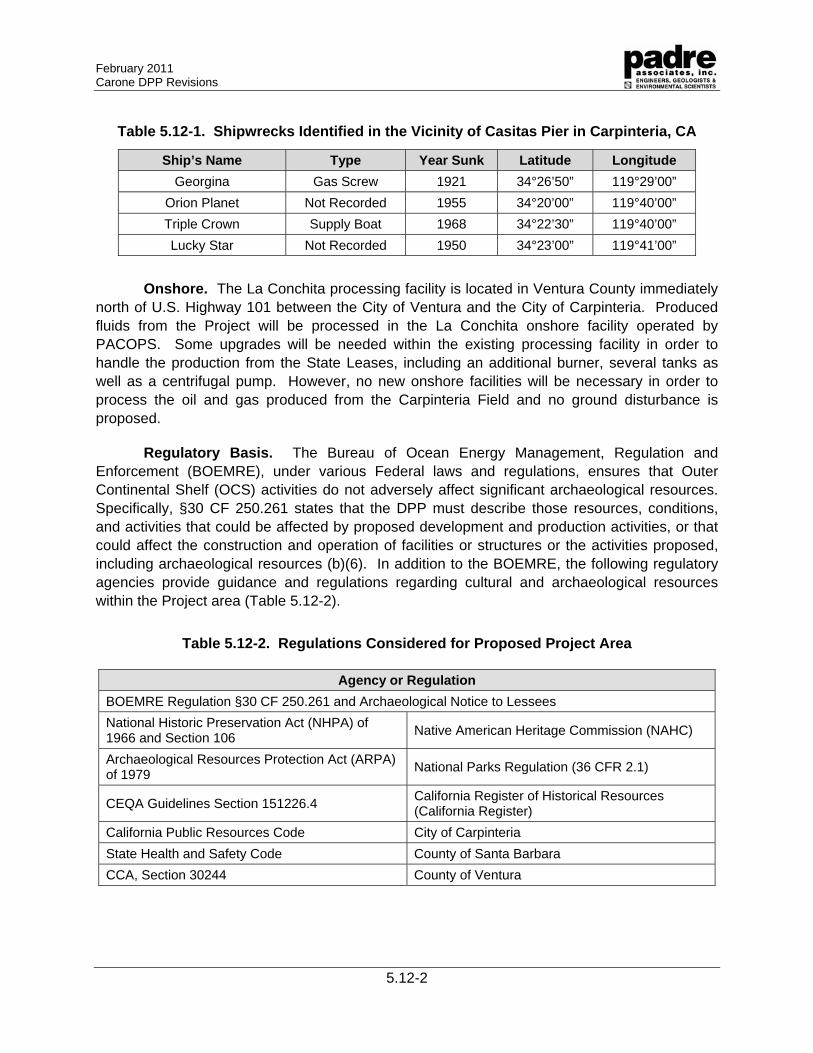
February 2011 Carone DPP Revisions
5.12-2
Table 5.12-1. Shipwrecks Identified in the Vicinity of Casitas Pier in Carpinteria, CA
Ship’s Name Type Year Sunk Latitude Longitude
Georgina Gas Screw 1921 34°26’50” 119°29’00”
Orion Planet Not Recorded 1955 34°20’00” 119°40’00”
Triple Crown Supply Boat 1968 34°22’30” 119°40’00”
Lucky Star Not Recorded 1950 34°23’00” 119°41’00”
Onshore. The La Conchita processing facility is located in Ventura County immediately north of U.S. Highway 101 between the City of Ventura and the City of Carpinteria. Produced fluids from the Project will be processed in the La Conchita onshore facility operated by PACOPS. Some upgrades will be needed within the existing processing facility in order to handle the production from the State Leases, including an additional burner, several tanks as well as a centrifugal pump. However, no new onshore facilities will be necessary in order to process the oil and gas produced from the Carpinteria Field and no ground disturbance is proposed.
Regulatory Basis. The Bureau of Ocean Energy Management, Regulation and Enforcement (BOEMRE), under various Federal laws and regulations, ensures that Outer Continental Shelf (OCS) activities do not adversely affect significant archaeological resources. Specifically, §30 CF 250.261 states that the DPP must describe those resources, conditions, and activities that could be affected by proposed development and production activities, or that could affect the construction and operation of facilities or structures or the activities proposed, including archaeological resources (b)(6). In addition to the BOEMRE, the following regulatory agencies provide guidance and regulations regarding cultural and archaeological resources within the Project area (Table 5.12-2).
Table 5.12-2. Regulations Considered for Proposed Project Area
Agency or Regulation
BOEMRE Regulation §30 CF 250.261 and Archaeological Notice to Lessees
National Historic Preservation Act (NHPA) of 1966 and Section 106
Native American Heritage Commission (NAHC)
Archaeological Resources Protection Act (ARPA) of 1979
National Parks Regulation (36 CFR 2.1)
CEQA Guidelines Section 151226.4 California Register of Historical Resources (California Register)
California Public Resources Code City of Carpinteria
State Health and Safety Code County of Santa Barbara
CCA, Section 30244 County of Ventura
February 2011 Carone DPP Revisions
5.12-3
5.12.2 Potential Environmental Impacts
As discussed above, Platform Hogan is situated approximately 3.7 miles from the nearest point of land near Carpinteria, California in a water depth of approximately 154 feet. As such, potential impacts to cultural resources associated with the proposed Project would be limited to underwater archaeological resources. For projects within the OCS area, the BOEMRE requires that environmental analysis must describe those resources, conditions, and activities, including archaeological resources that could be affected by the proposed development and production activities, or that could affect the construction and operation of facilities or structures or the activities proposed. This includes archaeological resources. As such, the BOEMRE Archaeological Notice to Lessees generally requires that archaeological surveys be conducted within offshore OCS areas, usually in conjunction with offshore geophysical of shallow hazards surveys. However, no structural changes to the submerged portion of the Platform are included within the proposed Project. Since no sea-floor activities will occur, Project OCS activities will not affect prehistoric or historic archaeological resources as discussed within the Notice to Lessees parameters. As such, no oceanographic surveys pertaining to archaeological resources will be conducted for the proposed Project and no underwater cultural or archaeological impacts would result. Changes made to the above water portion of the Project will be contained within the existing Platform; therefore, no risk to archaeological sites would occur.
Furthermore, vessel traffic to Platform Hogan would only increase by approximately one additional workboat arriving and departing from the Platform per week. Vessel traffic would be limited to existing offshore traffic areas and would not result in impacts to underwater resources.
Although some onshore upgrades will be needed within the existing La Conchita Oil and Gas Facility in order to handle the production from the State Leases, no new onshore facilities will be necessary. In addition, no ground disturbance is proposed. As such, no onshore impacts to cultural or archaeological resources will occur.
Oil Spill Response. The proposed Project is located within the offshore OCS region of the Santa Barbara Channel. As such, the potential impacts to cultural resources associated with the proposed Project would be limited to underwater archaeological resources. However, in the unlikely event of a large scale oil spill, the proposed development could impact onshore environmentally sensitive cultural or archaeological areas. The current Oil Spill Response Plan, for Platform Hogan and associated pipelines, defines areas within possible oil spill paths and delineates procedures to protect these areas from contamination. It also contains detail regarding notification procedures and policies in the unlikely event of an unanticipated release into the marine environment. The current oil production from Platform Hogan is estimated to be 600 bbls per day, and is not anticipated to increase significantly with the development of the Carpinteria Field. No incremental increase to PACOPS’ worst-case spill discharge scenario volume is anticipated. Incrementally production will simply result in a similar volume of gross fluid being transported from the platforms to shore per given unit of time. Therefore, the proposed Project will not increase the severity of impacts in the unlikely case of a spill. For
February 2011 Carone DPP Revisions
5.12-4
detailed analysis of the potential for oil spills, please refer to Attachment 9.0 (Oil Spill Risk Assessment).
In addition to the current Platform Hogan Oil Spill Response Plan, the California Department of Fish and Game Office of Spill Prevention and Response website (http://www.dfg.ca.gov/ospr/response/acp/marine/2005ACPs/2005LAACPs/lalb_acp_index.html) includes specific response tools and Area Contingency Plans (ACP) to be followed by lessees and operators should a spill occur. For the Santa Barbara region, this information is included within the Marine - Los Angeles / Long Beach Contingency Plans, Section 9812 (Santa Barbara County – East ACP-5) for the Carpinteria. According to the ACP, Cultural, Historical, and Archeological sites are known to exist in the Carpinteria area; however, the exact locations of these sites must be ascertained by contacting the Native American Heritage Commission at (916) 653-4082 and State Office of Historical Preservation (916) 653-6624, and/or the Central Coast Archeological Information Center (805) 893-2474 should a spill occur. Other areas within the Project vicinity are also included within the ACP and contact information for those resources can be found at the Department of Fish and Game website at (http://www.dfg.ca.gov/ospr/response/acp/marine/2005ACPs/2005LAACPs/lalb_acp_index.html)
February 2011 Carone DPP Revisions
5.12-5
5.12.3 References
Minerals Management Service (MMS). Federal Code of Regulations §30 CFR 250.261. Accessed online March 23, 2010 athttp://ecfr.gpoaccess.gov/cgi/t/text/text-idx?c=ecfr&sid=01933d3f8d318254de0993752b6ff47d&rgn=div8&view=text&node=30:2.0.1.2.26.2.93.55&idno=30
Marine Research Services (MRS), 2008. Proposed Final Environmental Impact Report (FEIR) for the Venoco Paredon Project. SCH# 2006051126.
Pacific Operators Offshore. 2009. Website. Accessed online December 2009
Pacific Operators Offshore. Oil Spill Response Plan - La Conchita Onshore Facilities. Goldberg Environmental Services. August 2008.
Pacific Operators Offshore. Oil Spill Response Plan - Platforms Hogan and Houchin and Associated Subsea Pipelines, Lease OCS-P 0166. Goldberg Environmental Services. August 2008.
Pacific Operators Offshore. Application to California State Lands Commission to Develop Oil and Gas Leases. October 2009.
Pacific Operators Offshore. Revisions to Development and Production Plan - Platform Hogan, the Carpinteria Field. September 2009.Pararas-Carayannis, G. 1969. “The Santa Barbara, California, Earthquakes and Tsunami(s) of December 1812.” Website http://www.drgeorgepc.com/Tsumani1812SantaBarbara.html
United States Department of the Interior, Minerals Management Service (MMS) (2006) Pacific OCS Region Notice to Lessees and Operators (NTL) of Federal Oil and Gas Leases in the Pacific Outer Continental Shelf Region – Archaeological Survey and Report Requirements. Accessed online March 23, 2010 at http://www.mms.gov/omm/pacifci/offshore/ntls/ntl_06_P03.pdf
United States Geological Survey. 1976. Final Environmental Impact Statement Oil and Gas Development in the Santa Barbara Channel Outer Continental Shelf Off California.
United States Coast Guard. 2008. Response Tools Area Contingency Plans Marine - Los Angeles / Long Beach Contingency Plans Accessed online March 23, 2010 at The Department of Fish and Game OSPR website at http://www.dfg.ca.gov/ospr/response/acp/marine/2005ACPs/2005LAACPs/lalb_acp_index.html.
Venoco, Inc. 2005. Cavern Point Unit Environmental Analysis (Final).
February 2011 Carone DPP Revisions
5.13-1
5.13 SOCIOECONOMICS AND ENVIRONMENTAL JUSTICE
5.13.1 Affected Environment
The Project site is the existing Platform Hogan located within Pacific Outer Continental Shelf Lease P-0166 within the Santa Barbara Channel offshore Carpinteria, California. The proposed drilling will be accomplished with a 1,000 horsepower electric drill and will not require any seafloor activities within state leased areas. All drilling will be conducted through subsurface operations from Platform Hogan. With the exception of the new wellhead equipment and associated piping and metering, no additional platform-based oil and gas handling and processing equipment is required for the proposed Project.
PACOPS leases one crew boat, which operates 24 hours per day to transport personnel and supplies of up to 30 tons per trip from Carpinteria pier to Platforms Hogan and Houchin. The boat is operated by a captain and 2 crewmembers per 12 hours after which the second shift takes over. During routine production operations, the crew boat makes on the average 4.9 round trips per day as compared to 6.6 round trips per day during drilling operations. Platform support will be provided via crew and supply boats from the existing pier facilities at Carpinteria. No long term increase in crew or supply boats is expected, however up to one additional workboat trip per week is expected during drilling operations. All vessels will use existing voluntary on-water corridors between the pier and Platform Hogan.
Initial oil/gas separation will occur on Platform Hogan then produced fluids and gas will be transported to the La Conchita onshore processing facility via existing submarine pipelines from Platform Hogan. Drilling is expected to commence following completion of environmental review and acquisition of all required permits; and will continue for up to seven years. Production is expected to begin in 2013 and continue through 2040. No expansion of onshore facilities will be necessary in order to process the oil and gas produced from the Carpinteria Field. The proposed Project will not require any additional crew to operate the onshore La Conchita facility compared to current requirements.
5.13.2 Socioeconomics
5.13.2.1 Onshore Socioeconomic Conditions
As shown in Table 5.13-1 below, Santa Barbara County’s per capita income estimated by the U.S. Census Bureau during the American Community Survey 5 Year Estimates (2005-2009), was $29,487, while the median household income was $59,350. The median income for a family was $68,848. Of the total population, 13.8% of individuals and 8.0% of families were below the established poverty level. Within the County of Ventura, the per capita income estimated by the U.S. Census Bureau during the American Community Survey 5 Year Estimates (2005-2009), was $32,063, while the median household income was $74,828. The median income for a family was $83.830. Of the total population, 9.0% of individuals and 6.5% of families were below the established poverty level.
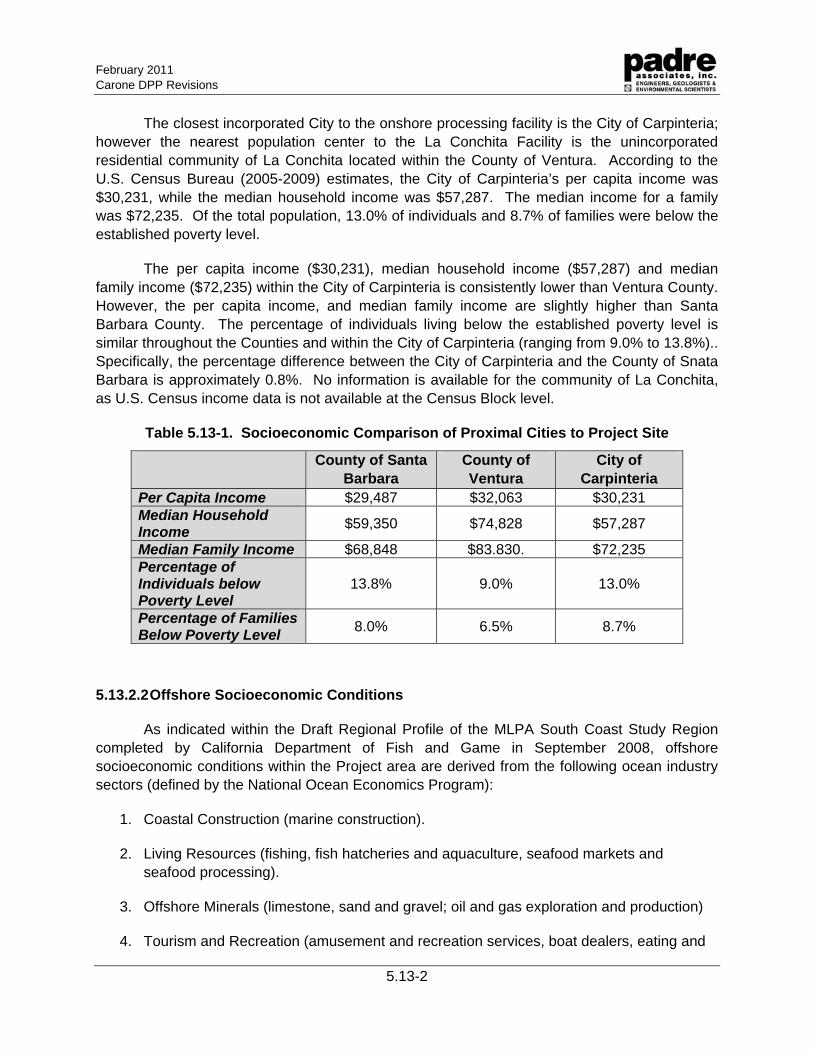
February 2011 Carone DPP Revisions
5.13-2
The closest incorporated City to the onshore processing facility is the City of Carpinteria; however the nearest population center to the La Conchita Facility is the unincorporated residential community of La Conchita located within the County of Ventura. According to the U.S. Census Bureau (2005-2009) estimates, the City of Carpinteria’s per capita income was $30,231, while the median household income was $57,287. The median income for a family was $72,235. Of the total population, 13.0% of individuals and 8.7% of families were below the established poverty level.
The per capita income ($30,231), median household income ($57,287) and median family income ($72,235) within the City of Carpinteria is consistently lower than Ventura County. However, the per capita income, and median family income are slightly higher than Santa Barbara County. The percentage of individuals living below the established poverty level is similar throughout the Counties and within the City of Carpinteria (ranging from 9.0% to 13.8%).. Specifically, the percentage difference between the City of Carpinteria and the County of Snata Barbara is approximately 0.8%. No information is available for the community of La Conchita, as U.S. Census income data is not available at the Census Block level.
Table 5.13-1. Socioeconomic Comparison of Proximal Cities to Project Site
County of Santa Barbara
County of Ventura
City of Carpinteria
Per Capita Income $29,487 $32,063 $30,231 Median Household Income
$59,350 $74,828 $57,287
Median Family Income $68,848 $83.830. $72,235 Percentage of Individuals below Poverty Level
13.8% 9.0% 13.0%
Percentage of Families Below Poverty Level
8.0% 6.5% 8.7%
5.13.2.2 Offshore Socioeconomic Conditions
As indicated within the Draft Regional Profile of the MLPA South Coast Study Region completed by California Department of Fish and Game in September 2008, offshore socioeconomic conditions within the Project area are derived from the following ocean industry sectors (defined by the National Ocean Economics Program):
1. Coastal Construction (marine construction).
2. Living Resources (fishing, fish hatcheries and aquaculture, seafood markets and seafood processing).
3. Offshore Minerals (limestone, sand and gravel; oil and gas exploration and production)
4. Tourism and Recreation (amusement and recreation services, boat dealers, eating and
February 2011 Carone DPP Revisions
5.13-3
drinking places, hotels and lodging places, marine, recreational vehicle parks and campgrounds, scenic water tours, sporting good retailers, zoos and aquaria).
5. Transportation (deep-sea freight transportation, marine passenger transportation, marine transportation services, search and navigation equipment, and warehousing).
*Please note that recreational fishing is included in the Tourism and Recreation category and not in the Living Resources category.
A summary of the information contained within Draft Regional Profile for Santa Barbara and Ventura Counties is provided below (CDFG, 2008).
Santa Barbara County. Santa Barbara County encompasses 2,738.5 mi2 and has a shoreline span of roughly 59.3 miles. The top employers in Santa Barbara are predominately service-based, not resource-based industries. Services, government, trade and transportation, and goods producing are the primary industries in the county. Approximately 35% of employment comes from the service industry; the other top industries provide no more than 5%. The tourism industry falls within the services sector. In 2006, travel spending in Santa Barbara totaled $1,443.0 million annually.
As part of the Draft Regional Profile, economic information was gathered for the ocean-related sectors found in the South Coast study region. These sectors, which depend upon ocean resources, include construction, living resources, minerals, ship and boat building, tourism and recreation, and transportation. Wages by sector provide an economic comparison of how important each sector is in any given county. Note that not all sectors were represented in the counties. For Santa Barbara County, the tourism and recreation sector provided the highest economic contribution, in terms of wages, compared to all other ocean-related sectors with an average $182.9 million per year. Transportation was the second highest sector with wages averaging $92.8 million annually. The other remaining sectors were roughly $25 million per year or less (See Figure 5.13-1).
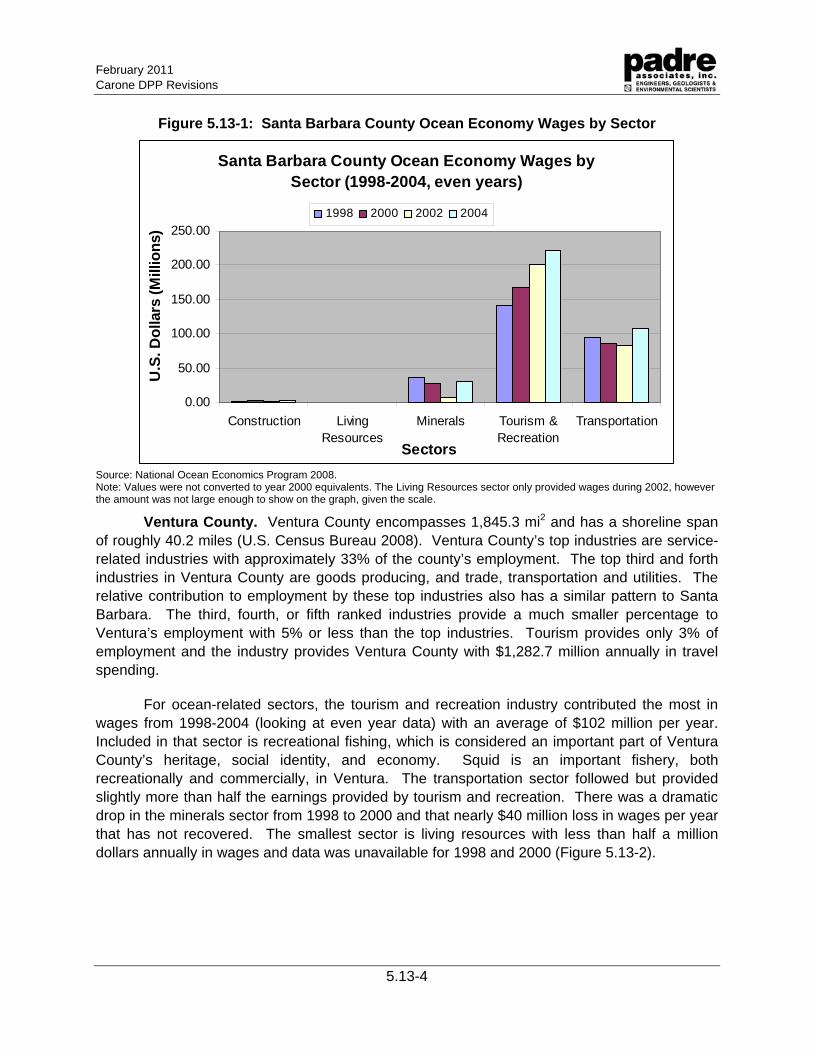
February 2011 Carone DPP Revisions
5.13-4
Figure 5.13-1: Santa Barbara County Ocean Economy Wages by Sector
Santa Barbara County Ocean Economy Wages by Sector (1998-2004, even years)
0.00
50.00
100.00
150.00
200.00
250.00
Construction LivingResources
Minerals Tourism &Recreation
Transportation
Sectors
U.S
. Do
llars
(M
illio
ns)
1998 2000 2002 2004
Source: National Ocean Economics Program 2008. Note: Values were not converted to year 2000 equivalents. The Living Resources sector only provided wages during 2002, however the amount was not large enough to show on the graph, given the scale.
Ventura County. Ventura County encompasses 1,845.3 mi2 and has a shoreline span of roughly 40.2 miles (U.S. Census Bureau 2008). Ventura County’s top industries are service-related industries with approximately 33% of the county’s employment. The top third and forth industries in Ventura County are goods producing, and trade, transportation and utilities. The relative contribution to employment by these top industries also has a similar pattern to Santa Barbara. The third, fourth, or fifth ranked industries provide a much smaller percentage to Ventura’s employment with 5% or less than the top industries. Tourism provides only 3% of employment and the industry provides Ventura County with $1,282.7 million annually in travel spending.
For ocean-related sectors, the tourism and recreation industry contributed the most in wages from 1998-2004 (looking at even year data) with an average of $102 million per year. Included in that sector is recreational fishing, which is considered an important part of Ventura County’s heritage, social identity, and economy. Squid is an important fishery, both recreationally and commercially, in Ventura. The transportation sector followed but provided slightly more than half the earnings provided by tourism and recreation. There was a dramatic drop in the minerals sector from 1998 to 2000 and that nearly $40 million loss in wages per year that has not recovered. The smallest sector is living resources with less than half a million dollars annually in wages and data was unavailable for 1998 and 2000 (Figure 5.13-2).
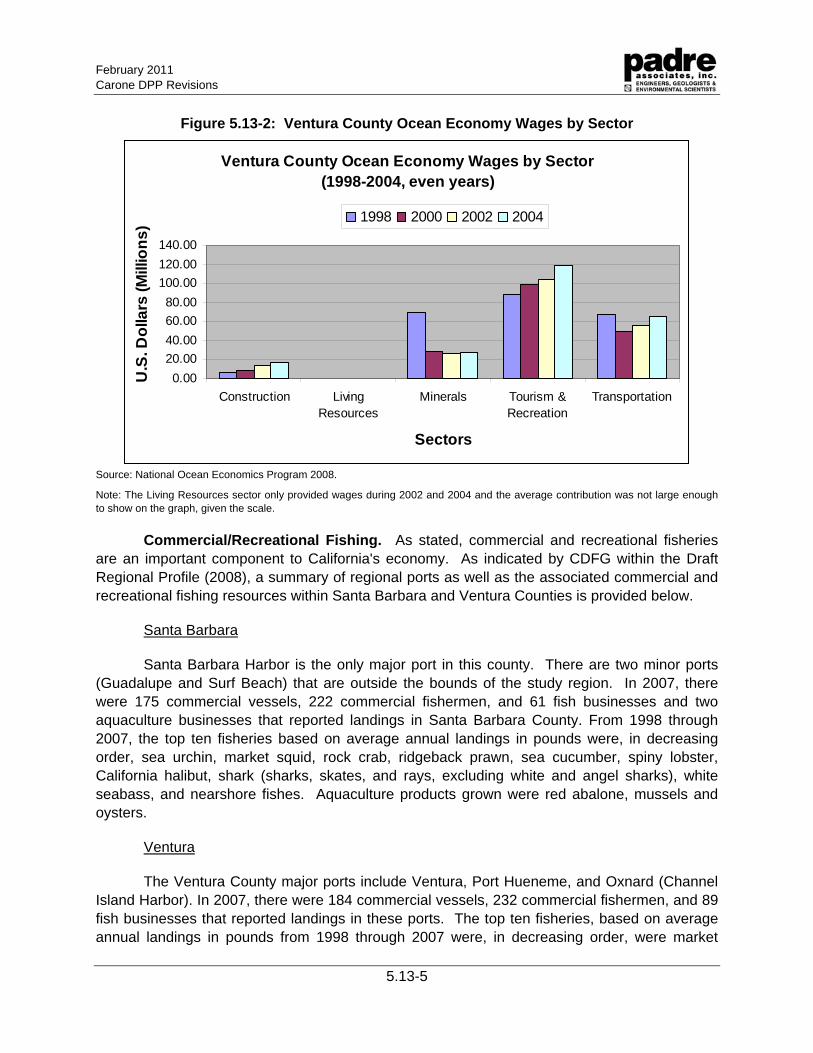
February 2011 Carone DPP Revisions
5.13-5
Figure 5.13-2: Ventura County Ocean Economy Wages by Sector
Ventura County Ocean Economy Wages by Sector (1998-2004, even years)
0.00
20.00
40.00
60.00
80.00
100.00
120.00
140.00
Construction LivingResources
Minerals Tourism &Recreation
Transportation
Sectors
U.S
. Do
llars
(Mill
ion
s)
1998 2000 2002 2004
Source: National Ocean Economics Program 2008.
Note: The Living Resources sector only provided wages during 2002 and 2004 and the average contribution was not large enough to show on the graph, given the scale.
Commercial/Recreational Fishing. As stated, commercial and recreational fisheries are an important component to California's economy. As indicated by CDFG within the Draft Regional Profile (2008), a summary of regional ports as well as the associated commercial and recreational fishing resources within Santa Barbara and Ventura Counties is provided below.
Santa Barbara
Santa Barbara Harbor is the only major port in this county. There are two minor ports (Guadalupe and Surf Beach) that are outside the bounds of the study region. In 2007, there were 175 commercial vessels, 222 commercial fishermen, and 61 fish businesses and two aquaculture businesses that reported landings in Santa Barbara County. From 1998 through 2007, the top ten fisheries based on average annual landings in pounds were, in decreasing order, sea urchin, market squid, rock crab, ridgeback prawn, sea cucumber, spiny lobster, California halibut, shark (sharks, skates, and rays, excluding white and angel sharks), white seabass, and nearshore fishes. Aquaculture products grown were red abalone, mussels and oysters.
Ventura
The Ventura County major ports include Ventura, Port Hueneme, and Oxnard (Channel Island Harbor). In 2007, there were 184 commercial vessels, 232 commercial fishermen, and 89 fish businesses that reported landings in these ports. The top ten fisheries, based on average annual landings in pounds from 1998 through 2007 were, in decreasing order, were market
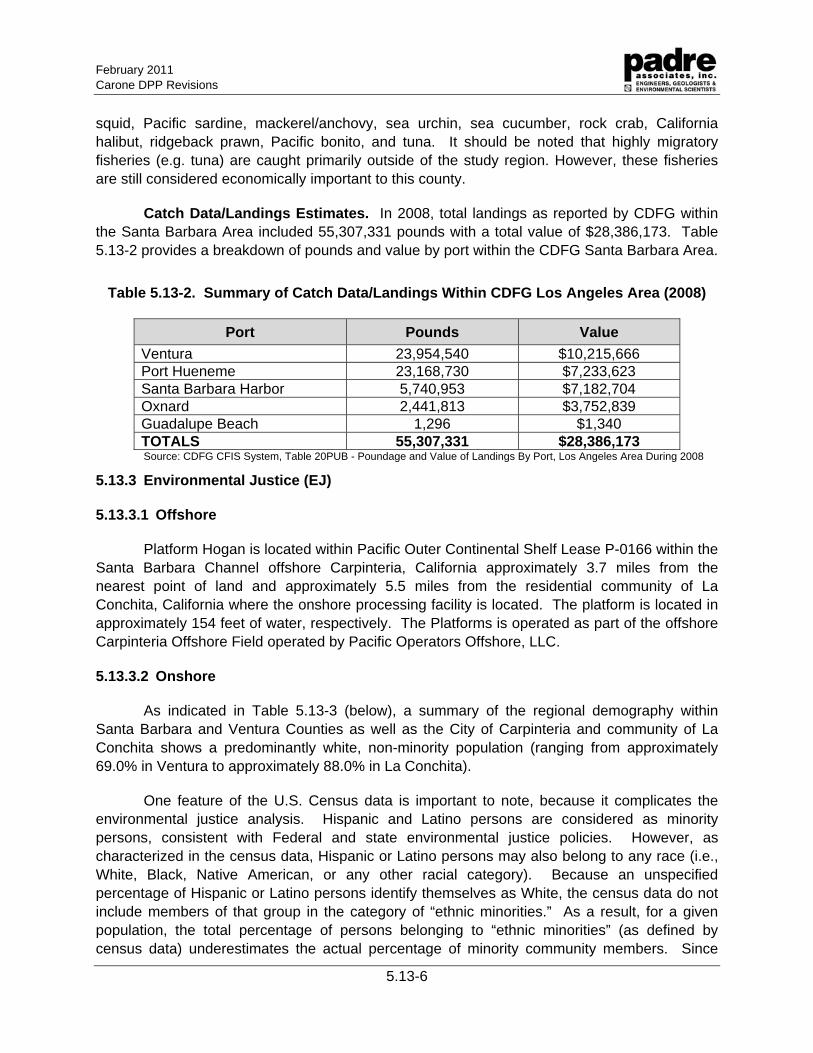
February 2011 Carone DPP Revisions
5.13-6
squid, Pacific sardine, mackerel/anchovy, sea urchin, sea cucumber, rock crab, California halibut, ridgeback prawn, Pacific bonito, and tuna. It should be noted that highly migratory fisheries (e.g. tuna) are caught primarily outside of the study region. However, these fisheries are still considered economically important to this county.
Catch Data/Landings Estimates. In 2008, total landings as reported by CDFG within the Santa Barbara Area included 55,307,331 pounds with a total value of $28,386,173. Table 5.13-2 provides a breakdown of pounds and value by port within the CDFG Santa Barbara Area.
Table 5.13-2. Summary of Catch Data/Landings Within CDFG Los Angeles Area (2008)
Port Pounds Value
Ventura 23,954,540 $10,215,666 Port Hueneme 23,168,730 $7,233,623 Santa Barbara Harbor 5,740,953 $7,182,704 Oxnard 2,441,813 $3,752,839 Guadalupe Beach 1,296 $1,340 TOTALS 55,307,331 $28,386,173
Source: CDFG CFIS System, Table 20PUB - Poundage and Value of Landings By Port, Los Angeles Area During 2008
5.13.3 Environmental Justice (EJ)
5.13.3.1 Offshore
Platform Hogan is located within Pacific Outer Continental Shelf Lease P-0166 within the Santa Barbara Channel offshore Carpinteria, California approximately 3.7 miles from the nearest point of land and approximately 5.5 miles from the residential community of La Conchita, California where the onshore processing facility is located. The platform is located in approximately 154 feet of water, respectively. The Platforms is operated as part of the offshore Carpinteria Offshore Field operated by Pacific Operators Offshore, LLC.
5.13.3.2 Onshore
As indicated in Table 5.13-3 (below), a summary of the regional demography within Santa Barbara and Ventura Counties as well as the City of Carpinteria and community of La Conchita shows a predominantly white, non-minority population (ranging from approximately 69.0% in Ventura to approximately 88.0% in La Conchita).
One feature of the U.S. Census data is important to note, because it complicates the environmental justice analysis. Hispanic and Latino persons are considered as minority persons, consistent with Federal and state environmental justice policies. However, as characterized in the census data, Hispanic or Latino persons may also belong to any race (i.e., White, Black, Native American, or any other racial category). Because an unspecified percentage of Hispanic or Latino persons identify themselves as White, the census data do not include members of that group in the category of “ethnic minorities.” As a result, for a given population, the total percentage of persons belonging to “ethnic minorities” (as defined by census data) underestimates the actual percentage of minority community members. Since
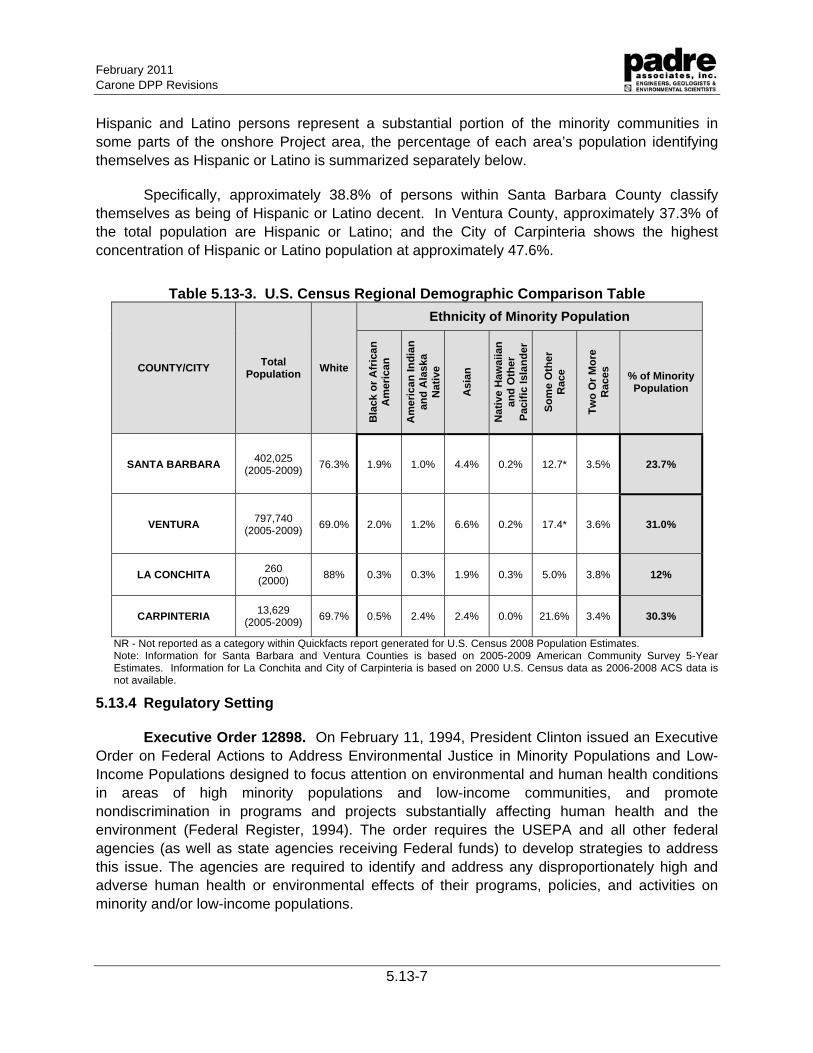
February 2011 Carone DPP Revisions
5.13-7
Hispanic and Latino persons represent a substantial portion of the minority communities in some parts of the onshore Project area, the percentage of each area’s population identifying themselves as Hispanic or Latino is summarized separately below.
Specifically, approximately 38.8% of persons within Santa Barbara County classify themselves as being of Hispanic or Latino decent. In Ventura County, approximately 37.3% of the total population are Hispanic or Latino; and the City of Carpinteria shows the highest concentration of Hispanic or Latino population at approximately 47.6%.
Table 5.13-3. U.S. Census Regional Demographic Comparison Table
COUNTY/CITY Total
Population White
Ethnicity of Minority Population
Bla
ck o
r A
fric
an
A
mer
ica
n
Am
eric
an
Ind
ian
an
d A
lask
a N
ativ
e
Asi
an
Nat
ive
Haw
aiia
n
and
Oth
er
Pac
ific
Isla
nd
er
So
me
Oth
er
Rac
e
Tw
o O
r M
ore
R
aces
% of Minority Population
SANTA BARBARA 402,025
(2005-2009) 76.3% 1.9% 1.0% 4.4% 0.2% 12.7* 3.5% 23.7%
VENTURA 797,740
(2005-2009) 69.0% 2.0% 1.2% 6.6% 0.2% 17.4* 3.6% 31.0%
LA CONCHITA 260
(2000) 88% 0.3% 0.3% 1.9% 0.3% 5.0% 3.8% 12%
CARPINTERIA 13,629
(2005-2009) 69.7% 0.5% 2.4% 2.4% 0.0% 21.6% 3.4% 30.3%
NR - Not reported as a category within Quickfacts report generated for U.S. Census 2008 Population Estimates. Note: Information for Santa Barbara and Ventura Counties is based on 2005-2009 American Community Survey 5-Year Estimates. Information for La Conchita and City of Carpinteria is based on 2000 U.S. Census data as 2006-2008 ACS data is not available.
5.13.4 Regulatory Setting
Executive Order 12898. On February 11, 1994, President Clinton issued an Executive Order on Federal Actions to Address Environmental Justice in Minority Populations and Low-Income Populations designed to focus attention on environmental and human health conditions in areas of high minority populations and low-income communities, and promote nondiscrimination in programs and projects substantially affecting human health and the environment (Federal Register, 1994). The order requires the USEPA and all other federal agencies (as well as state agencies receiving Federal funds) to develop strategies to address this issue. The agencies are required to identify and address any disproportionately high and adverse human health or environmental effects of their programs, policies, and activities on minority and/or low-income populations.
February 2011 Carone DPP Revisions
5.13-8
In 1997, the USEPA’s Office of Environmental Justice released the Environmental Justice Implementation Plan (USEPA, 1997), supplementing the USEPA environmental justice strategy and providing a framework for developing specific plans and guidance for implementing Executive Order 12898. Federal agencies received a framework for the assessment of environmental justice in the USEPA’s Guidance for Incorporating Environmental Justice Concerns in EPA’s NEPA Compliance Analysis in 1998 (USEPA, 1998). This approach emphasizes the importance of selecting an analytical process appropriate to the unique circumstances of the potentially affected community.
5.13.5 Impact Assessment
5.13.5.1 Offshore Impacts
Socioeconomics. During construction and operation of the Project, the potential for socioeconomic impacts would be negligible; as Project activities (drilling, on-platform processing and transporting of produced oil and gas, discharging produced water, and vessel operations) would be predominantly accomplished utilizing existing staff and resources, with the exception of the addition of one offshore vessel trip per week within existing offshore transportation corridors from Carpinteria Pier to Platform Hogan during the drilling timeframe.
Additionally, as indicated above, offshore ocean resources play an important role in the local economy in Santa Barbara and Ventura Counties. However, as discussed in Section 7.0 (EFHA), Platform discharges will be in accordance with existing NPDES permits and will therefore not degrade the existing quality of the marine waters around the platform. The on-platform and subsurface noise that will be produced during the proposed activities are expected to be similar to those that are currently occurring at the platform and are not expected to be detrimental to the viability of the essential fish habitat (EFH). Oil and gas, along with produced water, is currently being transported between Platform Hogan and the La Conchita facility. No structural changes to the submerged portion of the platform are proposed, thus no additional solid habitat will be created nor will any be removed as a result of the proposed activities that would have the potential to affect local fisheries. The additional production is not expected to result in any effects to the marine environment that would have a negative effect on recreational or commercial fisheries and the resulting offshore economy.
Environmental Justice. Offshore activities, both construction and post-construction, all occur in the open ocean miles from shore; therefore they do not have the potential to directly impact low-income and minority communities. Additionally, indirect impacts as a result of energy consumption will be minimized during proposed activities by the use of an electric drill rig on Platform Hogan, which is connected to the Southern California Edison electrical grid, via a power cable from shore. The Project itself will represent a net increase in energy production.
5.13.5.2 Onshore Impacts
Socioeconomics. The per capita income ($30,231), median household income ($57,287) and median family income ($72,235) within the City of Carpinteria is consistently lower than Ventura County. However, the per capita income, and median family income are
February 2011 Carone DPP Revisions
5.13-9
slightly higher than Santa Barbara County. The percentage of individuals living below the established poverty level is similar throughout the Counties and within the City of Carpinteria (ranging from 9.0% to 13.8%).. Specifically, the percentage difference between the City of Carpinteria and the County of Snata Barbara is approximately 0.8%. No information is available for the community of La Conchita, as U.S. Census income data is not available at the Census Block level.
Although the onshore processing facility at La Conchita is located within proximity to an area with minority populations, the proposed upgrades to the existing La Conchita facility are minor in nature. The proposed Project will not require any additional crew or changes to operate the onshore La Conchita Facility compared to current requirements. The only effect on transportation as a result of the proposed Project will be from a small number of truck deliveries of equipment needed to complete the minor upgrades required by the proposed Project. Since no additional crew will be needed onshore or offshore to complete proposed drilling in State leases, there will be no impact to local transportation from additional crew as a result of this Project. Also, no new suppliers or services are currently anticipated to support the proposed Project. All supplies and services will be obtained from existing providers. As such, short-term socioeconomic effects of the Carone Platform Hogan DPP revisions are expected to be negligible.
Environmental Justice. The La Conchita onshore processing facility is located within the community of La Conchita; part of Ventura County. As indicated within Table 5.13-3, although the demographics of the onshore area are predominantly non-minority (white); there is a substantial percentage of individuals who consider themselves to be of Hispanic or Latino decent (specifically, approximately 38.8% of persons within Santa Barbara County approximately 37.3% of the total population in Ventura County, and approximately 47.6% within the City of Carpinteria); which are minority populations under existing Federal and State EJ policies. Additionally, the La Conchita processing facility is located closest to the City of Carpinteria, which has shown a higher percentage of minority persons than that of the greater surrounding Santa Barbara and Ventura Counties as a whole.
However, the proposed upgrades to the existing La Conchita facility are minor in nature. As indicated in Section 5.9 (Air Quality), the Plan of Development has been configured to stay within the permitted emission limits of the current La Conchita Permit to Operate (PTO). No new impacts to air quality would result. Further, since no onshore construction is required, no significant impacts to transportation systems from the proposed Project are expected. The proposed development will no create a substantial increase in vehicle trips per day, nor will it disrupt or affect any special communities or neighborhoods. Therefore, no disproportionate impacts to local minority communities existing within the vicinity of the onshore Project area would result.
February 2011 Carone DPP Revisions
5.13-10
5.13.6 References
CDFG, 2008. California Marine Life Protection Act Initiative - Draft Regional Profile of the MLPA South Coast Study Region.
CDFG CFIS System, 2010. Table 12 - Poundage and Value of Landings By Port, Santa Barbara Area During 2008.
Federal Register. 1994. Presidential Documents – Executive Order 12898 (Federal Actions to Address Environmental Justice in Minority Populations and Low-Income Populations).
United States Census Bureau (U.S. Census). 2011. http://factfinder.census.gov
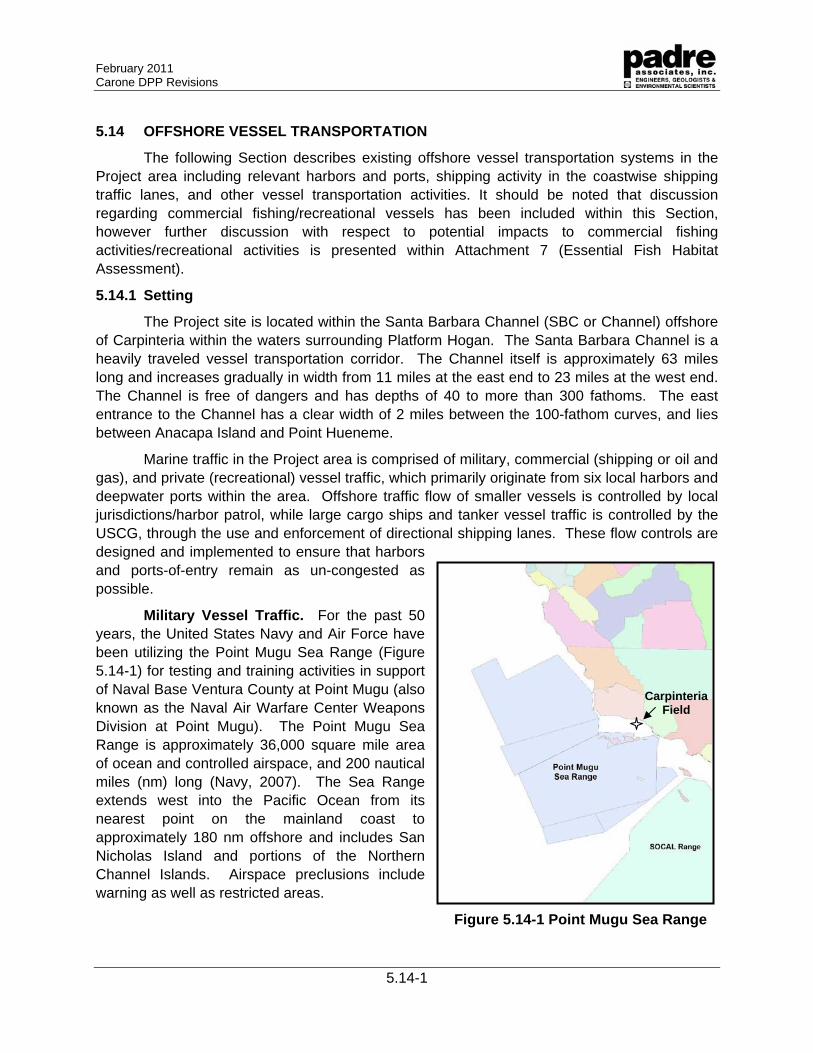
February 2011 Carone DPP Revisions
5.14-1
5.14 OFFSHORE VESSEL TRANSPORTATION
The following Section describes existing offshore vessel transportation systems in the Project area including relevant harbors and ports, shipping activity in the coastwise shipping traffic lanes, and other vessel transportation activities. It should be noted that discussion regarding commercial fishing/recreational vessels has been included within this Section, however further discussion with respect to potential impacts to commercial fishing activities/recreational activities is presented within Attachment 7 (Essential Fish Habitat Assessment).
5.14.1 Setting
The Project site is located within the Santa Barbara Channel (SBC or Channel) offshore of Carpinteria within the waters surrounding Platform Hogan. The Santa Barbara Channel is a heavily traveled vessel transportation corridor. The Channel itself is approximately 63 miles long and increases gradually in width from 11 miles at the east end to 23 miles at the west end. The Channel is free of dangers and has depths of 40 to more than 300 fathoms. The east entrance to the Channel has a clear width of 2 miles between the 100-fathom curves, and lies between Anacapa Island and Point Hueneme.
Marine traffic in the Project area is comprised of military, commercial (shipping or oil and gas), and private (recreational) vessel traffic, which primarily originate from six local harbors and deepwater ports within the area. Offshore traffic flow of smaller vessels is controlled by local jurisdictions/harbor patrol, while large cargo ships and tanker vessel traffic is controlled by the USCG, through the use and enforcement of directional shipping lanes. These flow controls are designed and implemented to ensure that harbors and ports-of-entry remain as un-congested as possible.
Military Vessel Traffic. For the past 50 years, the United States Navy and Air Force have been utilizing the Point Mugu Sea Range (Figure 5.14-1) for testing and training activities in support of Naval Base Ventura County at Point Mugu (also known as the Naval Air Warfare Center Weapons Division at Point Mugu). The Point Mugu Sea Range is approximately 36,000 square mile area of ocean and controlled airspace, and 200 nautical miles (nm) long (Navy, 2007). The Sea Range extends west into the Pacific Ocean from its nearest point on the mainland coast to approximately 180 nm offshore and includes San Nicholas Island and portions of the Northern Channel Islands. Airspace preclusions include warning as well as restricted areas.
Figure 5.14-1 Point Mugu Sea Range
Carpinteria Field
February 2011 Carone DPP Revisions
5.14-2
The restricted areas are located over San Nicholas Island, the Point Mugu Airfield, and coastline adjacent to the Point Mugu airfield. According to the US Navy, there have been no accidents involving non-participants within the Point Mugu Sea Range (MMS, 2001). The proposed Project will not result in any conflicts with military activities in the Channel.
Commercial and Recreational Vessel Traffic. The Santa Barbara Channel is used on a daily basis by commercial and recreational vessels. The size of these vessels can range from very large commercial vessels that are over 1,000 feet in length to small recreational fishing and leisure boats. The majority of these vessels travel within the Channel via existing harbors and ports. The locations and characteristics of the six harbors/ports located in proximity to the Project site locations are as follows:
Santa Barbara Harbor. Santa Barbara Harbor contains over 1,000 slips. Vessels providing routine service to the offshore oil and gas industry typically do not use Santa Barbara Harbor to load or unload personnel, supplies, or equipment, but may refuel there. Vessels belonging to the Clean Seas Oil Spill Response Cooperative are anchored east of Stearns Wharf (MMS, 1999; CINMS, 2006)
Ventura Harbor. Ventura Harbor is located between the cities of Santa Barbara and Los Angeles, and is primarily utilized by recreational vessels. Ventura Harbor consists of 1,375 slips, of which approximately 120 vessels designated for commercial fishing and offshore platform services operate.
Channel Islands Harbor. Channel Islands Harbor in the City of Oxnard is located approximately 6.8-miles southeast of Ventura Harbor and approximately 1 mile northwest of the Port of Hueneme. Channel Islands Harbor is home to more than 2,800 recreational and commercial vessels (CINMS, 2006) and provides charter boat service for transport to offshore oil facilities, transport to the Channel Islands, dock space for sport and commercial fishing, 11 marinas and yacht clubs, and a USCG Station (Stienstra, 1996). Vessels associated with the offshore oil and gas operations typically do not use Channel Islands Harbor (MMS, 1999; CINMS, 2006)
Port Hueneme. Port Hueneme is the only deep-water port between Los Angeles and San Francisco, and is used by commercial ships to load and unload goods. This port serves as the principal staging area for supplies, equipment, and crews for the oil platforms located in the Santa Barbara Channel. The Port was constructed in 1938 onshore from Hueneme (submarine) Canyon. Tidal currents and flushing action keep the depth of the harbor relatively constant. The harbor is man made, and connected to the open sea by a jetty-protected entrance channel. The outer part of the entrance channel terminates at the head of a submarine canyon that offers an excellent deepwater approach. Occasional dredging is needed to maintain harbor depths ranging from 35 to 32 feet.
Port Hueneme handles a variety of commodities in addition to offshore oil and gas supplies. The Port received approximately 1,011 metric tons (T) of cargo in 2001. In addition, the Port of Hueneme accepts approximately 340 deep draft commercial vessels each year. Port Hueneme is the closest deep water port to the proposed Project site and is routinely used by supply and crew vessels that service offshore Platforms.
February 2011 Carone DPP Revisions
5.14-3
Port of Los Angeles. The Port of Los Angeles (POLA) is located approximately 20 miles south of downtown Los Angeles. The Port complex occupies 7,500 acres of land and water along 43 miles of waterfront. In April of 2004, 339,942 loaded inbound vessels and 102,541 loaded outbound vessels utilized the Port of Los Angeles.
Port of Long Beach. The Port of Long Beach (POLB) is one of the world's busiest seaports. Located on San Pedro Bay, the POLB comprises more than 7,600 acres of wharves, cargo terminals, roads, rail yards, and shipping channels. The POLB shares San Pedro Bay with the neighboring Port of Los Angeles (POLA). Together, the San Pedro Bay Ports comprise a significant regional and national economic engine for California and the United States through which more than 40 percent of all containerized trade in the nation flows (POLB, 2006).
Vessel Traffic. Most California coastwise vessel traffic passes through the Santa Barbara Channel en route to major ports on the west coast. Exceptions are super tankers, which for safety reasons generally avoid the channel by traveling south of the Channel Islands. Vessel transportation includes many types of vessels, such as tankers, container ships, military vessels, research vessels, cruise ships, tugs and tows, commercial fishing boats, and recreational vessels.
Between San Francisco Bay and the POLA/POLB, large vessels make an estimated 4,000 coastal transits per year (approximately 11 per day). About 20 percent of these transits are crude oil tankers. Most of the remainder is large commercial vessels greater than 300 gross tons, including container ships and bulk carriers (USCG and NOAA, 1998).
Coastwise Shipping Lanes. Container ships and other large commercial vessels use shipping lanes along the California coast are generally 4 to 20 nautical miles (nm) offshore. Members of the Western States Petroleum Association, however, voluntarily keep oil and hazardous materials laden vessels a minimum of 50 nautical miles (nm) from the coast’s shoreline (SAIC, 2000). As shown in Figure 7.11-1, designated coastwise shipping lanes that traverse the California coast from near Point Arguello in western Santa Barbara County, through the Santa Barbara Channel and continue southeast to the Ports of Los Angeles/Long Beach.
There are two primary routes through and around the Santa Barbara Channel. The most heavily traversed route is the Santa Barbara Channel Route, or Northern Approach. The second, less utilized route is the Western Approach, which runs about 25 nm south of the Channel Islands and through the Point Mugu Sea Range.
Joint Oil Fisheries Liaison Office Designated Transportation Corridors. Crew and supply boats serving offshore oil and gas facilities are directed through a cooperative vessel traffic corridor program between the offshore oil industry and commercial fishing operations administered through the Joint Oil-Fisheries Liaison Office (JOFLO). For Platform Hogan, these corridors exist from Casitas Pier heading southwest approximately 3.75 miles. The negotiated corridors are typically 1,500 feet wide (1/4 nautical mile) to allow for the safe passage of two service vessels in opposite directions. However where traffic is expected to be heavy, such as near the Casitas Pier, the corridor has been widened to accommodate these needs (Figure 5.14-2). These corridors are not meant to supersede existing U.S. Coast Guard regulations regarding ocean traffic or traffic safety, not the existing Traffic Separation Lanes in the Santa Barbara Channel.
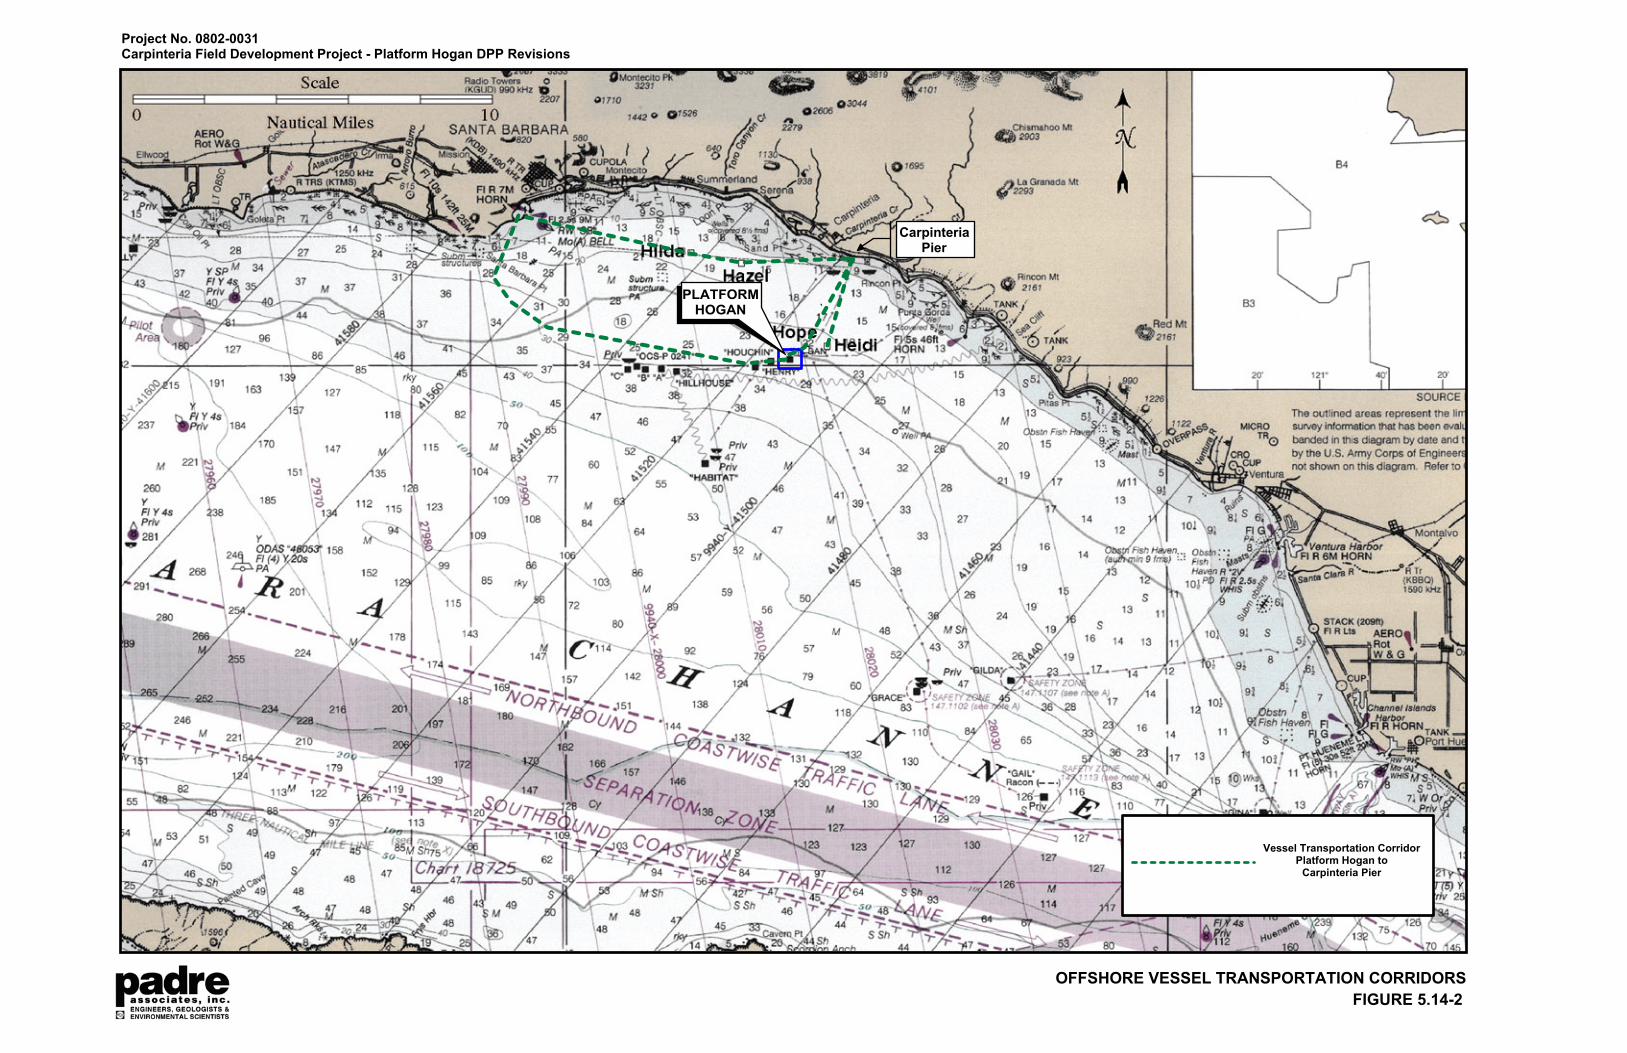
� � � � � � � � �
� � � � � � � � � � � � � � � � � � � � � � � � � � � � � � � � � � � �
� � � � � � � � � � � � �
� � � � � � � � � � � ! � � " �� # � $ % & � � � % # � � % � ' ( � � � ) � ' � $ * � & � � � � � � � � � � � � � ' # � + � � * � � � , # & � � � � � � � ) % - % � & -
�
� � � � � � .� � � �
� # � $ % & � � � % #� � � � � � � % � �
�
� - - � ' � � � # & - $ � � � # � % � & � � � � � % ( � �� ' # � + � � * � � � , # & � � � �� # � $ % & � � � % # � � % � �
February 2011 Carone DPP Revisions
5.14-5
5.14.2 Project Related Vessel Traffic
Construction-Related Vessel Traffic. During construction, a drilling rig of the type and configuration listed in Section 4 of the Revised DPP document will be temporarily installed on Platform Hogan. This rig will be transported to the Platform using a derrick barge similar to what has recently been used to install the drilling rig on Platform Houchin. During this same visit by the derrick barge, the existing platform workover rig will be de-mobilized. As such, no additional derrick barge vessel trips will be required. Once the drilling program has been completed, the drilling rig will be demobilized and a workover rig will be re-installed on the platform. The demobilization of the drilling rig and remobilization of the workover rig will also be performed by the derrick barge. The derrick barge will most likely mobilize from Port Hueneme or the POLA/POLB area utilizing existing JOFLO vessel corridors. The addition of two derrick barge trips (round-trip) to the Platform Hogan Project site will not interfere with existing vessel transportation.
A crew boat currently makes 4.9 daily trips from the Casitas Pier to the Platforms. This same crew boat will be utilized to accommodate the Project construction needs and during construction the crew boat would make approximately 6.6 daily trips from Casitas Pier to the platforms with support equipment and personnel each workday. The crew vessel would use the existing oil and gas transportation corridors established for transport to the platforms, and a notice to mariners would be provided prior to the commencement of construction activities. As such, the approximately two additional trips per day to and from the Casitas Pier using the existing oil and gas transit corridors to the Platforms would not impact offshore vessel traffic.
Project Operations-Related Vessel Traffic. The drilling phase for development of the Carpinteria Field will involve vessel movements to and from Platform Hogan and the Carpinteria Pier. It is projected that the proposed Project will not result in an increase in annual number of supply or crew boat trips to the platform. The supply and crew boats that will be used are existing boats that currently service Platform Hogan. All vessel operations will use the existing oil service vessel corridors to extent feasible. In addition, Carpinteria Pier is not open to the public, and the supply and crew boats are moored to buoys adjacent to the Pier rather than at the Santa Barbara Harbor. Therefore, the development of the Carpinteria Field will not reduce commercial fishing or recreational boating harbor space. Crew boat trips during drilling activities will be the same as crew boat requirements discussed above for construction; approximately 6.6 daily crew boat trips will occur during drilling activities. Following completion of proposed drilling activities, daily crew boat trips will return to the current frequency of 4.9 trips per day. No additional supply boat trips above what is required for the proposed Project will be needed once drilling is completed.
February 2011 Carone DPP Revisions
5.14-6
5.14.3 References
Arthur D. Little, MRS, SAIC. Tranquillion Ridge Oil and Gas Development Project. LOGP 2002 Produced Water Treatment System Project. Sisquoc Pipeline Bi-Directional Flow Project. Final Environmental Impact Report.
Channel Islands National Marine Sanctuary (CINMS). 2006. Management Plan Review – Draft Environmental Impact Statement Accessed online April 5, 2010 at http://channelislands.noaa.gov/manplan/overview.html
Clearwater Port. 2007. Revised Project Application Package.
Minerals Management Service. l984. Final Environmental Impact Statement for Proposed 1984 Outer Continental Shelf Oil and Gas Lease Sale Offshore Southern California. OCS Lease Sale No. 80. U.S. Department of the Interior, Minerals Management Service, Pacific OCS Region, Los Angeles, CA.
1999. Pacific OCS Region.. Offshore Facility Decommissioning Costs. March 31.
2001. Draft Environmental Impact Statement - Delineation Drilling Activities in Federal Waters Offshore. Santa Barbara County, California. Prepared by Pacific 33 OCS Region, Camarillo, California. June. 34
2010. Carpinteria Field, Pacific Operators Offshore - Platform Hogan Webpage accessed online April 5, 2010 at http://www.mms.gov/omm/Pacific/offshore/platforms/pacificopsplatform.htm
Plains Exploration and Production Company. 2008. Revisions to the Point Pedernales Field DPP Tranquillon Ridge Field - Environmental Evaluation
Port of Long Beach (POLB). 2006. Air Emissions Inventory
Stienstra, Tom, 1996, California Boating and Water Sports. Foghorn Press.
United States Coast Guard and National Oceanic and Atmospheric Administration (USCG and NOAA). 1998. Monterey Bay National Marine Sanctuary — Vessel Management. Final Report. October 22. 24
United States Navy Sustainability Office, 2007. Naval Air Systems Command Point Mugu Sea Range PowerPoint presented by Tony Parisihead, September 2007 accessed online April 5, 2010 at http://www.energy.ca.gov/lng/documents/2007-09-20_PARISI_TONY_POINT_MUGU_SEA_RANGE.PDF
February 2011 Carone DPP Revisions
REVISED FEBRUARY 2011
ATTACHMENT 6.0
BIOLOGICAL EVALUATION OF THREATENED AND
ENDANGERED SPECIES (BIOLOGICAL ASSESSMENT)
ATTACHMENT 6
BIOLOGICAL EVALUATION OF THREATENED AND ENDANGERED SPECIES (BIOLOGICAL ASSESSMENT)
Revision 4
February 2011
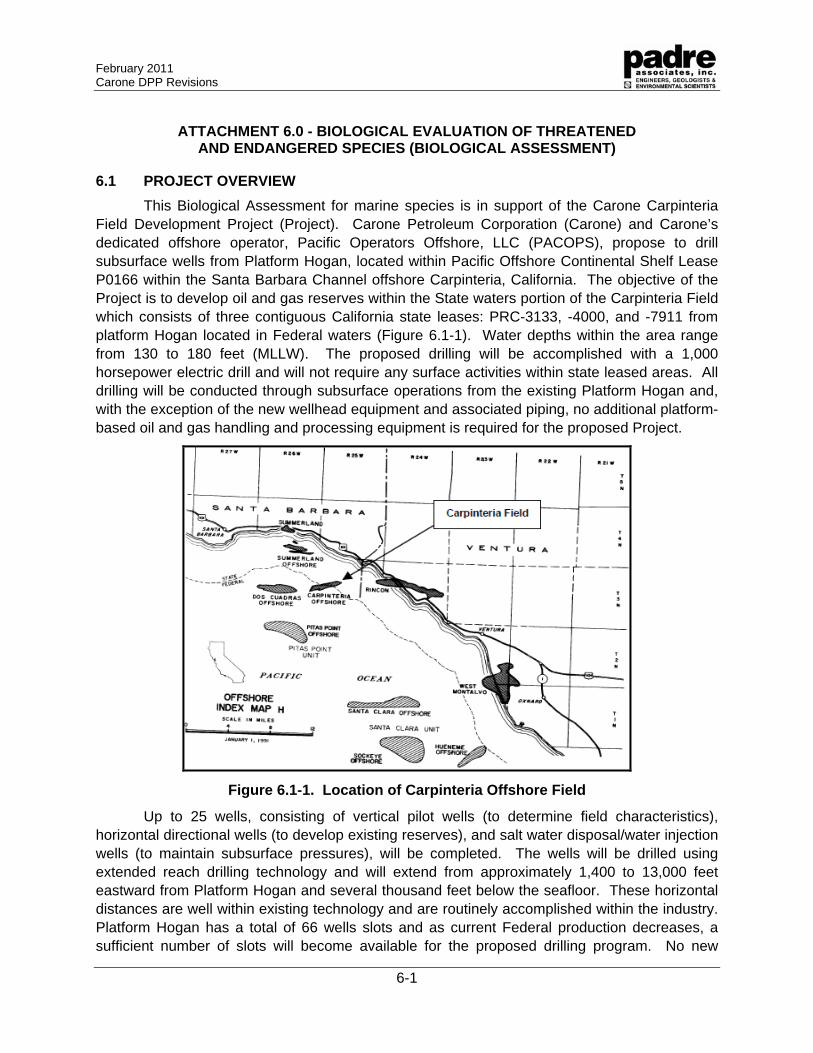
February 2011 Carone DPP Revisions
6-1
ATTACHMENT 6.0 - BIOLOGICAL EVALUATION OF THREATENED AND ENDANGERED SPECIES (BIOLOGICAL ASSESSMENT)
6.1 PROJECT OVERVIEW
This Biological Assessment for marine species is in support of the Carone Carpinteria Field Development Project (Project). Carone Petroleum Corporation (Carone) and Carone’s dedicated offshore operator, Pacific Operators Offshore, LLC (PACOPS), propose to drill subsurface wells from Platform Hogan, located within Pacific Offshore Continental Shelf Lease P0166 within the Santa Barbara Channel offshore Carpinteria, California. The objective of the Project is to develop oil and gas reserves within the State waters portion of the Carpinteria Field which consists of three contiguous California state leases: PRC-3133, -4000, and -7911 from platform Hogan located in Federal waters (Figure 6.1-1). Water depths within the area range from 130 to 180 feet (MLLW). The proposed drilling will be accomplished with a 1,000 horsepower electric drill and will not require any surface activities within state leased areas. All drilling will be conducted through subsurface operations from the existing Platform Hogan and, with the exception of the new wellhead equipment and associated piping, no additional platform-based oil and gas handling and processing equipment is required for the proposed Project.
Figure 6.1-1. Location of Carpinteria Offshore Field
Up to 25 wells, consisting of vertical pilot wells (to determine field characteristics), horizontal directional wells (to develop existing reserves), and salt water disposal/water injection wells (to maintain subsurface pressures), will be completed. The wells will be drilled using extended reach drilling technology and will extend from approximately 1,400 to 13,000 feet eastward from Platform Hogan and several thousand feet below the seafloor. These horizontal distances are well within existing technology and are routinely accomplished within the industry. Platform Hogan has a total of 66 wells slots and as current Federal production decreases, a sufficient number of slots will become available for the proposed drilling program. No new
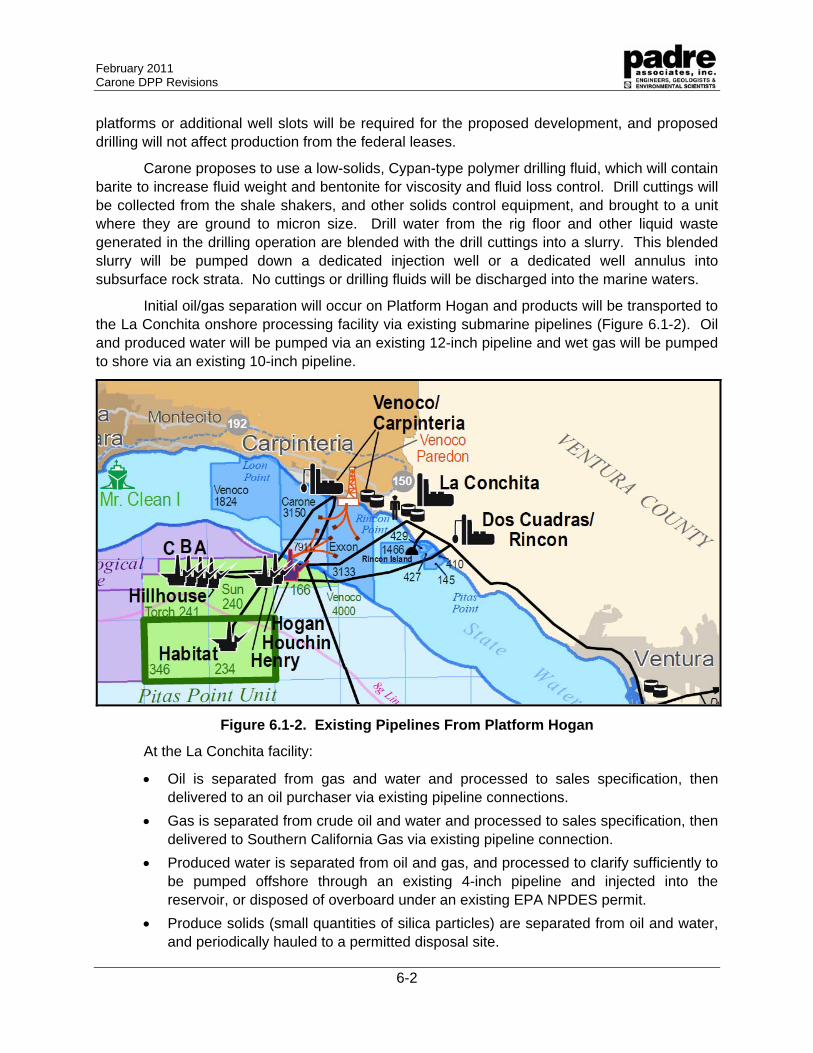
February 2011 Carone DPP Revisions
6-2
platforms or additional well slots will be required for the proposed development, and proposed drilling will not affect production from the federal leases.
Carone proposes to use a low-solids, Cypan-type polymer drilling fluid, which will contain barite to increase fluid weight and bentonite for viscosity and fluid loss control. Drill cuttings will be collected from the shale shakers, and other solids control equipment, and brought to a unit where they are ground to micron size. Drill water from the rig floor and other liquid waste generated in the drilling operation are blended with the drill cuttings into a slurry. This blended slurry will be pumped down a dedicated injection well or a dedicated well annulus into subsurface rock strata. No cuttings or drilling fluids will be discharged into the marine waters.
Initial oil/gas separation will occur on Platform Hogan and products will be transported to the La Conchita onshore processing facility via existing submarine pipelines (Figure 6.1-2). Oil and produced water will be pumped via an existing 12-inch pipeline and wet gas will be pumped to shore via an existing 10-inch pipeline.
Figure 6.1-2. Existing Pipelines From Platform Hogan
At the La Conchita facility:
Oil is separated from gas and water and processed to sales specification, then delivered to an oil purchaser via existing pipeline connections.
Gas is separated from crude oil and water and processed to sales specification, then delivered to Southern California Gas via existing pipeline connection.
Produced water is separated from oil and gas, and processed to clarify sufficiently to be pumped offshore through an existing 4-inch pipeline and injected into the reservoir, or disposed of overboard under an existing EPA NPDES permit.
Produce solids (small quantities of silica particles) are separated from oil and water, and periodically hauled to a permitted disposal site.
February 2011 Carone DPP Revisions
6-3
Drilling is expected to commence following completion of environmental review and acquisition of all required permits, and will continue for up to seven years. Production is expected to begin in 2013 and continue through 2039. Maximum oil production is expected to be reached in 2020 and is estimated to be 3,500 barrels of oil per day (BOPD). When production is no longer economically viable, all wells will be plugged and abandoned in accordance with state and/or federal requirements and the related offshore and onshore facilities will be decommissioned.
Platform support will be provided via crew and supply boats from the existing pier facilities at Carpinteria. No long-term increase in crew or supply boats is expected, however up to one additional workboat trip per week is expected during drilling and production operations. All vessels will use existing voluntary on-water corridors between the pier and Platform Hogan.
6.2 PROJECT LOCATION AND PLATFORM CHARACTERISTICS
The Project area consists of the marine waters between the shoreline and Platform Hogan (a distance of approximately 3.7 miles) and immediately around and within the footprint of the platform, and the seafloor between Platform Hogan and the La Conchita onshore processing facility. According to Love, et al. (2003) Platform Hogan is located in approximately 154 feet of water and covers approximately 15,440 feet2 of the seafloor at its base. The platform consists of primary legs (jackets) with various steel cross-members and bracing (Figure 6.2-1).
The surface area of the submerged portion of the platform provides an estimated 88,125 feet2 (Carr, et al., 2003; Schmitt, et al., 2006) and approximately 18 million gallons of water are within the water column encompassed by the platform structure (Carr, et al., 2003). Page, et al. (2005) report that the debris/shell mound located below Platform Hogan is approximately 26 feet high and is generally round with a diameter of approximately 256 feet. The natural seafloor between the platform and onshore processing facility is generally sedimentary, and the existing pipeline bundle is partially or completely buried from the platform to the inshore area (Hyland, pers. comm.).
6.3 REGULATORY BASIS
The Endangered Species Act of 1973 (Section 9 and implementing regulations 50 CFR Part 17) protects marine wildlife species including those that are found off the coast of California. The Endangered Species Act (ESA) makes it unlawful to harass, harm, pursue, hunt, shoot, wound, kill, trap, capture, or collect an endangered species, or to attempt to engage in any such conduct. Violations of the ESA and regulations are subject to a fine and imprisonment. An “endangered species” is defined by the Secretaries of the Department of the Interior and/or the Department of Commerce as any species that is in danger of extinction throughout all or a portion of its range. A “threatened species” is defined as any species, likely to become an endangered species within the foreseeable future throughout all or a significant portion of its range. The United States Fish and Wildlife Service (USFWS) and NOAA Fisheries (previously called National Marine Fisheries Service) are responsible for implementation of the federal ESA.
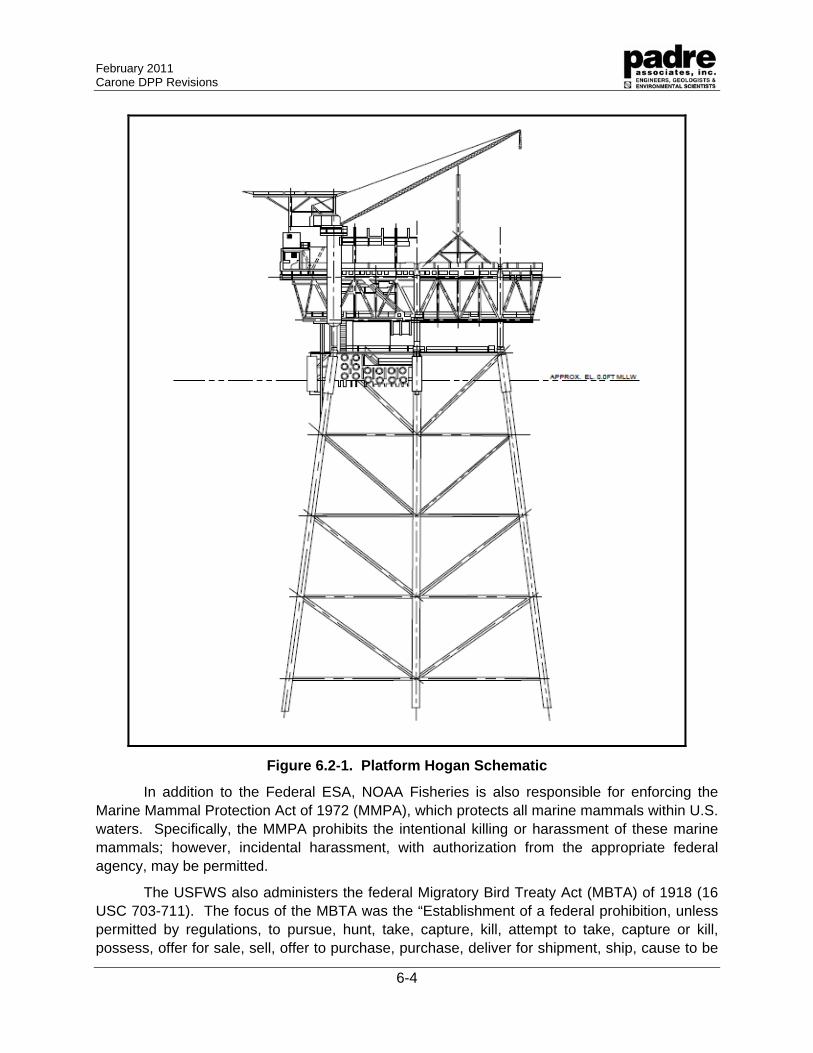
February 2011 Carone DPP Revisions
6-4
Figure 6.2-1. Platform Hogan Schematic
In addition to the Federal ESA, NOAA Fisheries is also responsible for enforcing the Marine Mammal Protection Act of 1972 (MMPA), which protects all marine mammals within U.S. waters. Specifically, the MMPA prohibits the intentional killing or harassment of these marine mammals; however, incidental harassment, with authorization from the appropriate federal agency, may be permitted.
The USFWS also administers the federal Migratory Bird Treaty Act (MBTA) of 1918 (16 USC 703-711). The focus of the MBTA was the “Establishment of a federal prohibition, unless permitted by regulations, to pursue, hunt, take, capture, kill, attempt to take, capture or kill, possess, offer for sale, sell, offer to purchase, purchase, deliver for shipment, ship, cause to be
February 2011 Carone DPP Revisions
6-5
shipped, deliver for transportation, transport, cause to be transported, carry or cause to be carried by any means whatever, receive for shipment, transportation or carriage, or export, at any time, or in any manner, any migratory bird, included in the terms of this Convention for the protection of migratory birds, or any part, nest or egg of any such bird.” (16 USC 703). Implementing regulations at 50 CFR 10 list the migratory birds covered under the MBTA which prevents the removal or harassment of active nests of migratory bird species that may result in the loss of eggs or nestlings
6.4 SPECIAL-STATUS AND PROTECTED MARINE SPECIES
Based on zoogeographic data, 16 federally threatened or endangered species and one candidate species could occur within the Project area or could potentially be affected by Project-related activities. Table 6.4-1 lists those species which comprise two invertebrates, two fish taxa, four marine reptiles (turtles), two birds, and six marine mammals. A description of each of the species is provided below. The potential effects and mitigations that Carone has incorporated into the proposed actions are discussed in Section 6.5, which follows the aforementioned species descriptions.
Table 6.4-1. Special-Status and Protected Species Within or Near the Project Area
Common Name Scientific Name Status
Invertebrates
White abalone Haliotis sorenseni Endangered
Black abalone Haliotis cracherodii Endangered
Fish
Steelhead (southern California ESU) Oncorhynchus mykiss Endangered
Tidewater goby Eucyclogobius newberryi Endangered
Turtles
Pacific olive Ridley turtle Lepidochelys olivacea Endangered/Threatened
Green turtle Chelonia mydas Endangered/Threatened
Loggerhead turtle Caretta caretta Threatened
Leatherback turtle Dermochelys coriacea Endangered
Birds
California least tern Sterna antillarum browni Endangered
Western snowy plover Charadrius alexandrinus nivosus Threatened
Xantus’s murrelet Synthliboramphus hypoleucus Candidate
Marbled murrelet1 Brachyramphus marmoratus Endangered
Short-tailed albatross1 Phoebastria albatrus Endangered
Mammals
Cetaceans (whales, porpoises, and dolphins)
Northern right whale Eubalaena glacialis Endangered
Blue whale Balaenoptera musculus Endangered
Humpback whale Megaptera novaeangliae Endangered
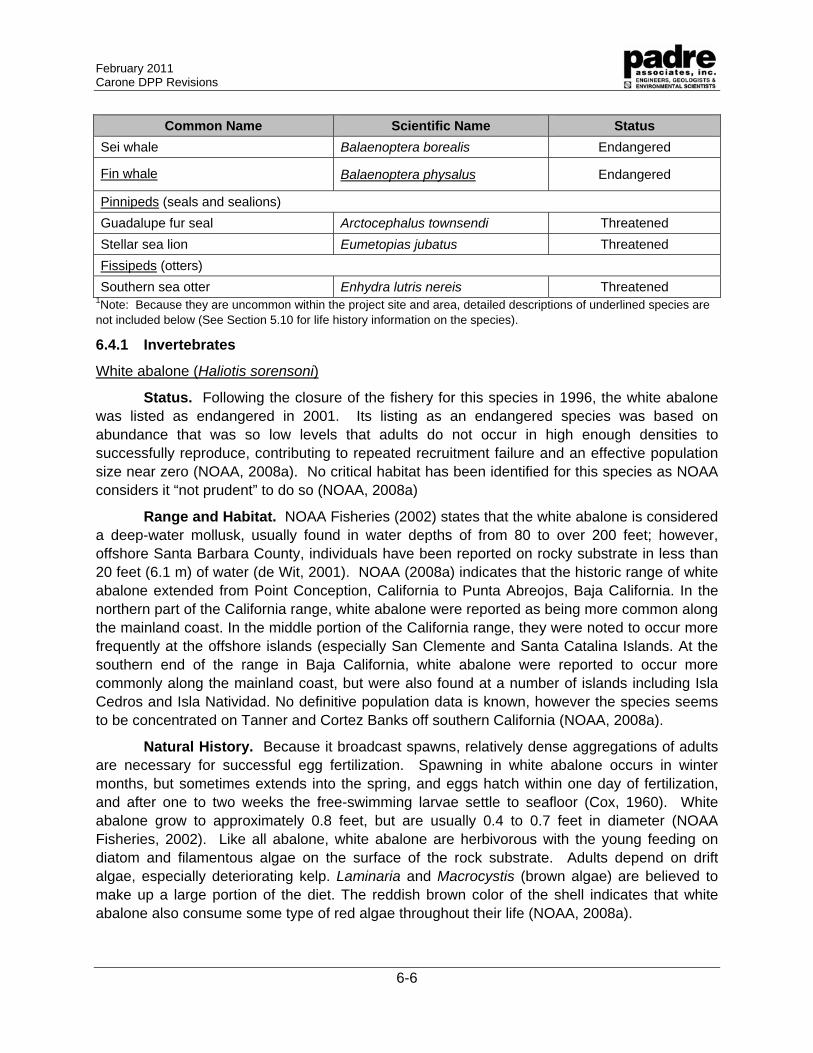
February 2011 Carone DPP Revisions
6-6
Common Name Scientific Name Status
Sei whale Balaenoptera borealis Endangered
Fin whale Balaenoptera physalus Endangered
Pinnipeds (seals and sealions)
Guadalupe fur seal Arctocephalus townsendi Threatened
Stellar sea lion Eumetopias jubatus Threatened
Fissipeds (otters)
Southern sea otter Enhydra lutris nereis Threatened 1Note: Because they are uncommon within the project site and area, detailed descriptions of underlined species are not included below (See Section 5.10 for life history information on the species).
6.4.1 Invertebrates
White abalone (Haliotis sorensoni)
Status. Following the closure of the fishery for this species in 1996, the white abalone was listed as endangered in 2001. Its listing as an endangered species was based on abundance that was so low levels that adults do not occur in high enough densities to successfully reproduce, contributing to repeated recruitment failure and an effective population size near zero (NOAA, 2008a). No critical habitat has been identified for this species as NOAA considers it “not prudent” to do so (NOAA, 2008a)
Range and Habitat. NOAA Fisheries (2002) states that the white abalone is considered a deep-water mollusk, usually found in water depths of from 80 to over 200 feet; however, offshore Santa Barbara County, individuals have been reported on rocky substrate in less than 20 feet (6.1 m) of water (de Wit, 2001). NOAA (2008a) indicates that the historic range of white abalone extended from Point Conception, California to Punta Abreojos, Baja California. In the northern part of the California range, white abalone were reported as being more common along the mainland coast. In the middle portion of the California range, they were noted to occur more frequently at the offshore islands (especially San Clemente and Santa Catalina Islands. At the southern end of the range in Baja California, white abalone were reported to occur more commonly along the mainland coast, but were also found at a number of islands including Isla Cedros and Isla Natividad. No definitive population data is known, however the species seems to be concentrated on Tanner and Cortez Banks off southern California (NOAA, 2008a).
Natural History. Because it broadcast spawns, relatively dense aggregations of adults are necessary for successful egg fertilization. Spawning in white abalone occurs in winter months, but sometimes extends into the spring, and eggs hatch within one day of fertilization, and after one to two weeks the free-swimming larvae settle to seafloor (Cox, 1960). White abalone grow to approximately 0.8 feet, but are usually 0.4 to 0.7 feet in diameter (NOAA Fisheries, 2002). Like all abalone, white abalone are herbivorous with the young feeding on diatom and filamentous algae on the surface of the rock substrate. Adults depend on drift algae, especially deteriorating kelp. Laminaria and Macrocystis (brown algae) are believed to make up a large portion of the diet. The reddish brown color of the shell indicates that white abalone also consume some type of red algae throughout their life (NOAA, 2008a).
February 2011 Carone DPP Revisions
6-7
Black abalone (Haliotis cracherodii)
Status. Following the closure of the fishery for this species in 1993, the black abalone was listed as endangered in 2008. Its listing as an endangered species was based on the results of a disease known as withering disease causing mass mortalities throughout its range (Butler, et al., 2009). Other contributing factors appear to be increased predation particularly in the intertidal habitats. No critical habitat has been identified for this species and according to Butler, et al. (2009) abundances have been steady at northern California sites, while populations are declining at a slow, but not catastrophic rate in northern areas of central California. Severe population declines have been documented at southern central California sites. There is no evidence of recruitment at central California sites.
Range and Habitat. Black abalone occur in rocky intertidal and shallow subtidal habitats (to approximately 20 feet) on exposed outer coasts from approximately Pt. Arena in northern California to Bahia Tortugas and Isla Guadalupe, Mexico (Butler, et al., 2009). They are most common in crevices and on the protected (under) sides of boulders and rocks and are found in rocky habitats along the California mainland and offshore islands (Butler, et al., 2009). The California Department of Fish and Game Office of Spill Prevention and Response Los Angeles/Long Beach Area Contingency Plan notes Javon Canyon, approximately 3 miles southeast of Carpinteria, as a site of possible occurrence in rocky intertidal area near Seacliff.
Natural History. Black abalone have separate sexes and are broadcast spawners. Female black abalone become reproductively mature at a size of about two inches in diameter and males at about 1.6 inches. Larvae are thought to be planktonic for four to10 days before settlement and metamorphosis. Dispersal capability of larvae is limited, and genetic data indicate population structure on a spatial scale consistent with known dispersal characteristics (Butler, et al., 2009). Black abalone reach a maximum size of about 200 mm (maximum diameter of the elliptical shell) but more typically reach sizes in the range of 100-140 mm. Maximum longevity is thought to be 20-30 years. Black abalone are herbivorous and adults primarily feed preferentially on large drifting fragments of marine algae such as kelps. The primary food species are said to be Macrocystis pyrifera and Egregia menziesii in southern California (i.e., south of Pt. Conception) habitats, and Nereocystis leutkeana in central and northern California habitats (Butler, et al., 2009).
6.4.2 Fish
Steelhead (Oncorhynchus mykiss)
Status. The Southern California steelhead Evolutionarily Significant Unit (ESU) was listed as an endangered species in August 1997 (62 FR 43937). As discussed in the final listing determination, this ESU is considered to be at a high risk of extinction based on the results of the NOAA Fisheries’ West Coast Steelhead Status Review (Busby et al., 1996). Its listing was based on dramatic declines in the number of returning spawning individuals in southern California and the degradation, simplification, and fragmentation of available aquatic habitats (NMFS, 2009). The NMFS estimates the southern steelhead population to be less than 1% of its historic population size (Stocker, et al., 2002).
Range and Habitat. The Southern California Steelhead Distinct Population Segment (DPS) encompasses populations in watersheds from the Santa Maria River (just north of Point
February 2011 Carone DPP Revisions
6-8
Conception) south to the Tijuana River at the U.S.-Mexico border. It includes those portions of coastal watersheds that are at least seasonally accessible to the anadromous O. mykiss entering from the ocean or that would be accessible in the absence of manmade passage barriers. A total of 708 miles of stream habitat were designated as critical 11 habitat from the 32 watersheds within the range of this DPS. Critical habitat for the Southern California Steelhead DPS includes most, but not all occupied habitat from the Santa Maria River in southern San Luis Obispo County to San Mateo Creek in northern San Diego County, but excludes some occupied habitat based on economic considerations and all military lands with occupied habitat. Critical habitat was not designated for most of the watersheds south of Malibu Creek with the exception of San Juan Creek and San Mateo Creek (NMFS, 2009). Some possible sites that steelhead may use include Bell Canyon Creek, Goleta Slough, Mission Creek, Sycamore Creek, Carpinteria Creek, Ventura River, Santa Clara River Estuary, and Mugu Lagoon.
Natural History. Adult steelhead spawn in coastal watersheds and their progeny rear in freshwater or estuarine habitats prior to migrating to the sea. They require cool clear water and gravel where the eggs mature in three weeks to two months; the alevins (juvenile steelhead) emerge from the gravel two to six weeks after hatching (NMFS, 2009). Young steelhead remain in fresh water from less than one year to up to three years. Juveniles migrate to sea usually in spring, but throughout their range steelhead are entering the ocean during every month, where they spend one to four years before maturing and returning to their natal stream. Only winter steelhead are found in southern and south-central California. Winter steelhead enter their “home” streams from about November to April and spawning takes place from March to early May. In freshwater, steelhead feed primarily on insects and larvae, while in the ocean their primary food source is “baitfish” such as herring and anchovies.
Tidewater goby (Eucyclogobius newberryi)
Status. The tidewater goby was listed as endangered in 1994 by the U.S. Fish and Wildlife Service and critical habitat for the species was listed in November 2000 (U.S. Fish and Wildlife Service, 2005). Principal threats to the tidewater goby include loss and modification of habitat, water diversions, predatory and competitive introduced fish species, habitat channelization, and degraded water quality (U.S. Fish and Wildlife Service, 2005). Revisions to the critical habitat for this species were developed in 2008 (Federal Register, 2008) which identified the Santa Maria River, Cañada de las Agujas, Cañada de Santa Anita, Cañada de Alegria, Cañada de Agua Caliente, Gaviota Creek, Winchester/Bell Canyon, Arroyo Burro, and Mission Creek-Laguna Channel as Santa Barbara County critical habitats for the tidewater goby.
Range and Habitat. According to U.S. Fish and Wildlife Service, 2005 the tidewater goby inhabits coastal brackish water habitats entirely within California, ranging from Tillas Slough (mouth of the Smith River, Del Norte County) near the Oregon border south to Agua Hedionda Lagoon (northern San Diego County). The tidewater goby is known to have formerly inhabited at least 134 localities. Presently 23 (17 percent) of the 134 documented localities are considered extirpated and 55 to 70 (41 to 52 percent) of the localities are naturally so small or have been degraded over time that long-term persistence is uncertain. The species is typically found in water less than 3.5 feet deep and salinities of less than 12 parts per thousand. Still water habitats that support submerged and emergent aquatic vegetation such as Potamogeton
February 2011 Carone DPP Revisions
6-9
pectinatus and Ruppia maritime provide protection from predators. Several coastal lagoons and stream mouths in Ventura and Santa Barbara County have or currently support tidewater goby populations, although numbers vary by season and annually.
Natural History. Demorest (n.d.) indicates that tidewater gobies prefer sandy areas for breeding, but they can be found on rocky, mud, and silt areas as well. Reproduction occurs year-round, but the gobies spawn more around spring and late summer. Most of the spawning occurs in late April through early May, when male gobies dig a vertical nesting burrow four to eight inches deep in ground. Female tidewater gobies lay 300 to 500 eggs, which stick to the walls of the burrow until hatching. Male gobies remain in or near the burrows for approximately nine to 11 days to guard the eggs until they hatch. All life stages of tidewater gobies are found at the upper end of lagoons in salinities less than 10 parts per thousand. They live in groups ranging in population from a few fish to several hundred individuals, and are mostly found in shallow water less than three feet deep. The primary food sources are small invertebrates, including plankton.
6.4.3 Turtles
Pacific olive Ridley turtle (Lepidochelys olivacea)
Status. In 1978, the breeding populations of the Pacific Ridley or olive turtle on the Pacific coast of Mexico are listed as federally endangered, while all other populations are listed as federally threatened. The most recent minimum population estimates for Pacific Ridley sea turtle indicate that at least 350,000 individuals and this population is believed to increasing (NOAA, 1999).
Range and Habitat. This species is considered to be the most common of the marine turtles and is distributed circumglobally. Within the eastern Pacific, the normal range of Pacific Ridley sea turtles is primarily from Baja California to Peru (Channel Islands National Marine Sanctuary, 2000; MFS Globenet Corp/WorldCom Network Services, 2000). However, they have been reported as far north as Washington, Oregon, and are a rare visitor to the California coast (MFS Globenet Corp/WorldCom Network Services, 2000).
Natural History. According to NOAA Fisheries website (a) the olive Ridley has one of the most extraordinary nesting habits in the natural world. Large groups of turtles gather off shore of nesting beaches. Then vast numbers of turtles come ashore and nest in what is known as an "arribada". During these arribadas, hundreds to thousands of females come ashore to lay their eggs. At many nesting beaches, the nesting density is so high that previously laid egg clutches are dug up by other females excavating the nest to lay their own eggs. Major nesting beaches are located on the Pacific coasts of Mexico and Costa Rica (MFS Globenet Corp/WorldCom Network Services, 2000). The Pacific Ridley sea turtle is omnivorous, feeding on fish, crabs, shellfish, jellyfish, sea grasses and algae (Channel Islands National Marine Sanctuary, 2000; MFS Globenet Corp/WorldCom Network Services, 2000), and may dive to depths of up to 980 feet (MFS Globenet Corp/WorldCom Network Services, 2000).
Green turtle (Chelonia mydas)
Status. Similar to the olive Ridley turtle, the breeding population of the green turtle off Florida and along the Pacific coast of Mexico were listed as federally endangered in 1978. Populations in other areas were listed as federally threatened in that same year. The most
February 2011 Carone DPP Revisions
6-10
recent minimum population estimates for green sea turtles indicate that at least 1,000 individuals are known to occur, and this population is believed to be increasing (NOAA, 1999).
Range and Habitat. Green sea turtles generally occur worldwide in waters with temperatures above 20° C (MFS Globenet Corp/WorldCom Network Services, 2000). Green sea turtles have been reported as far north as Redwood Creek in Humboldt County and off the coasts of Washington, Oregon, and British Columbia (Channel Islands National Marine Sanctuary, 2000; MFS Globenet Corp/WorldCom Network Services, 2000). Green sea turtles are sighted year-round in marine waters off the southern California coast, with the highest concentrations occurring during July through September.
Natural History. NOAA Fisheries’ website (b) states that the green turtle is the largest of the hard-shelled turtles and that the adults are herbivorous feeding on sea grasses and algae. The two largest nesting populations are found at Tortuguero, on the Caribbean coast of Costa Rica, and Raine Island, on the Great Barrier Reef in Australia, where an annual average of 22,500 and 18,000 females nest per season, respectively. In the U.S., green turtles nest primarily along the central and southeast coast of Florida; present estimates range from 200-1,100 females nesting annually.
Loggerhead turtle (Caretta caretta)
Status. The loggerhead turtle was listed as federally threatened throughout its range in 1978. The most recent reviews show that only two loggerhead nesting beaches have greater than 10,000 females nesting per year: South Florida (U.S.) and Masirah Island (Oman). The status of the Oman nesting colony has not been evaluated recently. Total estimated nesting in the U.S. is approximately 68,000 to 90,000 nests per year; those areas are in Florida, North and South Carolina, and Georgia (NOAA Fisheries’ website [c]).
Range and Habitat. NOAA Fisheries (2009) states that the loggerhead occurs throughout the temperate and tropical regions of the Atlantic, Pacific, and Indian Oceans. However, the majority of loggerhead nesting is at the western rims of the Atlantic and Indian Oceans. Loggerheads can be found throughout tropical to temperate waters in the Pacific; however, their breeding grounds include a restricted number of sites in the North Pacific and South Pacific. Southern California is considered to be the northern limit of loggerhead sea turtle distribution (MFS Globenet Corp/WorldCom Network Services, 2000). However, loggerhead sea turtles have stranded on beaches as far north as Washington and Oregon (Channel Islands National Marine Sanctuary, 2000; MFS Globenet Corp/WorldCom Network Services, 2000). Loggerhead sea turtle abundance in southern California waters is higher in the winter during warm years than cold years. However, during the summer months (July through September), abundance is similar in warm and cold years.
Natural History. Loggerheads nest on ocean beaches and occasionally on estuarine shorelines. Although specific characteristics vary between rookeries, loggerhead nesting beaches tend to be wide, sandy beaches backed by low dunes and fronted by a flat, sandy approach from the water (NOAA, 2009). Nests are typically laid between the high tide line and the dune front. Loggerhead sea turtles are omnivorous and feed on a wide variety of marine life including shellfish, jellyfish, squid, sea urchins, fish, and algae (MFS Globenet Corp/WorldCom Network Services; Channel Islands National Marine Sanctuary).
February 2011 Carone DPP Revisions
6-11
Leatherback turtle (Dermochelys coriacea)
Status. The leatherback turtle was listed as federally endangered in 1970. NOAA Fisheries’ website (d) indicates that the Pacific Ocean leatherback population is generally smaller in size than that in the Atlantic Ocean. While some Caribbean nesting populations appear to be increasing, these populations are very small when compared to those that nested in the Pacific less than 10 years ago. Nesting trends on U.S. beaches have been increasing in recent years.
Range and Habitat. Leatherback sea turtles are the most common sea turtle off the west coast of the U.S. (Channel Islands National Marine Sanctuary, 2000). Leatherback sea turtles have been sighted as far north as Alaska and as far south as Chile (Channel Islands National Marine Sanctuary, 2000; MFS Globenet Corp/WorldCom Network Services, 2000). Their extensive latitudinal range is due to their ability to maintain warmer body temperatures in colder waters (MFS Globenet Corp/WorldCom Network Services, 2000). Off the U.S. west coast, including the southern California marine waters, leatherback turtles are most abundant from July to September and in years when water temperatures are above normal (MFS Globenet Corp/WorldCom Network Services, 2000).
Natural History. NOAA Fisheries’ website (d) indicates that the leatherback is the largest turtle and the largest living reptile in the world. Mature males and females can be as long as 6.5 feet and weigh almost 2000 lbs. Leatherback sea turtles are omnivores, but feed principally on soft prey items such as jellyfish and planktonic chordates (e.g., salps) (Channel Islands National Marine Sanctuary, 2000; MFS Globenet Corp/WorldCom Network Services, 2000). Leatherback turtle nesting grounds are located around the world, with the largest remaining nesting assemblages found on the coasts of northern South America and west Africa (NOAA Fisheries’ website [d]). No nesting occurs within U.S. beaches (MFS Globenet Corp/WorldCom Network Services, 2000).
6.4.4 Birds
California least tern (Sterna antillarum browni)
Status. The California least tern was listed as federally endangered species in 1970. No critical habitat has been identified for the California least tern.
Range and Habitat. California least terns live along the coast from San Francisco to northern Baja California and migrate from the southern portion of their range to the north. Least terns begin arriving in southern California as early as March and depart following the fledging of the young in September or October (U.S. Fish and Wildlife Service, 2006). Least terns have been historically documented by Keane, 1998) to breed around the Coal Oil Pt. area of Santa Barbara, as well as on sandy habitats near the mouth of the Santa Clara River, near McGrath Lake, and Hollywood Beach (near Channel Islands Harbor).
Natural History. This species nests in colonies and utilize the upper portions of open beaches or inshore flat sandy areas that are free of vegetation. The typical colony size is 25 pair. Most least terns begin breeding in their third year, and mating begins in April or May. The nest consists of a simple scrape in the sand or shell fragments and typically there are two eggs in a clutch; egg incubation and care for the young are accomplished by both parents. Least terns can renest up to two times if eggs or chicks are lost early in the breeding season. Least
February 2011 Carone DPP Revisions
6-12
terns dive to capture small fish and require clear water to locate their prey (i.e. anchovies) that are found in the upper water column in the nearshore ocean waters.
Western snowy plover (Charadrius alexandrinus nivosus)
Status. The western snowy plover, which is one of 12 subspecies of the snowy plover, was listed as federally threatened in 1973 and the Pacific coast population of this species, which includes all nesting birds on the mainland coast, peninsulas, offshore islands, adjacent bays, estuaries, and coastal rivers, was separately listed as federally threatened in 1993. Critical habitat was designated in 1999 and includes Devereaux Beach in Santa Barbara County, and beaches within the Oxnard lowlands, which include those beaches between Mandalay and the Santa Clara River mouth, Ormond Beach, and south Mugu Lagoon in Ventura County.
Range and Habitat. The current known breeding range of this population extends from Damon Point, Washington, to Bahia Magdelena, Baja California, Mexico (U.S. Fish and Wildlife Service, 1999). Snowy plovers that nest at inland sites are not considered part of the Pacific coast population, although they may migrate to coastal areas during winter months. Sand spits, dune-backed beaches, beaches at creek and river mouths, and salt pans at lagoons and estuaries are the preferred habitats for nesting.
Natural History. The Pacific coast population of the western snowy plover breeds primarily on coastal beaches from southern Washington to southern Baja California, Mexico (U.S. Fish and Wildlife Service, 1999). The breeding season for western snowy plovers extends from early March to late September, with birds at more southerly locations beginning to nest earlier in the season than birds at more northerly locations. Females typically desert the brood shortly after hatching, leaving the chick rearing duties to the male. Females may renest if another male is available and if time remains in the season to do so. Snowy plover chicks are precocial, leaving the nest within hours after hatching to search for food. Males attend the young until they fledge, which takes about a month. Adult plovers do not feed their chicks, rather they lead them to suitable feeding areas.
Xantus’s Murrelet (Synthliboramphus hypoleucus)
Status. The Xantus’s murrelet is currently a candidate for Federal listing and is listed as California State Threatened in 2004.
Range and Habitat. The historical and current breeding range of Xantus’s murrelets is from the Channel Islands in southern California to islands off the west coast of Baja California, Mexico (USFWS, 2009). Known nesting islands in southern California included San Miguel, Santa Cruz, Anacapa, Santa Barbara, San Clemente, and Santa Catalina Islands, collectively known as the Channel Islands.
Natural History. Xantus’s murrelets spend the majority of their lives at sea, only coming to land to nest. They begin arriving within the vicinity of nesting colonies in December and January (USFWS, 2009). They likely begin breeding at 2 to 4 years of age, and usually nest at the same site each year with the same mate. They begin visiting nest sites up to 2 months before egg-laying, but typically 2 to 3 weeks prior (USFWS, 2009). Nesting within the population is asynchronous, spanning a period of up to 4 months (March-June), and peak time of egg laying varies from year to year (USFWS, 2009). Xantus’s murrelets swim underwater to capture prey, using their wings to propel themselves forward in a technique known as pursuit diving.
February 2011 Carone DPP Revisions
6-13
They feed offshore in small, dispersed groups, usually in singles and pairs, but occasionally in groups of up to eight. They feed on small schooling fish and zooplankton, and may forage at oceanfronts where prey is concentrated near the surface of the water (USFWS, 2009). During the breeding season, the distance that they travel from nesting colonies to obtain prey is highly variable and probably dependent upon the availability and location of prey patches (USFWS, 2009). For example, murrelets from Santa Barbara Island foraged far from the island in 1996 (mean = 62 km {38 statute miles]) and 1997 (mean = 111 km [69 statute miles]), whereas murrelets from Anacapa Island in 2002 and 2003 usually foraged within 20 km of the island (USFWS, 2009)
6.4.5 Marine Mammals
Cetaceans (whales and dolphins)
Northern right whale (Eubalaena glacialis)
Status. The northern right whale was listed as federally endangered in 1970 and since that time, critical habitat, encompassing a total of approximately 36,750 square nm within the Gulf of Alaska and the Bering Sea, was designated in 2006. In April 2008, because the North Pacific right whale was listed as a separate, endangered species (the "northern right whale"), and because this was a newly listed entity, NMFS was required to designate critical habitat for the "North Pacific right whale" which is the same area for the northern right whale discussed above.
Range and Habitat. North Pacific right whales inhabit the Pacific Ocean, particularly between 20° and 60° latitude. Before commercial whalers heavily exploited right whales in the North Pacific, concentrations were found in the Gulf of Alaska, eastern Aleutian Islands, south central Bering Sea, Sea of Okhotsk, and Sea of Japan. Like other baleen whales, right whales appear to migrate from high-latitude feeding grounds toward more temperate waters in the fall and winter, although the location of seasonal migration routes is unknown (Scarff, 1986). Reeves and Brownell (1982) concluded that the usual wintering ground of northern right whales extended from northern California to Washington, although sightings have been recorded as far south as Baja California and near the Hawaiian Islands (Scarff, 1986; NMFS, 1991b; Gendron et al., 1999). Since 1955, only five sightings of right whales have been recorded in waters off southern California, all these sightings were of individuals and were recorded between February and May (Scarff, 1991; Carretta et al., 1994).
Natural History. Females give birth to their first calf at an average age of 9-10 years. Gestation lasts approximately 1 year. Calves are usually weaned toward the end of their first year. This species feeds from spring to fall, and also in winter in certain areas. The primary food sources are zooplankton, including copepods, euphausiids, and cyprids. Unlike other baleen whales, right whales are skimmers: they feed by removing prey from the water using baleen while moving with their mouth open through a patch of zooplankton (NOAA Fisheries website [e]).
Blue whale (Balaenoptera musculus)
Status. The blue whale was listed as federally endangered throughout its range in 1970. Blue whale abundance in the eastern Pacific is about 1,700. In the North Pacific, pre-exploitation population size is estimated as approximately 4,900 blue whales, whereas the
February 2011 Carone DPP Revisions
6-14
current population estimate is a minimum of 3,300 blue whales. Along the California coast blue whale abundance has been increasing during the past two decades (NOAA website [f]). A primary threat to blue whales is mortality and serious injury caused by ship strikes. In the eastern North Pacific, ship strikes were implicated in the deaths of blues whales in 1980, 1986, 1987, 1993 and 2002. The average number of blue whale mortalities in California attributed to ship strikes was 0.2 per year from 1991-1995 and from 1998-2002. In September 2007, three blue whale mortalities were confirmed to be caused by ship strikes in the Santa Barbara Channel off Southern California.
Range and Habitat. Blue whales inhabit sub-polar to sub-tropical latitudes. Poleward movements in spring allow the whales to take advantage of high zooplankton production in summer (NOAA website [f]). This species is most common in the summer months off southern California and particularly within the Santa Barbara Channel where it tends to concentrate near areas of upwelling particularly off the northern Channel Islands.
Natural History. The best available science suggests the gestation period is approximately 10-12 months and that blue whale calves are nursed for about 6-7 months. Most reproductive activity, including births and mating, takes place during the winter (NOAA website [f]). Blue whales are baleen whales and feed primarily on euphausid shrimp (krill). In the North Pacific, blue whales prey mainly on Euphausia pacifica and secondarily on Thysanoëssa spinifera. While other prey species, including fish and copepods, have been mentioned in the scientific literature, these are not likely to contribute significantly to the diet of blue whales.
Humpback whale (Megaptera novaeangliae)
Status. Following the prohibition of commercial whaling on this species in 1966, the humpback whale was listed as federally endangered 1970 (NOAA website [g]). While estimating humpback whale abundance is inherently difficult, the best estimates for minimum population in the marine waters off California/Oregon/Washington is about 1,250 (NOAA website [g]).
Range and Habitat. During migration, humpbacks stay near the surface of the ocean. While feeding and calving, humpbacks prefer shallow waters. During calving, humpbacks are usually found in the warmest waters available at that latitude. Calving grounds are commonly near offshore reef systems, islands, or continental shores. Humpback feeding grounds are in cold, productive coastal waters. Humpback whales tend to occur throughout the western two-thirds of the Santa Barbara Channel and, to a lesser extent, in the Santa Maria Basin. As was the case for blue whales, there appears to be a tendency for humpbacks to concentrate along the shelf break north of the Channel Islands.
Natural History. In the North Pacific, there are at least three separate populations, which include the California/Oregon/Washington stock, which winters in coastal Central America and Mexico and migrates to areas ranging from the coast of California to southern British Columbia in summer/fall. In the summer, humpbacks are found in high latitude feeding grounds such as the Gulf of Maine in the Atlantic and Gulf of Alaska in the Pacific. In the winter, they migrate to calving grounds in subtropical or tropical waters such as the Dominican Republic in the Atlantic and the Hawaiian Islands in the Pacific.
Sei whale (Balaenoptera borealis)
February 2011 Carone DPP Revisions
6-15
Status. The sei whale was listed as federally endangered species in 1970; no critical habitat has been identified for this species to date (NOAA website [h]).
Range and Habitat. Sei whales have a cosmopolitan distribution and occur in subtropical, temperate, and sub polar waters around the world. They prefer temperate waters in the mid-latitudes, and can be found in the Atlantic, Indian, and Pacific Oceans. This species prefers subtropical to sub polar waters on the continental shelf edge and slope worldwide. They are usually observed in deeper waters of oceanic areas far from the coastline (NOAA website [h]). In the eastern North Pacific, sei whales migrate northward from wintering grounds in temperate and subtropical waters to feeding grounds that extend from west of the California Channel Islands as far north as the Gulf of Alaska and the Aleutians in the summer
Natural History. Sei whales become sexually mature at between six and 12 years of age when they reach about 45 feet in length, and generally mate and give birth during the winter in lower latitudes. Females breed every two or three years, with a gestation period of from 11 to 13 months. Sei whales are capable of diving up to 20 minutes to opportunistically feed on plankton (e.g., copepods and krill), small schooling fish, and cephalopods (e.g., squid) by both gulping and skimming. They prefer to feed at dawn and may exhibit unpredictable behavior while foraging and feeding on prey. This species is now rare in California waters, and although there is no current estimate for the population off California, it is believed to be very low, in the tens to several hundreds (Reeves et al., 1998).
Fin whale (Balaenoptera physalus)
Status. The fin whale was listed as federally endangered species in 1973; no critical habitat has been identified for this species to date (NOAA website [i]).
Range and Habitat. In the Southern California Bight, summer distribution is generally offshore and south of the northern Channel Island chain, particularly over the Santa Rosa-San Nicolas Ridge. Acoustic signals from fin whale are detected year-round off northern California, Oregon and Washington, with a concentration of vocal activity between September and February (Moore et al. 1998 [cited in NOAA, 2008b]). The most recent population data indicate approximately 3,200 individuals within 300 nautical miles of the shoreline of California, Oregon, and Washington (NOAA, 2008b).
Natural History. Little is known about the social and mating systems of fin whales. Males become sexually mature at 6-10 years of age; females at 7-12 years of age. Physical maturity is attained at approximately 25 years for both sexes. And usually mate and give birth in tropical and subtropical areas during midwinter. Fin whales are the second-largest species of whale, with a maximum length of about 75 feet (22 m) in the Northern Hemisphere, and 85 feet (26 m) in the Southern Hemisphere. Fin whales feed on euphasid shrimp, copepods, and small fish (NOAA, 2006). Although there is no indication of recent population trends, the California coastal waters stock did increase in the 1980s and 1990s (NOAA, 2008b).
Pinnipeds (seals and sea lions)
Guadalupe fur seal (Arctocephalus townsendi)
Status. The Guadalupe fur seal was listed as federally threatened in 1985. The population is apparently increasing annually (Carretta, et al., 2008). No conservation plan has
February 2011 Carone DPP Revisions
6-16
been prepared nor has critical habitat been identified for this species (U.S. Fish and Wildlife website [a]).
Range and Habitat. Prior to the harvest it ranged from Monterey Bay, California, to the Revillagigedo Islands, Mexico (Carretta, et al., 2008). Guadalupe fur seals pup and breed mainly at Isla Guadalupe, Mexico. In 1997, a second rookery was discovered at Isla Benito del Este, Baja California and a pup was born at San Miguel Island, California (Carretta, et al., 2008).
Natural History. Although population censuses have been conducted irregularly since the 1950s, little is known about the biology of this species. Guadalupe fur seals breed during the summer (Peterson et al., 1968). Limited analysis of scats and stomach contents indicates that they feed on pelagic squid and schooling fishes such as mackerel and sardine (Hanni et al., 1993; Gallo, 1994).
Steller sea lion (Eumetopias jubatus)
Status. The Steller sea lion was listed as federally threatened in 1990; in 1997, the population west of the 144o W longitude (west of a line near Cape Suckling, AK) was listed as federally endangered (U.S. Fish and Wildlife Service, 1997). Critical habitat identified for this species includes the major California rookeries at Año Nuevo and the Farallon Islands. The Steller sea lion recovery plan was finalized in 1992.
Range and Habitat. The species’ range extends along the North American coast from the Bering Strait in Alaska to southern California. At least 90 percent of the species' world population is centered in the Gulf of Alaska, the Bering Sea, and the Sea of Okhotsk. Historically, this species was one of the most abundant pinnipeds in the SCB. Numbers have declined precipitously in the last several decades, but the causes of the decline are not well understood (Bartholomew 1967; Le Boeuf and Bonnell 1980). The SCB is at the southern extreme of the historical breeding range of the species and presently, 96 percent of the world population is found in Alaska or Siberian waters (Loughlin et al., 1980). A few adult or sub adult males occasionally may occupy territories on relict rookeries at the west end of San Miguel Island and adjacent rocks in the summer months, but the last reported pups on San Miguel Island were seen in the summer of 1980 (Bonnell and Dailey, 1993; DeLong and Melin, 2000).
Natural History. Adult males begin arriving on the rookeries first, in mid-May, and establish territories. Pregnant females arrive in late May and give birth to a single pup. Females and pups begin leaving the rookeries in September and pups typically remain with their mother through the first year. Steller sea lions are known to feed on a variety of nearshore, sub littoral prey in estuarine and marine waters. Jones (1981) reported that Steller sea lions feed mainly on bottom-dwelling fishes, and that all the prey items normally eaten by this species inhabit waters less than about 600 feet deep.
Fissipeds (otters)
Southern sea otter (Enhydra lutris nereis).
Status. The southern sea otter was listed as federally threatened in 1977; no recovery plan or critical habitat have been yet completed or identified.
February 2011 Carone DPP Revisions
6-17
Range and Habitat. Historically the range of sea otters extended from the northern islands of the Japanese Archipelago northeast along Alaska and southward along North America to Baja California. Ranging from San Mateo County in the north to Santa Barbara County in the south, southern sea otters live in the nearshore waters along the mainland coastline of California. A small population of sea otters lives at San Nicolas Island as a result of translocation efforts initiated in 1987 (U.S. Fish and Wildlife Service website [b]).
Natural History. Information provided on U.S. Fish and Wildlife Service website (b) indicates that southern sea otters are among the smallest of marine mammals and may live for 20 years in the wild. This species prefers rocky shoreline with water depth less than 50 feet, where they feed on a variety of benthic (bottom-dwelling) invertebrates, including sea urchins, abalone, crabs, clams, marine snails, marine worms, sea stars, sand dollars, and squid and octopus. Individual animals tend to specialize on a subset of the overall population diet. Most adult female sea otters give birth to one pup each year. Birth peaks occur in the spring and fall, but pups may be born at any time of year. Male sea otters typically aggregate at the northern and southern limits of the range in winter and early spring, when some males that have maintained breeding territories in the predominantly female center of the range abandon their territories and join other males at its ends.
6.5 POTENTIAL IMPACTS AND MITIGATION MEASURES
6.5.1 Endangered Species Act
This Biological Assessment provides sufficient information for the Federal lead agencies, NOAA Fisheries and the USFWS, to determine the potential to affect threatened or endangered species, based on one of three possible findings for each species potentially affected:
No effect: the proposed action will not affect the listed species or critical habitat;
Not likely to adversely affect: effects of the listed species are expected to be discountable (extremely unlikely to occur), insignificant (minimal impact without take), or beneficial; and
Likely to adversely affect: adverse effect may occur as a direct or indirect result of the proposed action, and the effect is not discountable, insignificant or beneficial.
No structural changes to the submerged portion of the platform are proposed, thus no additional impacts will be created for species listed under the Endangered Species Act. The changes made to the above water portion of the Project will be contained within the existing platform; therefore, no habitat for marine wildlife will be affected. Potential impacts are described below and mitigation measures instituted during the proposed activities are expected to result in the proposed actions to not likely to adversely affect the listed species.
6.5.2 Noise Impacts
Noise-related effects would be expected to be potentially significant to marine mammals, particularly cetaceans, if Project-related in-water noise exceeds guidelines accepted by federal resource agencies as harmful, although not regulated by law. NOAA Fisheries has established guidelines for noise levels that could affect marine mammals which are based on studies that have shown behavioral changes in marine mammals occur when an impulse sound pressure level (SPL) of 160 dB re 1Pa rms, mitigation is usually required within an area within which
February 2011 Carone DPP Revisions
6-18
SPLs between of180 dB and 190 dB (both re 1Pa rms) are predicted. The 180 dB level is generally applicable within areas where cetaceans (whales and dolphins) are present, and the 190 dB distance applies to areas supporting otarids and pinnipeds (seals and sea lions). Available scientific evidence suggests that harassment of these marine mammals could occur from SPLs at or above these levels and mitigations are developed on a case-by-case basis through consultation with the NOAA Fisheries office within the region.
Underwater noise levels associated with Project construction are not expected to exceed the 160 and 180 dB Level A take limits. Primary Project-related underwater noise sources are expected to be from platform operations. According to Malme and LGL (2001), the normal underwater noise level output from oil platform production is approximately 140 dB, which does not exceed Level A take limits. During drilling operations, in-water noise levels are expected to be below those limits and are not expected to result in a “take” of marine mammals. With the proposed operation, no noise increases above the current noise levels are expected.
Data presented in Entrix (2004), which cites various published sources, indicate that underwater noise levels generated by tugs and supply boats range from 147 to 156 dB at 33 feet (10 m) from the source; those levels decrease to 107 to 116 dB within 0.6 mile (one kilometer). There will be no additional crew boats and up to one additional workboat arriving and departing from the platform per week.
Based on the noise levels expected from the proposed Project: 1) the current noise levels at the operating platform do not appear to be producing significant negative effects to marine wildlife that occur in the vicinity of the operations; and 2) noise generated by the additional vessel is not expected to result in significant effects to the marine wildlife at and around the platform. Therefore noise-related impacts are not likely to affect marine wildlife within the Project area.
6.5.3 Oil Spill Potential
The unintentional release of petroleum into the marine environment from proposed drilling and production operations could result in potentially significant impacts to the marine biota, particularly avifauna and early life stage forms of fish and invertebrates, which are sensitive to those chemicals. Refined products (i.e., diesel, gasoline.) are more toxic than heavier crude or Bunker-type products, and the loss of a substantial amount of fuel or lubricating oil during construction operations could affect the water column, seafloor, and intertidal habitats and associated biota, resulting in their mortality or substantial injury, and in alteration of the existing habitat quality. The release of petroleum into the marine environment is considered a potentially significant impact.
Although many marine organisms have created adaptive strategies to survive in their environment, when these marine organisms are introduced to oil it adversely affects them either physiologically and/or chemically. For example, physiological effects from oil spills on marine life could include the contamination of protective layers of fur or feather, loss of buoyancy, and loss of locomotive capabilities. Direct lethal toxicity or sub-lethal irritation and temporary alteration of the chemical make-up of the ecosystem are examples of chemical effects of oil within marine wildlife. Oil spills have many variables to consider when dealing with the impact of the spill including: oil type, season of occurrence, animal behavior, oceanographic and meteorological conditions, and the cleanup methods employed (MMS, 1983a).
February 2011 Carone DPP Revisions
6-19
The possible effects of oil on marine wildlife has been studied and discussed by federal and state agencies such as the National Oceanic and Atmospheric Administration (NOAA) and the California Department of Fish and Game (CDFG). In 1995, the Office of Oil Spill Prevention and Response (OSPR) organized California’s existing oiled wildlife centers into the Oiled Wildlife Care Network (OWCN). OSPR is an office within the Department of Fish and Game charged with oil spill prevention and response. The office directs spill response, cleanup, and natural resource damage assessment activities (SBWCN, 2010). The research and experiments conducted by these agencies is a cumulative ongoing effort to better understand what potential effects an oil spill of any magnitude will or may have on special status and protected species that includes invertebrates, fish, turtles, marine birds, cetaceans, pinnipeds, and fissipeds. The following text summarizes the potential impacts from exposure to oil spills.
Marine Invertebrates. Oil spill impacts on sensitive marine invertebrates including the white and black abalone would likely result from direct contact, ingestion of contaminated water and food (algae) and secondary impacts associated with response operations. The mainland portion of the project is unlikely to support significant populations of these species however; the Channel Islands are an area with previously documented occurrences. In the event of a spill related to the proposed project activities, the oil would undergo considerable weathering before reaching the Channel Islands. Invertebrates would therefore be limited to exposure to highly weathered tar balls, which have limited toxicity. Therefore no adverse impacts would occur to sensitive invertebrates as a result of the proposed project activities.
Fish Resources. The effects of oil on fish have been well documented both in the field and within a laboratory. This research shows that fish that are unable to avoid hydrocarbons with take them up from food, sediments and surrounding waters. Once these hydrocarbons are in the organism’s tissues they will affect the life span through a variety of behavioral, physiological, or biochemical changes. Also, exposure to oil will affect a species’ ability to search, find and capture food, which will affect its nutritional requirements. Early development life stages such as larvae will be especially impacted by this (Jarvela et al., 1984). Small amount of oil can impact fish embryos by causing physical deformities, damage to genetic material and mortality (Carls, 1999). Fish species experience the highest mortalities due to oil exposure when they are eggs or larvae. However, these deaths would not be significant in terms of the species total population in offshore water (Jarvela et al, 1984). Brief encounters with oil with juvenile and adult fish species would be unlike to be fatal. Based on past studies of fish populations following oil spill events in the Santa Barbara and other locations, no long term adverse impacts to fish populations are anticipated as a result of the proposed project.
Sea Turtles. Oil spills are not considered a high cause for morality for sea turtles, although recent reports from the Gulf of Mexico Deepwater Horizon spill indicate a possible increase in strandings of oil impacted turtles. Since sea turtles species have been listed as threatened or endangered under the 1973 U.S. Endangered Species Act there is very little direct experimental evidence about the toxicity of oil to sea turtles. Sea turtles are negatively affected by oil at all life stages: eggs on the beach, post hatchings, young sea turtles in near shore habitats, migrating adults and foraging grounds. Each life stage varies depending on the rate, severity and effects of exposure.
February 2011 Carone DPP Revisions
6-20
Sea turtles are more vulnerable to oil impacts due to the lack of to their biological and behavior characteristics including indiscriminate feeding in convergence zones, long pre-dive inhalations, and lack of avoidance behavior (Milton et al., 2004). The type of diving behavior puts sea turtles at risk because they inhale a large amount of air before diving and will resurface over time. During an oil spill this would expose sea turtles to long periods of both physical exposure and petroleum vapors, which can be the most harmful during an oil spill.
Marine Birds. Marine birds can be affected by direct contact with oil in three ways: thermal effects due to external oiling of plumage; toxic effects of ingested oil as adults; and effects on eggs, chicks, and reproductive abilities.
The loss of waterproofing is the primary external effect of oil on marine birds. Buoyancy is lost if the oiling is severe. A main issue with oil on marine birds is the damage oil does to the arrangement of feathers, which is responsible of water repellency (Fabricius, 1959). When this happens the water can go through the dense layers of feathers to the skin causing a loss of body heat (Hartung, 1964). To survive the bird must metabolize fat, sugar and eventual skeletal muscle proteins to main body heat. The cause of oiled birds death can be the result from exposure and loss of these energy reserves as it is to the toxic effects of ingested oil (Schultz et al., 1983).
The internal effect of oil on marine birds varies. Anemia can be the result of bleeding from inflamed intestinal walls. Oil passing into the trachea and bronchi could result in the development of pneumonia. A bird’s liver, kidney and pancreatic functions can be disturbed due to internal oil exposure. Ingested oil can inhibit a bird’s mechanism for salt excretion that enables seabirds to obtain fresh water from salt water and could result in dehydration (Holmes and Cronshaw, 1975). Studies have shown that ingested oil may alter egg yolk structure, reduce egg hatchability, and reduce egg-laying rate for seabirds (Grau et al., 1977; Hartung, 1965). When oil contacts the exterior of eggs it could reduce the hatching success (Hartung, 1965; Albers and Szaro, 1978; King and Lefever, 1979; Patten and Patten, 1979; Coon et al., 1979; McGill and Richmond, 1979).
A bird’s vulnerability to an oil spill depends on each individual species’ behavioral and other attributes. The some of the more vulnerable species are alcids and sea ducks due to the large amount of time they spend on the ocean surface, dive when disturbed and they are gregarious. Also, alcids and other birds have low reproductive rates which result in a lengthen population recovery time. Birds’ vulnerability depends on the season as well. For example, colonial seabirds are most vulnerable between early spring through autumn because they are tied to breeding colonies.
Cetaceans. The documentation on the effects on oil with whales, dolphins and porpoises is hard to find due to the difficult reclusive nature and migratory behavior (Australian Maritime Safety Authority, 2010). The impact of direct contact with oil on the animal’s skin varies depending on the species. Cetaceans have no fur, which can be oiled and do not depend on fur for insulation. Therefore, they are not susceptible to the insulation effects such as hypothermia in other mammals. However, external impacts to cetaceans from direct skin contract with oil could include: eye irritation, burns to mucous membranes of eyes and mouth and can increase vulnerability to infection (Office of Protected Resources - NOAA Fisheries, 2010).
February 2011 Carone DPP Revisions
6-21
Baleen whales (e.g. Pacific right whale) skim the surface of water for feeding and are particularly vulnerable to ingesting oil and baleen fouling. Adult cetacean would most likely not suffer from oil fouling of their blowholes because they spout before inhalation and therefore clearing the blowhole. Younger cetaceans are more vulnerable to inhale oil. It has been suggested that some pelagic species can detect and avoid contact with oil (Australian Maritime Safety Authority, 2010). This still presents a problem for those animals that must come up to the surface to breathe and to feed (MMS, 1983).
Internal injury is more probably for cetaceans due to oil. Oil inhaled could result in respiratory irritation, inflammation, emphysema, or pneumonia. Ingestion of oil could cause ulcers, bleeding, and disrupt digestive functions. Both inhalation and ingested chemicals could cause damage in the liver, kidney, lead to reproductive failure, death, or result in anemia and immune suppression.
Pinnipeds: Seals and sea lions that come in contact with oil could experience a wide range of adverse impacts including; thermoregulatory problems: disruption of respiratory functions; ingestions of oil as a result of grooming or eating contaminated food; external irritation (eyes); mechanical effects; sensory disruption; abnormal behavioral responses; loss of food and avoidance of contaminated areas.
Guadalupe fur seals and Northern fur seals could experience thermoregulatory problems if they come into contact with oil (Geraci and Smith, 1976). Oil makes hair of a fur seal lose its insulating qualities. Once this happens the animal’s core body temperature may drop and increases its metabolism to prevent hypothermia. This could potentially be fatal to a distressed or diseased animal and highly stressful for a healthy animal (Engelhardt, 1983).
Pinnipeds that use blubber for insulation (California sea lion, harbor seal, northern elephant seal, and Stellar sea lion) do not experience long term effects to exposure to oil (Geraci and St. Aubin, 1982). Newborn harbor seal pups, which rely on a dense fur for insulation, would be subject to similar thermoregulatory problems of the previously discussed fur seal species. (Engelhardt and Ferguson, 1980, Oritsland and Ronald, 1973; and Blix et al., 1979).
When pinnipeds are coated with viscous oil it may cause problems in locomotion and breathing. Pinnipeds that are exposed to heavy coating from oil will experience swimming difficulties, which may lead to exhaustion (Engelhardt, 1983; David and Anderson, 1976) and possible suffocation from breathing orifices that are clogged. The viscosity of the oil is a major factor in determining the effects on pinnipeds. Severe eye irritation is caused by direct contact with oil but non-lethal (Engelhardt, 1983). Skin absorption, inhalation and swallowing of oil while grooming are all possible ways pinnipeds may ingest oil. However, there have not been enough studies done on the long-term effects of chronic exposure to oil on pinnipeds.
Sea Otters. Sea otters, although not expected to be found in the immediate project area, are highly impacted to the adverse impacts of exposure to spilled oil due to the large amount of time spent on the ocean’s surface. Contact with spilled oil could result in reducing or eliminating the layer of air trapped in sea otters fur. Matting their fur could cause hypothermia, elevated metabolism, cessation of feeding, weight loss (Environment Canada, 1982; Engelhardt, 1983; Kooyman et al., 1997; Siniff et al., 1982) because the layer of air in their fur provides both insulation and buoyancy for the sea otters (Davis and Anderson, 1976; Geraci and Smith,
February 2011 Carone DPP Revisions
6-22
1976). Hypothermia could prove to be fatal as the result of contamination of greater than 30 percent of a sea otter’s body (Costa and Kooyman, 1980).
Sea otters are especially vulnerable to oil spills might ingest oil while feeding of oil-contaminated prey, grooming or inhalation. (Bodkin et al. 2002; Ridoux et al. 2004). Ingestion of oil is considered potentially toxic depending on the type and quantity consumed. Oil spills could affect a sea otter’s caloric intake by oil spill-induced mortality of their prey, such as crabs and sea urchins (Cimberg and Costa, 1985).
The current oil spill prevention plan will be used to avoid any release of oil based products into the marine environment and the existing oil spill response and recovery plan will be used to reduce the effects of accidentally discharged petroleum by facilitating rapid response and cleanup operations. The following mitigations have been incorporated into the proposed plan of operation and will result in reducing the chances of a spill occurring:
All vessels will be USCG-inspected and will have the appropriate spill response equipment onboard.
Carone will maintain an approved oil spill response plan and the appropriate spill response equipment on the platform. Response drills will be in accordance with federal and state requirements. Contracts with off-site spill response companies will be in-place and will provide additional containment and clean-up resources as needed.
Pipelines will be maintained and inspected in accordance with BOEMRE regulations.
Petroleum-fueled equipment on the platform will have drip pans or other means of collecting dripped oil, which will be collected and treated with onboard equipment. No petroleum will be allowed to enter the marine waters from the platform.
The drilling rig will be fitted with blowout preventer equipment (BOPE). The blowout equipment will be sized, specified, and tested in accordance with the BOEMRE regulation well control guidelines. The BOPE and choke manifold will be hydrotested with water in accordance with applicable regulations. The BOPE will be tested when installed, before drilling out each string of casing, and once every 14 days. In addition, Carone completes regular ROV and “smart pig” inspections of its pipelines in accordance with BOEMRE requirements. As designed and with existing plans and resources in-place, the effects of an accidental discharge of petroleum could, but are likely to, adversely affect federally listed species.
6.5.4 Platform Fluid (non-Petroleum) Release
Platform Hogan’s existing and proposed discharges are and will be in conformance with General Permit No. CAG 28000 (Authorization to Discharge under the NPDES for Oil and Gas Exploration, Development and Production Facilities). Fluid discharges at the platform include treated sanitary wastes (discharged 130 feet below MLLW). Production water that contains oil is sent to shore for treatment and other treated platform wastewater, including rainwater, is discharge below the water surface at the platform. Drill cuttings and drill fluids will be slurried and re-injected into a dedicated well at the platform following separation at a shale shaker and grinding of the material into micron size.
February 2011 Carone DPP Revisions
6-23
The proposed Project will use an EPA-approved, Cypan polymer mud and bentonite-based fluid. Bentonite may contain elevated concentrations of barium and other metals that could be present as trace impurities in the clay; however, these metals are present in an insoluble form and do not readily dissolve in seawater and are not bio-available (SAIC, 1999). An accidental release of drilling fluid could result in increased turbidity and water quality degradation. If a release of drilling fluid occurs, prevailing wave activity and resulting dispersion at the site is expected to result in short-term, less than significant impacts to the marine biota and habitats. Nevertheless, deposition resulting from large releases of drill fluid over an extended period could result in those fluids being incorporated into the sediment. As such, the unrestricted release of drill fluid could violate one or more water quality standards including reduction of light transmission, creation of a visible sheen or turbidity layer, and impacts to marine organisms are considered potentially significant. The species most likely to be affected by such an event would be the steelhead and abalone. However steelhead would be expected to avoid or move quickly through affected water and the lack of abalone habitat within the vicinity of the platform make their presence unlikely. As designed, and with discharges in accordance with existing permit requirements, fluid releases are not likely to adversely affect federally listed species.
6.5.6 Vessel Collisions
Collisions of Project-related vessels would be expected to most likely affect marine mammals and sea turtles. Such collisions have been documented in Santa Barbara Channel; however, those collisions are typically associated with large ships interactions with slower-moving marine wildlife on the ocean surface rather than smaller work vessels traversing between shore-based support facilities and the offshore platforms. Impacts from vessel operations can range from a change in the animal’s travel route or time on the surface to direct mortality. The most recent incidents within the marine waters off California were five blue whale carcasses attributed to ship strikes in 2007 (Abramson, et al., 2009).
During the proposed drilling, there will be no additional crew boats and up to one additional workboat arriving and departing from the platform per week. This level of activity is not expected to result in a significant increase in the chances of a mammal-vessel collision. On-board personnel will be watchful as the vessel crosses this path or anytime whales are observed in the area. Pinnipeds, the most common marine mammals within the vessel transit corridors are “nimble” enough to avoid these vessels, however slow moving and surface dwelling turtles and larger cetaceans could be affected. Blue and humpback whales are not common within the proposed vessel transit routes and dolphins, similar to the pinnipeds, would be agile enough to avoid vessels. Irrespective, all vessel operators shall observe the following guidelines:
Make every effort to maintain a distance of 500 feet from sighted whales and other marine wildlife (e.g., sea turtles);
Do not cross directly in front of (perpendicular to) migrating whales or any other marine mammal or turtle;
When paralleling whales, vessels will operate at a constant speed that is not faster than that of the whales;
February 2011 Carone DPP Revisions
6-24
Care will be taken to ensure that female whales are not be separated from their calves; and
If a whale engages in evasive or defensive action, vessels will reduce speed or stop until the animal calms or moves out of the area.
If a collision with a marine mammal or turtle occurs, the vessel operator must document the conditions under which the accident occurred, including the following:
location of the vessel when the collision occurred (latitude and longitude);
date and time;
speed and heading of the vessel;
observation conditions (e.g., wind speed and direction, swell height, visibility in miles or kilometers, and presence of rain or fog);
species of marine wildlife contacted;
whether an observer was standing watch for the presence of marine wildlife; and,
name of vessel, operator (the company), and captain or officer in charge of the vessel at time of accident.
Following an unanticipated strike, the vessel will stop, if safe to do so. The vessel is not obligated to stand by and may proceed after confirming that it will not further damage the animal by doing so. The vessel will then communicate by radio or telephone all details to the vessel’s base of operations. From the vessel’s base of operations, a telephone call will be placed to the Stranding Coordinator, NOAA Fisheries, Southwest Region, Long Beach, to obtain instructions (see below).
Alternatively, the vessel captain may contact the NOAA Fisheries’ Stranding Coordinator directly using the marine operator to place the call or directly from an onboard telephone, if available. It is unlikely that the vessel will be asked to stand by until NOAA Fisheries or CDFG personnel arrive, but that will be determined by the Stranding Coordinator. Under the MMPA, the vessel operator is not allowed to aid injured marine wildlife or recover the carcass unless requested to do so by the NOAA Fisheries Stranding Coordinator. The Stranding Coordinator will then coordinate subsequent action, including enlisting the aid of marine mammal rescue organizations, if appropriate.
Although the NOAA Fisheries has primary responsibility for marine mammals in both state and federal waters, the California Department of Fish and Game should also be advised that an incident has occurred in state waters affecting a protected species. Reports should be communicated to the federal and state agencies listed below:
February 2011 Carone DPP Revisions
6-25
Federal
Joe Cordaro, Stranding Coordinator Southwest Region NOAA Fisheries
Long Beach, California 90802-4213 (562) 980-4017
State
Enforcement Dispatch Desk California Department of Fish & Game
Long Beach, California 90802 (562) 590-5132 (562) 590-5133
As proposed and with the existing measures incorporated into the vessel operations, vessel strikes could, but are not likely to affect federally listed marine species.
February 2011 Carone DPP Revisions
6-26
6.6 REFERENCES
Abramson, L., S. Polefka, S. Hastings, and K. Bor, 2009. Reducing the Threat of Ship Strikes on Large Cetaceans in the Santa Barbara Channel Region and Channel Islands National Marine Sanctuary: Recommendations and Case Studies. Technical report prepared for and adopted by the Channel Islands National Marine Sanctuary Advisory Council. September 2009.
Albers, P.H. and Szaro, R.C. 1978. Effects of No. 2 Fuel Oil on Common Eider Eggs. Marine Pollution Bulletin. Vol.9.
Audobon Society Watchlist. 2007. Birds and Science: State of the Birds. Website: http://web1.audubon.org/science/species/watchlist/profile.php?speciesCode=xanmur
Baker, J. R, Jones, A. M, Jones, T. P., and Watson, H.C. 1981. Otter Lutra lutra L. Mortality and Marine Oil Pollution. Biol. Conserv. 20, 311-321.
Bartholomew, G.A., 1967. Seal and sea lion populations of the California Islands. In: R.N. Philbrick (ed.) Proceedings, Symposium on the Biology of the California Islands. Santa Barbara Botanic Garden, Santa Barbara, CA. pp. 229-244.
Blix, A. S., Grav, H. J., and Ronald, K. 1979. Some Aspects of Temperature Regulation in Newborn Harp Seal Pups. Am. J. Physiol., V. 236.
Bodkin, J.L., B.E. Ballachey, T.A. Dean, A.K. Fukuyama, S.C. Jewett, L. McDonald, D.H. Monson, C.E. O’Clair, and G.R. VanBlaricom.2002 Sea Otter Population Status and the Process of Recovery from the 1989 Exxon Valdez Oil Spill. Marine Ecology Progress Series 241: 237-253.
Bonnell, M.L., and M.D. Dailey, 1993. Ecology of the Southern California Bight: A Synthesis and Interpretation. Berkeley, CA: University of California Press.
Bonnell, M.L., R.G. Ford, 1987. California sea lion distribution: A statistical analysis of aerial transect data, J. Wildl. Manage, 51(1):13-20.
Braham, H.W., 1984. The status of endangered whales: An overview. Marine Fisheries Review 46:2-6.
Busby, P.J., T.C. Wainwright, G.J. Bryant, L.J. Lierheimer, R.S. Waples, F.W. Waknitz, and I.V. Lagomarsino, 1996. Status review of west coast steelhead from Washington, Idaho, Oregon, and California. U.S. Department of Commerce, NOAA Tech. Memo. NMFS-NWFSC-27, 261 pp.
Butler, J., A. DeVogelaere, R. Gustafson, C. Mobley, M. Neuman, D. Richards, S. Rumsey, B. Taylor, and G. VanBlaricom, 2009. Status Review Report for Black Abalone (Haliotis cracherodii). Prepared for MNGS Southwest Region, January 2009.
Carls, M.G., S.D. Rice, and J.E. Hose.1999. Sensitivity of fish embryos to weathered crude oil: Part I. low level exposure during incubation causes malformations, genetic damage, and mortality in larval Pacific herring (Clupea pallasi). Environ. Toxicol. Chem. 18: 481-493.
Carretta, J.V., et al., 1994. Right whale sighting off San Clemente Island, California. Marine Mammal Science 10(1):101-105.
February 2011 Carone DPP Revisions
6-27
Carretta, J. V., K. A. Forney, M. S. Lowry, J. Barlow, J. Baker, V. Johnston, B. Hanson, M. M. Muto, D. Lynch, and L. Carswell, 2008. U.S. Pacific Marine Mammal Stock Assessments, 2008. NOAA Technical Memorandum, NMFS. NOAA TM MNFS SWFSC-434
Channel Islands National Marine Sanctuary. 2000. Working Draft Environmental Impact Statement for Channel Islands National Marine Sanctuary.
Cimberg, R. L. and Costa, D. P. 1985. North Aleutian Shelf Sea Otters and Their Vulnerability to Oil. In: Proceedings 1985 Oil Spill Conference (Prevention, Behavior, Control, Cleanup). February 24-28, 1985, Los Angeles, CA. American Petroleum Institute Pub. No. 4385.
Coon, N.C., Albers, P. H., and Szaro, R.C. 1979. No.2 Fuel Oil Decreases Embryonic Survival of Great Black-backed Gulls. Bulletin of Environmental Contamination and Toxicology. Vol. 21.
Costa, D.P. and Kooyman, G. L. 1980. Effects of Oil Contamination in the Sea Otter, Enhydra lutris. Report, Outer Continental Shelf Environmental Assessment Program, NOAA, Alaska.
County of Santa Barbara/Department of Interior, 2003. Mitigated Negative Declaration/Environmental Assessment. ExxonMobil Offshore Power System Repair Project.
Cox, K. W., 1960. Review of the Abalone in California. Reprint from California Dept. of Fish and Game Vol. 46 (4). October 1960
Davis, J. E. and Anderson, S.S. 1976. Effects of Oil Pollution on Breeding Gray Seals. Marine Poullution Bulletin, V. 7 (6).
Demrost, J. no date. Endangered Species Report, Tidewater Goby (Eucyclogobius newberryi) on website: http://www.amphi.com/~crobson/animals/Period05/tidewater_goby_jd.htm
de Wit, L. A., Consultant. 2001. Pre-Installation Marine Biological Survey and Preliminary Impact Assessment. Santa Ynez Unit Power Cable C Replacement Project. September 2001. LAD Job No. 01-09. Prepared for ExxonMobil Co.
Dohl, T.P., R.C. Guess, M.L. Duman, and R.C. Helm, 1983. Cetaceans of central and northern California, 1980-1983: Status, abundance, and distribution, prepared for U.S. Department of the Interior, Minerals Management Service, Pacific OCS Region, OCS Study MMS 84-0045, 284 pp.
Dohl, T.P., K.S. Norris, R.C. Guess, J.D. Bryant, and M.W. Honig, 1981. Cetacea of the Southern California Bight, Part II of Investigators’ reports: In: Summary of marine mammal and seabird surveys of the Southern California Bight Area, 1975-1978, prepared for U.S. Department of the Interior, Bureau of Land Management, Pacific OCS Region, NTIS #PB 81-248-189, 414 pp.
"Effects of Maritime Oil Spills on Wildlife." Australian Maritime Safety Authority. Web. 13 July 2010. http://www.amsa.gov.au/Marine_Environment_Protection/National_Plan/General_Information/Oiled_Wildlife/Oil_Spill_Effects_on_Wildlife_and_Non-Avian_Marine_Life.asp.
February 2011 Carone DPP Revisions
6-28
Engelhart, F.R. 1983. Petroleum Effects on Marine Mammals. Aquatic Toxicology, 4(1983).
Engelhart, F.R. 1981. Oil Production in Polar Bears: Exposure and Clinical Effects. In: Proc. of the 4th Artic Marine Oilspill Program Technical Seminar June 16-18, Edmonton, Alberta.
Engelhart, F.R. 1978. Petroleum Hydrocarbons in Artic Ringed Seals, Phoca hispida, Following Experimental Oil Exposure. Proc. Conf. on Assessment of Ecological Impacts of Oil Spills, Keystone, Colorado, American Institute of Biological Sciences.
Engelhart, F.R. and Ferguson, J.M. 1980. Adaptive Hormone Changes in Harp Seals, Phoca groenlandica, and Gray seals, Halichoerus grypus, During the Post-natal Period. Gen. Comp. Endocrinol. V. 40.
Entrix, 2004. Noise Analysis of Onshore and Offshore Construction Phase. Appendix H in Draft EIR/EIS for BHP Biliton LNG International Inc. Cabrillo Port Project.
Environment Canada, Environmental Protection Service. 1982. Oil and Dispersants in Canada Seas – Research Appraisals and Recommendations, Economic and Technical Review, Report EPS 3-EC-82-2.
Fabricious, E. 1959. What Makes Plumage Waterproof? Tenth Annual Report of the Wildfowl Trust.
Federal Register, 2008. Vol. 73, No. 21 / Thursday, January 31, 2008. Endangered and Threatened Wildlife and Plants; Revised Designation of Critical Habitat for the Tidewater Goby (Eucyclogobius newberryi)
Forney, K.A., et al., 2000. U.S. Pacific marine mammal stock assessments, U.S. Department of Commerce, NOAA Technical Memorandum NMFS-SWFSC-300, 276 pp.
Geraci, J. R. and Smith, T. G. 1976. Direct and Indirect Effects of Oil on Ringed Seals (Phoca hispida) of the Beaufort Sea. J. Fish, Res. Bd. Can. 33: 1976-1984.
Geraci, J. R. and Smith, T. G. 1977. Direct and Indirect Effects of Oil on Ringed Seals ( Phoca hispida) of the Beaufort Sea. J. Fish, Res. Bd. Can. 33: 1976-1984.
Geraci, J.R. and St. Aubin, D.J. 1982. Study of Effects on Oil on Cetaceans. For Bureau of Land Management, U.S. Department of Interior, Contact No. AA551-CT9-29.
Geraci, J.R. and St. Aubin, D.J. 1980. Offshore Petroleum Resource Development and Marine Mammals: A Review and Research Recommendations. Marine Fisheries Review, November.
Grau, C. R., Roudybush, T., Dobbs, J., and Wathen, J. 1977. Altered Yolk Structure and Reduced Hatchablility of Eggs From Birds Fed Singles Does of Petroleum Oils. Science, V. 195.
Hanni, K.D., D.J. Long, and L.E. Morgan. 1993. Recent strandings of Guadalupe fur seals (Arctocephalus townsendi) from central California. In: Abstracts Tenth Biennial Conference on the Biology of Marine Mammals, Galveston, TX, November 11-15, 1993. p. 57.
February 2011 Carone DPP Revisions
6-29
Hartung, R. 1965. Some Effects of Oiling on Reproduction in Ducks. Journal of Wildife Management. Vol. 29.
Hartung, R. 1964. Some Effects of Oiling on Waterfowl. Doctoral Dissertation, University of Michigan.
Holmes, W. N. and Cronshaw, J. 1975. Final Progress Report on Studies Completed During 1972 and 1975 on the Effects of Petroleum on Marine Birds. Submitted to the American Petroleum Institute, Washington, D. C.
Heyning, J.E., and W.F. Perrin, 1994. Evidence for two species of common dolphins from the eastern North Pacific, contributions in Science Natural History Museum of Los Angeles County 442:1-35.
Hyland, T., personal communication. Hyland Diving Inc., Santa Barbara, CA. Telephone discussion with Ray de Wit, Padre Associates, Inc. October 27, 2009.
Jarvela, L. E., Thorsteinson, L. K., and Pelto, M.J. 1984. Oil and Gas Development and Related Issues. In: The Navarin Basin Environment and Possible Consequences of Planned Offshore Oil and Gas Development. Edited by Jarvela, L. E. OCSEAP. Juneau, AK.
Jones, R.E. 1981. Food habits of smaller marine mammals from northern California. Proceedings of the California Academy of Sciences 42(16):409-433.
Jones, M.L., and S.L. Swartz, 1984. Demography and phenology of gray whales and evaluation of whale-watching activities at Laguna San Ignacio, Baja California Sur, Mexico.
Keane, K., 1998. California Least Tern Breeding Survey, 1997 Season. Prepared for the California Department of Fish and Game, Bird and Mammal Conservation Program Report, 98-12.
King, K. A. and Leferer, C. A. 1979. Effects of Oil Transferred from Incubating Gulls to their Eggs. Marine Pollution Bullentin, V. 10.
Kooyman, G. L. Davis, R. W., and Castellini, M. A. 1977. Thermal Conductance of Immersed Pinniped and Sea Otter Pelts Before and After Oiling with Prudhoe Bay Crude. In: Fate and Effects of Petroleum Hydrocarbons in Marine Ecosystems and Organisms, edited by D.A. Wolfe, Pergman Press, New York.
Leatherwood, S., R.R. Reeves, W.F. Perrin, and W.E. Evans, 1982. Whales, dolphins, and porpoises of the eastern North Pacific and adjacent Arctic waters, A guide to their identification, NOAA Tech. Rept., NMFS Circular 444, 245 pp.
Leatherwood, S., et al., 1987. Cetaceans of the Channel Islands National Marine Sanctuary. NOAA, Channel Islands National Marine Sanctuary and NMFS. 66 pp.
Loughlin, T.R., et al., 1984. Northern sea lion distribution and abundance: 1956-80. J. Wildl. Manage. 48(3):729-740.Environmental Research Associates, 2001. Assessment of Noise Issues Relevant to Marine Mammals near the BP Clair Development. LGL Report No. TA2565-2.
February 2011 Carone DPP Revisions
6-30
Malme, C.I. and LGL LeBouef, B.J., and M.L. Bonnell, 1980. Pinnipeds of the California islands: Abundance and distribution. In: D.M. Power, ed. The California Islands: Proceedings of a Multidisciplinary Symposium. Haagen Printing, Santa Barbara, CA. pp. 475-493.
"Marine Mammal Health and Stranding Response Program - Office of Protected Resources - NOAA Fisheries." NOAA :: National Marine Fisheries Service. Web. 14 July 2010. <http://www.nmfs.noaa.gov/pr/health/>.
McGill, P. A. and Richmond, M. E. 1979. Hatching Success of Great Black-backed Gull Eggs Treated with Oil. Bird-banding. Vol. 50.
Milton, Sarah, Peter Lutz, and Gary Shigenaka. "Oil and Sea Turtles: Biology, Planning, and Response | Planning for Environmental Emergencies | Publications | NOAA's National Ocean Service Office of Response and Restoration." NOAA's Ocean Service Office of Response and Restoration. 23 Aug. 2004. Web. 14 July 2010. <http://response.restoration.noaa.gov/type_subtopic_entry.php?RECORD_KEY(entry_subtopic_type)=entry_id,subtopic_id,type_id&entry_id(entry_subtopic_type)=9&subtopic_id(entry_subtopic_type)=3&type_id(entry_subtopic_type)=2>.
Minerals Management Service (MMS). 1983a. Final Environmental Impact Statement Proposed 1983 Outer Continental Shelf Oil and Gas lease Sale Offshore Central California OCS Sale No. 73. Volumes I and II. U.S Department of the Interior.
MFS Globenet Corp./WorldCom Network Services. 2000. MFS Globenet Corp./WorldCom Network Services Fiber Optic Cable Project Final Environmental Impact Report, Volume I.
Miller, D. J., and R. N. Lea., 1972. Guide to the Coastal Marine Fishes of California. California Department of Fish and Game. Fish Bulletin No. 157. 249 pp.
National Oceanic and Atmospheric Administration, 1993. Our Living Oceans, Report on the Status of U.S. Living Marine Resources, 1993.
1996. Our Living Oceans, Report on the Status of U.S. Living Marine Resources, 1995.
NMFS, 2009. Southern California Steelhead Recovery Plan (Public Review Draft Version). National Marine Fisheries Service, Long Beach. July 2009.
NOAA. 1999. Our Living Oceans, Report on the Status of U.S. Living Marine Resources, 1999.
NOAA Fisheries, 2002. White Abalone (Haliotis sorenseni). Fact Sheet. Office of Protected Resources website document www.nmfs.noaa.gov/prot_res/species/inverts/White/AB.html.
NOAA, 2006. Draft Recovery Plan for Fin Whale (Balaenoptera physalus). Prepared by the Office of Protected Resources, NMFS, Silverspring, Maryland. June 2006.
NOAA Fisheries, 2008a. Final White Abalone Recovery Plan. Prepared by The White Abalone Recovery Team. October 2008.
NOAA Fisheries, 2008b. Marine Mammal Stock Assessment Reports by Species. Website: http://www.nmfs.noaa.gov/pr/sars/species.htm
February 2011 Carone DPP Revisions
6-31
NOAA Fisheries, 2009. Loggerhead Sea Turtle (Caretta caretta) 2009 Status Review Under the U.S. Endangered Species Act. August 2009.
NOAA Fisheries’ website (a). Fact sheet on olive Ridley turtle (Lepidochelys olivacea) from: http://www.nmfs.noaa.gov/pr/species/turtles/oliveridley.htm
NOAA Fisheries’ website (b). Fact sheet on green turtle (Chelonia mydas) from: http://www.nmfs.noaa.gov/pr/species/turtles/green.htm
NOAA Fisheries’ website (c). Fact sheet on loggerhead turtle (Caretta caretta) from: http://www.nmfs.noaa.gov/pr/species/turtles/loggerhead.htm
NOAA Fisheries’ website (d). Fact sheet on leatherback turtle (Dermochelys coriacea) from: http://www.nmfs.noaa.gov/pr/species/turtles/leatherback.htm
NOAA Fisheries’ website (e). Fact sheet on northern right whale (Eubalaena japonica) from: http://www.nmfs.noaa.gov/pr/species/mammals/cetaceans/rightwhale_northpacific.htm
NOAA Fisheries’ website (f). Fact sheet on blue whale (Balaenoptera musculus) from: http://www.nmfs.noaa.gov/pr/species/mammals/cetaceans/bluewhale.htm
NOAA Fisheries’ website (g). Fact sheet on humpback whale (Megaptera novaeangliae) from: http://www.nmfs.noaa.gov/pr/species/mammals/cetaceans/bluewhale.htm
NOAA Fisheries’ website (h). Fact sheet on sei whale (Balaenoptera borealis) from: http://www.nmfs.noaa.gov/pr/species/mammals/cetaceans/seiwhale.htm
NOAA Fisheries’ website (i). Fact sheet on fin whale (Balaenoptera physalus) from: http://www.nmfs.noaa.gov/pr/species/mammals/cetaceans/finwhale.htm
Oritsland, N. A. and Ronald, K. 1973. Effects of Solar Radiation and Windchill on Skin temperature of the Harp Seal, Pagohilus groenlandicus, Comp. Biochem. Physiol., V. 44
Patten, S. M. and Patten, L. R. 1977 Effects of Petroleum Exposure on Hatching Success and Incubation Behavior of Glaucous- winged Gulls ( Larus Glaucescens) in the Northeast Gulf of Alaska. In: Environmental Assessment of the Alaskan Continental Shelf. Annual Reports of Principal Investigators Vol. III. National Oceanic and Atmospheric Administration Environmental Research Laboratory, Boulder, Co.
Peterson, R.S., C.L. Hubbs, R.L. Gentry, and R.L. DeLong. 1968. The Guadalupe fur seal: habitat, behavior, population size, and field identification. Journal of Mammalogy 49(4):665-675.
Reeves, R.R., G.K. Silber, and P.M. Payne. 1998. Draft recovery plan for the fin whale Balaenoptera physalus and sei whale Balaenoptera borealis. Office of Protected Resources, National Marine Fisheries Service, NOAA, Silver Spring, MD.
Ridoux, V., L. LaFontaine, P. Bustamante, F. Caurant, W. Dabin, C. Delacroix, S. Hassani, L. Meynier, V.P. da Silva, S. Simonin, M. Robert, J. Spitz, and O. Van Canneyt. 2004 The impact of the Erika oil spill on pelagic and coastal marine mammals: Combining demographic, ecological, trace metals and biomarker evidences. Aquat. Living Resour. 17: 379-387.
February 2011 Carone DPP Revisions
6-32
Ross, J.P., 1982. Historical decline of loggerhead, ridley, and leatherback sea turtles. Biology and conservation of sea turtles, K.A. Bjorndal (ed.) Washington, D.C.: Smithsonian Institution Press. pp. 189-195.
Scarff, J.E., 1986. Historic and present distribution of the right whale in the eastern North Pacific south of 50 N and east of 180 W. Pp. 43-63, in: R.L. Brownell, Jr., P.B. Best, and J.H. Prescott (eds.), Right whales: Past and present status. International Whaling Commission, Cambridge, UK.
Science Applications International Corporation (SAIC) (1999), Draft Environmental Impact Report for Global West Fiber Optic Cable Project.
Schultz, D. P.< Johnson, W.W., and Berkner, A. B. 1983. A Unique Oiled Bird Rehabilitation Operation – Myrtle Beach, South Carolina, February, 1981. In: Proceedings 1983 Oil Spill Conference ( Prevention< Behavior, Control, Cleanup). February 29 March 3, 1983, San Antonio, TX. American Petroleum Institute. Pub. No. 4356.
Shuford, W. D., and Gardali, T.(eds), 2008. California Bird Species of Special Concern: A ranked assessment of species, subspecies, and distinct populations of birds of immediate conservation concern in California. Studies of Western Birds 1. Western Field Ornithologists, Camarillo, California, and California Department of Fish and Game, Sacramento.
Siniff, D. B., Williams, T. D., Johnson, A. M., and Garshelis, D.L. 1982. Experiments on the Response of Sea Otters (Enhydra lutris) to Oil Contamination. Biological Conservation.
Stocker, M. W. and Conception Coast Project, 2002. Steelhead Assessment and Recovery Opportunities in Southern Santa Barbara County, California. June 2002.
Watson, L., 1981. Sea Guide to the Whales of the World. E.P. Dutton, New York, N.Y
Weller, D.W., and R.H. Defran, 1989. Coastal bottlenose dolphins in Santa Barbara: An analysis of home range and social affiliation. Abstr. Eighth Biennial Conf. on the Biology of Marine Mammals, Pacific Grove, California, December 7-11, 1989.
U.S. Fish and Wildlife Service, 1997. Endangered and Threatened Wildlife and Plants; Change in Listing Status of Steller Sea Lion 50 CFR Part 17, Federal Register / Vol. 62, No. 108
U.S. Fish and Wildlife Service, 1999. Endangered and Threatened Wildlife and Plants; Designation of Critical Habitat for the Pacific Coast Population of the Western Snowy Plover. 50 CFR Part 17, Federal Register / Vol. 64, No. 234 /
U.S. Fish and Wildlife Service, 2005. Recovery Plan for the Tidewater Goby (Eucyclogobius newberryi). Prepared by the Pacific Region USFWS, Portland, Oregon. December 7, 2005.
U.S. Fish and Wildlife Service, 2006. California Least Tern, Five Year Review Summary and Evaluation. USFWS Carlsbad Office, September 2006.
U.S. Fish and Wildlife Service, website (a). Species profile data sheet from: http://ecos.fws.gov/speciesProfile/profile/speciesProfile.action?spcode=A0A8
U.S. Fish and Wildlife Service website (b). Information on the southern sea otter from: http://www.fws.gov/ventura/speciesinfo/so_sea_otter/
February 2011 Carone DPP Revisions
6-33
U. S. Geological Survey, 2008. California Sea Otters; Population Recovery Continues at a Slower Rate. Website: http://www.usgs.gov/newsroom/article.asp?ID=1964
U.S. Fish & Wildlife Service, 2009. Species Assessment and Listing Priority Assignment Form, Xantus’s Murrelet (Synthliboramphus hypoleucus),_April 2009. From website: www.fws.gov
Woodward-Clyde Consultants. 1982. Central and Northern California Coastal Marine habitats: Oil Residence and Biological Sensitive Indices.
Zeiner, D., W. Laudenslayer, Jr., K. Mayer, and M. White, 1990. California's Wildlife, Volume II, Birds. California Department of Fish and Game. Sacramento, CA.
February 2011 Carone DPP Revisions
REVISED FEBRUARY 2011
ATTACHMENT 7.0
ESSENTIAL FISH HABITAT ASSESSMENT
ATTACHMENT 7
ESSENTIAL FISH HABITAT ASSESSMENT
Revision 4
February 2011
February 2011 Carone DPP Revision
7-1
ATTACHMENT 7.0 - ESSENTIAL FISH HABITAT ASSESSMENT
7.1 INTRODUCTION
In support of a various federal permit applications and consistent with the requirements of Section 305(b) (2) of the Magnuson-Stevens Fishery Conservation and Management Act, the following assessment of potential impacts to Essential Fish Habitat (EFH) has been prepared to address the proposed subsurface drilling and development of petroleum reserves within the California state leases of the Carpinteria offshore field. This assessment is prepared in accordance with 50 CFR 600.920(g) (2) and addresses the managed fish and invertebrate taxa that could occur within the Project area and within the water depth range and habitats of the existing platform and subsea pipeline.
EFH is defined as “…those waters and substrate necessary to fish for spawning, breeding, feeding, or growth to maturity”. “Waters”, as used in this definition, are defined to include “aquatic areas and their associated physical, chemical, and biological properties that are used by fish”. These may include “…areas historically used by fish where appropriate; ‘substrate’ to include sediment, hard bottom, structures underlying the waters, and associated biological communities”. “Necessary” means, “the habitat required to support a sustainable fishery and the managed species’ contribution to a healthy ecosystem”. EFH is described as a subset of all habitats occupied by a species (NOAA, 1998).
7.2 PROPOSED ACTION
Carone Petroleum Corporation (Carone) and Carone’s dedicated offshore operator, Pacific Operators Offshore, LLC (PACOPS) propose to drill subsurface wells from Platform Hogan, an existing oil and gas production platform located within Pacific Outer Continental Shelf Lease P-0166 within the Santa Barbara Channel offshore Carpinteria, California. The objective of the Project is to develop oil and gas reserves within the State waters portion of the Carpinteria Field which consists of three contiguous California state leases: PRC-3133, -4000, and -7911 from Platform Hogan located in Federal waters (Figure 7.2-1).
Water depths within the area range from 130 to 180 ft (MLLW) and the proposed drilling will not require any seafloor activities within state leased areas. All drilling will be conducted through subsurface operations from the existing Platform Hogan, located within Lease P-0166. With the exception of the new wellhead equipment and associated piping, no additional platform-based oil and gas handling and processing equipment is required for the proposed Project.
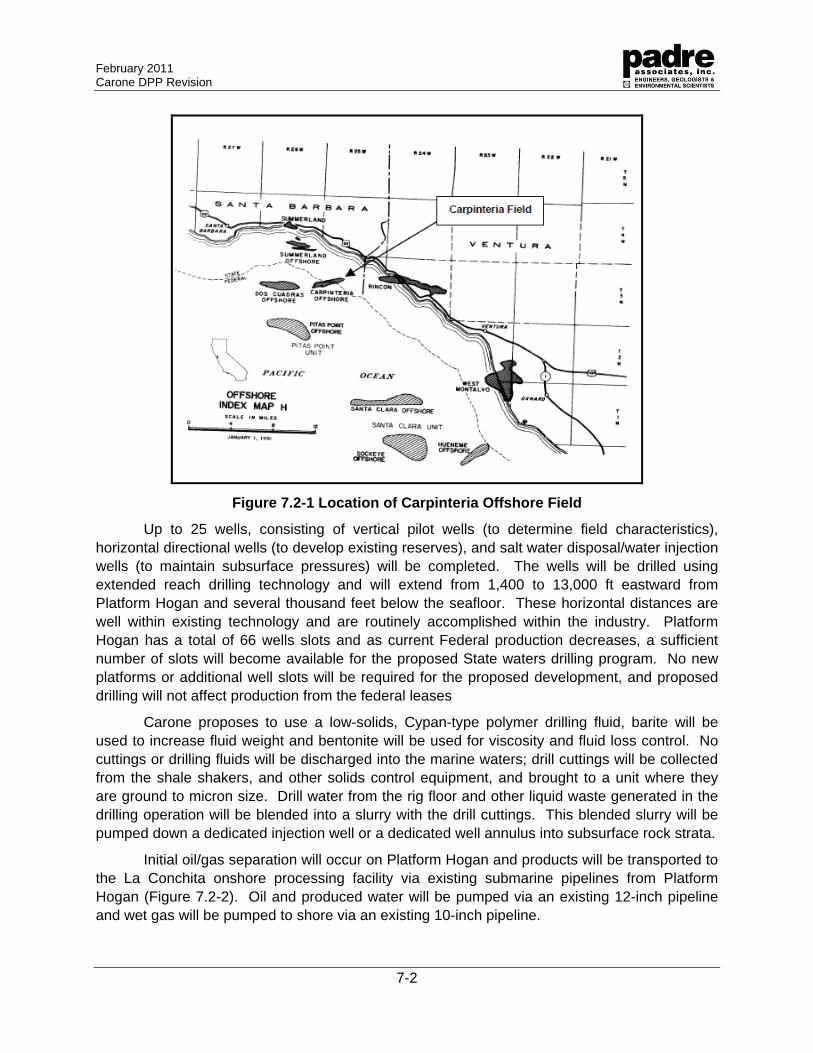
February 2011 Carone DPP Revision
7-2
Figure 7.2-1 Location of Carpinteria Offshore Field
Up to 25 wells, consisting of vertical pilot wells (to determine field characteristics), horizontal directional wells (to develop existing reserves), and salt water disposal/water injection wells (to maintain subsurface pressures) will be completed. The wells will be drilled using extended reach drilling technology and will extend from 1,400 to 13,000 ft eastward from Platform Hogan and several thousand feet below the seafloor. These horizontal distances are well within existing technology and are routinely accomplished within the industry. Platform Hogan has a total of 66 wells slots and as current Federal production decreases, a sufficient number of slots will become available for the proposed State waters drilling program. No new platforms or additional well slots will be required for the proposed development, and proposed drilling will not affect production from the federal leases
Carone proposes to use a low-solids, Cypan-type polymer drilling fluid, barite will be used to increase fluid weight and bentonite will be used for viscosity and fluid loss control. No cuttings or drilling fluids will be discharged into the marine waters; drill cuttings will be collected from the shale shakers, and other solids control equipment, and brought to a unit where they are ground to micron size. Drill water from the rig floor and other liquid waste generated in the drilling operation will be blended into a slurry with the drill cuttings. This blended slurry will be pumped down a dedicated injection well or a dedicated well annulus into subsurface rock strata.
Initial oil/gas separation will occur on Platform Hogan and products will be transported to the La Conchita onshore processing facility via existing submarine pipelines from Platform Hogan (Figure 7.2-2). Oil and produced water will be pumped via an existing 12-inch pipeline and wet gas will be pumped to shore via an existing 10-inch pipeline.
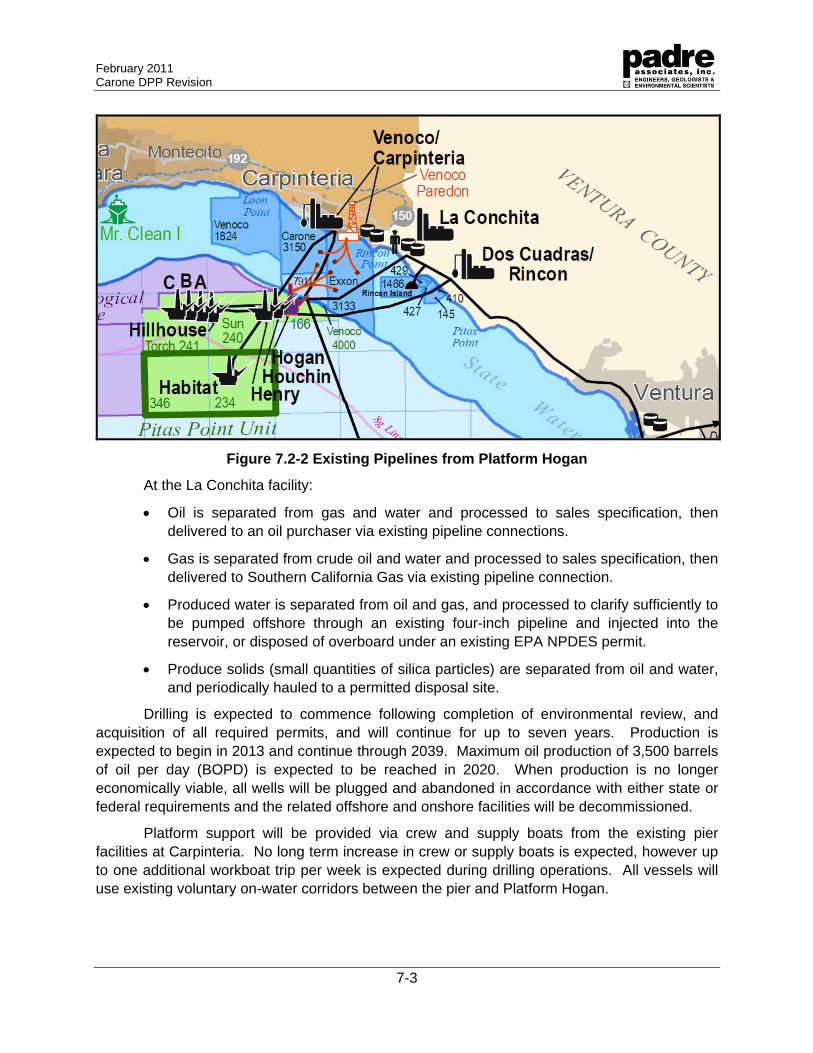
February 2011 Carone DPP Revision
7-3
Figure 7.2-2 Existing Pipelines from Platform Hogan
At the La Conchita facility:
Oil is separated from gas and water and processed to sales specification, then delivered to an oil purchaser via existing pipeline connections.
Gas is separated from crude oil and water and processed to sales specification, then delivered to Southern California Gas via existing pipeline connection.
Produced water is separated from oil and gas, and processed to clarify sufficiently to be pumped offshore through an existing four-inch pipeline and injected into the reservoir, or disposed of overboard under an existing EPA NPDES permit.
Produce solids (small quantities of silica particles) are separated from oil and water, and periodically hauled to a permitted disposal site.
Drilling is expected to commence following completion of environmental review, and acquisition of all required permits, and will continue for up to seven years. Production is expected to begin in 2013 and continue through 2039. Maximum oil production of 3,500 barrels of oil per day (BOPD) is expected to be reached in 2020. When production is no longer economically viable, all wells will be plugged and abandoned in accordance with either state or federal requirements and the related offshore and onshore facilities will be decommissioned.
Platform support will be provided via crew and supply boats from the existing pier facilities at Carpinteria. No long term increase in crew or supply boats is expected, however up to one additional workboat trip per week is expected during drilling operations. All vessels will use existing voluntary on-water corridors between the pier and Platform Hogan.
February 2011 Carone DPP Revision
7-4
7.3 SITE CHARACTERISTICS
The Project area consists of the marine waters between the shoreline and Platform Hogan (a distance of approximately 3.7 miles) and immediately around and within the footprint of the platform, and the seafloor between Platform Hogan and the La Conchita onshore processing facility. According to Love, et al. (2003) Platform Hogan is located in approximately 154 ft of water and covers approximately 15,440 ft2 of the seafloor at its base. The platform consists of primary legs (jackets) with steel cross-members and bracing (Figure 7.3-1).
The surface area of the submerged portion of the platform is estimated to be 88,125 ft2 (Carr, et al., 2003, Schmitt, et al., 2006) and approximately 18 million gallons of water are within the water column encompassed by the platform structure (Carr, et al., 2003). Page, et al. (2005) report that the debris/shell mound located below Platform Hogan is approximately 26 ft high and is generally round with a diameter of approximately 256 ft.
The distance between the platform and the onshore processing plant is approximately four miles (Figure 7.2-2). The seafloor between the platform and onshore processing facility is generally sedimentary. The pipeline bundle is partially or completely buried from the platform to the inshore area (Hyland, pers. comm.) and no seafloor disturbance is expected to occur during the proposed Project.
Schmitt, et al. (2006) included Platform Hogan in a seven-platform study of the algae and invertebrates associated with the structures. The results of that study suggest that for all seven platforms (Gina, Gail, Grace, Gilda, Houchin, Hogan, and Holly), the most widely distributed and abundant higher taxi, were anemones (e.g., Corynactis californium, Meridian sp.), tubiculous amphipods, hydroids (Plumaria, Agalophenia), and sponges (e.g., Halichondria panicea, Sphaeciospongia confoederata). Together, these taxa accounted for over 83 percent of the attached epibiota. Platform Hogan supported the highest percent cover of hydroids, but the lowest cover of the powder-puff anemone, Metridium sp. Other widespread taxa included mussels, (Mytilus californianus, M. galloprovincialis), barnacles (Megabalanus californicus, Balanus spp.), and tunicates (e.g., Styela montereyensis). Schmitt, et al. (2006) also found that filamentous red algae were the most widely distributed algal taxa. However, in general the cover of algae was low (~5 percent).
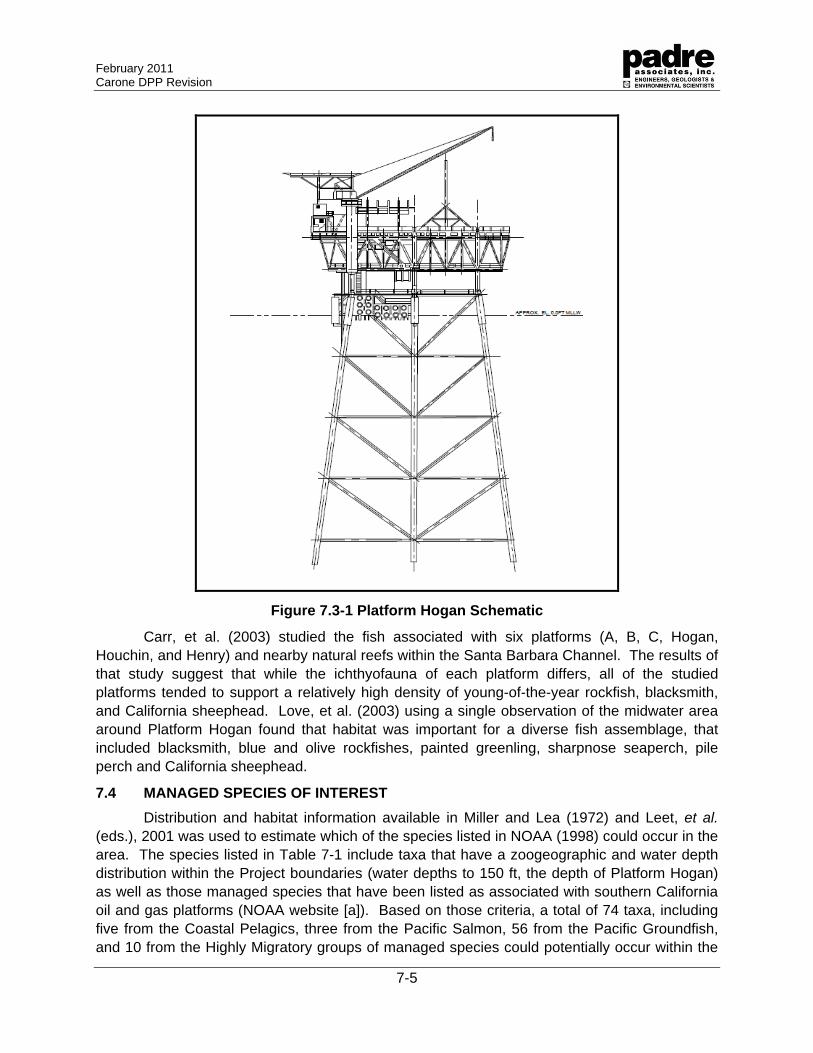
February 2011 Carone DPP Revision
7-5
Figure 7.3-1 Platform Hogan Schematic
Carr, et al. (2003) studied the fish associated with six platforms (A, B, C, Hogan, Houchin, and Henry) and nearby natural reefs within the Santa Barbara Channel. The results of that study suggest that while the ichthyofauna of each platform differs, all of the studied platforms tended to support a relatively high density of young-of-the-year rockfish, blacksmith, and California sheephead. Love, et al. (2003) using a single observation of the midwater area around Platform Hogan found that habitat was important for a diverse fish assemblage, that included blacksmith, blue and olive rockfishes, painted greenling, sharpnose seaperch, pile perch and California sheephead.
7.4 MANAGED SPECIES OF INTEREST
Distribution and habitat information available in Miller and Lea (1972) and Leet, et al. (eds.), 2001 was used to estimate which of the species listed in NOAA (1998) could occur in the area. The species listed in Table 7-1 include taxa that have a zoogeographic and water depth distribution within the Project boundaries (water depths to 150 ft, the depth of Platform Hogan) as well as those managed species that have been listed as associated with southern California oil and gas platforms (NOAA website [a]). Based on those criteria, a total of 74 taxa, including five from the Coastal Pelagics, three from the Pacific Salmon, 56 from the Pacific Groundfish, and 10 from the Highly Migratory groups of managed species could potentially occur within the
February 2011 Carone DPP Revision
7-6
Project area. Additional information on the life history of the managed species can be found in the various Pacific Fisheries Management Council’s management plans on the website (www.pcouncil.org) and in Cailliet, et al., 2000. Even though the recorded water depth or zoogeographic range of some the species listed in Table 7.4-1 are outside of the Project area, the effects discussions are applied to all managed rockfish species as offshore oil and gas platforms have been shown to support a variety of rockfish taxa and the planktonic stage of those taxa could occur within the Project area at various times of the year.
According to the various management plans prepared by the Pacific Fisheries Management Council, the marine waters within the Project region are considered essential habitat for the coastal pelagic species, groundfish species, and four (swordfish, common thresher, shortfin mako, and blue shark) of the highly migratory species listed in Table 7.4-1. Although oil and gas production platforms are not considered a groundfish Habitat of Particular Concern (which include estuaries, kelp canopies, rocky reefs, and sea grass beds) or an “Area of Interest”, those structures support several of the managed taxa and therefore the submerged portion of the platform is considered an important habitat. Likewise, the shell mounds of Santa Barbara Channel platforms have been shown to support juveniles and adults of several of the managed groundfish species, particularly rockfish, however that habitat has not been identified as “essential”, “of particular concern” or “of interest” in the management plans.
Although the salmonids listed in Table 7.4-1 could be expected to occur within the Project region, the marine waters south of Point Conception are not considered essential fish habitat for Pacific salmon managed species.
Therefore, the EFH within the Project area is limited to the marine waters that are under and around Platform Hogan and within the state leases that are to be developed. Seafloor disturbance is not expected to occur during the proposed Project therefore no natural or sedimentary habitat, or the biota attached to or associated with that habitat, are expected to be affected. Potential effects of the proposed actions and accidents, and the mitigations to reduce or eliminate those effects, are discussed below.
Table 7.4-1. Managed Taxa Potentially Occurring Within the Project Area
Common Name Scientific Name Common Name Scientific Name
COASTAL PELAGICS
Northern Anchovy Engraulis mordax Pacific sardine Sardinops sagax Pacific mackerel Scomber japonicus Jack mackerel Trachurus symmetricus Market squid Loligo opalescens
PACIFIC SALMON
Chinook salmon Oncorhynchus tshawytscha Coho salmon Oncorhynchus kisutch
Pink salmon Oncorhynchus gorbuscha
PACIFIC GROUNDFISH
Butter sole Isopsetta isolepis Flathead sole Hippoglossoides elassodon Curlfin sole Pleuronichthys decurrens Dover sole Microstomus pacificus English sole Parophrys vetulus Petrale sole Eopsetta jordani
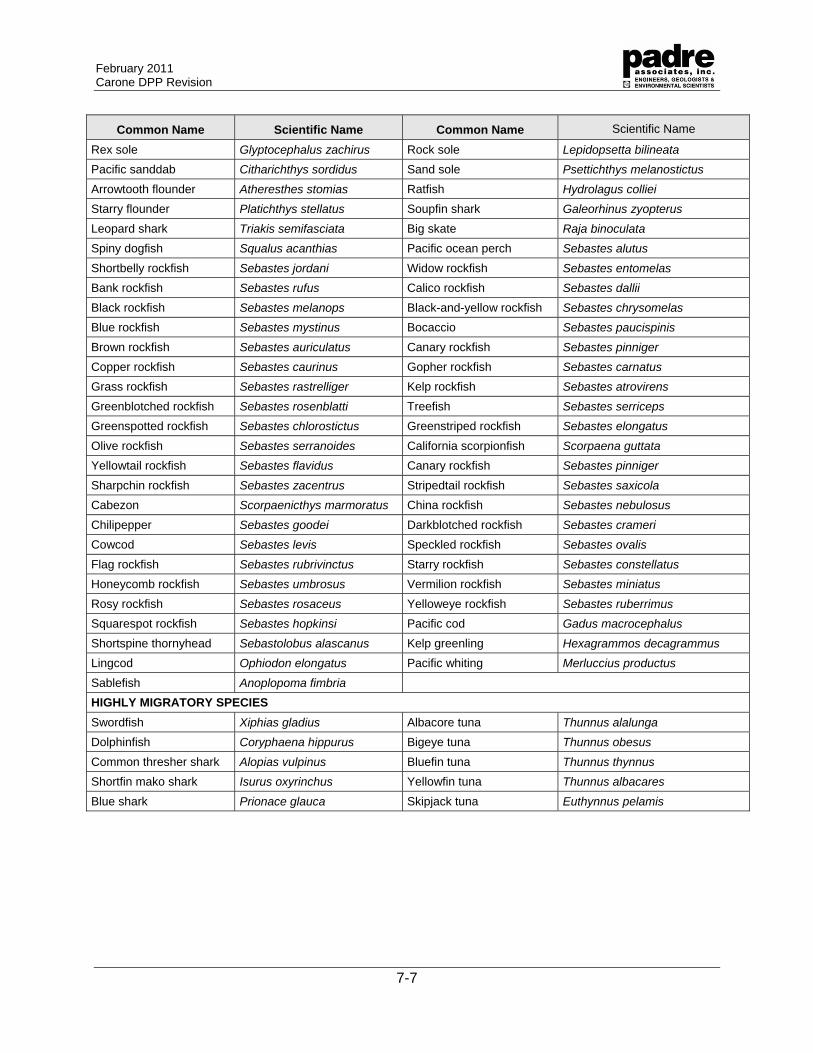
February 2011 Carone DPP Revision
7-7
Common Name Scientific Name Common Name Scientific Name
Rex sole Glyptocephalus zachirus Rock sole Lepidopsetta bilineata Pacific sanddab Citharichthys sordidus Sand sole Psettichthys melanostictus Arrowtooth flounder Atheresthes stomias Ratfish Hydrolagus colliei Starry flounder Platichthys stellatus Soupfin shark Galeorhinus zyopterus Leopard shark Triakis semifasciata Big skate Raja binoculata Spiny dogfish Squalus acanthias Pacific ocean perch Sebastes alutus Shortbelly rockfish Sebastes jordani Widow rockfish Sebastes entomelas Bank rockfish Sebastes rufus Calico rockfish Sebastes dallii Black rockfish Sebastes melanops Black-and-yellow rockfish Sebastes chrysomelas Blue rockfish Sebastes mystinus Bocaccio Sebastes paucispinis Brown rockfish Sebastes auriculatus Canary rockfish Sebastes pinniger Copper rockfish Sebastes caurinus Gopher rockfish Sebastes carnatus Grass rockfish Sebastes rastrelliger Kelp rockfish Sebastes atrovirens Greenblotched rockfish Sebastes rosenblatti Treefish Sebastes serriceps Greenspotted rockfish Sebastes chlorostictus Greenstriped rockfish Sebastes elongatus Olive rockfish Sebastes serranoides California scorpionfish Scorpaena guttata Yellowtail rockfish Sebastes flavidus Canary rockfish Sebastes pinniger Sharpchin rockfish Sebastes zacentrus Stripedtail rockfish Sebastes saxicola Cabezon Scorpaenicthys marmoratus China rockfish Sebastes nebulosus Chilipepper Sebastes goodei Darkblotched rockfish Sebastes crameri Cowcod Sebastes levis Speckled rockfish Sebastes ovalis Flag rockfish Sebastes rubrivinctus Starry rockfish Sebastes constellatus Honeycomb rockfish Sebastes umbrosus Vermilion rockfish Sebastes miniatus Rosy rockfish Sebastes rosaceus Yelloweye rockfish Sebastes ruberrimus Squarespot rockfish Sebastes hopkinsi Pacific cod Gadus macrocephalus Shortspine thornyhead Sebastolobus alascanus Kelp greenling Hexagrammos decagrammus Lingcod Ophiodon elongatus Pacific whiting Merluccius productus Sablefish Anoplopoma fimbria HIGHLY MIGRATORY SPECIES
Swordfish Xiphias gladius Albacore tuna Thunnus alalunga Dolphinfish Coryphaena hippurus Bigeye tuna Thunnus obesus Common thresher shark Alopias vulpinus Bluefin tuna Thunnus thynnus Shortfin mako shark Isurus oxyrinchus Yellowfin tuna Thunnus albacares Blue shark Prionace glauca Skipjack tuna Euthynnus pelamis
February 2011 Carone DPP Revision
7-8
7.5 IMPACTS AND MITIGATIONS
The normal activities associated with the proposed Project (drilling, on-platform processing and transporting of produced oil and gas, discharging produced water, and vessel operations) are not expected to directly impact EFH for the managed species. Platform discharges will be in accordance with existing NPDES permits, including General Permit CAG 280000 which has specific effluent requirements for Platform Hogan, and will therefore not degrade the existing quality of the marine waters around the platform. The on-platform and subsurface noise that will be produced during the proposed activities are expected to be similar to those that are currently occurring at the platform and are not expected to be detrimental to the viability of the EFH. Oil and gas, along with produced water, is currently being, and will continue to be transported between Platform Hogan and the La Conchita facility. The additional production is not expected to result in any effects on EFH. No structural changes to the submerged portion of the platform are proposed, thus no additional solid habitat will be created nor will any be removed as a result of the proposed activities.
The addition of one work vessel trip per week between the existing Venoco Carpinteria supply pier and the platform during drilling operations represents a minimal addition to existing vessel traffic and is not expected to result in any negative effects to EFH.
Potentially significant impacts to EFH could result from the accidental discharge of untreated produced water or petroleum into the marine waters and/or onto the existing sedimentary seafloor. That release could occur from damage to the crew/supply/work vessels’ fuel tanks or from a rupture of the pipelines between the platform and onshore facility. Discussions on the sources of potential impacts are discussed in detail below and mitigations that have been built into the proposed Project to reduce possible negative effects on EFH are listed after the impact discussions.
Noise. Richardson et al. (1995) (cited in Plains Exploration and Production Co. [PXP], 2008) cites only one example of recorded noise from drilling platforms off the California coast, which resulted in auditory levels that were nearly undetectable even alongside the platforms. No sound levels were computed, but the strongest received tones were very low frequency, below approximately 5 Hz. Richardson et al. (1995) also suggests that typical broadband received underwater source sound levels for vessels range from 145 to 190 dB re: 1 µ Pa. Banner and Hyatt (1973) found the viability of eggs of an estuarine fish, Cyprinodon variegatus, was significantly reduced in a tank with noise levels that exceeded normal ocean noise a wind force 2 and heavy vessel traffic, than those that were in a “quieter tank”. Other studies have found that caged fish showed classic “c-turn” startle responses and a tendency to gather together in tight groups at the bottom center of the cage at levels above 145-150dB re: 1 µPa2s Cummings and Brandon, 2004. Woodbury, (pers. comm.) stated that fish tend to show changes in behavior when exposed to noise levels above 150 dBA re: 1 µ Pa and physical effects are realized at between 183 and 187 SEL for fish weighing less than 2 grams and more than 2 grams, respectively.
Noise levels within the Project area resulting from the proposed actions are not expected to substantially increase over existing levels. Platform Hogan currently supports drilling and oil production operations and is supplied by the same shore-based vessels that would be used during the expanded drilling and production. The increase of one vessel trip per day to
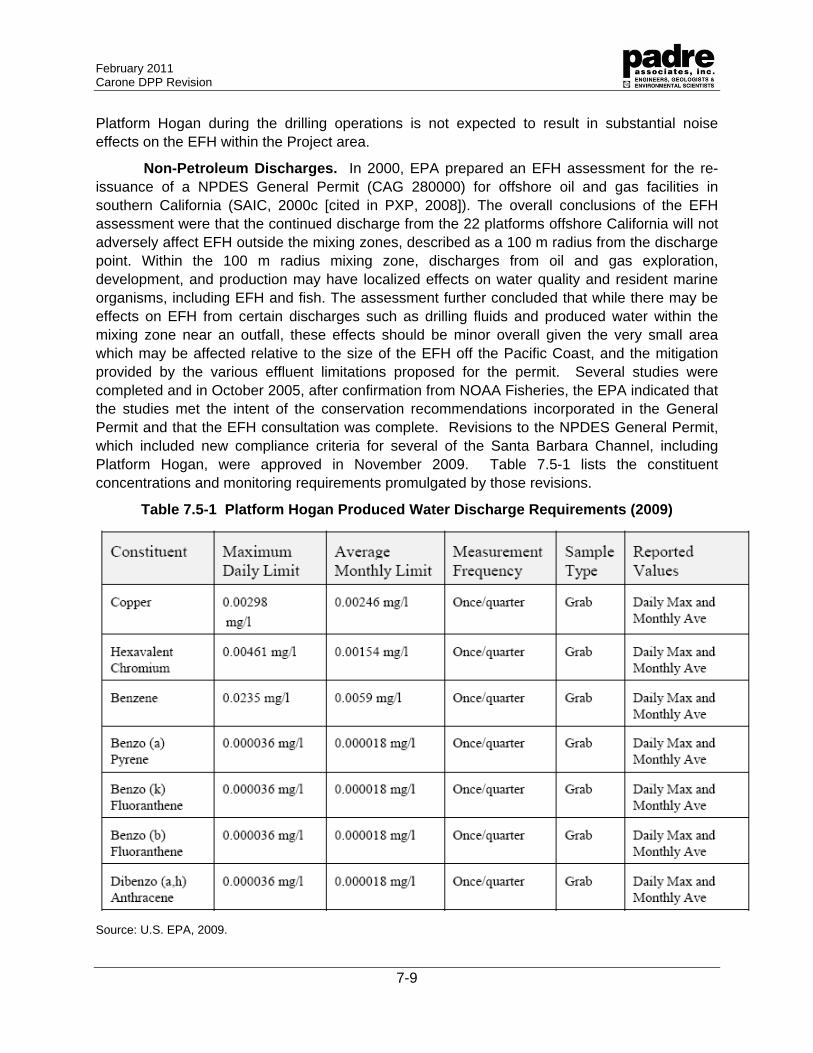
February 2011 Carone DPP Revision
7-9
Platform Hogan during the drilling operations is not expected to result in substantial noise effects on the EFH within the Project area.
Non-Petroleum Discharges. In 2000, EPA prepared an EFH assessment for the re-issuance of a NPDES General Permit (CAG 280000) for offshore oil and gas facilities in southern California (SAIC, 2000c [cited in PXP, 2008]). The overall conclusions of the EFH assessment were that the continued discharge from the 22 platforms offshore California will not adversely affect EFH outside the mixing zones, described as a 100 m radius from the discharge point. Within the 100 m radius mixing zone, discharges from oil and gas exploration, development, and production may have localized effects on water quality and resident marine organisms, including EFH and fish. The assessment further concluded that while there may be effects on EFH from certain discharges such as drilling fluids and produced water within the mixing zone near an outfall, these effects should be minor overall given the very small area which may be affected relative to the size of the EFH off the Pacific Coast, and the mitigation provided by the various effluent limitations proposed for the permit. Several studies were completed and in October 2005, after confirmation from NOAA Fisheries, the EPA indicated that the studies met the intent of the conservation recommendations incorporated in the General Permit and that the EFH consultation was complete. Revisions to the NPDES General Permit, which included new compliance criteria for several of the Santa Barbara Channel, including Platform Hogan, were approved in November 2009. Table 7.5-1 lists the constituent concentrations and monitoring requirements promulgated by those revisions.
Table 7.5-1 Platform Hogan Produced Water Discharge Requirements (2009)
Source: U.S. EPA, 2009.
February 2011 Carone DPP Revision
7-10
Platform Hogan currently discharges between 4,500 and 5,500 bbl/day of treated produced and other source water into Santa Barbara Channel through an existing pipe that terminates 130 ft below the surface (Lawry, pers. com.). All effluents are discharged in accordance with CAG 280000 and monitoring is conducted in accordance with permit requirements. The produced water will either be treated and discharged through the existing outfall or will be slurried with drill cuttings and fluids and re-injected into an existing well. All effluents that are discharged into the ocean will be in compliance with NPDES General Permit CAG 280000 and the results of two-dimensional dispersion modeling of the on-platform discharge indicate that effluent dilutions of from 1,250:1 to 1,350:1 are maintained at the 100 m boundary of the zone of initial dilution (ZID) (Lawry, pers. com.). Reasonable potential (RP) modeling of the effluent from Platform Hogan completed in 2005 and 2007 indicate that treated water discharges at or below 6,000 barrels per day (bpd) provide the appropriate dilution to meet all NPDES permit requirements (Lawry, pers. com.). Over the past five years, those discharges are ranged from approximately 4,500 to 5,500 bpd. An increase of the discharge volume with the current treatment could result in a violation of the NPDES requirements beyond the 100 m ZID. While some degradation of the marine water quality could occur immediately adjacent to the discharge and inside the ZID, the effluent meets NPDES requirements at the 100 m ZID boundary and therefore is not expected to significantly affect the EFH within the Project area.
Seafloor Disturbance. No additional seafloor disturbance is expected from the proposed actions. Existing conductors will be used to direct the drill into the seafloor and the directional drilling will be below the seafloor. No disturbance of the existing shell mound habitat is expected. No physical disturbance of the seafloor EFH is expected. Fish can be affected directly by oil, either by ingestion of oil or oiled prey, through uptake of dissolved petroleum compounds through the gills and other body epithelia, through effects on fish eggs and larval survival, or through changes in the ecosystem that supports fish. Although fish can accumulate hydrocarbons from contaminated food, there is no evidence of food web magnification
Fish have the capability to metabolize hydrocarbons and can excrete both metabolites and parent hydrocarbons from the gills and the liver (NRC, 1985). Nevertheless, oil effects in fish can occur in many ways: histological damage, physiological and metabolic perturbations, and altered reproductive potential (NRC, 1985 [cited in PXP, 2008]). Many of these sublethal effects are symptomatic of stress and may be transient and only slightly debilitating. However, all repair or recovery requires energy, and this may ultimately lead to increased vulnerability to disease or to decreased growth and reproductive success. Fish can also be affected indirectly by oil through changes in the ecosystem that supports fish. In simplistic terms, this ecosystem would include all prey species and habitats the fish use during all life stages.
Perhaps the most important food on which all fish rely during their larval and juvenile stages is plankton. In general, the studies to date indicate that zooplankton are more susceptible to effects from oil spills than are phytoplankton. Even if a large number of algal cells were affected during a spill, regeneration time of the cells (9-12 hours), together with the rapid replacement by cells from adjacent waters, probably would obliterate any major impact on a pelagic phytoplankton community (NRC, 1985).
February 2011 Carone DPP Revision
7-11
Petroleum Spills. The effects of oil on marine wildlife, particularly birds, have been well documented during cleanup operations of various spills. Oil in the marine environment can, in sufficient concentrations, cause adverse impacts to fish (NRC, 1985; GESAMP, 1993 [cited in PXP, 2008]). The effects can range from mortality to sublethal effects that inhibit growth, longevity, and reproduction. Benthic macrofauna can be heavily impacted, as well as intertidal communities that provide food and cover for fishes. Studies by Longwell, 1977, and Samain et al., 1980 indicate that organisms in oil spills have been affected in a number of ways: direct mortality (fish eggs, copepods, mixed plankton), external contamination by oil (chorion of fish eggs, cuticles and feeding appendages of crustacea), tissue contamination by aromatic constituents, abnormal development of fish embryos, and altered metabolic rates.
Fish can be affected directly by oil, either by ingestion of oil or oiled prey, through uptake of dissolved petroleum compounds through the gills and other body epithelia, through effects on fish eggs and larval survival, or through changes in the ecosystem that supports fish. Although fish can accumulate hydrocarbons from contaminated food, there is no evidence of food web magnification. Fish have the capability to metabolize hydrocarbons and can excrete both metabolites and parent hydrocarbons from the gills and the liver (NRC, 1985). Nevertheless, oil effects in fish can occur in many ways: histological damage, physiological and metabolic perturbations, and altered reproductive potential (NRC, 1985). Many of these sublethal effects are symptomatic of stress and may be transient and only slightly debilitating. However, all repair or recovery requires energy, and this may ultimately lead to increased vulnerability to disease or to decreased growth and reproductive success (PXP, 2008). The egg, early embryonic, and larval-to-juvenile stages of fish seem to be the most sensitive to oil. Damage may not be realized until the fish fails to hatch, dies upon hatching, or exhibits some abnormality as a larva, such as an inability to swim (Malins and Hodgins, 1981, cited in PXP, 2008).
The most likely sources of an accidental spill would be from a pipeline rupture or the loss of fuel from a damaged or sunken supply vessel would another possible source of petroleum discharge; however volumes of the refined products would be substantially less than from a pipeline rupture. Under normal conditions for the area, wind and sea conditioned-induced mixing and weathering of the oil would result in the evaporation of the toxic light-end hydrocarbons into the atmosphere, disperse the oil into the water column, and likely break the slick into smaller patches. The weathered tar balls would likely cause some mortality to intertidal macrophytes and invertebrates through smothering. The effects on the EFH would likely be limited to short-term degradation of the water column and the resulting toxic effects to the eggs and larvae of managed species. Sinking of the oil through sorption onto suspended sediment in the water column would be expected to have minimal effect on the demersal taxa or their food sources. The onshore movement and subsequent deposition of tar-like oil onto the shoreline substrate and algae would be expected to have minimal impacts on EFH for managed species that rely on that habitat. Containment and cleanup operations would be expected to commence immediately after detection of the spill, thus further reducing the effects of the petroleum.
While the potential for an accident does exist, the following mitigations have been incorporated into the proposed plan of operation and will result in reducing the chances of a spill occurring:
BOEMRE-approved blow-out preventers will be installed on the new wells.
February 2011 Carone DPP Revision
7-12
All vessels will be USCG-inspected and will have the appropriate spill response equipment onboard.
Carone will maintain an approved oil spill response plan and the appropriate spill response equipment on the platform. Response drills will be in accordance with federal and state requirements. Contracts with off-site spill response companies will be in-place and will provide additional containment and clean-up resources as needed.
Pipelines will be maintained and inspected in accordance with BOEMRE regulations.
Petroleum-fueled equipment on the platform will have drip pans or other means of collecting dripped oil which will be collected and treated with onboard equipment or sent to the onshore La Conchita facility for treatment. No petroleum will be allowed to enter the marine waters from the platform.
While a release of petroleum would be expected to have some effect on the EFH within the Project area, the likelihood of such an event occurring and the existing mitigations that have been built into the Project design reduce the possibility to less than significant. Short-term, less than significant effects to managed species’ eggs and larvae are the most likely to occur should a spill, particularly of a refined product such as gasoline or diesel, occur during the spring or fall spawning and early development periods. No long term effects of a spill associated with this Project would on EFH would be expected.
February 2011 Carone DPP Revision
7-13
7.6 REFERENCES
Banner, A. and M. Hyatt, 1973. Effects of noise on eggs and larvae of two estuarine fishes. Trans. American Fisheries Society, Vol. 102 (1), January 1973.
Cailliet, C.M., E.J. Burton, J.M. Cope, L.A. Kerr, R.J. Larson, R.N. Lea, D. Van Tresca, and E. Knaggs, 2000. Biological characteristics of nearshore fishes of California: A review of existing knowledge and proposed additional studies. Presented to Pacific States Marine Fisheries Commission, August 2000.
Carr, M. H., M. V. McGinnis, G.E. Forrester, J. Harding, and P. T. Raimondi, 2003. Consequences of Alternative Decommissioning Options to Reef Fish Assemblages and Implications for Decommissioning Policy. MMS OCS Study 2003-053. Coastal Research Center, Marine Science Institute, University of California, Santa Barbara, California. MMS Cooperative Agreement Number 14-35-0001-30758.
Cummings, J. and N. Brandon, 2004. SONIC IMPACT: A Precautionary Assessment of Noise Pollution from Ocean Seismic Surveys. Greenpeace publication, June 2004.
Hyland, T., personal communication. Hyland Diving Inc., Santa Barbara, CA. Telephone discussion with Ray de Wit, Padre Associates, Inc. October 27, 2009
Lawry, Steve (personal communication). LTS Environmental, XXXX. Telephone conversations with Ray de Wit, Padre Associates, Inc. March 4 and 8, 2010.
Leet, W. S., C. M. Dewees, R. Klingbeil, and E. J. Johnson (eds.), 2001. California’s Living Marine Resources: A Status Report. California Dept. of Fish & Game, University of California Agriculture and Natural Resources Publication SB01-11.
Longwell, A.C. 1977. A genetic look at fish eggs and oil. Oceanus 20:45.
Love, M. S., D. M. Schroeder, and M. M. Nishimoto, 2003. The ecological role of oil and gas production platforms and natural outcrops on fishes in southern and central California: a synthesis of information. U. S. Department of the Interior, U. S. Geological Survey, Biological Resources Division, Seattle, Washington, 98104, OCS Study MMS 2003-032.
Miller, D. J., and R. N. Lea. 1972. Guide to the Coastal Marine Fishes of California. California Department of Fish and Game. Fish Bulletin No. 157. 249 pp.
NOAA, 1998. A Primer for Federal Agencies, Essential Fish Habitat: New Marine Fish Habitat Conservation Mandate for Federal Agencies. National Marine Fisheries Service, Southwest Regional Office, Long Beach, CA. November 1998.
NOAA website (a). Managed fish species that are associated with southern California oil and gas platforms. From: http://swr.nmfs.noaa.gov/hcd/HCD_webContent/EFH/socal_oilgas_fmp.htm
Page, H. M., J. Dugan, and J. Childress, 2005. Role of food subsidies and habitat structure in influencing benthic communities of shell mounds at sites of existing and former offshore oil platforms. MMS OCS Study 2005-001. Coastal Research Center, Marine Science Institute, University of California, Santa Barbara, California. MMS Cooperative Agreement Number 14-35-0001-31063.
February 2011 Carone DPP Revision
7-14
Plains Exploration and Production Co., 2008. Revisions to the Point Pedernales Field DPP Tranquillon Ridge Field Supporting Information Volume Essential Fish Habitat Assessment. Submitted to the U.S. Minerals Management Service, Pacific OCS Region. May 2008.
Richardson, W. J., C.R. Greene, C.I. Malme, and D.H. Thomson, 1995. Marine Mammals and Noise. Academic Press, Inc. , San Diego, CA. 576 pp.
Samain, J.F., J. Moal, A. Coum, J.R. Le Coz, and J. Y. Daniel. 1980. Effects of the Amoco Cadiz oil spill on zooplankton: A new possibility of ecophysiological survey. Helgolander Meeresunters. 33:225-235.
Schmitt, R.J., R.S. Jacobs, H.M. Page, J.E. Dugan, L. Wilson, S.D. Gaines and S.A. Hodges, 2006.. Advancing marine biotechnology: use of OCS oil platforms as sustainable sources of marine natural products. MMS OCS Study 2006-054. Coastal Research Center, Marine Science Institute, University of California, Santa Barbara, California. MMS Cooperative Agreement Number 14-35-0001-31063.
U.S. EPA, 2009. Fact sheet: Final modification of general national pollution discharge elimination system (NPDES) permit no. CAG 280000 for offshore oil and gas exploration, development, and production facilities in federal waters offshore southern California. November 24, 2009. 10 pp.
Woodbury, Dave (personal communication). U.S. Fish and Wildlife Service, Santa Rosa. Telephone discussion with Ray de Wit, Padre Associates, Inc. October 6, 2008.
February 2011 Carone DPP Revisions
ATTACHMENT 8.0
COASTAL ZONE CONSISTENCY CERTIFICATION
ATTACHMENT 8
COASTAL ZONE CONSISTENCY CERTIFICATION
Revision 4 February 2011
February 2011 Carone DPP Revisions
8-1
ATTACHMENT 8.0 - COASTAL ZONE CONSISTENCY CERTIFICATION
8.1 COASTAL MANAGEMENT PROGRAM REVIEW
The proposed development activities for the Carpinteria Field, which are discussed in detail in the Revision to Development and Production Plan - Platform Hogan, Carpinteria Offshore Field (DPP), are consistent with the policies of the California Coastal Management Program. The proposed activities will be conducted in a manner which will ensure conformity with that program.
Each of the applicable California Coastal Zone Management Plan policies, as specified in the California Coastal Act, are presented below and evaluated relative to the proposed development activities. Based upon the evaluation included in this document, along with the information presented in the DPP, the proposed development activities complies with the State of California’s approved Coastal Management Program and will be conducted in such a manner which is consistent with the program.
8.2 SECTION 30211-PUBLIC ACCESS
30211. Development shall not interfere with the public’s right of access to the sea where acquired though use or legislative authorization, including, but not limited to, the use of dry sand and rocky coastal beaches to the first line of terrestrial vegetation.
8.2.1 Assessment
Proposed development of the Carpinteria Field will not require the construction of any new onshore or offshore facilities that would interfere with the public’s right of access to the sea. The drilling and operational phases of the Project would not increase local road traffic or impact the Level of Service of any roadways. All onshore truck traffic will utilize existing roadways including access routes (Highway 101 and Carpinteria Ave) to the Carpinteria Pier. Public access across the existing Dump Road access road and associated parking areas will be maintained throughout the life of the Project. None of the trucking activities to Carpinteria Pier will interfere with the public’s right of access to the sea.
8.2.2 Finding
The proposed Project would not provide new public access to the sea, nor will it interfere with current public access to the sea. The proposed Project is therefore consistent with this section of the Coastal Act.
8.3 SECTION 30230-MARINE RESOURCES; MAINTENANCE, AND 30231-BIOLOGICAL PRODUCTIVITY; WASTE WATER
30230. Marine resources shall be maintained, enhanced, and where feasible, restored. Special protection shall be given to areas and species of special biological or economic significance. Use of the marine environment shall be carried out in a manner that will sustain the
February 2011 Carone DPP Revisions
8-2
biological productivity of coastal waters and that will maintain healthy populations of all species of marine organisms adequate for long-term commercial, recreation, scientific, and educational purposes.
30231. The biological productivity and the quality of coastal waters, streams, wetlands, estuaries, and lakes appropriate to maintain optimum populations of marine organisms and for the protection of human health shall be maintained and, where feasible, restored though, among other means, minimizing adverse effects of waste water discharges and entrainment, controlling runoff, preventing depletion of ground water supplies and substantial interference with surface waterflow, encouraging waste water reclamation, maintaining natural vegetation buffer areas that protect riparian habitats, and minimizing alteration of natural streams.
8.3.1 Assessment
The Santa Barbara Channel contains a large number of important marine resources. The associated Biological Assessment, Essential Fish Habitat and the biological resources section of the Project specific environmental assessment describe in detail the seabirds, marine mammals, fish resources, and other flora and fauna of the area.
The development of the Carpinteria Field will not require any new offshore structures or facilities. The development will occur from the existing Platform Hogan. As discussed in the 2009 Essential Fish Habitat Analysis, Platform Hogan itself is an essential fish habitat because its construction created additional fish habitat and has supported a localized increase in the number of fish and marine organisms. The marine resources that have been documented around Platform Hogan are discussed in the following documents: Biological Assessment, Essential Fish Habitat, and the Marine Biology section of the Project specific environmental assessment. The presence of Platform Hogan has resulted in an increased fish population and has amplified biological productivity around the platform, and this effect is considered beneficial.
The development of the Carpinteria Field may result in an increase in waste discharges or produced water. PACOPS currently discharges produced water under the authority of two separate NPDES permits. Produced gross oil and water as obtained from both platform operations is transported to shore via pipeline. The produced water fraction is treated and returned via pipeline to platform Hogan where it is discharged with a relatively minor volume being routinely injected into a disposal well. Treated water quality is routinely monitored beyond what PACOPS’s NPDES permits currently require in that water quality chemistry monitoring occurs on an average of three times per week. Prudent operating practice dictates that such monitoring is essential in order to maintain optimal level of water treatment chemicals and to ensure that all produced water is optimally treated before it is allowed to leave the onshore treatment facility. The addition of chemicals include a corrosion inhibitor to maximize pipeline life, biocide to inhibit the likelihood of any proliferation of anaerobic H2S generating bacteria, a de-emulsifier to enhance initial oil/water separation, and a clarifier designed as a final polish for sustained water quality. This increase in discharge of water from Platform Hogan may have a minor, localized impact in the vicinity of the discharge point by increasing the concentration of such constituents as suspended solids/turbidity, oxygen demand, oil and grease, and trace metals. Any concentration of materials above normal background levels will be diluted rapidly
February 2011 Carone DPP Revisions
8-3
within the established mixing zone by waves and currents. PACOPS operates in full compliance with, and with far greater stringency than the provisions of its current NPDES permits require.
All solid wastes generated aboard the platform, with the exception of washed drill cuttings and drilling muds, will be collected and disposed of at appropriate onshore facilities in accordance with the EPA and local disposal permit conditions.
Oil contaminated soils, spend oils, solvents, etc. will be containerized, transported onshore and disposed of in an appropriate disposal site or as specified in the local disposal permit.
The US EPA and the BOEMRE strictly regulate discharges into the marine environment, including the discharge of drilling muds and cuttings. The ocean disposal of oil contaminated waste is prohibited. Drill cuttings will be collected from the shale shakers, and other solids control equipment, and brought to a unit where they are ground to micron size. Drill water from the rig floor and other liquid waste generated in the drilling operation are blended with the drill cuttings into a slurry. This blended slurry will be pumped down a dedicated injection well or a dedicated well annulus into subsurface rock strata. This approach to drill cutting disposal will eliminate any adverse impacts to marine resources.
The literature indicates that while marine mammals hear man-made noises and sounds generated by vessels, there is no indication that they are negatively affected by the noise (Richardson et al.,1995) Because noise and vessel sounds generated from the Project are localized and periodic, adverse impacts to marine mammals from noise are not expected. The literature suggests that some species, such as dolphins, may be attracted to vessels, but the majority will maintain a distance of 100-200 meters. Collisions of Project related vessels with marine mammals is extremely unlikely and all vessel operations will be conducted in accordance with established operating procedures designed to reduce impacts to marine wildlife.
Richardson et al. (1995) cite only a single source of information on the levels of noise produced by platform-based drilling activities. Gales (1982) recorded noise produced by drilling on and from production platforms offshore California. The noise produced was so weak that they were nearly undetectable even alongside the platform in sea states of Beaufort 3 or higher. No sound levels were computed, but the strongest received tones were very low frequency, about 5 Hz, at 119-127 dB re 1µPa. The highest frequency recorded was about 1.2 Hz. Richardson et al. (1995) predicted that the radii of audibility for baleen whales for production platform noise would be about 2.5 km in nearshore waters and 2km near the shelf break (MMS 2000).
For grey whales of the coast of central California, Malme et al. (1984) recorded a 50-percent response threshold to playback at 123 dB re 1µPa. This is well within 100m in both the nearshore and shelf-break waters. Therefore, the predicted radius of response for grey whales, and most likely other baleen whales, would be less than 100 m. Richardson predicted similar radii of response for Odontocetes and pinnipeds (MMS 2000). As such, noise impacts to marine mammals would be limited to within 100m of the platform.
February 2011 Carone DPP Revisions
8-4
8.3.2 Finding
The proposed activities are consistent with specified policies for the following reasons:
1. Compliance with BOEMRE regulations, EPA and State NPDES permit requirements.
2. Disposal of drill cuttings (pumped as a slurry back into strata), will have no impact on marine resources and productivity within State waters.
3. Produced water is transported to shore via pipeline, treated, and returned via pipeline to Platform Hogan where it is discharged full compliance with current NPDES permits.
4. All proposed platform and vessel operations are consistent with ongoing activities and will not result in any noise impacts to marine wildlife.
5. Vessel operations will be conducted in a manner consistent with current operational practices and in conformance with measures designed to reduce impacts to marine mammals.
8.4 SECTION 30232-OIL AND HAZARDOUS SUBSTANCE SPILLS
Protection against spillage of crude oil, gas, petroleum products, or hazardous substances shall be provided in relation to any development or transportation of such materials. Effective containment and cleanup facilities and procedures shall be provided for accidental spills that do occur.
8.4.1 Assessment
The proposed Project activities would not increase the probability of a spill. For current operations, PACOPS has calculated a Worst-Case Oil Discharge Scenario which has been both reviewed and approved by the Minerals Management Service (now BOEMRE) (as per 30 CFR 253; “Oil Spill Financial Responsibility for Offshore Facilities”). PACOPS’s current worst-case spill of approximately 500 barrels (bls) falls beneath the 1,000 bbl threshold that would trigger the necessity of obtaining a Certificate of Financial Responsibility under 30 CFR 253. Notwithstanding this fact, good operating business practice and prudent management dictates that PACOPS maintains such protection in the event of any spill, regardless of volume. No incremental increase to PACOPS’s worst-case spill discharge scenario volume is anticipated. Incrementally higher production will simply result in a correspondingly higher volume of gross fluid being transported from the platforms to shore per given unit of time. However, the volume of gross fluid in the pipeline at any given moment in time, and its corresponding water/oil ratio, as also noted at any given moment in time, will remain consistent with the current nominal water cut figure.
To reduce the risk of a spill, PACOPS currently regularly performs Pipeline Integrity Reviews at frequencies that meet the Department of Transportation requirements. In addition, pipeline inspections and corrosion prevention measures are implemented and a state of the art
February 2011 Carone DPP Revisions
8-5
ATMOS Pipeline Monitoring System, which monitors pressure and flow changes and performs automatic calculations to identify possible leaks on a 24 hour basis, is in place to monitor the pipeline. PACOPS has implemented a corrosion control program and will ensure that pipelines are maintained with acceptable corrosion penetration rates through their monitoring, corrosion inhibition and cleaning programs. Additionally, periodic pipeline integrity reviews will continue to be conducted to ensure the safety of the pipelines.
However, the potential for spills associated with the platform and the on and offshore pipelines remains. Protection against spillage of crude oil is a routine part of PACOPS’s operations. An Oil Spill Response Plan (OSRP) for Platform Hogan has been developed, and submitted to and approved by the BOEMRE. The OSRP describes the measures that will be taken in the event of an oil spill and the personnel and equipment available to implement spill containment and cleanup procedures. The basic procedure in the event of a spill is to immediately ensure personnel safety, stop spill flow, begin containment and cleanup procedures, and contact the designated company personnel and Government agencies. Platform personnel would conduct the initial spill response activity. For spills beyond the capability of the platform personnel and equipment, the primary sources of assistance would be from Clean Seas, an industry-sponsored spill containment cooperative.
Additional information on the oil spill equipment and response can be found in the approved OSRP for Platform Hogan and Houchin.
8.4.2 Finding
The proposed activities are consistent with the policy to protect against oil spills because: 1) all possible protective measures have been taken to prevent accidental spills; and 2) in the unlikely event that an oil spill does occur, all available means will be implemented to mitigate its impacts and to minimize or eliminate any adverse impacts to the marine resources of the area.
8.5 SECTION 30234-COMMERCIAL FISHING AND RECREATIONAL BOATING FACILITIES
Facilities serving the commercial fishing and recreational boating industries shall be protected and, where feasible, upgraded. Existing commercial fishing and recreational boating harbor space shall not be reduced unless demand for those facilities no longer exists or adequate substitute space has been provided. Proposed recreational boating facilities shall, where feasible, be designed and located in such a fashion as to not interfere with the needs of the commercial fishing industry.
8.5.1 Assessment
The drilling phase for development of the Carpinteria Field will involve vessel movements to and from Platform Hogan and the Carpinteria Pier. It is projected that the proposed Project will not result in an increase in annual number of supply or crew boat trips to the platform. The supply and crew boats that will be used are existing boats that currently service Platform Hogan. All vessel operations will use the existing oil service vessel corridors to
February 2011 Carone DPP Revisions
8-6
extent feasible. In addition, Carpinteria Pier is not open to the public, and the supply and crew boats are moored to buoys adjacent to the Pier rather than at the Santa Barbara Harbor. Therefore, the development of the Carpinteria Field will not reduce commercial fishing or recreational boating harbor space. No additional supply boat trips above what is required for the proposed Project will be needed once drilling is completed.
8.5.2 Finding
The proposed Project will not compete with commercial or recreational vessels for available dock space or ancillary facilities and is therefore consistent with the policy presented above.
8.6 SECTION 30240-ENVIRONMENTALLY SENSITIVE HABITAT AREAS; ADJACENT DEVELOPMENTS
Environmentally sensitive habitat areas shall be protected against any significant disruption of habitat values, and only uses dependent on those resources shall be allowed within those areas.
Development in areas adjacent to environmentally sensitive habitat areas and parks and recreation areas shall be sited and designed to prevent impacts which would significantly degrade those areas, and shall be compatible with the continuance of those habitat and recreation areas.
8.6.1 Assessment
The proposed development of the Carpinteria Field will occur from the existing Platform Hogan. No new facilities will need to be built in order to accommodate the production of State leases. Platform Hogan is not located within or considerably close to any environmentally sensitive habitat areas.
The proposed development could impact environmentally sensitive areas such as the Channel Islands National Marine Sanctuary, the Channel Islands National Park, the Carpinteria Salt Marsh, or the Goleta Slough in the unlikely event of a major oil spill occurring and reaching the shoreline. The current peak oil production from Platform Hogan is estimated to be 5,500 bbls per day, and is not anticipated to increase significantly with the development of the Carpinteria Field. No incremental increase to PACOPS’s worst-case spill discharge scenario volume is anticipated. Incrementally production will simply result in a similar volume of gross fluid being transported from the platforms to shore per given unit of time. Therefore, the proposed Project will not increase the severity of impacts in the unlikely case of a spill.
The Oil Spill Response Plan, for Platform Hogan and associated pipelines, defines the sensitive ecological areas within possible oil spill paths and delineates procedures to protect these areas from contamination.
Normal operation of seafloor pipelines will not impact sensitive habitation areas. In the unlikely chance of an accidental spill, offshore kelp beds, rocky intertidal habitats, sensitive salt
February 2011 Carone DPP Revisions
8-7
marshes and estuaries, and many of Santa Barbara, Goleta and Carpinteria’s beaches could be adversely affected. PACOPS’s OSRP includes specific reference to these areas to help minimize impacts in the event of an accidental spill.
8.6.2 Finding
The proposed activities will be conducted so that adverse environmental impacts on important habitat areas will be avoided. The proposed Project is consistent with this policy because normal Project activities will not have any adverse impacts on environmentally sensitive habitat areas. Observing the requirements of the BOEMRE, which require that immediate action be take to minimize impacts on water and marine resources, would reduce the impacts of an oil spill.
8.7 SECTION 30244 - ARCHAEOLOGICAL OR PALEONTOLOGICAL RESOURCES
Where development would adversely impact archaeological or paleontological resources as identified by the State Historic Preservation Officer, reasonable mitigation measures shall be required.
8.7.1 Assessment
As indicated within Section 5.12 (Archaeology) no structural changes to the submerged portion of the Platform are proposed, therefore no underwater cultural or archaeological impacts would result. Changes made to the above water portion of the Project will be contained within the existing Platform; therefore, no risk to archaeological or paleontological sites would occur. In the event of an oil spill that would have the potential to affect archaeological resources as identified by the CDFG Area Contingency Plan, all activities and notifications would be conducted in accordance with the Platform’s existing OSRP as outlined within Attachment 9 (Oil Spill Risk Assessment).
8.7.2 Finding
The proposed Project is consistent with this policy because no subsurface construction will be required that has the potential to affect archaeological or paleontological resources; and in the event of an oil spill, all reasonable mitigation measures and notifications to appropriate responsible agencies would be conducted.
8.8 SECTION 30251-SCENIC AND VISUAL QUALITIES
The scenic and visual qualities of coastal areas shall be considered and protected as a resource of public importance. Permitted development shall be sited and designed to protect views to and along the ocean and scenic coastal areas, to minimize the alteration of natural land forms, to be visually compatible with the character of surrounding areas, and where feasible, to restore and enhance visual quality in visually degraded areas. New development in highly scenic area such as those designated in the California Coastline Preservation and Recreation Plan prepared by the Department of Parks and Recreation and by local government shall be subordinate to the character of its setting.

February 2011 Carone DPP Revisions
8-8
8.8.1 Assessment
The proposed development of the Carpinteria Field from the existing Platform Hogan will not require the construction of any new offshore facilities. The Project will be done by installing a new 1,000 hp all electric drill rig on Platform Hogan and using existing well slots. Because the drill rig will be placed on an existing platform which is 3.7 miles from shore, the drill rig will not significantly alter the current view. As such, no activities associated with the development of the Carpinteria Field would adversely change the existing scenic and visual qualities of the area.
8.8.2 Finding
The proposed Project is considered consistent with this policy because no new construction will be required, and therefore, there will be no change in the existing scenic and visual qualities of the area.
8.9 SECTION 30253-MINIMIZATION OF ADVERSE IMPACTS
New development shall:
a. Minimize risks to life and property in areas of high geologic, flood and fire hazard.
b. Assure stability and structural integrity, and neither create nor contribute significantly to erosion, geologic instability, or destruction of the site or surrounding areas or in any way require the construction of protective devices that would substantially alter natural landforms along bluffs and cliffs.
c. Be consistent with requirements imposed by an air pollution control district or the State Air Resources Board as to each particular development.
d. Minimize energy consumption and vehicle miles traveled.
e. Where appropriate, protect special communities and neighborhoods that, because of their unique characteristics, are popular visitor destination points for recreational uses.
8.9.1 Assessment
The development of the Carpinteria Field will not require the construction of any new offshore facilities. The State leases proposed for development will be developed using existing well slots on Platform Hogan. All oil and gas production will be handled with existing facilities, except for minor alterations to current facilities for measurement and allocation purposes. Therefore, no proposed activities would affect areas of high geologic, flood or fire hazard. Since no new facilities are being proposed, there would be no new impacts to geologic stability, or require the construction of protective devices that would alter natural landforms along bluffs or cliffs.
February 2011 Carone DPP Revisions
8-9
The proposed development of the Carpinteria Field will be covered by the existing Permits to Operate (PTOs) which have been issued by the Santa Barbara County Air Pollution Control District (APCD). Estimates of the emissions associated with the proposed development will be provided in the Air Quality section of the projects environmental assessment. All of the emissions associated with the proposed development will be offset consistent with APCD rules and regulations.
Energy consumption will be minimized during proposed activities by the use of an electric drill rig on Platform Hogan, which is connected to the Southern California Edison electrical grid, via a power cable from shore. The Project itself will represent a net increase in energy production.
Since no onshore construction is required, no significant impacts to transportation systems from the proposed Project are expected. The proposed development will no create a substantial increase in vehicle trips per day, nor will it disrupt or affect any special communities or neighborhoods.
8.9.2 Finding
The proposed development of the Carpinteria Field is consistent with the above policy for the following reasons:
1. Since no new offshore structures will be built as a part of the proposed development, no Project components will impact high geologic, flood or fire hazards.
2. The proposed development will occur from the existing Platform Hogan. The platform was designed to remain stable, even under maximum credible earthquake conditions. The platform was also designed to withstand maximum feasible oceanographic conditions and has recently under gone an independent recertification of the structure.
3. Adhering to the rules and drilling procedures provided by the BOEMRE and CSLC, and implementation of best available safety technology will minimize the risk of a loss of well control.
4. The proposed development will use existing pipelines. These pipelines are designed to minimize the risk of damage from geologic hazards and to ensure their structural integrity. The onshore on-shore pipelines will not require any changes or new construction; therefore there will be no need for the installation of protective devices that could substantially alter natural landforms along bluffs or cliffs.
5. The proposed development will be covered under the existing PTOs for the current facilities which were issues by the Santa Barbara County APCD. Air emissions associated with the proposed development will be offset consistent with APCD Rules and Regulations.
February 2011 Carone DPP Revisions
8-10
6. Energy consumption will be minimized during the proposed activities by use of an electric drill rig which will be connected to the Southern California Edison power grid.
7. The Santa Barbara and Ventura coastal regions provide a multitude of recreational opportunities that attract tourism to the area. The proposed development will be situated approximately 19 miles from the Channel Islands National Park, which is a popular destination for various forms of recreational uses. The development will be satiated approximately 4 miles southwest of Carpinteria City Beach and Carpinteria State beach, a popular destination for day users and overnight campers. Project activities will occur at a sufficient distance from the national, state and city parks to avoid any adverse impacts during normal activities. Recreational activities along the Santa Barbara and Ventura coastlines will not be disrupted since there are no construction activities associated with the proposed Project. No long-term effects on recreational opportunities are expected to result from the Project, since all activities will occur from existing oil and gas infrastructure.
8.10 SECTION 30260-INDUSTRIAL DEVELOPMENT; LOCATION OR EXPANSION
Coastal-dependent industrial facilities shall be encouraged to locate or expand within existing sites and shall be permitted reasonable long-term growth where consistent with this division. However, where new or expanded coastal-dependent industrial facilities cannot feasibly be accommodated consistent with other policies of this division, they may nonetheless be permitted in accordance with this section and Sections 30261 and 30262 if (1) alternative locations are infeasible or more environmentally damaging; (2) to do otherwise would adversely affect public welfare; and (3) adverse environmental effects are mitigated to the maximum extent feasible.
8.10.1 Assessment
The development of the Carpinteria Field will not require the construction of any new facilities. The Project will be completed using existing well slots on Platform Hogan. All oil and gas processing will be handled in existing facilities with minor modifications. Therefore, the development of the Carpinteria Field will not result in any new or expanded industrial development over what currently exists.
8.10.2 Finding
The development of the Carpinteria Field will not result in any new or expanded industrial development over what exists today.
8.11 SECTION 30262-OIL AND GAS DEVELOPMENT
A. Oil and gas development shall be permitted in accordance with Section 30260, if the following conditions are met:
1. The development is performed safely and consistently with the geologic conditions of the well site.
February 2011 Carone DPP Revisions
8-11
2. New or expanded facilities related to such development are consolidated, to the maximum extent feasible and legally permissible, unless consolidation will have adverse environmental consequences and will not significantly reduce the number of producing wells, support facilities, or sites required to produce the reservoir economically and with minimal environmental impacts.
3. Environmentally safe and feasible subsea completions are used when drilling platforms or islands would substantially degrade coastal visual qualities unless use of such structures will result in substantially less environmental risk.
4. Platforms or islands will not be sited where a substantial hazard of vessel traffic might result from the facility or related operation, determined in consultation with the USCG and the Army Corp of Engineers.
5. Such development will not cause or contribute to subsidence hazards unless it is determined that adequate measures will be undertaken to prevent damage from such subsidence.
6. With respect to new facilities, all oilfield brines are reinjected into oil producing zones unless the Division of Oil and Gas of the Department of Conservation determines to so do would adversely affect production of the reservoirs and unless injection into other subsurface zones will reduce environmental risks. Exemptions to reinjection will be granted consistent with the Ocean Waters Discharge Plan of the State Water Resources Control Board and where adequate provision is made for the elimination of petroleum odors and water quality problems.
7. All oil produced offshore California shall be transported onshore by pipelines only. The pipelines used to transport this oil shall utilize the best achievable technology to ensure maximum protection of public health and safety and of the integrity and productivity of terrestrial and marine ecosystems.
8. Once oil produced offshore California is onshore, it shall be transported to processing and refining facilities by pipeline.
9. If a state of emergency is declared by the Governor for an emergency that disrupts the transportation of oil by pipeline, oil may be transported by a waterborne vessel, if authorized by permit, in the same manner as required by emergency permits that are issued pursuant to Section 30624.
10. In addition to all other measures that will maximize the protection of marine habitat and environmental quality, when an offshore well is abandoned, the best achievable technology shall be used.
B) When appropriate, monitoring programs to record land surface and near-shore ocean floor movements shall be initiated in locations of new large-scale fluid extraction on land or near shore before operations begin and shall continue until surface conditions have
February 2011 Carone DPP Revisions
8-12
stabilized. Cost of monitoring and mitigation programs shall be borne by liquid and gas extraction operators.
C) Nothing in this section shall affect the activities of any state agency that us responsible for regulating the extraction, production, or transport of oil and gas.
8.11.1 Assessment
The proposed activities are consistent with the enumerated policies for the following reasons:
A) The proposed development will be in accordance with Section 30262 for the following reasons:
1. The development of the Carpinteria Field will occur from existing Platform Hogan, which was designed and built to meet all safety requirements. The proposed drilling program has been designed to account for subsurface geologic conditions and in a manner consistent with the past drilling program. Such programs have resulted in numerous wells being drilled from Platform Hogan and surrounding platforms. Therefore, the Project activities will be compatible with geologic conditions of the well site.
2. The proposed development will utilize existing facilities for the drilling, processing and transportation of the oil and gas production with minimal modifications. Conductors currently used for Federal wells on Hogan will be transitioned for use by State wells over time, as Federal wells become uneconomic. Therefore, there are sufficient well slots from the existing platforms to implement the proposed State drilling program without impacting Federal production. The proposed Project is consistent with the requirement to consolidate such facilities when possible.
3. Since the proposed Project will be completed with the use of an existing platform and facilities, a subsea completion will not be necessary to avoid the potential impacts from installing a new platform.
4. Platform Hogan, which will be used for the development of the Carpinteria Field, is located sufficiently clear of the existing northbound shipping lane. The platform was sited in accordance with the requirements of the U.S. Army Corps of Engineers and the U.S. Coast Guard.
5. The development of the Carpinteria Field will occur from existing Platform Hogan, which was designed and built to meet all existing geologic conditions. Therefore, the proposed Project will not cause or contribute to subsidence hazards.
6. Produced water will be injected into offshore injection wells to the extent feasible. When injection is not available produced water will be discharged to the ocean following processing and treatment in accordance with the current NPDES
February 2011 Carone DPP Revisions
8-13
permit. Currently, PACOPS discharges 4,000 barrels of water per day (bwpd) into the ocean in accordance with the current NPDES permit.
7. The proposed development will utilize existing pipelines for the transportation of the oil and gas production. Best available safety technology will be used to ensure maximum protection of public health and safety, and of the entegrity and productivity of terrestrial and marine ecosystems. Pipeline inspections and corrosion prevention measures are implemented and a state of the art ATMOS Pipeline Monitoring System, which monitors pressure and flow changes and performs automatic calculations to identify possible leaks on a 24 hour basis, is in place to monitor the pipeline. PACOPS has implemented a corrosion control program and will ensure that pipelines are maintained with acceptable corrosion penetration rates through their monitoring, corrosion inhibition and cleaning programs. Additionally, periodic pipeline integrity reviews will be conducted to ensure the safety of the pipelines.
8. The proposed Project will use existing onshore pipelines to transport oil and gas from the existing La Conchita processing and refining facility to refining facilities located in the LA basin.
9. If a state of emergency is declared by the Governor that disrupts the transportation of oil by pipeline, and it becomes necessary to transport oil via a waterborne vessel, then and emergency permit will be acquired pursuant to Section 30624.
10. When a well is abandoned at Platform Hogan, whether related to the proposed Project or not, best available technology will be used to maximize the protection or marine habitat and environmental quality.
B) The casing and mud program for the Project will use the best available safety technology to minimize the risk of a loss of well control resulting from communication between a higher pressure strata and lower pressure strata. All wells will be drilled following BOEMRE and CSLC approved drilling procedures.
C) The proposed Project activities will be conducted in accordance with the requirement of state agencies responsible for the extraction, production or transport of oil.
8.11.2 Finding
The proposed activities are consistent with the enumerated policies as outlined above.
February 2011 Carone DPP Revisions
REVISED FEBRUARY 2011
ATTACHMENT 9.0
OIL SPILL RISK ASSESSMENT
ATTACHMENT 9
OIL SPILL RISK ASSESSMENT
PLATFORM HOGAN DPP REVISIONS
Revision 4
February 2011
February 2011 Carone - DPP Revisions
9-1
ATTACHMENT 9 OIL SPILL RISK ASSESSMENT - PLATFORM HOGAN DPP REVISIONS
9.1 WORST-CASE SPILL VOLUME
The following section describes the potential worst-case discharge that could occur during drilling operations within the Carpinteria Field. The analysis is based on information provided by PACOPS for Platforms Hogan and Houchin within their existing Oil Spill Response Plan (OSRP) which has been summarized below. It should be noted that per the requirements of 30 CFR 250.243(h) and the associated National Notice to Lessees and Operators (NTL) 2010-N06, PACOPS has provided an estimate of potential spill volumes associated with the unlikely event of an uncontrolled well release (blowout). In response to this requirement, PACOPS contracted with Gemini Solutions, Inc. (Gemini) of Richmond, Texas to conduct studies and model a worst-case discharge (WCD) scenario for the Carpinteria Field. Gemini completed studies for both Sub-Thrust and Supra-Thrust reservoirs in the Carpinteria Field project area. According to Gemini, “the models for each of these reservoirs show that the current reservoir pressures are lower than the pressure required for the wells to flow under a WCD scenario…. All models showed that the current reservoir pressures are too low to flow the wells in a WCD scenario.” As such, Gemini determined that the worst-case discharge rates for the Carpinteria Field are zero (0) bbls from an uncontrolled well release (blowout). (Please refer to the Comment Letter attached to this submittal for a copy of all Gemini documents including the February 14th 2011 Summary Letter as well as three (3) PowerPoint presentations by Gemini discussing the Final Report dated 1/25/2011).
Although the worst-case discharge rates for a blowout within the Carpinteria Field are zero (0) bbls, analysis within this section has been provided regarding simulations for an unanticipated release from a pipeline spill (worst-case discharge) lasting 3 days, 10 days, and 30 days. The following information includes detail regarding each of these potential spill scenarios based on the guidance provided by the BOEMRE (formerly MMS) Oil Spill Risk Analysis. Specifically, Specifically, Attachment 9 has been modified to include additional information regarding sensitive coastal resources identified in the Area Contingency Plan.
9.1.1 PACOPS OSCP ESTIMATES
The worst-case discharge has been calculated within the existing Platforms Hogan and Houchin Oil Spill Response Plan (dated January 2001 with updates through 2008) in accordance with 30 CFR §254.47. The OSRP consists of the greatest of the worst-case discharges from each of the two platforms, the pipelines, and from exploratory drilling operations. Since all the pipelines are connected to the platforms, their worst-case discharges are included in the platforms and not considered separately. Based on the calculation completed below PACOPS estimates the BOEMRE (formerly MMS) worst-case discharge potential for the facilities is 495.77 bbls of oil while the OSPR Reasonable Worst-Case Discharge is 47 bbls.
The reservoir is very mature and must be pumped to produce. There are no flowing wells. Hence, considering the reservoir characteristics, it would be virtually impossible for an
February 2011 Carone - DPP Revisions
9-2
uncontrolled blowout to occur at either of the platforms. Thus, this component of the reasonable worst-case discharge has been assumed to be zero (Gemini, 2011).
Thus, the worst-case discharge from Platform Hogan consists of the sum of the following:
• The maximum capacity of all of the oil storage tanks and flowlines on the platform.
• The volume of oil calculated to leak from a break in any of the pipelines (i.e., inter-platform and subsea pipelines) connected to the facility considering shutdown time and the effect of hydrostatic pressure, gravity, frictional wall forces, and other factors.
PACOPS calculations assume a five-minute shutdown time and a total containment is achieved within a 48-hour period from the time of an initial total breech. A produced oil/water ratio of 0.3188 is assumed. This ratio is taken as the average of the last three months of actual production of the oil/water ratios from March 1999 through May 1999.
9.1.1.1 Analysis
1. Flow Until Emergency Shutdown. The first step of the spill occurs when the pipeline parts near the base of the platform. The fluids (water and oil) are being pumped at a rate of 4.4 bbl/minute. The response time for the emergency shutdown of the pipeline due to a pressure safety low (PSL) is approximately 45 seconds. Therefore, we can conservatively assume that the valve will close in 2-to-5 minutes. Assuming 5 minutes and 4.4 bbl/minute, then 22 bbl is released.
2. Equalization of Platform Piping. The next step of the spill is the hydrostatic equalization of draining of platform piping. The specific gravity of the bulk fluid is almost the same as seawater: {[(45,000/190,000) x 0.93] +[(145,000/190,000) x 1.02]} = 1.00. The bulk fluid interface is 153 feet above the seafloor [(150’ x 1.02)/1.00]. If we conservatively assume the deck piping runs horizontally about 50 feet, we have (200 & 153) + 50 = 97 feet of piping with a fill volume of approximately 0.1 bbl/foot. The amount of fluids that discharge is: 97 feet x 0.1 bbl/foot = 9.7 bbl or 10 bbl release.
3. Oil Separation from Pipeline due to Delta Specific Gravity. We can conservatively look at the pipeline as a separator. Typical light hydrocarbons such as condensate have a 5-minute retention time to separate approximately one foot by difference in specific gravities. Over 48 hours after the break (i.e., the estimated time it takes to locate and temporarily plug the pipeline), oil can separate almost 600 feet [(48 x 60)/5 = 576]. We can conservatively say 15 bbl [600 x 0.1 bbl/foot x (45,000/190,000) = 14.21 bbl] could separate out due to delta specific gravity of the fluids (based on light condensate versus heavier crude).
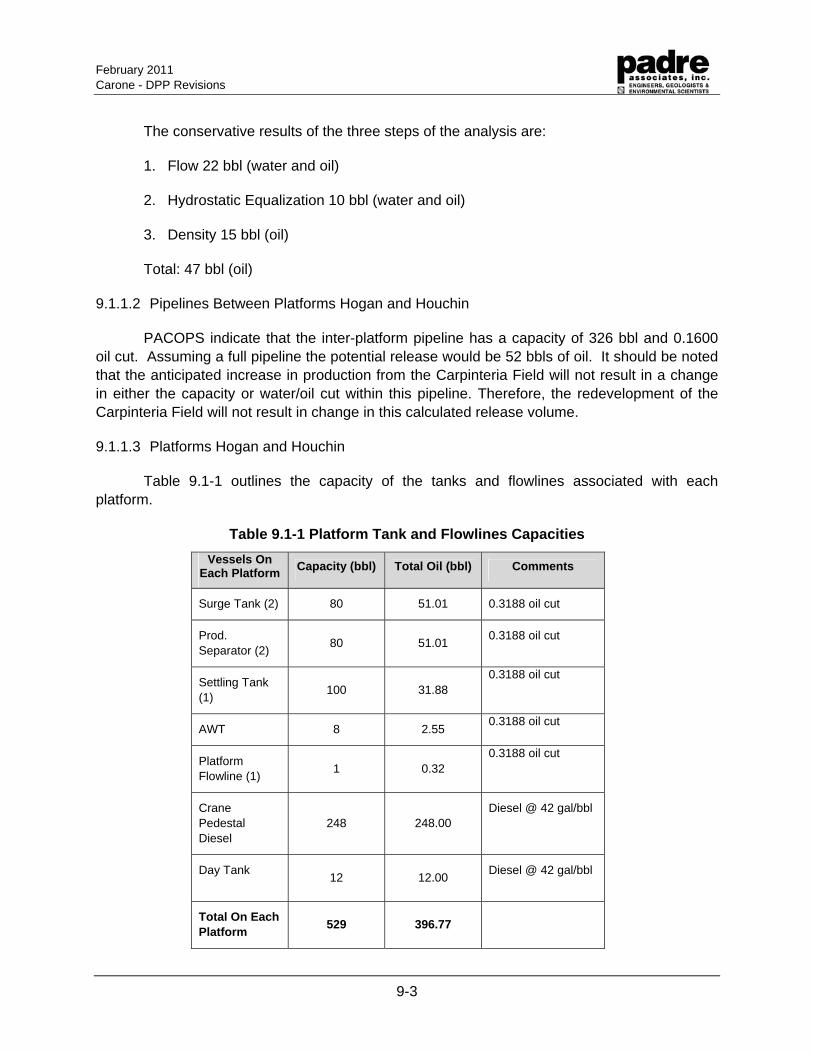
February 2011 Carone - DPP Revisions
9-3
The conservative results of the three steps of the analysis are:
1. Flow 22 bbl (water and oil)
2. Hydrostatic Equalization 10 bbl (water and oil)
3. Density 15 bbl (oil)
Total: 47 bbl (oil)
9.1.1.2 Pipelines Between Platforms Hogan and Houchin
PACOPS indicate that the inter-platform pipeline has a capacity of 326 bbl and 0.1600 oil cut. Assuming a full pipeline the potential release would be 52 bbls of oil. It should be noted that the anticipated increase in production from the Carpinteria Field will not result in a change in either the capacity or water/oil cut within this pipeline. Therefore, the redevelopment of the Carpinteria Field will not result in change in this calculated release volume.
9.1.1.3 Platforms Hogan and Houchin
Table 9.1-1 outlines the capacity of the tanks and flowlines associated with each platform.
Table 9.1-1 Platform Tank and Flowlines Capacities
Vessels On Each Platform
Capacity (bbl) Total Oil (bbl) Comments
Surge Tank (2) 80 51.01 0.3188 oil cut
Prod. Separator (2)
80 51.01 0.3188 oil cut
Settling Tank (1)
100 31.88 0.3188 oil cut
AWT 8 2.55 0.3188 oil cut
Platform Flowline (1)
1 0.32 0.3188 oil cut
Crane Pedestal Diesel
248 248.00 Diesel @ 42 gal/bbl
Day Tank 12 12.00
Diesel @ 42 gal/bbl
Total On Each Platform
529 396.77
February 2011 Carone - DPP Revisions
9-4
9.2 TRAJECTORY ANALYSIS
This appendix presents the results of pat drifter and trajectory studies and oil spill modeling conducted for Platform Hogan. Two models were examined, the BOEMRE (Formerly MMS) Oil Spill Risk Analysis (OSRA) and the General National Oceanic and Atmospheric Administration Office of Response and Restoration (NOAA) Oil Modeling Environment (GNOME). Each is a publicly available model.
9.2.1 BOEMRE (formally MMS) PROBABLISTIC APPROACH (OSRA)
In July 2000, MMS used their Oil Spill Risk Analysis (OSRA) for the California Pacific region, which provides a probabilistic analysis of oil spill trajectories for use in preparing spill response plans. The results of this analysis were reviewed to identify land segments and resources on the California coast and nearby islands most likely to be impacted by an oil spill. Figure 9.2-1 shows the southern California coastline and nearby islands with a grid numbering system used by BOEMRE (formerly MMS) to identify specific land segments. These segments correspond with maps included in Section 4600 of the Los Angeles/Long Beach Area Contingency Plan (2000 ACP revision). The BOEMRE (formerly MMS) results list probabilities that specific land segments will be contacted by an oil spill starting at a particular location within 3, 10, and 30 days. The seasonal average probabilities are most useful for identifying segments and resources at risk for each of the four primary seasonal periods (Table 9.2-1). (The MMS tables round to the nearest percent, so segments with less than 0.5 percent chance of contact would be shown as zero.)
The OSRA trajectory analysis indicates that during the spring and summer months, there is a 64-78 percent chance that an oil spill would travel eastward towards the City of Carpinteria shoreline within three days of occurrence. During the spring, there is a slight chance (ranging from between 1-6 percent) that within 30 days a spill could reach the southern Channel Islands (Catalina and San Clemente Islands).
During the autumn and winter months, the results show a much greater distribution along the coastline between northern Santa Barbara County southward to southern Ventura County with a range of 11-14 percent chance in Carpinteria within 3 days; as well as small percentages (ranging from 1-13 percent chance) primarily at the northern Channel Islands (San Miguel, Santa Rosa, Santa Cruz and Anacapa Islands) within 30 days.
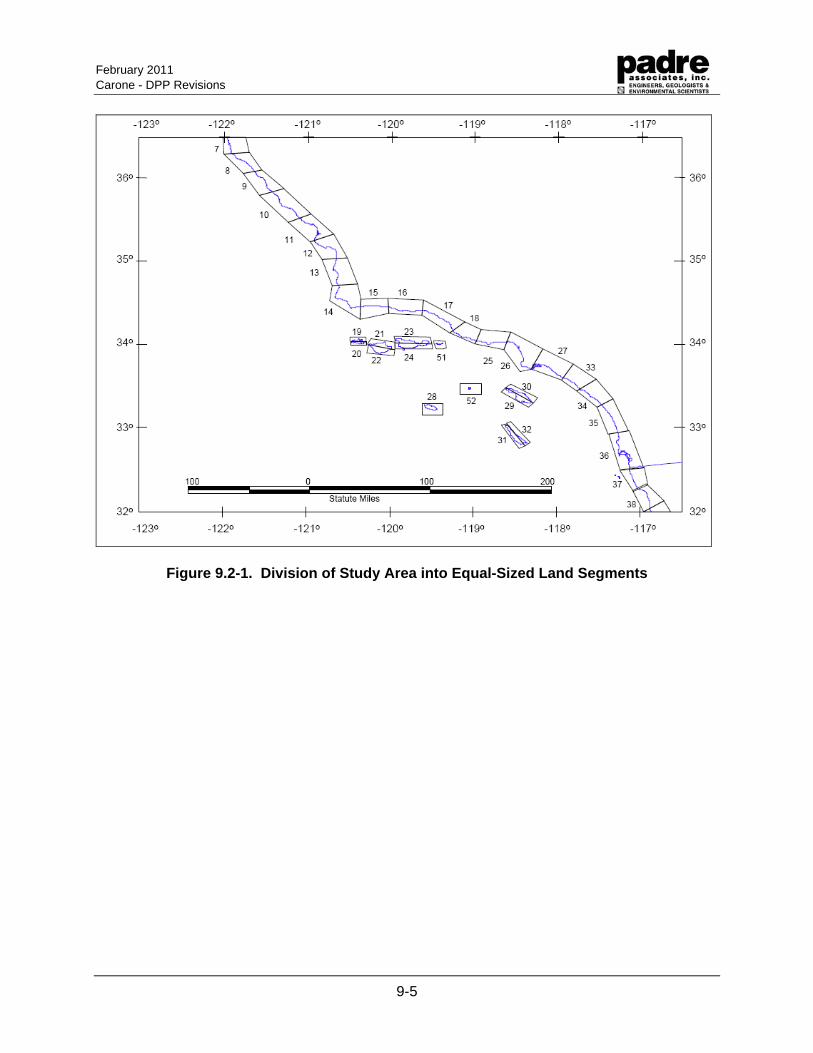
February 2011 Carone - DPP Revisions
9-5
Figure 9.2-1. Division of Study Area into Equal-Sized Land Segments
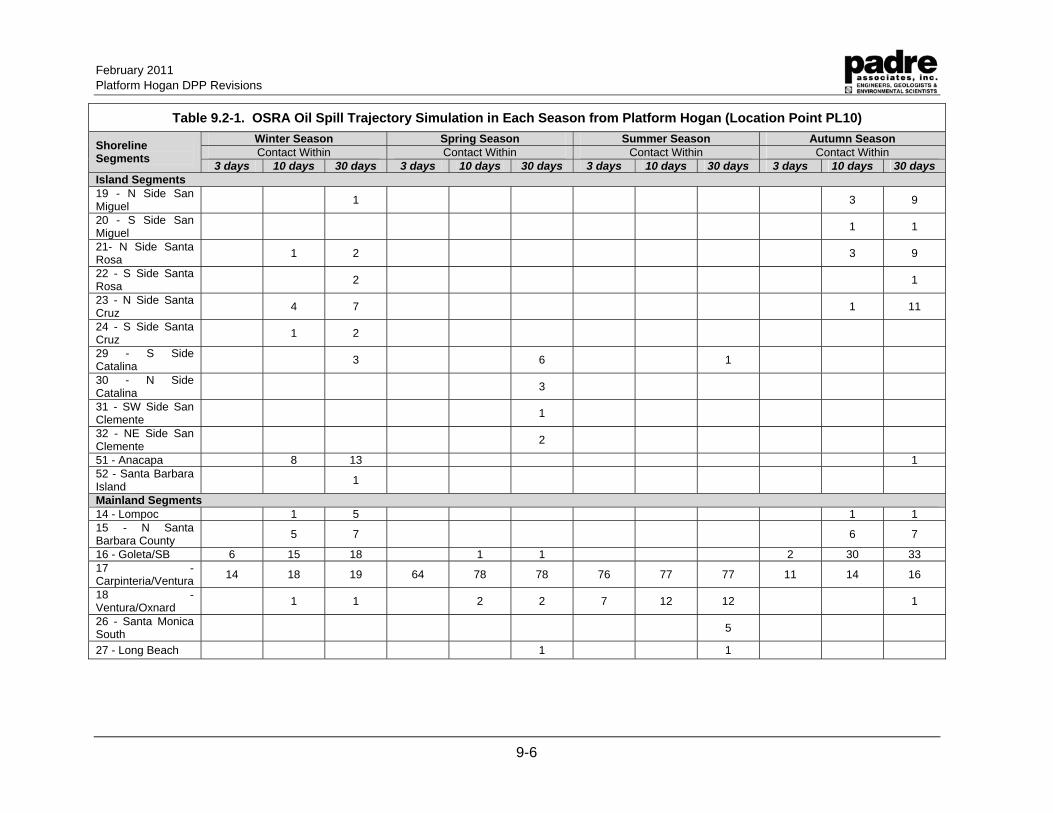
February 2011 Platform Hogan DPP Revisions
9-6
Table 9.2-1. OSRA Oil Spill Trajectory Simulation in Each Season from Platform Hogan (Location Point PL10)
Winter Season Spring Season Summer Season Autumn Season Contact Within Contact Within Contact Within Contact Within
Shoreline Segments
3 days 10 days 30 days 3 days 10 days 30 days 3 days 10 days 30 days 3 days 10 days 30 days Island Segments 19 - N Side San Miguel
1 3 9
20 - S Side San Miguel
1 1
21- N Side Santa Rosa
1 2 3 9
22 - S Side Santa Rosa
2 1
23 - N Side Santa Cruz
4 7 1 11
24 - S Side Santa Cruz
1 2
29 - S Side Catalina
3 6 1
30 - N Side Catalina
3
31 - SW Side San Clemente
1
32 - NE Side San Clemente
2
51 - Anacapa 8 13 1 52 - Santa Barbara Island
1
Mainland Segments 14 - Lompoc 1 5 1 1 15 - N Santa Barbara County
5 7 6 7
16 - Goleta/SB 6 15 18 1 1 2 30 33 17 - Carpinteria/Ventura
14 18 19 64 78 78 76 77 77 11 14 16
18 - Ventura/Oxnard
1 1 2 2 7 12 12 1
26 - Santa Monica South
5
27 - Long Beach 1 1
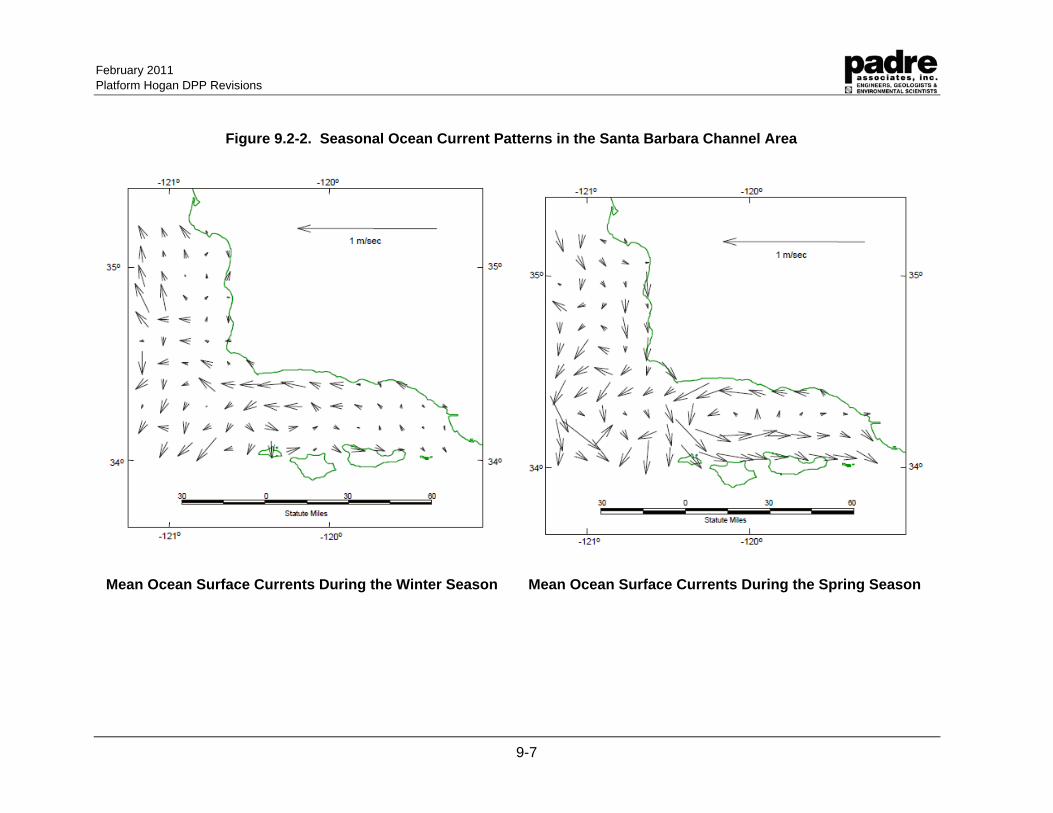
February 2011 Platform Hogan DPP Revisions
9-7
Figure 9.2-2. Seasonal Ocean Current Patterns in the Santa Barbara Channel Area
Mean Ocean Surface Currents During the Winter Season Mean Ocean Surface Currents During the Spring Season
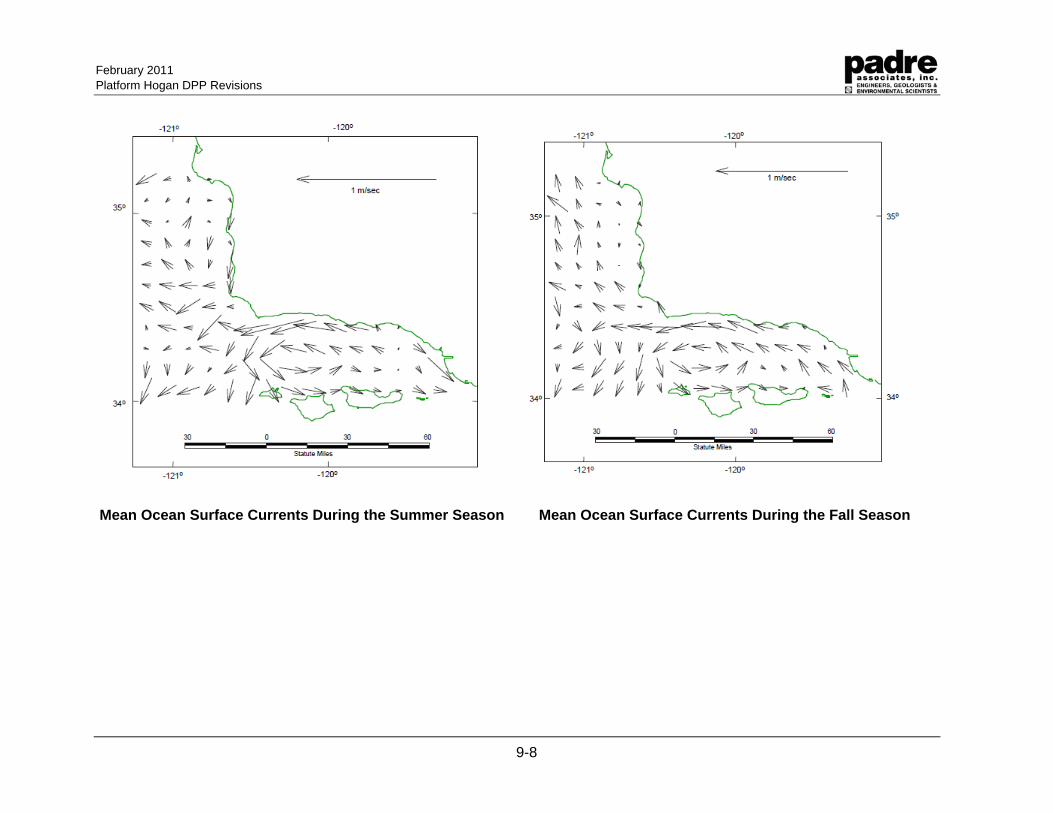
February 2011 Platform Hogan DPP Revisions
9-8
Mean Ocean Surface Currents During the Summer Season Mean Ocean Surface Currents During the Fall Season
February 2011 Platform Hogan DPP Revisions
9-9
9.2.2 NOAA GNOME Model
An Oil Spill Trajectory Analysis tool that the Company will use for their Carpinteria Field Development is NOAA’s GNOME (General NOAA Oil Modeling Environment) model. This modeling was used to present possible movement and fate of an oil spill occurring at either of these locations.
GNOME is a trajectory model that can conduct the following functions:
1. Estimate the trajectory of spills by processing information that is provided about wind and weather conditions, circulation patterns, river flow, and the oil spill(s) one wishes to simulate.
2. Predict the trajectories that can result when there is inexactness (uncertainty) in current and wind observations and forecasts.
3. Use weathering algorithms to make simple predictions about the changes the oil will undergo while it is exposed to the environment.
4. Quickly be updated and re-run with new information.
5. Provide trajectory output (including uncertainty estimates) in a geo-referenced format that can be used as input to GIS (geographic information system) programs.
In using GNOME, information about an oil spill scenario is entered. GNOME then creates and displays a spill "movie," showing how the oil spilled in a scenario is predicted to move and spread across the water. Available within GNOME are different modes in which the model can be run.
GNOME Model Setting: GNOME is an oil spill trajectory model that uses variables such as winds, currents, tides, and spreading to simulate oil movement. The GNOME model is used to predict worst-case oil spill movements. The modeling was done with a variety of different variables in order to get all possible results if an oil spill occurred. GNOME created a map specifically for the Santa Barbara coastline and three types of currents unique to the Santa Barbara Channel and Santa Maria Basin. The three different current types are upwelling, convergent and relaxation.
The model used the same oceanographic and meteorological conditions as were modeled in the MMS report, Delineation Drilling Activities in the Federal Waters Offshore Santa Barbara, California: Draft Environmental Impact Statement, 2001 (MMS, 2001-046). The conditions were different for each current and shown below.
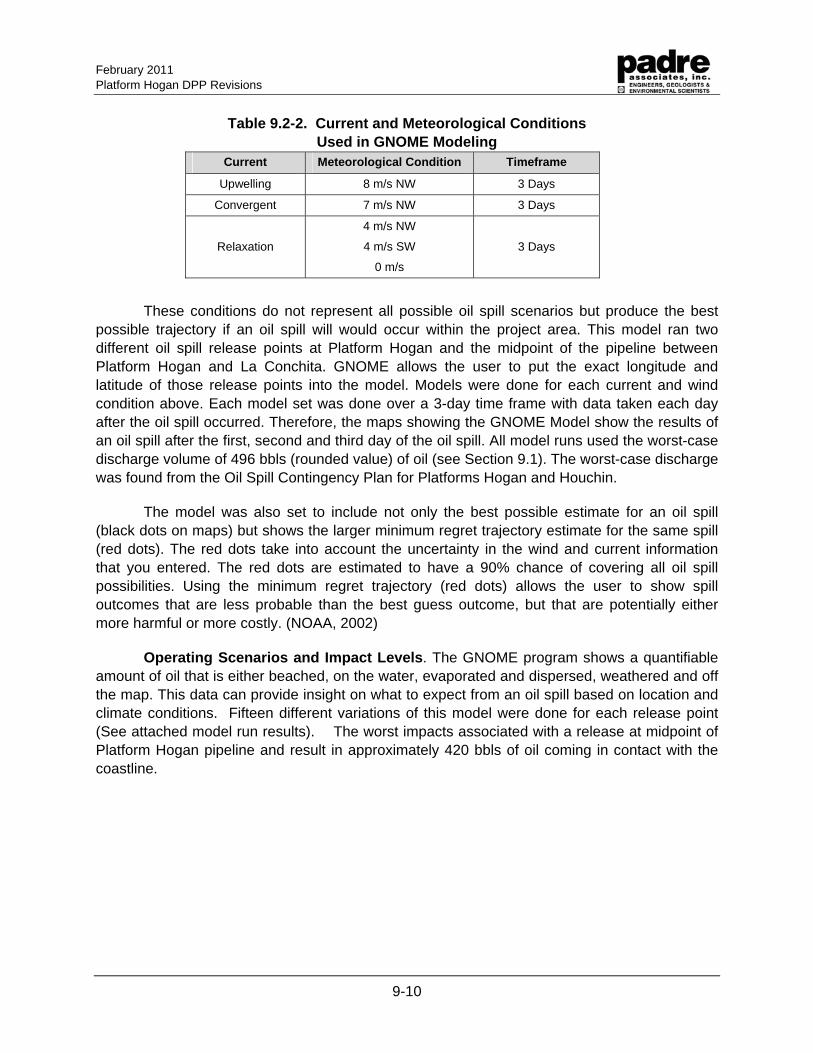
February 2011 Platform Hogan DPP Revisions
9-10
Table 9.2-2. Current and Meteorological Conditions Used in GNOME Modeling
Current Meteorological Condition Timeframe
Upwelling 8 m/s NW 3 Days
Convergent 7 m/s NW 3 Days
Relaxation
4 m/s NW
4 m/s SW
0 m/s
3 Days
These conditions do not represent all possible oil spill scenarios but produce the best possible trajectory if an oil spill will would occur within the project area. This model ran two different oil spill release points at Platform Hogan and the midpoint of the pipeline between Platform Hogan and La Conchita. GNOME allows the user to put the exact longitude and latitude of those release points into the model. Models were done for each current and wind condition above. Each model set was done over a 3-day time frame with data taken each day after the oil spill occurred. Therefore, the maps showing the GNOME Model show the results of an oil spill after the first, second and third day of the oil spill. All model runs used the worst-case discharge volume of 496 bbls (rounded value) of oil (see Section 9.1). The worst-case discharge was found from the Oil Spill Contingency Plan for Platforms Hogan and Houchin.
The model was also set to include not only the best possible estimate for an oil spill (black dots on maps) but shows the larger minimum regret trajectory estimate for the same spill (red dots). The red dots take into account the uncertainty in the wind and current information that you entered. The red dots are estimated to have a 90% chance of covering all oil spill possibilities. Using the minimum regret trajectory (red dots) allows the user to show spill outcomes that are less probable than the best guess outcome, but that are potentially either more harmful or more costly. (NOAA, 2002)
Operating Scenarios and Impact Levels. The GNOME program shows a quantifiable amount of oil that is either beached, on the water, evaporated and dispersed, weathered and off the map. This data can provide insight on what to expect from an oil spill based on location and climate conditions. Fifteen different variations of this model were done for each release point (See attached model run results). The worst impacts associated with a release at midpoint of Platform Hogan pipeline and result in approximately 420 bbls of oil coming in contact with the coastline.
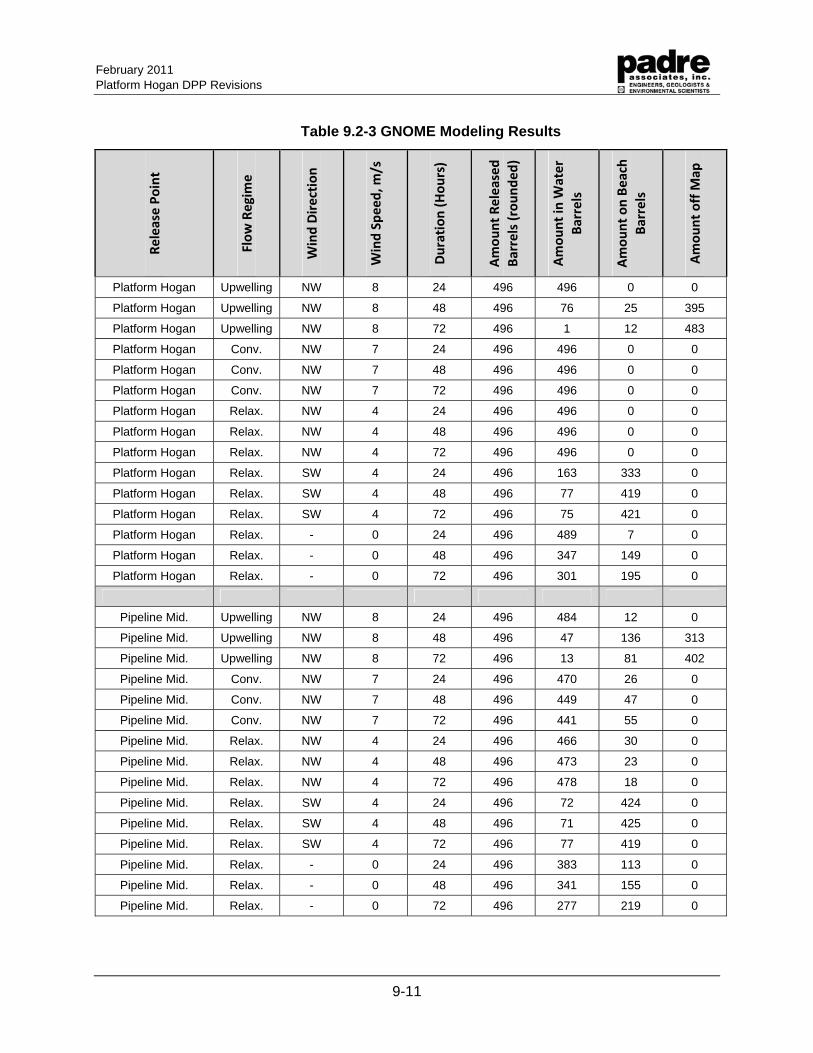
February 2011 Platform Hogan DPP Revisions
9-11
Table 9.2-3 GNOME Modeling Results
Release Po
int
Flow
Regim
e
Wind Direction
Wind Sp
eed, m
/s
Duration (Hou
rs)
Amou
nt Released
Barrels (rou
nded
)
Amou
nt in
Water
Barrels
Amou
nt on Be
ach
Barrels
Amou
nt off M
ap
Platform Hogan Upwelling NW 8 24 496 496 0 0
Platform Hogan Upwelling NW 8 48 496 76 25 395
Platform Hogan Upwelling NW 8 72 496 1 12 483
Platform Hogan Conv. NW 7 24 496 496 0 0
Platform Hogan Conv. NW 7 48 496 496 0 0
Platform Hogan Conv. NW 7 72 496 496 0 0
Platform Hogan Relax. NW 4 24 496 496 0 0
Platform Hogan Relax. NW 4 48 496 496 0 0
Platform Hogan Relax. NW 4 72 496 496 0 0
Platform Hogan Relax. SW 4 24 496 163 333 0
Platform Hogan Relax. SW 4 48 496 77 419 0
Platform Hogan Relax. SW 4 72 496 75 421 0
Platform Hogan Relax. - 0 24 496 489 7 0
Platform Hogan Relax. - 0 48 496 347 149 0
Platform Hogan Relax. - 0 72 496 301 195 0
Pipeline Mid. Upwelling NW 8 24 496 484 12 0
Pipeline Mid. Upwelling NW 8 48 496 47 136 313
Pipeline Mid. Upwelling NW 8 72 496 13 81 402
Pipeline Mid. Conv. NW 7 24 496 470 26 0
Pipeline Mid. Conv. NW 7 48 496 449 47 0
Pipeline Mid. Conv. NW 7 72 496 441 55 0
Pipeline Mid. Relax. NW 4 24 496 466 30 0
Pipeline Mid. Relax. NW 4 48 496 473 23 0
Pipeline Mid. Relax. NW 4 72 496 478 18 0
Pipeline Mid. Relax. SW 4 24 496 72 424 0
Pipeline Mid. Relax. SW 4 48 496 71 425 0
Pipeline Mid. Relax. SW 4 72 496 77 419 0
Pipeline Mid. Relax. - 0 24 496 383 113 0
Pipeline Mid. Relax. - 0 48 496 341 155 0
Pipeline Mid. Relax. - 0 72 496 277 219 0
February 2011 Platform Hogan DPP Revisions
9-12
Real-Time Trajectory Analysis. In the event of an actual spill event, real-time spill trajectories would be generated using GNOME and available wind and current data. Initial oceanographic data will be obtained from a commercial weather service Pacific Weather Analysis (805-969-3354). In addition, a considerable database of published oceanographic conditions within the Santa Barbara Channel Area is available in printed and electronic formats. These databases have been developed through ongoing governmental and institutional studies, as well as direct observations and recordings on fixed structures and mobile vessels within the region. Such resources include the Coastal Data Information Program (http://www.cdip.ucsd.edu/), National Data Buoy Center (http://www.ndbc.noaa.gov/index.html) and a commercial web site (www.stormsurf.com).
A comprehensive study has been undertaken by the Minerals Management Service to provide near-real time data for oil spill response. These data are available through the Internet at: http://www-CCS.ucsd.edu/oilspill/. The database was developed in coordination with the Scripps Institution of Oceanography. These and other published data can and will be used at the time of a spill to develop potential trajectories of an oil spill.
In addition, representatives from the National Oceanic and Atmospheric Administration (NOAA), who are part of the Regional Response Team, are available to conduct trajectory modeling during a major spill event. The Company will utilize these trajectory-modeling capabilities during the response to a spill event.
9.3 RESOURCES AT RISK
9.3.1 OFFSHORE
The release of petroleum into the marine environment from any of the construction vessels, from a break in the pipeline between Platform Hogan and the La Conchita onshore facilities could result in potentially significant impacts to the marine biota, particularly avifauna and early life stage forms of fish and invertebrates which are sensitive to those effects. Although refined products (i.e., diesel, gasoline) are more toxic than heavier crude or Bunker-type products, the effects of an oil spill also include the coating of organisms and habitats that result in smothering of attached animals, hypothermia due to loss of the insulation properties of feathers (birds) and fur (otters), ingestion of toxic chemicals and irritation of eyes and internal organs, and alteration of habitat when heavier oil attaches to rocky substrate. The loss of a substantial amount of fuel or lubricating oil during construction operations could affect the water column, seafloor, and intertidal habitats and associated biota, resulting in their mortality or substantial injury, and in alteration of the existing habitat quality.
Open Ocean Response Techniques. Several methods are available for cleaning open ocean oil spills. They include the application of dispersants, in-situ burning, and mechanical containment and recovery. When applied to spilled oil, dispersants reduce the surface tension of oil. The reduction of tension allows oil droplets to break from the slick. Natural processes then breakdown the droplets much sooner than they would if the oil were allowed to remain on the surface. Mechanical recovery involves the use of booms and skimmers to pick up oil from the water surface. In a typical cleanup scenario, a boom is deployed in a V, J, or U-shape to
February 2011 Platform Hogan DPP Revisions
9-13
gather and concentrate oil on the surface of the water. The oil is gathered at the wide or front end of the boom and is concentrated at the narrow apex or back end of the boom where it is collected by a skimmer. The oil is usually removed by a weir skimmer or by having it adhere to an oleophylic skimmer. The oil is then pumped from the skimmer to temporary storage or to a vessel or barge for removal from the spill location. In-situ burning involves an oil recovery process similar as that used for mechanical recovery. However, instead of the oil going into a skimmer, it is funneled into a fire boom. The oil in the fire boom is then ignited and allowed to burn.
9.3.1.1 Mechanical Containment and Recovery
The benefits of mechanical containment and recovery include minimal impacts in open water environments, allows recycling or proper disposal of recovered oil, and physically removes oil from the environment. Limitations of this removal method include wind, wave, and current interference that allow only a fraction of the spilled oil to be contained and recovered.
9.3.1.2 Dispersants
The ecological consequences of the use of dispersants during a spill situation are complex. The effects are highly variable and dependent on a number of factors. Hayes et al. (1992) provide some insights in regards to the implications of dispersant use (MRS, 2002).
• The number of combinations of oil, dispersant, organism, life stage, nature of exposure, and time of year, that are possible in an area make a prediction of the ecological impacts of dispersant use very difficult. Several studies suggest that effects can vary significantly with different combinations of parameters, making generalizations inappropriate.
• The common wisdom in the case of the newer dispersants is that they are no more toxic than the crude or refined oils to which they are applied, and that toxicity resulting from an oil-dispersant mixture is largely attributable to the oil component. Recent studies suggest otherwise, so more carefully designed and administered investigations are needed.
• Conceptually, the use of dispersants moves an oil product from one physical environment (the air water interface) to another (e.g., the water column or the benthic environment). However, no dispersant is 100 percent effective; application will result in variable amounts in each physical compartment, with resultant impacts proportional to the partitioning.
• Laboratory studies suggest that the toxicity of dispersants is correlated with efficiency. The more efficient a dispersant is in moving oil into the water column, the greater the toxicity to organisms in the water column or in the benthos.
• It is difficult to extrapolate results from the laboratory to anticipated results in field exposures.
February 2011 Platform Hogan DPP Revisions
9-14
• Comparisons of such results show a wide variation, with field mortalities attributable to exposure lower than those in the laboratory. However, some methods employed in these assessments may introduce biases that inaccurately portray toxicities.
• Certain life stages of organisms, particularly early reproductive stages, appear to be most at risk from exposure to dispersants.
• Mature life stages of animals are more tolerant to exposures to oil-dispersant mixtures. However, consideration of life cycle timing is critical, since physiological stresses imposed by reproductive or other activities may increase the susceptibility to both oil and dispersants.
9.3.1.3 In-Situ Burning
On open water, burning requires the use of fire resistant booms because uncontained oil rapidly spreads to thin layers that cannot sustain combustion. Compared to other cleanup methods, in-situ burning requires less labor and can be applied in spill areas having limited access or in ice conditions. Burning rapidly removes large quantities of oil and also minimizes the need for oil recovery and storage.
Field studies have shown that most air pollutants produced by in-situ burns are concentrated near the area of the fire. However, one pollutant, the fine particulate particles in the smoke, is of concern beyond the immediate area of the fire. The fine particulate matter can cause respiratory problems for the elderly or those with impaired lung function if they are inhaled at high concentrations. The small particles from an in-situ burn typically remain suspended and dilute above the human breathing zone.
Monitoring plans that measure particulate levels can be implemented to ensure the protection of public health. The decision to utilize in-situ burning as a cleanup method must consider the impacts to air quality, benefits of rapid oil removal, safety of oil response personnel, and the risk of secondary fires. The environmental benefits include the reduction of surface oil impact on shorelines, sensitive habitats, birds, mammals, and other marine organisms. In-situ burning rapidly consumes oil, reduces oil storage and disposal problems, and eliminates air quality impacts of the volatile hydrocarbons that would otherwise evaporate.
9.3.2 ONSHORE
9.3.2.1 CDFG Area Contingency Plan Sensitive Resource Areas
The Los Angeles/Long Beach (Northern/Southern Sector) Area Contingency Plan represents the most detailed and up-to-date information available on sensitive areas and response strategies. This information has been compiled by the Coast Guard, and the California Office of Oil Spill Prevention and Response (OSPR), with input from other Federal, State, and local agencies and industry. Section 4600, pages 4600-1 to 4600-485, of the Los Angeles/Long Beach (Northern/Southern Sector) Area Contingency Plan (ACP) (1/2000) provides the best available information for protective strategies and tactics in most sensitive
February 2011 Platform Hogan DPP Revisions
9-15
areas. Maps within the ACP will be utilized by the Company in coordination with the RRT during a spill response. A copy of the ACP will be available to Company response personnel throughout a spill event.
As shown in Table 9.3-1, an unanticipated, worst-case oil spill scenario occurring at the Platform Hogan Project site could have the potential to reach onshore sensitive resources. These would include onshore areas as far north as Point Conception (located more than 50 miles to the north of the Project site) and as far south as Long Beach (approximately 90 miles to the south of the Project site). However, based on the modeling scenarios presented in Section 9.2 (Spill Trajectory) above, the likelihood of such a spill reaching these remote locations is between one and seven percent (1-7%) in a 30-day spill window left unattended. Federal and State regulations require the immediate notification of emergency responders in order to control and/or minimize the impacts of an incident should a spill occur. As such, the area for which a spill could occur would be greatly reduced. Table 9.2-1 above indicates that only those areas of the coastline between the Goleta Beach Slough and the Ventura/Oxnard shoreline would be at any significant risk should an unanticipated spill occur. These onshore resources have been evaluated in detail by the United States Coast Guard (USCG) and the Department of Fish and Game within the Office of Spill Prevention and Response, Marine Area Contingency Plan (ACP) for the Los Angeles / Long Beach Area. Figure 9.3-1 shows the mainland locations of these sensitive resource areas and their corresponding ACP number, while Figure 9.3-2 depicts the Channel Islands sensitive resource areas. The following discussions provide information on these resource areas. For additional detail regarding emergency response to areas further north and south, please refer to the site-specific descriptions located at the DFG website online at http://www.dfg.ca.gov/ospr/los_angeles_plan.aspxb
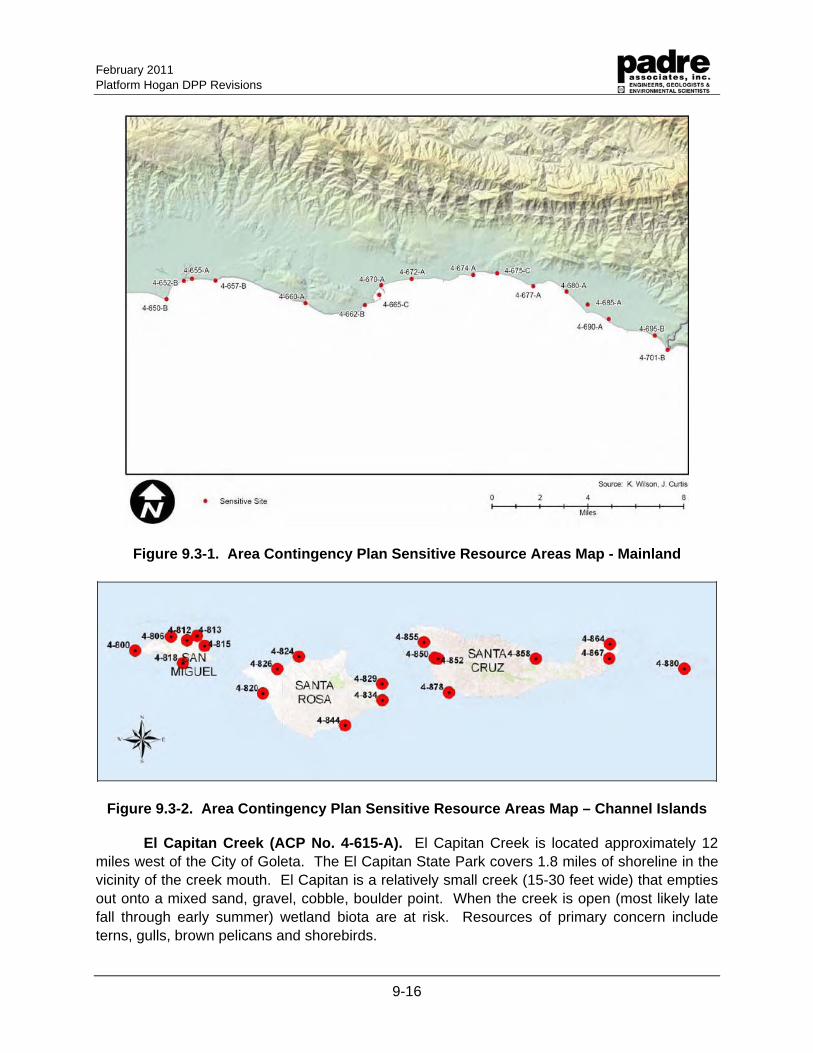
February 2011 Platform Hogan DPP Revisions
9-16
Figure 9.3-1. Area Contingency Plan Sensitive Resource Areas Map - Mainland
Figure 9.3-2. Area Contingency Plan Sensitive Resource Areas Map – Channel Islands
El Capitan Creek (ACP No. 4-615-A). El Capitan Creek is located approximately 12 miles west of the City of Goleta. The El Capitan State Park covers 1.8 miles of shoreline in the vicinity of the creek mouth. El Capitan is a relatively small creek (15-30 feet wide) that empties out onto a mixed sand, gravel, cobble, boulder point. When the creek is open (most likely late fall through early summer) wetland biota are at risk. Resources of primary concern include terns, gulls, brown pelicans and shorebirds.
February 2011 Platform Hogan DPP Revisions
9-17
Las Llagas (El Capitan Ranch Beach) (ACP No. 4-620-A). Las Llagas is located approximately one mile east of El Capitan State Beach. The inlet is located within a small private gated beach community. The mouth of Las Llagas Creek is characterized by a small possibly seasonal lagoon, approximately 0.1 to 0.2 acres. The lagoon is bounded on the west by a graded earthen access road and to the east by a steep brush covered hillside with no access. The stream empties onto a sand covered pocket beach which may erode to cobbles in the winter months. Resources of primary concern which may be present include tidewater gobies, southwestern pond turtles, California red-legged frogs and sea otters.
Naples (ACP No. 4-625-A). Naples is located approximately three miles east of Las Llagas. Naples includes an area of approximately two miles where the shoreline is primarily wave-cut rock platforms with some fine-grained sand and mixed sand and gravel beaches backed by coastal bluffs. Offshore is Naples Reef a popular fishing, diving and marine research area. Resources of primary concern include harbor seals, grunion spawning (spring and summer), sea otters, rockfish, California spiny lobster, Pismo clams (June through September) and giant kelp.
Eagle Canyon Creek (ACP No. 4-630-C). Eagle Canyon Creek is located approximately one mile east of Naples. This is a small, intermittent creek which empties out onto a small fine-grained sand beach backed by a cobble-boulder storm berm. Tidal wash over occurs into a seasonal lagoon where the creek meets the beach. The mouth is probably only open during winter rain events. When the creek mouth is open wetland biota are at risk. Sea otter have been known to move through the area.
Tecolote Creek (ACP No. 4-635-A). Tecolote Creek is located approximately one mile east of Eagle Canyon Creek. This creek empties into an approximately ¼ acre lagoon. The lagoon is fringed by vegetation and a small sand berm develops during the dry season where fine-grained sand beaches exist. Whenever the creek is open wetland biota are at risk. Resources of primary concern include waterfowl, gulls, terns, brown pelicans, shorebirds, harbor seals, sea otters and tidewater goby.
Bell Canyon Creek (ACP No. 4-640-A). Bell Canyon Creek is located just west of sandpiper golf course with a well developed lagoon. A sand berm which develops during summer is usually relatively low and the lagoon is subject to wash over especially during high tides. The beaches to the east and west are of fine to medium-grained sand, and often have very high volumes of debris after rains. Whenever the mouth is open wetland biota are at risk. Resources of primary concern include tidewater goby, steelhead, waterfowl, marsh vegetation, brown pelicans, shorebirds and sea otters.
Devereaux Slough (ACP No. 645-A). Devereaux Slough lies just north of Coal Oil Point. This 45 acre slough contains freshwater emergent vegetation, salt marsh, tidal flats and sand dunes. The mouth is generally cut off from the ocean by a well developed sand berm except during heavy rainfall. East and west of the slough are extensive medium-grained sand beaches backed by vegetated dunes. The slough is part of the larger coal oil point natural reserve, managed by the University of California Santa Barbara. Whenever the slough is open to the ocean, wetland biota are at risk. Resources of primary concern include western snowy
February 2011 Platform Hogan DPP Revisions
9-18
plovers, California least tern, American coot, American wigeon, black-crowned night heron, canvasback, green winged teal, mallard, pintail, red-breasted merganser.
Goleta Beach Point and Campus Lagoon (ACP No. 4-650-C). The Goleta Beach Point and Campus Lagoon resource areas are located on the UCSB campus near the Marine Science Institute. Goleta Point is a combination of fine-grained sand beach and wave-cut rock platforms, while the Campus Lagoon is a 25-30 acre brackish water pond located adjacent to the Point. Seawater is pumped into the lagoon at the eastern side (near the marine science institute) and discharges into the ocean on the southwest side. The area is considered sensitive due to the spawning of grunion during the spring and summer, the hauling out of California sea lions and the presence of eel grass beds along the shoreline. Other species of consideration include California least tern, gulls and other waterfowl, the common Pacific littleneck clam, Pismo clam and Giant kelp.
Goleta Beach (ACP No. 4-652-C). Goleta Beach County Park is located east and adjacent to the UCSB campus. The Beach is wide with fine to coarse-grained sand backed by low bluffs or a long grass picnic area and parking lot. The Goleta pier and beachside restaurant are also located at this site. The area is considered sensitive due to the spawning of grunion during the spring and summer, the presence of shorebirds, and the presence of giant kelp along the shoreline.
Goleta Slough (ACP No. 4-655-A). The Goleta Slough resource area is bounded by Goleta pier east to the bluffs at More Mesa. The mouth of the slough runs through the Goleta Beach County Park. The slough opens to the ocean via a broad channel that is frequently closed in summer by formation of a sand bar. The area is considered sensitive because it is the largest wetland in the region at 350 acres. Species of special concern within the Slough include steelhead trout (February through June), brown pelicans, Belding's savannah sparrow, waterfowl, shorebirds, seabirds, and the western snowy plover. Plants such as salt marsh bird’s beak and pickleweed are also found within the Goleta Slough.
More Mesa and Goleta Rocks (ACP No. 4-657-B). Located east of Goleta Beach, More Mesa and the Goleta rocks are backed by More Mesa cliffs. The shoreline is a fine-grained sand beach with rocky haul-out areas utilized by harbor seals. Breeding and pupping occurs at this location January through June. Other species within the area include brown pelicans, the common Pacific littleneck clam, and the Pismo clam.
Arroyo Burro Creek (ACP No. 4-660-A). Arroyo Burro Creek passes through steep sided bluffs, opening out into a small lagoon near the beach. The mouth can be open any time of year, but it is most commonly open during the rainy season. Whenever the creek is open to the ocean, generally during rainy season into early summer, wetland biota would be at risk. To the east and west are extensive beaches typically fine to medium-grained sand in the summer and bedrock, boulders, and mixed sand and gravel in the winter. Offshore are moderate kelp and surf grass beds. Other species of consideration include California barn swallows and the federally endangered tidewater goby.
February 2011 Platform Hogan DPP Revisions
9-19
Leadbetter Beach (ACP No. 4-662-C). Leadbetter beach is a heavily used recreational beach comprised of wide find-grained sand. It is approx. 3/4 mile long, extending from Santa Barbara point to the beginning of the breakwater of the Santa Barbara Harbor. Erosion/deposition of sand appears to occur on a winter/summer basis, however, there is usually little, if any, coarser-grained sediments. Grunion usually spawn in the spring and summer months, but the season may extend through September. Other species of consideration at the beach include sea and shorebirds, brown pelicans and cormorants.
Santa Barbara Harbor (ACP No. 4-665-A). Santa Barbara harbor is protected by a 0.25-mile long, south facing breakwater which is connected to a 0.25 mile long west facing sand bar. Stearns Wharf (approximately 0.65 miles long) is less than 0.25 mile east of the harbor entrance. Seabirds congregate on the breakwater, sand bar, in the harbor, and at Stearns Wharf year round. Other species of consideration include western snowy plovers (nesting), California least tern, gulls, and shorebirds.
Mission Creek Laguna Channel (ACP No. 4-670-A). The Mission Creek Laguna Channel is a wide stretch of sandy beach extending from Stearns Wharf on the West to Laguna Channel to the east. The estuary is located near Stearns Wharf, and represents a diverse and sensitive area when the channel mouth is open. The Channel itself is a drainage containment sump, which collects runoff water from the lower east side of Santa Barbara. Under normal conditions, it is closed to the ocean by a floodgate. A small estuary pond on the beach is backed by a low-lying grassy park and parking lots. Species of consideration include steelhead trout, tidewater goby, grunion, western snowy plovers (not a nesting area), brown pelicans and other sea and shore birds.
Sycamore Creek and Andree Clark Bird Refuge (ACP No. 4-672-A). Sycamore Creek and the Andree Clark Bird refuge represent a stretch of wide, sandy beach extending from the Creek on the west, to just east of the outlet for the bird refuge. The beach area includes two estuaries of concern backed by a low-lying grassy park or parking lots. Sycamore Creek estuary is a small brackish water ponded area located on the upper beach. The second area of concern is the brackish water ponded area at the south side of the Andre Clark Bird Refuge (created by the outflow of the bird refuge). The bird refuge is a 30-acre lake that connects to the ocean via a channel running under the street and onto the beach. Whenever the estuaries area is open to ocean, habitat and biota, including steelhead trout and tidewater gobies are at risk. Other species of consideration at Sycamore Creek and Andree Clark bird refuge include grunion, western snowy plovers, brown pelicans and shorebirds.
Fernald Point (ACP No. 4-674-A). Fernald Point is located approximately four (4) miles east of the Santa Barbara harbor. The Point is biologically sensitive due to the confluence of three creeks (Romero Creek, San Ysidro Creek and Oak Creek), which all empty out onto the beach west of Fernald Point. The beach is fine to medium-grained sand backed by low (5 to 10 ft) cobble-boulder riprap or sea walls that protect houses and a hotel. Species of consideration at Fernald Point include clams.
Summerland Beach (ACP No. 4-675-C). Summerland Beach is comprised of approximately 1.4 miles of shoreline between Ortega Hill, on the northwest, and a small canyon
February 2011 Platform Hogan DPP Revisions
9-20
located approx. 0.5 mile west of Loon Point to the southeast. Summerland Beach is characterized by medium-grained sand beaches backed by steep vertical cliffs. Summerland Beach is a heavily used recreational area popular for sunbathing, walking, swimming, and other water sports. Oil seepage and sheens in this area has been the subject of local attention and have been investigated by Federal and State agencies. Species of concern at Summerland Beach include sea lions, amphipods and sand crabs, brown pelicans, cormorants, gulls and other shorebirds, and giant kelp.
Loon Point and Elyse Creek (ACP No. 4-677-C). Loon Point lies approximately six (6) miles east of the Santa Barbara harbor. The point itself is a mixed sand and gravel beach. To the east and west the beach areas are backed by cobble-boulder sand berms and by steep bluffs approx. 50 feet high. Elyse Creek is a small lagoon at the upper beach about 75 feet from the mean tide line. The upper end of the lagoon is fenced off by a chain-linked fence. Species of consideration for both areas include wading birds and other wetland biota.
Arroyo Paredon Creek and Sandyland Area (ACP No. 4-680-A). Arroyo Paredon Creek and Sandyland are located between Serena Point and Sand Point. The Sandyland area is a wide, fine-grained sand beach backed by riprap structures. The Arroyo Paredon creek empties out into the beach at the northwest end of the site. Species of consideration within the Arroyo Paredon and Sandyland areas include Pismo clams, beach sand tiger beetle (inhabits higher clean sandy beach), tidewater gobies, gulls, shorebirds, terns, waterfowl, western snowy plovers and harbor seals.
Carpinteria Marsh (ACP No. 4-685-A). The Carpinteria Salt Marsh is an area bounded by Sandyland to the northwest and Sandyland Cove to the southwest. The Salt Marsh (also called El Estero) covers approximately 230 acres and is one of the few large wetland habitats left in southern California. Pickleweed dominates the regularly flooded emergent wetland, and saltgrass. The University of California owns 120 acres, which are part of the natural reserve system for teaching and research. Harbor seals haul out on the sand beach near the mouth and there is a sub tidal reef offshore of the mouth (at Sand Point). Other species of consideration include 125 different bird species (including raptors, waterfowl, sea and shore birds), Belding’s savannah sparrow, the light footed clapper rail (last seen in 1988), raccoon, weasels and rodents, skunks, foxes, opossums, salt marsh bird’s beak, Pismo clams, and beach sand tiger beetle (inhabits higher clean sandy beaches).
Carpinteria Creek and State Beach (ACP No. 4-690-A). Carpinteria State Beach is located from Ash Avenue at the up-coast end, to south of the Venoco Pier at the down-coast end, and covers approximately 1.5 miles of coastline. The beach is backed by dunes along the up coast-end and bluffs along the down-coast end. Rocky intertidal habitats are common and there is a shallow rock reef just off shore and south of the creek. Species of consideration for the area include harbor seals, western snowy plover, tidewater goby, brown pelican, Pismo clams on the beach, steelhead trout and intertidal reef biota.
Rincon Point Wave Area (ACP No. 4-695-B). The Rincon Point wave area is located southeast of Carpinteria State Beach to just northwest of Rincon Point, and consists of approximately 1.5 miles of fine to medium-grained sand beach. The Beach is backed by steep
February 2011 Platform Hogan DPP Revisions
9-21
bluffs. Rincon Beach County Park is located at the southeast end of site. Species for consideration within the area include clams and western snowy plovers.
Rincon Creek and Point (ACP No. 4-701-B). Rincon Creek and Point are located east of Rincon Point wave area. A pedestrian path from Rincon Beach County Park leads to the site. The point is an alluvial fan composed of cobbles underlain by sand. Species of consideration within the area include wetland biota: waterfowl and marsh vegetation, seabirds, shorebirds, harbor seals, western snowy plovers (spring through summer for nesting), dolphins, common Pacific littleneck clams (April through September) and California mussels.
Los Sauces Creek (ACP No. 4-705-C). Los Sauces Creek is located approximately 1.5 miles south of Mussel Shoals and approximately 0.5 mile north of Seacliff. Los Sauces Creek empties into the ocean through four rectangular concrete culverts onto a wavewashed boulder rip-rapped shoreline which could be oiled. Brown Pelicans feed in nearshore waters at this site.
Madranio Canyon (ACP No. 4-711-C). Madranio Canyon is located approximately 0.5 miles south of Los Sauces Creek. The stream empties into the ocean through two rectangular concrete culverts onto a wavewashed boulder rip-rapped shoreline which could be oiled. Brown pelicans and marine mammals feed in nearshore waters year round.
Javon Canyon (ACP No. 4-717-C). Javon Canyon is located approximately 0.5 miles south of Hobson County Park. The stream empties into the ocean through a rectangular concrete culvert onto a sand beach backed by concrete seawalls. Special resource concerns include Pismo clams on sand beaches (year round); common Pacific littleneck clams occur on some of the sand/cobble beaches. Black abalone reportedly occur in rocky intertidal area near Seacliff. Surfperch, shorebirds and seabirds occur throughout the area with brown pelicans and cormorants common on Oil Island. The rip-rapped coastline adjacent to this site does not have inlets, marshes, or coastal wetlands which would be threatened by a spill.
Padre Juan Canyon (ACP No. 4-723-C). Padre Juan Canyon is located approximately one mile south of Javon Canyon. The stream empties into the ocean through two rectangular concrete culverts onto a wavewashed boulder rip-rapped shoreline which could be oiled. Special resource concerns include brown pelicans and marine mammals that feed in the nearshore waters year round.
A-Lease Canyon (ACP No. 4-729-C). A-Lease Canyon is located approximately 1.5 miles south of Padre Juan Canyon. The stream empties into the ocean through a rectangular concrete culvert onto a sand beach lined by boulder rip-rap which could be oiled. Special resource concerns include brown pelicans and marine mammals that feed in the nearshore waters year round.
Amphitheater Canyon (ACP No. 4-735-C). Amphitheater Canyon is located approximately one mile south of A-Lease Canyon. The stream empties into the ocean through an open channel onto a sand beach backed by boulder rep-rap in the gated community of Solimar Beach. Special resource concerns include brown pelicans and marine mammals that feed in the nearshore waters year round.
February 2011 Platform Hogan DPP Revisions
9-22
Ventura River (ACP No. 4-740-A). The Ventura River is located approximately four miles south of Amphitheater Canyon. The Ventura River mouth and lagoon are relatively large and are considered important wildlife habitats for birds, wetland biota, and fishes (particularly tidewater goby and steelhead trout). Whenever the river is open (depending on flow) wetland biota, including several listed species are at risk. Resources of primary concern include Belding’s savannah sparrow, Least bells vireo, Clapper rail, numerous seabirds including brown pelicans (February through November), and California least terns; plus shorebirds, waterfowl and hawks. Western snowy plover (April through September) nest along the beach between the main and secondary river mouths. Western pond turtles and legless lizard may also be present. Steelhead trout (December through April) when mouth is open and tidewater goby (year round).
San Buenaventura State Beach (ACP No. 4-743-A). The San Buenaventura State Beach is approximately 1.5 miles southeast of the Ventura River. The beach is a wide, fine to medium grained sand beach (approx. 2.5 miles long) with about eight rip-rap groins. Resources of primary concern include shorebirds and seabirds including brown pelicans (February through November) and western snowy plovers (year round), grunion (April through August), surfperch, Pismo clams (June through September) on sand beaches and various invertebrates associated with rip-rap groins.
Ventura Harbor (ACP No. 4-747-A). Ventura Harbor is located just south of San Buenaventura State Beach and is bounded by jetties to the north and south of the harbor mouth. Marina Cove Beach (fine to medium-grained sand) lies just inside the south entrance. Resources of primary concern include California least terns (April through September), brown pelicans (February through November), gulls, seabirds, waterfowl, harbor seals, California spiny lobster, common Pacific littleneck clams (April through September) and Nuttall’s cockle.
Santa Clara River Estuary (ACP No. 4-750-A). The Santa Clara River Estuary lies just south of the Ventura Harbor and just north of the park at McGrath State Beach. The river mouth is designated as a State wildlife refuge and a natural reserve and is part of the McGrath State Beach. The lagoon and salt marsh habitats support a wide variety of plants, birds, fishes and other wildlife. North and south of the river mouth are extensive fine to medium-grained sand beaches. Whenever the estuary is open to the ocean (most likely late fall through early summer) wetland biota are at risk. Resources of primary concern include California least tern (April through September), Western snowy plovers (April through September) and numerous species of shorebirds, seabirds, waterfowl, steelhead trout, tidewater goby (August through November), surfperch, Pismo clams (June through September) and salt marsh bird’s beak.
McGrath State Beach & McGrath Lake (ACP No. 4-761-A). McGrath State Beach is located just south of the Santa Clara River Estuary. This is a wide fine to medium-grained sand beach, backed by coastal dunes and is approximately two miles long. Resources of primary concern include California least tern (April through September), Western snowy plovers (April through September) and Pismo clams (June through September).
Mandalay State Beach (ACP No. 4-765-A). Mandalay State Beach is located approximately 0.5 mile south of McGrath State Beach. This is a fine to medium-grained sand beach, about one mile long. The beach is backed by low dunes with sparse vegetation.
February 2011 Platform Hogan DPP Revisions
9-23
Resources of primary concern include grunion and western snowy plovers (April through September).
Oxnard Beach (ACP No. 4-769-A). Oxnard Beach is located just south of Mandalay State Beach. This a wide, fine to medium-grained sand beach, approximately three miles long. The site is backed by residences. Resources of primary concern include grunion and western snowy plovers (April through September) and California least terns (April through September).
Channel Islands Harbor (ACP No. 4-775-A). The Channel Islands Harbor is located immediately south of Oxnard Beach. The entrance faces southwest and is formed and protected by rip-rap jetties on the north and south of the opening. A rip-rap breakwater approximately 2,200 feet in length, lies about 1,000 feet offshore of the jetties. The beaches immediately north of the site are fine to medium-grained sand beaches which are backed by houses. Resources of primary concern include California least terns, western snowy plovers, brown pelicans, seabirds, waterfowl, marine mammals, grunion, clams and other invertebrates.
Port of Hueneme (ACP No. 4-780-A). Port of Hueneme is located approximately one mile southeast of the Channel Islands Harbor. The port is protected by rip-rap jetties on the north and south of the opening. Immediately north of the port is a fine to medium grained sand beach backed by houses. Private mariculture facilities and a desalination plant (operated by the US Navy) are located on the south side of the harbor entrance. Resources of primary concern include California least tern, brown pelican, western snowy plovers, grunion, seabirds, sea lions, shorebirds and Pismo clams.
Ormond Beach Wetlands and State Beach (ACP No. 4-783-A). This site is bounded to the northwest by Port Hueneme and runs southeast approximately three miles. The most sensitive habitat component of this site is the nearly 130 acres of wetlands that lie just shoreward of the vegetated sand dunes and broad sandy beaches. The site includes a stretch of medium-grained sand beach approximately three miles in length. Resources of primary concern include California least tern (April through September), brown pelicans, western snowy plovers (April through September), Belding’s savannah sparrow, waterfowl, seabirds, shorebirds, Pismo clams, grunion, harbor seals, California sea lions, and tidewater goby. Candidates for endangered species include sandy beach tiger beetle, Globose dune beetle and wandering skipper. Rare species include Frost’s tiger beetle and Point Mugu dune weevil.
Laguna Point (ACP No. 787-A). Laguna Point is located approximately 3.5 miles from Arnold Rd. This site includes a stretch of medium to coarse grained sand beaches. Resources of primary concern include California least tern (April through September), western snowy plovers (April through September), grunion, Pismo clams (June through September) and year round concentrations of various shorebirds and seabirds.
Mugu Lagoon (ACP No. 4-790-A). Mugu Lagoon is bounded by Laguna Pt. to the northwest and Point Mugu to the southwest. The coastal wetland covers nearly 2,000 acres. The opening of the lagoon is delineated by a large boulder rip-rap seawall to the west, and a sand spit to the east. Resources of primary concern include California least tern, western
February 2011 Platform Hogan DPP Revisions
9-24
snowy plovers, light footed clapper rails, brown pelicans, Belding’s savannah sparrow, harbor seals, California sea lions, steelhead, Pismo clams and salt marsh bird’s beak.
Channel Islands Sensitive Resource Areas. The Channel Islands described here and the surrounding one nautical miles of water are all part of the Channel Islands National Park (CINP) while the surrounding 6 nautical miles of water are part of the Channel Islands National Marine Sanctuary (CINMS). The State of California has jurisdiction over the living marine resources within 3 miles of the islands. CINP consists of 390 m2 (half of which is under water) while the CINMS consists of a total of a 1,252-square-nautical-mile area of ocean surrounding the islands. Roughly 75% of Santa Cruz Island is owned and managed by the Nature Conservancy, a private, non-profit organization. The islands and the surrounding waters hold significant biological, archeological, and cultural resources that are at risk from oil spills. These resources include but are not limited to: federal and state listed endangered species, large sea bird and marine mammal populations, Native American archeological sites, and shipwrecks. The following discussion outlines key physical parameters of the sites as well as seasonal or special resource concerns for these sites. Additional information can be found in the ACP.
San Miguel Island: Point Bennett Area 5 (ACP No. 4-800-A). The Point Bennett area has vertical rock cliffs, exposed wave-cut platforms, and medium to coarse-grained sand beaches. This is a prime pinniped haul out, pupping, and breeding area. This is also one of the largest seabirds nesting areas in southern California. Castle Rock Island is a large exposed vertical rocks pinnacle offshore. All year for high concentrations of marine mammals pupping and breeding and nesting seabirds.
San Miguel Island: East Simonton Cove (ACP No. 4-806). East Simonton Cove area is primarily exposed wave-cut rock platforms. The areas offshore of this site are included in the Harris Point Marine Reserve. In March through August nesting seabirds are found at the site. From December through August marine mammal pupping and breeding occurs at the site.
San Miguel Island: Cuyler Harbor (ACP No. 4-812-A). The east side of Cuyler Harbor is primarily medium to coarse-grained sand beach. Some of the areas offshore of this site are included in the Harris Point Marine Reserve. Western snowy plover’s nesting occurs at the site from March through August
San Miguel Island: Prince Island (ACP No. 4-813-A). Located at northeast corner of San Miguel Island, Prince Island is a large, steep sided rock pinnacle. It has large populations of nesting seabirds (March through July) with high concentrations present on a year basis.
San Miguel Island: Bay Point (ACP No. 4-815-A). The Bay Point area is primarily wave-cut rock platforms and is located northeast side of island. The area supports harbor seal pupping and breeding from January through June and seabird nesting from March through July.
San Miguel Island: South Side (ACP No. 4-818-A). Located on the front side of San Miguel Island, from Tyler Bight to Cardwell Point this area is primarily wave-cut rock platforms and medium to coarse-grained sand beaches. It has large populations of nesting seabirds (March through July), as well as snowy plover nesting from April to March.
February 2011 Platform Hogan DPP Revisions
9-25
Santa Rosa Island: South West Beaches (ACP No. 4-820-A/B). Located on the west end of Santa Rosa Island, from Sandy Point to Cluster Point. T he area is comprised primarily of exposed wave-cut rock platforms and medium to coarse-grained sand beaches, with some offshore rock pinnacles. Marine mammal pupping and breeding occurs from December through August. Nesting seabirds are found at the site from March through August.
Santa Rosa Island: North Area (ACP No. 4-824-A). Site consists of the northern part of Santa Rosa Island, from the East end of Sandy Point Beach to Carrington Point. The area is comprised of exposed wave-cut rock platforms, vertical rock cliffs, and a few pocket sand beaches. The areas offshore of this site are included in the Carrington Point Marine Reserve. High concentrations of marine mammals, seabirds, and important intertidal resources are present all year round. Specifically, the area supports harbor seal pupping and breeding from December through June and seabird nesting from March through September.
Santa Rosa Island: Arlington Canyon Lagoon (ACP No. 4-826-A). Santa Rosa Island is located 40 miles west of Ventura and is home to large numbers of seals and sea lions as well as colonies of seabirds. This site has seasonal marine mammal pupping and breeding from December through August and nesting seabirds from March through July.
Santa Rosa Island: Skunk Point Area (ACP No. 4-829-A). The northeast part of Santa Rosa Island, from the "Southeast Anchorage" area to East Point. Primarily medium to coarse-grained sand beaches and wave-cut rock platforms. Some areas offshore of this site are included in the Skunk Point Marine Reserve. Harbor seals pupping and breeding occurs from December through June. California sea lions are present from May through August. Nesting seabirds are present from March through July.
Santa Rosa Island: Lagoon (East Side) (ACP No. 4-834-A). A small unnamed lagoon located on the east side of Santa Rosa Island. Increased sensitivity when lagoon is open to ocean during high rainfall and extreme high tides. This site has seasonal marine mammal pupping and breeding from December through August and nesting seabirds from March through July.
Santa Rosa Island: South East Beaches (ACP No. 4-844-A).Located on the south side of Santa Rosa Island, from East Point to South Point. This is primarily vertical rock cliff habitat with a few pocket sand beaches and wave-cut rock platforms. All year for high concentrations of marine mammals, seabirds, and important intertidal resources. The area supports harbor seal pupping and breeding from December through June and seabird nesting from March through July.
Santa Cruz Island: Posa Anchorage Lagoon (ACP No. 4-850-A). Located on the southwest side of Santa Cruz Island. Posa Anchorage has a moderate sized wetland (about 75 m inland of the ocean) with a well-defined channel running through willows and scrub vegetation. This is an intermittent stream. The surrounding fine to medium-grained beach is approx. 50 m wide and two miles long, backed by bluffs in the area of the wetland, with rocky headlands further to the NW and SE. The site faces SW and is subject to strong winds and
February 2011 Platform Hogan DPP Revisions
9-26
surf. Whenever the lagoon is open to the ocean (during periods of high rainfall, or with extreme high tides).
Santa Cruz Island: Christi Beach (ACP No. 4-852-A). Located on the west side of Santa Cruz Island, the Christi Ranch area is primarily mixed sand, gravel, cobble, and boulder beach. All year for high concentrations of marine mammals, seabirds, and important intertidal resources.
Santa Cruz Island: Forney Cove (ACP No. 4-855-A). Located from Forney Cove to Black Point, this area includes vertical rock cliff, wave-cut platforms and sand or gravel beaches. Some of the offshore areas of this site are included in the Painted Cave State Marine Conservation Area. All year for important intertidal resources. The area supports harbor seal pupping and breeding from December through June and seabird nesting from March through November.
Santa Cruz Island: Prisoners Harbor (ACP No. 4-858-A). Located in the north central area of Santa Cruz Island. Prisoners Harbor has mixed sand and gravel beaches and a small creek and wetland. Nearby Chinese harbor is primarily mixed sand and gravel beach. All year for important intertidal resources. The area supports marine mammal pupping and breeding from December through August and seabird nesting from March through November.
Santa Cruz Island: Scorpions Harbor Area (ACP No. 4-864-A). Located on Santa Cruz Island, from Scorpion Anchorage to Pedro Point. The area is primarily exposed rock cliffs with a few pocket sand beaches. Some of the offshore areas of this site are included in the Scorpion State Marine Reserve. All year for important intertidal resources. The area supports marine mammal pupping and breeding from December through August and seabird nesting from March through November.
Santa Cruz Island: Smuggler’s Cove (ACP No. 4-867-B). Located on Santa Cruz Island, from Pedro Point to Middle Anchorage. The area is primarily vertical cliffs, coarse grained sand and cobble beaches.
Santa Cruz Island: Punta Arena to Near Point (ACP No. 4-878-A). On the southwest corner of Santa Cruz Island, the Punta Arena area is primarily wave-cut platforms, and medium to coarse-grained sand beaches. Gull Island is a large exposed vertical rocks pinnacle offshore. Some offshore areas of this site are included in the Gull Island State Marine Reserve. Year-round high concentrations of marine mammals, seabirds, and important intertidal resources. The area supports harbor seal pupping and breeding from December through June and seabird nesting from March through July.
Anacapa Island (ACP No. 4-880-A). The three islets (west, middle, and east) that make up Anacapa Island are oriented in an east-west direction, making it very long and narrow chain of islands. The north side is primarily exposed vertical rock cliffs, with a few pocket beaches, while the south side is a combination of wave-cut rock platforms, vertical cliffs, and pocket beaches. Much of the northern offshore area of Anacapa Island is included in the Anacapa Island State Marine Reserve. Nesting seabirds are present from March through July and
February 2011 Platform Hogan DPP Revisions
9-27
include the brown pelican. The island is used year-round as haul out site for harbor seals and California sea lions and supports high concentrations of seabirds throughout the year.
9.4 POTENTIAL IMPACT SCENARIOS
As previously discussed in Section 9.2.1, the MMS used their Oil Spill Risk Analysis (OSRA) for the California Pacific region, which provides a probabilistic analysis of oil spill trajectories for use in preparing spill response plans. The results of this analysis were reviewed to identify land segments and resources on the California coast and nearby islands most likely to be impacted by an oil spill. Based on these results resources can be assessed further at local level. These onshore resources have been evaluated in detail by the United States Coast Guard (USCG) and the Department of Fish and Game within the Office of Spill Prevention and Response, Marine Area Contingency Plan (ACP) for the Los Angeles / Long Beach Area.
9.4.1 3-Day Potential Impact Scenario
The OSRA Spill Trajectory Simulation from Platform Hogan (Location Point PL10) show mainland segments 16 (Goleta and SB) and 17 (Carpinteria and Ventura) being contacted within 3 days. As seasonal ocean currents patterns change in the Project area the probabilities of contact with the mainland vary as well.
In the autumn and winter seasons, mainland segment 17 has an 11-14 chance that an oil spill would travel to this segment. In the spring and summer seasons, mainland segment 17 has a 64-76 percent chance that an oil spill would travel to this segment. Potential impacts to resources within these land segments are discussed in detail in Section 5.10.5 (Potential Environmental Impacts).
9.4.2 10-Day Potential Impact Scenario
The OSRA Spill Trajectory Simulation from Platform Hogan (Location Point PL10) show mainland segments 16 (Goleta and SB) 17 (Carpinteria and Ventura) and 18 (Ventura and Oxnard) being contacted within 10 days.
In the autumn and winter seasons, mainland segment 16 has a 15-30 percent chance that an oil spill would travel to this segment. Mainland segment 17 has a 14-18 percent chance of contact in the same seasons. In the spring and summer seasons, mainland segment 17 has a 77-78 percent chance that an oil spill would travel to this segment. Mainland segment 18 has a 12 percent chance of contact in the summer season. Potential impacts to resources within these land segments are discussed in detail in Section 5.10.5 (Potential Environmental Impacts).
9.4.3 30-Day Potential Impact Scenario
The OSRA Spill Trajectory Simulation from Platform Hogan (Location Point PL10) show mainland segments 16 (Goleta and SB), 17 (Carpinteria and Ventura) and 18 (Ventura and Oxnard) being contacted within 30 days. Island segment 51 (Anacapa) and segment 23 (N Side Santa Cruz) also have a potential of being contacted within 30 days.
February 2011 Platform Hogan DPP Revisions
9-28
In the autumn and winter seasons mainland segment 16 has an 18-33 percent chance of contact that an oil spill would travel to this segment. Mainland segment 17 has a 16-19 percent chance of contact in the same seasons. Island segment 23 has an 11 percent chance of contact in the autumn season, while island segment 51 has a 13 percent chance of contact in the winter season. In the spring and summer seasons, mainland segment 17 has a 77-78 percent chance that an oil spill would travel to this segment. Mainland segment 18 has a 12 percent chance of contact in the summer season. Potential impacts to resources within these land segments are discussed in detail in Section 5.10.5 (Potential Environmental Impacts).
9.5 RESPONSE PROCEDURES
The following discussion has been prepared to summarize the procedures that would be implemented to address the worst-case spill volume for Platform Hogan within the Carpinteria Field. It should be noted that the actual procedures implemented by PACOPS would be dependent on the specific characteristics of the spill event.
Pacific Operators Offshore, Inc has developed an emergency response organization comprised of an Immediate Response Team (IRT) and a Major Incident Response Team (MIRT). PACOPS platform personnel make up the IRT and are responsible for taking the initial steps to control and/or contain a spill. The Senior Supervisor will normally activate the IRT and notify other platforms that might be affected by the spill. He is responsible for managing the incident until relieved by the Operations Superintendent who is the Incident Commander (IC) of the IRT.
In the event of an oil spill, the initial response to be directed by the Senior Supervisor/Operations Superintendent will be to:
• Identify the source of the release and try to stop the flow of oil and contain it, if it can be accomplished safely.
• Activate the IRT.
• Call Cleans Seas for assistance if spill to water or to standby.
• Make the required government notifications.
• Activate the MIRT and initiate the ICS as necessary.
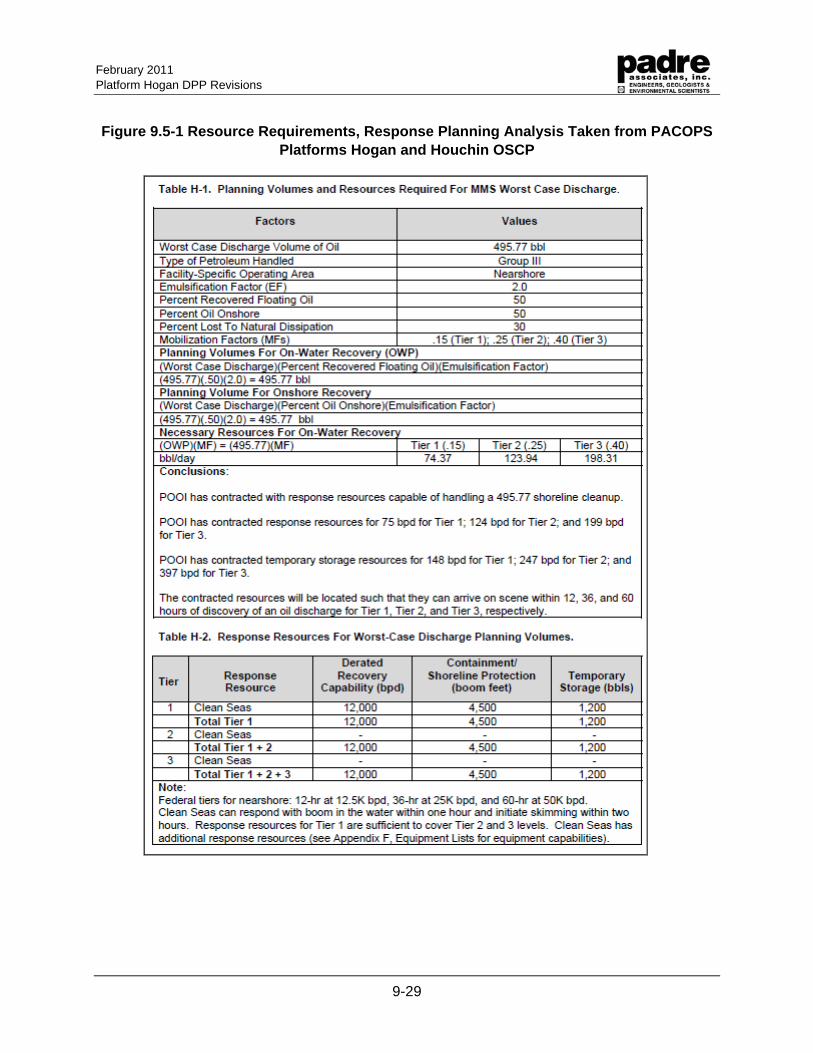
February 2011 Platform Hogan DPP Revisions
9-29
Figure 9.5-1 Resource Requirements, Response Planning Analysis Taken from PACOPS Platforms Hogan and Houchin OSCP
February 2011 Platform Hogan DPP Revisions
9-30
Immediately following notification of the spill, the Senior Supervisor/Operations Superintendent would notify the Company’s Qualified Individual (Incident Commander) of the severity of the release and initiate the mobilization of primary response equipment and personnel. In addition, the onsite personnel would be instructed to contain and stop the release at the site if possible. Spill movement and size would be estimated and information on the cause, size, and movement of the spill would be transmitted to Clean Seas primary and secondary response personnel and to the Incident Response Team (IRT). IRT team members would be instructed to report to the Incident Command Center as soon as possible.
Upon arrival of the primary response personnel and equipment, site characterization would be conducted and if determined safe, initial containment and recovery procedures would be implemented. Onsite personnel would be responsible for notifying the IC through the IRT team members of initial field operations and the anticipated equipment requirements for the response operations. Secondary equipment, if necessary, would be mobilized from other spill response cooperatives, independent contractors, and governmental agencies to ensure timely delivery to the spill site as necessary.
Following initiation of spill response operations, the Company’s IRT team members working in coordination with the Federal On-Scene Coordinator or his representative and IC team would continue to monitor spill movement and response operations effectiveness. In the event that trajectory modeling and associated real time observations indicate that shoreline areas are at risk of being impacted by the spill, shoreline protection and cleanup procedures would be implemented. Should multiple areas require protection, sites will be prioritized. All necessary equipment would be moved to the assigned staging areas by the assigned onshore cleanup contractor (ACTI and Clean Seas).
In the event wildlife resources are threatened, PACOPS would work with the California Oiled Wildlife Care Network, California Department of Fish and Game, National Marine Fisheries Service, or other related wildlife rescue and rehabilitation services to identify the necessary resources to capture, clean, and care for the impacted animals. The Company IRT members would provide the necessary support to the site and maintain operations at the care sites.
Recovery, temporary storage, recycling, and/or disposal of oil from offshore operations would be coordinated by the IRT. Initial recovered oil storage and transfer sites would be identified and all necessary agencies approvals would be obtained. Recovered oil and oily debris would then be transferred to approved recycling and/or disposal sites.
Response, containment, recovery, and cleanup operations would be continued for the duration of the spill event. Modifications to the response procedures and associated equipment and personnel would be implemented in coordination with the Federal On-Scene Coordinator and/or State On-Scene Coordinator as the events dictated. Spill source control would be continued until the release was successfully contained. Additional response procedures including chemical agents (dispersants) and in-situ burning would be continually evaluated and if determined necessary; agency approvals would be requested accordingly.
February 2011 Platform Hogan DPP Revisions
9-31
9.5.1 NOTIFICATIONS
An important step in the response procedure is notification to appropriate participants of the incident. Notification is essential to activate the response organizations, alert company management, obtain assistance and cooperation of agencies, mobilize resources, and comply with local, state, and federal regulations. The order of notification is based on the premise that those parties who can render assistance in controlling or minimizing the impacts of an incident be notified before those that are remote from the incident. The notification process encompasses the following categories:
• Emergency Agency notification
• Company notification/onsite spill response team activation
• Cleanup contractors (if required)
• Notification of other interested parties
• Periodic progress updates and reports (if necessary)
9.5.2.1 Emergency Agency Notification
In the event of a spill, immediate notification to the National Response Center at (800) 424-8802 is mandatory. This notification also normally results in simultaneous notification of the U.S. Coast Guard. However, it is recommended that a call also be made to the local U.S. Coast Guard office in Long Beach at 562-980-4450 between 8:00 a.m. and 4:00 p.m., or 562-980-4444 after normal working hours and on weekends. The U.S. Coast Guard office in Santa Barbara can be reached at 805-965-0407.
The Lempert-Keene Seastrand Oil Spill Prevention and Response Act (SB 2040) requires notification of the California Office of Emergency Services when oil spills occur or threaten to occur from facilities, vessels, or pipelines into California marine waters. Essential agency notifications are further assured by the California Office of Emergency Services and the National Response Center, since they will notify related state and federal agencies. Based on the spill trajectory analysis, if the spill is a threat to the shoreline, the appropriate fire department and lifeguard stations should be notified. This would not normally be an immediate notification.
9.5.2.2 Archaeological Resources
In addition to the biologically sensitive areas discussed within the ACP, Cultural, Historical, and Archeological sites are known to exist along the shorelines of, and adjacent to these sensitive resource areas. However, as discussed within the ACP, due to the sensitivity of mapping site-specific archaeological resources, the exact locations of these sites must be ascertained by contacting the Native American Heritage Commission at (916) 653-4082 and State Office of Historical Preservation (916) 653-6624, and/or the Central Coast Archeological Information Center (805) 893-2474. The ACP contains detailed information regarding how to
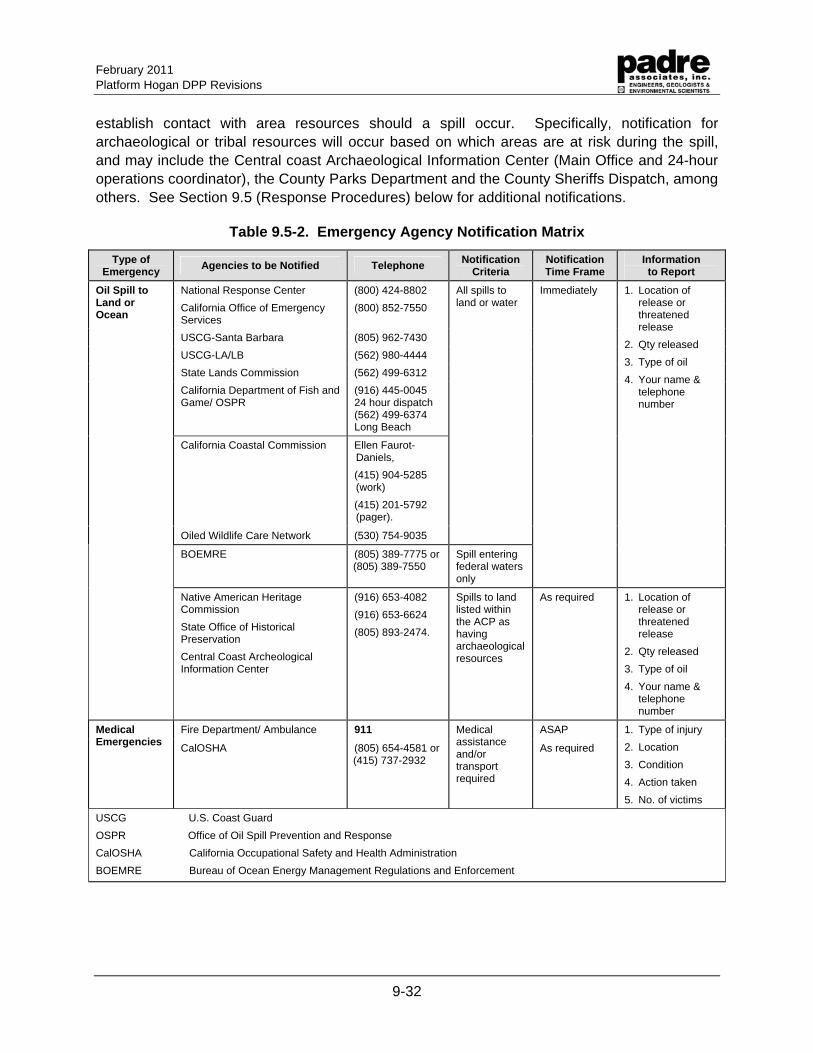
February 2011 Platform Hogan DPP Revisions
9-32
establish contact with area resources should a spill occur. Specifically, notification for archaeological or tribal resources will occur based on which areas are at risk during the spill, and may include the Central coast Archaeological Information Center (Main Office and 24-hour operations coordinator), the County Parks Department and the County Sheriffs Dispatch, among others. See Section 9.5 (Response Procedures) below for additional notifications.
Table 9.5-2. Emergency Agency Notification Matrix
Type of Emergency
Agencies to be Notified Telephone Notification
Criteria Notification Time Frame
Information to Report
National Response Center (800) 424-8802
California Office of Emergency Services
(800) 852-7550
USCG-Santa Barbara (805) 962-7430
USCG-LA/LB (562) 980-4444
State Lands Commission (562) 499-6312
Oil Spill to Land or Ocean
California Department of Fish and Game/ OSPR
(916) 445-0045 24 hour dispatch (562) 499-6374 Long Beach
All spills to land or water
Immediately 1. Location of release or threatened release
2. Qty released
3. Type of oil
4. Your name & telephone number
California Coastal Commission Ellen Faurot-Daniels,
(415) 904-5285 (work)
(415) 201-5792 (pager).
Oiled Wildlife Care Network (530) 754-9035
BOEMRE (805) 389-7775 or (805) 389-7550
Spill entering federal waters only
Native American Heritage Commission
State Office of Historical Preservation
Central Coast Archeological Information Center
(916) 653-4082
(916) 653-6624
(805) 893-2474.
Spills to land listed within the ACP as having archaeological resources
As required 1. Location of release or threatened release
2. Qty released
3. Type of oil
4. Your name & telephone number
Fire Department/ Ambulance 911 ASAP Medical Emergencies
CalOSHA (805) 654-4581 or (415) 737-2932
Medical assistance and/or transport required
As required
1. Type of injury
2. Location
3. Condition
4. Action taken
5. No. of victims
USCG U.S. Coast Guard
OSPR Office of Oil Spill Prevention and Response
CalOSHA California Occupational Safety and Health Administration
BOEMRE Bureau of Ocean Energy Management Regulations and Enforcement
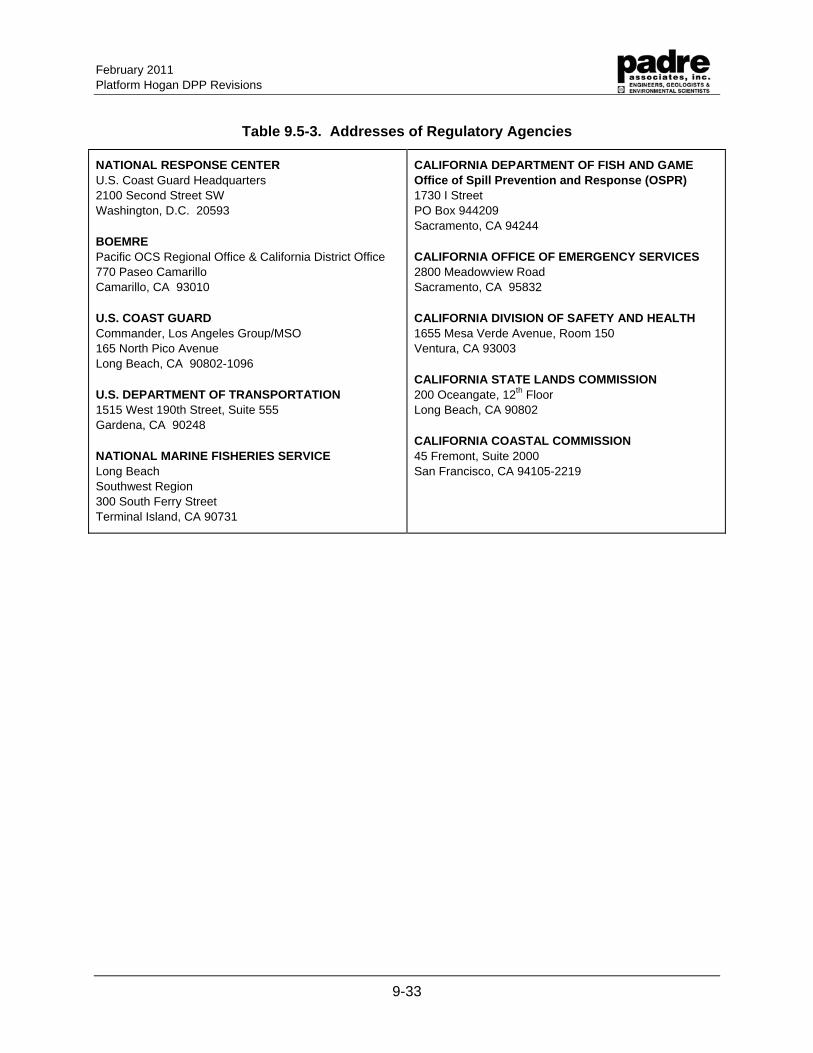
February 2011 Platform Hogan DPP Revisions
9-33
Table 9.5-3. Addresses of Regulatory Agencies
NATIONAL RESPONSE CENTER U.S. Coast Guard Headquarters 2100 Second Street SW Washington, D.C. 20593
BOEMRE Pacific OCS Regional Office & California District Office 770 Paseo Camarillo Camarillo, CA 93010
U.S. COAST GUARD Commander, Los Angeles Group/MSO 165 North Pico Avenue Long Beach, CA 90802-1096
U.S. DEPARTMENT OF TRANSPORTATION 1515 West 190th Street, Suite 555 Gardena, CA 90248
NATIONAL MARINE FISHERIES SERVICE Long Beach Southwest Region 300 South Ferry Street Terminal Island, CA 90731
CALIFORNIA DEPARTMENT OF FISH AND GAME Office of Spill Prevention and Response (OSPR) 1730 I Street PO Box 944209 Sacramento, CA 94244
CALIFORNIA OFFICE OF EMERGENCY SERVICES 2800 Meadowview Road Sacramento, CA 95832
CALIFORNIA DIVISION OF SAFETY AND HEALTH 1655 Mesa Verde Avenue, Room 150 Ventura, CA 93003
CALIFORNIA STATE LANDS COMMISSION 200 Oceangate, 12th Floor Long Beach, CA 90802
CALIFORNIA COASTAL COMMISSION 45 Fremont, Suite 2000 San Francisco, CA 94105-2219
February 2011 Platform Hogan DPP Revisions
9-34
9.6 REFERENCES
Gemini Solutions, Inc. Carpinteria Field Offshore California-Sub and Supra-Thrust Worst-Case Discharge Studies. February 2011.
"GNOME User's Manual and Tour | Emergency Response | Software & Data Sets | NOAA's
National Ocean Service Office of Response and Restoration." NOAA's Ocean Service Office of Response and Restoration. Jan. 2002. Web. 20 July 2010.
Marine Research Specialists, 2002. Potential Impacts Associated with the Cleanup of a Marine Oil Spill.
Minerals Management Service, 2001. Delineation Drilling Activities in Federal Waters Offshore Santa Barbara County, California Draft Environmental Impact Statement. OCS EIS/EA MMS 2001-046. Minerals Management Service, Pacific OCS Region, Camarillo, CA.
Pacific Operators Offshore, 2001, with revisions through 2008. Oil Spill Response Plan, Platforms Hogan and Houchin and Associated Subsea Pipelines (OCS-P 0166).
Padre Associates, 2000. Oil Spill Response Plan for Operations on AERA Energy LLC Point Sal Unit Delineation Drilling Program.
February 2011 Platform Hogan DPP Revisions
9-35
GNOME MODEL RUN OUTPUTS
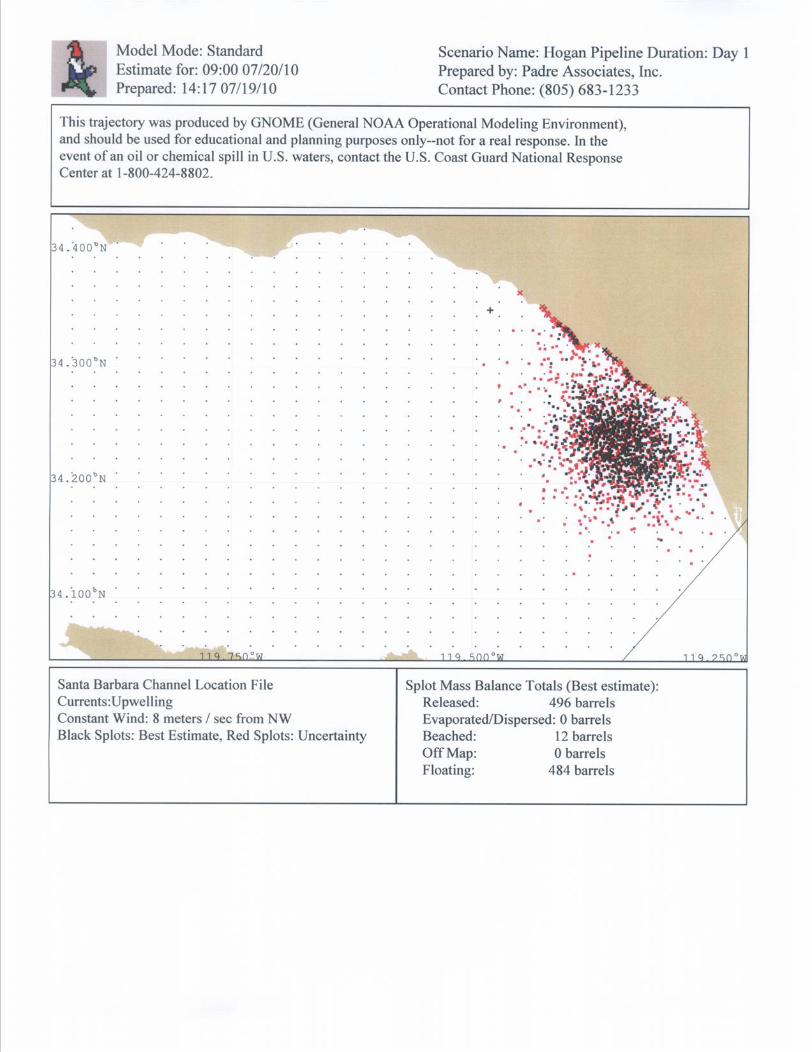
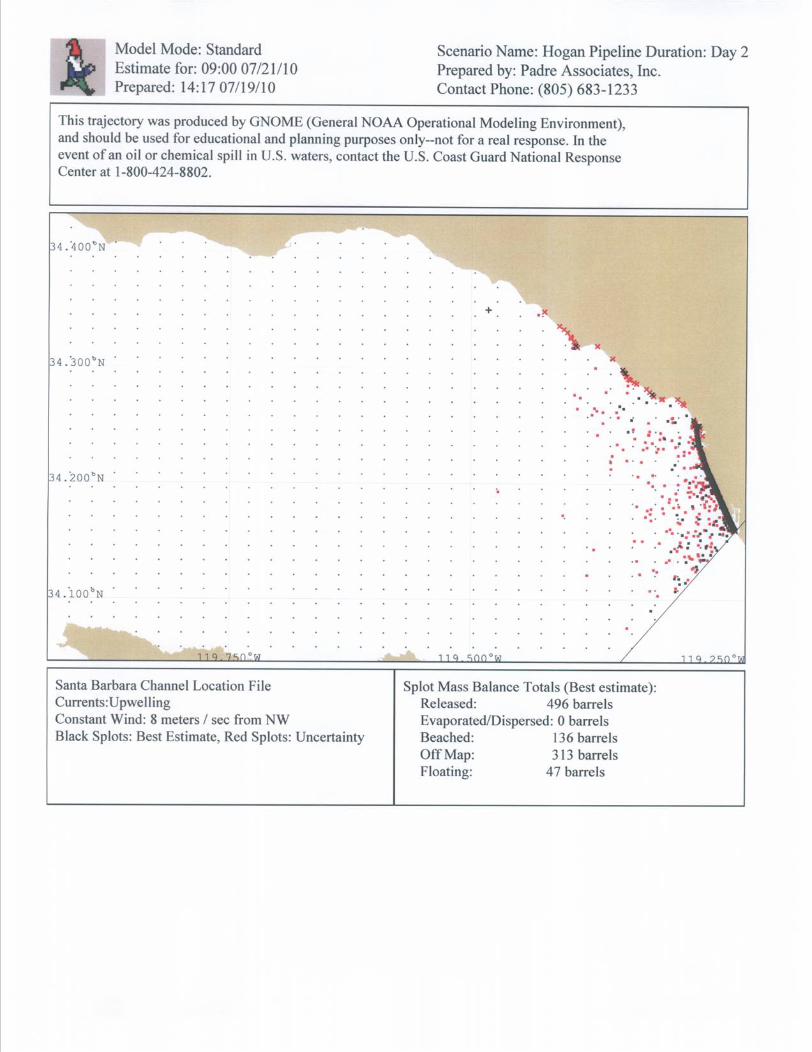
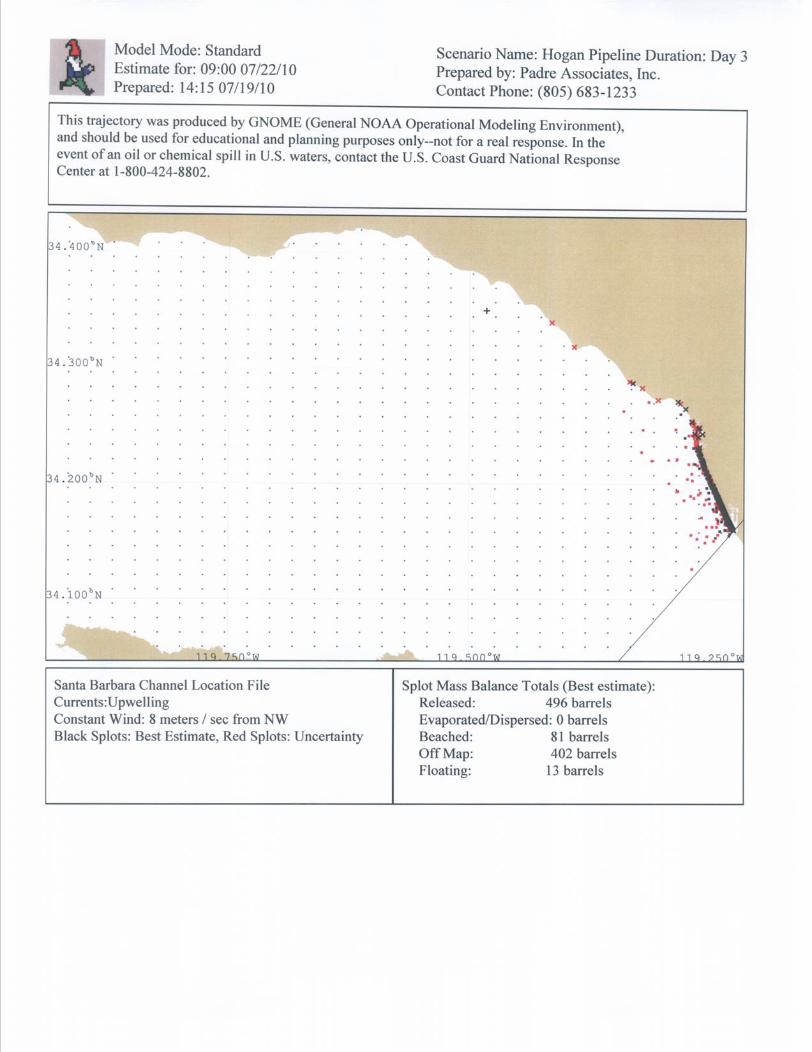
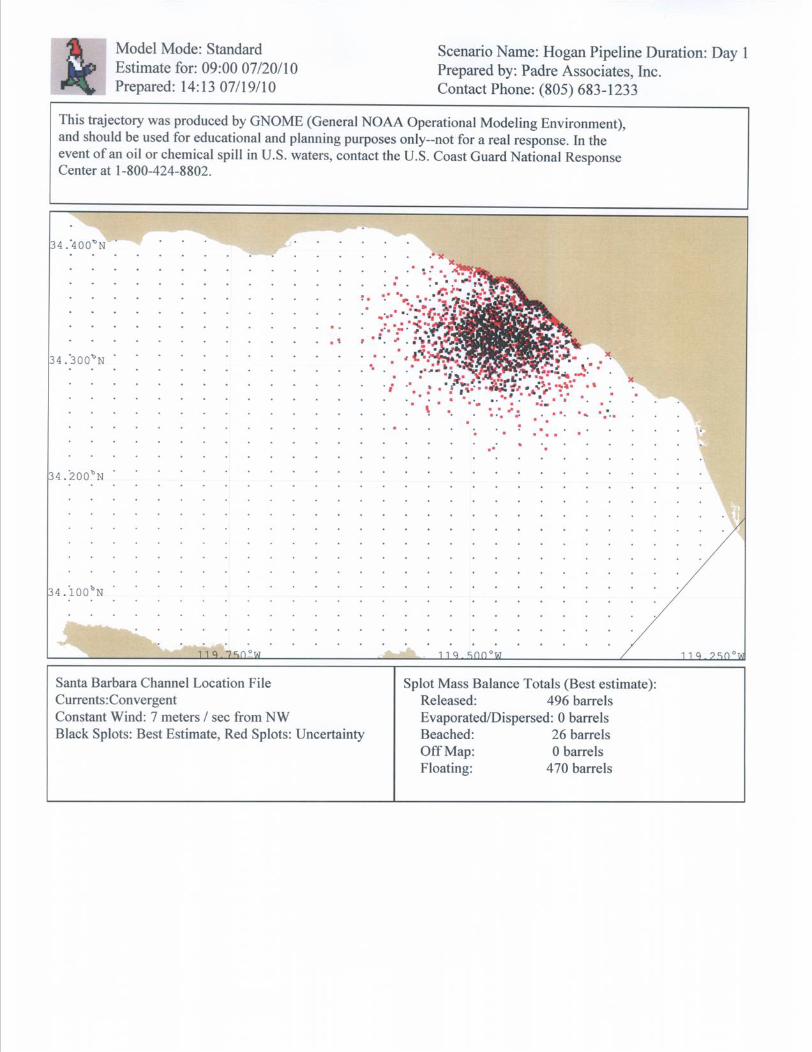
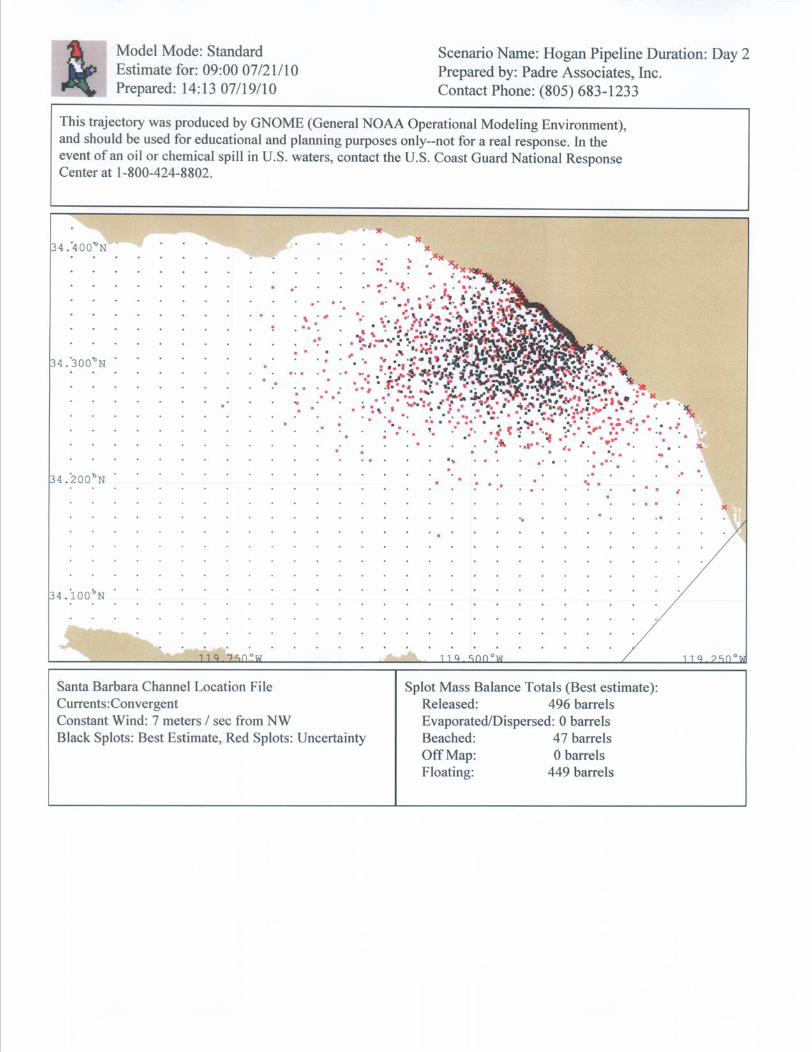
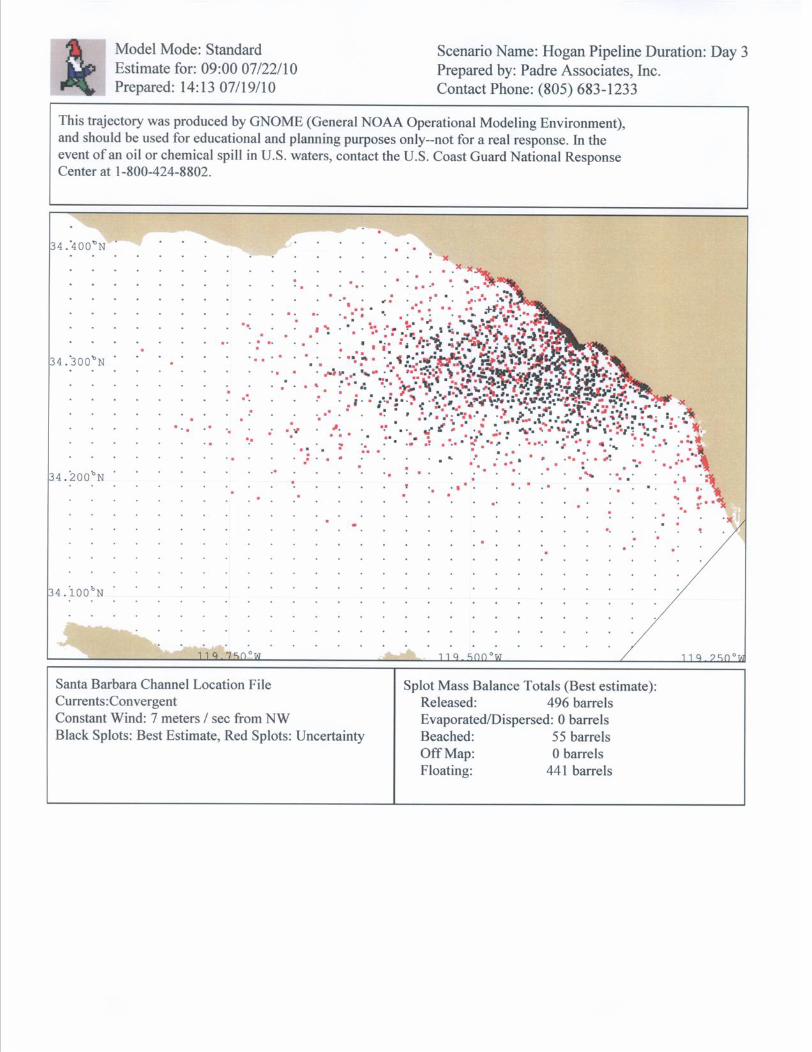
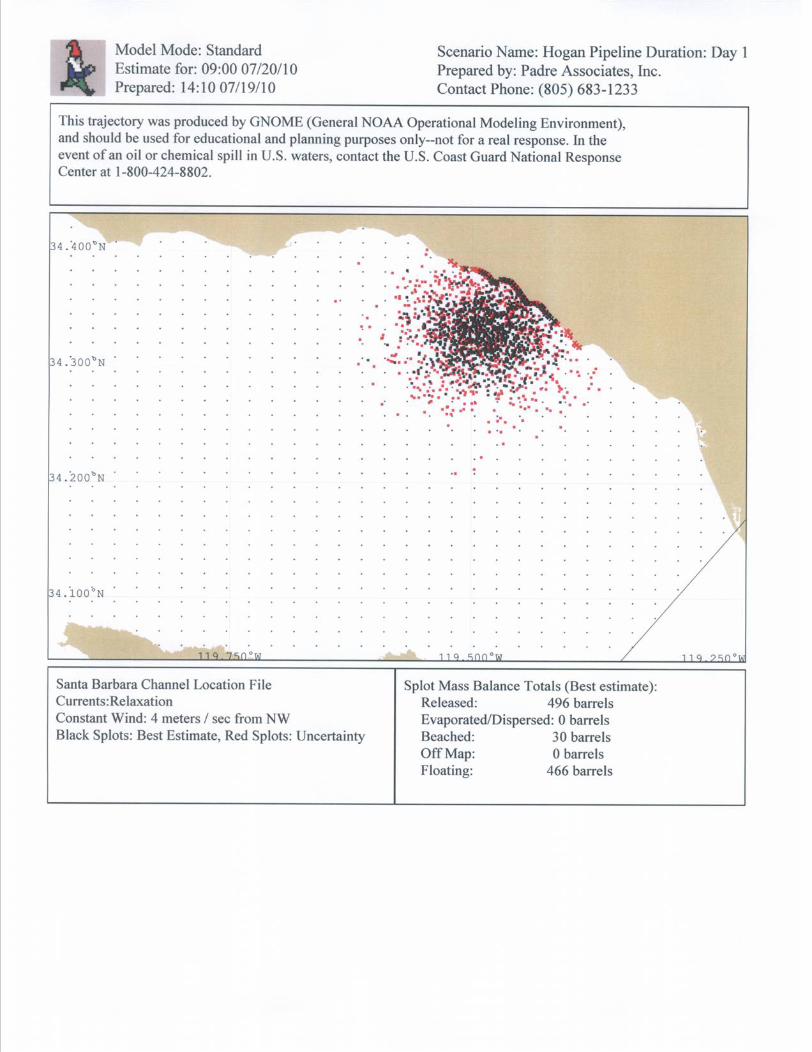
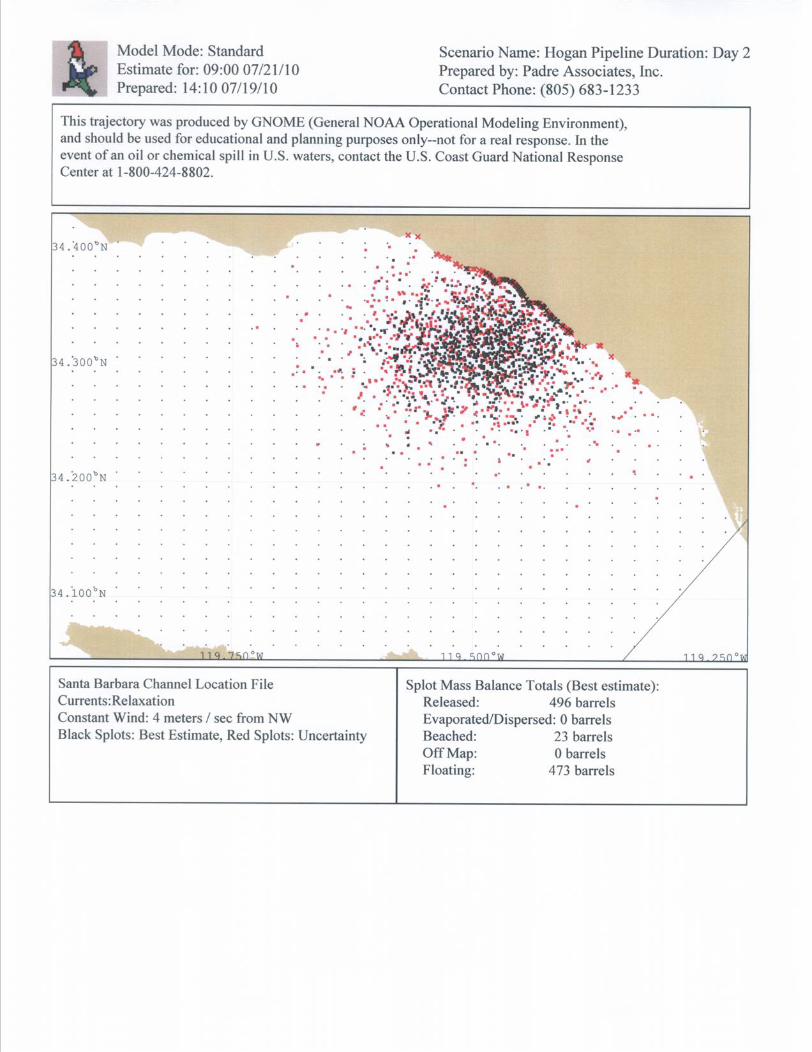
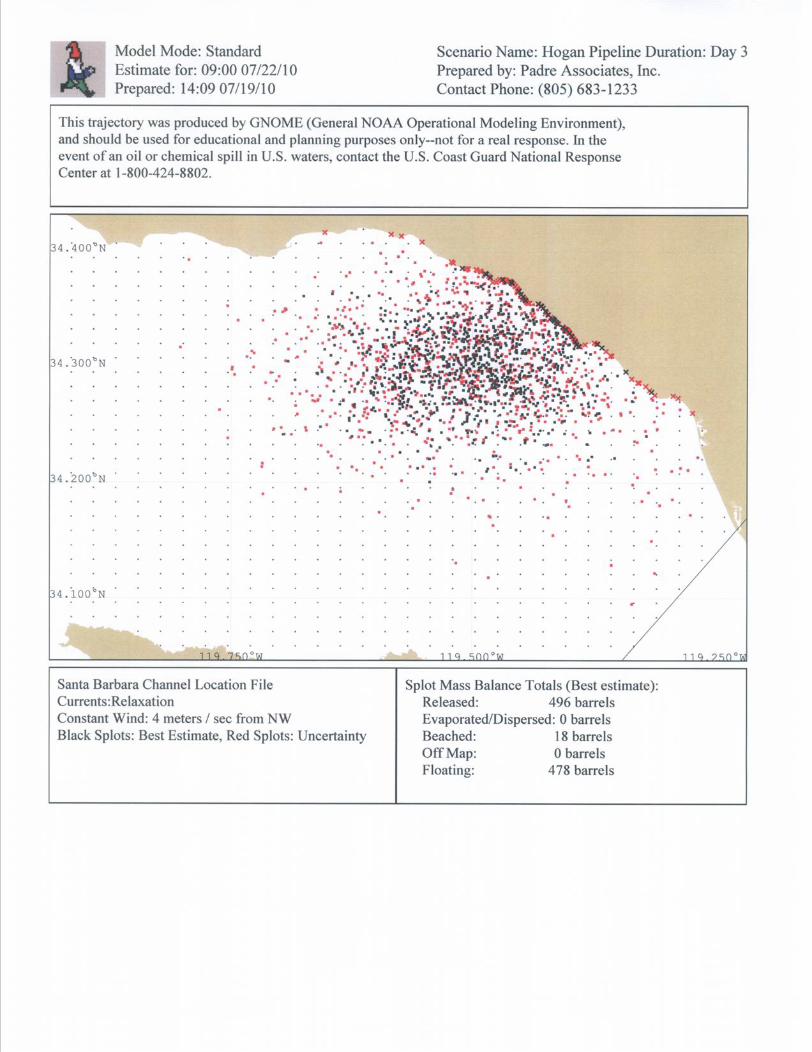

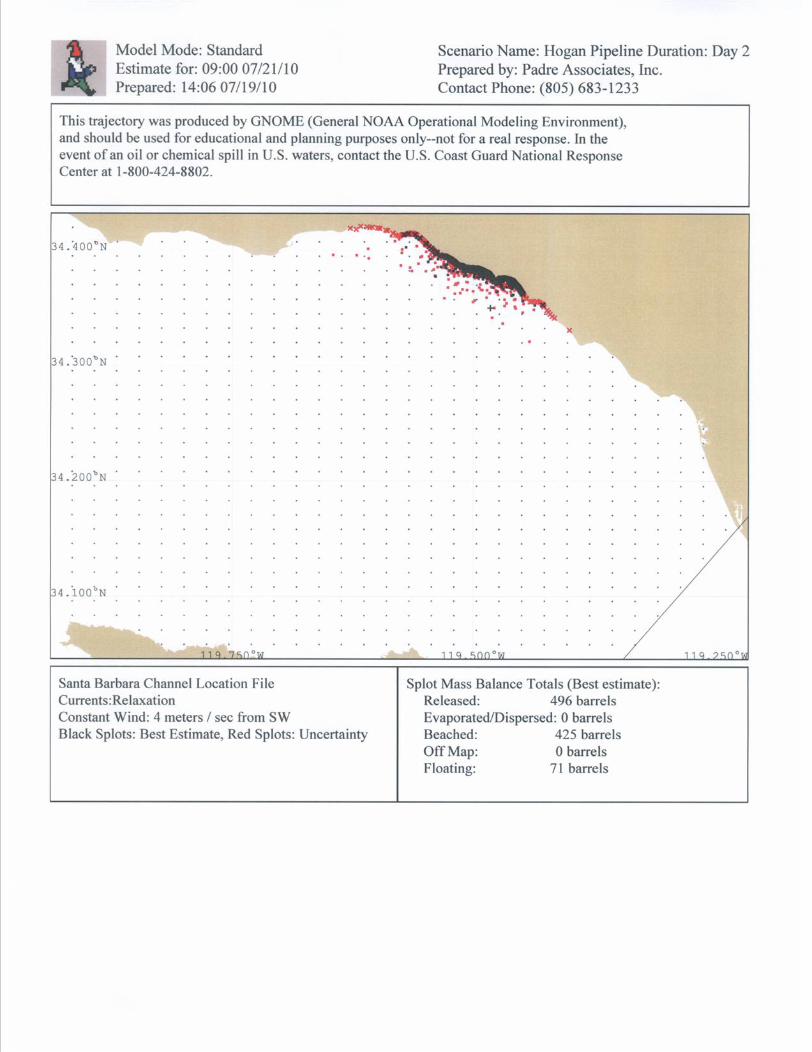
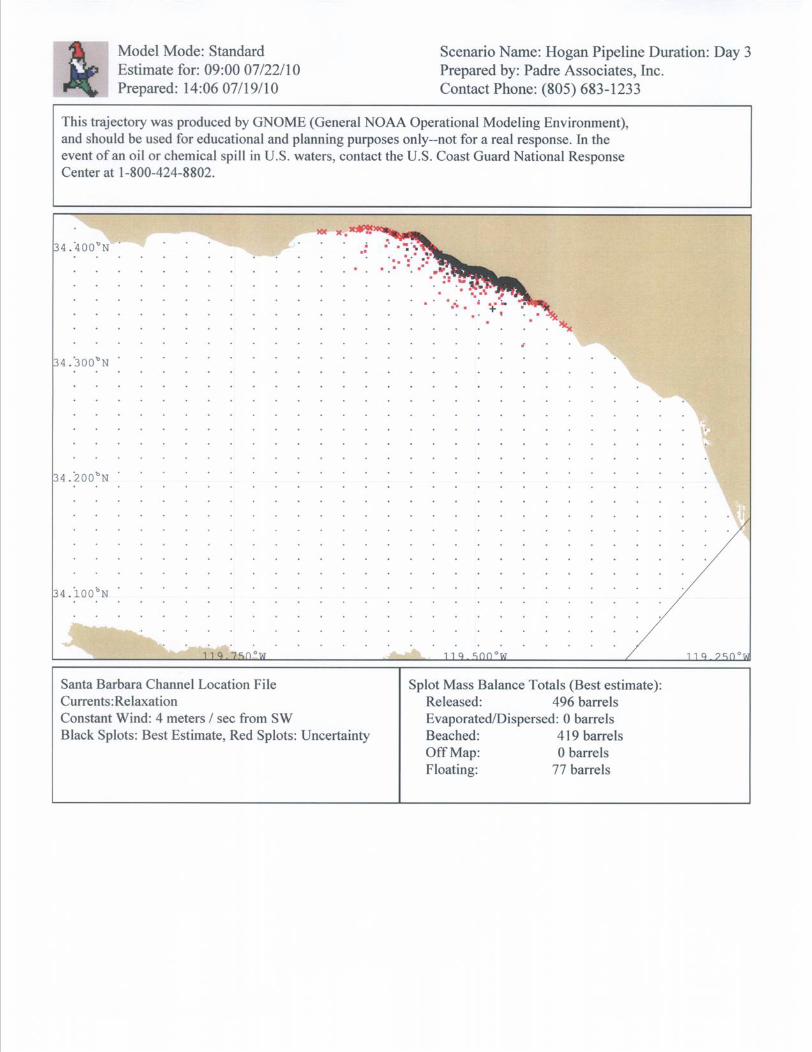
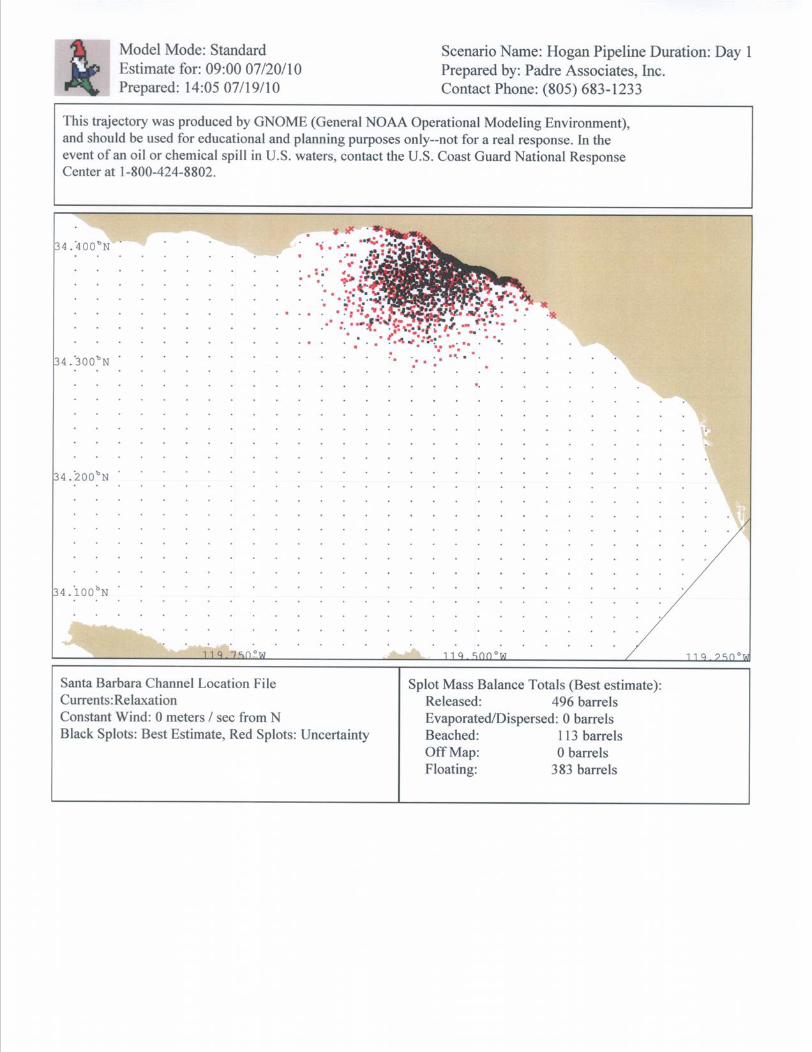
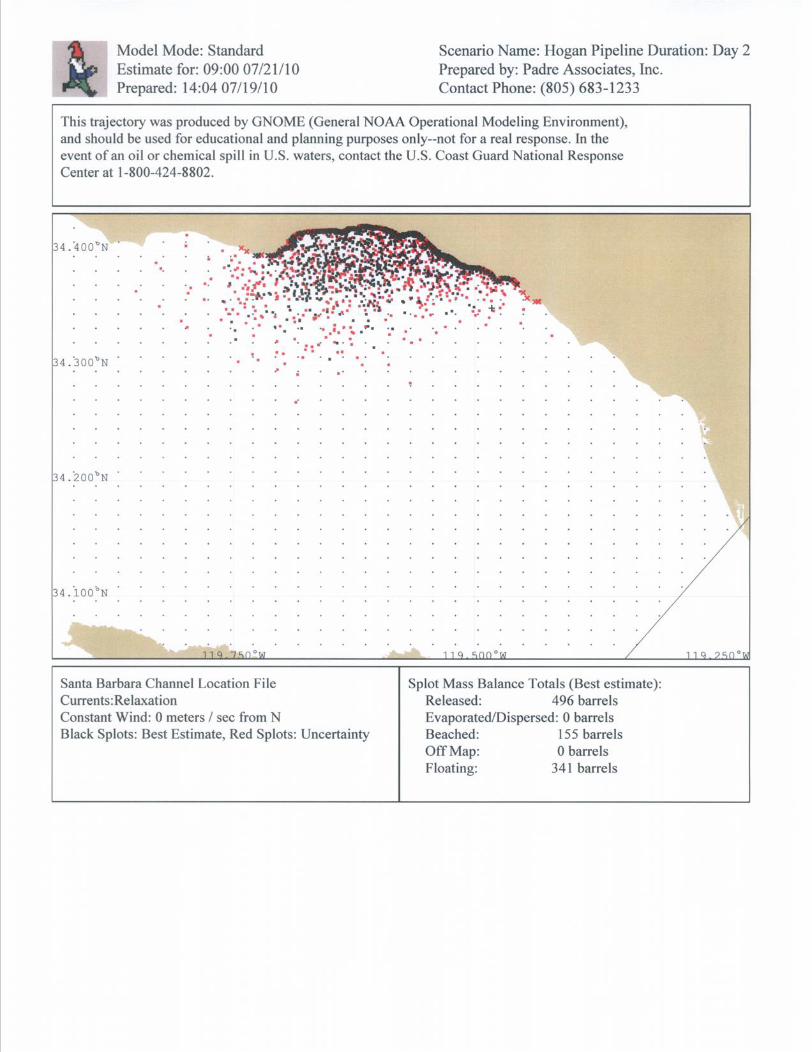
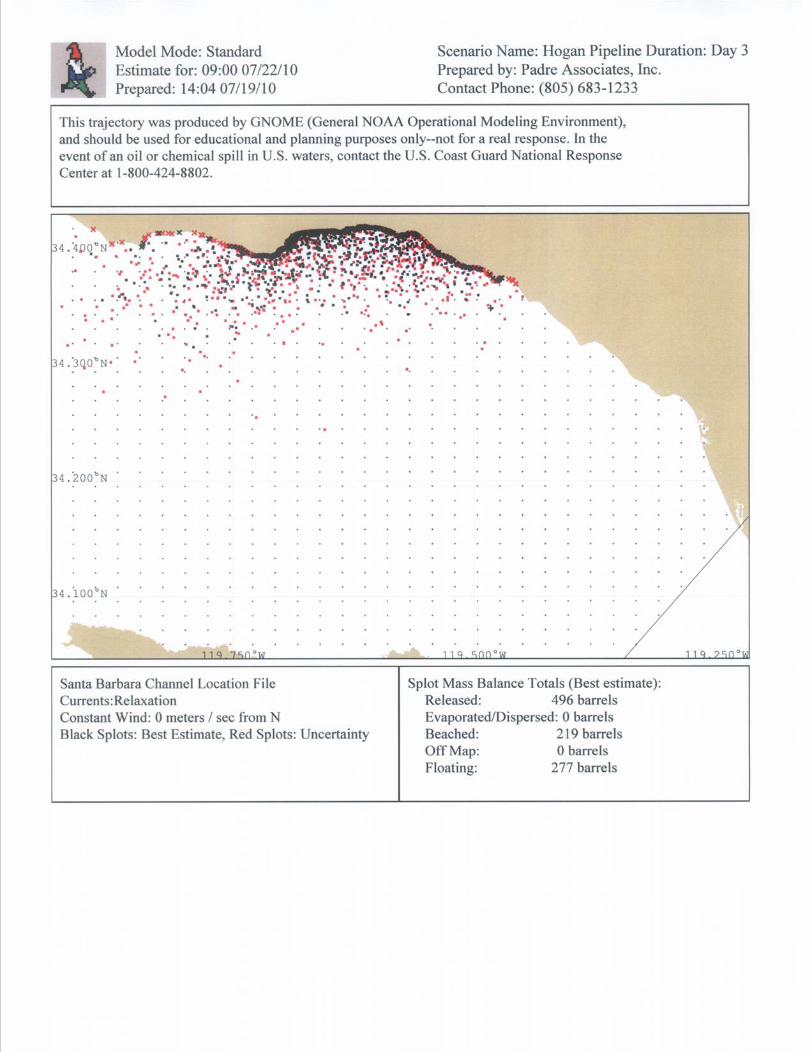
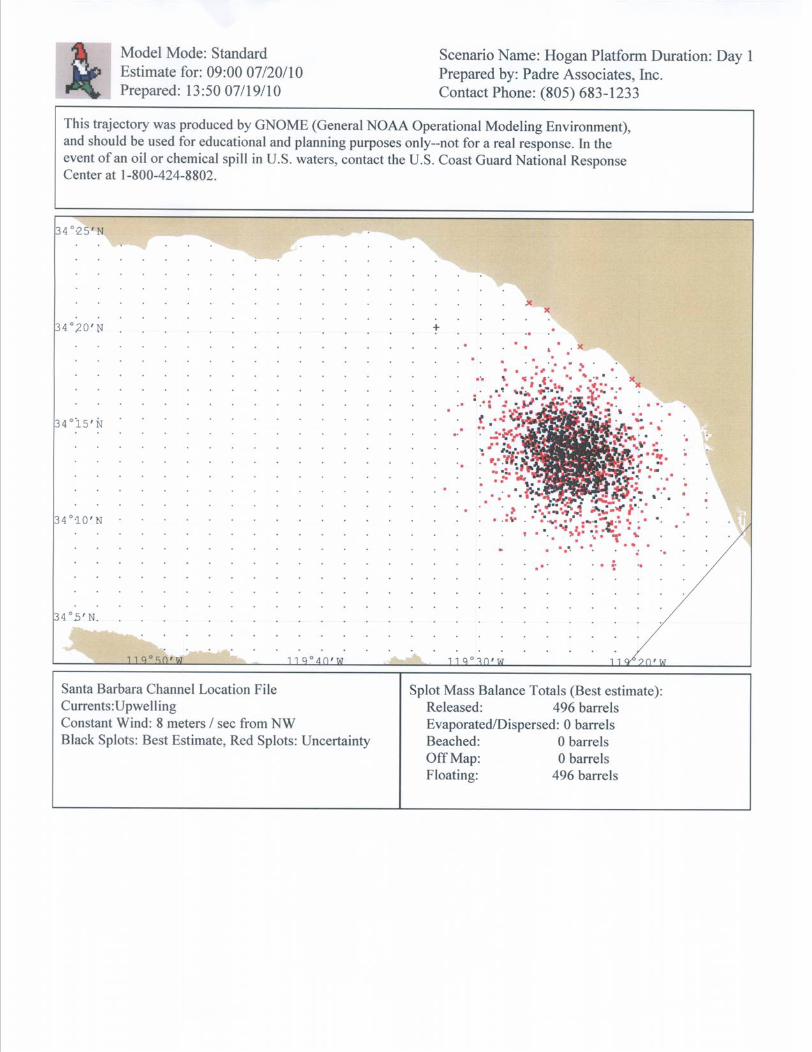
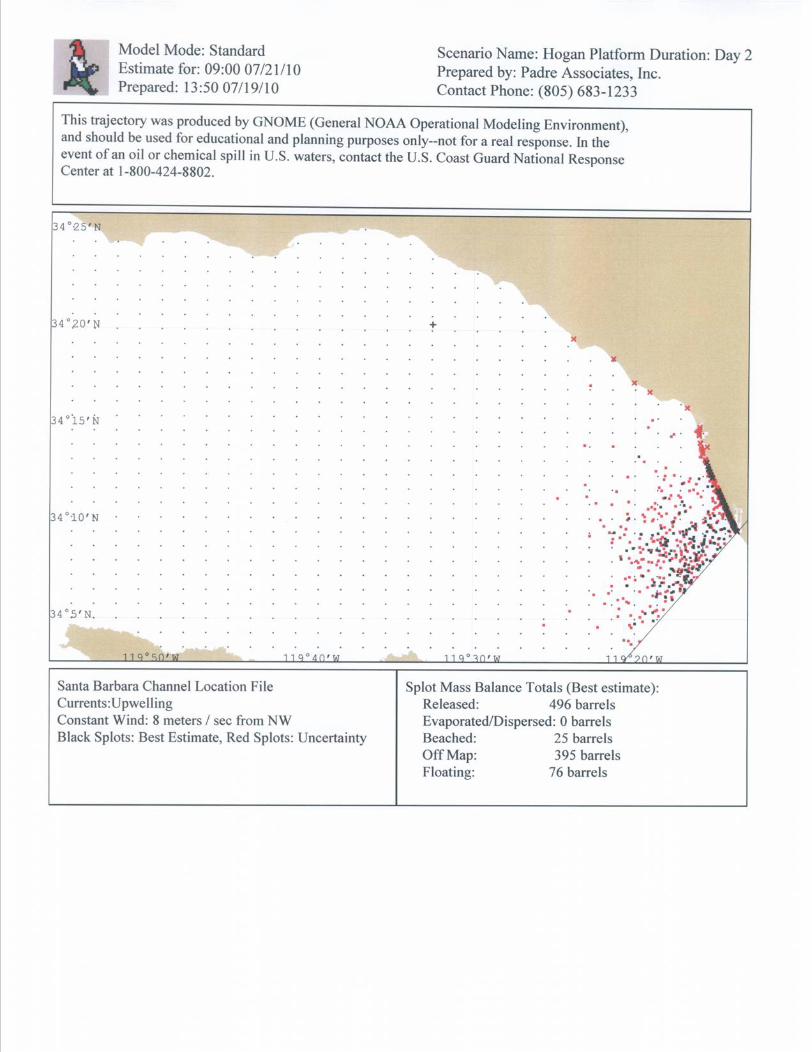
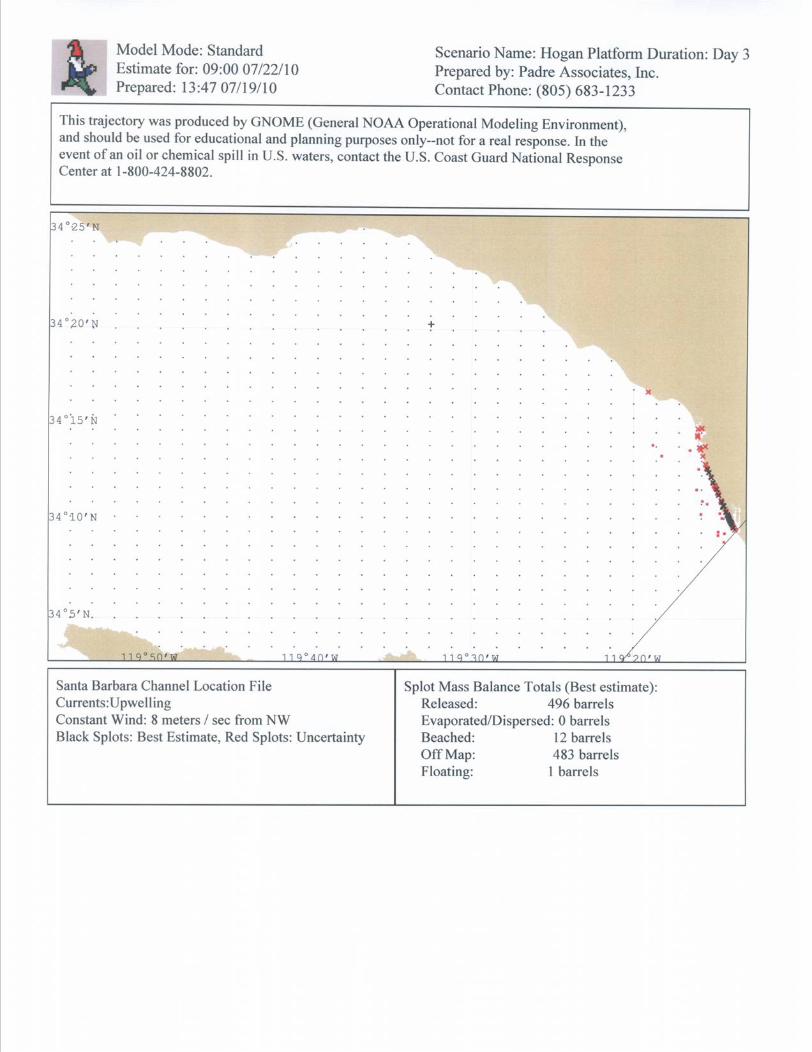
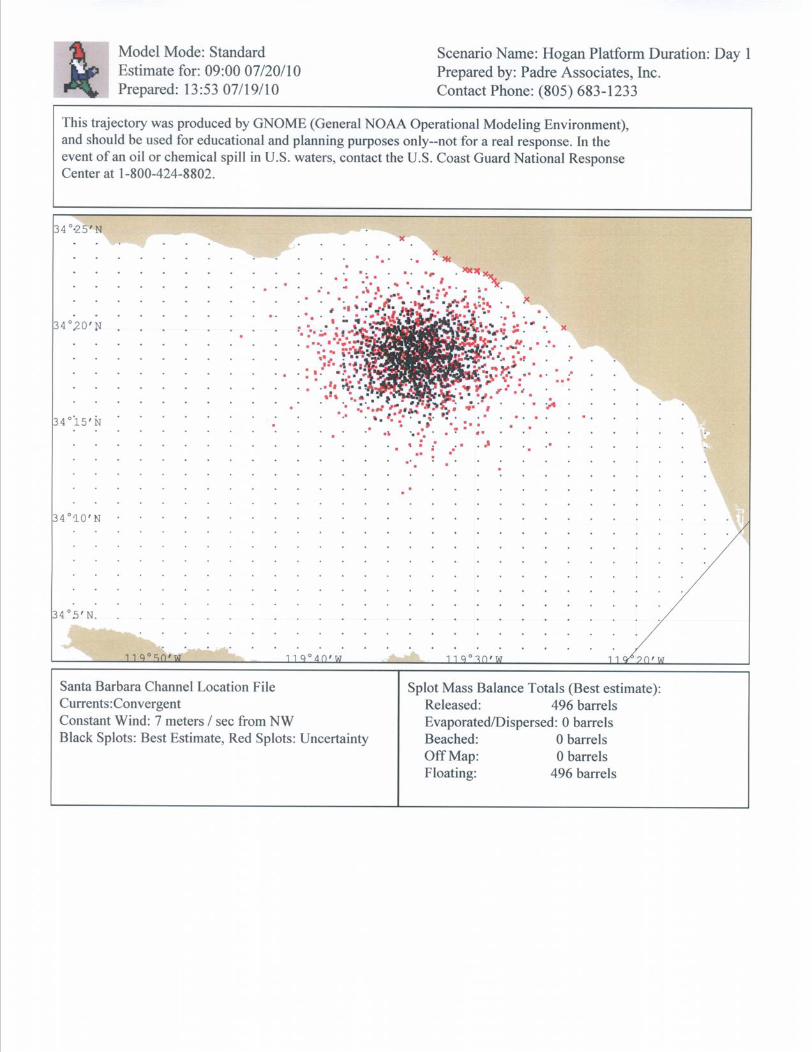
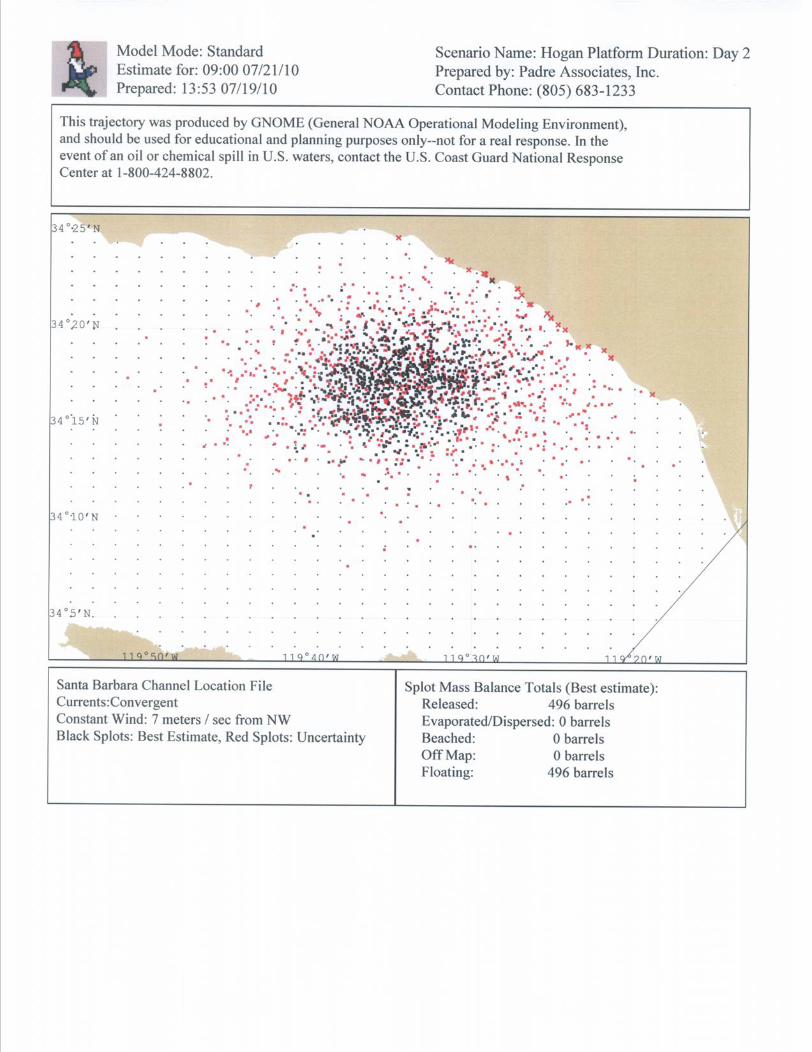
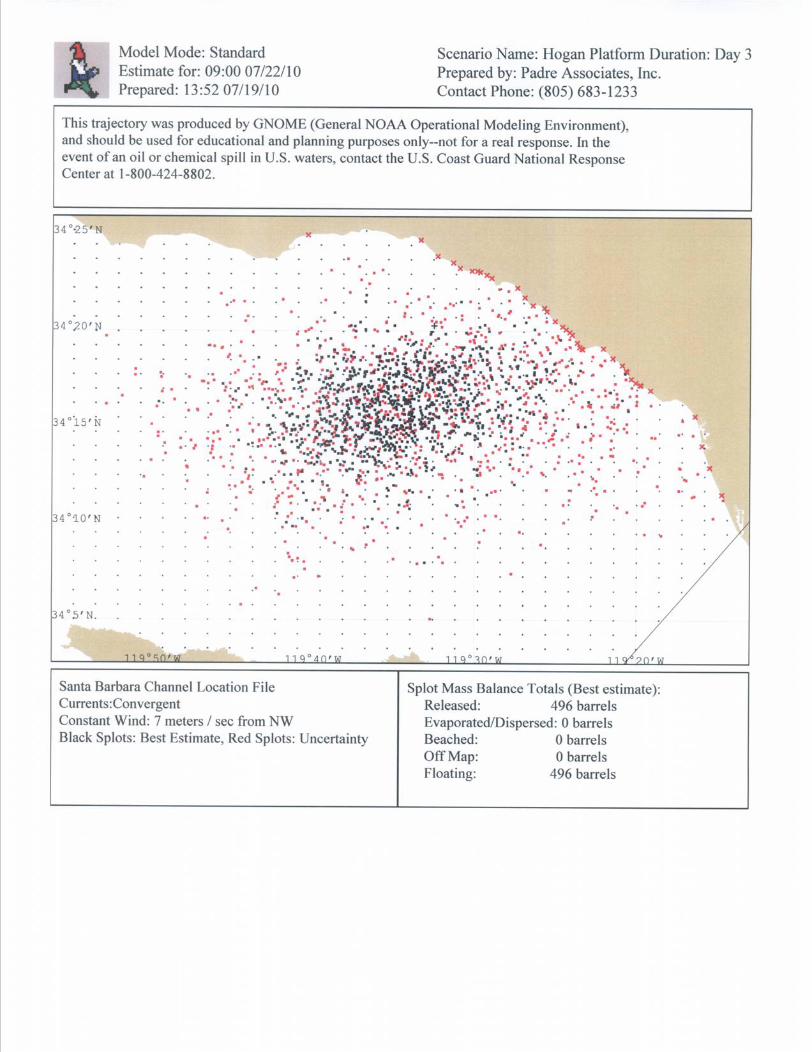
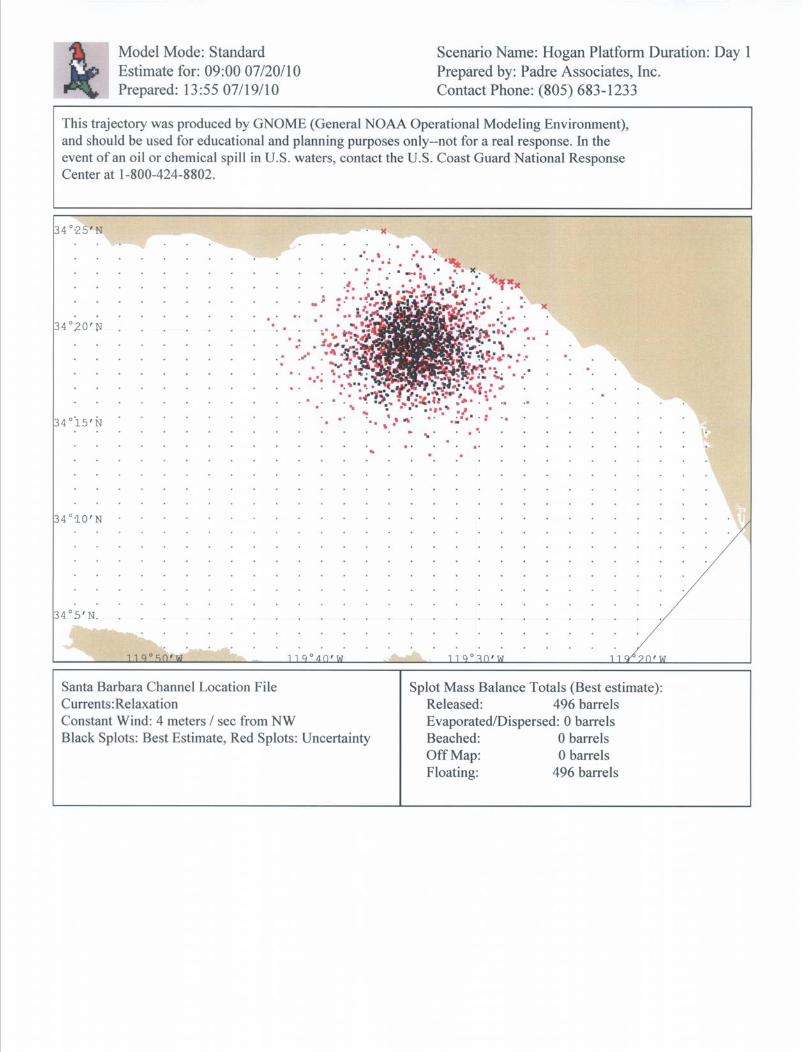
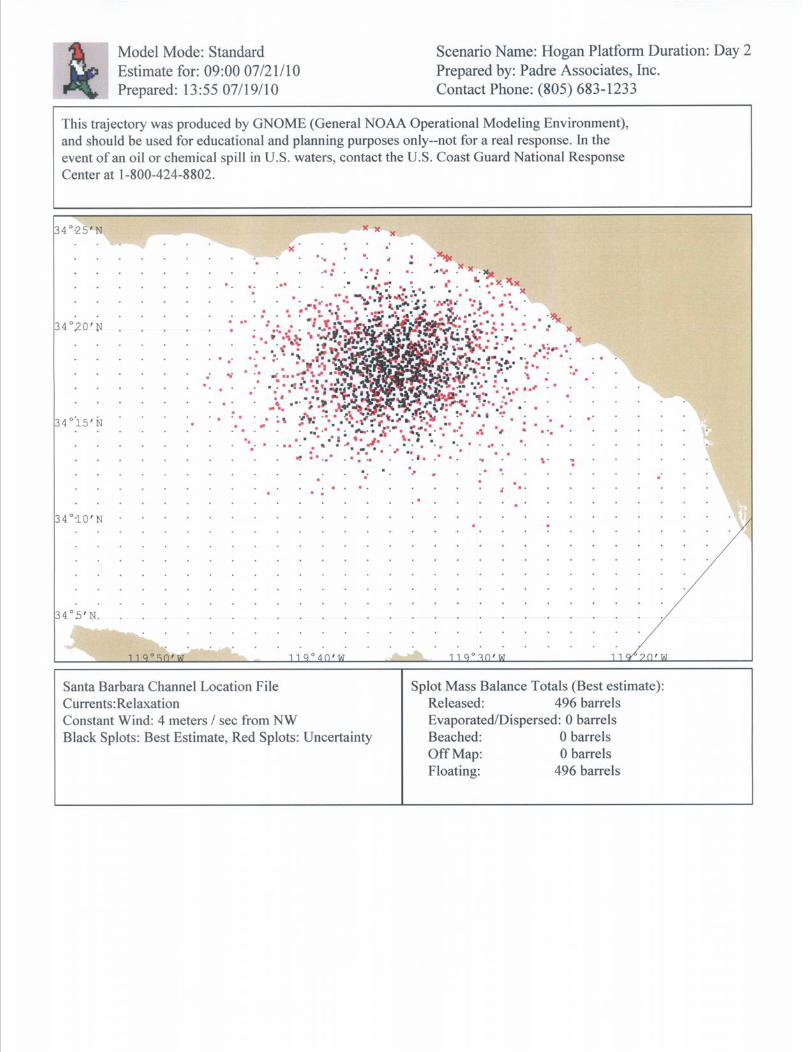
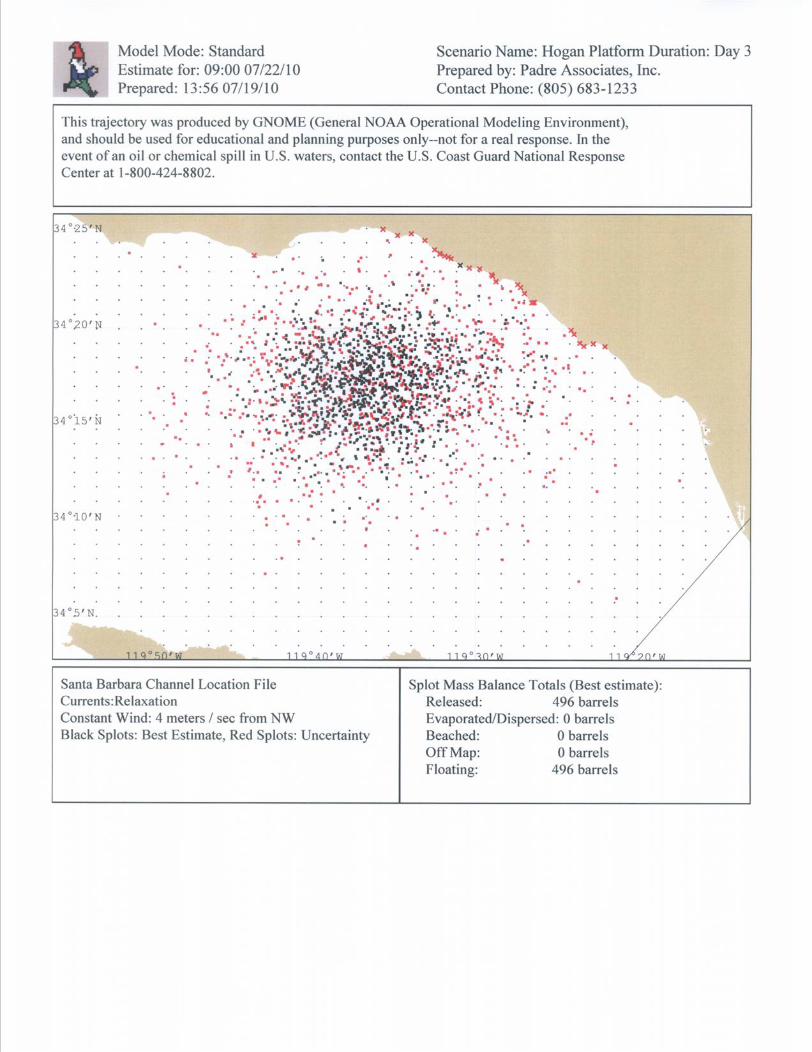


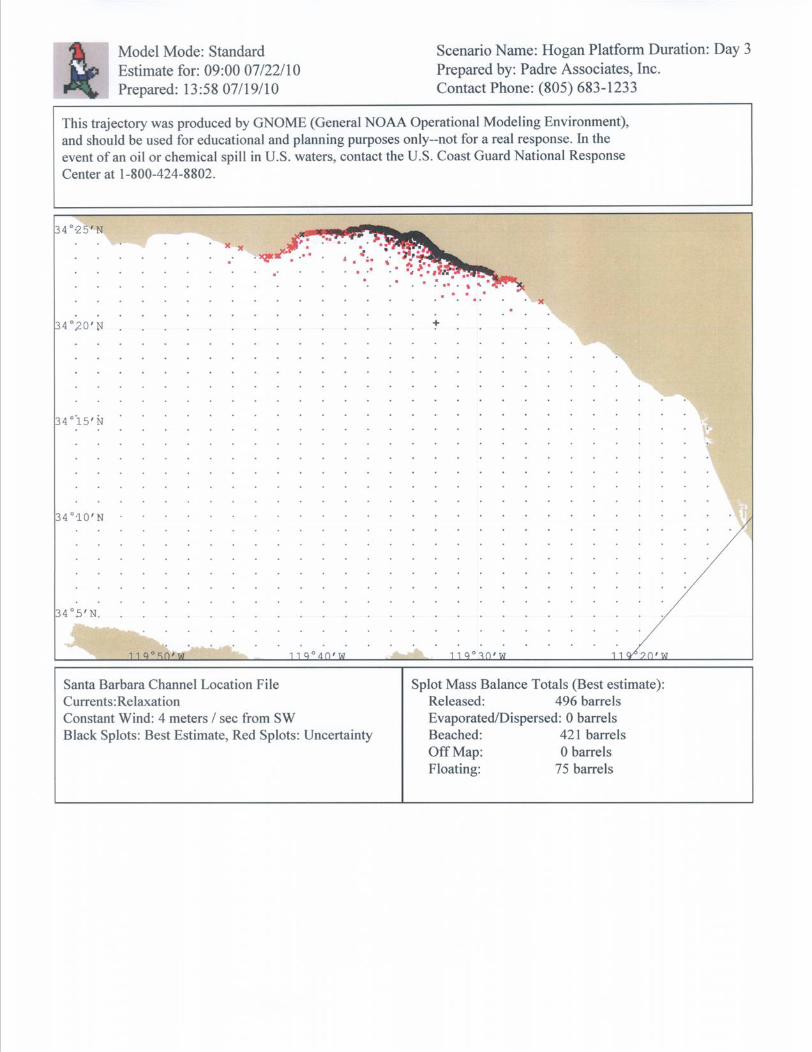
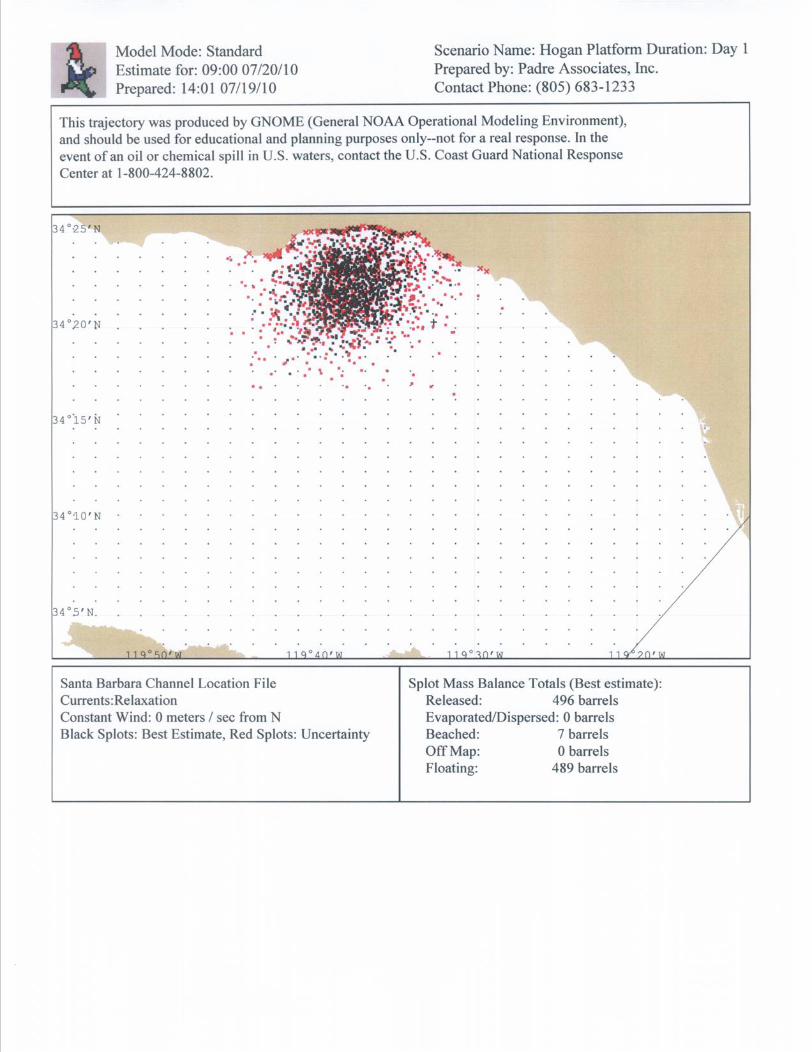
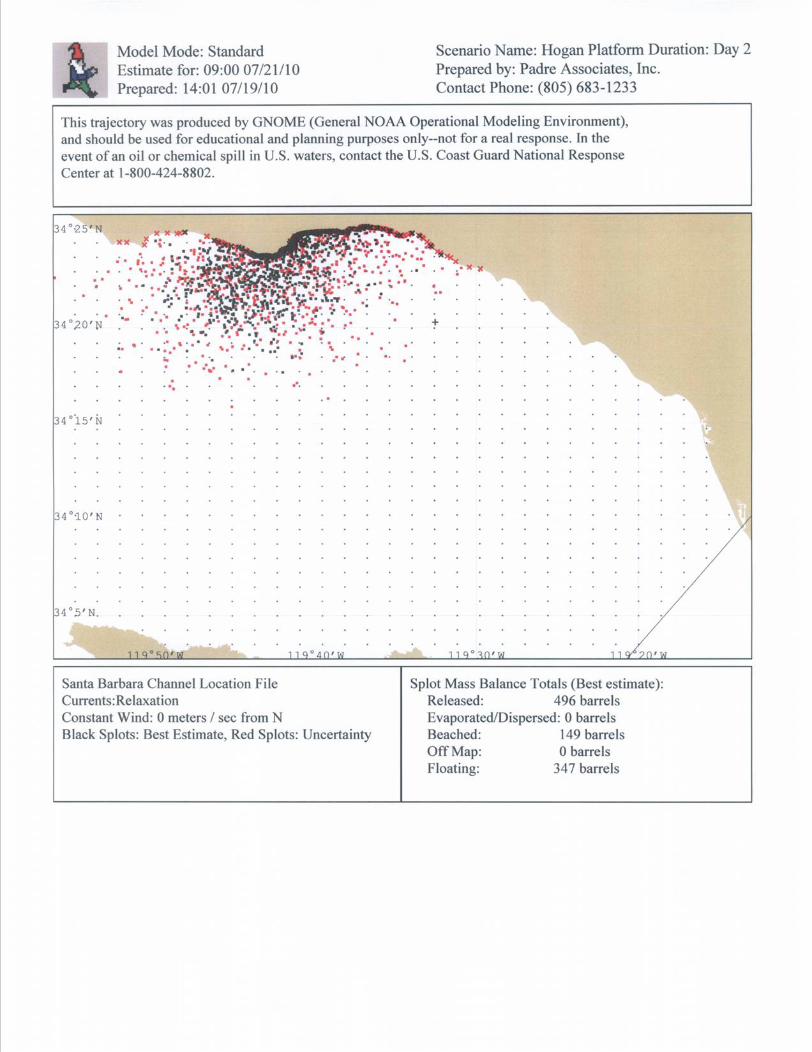
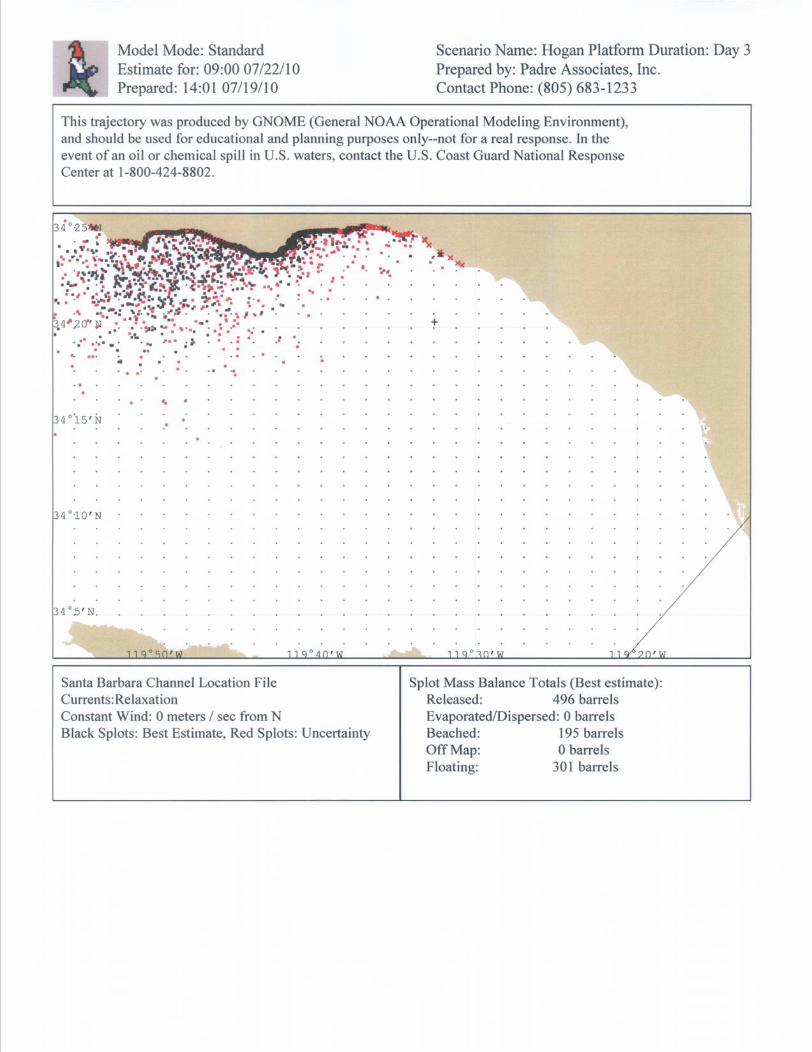
Related Documents