Revised Deliverable 3 – Campaign Assessment Guidance TAPESTRY Contract No: 2000-10988 Project Co-ordinator: Transport & Travel Research Ltd, UK Partners: Transport Studies Group, University of Westminster Hampshire County Council Hertfordshire County Council Langzaam Verkeer Komitee Milieu en Mobiliteit or Committee for Environment and Mobility Consultores Em Transportes Inovação e Sistemas S.A. Aristotle University of Thessaloniki Agenzia per i Trasporti Autoferrotramviari Del Comune Di Roma Asstra-Associazione Trasporti Citta di Torino Forschungsgesellschaft Mobilität - Austrian Mobility Research Ayuntamiento de Vitoria-Gasteiz CH2MHILL Uniunea Romana De Transport Public Gestionnaires Sans Frontieres Regia Autonoma De Transport in Comun Constanta Interactions Ltd Communauté Urbaine de Nantes Société D'Économie Mixte Des Transports De L'Agglomération Nantaise Centre D'Études sur les Réseaux, Les Transports L'Urbanisme et Les Constructions Publiques T.E.Marknadskommunikation A.B. Gävle City, The Technical Office Socialdata Institut für Verkehrs- und Infrastrukturforschung GmbH Date: Revised September 2003 PROJECT FUNDED BY THE EUROPEAN COMMISSION UNDER THE TRANSPORT RTD PROGRAMME OF THE 5 TH FRAMEWORK PROGRAMME

Welcome message from author
This document is posted to help you gain knowledge. Please leave a comment to let me know what you think about it! Share it to your friends and learn new things together.
Transcript

Revised Deliverable 3 –
Campaign Assessment Guidance
TAPESTRY Contract No: 2000-10988
Project Co-ordinator: Transport & Travel Research Ltd, UK Partners: Transport Studies Group, University of Westminster
Hampshire County Council Hertfordshire County Council Langzaam Verkeer Komitee Milieu en Mobiliteit or Committee for Environment and Mobility Consultores Em Transportes Inovação e Sistemas S.A. Aristotle University of Thessaloniki Agenzia per i Trasporti Autoferrotramviari Del Comune Di Roma Asstra-Associazione Trasporti Citta di Torino Forschungsgesellschaft Mobilität - Austrian Mobility Research Ayuntamiento de Vitoria-Gasteiz CH2MHILL Uniunea Romana De Transport Public Gestionnaires Sans Frontieres Regia Autonoma De Transport in Comun Constanta Interactions Ltd Communauté Urbaine de Nantes Société D'Économie Mixte Des Transports De L'Agglomération Nantaise Centre D'Études sur les Réseaux, Les Transports L'Urbanisme et Les Constructions Publiques T.E.Marknadskommunikation A.B. Gävle City, The Technical Office Socialdata Institut für Verkehrs- und Infrastrukturforschung GmbH
Date: Revised September 2003
PROJECT FUNDED BY THE EUROPEAN COMMISSION UNDER THE TRANSPORT
RTD PROGRAMME OF THE 5TH FRAMEWORK PROGRAMME

Revised Deliverable 3
Revised September 2003 2
TABLE OF CONTENTS
1 INTRODUCTION........................................................................................................................................4 1.1 INTRODUCTION TO TAPESTRY............................................................................................................4 1.2 THE CAMPAIGN ASSESSMENT GUIDANCE IN THE CONTEXT OF OTHER TAPESTRY DELIVERABLES.....5 1.3 TAPESTRY APPROACH TO COMMUNICATIONS MANAGEMENT AND ASSESSMENT ..............................6 1.4 INTRODUCTION TO SEVEN STAGES OF CHANGE MODEL......................................................................11 1.5 WHY MONITOR AND ASSESS? .............................................................................................................15
2 PRINCIPLES..............................................................................................................................................17 2.1 THE ASSESSMENT PROCESS.................................................................................................................17
2.1.1 Campaign Objectives .....................................................................................................................17 2.1.2 Key steps in the process .................................................................................................................18 2.1.3 Indicators & Contextual Information.............................................................................................20
2.2 ATTRIBUTION OF OUTCOMES...............................................................................................................22 2.2.1 What is attribution? .......................................................................................................................22 2.2.2 The role of control groups .............................................................................................................22 2.2.3 Examining the role of external factors...........................................................................................23 2.2.4 Examining Campaign Exposure – the role of measuring campaign recall....................................23
2.3 PERFORMANCE MEASURES..................................................................................................................24 2.3.1 Campaign Effectiveness .................................................................................................................24 2.3.2 Campaign Efficiencies ...................................................................................................................24
2.4 THE TAPESTRY CAMPAIGN ASSESSMENT GUIDANCE AND THE SPECTRUM OF QUALITATIVE – QUANTITATIVE DATA .........................................................................................................................................25
2.4.1 Illustration of the qualitative – quantitative range of data for assessing campaigns ....................25 2.4.2 Defining assessment requirements.................................................................................................28 2.4.3 Balancing assessment requirements with resources available ......................................................29 2.4.4 Where the TAPESTRY Campaign Assessment Guidance fits in.....................................................30
2.5 TYPES OF ASSESSMENT .......................................................................................................................30 2.5.1 Campaign Management and Design..............................................................................................30 2.5.2 Inputs and Outputs.........................................................................................................................31 2.5.3 Outcomes .......................................................................................................................................31 2.5.4 Data Collection (Summary) ...........................................................................................................32
3 CAMPAIGN MANAGEMENT & DESIGN............................................................................................33 3.1 INTRODUCTION....................................................................................................................................33 3.2 ASSESSMENT PROTOCOL .....................................................................................................................33 3.3 ASSESSMENT USING THE CAMPAIGN DESIGN TOOL.............................................................................43
4 INPUTS & OUTPUTS ...............................................................................................................................57 4.1 INPUT RECORDS ...................................................................................................................................57 4.2 OUTPUT RECORDS................................................................................................................................58
5 MEASURING OUTCOMES.....................................................................................................................61 5.1 INDIVIDUAL LEVEL IMPACTS...............................................................................................................61
5.1.1 Question types for each of the Seven Stages ..................................................................................61 5.1.2 Questions for adults used by TAPESTRY.......................................................................................64 5.1.3 Children’s questions ......................................................................................................................70 5.1.4 Campaign Recall as a measure of Campaign Exposure ................................................................72
5.2 SYSTEM LEVEL IMPACTS .....................................................................................................................74 6. TOOLKIT – GUIDELINES ON MEASURING CHANGE...................................................................76
6.1 INTRODUCTION....................................................................................................................................76 6.2 DIFFERENT WAYS OF MEASURING CHANGE: SURVEYS & COUNTS ........................................................76 6.3 DEFINITION OF TERMS DESCRIBING DATA OR CLASSIFYING IT – QUICK REFERENCE.............................77 6.4 DATA QUALITY....................................................................................................................................77 6.5 NOTES ON DATA COLLECTION ............................................................................................................78
6.5.1 Interview methods ..........................................................................................................................78 6.5.2 Questionnaire design .....................................................................................................................81

Revised Deliverable 3
Revised September 2003 3
6.5.3 Sampling ........................................................................................................................................83 6.6 DATA COLLECTION TECHNIQUES ........................................................................................................88
6.6.1 Survey methods ..............................................................................................................................88 6.6.2 Count methods ...............................................................................................................................97
6.7 DATA CHECKING AND ANALYSIS .......................................................................................................106 6.7.1 Data verification, cleaning and weighting...................................................................................106 6.7.2 Data analysis ...............................................................................................................................107

Revised Deliverable 3
Revised September 2003 4
1 INTRODUCTION 1.1 Introduction to TAPESTRY
TAPESTRY is a European R&D project looking at communication programmes in the transport sector. The overall aim of the TAPESTRY project is to increase knowledge and understanding of how to develop effective communication programmes to support sustainable transport policies in Europe. There are seven main objectives:
1. To manage the TAPESTRY project effectively and efficiently, including a programme of three case study clusters and follower sites to meet TAPESTRY objectives within resource constraints.
2. To produce and maintain during the life of the project a European-wide state of the art on the principles and practice of promoting sustainable transport and its assessment, drawing on the Consortium's past experience in projects such as INPHORMM and CAMPARIE.
3. To develop and implement clusters of case studies, in which the ‘state of the art’ principles and best practice can be applied, monitored and evaluated.
4. To develop a common assessment framework for all case studies covering the life
cycle of design, implementation and review, allowing for a local assessment, a European cross-site assessment and a thematic assessment.
5. To create an active network of interested individuals and organisations across the case
study and elsewhere, to share good practice in the use of communication tools to deliver transport policies and plans, including links to partners in the USA, Central and Eastern European Countries and Iceland.
6. To produce guidance, best practice and resource materials for organisations and
transport professionals in the field of communication, marketing and community development.
7. To actively exploit the project results in all European countries, through both existing city co-operations networks and the network developed during the project lifetime itself.
The three case study clusters that have been formed dealt with the promotion of sustainable transport modes, the image of public transport and with linking transport to other sectors in communication programmes. The case study clusters have assessed their communication efforts in terms of impacts on awareness, attitudes and behaviour of their target group(s). Therefore, Workpackage 4 has provided the scientific foundation for this process, through the development of a Common Assessment Framework. The Common Assessment Framework (Deliverable 3) was prepared as a basis for the assessment of each case study campaign, to ensure that data were collected according to a common format in order for a cross-site analysis to be completed.

Revised Deliverable 3
Revised September 2003 5
This revised Deliverable intends to go further, extending the approach used for assessing the TAPESTRY case studies, so it can be used to assess any campaign regardless of its local specificity and / or constraints. 1.2 The Campaign Assessment Guidance in the context of other TAPESTRY
Deliverables
The Common Assessment Framework (CAF) was, from the start of TAPESTRY, one of the crucial outputs of the project. Its key function was to define the framework in which the case studies should be assessed, ensuring that there was a common basis for a cross-site analysis. However, based on the partners’ experience in using the CAF and the Site Assessment Plans, the Campaign Assessment Guidance aims to be a valid output of TAPESTRY that can be useful for the assessment of other campaigns, outside the project. The Assessment Guidance is therefore an integral part of the final set of four TAPESTRY products: Campaign Assessment Guidance (this document) An updated version of the Common Assessment Framework, based on the experience of the case studies carried out in the course of TAPESTRY. Best Practice Guidelines A set of guidelines, based on the experiences of the TAPESTRY case studies, setting out a step-by-step approach to planning, designing and implementing campaigns. The guidelines are illustrated by examples from the TAPESTRY case studies. Policy Recommendations Based on other TAPESTRY Deliverables and targeted at policy makers, National governments and Non Governmental Organisation, Local and Regional Governments, including European city/ regional networks. Interactive CD-ROM This set of TAPESTRY products will then be condensed on to a CD-ROM, which will enable the exploration of the results of TAPESTRY using a series of different search types. This document is divided into six sections: The remainder of this Section 1 sets out the TAPESTRY approach to communications management and assessment, introduces the behavioural model adopted by TAPESTRY called the ‘Seven Stages of Change’ and explores why is it important to monitor and assess campaigns. Section 2 outlines some guiding principles of campaign assessment, including the assessment process, how to attribute outcomes and measure performance. In addition, it offers guidance on how to reach the most appropriate balance between quantitative and qualitative methods according to the assessment requirements and budget. Finally, it introduces the remaining four sections of the document.

Revised Deliverable 3
Revised September 2003 6
Section 3 presents two approaches to assessing the elements of campaign management and design. The first is an ‘Assessment Protocol’ that may be useful to researchers or marketing / campaign managers who wish to engage a panel of external experts to carry out a quantified assessment. The second is a ‘Campaign Design Tool’, that can be used by campaign managers to record decisions and actions at the planning phase for comparison later with actual outcomes. Section 4 sets out recommended ways to monitor the inputs and outputs to a campaign. Section 5 gives detailed guidance on measuring campaign outcomes, including recommended questions types for measuring individual level impacts, based on the ‘Seven Stages of Change’ model and information on system level impacts. Section 6 comprises a comprehensive ‘toolkit’ on data collection and analysis, including advice on sampling, interview, survey and count methods, as well as recommendations on appropriate statistical tests for data analysis. 1.3 TAPESTRY Approach to Communications Management and Assessment
In the course of TAPESTRY, a set of 18 pilot campaigns were developed and implemented, providing a source of valuable information. By looking at this set, it is possible to find many different types of campaigns covering a large spectrum of issues such as vandalism, tourism, public transport, health, rural buses, and education. However, one key point to note is that some of the campaigns have shown that they are no longer traditional campaigns that just produce outputs such as posters, informative leaflets, radio and TV adverts. They have evolved to become part of a more complex communications management process that combines elements from:
• traditional campaigns • product marketing approaches • image and brand-building • social and cultural events aimed at target groups • educational approaches
In the light of this new perspective, and considering the need to produce a tool useful for campaigns outside TAPESTRY, the original approach adopted for the Common Assessment Framework (CAF) has been adapted to cover this broader and more complex concept of campaigning. In particular, the campaign “life cycle” scheme, used on an experimental basis for the CAF, has been used and further developed to take account of this new perspective. The TAPESTRY approach to communications management and assessment is represented in Figure 1.1. It illustrates the model that can be used for describing the elements of the campaign management, design and implementation processes. It represents the “life cycle” of a campaign, starting with the broad policy objectives, preceding to specific campaign objectives, through various stages, until the campaign is over and the campaign initiators want to establish to what extent the objectives have been met.

Revised Deliverable 3
Revised September 2003 7
The campaign “life cycle” can be divided in two broad parts – Strategic Management and Operational Management. However, experience shows that there is always a “grey area” where the boundaries between these two parts are difficult to draw, especially when it comes to the definition of both campaign objectives and campaign design. Strategic Management is mainly focused on establishing the aims (What do we want to achieve?) while Operational Management is linked to the production level (How to run the campaign?), the overlap between them can thus be seen as the Tactical level (What can we do to achieve the aims?). To assess an awareness campaign, the TAPESTRY model foresees eleven factors to be analysed:
• Strategic policy objectives; • Campaign initiator; • Campaign objectives; • Campaign design; • Non-campaign measures; • External factors; • Inputs; • Campaign management; • Outputs; • Campaign exposure; • Campaign impacts at the individual and social/system levels.
Each of these factors and the way they are related to one another are explained in the following pages.

Revised Deliverable 3
Revised September 2003 8
Figure 1.1: Campaign Communications Management & Assessment
Strategic Policy Objectives
Campaign Initiator
Non-CampaignMeasures
Campaign objectives(Measurable objectives)
Campaign Management
Leadership/coordinationPartnershipsDesignImplementation
Campaign Inputs
Financial resourcesMaterialsServicesStaff
Exte
rnal
Fact
ors OUTPUTS
Campaign Impacts - Social / SystemL l
Campaign Design
Campaign Exposure
Aw
aren
ess
of p
robl
em
Acc
eptin
gre
spon
sabi
lity
Perc
eptio
nof
opt
ions
Eval
uatio
nof
opt
ions
Mak
ing
a
choi
ce
Expe
rimen
tal
beha
viou
r
Hab
itual
beha
viou
r
1 2 3 4 5 6 7
EFFECTIVN
ESS
Campaign Impacts - IndividualL l
STR
ATEG
ICM
ANAG
EMEN
TC
AMPA
IGN
OPE
RAT
ION
ALM
ANAG
EMEN
T
Strategic Management Strategic policy objectives Each campaign should be developed and implemented in the context of wider strategic policy objectives. These may include broad objectives set out in a local transport plan or strategy, or in the regional or national government policy, such as to reduce congestion and emissions, to improve health, or to enhance road safety. These wider policy objectives will steer the campaign objectives and any measurable objectives that will be more concrete and specific for the campaign in question. Campaign initiator The campaign initiator is the institution or individual who takes the initiative to set up a campaign. The initiator is part of the process of transforming general policy objectives into campaign objectives and the more specific measurable objectives.

Revised Deliverable 3
Revised September 2003 9
Campaign objectives For each campaign, specific objectives need to be defined, in the light of the broad policy objectives for the city or region in which they are to be implemented. They make clear what the responsible organisation wants to realise by launching this campaign. Determining the target group(s) to whom the campaign is directed is part of this as well. Target groups can be very large such as the general public or very specific e.g. the pupils of a certain school. Campaign objectives can be formulated in terms of all stages leading to behaviour change (see Figure 1.2 for more details), however, they are usually formulated in terms of awareness (e.g. improvement of the awareness of air quality problems), knowledge (e.g. about a new road safety legislation), and or behaviour (e.g. increasing public transport patronage at non-peak times). It is important to be able to measure progress towards objectives, which should be ‘SMART’: Specific, Measurable, Acceptable, Realistic and Time related. For example, rather than “in the coming years more people should be aware of environmental problems”, a smart objective would be “In 2010 at least 90% of the Belgian population will throw the majority of its glass into the bottle bank”. Sometimes, the campaign initiator doesn’t have all the right information to formulate realistic measurable objectives. However, it is crucial to be aware that without them it can be extremely difficult (if not impossible) to assess the effectiveness of a campaign. Campaign Design This is one of the most important parts of conceiving a campaign, as it is here that decisions are made on several issues: the target audience(s), the message to use, which materials to produce, which media to use, whether to pre-test or not pre-test the materials, etc. At this stage it important to keep the campaign objectives firmly in mind. Due to the growing complexity of this type of communication initiative, one of the crucial steps is linked with the choice of the right campaign team. Non-campaign measures Campaigns should not be considered as independent events that attempt to change awareness, attitudes or travel behaviour. When campaigns are part of or linked to a wider programme of other measures, either hard or soft, they are more likely to have a significant effect. Because of this potential influence on the results and impacts of the campaign, these ‘non-campaign measures’ are integrated in the Campaign Communications Management and Assessment model (Figure 1.1). A new bus service, a free car pool database, enhanced police control on speeding may have a strong effect on the attitudes and behaviour of the public and, therefore, on the campaign results. The assessor should be aware of the relation with and the effects of other measures and take this into account when measuring the effectiveness of the campaign. External factors External factors can have a key role in affecting the results of a campaign. These effects can be either positive or negative. Examples include a change in legislation (e.g. lower maximum speed limits and the effect on road safety campaign objectives), extremely good or bad

Revised Deliverable 3
Revised September 2003 10
weather during an event, or a public transport strike during a campaign discouraging the use of public transport. Due to the possible effects associated with “Non-campaign measures” and “External factors”, a flexible management approach is needed, coupled with appropriate monitoring, as such effects can jeopardise the entire communication initiative. Campaign Operational Management The campaign takes shape in the campaign management “box” (shadowed in blue) which sets out how the campaigning organisation will try to meet the campaign objectives. Inputs The nature of the campaign will be determined to an important extent by the available inputs. These will probably be fixed from the start (the main working budget), but a part of it can be the result of a process: supplementary sponsorship depends on the efforts made during the management process. This can result in direct financial sponsorship, but could also be in kind: gifts and free use of material, infrastructure and services. The contribution made by staff and volunteers working on the campaign should also be taken into account. Campaign Management To explain fully why a technique has been successful or not, factors need to be examined relating to the management process. Examples include the way in which key actors involved in the campaign related to one another, the way information was distributed and the way in which the public was involved in the campaign’s development. Outputs The inputs, in interaction with what happens during the management process, lead to certain ‘material’ outputs. These can include an event or happening, a number of roadside posters and leaflets, a radio advert played a certain number of times. The outputs can be compared to the inputs, which tells us something about the efficiency of the campaign when comparing it to the input-output results of other campaigns. Campaign Exposure Campaign exposure is the term used to describe the extent to which the target audience have actually seen (or heard) the campaign messages. Traditionally this is measured through campaign recall, which tests whether someone can remember or recognise the elements of the campaign. However, people may be exposed to campaign messages and take in the information in their subconscious memory, but not consciously remember it. They then may go on to modify their awareness, attitudes or behaviour, without being able to recall the campaign messages. This means that measuring the extent to which the campaign reached the target audience can be difficult. Nevertheless, measuring the level of campaign recall should always be measured. This includes both recognition of the campaign and recall of specific messages. Campaign impacts Campaign impacts fall into two broad categories: • The first concerns changes in levels of awareness, attitudes or to the travel behaviour of
individual travellers that make up the target group – impacts at the individual level.

Revised Deliverable 3
Revised September 2003 11
• The second includes more aggregate impacts on the transport system, such as on congestion, air quality, noise and accidents – impacts at the social / system level.
By comparing the impacts of the campaign against the campaign objectives, the effectiveness of the campaign can be assessed. Whilst the assessment of impacts at the social / system level can be (more or less) easily performed, if the measurable objectives have been correctly formulated (see the “Campaign objectives and measurable objectives” paragraph above) and control areas have been monitored, the assessment of the impacts at the Individual Level poses some difficulties. Even if campaigns have been set clear objectives, very often they may have different effects than originally foreseen. This suggests that it would be helpful to have a set of questions especially designed to measure the different levels of awareness, attitudes and behaviour before and after the campaign, thus allowing a clearer determination of its real impact at the individual level. In addition, some campaigns arouse the interest of politicians and other decision- makers and this occasionally results in a public debate, or in new legislation. These kinds of results cannot be measured in the same way as the direct impacts of a campaign, but are worth taking into account in the overall assessment of a campaign. 1.4 Introduction to Seven Stages of Change Model
As shown in Figure 1.1 and suggested above, individual level impacts of campaigns are not just in terms of travel behaviour. It is also important to measure changes in other factors, such as awareness and attitudes. Using the results of the INPHORMM project and elements of the Theory of Planned Behaviour, a new model or “barometer” (Figure 1.2) was developed a part of TAPESTRY. Its aim is twofold: first to assist campaign initiators in the planning and targeting of their campaigns; second, to provide a “process of change” scale against which the attitudinal and behavioural impacts of a campaign can be measured. By measuring the number of people who are at each stage of the scale “before” and “after” (or when not appropriate, “with” or “without”) the campaign, an assessment can be made of the extent to which a campaign has moved individuals in the target groups towards changing their travel behaviour. The model sets out a seven stage process: 1. Awareness of problem or of opportunities Awareness of the problems caused by car traffic (e.g. congestion, pollution etc.) is the first step. Being aware that there are problems to be solved is a pre-condition to accepting the need for action to help solve them. However, in some cases, it may not be a question of being aware of problems, but rather of the opportunities that exist to change travel behaviour.
2. Accepting responsibility or relevance The second stage is to accept a level of personal responsibility for the problems and for contributing to the solutions. Car users are unlikely to move any further towards changing their behaviour as a result of a campaign if they don’t accept that they have a personal part to play in alleviating problems caused by car traffic. Equally, this stage could also be to accept

Revised Deliverable 3
Revised September 2003 12
the personal relevance of a particular message, policy or service, having been made aware of the opportunities they may present.
3. Perception of options How alternative modes are perceived will have a strong influence on whether they are viewed as viable options in place of the car. The most important factors at this stage are related to the “system” (e.g. whether public transport is seen to be on time, safe, easy to use), and those related to “society” (e.g. an individual’s reliance on the views of other people in shaping their own attitudes and behaviour). The latter include the valued opinions of family members, friends, work colleagues and what is seen to be “normal” in their community.
4. Evaluation of options People may perceive different modes in different ways. However, the way in which they prioritise the characteristics of the alternatives may vary according to particular circumstances. People will only consider voluntarily changing mode if they have a positive perception of the alternatives with regard to factors which are most important to them. For example, if the most important factor for them is cost, they are unlikely to favour buses if they think the tickets are too expensive, even if a bus trip is seen to be quicker than the same trip by car. This stage therefore will assess which factors are most important in travel choices.
5. Making a choice This fifth stage relates to whether an individual really intends to change to using an alternative mode for certain trips. The establishment of an intention to change is one step before a change in behaviour can be measured.
6. Experimental behaviour * Trying out the new mode for certain trips for a short time on an experimental basis is the next to final step. If the experience is positive, then this change may become more permanent. If, however the (positive) perceptions are not confirmed by experience, then it may lead to a re-evaluation of the options and a relapse to the old behaviour. A potentially greater risk is that previously held “negative” perceptions are re-confirmed. In either case, this may also lead to a re-assessment of their actual / stated level of concern about the underlying problem, or their willingness to accept personal responsibility. 7. Habitual behaviour * The final stage is the long-term adoption of the new mode for certain trips. When this stage has been reached, the old habitual behaviour has been broken and a new pattern established. This is final goal of a programme to change travel behaviour, but is the most difficult to achieve. In addition, efforts are still needed at this stage to support the new “habitual behaviour” and therefore to confirm that is the correct option. This goes hand in hand with supporting existing users of sustainable modes to maintain their behaviour. The overall impact of a campaign on the behaviour of the target population can be assessed by measuring changes in modal split (i.e. percentage of trips by mode), using travel diary or related data. The model can be applied to the majority of campaigns that seek to change travel behaviour through modal shift. However, campaigns can also achieve changes in behaviour through promoting objectives such as avoidance of travel, changing type or length of trips or changing the time of travel.

Revised Deliverable 3
Revised September 2003 13
*N.B. There are some cases where behaviour is a one off event for a given individual (e.g. making a visit to a particular area as a tourist). Here the notions of ‘experimental’ and ‘habitual’ behaviour are not applicable and they reduce to one-step, assessing whether behaviour was influenced by the campaign.

Revised Deliverable 3
Revised September 2003 14
Figure 1.2 The seven stages of change model
7. Habitual behaviourLong-term adoption of sustainable modes?
6. Experimental behaviourTrying out new travel choices?
5. Making a choiceReally intend to modify behaviour?
4. Evaluation of optionsIs there actually a viable alternative?
33.. PPeerrcceeppttiioonn ooff ooppttiioonnssPerception of sustainable modes?
influence on peers
influence on peers
influence on peers
influence on peers
influence on peers
2. Accepting responsibilityAccept personal / corporate responsibility?
1. Awareness of problemAware of the issue of traffic congestion?
campaign factors
exogenous factors
campaign factors
exogenous factors
campaign factors
exogenous factors
campaign factors
exogenous factors
campaign factors
exogenous factors
campaign factors
exogenous factors
campaign factors
exogenous factors
influence on peers
influence on peers

Revised Deliverable 3
Revised September 2003 15
1.5 Why Monitor and Assess?
According to the MOST Project Key Recommendations1, there are several reasons that justify the case for monitoring and assessing a campaign: • To satisfy the people involved in organising the campaign; • To compare the actual progress with the pre-established objectives; • To enable any modification and/or improvement in the campaign; • To compare forecast impacts to actual results; • To track results over time (in the case of long term campaigns); • To assess the cost effectiveness of the campaign. Figure 1.3: Why monitor and assess?
CampaignInitiator
CampaignPlanning
CampaignImplementation
AssessmentMonitoring
Reporting
Financing
Figure 1.3 attempts to summarise the importance of having a monitoring and assessment process in any communication initiative - once again, assuming that the initiative is not an isolated action. The cycle is initiated for the first time by the - “Campaign Initiator”, having secured the finance for the campaign. The campaign enters then into the planning phase and continues with implementation. Without assessment the cycle ends here, as the report to the campaign initiator is limited to what happened during the campaign implementation phase.
1 See http://mo.st for more details
Revised Deliverable 3
Revised September 2003 16
By implementing a monitoring and assessment process, it becomes possible to complete several other cycles. Not only will this process allow the campaign team to react to unforeseen events during the campaign implementation phase, but it will also enable a more complete reporting of the successes (and/or failures) achieved by the campaign. Moreover, a better-informed report can demonstrate the value of the campaign to those providing funding, making its re-financing easier, which, in its turn, should also improve the prospects for similar campaigns to be financed in the future. In conclusion, by promoting monitoring and assessment as an ongoing process, the campaign initiator can:
• Demonstrate whether or not the campaign is a “good investment”, delivering changed attitudes and travel behaviour as set out in the objectives
• Determine the effectiveness and efficiency of any campaign, thus allowing better informed planning
• Help understand which techniques work best, providing a valuable learning mechanism for future campaigns
• Modify the campaign at any intermediary stages as soon as the conditions justify, contributing to better results.
Being such an important mechanism to monitor the performance and track results, it is worthwhile setting out the requirements for a successful monitoring and assessment process in the early stages of campaign planning. The best way to do this is to apply the maxim “Better safe than sorry” or, in other words, always consider the monitoring and assessment as a formal phase of the communication initiative. Only by doing this will it be possible to collect sufficient appropriate data to collect baseline data, before the campaign begins. This allows a more accurate assessment of the campaign impacts, and enables the allocation of sufficient time and staff resources. Experience shows that when the assessment phase is only dealt with after the communication initiative has been planned, data collection problems and budget / staff restrictions always arise.

Revised Deliverable 3
Revised September 2003 17
2 PRINCIPLES This section outlines some guiding principles on the assessment process recommended by TAPESTRY. It is divided into five sub-sections. The first sets out the key stages in the assessment process, from defining campaign objectives and selecting target and control groups, to collecting data, before and after the campaign. The second part addresses the issue of how to attribute outcomes from the campaign and the role that control groups, campaign exposure and external factors can play. An introduction is then given to ways in which the performance of the campaign, in terms of effectiveness and efficiency can be measured. The fourth part outlines the spectrum of data that can be collected to assess campaigns and the choices to be made when defining the type of assessment to be used. Finally an introduction is given to the three remaining sections of this document, which give details of monitoring campaign management and design, inputs and outputs and measuring outcomes. 2.1 The Assessment Process
2.1.1 Campaign Objectives A pre-condition for a successful monitoring and assessment process is that the campaign objectives are clearly defined. These describe what is hoped to be achieved by the campaign and are usually defined by the campaign initiators in relation to the broad strategic policy objectives (as illustrated by Figure 1.1). However, they may also be influenced by short term or very localised needs, such the aim to reduce parking problems at a particular site. Campaign objectives usually translate general policy objectives into specific outcomes relating to attitudinal or behavioural change (e.g. an increase in awareness of the air quality problems caused by cars or a change in mode for a particular trip). Campaign objectives may also include impacts of attitudinal or behavioural change, such as less noise or better local air quality due to less traffic. Some campaigns will also combine travel-related objectives with those from other policy areas (e.g. to increase physical activity levels of a target audience through regular cycling and walking, or to improve customer services and satisfaction rates). In some cases, it may also be possible to translate the campaign objectives into measurable objectives2. These can be used to measure the results of the campaign, to assess its effectiveness. They are usually expressed in terms of a quantifiable change (e.g. by the end of the campaign in December 2003, 10% more children from ‘school x’ should travel to school on foot than in September 2002). Part of the process of defining objectives is to define the target audience or audiences at which the campaign is aimed. It may be that the campaign is targeting several audiences at the same time (e.g. the pupils, parents and teachers at a particular school) or just one large one (e.g. all residents in a defined area). Different objectives can be set for different target audiences. For more information on defining campaign objectives, see Section 2 of the Best Practice Guidelines. 2 ‘Measurable objectives’ are sometimes more commonly known a ‘targets’. However, the term ‘targets’ is not used throughout the document to avoid confusion with ‘target groups’, relating to those whom the campaign is trying to address.

Revised Deliverable 3
Revised September 2003 18
2.1.2 Key steps in the process Once the campaign objectives have been defined and a decision made that some sort of monitoring and assessment process should be carried out, there are a number of key steps that need to be considered: • Selecting a part of the target group for the assessment process • Definition of a control group • Strategy for collecting baseline data before the campaign starts • Strategy for collecting data after the campaign or several times during and after the
campaign (tracking) These steps are set out in more detail below:
2.1.2.1 Selection of part of the target group In some cases it may be possible to assess changes in attitudes and behaviour for all the target group(s) of the campaign. For example, for a campaign where the target groups are all those connected with travel to a particular school, it may be possible to carry out counts and surveys of all the children and their parents and teachers. However, in most cases, it will be necessary to define a sample for the assessment process, which is likely to be a selection of the campaign target group(s). For example, it may only be possible to survey the pupils of a few classes in the school. The first step in the assessment process is therefore to decide who will form part of this group. Where a quantitative3 survey is involved, this will mean that a sample of the target group has to be selected. (For more details on Sampling see Section 6). If it has been decided that a qualitative4 approach is more appropriate, it is easier to be judgmental and select those who are thought to be useful to involve.
2.1.2.2 Definition of a control group A control group is made up of those with similar characteristics to the target group. The only difference (ideally) between the two groups is that the control group will not be exposed to the campaign. This means that, ideally, the control group should be just as likely to be influenced by non-campaign measures and external factors as the target group. The formation of the control group should be considered at the same time as definition of the target group. Figure 2.1 sets out the role of the control group in the assessment process.
3 See Section 2.1.2.3 for a definition of “quantitative” and “qualitative”.

Revised Deliverable 3
Revised September 2003 19
Figure 2.1: Identifying Campaign Outcomes with a Control Group
Control groups are an almost essential part of any rigorous quantitative assessment (see Section 2.2). They are less important when carrying out a qualitative assessment. However, even if just a qualitative assessment is chosen, it may be useful to investigate the attitudes and behaviour of those outside the target group of the campaign, to gain a wider understanding of the campaign’s influence. The use of a control group is one of the most important ways to ensure that the campaign outcomes can be accurately attributed. Without a control, it is very difficult to conclude whether changes in the attitudes and behaviour of the target group are due to the campaign or to other factors. For more details on the role of control groups in attributing the outcomes of campaigns see Section 2.2.2.
2.1.2.3 Strategy for collecting baseline data before the campaign starts Once the target group and control groups (where appropriate) have been defined, the next stage is to collect data to form a “baseline”. Both “quantitative” and “qualitative” data should be collected. ‘Qualitative’ data refers to information which ‘qualifies’ or describes that which is being investigated – e.g. a change in attitude. An example of qualitative data is the verbal responses given during a focus group (see Section 6 for more information on focus groups).
SAMPLETARGET GROUP
PRE-CAMPAIGNCONDITIONS
- Individual Level- System Level
EXPOSEDTO CAMPAIGN
POST CAMPAIGNCONDITIONS
- Individual Level- System Level
ESTIMATECAMPAIGN
OUTCOMESNet Changes
SAMPLECONTROL
GROUP
PRE-CAMPAIGNCONDITIONS
- Individual Level- System Level
NOCAMPAIGN
POST CAMPAIGNCONDITIONS
- Individual Level- System Level
BEFORE
(Baseline)
AFTER

Revised Deliverable 3
Revised September 2003 20
‘Quantitative’ data refers to information which ‘quantifies’ or counts that which is being investigated. An example of quantitative data is the proportion of people who agree that congestion is a problem or reported levels of trip making. Collecting “baseline” quantitative data will help form a picture of the situation before the campaign, both in terms of individual level awareness, attitudes and behaviour, but also at the social and system level (e.g. levels of congestion, air pollution, or parking). Equally, when carrying out a more qualitative assessment, it is important to gain as broad a picture as possible of the situation before the campaign, through the use of methods such as focus groups. The most important factor to consider with the collection of baseline data is that it must be collected before any aspect of the campaign has started. This includes, for example, any preparatory work, which involves explaining the purpose of the campaign to members of the target group. It is also important to assess recall of the campaign before it has started, as there will always be some people who falsely recall the campaign. This is often overlooked but is essential to gain an accurate assessment of the impact of the campaign. More guidance on data collection can be found in Section 6.
2.1.2.4 Strategy for collecting data after a campaign or throughout the campaign (tracking) Once baseline data has been collected, the campaign can start. The decision whether to just collect data at a specified time after the campaign has been implemented, or several times during and after the campaign is largely dependent on the size and duration of the campaign and on the budget. In most cases, collecting one set of “after” data is the most feasible option. However, where possible, collecting data at several points during and after the campaign, “tracking” the progress of the campaign, has a number of advantages. For example, it can enable to pinpoint more accurately the aspects of the campaign which are working best (or not working at all) and see whether the impacts of the campaign are sustained after it has finished. Whether data is collected once after the campaign or a tracking approach used, the data should be collected in the same way as the baseline data. 2.1.3 Indicators & Contextual Information The data or information collected as part of the assessment process can be divided into two broad categories: • Indicators • Contextual information
2.1.3.1 Indicators Indicators are used to describe how well certain aspects of the campaign perform, i.e. they reflect things we are trying to change. Indicators may be either quantitative or qualitative, but are more often quantitative.
2.1.3.2 Contextual Information Contextual information includes all those factors which can help explain the settings, (pre) conditions and process of the campaign or factors which influence the campaign during its

Revised Deliverable 3
Revised September 2003 21
implementation. A key function of the contextual information is to help explain the changes observed in the indicators. Contextual information may be either quantitative or qualitative, but is most often qualitative. An overview of indicators and contextual information is set out in Table 2.1. These reflect elements of Figure 1.1. In order to be able to fully assess any campaign, information should be collected relating to each of the descriptors listed below and data collected in relation to each of the indicators. Table 2.1 Overview of indicators and contextual information Descriptor / indicator
Section of report Example Description
Strategic policy objectives Contextual information
1
Federal Ministry has a policy objective to increase public transport modal share
to identify the broader, higher level context of the campaign, and to show which campaign initiatives are synergistic with higher level objectives
Non-campaign measures Contextual information
1 City Council closes city centre to road traffic
to identify specific local policy measures which may act in favour of, or against, the campaign objectives
Campaign initiator Contextual information
1 Key persons involved in initiating the campaign objectives
to establish key persons involved in establishing the campaign at the outset
Campaign objectives Contextual information
3 To reduce the number of pupils driven to school
to describe campaign objectives, later to be compared with impacts, to measure effectiveness
Measurable objectives Contextual Information
3 To reduce the number of pupils driven to school by 10%
to describe quantitative campaign objectives, later to be compared with impacts, to measure effectiveness
Campaign Management Contextual information
3 Did the overall manager have a clear vision of the entire campaign?
describing the management structure and co-ordination of the campaign,
Inputs Indicators 4.1
Costs of producing a leaflet campaign [in Euro]
for recording all input costs, broken down into design, production & distribution
Outputs Indicators 4.2 Number of leaflets
produced
for recording quantitative data on campaign outputs, both in absolute terms (e.g. number of leaflets) and numbers of exposures (e.g. how many people saw the leaflet)
Campaign exposure Indicators 5.1.4 Recall of leaflet and
its message
quantitative measurement of recall of campaign material and messages, looking at specific output media (e.g. leaflets, posters, public events)
Campaign impacts Indicators 5 Level of concern
with air pollution
to measure the actual impacts of the campaign on attitudes and behaviour: fundamental component of the assessment
External factors Contextual information
2.2.3 Flood disrupting the local PT operators' timetable
by documenting key external factors, including acts of God, beyond our immediate control, we may qualify any abnormalities or unexpected observations revealed during the analysis of the campaigns

Revised Deliverable 3
Revised September 2003 22
2.2 Attribution of Outcomes
2.2.1 What is attribution? Attribution refers to the process of making sure that the changes that have been observed were as a direct result of the campaign itself. One of the key arguments in favour of assessing campaigns is that it enables the demonstration of the changes that they can bring in terms of awareness, attitudes, travel behaviour and the associated system level impacts (less congestion, noise, improved air quality etc.). However, it order to be able to do this, it must be possible to tell which of the observed changes were caused by the campaign and what was the result of other, external factors or non- campaign measures. This is “attributing the outcomes” correctly. Table 2.2 External factors Campaign Time scale
Month 1 –3 Month 4-6 Month 7-9 Month 10-12
“Acts of God” Floods disrupt PT timetables October 2001
Publicity (not linked to campaign)
Local newspaper runs articles on the local sources of air pollution, including traffic April 2002
Political changes
New Mayor elected – more in favour of PT, cycling and walking June 2002
Other campaigns
Motoring Organisation campaign on “stop bans on cars in town centres” September 2002
Any other factors:- Helping campaign objectives
Any other factors: Hindering Campaign objectives
2.2.2 The role of control groups Where a control group has been used to collect data on people similar to the target group but not exposed to the campaign, attributing the outcomes of the campaign is made much easier. If members of the control group have similar characteristics to the target group and data are

Revised Deliverable 3
Revised September 2003 23
collected at the same time as the target group, then it can be assumed that any external factors or non-campaign measures will have had a similar impact on both groups. Therefore, any changes observed in the target group, but not in the control group, can be attributed to the campaign with more confidence. This form of attribution is the strongest that can be made, particularly when combined with examining external factors and campaign exposure. 2.2.3 Examining the role of external factors Where it has not been possible to use a control group, it is even more important to monitor any external factors which might have influenced the outcome indicators. Table 2.2 sets out a suggested format for recording external factors, with some examples for each category. The timescale can of course be adjusted to suit the duration of a specific campaign. By examining external factors and non-campaign measures in parallel with the campaign outcomes in the target group (and the data collected from the control group, if used), some estimation can be made of what can be attributed to the campaign. However, even a very thorough examination of external factors cannot replace the more accurate attribution that can be made when a control group has been used. 2.2.4 Examining Campaign Exposure – the role of measuring campaign recall The final factor to be examined in order to be able to attribute any changes to the campaign is campaign exposure. As illustrated by Figure 1.1, campaign exposure is the process by which the target group sees, hears or attends the campaign outputs (leaflets, posters, radio ads, events etc.) and becomes exposed to the campaign messages. This can be a subconscious or a subliminal process: in some cases people will not be aware that they have received and / or responded to the campaign message, or have heard it indirectly. This process is illustrated in more detail by Figure 2.2. Figure 2.2: Campaign Exposure and Campaign Recall
Where campaign exposure remains at the conscious level, this can be measured by looking at whether target group members remember aspects of the campaign (messages and outputs used). This is “campaign recall” (see Section 5.1.4 for more details on data collection). By
recall no recall
receive / attend
false recall no recall
not receive / attend
exposed
false recall no recall
not receive / attend
not exposed
output

Revised Deliverable 3
Revised September 2003 24
comparing individual changes in attitudes and behaviour with whether they have a positive recall of the campaign, it is possible to estimate whether these changes can be attributed to the campaign. However, this type of attribution through campaign recall is not conclusive; it does not take into account any changes caused by subliminal responses to the campaign, nor does it replace the stronger associations that be made if a control group is used. An important way to measure subliminal campaign effects it to look at specific changes in awareness or attitudes in the target group, which are not observed in the control group. 2.3 Performance Measures
2.3.1 Campaign Effectiveness As indicated by Figure 1.1, campaign effectiveness can be assessed (at least in part) by comparing campaign objectives and the measurable objectives (where used), with outcomes (see Section 5 for a full description of impact measurements). In the case of comparing campaign objectives with outcomes, such comparisons can be both qualitative and quantitative. For example, a campaign objective might be described as "Reducing the number of school children travelling to school by car over a period of one month". The corresponding impact indicator would measure this more precisely, in terms of the actual number of such children changing mode (e.g. from car to bicycle) for their journey to school over a given period (quantitative). Assuming that the monitoring reveals a reduction in car trips, then the objective will have been met. However, we can then go further and quantify the level of reduction. If a more qualitative approach was taken, then an example of an indictor could be that before the campaign, there were hardly any bicycles parked at the school, where as after the campaign, the was no room in the bike sheds. Some campaign managers may decide to include measurable objectives to quantify some of the objectives of their campaign. An example might be "Reducing the number of school children travelling to school by car over a period of one month by 10%". In these cases, a directly quantitative comparison may be made with the corresponding impact indicators, in order to assess the extent to which the target has been met (or exceeded). The measures of effectiveness will draw on the evidences of the appropriate impact indicators for the campaign in question, comparing these (quantitative) outcomes with the objectives set at the outset of the campaign. The purpose of assessing such effectiveness is to identify the probable causes for success. Whilst making such considerations, it will, of course, be important to consider effectiveness not in isolation, but in the fuller context of other indicators and contextual information, in particular those on external factors affecting the campaign implementation. 2.3.2 Campaign Efficiencies Various measures of campaign efficiency can be assessed by comparing inputs, outputs, exposure and outcome indicators. These comparisons can be made typically by taking ratios of these elements. This is only possible if the units used for each have been standardised and that most of these outcome indicators are quantitative. For the four elements, six different types of ratio can be produced, each quantifying a different type of efficiency for appropriately selected pairs as shown in Table 2.3.

Revised Deliverable 3
Revised September 2003 25
Table 2.3 Different Possible Efficiency Ratios Name Ratio Example Efficiency 1 Input / Output Cost per 1000 leaflets Efficiency 2 Input / Exposure Cost per person in target group
who recalls the campaign message
Efficiency 3 Input / Outcome Cost per km reduction in car useEfficiency 4 Outcome / Output % increase in awareness per
leaflet distributed Efficiency 5 Outcome / Exposure Increase in bus use per target
person recalling the campaign Efficiency 6 Output / Exposure Number of leaflets produced per
target person recalling the campaign
These efficiency measures offer enormous depth of scope in the range of specific ratios which may be calculated and interpreted. For example, any increase (or decrease) in awareness levels could be assessed for awareness of specific issues raised in any given campaign, by specific inputs (e.g. costs) invested in particular media (e.g. posters or leaflets), or total costs, across all media. However, this sort of analysis requires a significant amount of detailed data and resources to process it. Whilst these ratios may be assessed in their own right, comparisons with other campaigns are likely to be more informative, where similarity between the campaign and prevailing conditions makes such comparisons more meaningful. This may be done on a thematic basis, by selecting common themes (such as leaflets designed to change travel to school) and comparing such common efficiency ratios across appropriate campaigns. Finally, even greater depth of understanding may be obtained by exploring what may be described as 'internal ratios', e.g. one impact indicator expressed as a ratio of another. An example here would be car kilometres replaced by sustainable-mode kilometres, expressed as a ratio of raised awareness for the environment (another impact indicator). Looking at these sorts of internal ratios would involve scaling up the results from the sample to cover the whole of the target group. Although not efficiency measures under the current definition, these ratios may be more important contributions to the understanding of the campaign processes. As with effectiveness assessments, efficiency ratios should also be considered in the light of contextual information. 2.4 The TAPESTRY Campaign Assessment Guidance and the spectrum of
qualitative – quantitative data
2.4.1 Illustration of the qualitative – quantitative range of data for assessing campaigns Figure 2.3 illustrates the range of data types which may be collected when assessing a campaign. The arrows in the middle of the Figure illustrate the extent to which comparisons may be made between findings. Heavier arrows indicate more rigorous comparisons.

Revised Deliverable 3
Revised September 2003 26
The lighter arrows at the top of the diagram represent the weaker comparisons which can be made between qualitative results: for example, most people in the focus group from Case 1 liked the campaign, but most people in Case 2 did not. The heavier arrows at the bottom of the diagram illustrate the stronger comparisons which can be made between quantitative data: for example, the mean number of car trips per person per week was 4.5 in Case 1 and 3.9 in Case 2. As commented in Section 5.1.3, collecting data from children presents its own particular challenges. Questions will often need to be simplified and this usually leads to a reduction in the amount and precision of the information that can be processed when it comes to statistical analysis. For example, where it may be possible to ask adults to rate something on a five-point scale (allowing interval or ordinal tests to be carried out on the data), such questions may have to be simplified for children into a simple ‘yes’ or ‘no’ question, thus reducing the statistical tests which can be applied to categorical tests (see Section 6.7.2). Tests on such (simplified) data are usually more conservative (restrained) – it is therefore less likely to identify a true change in the statistical analysis, and more likely to attribute it to chance.

Revised Deliverable 3
Revised September 2003 27
Figure 2.3: Illustration of qualitative – quantitative range of data for assessing campaigns
Case 1
Case 2
Market research with children, e.g.
focus groups
Market research with children, e.g.
focus groups
Market research with adults, e.g.
focus groups
Market research with adults, e.g.
focus groups
qual
itativ
e
Unsystematic Observations /
counts
Unsystematic Observations /
counts
qual
itativ
e
Market research with children, e.g. questionnaire with
some open responses
Market research with children, e.g. questionnaire with
some open responses
Market research with adults, e.g.
questionnaire with some open responses
Market research with adults, e.g.
questionnaire with some open responses
quan
titat
ive
(fle
xibl
e)
Systematic Observations /
counts
Systematic Observations /
counts
quan
titat
ive
(fle
xibl
e)
Market research with children, e.g. questionnaire with
closed responses
Market research with children, e.g. questionnaire with
closed responses
Market research with adults, e.g.
questionnaire with closed responses
Market research with adults, e.g.
questionnaire with closed responses
quan
titat
ive
(fix
ed)
Systematic Observations /
counts
Systematic Observations /
counts
quan
titat
ive
(fix
ed)
increasing statistical richness
Weak comparisons can be made
Stronger comparisons can be made
Strongest comparisons can be made

Revised Deliverable 3
Revised September 2003 28
The arrows in Figure 2.3 show that not only may comparisons be made between different types of data within a particular Case (e.g. comparing the results of adults’ and children’s market research for a campaign run in Case 1), but also, between Cases (e.g. between adults in Case 1, and adults in Case 2). Comparisons could, of course, also be made for a single town across many survey waves, as in a ‘tracking’ study. The large arrow on the right-hand side shows that, broadly speaking, the richness of the data increases as you descend the table. (The word ‘richness’ is used to indicate that more can be done with the data. ‘Power’ could almost be used instead, but this term has a very specific meaning in statistical analysis, so it has not been used here, to avoid confusion). When considering the top and the bottom of the table, for example, it is clear that qualitative data from children (e.g. quotations from interviews) are less statistically useful than hard passenger counts on a targeted bus route, with supporting, quantitative interview data. This is not to say that the former are not valuable: each type of data has a role to play in contributing to understanding the overall picture. 2.4.2 Defining assessment requirements How to decide what type of assessment is required? In order to answer this question three factors should be considered: • The medium and audience for the results. For example an article in a professional journal
may require more accurate results than a presentation to a politician. • Whether it is a priority to be able to compare the campaign results with other campaigns,
i.e. benchmark against previous campaigns or be able to carry out a cross-site comparison with campaigns in other areas;
• How thorough the assessment is needed to be. The more thorough the assessment is required to be the lower down the qualitative - quantitative range (Figure 2.3) one needs to be. For a fully comparable assessment process, the quantitative (fixed) option must be chosen. Practice shows that this option is very difficult to realise fully with the same (fixed) structure across multiple site, that is using the same questions (allowing, of course for any cultural and timescale factors) and common responses, across all sites. If just a handful of sites omit a particular question, or code the responses differently, then the impacts on any attempted cross-site analysis (or tracking study) can be quite large. As soon as a strict comparison cannot be made between Question X for Case 1 and Case 2, for example, one is left with the decision of adapting the way Question X is analysed across all the sites (which inevitably means a reduction in the level of analysis, down to the lowest common denominator – e.g. the only two responses Case 1 coded properly in their data) or the omission of Case 1 or Case 2, or both, from any planned cross-site analysis. In short, achieving a true cross-site analysis across multiple sites, or benchmarking one campaign rigorously against another, requires substantial human resource and financial backing. The benefits of such a rigorous comparison, particularly when there is also a properly planned experimental design (with control group) are often very great. However, these levels of insight into the individual impacts and campaign implementation are expensive to obtain.

Revised Deliverable 3
Revised September 2003 29
Even if the possibility to benchmark or compare the results of the campaign is not a priority, it may be necessary to carry out a very thorough assessment. This is likely to the case if this is the first time that an organisation has run a campaign or a campaign of the type chosen. In this case, more detailed results may be needed to be able to demonstrate how campaigns can work and the outcomes they can have, in terms of changes in attitudes, travel behaviour and the associated system level impacts. As with the cross-site analysis, if it is decided to carry out such as assessment, be prepared for the fact that the costs may be larger than the cost of the campaign. Finally, if benchmarking with other campaigns or proving the worth of campaigns for the first time is not needed, it may be more appropriate to choose a less rigorous form of assessment, which gives the information required with more modest costs. The type of choice made will, of course, have implications for the type and amount of data that needs to be collected and the resources required. 2.4.3 Balancing assessment requirements with resources available “What should we do with only a limited budget?” is probably one of the most difficult questions to answer. The simplest answer is that all the campaign stakeholders involved in Figure 1.1, from those setting objectives, to those designing a poster, need to agree on realistic assessment criteria within the constraints of time and budget available for the assessment (e.g. attempting to carry out a city wide air pollution measurement may not be the best use of resources if only 1000 Euro is available for the whole assessment process): and why the assessment is needed, taking into account the two factors set out above. This includes an evaluation of who will use the information collected as part of the assessment process and for what purpose. For example, the needs of a national government programme, gathering data from several cities will be very different to a local campaign group, running a specialised initiative in a particular neighbourhood.
The worst possible outcome is to invest substantial resources into an assessment which does not deliver what was required, and which therefore dissatisfies those who have invested in it. This situation can lead to a negative culture for future assessment within the participating organisations: “Why do we need to do market research again? It was a waste of time last year.”
A comprehensive assessment, with a ‘before’ and ‘after’ survey (and subsequent survey waves if setting up a tracking study) and a proper control group, with decent sample sizes is never going to be cheap. The likely benefits from carrying out such an assessment have to be realistically considered. In terms of assessing campaigns aimed at changing travel behaviour, it would seem pointless to keep spending money if such campaigns repeatedly fail to deliver. Here, substantial investments in assessment may be justified in terms of avoiding future mis-spending on inappropriate campaign approaches. In the absence of a good assessment, with a quality experimental design, one is left guessing as to how one might improve a campaign next time round. Such guesses appear to be a lot cheaper than proper assessments, but may well turn out more expensive in the long run. In addition, there must be a genuine commitment and functional ability (i.e. process and budget) at the higher, organisational levels to act on the results of the assessment. The inability to act on market research data is a primary reason for this expensive resource becoming devalued.

Revised Deliverable 3
Revised September 2003 30
Where there are particularly limiting constraints on budget and time which may be committed to an assessment, the answer is very rarely to cut back drastically on sample size, or drop the control group. These ‘savings’ have a nasty habit of backfiring. It is better in these circumstances to opt for a different approach, e.g. running a few focus groups with members of the target group, which may often result in useful insights into the campaign’s (lack of) impact, and usually at rather lower cost than a fuller, quantitative assessment. Better to do this well, than to do a quantitative assessment poorly. This comes, however, with the associated problem that with qualitative data alone, one is often left wondering to what extent the views expressed by participants actually represent those of the whole target group, or if they were just isolated examples. In this respect, the assessment process is much like the campaign design and implementation process: you tend to get what you pay for. Sometimes, of course, it may be wise not to have any assessment at all. For example, it would be better to carry out intermittent, proper, and well-timed assessments (e.g. at points in time where a whole new campaign approach is attempted) than to dilute resources in an attempt to assess small changes to a leaflet from one year to the next. 2.4.4 Where the TAPESTRY Campaign Assessment Guidance fits in The TAPESTRY Common Assessment Framework, used during the project by the case studies aimed to provide guidelines on a fixed quantitative approach, in order to be able to carry out a full cross site analysis, i.e. the aim was to implement standardised, fixed (‘core’) questionnaires across as many sites as possible, before and after the campaigns, and wherever possible collect supporting control group data (see Section 2.1.2). This Campaign Assessment Guidance aims to provide the tools required to carry out all the types of assessment set out in Figure 2.3. In addition, it sets out the core questionnaire (fixed structure and wording) which was used to collect the data required for the TAPESTRY cross-site analysis. In this way, if this more fixed approach is followed, there is the option of being able to benchmark the results either against other campaigns that have followed the same approach, and/ or the original TAPESTRY case study results. 2.5 Types of Assessment
This section sets out in brief the four remaining sections of this document, which are aimed at providing information for different purposes: Campaign Management and Design, Inputs and Outputs, Outcomes and Data Collection. 2.5.1 Campaign Management and Design
2.5.1.1 Definition of Campaign Management & Design Campaign management includes all those elements included in the ‘Campaign Management’ box of Figure 1.1. These include the leadership and co-ordination of the campaign, any partnerships that are established and the way in which the day-to day tasks are carried out by the campaign team, led by the campaign manger. Campaign Design includes all those elements relating to how the campaign looks, feels and sounds, ranging from messages and message givers, the creative style and the use of branding.

Revised Deliverable 3
Revised September 2003 31
2.5.1.2 Summary of elements addressed in Section 3 Section 3 is divided into two main parts. The first part (Section 3.2) set out an ‘Assessment Protocol’ on issues relating to campaign management. Divided into six parts, relating to the guidance set out in Section 3 of the Best Practice Guidelines (Deliverable 5), it includes a scoring system which is designed to be used by an external expert or panel of experts The second part (Section 3.3) presents a ‘Campaign Design Tool’, which is primarily designed as a self-assessment process. The tool enables a campaign manager (or team) to record their planned actions and decisions at the beginning of the design phase. These can then be compared with actual outcomes at the end of the campaign. 2.5.2 Inputs and Outputs
2.5.2.1 Definition of Inputs and Outputs Inputs are all the resources allocated and used in the implementation of the campaign. They are usually financial, but can also be the free use of materials, infrastructure or services (in kind). Inputs also include any human resources allocated to the campaign. These inputs, in interaction with the campaign implementation process, lead to certain outputs. These can include an event, materials such as posters and leaflets, a radio or TV advert, or an offer for discounted cycle equipment or public transport tickets.
2.5.2.2 Summary of elements addressed in Section 4 Section 4 presents tables for monitoring both inputs and outputs. The inputs table relates to the design and production of specific outputs and sets out columns to record design, production and distribution costs. An explanation is also given of how best to allocate these costs between the three categories. The output table enables information on the specific outputs to be recorded, including whether they were pre-tested, where they were exposed to the target groups and estimations of total exposures. Guidance on how to fill in each column is given. 2.5.3 Outcomes
2.5.3.1 Definition of Outcomes Outcomes describe to what has been the result of the campaign, in terms of individual impacts (e.g. changes in awareness and behaviour) and system or social level impacts (e.g. less congestion, better air quality). In addition campaign exposure - how the campaign has been received in order to bring about these impacts - can also be counted as an outcome. One of the ways to roughly estimate campaign exposure is to measure campaign recall. (See Section 2.2.4 for more details.)
2.5.3.2 Summary of elements addressed in Section 5 Section 5 sets out a series of questions, based on the “Seven Stages of Change Model” in Figure 1.2, that can be used to measure individual level impacts, together with suggestions on how they can be adapted to suit different assessment types. The role of campaign exposure and its relation to campaign recall is explained. Finally, a definition of system level impacts is given, together with a list of those most appropriate to measure for campaigns

Revised Deliverable 3
Revised September 2003 32
2.5.4 Data Collection (Summary) Section 6 sets out a comprehensive toolkit on data collection methods. It first gives an explanation of the difference between surveys and counts. Second, it provides definitions of common terms used in the toolkit to describe data or to classify them. The toolkit then presents seven survey techniques, including focus groups, panel surveys and Origin/Destination surveys, followed by seven count techniques, for example passenger counts and noise measurements. For each technique there are details of how to use it, its advantages and disadvantages and suggestions for lower budget options. The toolkit also contains guidance on interview methods, questionnaire design, sampling, data verification, cleaning and weighting and the most appropriate statistical tests for deciding if a measured change is statistically significant or not.

Revised Deliverable 3
Revised September 2003 33
3 CAMPAIGN MANAGEMENT & DESIGN 3.1 Introduction
This section sets out two different methodologies for assessing campaign management and design. First, an external quantitative assessment protocol that may be useful to researchers or marketing / campaign managers who wish to carry out quantified, rigorous and impartial assessment of campaigns in order to assess performance against financial criteria and other measurements such as recall and behaviour change. This tool could be administered by one person, or by an ‘expert’ panel of assessors, professionals and stakeholders. The second form is an adaptation of the ‘Campaign Design Tool’ (see Annex 1 of the Best Practice Guidelines - Deliverable 5) where actions and decisions noted at the design phase can be informally compared with the actual outcome. This is a more qualitative form of assessment. It may be carried out by the campaign manager alone, or used as a tool for training and developing the skills and business procedures of the communications or marketing group. The second part of this design tool could be used as the basis for the documentation process referred to in Part 5 of the Assessment Protocol below. 3.2 Assessment Protocol
To be successful, transport campaigns, regardless of objective, size, structure or maturity, need to establish an appropriate management system. In this respect, organisations running campaigns do not differ from other organisations. For this reason, campaign design, management and roll-out processes and their impacts are seen as part of a whole managerial system. Moreover, campaign performance in terms of outputs and impacts will be determined by the quality of the process and by the decisive role of the campaign manager. It may ruin a campaign or underpin its success. Whilst an assessment of the campaign objectives, inputs, outputs and outcomes gives indications of the effectiveness and efficiency of a particular campaign, it cannot explain fully why a campaign has been successful or not. This section comprises an assessment protocol that can be used to look at the quality of the following factors of the campaign process. It should not be seen as a managerial / supervisory tool, but rather as a guide to assessing work / business practices in the light of the success or otherwise of a campaign. It is a tool for continuous improvement. However, it is best administered by an external expert or a panel of experts, with experience of campaign implementation. The same assessment scales could also be used for academic research or for monitoring effectiveness of advertising spend, compliance with procedures and advertising agency performance. There are seven major parts. These reflect the sub-sections set out in the Best Practice Guidelines Section 3:
1. Defining objectives 2. Creating the team 3. Defining target audience(s)

Revised Deliverable 3
Revised September 2003 34
4. Strategic and operational partnerships 5. The operational campaign programme 6. Briefing / working with agencies 7. Overall assessment
Please note that the first 6 parts are not necessarily sequential – there may be actions taking place in all sections throughout the campaign, the emphasis at any one time, however may be more focused on one ore more specific activities. Likewise not all evaluation criteria described below will apply to all campaigns, whether or not they apply will depend on decisions made in the design process (see the next Section). The methodology has been adapted from the common quality management framework, used in the EU Common Assessment Framework model (CAF) for quality management in the public sector4. In addition to a score rating, positive and negative comments, as well as suggestions for improvement can be given for each section. Part 1: Campaign objectives and measurable objectives This is an assessment of the campaign manger’s role in bringing the campaign objectives and measurable objectives into operation
• Step 1: Interact with the campaign initiator about objectives Understand what the campaign initiator wants to achieve. Turn policy objectives into real life actions taking into account the context of the campaign, cultural and social issues.
Did not
happen Tick a box to the left or the right according to the level of achievement
Successful liaison / interaction
Score 0 1 2 3 4
• Step 2: Once the initial objectives are set and the campaign type is selected, define objectives and set measurable objectives. Introduce these objectives in the work plan. According to current or previous research or review of previous campaigns, it may have been decided to carry out an explicit campaign, in which case objectives, such as campaign recall, accepting responsibility etc. may be framed using the ‘Seven Stages of Change’ model. Or, if indications are that an implicit campaign is required the objectives may be more directed towards actual outcomes and recall of campaign message rather than recall of the campaign itself. Examples of objectives could be:
Provide households with timetables (non quantified)
4 EU Common (self) Assessment Framework Model (CAF) for quality management in the public sector, as been adopted at the EU Conference on best practices for quality management in the public sector, Lisbon , May 2000. See also: http://www.eipa.nl/CAF/CAFmenu.htm.

Revised Deliverable 3
Revised September 2003 35
Provide 60% of households in a defined area with timetables within a stated period Achieve an awareness of 50% amongst the target audience that timetables have been delivered Set a target that 80% of people who were aware of the timetables found them easy to read Set a target that 5% more people within the target area changed mode to public transport as a result of raised awareness from the timetable information.
To what extent were measurable objectives set which were appropriate to the policy objectives: Did not
happen Tick a box to the left or the right according to the level of achievement
Objectives were set and included in the plan
Score 0 1 2 3 4
• Step 3: Use these objectives as leading principles throughout the campaign To what extent did the objectives set remain as leading principles throughout, or did the campaign deviate from its intended purpose
Deviated from objectives
Tick a box to the left or the right according to the level of achievement
Remained true to objectives
Score 0 1 2 3 4
• Step 4: Set a clear assessment framework to measure the impact of the campaign and create the conditions for assessment
Did not
happen Tick a box to the left or the right according to the level of achievement
Achieved as planned
Score 0 1 2 3 4
Notes:

Revised Deliverable 3
Revised September 2003 36
Part 2: Forming and managing the campaign team This is an assessment of campaign manger’s role in appointing and managing the right campaign team, including attracting the appropriate competencies in operational campaigning. (For a more complete description of the requirements under this section see the Best Practice Guidelines Section 3.2.) Essentially the requirement is to build a team with all relevant competencies from ‘Planning skills’ to budgeting and creativeness. Clearly a small, low budget campaign may only be able to support a few multi-skilled people; a large campaign will be able to support a larger team with more sharply differentiated skills. A solution to skills shortfalls is the employment of external consultants or agencies, as for example when the TAPESTRY team wanted to produce a CD ROM the skills had to be purchased from outside the team. Finally ensure that appropriate tasks are allocated to team members and provide ample opportunity through team briefings etc. so that problems can be raised and everybody is sure of the objectives, their role and progress.
• Step 1: Define the skills and competencies needed according to the selected campaign design
Skills not Tick a box to the left or the right according to the level of
achievement Achieved as planned
Score 0 1 2 3 4
• Step 2: Select people / outside agencies with the required competencies Did not
happen Tick a box to the left or the right according to the level of achievement
Achieved as planned
Score 0 1 2 3 4
• Step 3: Define and allocate specific tasks
Did not
happen Tick a box to the left or the right according to the level of achievement
Achieved as planned
Score 0 1 2 3 4
• Step 4: Provide opportunities for information flow, feedback and discussions /
problem-solving Did not
happen Tick a box to the left or the right according to the level of achievement
Achieved as planned
Score 0 1 2 3 4

Revised Deliverable 3
Revised September 2003 37
Notes: Part 3: Target Audiences • Defining and understanding target audiences • Sensitivity to contextual, social, cultural, mobility issues • Interaction with target audiences
• Step 1: Sufficient time allocated to define the campaign target audience(s) Insufficient
time Tick a box to the left or the right according to the level of achievement
Sufficient time allocated
Score 0 1 2 3 4
• Step 2: Make use of a pre-campaign survey to understand the campaign target
audience Did not
happen Tick a box to the left or the right according to the level of achievement
Achieved as planned
Score 0 1 2 3 4
• Step 3: Using the output from pre-campaign market research plus other background
information. Involve contextual, social, cultural, mobility issues in the campaign (if relevant)
(Note – in some campaigns operating at the subliminal or Low Involvement Processing level it may not be a relevant or desired component of campaign design to include the awareness of social or environmental problems, or the individual’s acceptance of personal responsibility.)
Did not
happen Tick a box to the left or the right according to the level of achievement
Achieved as planned
Score 0 1 2 3 4
Note: The following two assessment items may be achieved by pre-testing materials and / or using feedback to modify the campaign. This will be essential if the campaign is to run over several years, as social and economic conditions will change significantly.
• Step 4: Create conditions to get target audience feedback Did not
happen Tick a box to the left or the right according to the level of achievement
Achieved as planned
Score 0 1 2 3 4
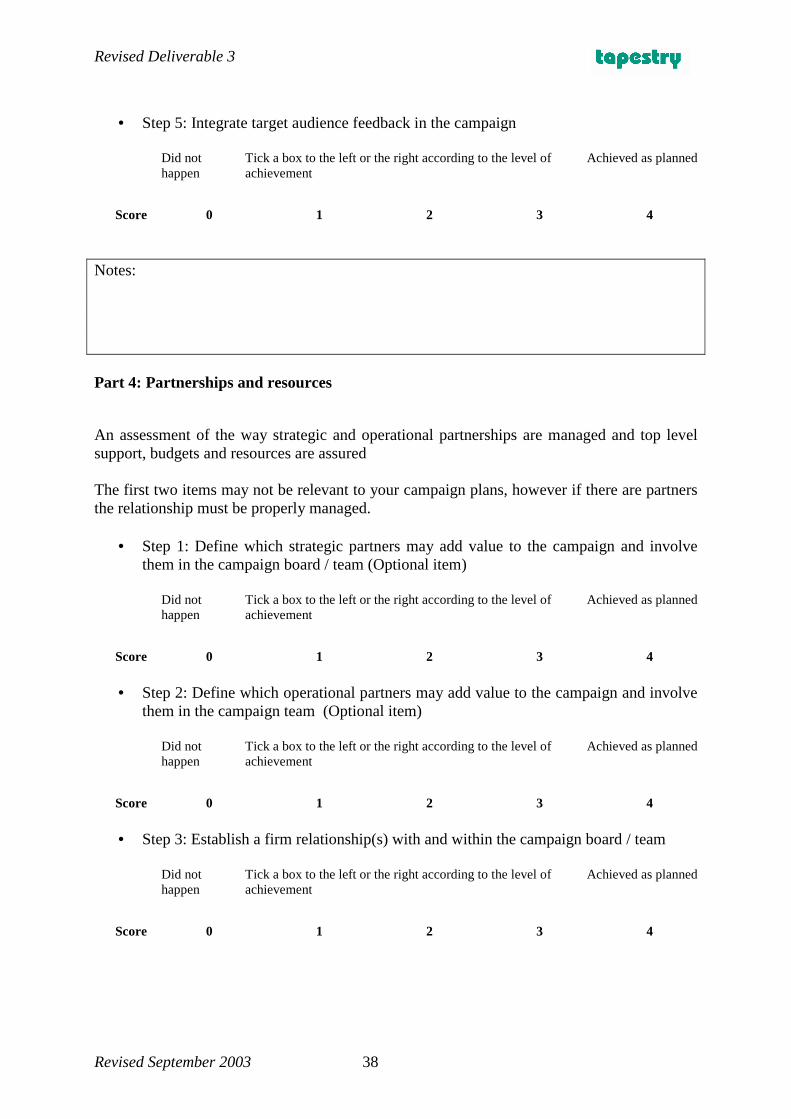
Revised Deliverable 3
Revised September 2003 38
• Step 5: Integrate target audience feedback in the campaign
Did not
happen Tick a box to the left or the right according to the level of achievement
Achieved as planned
Score 0 1 2 3 4
Notes: Part 4: Partnerships and resources
An assessment of the way strategic and operational partnerships are managed and top level support, budgets and resources are assured The first two items may not be relevant to your campaign plans, however if there are partners the relationship must be properly managed.
• Step 1: Define which strategic partners may add value to the campaign and involve them in the campaign board / team (Optional item)
Did not
happen Tick a box to the left or the right according to the level of achievement
Achieved as planned
Score 0 1 2 3 4
• Step 2: Define which operational partners may add value to the campaign and involve
them in the campaign team (Optional item) Did not
happen Tick a box to the left or the right according to the level of achievement
Achieved as planned
Score 0 1 2 3 4
• Step 3: Establish a firm relationship(s) with and within the campaign board / team
Did not
happen Tick a box to the left or the right according to the level of achievement
Achieved as planned
Score 0 1 2 3 4

Revised Deliverable 3
Revised September 2003 39
• Step 4: Specify the campaign budget Did not
happen Tick a box to the left or the right according to the level of achievement
Achieved as planned
Score 0 1 2 3 4
• Step 5: Secure additional budget whenever initial programme changes (Optional)
Did not
happen Tick a box to the left or the right according to the level of achievement
Achieved as planned
Score 0 1 2 3 4
• Step 6: Secure additional financial and other resources / adjust manpower and
competencies whenever initial programme changes (Optional) Did not
happen Tick a box to the left or the right according to the level of achievement
Achieved as planned
Score 0 1 2 3 4
• Step 7: Allocate tasks to partners
Strategic partners who are supporting the campaign either with money, or by political means will need to have their role clearly defined. An operational partner should be an integral part of the team.
Did not
happen Tick a box to the left or the right according to the level of achievement
Achieved as planned
Score 0 1 2 3 4
Notes: Part 5: Operational campaign programme An assessment of the way an effective operational campaign programme is established. Step 1:
• Draw up the campaign action plan • Define the various actions, set timetable
Assess these two actions jointly: Did not
happen Tick a box to the left or the right according to the level of achievement
Achieved as planned
Score 0 1 2 3 4

Revised Deliverable 3
Revised September 2003 40
• Step 2: Allocate responsibilities and budgets
Did not
happen Tick a box to the left or the right according to the level of achievement
Achieved as planned
Score 0 1 2 3 4
• Step 3: Assess progress
Did not keep
to schedule Tick a box to the left or the right according to the level of achievement
Design and implementation as
planned
Score 0 1 2 3 4
• Step 4: Turn the action plan into a campaign handbook for future campaigns (see Campaign Design Tool in Section 3.3)
Did not
happen Tick a box to the left or the right according to the level of achievement
Achieved as planned
Score 0 1 2 3 4
Notes: Part 6: Working with Communications Agencies An assessment on press liaison and PR and writing a brief for an advertising agency (See also Best Practice Guidelines Section 3.6 on briefing an agency.) It may be that your campaign does not merit engagement of an outside agency, either because the task is intrinsically simple, or your own organisation has its own integral communications function which is adequately skilled, resourced and experienced. Nevertheless, the same process of assessment and briefing should be applied equally to internal as well as external resources.)
• Step 1: Define the tasks that you want to commission to advertising agencies Did not
happen Tick a box to the left or the right according to the level of achievement
Achieved as planned
Score 0 1 2 3 4

Revised Deliverable 3
Revised September 2003 41
• Step 2: Contact advertising agencies
Did not
happen Tick a box to the left or the right according to the level of achievement
Achieved as planned
Score 0 1 2 3 4
• Step 3: Assess the work previously done by agencies
Did not
happen Tick a box to the left or the right according to the level of achievement
Achieved as planned
Score 0 1 2 3 4
• Step 4: Define the relationship you want to establish with press and media
Did not
happen Tick a box to the left or the right according to the level of achievement
Achieved as planned
Score 0 1 2 3 4
• Step 5: Set out a workplan for press relations
Did not
happen Tick a box to the left or the right according to the level of achievement
Achieved as planned
Score 0 1 2 3 4
• Step 6: Inform the press and media at the most appropriate times
Did not
happen Tick a box to the left or the right according to the level of achievement
Achieved as planned
Score 0 1 2 3 4
Notes:

Revised Deliverable 3
Revised September 2003 42
Part 7: Final Assessment
Campaign management - assessment Part
Description Maximum score available
Score
Part 1 Objectives 16
Part 2 Forming and managing the campaign team 16
Part 3 Target audiences 20
Partnerships and resources (Steps 3, 4, 7 – mandatory) 12
Part 4
(steps 1, 2, 5, 6 – optional or dependent on circumstances) 16
Part 5
Operational campaign programme 16
Part 6 Working with communications agencies 24
Total 104 Additional optional or dependent
items 16
Notes:

Revised Deliverable 3
Revised September 2003 43
3.3 Assessment using the Campaign Design Tool
This assessment tool makes use of the Campaign Design Tool (see Annex 1 of the Best Practice Guidelines - Deliverable 5). The Design Tool provides a checklist or aide-memoire for campaign managers. Decisions regarding plans for management, design and roll-out can be recorded against specific items. Following campaign implementation, the manager can check actual outcomes against intentions and the impact and recall of the campaign in the market place. The Tool is therefore a useful way to identify areas which could be improved or adjusted when planning future campaigns. In addition, this document can be used as the core recording instrument for creating the ‘Campaign Handbook’ (see Part 5, Step 4 in Section 3.2 above). The following tables contain elements of design that should be considered during the design process of any campaign. Not all will be relevant to every campaign. However, it is a checklist of criteria that should at least be considered. After implementation, an evaluation can then be made as to whether these decisions were implemented as planned, and if so were they correct or applicable to the particular campaign and its objectives. Explanatory notes in the ‘Notes’ column have been abbreviated. For a full explanation please refer to the ‘Campaign Design Tool’ in the Best Practice Guidelines and other relevant items within those Guidelines.


Revised Deliverable 3
Revised September 2003 45
Campaign Title / Reference _____________________________ Date (other reference / job number ) _________________________ In the following table enter a tick ! in the ‘Relevant to Campaign’ column to indicate that you consider this item relevant to your campaign / situation. After the campaign assess whether this judgement was appropriate.. Campaign Management
1. Strategy
Specific items Notes Relevant to campaign
Recommendations, Decisions or Actions planned / Use this column to record your plans under each heading
Record outcome here – did the actions proceed as planned? What were the problems? How were they solved.
1. Specify an overall aim for the campaign
Aim based on Policy Social need Commercial or economic pressure Other
2. Aim related to an overall explicit policy/strategy/vision
For example, is a car sharing campaign related to an explicit policy to reduce road traffic, or is it intended to solve employee dissatisfaction with commuting and parking problems.
Aim
3. Does the aim directly support the overall explicit policy/strategy/vision?
If successful would the campaign achieve social attitudinal and behavioural change in line with policy.
4. Set a main objective which supports the aim
An objective would be a specific outcome e.g. to reduce the number of cars – or make people more aware of ….
Objectives
5. Has more than one objective been set?
There is no rule that says a campaign should have only one objective. However, a number of diverse objectives may not be a successful recipe.

Revised Deliverable 3
Revised September 2003 46
1. Strategy
Specific items Notes Relevant to campaign
Recommendations, Decisions or Actions planned / Use this column to record your plans under each heading
Record outcome here – did the actions proceed as planned? What were the problems? How were they solved.
6. Are all objectives congruent or compatible with the main aim and objective?
This is an extension of point 5 above. In general we believe at present that objectives should be congruent, i.e. all supporting the aim and directed towards common target audience(s).
7. Setting behavioural change targets
A measurable outcome which could be a hard measure, e.g. 5% fewer cars on the road by a certain date.
Measurable objectives or Measurable outcomes
8. Setting attitudinal change targets
Measurable soft measures such as increase in staff morale or satisfaction as measured in an attitude survey, e.g. an increase from 65% to 75% of people satisfied with travel arrangements.

Revised Deliverable 3
Revised September 2003 47
2. Management / co-ordination.
Specific items Notes Relevant to campaign
Recommendations, Decisions or Actions planned / Use this column to record your plans under each heading
Record outcome here – did the actions proceed as planned? What were the problems? How were they solved.
1. Top level support for the campaign
Endorsement of campaign by senior management
2. Clearly defined management structure
Appropriate management structure, authority levels, lines of reporting and clarity of role
3. Management is knowledgeable about the ‘mobility’ (or contextual) issues
Management objectives may not conform to ‘sustainable mobility’ objectives. They may be more business focussed, concerned with maximising occupancy and profitability, rather than removing private cars from the road. The message is – ‘Be clear about what you are trying to achieve’ and make sure that senior management and policy makers are talking the same message.
4. Appoint an overall campaign ‘Champion’ or manager
For a campaign to be successful it must have a ‘champion’ or manager who will ensure that design, execution and roll-out all occur as planned, that nothing is left to chance, that branding or common look, sound and feel to a campaign is jealously guarded.
Campaign management
5. Ensure top level support for the campaign manager
Almost a sub-set of 1 above – this is a reflection of the organisation culture. The campaign manager must have access to and support from senior management so that issues of budgeting, resourcing and response to social and market conditions can be quickly resolved.

Revised Deliverable 3
Revised September 2003 48
2. Management / co-ordination.
Specific items Notes Relevant to campaign
Recommendations, Decisions or Actions planned / Use this column to record your plans under each heading
Record outcome here – did the actions proceed as planned? What were the problems? How were they solved.
6. Involvement of team and staff succession
The campaign team should ideally be formed at the inception stage so that everybody is fully briefed about the aims, objectives, management structures, lines of reporting and their roles.
7. Staff succession Manager must deal adequately with staff succession and subsequent briefing and training.
8. Planned roll out Campaigns do not just ‘happen’. Ensure that issues of timing etc (covered in roll-out section) are considered.
9. Market research Consider the need for research. Maybe there is existing research, tracking from other or previous campaigns, or maybe the attitudes and behaviours of the target audience are sufficiently well known by some other means. However, be aware that the opinions of the campaign manager or those of competing advertising creative teams may not be an accurate reflection of the target audience. Selection of target audience may itself require an initial piece of research so that the highest number of ‘early adopters’ or acceptors of change can be targeted.

Revised Deliverable 3
Revised September 2003 49
3. Resource allocation
Specific items Notes Relevant to campaign
Recommendations, Decisions or Actions planned / Use this column to record your plans under each heading
Record outcome here – did the actions proceed as planned? What were the problems? How were they solved.
Financial resources
1. Financial resource allocation
Ensure adequate allocation at the start – build in contingency fund for unexpected changes
2. a) for campaign development
Development and roll-out phases of a campaign must be seen as separate so that planning can take place well in advance of launch / roll-outdate.
Time resources
b) for roll out 3. Human resource allocation
Ensure adequate allocation
4. Continuity of staff Make provision for turnover / wastage 5. Staff skills in communications / marketing?
Ensure adequately skilled staff
Human resources
6. Staff briefing on social, cultural and mobility issues?
This topic concerns adequate briefing / training and information flow so that all those involved in the campaign from creatives / designers to administrators are well informed.
7. Framework for campaign assessment set up
Monitoring and assessment framework, pre-testing, market research programme and feedback loops must be set up in advance of campaign execution.
Management monitoring
8. Mechanism for information to reach the campaign manager
This is essential so that, wherever possible, the campaign content and roll-out programme can be adjusted to match the circumstances in the market place, e.g. advancing or delaying a campaign phase to avoid a clash with another campaign, or removing or re-designing the campaign in the event of adverse reaction.

Revised Deliverable 3
Revised September 2003 50
3. Resource allocation
Specific items Notes Relevant to campaign
Recommendations, Decisions or Actions planned / Use this column to record your plans under each heading
Record outcome here – did the actions proceed as planned? What were the problems? How were they solved.
9. Mechanism for information to reach a higher strategic level
Formal feedback sessions are vital if lessons are to be learned.
10. Take notice of previous campaign assessment/ learning?
Don’t be dogmatic. An open or credulous mind is required in order to understand the perspectives of target audiences and how their 'realities' are constructed.
4. Partnerships / synergies
Specific items Notes Relevant to campaign
Recommendations, Decisions or Actions planned / Use this column to record your plans under each heading
Record outcome here – did the actions proceed as planned? What were the problems? How were they solved.
1. Strategic partners Contributing finance or other sponsorship / benefit-in-kind – Decision to seek or involve?
?
2. Operating partners Decision to seek or involve? ? 3. Strategic partner
objectives and ethos
Are the strategic partners' objectives and campaign contributions in line with the campaign objectives?
?
4. Strategic partner objectives and ethos
Direct input to campaign operation / materials and content? If partners are active supporters, ensure that their activities are congruent with the aims of the campaign. Also ensure that the partner does not have another agenda that dilutes or confuses the aims and message of the campaign
Involvement of other partners (private/social) or sponsors
5. Involve / collaborate with other bodies
The ‘sign-up’ of leading bodies (e.g. other cities, transport operators to a campaign can enhance its credibility and status.

Revised Deliverable 3
Revised September 2003 51
5. Research
Specific items Notes Relevant to campaign
Recommendations, Decisions or Actions planned / Use this column to record your plans under each heading
Record outcome here – did the actions proceed as planned? What were the problems? How were they solved?
Careful targeting is required for effective communications.
1 Identify a clearly defined target audience – group to which campaign is directed
a) How many target audiences were identified? b) Was an effort made to tailor the campaign for different audiences (i.e. the campaign made use of market info.)?
2.Identify key audiences
Those most likely to change – early or likely adopters
3. Identify key audience criteria
These relate to the life of the audience; lifestyle, behaviours, needs, priorities, preferences, motivators What sort of people are they. Gentle or aggressive, materialistic and acquisitive etc.
4. Research to provide baseline data for further tracking / feedback
A baseline should be established prior to roll-out
Was market research commissioned to:
5. Make use of research outcomes
Was the output from all aspects of research used to inform the design of the brand image

Revised Deliverable 3
Revised September 2003 52
Design & brand image 6. Design Specific items Notes Relevant to
campaign Recommendations, Decisions or Actions planned / Use this column to record your plans under each heading
Record outcome here – did the actions proceed as planned? What were the problems? How were they solved?
1. Local , National or International
2. Broad or Specific
Context
3. Real life or Fantasy
4. Multiple messages within one communication?
5. How many messages
e.g. health & environment & congestion,
6. Clear overall message
7. Relationship to the audience’s lifestyle / behaviours
(as identified in the research)
8. Relationship of message(s) to audience aspirations
(as identified in the research)
Message
9. Relationship of message(s) to objectives
Argument 10. Cognitive (rational, logical) and / or
Affective (appealing to emotions)
e.g. social benefits (e.g. fewer cars = less pollution) versus personal advantage (protect your children’s health)

Revised Deliverable 3
Revised September 2003 53
6. Design Specific items Notes Relevant to campaign
Recommendations, Decisions or Actions planned / Use this column to record your plans under each heading
Record outcome here – did the actions proceed as planned? What were the problems? How were they solved?
11. Explicit or Implicit
(See Revised Deliverable 2 - State of the Art Review for a fuller explanation)
Recent studies show that ‘Low involvement processing’ whereby advertisements do not actively engage with the minds of the audience can on occasion be most effective. This research is contrary to conventional advertising design and tracking -–because by definition, audience recall is low. Most transport / mobility advertising is explicit.
12. Validating (behaviour change) OR
Invalidating (current behaviour)
Psychological theories argue that lasting personal attitudinal and behaviour change is most effective when campaigns and communications suggest more attractive personal alternatives and then reward their choice by validating or enhancing the image of the adopter. School action packs and games are good examples of validating campaigns. Invalidating advertising e.g. “don’t drive” – often using shock tactics may be less successful because of the phenomenon of denial – whereby people attribute blame to ‘them’ not me. Such commercials are often not ‘seen’ even though people actually look at and listen to them.
Content 13. Use of colour sound animation / cartoons shock tactics Other
Consider what use you will make of colour and sound. Likewise the use shock and other tactics should be carefully assessed in relation to the target audience.

Revised Deliverable 3
Revised September 2003 54
6. Design Specific items Notes Relevant to campaign
Recommendations, Decisions or Actions planned / Use this column to record your plans under each heading
Record outcome here – did the actions proceed as planned? What were the problems? How were they solved?
14. Passive or Active Audience involvement
Consider whether the communication will be passive, or whether some form of engagement extending from mere intellectual involvement to actions on the ground will be most effective. (Competitions, signing-up to a car share scheme are examples of involvement)
,
15. Icons / famous actors / sports people, etc
Will a campaign work better if endorsed by a local or national / international personality?
16. Public / ordinary people / peers, etc
Or will an appearance of normal people just like me work better?
Message givers
17. Officials / institutions / authority, etc
Or would the endorsement of an authority or public body have more impact?
18. Positive Negative
19. Offering new alternatives or Restricting (no choices, less freedom)
Tone (tone of voice or attitude of the message giver)
20. Persuasive / Coercive
21. Authoritative / Dictatorial Humorous
22. Appealing to conscience Appealing to audience aspirations
23. Shocking 24. Upbeat 25. Fear
Mood communicated by message
26. Other ____________________
The tone of a communication will be governed by the context, the audience and nature of the intended change.
There is often no single clear-cut answer to the design to adopt. Pre-testing of concepts, visual presentations, audio and text are often required. This may take a lot of time and research. For example the music that accompanies the tourist board advertisements for the Island of Ireland took one year to be selected!

Revised Deliverable 3
Revised September 2003 55
6. Design Specific items Notes Relevant to campaign
Recommendations, Decisions or Actions planned / Use this column to record your plans under each heading
Record outcome here – did the actions proceed as planned? What were the problems? How were they solved?
27. Define a specific creative style
28. Graphic - using drawings and cartoons
29. People
Creative style
30. Things, etc.
How clear and specific was the brief to the advertising agency?
31. Was a clear brand
image specified? Is this a one-off campaign where any identity will never be repeated, or is it an ongoing initiative that must have continuity of image and style – so that even short snips can be recognised, for example ‘Probably ….’ = Carlsberg, ‘Happiness …’ = Hamlet
32. Was a clear brand image used / achieved?
Despite best attempts was a clear brand image achieved. Was the achieved image that which was intended?
33. Branding clear and consistent across all media?
Consistency is vital. For recognition and recall
Brand image
34. Brand image based on research on life of audience ?
Concept testing
35. Campaign concept pilot tested with a sample of the target audience? (mood boards, etc.)
(see above)

Revised Deliverable 3
Revised September 2003 56
Implementation / Roll-out 7 Implementation and Roll-out Tick if
planned / intended
Tick if Media choice / action was researched
How / why relevant to target audience (other comment)
Tick if used
Comment on outcome
1. Radio/ TV " " " 2. Cinema " " " 3. Posters / Wall displays " " " 4. Flyer / leaflet " " " 5. Newspapers, magazines,
journals " " "
6. Email " " " 7. Internet " " " 8. Direct mail " " " 9. Play " " " 10. Competition " " " 11. Action packs " " " 12. Press conference " " " 13. Sponsored event " " "
Media choice
14. Other " " " 15. Was there a step-by-step action
plan " " Roll-out
16. Implementation – how phased Tick appropriate boxes: All at once " Drip feed "
Teasers followed by main campaign " Intermittent" Continuous " Comment:
Tick appropriate boxes: All at once " Drip feed " Teasers followed by main campaign " Intermittent" Continuous " Comment:
17. Where Home " Work/school " Street " Shops" On vehicle " Comment:
Comment Delivery -
18. Dependence on involvement of others
" e.g. teachers Other / comment
Comment
Timing 19. Takes account of other environmental factors
" e.g. school holidays, major sport events
Comment

Revised Deliverable 3
Revised September 2003 57
4 INPUTS & OUTPUTS 4.1 Input records
Recording campaign inputs systematically is an essential part of a comprehensive approach to campaign assessment. Inputs to a campaign may be financial, material or in the form of services from many different sources, such as local government, bus companies and other campaign organisations. In order to systematically record such inputs, they must all be recorded in monetary units, i.e., Euros (or other appropriate national currency). Where exact values cannot be given, these need to be estimated as accurately as possible. For example, if volunteers contribute their time to a campaign, or a hall is made available for a focus group meeting free of charge, the normal market rate for these services should be estimated in order to include all inputs invested in the campaign. Developed as part of the TAPESTRY Common Assessment Framework, Table 4.1 shows the format in which input costs can be recorded. The campaign manager should tick those media that apply, and then to fill in the corresponding costs. Design costs will probably include a relatively high proportion of management and administration costs (compared with direct costs), since 'design' is used in the broadest sense. Design costs should also include any costs associated with pre-testing of campaign materials, e.g., through market research, such as a focus group. Production costs are likely to contain a relatively high proportion of direct costs, and fewer manpower costs. Distribution costs reflect the investment in disseminating the various campaign materials, and would include the (true market) cost of putting a poster on a public billboard, or in a vehicle, of volunteers involved in door-to-door distribution and of running an advertisement on local radio. Wherever possible, all input costs should be allocated to the appropriate media. If management and administration costs over several months are dedicated to both the production of a poster, and the running of some public event (e.g. a roadshow), these management and administration costs should be divided as accurately as possible between the two inputs. Where needed, ad hoc items may be added, and associated costs recorded in the lower half of the table. It is advised to keep these to a minimum, such that the vast majority of costs may be attributed to (a possibly extended list of) media in the upper half of the table. This will allow a direct comparison between inputs and outputs, by comparing input values in Table 4.1 with the corresponding output values in Table 4.2.

Revised Deliverable 3
Revised September 2003 58
Table 4.1 Recommended input categories (all costs in Euro or appropriate national currency)
Medium ! tick
those which apply
Design costs Production costs
Distribution costs
Geared to specific outputs (see Table 4.2) newspaper – national newspaper – local magazine – national magazine – local radio – national radio – local television – national television – local telephone call personal visit Poster Leaflet Postcard info pack Letter ad other product CD Diskette Website WAP site mob. phone text press conference. drama event Roadshow other public Meeting Ad hoc inputs bus ticket offer bicycle offer : etc if needed
4.2 Output records
The set of inputs considered in a communication initiative, together (and in interaction) with the several aspects of the management process, lead to certain outputs. These outputs can be divided into two types: materials and events / actions.

Revised Deliverable 3
Revised September 2003 59
The outputs can be compared to the inputs, which tells us something about the efficiency of the campaign when comparing it to the input-output results of other campaigns (see Section 2.3.2). However, more important than the type of outputs produced by each communication initiative, is the reach of the outputs. The reach can be measured in terms of exposure, e.g. market share associated with the media used. Therefore, as a prerequisite for assessing a communication initiative, good records should be kept on inputs, outputs and exposure. Also developed as part of the Common Assessment Framework, Table 4.2 provides a standardised structure for recording campaign outputs. Not all of these will be applicable to each communication initiative, but it is anticipated that, by building on the list as may be required, a comprehensive and standardised record of outputs may be kept for each initiative. The 'pre-testing' code will allow the campaign team to record whether or not a poster, for example, was pre-tested with the target audience (e.g. in focus groups at the design stage). The personalisation column is to be used to show if the medium was directed to a particular person with their name on it, which typically commands better attention than several mail shots (for example to "The Occupier" of a house). This would include personalisation of invitations to events, for example. More than one code may be entered in the fourth column to show where a particular medium was employed / distributed. Exposures should be recorded both as the total number of exposures, and the number of exposures to the target group. Newspapers, radio stations etc. can often provide some information on the profile of the readership and audience. Another good example is the use of outdoors located near heavy traffic roads. Very often there are traffic counts (manual or automated) from which the potential volume of exposures can be easily determined. This requires knowledge of the size of the target group, and some knowledge of its access to the campaign media. The number of targeted exposures over the total number of exposures will give an estimate of the strength of the targeting. The 'duration' column should be used to record the duration of the exposure, e.g. how long a poster is up for, total number of radio broadcast minutes, or the number of repeat advertisements. In many cases there these will be rough estimates. In some cases more accurate data may have been collected through market research (e.g. on target group exposures), for others even cruder estimates may have to be made, of how often a poster on a public board may be seen by members of the target group, for example. The limitations of such data are recognised, but the very act of thinking through such issues should in itself contribute positively to the campaign implementation and will, at least, provide some basic figures for assessing the efficiency of the campaign.
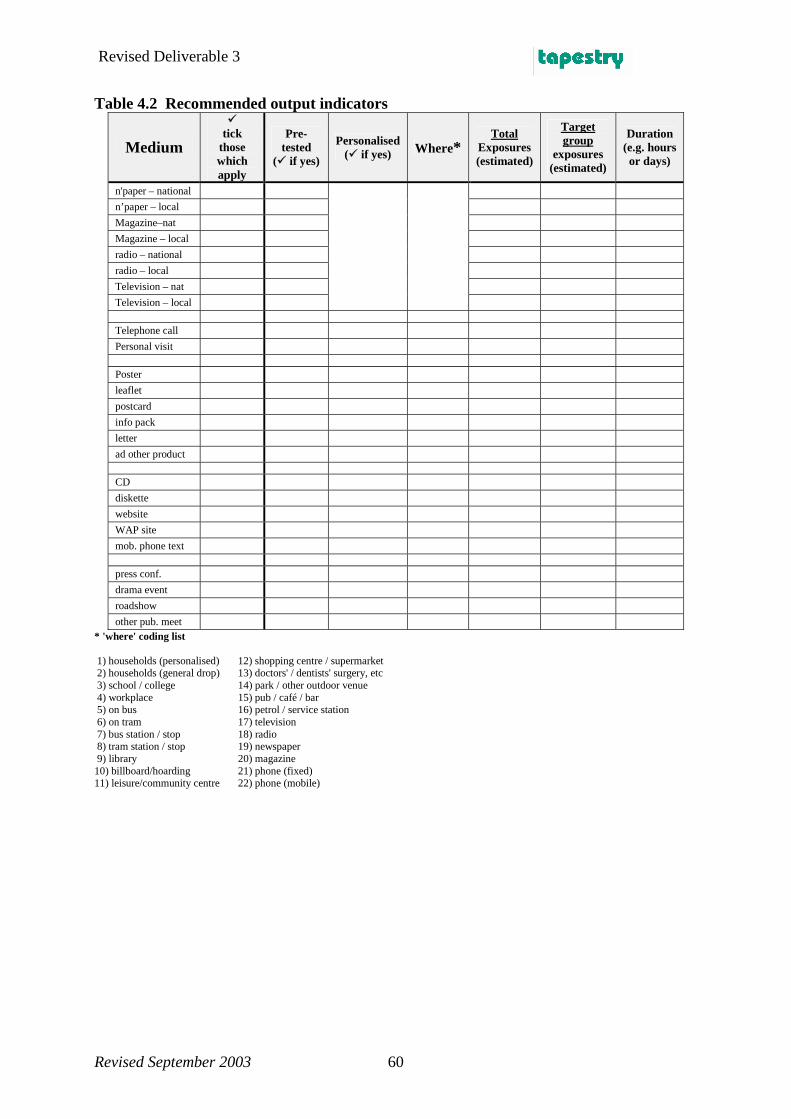
Revised Deliverable 3
Revised September 2003 60
Table 4.2 Recommended output indicators
Medium
! tick
those which apply
Pre-tested
(! if yes)
Personalised (! if yes) Where*
Total Exposures (estimated)
Target group
exposures (estimated)
Duration (e.g. hours or days)
n'paper – national n’paper – local Magazine–nat Magazine – local radio – national radio – local Television – nat Television – local
Telephone call Personal visit Poster leaflet postcard info pack letter ad other product CD diskette website WAP site mob. phone text press conf. drama event roadshow other pub. meet
* 'where' coding list 1) households (personalised) 12) shopping centre / supermarket 2) households (general drop) 13) doctors' / dentists' surgery, etc 3) school / college 14) park / other outdoor venue 4) workplace 15) pub / café / bar 5) on bus 16) petrol / service station 6) on tram 17) television 7) bus station / stop 18) radio 8) tram station / stop 19) newspaper 9) library 20) magazine 10) billboard/hoarding 21) phone (fixed) 11) leisure/community centre 22) phone (mobile)
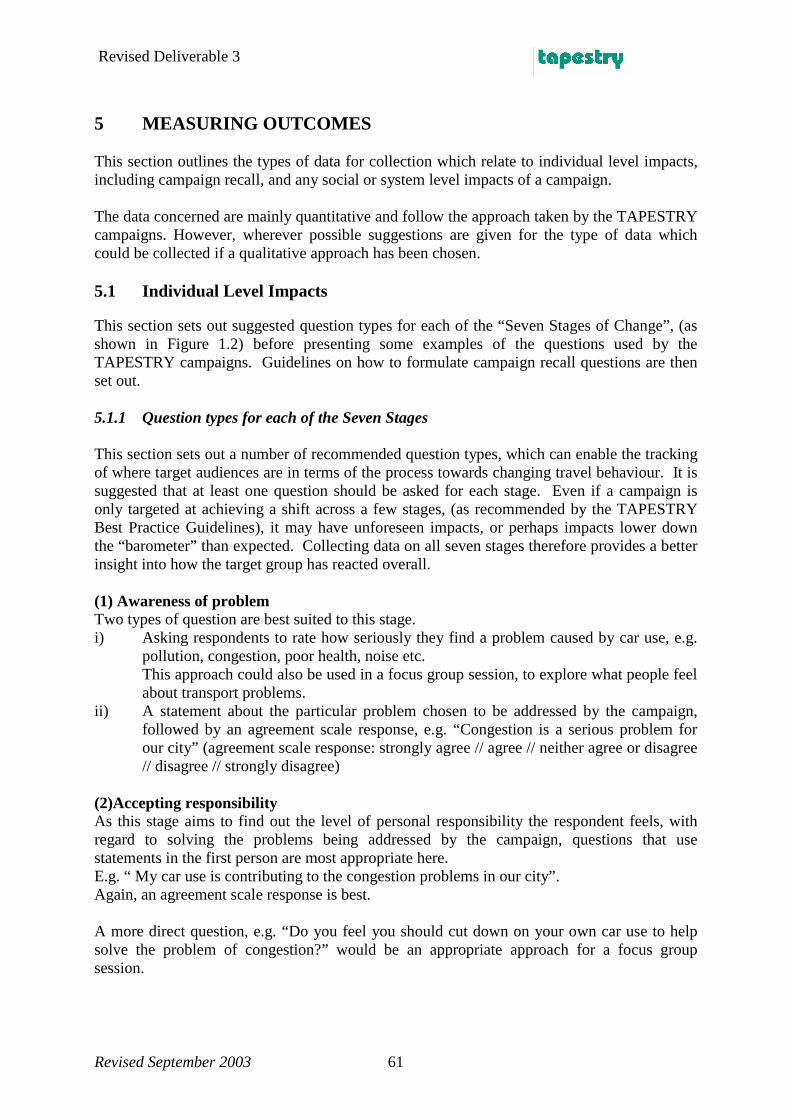
Revised Deliverable 3
Revised September 2003 61
5 MEASURING OUTCOMES This section outlines the types of data for collection which relate to individual level impacts, including campaign recall, and any social or system level impacts of a campaign. The data concerned are mainly quantitative and follow the approach taken by the TAPESTRY campaigns. However, wherever possible suggestions are given for the type of data which could be collected if a qualitative approach has been chosen. 5.1 Individual Level Impacts
This section sets out suggested question types for each of the “Seven Stages of Change”, (as shown in Figure 1.2) before presenting some examples of the questions used by the TAPESTRY campaigns. Guidelines on how to formulate campaign recall questions are then set out. 5.1.1 Question types for each of the Seven Stages This section sets out a number of recommended question types, which can enable the tracking of where target audiences are in terms of the process towards changing travel behaviour. It is suggested that at least one question should be asked for each stage. Even if a campaign is only targeted at achieving a shift across a few stages, (as recommended by the TAPESTRY Best Practice Guidelines), it may have unforeseen impacts, or perhaps impacts lower down the “barometer” than expected. Collecting data on all seven stages therefore provides a better insight into how the target group has reacted overall. (1) Awareness of problem Two types of question are best suited to this stage. i) Asking respondents to rate how seriously they find a problem caused by car use, e.g.
pollution, congestion, poor health, noise etc. This approach could also be used in a focus group session, to explore what people feel about transport problems.
ii) A statement about the particular problem chosen to be addressed by the campaign, followed by an agreement scale response, e.g. “Congestion is a serious problem for our city” (agreement scale response: strongly agree // agree // neither agree or disagree // disagree // strongly disagree)
(2)Accepting responsibility As this stage aims to find out the level of personal responsibility the respondent feels, with regard to solving the problems being addressed by the campaign, questions that use statements in the first person are most appropriate here. E.g. “ My car use is contributing to the congestion problems in our city”. Again, an agreement scale response is best. A more direct question, e.g. “Do you feel you should cut down on your own car use to help solve the problem of congestion?” would be an appropriate approach for a focus group session.

Revised Deliverable 3
Revised September 2003 62
(3) Perception of options This stage requires two question types: One regarding the respondent’s perception of the car and alternatives modes, in terms of their performance; the other to establish the degree to which the opinions of others (family, friends, colleagues) has an impact on the way they perceive alternative modes. The first type should include three elements: (i) a list of attributes for transport modes, such as, speed, reliability, comfort, safety, cost etc.; (ii) the modes concerned (usually car and the main targeted modes for the campaign, such as bus, bicycle, etc) and (iii) an agreement scale response. The second type is best set out as a statement, with an agreement scale response. However, the way in which the question is worded will depend very much on local cultural norms. In addition, it may be necessary to de-personalise the statement, so that the respondent feels more comfortable about answering it honestly. E.g. “Do you think most people would cycle more if their friends did?” Both question types could be adapted for use in a focus group. A list of attributes for transport modes would provide a starting point for a discussion about which could be applied to the car and which to the alternative mode prompted by the campaign. The second question type could be used to provoke a discussion on whether friends, colleagues and family members influence how travel choices are perceived. Questions from this stage onwards should focus on a particular journey type / time of day, depending on campaign objectives. (4) Evaluation of the options Once respondents’ perceptions of difference modes have been explored, the next step is to find out how important they regard each of the attributes that were listed (speed, reliability, comfort, safety, cost etc.). This is best set out as a grid with the list of characteristics along one side, and an importance scale on the other. Again, this should be for a specific journey type/ time of day, relating to the campaign. If sufficient resources are available, a Stated Preference survey could be used to explore this stage in more detail (see Section 6). In a focus group setting, the same list of attributes could be presented, with the question as to which attribute people found to be most important for a particular trip type. (5) Making a choice This fifth stage looks at whether the respondents, having weighed up the options are intending to switch to the alternative mode, promoted by the campaign. A statement, with an agreement scale response is the best approach. E.g. “I intend to use the bus next time I go to the city centre to shop”. However, in order to find out whether the choice has been made due to the campaign or other factors, a question asking for the reason why could be included (see “Experimental and Habitual Behaviour” below for more guidance)

Revised Deliverable 3
Revised September 2003 63
This stage would be more difficult to explore in a qualitative way. However, it could be part of a more general discussion on the modes people choose to use most regularly and why. (6/7) Experimental behaviour & Habitual behaviour The final two stages require similar techniques; changes in habitual behaviour, however, are more difficult to measure, unless a series of “after” questionnaires are planned. Here we are interested in measuring two things: • Whether any changes in travel behaviour have occurred • The reasons for such changes (i.e. whether due to the campaign or some other factor) Since a proportion of the target population are changing their behaviour at any point in time (due to population and employment ‘turnover’), it is important to ask about behavioural change in the ‘before’ as well as in the ‘after’ surveys, and the reasons for such change. Core aspects of travel behaviour to be measured include: • Mode of travel • Trip length and/ or trip origin and destination • Trip purpose • Travel time • Frequency of travel This information may be obtained in a variety of ways (see Section 6), either by targeting particular trips, or by recording travel over given time periods (e.g. one-day or multi-day travel diary). There are two general settings in which questions on behavioural change (including intended change) can be presented: (i) In the course of a trip (on-mode or at the destination); here information collection will
focus on that (type of) trip. (ii) At the respondent’s home (or workplace); here information collection may span a
variety of trips, over one or several days. It is also necessary to establish whether travel behaviour has changed as a result of (or, in the case of a one-off trip, has been influenced by) the campaign, or some external factors. And then (where the trip is made on a regular basis), whether this represents experimental behaviour or a permanent shift in behaviour. This can be done: • By comparing reported behaviour at two points in time (e.g. comparing travel diaries
recorded by the same respondent ‘before’ and ‘after’ the campaign). • By directly asking the respondent whether they have changed their travel behaviour. NB: The distinction between experimental and habitual behaviour will not be relevant in all cases (e.g. for a tourist making a one-off trip to an area), and where it is relevant – in the case of relatively frequent trips - it will not always be possible to design surveys to pick up these two stages separately.

Revised Deliverable 3
Revised September 2003 64
Reasons for (Intended) Change Respondents may report a change in actual or intended travel behaviour for a whole variety of reasons, some to do with the campaign, but many for other reasons too. The rate of ‘turnover’ in the use of a public transport service may range between 20% and 50% per annum – without a campaign or any major change in service provision. Reasons for change can be grouped into: • Personal circumstances (e.g. change in home or work location, retirement, disqualification
from driving) • Transport system characteristics:
- ‘objective’ improvements in service provision (higher frequencies, new buses, etc.) - ‘subjective’ improvements, brought about by changes in perception – usually as the
result of a campaign. • Other external factors (see Section 2.2.3), such as fuel price increases, severe flooding,
etc. 5.1.2 Questions for adults used by TAPESTRY The following were the questions set by TAPESTRY in relation to the Seven Stages of Change Model, for all adult questionnaires. An example of how these questions could be set out in a questionnaire, including further questions to collect data on social-economic issues can be found in Annex 1.
I . BELIEFS AND ATTITUDES (Stages 1 to 4)
1. Awareness of the problem “How serious a problem do you think the following are in this area [or name area]?”: Traffic congestion ] Items depend on Air pollution ] campaign objectives Etc….. ] Use a 4-point scale:
‘extremely serious’, ‘fairly serious’, ‘slight problem’, ‘no problem’ “Something needs to be done to reduce the number of cars on the roads in this area [or name area]”5
Use a 5-point scale: ‘strongly agree’, ‘agree’, ‘neither agree nor disagree’, ‘disagree’, ‘strongly disagree’
5 This question should be used with care, as if the campaign is successful, the number of cars on the roads in the target area may decrease. Therefore respondent may tend to disagree with the statement, even if they are more aware of the impacts of car use after the campaign is over.

Revised Deliverable 3
Revised September 2003 65
2. Accepting responsibility “I am contributing to air pollution [or other policy concern] when driving a car”
Use a 5-point scale: ‘strongly agree’, ‘agree’, ‘neither agree nor disagree’, ‘disagree’, ‘strongly disagree’
“I feel I should cut down on my car use, to help reduce the problem of air pollution [or other policy concern]”
Use a 5-point scale: ‘strongly agree’, ‘agree’, ‘neither agree nor disagree’, ‘disagree’, ‘strongly disagree’

Revised Deliverable 3
Revised September 2003 66
3. Perceptions of options From here onwards it may be necessary to focus on particular trip purposes/journey types/times of day, depending on the campaign objectives and the nature of the target group. 3(a) Transport system performance Q3a.1 “For your journeys to [work, shop; the town centre – AS APPROPRIATE] to what extent do you agree with the following statement?”
Please tick one box for each of the modes:
(Choose Car + one other mode as appropriate)
1. Strongly Agree 2. Agree 3. Neither Disagree or agree
4. Disagree 5.Strongly Disagree
Car Bicycle Walking
1. gets me to [school] quickly
Public transport Car Bicycle Walking
2. does not cost very much
Public transport Car Bicycle Walking
3. is reliable
Public transport Car Bicycle Walking
4. is convenient door-to-door
Public transport Car Bicycle Walking
5. allows me to travel when I want to Public transport

Revised Deliverable 3
Revised September 2003 67
(Choose Car + one other mode as appropriate)
1. Strongly Agree 2. Agree 3. Neither Disagree or agree
4. Disagree 5.Strongly Disagree
Car Bicycle Walking
6. is comfortable
Public transport Car Bicycle Walking
7. is safe in traffic
Public transport Car Bicycle Walking
8. offers good personal security
Public transport Car Bicycle Walking
9. has a good image
Public transport Car Bicycle Walking
10. is an enjoyable way to travel
Public transport Car Bicycle Walking
11. helps the environment
Public transport

Revised Deliverable 3
Revised September 2003 68
3(b) Social/cultural influences “Do you think that most people would stop using their car for [insert trip purpose] if
their friends [/colleagues] did?”
Use a 5-point scale: ‘definitely stop’, ‘probably stop’, ‘not sure’, ‘probably not’, ‘definitely not’ 4. Evaluation of the options “How IMPORTANT are each of the following factors to you when deciding on the way you travel to [work, shop; the town centre – AS APPROPRIATE] ?“
Importance of each factor in your travel decision
1. Very important
2. Important 3. Fairly
important
4. Not at all important
1. gets me to [school, work etc.] quickly
2. does not cost very much
3. is reliable
4. is convenient door-to-door
5. allows me to travel when I want to
6. is comfortable
7. is safe in traffic
8. offers good personal security
9. has a good image
10. is an enjoyable way to travel
11. helps the environment
II: TRAVEL BEHAVIOUR (Stages 5 to 7) 5. Making a Choice (Intention) “Next time I go to [purpose] I intend to travel by [bus/tram, walk, cycle – AS APPROPRIATE] instead of driving.”

Revised Deliverable 3
Revised September 2003 69
Use a 5-point scale: ‘strongly agree’, ‘agree’, ‘neither agree nor disagree’, ‘disagree’, ‘strongly disagree’
6./7. Experimental / Habitual Behaviour Current use of transport modes [particularly in household surveys]: 5 or more
days/week
2 to 4 days/week
Once/ week
At least once/month
At least once/year
Less often / Never
Car driver Car passenger Bus Tram/train Taxi Motorcyle / scooter
Cycle Change in use of targeting mode “How often do you [“your child”] [insert campaign targeted mode and journey type], compared with this time last year?”
about the same [campaign targeted mode] more often now [campaign targeted mode] less often now
Reasons for (intended) change in behaviour (Example, uses children walking to school as campaign objective) “What influences how often your child walks to school?” Please tick as many reasons as
applyneed to combine school journey with other journey (e.g. to work)
too far to walk not enough time for walking
walking is not safe Somebody else gives a lift
have to use the car because of mobility impairment (now) have own car available
no school bus/public transport somebody else not able to provide lift
Unavailability of own car Decided car too expensive Decided car too polluting
decided driving is too stressful decided walking is healthier decided walking is cheaper
other reason(s) (please write in):

Revised Deliverable 3
Revised September 2003 70
5.1.3 Children’s questions The following questions were developed by TAPESTRY for completion by children between 9-12 years old. Current Travel Behaviour
please tick your answers ! “How do you travel [to school]?” d Usually Sometimes By car (passenger)
By motorbike / moped (driver)a
By motorbike / moped (passenger)
By taxi
By train c
By tram c
[By service bus]b, c
[By special school bus]a, b, c
Cycling c
On foot / walking c
please only put ONE tick in this column
for the way you most often go [to school]
#
a) to be removed where not valid b) or, for example 'autobus' cf 'scuolabus', 'lijnbus' cf 'schoolbus' c) care must be taken to exclude demonstration / school-organised journeys, etc. d) may also ask for who accompanies children “And how do you return home?” (style as above) Raising awareness
What do you think? – please tick one of the boxes I agree a lot I agree with this quite a bit I’m not really sure I do not agree with this I do not agree at all
Note use of 'projective' approach, with neutral figures, which do not represent authority figures or peers
[“There are too many cars arriving at our school each morning”]

Revised Deliverable 3
Revised September 2003 71
Accepting responsibility
What do you think? – please tick one of the boxes I agree a lot I agree with this quite a bit I’m not really sure I do not agree with this I do not agree at all
Social influences
What do you think? – please tick one of the boxes I definitely would [cycle more] I probably would [cycle more] I’m not really sure I probably would not [cycle more] I definitely would not [cycle more] It’s not up to me: other people decide I already [cycle] all the time
3a.1/4.1 Perceptions of options a Please look at the statements below and tick under 'car' if you agree that it describes travelling by car, and tick under ['bus'] if you agree it describes travelling by bus. In the last column, tick if the statement describes something which is important to you. In the example: - if you agreed that travelling by car did not let you see the scenery, you would not put a tick - if you thought that travelling by [bus] did let you see the scenery, you would put a tick - if seeing the scenery was important to you, you would tick 'yes' in the last column a) this question attempts to simply combine CAF questions on 'satisfaction' and 'importance'. This may be too confusing, and need to be separated again, although this will increase questionnaire length, possibly beyond the attention span of younger children?
[“Children who are driven to school should encourage their parents to use their car less for journeys to school”]
“I would [cycle to school more] if my friends did”

Revised Deliverable 3
Revised September 2003 72
important to you? For your journey [to school], please tick boxes where you agree and where things are important. car [bus] yes no
example:
lets me see the scenery b ! !
1. gets you [to school] quickly
2. does not cost very much c
3. is reliable
4. is easy door-to-door
5. lets you travel when you want
6. is comfortable
7. is safe in traffic
8. is safe from other people
9. is a [cool] way to travel
10. is an enjoyable way to travel
11. helps the environment b) example needs to be neutral option c) care needed with this, e.g. if parents / state pay Intention
What do you think? – please tick one of the boxes I definitely will [cycle as often as I can] I probably will [cycle as often as I can] I’m not really sure I probably will not [cycle as often as I can] I definitely will not [cycle as often as I can]
It’s not up to me: other people decide
5.1.4 Campaign Recall as a measure of Campaign Exposure As well as questions to measure changes in attitudes and behaviour, some questions on whether the respondents have remembered the campaign and its message(s) should be included, i.e. levels of “campaign recall”. As illustrated by Figure 2.2, campaign recall is a crude way to assess the campaign exposure process, as it can only measure the extent to which respondents consciously remember the campaign, its design and messages. However, even if it is not a perfect measure of campaign exposure, it can give a useful insight into whether the campaign has had an effect.
In the future, I am going to [cycle as often as I can to school]

Revised Deliverable 3
Revised September 2003 73
Campaign recall can be tested in two ways: i) Prompted recall: by asking the respondent whether they have seen / heard a particular
aspect of the campaign, e.g. showing them an image used on campaign material OR by describing the campaign aimed to do, e.g. “There has been a campaign promoting bus use in the last 3 months. Have you seen / heard anything about it?”
ii) Unprompted recall: by asking a more general question about whether the respondent
has seen / heard about any campaigns relating to the broad area of the campaign e.g., “Have you heard / seen a transport-related campaign recently?” It is more common for unprompted recall questions for a space to be left for respondents to write in their own response.
For both approaches, a question should then be asked about the campaign messages, e.g. Which of the following messages was the campaign trying to get across? I don’t remember [ ]
[cycling to school is quicker than going by car] [ ] [cycling to school is healthier than going by car] [ ] [walking to school is quicker than going by car] [ ] [walking to school is healthier than going by car] [ ] [going by car to school is the safest way to get there] [ ] [going by car to school is the most comfortable way to get there] [ ] Please tick as many boxes as apply, or just the first box. Please tick what the campaign messages were, not your opinion! For children, a single question could be used: Campaign recall Do you remember seeing/hearing anything about [travelling to school] in the last [2] months? No, [I don’t think this has happened at our school yet] a Yes, the message was “cars are a safe way to travel” Yes, the message was “cars are a fast way to travel” Yes, the message was “cycling helps to reduce congestion” Yes, the message was “cycling is a fast way to get to school” Yes, the message was “there are too many cycles on the road” Yes, the message was “our parents should never use their cars” a) reduces pressure bias – i.e. feeling they ought to have heard of campaign, and thus guessing In addition to asking whether respondents have seen or head about the campaign and whether they remember the message, it is useful to get some feedback on whether it was received

Revised Deliverable 3
Revised September 2003 74
positively. For respondents who have remembered the campaign, TAPESTRY used the following responses. 1) I found it interesting [ ] 2) It was well designed [ ] 3) It was directly relevant to me [ ] 4) It made me think about my use of the car [ ] 5) I agreed with what was being said [ ] 6) It seemed irrelevant to me [ ] 7) It had no affect on me at all [ ] 8) I found it irritating [ ] A good way to test whether the respondent has correctly identified a particular campaign, is to include a question on where they saw / heard about it, e.g. And where did you [see this]? 1) own home [ ] 12) shopping centre / supermarket [ ] 2) other's house [ ] 13) doctors' / dentists' surgery etc [ ] 3) school / college [ ] 14) park / other outdoor venue [ ] 4) workplace [ ] 15) pub / café / bar [ ] 5) on bus [ ] 16) petrol / service station [ ] 6) on tram [ ] 17) television [ ] 7) bus station / stop [ ] 18) radio [ ] 8) tram station / stop [ ] 19) newspaper [ ] 9) library [ ] 20) magazine [ ] 10) billboard/hoarding [ ] 21) phone (fixed) [ ] 11) leisure/community centre [ ] 22) phone (mobile) [ ]
Finally, it is very important to include the more general questions on campaign recall in the “before” survey. There will always be some respondents who say that they have seen or heard of the campaign before it has even started. This type of “false recall” can then be taken into account when the results of the campaign are compared with levels of campaign recall after the campaign. 5.2 System Level Impacts
In addition to influencing the attitudes and behaviour of individual travellers, some campaigns will have objectives that include having an impact on the performance of the relevant transport systems. The analysis of these impacts will enable some of the wider benefits of the campaign for society to be assessed, such as reduced congestion levels, better air quality, reduced noise and accidents. The indicators chosen will relate closely to campaign objectives and the higher level strategic policy objectives. Therefore, in some cases only a selection of the following will be measured. Key indicators include:
• Traffic volumes: • Road traffic volumes – (at selected locations) • Bus/tram passenger volumes • Walking volumes • Cycling volumes

Revised Deliverable 3
Revised September 2003 75
• Pattern and level of parking activity • Public transport punctuality • Air quality measurements • Noise measurements • Accident data
For each relevant category, data should be collected before and after the campaign, according to the guidelines set out in Section 6. Collecting data on traffic volumes will enable interesting comparisons with any changes in behaviour recorded by a questionnaire. This will particularly be the case where the campaign has been targeted at a particular area or journey type. For most campaigns it will also be necessary to measure changes in public transport volumes or walking and cycling volumes, according to their objectives, in order to demonstrate any shifts to sustainable modes. Tracking public transport punctuality can be an indirect way to measure congestion levels. Looking at changes in the pattern and level of parking activity may also be a useful way to record changes in car use, in particular for those campaigns which are seeking to reduce traffic in city centres or are promoting the use of park and ride. Both air quality and noise measurements can reflect any changes to the wider environment or the quality of life in the area targeted by the campaign. Where the campaign objectives include reducing local air pollution and improving the quality of life of the target group, then these measurements can be a useful barometer of progress. Finally, data on road traffic accidents may be collected where the campaign seeks to improve road safety, either through the increased use of cycling and walking or through a reduction in car traffic. However, it is usually necessary to collect three years of ‘after’ data before any impacts can be reliably determined.

Revised Deliverable 3
Revised September 2003 76
6. TOOLKIT – GUIDELINES ON MEASURING CHANGE 6.1 Introduction
These notes are designed to offer guidance on how to measure change. We may wish to measure the differences between the 'before' and 'after' situation of a campaign, or between characteristics of target groups and control groups. The aim here is to offer uncomplicated advice on how to measure these differences, and assess change. It is assumed that the reader has little or no previous knowledge of the techniques described: the tables on each technique are intended to act as an introduction only. Further details (often more technical) may be found in the 'Further information' references for each technique. It is also appreciated that in many cases it will be necessary to work in conjunction with an academic partner, or a market research company, who will undertake the main aspects of the data collection and analysis. In this case, these notes will help to understand the basic elements and to work with the partner agency more effectively. Finally, it is worth highlighting that another body may already routinely collect some of the data that needs to be collected (especially traffic counts, air quality data, etc). Even if this is not the case, it may be substantially cheaper to add a traffic count to an existing programme (e.g., run by a local authority) or to 'piggy-back' questions onto another survey (e.g., national omnibus surveys, for national campaigns), than to commission special surveys or counts. However, whilst collecting primary data is often quite expensive, the more specialist the need (e.g., attitudinal and behavioural data from a limited target group), the less likely it will be that some other party has already collected similar data. Nevertheless, joint surveys with other interested bodies may still often reduce costs (e.g., a joint survey between the local authority and the bus company). 6.2 Different ways of measuring change: surveys & counts
In simple terms, it is hoped that campaigns will lead to a change in people's attitudes (usually measured by a survey), which will, in turn, lead to a change in people's behaviour (again, usually measured by a survey, e.g. through travel diaries). The combined effect of changing the way individuals travel will be reflected at the macro level of the transportation system itself (e.g. 10% fewer cars on the road), and these changes are usually measured by counts (e.g. traffic flow counts).
Change in attitudes
Change in behaviour
Change in system
(survey) ⇨ (survey) ⇨ (counts) Figure 6.1: Measuring changing attitudes, behaviour and the system There is, of course, some overlap between these techniques. For example, changes in behaviour may be measured by counts, although it is rare to do this for individuals, so that changes tend to be counted at the macro, system level.

Revised Deliverable 3
Revised September 2003 77
Although Section 6.6.1 describes different types of survey (e.g. 'attitudinal' survey and ‘travel’ survey) these are often carried out by means of a single questionnaire, whereby questions about both attitudes (e.g. to sustainable travel) and on behaviour are asked on the same questionnaire. This is very important, not only does it reduce survey costs, but more importantly it enables conclusions to be drawn about associations between attitudes (and campaign awareness) and behaviour (travel patterns). Although it is not possible to say which changes may be attributed to a campaign by using counting methods only, it is often very informative to compare count data (e.g. slightly reduced traffic counts on a targeted road) with survey data (target group reporting greatly reduced usage of their car). Both surveys and counts have their place, and neither may be considered superior to the other. Attempting to collect attitudinal and awareness data using roadside equipment is as inappropriate as trying to accurately measure NOx levels with an attitudinal survey. Finally, it is to be noted that the generic term 'counts' has been used to encompass not only vehicle and traveller counts, but also those relating to air quality and noise levels. Some basic terms are defined in the next Section. 6.3 Definition of terms describing data or classifying it – quick reference
Table 6.1: Quick reference table for classifying data
survey
usually refers to data collected by means of interview – asking people questions (e.g. using a questionnaire) instead of by observing people. Produces what is often termed 'soft' data, as it is more difficult to objectify, and often refers to less tangible things like people's attitudes (which may be measured in various ways and are arguably easier to change than actual behaviour).
count
usually refers to data collected by direct observation or measurement, e.g. by roadside equipment for measuring vehicle flows. (Sometimes also referred to more loosely as a 'survey', too, although this may be confusing!) Produces what is often referred to as 'hard' data because it is more easy to verify (e.g. by testing the equipment used) and refers to less debatable physical counts.
qualitative data
data which qualify (describe or modify) something, without expressing numbers or magnitude. Surveys may produce qualitative or quantitative data.
quantitative data
data which quantify measurement, i.e. give magnitudes. These may be obtained by surveys or counts. (Sometimes survey results measuring attitudes on a 5-point scale are incorrectly described as qualitative, because these are 'soft' data).
O/D origin – destination, e.g. "home" to "work". An O/D survey thus collects data on journeys which people make, and occupies a somewhat grey area between pure surveys and pure counts, and may draw on both techniques (hence its position in this document on the borderline between the two).
6.4 Data quality
Particularly before investing in collecting primary data, it is important to decide upon the level and detail required. Collecting data of insufficient quality for drawing conclusions on the target population is a waste of resources, as is taking a sample that is too large for the required purpose.

Revised Deliverable 3
Revised September 2003 78
There are two opposing rules in force here. One is a statistical law of diminishing returns, which applies when taking a sample. Increasing the statistical 'precision' by a relatively small amount could easily double or triple the survey costs. On the other hand, running a total of eleven focus groups instead of ten, or monitoring traffic flows for 1100 hours instead of 1000 hours, are both unlikely to increase costs by as much as 10%, since economies of scale may apply. Costs and benefits need to be carefully assessed, and some more advice on sampling can be found in Section 6.5.3. It is also important to document and report on the methodology (e.g., for surveys, include call-back protocols for telephone surveys, fieldwork rosters, refusal rates, fieldwork dates and times) and to include copies of all accompanying materials (e.g., focus group topic guides, questionnaires). This should include copies of campaign leaflets and publicity materials, such that the reader has access to a single, consolidated future reference source (survey results referring to public attitudes towards a particular poster, for example, are of little use several years later if the reader has no copy of the poster to refer to). External factors affecting the data collection period (such as the weather, and transport system strikes / failures) should also be recorded (see Section 2.3.3), as should actions taken on the data by the researchers (such as verification, cleaning and weighting - see Section 6.7). Careful recording of the issues described in the preceding two paragraphs will allow subsequent readers to make their own judgements on data quality and validity. 6.5 Notes on Data Collection
6.5.1 Interview methods Below four basic interview methods are discussed: face-to-face (personal), telephone, postal and web-assisted. All methods may benefit from the use of computers with specialist market research software (obviously required in the case of web-assisted interviews). Such software packages typically allow automatic routing through the questionnaire (skipping inappropriate questions), may rotate items in lists (to reduce order bias) and may range and logic check the data, at the time of data entry (see Section 6.7.1). For most approaches (except, usually, those relying on random intercept or opportunistic contacts, such as web-assisted interviews and on-street interviews), both pre-notification of the survey and call-backs or reminders should be considered, as should the possibilities for sending materials (such as copies of campaign posters) in advance. The extent to which audio and/or visual material may be used will vary according to the exact methodology: for example, both are well-suited to web-assisted interviews, both may be used with personal interviews at home or in “hall-based” situations (but probably not on-street) and neither are typically used with telephone surveys. Face-to-face (personal) (i) description The interviewer asks questions face-to-face with the interviewee. Personal interviews can take place in the home, at the workplace, at a shopping precinct, on street, outside a train station,

Revised Deliverable 3
Revised September 2003 79
in-vehicle, etc. Where the interview is computer based, it is referred to as a CAPI interview (computer-assisted personal interview). (ii) advantages - interviewee can see the interviewer, and build a rapport - ability to find the target population, e.g. people who use buses are more easily found
at a bus stop than by calling telephone numbers randomly - longer interviews are sometimes tolerated, particularly with in-home interviews
arranged in advance - may be more detailed/complex than other types, because of the extra time which may
be available, and the interviewer can make sure that the respondent understands the questions
- response rates often good due to effect (persuasion) of the interviewer (iii) disadvantages - usually cost more per interview than other methods; particularly true of in-home (at-
work) interviews, and longer interviews - quality of interview dependent on skills of interviewer - choose carefully - be aware of interviewer bias (e.g. a very trendy interviewer might get slightly more
liberal answers) - presence of others during interview (e.g. other family members, at home) may
influence answers - try to interview alone, usually (although beware of national rules for interviewing children)
(iv) notes • face-to-face interviews may not be advisable in certain socially-excluded areas, which
may bias the sample
• in-vehicle - easy way to sample bus/train/tram users - interview time / space might be very restricted (consider respondents making a short
journey on a crowded bus) - permission needed from transport operator
• at work - see also "Focus groups" (Technique 1) and "Professional stakeholders" (Technique 3)
• at home - see also "Panel surveys" (Technique 2) and "Travel diaries" (Technique 6)
• other locations - “hall-based” interviews Telephone (CATI) (i) description Surveying by telephone is one of the most popular interviewing methods in several countries, especially those where the telephone coverage rate is high. With the increase in use of the mobile phone, however, some younger people (in particular) may no longer have a fixed telephone in their home (and poorer people may not be able to afford one) and an increasing number of people use answer-phones to screen their calls. CATI is Computer-Assisted Telephone Interviewing - most large market research agencies offer this service.

Revised Deliverable 3
Revised September 2003 80
(ii) advantages - people can usually be contacted faster over the telephone than with other methods - it is possible to reach isolated areas at little / no extra cost - results available almost immediately if CATI used (iii) disadvantages - approach not well-tolerated in some countries due to confusion with marketing - the opening words of the interviewer are very important to get an interview - longer interviews difficult due to respondent tolerance / boredom - response rates may be poor / many calls needed to get one interview - may be difficult to get anybody at home during day, and people less likely to want to
be interviewed in the evening (be aware of national rules for times during which any calls should be made)
- sample bias due to those with no phone / not in (iv) notes Telephone surveys are often more expensive than postal surveys (although often with higher response rates) but cheaper than face-to-face surveys Postal (i) description This method is based on the usage of postal questionnaires. Postal interviews do not require an interviewer, so questionnaire design (see next Section) is particularly important. Questionnaires can be sent (mail-out, mail-back system) or given directly by hand to potential interviewees (drivers, pedestrians, etc. See O/D surveys, Technique 7). Reply-paid envelopes usually help with response rates, but may not be needed if questionnaires are sent to large workplaces, where respondents may just drop their response in the company mail. Small incentives / prizes may increase response rate, but interest / relevance of questions to the respondent is more important. (ii) advantages - allows respondents to have time to reflect on questions, although the number of
questions should be limited, to reduce burden - can reach isolated areas at little/no extra cost - mail surveys are among the least expensive techniques - can reach larger sample sizes without much increase in the cost (iii) disadvantages - often very low response rates (maybe as low as around 10%) - mail surveys take longer than other kinds: need to wait several weeks after mailing out
questionnaires - make sure a return-by date is clearly specified to encourage a quicker response
- no control over who completes the questionnaire - response bias may be high: response rates may be very low among those with poor
education / literacy, and higher among those with an interest in the subject (iv) notes

Revised Deliverable 3
Revised September 2003 81
May carry out a non-response survey to find out who did not answer, and why not. Extremely useful, but often very expensive (it is usually difficult to make contact with a representative sample of non-respondents) Web-assisted personal interview (WAPI) (i) description This technique uses the World Wide Web to reach the interviewees: Web-Assisted Personal Interviewing. Web surveys are rapidly gaining popularity - they have major speed and cost advantages, but also major sampling limitations. (ii) advantages - WAPI surveys are extremely fast. A questionnaire posted on a popular Website can
gather several thousand responses within a few hours. Many people who respond to an e-mail invitation to participate in a WAPI survey will do so the first day, and the majority will do so within a few days.
- there are practically no fieldwork costs involved once the set up has been completed - large samples cost little/no more than smaller ones - multimedia may be used - people may give longer answers to open-ended questions on WAPI questionnaires
than they do on other kinds of self-administered surveys (iii) disadvantages - sample bias (no capture of those without access to Internet): under-samples poorer
people, older people, and females - interviews may be incomplete (due to quitting/boredom or a technical fault) - depending on software, there may be no control over who replies - it is difficult to control people responding multiple times, therefore, those with a
particular interest in the subject may bias the results (iv) notes At this stage, it is advisable to use WAPI for surveys only when the target population consists entirely of Internet users, which surveys of the general population are not. Software selection is especially important. It is advisable to check that the survey software prevents people from answering more than one questionnaire.
6.5.2 Questionnaire design A questionnaire is a structured interface between the researcher, and the interviewees. It allows data collection to be standardised across many sites at one time (horizontal standardisation), and/or at one or many sites for repeat surveys, or 'waves', across a period of time (longitudinal standardisation). Methods and definitions should, where appropriate, be consistent with other / national surveys, to allow comparisons to be made, and to facilitate weighting (see Section 6.7.1). The main problems to be addressed in the design of a good questionnaire are clarity (making it clear to the interviewee exactly what is meant) and reducing bias (so the measure reflects the true situation, not a distorted view of it). Clarity of content, and clear instructions, are particularly important for self-completion questionnaires, where there is no interviewer there to help the respondent.

Revised Deliverable 3
Revised September 2003 82
Some factors to consider when designing a questionnaire are as follows: - keep it short, simple, and to the point - maintain the respondent's interest with 'bridging' statements (short explanatory links
between sections), positive feedback and short introductions where appropriate - the general tone should be friendly, although take care not to patronise (especially
with professional stakeholder interviewers) - make every effort not to ask 'leading' questions which will bias the response in one
way or another (this is very difficult to avoid completely) - a good introduction will encourage people to participate. Include any appropriate
information on confidentiality - 'screening' questions may be needed at the start (e.g. to exclude households with no
children, or without a car) - start with general, easier questions, if at all possible. Also, if feasible, put the most
important questions into the first half of the survey. (If a person gives up half way through, at least you have the most important information. However, the interviewee's right to stop the interview, and not to have their responses used must be respected, if they so request)
- leave sensitive / demographic questions (employment / income, education, age, sex
etc.) until the end of the questionnaire. By then the interviewer should have built a rapport with the interviewee that will allow more honest responses to any more personal questions
- remember that free-response questions (where the respondent is free to write in what
they want) are very useful, but very time consuming and expensive to process - don't leave big gaps for short answers: it might put people off writing anything at all
(but make sure there is enough space, too) - questions should be unambiguous: avoid jargon, acronyms, complicated words, vague
words and technical terms. If special terms have to be used, make sure they are clearly defined to avoid confusion
- ask yourself what you will do with the information from each question. If you cannot
give yourself a satisfactory answer, leave it out. Avoid the temptation to add a few more questions just because you are doing a questionnaire anyway
- 'closed' questions (with a pre-determined list of responses) are quicker for
interviewees to answer, and cheaper to process. Make sure all alternatives are covered, however (see following points)
- allow “Don't know” or "No experience" or “Not applicable” responses, if they are
appropriate

Revised Deliverable 3
Revised September 2003 83
- include "none" and "other" categories where appropriate - but bear in mind the latter
will be expensive to code later if the respondent is asked to specify detail - questionnaire lay-out is very important. As far as possible it should be appealing / easy
to complete (especially important for self-completion questionnaires). Any instructions on routings (which questions to answer) should be clear.
- bear in mind data entry implications. Pre-coding (numbering responses) and
questionnaires which are easy to read after they are completed (by data entry staff) may very significantly reduce data entry costs
- finally, it is difficult to think of everything! Always test ('pilot') the questionnaire
before you start the fieldwork for real – preferably among people as similar to the target sample as possible.
Additional information on questionnaire design can be found at the following site: http://www.surveysystem.com/sdesign.htm
6.5.3 Sampling Who to sample Identifying the target population may require considerable thought. Are existing bus users, or all potential bus users being targeted? What is the geographical scope of interest - a well-defined area of a town or city, the whole town or city, or an entire urban or rural area? How will the area be defined, by postcode? Is there an appropriate list (sampling frame) of the entire target population? - Who might be missing from such a list, such as telephone books, or electoral registers? Make sure the target population will be appropriately sampled at the times chosen to sample (see below). Sampling the same people 'before' and 'after', produces a matched sample. Sampling different people 'before' and 'after' produces independent samples (see Section 6.7.2). How many to sample It is unlikely that there will be sufficient budget to sample the entire target population (i.e. take a census), so a sample will have to be taken. It is usually important to take a sample which is representative of the target population. Larger samples are more likely to be more representative, although the rates of improvement in the precision decrease as the sample size increases. It is important to be aware of the types of analysis to be carried out, and on which groups. For example, a random sample of 100 people may not have enough young males if this group needs to be broken down further. As a rough rule, there needs to be about 30 in each particular sub-category under consideration (e.g. females under 25). An example of how such calculations can be done in practice is given in Figure 6.2 (related to Figure 6.3 on the next page).
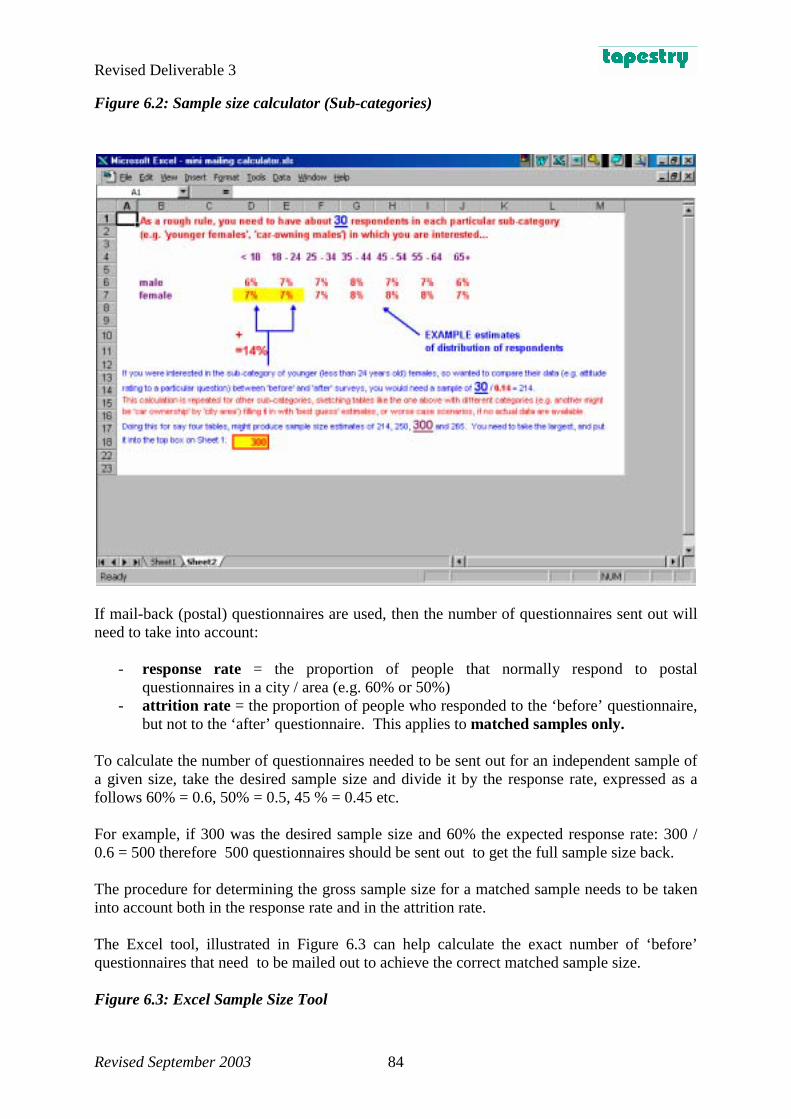
Revised Deliverable 3
Revised September 2003 84
Figure 6.2: Sample size calculator (Sub-categories)
If mail-back (postal) questionnaires are used, then the number of questionnaires sent out will need to take into account:
- response rate = the proportion of people that normally respond to postal questionnaires in a city / area (e.g. 60% or 50%)
- attrition rate = the proportion of people who responded to the ‘before’ questionnaire, but not to the ‘after’ questionnaire. This applies to matched samples only.
To calculate the number of questionnaires needed to be sent out for an independent sample of a given size, take the desired sample size and divide it by the response rate, expressed as a follows 60% = 0.6, 50% = 0.5, 45 % = 0.45 etc. For example, if 300 was the desired sample size and 60% the expected response rate: 300 / 0.6 = 500 therefore 500 questionnaires should be sent out to get the full sample size back. The procedure for determining the gross sample size for a matched sample needs to be taken into account both in the response rate and in the attrition rate. The Excel tool, illustrated in Figure 6.3 can help calculate the exact number of ‘before’ questionnaires that need to be mailed out to achieve the correct matched sample size. Figure 6.3: Excel Sample Size Tool

Revised Deliverable 3
Revised September 2003 85
The following site also has a user-friendly sample size calculator: http://www.surveysystem.com/sscalc.htm How to sample After deciding the sample size, the respondents should be selected. Put simply, to do this, either a randomised sampling protocol (system) can be adopted to produce a 'probability sample' (which actually means selection procedures are statistically randomised) or a 'nonprobability sample', should be established, e.g. by use of quotas (specifying that certain numbers of different types of people in various sub-groups are needed - see comments above). If the survey is to accurately reflect the target population's opinions, the percentages of older and younger people in the sample must be ensured, for example, to reflect their percentages in the target population (see Section 6.7.1 for what to do if they do not). Common sampling methods which may incorporate random sampling protocols are stratified sampling and cluster sampling. In the stratified method, the population is divided into subgroups, or strata (e.g. by income), that must be mutually exclusive and exhaustive. In other words, each person can only be allocated to one stratum, and no person can be omitted. The sample is then randomly drawn within each stratum. This method is well adapted when the subgroups of the population to be

Revised Deliverable 3
Revised September 2003 86
studied vary considerably. It is statistically advantageous to sample each stratum independently. In the cluster method the population is also divided into subgroups, here called clusters, which are also mutually exclusive and exhaustive. The sample is then randomly drawn from the clusters. This means that either all members of a cluster can be included in the sample, only a part of them, or none. In practical terms, the cluster method is very well adapted in situations where the population is geographically dispersed. This means that better fieldwork economies may be achieved by including several respondents within a local area. Therefore, the main distinction between the two methods is that in cluster sampling only a sample of subgroups (clusters) is chosen, whereas in stratified sampling all the subgroups (strata) are selected for further sampling. In addition, the objectives are also different, the cluster sampling intends to increase the sampling efficiency by reducing the costs, whereas the stratified sampling is designed to increase statistical precision. Nonprobability samples include: quota samples chosen to ensure representativeness of the target population.
Need to ensure target data are recent and easy to classify for sampling purposes
convenience samples based on the convenience of the sampler / interviewer; might
use for cheaply pre-testing a questionnaire (but beware of lack of representativeness)
judgement samples based on (expert) judgement (e.g. which schools to sample)
rather than random selection. May be good for selecting relatively small samples (where random selection might not be effective), but poorer approach for larger samples
purposive samples chosen intentionally not to represent the general population, but
to oversample bus users, or people with very low incomes, for example
The main differences between probability and nonprobability samples are that probability samples usually: - cost more - take longer to collect but - allow (better) weighting and projectable totals (see next Section) - allow statistical tests to be carried out on the data - produce relatively low bias Note, however, that whilst a probability sample is more likely to be representative, this cannot be guaranteed, although the chances do improve with sample size. When to sample

Revised Deliverable 3
Revised September 2003 87
Key issues relating to any sampling scheme are when to sample, and how long to sample for. It is clearly important that before surveys are carried out strictly before any campaign activities have commenced, and that the before survey represents, as far as possible (and appropriate), (a) neutral day(s) or week (e.g. not just before, after or including local or national holidays which may influence travel behaviour). The after survey also needs to be conducted at an appropriate time, preferably another neutral period soon after all campaign activities have ceased, and have had time to take effect, but not so long after as to be too diluted. This is preferably at the same time of year as the before survey, to avoid seasonal variations (e.g. in Northern Europe, cycling is more popular in summer than winter, so survey periods need to be matched to measure real differences in behaviour). Sampling duration is likely to be determined primarily by budget, but should cover as representative a period as possible, according to the objectives of the campaign. The shorter the sampling duration, the more the results might be affected by external factors (such as poor weather, or a local strike). At the finer level, consider also the time of day when samples are taken. An example is when to choose to perform a home interview (telephone or face-to-face). Carrying out all fieldwork during the middle of the day means that there will be a non-working bias in the sample, since most of the people that are at home during the daytime do not work. Therefore, the sample does not reflect the working population. When studying transport issues, it should not be forgotten that during the week there are significant differences, as there are during the day and during the year. For example, Mondays and Fridays are often atypical days, because of their proximity to weekends. In the processes involving counting (vehicles, passengers, noise, pollution) it is advisable to characterise the type of flow / emissions on both a daily and weekly basis, where possible, to avoid any shorter-term bias. It is recommended that O/D surveys and related counts should at least cover the main working period of the transport system (typically from 0600 to 2200), and should be made on two different weekdays, where possible. Tuesday, is often good as a low average demand day; Friday, as a high average demand day. If required, surveys can also be carried out on Saturdays or Sundays, as travel patterns are likely to be very different to weekdays. However, this of course has huge cost implications. On the other hand, if a travel diary technique is chosen, it should not be forgotten that if one of the aims is to evaluate variation of daily behaviour, a single day travel diary will not provide the required breadth of data.

Revised Deliverable 3
Revised September 2003 88
6.6 Data Collection Techniques
Here we describe seven commonly used survey techniques, involving the use of some form of questionnaire: • Focus groups • Panel surveys • Professional stakeholder survey • Attitudinal surveys • Stated preference (conjoint) surveys • Travel diaries • O/D surveys. 6.6.1 Survey methods Technique 1: Focus groups
Description
Focus groups are in-depth discussions held with a relatively small group of participants, usually led by a trained 'moderator'. The discussion typically follows a topic guide, but is usually relatively open in scope. Location is important, as it is essential to create a relaxed atmosphere that encourages good group dynamics. The interviews are usually recorded (video or audio-tape). Typically, a focus group includes 8 to 12 interviewees. Groups with less than 8 are unlikely to generate the necessary group dynamics; groups with more than 12 generate too much “noise” and are difficult to conduct.
When to use - To gain impressions on (new) products, services or situations - To generate ideas that can be further tested in quantitative terms - To generate useful information in structuring questionnaires - To provide background information and new insights on issues
Related tools Often associated with more quantitative survey methods (before and/or after the focus group, to quantify the findings).
How to do it
- Specify the objectives of the focus group (questions to be answered) - Select and prepare the moderator and the site - Carefully select potential participants (usually recruit 10-12 for 8 to show) - Conduct the focus group interview (usually 90 - 120 minutes); use of supporting materials (e.g. show cards, posters) often made - Review the tapes (if recorded - may be very time consuming) - Summarise the findings
Advantages - New ideas frequently obtained from a free flowing group discussion - More spontaneous and less conventional than many other techniques - Posterior analysis of the sessions may be possible (with recordings) - Interviews several people at once: synergies of group dynamics
Disadvantages - Difficult to moderate (need somebody with experience) - Susceptible to moderator's bias - Not representative: scooping in nature, cannot be generalised - Resulting data may be conflicting (small samples)
Lower budget options
Possible to conduct a 'mini' focus group with only four of five participants, but group dynamics not usually as good
Notes
- When interviewing members of professional groups (e.g. local authority members), it is of particular importance that the moderator has a good level of understanding of the topic. - Conversely, when holding groups with the general public, it is important that the moderator's knowledge does not constrain or dominate the group discussion
Further information
Section 6.5.1 - Interview methods Section 6.5.2 - Questionnaire design Section 6.5.3 - Sampling

Revised Deliverable 3
Revised September 2003 89
Technique 2: Panel surveys
Description
A panel consists of a group of respondents, typically sampled within a specific market (e.g. bus users) or area (e.g. outer city area), that agree to give information at certain intervals over an extended period of time. The panel members may be compensated for their participation, either with cash or with other incentives. Panel members are usually presented with several 'waves' (repeats) of a questionnaire at different times of the case study evolution, assessing changes in their behaviour. The data forms matched samples (see Section 6.7.2).
When to use Panel surveys can be a useful technique when we want to analyse and evaluate the evolution of group behaviour over time, in reaction to specific changes (such as a campaign implementation). Individual and group changes may be studied.
Related tools Panel members may also be asked to complete travel diaries, and/or participate in focus groups (see under 'Disadvantages', however)
How to do it
- Once the panel has been set up, any method of data collection can be used: face-to-face, telephone (if all have a telephone), or postal - A control panel may be established, not exposed to the change or effect being monitored (such as a campaign) - A sample should be chosen which is representative of the target population
Advantages - Allows very powerful tracking of group (and individual) attitudes and behaviour, as a function of changes / responses to external conditions
Disadvantages
- Response rates tend to go down, and/or people may drop out (attrition) if the panel members have been inundated with requests to collaborate in research, if the researcher demands too much time from them (burdening), or if they are disillusioned (for example, if they have been in the panel for a couple of years and they have not seen any changes (improvements) emerging from the findings of the research) - May get biased / strategic answers from disillusioned panel members, or those who become sensitised to / more aware of the issues being studied - Smaller samples (especially) may be non-representative of the target population
Lower budget options
- The sample size can be reduced, with the risk of increasing sample bias - Number of survey waves can be reduced (need a minimum of two)
Notes Panel needs to be quite big to start with, to allow for attrition, and may need topping up with new members (although this complicates the analyses and is best avoided). Attrition tends to be most common in young people, the elderly and in minority groups.
Further information
Section 6.5.1 – Interview methods Section 6.5.2 – Questionnaire design Section 6.5.3 – Sampling Section 6.7.1 – Data verification, cleaning and weighting Section 6.7.2 – Data analysis

Revised Deliverable 3
Revised September 2003 90
Technique 3: Professional stakeholders' survey
Description A professional stakeholder interview is an in-depth interview on a specific topic with a professional (such as a bus company director, local authority leader) aimed at gaining insight into the expert viewpoint and understanding influential opinion relating to the campaign (for example).
When to use When the goal is to learn about key persons' opinions, their perceptions of the planning or development process, and the political setting. Results may be used to help a campaign's development, by understanding higher level perceptions and behaviour.
Related tools May draw on focus group techniques and attitudinal survey techniques
How to do it - Should begin early in the research process to give the research team insights into the issues and concerns to be addressed - Interview should preferably take place in person's own environment, so they can be more comfortable: face-to-face interview recommended
Advantages - Informal setting may reveal details not readily disclosed in public - Can generate useful extra contacts with other professional stakeholders - It is a relatively cheap way of gathering important data
Disadvantages - Relies heavily on skill and knowledge of interviewer, and interviewee - Bias of limited sample - include those with opposing viewpoints
Lower budget options Fewer / shorter interviews
Notes - Special attention needs to be paid to the selection and identification of the interviewees: care to select appropriate stakeholders with suitable knowledge - Scope of interviewees should be as broad as possible: authorities, operators, group representatives, customers (users) and non-customers
Further information
Section 6.5.1 – Interview methods Section 6.5.2 – Questionnaire design Section 6.5.3 – Sampling & www.fhwa.dot.gov/reports/pittd/keypers.htm (produced by the United States Department of Transportation - Federal Highway Administration)

Revised Deliverable 3
Revised September 2003 91
Technique 4: Attitudinal surveys
Description Surveys designed to collect data on people's attitudes (including broader issues such as beliefs and awareness), rather than behavioural information (e.g. travel diaries and O/D surveys, techniques 6 and 7). Usually take the form of a printed questionnaire, and used for quantitative purposes (with a medium – large sample).
When to use
Particularly useful when you wish to quantify attitudes to new products and services, and to track changes over a period of time (e.g. before and after a campaign).
Often, qualitative research is carried out first (typically focus groups) to fully ascertain what the appropriate issues are, before using an attitudinal survey to then quantify particular aspects raised in the focus group (for example).
Related tools
Attitudinal surveys often include behavioural questions (e.g. on travel behaviour) and usually include basic classificatory questions (socio-demographic data, e.g. age & sex) on the same questionnaire for the purposes of cross-tabulation. It is then possible to draw conclusions such as 'younger males were less likely to switch to travel by bus because it had a poor image in their peer group'.
Conversely, attitudinal questions may form part of a survey collecting other information, e.g. incorporated into a travel diary or O/D survey. A questionnaire collecting purely attitudinal data or purely behavioural data is not likely to be particularly useful.
When attitudinal questions are incorporated into a panel survey, individual changes may be tracked (rather than aggregate changes in the population as a whole).
How to do it
Questions typically offer a statement, then ask for agreement on a 5-point scale: agree strongly agree neither agree nor disagree disagree disagree strongly (Likert scale)
Avoid pressure bias – forcing people to offer opinions on matters about which they truly have no information or experience. Such forced responses are practically impossible to identify, and corrupt the data. Allow a 'No experience / no opinion' option, where appropriate.
Take care regarding coding schemes (e.g. remove 6s for 'No experience / no opinion' before analysing; avoid 0s for missing data) and choose methods of analysis carefully (need to use appropriate statistical tests - see Section 6.7.2).
Take care in the questionnaire design to avoid bias and political responses (people guess when this is happening, and may tell lies to achieve their own objectives) – see Section 6.5.2.
Advantages
- Offers opportunities for very powerful cross-tabulations with other questions, to establish relationships amongst those surveyed (e.g. why young males have poorer attitudes towards bus travel) - Using standardised questions allows tracking of changes in attitudes over period of time, whereby changes are attributable to changes in people's attitudes toward a product or service, and not to the nature of the question asked - Allows quantification of attitudes, c.f. findings of focus groups often more difficult to use to justify action, due to lack of substantiation and dependency on small samples
Disadvantages
- Overly rigid / closed structure may miss unexpected / unanticipated views and opinions (therefore need to include free-response options on questionnaire, too) - Particular care needed in the sampling and type of statistical tests applied, in order to draw valid conclusions about the results - Results may be very dependent on small nuances and shades of meaning in the text offered to the respondent, which must not be ambiguous or leading, e.g. "I like buses because they are good for the environment" - Response bias and lack of respondent compliance (not answering the questions properly / honestly) are difficult to monitor
Lower budget - Reduce the number of items on the questionnaire

Revised Deliverable 3
Revised September 2003 92
options - Reduce the sample size (but careful regarding loss of representativeness) - Carry out a joint survey with third party and share costs
Notes
Further information
Section 6.5.1 - Interview methods Section 6.5.2 - Questionnaire design Section 6.5.3 – Sampling Section 6.7.1 - Data verification, cleaning and weighting Section 6.7.2 - Data analysis

Revised Deliverable 3
Revised September 2003 93
Technique 5: Stated preference (conjoint) surveys
Description
A type of survey used to predict behaviour and/or measure preference weightings based on a set of realistic trade-offs offered to the respondent, based on current / likely information about the (transport) system in question. Although called 'stated preference' in the transport world, usually called conjoint analysis elsewhere. Often carried out using laptops, and requires relative specialist skills for design and analysis.
When to use In the transport world, this technique is usually used to analyse the future attitudes of a target group regarding a real or hypothetical (but feasible) change to the conditions affecting them, e.g. to estimate the potential modal shift from private to public transport due to a new underground line / extension.
Related tools The trade-offs presented to respondents may be designed on the basis of attitudinal surveys, and/or cross-checked against these
How to do it
- Identify the population group or groups to interview - Careful identification of each variable (e.g. price of ticket, frequency of train), & number of variation levels (typically five), and its independence from the other variables (this design process requires specialist skills) - Personal interview
Advantages - It is a well proven method for forecasting transport demand & preference weightings (e.g. price versus service level)
Disadvantages - Slow and relatively complex design, data acquisition, and analysis
Lower budget options
- Reduce number of variables studied, and/or sample size
Notes
- Need to offer people realistic alternatives in their trade-offs, based on their actual experiences, if possible - Advisable to include checks to counteract strategic answering - If the number of questions asked per interviewee is too high, the questionnaire can be divided into two or more samples, to prevent burdening. Maintaining a group of common questions to all individuals, and varying a number of specific questions from group to group can do this.
Further information
Section 6.5.1 - Interview methods Section 6.5.2 - Questionnaire design Section 6.5.3 - Sampling Section 6.7.1 - Data verification, cleaning and weighting

Revised Deliverable 3
Revised September 2003 94
Technique 6: Travel diaries Description The travel diary is a type of survey that collects a record of the respondent's travel
activities over a certain period of time.
When to use
- The purpose of the travel diary is to have respondents write down each place they went to as they proceeded through the day, in order to obtain a more complete description of travel behaviour and better reporting of trip characteristics, such as time of day the trip started, the trip duration, trip distance, etc. - In some countries, travel diaries are one of the most effective methods to capture full reporting of personal travel
Related tools O/D surveys – see technique 7 (& may form part of panel survey)
How to do it
After a previous household interview to collect some socio-demographic data, a packet of survey materials is mailed to each household (a travel diary for each appropriate household member; plus instructions for filling out the travel diary, including a sample diary). Researcher visits may be necessary to avoid a decrease in participants' co-operation. Alternative methods include a diary sent to a household and then sent back by post (e.g. Socialdata “KONTIV” design) or asking respondents about all the journeys they made on one day (one-day retrospective recall) either by telephone or face to face, with interviewer completion.
Advantages - May provide quite accurate reports, particularly for incidental trips, such as stopping at a convenience shop, or short walking trips, which are the most difficult to capture through other types of (less detailed) survey - Enables the evaluation of individual / group behaviour over time
Disadvantages
- Loss of respondent motivation can occur due to boredom (which may increase with the survey period) leading to biases (typically, the number of recorded trips diminishes over time) - Expensive, especially with larger samples - May require a considerable number of interviewers to help with compliance - Short walks are sometimes neglected: ensure instructions emphasise need to record these
Lower budget options
Use of simpler questions instead of full diary option
Further information
Section 6.5.1 - Interview methods Section 6.5.2 - Questionnaire design Section 6.5.3 - Sampling Section 6.7.1 - Data verification, cleaning and weighting Section 6.7.2 - Data analysis

Revised Deliverable 3
Revised September 2003 95
Technique 7: O/D surveys
Description
Origin/destination surveys occupy a somewhat grey area between pure surveys and pure counts, and may draw on both techniques. An O/D survey could range from a relatively simple count of vehicles along a given stretch of road, with an associated measure or estimate (see below) of vehicles' origins and destinations, or it could be combined with personal interviews of those travelling, providing information on the trips made, including modes used, trip purposes, hours, trip duration etc; traveller characteristics, such as age, sex, occupation etc; and household characteristics, such as number and age of other household members, cars available, etc..
When to use
They have various applications at different levels: - Global level: e.g. urban traffic circulation planning - Local level: e.g. restructuring a complex crossroads Campaign assessment could be undertaken at either, or both, levels
Related tools Related to travel diaries, and several count methods (see section 6.6.2)
How to do it
Section and cordon counts - A section count comprises a count of vehicles on a certain road section - A cordon survey count is based on registering all vehicles that enter or exit a certain area, and it is recommended for small or well-controlled areas only these may be applied using the following techniques: (i) methods which do not require stopping the vehicle (more practical in small or well-controlled areas) - licence plate recording recording licence plate numbers, time, and vehicle direction at given points; may be difficult to manage, testing of fieldwork strongly recommended - headlamp method drivers are asked to turn on their headlights until they reach the end of their journey / survey exit point; relies on driver co-operation; cannot be used at night; cannot be used in Scandinavia (where drivers must all use headlights during the day) & must exclude Volvos (headlamps are always on) - labelling method labelling vehicles with removable stickers. Vehicles are labelled at the origin / entry point and the labels removed at the destination / exit point, e.g. using different coloured labels at each labelling point. May require stopping the vehicle twice, and be difficult to manage (ii) methods which require stopping the vehicle Selected vehicles are stopped, and a very brief personal interview is carried out in situ, or is arranged for a later time (e.g. by telephone). Alternatively, a self-completion questionnaire may be handed to the driver. Subsequent survey could include non-trip (e.g. attitudinal) questions as well - a very useful combination. Although this requires careful consideration of the point at which the driver is stopped, this may provide more accurate information than the methods described in (i), where levels of 'leakage' (missing information) may be high. Again, fieldwork testing highly recommended.
Advantages - May provide detailed information regarding travel behaviour, possibly combined with attitudinal data: a powerful combination of techniques

Revised Deliverable 3
Revised September 2003 96
Disadvantages - Can be a very expensive - Can be very time consuming - Local authority permission needed to stop / intercept vehicles - Possible hazards of intercepting vehicles
Lower budget options
Reduction of the sample, for example: - counting only a specific colour of cars - counting only a specific category of vehicles - selecting only one in twenty vehicles, instead of one in ten, etc.
Further information
Section 6.5.3 – Sampling Section 6.7.1 – Data verification, cleaning and weighting Section 6.7.2 – Data analysis

Revised Deliverable 3
Revised September 2003 97
6.6.2 Count methods Eight types of ‘count’ methods are summarised here covering: • Traffic flow • Speed measurement • Parking • Cycling • Pedestrians • Public transport occupancy • Air quality • Noise Technique 8: Traffic flow counts
Description
Used for assessing vehicle flows along a certain road, or in/out/through a certain 'cordon' area. Basically two types of count: - MCCs (Manual Classified Counts) recorded by people: using recording sheets and pens, or clickers (manual counters) or electronic recorders; identifies different vehicle types - ATCs (Automatic Traffic Counts) recorded by machines: pneumatic tubes, piezoelectric counters or induction loops; gives total vehicle counts MCCs also useful for counting flows along a given routing (e.g. turning left at particular junction)
When to use
Check that local or national data are not available from the relevant national or local authority first.
Consider particular advantages of ATCs versus MCCs (below) before deciding on best method (MCCs probably better for most campaigns , since ATCs often cannot identify/differentiate pedal cycles and motorbikes, omit pedestrians and ignore (public transport) occupancy [see also Technique 13]).
Timing and length of monitoring are very important – careful consideration required of period / flows trying to represent: ensure measurements made at appropriate times of the day, days of week, weeks of year. Are 'neutral' days required or seasonal / peak flows? (See reference under 'Further information' for more details of sampling, weighting & grossing up).
Ensure 'before' and 'after' counts are taken at comparable times.
Related tools Synergies and interesting comparisons may be drawn with O/D surveys and travel diaries, plus most other counts, especially those with known / expected associations (e.g. comparing traffic counts along a road leading to a hospital with parking counts at the hospital).
How to do it
Ensure careful selection of site (don't just choose a convenient one!) and consider bias effects of local traffic conditions (e.g. local traffic calming)
Test the site & method before committing resources
Careful to differentiate between: - vehicle counts (using this technique) - vehicle kilometres (e.g. generated by an O/D survey - passenger kilometres or travel diary)
Advantages
General – more accurate and comprehensive than relying on reported behaviour through surveys alone
ATCs – good for collecting data over longer periods and during unsociable hours
MCCs – better at differentiating between vehicle types & can include pedestrians and vehicle occupancy counts; cheaper over shorter periods; less prone to technical problems and losses of recording than ATCs

Revised Deliverable 3
Revised September 2003 98
Disadvantages
General – counts alone may not be useful in absence of other supporting data; particularly susceptible to external factors (such as road accidents) – more susceptible, the shorter the counting period; difficult to avoid 'leaks' in/out/through a cordon, e.g. through minor roads not monitored ATCs – generally not good at detecting low speed flows (so avoid use at junctions, bends and steep gradients); pneumatic tubes cheaper to install but less reliable than other types; often not good at differentiation between similar vehicle types and may miss pedal cycles; may undercount due to simultaneous passing of vehicles MCCs – clickers and electronic recorders need experienced operators; experience has shown that it is difficult for one person to carry out observational counts on their own - better to work in pairs
Lower budget options
- MCCs are usually cheaper than ATCs - use fewer sampling points (but careful regarding loss of representativeness)
Notes Caution! Will vehicle counts alone be useful in the assessment process? Consider requirement for associated O/D data and ability to correlate with campaign factors
Further information
www.clip.gov.uk/groups/transport/trafflev.pdf Produced by the UK Department of the Environment, Transport and the Regions (now Department for Transport)– used extensively in compiling above notes (8 pages) Section 6.5.3 - Sampling Section 6.7.1 - Data verification, cleaning and weighting

Revised Deliverable 3
Revised September 2003 99
Technique 9: Speed measurement methods
Description
Average traffic speeds are deduced from sample measurements taken at carefully chosen times and locations. There are two commonly use definitions of speed:
- Space mean speed: the average of the speeds of vehicles in a typical length of road at a particular instance
- Time mean speed: the average of the speeds of vehicles passing a typical point in the road over a particular period of time.
When to use When the traffic flow average speed on a certain section of road, and/or along a given corridor needs to be identified
Related tools May be combined with traffic flow counts
How to do it
(i) manual methods - "with traffic flow" method Observer joins the traffic flow, trying to maintain an average speed close to the traffic average speed, covering a previously selected distance, and registering the time at the start and end point. Simple, but may need many observers. - section count sample measurement After choosing two points with a known distance between them, a chosen sample of vehicles is timed between two points. - mobile observer / floating vehicle method With this method, the whole traffic flow is defined. A vehicle is included in the traffic flow, making a registration of its own speed, total time, number of vehicles that overtake it, and number vehicles that it overtakes. Requires sophisticated recording equipment and analysis (ii) automatic methods - Electrical devices similar to those described for traffic flow counts, but set to measure speed - Optical Character Recognition with video support: automatic licence plate recording, registering the time each vehicle takes between two points. Requires specific software (expensive), may miss vehicles hidden by others from camera
Advantages - May provide very accurate data over longer periods of time (especially if automatic methods used)
Disadvantages - May be very expensive (especially if automatic methods used) - May be difficult / time consuming to manage manual methods
Lower budget options
Reduce number of vehicles / times sampled (but data then more prone to bias)
Notes Careful consideration of cost / time implications of method chosen is suggested
Further information
Section 6.5.3 - Sampling Section 6.7.1 - Data verification, cleaning and weighting

Revised Deliverable 3
Revised September 2003 100
Technique 10: Parking counts
Description
Counting: - Number of parking spaces (differentiating between public free/paid and private / private reserved) - Occupation (& time) of the parking spots: legal and illegal - Possible inclusion of vehicle occupation Evaluation of: - Parking turnover - Supply / demand ratio - Illegal parking
When to use For evaluation of public parking (e.g. in town) or at private workplaces (e.g. offices)
Related tools May be compared with other counts described in this section, and/or results of travel diaries & O/D surveys, and/or reported behaviour from other interviews; and/or interviews combined with the actual parking count.
How to do it
Usually by 'patrols' (interviewers walking around pre-determined areas) at repeated intervals during the day, recording parking information on carefully designed forms May, however, record parking behaviour using video equipment, or obtain simple occupancy counts from public car park operators (if these are kept and operator is willing to make available)
Advantages - Rapid collection of large amounts of data
Disadvantages - May be labour intensive, needing good management - Analysis of video data can be time consuming - Data entry / analysis of final data also time consuming
Lower budget options
Reduce sampling periods / area (but associated bias likely to increase)
Notes
- Information required should be clearly specified at outset: take care that sample sizes are neither too large, nor too small, for required purpose - Reliability of the data should be checked, to prevent corrupted samples: fieldwork may need close supervision to avoid false / inaccurate recording (especially at anti-social hours, where patrol staff /interviewers may not turn up)
Further information
Section 6.5.3 - Sampling Section 6.7.1 - Data verification, cleaning and weighting

Revised Deliverable 3
Revised September 2003 101
Technique 11: Cycling counts Description
Similar to / part of broader traffic counts, used for monitoring cycle use.
When to use - Check that local or national data are not available from the national or local authority first. Can survey needs be extended / combined with existing counts?
Related tools
It is suggested that: - Technique 7 (O/D surveys) - Technique 8 (traffic flow counts) - Technique 10 (parking counts) are also referred to for appropriate information and ideas which may be transferred to monitoring cycle use.
How to do it
- For campaign assessment purposes, MCCs (see Technique 8) are probably best. Special care should be taken to select a suitable sample size if the results are to represent overall cycling levels for the selected target population. - Another useful way to obtain data on the cycle use is by counting parked cycles at transport interchanges, schools, places of work etc. - A more informative / comprehensive method to obtain cycling behaviour information will be to also interview those actually cycling. Ensure careful selection of site (don't just choose a convenient one!). If an ATC is chosen, please take into consideration that some ATCs are not capable of counting cyclists travelling slowly (avoid uphill gradients, bends and junctions). Test the site & method before committing resources Careful to differentiate between: - cycle counts (using this technique) - cycle kilometres (e.g. generated by an O/D survey - passenger kilometres or travel diary)
Advantages - relatively easy/cheap to carry out with manual counts
Disadvantages
- take care regarding 'leakage': carry out observations of the counting spots in order to identify situations where the cyclists use the pavement (etc) to avoid the traffic flow (all cyclists must be counted) - will counts alone be useful in the assessment process? Consider requirement for associated O/D data and ability to correlate with campaign factors - flows may be strongly affected by the weather (be sure to record it)
Lower budget options
Check where existing traffic counts are being made: it may possible to include cycle counting, whether the counts are performed by ATCs or MCCs. In the latter case, the cost increase will certainly be marginal.
Further information
Section 6.5.3 – Sampling Section 6.7.1 - Data verification, cleaning and weighting

Revised Deliverable 3
Revised September 2003 102
Technique 12: Pedestrian counts Description Pedestrian counts are used to evaluate the importance of walking as a way of travel per
se, and/or as a part of other trips using other forms of travel.
When to use
- Check that local or national data are not available from the national or local authority first. Can survey needs be extended / combined with existing counts? - Since most walk journeys are for utility reasons, the number of walk journeys per month does not vary greatly - unlike cycling - although school holidays influence walking patterns
Related tools Technique 7 (O/D surveys) & reported behaviour from personal interviews / travel diaries
How to do it
(i) manual counts Manual counts are the traditional method for counting pedestrians. Other information can also be recorded, such as gender, approximate age, walking impairment and luggage. (ii) automatic count methods The use of automatic methods for monitoring pedestrian activity is currently very limited for non-commercial purposes. - Video imaging Walking activity can be captured by video camera and the data processed automatically (or manually). This may be more cost effective where prolonged monitoring is required. - Infra-red beams Infra-red beams can be used to count pedestrians. The equipment is generally cheaper than video imaging but less flexible, and good only for very low flows - Piezoelectric pressure mats Piezoelectric pressure mats have been used to count pedestrians and cyclists on some off-road paths. More recently, they have been used to count boarding and alighting passengers in public transport.
Advantages
- manual counts are often easy and cheap to undertake - automatic counts may be cost effective where prolonged monitoring is required - possible to record additional details such as gender, age, and where people are carrying luggage or have obvious difficulties with walking - often easier to count and intercept people compared to other observational methods, also more likely they will agree to a short interview
Disadvantages - daily pedestrian flows may be strongly affected by the weather (be sure to record it) - pedestrian flows at any one location are likely to show more variety from day to day than flows of motor vehicles. One-day counts are unlikely to form a statistically reliable sample
Lower budget options
Reduce sampling periods / area (but associated bias likely to increase)
Notes
- it is likely that leisure walking is more strongly affected by weather conditions than walking for utility purposes - since pedestrian journeys are usually very short, the choice of any cordon is more critical than it would be for surveys of motor vehicles. The cordons used to monitor vehicles may be inappropriate for surveying pedestrians.
Further information
Section 6.5.3 - Sampling Section 6.7.1 - Data verification, cleaning and weighting

Revised Deliverable 3
Revised September 2003 103
Technique 13: Public transport occupancy counts Description Monitoring bus and tram use can be achieved at relatively low costs using passenger
counts on public transport along a certain section of road, or corridor When to use Especially useful when official (operator) counts of passengers are not taken or not
made available by the operators to third parties
Related tools Synergies and interesting comparisons may be drawn with O/D surveys and travel diaries, plus most other counts, especially those with known / expected associations (e.g. comparing actual occupancies on a given route with reported PT use on the same route).
How to do it
Firstly, identify all the possible types of vehicles circulating in the section under study in order to give the best preparation possible to the observers. Locate an observer in a spot with good visibility for the passing traffic: preferably, the observation should be made near stops or traffic light signals - sections where vehicles normally travel more slowly Normally, three (or possibly four) levels of occupancy estimate are sufficient: - High (more than 90% of nominal capacity) - Medium (35% to 90% of nominal capacity) - Low (less than 35% of nominal capacity) If the corridor/section is very busy, it is best to have two-observer teams
Advantages - A low budget solution that usually generates quite reliable results - Very easy to implement
Disadvantages - Not as reliable as most operator counts
Lower budget options
Reduce sampling periods / area (but associated bias likely to increase)
Notes - may be combined with boarding / alighting counts at stops and termini
Further information
Section 6.5.3 - Sampling Section 6.7.1 - Data verification, cleaning and weighting Section 6.7.2 - Data analysis

Revised Deliverable 3
Revised September 2003 104
Technique 14: Air quality
Description Air quality can be measured objectively by different techniques, from relatively simple chemical and physical methods, through to more sophisticated spectroscopic techniques. Subjective measurement requires attitudinal surveys.
When to use
In passive sampling methods, a physical process such as diffusion controls the flow of air. In these methods, diffusion tubes are used as passive samplers, containing chemical reactants to 'capture' pollutants. These tubes are manually distributed and collected, and are analysed afterwards in a laboratory. Use when results are not required particularly quickly. Available tubes / methods may only capture nitrogen dioxide and benzene. In active sampling methods, active physical or chemical methods are used to collect polluted air (rather than simple diffusion). Typically, a known volume of air is pumped through a collector (such as a filter, or a chemical solution) for a known period. The collector is later removed for analysis. Use when results are not required particularly quickly. Automatic methods produce high-resolution measurements of hourly pollutant concentrations or better, at a single point. Pollutants analysed include ozone, nitrogen oxides, sulphur dioxide, carbon monoxide and particulates. Automatic sampling involves analyses using a variety of methods, including spectroscopy. May yield (near) real-time values.
Related tools Some similarities with noise measurements (see Technique 15). Perceptions / actual effects on people may only be ascertained through attitudinal surveys (see Technique 4). Crude estimates may be based on traffic flow data (see Technique 8).
How to do it Specialist advice recommended, but ensure location of monitoring/sampling equipment is not affected by micro-variations in air quality / circulation
Advantages - usually accurate and reliable data (but take care to record weather conditions)
Disadvantages - will not fully assess effects on, or perceptions of, people - affected by weather (see 'Notes')
Lower budget options
- reduce sampling periods / area (but associated bias likely to increase) - rough estimates of air quality may be made from good traffic flow data
Notes
The air quality can be strongly affected by the weather: - high temperature / bright sunlight generates ground-level ozone - the wind can bring pollution from other locations or prevent local dissipation - the inversion phenomenon: occurs when air is trapped by a warmer layer above it that prevents it from ascending normally, thus increasing pollutants Therefore, each time the concentration of pollutants in a particular area is measured, the temperature, wind speed (and direction) at different altitudes should be measured. Normally, this can be obtained at a local official weather station.
Further information
The quantity of pollution in the air is usually expressed as a concentration: - usually measured in parts per million by volume (ppmv), parts per billion by volume (ppbv) or parts per trillion (million million) by volume (pptv) - can be also measured by weight of pollutant within a standard volume of air, for example micrograms per cubic metre (µgm-3) or milligrams per cubic metre (mgm-3) refer also to: Section 6.5.3 – Sampling Section 6.7.1 - Data verification, cleaning and weighting

Revised Deliverable 3
Revised September 2003 105
Technique 15: Noise measurements
Description
Noise is defined by the World Health Organisation (WHO) as unwanted sounds. Transportation is the main source of environmental noise pollution, including road traffic, rail traffic and air traffic. Two objective characteristics can be measured: intensity and frequency. Noise should, however, also be considered as a subjective experience (like air quality), requiring attitudinal surveys for measurement.
When to use The process of noise measurement must be developed according to the defined objective or purpose, and is often used for investigating complaints, measuring compliance with regulations, for research surveys, and also for land use planning and trend monitoring.
Related tools Some similarities with measuring air quality (see Technique 14). Perceptions / actual effects on people may only be ascertained through attitudinal surveys (see Technique 4). Crude estimates may be based on traffic flow data (see Technique 8).
How to do it
Specialist advice suggested, but two key pointers are: - locate the measuring instrumentation quite close to the point of reception of the noise; if measured close to the source, need to estimate propagation - ensure propagation of the sound to the meter is not shielded or blocked by structures that would reduce the incident sound pressure levels.
Advantages - equipment and data collection / processing methods now very sophisticated - usually accurate and reliable data (but take care to record weather conditions)
Disadvantages
- very dependent on quality of meters / microphones, and on weather - special problems can arise in areas where the traffic movements involve a change in engine speed and power, such as at traffic lights, hills, and intersecting roads - sound propagation can be quite complicated (and affected by weather) and estimates of sound pressure levels at some distance from the source will inevitably introduce further errors
Lower budget options
Reduce sampling periods / area (but associated bias likely to increase) Sound pressure levels from traffic can be approximately predicted from the traffic flow rate, the speed of the vehicles, the proportion of heavy vehicles, and the nature of the road surface.
Notes
Noise meters may be classified into two broad categories: - 'Type 1 meters' are usually much more expensive and should be used where more precise results are needed, or when frequency analysis is required - 'Type 2 meters' are adequate for broad-band level measurements, where extreme precision is not required and where very low sound pressure levels are not to be measured. Many modern sound pressure meters can integrate sound pressure levels over some specified period, and/or may include sophisticated digital recording / processing capabilities.
Further information
Section 6.5.3 - Sampling Section 6.7.1 - Data verification, cleaning and weighting For more information, please visit the World Health Organisation site: http://www.who.int/ and http://www.health.tno.nl/en/about_tno/organisation/divisions/publichealth/environment/transportation_annoyance_en.html

Revised Deliverable 3
Revised September 2003 106
6.7 Data checking and analysis
6.7.1 Data verification, cleaning and weighting Verification Data verification in market research is a procedure whereby a sample (typically 5%) of the paper questionnaires entered into a software package are re-entered, to assess the accuracy of the data entry. It is not possible (or usually necessary) with CATI (Computer Aided Telephone Interviewing) or CAPI (Computer Aided Personal Interviewing) surveys, where data is captured electronically and checked at the time of entry. Not all software packages have this facility, but it is a useful quality assurance check, especially if new procedures or methods are being used. The knowledge that data verification will take place is likely, in itself, to improve the quality of the data entry, since errors from individual data entry staff may be spotted. Acceptable error levels will be determined by the level of statistical precision required, but should certainly not exceed 0.1% of keystrokes (or 'punches'). Verification in this sense is not usually possible with count data, although values generated by one technique (e.g., a parking count) may be informatively compared with reported behaviour from a questionnaire, for example, or other count data (e.g. local traffic flows). Similarly, automatic traffic counters can be calibrated or validated against video recordings or direct observation. Cleaning This involves carrying out range and logic checks on market research data. Range checks confirm that values are within an acceptable range (e.g. number of days travelled in a week to a particular destination cannot be more than 7) and that logically incompatible answers are not given to questions. Care must be taken, however, not to hastily exclude unlikely response combinations. Computer-assisted techniques often alert the interviewer to such discrepancies as they are entered, allowing them to be resolved with the respondent in situ. Where the respondent cannot be recontacted, judgements must be made by the researcher, and full cleaning of a medium size record set (several hundred responses) may take several weeks, if the data contains relatively complicated trip details. Weighting Weighting may be used to 'correct' both survey data and count data. Data from particular sampling periods might be 'scaled up' (or down) to more closely represent known population / temporal values. For example, O/D survey data or noise measurements, taken on a Tuesday, Friday and Sunday, might each be separately multiplied by appropriate 'weighting factors', and combined to give a representative week's worth of data. Under- or over-representation of a particular group of people from a probability sample might be weighted to represent known characteristics of the target population, using data from secondary sources (such as census data, and previous surveys). It is important to ensure that such secondary sources used are reliable, recent, and have suitably-matched classifications (e.g. age categories) as the data to be weighted. Very great care must be taken when weighting data (especially non-probability samples) and with statistical tests carried out on weighted data. Weighting techniques often assume that missing data (e.g. from people who did not

Revised Deliverable 3
Revised September 2003 107
respond to a survey) is likely to have been very similar to the data actually sampled - this may not always be true, although very expensive to prove either way.
6.7.2 Data analysis
6.7.2.1 Deciding if a measured change is statistically significant As pointed out in Section 6.1, these notes are designed to offer guidance on how to measure change. When measuring the differences between the 'before' and 'after' situation of a campaign, or between characteristics of target groups and control groups, often a decision needs to be made if such changes are statistically significant, or not. The aim of this Section is to offer uncomplicated advice on how to assess the statistical significance of such changes. It is assumed that the reader has little or no previous knowledge of the methods described.
6.7.2.2 What this Section covers Table 6.2 shows tests appropriate for measuring change, according to the type of change being measured, and the type of samples used. Common tests are shown, some of which may be carried out in Excel, all of which may be carried out in SPSS, but the list is not intended to be exhaustive. Other statistical tests may be used to assess the changes described by the scenarios. For specific examples of different approaches to scenarios B and D, see Notes 5 and 6, respectively, later in this Section. The table represents the four commonest scenarios encountered in market research. Each scenario (A-D) is illustrated by a one-page example. These have been set up and worked through in SPSS, with an assumed sample of 250 people in both the before and after sample in each case, or 500 combined for matched samples. Table 6.2 Appropriate statistical tests for different types of sample and data
measuring a change in proportions
measuring a change on a scale (1)
Type of change measured by
type of sample e.g. proportion of people aware of a campaign
e.g. agreement with a policy, on a scale of 1-5
independent samples (e.g. on-street before and
after questionnaire)
chi-squared or paired proportion test
[Scenario A]
Mann-Whitney U test
[Scenario C] matched samples
(e.g. before and after panel survey)
McNemar test [Scenario B]
Wilcoxon Signed Ranks
[Scenario D]
6.7.2.3 What this Section does not cover Measuring statistically significant changes outside the context of more typical survey data often requires greater specialist knowledge, beyond the remit of these guidelines. Analysing results from a stated preference survey (conjoint analysis), for example, requires specialist software and is safer in the hands of those experienced in such analyses. Measuring changes in air pollution data, or traffic flow data, often requires particular knowledge of the

Revised Deliverable 3
Revised September 2003 108
underlying distributions of these data. Whilst it is often possible to collapse such data into simple categories, and use some of the techniques outlined here (e.g., looking at changes in proportions, Scenario A), such simplifying analyses are less 'efficient', and are therefore more likely to miss real changes, since part of the richness of the underlying data is ignored.
6.7.2.4 Matched versus independent (unmatched) samples There are two basic ways of drawing samples in market research. Either two independent samples at different points in time can be collected, where questions are put to two different groups of people (and the choice of respondents in the one sample does not affect the sampling in the other), OR the same people are asked the same questions each time, giving a matched sample. The type of sampling used determines the types of statistical tests which may be applied. The matched sampling relies on the fact that these same people can be properly matched up in the two samples, for example in a ‘before’ and ‘after’ survey. If the same class of schoolchildren took part in a survey in both a ‘before’ and ‘after’ survey, but it is not possible to match individual children’s answers up for each question, ‘before’ and ‘after’, then this cannot be treated as a matched sample. In such a case, the data would have to be treated as two independent samples, and it would then have been better to collect two properly independent samples in the first place. (This is because asking the same people but not being able to properly match the answers causes complications when interpreting the p values - but this is beyond the scope of the current discussion). The advantages of collecting matched samples are that, statistically speaking, this sampling is more efficient than independent sampling. This means that for the same sample size (and, importantly, often for the same market research budget!) it is more likely to be able to identify real changes which have occurred. The disadvantage of collecting matched samples is that they may require more administration in terms of actually getting the matching right (i.e. the records kept and the way data is entered is more complicated) and there may be issues regarding confidentiality, i.e. people may object to having their names recorded. There is a solution to this latter problem, in that it is perfectly possible to carry out anonymised matched samples, where the actual name of the respondents does not appear on the questionnaire at all. This requires good survey administration, and that the respondents have the confidence of the people carrying out the survey. Attitudes to such approaches will vary from culture to culture, and according to the sensitivity of the data being collected. In addition, with matched samples, it is very likely that some respondents will drop out, after being questioned a first time. It is therefore necessary to take account of this factor (known as attrition) when calculating sample sizes and the number of questionnaires that need to be carried out. From the above discussion it will be concluded that the advantage of independent samples is that they are easier to administer, but that they typically require larger samples in order to identify statistically significant changes. Or, put another way, sampling say 500 people in a ‘before’ and ‘after’ survey, it is less likely to identify true changes with independent samples, because the types of statistical test applied are more conservative. As a final consideration, it is worth pointing out that independent samples also have another advantage, in that if two surveys are to be carried out with only a short period of time in

Revised Deliverable 3
Revised September 2003 109
before after
between, it may be prudent to collect independent samples, as then it will be less likely to annoy or irritate respondents. If the same group of people are asked the same sets of questions within a couple of weeks, the quality of the response is likely to go down in the second survey – so better to select a new group of people. In summary, the choice of whether to have independent or matched samples is a question of balancing the advantages and disadvantages of each to meet the needs of a particular survey. Whilst, on the whole, matched samples are preferable, there is no point pushing for this if the quality of the data may be jeopardised as a result, otherwise the whole object of the survey is defeated.
6.7.2.5 Statistical examples (see Table 6.2) Scenario A: Change in proportions, independent samples
Table A1 before after 115 135 heard name 250 250
These example data illustrate a case where the campaign name had been previously used, with 115 people having heard of the name before it was used again as part of the campaign. The example 'after' data shows 20 more people (out of 250) had heard of the campaign name after the repeat initiative. This particular increase of 8% is not significant, since the p value is greater than 0.05 (2) Chi-square test, p = 0.074
Table A2 before after 115 145 heard name 250 250
Table A2 shows 30 more people (per 250) aware of the campaign after it has taken place, i.e. a 12% increase in recall. The 'after' cone is now slightly higher than the one above. The chi-square test shows this to be a highly significant shift in recall, since the p value is now less than 0.01. Chi-square test, p=0.007 How to carry out the tests These can be carried out in SPSS as a
before after

Revised Deliverable 3
Revised September 2003 110
cross-tabulation with a chi-squared test; in Excel as a chi-squared test, or as a paired proportion test (in Excel, or manually). The p values will all be the same. See Note 3 for fuller details of these options. Scenario B: Change in proportions, matched samples
Table B1 after before agree disagree
agree 190 55 disagree 75 180
Here again changes in proportions are measured, but now asking the same people before and after. This test measures whether the difference between the 'agree before / disagree after' group (55 people) is statistically different from the 'disagree before / agree after' group (75 people). This particular difference isn't significant (but see Note 5). McNemar test, p = 0.096
Table B2 After before agree Disagree
agree 190 45 disagree 85 180
Table B2 shows a hypothetical conversion of another 10 people after the campaign relative to Table B1, and the change is now highly significant. The cone furthest away has increased at the expense of the nearest one. Many other combinations of changes would also be significant, of course. McNemar test, p = 0.001 How to carry out the tests In SPSS, use "Analyze… Nonparametric tests… 2 related samples" and check the "McNemar" box to carry out this
test. A special χ 2 (chi-square) value is calculated (4), and attention needs to be paid of expected counts lower than five. See Note 5 for an alternative test.
agree afterdisagree
afteragree before disagree before
agree after
disagree after agree before disagree before

Revised Deliverable 3
Revised September 2003 111
Scenario C: Change on a scale, independent samples
Table C1 before After 1 80 70 2 60 50 3 50 50 4 40 50 5 20 30
Table C1 shows example data from a before and after survey for independent samples, i.e. different people were asked to give a view, measured on a 1-5 scale. Although there was some change between surveys, the difference is not significant. Mann-Whitney U test p = 0.056
Table C2 before after 1 80 60 2 60 50 3 50 50 4 40 50 5 20 40
Had 10 more people responded with a '5' ("strongly disagree", say) and 10 fewer with a '1' ("strongly agree"), the observed change would have been highly significant. Many other combinations of numbers could have represented a significant shift in attitude. Mann-Whitney U test p = 0.002
How to carry out the tests To carry out the Mann-Whitney U test in SPSS use "Analyze…
Nonparametric tests… 2 independent samples". The Mann-Whitney option is set as the default. 'U' values may disagree with manual calculations, but the p values reported are accurate.
1 2 3 4 5
Aft
er
Befo
re
1 2 3 4 5A
fter
Be
fore

Revised Deliverable 3
Revised September 2003 112
Scenario D: Change on a scale, matched samples
Table D1 after before 1 2 3 4 5
1 35 25 15 9 5 2 25 35 25 15 9 3 15 25 44 25 15 4 1 15 25 35 25 5 1 1 15 25 35
This example is similar to Scenario C, except that here individual changes in responses between the before and after survey (matched samples) may be tracked. This test, however, only measures net departures from symmetry (around the diagonal) in the table: see Note 6 for an alternative test. Table D1 is only 10 responses different from a perfectly symmetrical distribution, and represents a change, which is statistically not significant. Wilcoxon Signed Ranks p = 0.053
Table D2 After before 1 2 3 4 5
1 35 25 15 5 26 2 25 35 25 5 5 3 15 25 44 25 15 4 0 15 25 35 25 5 0 0 15 25 35
Moving another 21 responses (see numbers in bold, and cones at corners), i.e. simulating a change in attitude of another 21 people, the result is now statistically highly significant. Wilcoxon Signed Ranks p = 0.008 How to carry out the tests In SPSS, use "Analyze… Nonparametric tests… 2 related samples". The "Wilcoxon" option is checked by
default: just add the two variables to the 'test pair(s) list'. See also Note 6.
6.7.2.6 Technical notes Note 1 Ordinal tests have been suggested for the analyses of scalar questions to obviate the stricter requirements of normally distributed responses, as required for parametric tests such as the t and z tests.
1 2 3 4 5
1
2
3
4
5
After
Before
1 2 3 4 5
1
2
3
4
5
After
Before

Revised Deliverable 3
Revised September 2003 113
Note 2 Conventional levels of 5% (p<0.05) for 'significant' changes, and 1% (p < 0.01) for 'highly significant' changes have been adopted. Cases where p ≤ 0.01 (including, of course, p ≈ 0.000) may be conventionally described as 'very highly significant'. These tests assume reasonable sample sizes, based on random sampling protocols. Note 3 The paired proportion test (two-tailed) and a 2x2 chi-square test (one-tailed, without a Yates' continuity correction) furnish identical p values for all but very small samples. The paired proportion test may be calculated according to:
)11)(ˆ1(ˆ21
21
nnpp
ppZ+−
−=
where the numerator shows the difference between the two observed sample proportions, and the estimate of the pooled (common) population proportion is given by:
21
2211ˆnn
pnpnp++=
and the test is subject to the (usually rather undemanding) constraints that:
55
22
11
≥≥
pnpn
Note 4 The p value is calculated using the special (McNemar) χ2 value:
( )BAAB
BAAB
XXXX+
−−=
22 1
χ
This is then referred to the standard χ2 distribution tables for the corresponding p value. Note 5 As noted in the text (and may be formally observed from Note 4) the McNemar test only uses the off-diagonal values in its calculations, and thus takes no account of the overall proportion of people changing their mind between the two survey waves ('before' and 'after'), since the numbers in the leading diagonal are not used. Is this a problem? Clearly, in the case of Tables B1 and B2, looking at the overall proportion of people changing their mind would give the same result each time:
260.0500130
5008545
5007555 ==+=+==
totalchangedp
whereas the McNemar test indeed differentiates between the two cases (hence the change in p value). Consider the situation in Table B3, however. Here, the McNemar test would give a p value of 1.000 ('absolutely no change'), although another way of looking at the table would be to say that 400 out of the 500 people surveyed over the two waves had changed their mind. The

Revised Deliverable 3
Revised September 2003 114
McNemar test advocate would argue that the net change was nil, because the overall agreement before and after was just the same.
Table B3 after before agree disagree
agree 50 200 disagree 200 50
Nevertheless, if we wanted to report on the important fact that 4 out of 5 people had been influenced by the campaign, how could we measure this? If people's responses to the question or statement (agreement or disagreement) were truly random, it could be expected, by chance, that half of them would give a different answer in the after survey to the one they gave in the before survey. The situation may, in fact, be treated as if a single sample had been taken, and simply "no change” versus “change” (of mind) was being measured. If behaviour were purely random, it would be expected that a proportion of 0.5 (250 people) would change their minds between waves. If the campaign had some effect, on the other hand, it would be expected that this proportion would be somewhat higher, or lower, than 0.56. If p represents the proportion of people observed in our sample who changed their minds, it is possible to test for a significant difference between this value and the 'comparison' or 'random' value of 0.5 using the following formula, so long as the sample size (n) is at least 10 (and preferably considerably higher):
n
.pz
41
50−=
and looking up the corresponding p value. In this case, z = -10.73, which is very highly significant (p ≈ 0.000), as might have been guessed, with 400 out of 500 people changing their minds. In fact, any fewer than 228, or more than 272 people changing their minds between survey waves would have been considered significantly different (p < 0.05) from the 'expected' value of 250 (had people behaved randomly). It might be considered unwise to rely solely either on the McNemar test value, or the proportion test. The latter's insensitivity to the ratio of numbers in the off-diagonal (mentioned above) could also be misleading. As a further example, whilst the data in Table B4 would suggest that nine times (225/25) as many people had been converted to agreeing with the policy objective (for example), as had been dissuaded, the preceding proportion test would give a p value of 1.000 ('no change'), whilst the McNemar test would decidedly pick up on the difference (p ≈ 0.000) and suggest a highly significant change.
6 In statistical terms, the null hypothesis would be that the population proportion of the binomially-distributed sample was p = 0.5, using the Normal approximation, since np ≥ 5 and n(1-p) ≥ 5 hold.

Revised Deliverable 3
Revised September 2003 115
Table B4 after
before agree disagree agree 125 25
disagree 225 125 In some cases both tests would give the same result, i.e. when the distribution between the cells is relatively close to 125 counts in each, both tests will report no significant change. The important factor to bear in mind is that neither approach is 'right' or 'wrong', but each must be considered in context. A closely analogous issue is explored in Note 6. Note 6 Although the Wilcoxon Signed Ranks test suggested no significant change, it will be noted that in Table D1 quite a few people actually changed their minds (score) between the before and after survey. The sum of the leading diagonal in Table D1 is 184, telling us that whilst 184 people did not change their mind between the surveys, 500 - 184 = 316 people did. Using the formula for testing to see if such a change is likely to have arisen by chance (given in Note 5) it can be seen that:
903.5
50041
5.0500316
=−
=
x
z
which gives p ≈ 0.000, i.e. this represents a very highly significant difference from is expected if people were behaving randomly (no campaign effect). However, no matter how many people actually changed their mind, the Wilcoxon Signed Ranks test will not pick this difference up if the overall change is relatively symmetrical (as in Table D1) - it is only sensitive to a net shift between the before and after situation. Even if 90% of people, say, changed score between the survey waves (i.e., only 50 people out of 500 gave the same score twice), as illustrated in Table D3, the Wilcoxon Signed Ranks test still gives a p value of 1.000, indicating 'absolutely no significant change', because just as many people swapped from a '1' before to '5' after (15 people, in fact) as swapped from a '5' to a '1', etc.
Table D3
after before 1 2 3 4 5
1 10 20 30 20 15 2 20 10 20 30 20 3 30 20 10 20 30 4 20 30 20 10 20 5 15 20 30 20 10
As with many statistical evaluations, one must be aware of (and report) exactly what is being tested, and what is not being tested. Using only the proportion test may equally lead to uninformed conclusions. Any distribution with between 228 and 272 counts in the leading diagonal will not give a significant result (p > 0.05) according to the proportion test, even one with such a skew in the distribution as that represented by Table D4, where many people changed from low 'before' scores, to high 'after' scores. Here, the proportion test (which ignores the magnitude of the change) may be misleading (p = 1.000), whereas the Wilcoxon Signed Ranks test would again be very sensitive to the change (p ≈ 0.000).

Revised Deliverable 3
Revised September 2003 116
Table D4
after before 1 2 3 4 5
1 40 16 18 13 10 2 16 50 16 18 13 3 6 16 70 16 18 4 5 6 16 50 16 5 4 5 6 16 40
Related Documents