CHRISTINA HOOD INFORMATION PAPER REVIEWING EXISTING AND PROPOSED EMISSIONS TRADING SYSTEMS 2010 November

Welcome message from author
This document is posted to help you gain knowledge. Please leave a comment to let me know what you think about it! Share it to your friends and learn new things together.
Transcript
Christina hood
INFORMATION PAPER
REVIEWING EXISTING AND PROPOSED EMISSIONS TRADING SYSTEMS
2010 November
INTERNATIONAL ENERGY AGENCY
The International Energy Agency (IEA), an autonomous agency, was established in November 1974. Its mandate is two-fold: to promote energy security amongst its member countries through collective response to physical disruptions in oil supply and to advise member
countries on sound energy policy.
The IEA carries out a comprehensive programme of energy co-operation among 28 advanced economies, each of which is obliged to hold oil stocks equivalent to 90 days of its net imports. The Agency aims to:
n Secure member countries’ access to reliable and ample supplies of all forms of energy; in particular, through maintaining effective emergency response capabilities in case of oil supply disruptions.
n Promote sustainable energy policies that spur economic growth and environmental protection in a global context – particularly in terms of reducing greenhouse-gas emissions that contribute to climate change.
n Improve transparency of international markets through collection and analysis of energy data.
n Support global collaboration on energy technology to secure future energy supplies and mitigate their environmental impact, including through improved energy
efficiency and development and deployment of low-carbon technologies.
n Find solutions to global energy challenges through engagement and dialogue with non-member countries, industry,
international organisations and other stakeholders. IEA member countries:
Australia Austria
Belgium Canada
Czech RepublicDenmark
Finland France
GermanyGreece
HungaryIreland
ItalyJapan
Korea (Republic of)LuxembourgNetherlandsNew Zealand NorwayPolandPortugalSlovak RepublicSpainSwedenSwitzerland
TurkeyUnited Kingdom
United States
The European Commission also participates in
the work of the IEA.
Please note that this publication is subject to specific restrictions that limit its use and distribution.
The terms and conditions are available online at www.iea.org/about/copyright.asp
© OECD/IEA, 2010International Energy Agency
9 rue de la Fédération 75739 Paris Cedex 15, France
Christina hood
INFORMATION PAPER
REVIEWING EXISTING AND PROPOSED EMISSIONS TRADING SYSTEMS
2010 November
This information paper was prepared for the IEA Standing Group on Long-Term Cooperation in October 2010. It was drafted by the IEA Climate Change Unit. This paper reflects the views of the International Energy
Agency (IEA) Secretariat, but does not necessarily reflect those of individual IEA member countries. For further information, please contact Christina Hood, Climate Change Unit at: [email protected]

© OECD/IEA 2010 Reviewing Existing and Proposed Emissions Trading Systems
Page | 3
Table of contents 1. Executive summary ..................................................................................................................... 6
2. Introduction............................................................................................................................... 10
3. Basics of emissions trading ....................................................................................................... 11
Nature of emissions quotas ................................................................................................... 11
Participants and timeframes ................................................................................................. 11
Coverage ................................................................................................................................ 12
Cap and allocation of allowances .......................................................................................... 13
Enforcement of emissions rights and enabling trading ......................................................... 13
Reducing the impact of emissions prices on consumers and emissions‐intensive sectors .. 14
Offsets and linking ................................................................................................................. 15
4. The need for ambitious targets ................................................................................................. 16
5. Current and proposed emissions trading systems .................................................................... 19
United Kingdom Emissions Trading Scheme (UK ETS) ........................................................... 19
New South Wales Greenhouse Gas Reduction Scheme (NSW) ............................................. 19
European Union Emissions Trading System (EU ETS) ............................................................ 20
Norway .................................................................................................................................. 21
Alberta, Canada ..................................................................................................................... 22
Switzerland ............................................................................................................................ 22
New Zealand .......................................................................................................................... 23
Regional Greenhouse Gas Initiative (RGGI), United States ................................................... 24
Tokyo ..................................................................................................................................... 24
UK CRC Energy Efficiency Scheme ......................................................................................... 25
Western Climate Initiative (WCI), United States and Canada ............................................... 25
California ................................................................................................................................ 26
Australian Carbon Pollution Reduction Scheme (CPRS) ........................................................ 27
H.R.2454: American Clean Energy and Security (ACES) Act of 2009 ..................................... 28
Other schemes under consideration ..................................................................................... 29
6. Design features and key lessons ............................................................................................... 31
6.1. Coverage ......................................................................................................................... 31
6.2. Cap setting ...................................................................................................................... 37
6.3. Overall costs ................................................................................................................... 44
6.4. Managing price uncertainty and volatility ...................................................................... 50
6.5. Long‐term investment signals ........................................................................................ 55
6.6. Free allocation and auctioning ....................................................................................... 57
6.7. Competitiveness ............................................................................................................. 62
6.8. Use of ETS revenue ......................................................................................................... 68
6.9. Market oversight ............................................................................................................ 72
Reviewing Existing and Proposed Emissions Trading Systems © OECD/IEA 2010
Page | 4
7. The need for complementary and supplementary policies ...................................................... 76
8. Conclusions ............................................................................................................................... 78
References ..................................................................................................................................... 80
Annex: Design details of emissions trading systems ..................................................................... 86
List of figures, tables and boxes Figure 4.1: Sources of emissions reductions to reach the IEA 450 Scenario ................................ 17
Figure 6.1: Modelled emissions reductions from the proposed H.R.2454 scheme ...................... 34
Figure 6.2: Modelled emissions and allowances under a 34% EU ETS target .............................. 39
Figure 6.3: Comparing the current European Union economy‐wide target with a 2 °C objective .... 41
Figure 6.4: Achieving an emissions reduction target via offsets and banking .............................. 47
Table 6.1: Section 6.1 summary: coverage ................................................................................... 36
Table 6.2: Section 6.2 summary: cap setting ................................................................................ 43
Table 6.3: Section 6.3 summary: overall costs and measures to manage them .......................... 49
Table 6.4: Section 6.4 summary: measures to address price uncertainty and volatility .............. 53
Table 6.5: Section 6.5 summary: measures to promote certainty for low‐carbon investment ... 57
Table 6.6: Section 6.6 summary: free allocation and auctioning provisions ................................ 61
Table 6.7: Section 6.7 summary: measures to address competitiveness concerns ..................... 66
Table 6.8: Section 6.8 summary: use of ETS revenue ................................................................... 71
Table 6.9: Section 6.9 summary: market oversight ...................................................................... 73
Box 3.1: Emissions trading and carbon taxes – two approaches to pricing emissions ................. 12
Box 6.1: Offsets and climate finance ............................................................................................ 48
Box 6.2: Consumer electricity prices and emissions trading ........................................................ 70
© OECD/IEA 2010 Reviewing Existing and Proposed Emissions Trading Systems
Page | 5
Acknowledgements The author of this paper is Christina Hood, Climate Policy Analyst with the Energy Efficiency and Environment Division of the IEA.
The author would like to thank Richard Baron for his advice and comments provided throughout this research. Very useful suggestions and feedback on the report were provided by Richard Bradley, Bo Diczfalusy, Ambassador Richard Jones, Cédric Philibert, Christa Clapp (OECD), Professor Denny Ellerman (MIT/EUI) and the delegations of Australia, Canada, Germany, Japan, Korea, Norway, Sweden, Switzerland and the European Union.
Reviewing Existing and Proposed Emissions Trading Systems © OECD/IEA 2010
Page | 6
1. Executive summary Putting a price on greenhouse gas emissions is a cornerstone policy in climate change mitigation. It is widely accepted that without price measures, it will be significantly more difficult and expensive to implement the economic transformation required to put the world on track to meet the Copenhagen Accord goal of limiting temperature rise to 2° C (OECD, 2009).
The need for change is particularly urgent in the power sector, in which IEA modelling shows global emissions need to be over 50% lower in 2030 than baseline trends (IEA, 2009). Energy sector carbon dioxide (CO2) emissions account for two thirds of the world’s total anthropogenic greenhouse gas emissions, so are a critical target for reductions.
Delivering the rapid turn‐around in energy investment patterns required to meet this goal will require clear, strong and sustained policies. To this end, many countries have implemented or are developing domestic emissions trading systems (ETS).
This paper reviews key design elements of mandatory emissions trading systems that had been established or were under consideration in 2010. It does not review existing and proposed carbon tax policies, or the relative merits of taxes versus trading. Rather, the intention is to explore key design features of emissions trading systems, based on practical experience to date, with a particular focus on the energy sector.
Mandatory emissions trading systems are already operating around the world (European Union, Norway, Switzerland, New Zealand, Alberta, New South Wales [NSW], United States Regional Greenhouse Gas Initiative [RGGI], Tokyo, United Kingdom Carbon Reduction Commitment Scheme [UK CRC]), are being planned (Western Climate Initiative [WCI] linking US states and Canadian provinces, California, Korea, Japan, Brazil, China), or have reached an advanced stage of design (Australia, United States H.R.2454 proposal).
The European Union Emissions Trading System (EU ETS) and New Zealand ETS (NZ ETS) are both comprehensive nationwide schemes, but take very different approaches: New Zealand allows unlimited trading with the international Kyoto Protocol market, has broad economy‐wide coverage and distributes all allowances by free allocation. By contrast the EU ETS has a narrower scope, limits the use of offsets to encourage domestic emissions reductions and is moving towards widespread auctioning. The Swiss and United Kingdom CRC markets are also national, but sit within the larger policy context of the CO2 levy in Switzerland and the EU ETS in the United Kingdom.
Other mandatory schemes have been established at the provincial, state or city level (Alberta, NSW, RGGI, Tokyo) and are limited to the power sector (RGGI, NSW), large industry (Alberta) or the commercial sector (Tokyo). These sub‐national schemes set their own targets which vary in ambition. Under some schemes (Alberta, NSW) domestic emissions have continued to increase.
These schemes vary in their purpose, coverage, ambition and design features and provide a wealth of information on the practical implementation of a policy instrument that is relatively new in climate policy and is being considered by countries outside IEA membership.
The design choices made in these schemes needs to be seen in the wider context of international action on climate change. For countries that are parties to the Kyoto Protocol, national trading schemes implemented thus far have been designed to operate within the Kyoto framework and to support the achievement of these commitments. It is currently unclear exactly what form the post‐2012 international agreement will take, but the current sense is that

© OECD/IEA 2010 Reviewing Existing and Proposed Emissions Trading Systems
Page | 7
although there needs to be international agreement on emissions commitments, key standards for measurement reporting and verification and assistance mechanisms for developing countries, the tools for delivering developed countries’ emissions reduction targets are likely to be left to individual countries to decide.
In this context, the design choices made by developers of new emissions trading systems are critical, as these schemes will form major building‐blocks in a future global mitigation framework. To the extent that key design features can be aligned to allow easy linking of schemes in future, the cost of reducing emissions can be reduced. This could allow for easier implementation of an eventual international agreement and increase the chances of its success.
The energy sector has particular characteristics that must be taken into account if trading systems are to be effective in reducing long‐term emissions. The long‐lived nature of assets in the sector is critical and delay or uncertainty in price signals can lead to locking‐in of high emissions infrastructure. The interaction between electricity markets and emissions pricing is complex, with quite different characteristics depending on the level of deregulation of the electricity market. Power price rises are politically and economically important, so careful thought needs to be given to how to address distributional issues caused by the introduction of emissions pricing.
Although emissions trading is a key tool for energy sector decarbonisation, trading can also be extended to deliver cost‐effective emissions reductions in other sectors of the economy and the coverage of schemes studied here varies significantly. Economy‐wide coverage as advocated by economic theory is being rolled out in the New Zealand scheme, but other schemes seek to target trading in areas in which the reduction potential is greatest, particularly the electricity sector and in sectors in which there are not already existing policy instruments in place.
A common feature of scheme design arises from the tension between the ambition for rapid emissions reductions and the desire to maintain existing economic activity and jobs. Fears over high economic impacts have led to initial caps which have often been set cautiously, sometimes causing prices to collapse due to oversupply of allowances. This should not be seen as a failure of emissions trading, rather it is a reflection of the difficulty in gathering robust data quickly and the political difficulty of setting and implementing ambitious climate change targets. Although initial targets are often weak, the infrastructure for measuring, reporting, verifying and managing emissions is now in place in these jurisdictions, producing a framework for more ambitious future action.
Despite fears of adverse economic impacts, countries’ economic analyses show that the cost impacts of emissions trading are not expected to be high, either economy‐wide or even for most energy‐intensive industries. Most schemes seek to reduce overall economic impacts by allowing use of offsets, which enable obligations to be met by making lower‐cost emissions reductions in sectors or countries not covered by the scheme. Because (for a given target) this reduces domestic abatement within the capped sectors, there is a trade‐off between cost and the rate of domestic transition to low‐carbon energy systems.
Generous free allocation of allowances to emissions‐intensive industries is standard, but economic analyses do not generally reveal why this should be in the wider economic interest. These companies face competition from rivals that do not face emissions pricing, but they also face competition from companies producing lower‐emissions alternative products. Overly generous support to maintain current production patterns slows the pace of transition to sustainable low‐carbon technologies. Assistance for some industries may be appropriate, but must be seen as a transitional measure.
Reviewing Existing and Proposed Emissions Trading Systems © OECD/IEA 2010
Page | 8
Another common concern is to try and provide certainty for low‐carbon investors. In the schemes studied this is promoted by unlimited banking (all schemes), by fixing rules over long trading periods (EU ETS, Tokyo) and by setting or signalling caps far in advance (H.R.2454, EU ETS, Australia). North American proposals (H.R.2454, WCI, California) propose to use cap and floor prices to assist with investment certainty, but the value of this is debated.
There are significant design choices to be made in establishing an ETS. The current and proposed schemes reviewed in this paper have a wide variety of designs, reflecting their varying aims, data availability, political acceptability and the need for transition measures to facilitate the change from existing high‐emissions economic activity to low‐emissions systems.
For future schemes, rather than simply copying what has been done elsewhere, it is critical that the costs and benefits of design choices be evaluated based on local circumstances.
Compromises may need to be made, or schemes phased in gradually. Careful analysis will allow the costs and consequences of these compromises to be clearly understood, to ensure that they are reasonable and that the trading system will still be a cost‐effective tool for emissions reductions. This will help provide a clear understanding of how to achieve a realistic, yet cost‐effective transition, as countries seek to chart a course to a low‐carbon economy.
Based on our review of the experience to date in the practical implementation and design of emissions trading systems, the following key lessons emerge:
Ambitious targets
Stabilising atmospheric temperature rise at 2 °C requires a revolution in energy systems. Strong investment signals are needed, driven by sufficiently high emissions prices. Trading schemes with very modest targets do not function well (due to the risk of oversupply of allowances) and will result in only small changes at the margin such as fuel switching in existing generating plants. If transformative change is desired, ambitious long‐term targets must be phased in.
No free allocation of allowances to electricity generators
In competitive markets, free allocation leads to windfall gains for electricity generators and does not prevent electricity price rises for end users. In regulated systems, although free allocation could prevent price rises it can also remove the incentive to move to low‐carbon generation. In both cases, if the desire is to offset price rises for end consumers, it is better to compensate consumers directly (or via electricity distribution companies), rather than providing free allocation to generators.
Clear long‐term investment signals
Visibility of long‐term emissions prices is critical to stimulate appropriate levels of investment in low‐carbon technologies. This can be achieved by signalling caps far in advance and political commitment to the scheme’s long‐term duration. This is particularly important for the power sector, in which early investment in low‐carbon capacity can help avoid the lock‐in of long‐term emissions from new fossil‐fuel plant.
Allow flexibility to make changes in the early years
There is a significant risk of insufficient targets and oversupply of allowances in the early stages of a trading scheme. If over‐allocated allowances can be banked for future use, they can make it more difficult to reach long‐term emissions reduction targets. For the market to function properly, there is a need to allow flexibility to correct for any early allocation or design errors.
© OECD/IEA 2010 Reviewing Existing and Proposed Emissions Trading Systems
Page | 9
Cost impacts should not be over‐estimated
Overall economic costs and competitiveness issues arising from pricing emissions are expected to be small compared to ongoing economic growth rates and can be addressed by specific measures such as use of offsets. Transitional assistance for some industries may be appropriate, but overly generous support to maintain current production patterns slows the pace of transition to sustainable low‐carbon technologies. The cost (or opportunity cost) of any free allocation should be considered carefully against alternative uses that could have a greater positive impact on employment and other economic outcomes.
Complementary and supplementary policies will be needed
Emissions pricing is a cornerstone of climate change mitigation policy, but complementary policies are also required due to incomplete coverage of trading schemes, the need to support technology research, development and deployment and the need to deliver underpinning low‐carbon infrastructure. Supplementary policies, if carefully designed, can be helpful in addressing market barriers and emissions prices that do not yet reflect the social cost of emissions.

Reviewing Existing and Proposed Emissions Trading Systems © OECD/IEA 2010
Page | 10
2. Introduction Numerous studies and publications have outlined the theoretical basis for emissions trading design choices, but to date there has been less attention paid to the choices made by actual developers of schemes, why these design choices were made and whether anything can be learnt from this for developers of future schemes.
This paper reviews key design features of emissions trading systems that were either in operation in 2010, or under consideration, with a particular focus on issues for the energy sector. It acknowledges that schemes diverge from the “optimal” prescription of economic theory, seeks to understand these choices and offers some emerging lessons from the practice to date of emissions trading design.
This review was undertaken with the assistance of IEA member countries, whose input in relation to the design details over their schemes is greatly appreciated.
In this paper, Chapter 3 provides a very brief introduction to emissions trading basics and Chapter 4 examines the issue of what level of emissions reductions are required to meet the Copenhagen Accord goal of keeping global temperature rises to 2 °C.
Chapter 5 summarises trading schemes that are currently in operation, soon to commence, or have reached an advanced stage of design. More details of all schemes are included as an extensive annex.
A more detailed analysis of key design features is presented in Chapter 6, including scheme coverage, cap setting, economic impacts, price volatility, investment certainty, allocation of allowances, competitiveness issues, use of revenue (including for consumer compensation) and market oversight.
Finally, Chapter 7 briefly explores supplementary policies to trading schemes and Chapter 8 draws conclusions.

© OECD/IEA 2010 Reviewing Existing and Proposed Emissions Trading Systems
Page | 11
3. Basics of emissions trading In an emissions trading system (ETS), liable entities – those responsible for emissions (for example electricity generators or large industrial plants) – must hold allowances to match their emissions over a given timeframe. A cap on the total number of allowances available sets a limit on the total quantity of emissions. Liable entities have the possibility to sell or acquire allowances, with a view to minimising their cost of compliance. Trading of allowances establishes a market price for emissions and promotes least‐cost actions to meet the cap.
This chapter provides a brief overview of these systems’ basic structure. Key design choices are analysed further in Chapter 6.
At the most basic level, schemes simply need to define emissions quotas (i.e. what an “allowance” represents and how it will be measured), determine how these rights will be allocated to participants in the scheme, ensure that rights can be enforced and set rules to enable trading.
Within these broad parameters a wide range of ETS designs are possible and indeed are currently being implemented in various countries. Beyond the basic requirements for trading, most schemes include measures that attempt to reduce the impact of introducing carbon pricing on consumers and emissions‐intensive sectors, promote investment certainty for clean technologies and support energy efficiency.
Nature of emissions quotas
A common definition of the unit of trade (an allowance) is important, particularly where schemes are linked. In all schemes implemented or proposed, one allowance represents the emission of one tonne of carbon dioxide (tCO2), or one tonne of carbon dioxide equivalent (tCO2eq), that is, the equivalent quantity of another greenhouse gas that gives the same amount of warming based on conversion factors adopted by the United Nations Framework Convention on Climate Change (UNFCCC).
Participants and timeframes
Liable entities (that is, those entities that will be held responsible for emissions and required to report emissions and submit allowances), can be “upstream”, for example by making petroleum suppliers responsible for emissions from their products, or “downstream”, for example making motorists responsible for the emissions released by the fuel they use. Downstream obligations provide a more immediate price signal to stimulate behaviour change and can be practical where a size threshold is used to limit the number of participants (as in the EU ETS). Upstream obligations are generally simpler and cheaper to implement as they involve many fewer participants and there is usually better data available, but the price signal is less direct. It is possible to mix upstream and downstream liabilities within a single ETS and to allow for the voluntary transfer of obligations downstream.1
1 For example, the New Zealand ETS makes liquid fuel suppliers liable for transport fuel emissions, but the scheme allows large users (such as airlines) to voluntarily opt‐in and manage their own obligations.

Reviewing Existing and Proposed Emissions Trading Systems © OECD/IEA 2010
Page | 12
System rules can be set over short or long trading periods (from one year to eight years in the schemes studied here), depending on the balance sought between certainty for scheme participants and flexibility to adapt to changing circumstances. Some schemes specify a long‐term pathway for a declining emissions cap, while in other schemes caps for future trading periods will be set by regular reviews.
Box 3.1: Emissions trading and carbon taxes – two approaches to pricing emissions
Coverage
Emissions trading systems can cover all or only a part of a country’s or an economy’s emissions. While wide coverage in theory increases the chance of finding the most cost‐effective mitigation opportunities (OECD, 2009), all sectors are not always easily able to participate in a trading system and other policy instruments (taxes, portfolio or technology performance standards, incentives) can also be mobilised to cover those activities that are less amenable to coverage by
Mechanisms to price emissions come in two forms: emissions trading schemes (in which the quantity of emissions is fixed, but the price is determined by the market and is therefore uncertain) and carbon taxes (in which the price is fixed but the quantity of emissions reductions is uncertain). Hybrid trading schemes with price caps and floors contain elements of both (Philibert, 2006).
In theory taxes and trading schemes are broadly equivalent: an appropriately struck tax or trading system should deliver the same emissions reductions for a given price (OECD, 2009). However establishing this price‐equivalence in advance assumes knowledge of future emissions: if BAU emissions are higher than expected, the trading scheme will deliver higher prices and greater abatement than the tax and vice‐versa for low BAU emissions. If reduction targets (or tax levels) are set appropriately, the market or tax price should reflect the “social cost of carbon”, which is a measure of the cost of the impacts of climate change.
If there is uncertainty about the precise level of emissions reductions required, it can be shown that a carbon tax can be theoretically superior to a trading scheme (Pizer, 2002; Philibert, 2006). However this assumes that the carbon tax is set at a high enough level to reflect the social cost of carbon and will be adjusted upwards as necessary; assumptions that may be politically unrealistic.
Carbon taxes are potentially simpler and easier to administer and provide clearer long‐term investment signals, but may be more difficult to set at an appropriate price. Emissions trading schemes have some critical practical advantages:
• The cap provides a guarantee on the level of emissions, ensuring target levels will be achieved.
• Free distribution of allowances provides a mechanism to address the unequal impacts of emissions pricing on different sectors (distributional impacts) and provides an “asset” to emitters that can give them a more vested interest in the scheme’s success.
• The environmental objective is less susceptible to being undermined by political compromises. In a tax system, political pressure can lead to exemption of some sectors, whereas in a trading system these sectors tend to receive greater free allocation of allowances rather than being exempted. This may raise distributional issues, but as long as the overall emissions cap is unchanged, it does not significantly undermine the overall economic efficiency or environmental effectiveness of the scheme.
• Trading schemes can be politically more achievable. In both Europe and New Zealand, carbon taxes were proposed and failed before trading schemes were implemented.
• International alignment of trading schemes rules will be easier than harmonising tax laws, as taxation is an area in which national sovereignty is fiercely guarded.
© OECD/IEA 2010 Reviewing Existing and Proposed Emissions Trading Systems
Page | 13
emissions trading. The ability to accurately measure, report and verify emissions is an important element in deciding the scope of coverage.
Some schemes studied are implemented economy‐wide, covering all sectors and all six Kyoto greenhouse gases.2 Others are narrowly targeted, for example covering only CO2 from power generation.
Cap and allocation of allowances
Perhaps the most critical decision in designing an ETS is the nature and level of the cap – the level of emissions that will be delivered by the scheme. Caps can be an absolute quantity of emissions for the given time period, or can be relative, for example referenced to production levels or GDP. An absolute cap guarantees the level of emissions that will be delivered,3 while a relative cap can allow for increases in emissions if production levels or GDP increase. A further variant is a “baseline and credit” scheme, in which participants are assigned a target emissions pathway. They are liable for emissions above that level, but receive credits if emissions are below the baseline.
For an ETS to function properly, the cap must be set tightly enough to constrain emissions, so that there is demand for allowances and a price is established. A system with a cap set above the actual level of emissions will have an oversupply of allowances, resulting in a low allowance price and little incentive for emissions to be reduced.
Within the overall cap, there must also be procedures for distributing allowances to scheme participants. Allowances can be auctioned, allocated for free, or a combination of these. If there is free allocation, further decisions are needed on whether to base this allocation on historical emissions, current production levels, or some other formula. Decisions need to be taken on how to deal with firms that enter or exit the scheme and whether to provide credit for early action taken ahead of the scheme’s commencement. If there is auctioning of units, the government has a revenue stream that can be used, for example, to offset the impacts of the scheme on consumers, businesses and the wider economy and to fund climate change finance commitments to developing countries. This revenue can be significant: OECD modelling shows that under emissions trading with full auctioning to deliver the Copenhagen Accord pledges, revenues in developed countries could reach more than USD 400 billion, or 1% of GDP in 2020 (Dellink et al., 2010a). Decisions are needed on how to best use this revenue.
Most schemes allow the import or export of allowances to other linked schemes, for example the import of Clean Development Mechanism (CDM) allowances generated under the Kyoto Protocol. The degree of linking between a domestic trading scheme and external allowances is again a matter of balance: some schemes allow unlimited imports as a way of reducing costs for domestic industries, while others set limits to encourage domestic emissions reductions.
Enforcement of emissions rights and enabling trading
If emissions are to be managed, they must first be measured and recorded. A registry (which records the allowance holdings of scheme participants) is a pre‐requisite, along with regulations
2 The greenhouse gases covered by the Kyoto Protocol are carbon dioxide (CO2), methane(CH4), nitrous oxide (N20), hydrofluorocarbons (HFCs), perfluorocarbons (PFCs) and sulphur hexafluoride (SF6). 3 Note that it cannot however guarantee the delivery of a particular level of emissions reductions, as the actual level of reductions achieved depends on the evolution of BAU emissions.

Reviewing Existing and Proposed Emissions Trading Systems © OECD/IEA 2010
Page | 14
that specify procedures and timelines for measuring and reporting emissions. Some schemes require independent verification of emissions inventories, while others rely on self‐reporting backed by auditing. In either case, there are generally severe penalties for non‐compliance with obligations to report or surrender allowances, so that their value is not undermined.
Provisions to enable trading vary significantly among the schemes studied. The minimum requirement is that the registry contains provisions for transfer of ownership of allowances. Beyond this, some schemes set particular conditions on the trading of allowances, as an attempt to dampen speculation or market power and provide greater transparency and oversight in response to recent carbon market fraud cases. Financial and accounting rules also play a role in this area.
Reducing the impact of emissions prices on consumers and emissions‐intensive sectors
A variety of mechanisms have been used or proposed to reduce the impact of emissions prices on industry and on consumers – in terms of price uncertainty, price rises, and the potential risk of price volatility.
Some schemes include measures to phase in emissions trading slowly, to ease the transition for consumers and companies that are liable entities. For example, start dates can vary among sectors, with those that need more adjustment given longer before obligations are imposed. Another transition measure is a period during which allowances can be purchased from the government at a fixed price, giving a simpler system during the start‐up phase. Some schemes have a transitional price‐cap for allowances, to reduce uncertainty for participants during the early stages of a new scheme. Finally a scheme can also start with partial obligations: for example companies only needing to hold one allowance for every two tonnes of emissions.
Beyond the transition phase, there are also design measures that can assist participants with managing allowance price variability. Variations in economic conditions, weather patterns, the availability of offsets and the actions of other countries can affect the availability of allowances and therefore their price. “Banking” of unused allowances to future time periods allows current surpluses to be carried forward and encourages emissions reductions to be made early when mitigation opportunities are cheaper. Limited “borrowing” of allowances from future years’ allocations is also allowed in some schemes, again to manage short‐term price fluctuations.
In addition, some schemes have proposed explicit price caps or floors for the allowance price which rise with time. Price floors are intended to provide greater certainty for investors in low‐carbon technologies by guaranteeing a minimum price, while price caps are intended to limit cost uncertainty for emitters. Price caps can be “hard”, meaning that the government guarantees to sell unlimited quantities of permits at the fixed price, or they can be “soft”, for example setting aside an extra reserve of units that is made available at a trigger price. Hard caps provide certainty on price but not total emissions. Soft price caps keep total emissions capped, but cannot give a complete guarantee on prices. As discussed in Section 6.4, the merits of cap and floor prices in providing certainty are disputed.
Most schemes also include provisions aimed at protecting the competitiveness of emissions‐intensive industries against rivals that do not face emissions pricing. The most common action is to provide these industries with high levels of free allowances, sometimes covering 100% of

© OECD/IEA 2010 Reviewing Existing and Proposed Emissions Trading Systems
Page | 15
their expected emissions.4 Some schemes also allow for border taxes to be imposed on imported products in future if competitors do not face similar carbon constraints (OECD, 2009).
Finally, many schemes dedicate some allowances or auction revenue to provide compensation to consumers for rising energy prices (electricity, heating and transport fuels) through cash payments, tax reductions, or by funding household energy efficiency improvements.
Offsets and linking
Most schemes allow the use of offsets, primarily to reduce the cost of complying with emissions targets. In offsetting, credits are generated for emissions reductions made in sectors or regions not covered by the cap and these credits used to “offset” emissions within the capped region. The Kyoto Protocol’s Clean Development Mechanism (CDM) is such an offsetting mechanism. As long as the credited reductions would not have occurred anyway under business as usual conditions, the same total level of emissions reductions is made, just in a different location and at lower cost. Most schemes allow the use of CDM credits (known as CERs) and some schemes also establish their own domestic crediting schemes for sectors outside the cap, particularly agriculture and forestry.
Schemes have also generally been designed with some thought of future linking with other emissions trading systems. For regions with high domestic abatement costs, linking can significant reduce the overall cost of action. Linking will also increase market size and liquidity, particularly significant for very small schemes.
At a basic level, any schemes with comparable allowances (for example representing one tonne of emissions) and measurement framework could be linked and both regions would benefit. The region with higher domestic abatement costs benefits from the ability to source cheaper abatement and the region with lower costs is able to profit from the sale of allowances.
In practice, a number of ETS design choices will affect the ease with which linking can occur. Reduction commitments and system rules would need to be broadly commensurate, to avoid undermining targets in the more ambitious schemes. The quantity and nature of offsets allowed would also need to be mutually acceptable, as linking would allow these offsets to move between schemes. The inclusion of cap and floor prices in one linked scheme but not others would make linking particularly difficult.
4 These entities are nonetheless encouraged to reduce emissions, as they can make a profit from the sale of surplus allowances on the carbon market.
Reviewing Existing and Proposed Emissions Trading Systems © OECD/IEA 2010
Page | 16
4. The need for ambitious targets It is generally accepted that pricing emissions is a cornerstone of any serious response to climate change in market economies (OECD, 2009). Given the speed and magnitude of economic transformation required, private sector investors must be engaged. Emissions pricing gives financial incentives to guide their investments. However these signals will only deliver the desired emissions reductions if the system caps are set sufficiently stringently and with a credible long‐term reduction path.
The Intergovernmental Panel on Climate Change’s 2007 Fourth Assessment Report (IPCC, 2007) finds that if atmospheric greenhouse gas concentrations are stabilised at around 450ppm (parts per million), temperature rises have around a 50:50 chance of being kept to within 2 °C of pre‐industrial levels. To achieve this stabilisation, developed country emissions would need to be reduced 50% to 80% by 2050. More recent analyses put the required developed‐country reductions at 80% to 95% (Allison et al., 2009). The goal of limiting global temperature rises to 2 °C was endorsed as part of the Copenhagen Accord in December 2009, the first time that governments have put a specific target on long‐term emissions reductions.
The IEA World Energy Outlook (WEO) 2009 (IEA, 2009) scenarios provide an insight into the degree of change that will be required to stabilise atmospheric greenhouse gas concentrations at 450 parts per million (ppm) (and hence give a fair chance of stabilising temperatures to 2 °C) and the role that emissions trading could play in this.
In the WEO‐2009 450 Scenario, OECD+ countries5 adopt a linked ETS in the power and industrial sectors from 2013, while non‐OECD+ countries undertake national policies and measures in these sectors. International sectoral approaches (such as co‐ordinated vehicle fuel economy standards) are established in the transport, aviation/shipping and industrial sectors. National policies and measures are taken in all countries in the transport and buildings sectors. From 2020 to 2030, other major economies6 also adopt emissions trading in the power and industrial sectors.
The reduction targets delivered by emissions trading in the 450 Scenario are ambitious. In 2020 global emissions are reduced by 3.85 GtCO2eq (gigatonnes
7 of carbon‐dioxide equivalent) compared to the Reference Scenario, of which cap and trade in the OECD+ delivers 1.8 GtCO2eq (Figure 4.1). This comprises 1.2 GtCO2eq of domestic reductions in the OECD+ 8 and 0.6 GtCO2eq of offset projects in developing countries. This level of reductions corresponds to a cap for the trading scheme in 2020 of a 32% reduction compared to 2007 emissions levels, with domestic emissions 23% below 2007 levels.9 In 2030, OECD+ domestic emissions in these sectors are
5 A group that includes the OECD and non‐OECD countries in the European Union. 6 China, Russia, Brazil, South Africa and the Middle East. 7 One gigatonne equals one billion tonnes. 8 This level of domestic abatement is set as a constraint in the model, but is only marginally different from an unconstrained efficient outcome. 9 2007 emissions 6.8 Gt. Reference scenario 2020 emissions 6.4 Gt, less 1.8 Gt gives a target of 4.6 Gt in 2020, 32% below 2007 levels. Domestic OECD+ emissions are 5.2 Gt in 2020. In this scenario 0.6 Gt of the reduction is delivered through offsets, 1/3 of reductions compared to the Reference Scenario or about a quarter of the reduction below 2007 levels.
© OECD/IEA 2010 Reviewing Existing and Proposed Emissions Trading Systems
Page | 17
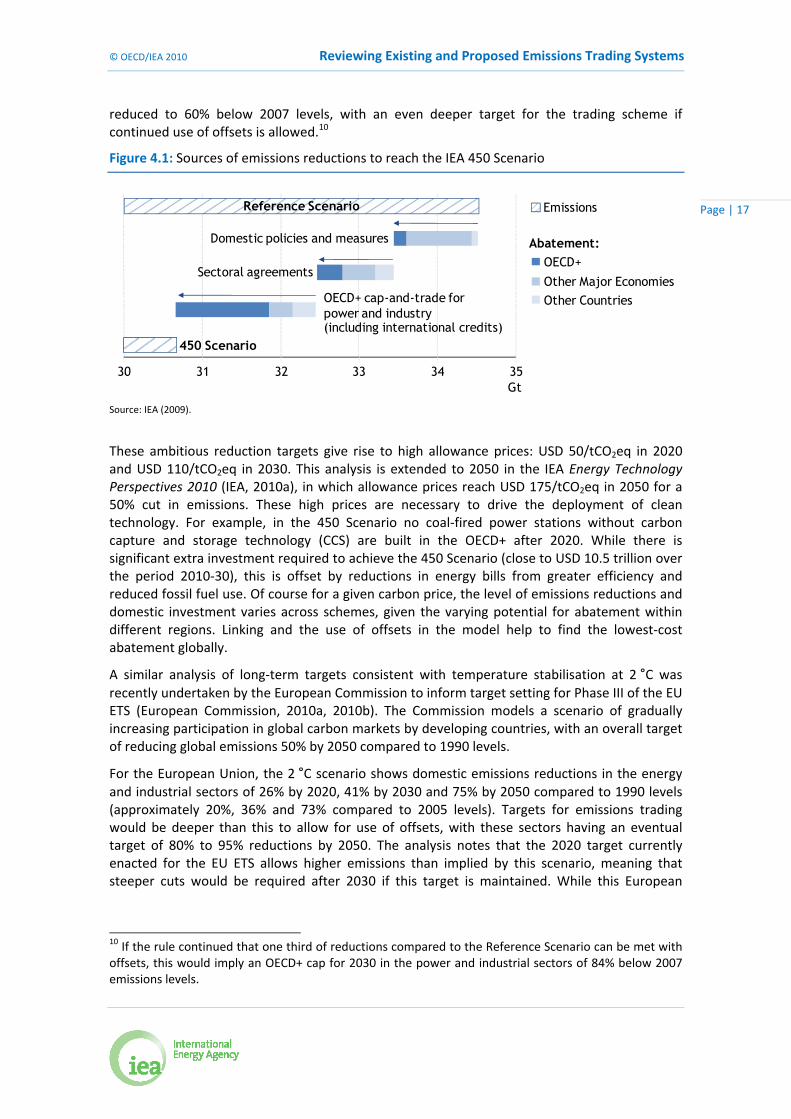
reduced to 60% below 2007 levels, with an even deeper target for the trading scheme if continued use of offsets is allowed.10
Figure 4.1: Sources of emissions reductions to reach the IEA 450 Scenario
30 31 32 33 34 35Gt
450 Scenario
Emissions
Abatement:OECD+
Other Major EconomiesOther Countries
Domestic policies and measures
Sectoral agreements
OECD+ cap-and-trade for power and industry(including international credits)
Reference Scenario
Source: IEA (2009).
These ambitious reduction targets give rise to high allowance prices: USD 50/tCO2eq in 2020 and USD 110/tCO2eq in 2030. This analysis is extended to 2050 in the IEA Energy Technology Perspectives 2010 (IEA, 2010a), in which allowance prices reach USD 175/tCO2eq in 2050 for a 50% cut in emissions. These high prices are necessary to drive the deployment of clean technology. For example, in the 450 Scenario no coal‐fired power stations without carbon capture and storage technology (CCS) are built in the OECD+ after 2020. While there is significant extra investment required to achieve the 450 Scenario (close to USD 10.5 trillion over the period 2010‐30), this is offset by reductions in energy bills from greater efficiency and reduced fossil fuel use. Of course for a given carbon price, the level of emissions reductions and domestic investment varies across schemes, given the varying potential for abatement within different regions. Linking and the use of offsets in the model help to find the lowest‐cost abatement globally.
A similar analysis of long‐term targets consistent with temperature stabilisation at 2 °C was recently undertaken by the European Commission to inform target setting for Phase III of the EU ETS (European Commission, 2010a, 2010b). The Commission models a scenario of gradually increasing participation in global carbon markets by developing countries, with an overall target of reducing global emissions 50% by 2050 compared to 1990 levels.
For the European Union, the 2 °C scenario shows domestic emissions reductions in the energy and industrial sectors of 26% by 2020, 41% by 2030 and 75% by 2050 compared to 1990 levels (approximately 20%, 36% and 73% compared to 2005 levels). Targets for emissions trading would be deeper than this to allow for use of offsets, with these sectors having an eventual target of 80% to 95% reductions by 2050. The analysis notes that the 2020 target currently enacted for the EU ETS allows higher emissions than implied by this scenario, meaning that steeper cuts would be required after 2030 if this target is maintained. While this European
10 If the rule continued that one third of reductions compared to the Reference Scenario can be met with offsets, this would imply an OECD+ cap for 2030 in the power and industrial sectors of 84% below 2007 emissions levels.
Reviewing Existing and Proposed Emissions Trading Systems © OECD/IEA 2010
Page | 18
Commission model shows a slightly slower rate of decarbonisation than the IEA 450 Scenario, it is still much faster than contemplated in any current emissions trading proposals.
Given the inherent uncertainties in long‐term modelling, no model can give a precise answer on the level of reductions that are required. Nonetheless these results clearly indicate the magnitude of change that is needed over the long term: a revolution in our energy systems. In introducing emissions trading, care therefore needs to be taken to ensure that target pathways in the early years are sufficiently ambitious for long‐terms cuts to remain achievable and that the ETS design options selected are compatible with ambitious caps in the longer term.

© OECD/IEA 2010 Reviewing Existing and Proposed Emissions Trading Systems
Page | 19
5. Current and proposed emissions trading systems A number of domestic greenhouse gas emissions trading schemes have now been implemented or proposed. These range in design from narrow regional schemes covering only electricity sector CO2 emissions, through to economy‐wide trading covering all greenhouse gases. Since the review carried out by Reinaud and Philibert (2007) many new schemes have emerged and some have been abandoned.
This chapter provides a short overview of mandatory schemes that have been established or that were under consideration in 2010 with an advanced stage of design detail available, presented chronologically. Chapter 6 provides further analysis of key design features and a detailed list of all schemes’ features is included as an Annex.
United Kingdom Emissions Trading Scheme (UK ETS) 2002‐06 (UK Department of Climate Change and Energy Efficiency, 2010a) The UK ETS ran from 2002‐06, as a precursor to the establishment of the EU ETS. Early experience gained in the United Kingdom scheme was an important contributor to trading being adopted Europe‐wide.
Participants were a mix of 32 direct participants, who participated voluntarily in return for incentive payments, and firms with Climate Change Agreements (CCAs) that wished to manage their obligations by trading. CCAs are negotiated legally binding emissions or energy reduction agreements that companies take on in order to receive an 80% discount on the United Kingdom’s Climate Change Levy (a tax on industrial energy use). Companies were able to use the UK ETS to buy allowances to cover excess emissions, or sell any surplus allowances from over‐achievement of targets. Because some CCAs were output‐linked (emissions were allowed to increase in line with production), restrictions were put in place to ensure there would be no net flow of allowances from output‐linked CCAs to the capped trading scheme. In practice, the surplus of allowances among direct participants meant that these restrictions were not required (Defra, 2006).
The Climate Change Levy and Climate Change Agreements remain in place, but companies now use the EU ETS to trade allowances.
New South Wales Greenhouse Gas Reduction Scheme (NSW) 2003‐ (IPART, 2010) The Australian State of New South Wales uses emissions trading to manage greenhouse gas emissions from the production and use of electricity, by using project‐based activities to reduce or offset production of greenhouse gases.
An annual state‐wide benchmark is set (expressed as emissions per capita), which is then apportioned to individual buyers and sellers of electricity, based on the share of demand they represent. Participants surrender certificates (representing one tCO2 of emissions reductions)

Reviewing Existing and Proposed Emissions Trading Systems © OECD/IEA 2010
Page | 20
created from project‐based activities in low‐emissions generation, reducing consumption of electricity, reducing other on‐site emissions, or the sequestration of carbon in forests.
In 2009, certificates representing 34 million tonnes of emissions reductions (34 MtCO2) were traded, at a market value of USD 117 million (World Bank, 2010).
European Union Emissions Trading System (EU ETS) 2005‐ (Ellerman, 2010; European Commission, 2010c) The European Union’s Emissions Trading System (EU ETS) is the largest and by far the most well‐developed ETS in place and is a cornerstone of Europe’s policy response to climate change. The overall cap is 6.5% below 2005 levels for 2008‐12 and will tighten to 21% below 2005 levels in 2020. The cap will be tightened further to 34% below 2005 levels if other countries also take on appropriate commitments. Discussions around tightening the target will take place in early 2011, informed by the European Commission’s work on developing a pathway for emissions reductions to 2050.
The EU ETS began with a trial phase (Phase I) from 2005‐07 and is now in its second phase of trading from 2008‐12 (Phase II). The phases have allowed for improvements. The cap was significantly tightened at the beginning of Phase II in light of improved installation‐level emissions data. The legislation underwent a major revision, agreed in 2008 based on lessons learned, agreeing significant changes that will apply to the third trading period (Phase III) which will run from 2013‐20 and beyond.
The scheme covers medium and large emitters such as electricity generators, pulp and paper, steel and cement production and combustion facilities greater than 20 megawatts thermal rating (MWth) – for example large commercial boilers. As of 2010, around 11 000 facilities in 27 member states are included, covering 45% of European CO2 emissions. Aviation is to be included from 2012 and aluminium production from 2013. Initially only CO2 was covered,
11 but from 2013 this is to be expanded to other greenhouse gases produced by processes already covered by the system.
Allocation of allowances in Phase I and II was determined by individual countries under National Allocation Plans (NAPs), based on criteria established collectively and overseen by the European Commission. The overall system‐wide cap is the sum of allocations made under the NAPs. Almost all allowances were allocated for free in Phase I and II: for example only 3% of allowances are set aside for auctioning in Phase II.
Rather than making significant emissions reductions, the objectives for Phase I were to establish the infrastructure for trading, gain experience and to test the rules that had been put in place. Modest initial targets also reflected the quick start‐up of the scheme, with companies having had little time to move to lower‐emissions production before trading commenced. Phase I targets were set (after downward adjustment by the European Commission) to below expected business as usual (BAU) levels. However when the first year’s audited emissions inventories were released, it became apparent that emissions would nonetheless be below the level of the cap. The resulting surplus of allowances and, most of all, the inability to bank them for future use caused the market price to crash – although the decision not to allow banking between the 11 In Phase II, countries are allowed to unilaterally include other gases or activities. Austria, the Netherlands and Norway have unilaterally opted in nitrous oxide from nitric acid production. The United Kingdom is consulting on the same opt‐in.
© OECD/IEA 2010 Reviewing Existing and Proposed Emissions Trading Systems
Page | 21
trial phase and Phase II ensured that the over‐allocation from the start‐up phase was not carried over into future years, protecting the level of ambition of the system going forward and ensuring its coherence with member states’ Kyoto Protocol commitments starting in 2008. The Phase I over‐allocation is largely attributed to the lack of availability of good data during the development of NAPs, both on emissions and emissions trends. Despite the over‐allocation, analysis has shown that emissions reductions were made in Phase I, estimated at between 2% and 5% (120 MtCO2eq and 300 MtCO2eq).
Phase II from 2008‐2012 was designed to coincide with the first commitment period of the Kyoto Protocol and is a major mechanism for meeting Europe’s Kyoto commitments. The draft Phase II NAPs were significantly tightened by the European Commission on the basis of improved emissions data, reported under the EU ETS legislation when it came into force in 2005 and the overall level of allocation was eventually set to 6.5% below actual 2005 emissions. Around 280 MtCO2eq of offset credits (credits for emissions reductions undertaken elsewhere via the Kyoto Protocol’s Clean Development Mechanism [CDM] and Joint Implementation [JI]) can be imported into the scheme each year and used towards firms’ compliance obligations. As these offset credits are generally cheaper than reducing emissions locally, they reduce the compliance costs for participants. Offsets from forestry and nuclear projects are not permitted.
Unexpectedly, Phase II has also turned out to be over‐supplied, largely due to the sharp drop in industrial output and power generation in 2008 and 2009. However the price of allowances has not collapsed, because unlike Phase I, allowances are now able to be banked for use in future trading periods. The tougher target for Phase III has supported demand for allowances and therefore allowance prices. Allowance prices traded around EUR 25/tCO2eq for much of 2008, before tumbling as industrial production and electricity generation fell with the recession, along with demand for allowances. Since mid‐2009, allowances have traded in a range between EUR 13/tCO2eq and EUR 16/tCO2eq.
For Phase III, allocation decisions will be centrally co‐ordinated by the European Commission so that industries are treated equally across member states, with harmonised rules for auctioning, allocation, treatment of new entrants, criteria for receiving free allocation and allowed use of offset credits. There will be a significant increase in auctioning, with more than 50% of units auctioned from 2013, increasing each year. In general there will be no free allocation for electricity generators in Phase III, to address concerns about windfall profits to this sector. Allocation to energy‐intensive industries will be benchmarked against industry best practice and allocation to other industries will be significantly reduced, phasing out completely by 2027. The total quantity of allowances allocated to industry (energy‐intensive and other) will decrease in line with the overall cap, reducing by 1.74% per year from 2013.
In 2009, 6 326 MtCO2eq of allowances were traded in the EU ETS, at a market value of USD 118 billion (World Bank, 2010).12
Norway 2005‐ Participant in EU ETS (with adaptations) from 2008 (Norwegian Ministry for the Environment, 2009; Alstadheim, 2010)
Norway launched domestic emissions trading in 2005, originally not connected with the EU ETS. The trial scheme covered approximately 10% of national emissions (mostly in industry). Just as in the EU ETS, supply of allowances exceeded demand during the initial phase and the
12 This reflects the total traded volumes, not net transfers between buyers and sellers.
Reviewing Existing and Proposed Emissions Trading Systems © OECD/IEA 2010
Page | 22
allowance price fell to zero. However valuable experience was gained in allocation, monitoring, reporting and verification.
From 2008 Norway’s trading scheme has been part of the EU ETS, covering 110 to 120 installations and about 40% of Norway’s emissions. As part of the European Economic Area, Norway is able to participate in the European market by implementing the EU ETS Directive in Norwegian law, with negotiated adaptations. These adaptations include more ambitious targets, a much lower level of free allocation and the inclusion of additional emissions – Norway has unilaterally included nitrous oxide from nitric acid production.
There is also a higher degree of auctioning than in other EU ETS countries. For the period 2008‐12, only around 30% of installations’ emissions are covered by free allocation. This is largely because there is no free allocation for offshore oil and gas production, which constitutes 64% of capped emissions.13 Land‐based industries receive higher allocations, comparable to elsewhere in Europe.
Alberta, Canada 2007‐ (Government of Alberta, 2010)
Alberta’s trading scheme covers around 100 very large emitters (over 100 000 tCO2 per year), such as oil sands mines and coal‐fired power plants. These make up around 70% of Alberta’s industrial greenhouse gases. These participants are required to reduce their emissions intensity (emissions per unit of production) by 12% from 1 July 2007. Because it is an output‐based scheme, absolute levels of emissions may still rise. Companies can make efficiency improvements, purchase Alberta‐based offset project credits, buy allowances from companies that over‐achieve on their targets, or pay CAD 15/tCO2 into a fund to invest in emissions‐reducing technologies. Further reductions of 2% per year will be required in subsequent years.
Switzerland 2008‐ (FOEN, 2009, 2010)
The Swiss ETS runs from 2008 to 2012, to coincide with the Kyoto Protocol’s first commitment period. Companies that take on a legally binding commitment to reduce energy‐related CO2 emissions can receive exemption from the country’s CO2 tax on heating fuels, currently set at CHF 36/tCO2 (EUR 26/tCO2). Targets are negotiated on a case‐by‐case basis, using information on the technical and economic potential of companies to make emissions reductions. Around 350 companies are covered by the scheme.
Allowances are allocated for free up to the level of their negotiated target and each year companies must submit allowances to match their level of CO2 emissions. Additional allowances must be purchased to cover any emissions above the target level – either by trading with other companies that have reduced emissions beyond their target, or by purchasing credits from offset projects (which can be used to cover a maximum of 8% of the target). In the case of non‐compliance, the full CO2 tax must be paid on every tonne of emissions since the date of exemption.
13 These installations had previously faced a high carbon tax which was reduced in 2008 so that their total costs were maintained at a similar level.
© OECD/IEA 2010 Reviewing Existing and Proposed Emissions Trading Systems
Page | 23
The Swiss government has initiated discussions aimed at linking the scheme to the EU ETS from 2013 (Point Carbon, 2009).
New Zealand 2008‐ (New Zealand Ministry for the Environment, 2010; NZIER/Infometrics, 2009; PricewaterhouseCoopers, 2008)
New Zealand’s ETS will, once fully phased in, have the most comprehensive coverage of any system in operation or planned: it covers all sectors of the economy and the six Kyoto Protocol greenhouse gases. Forestry activities (credits for afforestation and emissions from harvesting or deforestation) have been covered since January 2008. From July 2010, energy, industrial and transport emissions have also been included in the scheme. The waste sector (predominantly landfill emissions) will come under the scheme in 2013 and agricultural methane and nitrous oxide from 2015.
There is no explicit cap or domestic target for emissions reductions in the New Zealand system.14 Rather, it relies on being fully linked to the international Kyoto Protocol market: New Zealand companies can emit as much as they wish as long as allowances are purchased internationally or from forestry companies to cover these emissions.15 The intention is that rather than setting a particular target, the international market price will be brought into the New Zealand economy and stimulate appropriate levels of emissions reductions.
The scheme uses a mixture of upstream and downstream liable entities. For example, electricity generators are responsible for on‐site emissions, whereas transport emissions are accounted for upstream when fuel is imported or refined. There will be some free allocation of units to the forestry and fishing sectors (as transitional assistance) and ongoing free allocation to emissions‐intensive industries and agriculture. There is no free allocation for electricity generation.
In 2009, following a change of government, significant amendments were made to the design of the New Zealand ETS, to align support for industry closely with Australia’s proposed scheme (see below). Free allocation to emissions‐intensive industries was changed to an output‐based approach, to allow production levels to increase without penalty and this support now phases out much more slowly.
The first two years (2010‐12) are a transition phase. Energy, industrial and transport emissions must submit only one allowance for every two tonnes of emissions. There is also a fixed‐price option of NZD 25/tCO2eq during the transition phase. These measures effectively cap the price at NZD 12.50/tCO2eq (EUR 7/tCO2eq) during the transition phase.
The current government has indicated that it will not proceed to full trading in 2013 and will not bring the agriculture sector into the scheme in 2015, unless other countries are also taking action to reduce greenhouse gases.
14 The government will not issue more allowances than its Kyoto Protocol balance, so there is a “cap” of sorts in the initial allocation. However unlimited use of forestry credits and international Kyoto Protocol allowances mean that the level of this initial allocation will be of little relevance in setting the market price of emissions. 15 Unlimited use is allowed of Kyoto Protocol CERs (CDM credits), RMUs (forestry credits), ERUs (JI credits) and “approved” AAUs (assigned amount units).
Reviewing Existing and Proposed Emissions Trading Systems © OECD/IEA 2010
Page | 24
Regional Greenhouse Gas Initiative (RGGI), United States 2009‐ (Snyder, 2010; RGGI, 2010)
RGGI is a mandatory trading scheme that caps emissions from power generation in ten north‐eastern US states (Connecticut, Delaware, Maine, Maryland, Massachusetts, New Hampshire, New Jersey, New York, Rhode Island and Vermont). Generators over 25 megawatts (MW) in size are included, covering 95% of emissions from the electricity sector. The trading scheme is enforced by state laws and regulation within each individual state.
The target for the initial phase of trading is stabilisation of emissions at current levels for 2009‐14, then reducing to reach 10% below 2009 levels in 2018. Offsets are allowed to be used for 3.3% of a company’s compliance obligation (rising to 10% in the event that allowance prices reach USD 10/tCO2, adjusted for inflation).
There is no free allocation of allowances, rather, they are auctioned by states. Because of the modest initial target, reduced electricity demand due to the recession and lower than expected natural gas prices, the market has been over‐supplied with allowances and the price has fallen to near the system floor‐price of USD 1.86/tCO2. While this is too low to provide an incentive for emissions reductions, allowance sales have still raised more than USD 662 million as of June 2010. Over 90% of these proceeds have been used to support consumer benefits, energy efficiency and renewable energy.
In 2009, 805 MtCO2 were traded at a market value of USD 2 179 million (World Bank, 2010).
Tokyo 2010‐ (Tokyo Metropolitan Government, 2010)
The Tokyo Metropolitan Authority launched its emissions trading scheme on 1 April 2010, covering 1 400 installations (offices, commercial buildings and factories) that emit 40% of Tokyo’s industrial and commercial CO2 emissions. Obligations are applied downstream, applying to CO2 from the electricity and fuel use of individual factories and buildings. Large tenants in commercial buildings are required to participate in developing emissions reduction plans.
The scheme is intended to help deliver on Tokyo’s target for a reduction of 25% on 2000 levels of emissions by 2020.
Over 2010‐14, participants will be required to achieve absolute reductions of 6% to 8% below the 2002‐07 baseline. In the second period from 2015‐20, a target of around 17% below baseline levels is envisioned. Facilities that have made outstanding progress can have their compliance obligation reduced.
To meet targets, entities can reduce emissions, purchase allowances from those that over‐achieve, surrender renewable energy certificates, use domestic offset credits from energy efficiency projects in small and medium businesses in Tokyo that are not covered by the emissions trading scheme, or within limits use offsets from outside of Tokyo. A long five‐year compliance period has been set, with the aim of encouraging participants to implement phased energy saving programmes rather than simply using the trading mechanisms for compliance.
Similar schemes are being explored by the Saitama and Kyoto prefectures, to start in 2011.
© OECD/IEA 2010 Reviewing Existing and Proposed Emissions Trading Systems
Page | 25
UK CRC Energy Efficiency Scheme 2010‐ (UK Department of Energy and Climate Change, 2010b)
The Carbon Reduction Commitment (CRC) Energy Efficiency Scheme in the United Kingdom is a mandatory emissions reduction programme for around 5 000 large businesses and public sector organisations using over 6 000 megawatt‐hours (MWh) of electricity per year. It covers CO2 emissions from direct fuel use and indirect emissions from electricity. A further 15 000 organisations have reporting requirements.
The scheme began in April 2010 with a three‐year introductory period, in which allowances are available from the government at a fixed price of GBP 12/tCO2.
In the current design of the scheme (now under review), this introductory period was to be followed by an emissions trading scheme with five‐year trading periods, with a capped pool of allowances set after advice from the independent Committee on Climate Change. Allowances from the EU ETS were also to be allowed into the scheme as a safety valve against high prices. All allowances were to be auctioned, with revenues recycled back to scheme participants. Annual “league tables” ranking the performance of participants were to be published, based on five‐year rolling improvements in emissions and emissions intensity. Auction revenues were to be distributed based on league table rankings. Companies that performed well would therefore have received more revenue back than they paid for allowances.
In September 2010, the Committee on Climate Change recommended that the emissions trading component of the scheme be dropped, replaced by an ongoing flat‐rate charge (a carbon tax). They saw auctioning as unnecessarily complex for the relatively small emitters in the scheme and as such would result in high compliance costs (CCC, 2010).
As part of the October 2010 comprehensive spending review (UK Treasury, 2010), the United Kingdom government decided that revenue from the sale of CRC allowances (GBP one billion per year by 2014‐15) will now be retained by the government rather than being recycled to scheme participants. The government has indicated that it will simplify the scheme, but has not yet indicated whether allowances will continue to be auctioned and traded, or sold at a fixed price.
Western Climate Initiative (WCI), United States and Canada Planned start 2012 (WCI, 2010a, 2010b)
The Western Climate Initiative (WCI) is a collective ETS agreed between 11 US states and Canadian provinces. Trading is scheduled to begin in 2012 with a smaller group of five participants (California, New Mexico, British Columbia, Ontario and Quebec).16 The scheme will be enacted as individual trading systems in state and provincial laws, linked by mutual recognition.
The programme is designed to reduce emissions to 15% below 2005 levels by 2020, which is the sum of the partners’ emissions goals. Allocations will start with a best‐estimate of actual emissions in 2012. The scheme will have a broad scope once fully phased in, covering 90% of economy‐wide emissions and entities emitting greater than 25 000 tCO2eq per year. The
16 The other WCI member US states (Washington, Oregon, Montana, Utah and Arizona) and Manitoba may join trading at a later date.
Reviewing Existing and Proposed Emissions Trading Systems © OECD/IEA 2010
Page | 26
electricity and industry sectors are included from 2012, while transport, industrial commercial and residential fuels join in 2015.17 Electricity imported into the WCI region is included in the cap.
The scheme has three‐year compliance periods and unlimited banking to allow flexibility. Auction price floors will be included and measures to mitigate high prices (such as reserves or allowing early use of future years’ allowances) are still being considered.
The distribution of allowances will be at the discretion of each partner, reminiscent of the National Allocation Plans in the first two phases of the EU ETS. Partners have undertaken to consider harmonising allocation if competitiveness issues are identified.
Harmonised offset standards have been developed with RGGI and the Midwestern Greenhouse Gas Reduction Accord (a similar collective trading effort among Midwestern states, which does not yet have a target start date). Linking with these other schemes is anticipated in future. Units from offsets and linked schemes are limited to 49% of emissions reductions, so that capped entities are required to make the majority of reductions locally.
California Planned start 2012 (CARB, 2010a, 2010b)
In November 2010 California released its draft emissions trading programme design for public comment. The scheme aims to deliver California’s legally‐binding target of returning emissions to 1990 levels by 2020, under its AB32 law, and when fully phased in will cover 85% of California’s emissions. The emissions trading scheme cap is approximately a 15% reduction on 2012 levels by 2020.
The scheme will cover approximately 600 facilities, starting with electricity generators and large industrial sites (>25 000 tCO2e/year) in 2012. The scheme expands to cover natural gas and liquid fuels in 2015. It will cover the six Kyoto gases and nitrogen trifluoride (NF3).
At the beginning of the scheme allowances are primarily allocated freely, with the intention to phase this out over time. Energy‐intensive industry will receive free allocation based on sector‐specific benchmarks and recent production levels. Electricity sector allocation will be to distribution companies (with the requirement that they pass on the value of allocation to consumers), and not to generators. For those allowances that are auctioned a price floor of USD 10/tCO2eq applies, which will rise at inflation plus 5%. Auction purchase limits and allowance holding limits are proposed to mitigate market power.
Offsets may be used for 8% of the compliance obligation. Four domestic offset protocols have been proposed (forestry, urban forestry, livestock manure management, and ozone depleting substances). The California Air Resources Board, which administers the scheme, may approve offsets from other schemes including sector‐based credits such as from reduced deforestation (REDD) projects.18
Around 5% of allowances are set aside as a cost‐containment reserve. These will be offered quarterly at a fixed price (starting at USD 40/tCO2eq in 2012), rising at 5% above inflation. Any
17 Individual states and provinces have discretion over which sectors will participate. 18 REDD (Reducing Emissions from Deforestation and Forest Degradation) is a crediting scheme being developed as part of the post‐2012 international framework to provide credits for avoided tropical deforestation.
© OECD/IEA 2010 Reviewing Existing and Proposed Emissions Trading Systems
Page | 27
allowances unsold at auction will be added to the reserve, but it will not otherwise be replenished.
Supplementary policies are expected to have a significant role in reducing emissions in the capped sectors, in addition reductions resulting directly from the carbon price. In the capped sectors, baseline emissions in 2020 are forecast at 409 MtCO2eq. Of the reductions required to meet the 334 MtCO2eq cap, 18 MtCO2eq are expected to be delivered by the trading scheme directly, and the remainder by complementary policies.
Linking with partner WCI jurisdictions is anticipated, but these must be approved on a case‐by‐case basis. Before linking, harmonisation of key features would be required including stringency of caps, offset criteria, auction floor prices, cost‐containment reserves, banking, borrowing, and provisions for measurement, reporting, verification, and enforcement.
Australian Carbon Pollution Reduction Scheme (CPRS) Will not proceed in this form, but a similar proposal is possible following the current review. (Australian Department of Climate Change and Energy Efficiency, 2008; Australian Treasury, 2008; Australian Government, 2009a, 2009b);
Legislation to enact the Australian Carbon Pollution Reduction Scheme (CPRS) was passed by Australia’s lower house of Parliament in 2009, but agreement was not reached in the Senate. The Australian government still supports emissions trading as a climate policy tool and has set up a parliamentary committee to review the best way of introducing carbon pricing to the Australian economy. The committee will consider carbon taxes, emissions trading and hybrid approaches (Australian Government, 2010). Given the extensive work that has already been undertaken in design of the CPRS scheme, elements of it may form part of Australia’s policy response following the review.
The CPRS was intended to help meet Australia’s commitment to a 5% cut in greenhouse gas emissions on 2000 levels by 2020 (or 25% in the event of a comprehensive global agreement) and was to commence in 2011. It covered all six Kyoto Protocol gases, in around 1 000 installations with emissions over 25 000 tCO2eq per year in the energy, industrial and transport sectors. Agricultural emissions were excluded, although the original scheme design had allowed for their inclusion. Emissions from deforestation were exempt, but afforestation activities could opt in to the scheme.
To provide certainty for participants, emissions caps for the scheme were to be set at least five years in advance and signalled a further 10 years out by giving “gateway” ranges for the cap.
The scheme would have phased in with a one‐year fixed price period (AUD 10/tCO2eq) and the inclusion of a price cap for the first five years of trading set at AUD 40/tCO2eq rising at 5% above inflation. Fuel price impacts would also have been phased in, with a cent‐for‐cent reduction in fuel excise until 2013. Permits bought through the price‐cap mechanism would not be able to be traded or banked for future use. Otherwise, unlimited banking was to be allowed.
There was to be a ban on exporting units from the scheme during the first five years, however unlimited use of CDM and JI offset allowances were allowed to further contain prices. Kyoto Protocol assigned amount units (AAUs) were not accepted in the scheme.
Approximately 70% of units would have been auctioned at the outset of the scheme, with the remainder allocated to emissions‐intensive industries linked to their level of production. The absolute level of allocation to industry was expected to rise over time, because production was expected to increase more quickly than the phase‐out of support.
Reviewing Existing and Proposed Emissions Trading Systems © OECD/IEA 2010
Page | 28
One‐off free allocations were to be made to high emissions coal mines and to compensate very intensive coal generators for their stranded costs (subject to a windfall gains test). Auction revenues were to fund household assistance, energy efficiency, information provision and community adjustment and to cover the cost of purchasing international allowances to meet the government’s overall emissions reduction target.
H.R.2454: American Clean Energy and Security (ACES) Act of 2009 Passed US Congress 2009. Will not proceed in this form, but similar proposals may be debated in future. (Holt and Whitney, 2009; EPA, 2009, 2010a, 2010b, 2010c; EIA, 2009; CBO, 2009; Pew Center on Global Climate Change, 2010)
This legislation is the first greenhouse gas emissions trading scheme to have been passed by the United States House of Representatives. It will not proceed in 2010 due to lack of support in the Senate, however similar proposals may be debated in future years.
H.R.2454 would have set up an ETS covering seven greenhouse gases19 for around 7 400 companies in the energy, industrial and transport sectors which emit more than 25 000 tCO2eq per year. Aviation and home heating fuels were included through upstream coverage of fuel suppliers. Agriculture and forestry were excluded from the cap, but projects in these sectors could qualify as offsets. Uniquely in comparison to other schemes, the cap was specified out to 2050 to provide a clear long‐term signal to investors. On 2005 levels, the cap was a 17% reduction in 2020, a 42% reduction in 2040 and an 83% reduction in 2050 (though of course this path was subject to reviews). The scheme was to have commenced in 2012, with industrial sources entering in 2014 and natural gas distributors in 2016. Once fully phased in, it would have covered 85% of United States emissions.
Significant use of offsets was allowed, aimed at reducing costs for participants. If all entities maximised their use of offsets, two billion tonnes per year would be allowed (although modelling suggests that around one billion per year would be a more likely demand). Starting in 2018, international offsets would be discounted (1.25 offset units required for each emissions allowance).
The system allowed unlimited banking and unlimited borrowing from one year ahead, effectively creating a two‐year rolling compliance period. Borrowing was allowed (with interest) from future years for up to 15% of obligations.
Initially, 85% of allowances would have been allocated for free. Of this, 20% was to selected market participants (including emissions‐intensive firms) and the remainder was used to support clean technology and energy efficiency, and to reduce the impact of the scheme on consumers. By 2030, 65% of allowances were to be auctioned as free allocation phased out.
Auctioned units were to be offered with a floor price (USD 10 in 2012, rising at 5% above inflation), with the intention of providing greater price certainty for low‐carbon investment. There was also a strategic reserve of units set aside as a mechanism to control price spikes in the market. These reserve allowances would be offered at quarterly auctions, with a reserve price of USD 28 in 2012, rising 5% in 2013 and 2014, then set at 60% above the three‐year rolling average market price.
Free allowances were to be given to emissions‐intensive industries based on production levels, to cover 100% of industry‐average emissions. However, the total pool was capped at 15% of all
19 The six Kyoto gases and nitrogen trifluoride (NF3).

© OECD/IEA 2010 Reviewing Existing and Proposed Emissions Trading Systems
Page | 29
allowances, phasing out to zero between 2026 and 2035. The president was given the ability to alter this phase‐out if other countries are not taking adequate action. If there was inadequate international action, border adjustments were also be introduced in 2020, requiring importers to purchase allowances for their products.
The legislation also contained a renewable portfolio standard, funding for carbon capture and storage, regulation of sources not covered by the trading scheme (such as landfills), support for energy efficiency and building codes and would have removed the Environmental Protection Agency (EPA)’s ability to regulate greenhouse gas emissions from sources covered by the trading scheme.
Other schemes under consideration
Korea (Ministry of Environment Republic of Korea, 2010)
The Korean government intends to submit legislation in 2010 to establish an ETS. The scheme will assist in delivering Korea’s target of a 30% improvement on BAU emissions by 2020, as part of its overall green growth strategy. Details are still being developed, but it will reportedly cover around 600 large companies responsible for 70% of Korea’s emissions, starting in around 2012.
Japan (Toda, 2010)
Japan’s government intends to pass legislation in 2010 requiring the establishment of a mandatory ETS. Design details would be brought back to Parliament within one year of passage of the bill.
There are some voluntary emissions trading schemes in Japan including experimental ones such as Japan’s Voluntary Emissions Trading Scheme which was established in 2005 and another voluntary experimental ETS launched in 2008.
Brazil (Point Carbon, 2010a; Lubowski and Piris‐Cabezas, 2010)
Brazil is considering introduction of a domestic ETS, to help deliver its target of reducing emissions by up to 38.9% by 2020. The role of a carbon market is being studied for reducing emissions in the power, transport, agribusiness and industrial sectors. Further details may be available in 2010.
China (China Daily, 2010)
China is reportedly considering setting up a pilot domestic ETS as part of its 12th 5‐year plan (2011‐15). The pilot scheme could cover a particular industry, or a certain region. Absolute and intensity‐based caps are reportedly being considered.

Reviewing Existing and Proposed Emissions Trading Systems © OECD/IEA 2010
Page | 30
Ukraine/Russia/Kazakhstan/Belarus (Point Carbon, 2010b)
Ukraine is exploring the possibility of a regional carbon market with neighbours Russia, Kazakhstan and Belarus, covering power generators and potentially large industrial sources. Ukraine may proceed with a single carbon market if the other countries do not wish to join.
Chile (Point Carbon, 2010c)
In September 2010 the Chilean government hosted a conference on emissions trading and appointed consultants to report on options for implementation of a trading scheme in Chile.
Turkey (Point Carbon, 2010d)
Turkey is exploring establishment of a domestic carbon market as a tool for facilitating crediting and carbon finance from developed countries, potentially through bilateral agreements.
Mexico (Bloomberg, 2009)
Mexico has undertaken some early design work on emissions trading for its cement, petroleum and electricity sectors.
© OECD/IEA 2010 Reviewing Existing and Proposed Emissions Trading Systems
Page | 31
6. Design features and key lessons This chapter reviews how key design issues have been addressed in the various schemes studied. These design choices need to be seen in the wider context of international action on climate change. For countries that are parties to the Kyoto Protocol, national trading schemes implemented thus far have been designed to operate within the Kyoto emissions trading framework and to support the achievement of Kyoto Protocol commitments.
Many proposed schemes will operate within the uncertain framework for post‐2012 action, in which the tools for delivering developed countries’ emissions reduction pledges are likely to be left to individual countries to develop.20 In this context, the design choices made by developers of new emissions trading schemes are critical, as these schemes will form major building‐blocks in a future global mitigation framework. To the extent that key design features can be aligned to allow easy linking of schemes in future, the cost of meeting emissions targets can be reduced.
6.1. Coverage Emissions trading schemes that have been designed or implemented range in coverage from power‐sector only to economy‐wide, from CO2‐only to seven greenhouse gases. These choices have been deliberate and have been influenced by a number of factors, discussed below.
The intention of the scheme
Is it designed to deliver external commitments? Make significant domestic emissions reductions? Or simply to begin to introduce a price on emissions that influences behaviour?
One of the attractions of emissions trading as a policy tool is that it provides certainty of outcome: emissions will be constrained by the level of the cap. Some emissions trading schemes have been implemented specifically with this in mind – to give certainty of delivery of an external commitment or target. For example, the design of New Zealand’s emissions trading scheme is tied closely to the architecture of the Kyoto Protocol. Once the scheme is fully phased in, the broad coverage of the scheme means that the New Zealand government’s external Kyoto Protocol commitments will essentially be passed on in full to participants in the trading scheme21 and New Zealand’s international compliance is assured, irrespective of actual emissions levels. All six Kyoto gases are included in the scheme, which in this case is important for delivering the emissions target, because non‐CO2 gases comprise over half of New Zealand’s emissions.
Similarly, the North American WCI, Californian, and H.R.2454 schemes propose broad coverage of sectors and gases to provide greater assurance that long‐term emissions targets (this time self‐imposed rather than external) will be delivered.
20 An international agreement covering emissions reduction commitments, key standards for measurement reporting and verification and assistance mechanisms for developing countries is clearly needed, but the choice of tools for delivering emissions reductions is likely to be left to individual countries. 21 The New Zealand government will continue to manage deforestation liabilities and afforestation credits for foresters that do not opt in to the scheme.

Reviewing Existing and Proposed Emissions Trading Systems © OECD/IEA 2010
Page | 32
Certainty of outcome would equally be of interest to developing countries considering participation in future sectoral crediting mechanisms: an appropriately designed domestic trading scheme could guarantee delivery of the target emissions or emissions‐intensity level and hence give greater certainty over delivery of credits (Baron, Buchner and Ellis, 2009).
Other schemes aim to make significant emissions reductions locally, rather than just providing a trading mechanism to ensure target compliance. The EU ETS is an obvious example. It forms part of a wider set of policies to deliver economy‐wide emissions reductions, with analysis undertaken to determine a cost‐effective division of effort between those sectors covered by the scheme (energy, industry) and those that are not (e.g. transport, residential). The Swiss trading scheme similarly forms a part of an overall policy package targeted at a particular sector, but with the CO2 levy being the principal policy. The United Kingdom CRC energy efficiency scheme also targets a particular sector’s emissions as part of an overall reduction plan.
Some schemes have been established independently and do not form part of an economy‐wide policy package. Several of these schemes allow emissions to continue increasing, either by design (by setting output‐based targets as in Alberta), or inadvertently (by use of questionable offsets as in New South Wales [Australian Government, 2010b] or because of weak targets as in the RGGI). Many of these stand‐alone schemes only intend to be a first step towards emissions trading, with a major purpose being to establish a framework for emissions measurement, management and verification and to begin to introduce a price that draws attention to emissions. As such, the low allowance prices arising in these schemes should not be surprising and does not necessarily mean that the schemes are not serving a purpose.
The availability of emissions data for those sectors to be included in a trading scheme
In establishing the EU ETS, coverage was limited to CO2 from large emitters in the power and industrial sectors. This was, in part, a pragmatic response to the lack of good baseline emissions data and a desire to focus effort on collecting high quality information at a smaller range of sites, which in turn would ensure emissions‐reduction activities were accurately measured and rewarded. Rules for the introductory phase of the EU ETS (2005‐07) were designed to reflect the lack of initial data: in particular, banking of allowances from this phase to the next was not allowed, in case baseline emissions were over‐estimated.
Conversely, New Zealand’s later start to trading meant that it had already developed measurement tools for other greenhouse gases and more difficult sectors such as agriculture and forestry, as part of its Kyoto Protocol obligations.22 For these sectors measurement is generally based on proxies: for example, using an average sequestration per hectare of forestry at a given forest species, age and location rather than measuring actual carbon stored in each hectare of forest. As such, the scheme creates a price signal for the general activity: planting more trees is rewarded and deforestation is penalised, however more detailed management decisions are not rewarded or penalised. Similarly, agricultural methane and nitrous oxide are difficult to measure and emissions are highly variable among individual animals, farming practices and locations. Use of proxy data can allow trading to be extended to these sectors (as
22 The importance of these sectors to New Zealand’s emissions profile means that under Kyoto rules, it is required to use more sophisticated measurement and reporting tools than countries where these sectors have few emissions. The New Zealand scheme also covers mainly plantation forestry, which is more uniform and easily measured than forestry in many other countries.

© OECD/IEA 2010 Reviewing Existing and Proposed Emissions Trading Systems
Page | 33
in the New Zealand case), but the measurement of emissions in these sectors will not be as accurate as in the power, industrial and transport sectors.
The different levels of data availability for sectors and gases therefore require a judgment to be made balancing the benefits to be gained from wider coverage against the increased cost of measurement and the potential inequalities created by holding different sectors accountable to different measurement standards.
The costs and benefits of including small sectors and small sources
Emissions in some sectors are small compared to total emissions, may be too difficult to monitor, or be adequately covered by existing policies. As such, the cost of extending the emissions trading scheme to cover these sectors can outweigh the environmental benefits. For example, agricultural emissions are only 9% of the European Union’s total emissions and they declined 20% between 1990 and 2006 (European Commission, 2009). Emissions in this sector are difficult to measure accurately, so their inclusion in a trading scheme could come at high cost, for a relatively small reduction in emissions.
Schemes generally set a size threshold for inclusion of participants, in terms of annual emissions, of heat or electricity production or consumption. The EU ETS sets an energy based threshold (20 MWth) for combustion, which has led to some small emitters to be captured by the scheme. From Phase III, there is an option to exclude small facilities with emissions less than 25 000 tCO2eq per year if they are covered by other policies.
Current discussions on the future of the United Kingdom CRC scheme echo this point. The Committee on Climate Change has found that emissions trading is too complex to be justified for the small emitters participating in the scheme and the government has expressed an intention to simplify the design.
Some gases that are emitted in small quantities or used for limited applications may also be more cost‐effective to manage through regulation than price measures. For example the European Union regulates the use and recovery of refrigerants and of SF6 in electrical transmission equipment, rather than including these gases in the EU ETS. Most schemes exclude the waste sector (methane from landfill gas emissions), instead imposing regulations to require landfill gas capture.
Targeting schemes on sectors with the greatest potential for abatement and greatest ability to respond to price signals
A number of emissions trading schemes have chosen to focus (at least initially) only on the power sector (NSW, RGGI), or only on the power and industrial sectors (EU ETS, Switzerland, Alberta).
In most cases, these are the sectors expected to respond most quickly to an emissions price in the short term, bringing forward the alternative technologies that already exist or are being developed. Particularly in the power sector, rapid decarbonisation is possible and expected, if emissions prices are allowed to reach sufficient levels.
EPA modelling of the emissions reductions from the economy‐wide trading scheme proposed under the H.R.2454 proposal shows that while there are notable emissions reductions in the energy intensive manufacturing and “other” sectors, by far the most significant reductions occur
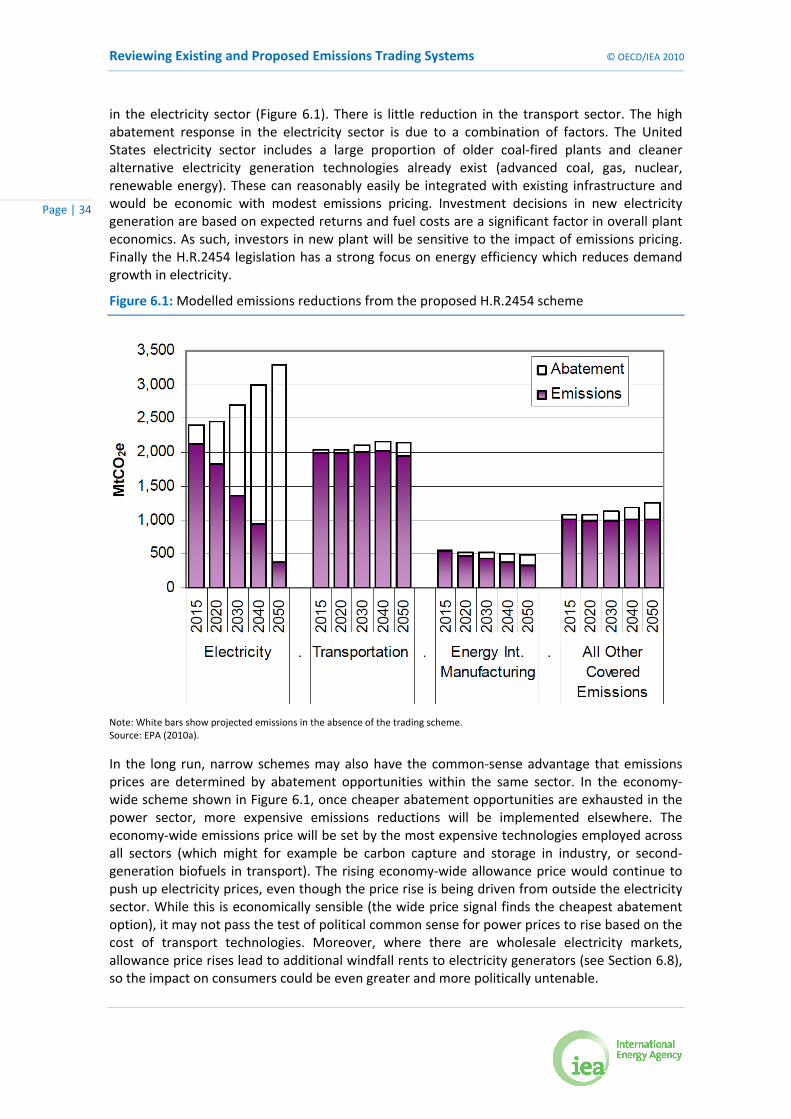
Reviewing Existing and Proposed Emissions Trading Systems © OECD/IEA 2010
Page | 34
in the electricity sector (Figure 6.1). There is little reduction in the transport sector. The high abatement response in the electricity sector is due to a combination of factors. The United States electricity sector includes a large proportion of older coal‐fired plants and cleaner alternative electricity generation technologies already exist (advanced coal, gas, nuclear, renewable energy). These can reasonably easily be integrated with existing infrastructure and would be economic with modest emissions pricing. Investment decisions in new electricity generation are based on expected returns and fuel costs are a significant factor in overall plant economics. As such, investors in new plant will be sensitive to the impact of emissions pricing. Finally the H.R.2454 legislation has a strong focus on energy efficiency which reduces demand growth in electricity.
Figure 6.1: Modelled emissions reductions from the proposed H.R.2454 scheme
Note: White bars show projected emissions in the absence of the trading scheme. Source: EPA (2010a).
In the long run, narrow schemes may also have the common‐sense advantage that emissions prices are determined by abatement opportunities within the same sector. In the economy‐wide scheme shown in Figure 6.1, once cheaper abatement opportunities are exhausted in the power sector, more expensive emissions reductions will be implemented elsewhere. The economy‐wide emissions price will be set by the most expensive technologies employed across all sectors (which might for example be carbon capture and storage in industry, or second‐generation biofuels in transport). The rising economy‐wide allowance price would continue to push up electricity prices, even though the price rise is being driven from outside the electricity sector. While this is economically sensible (the wide price signal finds the cheapest abatement option), it may not pass the test of political common sense for power prices to rise based on the cost of transport technologies. Moreover, where there are wholesale electricity markets, allowance price rises lead to additional windfall rents to electricity generators (see Section 6.8), so the impact on consumers could be even greater and more politically untenable.
© OECD/IEA 2010 Reviewing Existing and Proposed Emissions Trading Systems
Page | 35
Based on such analyses, an initial focus on sectors with large abatement potential can make sense if it is politically or logistically difficult to implement a broader scheme. With a narrow scope some economic efficiency is lost and a higher emissions price will be needed to achieve a given level of emissions reduction, but this may be considered acceptable in light of easier implementation and political acceptability. However, even if a scheme begins with narrow coverage, it is important to ensure that the system is designed to be able to expand over time to include other sectors.
The desire to achieve least‐cost abatement by extending coverage as widely as possible
In theory, it is clear that broader coverage of sectors and gases gives greater efficiency: a wider range of emissions abatement opportunities are captured, giving a greater chance of finding low‐cost emissions reductions (OECD, 2009). Schemes that have been designed to give broad coverage (New Zealand, Australia, H.R.2454, WCI, California) follow this logic: they give a high priority to making emissions reductions in the most cost‐effective way for the economy as a whole.
Although the trading scheme shown in Figure 6.1 is not expected to be very effective at reducing transport emissions, those reductions that are made will be (by definition) cost‐effective and will reduce the need for more expensive actions in other sectors.
However, even complete coverage does not guarantee the most efficient outcome. Broad‐based emissions trading schemes will still need supplementary policies, particularly to correct market failures and barriers. This is particularly true in areas where price signals alone are not expected to deliver a full cost‐effective response, such as in energy efficiency and transport. The Californian proposal, despite wide coverage, relies heavily on supplementary policies to deliver the emissions reduction goal.
The political acceptability of inclusion of some sectors
Decisions on the inclusion of various sectors in a trading scheme are determined not only by practical logistics and economics, but by political acceptability – both to scheme participants and to governments.
For example, agricultural emissions were eventually removed from the Australian CPRS proposal through political negotiation, while the similar New Zealand scheme includes them.
Another example is that of transport fuels in the United States. Although these have the lowest fuel tax rates in the OECD23 (IEA, 2010b), there is strong political and public resistance in the United States to increasing fuel taxation, so including these in an emissions trading scheme may prove difficult. The H.R.2454 proposal included transport emissions, but in the US Senate a utilities‐only scheme was considered more likely to succeed.
23 Except for Mexico, which varies its excise tax based on wholesale prices. At current prices, fuel is subsidised.
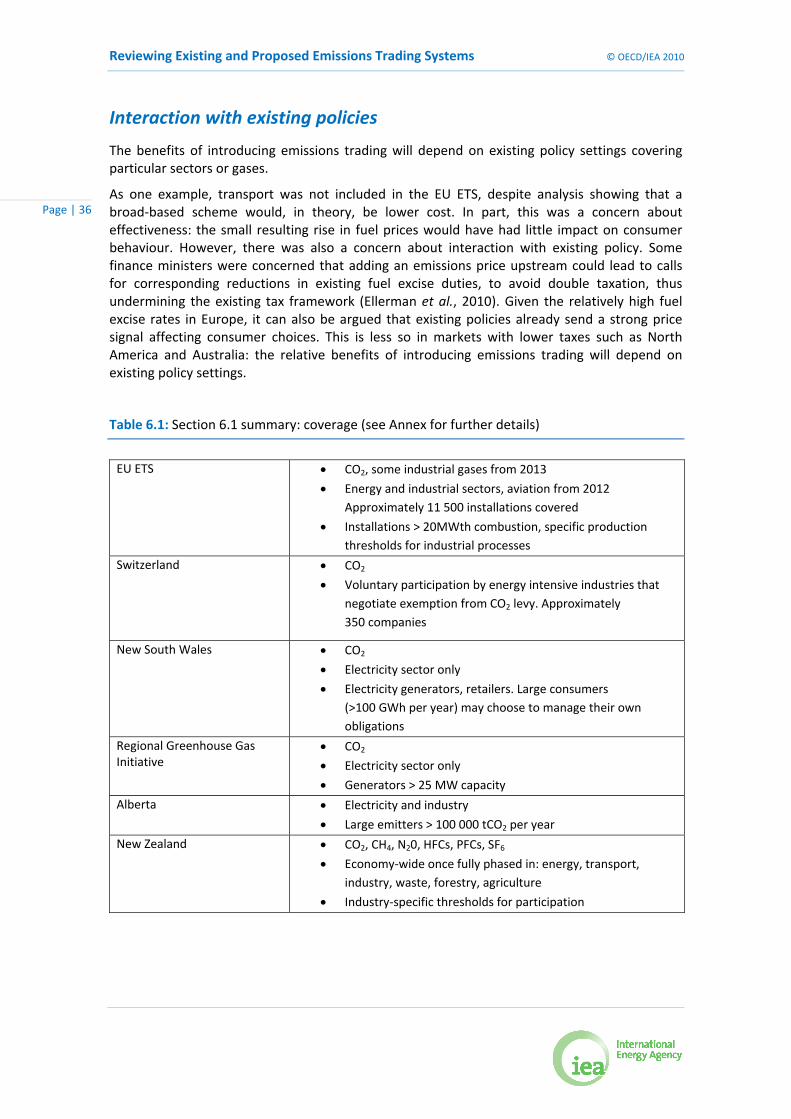
Reviewing Existing and Proposed Emissions Trading Systems © OECD/IEA 2010
Page | 36
Interaction with existing policies
The benefits of introducing emissions trading will depend on existing policy settings covering particular sectors or gases.
As one example, transport was not included in the EU ETS, despite analysis showing that a broad‐based scheme would, in theory, be lower cost. In part, this was a concern about effectiveness: the small resulting rise in fuel prices would have had little impact on consumer behaviour. However, there was also a concern about interaction with existing policy. Some finance ministers were concerned that adding an emissions price upstream could lead to calls for corresponding reductions in existing fuel excise duties, to avoid double taxation, thus undermining the existing tax framework (Ellerman et al., 2010). Given the relatively high fuel excise rates in Europe, it can also be argued that existing policies already send a strong price signal affecting consumer choices. This is less so in markets with lower taxes such as North America and Australia: the relative benefits of introducing emissions trading will depend on existing policy settings.
Table 6.1: Section 6.1 summary: coverage (see Annex for further details)
EU ETS • CO2, some industrial gases from 2013
• Energy and industrial sectors, aviation from 2012 Approximately 11 500 installations covered
• Installations > 20MWth combustion, specific production thresholds for industrial processes
Switzerland • CO2
• Voluntary participation by energy intensive industries that negotiate exemption from CO2 levy. Approximately 350 companies
New South Wales • CO2
• Electricity sector only
• Electricity generators, retailers. Large consumers (>100 GWh per year) may choose to manage their own obligations
Regional Greenhouse Gas Initiative
• CO2
• Electricity sector only
• Generators > 25 MW capacity
Alberta • Electricity and industry
• Large emitters > 100 000 tCO2 per year
New Zealand • CO2, CH4, N20, HFCs, PFCs, SF6
• Economy‐wide once fully phased in: energy, transport, industry, waste, forestry, agriculture
• Industry‐specific thresholds for participation
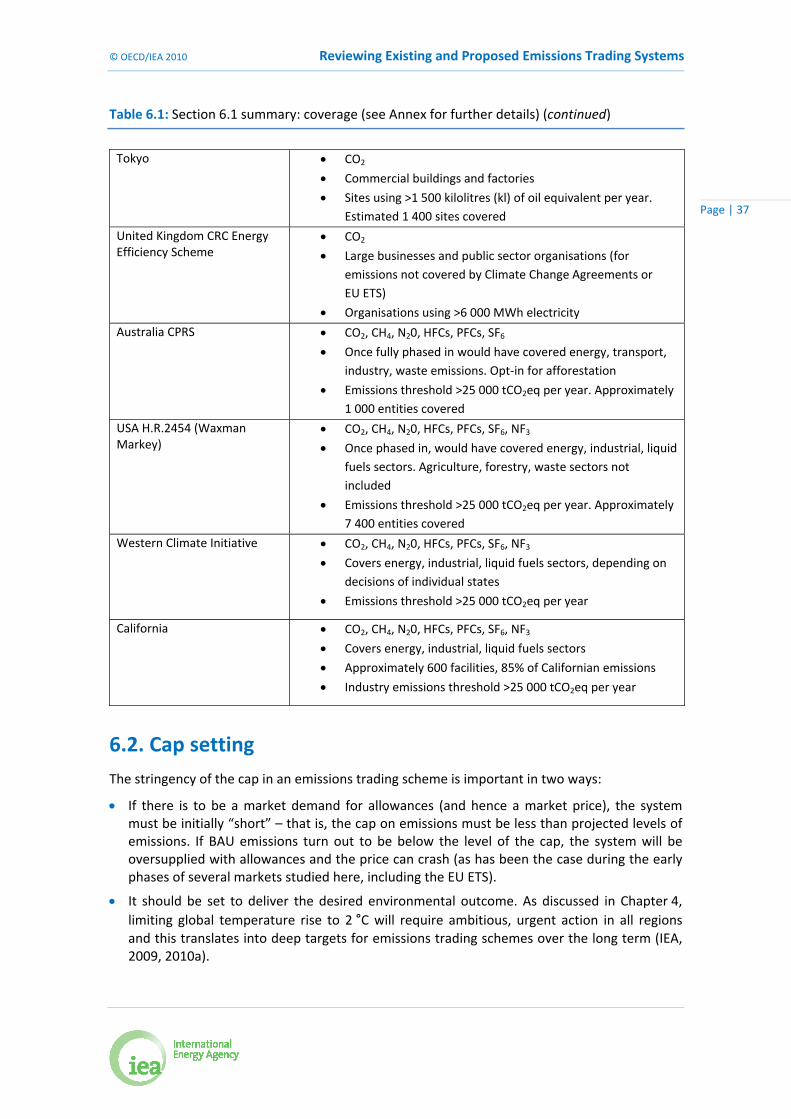
© OECD/IEA 2010 Reviewing Existing and Proposed Emissions Trading Systems
Page | 37
Table 6.1: Section 6.1 summary: coverage (see Annex for further details) (continued)
Tokyo • CO2
• Commercial buildings and factories
• Sites using >1 500 kilolitres (kl) of oil equivalent per year. Estimated 1 400 sites covered
United Kingdom CRC Energy Efficiency Scheme
• CO2
• Large businesses and public sector organisations (for emissions not covered by Climate Change Agreements or EU ETS)
• Organisations using >6 000 MWh electricity
Australia CPRS • CO2, CH4, N20, HFCs, PFCs, SF6
• Once fully phased in would have covered energy, transport, industry, waste emissions. Opt‐in for afforestation
• Emissions threshold >25 000 tCO2eq per year. Approximately 1 000 entities covered
USA H.R.2454 (Waxman Markey)
• CO2, CH4, N20, HFCs, PFCs, SF6, NF3
• Once phased in, would have covered energy, industrial, liquid fuels sectors. Agriculture, forestry, waste sectors not included
• Emissions threshold >25 000 tCO2eq per year. Approximately 7 400 entities covered
Western Climate Initiative • CO2, CH4, N20, HFCs, PFCs, SF6, NF3
• Covers energy, industrial, liquid fuels sectors, depending on decisions of individual states
• Emissions threshold >25 000 tCO2eq per year
California • CO2, CH4, N20, HFCs, PFCs, SF6, NF3
• Covers energy, industrial, liquid fuels sectors
• Approximately 600 facilities, 85% of Californian emissions
• Industry emissions threshold >25 000 tCO2eq per year
6.2. Cap setting The stringency of the cap in an emissions trading scheme is important in two ways:
• If there is to be a market demand for allowances (and hence a market price), the system must be initially “short” – that is, the cap on emissions must be less than projected levels of emissions. If BAU emissions turn out to be below the level of the cap, the system will be oversupplied with allowances and the price can crash (as has been the case during the early phases of several markets studied here, including the EU ETS).
• It should be set to deliver the desired environmental outcome. As discussed in Chapter 4, limiting global temperature rise to 2 °C will require ambitious, urgent action in all regions and this translates into deep targets for emissions trading schemes over the long term (IEA, 2009, 2010a).

Reviewing Existing and Proposed Emissions Trading Systems © OECD/IEA 2010
Page | 38
Schemes implemented or proposed to date generally impose an absolute cap on the quantity of emissions within the system (EU ETS, Australia, H.R.2454). However trading is also possible with output‐based caps (Alberta) or against negotiated baselines (Switzerland). An absolute cap guarantees that the specified level of emissions will be achieved,24 while an output‐based cap can allow for emissions to increase in line with rising production levels or GDP. (Conversely, relative caps result in a tighter limit on emissions when output decreases.) Although it is harder to account for overall emissions under an output‐based system, emissions can be managed in this way in principle: if ambitious targets are set, overall emissions can be reduced under either framework. Relative caps will however not provide the same level of certainty over emissions levels as absolute caps. In the case of developed countries with international commitments expressed as absolute emission levels, use of a domestic output‐based system would lead to a greater risk in their ability to deliver on these international commitments.
Establishing a market price
In schemes implemented to date, there has been a clear tendency for caps to be set too high, at least in the initial stages of trading. Governments have tended to overestimate BAU trends, due to the inherent uncertainty of forecasting, a lack of data on historical emissions, over‐optimistic forecasts of baseline GDP and industrial (and hence emissions) growth, unanticipated changes in fuel prices and a tendency to underestimate the potential for abatement and innovation (a case of asymmetric information, in which industries have an incentive to understate the potential for abatement). In addition, governments have been deliberately cautious in setting initial caps, due to fears of economic damage and job losses.
Together, these factors have often led regulators to set the initial cap close to BAU estimates. As explained in the RGGI scheme:
“This phased approach with initially modest emissions reductions is intended to provide market signals and regulatory certainty so that electricity generators begin planning for and investing in, lower‐carbon alternatives throughout the region, but without creating dramatic wholesale electricity price impacts and attendant retail electricity rate impacts” (RGGI, 2007).
Setting initial caps close to projected BAU emissions has sometimes led to problems with oversupply of allowances, when emissions levels have turned out to be lower than the level of the cap. A surplus of allowances can cause the market price to crash, leading to perceptions that emissions trading as a tool has failed.
The most well‐known example was Phase I of the EU ETS, however, a similar pattern of over‐allocation and price collapse has been repeated in the early stages of the Norwegian market and in the RGGI. The WCI’s decision to set initial allocations at BAU levels also runs the risk of initial oversupply of allowances.
One way of preventing price collapse from unintended oversupply of units is to allow banking of allowances for future use. If the emissions trading scheme includes a credible pathway of strict targets into the future, allowances that are surplus in the short term will still have value. This is the case in current trading in the EU ETS, where despite an expected surplus for the period 2008‐12, allowances are still trading at around EUR 15 in anticipation of the tighter targets that have been put in place for 2013‐20. 24 Assuming that there is full compliance with the scheme. Penalty provisions are important in this regard (see Section 6.9).

© OECD/IEA 2010 Reviewing Existing and Proposed Emissions Trading Systems
Page | 39
The bankability of over‐allocated units can support the allowance price in the short term, however it does so by carrying forward the surplus units into future trading periods. Unless future caps are adjusted to take account of the excess allowances, carrying forward a large quantity of excess allowances would reduce the need for emissions reductions in future. It is therefore important to try and avoid over‐allocation if possible, rather than simply using banking to mitigate its consequences.
It is anticipated that a significant excess of allowances will be banked forward from Phase II of the EU ETS, according to the European Commission’s analysis. Due to the unforeseen decrease in emissions caused by the recession, Phase II of the EU ETS is oversupplied. Even if the 2020 target was tightened to 34% reduction, the pool of banked units (arising from un‐used international offsets and the 2008‐12 allowances surplus) is still projected to be at current levels in 2020 (Figure 6.2). These units will allow a slower rate of domestic emissions reductions than would otherwise be the case in trading periods after 2020.
Figure 6.2: Modelled emissions and allowances under a 34% EU ETS target
Note: Even with a tightened system cap with 34% emissions reductions by 2020, the level of banked allowances in 2020 is similar to current levels. Source: European Commission (2010b).
In theory, EU ETS caps could be tightened for subsequent periods to absorb excess allowances that have been banked forward, however it may not be politically realistic to set such an ambitious target. For example, absorbing all banked units shown in Figure 6.2 by 2020 would require a target of around 50% reductions by 2020.
To avoid oversupply causing problems in the early stages of an emissions trading scheme, several strategies can be employed:
• Use of a transition phase with no banking to subsequent periods. This approach ensures that any allocation mistakes are not carried forward to future trading periods, but can result

Reviewing Existing and Proposed Emissions Trading Systems © OECD/IEA 2010
Page | 40
in price collapse in the transition phase and perceptions that the scheme has failed. Restricting banking also reduces the flexibility of firms to manage costs.
• Using a fixed‐price period for allowances in a transition phase, coupled with a ban on banking forward (that is, the scheme acts as a carbon tax during the start‐up phase). This allows more time for collection of emissions data and for processes to be solidified for managing, measuring, reporting and verifying emissions. If allowances are allocated free to some participants there is still the risk of over‐allocation to individual companies, but this should not affect the system as a whole.
• Linking to other markets. The New Zealand scheme allows export and import of allowances to the Kyoto Protocol market, so the international market sets allowance prices and any local surplus can be exported. Because the size of the New Zealand market is small, any net deficit or surplus will have a negligible impact on global allowance prices.25
• Use of price floors. Assuming a reasonable proportion of allowances are auctioned, introducing an auction price floor can correct for oversupply. Allowances unsold at the minimum price would be cancelled, or potentially used to fill a reserve to manage exceptionally high prices (Section 6.4), reducing the supply of allowances to a level commensurate with actual demand. The Californian scheme proposes to use auction price floors for this purpose.
• Output‐based allocation. If free allocation and the overall system cap are linked to actual production levels, participants would not receive surplus allowances if BAU emissions are lower than expected. However output based allocation dampens the price incentive seen by participants, because only a portion of the allowance price is passed through to product prices, leading to an incentive to increase production beyond efficient levels and to greater uncertainty around total emissions (see Sections 6.6 and 6.7).
The United Kingdom CRC energy efficiency scheme is an example in which an introductory phase is used with no banking allowed into subsequent periods. To avoid over‐supply, the total permit supply in this phase is based on actual emissions rather than projections or targets and is sold by the regulator at a fixed price. This ensures a stable supply of permits and a stable price while emissions data are collected. The overall caps for subsequent phases will be set using verified emissions data and set tightly enough to ensure genuine emissions reductions. In its recommendations on setting a cap for the second phase of the CRC, the United Kingdom Committee on Climate Change noted that it is difficult to guarantee that the cap will be set appropriately to avoid oversupply and price collapse, given the uncertain abatement potential in the sectors covered by the scheme. They suggested that a supplementary floor price could be used to guard against this possibility (CCC, 2010).
Finally, use of an independent regulator or advisory body may be useful in setting binding caps, as independent bodies may be less susceptible to political pressure. The experience of the European Union in Phase I and II is illustrative: in each phase, the overall final cap was reduced significantly (by 4.3% and 10%, respectively) by the European Commission compared to the sum of proposed allocations put forward by member states. In the United Kingdom CRC scheme, caps will be set based on advice from the Committee on Climate Change, an independent body established under United Kingdom legislation. 25 Clearly this approach will not work for larger markets where surpluses would affect the global supply and demand balance. For example Eastern European countries are unable to sell their surplus Kyoto allowances in this way.

© OECD/IEA 2010 Reviewing Existing and Proposed Emissions Trading Systems
Page | 41
Setting ambitious long term targets
As discussed in Section 4, emissions trading can play an important cornerstone role in emissions reductions, if ambitious targets are set for trading schemes.
Few current or proposed trading schemes have attempted to set short‐term caps based on consistency with long‐term 2050 reduction goals – the notable exceptions being the EU ETS and the H.R.2454 proposal.
Uniquely, the H.R.2454 proposal set a cap all the way to 2050, requiring an 83% reduction in emissions by this time. The European Union has also conducted analysis to 2050. The current EU ETS cap reduces linearly by 1.74% from 2013 up to and beyond 2020 (subject to review). As part of its analysis considering the implications of moving to a deeper target for 2020, the European Commission has noted that this current 20% economy‐wide target (21% for the EU ETS) is less ambitious than would be consistent with a long‐term pathway to 80% to 95% reductions, so if this initial target is retained, steeper reductions will be required after 2020 (Figure 6.3). Switzerland is also currently in the process of setting 2020 targets, with a view to how these deliver long‐term reductions.
Figure 6.3: Comparing the current European Union economy‐wide target with a 2 °C objective
Note: European Commission analysis comparing enacted legislation (red) with a pathway consistent with 2 °C warming (black). Source: European Commission (2010b).
Other jurisdictions have specified 2050 targets, but these have not been used to set the initial or long‐term caps for emissions trading schemes. Rather, caps for future trading periods will be set by future reviews. While this strategy provides flexibility to adjust trading schemes in line with
Reviewing Existing and Proposed Emissions Trading Systems © OECD/IEA 2010
Page | 42
international developments, it runs the serious risk that emissions will not be reduced enough in the early stages for long‐term targets to remain achievable or affordable.
The share of domestic abatement desired, compared to compliance achieved through offsets or international trading, is another issue that needs to be considered in setting caps. As discussed in more detail in Section 6.3, offsetting allows emissions reductions to be made in other regions or sectors where they are more cost effective, significantly reducing the costs of complying with emissions targets both for the capped region and globally. The trade‐off of allowing reductions to be made elsewhere is a slower rate of transformation of the domestic economy. If this leads to the lock‐in of new high‐emissions infrastructure (such as fossil‐fuel electricity generation), it could raise the long‐term cost of transition. The balance between lowering costs and driving domestic change is therefore essential.
The IEA 450 Scenario assumes that in OECD emissions trading schemes, two thirds of reductions are made domestically. This is a constraint in the model, but only differs marginally from the efficient outcome determined by top‐down modelling using the OECD Linkages Model, which is used to set broad parameters for the WEO‐2009 scenarios. In the 450 Scenario, the cap for emissions reductions in OECD trading schemes (including use of offsets) is 32% below 2007 levels in 2020.
By contrast, even the most ambitious proposed schemes have relatively high use of offsets. The EU ETS’s Phase III rules limit use of project credits from outside the European Union to 50% of required emissions reductions. The H.R.2454 proposal would have allowed even greater use of offsets: in the EPA’s analysis, domestic emissions were modelled to be 9% below 2010 levels in 2020 and 38% below 2010 levels in 2050, with the remaining reductions to reach the full target (17% in 2020 and 83% in 2050) achieved by use of offsets.
Many experts would argue against setting a quota for domestic abatement, as it runs counter to emissions trading’s fundamental advantage of allowing reductions to occur wherever they can be made at least cost. However, there are compelling reasons to consider mapping a target pathway for domestic emissions in addition to the overall cap:
• There is an expectation in the international negotiations that developed countries should make a significant portion of their emissions reductions at home, rather than simply relying on purchased offsets. This is codified in the “supplementarity” principle of the Kyoto Protocol (UNFCCC, 1997). There is also often strong domestic pressure from industry and the public that investment in emissions reductions should first be made to promote innovation and growth in clean technology at home.
• Global allowance prices are currently low, due to a lack of ambitious emissions targets in both developed and developing nations. This leads to under‐investment in domestic abatement in the short term, below that which would be optimal when considering a least‐cost pathway to meeting 2050 targets. Setting a strong domestic cap with a limitation on offset use will help correct for this.
• In the power sector in particular, short‐term investment decisions will lock in emissions, potentially for 30 or 40 years (IEA, 2010c). High reliance on offsets will defer short‐term domestic investment in low‐carbon technologies, locking in emissions and making later reductions significantly more difficult.
Setting any such target for domestic abatement (or limit for offset use) will need to balance the desire for increased domestic action with the increased costs faced in complying with the target.
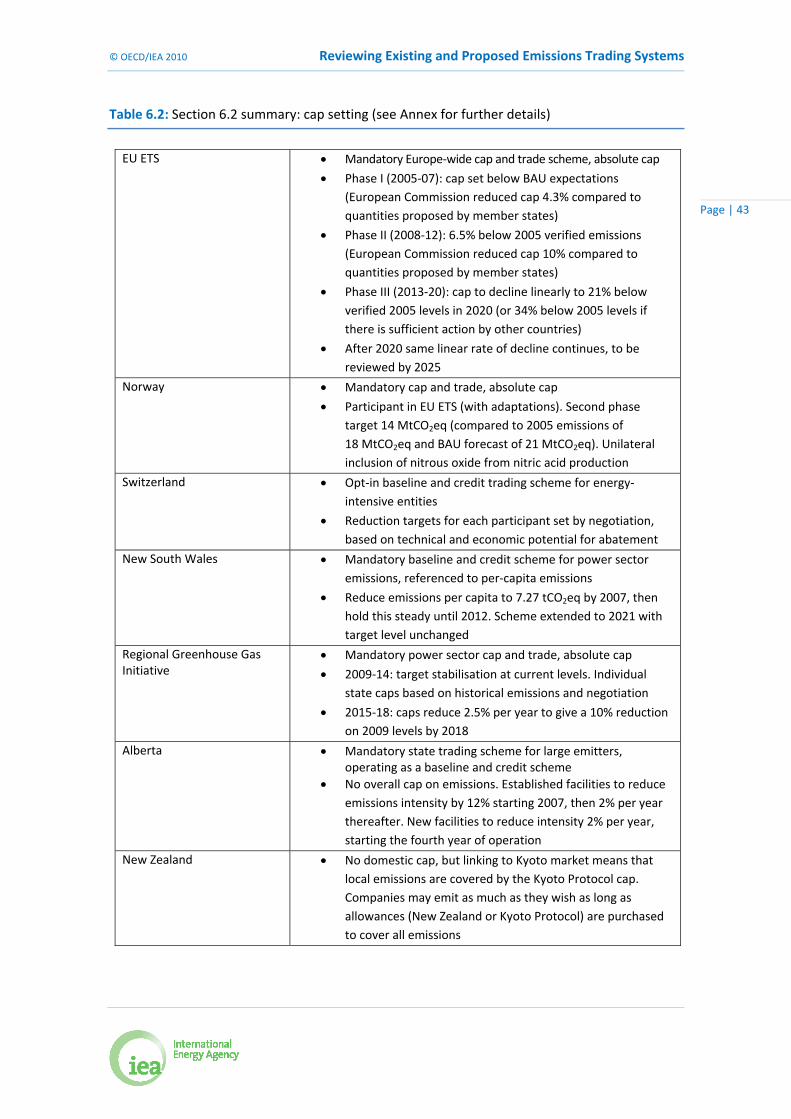
© OECD/IEA 2010 Reviewing Existing and Proposed Emissions Trading Systems
Page | 43
Table 6.2: Section 6.2 summary: cap setting (see Annex for further details)
EU ETS • Mandatory Europe‐wide cap and trade scheme, absolute cap
• Phase I (2005‐07): cap set below BAU expectations (European Commission reduced cap 4.3% compared to quantities proposed by member states)
• Phase II (2008‐12): 6.5% below 2005 verified emissions (European Commission reduced cap 10% compared to quantities proposed by member states)
• Phase III (2013‐20): cap to decline linearly to 21% below verified 2005 levels in 2020 (or 34% below 2005 levels if there is sufficient action by other countries)
• After 2020 same linear rate of decline continues, to be reviewed by 2025
Norway • Mandatory cap and trade, absolute cap
• Participant in EU ETS (with adaptations). Second phase target 14 MtCO2eq (compared to 2005 emissions of 18 MtCO2eq and BAU forecast of 21 MtCO2eq). Unilateral inclusion of nitrous oxide from nitric acid production
Switzerland • Opt‐in baseline and credit trading scheme for energy‐intensive entities
• Reduction targets for each participant set by negotiation, based on technical and economic potential for abatement
New South Wales • Mandatory baseline and credit scheme for power sector emissions, referenced to per‐capita emissions
• Reduce emissions per capita to 7.27 tCO2eq by 2007, then hold this steady until 2012. Scheme extended to 2021 with target level unchanged
Regional Greenhouse Gas Initiative
• Mandatory power sector cap and trade, absolute cap
• 2009‐14: target stabilisation at current levels. Individual state caps based on historical emissions and negotiation
• 2015‐18: caps reduce 2.5% per year to give a 10% reduction on 2009 levels by 2018
Alberta • Mandatory state trading scheme for large emitters, operating as a baseline and credit scheme
• No overall cap on emissions. Established facilities to reduce emissions intensity by 12% starting 2007, then 2% per year thereafter. New facilities to reduce intensity 2% per year, starting the fourth year of operation
New Zealand • No domestic cap, but linking to Kyoto market means that local emissions are covered by the Kyoto Protocol cap. Companies may emit as much as they wish as long as allowances (New Zealand or Kyoto Protocol) are purchased to cover all emissions
Reviewing Existing and Proposed Emissions Trading Systems © OECD/IEA 2010
Page | 44
Table 6.2: Section 6.2 summary: cap setting (see Annex for further details) (continued)
Tokyo • Mandatory emissions trading scheme for factories and commercial buildings in Tokyo, absolute cap
• 2010‐15: ‐6% for factories, ‐8% for other buildings
• 2015‐20: target around ‐17% anticipated. Facilities that have made outstanding progress can have their target reduced
United Kingdom CRC Energy Efficiency Scheme
• Mandatory cap and trade scheme, absolute cap
• Three‐year introductory phase no cap, fixed price
• Caps for trading periods to be set after advice from Committee on Climate Change
Australia CPRS • Nationwide mandatory cap and trade scheme, absolute cap
• Target 5% below 2000 levels by 2020 (25% if a comprehensive global agreement were reached)
• Caps set five years in advance, with gateway range signaled further 10 years ahead
USA H.R.2454 (Waxman Markey)
• Nationwide mandatory cap and trade scheme, absolute cap
• Reductions on 2005 levels: 3% in 2012, 17% in 2020, 42% in 2030, 83% in 2050
Western Climate Initiative • Mandatory cap and trade scheme, absolute cap
• Initial cap best estimate of actual emissions. Declining linearly to 15% below 2005 levels in 2020
California • Mandatory cap and trade scheme, absolute cap
• Initial cap best estimate of actual 2012 emissions. Cap declines to approximately 15% below 2012 levels in 2020
6.3. Overall costs Efforts to introduce emissions pricing have often stalled over concerns about the economic impact of rising energy prices and the resulting impacts on the competitiveness of high‐emissions industries.
Economic modelling of current and proposed trading schemes shows that while some emissions‐intensive industries will be adversely affected, the overall economic impact is modest compared to the ongoing growth rates of the economies concerned, even with ambitious targets.
Overall economic impacts
Economic modelling of macro‐economic impacts has been undertaken as part of the design of all significant emissions trading schemes. For example, the main scenario in the US EPA model of the H.R.2454 proposal shows allowance prices of USD 20/tCO2eq in 2020 rising to USD 87/tCO2eq in 2050, but GDP and domestic consumption remain virtually unchanged compared to the reference scenario. GDP to 2050 increases 163% with emissions reductions, compared to 167% in the reference scenario (EPA, 2010a).
© OECD/IEA 2010 Reviewing Existing and Proposed Emissions Trading Systems
Page | 45
Similarly, recent modelling of Phase III of the EU ETS projects allowance prices of EUR 16/tCO2eq in 2020 (or EUR 30/tCO2eq with a 34% reduction target). In dollar terms the economic cost of meeting emissions targets seems high: EUR 48 billion for the current policy package (21% ETS target, 20% renewable energy and energy efficiency targets) and EUR 81 billion if a 30% economy‐wide target is taken on. These correspond to GDP reductions of 0.32% and 0.54% in 2020 for the two targets. However these costs need to be seen in the context of GDP growth over the same timeframe: with a 30% emissions reduction target, GDP growth to 2020 is reduced from 28% to 27.5% according to the European Commission’s analysis (European Commission, 2010a, 2010b). In addition, important co‐benefits such as the health benefits from reduced air pollution are not captured by these models.
Private sector analysts expect higher Phase III allowance prices than modelled by the Commission, averaging around EUR 30/tCO2eq in 2020 for current targets, and consequently expect higher economic impacts (Reuters, 2010). However even doubling the Commission’s calculated impacts would still imply GDP growth of 27% to 2020, compared to 28% in the baseline.
Modelling of the New Zealand scheme and the Australian proposal shows economic impacts that are a little higher, in part due to the rapid population growth and more limited domestic abatement potential of these countries. However, in both cases costs are still a small proportion of anticipated economic growth. In New Zealand, national per capita welfare (real gross national disposable income per capita) is modelled to grow 46% by 2025 under a BAU scenario, 44% with an international carbon price of NZD 25/tCO2eq, or 40% at an international carbon price of NZD 100/tCO2eq, assuming full linking to international markets. The model indicates emissions reductions of 5% below BAU with an emissions price of NZD 25/tCO2eq and 15% to 20% with a price of NZD 100/tCO2eq (NZIER/Infometrics, 2009). In Australia, real GNP per capita rises 10.9% to 2020 in the baseline scenario. This becomes a 9.5% rise if a modest 5% emissions reduction target is adopted, or an 8.5% rise with an ambitious 25% reduction target. Allowance prices of AUD 35/tCO2eq or AUD 60/tCO2eq are expected in 2020 under the two target levels (Australian Treasury, 2008).
Linking and offsets to minimise overall economic impacts
Although expected economic impacts are modest compared to the size and growth rates of economies, these costs are real and should be minimised if possible. Costs will vary considerably depending on the potential for domestic abatement within different regions. A key mechanism for lowering the cost of emissions trading schemes is to extend their coverage, either by linking with other capped trading schemes or by allowing use of offsets.
For small economies, linking can be critical for reducing costs of abatement. For New Zealand, a purely domestic scheme would require higher allowance prices to achieve the same target levels, leading to economic welfare impacts around twice as high as without linking (NZIER/Infometrics, 2009). This is also an issue for smaller participants in the Western Climate Initiative, for example New Mexico has stated that it will only participate if the market is at least 100 MtCO2eq in size (New Mexico Environment Department, 2010). Designers of small schemes will want to pay particular attention to design choices that help or hinder linking with key external markets.
Direct linking of schemes will not be straightforward. Although any schemes with comparable allowances (for example representing one tonne of verified emissions) could be linked, political considerations will tend to mean that direct linking only takes place among schemes that have
Reviewing Existing and Proposed Emissions Trading Systems © OECD/IEA 2010
Page | 46
similar caps, system rules and offset provisions (Dellink et al., 2010b). By contrast, price control mechanisms such as caps and floors would make linking technically more difficult, if not politically unlikely.26 For example the Australian CPRS proposal would have allowed linking with comparable schemes (comparable targets, design rules and measurement reporting and verification) with five years notice and the H.R.2454 proposal would have allowed linking with schemes that are at least as stringent. The Californian draft scheme anticipates linking with WCI partners, but notes an extensive list of issues that require harmonisation: cap stringency, offset criteria, auction floor prices, cost‐containment reserves, banking, borrowing, and provisions for measurement, reporting, verification and enforcement. These have largely already been agreed through the WCI process, except for the details of price control measures. The Swiss government has begun discussions on linking their scheme with the EU ETS. As the first example of attempted linking of schemes, this will be an interesting test of how readily linking can be achieved in practice.
However, even without direct linking there is likely to be some convergence of allowance prices if common offsets are allowed. For example, most schemes currently accept Kyoto Protocol CDM allowances, the value of which is driven by demand and allowance prices in the EU ETS. This implicitly links the market price in other schemes such as the New Zealand ETS to the European market, unless offset prices rise to the point at which domestic abatement (such as forestry planting in New Zealand) is cheaper.
The use of offsets can also have a significant impact on total abatement costs. Offsets can be domestic, generated in sectors not covered by the trading scheme (such as agriculture, waste or forestry), or international, such as those generated by the Kyoto Protocol’s CDM or offsets from potential future sectoral crediting or reduced deforestation mechanisms.
Allowing significant use of offsets can make it easier to extend the coverage of a trading scheme economy‐wide to sectors with more expensive abatement options, as the price of allowances will tend to be set by international offset prices rather than domestic abatement costs.
As one example of offset provisions, the H.R.2454 proposal would have allowed significant use of offsets: up to two billion tons per year (half from international offsets) if all participants were to use their entitlements. These reduce the overall costs of the scheme significantly: in a scenario in which no international offsets are available, modelled allowance prices are 50% to 150% higher than in the main scenario (EPA, 2010a).27
However as noted in Section 6.2, extensive use of offsets in the short term could lock in investment in high‐emissions infrastructure domestically, making the eventual transition to a low‐carbon economy more difficult.
An example of this is shown in EPA modelling of United States domestic emissions under the H.R.2454 proposal, using its IGEM model. Because the entitlement to use offsets is greater than required for compliance in the early stages of the scheme, participants are able to purchase offsets and bank them for later use. This “offset and bank” strategy means that while domestic emissions are significantly reduced compared to BAU, they do not reduce as rapidly as might be expected given the ambitious 83% reduction target (Figure 6.4). The EPA’s other model (ADAGE) shows slightly steeper domestic emissions reductions under the same scenario: 9% below 2010 levels in 2020 and 38% below 2010 levels in 2050.
26 A system with a price cap set much below the existing price level of another may not be inclined to link. 27 If the availability of international offsets is delayed by 10 or 20 years rather than removed, the impact is much smaller: an allowance price rise of only 2% to 5%.
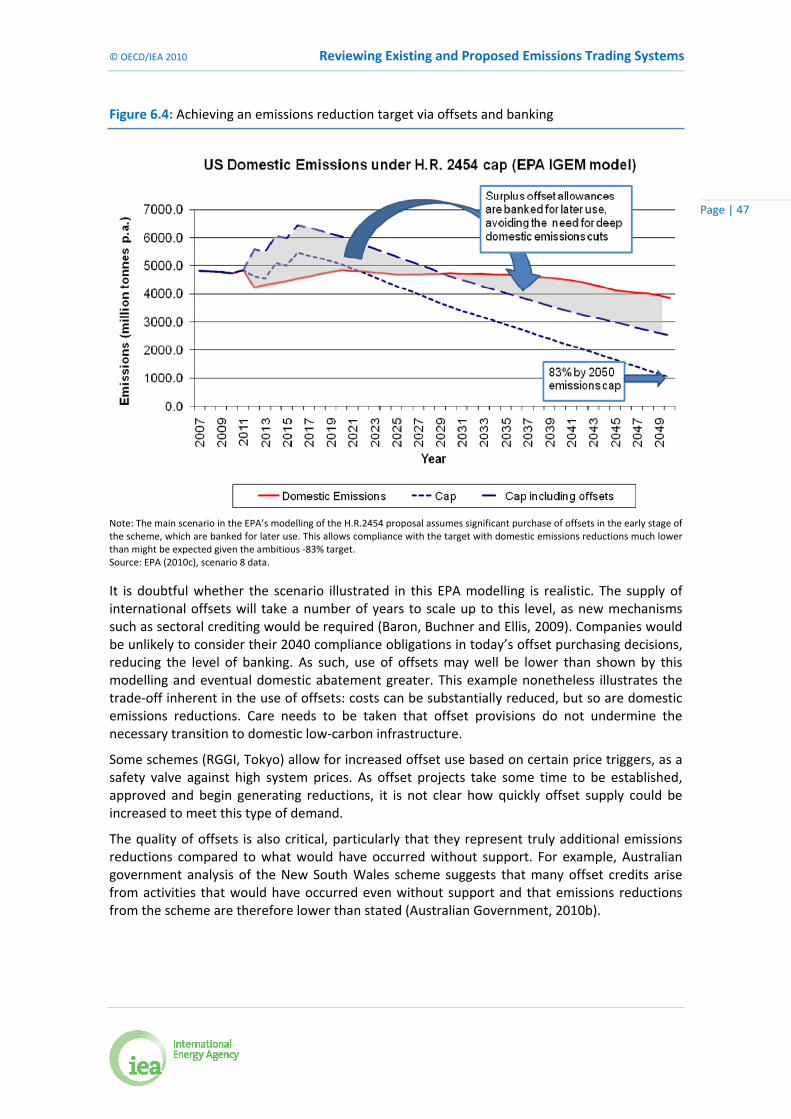
© OECD/IEA 2010 Reviewing Existing and Proposed Emissions Trading Systems
Page | 47
Figure 6.4: Achieving an emissions reduction target via offsets and banking
Note: The main scenario in the EPA’s modelling of the H.R.2454 proposal assumes significant purchase of offsets in the early stage of the scheme, which are banked for later use. This allows compliance with the target with domestic emissions reductions much lower than might be expected given the ambitious ‐83% target. Source: EPA (2010c), scenario 8 data.
It is doubtful whether the scenario illustrated in this EPA modelling is realistic. The supply of international offsets will take a number of years to scale up to this level, as new mechanisms such as sectoral crediting would be required (Baron, Buchner and Ellis, 2009). Companies would be unlikely to consider their 2040 compliance obligations in today’s offset purchasing decisions, reducing the level of banking. As such, use of offsets may well be lower than shown by this modelling and eventual domestic abatement greater. This example nonetheless illustrates the trade‐off inherent in the use of offsets: costs can be substantially reduced, but so are domestic emissions reductions. Care needs to be taken that offset provisions do not undermine the necessary transition to domestic low‐carbon infrastructure.
Some schemes (RGGI, Tokyo) allow for increased offset use based on certain price triggers, as a safety valve against high system prices. As offset projects take some time to be established, approved and begin generating reductions, it is not clear how quickly offset supply could be increased to meet this type of demand.
The quality of offsets is also critical, particularly that they represent truly additional emissions reductions compared to what would have occurred without support. For example, Australian government analysis of the New South Wales scheme suggests that many offset credits arise from activities that would have occurred even without support and that emissions reductions from the scheme are therefore lower than stated (Australian Government, 2010b).

Reviewing Existing and Proposed Emissions Trading Systems © OECD/IEA 2010
Page | 48
Box 6.1: Offsets and climate finance
When setting long‐term caps and/or allowed offset levels, careful consideration needs to be given to whether there is broad or narrow coverage in the scheme. In the H.R.2454 proposal (Figure 6.1 in Section 6.1), most emissions reductions would have occurred in the electricity sector. In fact, this sector’s emissions would decline roughly in line with the overall cap, reduced by 22% in 2020 and 84% in 2050. That is, the electricity sector would meet its overall compliance obligations largely by making domestic reductions, rather than use of offsets.
In July 2010, the United States Senate was considering whether to take up emissions trading legislation similar to H.R.2454, with the same reduction cap but limited to the power sector. Presumably, the intention would be to achieve the same degree of power‐sector transformation as would have occurred under the wider bill. However, this outcome could have been inadvertently undermined by the bill’s offset provisions. Narrowing the bill’s coverage would significantly reduce global demand for international offset credits; as a result their price would be lower than would have been the case under the broad bill. The electricity sector might now find it economic to use offsets for compliance rather than making domestic emissions reductions, giving much slower change than intended. In making such decisions, there is a need for careful consideration of the interplay between offset price and availability, banking provisions and scheme coverage.
As well as reducing costs, offsets play a critical role in channelling funding for climate change mitigation to developing countries.
To 2012, the Kyoto Protocol’s CDM is expected to generate a total of around one Gt of emissions reductions in developing countries, funded primarily by participants in the EU ETS (UNEP Risoe, 2010).
To meet the Copenhagen Accord goal of mobilising USD 100 billion per year by 2020 to address the needs of developing countries, carbon market funding will need to be scaled up substantially, supplemented by direct funding.
In the IEA 450 Scenario, OECD+ countries are assumed to implement emissions trading in the power and industry sectors from 2013. Several scenarios were modelled, in which countries fulfilled a required level of domestic emissions reductions, then funded further reductions through offsets. The resulting value of primary transfers in 2020 ranged from USD 13 billion (0.5 GtCO2eq offsets at USD 26/tCO2eq) to USD 63 billion (1.7 GtCO2eq offsets at USD 37/tCO2eq). This indicates that the carbon market could provide a reasonable share of the financing announced in Copenhagen – if sufficiently ambitious targets are adopted for OECD+ emissions trading schemes and developing countries set up market mechanisms that can deliver offset credits to the international market (IEA, 2009).
New mechanisms will be needed to deliver this scaled‐up effort. CDM projects already registered or in the pipeline have the potential to meet EU ETS demand for offsets to 2020. But if emissions trading schemes are established in the United States and Japan, the global demand for offsets will increase dramatically. Scaled‐up market mechanisms, such as sectoral crediting and sectoral trading (Aasrud et al., 2009), are being explored as potential ways to deliver both the required offset supply and to drive the structural change towards low‐emissions growth that is needed in developing countries.
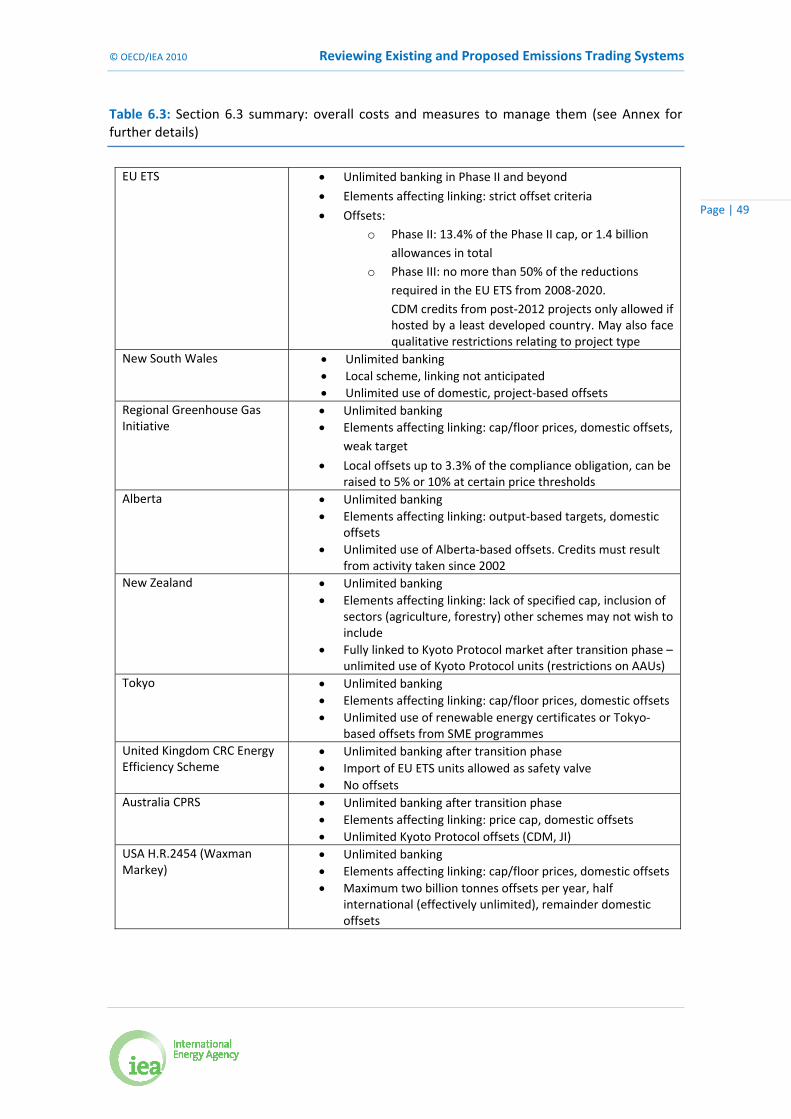
© OECD/IEA 2010 Reviewing Existing and Proposed Emissions Trading Systems
Page | 49
Table 6.3: Section 6.3 summary: overall costs and measures to manage them (see Annex for further details)
EU ETS • Unlimited banking in Phase II and beyond
• Elements affecting linking: strict offset criteria
• Offsets: o Phase II: 13.4% of the Phase II cap, or 1.4 billion
allowances in total o Phase III: no more than 50% of the reductions
required in the EU ETS from 2008‐2020. CDM credits from post‐2012 projects only allowed if hosted by a least developed country. May also face qualitative restrictions relating to project type
New South Wales • Unlimited banking • Local scheme, linking not anticipated • Unlimited use of domestic, project‐based offsets
Regional Greenhouse Gas Initiative
• Unlimited banking • Elements affecting linking: cap/floor prices, domestic offsets,
weak target
• Local offsets up to 3.3% of the compliance obligation, can be raised to 5% or 10% at certain price thresholds
Alberta • Unlimited banking • Elements affecting linking: output‐based targets, domestic
offsets • Unlimited use of Alberta‐based offsets. Credits must result
from activity taken since 2002 New Zealand • Unlimited banking
• Elements affecting linking: lack of specified cap, inclusion of sectors (agriculture, forestry) other schemes may not wish to include
• Fully linked to Kyoto Protocol market after transition phase – unlimited use of Kyoto Protocol units (restrictions on AAUs)
Tokyo • Unlimited banking • Elements affecting linking: cap/floor prices, domestic offsets • Unlimited use of renewable energy certificates or Tokyo‐
based offsets from SME programmes United Kingdom CRC Energy Efficiency Scheme
• Unlimited banking after transition phase • Import of EU ETS units allowed as safety valve • No offsets
Australia CPRS • Unlimited banking after transition phase • Elements affecting linking: price cap, domestic offsets • Unlimited Kyoto Protocol offsets (CDM, JI)
USA H.R.2454 (Waxman Markey)
• Unlimited banking • Elements affecting linking: cap/floor prices, domestic offsets • Maximum two billion tonnes offsets per year, half
international (effectively unlimited), remainder domestic offsets
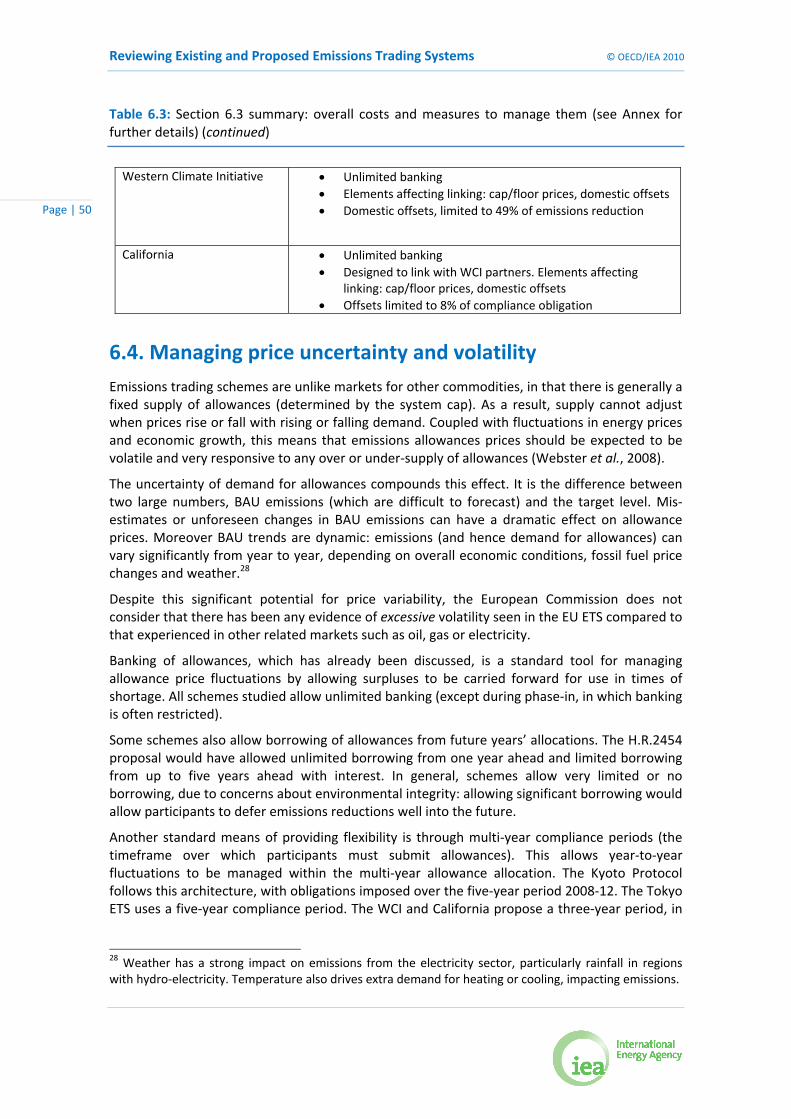
Reviewing Existing and Proposed Emissions Trading Systems © OECD/IEA 2010
Page | 50
Table 6.3: Section 6.3 summary: overall costs and measures to manage them (see Annex for further details) (continued)
Western Climate Initiative • Unlimited banking • Elements affecting linking: cap/floor prices, domestic offsets • Domestic offsets, limited to 49% of emissions reduction
California • Unlimited banking • Designed to link with WCI partners. Elements affecting
linking: cap/floor prices, domestic offsets • Offsets limited to 8% of compliance obligation
6.4. Managing price uncertainty and volatility Emissions trading schemes are unlike markets for other commodities, in that there is generally a fixed supply of allowances (determined by the system cap). As a result, supply cannot adjust when prices rise or fall with rising or falling demand. Coupled with fluctuations in energy prices and economic growth, this means that emissions allowances prices should be expected to be volatile and very responsive to any over or under‐supply of allowances (Webster et al., 2008).
The uncertainty of demand for allowances compounds this effect. It is the difference between two large numbers, BAU emissions (which are difficult to forecast) and the target level. Mis‐estimates or unforeseen changes in BAU emissions can have a dramatic effect on allowance prices. Moreover BAU trends are dynamic: emissions (and hence demand for allowances) can vary significantly from year to year, depending on overall economic conditions, fossil fuel price changes and weather.28
Despite this significant potential for price variability, the European Commission does not consider that there has been any evidence of excessive volatility seen in the EU ETS compared to that experienced in other related markets such as oil, gas or electricity.
Banking of allowances, which has already been discussed, is a standard tool for managing allowance price fluctuations by allowing surpluses to be carried forward for use in times of shortage. All schemes studied allow unlimited banking (except during phase‐in, in which banking is often restricted).
Some schemes also allow borrowing of allowances from future years’ allocations. The H.R.2454 proposal would have allowed unlimited borrowing from one year ahead and limited borrowing from up to five years ahead with interest. In general, schemes allow very limited or no borrowing, due to concerns about environmental integrity: allowing significant borrowing would allow participants to defer emissions reductions well into the future.
Another standard means of providing flexibility is through multi‐year compliance periods (the timeframe over which participants must submit allowances). This allows year‐to‐year fluctuations to be managed within the multi‐year allowance allocation. The Kyoto Protocol follows this architecture, with obligations imposed over the five‐year period 2008‐12. The Tokyo ETS uses a five‐year compliance period. The WCI and California propose a three‐year period, in
28 Weather has a strong impact on emissions from the electricity sector, particularly rainfall in regions with hydro‐electricity. Temperature also drives extra demand for heating or cooling, impacting emissions.

© OECD/IEA 2010 Reviewing Existing and Proposed Emissions Trading Systems
Page | 51
lieu of allowing borrowing. The RGGI has a three‐year compliance period, extendible to four years under certain price conditions.
Availability and transparency of emissions data are also helpful in reducing market volatility, as they reduce the potential for surprises (such as the lower‐than‐expected first year’s verified emissions in the EU ETS Phase I). Some North American schemes (RGGI, H.R.2454) have implemented or proposed quarterly reporting of emissions, rather than the annual reporting that is standard elsewhere. This is in line with company financial reporting cycles and provides good market data. This was possible because reporting could be combined with existing quarterly obligations to the United States EPA.
Beyond borrowing, banking, length of compliance period and transparency of emissions data, there is disagreement over the merits of introducing explicit measures to manage price volatility or price uncertainty. There are broadly two schools of thought. One argues that existing market tools are adequate and that additional mechanisms only further increase uncertainty by undermining the one thing that is certain: the number of allowances. Any price‐cap mechanism might also be susceptible to political lobbying, being set too low to achieve environmental outcomes, or being altered in the event of sustained high prices leading to further uncertainty about future supply of allowances. This view is reflected in the designs of the EU ETS, which aims to give clarity on the number of allowances in circulation, and then to allow participants to manage their obligations using standard market tools.
The other school of thought (as seen in North American markets in particular) seeks to provide greater price certainty for long‐term investment by constraining allowances prices in a pre‐determined band between cap and floor prices (CCAP, 2008; Burtraw, Palmer and Kahn, 2009). This is generally intended to provide a clearer understanding of the costs likely to be faced in a new emissions trading scheme, allowing for easier agreement on ambitious targets (Philibert, 2008). Ahead of trading commencing, views may differ significantly over what market price for allowances is likely to emerge and hence over cost implications for participants. An escalating price cap acts as a safety valve, providing some reassurance over maximum costs for large emitters. Conversely, investors in low‐carbon infrastructure may be concerned about potential oversupply of allowances and low prices. Providing a market floor price is intended to give this type of certainty.
Proponents of price caps and floors point to theoretical support for this view, which is based on the finding that while carbon taxes and emissions trading are equivalent under conditions of certainty, under uncertainty an appropriately set carbon tax is superior (Pizer, 2002; Quirion, 2005). If taxes are not politically viable, a cap‐and‐floor approach (which is essentially a hybrid between a carbon tax and a pure ETS) comes out with a theoretical advantage (Philibert, 2006). Recent literature suggests that hybrid instruments should be preferred over intensity or indexed targets (Webster et al., 2010).
Opponents argue that this approach relies on the cap and floor prices being struck at appropriately high levels,29 for politicians to be willing to adjust price caps upward if necessary
29 The “social cost of carbon” measures the economic cost of the impacts of climate change and economically it is efficient to implement mitigation measures up to this social cost (above this, the cost of emissions reductions exceeds social benefits). An appropriately ambitious ETS should be expected to have allowance prices averaging around the social cost of carbon over the long run, but ranging higher and lower. Any cap on market prices therefore needs to be well above this level to allow efficient market operation.
Reviewing Existing and Proposed Emissions Trading Systems © OECD/IEA 2010
Page | 52
and that it assumes the caps and floors do not introduce any perverse incentives30 that reduce the efficiency of the system (Stern, 2006). Given the political difficult in setting high carbon prices (as evidenced by the difficulties that carbon tax proposals have encountered), they argue that pure trading schemes may therefore be more robust than hybrid approaches. Experience has shown that it is difficult to set emissions caps appropriately compared to baseline emissions. Given this experience, there is a significant risk that in a hybrid cap‐and‐floor scheme, prices could either fall to the floor price, or stay at the cap price, at least in initial stages of trading. This could lead to political intervention to reset the price thresholds and/or emissions caps. Participants will only value the “certainty” provided by price caps and floors if there is a credible commitment that they will not be arbitrarily reset (Blyth and Yang, 2006).31
In current and proposed trading schemes, price caps are implemented in a number of ways. Implementation of price floors, which primarily aim to support low‐carbon investment, will be discussed in Section 6.5.
Some schemes allow unlimited supply of allowances at a low cap price, effectively turning the trading scheme into a low‐level carbon tax. The Alberta scheme provides the option of paying into a fund at CAD 15/tCO2eq, capping the allowance price at this level. The New South Wales scheme has a low penalty (AUD 12/tCO2eq) for non‐surrender of allowances, so allowances prices will not rise above this level. In both cases, the low cap price significantly reduces the incentive for emissions abatement, and total emissions have continued to rise substantially under both schemes.
Other schemes (Australia, New Zealand) have a low price cap as a short‐term transitional measure for one or two years while trading is established. While this delays the full price signal being seen by participants, a short‐term price cap may provide a smoother transition to trading, as long as it is made clear to investors that the transition to full pricing will occur.
A “soft” price cap has been proposed in the H.R.2454 scheme. Here, a strategic reserve of allowances was to be set aside from each year’s pool and offered quarterly with a high reserve price. After a two‐year phase‐in period, the cap would have been set at 60% above the three‐year rolling average market price. That is, this mechanism was designed to mitigate short‐term price spikes in the market but not consistently high prices.
Strategic reserves can also be designed to be triggered by an absolute price threshold. The Californian scheme sets aside approximately 5% of allowances as a reserve, offered at fixed price at quarterly sales. Reserve allowances will be offered in three price tiers: USD 40/tCO2eq, USD 45/tCO2eq and USD 50/tCO2eq in 2012. These prices will escalate by 5% plus inflation each year, reaching USD 60/tCO2eq, USD 67/tCO2eq and USD 75/tCO2eq in 2020. These are well above the anticipated allowance prices in the California market.
Using a strategic reserve is intended to preserve some certainty on the emissions outcome, as all allowances come from within the emissions cap or arise from offsets. Because of the fixed pool of allowances in the reserve, there is a limitation on how long it can cap prices. However, in the event of sustained high prices, the intention is that offset supply should be able to ramp up to cover participants’ additional demand for allowances, with the reserve covering their needs in the interim.
Several schemes use linking and offsets to provide greater short‐term price stability. The United Kingdom CRC market allows import of EU ETS allowances as a safety valve. The Tokyo market 30 For example, the potential for gaming up the allowance price to hit the cap level to release a greater supply of allowances. 31 Conversely, in the absence of price caps and floors, very low or high prices could also lead to policy intervention modifying the emissions cap.
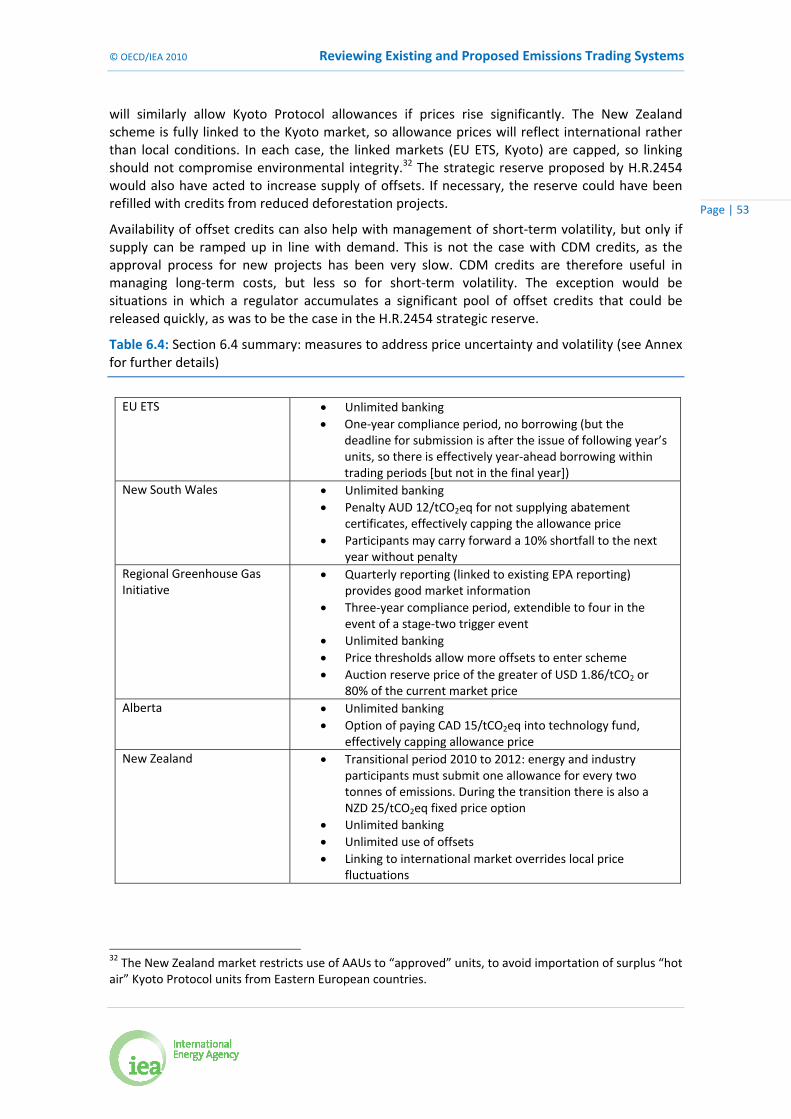
© OECD/IEA 2010 Reviewing Existing and Proposed Emissions Trading Systems
Page | 53
will similarly allow Kyoto Protocol allowances if prices rise significantly. The New Zealand scheme is fully linked to the Kyoto market, so allowance prices will reflect international rather than local conditions. In each case, the linked markets (EU ETS, Kyoto) are capped, so linking should not compromise environmental integrity.32 The strategic reserve proposed by H.R.2454 would also have acted to increase supply of offsets. If necessary, the reserve could have been refilled with credits from reduced deforestation projects.
Availability of offset credits can also help with management of short‐term volatility, but only if supply can be ramped up in line with demand. This is not the case with CDM credits, as the approval process for new projects has been very slow. CDM credits are therefore useful in managing long‐term costs, but less so for short‐term volatility. The exception would be situations in which a regulator accumulates a significant pool of offset credits that could be released quickly, as was to be the case in the H.R.2454 strategic reserve.
Table 6.4: Section 6.4 summary: measures to address price uncertainty and volatility (see Annex for further details)
EU ETS • Unlimited banking • One‐year compliance period, no borrowing (but the
deadline for submission is after the issue of following year’s units, so there is effectively year‐ahead borrowing within trading periods [but not in the final year])
New South Wales • Unlimited banking • Penalty AUD 12/tCO2eq for not supplying abatement
certificates, effectively capping the allowance price • Participants may carry forward a 10% shortfall to the next
year without penalty Regional Greenhouse Gas Initiative
• Quarterly reporting (linked to existing EPA reporting) provides good market information
• Three‐year compliance period, extendible to four in the event of a stage‐two trigger event
• Unlimited banking • Price thresholds allow more offsets to enter scheme • Auction reserve price of the greater of USD 1.86/tCO2 or
80% of the current market price Alberta • Unlimited banking
• Option of paying CAD 15/tCO2eq into technology fund, effectively capping allowance price
New Zealand • Transitional period 2010 to 2012: energy and industry participants must submit one allowance for every two tonnes of emissions. During the transition there is also a NZD 25/tCO2eq fixed price option
• Unlimited banking • Unlimited use of offsets • Linking to international market overrides local price
fluctuations
32 The New Zealand market restricts use of AAUs to “approved” units, to avoid importation of surplus “hot air” Kyoto Protocol units from Eastern European countries.

Reviewing Existing and Proposed Emissions Trading Systems © OECD/IEA 2010
Page | 54
Table 6.4: Section 6.4 summary: measures to address price uncertainty and volatility (see Annex for further details) (continued)
Tokyo • Five‐year compliance period • Unlimited banking • In the event of high allowance prices, increase supply of Tokyo
offsets, credits from outside Tokyo and allow Kyoto Protocol units United Kingdom CRC Energy Efficiency Scheme
• Fixed allowance price GBP 12/tCO2 for introductory three‐year phase, no limit on volume
• No banking from introductory phase, otherwise unlimited banking
• Safety valve allows import of EU ETS allowances, with a minimum price of GBP 14/tCO2.
Australia CPRS • One‐year fixed price phase‐in period at AUD 10/tCO2eq • Transport fuel price rises would have been offset with a
reduction in fuel excise tax for the first two years • Unlimited banking • Borrowing of 5% of year‐ahead allowance permitted • Unlimited access to international Kyoto Protocol offsets • Price cap for five years AUD 40/tCO2eq rising at 5% above
inflation USA H.R.2454 (Waxman Markey)
• Quarterly reporting cycle provides good information to market • Unlimited banking • Borrowing without interest one year ahead, with interest up
to five years for up to 15% of obligation • Strategic reserve set aside as safety valve, offered at auction with
reserve price. Reserve is USD 28/tCO2eq in 2012, rising 5% in 2013/14, then set at 60% above three‐year rolling average price. Proceeds used to purchase REDD units to replenish reserve
• Auction floor price starting at USD 10/tCO2eq then rising at 5% per year above inflation
Western Climate Initiative • Three‐year compliance periods • Unlimited banking • Other measures to mitigate high prices are still under
consideration: a reserve set‐aside, or allowing use of future years’ allowances above certain price triggers
• Auction floor price (level yet to be specified), to support low‐carbon investment and help correct inadvertent oversupply of allowances
California • Three‐year compliance periods • Unlimited banking • USD 10/tCO2eq auction price floor. Allowances unsold at
auction are added to the price containment reserve • Allowance price containment reserve (approximately 5% of
total allowances), offered at fixed price at quarterly sales. Reserve will not be replenished. Reserve allowances will be offered in three tiers: USD 40/tCO2eq, USD 45/tCO2eq and USD 50/tCO2eq in 2012. These prices will escalate by 5% plus inflation each year, reaching USD 60/tCO2eq, USD 67/tCO2eq and USD 75/tCO2eq in 2020
© OECD/IEA 2010 Reviewing Existing and Proposed Emissions Trading Systems
Page | 55
6.5. Long‐term investment signals Emissions trading schemes have multiple objectives. Besides efficient deployment of emissions‐reducing technologies in the short term, they aim to stimulate investment in long‐lived low‐carbon infrastructure. This is particularly the case in the power sector, in which early investment in renewable supply or nuclear capacity can help avoid the lock‐in of long‐term emissions from new fossil‐fuel plant.
Investors will assess anticipated allowance prices of a given ETS over the lifetime of a particular asset. If there is significant uncertainty about future conditions (caused by political, market or technology factors), their rational approach may be to delay investment, or to invest in plant that can recover its costs quickly (such as gas‐fired combined cycle electricity generating plant). Both renewable and nuclear investors have recently been calling for greater policy certainty (and therefore allowance price certainty) to enable their investments to proceed. Of course for a given allowance price, the details of investment will vary between schemes, based on the abatement potentials within each capped region.
Emissions trading schemes are not compatible with certainty of price, but a number of approaches have been taken or proposed to attempt to provide greater investment clarity.
The first is to signal emissions caps far in advance. In the EU ETS, targets are set for 2020 and the linear decline in the emissions cap continues at the same rate after 2020. In the H.R.2454 proposal, the cap was specified all the way to 2050. The cap in the Australian scheme was to be set five years in advance, with a “gateway” range specified for a further ten years to provide some guidance to investors. Other schemes rely on more frequent reviews to set targets, but still attempt to provide certainty by using long trading periods (five years or more) in which system rules are fixed, or requiring notice periods for major changes in system rules (Australia). IEA analysis shows that providing certainty over the trading scheme’s environmental goals – and related prices of CO2 – for ten years increases low‐carbon investment: with less than this it is in investors’ interests to take a “wait and see” approach and this leads to higher system prices overall (IEA, 2007a).
However, even if caps are specified over a long timeframe, significant uncertainty remains in the translation of future cap levels into allowance prices. Mitigation could be cheaper or more expensive than anticipated, suppressing or raising market prices. Economic conditions could change. New technologies could arrive, or be delayed. Supplementary policies (such as renewable energy standards) could suppress allowance prices by deploying low‐carbon technologies by other means, making targets easier to achieve. The availability and price of international offsets will also have a significant impact on eventual market prices. There is also the reality that future governments will review existing targets and caps to take account of improved understanding of climate science, economic conditions and international agreements.
Because some of these risks arise from government policy choices (particularly those surrounding reviews of targets, offset allowances and complementary policies), some argue for governments to assist with providing greater price certainty. Some schemes seek to do this through specifying a floor price for allowances – though as discussed in the previous section, the value of cap and floor prices is debated.
Although the EU ETS does not have a floor price, the United Kingdom is currently considering adopting a floor price for its EU ETS participants, by restructuring its Climate Change Levy as a compulsory alternative payment if allowances prices drop below the floor price. North American schemes (H.R.2454, WCI, California) propose to introduce price floors for auctioned
Reviewing Existing and Proposed Emissions Trading Systems © OECD/IEA 2010
Page | 56
allowances. To be effective as an investment driver, the floor price must be set high enough to provide a sufficient carbon price for low‐carbon investors. This is particularly so if there is a real risk that the market will be over‐allocated and the market price will be determined by the floor price. As an example, the RGGI’s current floor price of USD 1.86/tCO2 is obviously insufficient to drive abatement or offsetting activity, although it has prevented auction revenue to states (used primarily for energy efficiency and consumer programmes) from completely collapsing with oversupply of allowances.
It may be politically difficult to implement sufficiently high floor prices to be effective, or to avoid the temptation to intervene to reduce a high floor price in the event that market prices are being set at this level.33 As with price caps, the calibration between overall emissions caps and appropriate price floors will be difficult to set correctly in advance and may well need adjustment so that allowances trade within the desired price range. Investors will consider the possibility of future political adjustments to the floor price in their risk assessments, rather than taking price floors at face value (Stern, 2006).
Allowance price risk is only one of several issues that governments may need to address to attract low‐carbon investment. Competitive electricity markets have been designed to provide revenue based on generators’ running costs. This model suits fossil‐fuel generation, but it is unclear whether high capital cost and low running cost renewable and nuclear plants will be able to recover their costs under these market arrangements, particularly as the share of clean energy increases (Redpoint, 2009; Ofgem, 2010). It is also generally accepted that additional policies are needed to accelerate the research, development and deployment of low‐carbon technologies through measures such as grants, loan guarantees, feed‐in tariffs, or renewable energy obligations. These issues will be discussed further in Chapter 7.
One of the most substantial risks for investors is that of a scheme being repealed or radically changed with changes of government, if there is a lack of political consensus upholding a scheme. In the European Union, there is a good deal of consensus across the political spectrum that the EU ETS should continue, however this is not the case in other jurisdictions such as Australia or the United States. Where there is lack of political consensus, this will increase the perceived value of delay to investors.
However, political uncertainty should not be seen as an argument to delay implementation of trading schemes until full consensus exists. Political positions change with time and once a scheme is implemented debate may shift to its particular rules rather than whether to proceed. This process can be seen at play in New Zealand, where there is now a broad political consensus that emissions trading is an appropriate tool to reduce emissions, but still political disagreement over some of the scheme’s design details. Investors have a clear signal that a price on emissions will persist and should, in time, have growing clarity regarding the precise implementation.
33 In this event, emitters could argue that the environmental objective is being achieved (the overall cap is met) and that if this can be done more cheaply than expected then this should be allowed, rather than arbitrarily raising prices with a floor price.

© OECD/IEA 2010 Reviewing Existing and Proposed Emissions Trading Systems
Page | 57
Table 6.5: Section 6.5 summary: measures to promote certainty for low‐carbon investment (see Annex for further details)
EU ETS • Five‐year trading period Phase II, extended to eight‐year trading period in Phase III
• EU ETS rules and the linear decline in the cap continue beyond 2020 (to be reviewed by 2025 at the latest)
New Zealand • Any significant changes to the scheme will require a five‐year notice period
Tokyo • Five‐year compliance period, to encourage participants to implement energy efficiency programmes rather than purchase offsets
• Targets to 2020 signalled United Kingdom CRC Energy Efficiency Scheme
• Five‐year trading periods
Australia CPRS • Caps set at least five years in advance, with a “gateway” range for the cap set a further 10 years ahead
USA H.R.2454 (Waxman Markey)
• Long‐term cap to 2050 specified • Auction floor price starting at USD 10/tCO2eq then rising at
5% per year above inflation Western Climate Initiative • Auction floor price (level yet to be specified), to support
low‐carbon investment and help correct inadvertent oversupply of allowances
California • Cap set to 2020 • USD 10/tCO2eq auction price floor. Allowances unsold at
auction are added to the price containment reserve
6.6. Free allocation and auctioning Within the overall emissions cap, policies to distribute allowances to scheme participants vary significantly among the schemes studied, ranging from 100% auctioning,34 to 100% free allocation of allowances. Different methods of free allocation are used, sometimes within the same scheme.
In theory, the method of allowance allocation has no impact on the environmental outcome: it is the cap that determines total emissions reductions (Stern, 2006). Allocation of allowances for free can therefore be used to assist affected parties (businesses and consumers) in the transition to carbon pricing. Even if a firm receives a free allocation greater than its total emissions (it is “long”), it still sees the same theoretical incentive to reduce emissions, as any reductions free up allowances that can be sold at the market price.
However free allocation also has its downsides:
• Significant free allocation will decrease market liquidity, potentially increasing price volatility.
• Allocation decisions represent wealth transfers between sectors of the economy. They can be used to correct distributional impacts, or they can further exacerbate them.
34 It is also possible for governments to sell allowances directly by tender or other means, as has been done by Denmark and Germany. However in general, schemes use auctioning as the sale process.
Reviewing Existing and Proposed Emissions Trading Systems © OECD/IEA 2010
Page | 58
• Free allocation can blunt price signals to investors, depending on how allocation is structured. This can slow the transition to a low‐carbon economy.
• Free allocation to new entrants can encourage high‐emissions activities, depending on how it is structured.
• If participants are able to pass through allowance costs to consumers, providing free allocation can lead to windfall profits. This is particularly the case in the electricity sector where competitive wholesale electricity markets are in place.
• Over‐allocation to firms can make the scheme less effective in practice, as management attention is unlikely to be focused on emissions reductions when they have a surplus of allowances.
And most importantly, if there is overly generous support for emissions‐intensive industries, this runs the risk of preserving the status quo, whereas revolutionary change is required. Every dollar (or allowance) spent supporting existing activity could instead be used to support clean technologies, so a careful balance needs to be struck.
Because of the issues inherent in free allocation, auctioning is preferred at a theoretical level. To the extent that auctioning can be used to distribute allowances, governments will have a revenue stream that can be used to offset the impacts of the scheme on consumers, businesses and the wider economy, to fund energy efficiency, renewable energy and climate change finance commitments to developing countries, or for other measures that increase economic welfare such as debt reduction or reducing income or company taxes. An example of this is the RGGI scheme, where despite low allowance prices, total auction proceeds to date have reached USD 662.8 million, mostly used to support consumer benefits, energy efficiency and renewable energy.
Having a significant level of auctioning within a system also helps provide flexibility to adjust caps as circumstances change. In the event that there is a desire to tighten the system cap, reducing promised levels of free allocation would be opposed by recipients and could send a poor signal in terms of regulatory certainty, however reducing volumes of allowances to be auctioned is easier.35 For example, a proposed way of tightening the 2020 EU ETS cap from 21% to 34% is to reduce the pool of auctioned allowances, leaving free allocations unchanged, should the European Union decide to move towards an overall 30% reduction target for 2020 (European Commission, 2010a).
However, full auctioning has rarely been implemented in practice. The only market operating so far with 100% auctioning is the RGGI and here allowances prices are so low that they have little impact on participants.
Free allocation has generally been included in emissions trading systems as a transitional measure, either to compensate existing entities for their loss of value resulting from the policy change, or else to preserve the competitiveness of existing industries until such time as emissions pricing is more widespread. Some schemes include a clear timeframe for phase‐out of support (EU ETS, H.R.2454, original New Zealand design), while others intend to review levels of free allocation based on international developments (New Zealand).
35 Note however that decisions to change the cap, however effected, could increase the likelihood of further alterations in future, which would not necessarily be to tighten the cap. As such, it can be argued that short‐term intervention to tighten caps might actually weaken long‐term investment signals.
© OECD/IEA 2010 Reviewing Existing and Proposed Emissions Trading Systems
Page | 59
Methods of free allocation
There are two main methods for deciding the distribution free allocation – basing it on a historical reference point (either emissions or production levels), or on future conditions (typically production levels). Each of these has advantages and disadvantages (See Stern, 2006 and OECD, 2010, for a more detailed discussion).
The first, grandfathering, references allocations to historical data. Typically this is historical emissions levels, but it can also be historical production levels multiplied by a reference emissions rate. This is the simplest method to implement (assuming base‐year data exist) and has the advantage that participants continue to feel the full price signal created by the emissions market. Grandfathered allocation can be thought of as compensation for the impacts of the scheme on shareholder value, rather than intending to maintain production levels or competitiveness. If possible, a historical base year is chosen to determine allocation levels (rather than years immediately preceding the scheme’s launch), to avoid companies increasing emissions in order to be given a larger emissions quota.
Grandfathering and auctioning share the advantage that they are counter‐cyclical: when production is booming, companies will be significantly short of allowances and prices will rise, but this is when they can most afford them. Conversely, when production levels fall (as in the current recession), allowance prices drop and companies need to purchase fewer allowances, or may even have a surplus. A significant disadvantage of grandfathering is that if it is based on historical emissions, companies with the highest emissions intensities receive larger allocations than more efficient competitors. Plant upgrades that would have occurred as part of business as usual operations can lead to windfall gains for these companies.
Over‐allocation to industrial sites in Phase I and II of the EU ETS led to the decision to use best‐practice benchmarking rather than historical emissions to determine grandfathered allocations in Phase III. Companies will receive free allocation based on best practice emissions within their industry (the top 10% within Europe), multiplied by historical production levels. This retains the advantage that the full market price signals are seen by participants, but reduces the prospect of windfall gains for poor performers. The main disadvantage of best‐practice benchmarking is that it is complex and data‐intensive. Given the complexity involved, transparency of information and extensive consultation with industry have been critical during the benchmarking process.
The second method references allocation levels to future conditions, typically production levels (Alberta, New Zealand, California). This is equivalent to a production subsidy, because the government covers a proportion of the allowance costs for each unit of production. This is intended to protect the competitiveness (production levels, jobs and profitability) of these sectors against rivals in areas without equivalent carbon pricing. Output‐based allocation removes the potential for windfall gains from BAU output changes, but if baselines (that is, allowances allocated per unit of production) are set too loosely, windfalls can still arise with companies receiving more allowances than required to cover their emissions. Companies still have an incentive to improve efficiency: because allocation is linked to output not emissions, efficiency gains free up allowances that can be sold at the full market price. However in practice, management attention is unlikely to be focused strongly on emissions reductions activities (not core business for many enterprises) if companies have a surplus of allowances.
Output‐based allocation also removes some of the price signal seen by both participants and end‐consumers. Companies receiving output‐based allocation can increase production (and emissions) while only paying part of the allowance cost. If this locks in investment in new high‐
Reviewing Existing and Proposed Emissions Trading Systems © OECD/IEA 2010
Page | 60
emissions infrastructure, it will make later emissions reductions more difficult. It also reduces the price increase of energy‐intensive products seen by end consumers, reducing their incentive to move to lower‐emissions alternatives.
Entry and exit provisions
An important detail of systems using grandfathered allocation is the treatment of companies that establish new facilities or close down. Current or proposed schemes generally provide new entrants with the same support as existing facilities. The rationale for this is to avoid investment moving to jurisdictions without carbon pricing (the “carbon leakage” argument, discussed further in Section 6.7). However in the EU ETS, new entrant provisions have been criticised for promoting investment in high‐emitting electricity generation plants, because under a grandfathered approach these receive the highest level of free allocation (Ellerman et al., 2010).
An alternative approach was proposed in the original design of the New Zealand scheme, in which there would have been no free allocation to new investors or for expansions of existing capacity. In this case, although some high‐emissions investment could be lost to other jurisdictions, all new investments would face the full price of emissions and would therefore reflect an efficient investment mix for a carbon‐constrained future.
In theory, firms that close down should not be required to return allowances, as this creates an incentive for inefficient plant to continue operation. However, there is an obvious political difficulty in continuing to allocate free allowances to facilities that have shut down and almost all emissions trading systems require allowances to be surrendered upon closure.36 Some NAPs in the early phases of the EU ETS allowed for the transfer of allowances when facilities were replaced. While this reduces the incentive to keep old plant in operation, it means that some new investments receive greater support than others, potentially skewing investment decisions.
Transition to auctioning
The evolution of the EU ETS illustrates a transition from free allocation to auctioning. Early analysis highlighted the benefits of auctioning and the European Commission attempted to make some degree of auctioning compulsory from the beginning of the EU ETS. However this was not supported by member states, which supported the position of their industries that free allocation was necessary to help manage the transition from a non‐carbon constrained policy environment to a carbon‐constrained one. The final rule allowed 5% auctioning in Phase I and 10% in Phase II, with no compulsory auctioning (Ellerman et al., 2010)
As trading proceeded, concerns began to arise that windfall profits were being made by those participants that were able to pass on allowance costs, particularly the power sector. It also became clear that free allocation could be better targeted to those companies most exposed to emissions costs. This has led to the decision for Phase III of the ETS that around 60% of allowances will be auctioned, that there will be (as a rule) no free allocation for the power sector and that free allocation will be centrally co‐ordinated to ensure it is targeted at the most exposed sectors.
The H.R.2454 proposal set out a similar path, with free allocation seen as a time‐limited transitional measure to assist existing industries and consumers to adjust. Initially 85% of 36 In Phase II of the EU ETS, the Netherlands and Sweden do not require the surrender of allowances on plant closure.

© OECD/IEA 2010 Reviewing Existing and Proposed Emissions Trading Systems
Page | 61
allowances would have been allocated for free (though only 20% of these would go to scheme participants), transitioning to 65% auctioning by 2030. EPA analysis finds that free allocation of 14.5% of allowances would be necessary to fully compensate large emitters for their direct and indirect costs, roughly in line with the level of allocation proposed in this scheme (EPA, 2010a).
Table 6.6: Section 6.6 summary: free allocation and auctioning provisions (see Annex for further details)
EU ETS • Phase I and II: Allocation by individual member countries through National Allocation Plans. 3% of allowances set aside for auctioning in Phase II (though 10% permitted). Allocations generally provided for new entrants (5.4% of allowances in Phase II), allowances generally must be returned at plant closure
• Phase III: full auctioning for power sector (with minor exceptions). Centralised free allocation to other sectors based on industry benchmarking. Trade‐exposed energy‐intensive sectors receive up to 100% of their sectoral benchmark. Other sectors receive 80%, phasing out to 30% in 2020 and zero in 2027. New entrants receive same allocations, plant closure will mean end of free allocation.
Norway • For 2008‐12 approximately 70% auctioning, 30% free allocation. Offshore oil and gas production (64% of emissions) receives no free allocation. Land‐based industries free allocation equivalent to approximately 92% of 1998‐2001 base period emissions (100% for process emissions and 87% for energy emissions)
Switzerland • Allowances are allocated for free corresponding to the negotiated target level
New South Wales • Baseline and credit scheme, so no free allocation or auctioning. Participants must submit abatement certificates for any emissions above their benchmark level, from project‐based activities
Regional Greenhouse Gas Initiative
• 100% auctioning. Over 90% of revenue has been used to support consumer benefits, energy efficiency and renewables
Alberta • Baseline and credit scheme, so no free allocation or auctioning. Companies must cover any emissions above their target level and are awarded credits for reducing emissions beyond target levels
New Zealand • Ongoing free allocation to agriculture and energy‐intensive industry linked to levels of production. Transitional free allocation to owners of pre‐1990 forests and fishing sector
• Previous 2008 design: free allocation to agriculture and energy‐intensive industry at 90% of 2005 levels, phasing out to zero between 2020 and 2030
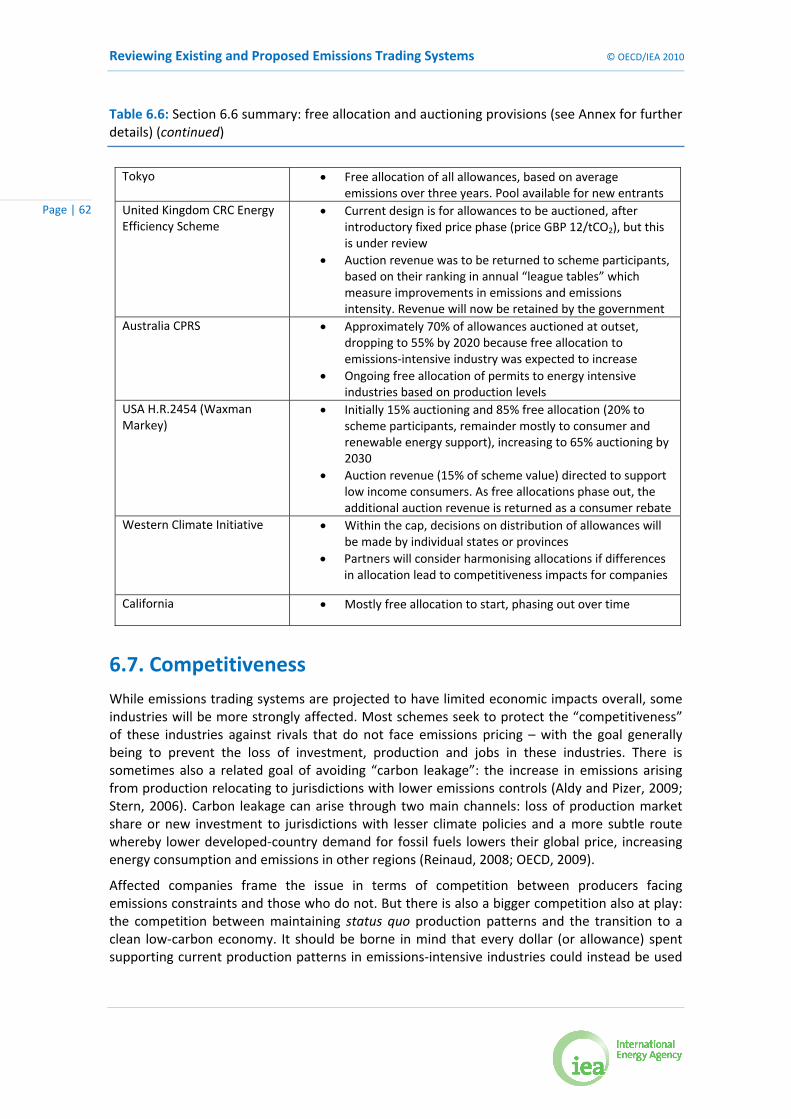
Reviewing Existing and Proposed Emissions Trading Systems © OECD/IEA 2010
Page | 62
Table 6.6: Section 6.6 summary: free allocation and auctioning provisions (see Annex for further details) (continued)
Tokyo • Free allocation of all allowances, based on average emissions over three years. Pool available for new entrants
United Kingdom CRC Energy Efficiency Scheme
• Current design is for allowances to be auctioned, after introductory fixed price phase (price GBP 12/tCO2), but this is under review
• Auction revenue was to be returned to scheme participants, based on their ranking in annual “league tables” which measure improvements in emissions and emissions intensity. Revenue will now be retained by the government
Australia CPRS • Approximately 70% of allowances auctioned at outset, dropping to 55% by 2020 because free allocation to emissions‐intensive industry was expected to increase
• Ongoing free allocation of permits to energy intensive industries based on production levels
USA H.R.2454 (Waxman Markey)
• Initially 15% auctioning and 85% free allocation (20% to scheme participants, remainder mostly to consumer and renewable energy support), increasing to 65% auctioning by 2030
• Auction revenue (15% of scheme value) directed to support low income consumers. As free allocations phase out, the additional auction revenue is returned as a consumer rebate
Western Climate Initiative • Within the cap, decisions on distribution of allowances will be made by individual states or provinces
• Partners will consider harmonising allocations if differences in allocation lead to competitiveness impacts for companies
California • Mostly free allocation to start, phasing out over time
6.7. Competitiveness While emissions trading systems are projected to have limited economic impacts overall, some industries will be more strongly affected. Most schemes seek to protect the “competitiveness” of these industries against rivals that do not face emissions pricing – with the goal generally being to prevent the loss of investment, production and jobs in these industries. There is sometimes also a related goal of avoiding “carbon leakage”: the increase in emissions arising from production relocating to jurisdictions with lower emissions controls (Aldy and Pizer, 2009; Stern, 2006). Carbon leakage can arise through two main channels: loss of production market share or new investment to jurisdictions with lesser climate policies and a more subtle route whereby lower developed‐country demand for fossil fuels lowers their global price, increasing energy consumption and emissions in other regions (Reinaud, 2008; OECD, 2009).
Affected companies frame the issue in terms of competition between producers facing emissions constraints and those who do not. But there is also a bigger competition also at play: the competition between maintaining status quo production patterns and the transition to a clean low‐carbon economy. It should be borne in mind that every dollar (or allowance) spent supporting current production patterns in emissions‐intensive industries could instead be used

© OECD/IEA 2010 Reviewing Existing and Proposed Emissions Trading Systems
Page | 63
to support the transition to more sustainable technologies (in these industries and in the wider economy), so the case for assistance must be carefully assessed.
The definition of what constitutes an “at risk” industry varies considerably between schemes and many definitions are very broad. Most require industries to be both emissions intensive (with a threshold based on revenue, value of shipments or value‐added) and trade‐exposed (based on a ratio of traded products to total production). However, some definitions are looser: for example the EU ETS criteria allow inclusion of trade‐intensive industries even if they are not emissions‐intensive and New Zealand entities are considered trade exposed if there is any (or potential for any) international trade in their product.
There are a number of arguments made for providing free allocation to exposed industries, aimed at protecting their competitiveness or preventing carbon leakage (Reinaud, 2008).
The first reason put forward is to reduce carbon leakage – the transfer of production to jurisdictions with weaker emissions regulations, leading to higher global emissions. In general, leakage is a small effect. Studies of competitiveness impacts in the United States context show that changes in domestic production levels of energy‐intensive goods would arise more from decreases in consumption (the desirable effect of consumption patterns shifting towards less emissions‐intensive goods) than international competitiveness issues (Aldy and Pizer, 2009). The Australian Treasury’s modelling of competitiveness impacts under the CPRS found that while domestic production would have decreased in energy‐intensive sectors, this reflects declining global demand not leakage:
“The risk of carbon leakage and cost of shielding is explored in the CPRS scenarios, which assume Australia prices emissions ahead of many other regions. The results show little evidence of carbon leakage. Where shielding is removed, the emissions and output from EITE [Emissions Intensive Trade Exposed] industries in non‐participating regions do not increase. This suggests the emission prices in these scenarios are not high enough to induce significant industry relocation. Noticeable impacts only occur at much higher emission prices (roughly double the price of the CPRS‐5 scenario)”37 (Australian Treasury, 2008).
The European Commission’s analysis of the impacts of moving to an overall 30% reduction target (34% reduction for the EU ETS) similarly finds:
“In terms of carbon leakage, if both the EU and the rest of the world step up their pledges one should not only consider the absolute change in output for the EU industry, but the relative change in output in the EU compared to the rest of the world, as this demonstrates the change in market shares. The analysis made shows that the relative loss for EU energy intensive industry in case EU steps up to 30% and the rest of the world makes high pledges is that EU’s relative position would be largely unchanged or even slightly improved compared to the case the EU only implements its low end targets on its own” (European Commission, 2010b).
The potential for competitiveness impacts will clearly depend on the degree of action of other countries. Analysis by the OECD (2009) finds that if the European Union were to act alone, cutting emissions unilaterally by 50% by 2050, around 12% of its reductions would be offset by increased emissions elsewhere. However, if all developed countries were to act, the leakage rate would be reduced to only 2%.
The second reason is as a means of providing compensation for the loss in competitiveness – and hence in shareholder value – arising from the policy change. In some circumstances governments may consider it fair to compensate for the value of stranded assets, or it may be 37 The CPRS‐5 scenario has an allowance price rising from AUD 20 in 2012 to AUD 115 in 2050.
Reviewing Existing and Proposed Emissions Trading Systems © OECD/IEA 2010
Page | 64
seen as important to maintain an investment climate where the private sector is confident that their investments will not be undermined by future policy changes. As such, governments may institute a policy of compensating investors for changes in value associated with a significant policy shift such as introduction of emissions trading. For example, some countries made one‐off payments of this type as part of electricity‐market liberalisation (IEA, 2005). In most countries and for most policy changes (for example labour laws or air quality regulations), compensation of this type is not made. Before agreeing to compensate industries affected by emissions trading, governments need to consider whether a policy impact of this type would normally lead to compensation.
If this type of compensation is considered appropriate, care needs to be taken to ensure it is at an appropriate level. A company that is able to pass on all or part of the allowance price to its customers may lose market share, but this effect may not be large. In industries in which it is not possible to pass on emissions prices (due for example to international commodity pricing of output products), profitability will be reduced, but the magnitude and impact of this needs to be assessed before deciding on the level of any compensation. Different levels of compensation may be appropriate in different emissions‐intensive sectors, given their varying ability to pass through emissions reduction costs, the varying impact of emissions pricing on firm profitability and the cost and availability of abatement options (IEA, 2007b).
The final reason cited for providing assistance is to maintain production levels (and hence jobs) in emissions‐intensive industries until such a time as competitors face similar emissions constraints. The argument is one of economic regret – that there would be an economic cost if facilities are closed that would be viable in future when competitors face the same constraints. This argument is one of wider economic welfare, so overall costs and benefits of providing support should be assessed. A number of factors need to be considered:
• Is the lost production expected to arise from consumers shifting to lower‐emissions products, or from leakage?
• What is the cost of the support proposed, compared to the value of production maintained?
• In terms of overall economic and employment outcomes, is this the best use of these funds? For example, for the same level of funding, more jobs may be stimulated by providing assistance to emerging low‐emissions industries than by supporting historical high‐emissions activity. (Though of course the impacts on dislocated workers need to be included in such an analysis.)
• If support is to be provided, what is the minimum level that would maintain employment levels?
• Is the industry concerned likely to be competitive with widespread international emissions pricing, or is support simply delaying necessary economic adjustment?
• How quickly should support phase out?
Again, the answer to these questions may be different for different industries. A blanket policy of support is likely to lead to some windfall gains and support of some facilities that may not be viable even with widespread international emissions pricing. And again, much of the lost production is expected to arise from the necessary and desirable consumer shift to lower‐emissions products. Negating this by subsidising emissions‐intensive production undermines the purpose of emissions pricing and slows the transition to a low‐carbon economy.
Current and proposed emissions trading systems use a number of methods to address competitiveness concerns: grandfathering of allowances based on historical emissions levels (EU
© OECD/IEA 2010 Reviewing Existing and Proposed Emissions Trading Systems
Page | 65
ETS, New Zealand original design) or benchmarked to industry best practice (EU ETS Phase III), output‐based allocation (Australia, New Zealand, H.R.2454), case by case negotiation of targets in baseline and credit schemes (Alberta, New South Wales, Switzerland) and the possibility for future border adjustments to included imported products in the trading scheme (H.R.2454, EU ETS).
The level of free allocations provided to emissions‐intensive industries is generally very high, often covering close to 100% of their increased costs (EU ETS Phases I and II, New Zealand, Australia, H.R.2454). In the case of output‐based allocation, the total level of support can increase with time: for example in the Australian scheme, production was expected to increase faster than the 1.3% per year reduction in support, so the overall level of free allocation was expected to rise significantly with time. For Phase III of the EU ETS, support will be benchmarked to the top 10% of industry, so most participants will need to purchase some allowances. Given the wide range of emissions performance within these industries, preliminary indications are that some emitters will need to purchase allowances for a significant proportion of their output.
The justification for high levels of support approaching 100% is usually unclear. With governments now facing significant financial constraints, designers of future emissions trading systems may focus greater attention on the costs and benefits of free allocation.
For example, the European Commission has modelled the impact of the EU ETS on production levels in key emissions‐intensive industries, under scenarios in which countries globally implement their low‐end or high‐end Copenhagen pledges. With high‐end pledges, output of the European Union cement sector is reduced by 0.3% in 2020 with benchmarked free allocation, or 0.6% if all allowances are auctioned. The conclusion drawn is that free allocation can help limited output losses of energy intensive industries (European Commission, 2010b). However this analysis does not directly address the wider economic questions surrounding this level of support: are production changes of less than 1% sufficiently material to justify implementing a policy response? How does the cost of free allocation compare to the value of lost production?
Because free allocation has the effect of underwriting all production rather than simply addressing carbon leakage, an alternative approach to competitiveness effects has been proposed: using border adjustments (Dröge et al., 2009). In this approach, importers of emissions‐intensive goods are required to participate in the ETS. This can have the significant advantage of levelling the playing field for producers while still allowing prices to rise and hence consumer demand to shift appropriately. The design details of any border adjustment measure are decisive in determining whether it is effective (Reinaud, 2008). However levelling the playing field, i.e. requiring producers from all countries to bear the same cost, is perceived by developing countries as violating the UNFCCC principle of common but differentiated responsibilities. It also has the significant downside of being politically contentious internationally, with such provisions likely to be challenged through the WTO process. It is also unclear how it could be implemented fairly, as the emissions‐intensity of goods from different parts of the world varies significantly. Interestingly, Burniaux et al. (2010) find that border adjustments do not necessarily curb the output losses incurred by the domestic energy intensive‐industries,38 because these industries often make use of energy‐intensive intermediate products imported from other regions. They also find that border adjustments would result in a small negative impact on global welfare and GDP (although the implementing country may have a welfare increase). 38 This is expected, as border tax adjustments only intend to prevent leakage, not production impacts caused by increased domestic prices for emissions‐intensive goods.

Reviewing Existing and Proposed Emissions Trading Systems © OECD/IEA 2010
Page | 66
Phase III of the EU ETS contains an option to allow inclusion into the EU ETS of imports from energy‐intensive industries, possibly for implementation after 2020. However, as this would pose a number of issues, the European Union is currently focused on the implementation of the already agreed competitiveness measures, namely free allocation based on industry benchmarking. The United States H.R.2454 proposal required BTAs to be implemented from 2020 unless 85% of imports in a sector are covered by international or sectoral agreements, or have lower than United States emissions intensities.39
Table 6.7: Section 6.7 summary: measures to address competitiveness concerns (see Annex for further details)
EU ETS • Phase II: free allocations according to individual NAPs. Has resulted in greater than 100% allocation for some sectors
• Phase III: allocation up to 100% of benchmarked sectoral emissions, total pool for allocation phasing out in line with overall cap. The criteria for inclusion are that:
o Direct and indirect costs from the ETS are greater than 5% of gross value added AND trade intensity is greater than 10%, OR
o Direct and indirect costs from the ETS are greater than 30% of gross value added, OR
o Trade intensity is greater than 30%. • An option to allow inclusion into the EU ETS of imports from
energy‐intensive industries
Switzerland • Baselines negotiated individually
Alberta • Output‐based allocation allows for increasing production
New Zealand • Free allocation on a production‐linked basis to emissions‐intensive industries and agriculture:
o 60% of historical industry‐average emissions per unit of production for moderately emissions‐intensive industries (> 800 tCO2eq per NZD one million revenue)
o 90% of historical industry‐average emissions per unit of production for highly emissions‐intensive (> 1 600 tCO2eq per NZD one million revenue)
• Allocations made in advance based on the previous year’s output, with true‐up based on actual output. Assistance per unit of production phases out at a rate of 1.3% per year beginning in 2013
• Previous 2008 design: fixed free allocation to agriculture and energy‐intensive industry, 90% of 2005 emissions levels, phasing out to zero by 2030. To be distributed in line with an allocation plan for each sector. No allocation for new entrants or expanded production
39 Note that if production moves from a capped region to an uncapped region with lower intensity, there is still leakage. This is because total emissions in the capped region are determined by the fixed system‐wide cap, so the shift in production adds to global emissions.

© OECD/IEA 2010 Reviewing Existing and Proposed Emissions Trading Systems
Page | 67
Table 6.7: Section 6.7 summary: measures to address competitiveness concerns (see Annex for further details) (continued)
Australia CPRS • Qualification: emissions‐intensive and a trade share greater than 10%
o Free allocation 94.5% for activities with emissions intensity of at least 2 000 tCO2eq per AUD one million revenue or 6 000 tCO2eq per AUD one million value‐added
o Free allocation 66% for activities with emissions intensity between 1 000 tCO2eq and 1 999 tCO2eq per AUD one million revenue, or between 3 000 tCO2eq and 5 999 tCO2eq per AUD one million value‐added
• Output‐based allocation, linked to historical industry‐average emissions. Initial rates of assistance reduced by 1.3 % per year. Permits allocated at the start of each year based on previous year’s level of production
• The 1.3% per year phase‐out of support was subject to review. If less than 70% of competitors faced similar constraints, this would be taken as evidence that the 1.3% phase‐out should cease
USA H.R.2454 (Waxman Markey)
• Energy intensive trade exposed entities receive up to 15% of total scheme allowances, phasing out to zero by 2035
• Criteria for inclusion as EITE (based on 2004‐06 data): o emissions cost greater than 5% of value of
shipments and trade intensity greater than 15%, or o emissions cost greater than 20% of value of
shipments • Rebate based on actual production, linked to industry
average emissions. Total pool capped: pro‐rata reduction if demand exceeds supply
• President may slow phase‐out of free allocation for an industry if more than 15% of imports come from countries with inadequate policies
• Border measures must be introduced in 2020 unless 85% of imports are from sectors covered by international or sectoral agreements, or have emissions lower than United States emissions intensities
Western Climate Initiative • Allocation decisions will be made by individual partner states and provinces. Focus of discussions to date has been on using benchmarking as a basis for allocation
• Electricity imported into the WCI region is included in the trading scheme to avoid competitiveness issues
California • Energy intensive industries receive output‐based allocation based on industry benchmarks (90% of industry average emissions intensity), updated for recent production
• Electricity imported into California is included to avoid competitiveness issues
Reviewing Existing and Proposed Emissions Trading Systems © OECD/IEA 2010
Page | 68
6.8. Use of ETS revenue Where schemes include auctioning, auction revenue is available. This can be used, for example, to reduce impacts on consumers, fund energy efficiency, renewable energy and technology development, or meet international climate financing obligations. Alternatively, allowances can be set aside to be sold by recipients to fund these activities. While most schemes dedicate ETS funding or allowances to these purposes, some do not, preferring to use separate policies in these areas.
Consumer impacts
One of the principal concerns faced by governments when introducing emissions trading systems are the expected (or feared) rises in consumer energy prices.
These price rises are generally expected to be modest (for example AUD 4 per week on electricity and AUD 2 per week on gas and other household fuels in the Australian proposal), but energy price rises are politically unpopular and many schemes contain policies to address consumer costs. These take two forms.
First, some schemes seek to directly compensate consumers for price rises, using auction revenues. A good example of this is the Australian proposal: here, revenue was to be tagged to adjust low‐income tax thresholds, increase family tax credits and adjust pensions and social security benefits. Most low‐income households were expected to receive more in these adjustments than their cost of living increase. In the H.R.2454 proposal, some auction revenue would have been directed to support low‐income consumers.
A related approach is to compensate consumers on a per‐capita basis, rather than targeting funds at low‐income groups. In the H.R.2454 proposal, as free allocations to industry and utilities phase out, the increasing auction revenue is to be returned to households directly on a per‐capita basis. This “cap and dividend” approach is seen to varying degrees in a number of United States proposals considered in 2010 (including the Kerry‐Lieberman and Cantwell‐Collins bills in the Senate).
The approach of recycling revenue to consumers has the advantage that while they are no worse off overall,40 they still face the full price of emissions in their purchasing decisions. There will be some reduction in demand in response to higher prices and an incentive to move to cleaner energy options.
Second, some schemes try to prevent consumer price rises, by using auction revenue (or allowance allocation) to subsidise energy consumption. In the Australian proposal, a transitional “cent for cent” transport fuel excise reduction was to be introduced, to offset petrol price rises during the scheme’s phase‐in period. In the H.R.2454 proposal, there was to be a very large free allocation (56%) of allowances to electricity and gas distribution companies, which they were required to use to offset price rise impacts for consumers.41
If consumers are shielded from price rises, energy demand (and hence emissions) will be higher than otherwise. For this reason, compensation rather than shielding is clearly preferred in theory. However, if consumer shielding is politically necessary to gain acceptance of the scheme, it may be an acceptable second‐best option. Particularly in the power sector, the 40 In the Australian proposal, 90% of low‐income households would receive assistance greater than 120% of their increased costs and 60% of middle‐income households would receive sufficient assistance to cover their increased costs. 41 This proposal set off a major debate among analysts concerning how to provide the compensation without diminishing price incentives for consumers and the extent to which consumers pay attention to marginal electricity rates in contrast to the entire bill. Ideas included payments outside the electricity bill on some basis.
© OECD/IEA 2010 Reviewing Existing and Proposed Emissions Trading Systems
Page | 69
greatest gains from emissions pricing are expected to flow from generation investment decisions (as companies move to renewable, nuclear or CCS generation), rather than price‐induced consumer demand reductions. The H.R.2454 and Californian proposals follow this logic: free allowances were allocated to electricity utilities (distribution companies), with the requirement that they be used to lower electricity bills for consumers. The idea is that electricity generators would still feel the price signal from emissions trading, but commercial and residential consumers would be compensated (at least in part) for price rises.
In some schemes there is no attempt to directly mitigate consumer costs. In the New Zealand scheme, there are no allowances available for this purpose because the choice has been made to dedicate free allocation to the industry and agriculture sectors. This free allocation absorbs most available allowances leaving none available for consumer compensation purposes.42 Although modest, electricity price rises were a controversial issue when the electricity sector came into the scheme in July 2010.
Many schemes add a third approach – using ETS revenue to fund consumer energy efficiency programmes, so that even though energy prices may rise, total energy costs to consumers do not (Australia, H.R.2454).
Energy efficiency, renewable energy, technology development
A number of schemes propose to set aside auction revenue or allowances to fund energy efficiency programmes (RGGI, Australia, H.R.2454), providing a stable funding stream for these programmes. Other schemes allow energy efficiency projects as offsets (Tokyo, NSW).
Energy efficiency improvements will be critical in achieving the transition to low‐carbon energy systems. In the WEO‐2009 model, more than half of the emissions reductions between the reference and 450 Scenarios are achieved through greater energy efficiency. Energy efficiency programmes are often directly funded by governments and budget limitations mean they may not reach their full economic potential. Emissions trading systems with auctioning represent a new revenue stream that may be able to bridge this gap.
Funding or allowances are also allocated for technology demonstration projects. The EU ETS, Australian and H.R.2454 schemes all earmark significant funds for carbon capture and storage demonstrations and have programmes to develop renewable energy.
To drive the deployment of renewable energy, most jurisdictions also add supplementary policies such as renewable portfolio standards or feed‐in tariffs. These are aimed at supporting high levels of investment in new technologies, in order to bring costs down to the point at which carbon prices alone will eventually make them competitive. In theory, emissions pricing could deliver this role if there were a credible long‐term forward price path for emissions. As such, some argue that supplementary policies can be redundant (OECD, 2007). However, given the very short timeframe available to achieve a radical transition in our energy systems, these technologies are needed far more quickly than market‐pull alone can deliver (IEA, 2009). The IEA 450 Scenario assumes significant direct support for technology development and deployment, which coupled with a strong emissions pricing pathway drives rapid development and uptake of clean technology.
However, while both renewable energy support and emissions pricing policies may both be necessary, the interaction between them must be carefully understood so that these overlapping policies do not undermine one another. This issue is discussed further in Chapter 7.
42 The government will retain some allowances to manage forestry liabilities.
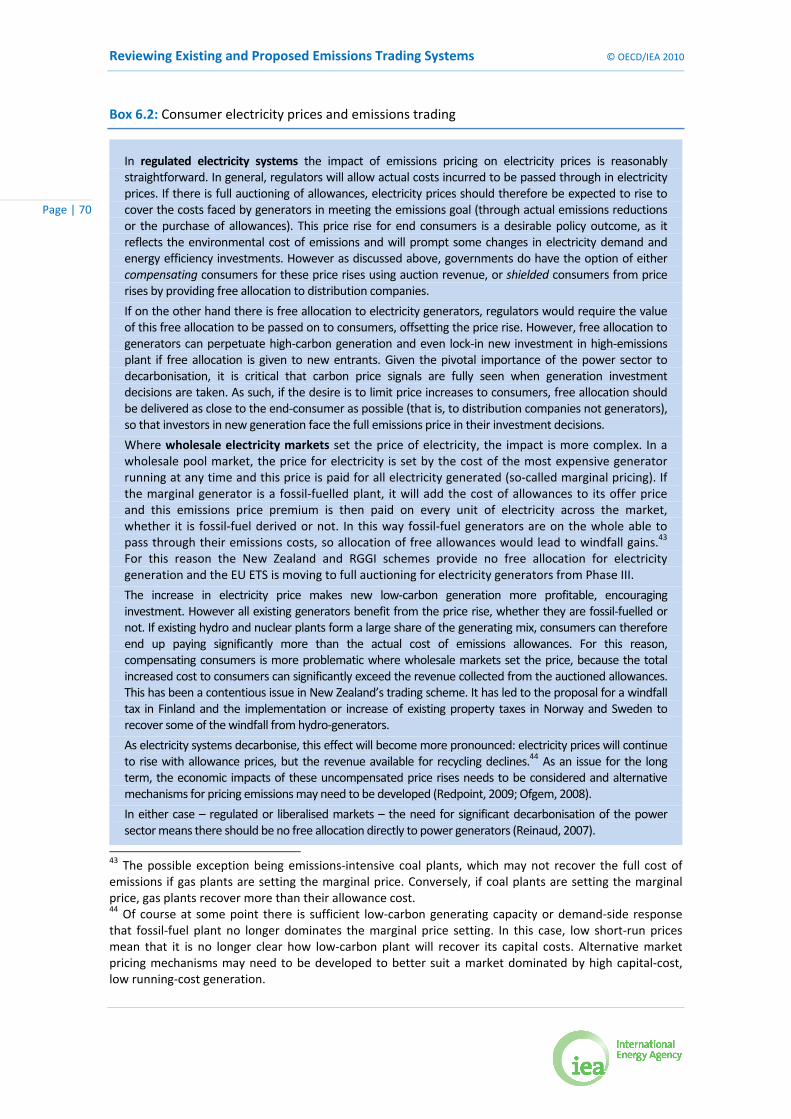
Reviewing Existing and Proposed Emissions Trading Systems © OECD/IEA 2010
Page | 70
Box 6.2: Consumer electricity prices and emissions trading
43 The possible exception being emissions‐intensive coal plants, which may not recover the full cost of emissions if gas plants are setting the marginal price. Conversely, if coal plants are setting the marginal price, gas plants recover more than their allowance cost. 44 Of course at some point there is sufficient low‐carbon generating capacity or demand‐side response that fossil‐fuel plant no longer dominates the marginal price setting. In this case, low short‐run prices mean that it is no longer clear how low‐carbon plant will recover its capital costs. Alternative market pricing mechanisms may need to be developed to better suit a market dominated by high capital‐cost, low running‐cost generation.
In regulated electricity systems the impact of emissions pricing on electricity prices is reasonably straightforward. In general, regulators will allow actual costs incurred to be passed through in electricity prices. If there is full auctioning of allowances, electricity prices should therefore be expected to rise to cover the costs faced by generators in meeting the emissions goal (through actual emissions reductions or the purchase of allowances). This price rise for end consumers is a desirable policy outcome, as it reflects the environmental cost of emissions and will prompt some changes in electricity demand and energy efficiency investments. However as discussed above, governments do have the option of either compensating consumers for these price rises using auction revenue, or shielded consumers from price rises by providing free allocation to distribution companies.
If on the other hand there is free allocation to electricity generators, regulators would require the value of this free allocation to be passed on to consumers, offsetting the price rise. However, free allocation to generators can perpetuate high‐carbon generation and even lock‐in new investment in high‐emissions plant if free allocation is given to new entrants. Given the pivotal importance of the power sector to decarbonisation, it is critical that carbon price signals are fully seen when generation investment decisions are taken. As such, if the desire is to limit price increases to consumers, free allocation should be delivered as close to the end‐consumer as possible (that is, to distribution companies not generators), so that investors in new generation face the full emissions price in their investment decisions.
Where wholesale electricity markets set the price of electricity, the impact is more complex. In a wholesale pool market, the price for electricity is set by the cost of the most expensive generator running at any time and this price is paid for all electricity generated (so‐called marginal pricing). If the marginal generator is a fossil‐fuelled plant, it will add the cost of allowances to its offer price and this emissions price premium is then paid on every unit of electricity across the market, whether it is fossil‐fuel derived or not. In this way fossil‐fuel generators are on the whole able to pass through their emissions costs, so allocation of free allowances would lead to windfall gains.43 For this reason the New Zealand and RGGI schemes provide no free allocation for electricity generation and the EU ETS is moving to full auctioning for electricity generators from Phase III.
The increase in electricity price makes new low‐carbon generation more profitable, encouraging investment. However all existing generators benefit from the price rise, whether they are fossil‐fuelled or not. If existing hydro and nuclear plants form a large share of the generating mix, consumers can therefore end up paying significantly more than the actual cost of emissions allowances. For this reason, compensating consumers is more problematic where wholesale markets set the price, because the total increased cost to consumers can significantly exceed the revenue collected from the auctioned allowances. This has been a contentious issue in New Zealand’s trading scheme. It has led to the proposal for a windfall tax in Finland and the implementation or increase of existing property taxes in Norway and Sweden to recover some of the windfall from hydro‐generators.
As electricity systems decarbonise, this effect will become more pronounced: electricity prices will continue to rise with allowance prices, but the revenue available for recycling declines.44 As an issue for the long term, the economic impacts of these uncompensated price rises needs to be considered and alternative mechanisms for pricing emissions may need to be developed (Redpoint, 2009; Ofgem, 2008).
In either case – regulated or liberalised markets – the need for significant decarbonisation of the power sector means there should be no free allocation directly to power generators (Reinaud, 2007).

© OECD/IEA 2010 Reviewing Existing and Proposed Emissions Trading Systems
Page | 71
Funding international climate finance obligations
Under the Copenhagen Accord, developed countries have committed to a goal of jointly mobilising USD 100 billion per year by 2020 to address the needs of developing countries. Some of this funding can be provided directly through the carbon market, with appropriate use of offsets (as discussed in Section 6.3). However this is only part of the solution and some developed country needs (particularly in adaptation) will need direct funding assistance.
Emissions trading schemes offer a possible mechanism for raising some of these additional funds. One option is to impose a small tax on all market transactions, to be used for climate finance purposes. There is a precedent for this in the Kyoto Protocol framework, in which there is a 2% adaptation levy on CDM transactions. This is expected to raise around USD 480 million in the period 2008‐12, a useful contribution but well short of the overall sums required (UNFCCC, 2009). Much more significant funding could be delivered by using auction revenue directly. For example, the total value of allowances in the H.R.2454 proposal was estimated to be USD 100 billion in 2020, rising to USD 350 billion in 2050 (EPA, 2010a, 2010b), so tagging a proportion of auction revenues for developing country commitments would go a substantial way towards meeting the United States’ share of the agreed funding. The United Nations panel established by Secretary‐General Ban Ki‐moon to investigate climate finance found that at a carbon price of USD 20/tCO2eq to USD 25/tCO2eq in 2020, USD 30 billion per annum could be mobilised towards the Copenhagen Accord finance goal, if developed countries adopted emissions pricing and 10% of proceeds were set aside in this way (United Nations, 2010).
Table 6.8: Section 6.8 summary: use of ETS revenue (see Annex for further details)
EU ETS • Phase I and II: little auctioning, revenue decisions made by individual governments
• Phase III: 50% of auction revenues should be used to fund greenhouse gas reductions, adaptation, research and development, renewable energy, energy efficiency (to meet European Union targets), carbon capture and storage, reduced deforestation and to offset the electricity impacts on low to middle income households. Some allowances will also be auctioned to fund demonstration carbon capture and storage projects
New South Wales • Demand‐side abatement projects a compliance option, so direct funding of energy efficiency
Regional Greenhouse Gas Initiative
• RGGI memorandum of understanding requires at least 25% of revenue to be used for consumer programmes. To date, over 90% has been used to support consumer schemes, energy efficiency and renewable energy
Alberta • Compliance option of paying CAD 15/tCO2 into the Alberta technology fund to invest in greenhouse gas reducing technologies. In 2008, CAD 83.3 million was paid into the technology fund in lieu of abatement
New Zealand • No auctioning Tokyo • Options for compliance include energy efficiency projects in
small and medium enterprises, renewable energy certificates

Reviewing Existing and Proposed Emissions Trading Systems © OECD/IEA 2010
Page | 72
Table 6.8: Section 6.8 summary: use of ETS revenue (see Annex for further details) (continued)
United Kingdom CRC Energy Efficiency Scheme
• All revenue was to be returned directly to participants based on league table rankings, but will now be retained by the government
Australia CPRS • Auction revenues would have funded AUD 5 billion per year in household assistance (through tax threshold changes, family tax credits and benefit and pension adjustments), a climate change action fund (energy efficiency projects, worker and community adjustment), biodiversity funding, industry support, coal sector projects and the purchase of REDD credits for meeting Australia’s Kyoto commitments
• Funding for carbon capture and storage demonstration • Energy efficiency programme
USA H.R.2454 (Waxman Markey)
• 56% of value would have gone to reduce price rises for consumers (via allocations to electricity and gas distribution companies), 7% to state renewable and energy efficiency programmes, and 6% to low‐carbon technology development
• As free allocation to industry phases out, resulting increase in auction revenue is returned directly to households
• 20% by 2020 combined renewable and energy efficiency portfolio standard introduced, to be overseen by FERC (15% renewable energy)
• Would have required EPA to promulgate non‐road and heavy vehicle emissions standards. EPA to set transport emissions goals
• USD one billion fund for carbon capture and storage in power generation, raised by levies on fossil fuel generation
• Would have enabled transport secretary to require flex‐fuel vehicles
• Enhanced building codes, building retrofit programme, energy efficiency programmes
Western Climate Initiative • Decisions to be taken by each partner state/province California • Free allocation to electricity distribution companies, which
are required to pass this value on to consumers
6.9. Market oversight There is currently a great deal of attention focused on the oversight of emissions trading markets, following several high profile fraud cases45 and general concerns about the oversight of financial markets arising from the financial crisis.
The international carbon market is now over USD 100 billion in size and as such will attract the attention of those wishing to defraud, cheat or exploit any loopholes in the system. Robust market rules, vigilant oversight and swift decision‐making processes to address any issues 45 Including the “carousel fraud” uncovered in December 2009 relating to non‐payment of VAT on allowance transactions and the “recycled credits” scandal which caused a three‐day trading halt on France’s BlueNext exchange after allowances that had previously been submitted for EU ETS compliance ended up being re‐introduced to the system. In both cases, swift action was taken to close the loopholes concerned.

© OECD/IEA 2010 Reviewing Existing and Proposed Emissions Trading Systems
Page | 73
detected are critical. The recent cases have highlighted the need for close co‐ordination of regulation (or even central regulation) in linked markets such as the EU ETS – which had decided to move to a single co‐ordinated registry and is currently reviewing its market regulation ahead of Phase III. The EU ETS experience will be of particular interest to the evolving Western Climate Initiative, which has a similar linked structure.
There has been a general move towards greater market transparency and regulation following the financial crisis and carbon markets are no exception.
This begins with clear transparent emissions reporting, which both ensures that markets are well informed (reducing volatility) and makes oversight easier. Annual reporting is standard, but some United States markets (RGGI, H.R.2454) include quarterly reporting, bringing emissions reporting in line with other financial reporting requirements. Transparency over any free allocation of allowances by government is also important, again so that market participants are fully informed of supply and demand balances in the marketplace.
To ensure that scheme participants comply with their obligations to surrender allowances, stiff penalties are generally provided for. These generally require surrender of the allowances, plus a penalty payment several times the allowance value. The Swiss scheme has a penalty that escalates with time: in the event of non‐compliance the full CO2 tax must be paid on every tonne of CO2 emissions since exemption was granted.
Most schemes use existing market regulators to oversee derivatives markets, but allowance markets are often largely unregulated. For example in New Zealand, a number of trades have been carried out via online auction site Trademe (New Zealand’s equivalent of eBay). Conversely, in an attempt to provide greater transparency of trading and easier market oversight, the H.R.2454 proposal banned over the counter trading in allowances, requiring them to be traded through exchanges. This limitation was controversial, with industry organisations claiming that over the counter trades are critical for risk management, particularly in the power sector (IETA, 2009).
The Californian proposal introduces relatively strict trading limits with the aim of mitigating market power.
Table 6.9: Section 6.9 summary: market oversight (see Annex for further details)
EU ETS • Annual reporting, independent verification required • National authorities of member states oversee trading in
options and futures, spot trades on exchanges and over‐the‐counter are largely unregulated. Various options are being considered, such as extending the financial markets legislation to the spot market, integrating it in the regulation of energy markets, or setting up a tailor‐made regime for the carbon market
• Penalty EUR 100/tCO2eq for non‐compliance, rising with inflation from 2013, plus surrender of allowances
Switzerland • In case of non‐compliance, the CO2 levy must be paid for the entire period for each tonne of CO2 emitted since exemption
Regional Greenhouse Gas Initiative
• Quarterly reporting linked to EPA obligations • Participation at auctions open, but >95% of allowances at
latest auction to compliance entities. Must show financial security to trade
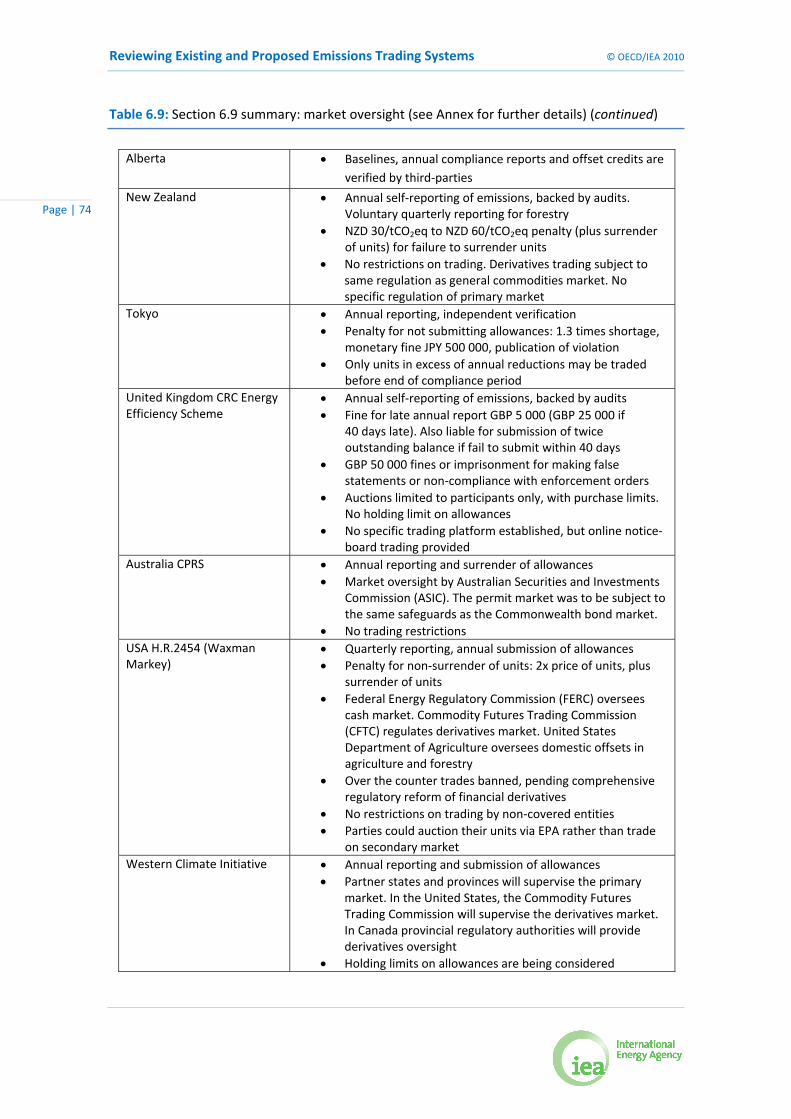
Reviewing Existing and Proposed Emissions Trading Systems © OECD/IEA 2010
Page | 74
Table 6.9: Section 6.9 summary: market oversight (see Annex for further details) (continued)
Alberta • Baselines, annual compliance reports and offset credits are verified by third‐parties
New Zealand • Annual self‐reporting of emissions, backed by audits. Voluntary quarterly reporting for forestry
• NZD 30/tCO2eq to NZD 60/tCO2eq penalty (plus surrender of units) for failure to surrender units
• No restrictions on trading. Derivatives trading subject to same regulation as general commodities market. No specific regulation of primary market
Tokyo • Annual reporting, independent verification • Penalty for not submitting allowances: 1.3 times shortage,
monetary fine JPY 500 000, publication of violation • Only units in excess of annual reductions may be traded
before end of compliance period United Kingdom CRC Energy Efficiency Scheme
• Annual self‐reporting of emissions, backed by audits • Fine for late annual report GBP 5 000 (GBP 25 000 if
40 days late). Also liable for submission of twice outstanding balance if fail to submit within 40 days
• GBP 50 000 fines or imprisonment for making false statements or non‐compliance with enforcement orders
• Auctions limited to participants only, with purchase limits. No holding limit on allowances
• No specific trading platform established, but online notice‐board trading provided
Australia CPRS • Annual reporting and surrender of allowances • Market oversight by Australian Securities and Investments
Commission (ASIC). The permit market was to be subject to the same safeguards as the Commonwealth bond market.
• No trading restrictions USA H.R.2454 (Waxman Markey)
• Quarterly reporting, annual submission of allowances • Penalty for non‐surrender of units: 2x price of units, plus
surrender of units • Federal Energy Regulatory Commission (FERC) oversees
cash market. Commodity Futures Trading Commission (CFTC) regulates derivatives market. United States Department of Agriculture oversees domestic offsets in agriculture and forestry
• Over the counter trades banned, pending comprehensive regulatory reform of financial derivatives
• No restrictions on trading by non‐covered entities • Parties could auction their units via EPA rather than trade
on secondary market Western Climate Initiative • Annual reporting and submission of allowances
• Partner states and provinces will supervise the primary market. In the United States, the Commodity Futures Trading Commission will supervise the derivatives market. In Canada provincial regulatory authorities will provide derivatives oversight
• Holding limits on allowances are being considered

© OECD/IEA 2010 Reviewing Existing and Proposed Emissions Trading Systems
Page | 75
Table 6.9: Section 6.9 summary: market oversight (see Annex for further details) (continued)
California • Annual reporting, third‐party verification • Despite having three‐year compliance periods, a proportion
of allowances must be surrendered annually to reduce the risk of non‐compliance
• Auction bid guarantees required • Auction purchase limit of 10% of allowances offered in
each budget year • Holding limit will be imposed on total allowances, to
mitigate market power (limit will be in addition to immediate compliance obligations)
• No borrowing • If surrender deadlines are missed, obligation becomes four
allowances for every tonne of emissions

Reviewing Existing and Proposed Emissions Trading Systems © OECD/IEA 2010
Page | 76
7. The need for complementary and supplementary policies While emissions pricing forms a key element of climate change mitigation policy, it is clearly insufficient on its own at this point in the evolution of climate policy and additional measures will be required.
Clearly, trading schemes will need to be supported by complementary policies addressing emissions (sectors or gases) that are not covered by the trading scheme, to complete the coverage of climate policy. There are also other areas of policy that complement the action of a trading scheme, such as government support to accelerate the provision of infrastructure for low‐carbon energy systems (such as electric vehicle charging stations or smart electricity grids). Research and development (R&D) funding to reduce the cost of low‐carbon technologies over time is another key complementary policy.
However, there is often also a case for supplementary policies, which target emissions already covered by the capped scheme.
At a simplistic level, support for supplementary policies would not be justifiable. Because total emissions levels are determined by the cap, adding further support policies will not lead to further emissions reductions, they simply rearrange abatement between sectors under the cap in a less cost‐effective manner (for example if high‐cost abatement such as renewable energy is subsidised, lower‐cost emissions reductions are no longer made).
There are two main instances in which supplementary policies may, nonetheless, be worthwhile.
The first is when there are market failures that mean cost‐effective emissions reductions are not made, resulting in higher than necessary allowance prices. In sectors in which emissions are closely linked to consumer choices (for example transport, residential buildings), cost‐effective emissions reductions are often not made due to factors beyond pricing. These include market imperfections and barriers (such as lack of information), but also reflect the tendency of consumers to not act strictly on rational economic principles (IEA, 2007c). Research into energy efficiency standards‐setting demonstrates that consumers tend to under‐value the lifetime running cost of appliances or vehicles, focusing primarily on upfront capital costs. Influencing up‐front costs (for example by bonus/penalty payments based on vehicle fuel economy) or regulating for energy efficiency standards may be more effective tools than emissions pricing alone (IEA, 2008). Energy efficiency policies still need to be backed by emissions pricing however, to avoid the rebound increases in consumption that would be expected.
A related issue is the deployment of expensive low‐carbon technologies (such as renewables and carbon capture and storage), with the goal of reducing their costs over time. This can be justified on the basis of improving overall dynamic efficiency: if support is at an appropriate level, these actions will minimise the long‐run costs of complying with the scheme. Without renewable support now, carbon prices would need to rise higher in later decades to achieve the same emissions reductions. 46
46 Recent theoretical work supports a combination of carbon pricing and research and development directed to low‐CO2 technologies, found to be superior to carbon pricing alone (Acemoglu et al., 2009). This work, focused on R&D, does not take learning effects of large‐scale deployment into account, nor does it account for other barriers to rational energy use.
© OECD/IEA 2010 Reviewing Existing and Proposed Emissions Trading Systems
Page | 77
Each type of supplementary policy (targeting short and long‐run efficiencies) aims to restore a more efficient pattern of abatement, lowering the overall cost of emissions reductions. Although they do not immediately result in reduced emissions, lowering costs will increase the likelihood of more ambitious targets being adopted in future trading periods. It is absolutely critical however, that these supplementary policies are developed alongside the trading scheme, so that caps are set taking into account the expected emissions reductions from supplementary policies. If they are not, supplementary policies run the risk of undermining the capped scheme.
A second (and more contentious) justification for supplementary policies relates to overcoming barriers caused by current policy uncertainty. Trading schemes and emissions targets currently in place do not give investors (or bankers) any clarity on the price of emissions over the long term, on which to base investment decisions. In this climate of uncertainty, investors will delay (IEA, 2007), or choose technologies that reduce their exposure to the carbon price. For example, in many electricity markets gas‐fired generation generally sets the market price of power, so these generators will be able to recover carbon costs. Even if low‐carbon alternatives such as nuclear or renewable would be more cost‐effective, their higher capital costs mean that further gas generation may be favoured. If this were merely a case of current emissions this would be a minor issue, but any new investments in electricity generation are effectively locked in for 30‐40 years. Decisions made today to avoid current uncertainty could be high‐cost for the system as whole over the long term.
Obviously the best option to overcome this uncertainty would be to immediately set ambitious, long‐term, certain targets in emissions trading systems, to provide the forward price visibility needed by investors. However until this certainty is forthcoming, there is an argument for additional support measures to bring forward the deployment of low‐carbon electricity generation. Once again, however, any such supplementary policy must be taken into account when the trading scheme cap is decided, so that prices in the trading scheme are not undermined.
The difficulty of calibrating renewable energy and energy efficiency policies alongside a capped scheme is illustrated by the EU ETS and its associated 20% renewable energy and 20% energy efficiency targets. When this package of targets was first agreed, assessments showed that even if the renewable energy and efficiency targets were met in full, substantial emissions reductions would be needed from EU ETS participants – the cap was set taking these supplementary policies in mind. However BAU emissions for 2008‐12 will now be substantially less than forecast due to the recession and it is now the case that the Phase III cap could be met entirely by delivering the renewable energy and energy efficiency targets, with no action by capped EU ETS participants (European Commission, 2010b). That is, the renewables target would be reducing the incentive for actions by fossil‐fuel generators, such as greater dispatch of electricity from gas or cleaner coal plants. Conversely, some private sector analysts think that the renewables target will not be achieved and significant abatement under the EU ETS will still be required, leading to higher allowance prices (Reuters, 2010).
When combining policy instruments then, careful thought must be given not only on how to calibrate them initially so they are effective, but how to monitor their performance and on what basis they will be reset as circumstances change.
Reviewing Existing and Proposed Emissions Trading Systems © OECD/IEA 2010
Page | 78
8. Conclusions Putting a price on greenhouse gas emissions is a cornerstone policy in climate change mitigation. It is widely accepted that without price measures, it will be significantly more difficult and expensive to implement the economic transformation required to put the world on track to meet the Copenhagen goal of limiting temperature rise to 2 °C.
The need for change is particularly urgent in the power sector, in which IEA modelling shows global emissions need to be over 50% lower in 2030 than baseline trends (IEA, 2009). Energy sector CO2 emissions account for two thirds of the world’s total anthropogenic greenhouse gas emissions, so are a critical target for reductions.
To this end, many countries have implemented or are developing domestic emissions trading schemes. The schemes examined in this paper employ a wide range of designs, with varying coverage, targets, cost‐containment measures, competitiveness policies, use of auctioning and consumer protection measures. These choices have been influenced by local circumstances and political realities in addition to economic analysis.
In designing an ETS, rather than simply copying what has been done elsewhere, it is critical that the costs and benefits of policy choices be evaluated locally. Compromises may need to be made, or schemes phased in gradually. Careful analysis can allow the cost and consequences of these compromises to be clearly understood, to ensure that they are reasonable and that the trading system will still be a cost‐effective tool for emissions reductions. This will help provide a clear understanding of how to achieve a realistic, yet cost‐effective transition to a low‐carbon future.
Based on the practical experience to date in emissions trading design reviewed in this paper, a number of key lessons emerge.
The first is the need for ambitious targets, over the long term. The effectiveness of emissions trading systems in meeting the 2 °C target will depend critically on the targets that are set. Emissions trading is a powerful tool that can deliver what is asked of it. Whether this results in a revolution in our energy systems or just continuation of BAU trends will depend on the political will to set ambitious reduction targets and then enforce them. All schemes proposed have taken an approach of starting with modest targets, an understandable first step. What is important is that more stringent targets in the longer‐term are clearly signalled, so that low‐carbon investment is not delayed.
In the electricity sector, the emerging lesson is to avoid any free allocation of allowances directly to electricity generators. In competitive markets free allocation leads to windfall gains for these companies and does not prevent the rise in electricity prices to end users – an unfortunate case of polluters being paid. In regulated systems, although free allocation to generators could offset the impact of price rises it could also reduce the incentive to invest in low‐carbon generation. In both cases, if the desire is to dampen price rises for end consumers, it is better to compensate consumers directly (or via electricity distribution companies), rather than providing free allocation to generators.
Because of the massive change in investment patterns needed to deliver a low‐carbon future, investment signals need to be clear and consistent including visibility of long‐term emissions prices. This can be achieved by allowing banking, signalling caps far in advance (even as far as 2050) and political commitment to the scheme’s long‐term duration. Although long‐term target

© OECD/IEA 2010 Reviewing Existing and Proposed Emissions Trading Systems
Page | 79
pathways will always be subject to review, they provide a much clearer signal of future direction than leaving cap‐setting to future reviews.
If modest targets are to be set in the early stages of a scheme, another emerging lesson is that it is important to include specific design features to allow flexibility to correct for potential oversupply of allowances in the start‐up phase. If an over‐allocation of allowances can be banked for future use, this has the potential to lock in high emissions activity, making it more difficult to meet long‐term targets. Allowing flexibility to isolate later trading periods from any early errors may be desirable.
Concerns about cost, both to the economy as a whole and to emissions‐intensive industries in particular, have been a driving factor in the scheme designs studied here. There is often a tension between the desire for rapid emissions reductions and the pressure to maintain traditional jobs and patterns of economic growth. However an emerging lesson, drawn from countries’ own economic analyses, is that these cost impacts should not be over‐estimated. While they are real, they are small compared to ongoing economic growth rates and can be addressed by specific design choices such as use of offsets and linking.
Transitional assistance to some industries may be appropriate, but the cost of this can be significant and need to be carefully considered and weighed against other potential uses of revenue. It should also be remembered that these companies face competition from rivals that do not face emissions pricing, but they also face competition from companies producing lower‐emissions alternative products. Overly generous support to maintain current production patterns slows the pace of transition to sustainable low‐carbon technologies. If support measures for emissions intensive industries are included in a scheme, it is important to provide a clear signal that this will be phased out over time.
Finally, it needs to be acknowledged that emissions trading alone will not solve the climate problem – supplementary and complementary policies will be needed. Current trading schemes have incomplete coverage, modest targets and prices that do not yet reflect (or even signal) the social cost of emissions. Market barriers and consumer behaviour limit the uptake of cost‐effective emissions reduction opportunities, particularly in energy efficiency. And there is need for direct infrastructure investment and policies to bring forward the research, development and deployment of low‐carbon technologies that will be needed in the coming decades.
There are significant design choices to be made in establishing an ETS. For future schemes, design choices will reflect international commitments, local objectives, data availability, political acceptability, the desire to link with other schemes and the need for transition measures to facilitate the change from existing high‐emissions economic activity to low‐emissions systems. Although compromises may be needed, particularly in the early stages of a scheme, these should be guided by careful analysis of the costs and benefits of these policy choices, to ensure that the final design is still able to act as an effective and cost‐effective tool in delivering the emissions reductions that are needed in the transition to a low‐carbon future.
Reviewing Existing and Proposed Emissions Trading Systems © OECD/IEA 2010
Page | 80
References Aasrud, A., R. Baron, B. Buchner, K. McCall (2009), Sectoral Market Mechanisms – Issues for
Negotiations and Domestic Implementation, OECD/IEA Information Paper, October, www.oecd.org/env/cc/ccxg/
Acemoglu, D., P. Aghion, L. Burstzyn, D. Hemous (2009), Environment and Directed Technical Change, mimeo Harvard.
Aldy, J.E. and W.A. Pizer (2009), The Competitiveness Impacts of Climate Change Mitigation Policies, Pew Center on Global Climate Change, Washington.
Allison, N.L. et al. (2009), The Copenhagen Diagnosis, 2009: Updating the World on the Latest Climate Science, The University of New South Wales Climate Change Research Centre (CCRC), Sydney, Australia, http://www.copenhagendiagnosis.org/
Alstadheim, E. (2010), “Cap and Trade – Achievements and Lessons Learnt – The Norwegian Experience”, Presentation to ICAP 2010 Conference June 2010, Tokyo, Japan, http://www.icap‐carbonaction.com/phocadownload/tokyo_conf/icap_tokyo_conf_ plenarythree_alstadheim.pdf
Australian Department of Climate Change and Energy Efficiency (2008), “Carbon Pollution Reduction Scheme, Australia’s Low Pollution Future”, Australian Government White Paper, http://www.climatechange.gov.au/publications/cprs/white‐paper/cprs‐whitepaper.aspx
Australian Government (2009a), “New Measures for the Carbon Pollution Reduction Scheme”, Government media release 6 May 2009, http://www.climatechange.gov.au /~/media/Files/minister/wong/2009/media‐releases/May/mr20090504.ashx
Australian Government (2009b), “Details of Proposed CPRS changes”, Government media release 24 November 2009, http://www.climatechange.gov.au/~/media/publications/ cprs/CPRS_ESAS/091124oppnofferpdf.ashx
Australian Government (2010a), “Prime Minister establishes Climate Change Committee”, Government media release 27 September 2010, http://www.pm.gov.au/node/6923
Australian Government (2010b), “Opposition policy does not address climate change” and attachment “GGAS Experience”, Government media release 4 February 2010, http://www.climatechange.gov.au/~/media/publications/cprs/CPRS_ESAS/091124oppnofferpdf.ashxhttp://www.climatechange.gov.au/minister/wong/2010/media‐releases/February/~/media/Files/minister/wong/2010/media‐releases/february/mr20100204a.ashx
Australian Treasury (2008), “Australia’s Low Pollution Future, The Economics of Climate Change Mitigation”, http://www.treasury.gov.au/lowpollutionfuture/
Baron, R., B. Buchner and J. Ellis (2009), “Sectoral Approaches and the Carbon Market”, OECD/IEA paper for Annex I experts group, http://www.oecd.org/dataoecd/ 8/7/42875080.pdf
Bloomberg (2009), “Mexico plans carbon market for Pemex, power, cement companies”, http://www.bloomberg.com/apps/news?pid=newsarchive&sid=aKYM6lkFL70g, accessed 27 October 2010.
Burniaux, J. et al. (2010), “Is there a case for carbon‐based border tax adjustment? An applied general equilibrium analysis”, OECD Economics Department Working Papers No 794, OECD, Paris, http://www.oecd.org/officialdocuments/displaydocumentpdf/?cote=ECO/WKP(2010)50&doclanguage=en
© OECD/IEA 2010 Reviewing Existing and Proposed Emissions Trading Systems
Page | 81
Blyth, W. and M. Yang (2006), “The effect of price controls on investment incentives”, presentation to the Sixth Annual Workshop on Greenhouse Gas Emissions Trading September 2006, IEA/IETA/EPRI, Paris, http://www.iea.org/work/2006/ghget/Blyth.pdf
Burtraw, D., K. Palmer and D. Kahn (2009), “A Symmetric Safety Valve”, Resources for the Future Discussion Paper DP 09‐06, Resources for the Future, Washington.
CARB (California Air Resources Board) (2010a), “ARB Emissions Trading Program Overview”, California Air Resources Board, http://www.arb.ca.gov/newsrel/2010/capandtrade.pdf
CARB (California Air Resources Board) (2010b), “Proposed Regulation to Implement the California Cap‐and‐Trade Program, PART I, Volume I, Staff Report: Initial Statement of Reasons”, California Air Resources Board, http://www.arb.ca.gov/regact/2010/ capandtrade10/capisor.pdf
CBO (Congressional Budget Office) (2009), “H.R.2454 American Clean Energy and Security Act of 2009”, Congressional Budget Office Cost Estimate, http://www.cbo.gov/doc.cfm?index=10262
CCAP (Center for Clean Air Policy) (2008), “Preventing Market Disruptions in Cap‐and‐Trade Programs”, Center for Clean Air Policy, Washington.
CCC (Committee on Climate Change) (2010), “The CRC Energy Efficiency Scheme – advice to Government on the second phase”, Committee on Climate Change, http://downloads.theccc.org.uk.s3.amazonaws.com/CRC/CRC%20Report_2010_web_1.pdf
China Daily (2010), “Carbon Trading in the Pipeline”, http://www.chinadaily.com.cn/bizchina/2010‐07/22/content_11034422.htm, accessed 20 August 2010.
Defra (Department for Food, Environment and Rural Affairs) (2006), “Appraisal of Years 1‐4 of the UK Emissions Trading Scheme”, Report by Enviros Consulting Ltd, http://webarchive.nationalarchives.gov.uk/20090908171815/http://www.defra.gov.uk/environment/climatechange/trading/uk/pdf/ukets1‐4yr‐appraisal.pdf
Dellink, R., G. Briner and C. Clapp (2010a), “Costs, Revenues and Effectiveness of the Copenhagen Accord Emission Pledges for 2020”, OECD Environment Working Papers, No. 22, OECD Publishing. doi: 10.1787/5km975plmzg6‐en
Dellink, R. et al. (2010b), “Towards Global Carbon Pricing, Direct and Indirect Linking of Carbon Markets”, OECD Environment Working Paper, OECD, Paris, http://www.oecd‐ilibrary.org/content/workingpaper/5km975t0cfr8‐en
Dröge, S. et al. (2009), Tackling Leakage in a World of Unequal Carbon Prices, Climate Strategies, http://www.climatestrategies.org/our‐reports/category/32/153.html
EIA (US Energy Information Administration) (2009), “Energy Market and Economic Impacts of H.R.2454, the American Clean Energy and Security Act of 2009”, United States Energy Information Administration, Washington, http://www.eia.doe.gov/oiaf/servicerpt/hr2454/index.html
Ellerman, D.A., et al. (2010), Pricing Carbon, The European Emissions Trading Scheme, Cambridge University Press, Cambridge.
EPA (Environmental Protection Agency) (2009), “The Effects of H.R.2454 on International Competitiveness and Emission Leakage in Energy‐Intensive Trade‐Exposed Industries – An Interagency Report Responding to a Request from Senators Bayh, Specter, Stabenow, McCaskill and Brown”, http://www.epa.gov/climatechange/economics/pdfs/ InteragencyReport_Competitiveness‐EmissionLeakage.pdf
EPA (2010a), “Supplemental EPA Analysis of the American Clean Energy and Security Act of 2009 H.R.2454 in the 111th Congress”, US Environmental Protection Agency, http://www.epa.gov/climatechange/economics/pdfs/HR2454_SupplementalAnalysis.pdf
Reviewing Existing and Proposed Emissions Trading Systems © OECD/IEA 2010
Page | 82
EPA (2010b), “Supplemental EPA Analysis of the American Clean Energy and Security Act of 2009 H.R.2454 in the 111th Congress – Appendix”, US Environmental Protection Agency, http://www.epa.gov/climatechange/economics/pdfs/HR2454_SupplementalAnalysis_Appendix.pdf
EPA (2010c), “Supplemental EPA Analysis of the American Clean Energy and Security Act of 2009 H.R.2454 in the 111th Congress – Data Annex”, US Environmental Protection Agency, http://www.epa.gov/climatechange/economics/downloads/HR2454_SupplementalAnalysis_DataAnnex.zip
European Commission (2009), “The role of European agriculture in climate change mitigation”, Commission Staff Working Document SEC (2009) 1093 final, http://ec.europa.eu/agriculture/climate_change/sec2009_1093_en.pdf
European Commission (2010a), “Analysis of options to move beyond 20% greenhouse gas emission reductions and assessing the risk of carbon leakage”, COM (2010) 265 final, http://ec.europa.eu/environment/climat/pdf/2010‐05‐26communication.pdf
European Commission (2010b), COM (2010) 265, “Commission Staff Working Document, Analysis of options to move beyond 20% greenhouse gas emission reductions and assessing the risk of carbon leakage, Background Information and Analysis”, http://ec.europa.eu/environment/climat/pdf/26‐05‐2010working_doc2.pdf
European Commission (2010c), Emission Trading System (EU ETS) website, http://ec.europa.eu/environment/climat/emission/index_en.htm, accessed 20 August 2010.
FOEN (Federal Office for the Environment) (ed.), (2009), Switzerland’s Fifth National Communication under the UNFCCC, FOEN, Bern, http://unfccc.int/resource/docs/natc/che_nc5.pdf
FOEN (2010), Emissions Trading website, http://www.bafu.admin.ch/emissionshandel/index.html?lang=en, accessed 20 August 2010.
Government of Alberta (2010), Alberta and Climate Change website, http://environment.alberta.ca/0918.html, accessed 20 August 2010.
Holt, M. and G. Whitney (2009), “Greenhouse Gas Legislation: Summary and Analysis of H.R.2454 as Passed by the House of Representatives”, Congressional Research Service Document R40643, Washington, http://assets.opencrs.com/rpts/R40643_20090727.pdf
IEA (2005), Lessons from Liberalised Electricity Markets, OECD/IEA, Paris.
IEA (2007), Climate Policy and Investment Risk, OECD/IEA, Paris.
IEA (2007b), Sectoral Approaches to Greenhouse Gas Mitigation – Exploring Issues for Heavy Industry, IEA Information Paper, OECD/IEA, Paris.
IEA (2007c), Mind the Gap – Quantifying Principal Agent Problems in Energy Efficiency, OECD/IEA, Paris.
IEA (2008), Energy Efficiency Policy – Worldwide Implementation Now, OECD/IEA, Paris, http://www.iea.org/papers/2008/cd_energy_efficiency_policy/index_EnergyEfficiencyPolicy_2008.pdf
IEA (2009), World Energy Outlook 2009, OECD/IEA, Paris.
IEA (2010a), Energy Technology Perspectives 2010, OECD/IEA, Paris.
IEA (2010b), Energy Prices and Taxes 2nd Quarter 2010, OECD/IEA, Paris.
IEA (2010c), The Economics of Transition in the Power Sector, OECD/IEA, Paris.
IETA (International Emissions Trading Association) (2009), “Statement from the International Emissions Trading Association (IETA) on House passage of the American Clean Energy and Security Act of 2009”, Media Release 26 June 2009, http://www.ieta.org/ieta/www/pages/getfile.php?docID=3313
© OECD/IEA 2010 Reviewing Existing and Proposed Emissions Trading Systems
Page | 83
IPART (Independent Pricing and Regulatory Tribunal of New South Wales) (2010), Greenhouse Gas Reduction Scheme website, http://www.greenhousegas.nsw.gov.au/, accessed 20 August 2010.
IPCC (Intergovernmental Panel on Climate Change) (2007), Climate Change 2007: Mitigation. Contribution of Working Group III to the Fourth Assessment Report of the Intergovernmental Panel on Climate Change, Cambridge University Press, Cambridge, http://www.ipcc.ch/ipccreports/ar4‐wg3.htm
Ministry of Environment Republic of Korea (2010), Presentation to ICAP 2010 Conference June 2010, Tokyo, Japan, “Greenhouse Gas and Energy Target Management System”, http://www.icap‐carbonaction.com/phocadownload/tokyo_conf/icap_tokyo_conf_ plenarytwo_lee_english.pdf
New Mexico Environment Department (2010), “Frequently Asked Questions New Mexico Environment Department Proposed Greenhouse Gas Cap‐and‐Trade Rule May 17, 2010”, http://www.nmenv.state.nm.us/cc/documents/CapTradeRule_FAQ.pdf
New Zealand Ministry for the Environment (2010), New Zealand Emissions Trading Scheme website, http://www.climatechange.govt.nz/emissions‐trading‐scheme/, accessed 20 August 2010.
Norwegian Ministry for the Environment (2009), Norway’s Fifth National Communication under the Framework Convention on Climate Change, Norwegian Ministry for the Environment, Oslo, http://unfccc.int/resource/docs/natc/nor_nc5.pdf
NZIER/Infometrics (2009), “Economic Modelling of New Zealand Climate Change Policy, report to the Ministry for the Environment”, http://www.climatechange.govt.nz/emissions‐trading‐scheme/building/reports/economic‐modelling/economic‐modelling‐of‐new‐zealand‐climate‐change‐policy.pdf
Lubowski, R. and P. Piris‐Cabezas (2010), “Preliminary Modeling of Cap and Trade Scenarios in Brazil”, Presentation to the Cap and Trade in Brazil Workshop, Rio de Janeiro 2 August 2010, http://www.fbds.org.br/fbds/IMG/pdf/doc‐423.pdf
OECD (2007), Instrument Mixes for Environmental Policy, OECD, Paris.
OECD (2009), The Economics of Climate Change Mitigation – Policies and Options for Global Action Beyond 2012, OECD, Paris.
Ofgem (Office of Gas and Electricity Markets) (2010), “Project Discovery – Options for delivering secure and sustainable energy supplies”, Consultation Document 16/10, http://www.ofgem.gov.uk/MARKETS/WHLMKTS/DISCOVERY/Documents1/Project_Discovery_FebConDoc_FINAL.pdf
Pearce, J. and R. Stavins (2010), “Meaningful and Cost Effective Climate Policy: The Case for Cap and Trade”, Policy Brief, Pew Center on Global Climate Change, http://www.pewclimate.org/publications/whitepaper/meaningful‐and‐cost‐effective‐climate‐policy‐case‐cap‐and‐trade
Pew Center on Global Climate Change (2010), “Economic Insights from Modeling Analyses of H.R.2454 – the American Clean Energy and Security Act (Waxman‐Markey)”, Pew Center on Global Climate Change, Washington, http://www.pewclimate.org/docUploads/economic‐insights‐hr2454.pdf
Philibert, C. (2006) “Certainty versus Ambition: Economic Efficiency in Mitigating Climate Change”, International Energy Agency working paper series LTO/2006/03, OECD/IEA, Paris, http://www.iea.org/papers/2006/certainty_ambition.pdf
Philibert, C. (2008) “Price caps and price floors in climate policy – A quantitative assessment”, IEA Information Paper, OECD/IEA, Paris, http://www.iea.org/papers/2008/price_caps_floors_web.pdf
Pizer, W.A. (2002), “Combining price and quantity controls to mitigate global climate change”, Journal of Public Economics 85(3):409‐434.

Reviewing Existing and Proposed Emissions Trading Systems © OECD/IEA 2010
Page | 84
Point Carbon (2009), “Switzerland to link ETS with EU”, http://www.pointcarbon.com/ news/1.1342535, accessed 20 August 2010.
Point Carbon (2010a), “Brazil considers domestic carbon market”, http://www.pointcarbon.com/ news/1.1442709, accessed 20 August 2010.
Point Carbon (2010b), “Ukraine eyes regional carbon market”, http://www.pointcarbon.com/ news/1.1472314, accessed 27 October 2010.
Point Carbon (2010c), “Chile to weigh options for domestic ETS”, http://www.pointcarbon.com/ news/1.1473219, accessed 27 October 2010.
Point Carbon (2010d), “Turkey eyes domestic carbon trade”, http://www.pointcarbon.com/ news/1.1476477, accessed 27 October 2010.
PricewaterhouseCoopers (2008), Emission Critical Issue 6, September 2008, http://www.pwc.com/ en_NZ/nz/climate‐change/emissioncriticalsept08.pdf
Quirion, P. (2005), “Does uncertainty justify intensity emissions caps?”, Resource and Energy Economics 27:343‐353.
Redpoint (2009), “Decarbonising the GB power sector: evaluating investment pathways, generation patterns and emissions through to 2030”, Report to the Committee on Climate Change, http://downloads.theccc.org.uk/docs/FINAL%20Decarbonising%20the%20GB%20 power%20sector_v1.pdf
Reinaud, J. (2007), “CO2 and Electricity Price Interaction – Impacts on Industry’s Electricity Purchasing Strategies”, IEA Information Paper, OECD/IEA, Paris, http://www.iea.org/papers/2007/jr_price_interaction.pdf
Reinaud, J. (2008), “Issues behind Competitiveness and Carbon Leakage – Focus on Heavy Industry”, IEA Information Paper, OECD/IEA, Paris, http://www.iea.org/papers/2008/ Competitiveness_and_Carbon_Leakage.pdf
Reinaud, J. and C. Philibert (2007), “Emissions Trading Trends and Prospects”, OECD/IEA paper for Annex I experts group, OECD/IEA, Paris, http://www.iea.org/papers/2007/ET_Trends&Prospects.pdf
Reuters (2010), “EU carbon emissions, price forecasts to 2020”, media release 14 June 2010, http://www.reuters.com/article/idUSTRE65D3VP20100614
RGGI (Regional Greenhouse Gas Initiative) (2007), “Overview of RGGI CO2 Budget Trading Program”, http://www.rggi.org/docs/program_summary_10_07.pdf
RGGI (2010), Regional Greenhouse Gas Initiative website, http://www.rggi.org/, accessed 20 August 2010.
Stern, N. (2006), The Economics of Climate Change – The Stern Review, Cabinet Office – H.M. Treasury, Cambridge University Press, Cambridge.
Snyder, G. (2010), “RGGI as a Laboratory of Democracy: Lessons Learned”, Presentation to ICAP 2010 Conference June 2010, Tokyo, Japan, http://www.icap‐carbonaction.com/phocadownload/tokyo_conf/icap_tokyo_conf_plenarythree_snyder_english.pdf
Toda, E. (2010), “Recent Development in Cap and Trade in Japan”, Presentation to ICAP 2010 Conference June 2010, Tokyo, Japan, http://www.icap‐carbonaction.com/phocadownload/tokyo_conf/icap_tokyo_conf_plenarytwo_toda_english.pdf
Tokyo Metropolitan Government (2010), “Tokyo Cap‐and‐Trade Program: Japan’s first mandatory emissions trading scheme”, http://www2.kankyo.metro.tokyo.jp/sgw/e/data/Tokyo‐cap_and_trade_program‐march_2010_TMG.pdf
UK Department of Energy and Climate Change (2010a), UK ETS website, http://www.decc.gov.uk/en/content/cms/what_we_do/change_energy/tackling_clima/ccas/uk_ets/uk_ets.aspx
© OECD/IEA 2010 Reviewing Existing and Proposed Emissions Trading Systems
Page | 85
UK Department of Energy and Climate Change (2010b), CRC Energy Efficiency Scheme website, http://www.decc.gov.uk/en/content/cms/what_we_do/lc_uk/crc/crc.aspx, accessed 20 August 2010.
UK Treasury (2010), “Spending Review 2010”, HM Treasury, London, http://cdn.hm‐treasury.gov.uk/sr2010_completereport.pdf
UNEP Risoe (2010), “CDM/JI Pipeline Overview”, UNEP, http://cdmpipeline.org/overview.htm#4, accessed 8 November 2010.
United Nations (2010), “Report of the Secretary‐General’s High‐level Advisory Group on Climate Change Financing”, United Nations, New York, http://www.un.org/wcm/webdav /site/climatechange/shared/Documents/AGF_reports/AGF_Final_Report.pdf
UNFCCC (1997), Text of the Kyoto Protocol, http://unfccc.int/essential_background/ kyoto_protocol/items/1678.php
UNFCCC (2009), Report of the Adaptation Fund Board, Report to the Fifth Conference of the Parties to the Kyoto Protocol, Copenhagen December 2009, FCCC/KP/CMP/2009/14, http://unfccc.int/resource/docs/2009/cmp5/eng/14.pdf
WCI (Western Climate Initiative) (2010a), Design for the WCI Regional Program website, http://westernclimateinitiative.org/the‐wci‐cap‐and‐trade‐program/program‐design
WCI (2010b), Updated Economic Analysis of the WCI Regional Cap‐and‐Trade Program: http://www.westernclimateinitiative.org/component/remository/Economic‐Modeling‐Team‐Documents/Updated‐Economic‐Analysis‐of‐the‐WCI‐Regional‐Cap‐and‐Trade‐Program
Webster, M.D. et al. (2008), “Cost Containment: A Primer”, Cap‐and‐Trade: Contributions to the Design of a U.S. Greenhouse Gas Program, MIT Center for Energy and Environmental Policy Research, Boston.
Webster, M.D. et al. (2010), “Second‐best instruments for near‐term climate policy: Intensity targets vs. the safety valve”, Journal of Environmental Economic and Management, 59: 250‐259.
World Bank (2010), State and Trends of the Carbon Market 2010, World Bank, Washington, http://siteresources.worldbank.org/INTCARBONFINANCE/Resources/State_and_Trends_of_the_Carbon_Market_2010_low_res.pdf
Reviewing Existing and Proposed Emissions Trading Systems © OECD/IEA 2010
Page | 86
Annex: Design details of emissions trading systems This Annex summarises key design details of emissions trading systems that had either been put into operation by 2010, or were under consideration with and had a significant level of design detail available.
Information is generally grouped by policy intent (for example “addressing competitiveness concerns”), so there is some repetition when design features address several policy goals.
Where information is available and relevant, each profile covers:
• General scheme design
• Coverage
• Cap/target
• Emissions reductions, allowance prices and economic impacts
• Details of allowance/revenue recycling
• Offsets
• Import and export of units, linking provisions
• Measures to support delivery of long‐term targets
• Measures to provide flexibility and to manage price volatility and uncertainty
• Measures to promote certainty for low‐carbon investment
• Measures to address competitiveness of “at‐risk” industries
• Market oversight and rules
• Complementary and supplementary measures linked to trading scheme
• References for further information
© OECD/IEA 2010 Reviewing Existing and Proposed Emissions Trading Systems
Page | 87
European Union Emissions Trading System (EU ETS) General scheme design
• Mandatory cap and trade scheme for large emitters in 30 countries (27 European Union countries plus Norway, Iceland and Liechtenstein under European Economic Area agreement).
• Introductory Phase I (2005‐07) completed, currently trading in Phase II (2008‐12), Phase III rules have been set (2013‐20).
Coverage • CO2 and from Phase III some industrial gases if resulting from processes that are otherwise
covered (for example PFCs from aluminium, N20 from nitric acid). In Phase II the Netherlands, Austria and Norway have unilaterally opted‐in nitrous oxide from nitric acid production.
• Includes installations undertaking combustion of fuels with total capacity 20MWth. For other industries there are specific production thresholds (for example 50t/day lime, 20t/day glass, 20t/day mineral wool insulation).
• Currently covers approximately 11 500 installations in 30 countries, owned by 5 000 companies. The scheme covers 45% of European CO2 emissions in 2010 (40% total European emissions).
• Aviation emissions will be included from 2012 and the aluminium industry from 2013. From Phase III there is an option to exclude small facilities with emissions less than 25 000/tCO2eq per year if they are covered by other policies.
Cap/target • Phase I (2005‐07): Cap was set below the full range of BAU estimates, with the objective of
establishing the infrastructure for trading not to achieve significant reductions. The cap reflected a 4.3% reduction by the European Commission in the quantity of allowances that had been proposed by member states.
• Phase II (2008‐12): Annual cap 11.8% below the number of allowances in Phase I, 6.5% below 2005 verified emissions. The cap reflects a 10% reduction by the European Commission in the quantity of allowances that had been proposed by member states.
• Phase III (2013‐20): Cap to decline linearly to 21% below 2005 verified levels by 2020. This is intended to deliver a large part of Europe’s targeted reduction of 20% on 1990 levels by 2020. If Europe adopts an overall 30% by 2020 target, the EU ETS cap will be reduced to 34% below 2005 levels by 2020.
Emissions reductions, allowance prices and economic impacts
• Phase I – Problems with poor initial data availability and a false assumption that energy efficiency trends had been exhausted meant that the cap was set too high. Following release of the first year’s verified emissions, allowance prices crashed. Nonetheless, analysis has found that emissions were reduced by 2% to 5% in Phase I due to high initial allowance prices.
• Phase II – Allowance prices traded around EUR 25/tCO2eq for much of 2008, before tumbling as industrial production and electricity generation was curtailed with the recession. Since mid‐2009, allowances have traded in a range between EUR 13/tCO2eq and EUR 16/tCO2eq. Emissions have reduced dramatically with the recession and are below the level of the cap.
• Phase III ‐ With a ‐21% EU ETS cap in 2020 (‐20% economy‐wide reduction target) the European Commission forecasts allowance prices will be EUR 16 in 2020 (or EUR 30 with a ‐34% cap [‐30% economy‐wide target]). This is lower than previously forecast, due to projections of slower emissions growth following the recession and the banking of excess units from Phase II. Private sector analysts expect higher Phase III allowance prices, in the range of EUR 30 to 40 (Reuters).
• Cost EUR 48 billion for the current policy package (‐21% ETS cap [‐20% economy‐wide target], 20% renewable energy and energy efficiency targets) and EUR 81 billion if a ‐34% ETS cap (‐30% economy‐wide target) is taken on. These correspond to reductions in GDP in 2020 of 0.32% and 0.54% in 2020 respectively, compared to 28% GDP growth to 2020.
Reviewing Existing and Proposed Emissions Trading Systems © OECD/IEA 2010
Page | 88
Details of allowance/revenue allocation• Phase I and II:
o Allocation decisions were made by individual member countries, through National Allocation Plans, approved by the European Commission.
o Almost all allowances were allocated for free, with only 3% of allowances set aside for auctioning in Phase II (although auctioning of up to 10% of allowances is permitted).
o Rules for plant closures and new entrants vary among NAPs. Most require return of allowances at plant closure (Sweden and the Netherlands being exceptions). New entrant pools were 2.7% set aside in Phase I, 5.4% in Phase II.
• Phase III: o Allocations will be made according to consistent rules Europe‐wide, to minimise
distortions to competition within the European Union. o There will be much greater use of auctioning, in part to address concerns about
windfall profits in the power sector. Full auctioning will generally be required in the power sector (with limited exceptions for new member states and even these must phase out by 2020). Allowances for auctioning will be distributed to member states based on historical emissions, with extra allowances to lower‐income member states.
o Other sectors receive free allocation based on industry best‐practice benchmarking. Trade‐exposed energy‐intensive sectors receive up to 100% of their sectoral benchmark. Other sectors receive 80%, phasing out to 30% in 2020 and zero in 2027. The total pool for allocation to benchmarked industries declines in line with the overall cap.
o New entrants will receive the same allocations as existing entities, with a 5% reserve provided for this purpose. Plant closure or significant reductions in capacity will mean curtailment or reduction in free allocation.
Offsets • Phase II: Each member state’s NAP includes a quota of offsets, based on base‐year emissions,
2004 emissions and 2010 projected emissions. The total quantity of allowed JI and CDM allowances is 13.4% of the Phase II cap, or 1.4 billion allowances in total. No forestry or nuclear offset projects are allowed.
• Phase III: o Access to project credits under the Kyoto Protocol from outside the European Union
will be limited to no more than 50% of the reductions required in the EU ETS from 2008‐20 below 2005 levels. The unused portion of the Phase II offset quota will be carried forward and topped up to this total amount.
o There are restrictions on use of the CDM in Phase III. Credits generated before 2012 and eligible for use in the Community scheme during Phase II (2008‐12) can be swapped for European allowances until 31 March 2015. Post‐2012 credits from pre‐2012 projects are valid until 2020. However credits from post‐2012 projects are only allowed if hosted by a least developed country. If there is no international post‐2012 agreement in place, bilateral offset agreements with developing countries may be pursued. CDM and JI allowances may also face qualitative restrictions relating to project type.
Import and export of units, linking provisions• Kyoto Protocol JI and CDM allowances within limits. Assigned Amount Units or Removal Units
(forestry) not allowed. • Elements affecting linking: strict offset criteria.
Measures to support delivery of long‐term targets
• No borrowing. • Targets reviewed ahead of each phase, to maintain appropriate long‐term reduction pathway.

© OECD/IEA 2010 Reviewing Existing and Proposed Emissions Trading Systems
Page | 89
Measures to provide flexibility and to manage price volatility and uncertainty• One year compliance period, but the deadline for submission is after the issue of following
year’s units – so there is effectively year‐ahead borrowing within trading periods (but not in the final year).
• Unlimited banking. Measures to promote certainty for low‐carbon investment
• Long eight‐year trading period in Phase III to provide greater investment certainty. • EU ETS rules and the linear decline in the cap continue beyond 2020 (to be reviewed by 2025 at
the latest). This is intended to signal long‐term policy stability. Measures to address competitiveness of “at‐risk” industries
• Phase II: allocations varied according to individual NAPs. Generally, industrial sites were allocated enough allowances to cover all expected emissions and as a result of reduced output during the recession these sectors have significant excess allowances that can be banked or sold.
• Phase III: The criteria and method of allocation will be standardised Europe‐wide to avoid competitiveness impacts. Companies can receive allocation for up to 100% of their emissions if they are at industry best practice (top 15% of installations within Europe). The criteria for inclusion is that:
o Direct and indirect costs from the ETS are greater than 5% of gross value added AND trade intensity is greater than 10%, OR
o Direct and indirect costs from the ETS are greater than 30% of gross value added, OR o Trade intensity is greater than 30%.
• The possibility of including imports from energy intensive industries is an option for possible implementation.
Market oversight and rules • Annual reporting, independent verification required. • National authorities of member states oversee trading in options and futures, spot trades on
exchanges and over‐the‐counter are largely unregulated. Consideration is being given to integrating allowance trading into general regulation of energy markets.
• Penalty EUR 100/tCO2eq for non‐compliance, rising with inflation from 2013, plus surrender of allowances.
Complementary and supplementary measures linked to trading scheme• Phase III: 50% of auction revenues should be used to fund greenhouse gas reductions,
adaptation, research and development, renewable, energy efficiency (to meet European Union targets), carbon capture and storage, reduced deforestation and to offset the electricity impacts on low to middle income households. Some allowances will also be auctioned to fund demonstration carbon capture and storage projects.
• Europe has a legally binding target for 20% renewable energy by 2020, with targets distributed among member states. There is also a target for a 20% improvement in energy efficiency by 2020.
References for further information
• Ellerman (2010); European Commission(2010a, 2010b,2010c).
Reviewing Existing and Proposed Emissions Trading Systems © OECD/IEA 2010
Page | 90
Norway General scheme design
• Mandatory nation‐wide cap and trade scheme for major emitters. • Started 2005, part of EU ETS (with adaptations) from 2008.
Coverage • First phase 2005‐07 covered approximately 10% of emissions (mostly industrial).
• Second phase since 2008 covers 110 to 120 installations, approximately 40% of emissions. Unilateral inclusion of nitrous oxide from nitric acid production.
Cap/target • Second phase target 14MtCO2eq (compared to 2005 emissions of 18MtCO2eq and BAU forecast
of 21MtCO2eq). Unilateral inclusion of nitrous oxide from nitric acid production.
Emissions reductions, allowance prices and economic impacts
• In phase one, supply of units exceeded demand and the market price for allowances went to zero. However experience was gained in allocation, monitoring, reporting and verification.
Details of allowance/revenue allocation• For 2008‐12 approximately 30% of installations’ emissions are covered by free allocation. Most
capped emissions (64%) are from offshore oil and gas production and these receive no free allocation. Land‐based industries receive free allocation corresponding to approximately 92% of emissions in the historical 1998‐2001 base period (87% of energy‐related emissions and 100% of process emissions). Nitrous oxide free allocation 50% of emissions in base period.
Offsets • Limit on offsets 13% of surrendered allowances. Same restrictions on offsets apply as in EU ETS
(no nuclear, forestry sinks).
Import and export of units, linking provisions• Part of EU ETS (with adaptations) since 2008.
References for further information
• Norwegian Ministry for the Environment (2009); Alstadheim (2010).
Switzerland General scheme design
• Opt‐in baseline and credit trading scheme primarily for energy‐intensive entities, who receive exemption from the CO2 levy on heating fuels (currently CHF 36/tCO2) if they participate.
• Runs 2008‐12. • Part of Switzerland’s overall target to meet its Kyoto Protocol target of reducing emissions to
8% below 1990 levels for 2008‐12. Policy for post 2012 is currently being discussed, including enlargement of the emissions trading scheme and potential linking with the EU ETS.
Coverage • Primarily companies in energy‐intensive sectors such as cement, paper and pulp, glass and
ceramics industries. Currently covers around 350 companies. Cap/target
• Reduction targets and an action plan are agreed through negotiations with the government, based on technical and economic potential for abatement. The government can alter annual caps after emissions have been reported. A simplified version is used for small and medium enterprises.
• Targets are set in absolute terms, but take into account expected production levels. • According to market analysts Point Carbon, the total cap in 2008 was 3.3 MtCO2.

© OECD/IEA 2010 Reviewing Existing and Proposed Emissions Trading Systems
Page | 91
Details of allowance/revenue allocation• Allowances are allocated for free corresponding to the negotiated target level. Companies must
account for any emissions above this level by: o Increasing energy efficiency (as specified in action plan). o Buying allowances from companies that have reduced emissions beyond their target. o Buying international offset credits (for example from the CDM) for up to 8% of the target.
Offsets • Kyoto Protocol CDM allowances may used to cover a maximum of 8% of the target.
Import and export of units, linking provisions• The Swiss government has begun discussions aimed at linking with the EU ETS from 2013.
Market oversight and rules • In case of non‐compliance, the CO2 levy must be paid for the entire period for each tonne of
CO2 emitted since exemption. Complementary and supplementary measures linked to trading scheme
• The CO2 level on heating and process fuels is Switzerland’s principal climate change mitigation policy. The levy automatically increases if emissions reductions have not reached target levels and since January 2010 has been set at CHF 36/tCO2 (EUR 26/tCO2). Proceeds from the levy are directly refunded to the Swiss population and business community, with some set aside for building sector energy upgrades.
• The “climate cent” is levied on transport fuels to raise revenue for CO2 reducing projects. • Combined cycle power plants only obtain planning permission if their emissions are fully
compensated (70% domestically). References for further information
• FOEN (2009, 2010); Point Carbon (2009).
New South Wales Greenhouse Gas Reduction Scheme, Australia General scheme design
• New South Wales mandatory trading scheme for greenhouse gas emissions in the production and use of electricity. Scheme targets emissions per capita and is structured as a baseline and credit scheme. Implemented by state law.
• Commenced 1 January 2003. Coverage
• Electricity sector only. Cap/target
• State‐wide annual greenhouse gas “benchmark” set (the “baseline”) and apportioned to individual participants. The benchmark is expressed as tCO2eq per capita. The initial level at the commencement of scheme was set at 8.65 tCO2eq and progressively dropped to 7.27 tCO2eq in 2007 and then remains at that level until 2012.
Emissions reductions, allowance prices and economic impacts
• In 2008, certificates representing 31 MtCO2eq were traded at a market value of USD 184M. In 2009, 34 MtCO2eq were traded at a market value of USD 117 million.
• As of 31 May 2010, 110 MtCO2eq of abatement certificates have been issued in total, most resulting from projects in low emissions electricity and efficiency improvements, or demand side abatement.
Details of allowance/revenue allocation• Participants must submit abatement certificates for any emissions above their benchmark
level, from project‐based activities in the following areas: 1. Low emissions electricity or efficiency improvements 2. Demand side abatement 3. Abatement of on‐site emissions 4. Carbon sequestration in forests, meeting Kyoto criteria

Reviewing Existing and Proposed Emissions Trading Systems © OECD/IEA 2010
Page | 92
Measures to provide flexibility and to manage price volatility and uncertainty• The penalty for not supplying abatement certificates is AUD 12/tCO2eq of shortfall, effectively
capping the cost of compliance for participants. • A benchmark participant may carry forward a shortfall of up to 10% of their benchmark to the
following year without incurring a penalty. References for further information
• IPART (2010)
United States – Regional Greenhouse Gas Initiative General scheme design
• Co‐operative mandatory emissions for electricity sector emissions in ten states of the United States, agreed as memorandum of understanding between governors (signed Dec 2005) and enacted by individual states’ laws and regulations.
• Commenced 1 January 2009. Coverage
• Electricity Sector only, generators >25MW. Covers 200 generators and 95% of emissions from the electricity sector in these states.
• Carbon dioxide (CO2) only. • Was originally envisioned that it could expand to cover other sectors (large industrials, smaller
electricity generators) but there are no plans at present for this. Cap/target
• Target for initial five‐year period is stabilisation “current” levels for 2009‐14. Individual state emissions budgets and the overall cap are based on historical (2000‐02) average emissions and negotiation.
• State emissions budgets will then reduce 2.5% per year over 2015‐18, giving a 10% reduction on 2009 levels by 2018.
Emissions reductions, allowance prices and economic impacts
• 805 MtCO2 of allowances were traded in 2009, with a market value of USD 2.2 billion. Details of allowance/revenue allocation
• A mix of free allocation and auctioning was originally envisaged in the scheme’s design, however states have moved to auction nearly all allowances.
• Over 90% of revenue has been used to support consumer benefits, energy efficiency and renewables. For 2011, New Jersey will divert some funds towards its budget deficit.
• 3‐monthly auctions are held on a common platform, as a uniform‐price sealed‐bid auction. There is an auction position limit 25% and an auction reserve price of the greater of USD 1.86/tCO2 or 80% of the current market price.
• Additional allowances were available for early action, for sources that demonstrate absolute reductions and improved intensity in 2006/07/08 compared to the 2003/04/05 years.
Offsets • Local offsets may be used to fulfil 3.3% of the compliance obligation. This is raised to 5% or 10%
if certain price thresholds are crossed: o Threshold 1: USD 7/tCO2 rolling average over 12 months, in 2005 dollars adjusted for
CPI. The 12 months follows a 14 month market settling period in each commitment period.
o Threshold 2: USD 10/tCO2 in 2005 dollars adjusted by CPI +2% per year. • There is tightly specified eligibility for offsets. Benchmarks and performance standards are used
to test additionality and eligibility. Offsets can be in landfill methane, SF6 reduction, afforestation, reduction of gas or oil in building sector due to energy efficiency, avoided methane from agricultural manure management.
© OECD/IEA 2010 Reviewing Existing and Proposed Emissions Trading Systems
Page | 93
Import and export of units, linking provisions• If the stage two trigger price is reached (12 month rolling average USD 10/tCO2), units from
mandatory schemes offshore or reduction credits certified by UNFCCC may be allowed. • Elements affecting linking: cap/floor prices, domestic offsets, weak target.
Measures to provide flexibility and to manage price volatility and variations• Quarterly reporting (linked to existing EPA reporting) provides good market information. • Three year compliance period, extendible to four in the event of a stage‐two trigger event. • Unlimited banking. • Price thresholds allow more offsets to enter scheme.
Market oversight and rules • Quarterly via EPA. • MOU requires review 2012. • >95% of allowances at latest auction to compliance entities, however participation is open.
Must show financial security. Complementary and supplementary measures linked to trading scheme
• The memorandum of understanding requires at least 25% of revenue to be used for consumer programmes. To date, over 90% has been used to support consumer schemes, energy efficiency and renewable energy.
References for further information
• Snyder (2010); RGGI (2010).
Alberta, Canada General scheme design
• Mandatory state trading scheme for large emitters, operating as a baseline and credit scheme. • Started 2007.
Coverage • Covers facilities emitting more than 100 000 tCO2eq per year, such as oil sands mines and coal‐
fired power stations. Covers about 100 emitters, 70% of Alberta’s industrial greenhouse gases. Industrial process emissions are not included.
Cap/target • Established facilities (those operating pre‐2000) must reduce their emissions intensity by 12%
from 2003 levels for the period July 1, 2007 to December 31, 2007. In each subsequent year, further reductions of 2% will be required. Baselines are set based on actual historical emissions of each regulated entity.
• New facilities must reduce their emissions intensity at 2% per year, starting in their fourth year of operation (first three years used to establish emissions baseline).
Emissions reductions, allowance prices and economic impacts
• In 2008, 6.5MtCO2eq of abatement was achieved (3.8MtCO2eq of reductions and 2.75MtCO2eq of offsets). CAD 83.3 million was paid into the technology fund in lieu of abatement.
Details of allowance/revenue allocation• Companies must cover any emissions above their target by
o making operating improvements (increasing efficiency) o buying Alberta‐based offsets o buying Emission Performance Credits from other companies that have reduced
emissions beyond target levels o paying CAD 15/tCO2eq into the Alberta technology fund to invest in greenhouse gas
reducing technologies • Entities that reduce emissions beyond their target receive Emission Performance Credits, which
can be banked or sold.
Reviewing Existing and Proposed Emissions Trading Systems © OECD/IEA 2010
Page | 94
Offsets • Unlimited use allowed of Alberta‐based offsets. Credits must result from activity taken since
2002. • Top‐down protocols specified for project types in waste, agriculture, energy efficiency and
renewable energy. Import and export of units, linking provisions
• Elements affecting linking: output‐based targets, domestic offsets. Market oversight and rules
• Baselines, annual compliance reports and offset credits being registered on the Alberta Emissions Offset Registry are verified by third‐parties.
References for further information
• Government of Alberta (2010).
New Zealand Emissions Trading Scheme (2009) [also key details of previous 2008 design, in italics]
General scheme design• Nationwide, economy‐wide cap and trade scheme. • Allowances allocated through ongoing free allocation.
Coverage • Gases: Carbon dioxide (CO2), methane (CH4), nitrous oxide (N2O), hydrofluorcarbons (HFCs),
perfluorocarbons (PFCs), sulphur hexafluoride (SF6). • Sectors – Comprehensive economy‐wide scheme. Mix of upstream and downstream liable
entities: o From 2008: Forestry o From 2010: stationary energy and industrial processes, liquid fossil fuels o From 2013: waste (landfills), synthetic gases o From 2015: agriculture
• Entities: Entities involved in certain listed activities (for example production of glass, smelting aluminium, producing clinker), undertaking deforestation, or supplying/using fuels must participate. Some industries have thresholds for participation (for example liquid fuel supply > 50 000 litres per year, deforestation > two hectares per year). Owners of forests planted since 1990 may opt in to the scheme, accepting credits for forest growth and liabilities for harvest.
Cap/target • There is no explicit cap or domestic target for emissions reductions. The scheme is fully linked
to the international Kyoto Protocol market: New Zealand companies can emit as much as they wish as long as allowances are purchased to cover these emissions. The government will issue allowances for free to the agriculture sector and energy‐intensive industries and will issue allowances to post‐1990 forest owners who have opted in corresponding to forest growth. Participants without sufficient free allocation can purchase allowances from foresters or from the international Kyoto market to meet their obligations.
Emissions reductions, allowance prices and economic impacts
• General equilibrium modelling indicates emissions reductions of 5% below BAU with an emissions price of NZD 25/tCO2eq and 15% to 20% with a price of NZD 100/tCO2eq.
• Allowance prices are modelled ranging from NZD 25/tCO2eq to NZD 100/tCO2eq. The global carbon price will determine New Zealand prices, due to full linking of the market.
• National per capita welfare (real gross national disposable income per capita) is modelled to grow 46% by 2025 under BAU, 44% with at an international carbon price of NZD 25/tCO2eq, or 40% at an international carbon price of NZD 100/tCO2eq.

© OECD/IEA 2010 Reviewing Existing and Proposed Emissions Trading Systems
Page | 95
Details of allowance/revenue allocation• FREE ALLOCATION: Free allocation to agriculture, energy‐intensive industry linked to levels of
production. Transitional free allocation to owners of pre‐1990 forests (21MtCO2eq in 2008‐12, a further 34MtCO2eq 2013‐20) to compensate for deforestation costs. Transitional free allocation to fishing sector for 2.5 years corresponding to 90% of fuel costs.
• Previous 2008 design: Free allocation to agriculture, energy‐intensive industry at 90% of 2005 levels, phasing out to zero between 2020 and 2030. No allocation for new entrants or expansion of production. Transitional free allocation to owners of pre‐1990 forests (21 MtCO2eq 2008‐12, further 34MtCO2eq 2013‐20) to compensate for deforestation costs. Transitional free allocation to fishing sector for 3 years corresponding to 50% of fuel costs. Transition to full auctioning as free allocation phases out.
Offsets • Unlimited use of Kyoto Protocol offsets.
Import and export of units, linking provisions• Unlimited use of CERs, RMUs, ERUs. Use of approved AAUs allowed. New Zealand allowances
may be converted to AAUs for export to the international Kyoto market. • Elements affecting linking: lack of specified cap, inclusion of sectors (agriculture, forestry) other
schemes may not wish to include. Measures to support delivery of long‐term targets
• Review by independent panel at least every five years. • No borrowing. • Previous 2008 design: Pathway for phase‐out of free allocation set to 2030.
Measures to provide flexibility and to manage price volatility and uncertainty• Transitional period 2010 to 2012: Energy and industry participants must submit one allowance
for every two tonnes of emissions. During the transition there is also a NZD 25/tCO2eq fixed price option. Export of allowances is banned during transition phase (except forestry). There is no restriction on banking during transition phase.
• Unlimited banking. • Unlimited use of offsets. • Linking to international market overrides local price fluctuations. • Previous 2008 design: No transition period. Unlimited banking and use of offsets, full
international linking. Measures to promote certainty for low‐carbon investment
• Any significant changes to the scheme will require a five‐year notice period. Measures to address competitiveness of “at‐risk” industries
• Free allocation on a production‐linked basis to emissions‐intensive industries and agriculture: o 60% of historical industry‐average emissions per unit of production for moderately
emissions‐intensive industries (> 800 tCO2eq per NZD one million revenue) o 90% of historical industry‐average emissions per unit of production for highly
emissions‐intensive (>1600 tCO2eq per NZD one million revenue). • Allocations will be made in advance based on the previous year’s output, with a reconciliation
mechanism (i.e. a true‐up payment) to be used once actual output is known. The level of assistance per unit of production will phase out at a rate of 1.3% per year beginning in 2013. Changes to the phase‐out rate will be considered as part of five‐yearly reviews.
• Previous 2008 design: Fixed free allocation to agriculture and energy‐intensive industry, 90% of 2005 emissions levels. Equal annual allocation until 2019, then phasing out to zero between 2020 and 2030. To be distributed in line with an allocation plan for each sector, which will determine thresholds for inclusion (trade exposure, emissions intensity, etc.) and rules for distribution of allowances. The trade test will consider the emissions costs of competitors and pass‐through ability. No allocation for new entrants or expanded production.
Reviewing Existing and Proposed Emissions Trading Systems © OECD/IEA 2010
Page | 96
Market oversight and rules • One year compliance periods. • Annual self‐reporting, backed by audits. Voluntary quarterly reporting for forestry. • NZD 30/tCO2eq to NZD 60/tCO2eq penalty (plus surrender of units) for failure to surrender units• Review by independent panel at least every five years. • No special restrictions on trading. Derivatives trading subject to same regulation as
commodities market. Complementary and supplementary measures linked to trading scheme
• Previous 2008 design: NZD one billion home insulation fund, from increased dividends to government from state‐owned electricity generators, one‐off electricity rebate to all households to compensate for increased costs, one‐off cash payment to persons in receipt of certain benefits, Innovation technology fund of 150 000 tCO2eq a year, 10‐year moratorium on new base load fossil‐fuelled thermal electricity generation.
References for further information
• New Zealand Ministry for the Environment (2010); NZIER/Infometrics (2009); PricewaterhouseCoopers (2008).
Tokyo, Japan General scheme design
• Mandatory ETS for factories and commercial buildings in Tokyo, absolute cap. • Started 1 April 2010.
Coverage • Initially covers energy‐related CO2 (from electricity and direct use of fuels). • Threshold for inclusion >1 500 kilolitres (kl) per year of crude oil equivalent energy use.
Estimated 1 400 facilities covered (1 100 commercial buildings and 300 factories). • Covers approximately 40% of industrial/commercial emissions, 1% of sites. This is
approximately 20% of Tokyo’s total CO2 emissions. • Tenants have obligations to measure CO2 and implement measures. Large tenants (6M kWh or
5 000 m2 floor area) are required to submit their own emissions reduction plan. Cap/target
• For first period (2010‐15): ‐6% on base levels for factories and buildings receiving energy from district heat and cooling, ‐8% for other buildings.
• For second period (2015‐20) reductions around ‐17% envisaged. • Facilities that have made outstanding progress can have compliance factor reduced to one half
or three quarters. Details of allowance/revenue allocation
• All allowances are distributed by grandfathered allocation, based on average emissions over three years x compliance factor.
• Baseline set on any three consecutive years between 2002 and 2007 to reward early action. • There is a pool of allowances for new entrants. Allocation is based on actual emissions, subject
to certain required energy‐saving measures. • A fixed emissions factor is used for electricity to avoid changes in the supply mix (for example
nuclear plant coming in and out of service) being reflected in participants’ emissions returns. Offsets
• Participants may use unlimited offset credits from a scheme to reduce emissions within small and medium enterprises within Tokyo.
• Unlimited use of renewable energy certificates for compliance • Offsets may also be generated from installations outside Tokyo – they are treated as if covered by
the scheme and reductions beyond their “target” can count as offsets. Use limited to one third of base year emissions.
© OECD/IEA 2010 Reviewing Existing and Proposed Emissions Trading Systems
Page | 97
Import and export of units, linking provisions• Kyoto units may be allowed as offsets in the event of high allowance prices. • Elements affecting linking: cap/floor prices, domestic offsets.
Measures to support delivery of long‐term targets
• No borrowing. • Five year compliance period, to encourage participants to implement energy efficiency
programmes rather than purchase offsets. Measures to provide flexibility and to manage price volatility and uncertainty
• Five year compliance period. • Unlimited banking. • In the event of high allowance prices, the intention is to increase the supply of Tokyo offsets
(for example by expanding the SME programme), increase use of credits from outside Tokyo and allow Kyoto Protocol units (as long as Tokyo SME credits are also used).
Measures to promote investment in low‐carbon technologies• Targets to 2020 signalled. • Five year compliance period, to encourage participants to implement energy efficiency
programmes rather than purchase offsets. Market oversight and rules
• Annual reporting, independent verification of reports required. Compliance assessment after five years at end of compliance period.
• Penalty for not submitting allowances: 1.3 times shortage, monetary fine JPY 500 000, publication of violation.
• Only units in excess of annual reductions may be traded before end of compliance period. Complementary and supplementary measures linked to trading scheme
• The scheme is part of Tokyo’s overall target for reduction of 25% by 2020 on 2000 levels of emissions. Separate targets have been set for residential (‐19%) and transport (‐42%) on 2000 levels by 2020 to give total ‐25% reduction.
• Free energy audits and low‐interest financing are available for SMEs. Energy efficiency investments 50% tax deductible.
• In the residential sector, incentives for heat pump water heaters and solar power, appliance labelling.
References for further information
• Tokyo Metropolitan Government (2010).
United Kingdom, CRC Energy Efficiency Scheme General scheme design
• Mandatory scheme for CO2 emissions from energy use in large businesses and public sector organisations.
• Started 1 April 2010. Coverage
• CO2 emissions from direct energy use and electricity. Emissions covered under Climate Change Agreements (CCAs) or direct emissions covered by the EU ETS are not included.
• Around 20 000 organisations have reporting requirements (if any half‐hourly electricity purchasing in 2008). Around 5 000 large businesses and public sector organisations have full participation (if > 6 000 MWh electricity consumption).
• Obligations imposed at organisation level rather than individual sites.
Reviewing Existing and Proposed Emissions Trading Systems © OECD/IEA 2010
Page | 98
Cap/target • Current design is for an initial three year introductory phase with a fixed price and no cap on
the quantity of allowances, then two five‐year trading periods with a cap on the number of allowances. Caps will be set based on actual emissions in the introductory phase with guidance from the Committee on Climate Change, with the goal of ensuring actual emissions reductions. Each participant must complete an emissions footprint ahead of each trading phase. This design is under review, with government having signalled an intention to make simplifications.
Details of allowance/revenue allocation• All allowances will be auctioned or sold by the Government. In the introductory three year
phase, there is a fixed allowance price of GBP 12 and no limit on the volume of allowances. In the following five year trading phases, the current proposal is that there will be a capped number of allowances, distributed by auction. The Committee on Climate Change has recommended scrapping the trading provisions, continuing instead with fixed‐price allowance sales.
• All revenue from allowance auctions was originally to be returned to scheme participants, based on their performance in reducing emissions. An annual “league table” was to be published ranking all participants based on five‐year rolling averages of improvements in emissions and emissions intensity. The revenue returned to each participant was to be scaled according to their league table ranking. The government has now decided to retain the CRC scheme revenue.
• There will be a single emissions factor for electricity, updated each period. Offsets
• No offsets. Import and export of units, linking provisions
• EU ETS allowances allowed under a “safety valve” mechanism. Measures to support delivery of long‐term targets
• No borrowing. Measures to provide flexibility and to manage price volatility and uncertainty
• Fixed allowance price GBP 12/tCO2 for introductory three year phase, no limit on volume. • No banking from introductory phase, otherwise unlimited banking. • Safety valve allows import of EU ETS allowances, with a minimum price of GBP 14/tCO2.
Measures to promote certainty for low‐carbon investment• Five‐year trading periods.
Market oversight and rules • Annual self‐reporting of emissions, backed by auditing. • Fine for late annual report GBP 5 000 (GBP 25 000 if 40 days late). Also liable for submission of
twice outstanding balance if fail to submit within 40 days. • GBP 50 000 fines or imprisonment for making false statements or non‐compliance with
enforcement orders. • Auctions limited to participants only, with purchase limits. No holding limit on allowances. • No specific trading platform established, but online notice board trading provided.
References for further information
• UK Department of Energy and Climate Change (2010b).
© OECD/IEA 2010 Reviewing Existing and Proposed Emissions Trading Systems
Page | 99
Australia – Carbon Pollution Reduction Scheme (CPRS) General scheme design
• Nationwide cap and trade scheme, was to start in 2011. • Approximately 70% of allowances auctioned at outset, dropping to 55% by 2020 because free
allocation to emissions‐intensive industry was expected to increase over time. Coverage
• Gases: Carbon dioxide (CO2), methane (CH4), nitrous oxide (N2O), hydrofluorcarbons (HFCs), perfluorocarbons (PFCs), sulphur hexafluoride (SF6).
• Sectors: The scheme was to cover emissions from the stationary energy, transport, fugitive, industrial processes and waste sectors, with an opt‐in for reforestation activities. Emissions from agriculture and deforestation were not included.
• Entities: threshold emissions greater than 25 000 tCO2eq per year, covering around 1 000 installations and 75% of Australian emissions.
Cap/target • 5% reduction on 2000 levels by 2020, 25% if a comprehensive global agreement was reached.
Caps after 2020 would be set at least 5yrs in advance, with a ‘gateway’ range for the cap set a further 10 years ahead. Australia has a long‐term target for emissions to be 60% below 2000 levels by 2050.
• Cap tightened to account for voluntary emissions reductions from greenpower purchases. Emissions reductions, allowance prices and economic impacts
• For a reduction target of ‐5% in 2020 and ‐60% in 2050 on 2000 levels: o Domestic emissions are approximately equal to 2005 levels in 2020 and 29% below
2005 levels in 2050. Remaining reductions to comply with the target pathway are through use of offsets and banking.
o Permit price AUD 35/tCO2eq (2008 dollars) in 2020 and AUD 115/tCO2eq in 2050. o Real GNP per capita rising by 9.5% to 2020 (compared to 10.9% in the reference
scenario) and by 58% to 2050 (compared to 66% in the reference scenario). • For a reduction target of ‐25% in 2020 and ‐90% in 2050 on 2000 levels (and assuming
concerted global action) o Domestic emissions are approximately 14% below 2005 levels in 2020 and 71% below
2005 levels in 2050. Remaining reductions to comply with the target pathway are through use of offsets and banking.
o Permit price AUD 60/tCO2eq (2008 dollars) in 2020 and AUD 197/tCO2eq in 2050. o Real GNP per capita rising by 8.5% to 2020 (compared to 10.9% in the reference
scenario) and by 55% to 2050 (compared to 66% in the reference scenario). Details of allowance/revenue allocation
• FREE ALLOCATION: There was to be ongoing free allocation of permits to energy intensive industries, detailed below. Transitional free allocation was also provided to emissions‐intensive coal mines (for five years) and coal‐fired electricity generation (for ten years).
• AUCTIONING: Auctions were to be held 12 times throughout the financial year. Entities receiving free permits would have been able to sell these at auctions (double‐sided auction design). Auction revenues would have funded AUD 5 billion per year in household assistance (through tax threshold changes, family tax credits and benefit and pension adjustments), a climate change action fund (energy efficiency projects, worker and community adjustment), biodiversity funding, industry support, coal sector projects and the purchase of REDD credits for meeting Australia’s Kyoto commitments.
Offsets • Unlimited use of international offsets from Kyoto Protocol (CDM, JI).

Reviewing Existing and Proposed Emissions Trading Systems © OECD/IEA 2010
Page | 100
Import and export of units, linking provisions• Linking permitted with comparable schemes (comparable targets, design rules and
measurement reporting and verification). Five years notice to be given before linking. • Certified emissions reductions (CERs) generated under the Kyoto CDM would be accepted for compliance,
with the exception of temporary CERs and long‐term CERs. Kyoto protocol units from forestry (RMUs) and the JI (ERUs) accepted after 2012. Kyoto Protocol assigned amount units (AAUs) were not accepted.
• No export of units was allowed for the first five years of the scheme. • Elements affecting linking: price caps, domestic offsets.
Measures to support delivery of long‐term targets
• Five‐yearly review by independent panel. Measures to provide flexibility and to manage price volatility and uncertainty
• One year fixed price phase‐in period at AUD 10/tCO2eq. Transport fuel price rises would be offset with a reduction in fuel excise tax for the first two years.
• Unlimited banking to smooth surplus/deficit years, reducing price volatility. • Borrowing of 5% of year‐ahead allowance permitted. • Unlimited access to international Kyoto Protocol offsets. • Price cap for five years AUD 40 rising at 5% above inflation. Companies would have unlimited
access to additional permits at the fixed price for meeting compliance obligations. These permits would not be able to be traded or banked for future use and there was to be a ban on export of units from the CPRS to other schemes for five years.
Measures to promote certainty for low‐carbon investment• Caps set at least five years in advance, with a “gateway” range for the cap set a further 10 years ahead.
Measures to address competitiveness of “at‐risk” industries
• Firms qualify if emissions‐intensive and have a trade share (defined as the ratio of the value of imports and exports to the value of domestic production) of greater than 10% in any year between 2004‐05 and 2007‐08, or a demonstrated lack of capacity to pass through costs due to the potential for international competition.
o Free allocation 94.5% for activities with emissions intensity of at least 2 000 tCO2eq per AUD one million revenue or 6 000 tCO2eq per AUD 1 million value‐added
o Free allocation 66% for activities with emissions intensity between 1 000 tCO2eq and 1 999 tCO2eq/$m revenue or between 3 000 tCO2eq and 5 999 tCO2eq per AUD one million value‐added
• Allocation output‐based, benchmarked to historical industry‐average emissions. Initial rates of assistance were to be reduced by 1.3% per year. Permits would be allocated at the start of each year based on previous year’s level of production. At the end of each year, the entity must relinquish permits for production that did not occur. Permits were to be allocated to compensate for indirect costs (electricity price rises) as well as direct emissions.
• The 1.3% per year phase‐out of support was subject to review. If less than 70% of competitors faced similar constraints, this would be taken as evidence that the 1.3% phase‐out should cease.
Market oversight and rules • Annual reporting and surrender of allowances. • One year compliance periods. • Market oversight by Australian Securities and Investments Commission (ASIC). The permit
market would be subject to the same safeguards as the Commonwealth bond market. • No trading restrictions.
Complementary and supplementary measures linked to trading scheme• Renewable Energy Target. • Funding for carbon capture and storage demonstration. • Energy efficiency.
References for further information
• Australian Department of Climate Change and Energy Efficiency (2008); Australian Treasury (2008); Australian Government (2009a, 2009b).
© OECD/IEA 2010 Reviewing Existing and Proposed Emissions Trading Systems
Page | 101
H.R.2454 American Clean Energy and Security Act of 2009 (Waxman‐Markey) General scheme design
• Nationwide United States Cap and Trade Scheme, under Clean Air Act, administered by the Environmental Protection Agency (EPA). Separate parallel cap and trade programme for HFCs established.
• Allowances would have been allocated through mix of auctioning and free allocation. Initially 15% auctioning and 85% free allocation, increasing to 65% auctioning by 2030.
Coverage • Gases: Carbon dioxide (CO2), methane (CH4), nitrous oxide (N2O), hydrofluorcarbons (HFCs),
perfluorocarbons (PFCs), sulphur hexafluoride (SF6), nitrogen trifluoride (NF3). EPA given authority to add other gases.
• Sectors ‐ Mix of upstream and downstream liable entities: o From 2012: electricity generators, liquid fuel importers and producers o From 2014: stationary industrial sources o From 2016: local gas distribution companies o Agriculture, forestry excluded from cap (can be used as offsets)
• Entities: Threshold emissions >25 000 tCO2eq per year. CBO estimates 7 400 entities covered. Cap/target
• Cap on emissions specified as a reduction compared to 2005 emissions levels: 3% by 2012, 17% by 2020, 42% by 2030 and 83% by 2050.
Emissions reductions, allowance prices and economic impacts
• The EPA’s main scenario (ADAGE model) shows: o Domestic emissions covered by the cap 9% below 2010 levels in 2020 and 38% below
2010 levels in 2050. In this modelling, compliance with the target pathway would be achieved by significant use of offsets and banking. Electricity sector CO2 emissions are reduced by 22% in 2020 and 84% in 2050.
o Allowances prices USD 20/tCO2eq in 2020 rising to USD 87/tCO2eq in 2050 o GDP and domestic consumption virtually unchanged compared to the reference
scenario (to 2050, a 163% increase in GDP compared to 167% in the reference scenario)
Details of allowance/revenue allocation• FREE ALLOCATION: In 2016 after full phase‐in, 83% of units would have been allocated free,
mostly to non‐participants to offset price increases or to fund low‐carbon activities. 56% of this value would go to reduce price rises for consumers (via allocations to electricity and gas distribution companies) , 13.4% to energy‐intensive trade‐exposed industries, 7% to state renewable & energy efficiency programmes, 6% to low‐carbon technology development. 5% of permits support reduced deforestation (REDD) projects. 1% of 2012 allowances would have been set aside as credit for early action for those who reduced emissions in 2001‐2008.
• AUCTIONING: Quarterly auctions, in single round sealed‐bid uniform price format. Auctions open to everyone. A purchase limit of 5% would have applied. Some units would be made available for purchase by small business at the auction clearing price. Auction revenue (15% of scheme value) directed to support low income consumers. As free allocations phase out, the additional auction revenue would have been returned as a consumer rebate.

Reviewing Existing and Proposed Emissions Trading Systems © OECD/IEA 2010
Page | 102
Offsets • In 2012, approximately 30% of an entity’s obligation could have been satisfied with offsets (half of which can be
from international offsets) increasing to 67% by 2050. Maximum offset use totals two billion tons per year. • The EPA could have increased the allowed use of international offsets (up to 1.5 billion), if there
were under‐supply of domestic offsets. • Domestic offset credits would be assigned ex‐post for verified reductions. There would be three
year recognition of offsets from existing state or tribal schemes. Agriculture, land use and forestry were included, but with five‐year “term” offset credits for temporary abatement. Details of the domestic offset programme were to be developed by EPA by regulation, including specifying a list of eligible project types.
• International offsets could be from projects (i.e. CDM credits), REDD (with bilateral or multilateral agreement with host govt), sectoral agreements, or international bodies (for example CDM credits via UNFCCC). From 2018 international offsets were to be discounted (1.25: 1).
• An independent offsets board would advise on criteria for offsets and measurement, verification and reporting requirements for both domestic and international offsets.
Import and export of units, linking provisions• EPA would set rules around qualifying international allowances. Qualifying allowances would
need to be from a scheme at least as stringent as that established under this legislation. • Elements affecting linking: cap/floor prices, domestic offsets.
Measures to support delivery of long‐term targets
• EPA and National Academy of Sciences to report on scheme’s progress every four years. If emissions reductions are not on track, the president would be required to submit plan to address this.
Measures to provide flexibility and to manage price volatility and uncertainty• Quarterly reporting cycle provides good information to market, minimising unforeseen events. • Unlimited banking to smooth surplus/deficit years, reducing price volatility. • Borrowing without interest was to be allowed from next year, effectively creating a two‐year
rolling compliance period. Borrowing (with interest) from up to five years in advance, for up to 15% of obligation.
• Strategic reserve of 2.7 GtCO2eq to mitigate market price spikes, created by small set‐aside of each year’s allowances. These would be offered at quarterly auctions (only for covered entities) with a reserve price. Reserve was to be USD 28/tCO2eq in 2012, rising 5% per year in 2013‐14, then set at 60% above three year rolling average price. Proceeds used to purchase REDD units to replenish reserve.
Measures to promote certainty for low‐carbon investment• Specifying a long‐term target pathway to 2050 would provide certainty for investors. • Floor price for allowances delivered by quarterly auction, starting at USD 10/tCO2eq then rising
at 5% per year above inflation, setting a minimum carbon price. Measures to address competitiveness of “at‐risk” industries
• EITE entities were to receive up to 15% of allowances, phasing out to zero by 2035. • Criteria for inclusion as EITE (based on 2004‐06 data):
o emissions cost greater than 5% of value of shipments and trade intensity greater than 15%, or o emissions cost greater than 20% of value of shipments.
• Rebate was to be 100% of industry average emissions per unit of output of previous four years times company annual average output over preceding two years AND industry average kWh per unit output over previous two years times company emissions per kWh, times efficiency factor.
• Pro‐rata reduction of free allowances if demand exceeds supply – total pool capped. • President may slow phase‐out of free allocation for an industry if 15% of imports come from
countries with inadequate policies. Phase‐out cannot be begun early or accelerated based on international action.
• Border measures would be introduced in 2020 unless 85% of imports are from sectors covered by international agreements, or have emissions lower than United States intensities, or have sectoral agreement. The border measures would require importers to participate in the scheme, purchasing allowances.

© OECD/IEA 2010 Reviewing Existing and Proposed Emissions Trading Systems
Page | 103
Market oversight and rules • Quarterly reporting, annual submission of allowances. • Penalty for non‐surrender of units: 2x price of units, plus surrender of units. • Central registry maintained by EPA. • Federal Energy Regulatory Commission (FERC) oversees cash market. Commodity Futures
Trading Commission (CFTC) regulates derivatives market. United States Department of Agriculture oversees domestic offsets in agriculture and forestry.
• Over the counter trades banned, pending comprehensive regulatory reform of financial derivatives.
• No restrictions on trading by non‐covered entities. • Parties would be allowed to auction their units via EPA rather than trade on secondary market.
Complementary and supplementary measures linked to trading scheme• 20% by 2020 combined renewable and energy efficiency portfolio standard, to be overseen by
FERC (15% renewables). • Would have removed EPA’s ability to regulate greenhouse gas emissions from point sources
covered by the trading scheme. • EPA would have been required to set new source performance standards for sources not
covered by the trading scheme (landfills, coalmines etc) emitting over 10,000 tCO2eq per year. • Would require EPA to promulgate non‐road and heavy vehicle emissions standards. EPA to set
transport emissions goals. • Would have prohibited state emissions trading programmes until 2017. • EPA programme to reduce black soot. • Green Jobs programme. • USD one billion fund for carbon capture and storage in power generation, raised by levies on
fossil fuel generation. • Would enable transport secretary to require flex‐fuel vehicles. • Would have Provided FERC transmission siting authority, support for FERC/DOE/EPA smart
grids work. • Enhanced building codes, building retrofit programme, energy efficiency programmes.
References for further information
• Holt and Whitney (2009); EPA (2009, 2010a, 2010b, 2010c); EIA (2009); CBO (2009); Pew Center on Global Climate Change (2010).
Western Climate Initiative General scheme design
• Mandatory regional cap and trade programme within participating US states and Canadian provinces. Enacted as separate schemes under state or provincial law in each partner jurisdiction, with mutual recognition of allowances.
• California, New Mexico, British Colombia, Ontario and Quebec are intending to begin trading from 2012. Other US states (Washington, Oregon, Montana, Utah and Arizona) and Manitoba may join at a later date.
• Method and quantity of allowance allocation will be determined by each partner jurisdiction. Coverage
• Gases: Carbon dioxide (CO2), methane (CH4), nitrous oxide (N2O), hydrofluorcarbons (HFCs), perfluorocarbons (PFCs), sulphur hexafluoride (SF6), nitrogen trifluoride (NF3).
• Sectors: from 2012 electricity (including electricity imported into the WCI area) and industry. From 2015 transport fuels, residential commercial and industrial fuels. Individual partner states or provinces can choose to include all sectors in the trading scheme, or cover some sectors with alternative policies.
• Entities: emissions threshold greater than 25 000 tCO2eq per year.
Reviewing Existing and Proposed Emissions Trading Systems © OECD/IEA 2010
Page | 104
Cap/target • System‐wide cap is the sum of individual targets of partner jurisdictions. The initial cap will be
set at a best estimate of expected actual emissions. The target then declines in a straight line to 15% below 2005 levels by 2020.
Emissions reductions, allowance prices and economic impacts
• Emissions within the WCI region in 2020 are modelled to be 10% below 2005 levels, with banked units and use of offsets delivering the remainder of the ‐15% target.
• 2020 emissions reduction goals can be met with a modest overall costs saving of USD 100 billion in the region (0.2% overall saving), at a 2020 emissions price of USD 33/tCO2eq. This analysis assumes gains from complementary policies in energy efficiency, clean car standards and transport fuels.
Details of allowance/revenue allocation• Within the cap, decisions on the method (free allocation or auctioning) and distribution (for
example to industry, consumers, or to support energy efficiency and low‐carbon technologies) of allowances will made by individual states or provinces.
• Partners will consider harmonising allocations if differences in allocation lead to competitiveness impacts for companies.
• Some additional allowances outside the cap will be available for early action. Offsets
• Use of offsets and imported units from linked schemes will be limited to 49% of emissions reductions for the period 2012‐2020.
• A joint paper on offset design was developed with the Regional Greenhouse Gas Initiative (RGGI) and Midwest Greenhouse Gas Reduction Accord (MGGRA), as a measure to underpin the future linking of these schemes.
Import and export of units, linking provisions• Future linking with the RGGI and MGGRA is anticipated, although these schemes would have to
have similar stringency to the WCI. • Elements affecting linking: cap/floor prices, domestic offsets.
Measures to support delivery of long‐term targets
• No borrowing. Measures to provide flexibility and to manage price volatility and uncertainty
• Three‐year compliance periods. • Unlimited banking to smooth surplus/deficit years, reducing price volatility. • Other measures to mitigate high prices are still under consideration: a reserve set‐aside, or
allowing use of future years’ allowances above certain price triggers. Measures to promote certainty for low‐carbon investment
• Price floor for auctioned allowances (yet to be specified), to support low‐carbon investment and help correct inadvertent oversupply of allowances. Discussions are ongoing about what to do with unsold units (cancel, carry forward, fill reserve, etc.).
Measures to address competitiveness of “at‐risk” industries
• Allocation decisions will be made by individual partner states and provinces. Focus of discussions to date has been on using benchmarking as a basis for allocation.
• Electricity imported into the WCI region is included in the trading scheme to avoid competitiveness issues.
Market oversight and rules • Annual reporting and submission of allowances. • Partner states and provinces will supervise the primary market. In the United States, the
Commodity Futures Trading Commission will supervise the derivatives market. In Canada provincial regulatory authorities will provide derivatives oversight.
• Holding limits on allowances are being considered.
© OECD/IEA 2010 Reviewing Existing and Proposed Emissions Trading Systems
Page | 105
Complementary and supplementary measures linked to trading scheme• Decisions on complementary policies will be taken by each partner state and province.
Assumed implementation of complementary policies in energy efficiency and vehicle fuel standards significantly lowers the modelled cost of the scheme’s implementation.
References for further information
• WCI (2010a, 2010b).
California draft design General scheme design
• State‐wide mandatory cap and trade scheme, covering 85% of California’s emissions once fully phased in. The trading scheme is administered by the California Air Resources Board (ARB), under California’s AB32 law which requires the state’s greenhouse gas emissions to be reduced to 1990 levels by 2020.
• Trading to commence 2012. The intention is to link the scheme with other WCI partner jurisdictions.
• Allowances to be allocated through mix of auctioning and free allocation. Coverage
• Gases: Carbon dioxide (CO2), methane (CH4), nitrous oxide (N2O), hydrofluorcarbons (HFCs), perfluorocarbons (PFCs), sulphur hexafluoride (SF6), nitrogen trifluoride (NF3).
• Sectors ‐ Mix of upstream and downstream liable entities: o From 2012: electricity generation (including electricity imported into California), large
industrial sources >25 000 tCO2eq per year (covers approximately 37% of state‐wide emissions)
o From 2015: natural gas and liquid fuels, transport fuels (scheme covers approximately 85% of state‐wide emissions)
• 360 businesses, 600 facilities. • Reporting requirements for entities >10 000 tCO2eq/year.
Cap/target • Cap set at expected 2012 emissions, then declines to target level in 2020 (with increase in cap
to cover increased scope in 2015). Cap levels: 2012 = 165.8 MtCO2eq, 2015 = 394.5 MtCO2eq, 2020 = 334 MtCO2eq. Total 2.7 billion allowances issued 2012‐20.
• 2020 cap is about 15% below 2012 levels. Emissions reductions, allowance prices and economic impacts
• Allowance prices of USD 15/tCO2eq to USD 30/tCO2eq expected in 2020. • Gross state product expected to grow at 2.3% per year compared to 2.4% without scheme. • Emissions reductions: Baseline emissions in the capped sectors are expected to be 409
MtCO2eq in 2020. Reductions needed to meet the cap of 334 MtCO2eq will come in part through complementary measures. After reductions from those measures, the cap‐and‐trade regulation is estimated to reduce at least 18 MtCO2eq.
Details of allowance/revenue allocation• FREE ALLOCATION: Initially high free allocation, phasing out over time. Allocation is made to
electricity distribution companies (based on a mix of historic emissions and sales) rather than generators, with the requirement that distribution companies pass on the value of the allowances for consumers. Allocation to industry is based on output and sector‐specific benchmarks. The details of free allocation are yet to be finalised.
• AUCTIONING: Allowances remaining after distributions to industry and the electricity sector will be auctioned quarterly, in a sealed‐bid single round auction. Auction floor price of USD 10/tCO2eq, rising at 5% above inflation. Staff recommend using auction revenue to fund consumer rebates, for a community benefit fund, and a low‐carbon investment fund.
Reviewing Existing and Proposed Emissions Trading Systems © OECD/IEA 2010
Page | 106
Offsets • 8% of an entity’s compliance obligation may be met with offsets (maximum 232 MtCO2eq total
to 2020). • Four domestic offset protocols have been included covering forestry, livestock manure
management, urban forests, and ozone depleting substances. • Approved offset credits from other schemes are allowed (ARB to approve). These could include
sector‐based crediting including REDD. • Offset verifiers accredited by ARB.
Import and export of units, linking provisions• Linking to other WCI schemes would require case‐by‐case analysis and decisions by the Board. • Linking candidates must have a similarly stringent cap, and adequate monitoring, reporting,
verification and enforcement provisions. Other provisions will also need to be harmonised before linking: offset provisions, auction floor prices, cost‐containment reserves, banking and borrowing.
Measures to support delivery of long‐term targets
• No borrowing. • Programme review at least with each three‐year compliance period.
Measures to provide flexibility and to manage price volatility and uncertainty• Quarterly reporting. • Unlimited banking to smooth surplus/deficit years, reducing price volatility. • Three‐year compliance periods (although allowances covering 30% of verified emissions must
be submitted annually to reduce the risk of non‐compliance). • Allowance price containment reserve of 123.5 MtCO2eq (approximately 5% of total
allowances), offered at fixed price at quarterly sales. Reserve will not be replenished if allowances are purchased, however allowances that are unsold at auction will be added to the reserve rather than being rolled forward to future auctions. Reserve allowances will be offered in three tiers: USD 40/tCO2eq, USD 45/tCO2eq, and USD 50/tCO2eq in 2012. These prices will escalate by 5% plus inflation each year, reaching USD 60/tCO2eq, USD 67/tCO2eq, and USD 75/tCO2eq in 2020.
Measures to promote certainty for low‐carbon investment• Floor price for allowances delivered by quarterly auction, starting at USD 10/tCO2eq then rising
at 5% per year above inflation, setting a minimum carbon price. Measures to address competitiveness of “at‐risk” industries
• Emissions‐intensive industries receive output‐based allocation, based on sector‐specific industry benchmarks, and recent years’ production levels.
• Leakage will be monitored (product prices, trade flows). Market oversight and rules
• Quarterly reporting. • Three‐year compliance periods (with a proportion of allowances surrendered annually to
reduce the risk of non‐compliance). • Third‐party verification required for emissions reports. • Auction bid guarantees required. Auction purchase limit of 10% of allowances offered in each
budget year. • Holding limit will be imposed on total allowances, to mitigate market power (limit will be in
addition to immediate compliance obligations). • No borrowing. • If surrender deadlines are missed, obligation becomes four allowances for every tonne of emissions.
Complementary and supplementary measures linked to trading scheme• Small set‐aside to cover voluntary renewable energy purchases.
References for further information
• CARB (2010a,b).


9 rue de la Fédération 75739 Paris Cedex 15
www.iea.org
Related Documents