REVIEW PRELIM PAPER 2 20 OCTOBER 2014 Lesson Description In this lesson we: Work through questions from various Paper 2 papers. Test Yourself Question 1 Angle PQR = 68 0 Select the correct options for the other angles A R = S = 112 0 B R = 68 0 = S C P = 68 0 D P = 112 0 Question 2 Angle NPQ is equal to angle….. A PSR B SPQ C RQP D QRS

Welcome message from author
This document is posted to help you gain knowledge. Please leave a comment to let me know what you think about it! Share it to your friends and learn new things together.
Transcript

REVIEW PRELIM PAPER 2 20 OCTOBER 2014
Lesson Description
In this lesson we:
Work through questions from various Paper 2 papers.
Test Yourself
Question 1
Angle PQR = 680 Select the correct options for the other angles
A R = S = 1120
B R = 680 = S
C P = 680
D P = 1120
Question 2
Angle NPQ is equal to angle…..
A PSR
B SPQ
C RQP
D QRS

Question 3
Angle PQR = 680
What reason would you give for saying that QRS = 1120?
A Exterior angle of cyclic quad
B Interior angles of cyclic quad are supplementary
C Co-interior angles between parallel lines are supplementary
D Base angles of a trapezium
Question 4
Given that O is the centre of the circle and that OB = 13 units and tat AB =10 units. The length of OC is equal to
A 12units
B 10 units
C 8 units
D 5 units

Question 5
Select all the angles which are equal to RPB?
A PBQ
B BQS
C BQR
D QRP
Question 6
The table represents the percentage of income spent on recreation by 50 people.
Percentage f
12 18p 8
18 24p 20
24 30p 12
30 36p 8
36 42p 2
Total
Calculate an estimate for the mean and the standard deviation for this data.
A 24,12x ; = 6,38
B 24,12x ; = 7,25
C 6,38x ; = 24,12
D 12,07x ; = 6,38

Question 7
A table of data, showing the price of crude oil at the beginning (January) of each year in US Dollars per barrel, is given.
Year (Jan) 2000 2001 2002 2003 2004 2005 2006 2007 2008 2009 2010 2011 2012 2013
Price per barrel (US $)
28 25 21 23 28 40 58 60 140 46 75 80 114 98
[<En.wikipedia.org/wiki/File:Brent_spot_monthly.svg>]
Find the equation of the best fit line for the price of crude oil per year (y) against the year (x)
in the form .y a bx Determine your values for a and b rounded to 2 decimal digits.
A a = 6,98and b =13946,10
B a = 6,98 and b = 13946,10
C a = 13946,10 and b = 6,98
D none of the above
Question 8
Three populations A, B and C are the same size and have the same range.
Which population has a standard deviation of zero?
Frequency histograms for the three populations are given below:
D None of these
Question 9
Study the box and whisker plot below which summarises the shoe sizes for a class of 23 boys.
Supposing the boys were asked to stand in a straight line so that the boys with the smallest shoe size were on the left and the boys with the largest shoe size were on the right.
Paul is the boy standing 6th from the left. What is his shoe size?
A 6 B 7 C 8 D 9
A B C
Question 10
A company has 132 employees working in their Gauteng branch. The distance (x), in kilometers,
they travel to work each day is summarized in the following grouped frequency table:
Determine the median interval for this data.
A 105 x
B 1510 x
C 2015 x
D 2520 x
Improve your Skills
Question 1
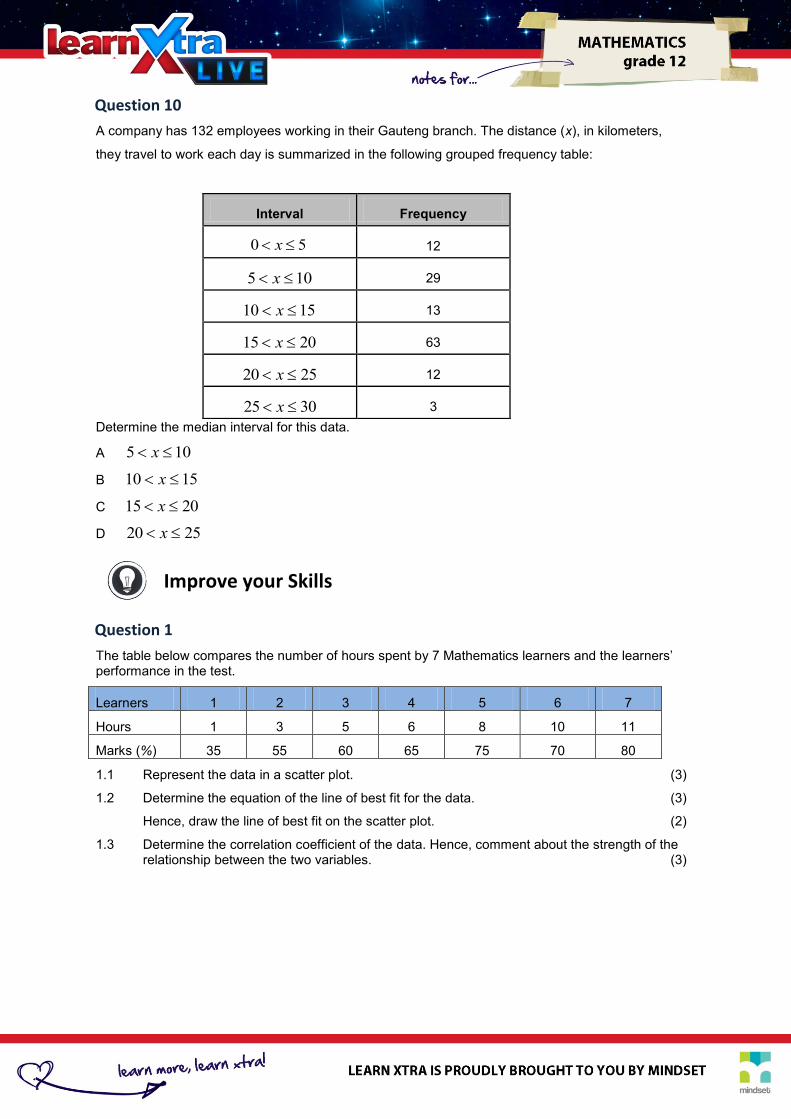
The table below compares the number of hours spent by 7 Mathematics learners and the learners’ performance in the test.
Learners 1 2 3 4 5 6 7
Hours 1 3 5 6 8 10 11
Marks (%) 35 55 60 65 75 70 80
1.1 Represent the data in a scatter plot. (3)
1.2 Determine the equation of the line of best fit for the data. (3)
Hence, draw the line of best fit on the scatter plot. (2)
1.3 Determine the correlation coefficient of the data. Hence, comment about the strength of the relationship between the two variables. (3)
Interval Frequency
0 5x 12
105 x 29
1510 x 13
2015 x 63
2520 x 12
3025 x 3

Question 2
The sketch represents the graphs of the following functions for ]0;180[ x :
xxf 2sin)( and xxg tan2
1)( .
Line segment ABC is perpendicular to the x-axis at 0),;135C( with A on f and B on g.
)2
3;120D(
is the point where f and g intersect.
2.1 Calculate the length of AB. (3)
2.2 Write down the period of f. (1)
2.3 Without calculations, use the graph to write down the values of x for which )()( xgxf in
the given interval. (5)
Question 3
PQR is a tangent to circle QABCD. AB ║ QD. CB = CD. Let
303Q and
703D .

3.1 Calculate
1Q . (2)
3.2 Prove that
110C (4)
3.3 Calculate
1B (4)
Question 4
PQRS is a rectangle. A is a point on QR such that 90ˆSAP .
Prove that:
4.1 RSAQAP (3)
4.2 ΔSAR///ΔAPQ (3)
4.3 If RS = 8 units, QA = x units and RA = y units, express y in terms of x. (3)
Question 5
Calculate the value(s) of x , ]270;90[ x if sin x = cos 2x – 1 (6)

Question 6
In the figure below, the origin O is the centre of the circle. P(x ; y) and Q(3 ; −4) are two points on the circle and POQ is a straight line. R is the point (k ; 1) and RQ is a tangent to the circle. T is an x-intercept of the circle.
Determine:
6.1 the equation of the circle. (3)
6.2 the length of TQ. (Leave your answer in simplified surd form.) (3)
6.3 the equation of OQ. (3)
6.4 the coordinates of P. (2)
6.5 the equation of the circle with centre P, that passes through (0; 0) in the form x2 + y
2 … (3)
6.6 the equation of QR. (4)
6.7 the value of k. (3)
Related Documents