1 REVIEW OF THE EDUCATION PreK‐12 FUNDING DISTRIBUTION MODEL Dan Perrins, Chair January 26, 2017

Welcome message from author
This document is posted to help you gain knowledge. Please leave a comment to let me know what you think about it! Share it to your friends and learn new things together.
Transcript
1
REVIEW OF THE EDUCATION
PreK‐12 FUNDING DISTRIBUTION MODEL
Dan Perrins, Chair
January 26, 2017
2
Review of the Education
PreK‐12 Funding Distribution Model
January 26, 2017
Honourable Don Morgan
Minister of Education
Room 361, Legislative Building
2405 Legislative Drive
Regina, SK
S4S 0B3
Dear Minister Morgan:
I am pleased to provide you with a report on the Review of the Education PreK‐12 Funding
Distribution Model.
Consistent with my mandate, I established a Technical Committee of school division and
ministry representatives to engage school divisions from across the province to assess the
funding model and how it can be improved to address any funding allocation inequities. We
have made several recommendations for improvement and for follow‐up work in the future.
I am very appreciative of the time and thoughtful consideration that school division
representatives and ministry officials provided throughout the review process. Ultimately, this
is about supporting Saskatchewan students to reach their potential through quality education,
regardless of where they live. The commitment of the entire sector to this goal and
achievement of the Education Sector Strategic Plan is commendable.
Thank you for providing me with the opportunity to hear from school divisions, learn from their
expertise and contribute to improvement.
Sincerely,
Dan Perrins, Chair
3
Acknowledgements
I would like to acknowledge the contribution of the many individuals and organizations that assisted me throughout the review process including school division Board Chairs and trustees, Directors of Education, Chief Financial Officers (CFOs), the Conseil des écoles Fransaskoises, the Saskatchewan School Boards Association (SSBA), the League of Education Administrators, Directors and Superintendents of Saskatchewan (LEADS), the Saskatchewan Association of School Business Officials (SASBO), and the Saskatchewan Teacher’s Federation (STF). In particular, I want to thank the following members of the PreK‐12 Education Funding Distribution Model Technical Committee and Working Committees for their time and expertise, and for their commitment to Saskatchewan’s children:
Technical Committee
Don Rempel, Director, North East School Division
Joel Lloyd, CFO, St. Paul’s Roman Catholic Separate School Division
Naomi Mellor, CFO, Prairie Valley School Division
Charlie McCloud, CFO, Northwest School Division
Rod Quintin, CFO, Chinook School Division
Garry Benning, CFO, Saskatoon School Division
Angela Chobanik, Executive Director, Ministry of Education
Laura Bennett, Senior Financial Policy Advisor, Ministry of Education Transportation Working Committee
Ryan Bruce (co‐chair), Saskatchewan Rivers School Division
Angela Chobanik (co‐chair), Ministry of Education
Derek Froese (co‐chair), Ministry of Education
Sharon Bender, Prairie Valley School Division
Bruce Lipinski, Regina School Division
Sheila May, Saskatoon School Division
Rod Quintin, Chinook School Division
Shelley Toth, South East Cornerstone School Division
Curt Van Parys, Regina Roman Catholic Separate School Division Base Instruction Working Committee
Diana Welter, Prairie South School Division
Lola Correia, Prairie Valley School Division Mike Walter, Regina Public School Division
Al Boutin, St. Paul’s Roman Catholic Separate School Division
Angela Chobanik, Ministry of Education
Laura Bennett, Ministry of Education
Special thank you to Shelley Whitehead for her invaluable support to the technical team and in the preparation of this report. In addition, I would also like to thank Donna Johnson, Assistant Deputy Minister, Josh Kramer and Janie Markewich, Directors of Education Financial Policy, for their hard work and assistance through this process.
4
TABLE OF CONTENTS
Executive Summary ............................................................................................... 5
Mandate ................................................................................................................ 7
Approach to the Review ........................................................................................ 7
Background to the Model ..................................................................................... 9
Why Strive for Equity? .........................................................................................10
How The Funding Distribution Model Works.......................................................13
Issues, Options and Recommendations ...............................................................17 Transportation................................................................................................................................... 18
Locally Determined Terms and Conditions (LDTC) .............................................................................. 28
Instruction ......................................................................................................................................... 30
Base Instruction ............................................................................................................................. 30
Enrolment Counts for Graduated Students ..................................................................................... 41
First Nations and Métis Education Achievement Fund .................................................................... 42
Instructional Resources .................................................................................................................. 43
Plant Operations and Maintenance.................................................................................................... 47
Supports For Learning (SFL) ............................................................................................................... 50
Students Requiring Intensive Supports ........................................................................................... 51
Vulnerability .................................................................................................................................. 51
Geographic Distance ...................................................................................................................... 52
Revenue ............................................................................................................................................ 61
First Nations .................................................................................................................................. 61
International Students ................................................................................................................... 64
Education Regulations ....................................................................................................................... 65
Governance and Accountability ......................................................................................................... 66
Sustaining the Model ......................................................................................................................... 67
Concurrent Analysis .............................................................................................68
Conclusion ............................................................................................................72
Biography .............................................................................................................73
Appendices ...........................................................................................................74
5
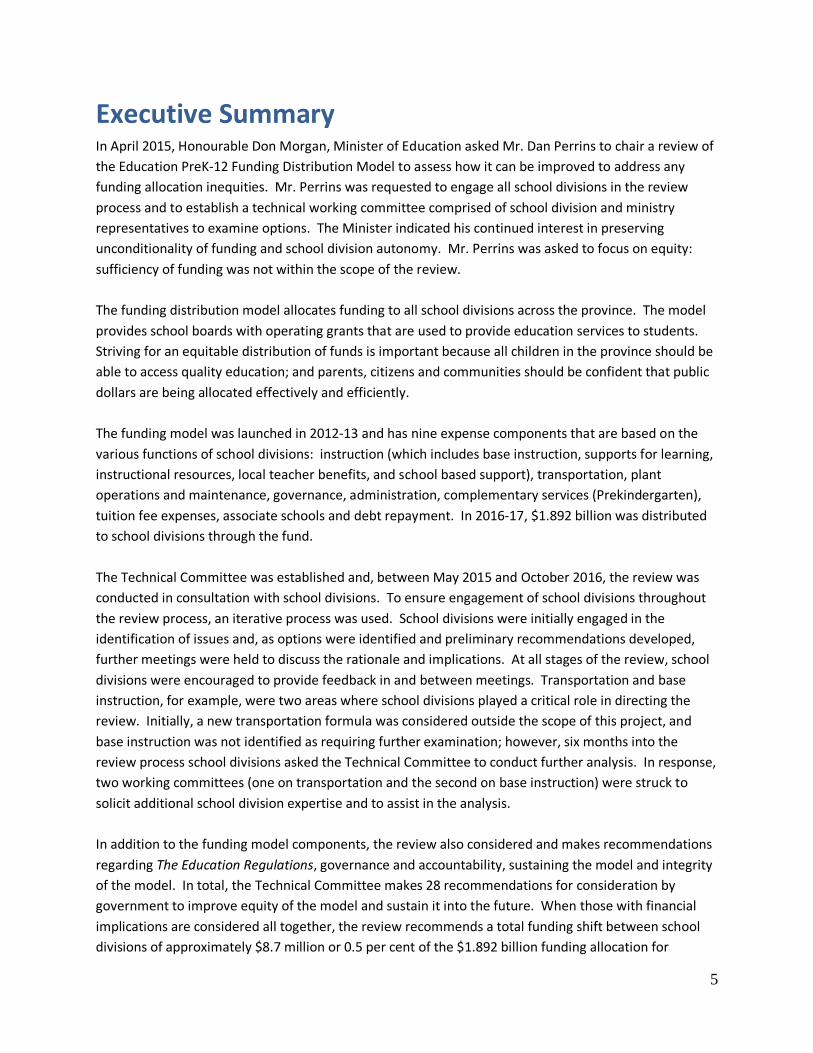
Executive Summary In April 2015, Honourable Don Morgan, Minister of Education asked Mr. Dan Perrins to chair a review of
the Education PreK‐12 Funding Distribution Model to assess how it can be improved to address any
funding allocation inequities. Mr. Perrins was requested to engage all school divisions in the review
process and to establish a technical working committee comprised of school division and ministry
representatives to examine options. The Minister indicated his continued interest in preserving
unconditionality of funding and school division autonomy. Mr. Perrins was asked to focus on equity:
sufficiency of funding was not within the scope of the review.
The funding distribution model allocates funding to all school divisions across the province. The model
provides school boards with operating grants that are used to provide education services to students.
Striving for an equitable distribution of funds is important because all children in the province should be
able to access quality education; and parents, citizens and communities should be confident that public
dollars are being allocated effectively and efficiently.
The funding model was launched in 2012‐13 and has nine expense components that are based on the
various functions of school divisions: instruction (which includes base instruction, supports for learning,
instructional resources, local teacher benefits, and school based support), transportation, plant
operations and maintenance, governance, administration, complementary services (Prekindergarten),
tuition fee expenses, associate schools and debt repayment. In 2016‐17, $1.892 billion was distributed
to school divisions through the fund.
The Technical Committee was established and, between May 2015 and October 2016, the review was
conducted in consultation with school divisions. To ensure engagement of school divisions throughout
the review process, an iterative process was used. School divisions were initially engaged in the
identification of issues and, as options were identified and preliminary recommendations developed,
further meetings were held to discuss the rationale and implications. At all stages of the review, school
divisions were encouraged to provide feedback in and between meetings. Transportation and base
instruction, for example, were two areas where school divisions played a critical role in directing the
review. Initially, a new transportation formula was considered outside the scope of this project, and
base instruction was not identified as requiring further examination; however, six months into the
review process school divisions asked the Technical Committee to conduct further analysis. In response,
two working committees (one on transportation and the second on base instruction) were struck to
solicit additional school division expertise and to assist in the analysis.
In addition to the funding model components, the review also considered and makes recommendations
regarding The Education Regulations, governance and accountability, sustaining the model and integrity
of the model. In total, the Technical Committee makes 28 recommendations for consideration by
government to improve equity of the model and sustain it into the future. When those with financial
implications are considered all together, the review recommends a total funding shift between school
divisions of approximately $8.7 million or 0.5 per cent of the $1.892 billion funding allocation for
6
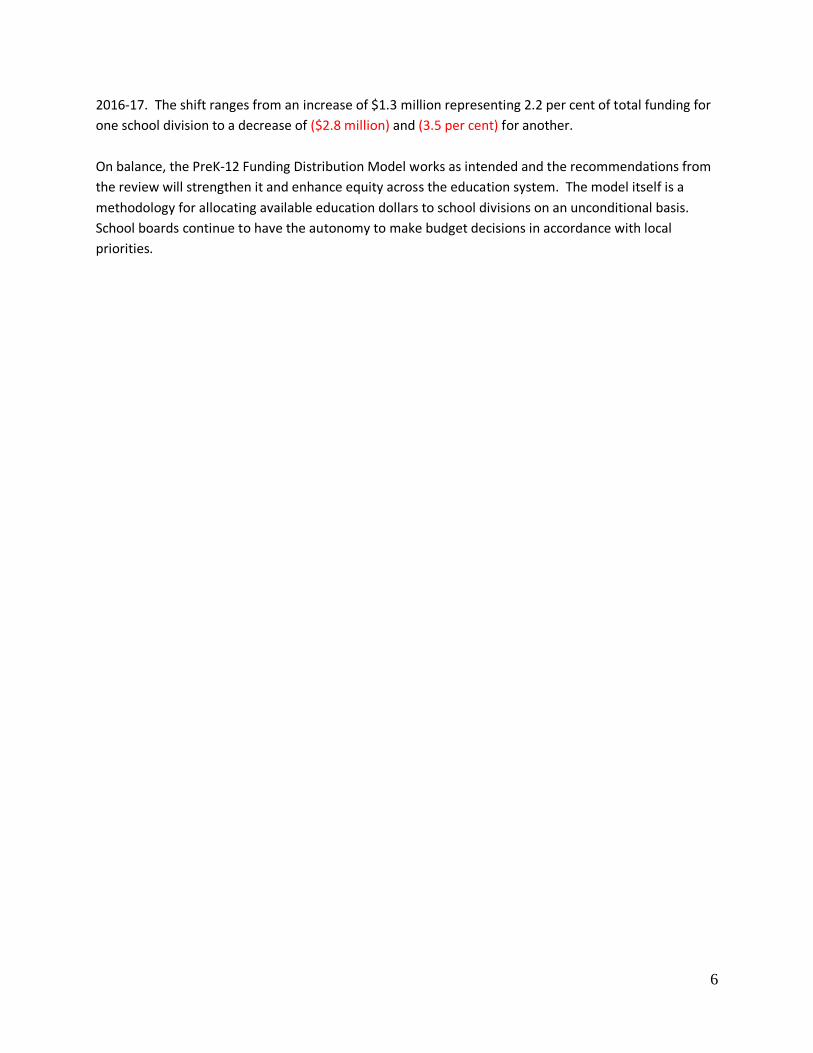
2016‐17. The shift ranges from an increase of $1.3 million representing 2.2 per cent of total funding for
one school division to a decrease of ($2.8 million) and (3.5 per cent) for another.
On balance, the PreK‐12 Funding Distribution Model works as intended and the recommendations from
the review will strengthen it and enhance equity across the education system. The model itself is a
methodology for allocating available education dollars to school divisions on an unconditional basis.
School boards continue to have the autonomy to make budget decisions in accordance with local
priorities.
7
Mandate In April 2015, Honourable Don Morgan, Minister of Education, asked me to chair a review of the
Education PreK‐12 Funding Distribution Model to assess how it can be improved to address any funding
allocation inequities. He clearly outlined his expectation that I engage all school divisions in the review
to ensure all sides of the issues are heard and to make every effort to obtain consensus across the
system about any proposed changes. He asked me to establish a technical working committee
comprised of school division and ministry representatives to examine options. I was asked to focus on
equity: sufficiency of funding was not within the scope of the review.
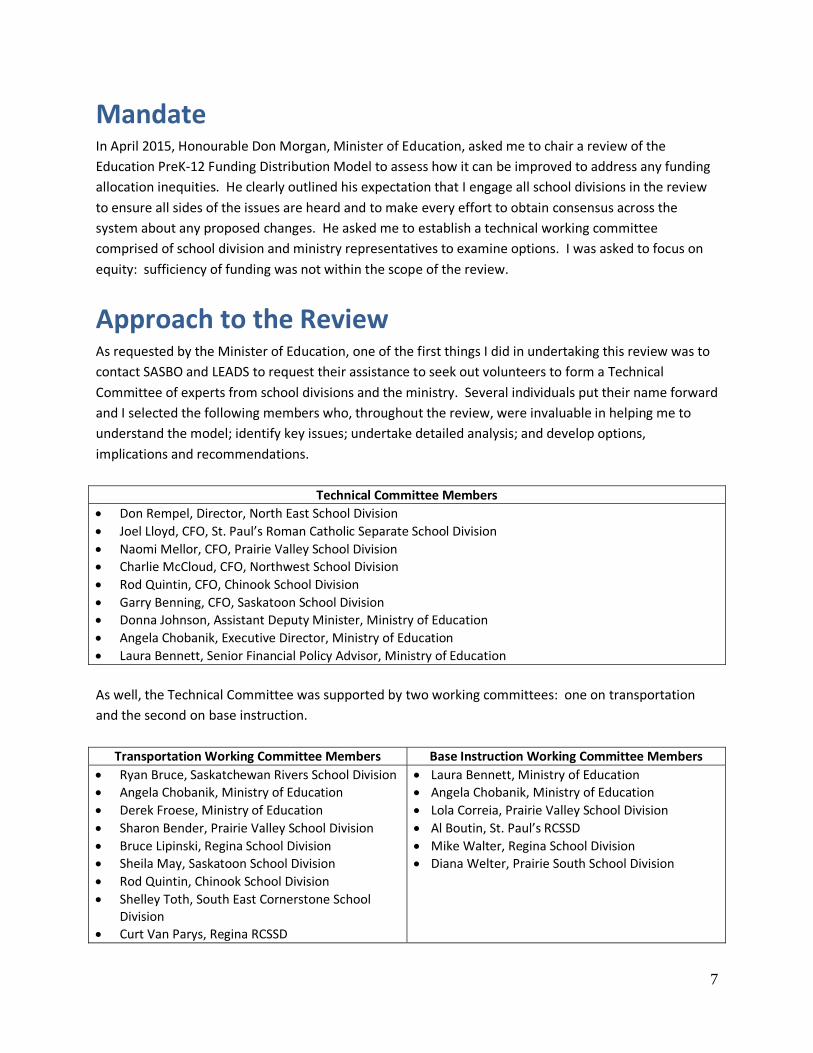
Approach to the Review As requested by the Minister of Education, one of the first things I did in undertaking this review was to
contact SASBO and LEADS to request their assistance to seek out volunteers to form a Technical
Committee of experts from school divisions and the ministry. Several individuals put their name forward
and I selected the following members who, throughout the review, were invaluable in helping me to
understand the model; identify key issues; undertake detailed analysis; and develop options,
implications and recommendations.
Technical Committee Members
Don Rempel, Director, North East School Division
Joel Lloyd, CFO, St. Paul’s Roman Catholic Separate School Division
Naomi Mellor, CFO, Prairie Valley School Division
Charlie McCloud, CFO, Northwest School Division
Rod Quintin, CFO, Chinook School Division
Garry Benning, CFO, Saskatoon School Division
Donna Johnson, Assistant Deputy Minister, Ministry of Education
Angela Chobanik, Executive Director, Ministry of Education
Laura Bennett, Senior Financial Policy Advisor, Ministry of Education
As well, the Technical Committee was supported by two working committees: one on transportation
and the second on base instruction.
Transportation Working Committee Members Base Instruction Working Committee Members
Ryan Bruce, Saskatchewan Rivers School Division
Angela Chobanik, Ministry of Education
Derek Froese, Ministry of Education
Sharon Bender, Prairie Valley School Division
Bruce Lipinski, Regina School Division
Sheila May, Saskatoon School Division
Rod Quintin, Chinook School Division
Shelley Toth, South East Cornerstone School Division
Curt Van Parys, Regina RCSSD
Laura Bennett, Ministry of Education
Angela Chobanik, Ministry of Education
Lola Correia, Prairie Valley School Division
Al Boutin, St. Paul’s RCSSD
Mike Walter, Regina School Division
Diana Welter, Prairie South School Division

8
I was committed to engaging all school divisions in the review process; however, especially over the
2015 summer months and during the writ period before the 2016 provincial election, this proved to be a
challenge. To ensure all sides of the issues were heard, and to make every effort to increase
understanding, discuss options and obtain consensus across the system; an iterative process was used.
School divisions were initially engaged in the identification of issues and, as options were identified and
preliminary recommendations developed, further meetings were held to discuss the rationale and
implications.
At all stages of the review, school divisions were encouraged to provide feedback in and between
meetings. Transportation and base instruction, for example, were two areas where school divisions
played a critical role in directing the review. Initially, a new transportation formula was considered
outside the scope of this project, and base instruction was not identified as requiring further
examination; however, six months into the review process school divisions asked the Technical
Committee to conduct further analysis. This is what led to establishment of the transportation and base
instruction working committees referenced above.
Meetings were held as follows:
May 27, 2015, April 14, 2016 meetings with Board Chairs;
September 24, 2015 and February 4, 2016 meetings with SSBA Executive Committee;
September 24, 2015, June 16, 2016, September 21, 2016 meetings with Board Chairs, Directors of
Education and Chief Financial Officers;
June 3, 2015, August 17, 2015, December 15, 2015 meetings with Directors of Education and Chief
Financial Officers (CFOs);
June 2, 2015, September 24, 2015 meetings with Conseil des écoles Fransaskoises;
January 20, 2016 meeting with Chinook, Prairie South and Sun West school divisions; and
November 15, 2016 meeting with Regina, Regina RCSSD, Saskatoon and St. Paul’s RCSSD.
In addition, I met with representatives of individual school divisions and other educational stakeholders
as requested and, throughout the review process, provided regular updates to the Minister.
9
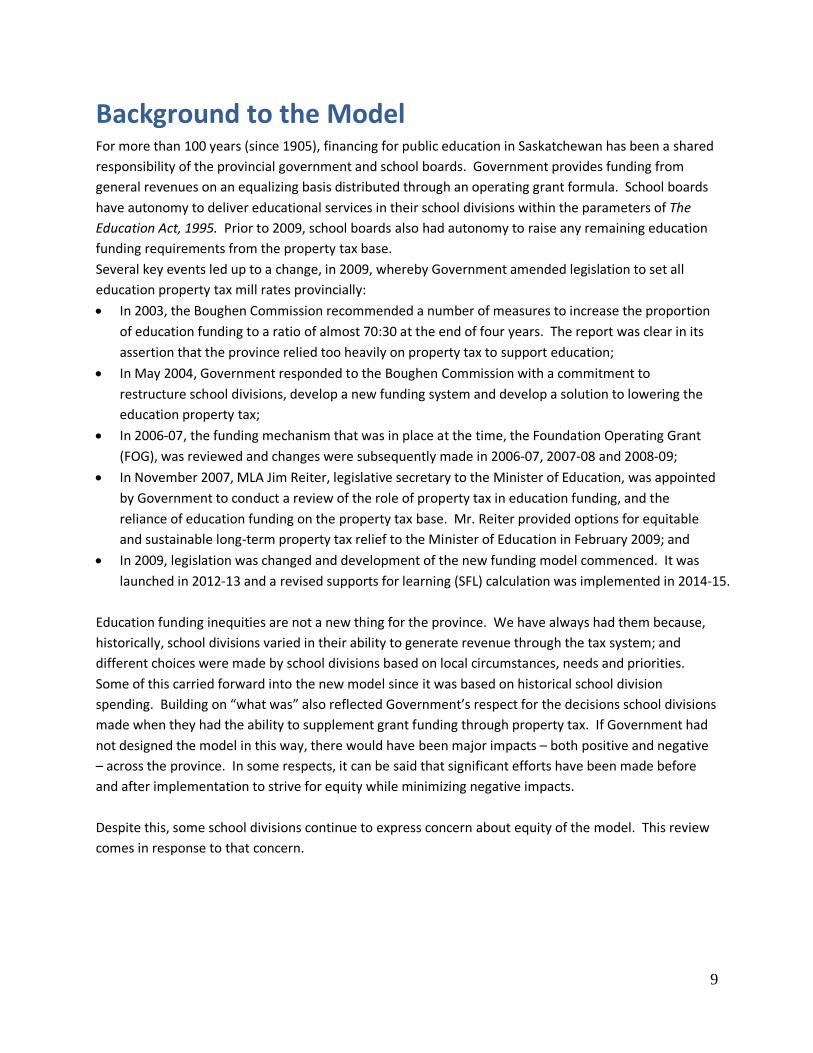
Background to the Model For more than 100 years (since 1905), financing for public education in Saskatchewan has been a shared
responsibility of the provincial government and school boards. Government provides funding from
general revenues on an equalizing basis distributed through an operating grant formula. School boards
have autonomy to deliver educational services in their school divisions within the parameters of The
Education Act, 1995. Prior to 2009, school boards also had autonomy to raise any remaining education
funding requirements from the property tax base.
Several key events led up to a change, in 2009, whereby Government amended legislation to set all
education property tax mill rates provincially:
In 2003, the Boughen Commission recommended a number of measures to increase the proportion
of education funding to a ratio of almost 70:30 at the end of four years. The report was clear in its
assertion that the province relied too heavily on property tax to support education;
In May 2004, Government responded to the Boughen Commission with a commitment to
restructure school divisions, develop a new funding system and develop a solution to lowering the
education property tax;
In 2006‐07, the funding mechanism that was in place at the time, the Foundation Operating Grant
(FOG), was reviewed and changes were subsequently made in 2006‐07, 2007‐08 and 2008‐09;
In November 2007, MLA Jim Reiter, legislative secretary to the Minister of Education, was appointed
by Government to conduct a review of the role of property tax in education funding, and the
reliance of education funding on the property tax base. Mr. Reiter provided options for equitable
and sustainable long‐term property tax relief to the Minister of Education in February 2009; and
In 2009, legislation was changed and development of the new funding model commenced. It was
launched in 2012‐13 and a revised supports for learning (SFL) calculation was implemented in 2014‐15.
Education funding inequities are not a new thing for the province. We have always had them because,
historically, school divisions varied in their ability to generate revenue through the tax system; and
different choices were made by school divisions based on local circumstances, needs and priorities.
Some of this carried forward into the new model since it was based on historical school division
spending. Building on “what was” also reflected Government’s respect for the decisions school divisions
made when they had the ability to supplement grant funding through property tax. If Government had
not designed the model in this way, there would have been major impacts – both positive and negative
– across the province. In some respects, it can be said that significant efforts have been made before
and after implementation to strive for equity while minimizing negative impacts.
Despite this, some school divisions continue to express concern about equity of the model. This review
comes in response to that concern.
10
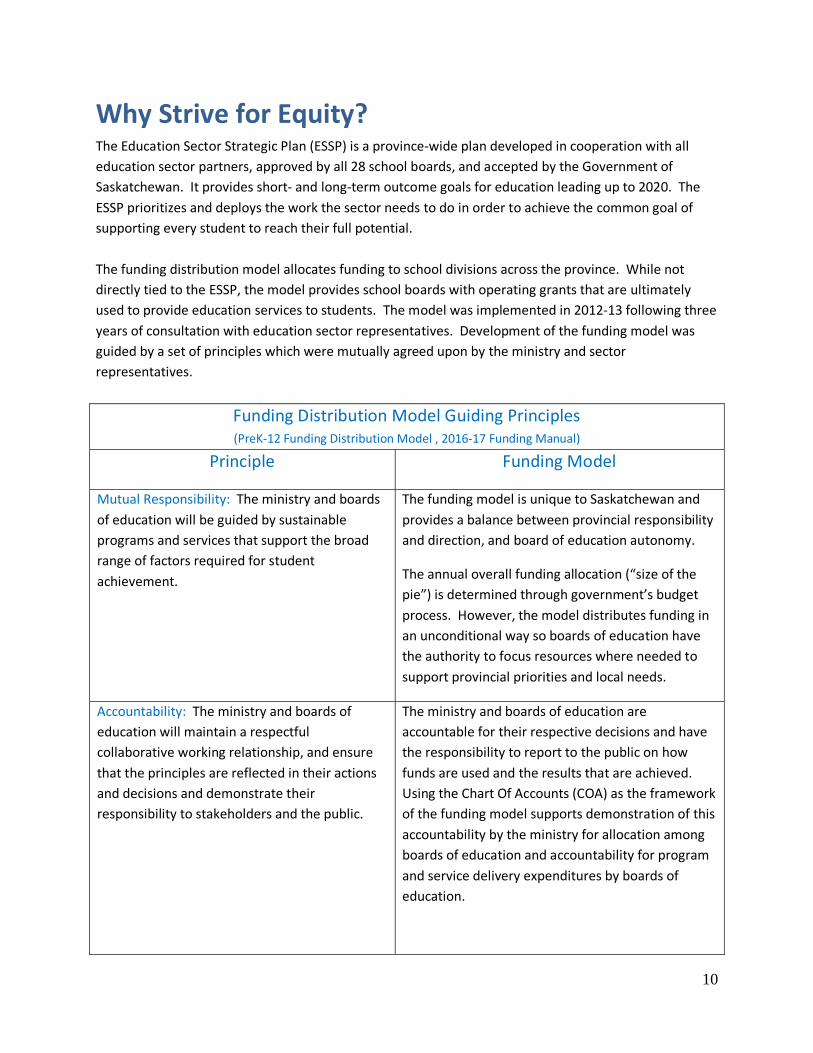
Why Strive for Equity? The Education Sector Strategic Plan (ESSP) is a province‐wide plan developed in cooperation with all
education sector partners, approved by all 28 school boards, and accepted by the Government of
Saskatchewan. It provides short‐ and long‐term outcome goals for education leading up to 2020. The
ESSP prioritizes and deploys the work the sector needs to do in order to achieve the common goal of
supporting every student to reach their full potential.
The funding distribution model allocates funding to school divisions across the province. While not
directly tied to the ESSP, the model provides school boards with operating grants that are ultimately
used to provide education services to students. The model was implemented in 2012‐13 following three
years of consultation with education sector representatives. Development of the funding model was
guided by a set of principles which were mutually agreed upon by the ministry and sector
representatives.
Funding Distribution Model Guiding Principles (PreK‐12 Funding Distribution Model , 2016‐17 Funding Manual)
Principle Funding Model
Mutual Responsibility: The ministry and boards
of education will be guided by sustainable
programs and services that support the broad
range of factors required for student
achievement.
The funding model is unique to Saskatchewan and
provides a balance between provincial responsibility
and direction, and board of education autonomy.
The annual overall funding allocation (“size of the
pie”) is determined through government’s budget
process. However, the model distributes funding in
an unconditional way so boards of education have
the authority to focus resources where needed to
support provincial priorities and local needs.
Accountability: The ministry and boards of
education will maintain a respectful
collaborative working relationship, and ensure
that the principles are reflected in their actions
and decisions and demonstrate their
responsibility to stakeholders and the public.
The ministry and boards of education are
accountable for their respective decisions and have
the responsibility to report to the public on how
funds are used and the results that are achieved.
Using the Chart Of Accounts (COA) as the framework
of the funding model supports demonstration of this
accountability by the ministry for allocation among
boards of education and accountability for program
and service delivery expenditures by boards of
education.
11
Transparency: The ministry and boards of
education will make decisions that are
supported by evidence‐based written policies
that are consistently applied and easily
understood.
The formulas within each component of the funding
model are clear and easily understood. The
ministry’s Funding Manual and written policies
identify rates and rationale of each formula within a
component used to distribute funding. This allows
for consistency amongst boards of education.
The COA structure supports the transparency of
ministry funding allocation among boards and
boards of education expenditures among priority
areas.
Equity: The ministry and boards of education
will make decisions that support all students in
reaching their full potential.
The distribution model recognizes cost differences
amongst boards of education in providing programs
and services. The formulas within each component
of the funding model consider the cost drivers for
delivery of education programs and services. Boards
of education continue to have the authority to
allocate resources among most cost areas and
among schools to meet provincial priorities and
student needs.
Stability: The ministry and the boards of
education will make decisions that endeavor to
provide the flexibility to deal with periods of
economic stability, growth and decline.
The distribution formulas within each component of
the model provide predictability and scalability,
which will allow boards of education to budget and
plan for the future.
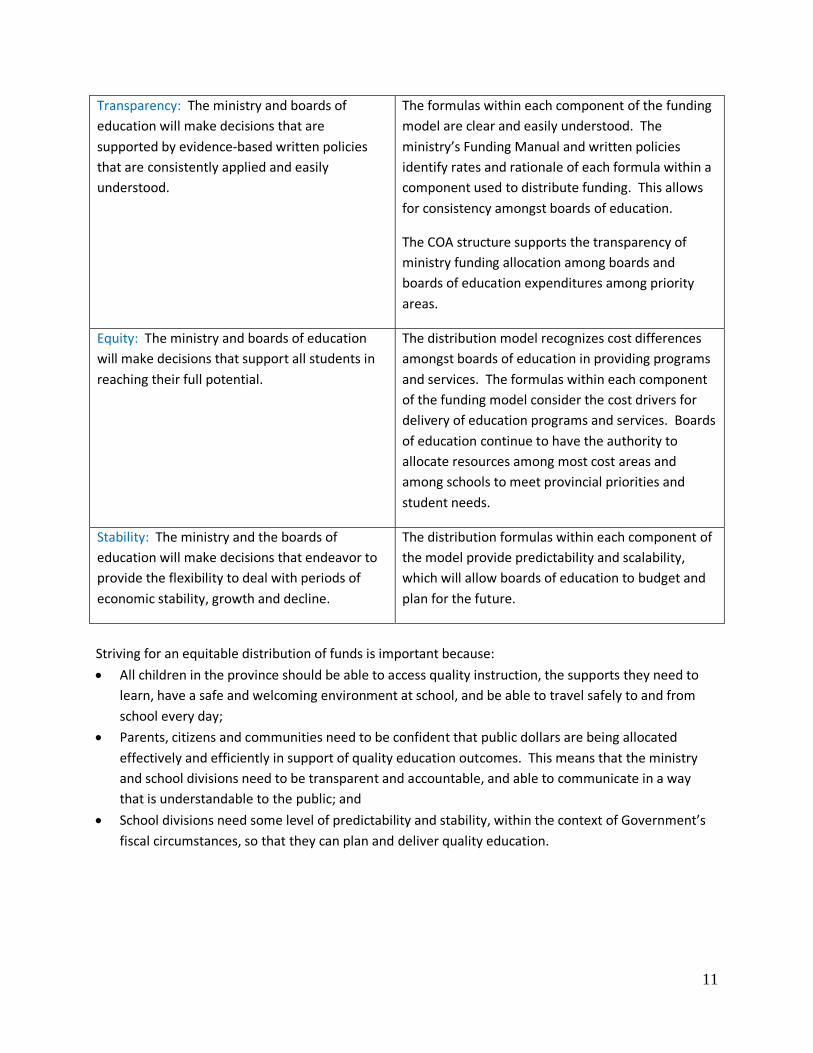
Striving for an equitable distribution of funds is important because:
All children in the province should be able to access quality instruction, the supports they need to
learn, have a safe and welcoming environment at school, and be able to travel safely to and from
school every day;
Parents, citizens and communities need to be confident that public dollars are being allocated
effectively and efficiently in support of quality education outcomes. This means that the ministry
and school divisions need to be transparent and accountable, and able to communicate in a way
that is understandable to the public; and
School divisions need some level of predictability and stability, within the context of Government’s
fiscal circumstances, so that they can plan and deliver quality education.
12
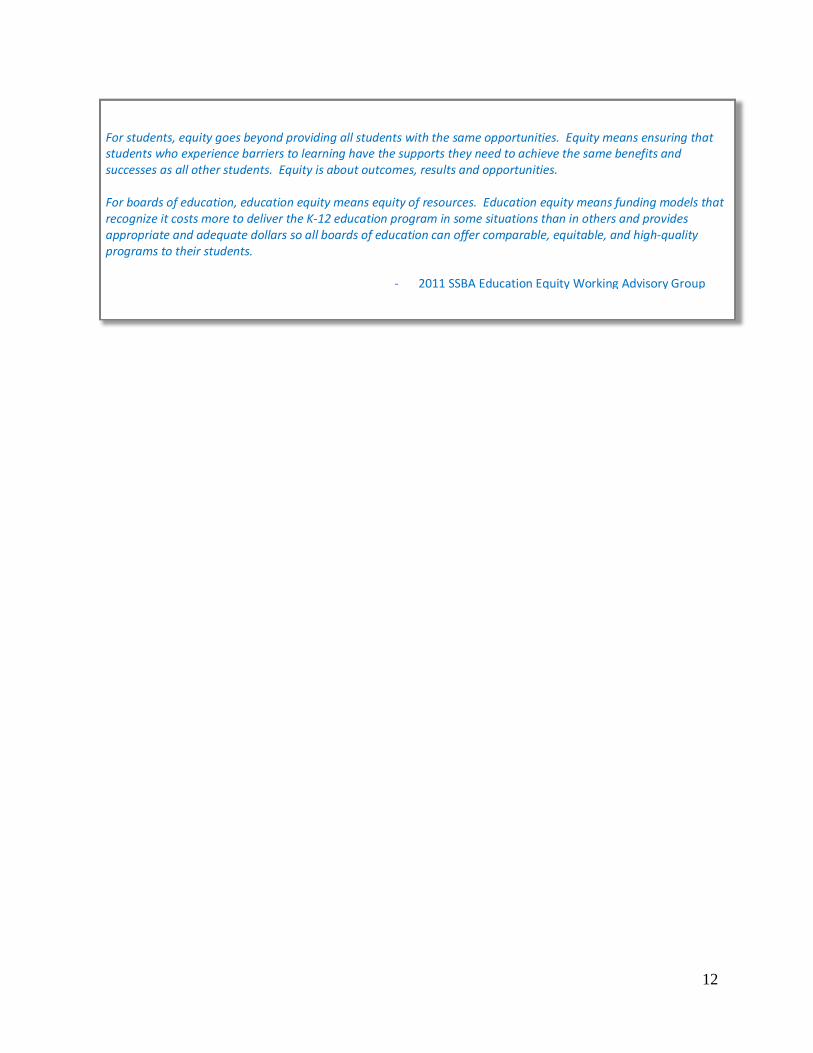
For students, equity goes beyond providing all students with the same opportunities. Equity means ensuring that students who experience barriers to learning have the supports they need to achieve the same benefits and successes as all other students. Equity is about outcomes, results and opportunities. For boards of education, education equity means equity of resources. Education equity means funding models that recognize it costs more to deliver the K‐12 education program in some situations than in others and provides appropriate and adequate dollars so all boards of education can offer comparable, equitable, and high‐quality programs to their students.
‐ 2011 SSBA Education Equity Working Advisory Group
13
How The Funding Distribution Model Works
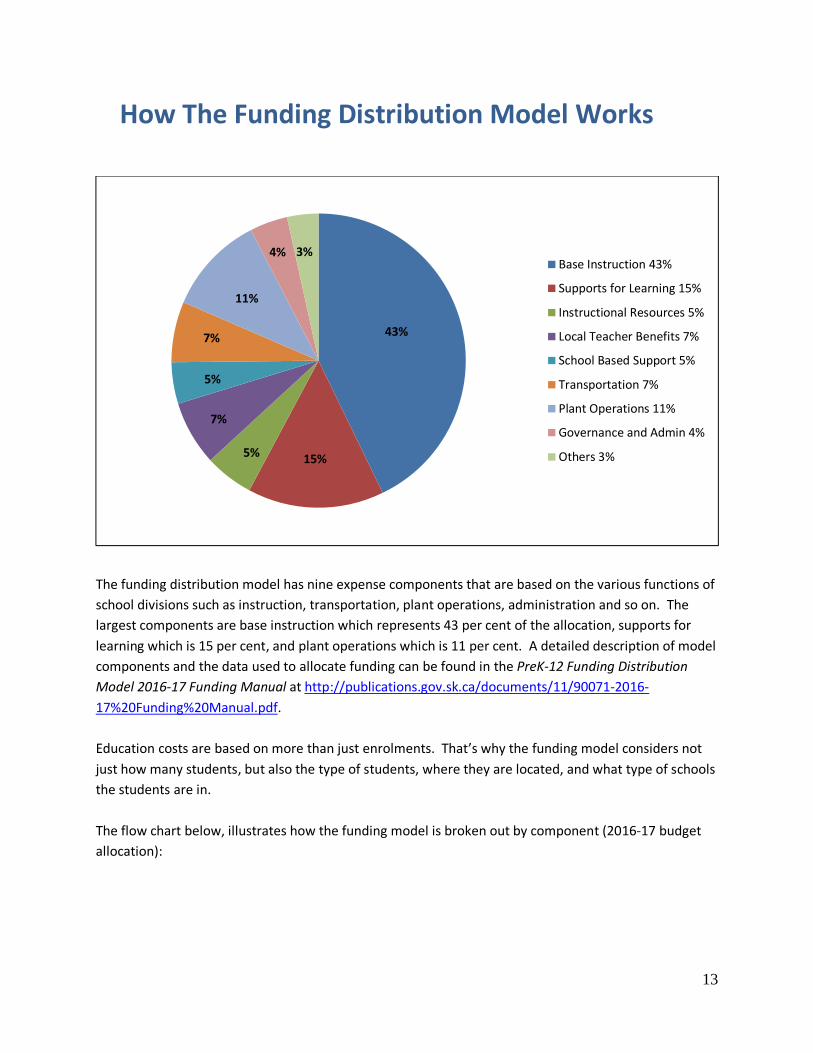
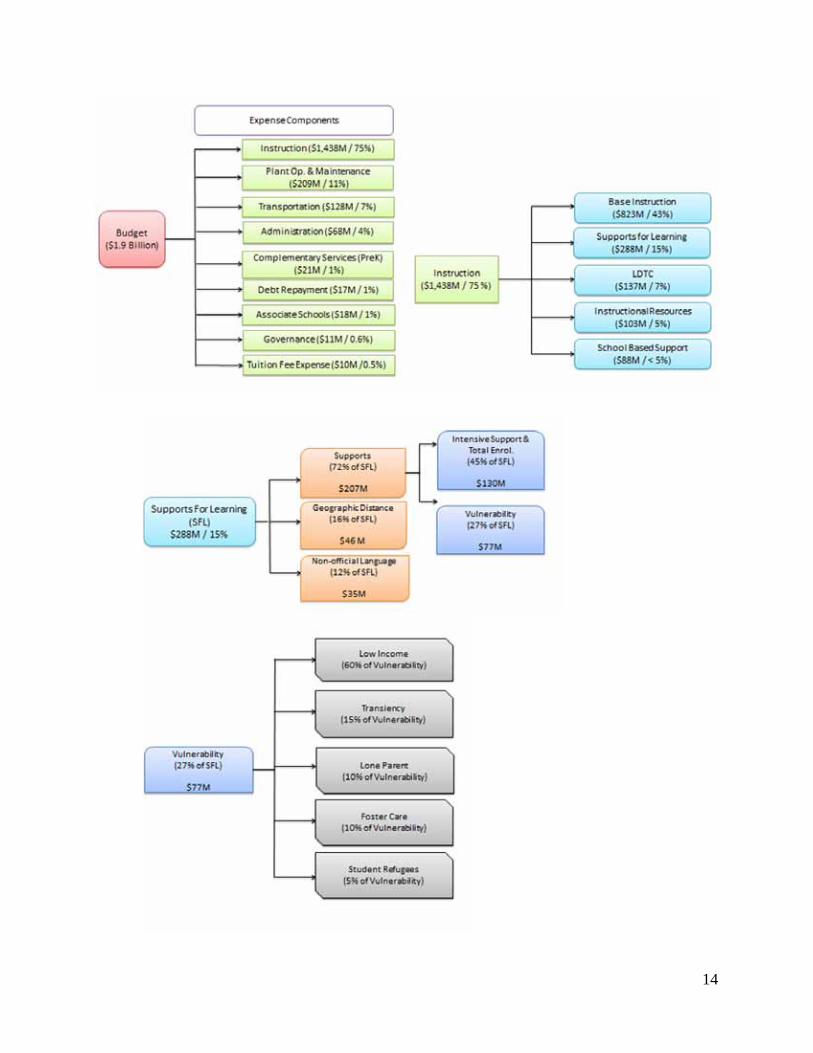
The funding distribution model has nine expense components that are based on the various functions of
school divisions such as instruction, transportation, plant operations, administration and so on. The
largest components are base instruction which represents 43 per cent of the allocation, supports for
learning which is 15 per cent, and plant operations which is 11 per cent. A detailed description of model
components and the data used to allocate funding can be found in the PreK‐12 Funding Distribution
Model 2016‐17 Funding Manual at http://publications.gov.sk.ca/documents/11/90071‐2016‐
17%20Funding%20Manual.pdf.
Education costs are based on more than just enrolments. That’s why the funding model considers not
just how many students, but also the type of students, where they are located, and what type of schools
the students are in.
The flow chart below, illustrates how the funding model is broken out by component (2016‐17 budget
allocation):
43%
15%5%
7%
5%
7%
11%
4% 3%Base Instruction 43%
Supports for Learning 15%
Instructional Resources 5%
Local Teacher Benefits 7%
School Based Support 5%
Transportation 7%
Plant Operations 11%
Governance and Admin 4%
Others 3%
14
15
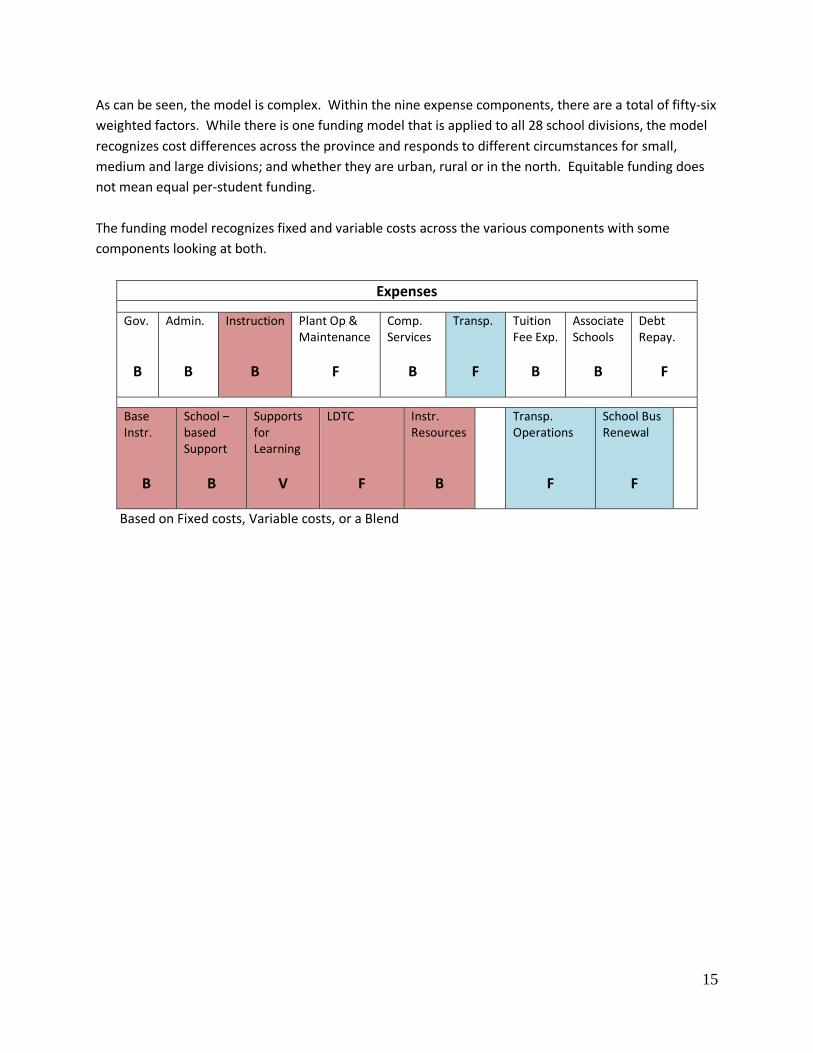
As can be seen, the model is complex. Within the nine expense components, there are a total of fifty‐six
weighted factors. While there is one funding model that is applied to all 28 school divisions, the model
recognizes cost differences across the province and responds to different circumstances for small,
medium and large divisions; and whether they are urban, rural or in the north. Equitable funding does
not mean equal per‐student funding.
The funding model recognizes fixed and variable costs across the various components with some
components looking at both.
Expenses
Gov.
B
Admin.
B
Instruction
B
Plant Op & Maintenance
F
Comp. Services
B
Transp.
F
Tuition Fee Exp.
B
Associate Schools
B
Debt Repay.
F
Base Instr.
B
School – based Support
B
Supports for Learning
V
LDTC
F
Instr. Resources
B
Transp. Operations
F
School Bus Renewal
F
Based on Fixed costs, Variable costs, or a Blend
16
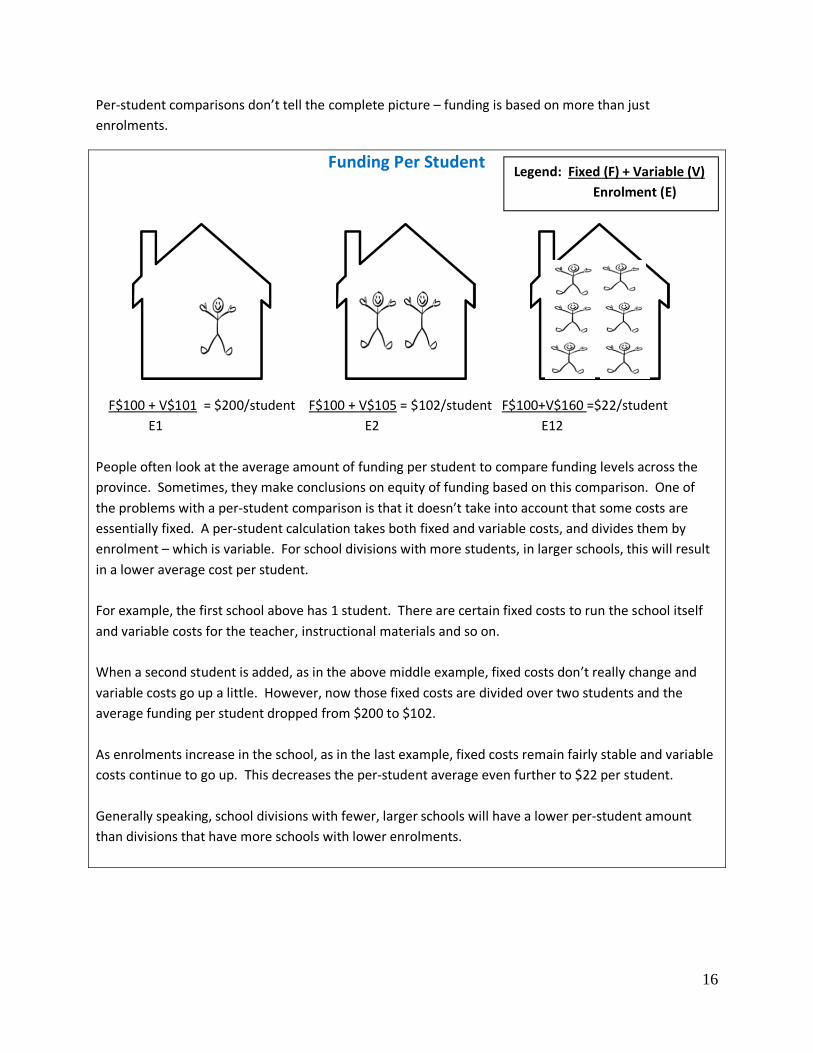
Per‐student comparisons don’t tell the complete picture – funding is based on more than just
enrolments.
Funding Per Student
F$100 + V$101 = $200/student F$100 + V$105 = $102/student F$100+V$160 =$22/student
E1 E2 E12
People often look at the average amount of funding per student to compare funding levels across the
province. Sometimes, they make conclusions on equity of funding based on this comparison. One of
the problems with a per‐student comparison is that it doesn’t take into account that some costs are
essentially fixed. A per‐student calculation takes both fixed and variable costs, and divides them by
enrolment – which is variable. For school divisions with more students, in larger schools, this will result
in a lower average cost per student.
For example, the first school above has 1 student. There are certain fixed costs to run the school itself
and variable costs for the teacher, instructional materials and so on.
When a second student is added, as in the above middle example, fixed costs don’t really change and
variable costs go up a little. However, now those fixed costs are divided over two students and the
average funding per student dropped from $200 to $102.
As enrolments increase in the school, as in the last example, fixed costs remain fairly stable and variable
costs continue to go up. This decreases the per‐student average even further to $22 per student.
Generally speaking, school divisions with fewer, larger schools will have a lower per‐student amount
than divisions that have more schools with lower enrolments.
Legend: Fixed (F) + Variable (V)
Enrolment (E)
17
Issues, Options and Recommendations The Technical Committee considered each of the components of the funding model to determine which
factors required further review. The following issues were identified:
Transportation
Locally Determined Terms and Conditions (LDTC)
Instruction
o Base Instruction
o Enrolment Counts for Graduated Students
o First Nations and Métis Education Achievement Fund
o Instructional Resources
Plant Operations and Maintenance
Supports for Learning (SFL)
o Students Requiring Intensive Supports o Geographic Distance
Revenue
o First Nations o International Students
Education Regulations
Governance and Accountability
Sustaining the Model
Concurrent Analysis
A discussion of each follows.
18
Transportation
Issue Since the PreK‐12 Funding Distribution Model was implemented in 2012, transportation has been funded
in a variety of ways, primarily based on past transportation expenditures along with adjustment factors
such as inflation, enrolment growth and funding availability. It includes school division operating costs
associated with the transportation of students, and a school bus renewal sub‐component that allocates
funding for the purchase and/or leasing of school buses. School divisions transport approximately 75,000
students per school day with buses travelling approximately 300,000 kilometers per day on rural routes
(the equivalent of more than 50 million kilometers per year). Total transportation funding in 2016‐17 is
$128.1 million, or 6.7 per cent of the total provincial funding recognition.
There is wide variation in transportation services and delivery methods across the province including
different policies on walk distances, ride times, and which students are eligible for transportation.
Some school divisions express concern with the transportation allocation because it is based on an
average of the three past years of transportation expenses which freezes‐in existing inequities. They are
concerned that since the transportation allocation is based on historical costs, there is no incentive for
school divisions to reduce spending as savings are subsequently removed from their funding allocation.
Background In 2012, a Transportation Funding Working Group comprised of chief financial officers and
transportation managers from eight school divisions and the ministry, was struck to develop a new
transportation formula. Objectives of the committee were to develop a transportation funding formula
that reflected best practices and cost pressures while encouraging efficiency and promoting equity; and
was predictable, stable, and could operate effectively with limited data resources. Over the next two
years the committee tested many different approaches to provide a “best fit” to historical spending
levels while minimizing funding shifts between school divisions as much as possible.
An approach was developed and presented to school divisions in December 2013. For rural
transportation, it was based on the student density of the school division and the actual distances
school buses travel on rural routes; and, for urban transportation, the type of student and size of the
urban centre. The approach was not implemented because the shifts in funding to school divisions were
significant and, in some cases, were difficult to fully explain.
In December 2015, the Funding Distribution Model Technical Committee was asked by school divisions
to re‐examine the formula developed in 2013‐14 and consider whether a new approach could be
implemented to replace the current funding method. The Transportation Funding Working Group was
re‐convened to build on the 2013‐14 work. The Working Group and the Technical Committee agree that
the following proposed changes will improve equity and better address the major cost drivers school
divisions are facing.
19
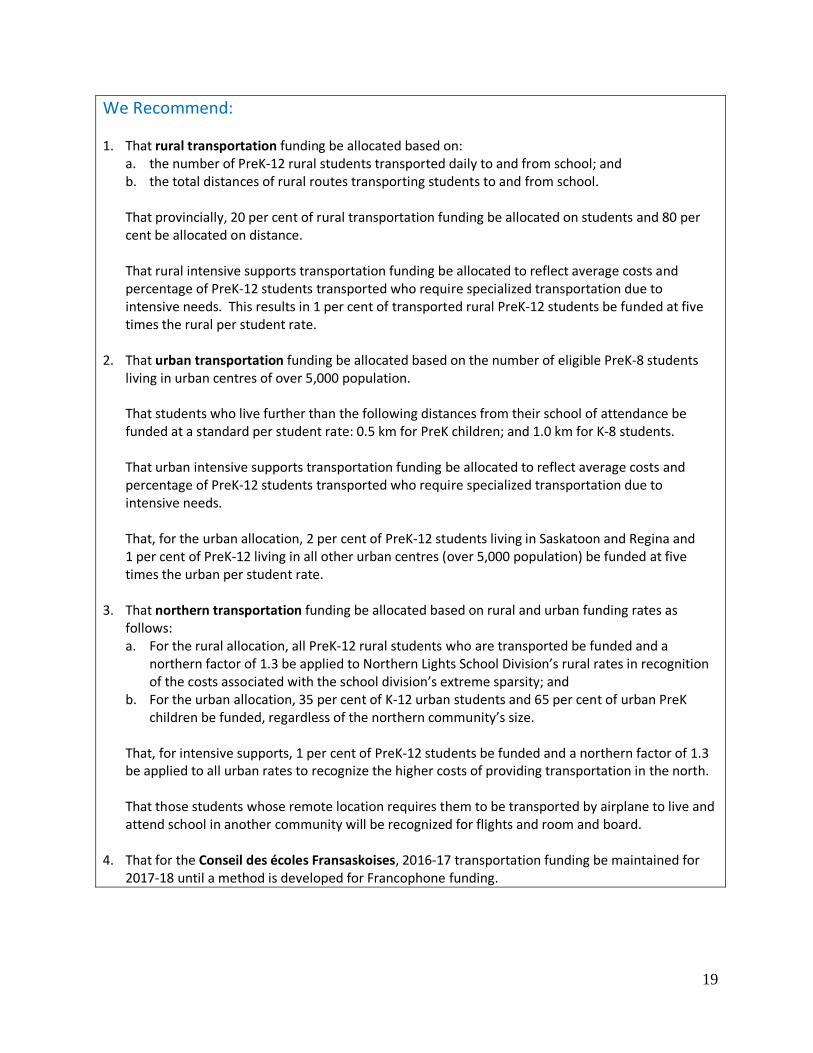
We Recommend: 1. That rural transportation funding be allocated based on:
a. the number of PreK‐12 rural students transported daily to and from school; and b. the total distances of rural routes transporting students to and from school.
That provincially, 20 per cent of rural transportation funding be allocated on students and 80 per cent be allocated on distance.
That rural intensive supports transportation funding be allocated to reflect average costs and percentage of PreK‐12 students transported who require specialized transportation due to intensive needs. This results in 1 per cent of transported rural PreK‐12 students be funded at five times the rural per student rate.
2. That urban transportation funding be allocated based on the number of eligible PreK‐8 students
living in urban centres of over 5,000 population.
That students who live further than the following distances from their school of attendance be funded at a standard per student rate: 0.5 km for PreK children; and 1.0 km for K‐8 students.
That urban intensive supports transportation funding be allocated to reflect average costs and percentage of PreK‐12 students transported who require specialized transportation due to intensive needs.
That, for the urban allocation, 2 per cent of PreK‐12 students living in Saskatoon and Regina and 1 per cent of PreK‐12 living in all other urban centres (over 5,000 population) be funded at five times the urban per student rate.
3. That northern transportation funding be allocated based on rural and urban funding rates as
follows: a. For the rural allocation, all PreK‐12 rural students who are transported be funded and a
northern factor of 1.3 be applied to Northern Lights School Division’s rural rates in recognition of the costs associated with the school division’s extreme sparsity; and
b. For the urban allocation, 35 per cent of K‐12 urban students and 65 per cent of urban PreK children be funded, regardless of the northern community’s size.
That, for intensive supports, 1 per cent of PreK‐12 students be funded and a northern factor of 1.3 be applied to all urban rates to recognize the higher costs of providing transportation in the north.
That those students whose remote location requires them to be transported by airplane to live and attend school in another community will be recognized for flights and room and board.
4. That for the Conseil des écoles Fransaskoises, 2016‐17 transportation funding be maintained for
2017‐18 until a method is developed for Francophone funding.
20
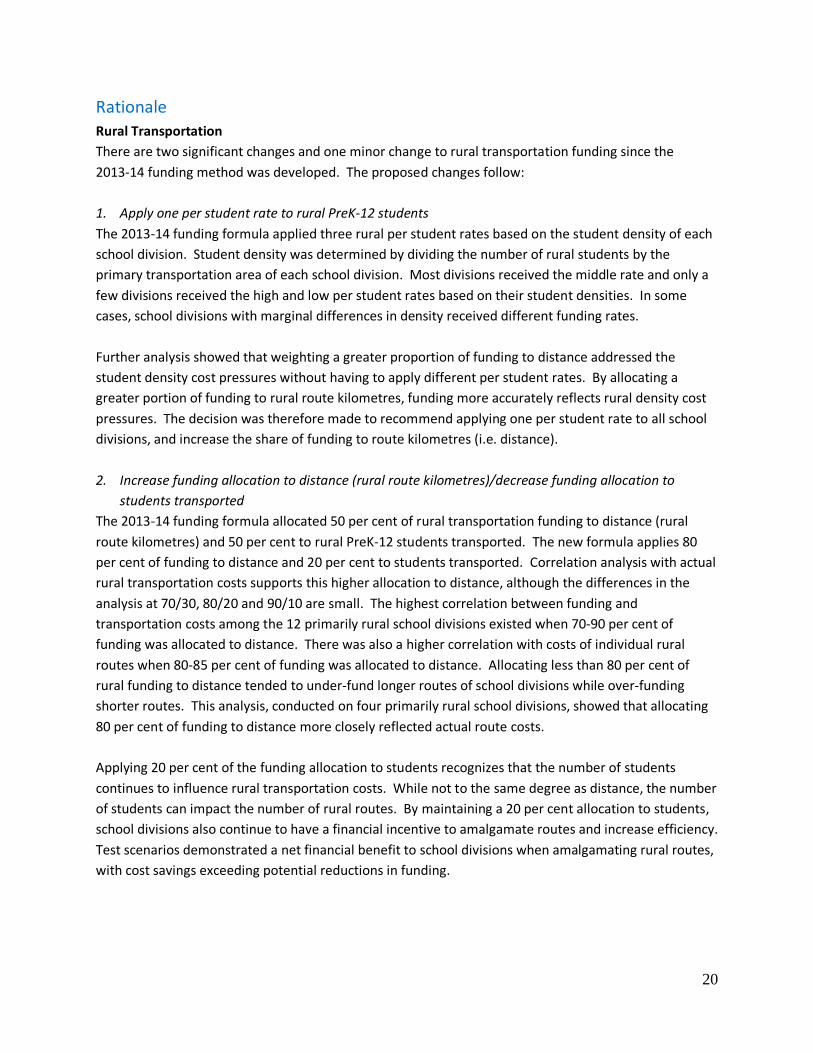
Rationale Rural Transportation
There are two significant changes and one minor change to rural transportation funding since the
2013‐14 funding method was developed. The proposed changes follow:
1. Apply one per student rate to rural PreK‐12 students
The 2013‐14 funding formula applied three rural per student rates based on the student density of each
school division. Student density was determined by dividing the number of rural students by the
primary transportation area of each school division. Most divisions received the middle rate and only a
few divisions received the high and low per student rates based on their student densities. In some
cases, school divisions with marginal differences in density received different funding rates.
Further analysis showed that weighting a greater proportion of funding to distance addressed the
student density cost pressures without having to apply different per student rates. By allocating a
greater portion of funding to rural route kilometres, funding more accurately reflects rural density cost
pressures. The decision was therefore made to recommend applying one per student rate to all school
divisions, and increase the share of funding to route kilometres (i.e. distance).
2. Increase funding allocation to distance (rural route kilometres)/decrease funding allocation to
students transported
The 2013‐14 funding formula allocated 50 per cent of rural transportation funding to distance (rural
route kilometres) and 50 per cent to rural PreK‐12 students transported. The new formula applies 80
per cent of funding to distance and 20 per cent to students transported. Correlation analysis with actual
rural transportation costs supports this higher allocation to distance, although the differences in the
analysis at 70/30, 80/20 and 90/10 are small. The highest correlation between funding and
transportation costs among the 12 primarily rural school divisions existed when 70‐90 per cent of
funding was allocated to distance. There was also a higher correlation with costs of individual rural
routes when 80‐85 per cent of funding was allocated to distance. Allocating less than 80 per cent of
rural funding to distance tended to under‐fund longer routes of school divisions while over‐funding
shorter routes. This analysis, conducted on four primarily rural school divisions, showed that allocating
80 per cent of funding to distance more closely reflected actual route costs.
Applying 20 per cent of the funding allocation to students recognizes that the number of students
continues to influence rural transportation costs. While not to the same degree as distance, the number
of students can impact the number of rural routes. By maintaining a 20 per cent allocation to students,
school divisions also continue to have a financial incentive to amalgamate routes and increase efficiency.
Test scenarios demonstrated a net financial benefit to school divisions when amalgamating rural routes,
with cost savings exceeding potential reductions in funding.
21
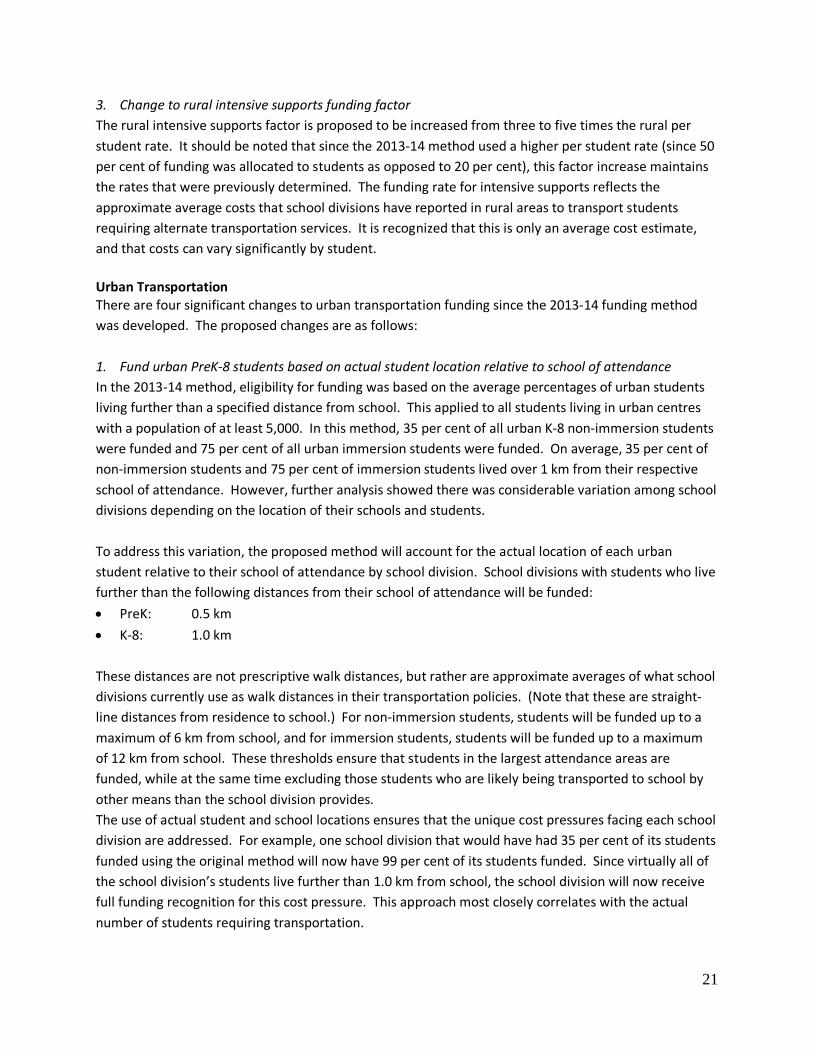
3. Change to rural intensive supports funding factor
The rural intensive supports factor is proposed to be increased from three to five times the rural per
student rate. It should be noted that since the 2013‐14 method used a higher per student rate (since 50
per cent of funding was allocated to students as opposed to 20 per cent), this factor increase maintains
the rates that were previously determined. The funding rate for intensive supports reflects the
approximate average costs that school divisions have reported in rural areas to transport students
requiring alternate transportation services. It is recognized that this is only an average cost estimate,
and that costs can vary significantly by student.
Urban Transportation There are four significant changes to urban transportation funding since the 2013‐14 funding method
was developed. The proposed changes are as follows:
1. Fund urban PreK‐8 students based on actual student location relative to school of attendance
In the 2013‐14 method, eligibility for funding was based on the average percentages of urban students
living further than a specified distance from school. This applied to all students living in urban centres
with a population of at least 5,000. In this method, 35 per cent of all urban K‐8 non‐immersion students
were funded and 75 per cent of all urban immersion students were funded. On average, 35 per cent of
non‐immersion students and 75 per cent of immersion students lived over 1 km from their respective
school of attendance. However, further analysis showed there was considerable variation among school
divisions depending on the location of their schools and students.
To address this variation, the proposed method will account for the actual location of each urban
student relative to their school of attendance by school division. School divisions with students who live
further than the following distances from their school of attendance will be funded:
PreK: 0.5 km
K‐8: 1.0 km
These distances are not prescriptive walk distances, but rather are approximate averages of what school
divisions currently use as walk distances in their transportation policies. (Note that these are straight‐
line distances from residence to school.) For non‐immersion students, students will be funded up to a
maximum of 6 km from school, and for immersion students, students will be funded up to a maximum
of 12 km from school. These thresholds ensure that students in the largest attendance areas are
funded, while at the same time excluding those students who are likely being transported to school by
other means than the school division provides.
The use of actual student and school locations ensures that the unique cost pressures facing each school
division are addressed. For example, one school division that would have had 35 per cent of its students
funded using the original method will now have 99 per cent of its students funded. Since virtually all of
the school division’s students live further than 1.0 km from school, the school division will now receive
full funding recognition for this cost pressure. This approach most closely correlates with the actual
number of students requiring transportation.
22
2. Apply one per student rate to urban PreK‐8 students
The 2013‐14 funding method applied two per student rates based on the size of the urban centre.
Students in smaller urban centres received a lower per student rate than students in the largest cities.
These differing rates were to account for the average difference in costs per student as experienced by
school divisions in small and large cities. The highest costs per student, on average, exist in Saskatoon
and Regina school divisions, and are largely associated with intensive supports transportation. Since the
cost differential is primarily related to intensive supports transportation, it has been addressed through
this funding allocation (see point #4 below).
Applying one per student rate assumes every school division faces the same transportation cost
pressures for non‐intensive supports students, whether transporting in a small or large city. While the
average cost per student varies by school division and by urban centre, depending on factors such as
contract costs and transportation policies, this variance is largely independent of the city’s size.
The 2013‐14 funding formula had also applied two different rates for immersion and non‐immersion
students. The recommended new formula will provide the same per student rate to both immersion
and non‐immersion students. The higher rate for urban immersion students (1.5 times the regular per
student rate) was originally created to account for the further distances that immersion students
typically travel and the assumed higher costs of transporting longer distances. Using the actual
distances between students and schools, as described above, eliminates the need for a separate
immersion rate. As well, costs in urban areas are primarily driven by the number of students, whether
they are immersion or non‐immersion (although it is recognized that distance can also pose an
additional cost pressure).
To address this cost pressure, a distance factor was considered for urban transportation. When a
funding rate was applied to student distances from residence to school, however, the funding impact on
school divisions was minimal. This is largely because school divisions’ average distances per student are
so similar. Since the funding impact and costs associated with distance in urban centres were both
minimal, the decision was made to allocate all urban funding through the student funding rate.
3. Urban high school students no longer funded in small urban centres
The 2013‐14 funding method funded high school students in smaller urban centres but not in larger
cities. This was to reflect current practice, where transportation services were less likely to be provided
in large cities where public transit was available. The new method proposes to not allocate funding for
any urban high school students. The rationale for this decision is as follows:
High school students are the most mobile of the age groups and can typically find other means to
attend school;
A high percentage of urban high school students is currently not transported provincially (most high
school students in Regina and Saskatoon are currently not transported);
By not funding high school students, a higher per student rate can be applied to urban PreK‐8
students; and
23
By not funding high school students, public expectations will be minimized, granting school divisions
greater flexibility in determining which students are eligible for transportation services.
Total transportation funding will not be reduced by not funding urban high school students. Instead, the
rates for urban PreK‐8 students will increase accordingly to ensure that urban transportation funding is
maintained. School boards will continue to have the autonomy to make decisions on whether to
transport high school students in urban areas or not. In addition, intensive supports funding will
continue to allocate funding for a percentage of urban high school students who require specialized
transportation services.
4. Changes to urban intensive supports funding factor
The 2013‐14 funding method funded 2 per cent of PreK‐12 students living in urban centres at three
times the urban per student funding rate. The proposed method will increase the intensive supports
rate to five times the urban per student rate. This is intended to more closely reflect the current
average costs of transporting students that require specialized transportation in urban centres.
The proposed method will continue to fund 2 per cent of all PreK‐12 students in Regina and Saskatoon,
but will fund 1 per cent of PreK‐12 students in all other cities. This change is intended to better reflect
the cost pressures facing the largest and smaller urban centres. Higher costs per student in Saskatoon
and Regina relate primarily to the transportation of intensive supports students. In these cities, on
average, a higher percentage of intensive supports students receive specialized transportation
(approximately 2 per cent of PreK‐12 students), while in smaller centres a lower percentage of students
receive specialized transportation (approximately 1 per cent of students). The percentage of intensive
supports students transported is higher in Saskatoon and Regina largely due to the presence of
centralized programming for these students.
Northern Transportation Changes to northern transportation funding largely incorporate the changes to urban and rural funding.
In the case of urban transportation, however, it is proposed that urban students continue to be funded
using provincial average percentages to determine eligibility for funding, as the data is not available to
determine actual distances from student residence to school. Based on 2015‐16 average percentages of
urban students living further than 0.5 km (PreK) and 1.0 km (K‐8) from school, 65 per cent of urban PreK
children and 35 per cent of urban K‐8 students will be recognized for funding. For the purposes of
northern transportation, urban students are defined as those that live within the community where the
school is located.
A northern factor will continue to be applied to the rural and urban per student rates and funding for
room and board and flights will continue to be provided for students living in remote areas.
24
Francophone Transportation
Francophone funding has yet to be determined. Until a method is developed, 2016‐17 transportation
funding will be maintained for 2017‐18.
School Division Feedback Following the presentation of the recommendations for a transportation funding formula to all school
divisions in June 2016, the committee invited school divisions to provide questions, comments and
feedback.
The committee received some informal questions, and a letter from one school division in October 2016.
Regina Public School Division expressed concerns about the impact of the proposed formula as well as
some of the mechanics within the calculations. In summary, the concerns were regarding:
The balance of funding provided for urban transportation versus rural transportation;
Funding for students requiring specialized transportation is based on enrolment rather than a count
of students requiring additional services (1 per cent of enrolment in rural areas and 2 per cent of
enrolment in urban areas);
The cost for contracted services are subject to market forces and as such transition adjustments
should be considered;
Using prior year data disadvantages school divisions with growing enrolments;
Whether the measurement of walking distances recognizes safety considerations (where students
walking is not feasible); and
The ability to verify student addresses within the provincial student data system.
The Technical Committee discussed these concerns and considered whether any of its recommendations
should be adjusted. A subset of the Technical Committee discussed these items with Regina Public and
the other large urban school divisions in November 2016. A letter was subsequently provided to Regina
Public with the Technical Committee’s response. That response is included as an Appendix A.
25
Implications Implications of the proposed recommendations regarding student transportation follow, and are also
displayed in concert with all review recommendations in the Concurrent Analysis section of this report.
Funding impacts compare current funding and past expenses of school divisions. The shifts in funding
caused by the proposed method reflect the variance among divisions in their transportation practices
and costs. Every division has a different starting point with regard to their current transportation
operations. Every division faces its own unique cost pressures and every division has made its own
service delivery choices. As a result, when a set of standard funding factors is applied to all divisions,
shifts in funding occur.
Current 2016‐17 transportation funding is primarily based on each school division’s three‐year average
of transportation costs. Comparing to past expenses is not always a good comparator, as costs can
change from year to year. Depending on the school division’s transportation contract, the price of fuel
and enrolment pressures, costs can vary significantly from year to year. Even average costs can change
substantially based on the number of years included. These factors must all be taken into account when
assessing the impacts on funding.
The following information compares 2016‐17 actual transportation funding to the proposed method’s
funding, assuming the proposed method had been implemented in 2016‐17. Actual transportation
funding for 2016‐17 includes both Transportation Operations and Bus Renewal funding. Funding for the
proposed method is based on the rates outlaid in the previous section. All rates are subject to change
for 2017‐18.
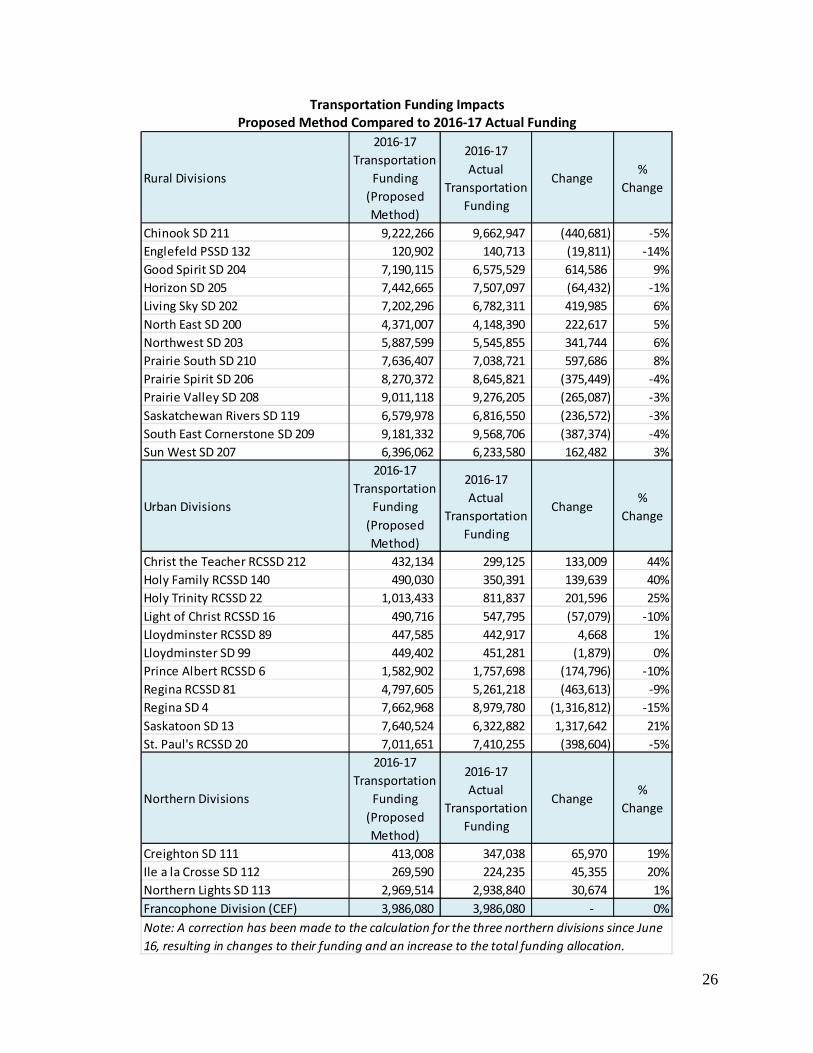
26
Transportation Funding Impacts Proposed Method Compared to 2016‐17 Actual Funding
Rural Divisions
2016‐17
Transportation
Funding
(Proposed
Method)
2016‐17
Actual
Transportation
Funding
Change%
Change
Chinook SD 211 9,222,266 9,662,947 (440,681) ‐5%
Englefeld PSSD 132 120,902 140,713 (19,811) ‐14%
Good Spirit SD 204 7,190,115 6,575,529 614,586 9%
Horizon SD 205 7,442,665 7,507,097 (64,432) ‐1%
Living Sky SD 202 7,202,296 6,782,311 419,985 6%
North East SD 200 4,371,007 4,148,390 222,617 5%
Northwest SD 203 5,887,599 5,545,855 341,744 6%
Prairie South SD 210 7,636,407 7,038,721 597,686 8%
Prairie Spirit SD 206 8,270,372 8,645,821 (375,449) ‐4%
Prairie Valley SD 208 9,011,118 9,276,205 (265,087) ‐3%
Saskatchewan Rivers SD 119 6,579,978 6,816,550 (236,572) ‐3%
South East Cornerstone SD 209 9,181,332 9,568,706 (387,374) ‐4%
Sun West SD 207 6,396,062 6,233,580 162,482 3%
Urban Divisions
2016‐17
Transportation
Funding
(Proposed
Method)
2016‐17
Actual
Transportation
Funding
Change%
Change
Christ the Teacher RCSSD 212 432,134 299,125 133,009 44%
Holy Family RCSSD 140 490,030 350,391 139,639 40%
Holy Trinity RCSSD 22 1,013,433 811,837 201,596 25%
Light of Christ RCSSD 16 490,716 547,795 (57,079) ‐10%
Lloydminster RCSSD 89 447,585 442,917 4,668 1%
Lloydminster SD 99 449,402 451,281 (1,879) 0%
Prince Albert RCSSD 6 1,582,902 1,757,698 (174,796) ‐10%
Regina RCSSD 81 4,797,605 5,261,218 (463,613) ‐9%
Regina SD 4 7,662,968 8,979,780 (1,316,812) ‐15%
Saskatoon SD 13 7,640,524 6,322,882 1,317,642 21%
St. Paul's RCSSD 20 7,011,651 7,410,255 (398,604) ‐5%
Northern Divisions
2016‐17
Transportation
Funding
(Proposed
Method)
2016‐17
Actual
Transportation
Funding
Change%
Change
Creighton SD 111 413,008 347,038 65,970 19%
Ile a la Crosse SD 112 269,590 224,235 45,355 20%
Northern Lights SD 113 2,969,514 2,938,840 30,674 1%
Francophone Division (CEF) 3,986,080 3,986,080 ‐ 0%
Note: A correction has been made to the calculation for the three northern divisions since June
16, resulting in changes to their funding and an increase to the total funding allocation.
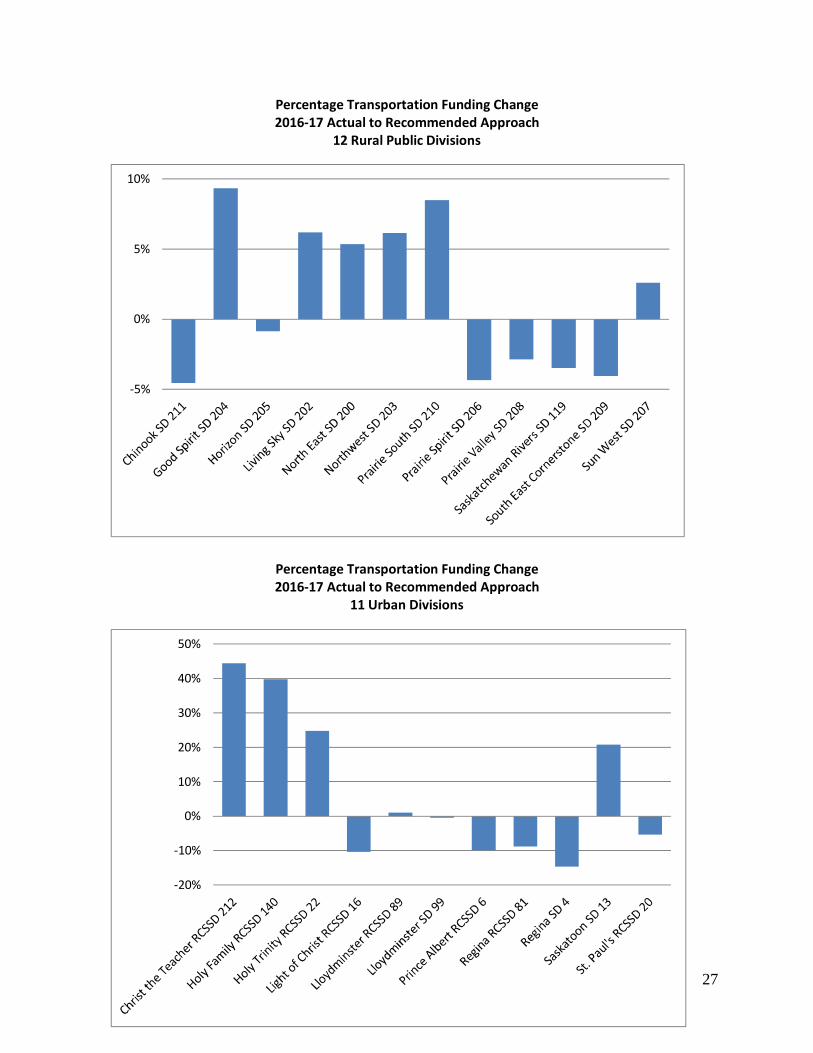
27
‐20%
‐10%
0%
10%
20%
30%
40%
50%
Percentage Transportation Funding Change 2016‐17 Actual to Recommended Approach
12 Rural Public Divisions
Percentage Transportation Funding Change 2016‐17 Actual to Recommended Approach
11 Urban Divisions
‐5%
0%
5%
10%
28
Locally Determined Terms and Conditions (LDTC)
Issue The Locally Determined Terms and Conditions of Employment of Teachers (LDTC) subcomponent of
instruction allocates funding for teacher benefits at the local level. This includes benefits and conditions
of employment that are typically bargained through Local Implementation and Negotiations Committee
(LINC) agreements, outlined in policy, or agreed to at the board level. It includes funding for classroom
teachers, non‐school based instructional support and school administration. LINC agreements include
provisions such as preparation time, professional development, leaves, recruitment and retention,
allowances and other provisions. The provincial funding allocation for LDTC in 2016‐17 is $137.0 million,
or 7.1 per cent of the total funding allocation.
Some school divisions express concern about the current LDTC allocation because it is based on
historical costs from 2011‐12. They believe a longer term funding strategy is required because of
historical inequities which have resulted from local bargaining, along with local school board policy and
practice. LINC agreements have been highly influenced by local priorities and pressures, and there is
disparity in teacher working conditions and benefits across the province.
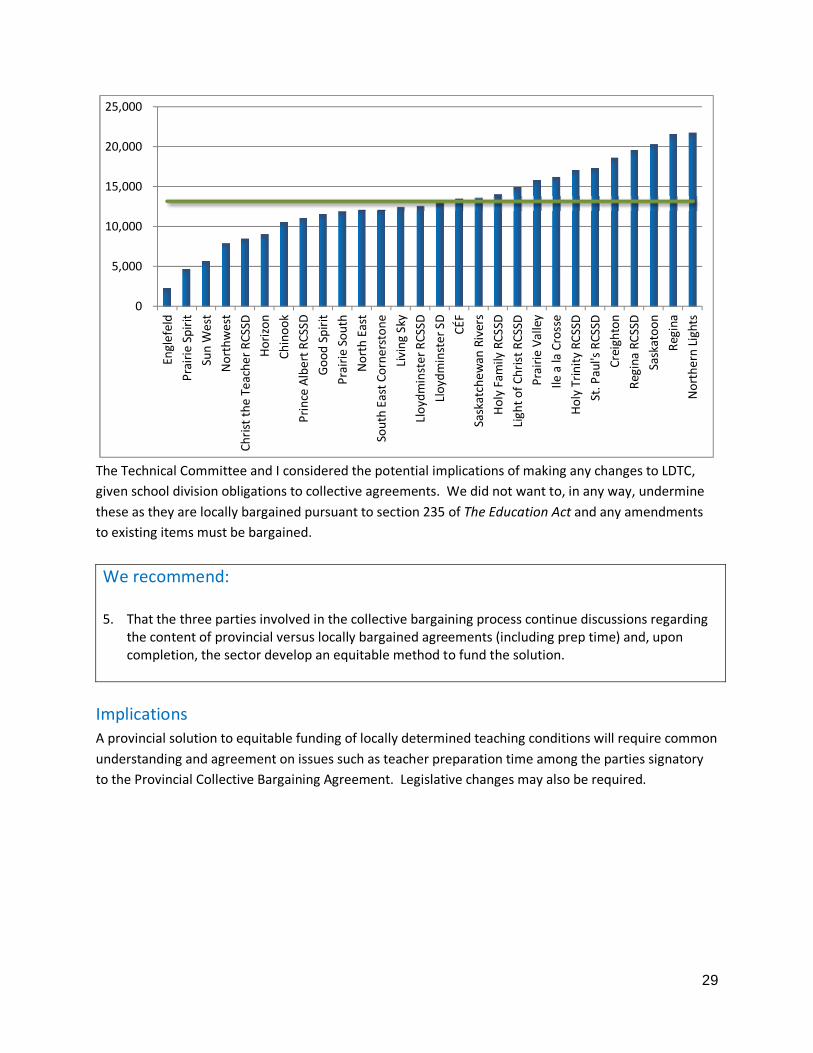
The graph below shows the LDTC cost‐per‐teacher based on costs reported for 2012‐13 for all school
divisions with the green line indicating the weighted average cost. As can be seen, there is a wide
variation in costs across the province. The biggest contributor to the differences is teacher preparation
time. Also, there are additional benefits provided to teachers in the northern school divisions to address
recruitment and retention issues.
29
The Technical Committee and I considered the potential implications of making any changes to LDTC,
given school division obligations to collective agreements. We did not want to, in any way, undermine
these as they are locally bargained pursuant to section 235 of The Education Act and any amendments
to existing items must be bargained.
We recommend: 5. That the three parties involved in the collective bargaining process continue discussions regarding
the content of provincial versus locally bargained agreements (including prep time) and, upon completion, the sector develop an equitable method to fund the solution.
Implications A provincial solution to equitable funding of locally determined teaching conditions will require common
understanding and agreement on issues such as teacher preparation time among the parties signatory
to the Provincial Collective Bargaining Agreement. Legislative changes may also be required.
0
5,000
10,000
15,000
20,000
25,000
Englefeld
Prairie Spirit
Sun W
est
Northwest
Christ the Teacher RCSSD
Horizon
Chinook
Prince Albert RCSSD
Good Spirit
Prairie South
North East
South East Cornerstone
Living Sky
Lloydminster RCSSD
Lloydminster SD CÉF
Saskatchewan
Rivers
Holy Fam
ily RCSSD
Light of Christ RCSSD
Prairie Valley
Ile a la Crosse
Holy Trinity RCSSD
St. Paul's RCSSD
Creighton
Regina RCSSD
Saskatoon
Regina
Northern Lights
30
Instruction
Base Instruction
Issue The base instruction funding subcomponent of instruction allocates funding for K‐12 instructional
activities. It includes funding for the salaries and benefits of teachers, instructional support and school
administrators, as well as an additional discretionary amount to enable boards of education to address
local needs and priorities. Base instruction does not allocate funding for specific schools and students.
As enrolments increase or decrease, a sliding scale is used to recognize costs and efficiencies of scale.
Consideration is also given within base instruction for Small Schools of Necessity and Hutterian schools.
The total allocation for base instruction in 2016‐17 is $823.4 million, or 42.8 per cent of the total
provincial funding recognition.
Initially, school divisions did not express a great deal of concern about the base instruction component
of the funding model. However, recognizing it is the largest component of the total allocation, in
September 2015, Board Chairs requested it be examined in some detail. A Working Group was formed
in October 2015 with representatives from the ministry and three school divisions. An additional
member from Regina School Division was added to the group in August 2016, based on a request from
the four divisions in Regina and Saskatoon. The Working Group was asked to evaluate whether the base
instruction calculation is distributing funds equitably and develop recommendations for the technical
committee to consider.
Approach As the Working Group progressed in its analysis, it became clear that additional funding model
components needed to be considered in the analysis of base instruction. There is overlap between the
base instruction, supports for learning, locally determined terms and conditions, and PreK components.
For example, school divisions have different service delivery approaches, with different complements of
base instruction and SFL staff, which cause overlap between the two components. For PreK, counts of
educational assistants (EAs) were included in the data and could not be easily removed. All PreK staff
and funding needed to be considered together to ensure cost estimates were accurate. The base
instruction review needed to consider the balance of costs and funding for the four components to gain
a better understanding of base instruction. This did not change the scope of the review: the focus
remained on the base instruction calculation and whether it allocates funds equitably.
The Working Group identified a method of evaluating equity in base instruction: there is variation in
staffing across schools, even within the same school type; however, on average, base instruction funding
should be somewhat higher than actual staffing for each school type (e.g., elementary, high school, K‐12).
The base instruction component includes a discretionary portion of funds that provides flexibility for
boards to address local needs and sector priorities. This discretionary portion should be similar for each
school type, on average.
31
Throughout the review process, the Working Group provided updates to the Funding Distribution Model
Technical Committee, and received and incorporated feedback from the Technical Committee into the
review. The final recommendation represents the conclusions of both the Working Group and the
Funding Distribution Model Technical Committee. Both groups agree that the revised base instruction
calculation represents a more equitable distribution of base instruction funds.
Methodology Current Base Instruction Calculation
Under the current calculation, funding is allocated using the enrolments of each funded school in a
division. School‐level enrolments are multiplied by the sliding scale threshold, resulting in the total
instruction units per school. This calculation is carried out for each school in the division, and total units
are summed and multiplied by the base instruction unit rate to determine total funding recognition for
each school division. There are separate factors for small schools of necessity (SSONs) and Hutterian
schools. These adjustment factors have distance (SSONs only) and enrolment criteria: schools that
meet these criteria are eligible for additional funding recognition.
The current calculation does not differentiate between school type (e.g., elementary, high school, K‐12
schools) or the location of schools. When school enrolments are the same, funding recognition is also
the same.
School and School Division Profiles
The goal of the review was to evaluate whether the base instruction calculation is distributing funds
equitably. The findings of the review show that, provincially, there is a pool of base instruction
discretionary funding at a level that provides flexibility for boards of education to address local needs
and priorities. However, at the school level, base instruction funding is not being distributed equitably
across different school types.
A key finding of the review is that there are school profiles and school division profiles, both of which
have an impact on a division’s level of discretionary funding. A school’s profile is based on the type of
school (e.g., elementary, high school, K‐12) and the enrolment level (school size). The combination of
these school profile elements affects the school’s level of discretionary funding for each school. The
school division profile is based on the configuration of all the schools in the division.
Certain types of schools have a higher level of discretionary funding than others. Elementary schools
have the highest amount of discretionary funding while high schools and K‐12 schools have a lower
amount. Elementary schools in Regina and Saskatoon have a significantly higher level of discretionary
funding than elementary schools outside of Regina and Saskatoon (‘rural’ elementary schools).
In terms of school size, those schools with less than 100 students, and high schools and K‐12 schools
with 400 or more students tend to have a lower level of discretionary funding than similar schools with
mid‐range enrolments (between 100‐399 students). The optimal mid‐range enrolment level varies
depending on the school type (e.g., it occurs between 100‐399 students for high schools, and between
200‐399 students for K‐12 schools).
32
Certain types and sizes of schools are able to function optimally, creating a higher level of discretionary
funding. Because of these optimal school profile elements, there are certain efficiencies that can be
achieved. Most elementary schools fall within this category. However, when the school type and
enrolment levels are not optimal, a lower level of discretionary funding is available: these schools are
not able to achieve the same efficiencies, as a function of their profile. This is the case with smaller
‘rural’ elementary schools, high schools, and K‐12 schools.
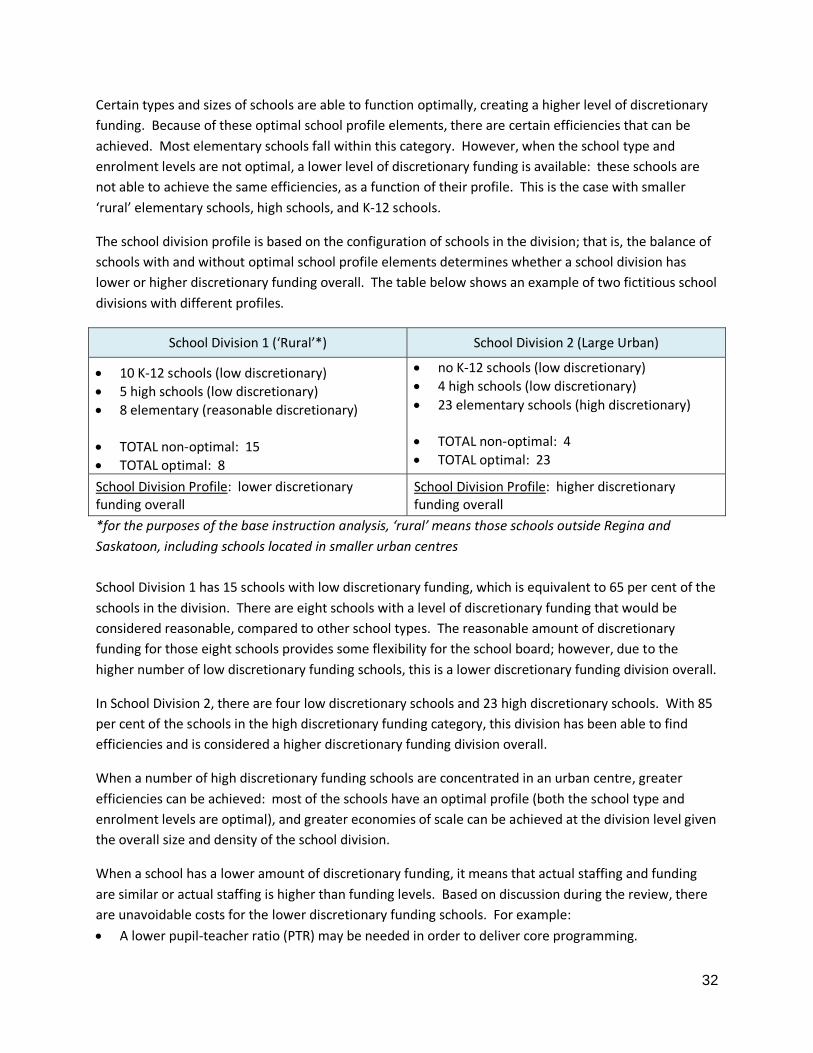
The school division profile is based on the configuration of schools in the division; that is, the balance of
schools with and without optimal school profile elements determines whether a school division has
lower or higher discretionary funding overall. The table below shows an example of two fictitious school
divisions with different profiles.
School Division 1 (‘Rural’*) School Division 2 (Large Urban)
10 K‐12 schools (low discretionary)
5 high schools (low discretionary)
8 elementary (reasonable discretionary)
TOTAL non‐optimal: 15
TOTAL optimal: 8
no K‐12 schools (low discretionary)
4 high schools (low discretionary)
23 elementary schools (high discretionary)
TOTAL non‐optimal: 4
TOTAL optimal: 23
School Division Profile: lower discretionary funding overall
School Division Profile: higher discretionary funding overall
*for the purposes of the base instruction analysis, ‘rural’ means those schools outside Regina and
Saskatoon, including schools located in smaller urban centres
School Division 1 has 15 schools with low discretionary funding, which is equivalent to 65 per cent of the
schools in the division. There are eight schools with a level of discretionary funding that would be
considered reasonable, compared to other school types. The reasonable amount of discretionary
funding for those eight schools provides some flexibility for the school board; however, due to the
higher number of low discretionary funding schools, this is a lower discretionary funding division overall.
In School Division 2, there are four low discretionary schools and 23 high discretionary schools. With 85
per cent of the schools in the high discretionary funding category, this division has been able to find
efficiencies and is considered a higher discretionary funding division overall.
When a number of high discretionary funding schools are concentrated in an urban centre, greater
efficiencies can be achieved: most of the schools have an optimal profile (both the school type and
enrolment levels are optimal), and greater economies of scale can be achieved at the division level given
the overall size and density of the school division.
When a school has a lower amount of discretionary funding, it means that actual staffing and funding
are similar or actual staffing is higher than funding levels. Based on discussion during the review, there
are unavoidable costs for the lower discretionary funding schools. For example:
A lower pupil‐teacher ratio (PTR) may be needed in order to deliver core programming.
33
Congregated programming may not be an option.
Certain positions may need to be staffed in‐school, at a higher allocation because it may be difficult to recruit itinerant staff.
In some cases, allocations may need to be increased to recruit staff [e.g., an increase from a 0.7 full time‐equivalent (FTE) to 1.0 FTE].
Students may not be equally dispersed in grades (lower enrolment levels may not permit a higher PTR).
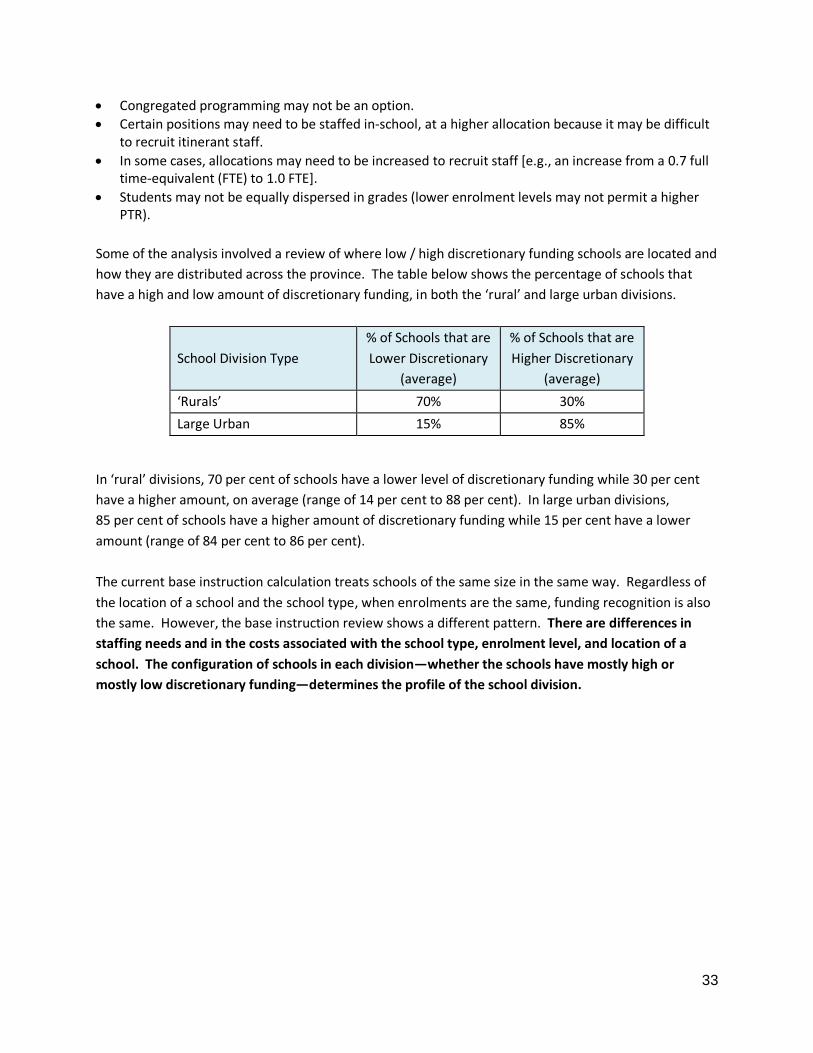
Some of the analysis involved a review of where low / high discretionary funding schools are located and
how they are distributed across the province. The table below shows the percentage of schools that
have a high and low amount of discretionary funding, in both the ‘rural’ and large urban divisions.
School Division Type
% of Schools that are
Lower Discretionary
(average)
% of Schools that are
Higher Discretionary
(average)
‘Rurals’ 70% 30%
Large Urban 15% 85%
In ‘rural’ divisions, 70 per cent of schools have a lower level of discretionary funding while 30 per cent
have a higher amount, on average (range of 14 per cent to 88 per cent). In large urban divisions,
85 per cent of schools have a higher amount of discretionary funding while 15 per cent have a lower
amount (range of 84 per cent to 86 per cent).
The current base instruction calculation treats schools of the same size in the same way. Regardless of
the location of a school and the school type, when enrolments are the same, funding recognition is also
the same. However, the base instruction review shows a different pattern. There are differences in
staffing needs and in the costs associated with the school type, enrolment level, and location of a
school. The configuration of schools in each division—whether the schools have mostly high or
mostly low discretionary funding—determines the profile of the school division.
34
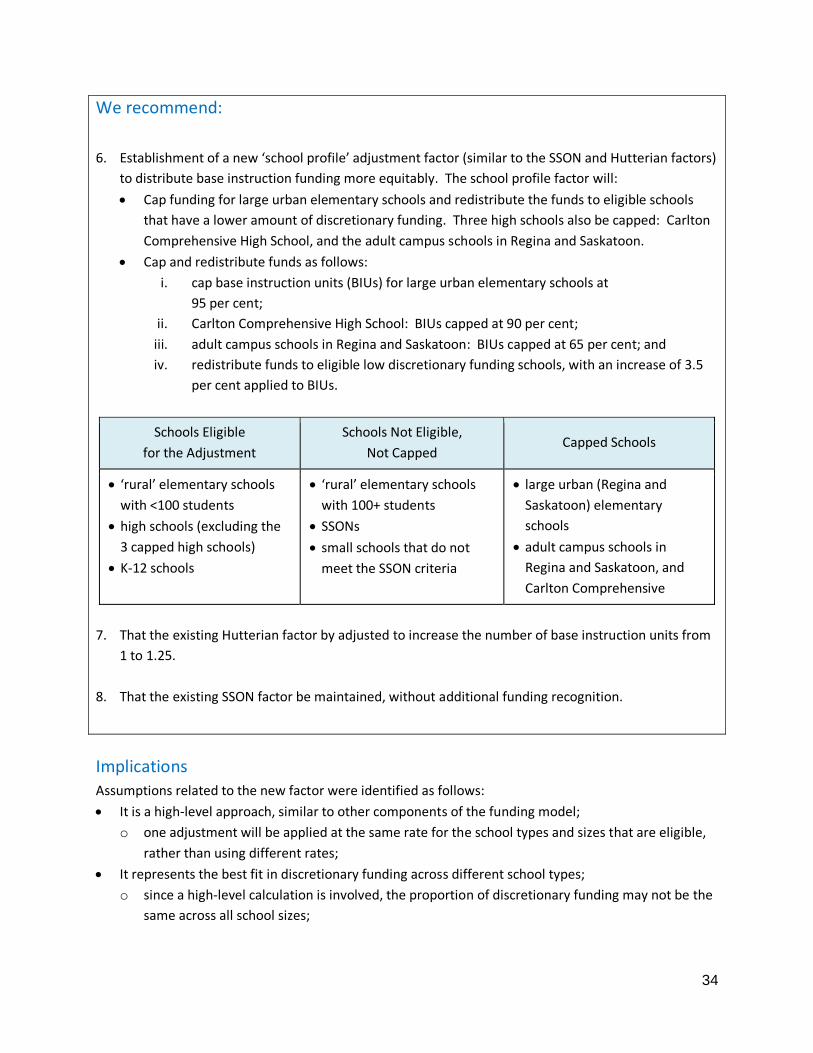
We recommend:
6. Establishment of a new ‘school profile’ adjustment factor (similar to the SSON and Hutterian factors)
to distribute base instruction funding more equitably. The school profile factor will:
Cap funding for large urban elementary schools and redistribute the funds to eligible schools
that have a lower amount of discretionary funding. Three high schools also be capped: Carlton
Comprehensive High School, and the adult campus schools in Regina and Saskatoon.
Cap and redistribute funds as follows:
i. cap base instruction units (BIUs) for large urban elementary schools at
95 per cent;
ii. Carlton Comprehensive High School: BIUs capped at 90 per cent;
iii. adult campus schools in Regina and Saskatoon: BIUs capped at 65 per cent; and
iv. redistribute funds to eligible low discretionary funding schools, with an increase of 3.5
per cent applied to BIUs.
Schools Eligible
for the Adjustment
Schools Not Eligible,
Not Capped Capped Schools
‘rural’ elementary schools
with <100 students
high schools (excluding the 3 capped high schools)
K‐12 schools
‘rural’ elementary schools
with 100+ students
SSONs small schools that do not
meet the SSON criteria
large urban (Regina and Saskatoon) elementary
schools
adult campus schools in
Regina and Saskatoon, and
Carlton Comprehensive
7. That the existing Hutterian factor by adjusted to increase the number of base instruction units from
1 to 1.25.
8. That the existing SSON factor be maintained, without additional funding recognition.
Implications Assumptions related to the new factor were identified as follows:
It is a high‐level approach, similar to other components of the funding model;
o one adjustment will be applied at the same rate for the school types and sizes that are eligible,
rather than using different rates;
It represents the best fit in discretionary funding across different school types;
o since a high‐level calculation is involved, the proportion of discretionary funding may not be the
same across all school sizes;
35
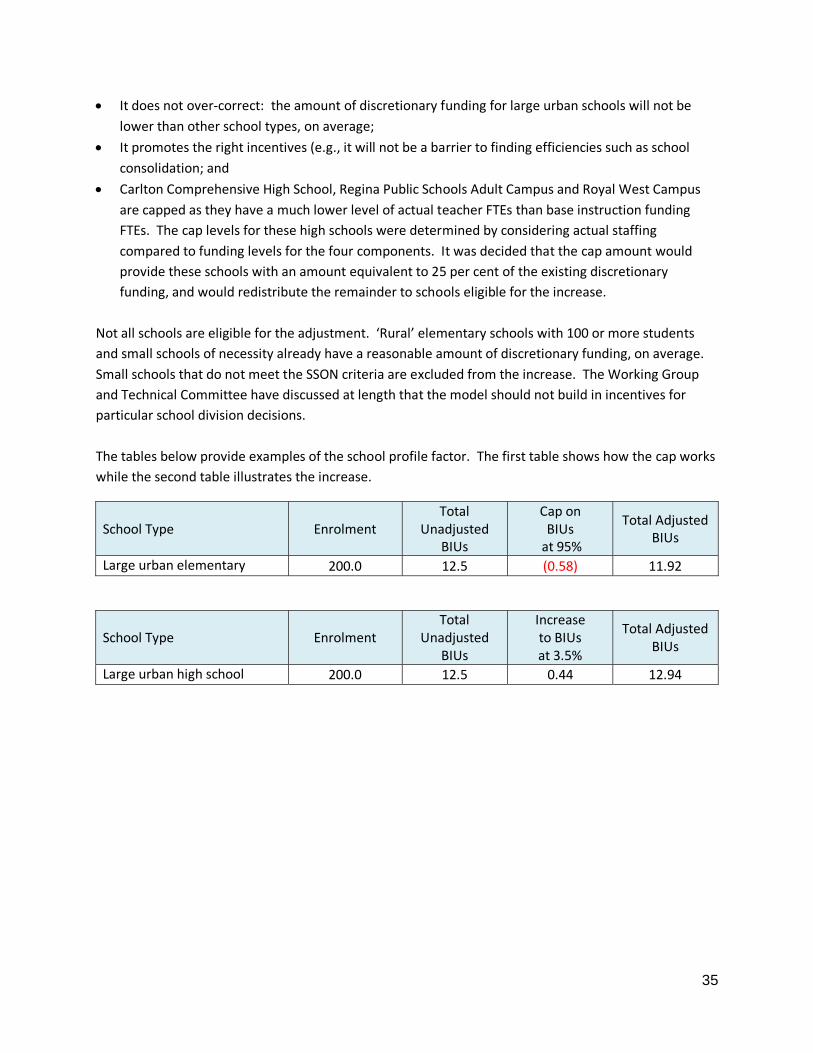
It does not over‐correct: the amount of discretionary funding for large urban schools will not be
lower than other school types, on average;
It promotes the right incentives (e.g., it will not be a barrier to finding efficiencies such as school
consolidation; and
Carlton Comprehensive High School, Regina Public Schools Adult Campus and Royal West Campus
are capped as they have a much lower level of actual teacher FTEs than base instruction funding
FTEs. The cap levels for these high schools were determined by considering actual staffing
compared to funding levels for the four components. It was decided that the cap amount would
provide these schools with an amount equivalent to 25 per cent of the existing discretionary
funding, and would redistribute the remainder to schools eligible for the increase.
Not all schools are eligible for the adjustment. ‘Rural’ elementary schools with 100 or more students
and small schools of necessity already have a reasonable amount of discretionary funding, on average.
Small schools that do not meet the SSON criteria are excluded from the increase. The Working Group
and Technical Committee have discussed at length that the model should not build in incentives for
particular school division decisions.
The tables below provide examples of the school profile factor. The first table shows how the cap works
while the second table illustrates the increase.
School Type Enrolment Total
Unadjusted BIUs
Cap on BIUs
at 95%
Total Adjusted BIUs
Large urban elementary 200.0 12.5 (0.58) 11.92
School Type Enrolment Total
Unadjusted BIUs
Increase to BIUs at 3.5%
Total Adjusted BIUs
Large urban high school 200.0 12.5 0.44 12.94
36
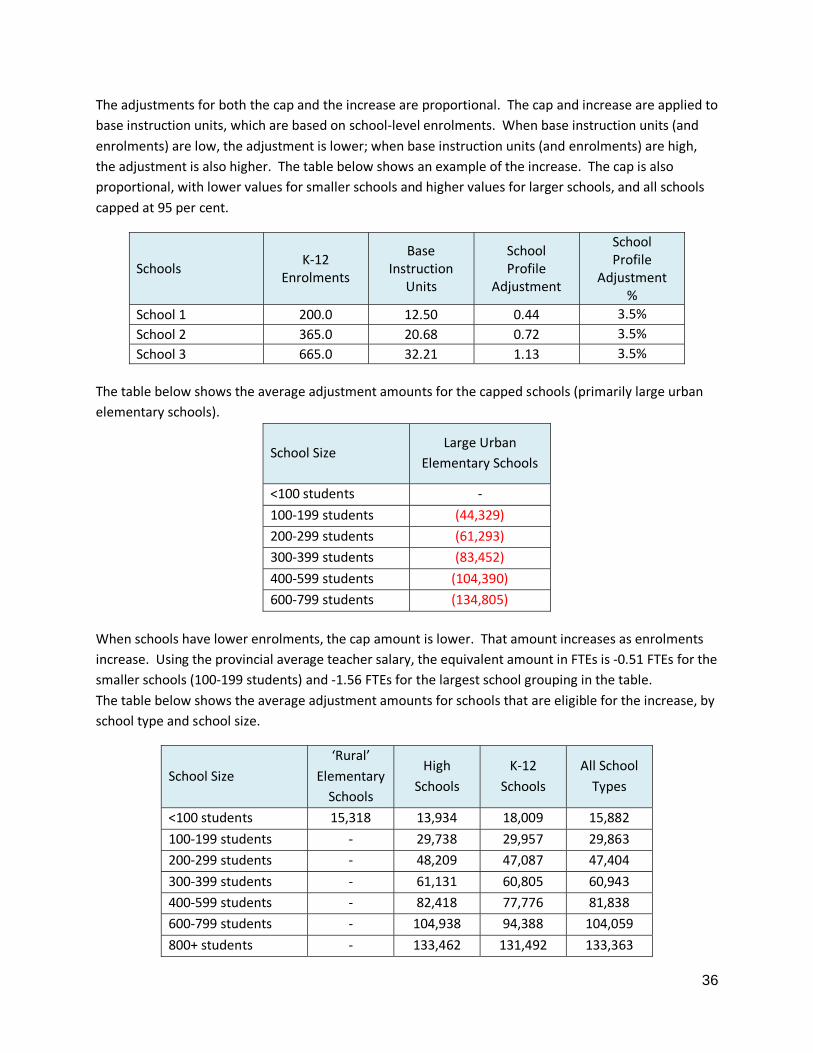
The adjustments for both the cap and the increase are proportional. The cap and increase are applied to
base instruction units, which are based on school‐level enrolments. When base instruction units (and
enrolments) are low, the adjustment is lower; when base instruction units (and enrolments) are high,
the adjustment is also higher. The table below shows an example of the increase. The cap is also
proportional, with lower values for smaller schools and higher values for larger schools, and all schools
capped at 95 per cent.
Schools K‐12
Enrolments
Base Instruction
Units
School Profile
Adjustment
School Profile
Adjustment %
School 1 200.0 12.50 0.44 3.5%
School 2 365.0 20.68 0.72 3.5%
School 3 665.0 32.21 1.13 3.5%
The table below shows the average adjustment amounts for the capped schools (primarily large urban
elementary schools).
School Size Large Urban
Elementary Schools
<100 students ‐
100‐199 students (44,329)
200‐299 students (61,293)
300‐399 students (83,452)
400‐599 students (104,390)
600‐799 students (134,805)
When schools have lower enrolments, the cap amount is lower. That amount increases as enrolments
increase. Using the provincial average teacher salary, the equivalent amount in FTEs is ‐0.51 FTEs for the
smaller schools (100‐199 students) and ‐1.56 FTEs for the largest school grouping in the table.
The table below shows the average adjustment amounts for schools that are eligible for the increase, by
school type and school size.
School Size
‘Rural’
Elementary
Schools
High
Schools
K‐12
Schools
All School
Types
<100 students 15,318 13,934 18,009 15,882
100‐199 students ‐ 29,738 29,957 29,863
200‐299 students ‐ 48,209 47,087 47,404
300‐399 students ‐ 61,131 60,805 60,943
400‐599 students ‐ 82,418 77,776 81,838
600‐799 students ‐ 104,938 94,388 104,059
800+ students ‐ 133,462 131,492 133,363
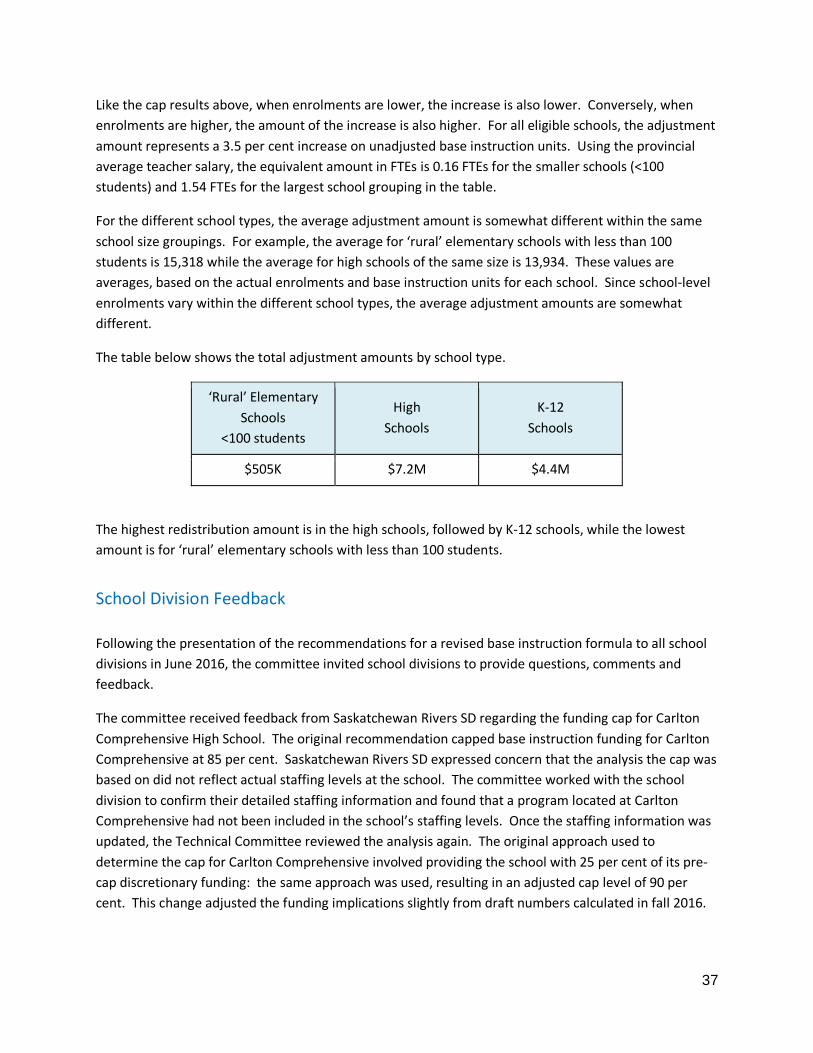
37
Like the cap results above, when enrolments are lower, the increase is also lower. Conversely, when
enrolments are higher, the amount of the increase is also higher. For all eligible schools, the adjustment
amount represents a 3.5 per cent increase on unadjusted base instruction units. Using the provincial
average teacher salary, the equivalent amount in FTEs is 0.16 FTEs for the smaller schools (<100
students) and 1.54 FTEs for the largest school grouping in the table.
For the different school types, the average adjustment amount is somewhat different within the same
school size groupings. For example, the average for ‘rural’ elementary schools with less than 100
students is 15,318 while the average for high schools of the same size is 13,934. These values are
averages, based on the actual enrolments and base instruction units for each school. Since school‐level
enrolments vary within the different school types, the average adjustment amounts are somewhat
different.
The table below shows the total adjustment amounts by school type.
‘Rural’ Elementary
Schools
<100 students
High
Schools
K‐12
Schools
$505K $7.2M $4.4M
The highest redistribution amount is in the high schools, followed by K‐12 schools, while the lowest
amount is for ‘rural’ elementary schools with less than 100 students.
School Division Feedback
Following the presentation of the recommendations for a revised base instruction formula to all school
divisions in June 2016, the committee invited school divisions to provide questions, comments and
feedback.
The committee received feedback from Saskatchewan Rivers SD regarding the funding cap for Carlton
Comprehensive High School. The original recommendation capped base instruction funding for Carlton
Comprehensive at 85 per cent. Saskatchewan Rivers SD expressed concern that the analysis the cap was
based on did not reflect actual staffing levels at the school. The committee worked with the school
division to confirm their detailed staffing information and found that a program located at Carlton
Comprehensive had not been included in the school’s staffing levels. Once the staffing information was
updated, the Technical Committee reviewed the analysis again. The original approach used to
determine the cap for Carlton Comprehensive involved providing the school with 25 per cent of its pre‐
cap discretionary funding: the same approach was used, resulting in an adjusted cap level of 90 per
cent. This change adjusted the funding implications slightly from draft numbers calculated in fall 2016.

38
The committee also received a joint letter from Regina SD, Regina RCSSD, Saskatoon SD, and St. Paul’s
RCSSD in October 2016 expressing concerns about the proposed base instruction changes. The concerns
raised by the four divisions related to:
the process, roles, and responsibilities of the Technical Committee;
the analysis and recommendations are inconsistent with the funding model’s principle of
unconditionality;
all schools operating in urban centres (including those outside Regina and Saskatoon) should be
included in the proposed school profile factor cap;
the proposed changes penalize large urban divisions for closing schools;
per‐student funding is lower in large urban school divisions than in rural areas; and
concerns around implementation of the proposed changes, including requests to receive transition
funding and defer implementation because of transformational change and uncertainty related to
Locally Determined Terms and Conditions.
The Technical Committee discussed these concerns and considered whether the base instruction
recommendation should be adjusted. A subset of the Technical Committee discussed the concerns
listed above with the four large urban school divisions in November 2016. A letter was subsequently
provided to Regina SD, Regina RCSSD, Saskatoon SD, and St. Paul’s RCSSD with the Technical
Committee’s response. That response is included as an appendix. The committee ultimately
determined that it will continue with the recommendations for base instruction that were presented to
school divisions in September 2016.
Impact The impact of the proposed recommendations regarding base instruction follow, and are also displayed
in concert with all review recommendations in the Concurrent Analysis section of this report. The
comparison shows funding changes using the proposed formula as compared to what school divisions
received under the existing formula in 2016‐17. Funding shifts range from ($2.95 million) to $1.04
million.
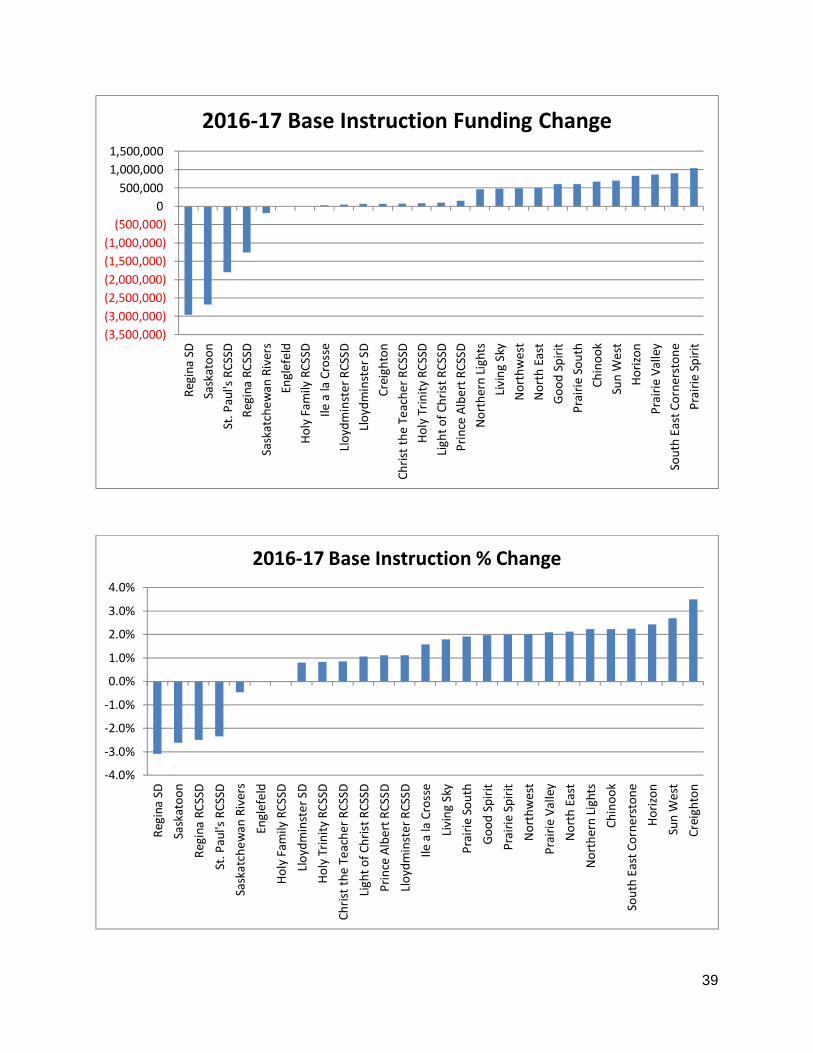
39
(3,500,000)
(3,000,000)
(2,500,000)
(2,000,000)
(1,500,000)
(1,000,000)
(500,000)
0
500,000
1,000,000
1,500,000
Regina SD
Saskatoon
St. Paul's RCSSD
Regina RCSSD
Saskatchewan
Rivers
Englefeld
Holy Fam
ily RCSSD
Ile a la Crosse
Lloydminster RCSSD
Lloydminster SD
Creighton
Christ the Teacher RCSSD
Holy Trinity RCSSD
Light of Christ RCSSD
Prince Albert RCSSD
Northern Lights
Living Sky
Northwest
North East
Good Spirit
Prairie South
Chinook
Sun W
est
Horizon
Prairie Valley
South East Cornerstone
Prairie Spirit
2016‐17 Base Instruction Funding Change
‐4.0%
‐3.0%
‐2.0%
‐1.0%
0.0%
1.0%
2.0%
3.0%
4.0%
Regina SD
Saskatoon
Regina RCSSD
St. Paul's RCSSD
Saskatchewan
Rivers
Englefeld
Holy Fam
ily RCSSD
Lloydminster SD
Holy Trinity RCSSD
Christ the Teacher RCSSD
Light of Christ RCSSD
Prince Albert RCSSD
Lloydminster RCSSD
Ile a la Crosse
Living Sky
Prairie South
Good Spirit
Prairie Spirit
Northwest
Prairie Valley
North East
Northern Lights
Chinook
South East Cornerstone
Horizon
Sun W
est
Creighton
2016‐17 Base Instruction % Change
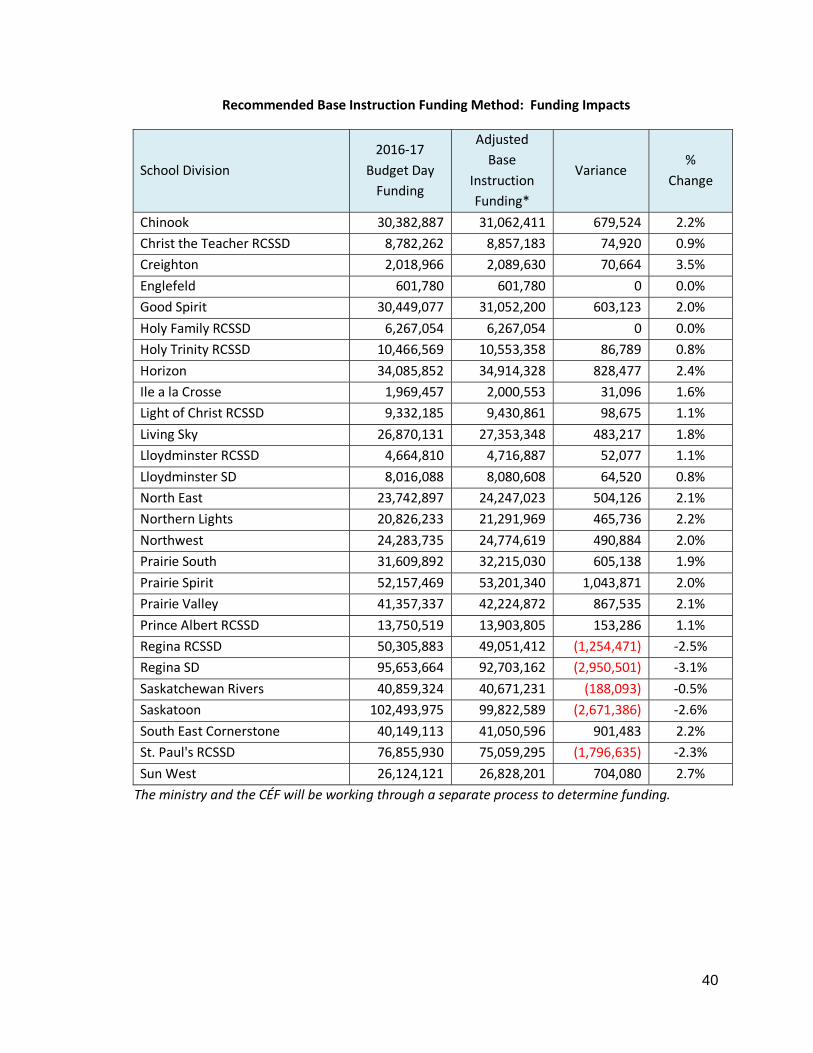
40
Recommended Base Instruction Funding Method: Funding Impacts
School Division
2016‐17
Budget Day
Funding
Adjusted
Base
Instruction
Funding*
Variance %
Change
Chinook 30,382,887 31,062,411 679,524 2.2%
Christ the Teacher RCSSD 8,782,262 8,857,183 74,920 0.9%
Creighton 2,018,966 2,089,630 70,664 3.5%
Englefeld 601,780 601,780 0 0.0%
Good Spirit 30,449,077 31,052,200 603,123 2.0%
Holy Family RCSSD 6,267,054 6,267,054 0 0.0%
Holy Trinity RCSSD 10,466,569 10,553,358 86,789 0.8%
Horizon 34,085,852 34,914,328 828,477 2.4%
Ile a la Crosse 1,969,457 2,000,553 31,096 1.6%
Light of Christ RCSSD 9,332,185 9,430,861 98,675 1.1%
Living Sky 26,870,131 27,353,348 483,217 1.8%
Lloydminster RCSSD 4,664,810 4,716,887 52,077 1.1%
Lloydminster SD 8,016,088 8,080,608 64,520 0.8%
North East 23,742,897 24,247,023 504,126 2.1%
Northern Lights 20,826,233 21,291,969 465,736 2.2%
Northwest 24,283,735 24,774,619 490,884 2.0%
Prairie South 31,609,892 32,215,030 605,138 1.9%
Prairie Spirit 52,157,469 53,201,340 1,043,871 2.0%
Prairie Valley 41,357,337 42,224,872 867,535 2.1%
Prince Albert RCSSD 13,750,519 13,903,805 153,286 1.1%
Regina RCSSD 50,305,883 49,051,412 (1,254,471) ‐2.5%
Regina SD 95,653,664 92,703,162 (2,950,501) ‐3.1%
Saskatchewan Rivers 40,859,324 40,671,231 (188,093) ‐0.5%
Saskatoon 102,493,975 99,822,589 (2,671,386) ‐2.6%
South East Cornerstone 40,149,113 41,050,596 901,483 2.2%
St. Paul's RCSSD 76,855,930 75,059,295 (1,796,635) ‐2.3%
Sun West 26,124,121 26,828,201 704,080 2.7%
The ministry and the CÉF will be working through a separate process to determine funding.
41
Enrolment Counts for Graduated Students
Issue Concerns were expressed that graduated students that return to attend school receive the same
recognition in the funding model as a full‐time student. The 2011‐12 to 2014‐15 four‐year
average of secondary students shows 834 students graduated from high school the previous year
and subsequently enrolled in Grade 12. Of these, 74 per cent registered in less than three courses
per year (excludes students enrolled in on‐line courses).
Option On average, graduated students are taking only a partial course‐load while their school division
receives full recognition for them through the model. There is an option to recognize graduated
students as a partial FTE (0.25 FTE) rather than as a full FTE (1.0 FTE). This would more accurately
reflect student FTEs across the province and would redistribute approximately $3.1 million within
the funding model.
A “graduated” student is calculated in the Student Data System after a student meets all the
requirements for their program. The requirements for the different programs are in the
Registrar’s Handbook which is available online at
https://www.saskatchewan.ca/government/government‐structure/ministries/education. The
funding policy for graduated students uses a field in the Student Data System which shows the
date the student met all the requirements for their program. The policy does not replicate the
calculation or try to estimate when students achieve their program requirements. Below are
some examples of how returning students would be counted in the policy.
Example 1: A student is changing programs from French Immersion to Regular English. At the
end of the Grade 12 year, the student may have 30 credits but be missing an English class. When
returning the following year, the student would not be considered a returning graduate. The
student would take the missing English class and be counted as a full FTE.
Example 2: A student met all of the requirements for Adult 12, but is missing the science classes
needed to get into a desired post‐secondary program. The student would return the following
year to take the missing science classes and be counted as 0.25 FTE.
Example 3: A student met all the requirements for the Regular English Program but the student’s
grades were not high enough to be accepted into university. The student would return to try to
achieve higher grades and would be counted as 0.25 FTE.
Example 4: A student meets all the requirements for the Regular English Program after the first
semester in grade 12 and continues to earn credits in the second semester (the first and second
semesters are in the same school year). The policy only applies to students who graduated in a
previous year. The student would be counted as a full FTE for the entire school year.
42
We recommend: 9. That graduated students returning to school be recognized as 0.25 of an FTE rather than 1.0. 10. That savings which result be re‐distributed within the base instruction component of the
model.
First Nations and Métis Education Achievement Fund
Issue First Nations and Métis children are not explicitly recognized in the funding formula. Rather, the
model provides funding for vulnerable students based on socioeconomic indicators such as low
income. Outside the model, a $3.8 million First Nations and Métis Education Achievement Fund is
available on a conditional basis to school divisions for culturally responsive instructional practices.
First Nations and Métis student achievement is a primary area of focus within the Education
Sector Strategic Plan (ESSP) and some school divisions are concerned that it is dissociated from
the broader planning and funding process.
Option Discussion with school divisions reveals general support for moving the First Nations and Métis
Education Achievement Fund into the funding distribution model to improve planning and
funding processes, and ensure a connection to the ESSP. This would not shift the distribution of
funds from how they are currently allocated.
We recommend: 11. That the First Nations and Métis Education Achievement Fund be moved into the instruction
component of the Funding Distribution Model as a standalone line for culturally responsive teaching practice.
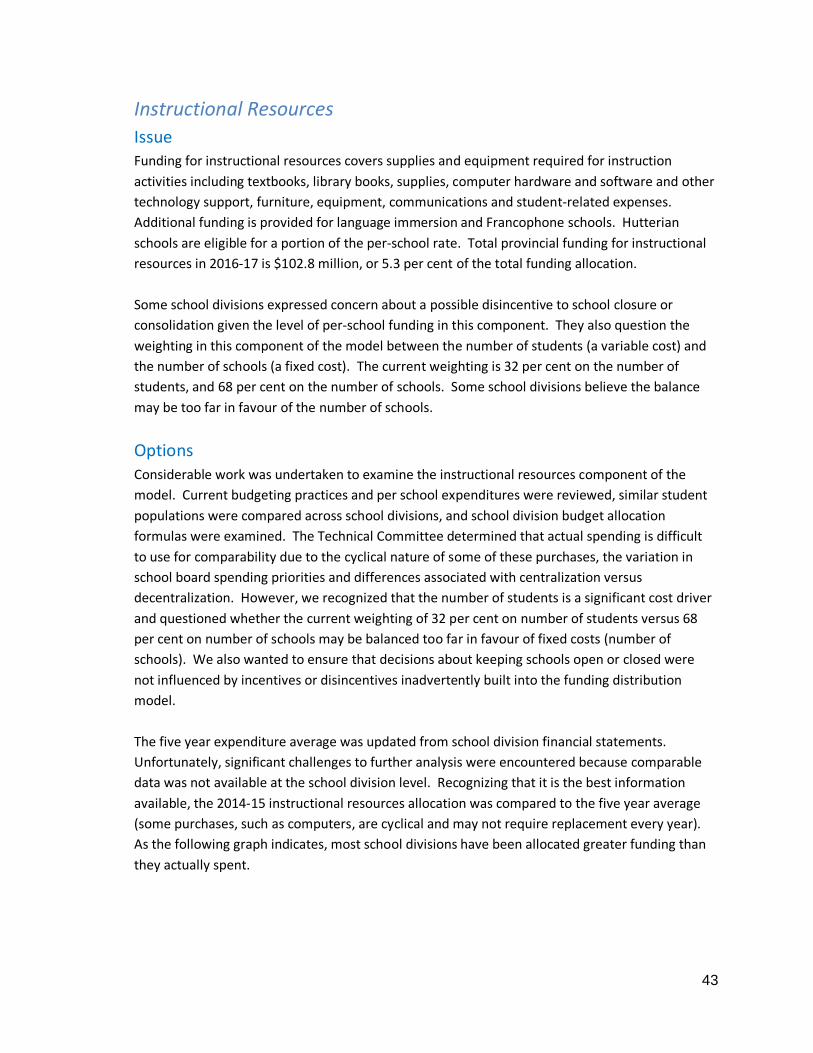
43
Instructional Resources
Issue Funding for instructional resources covers supplies and equipment required for instruction
activities including textbooks, library books, supplies, computer hardware and software and other
technology support, furniture, equipment, communications and student‐related expenses.
Additional funding is provided for language immersion and Francophone schools. Hutterian
schools are eligible for a portion of the per‐school rate. Total provincial funding for instructional
resources in 2016‐17 is $102.8 million, or 5.3 per cent of the total funding allocation.
Some school divisions expressed concern about a possible disincentive to school closure or
consolidation given the level of per‐school funding in this component. They also question the
weighting in this component of the model between the number of students (a variable cost) and
the number of schools (a fixed cost). The current weighting is 32 per cent on the number of
students, and 68 per cent on the number of schools. Some school divisions believe the balance
may be too far in favour of the number of schools.
Options Considerable work was undertaken to examine the instructional resources component of the
model. Current budgeting practices and per school expenditures were reviewed, similar student
populations were compared across school divisions, and school division budget allocation
formulas were examined. The Technical Committee determined that actual spending is difficult
to use for comparability due to the cyclical nature of some of these purchases, the variation in
school board spending priorities and differences associated with centralization versus
decentralization. However, we recognized that the number of students is a significant cost driver
and questioned whether the current weighting of 32 per cent on number of students versus 68
per cent on number of schools may be balanced too far in favour of fixed costs (number of
schools). We also wanted to ensure that decisions about keeping schools open or closed were
not influenced by incentives or disincentives inadvertently built into the funding distribution
model.
The five year expenditure average was updated from school division financial statements.
Unfortunately, significant challenges to further analysis were encountered because comparable
data was not available at the school division level. Recognizing that it is the best information
available, the 2014‐15 instructional resources allocation was compared to the five year average
(some purchases, such as computers, are cyclical and may not require replacement every year).
As the following graph indicates, most school divisions have been allocated greater funding than
they actually spent.
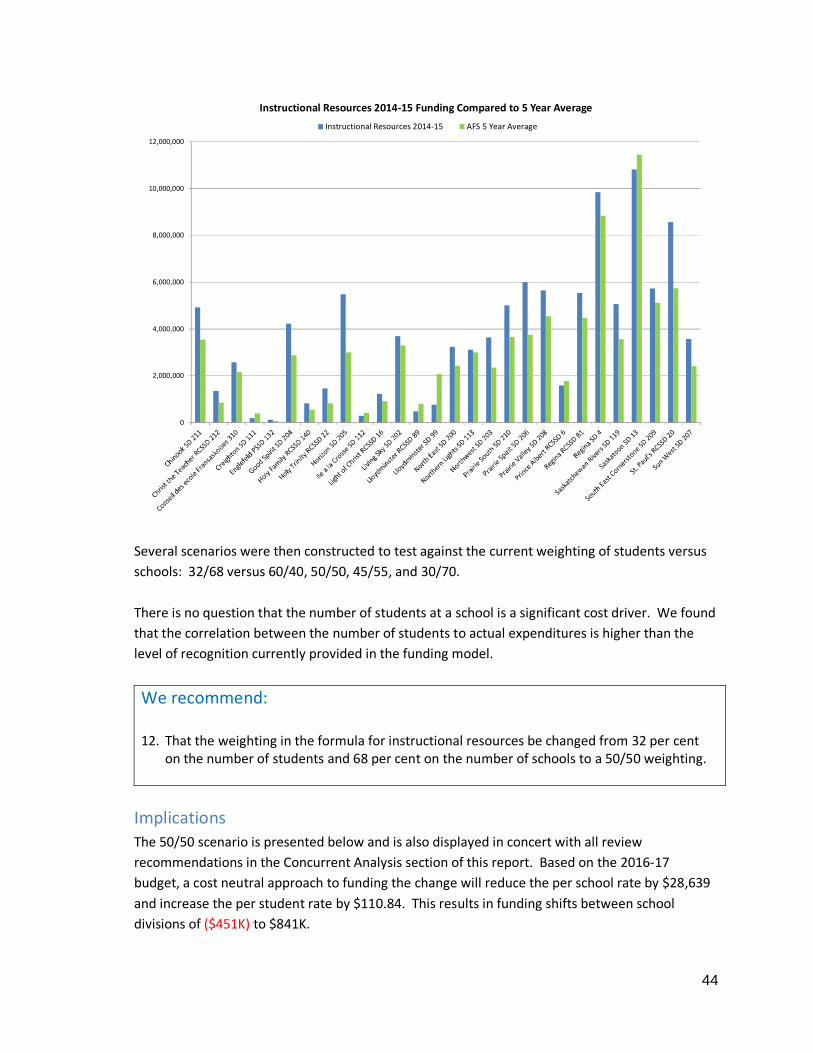
44
Several scenarios were then constructed to test against the current weighting of students versus
schools: 32/68 versus 60/40, 50/50, 45/55, and 30/70.
There is no question that the number of students at a school is a significant cost driver. We found
that the correlation between the number of students to actual expenditures is higher than the
level of recognition currently provided in the funding model.
We recommend: 12. That the weighting in the formula for instructional resources be changed from 32 per cent
on the number of students and 68 per cent on the number of schools to a 50/50 weighting.
Implications The 50/50 scenario is presented below and is also displayed in concert with all review
recommendations in the Concurrent Analysis section of this report. Based on the 2016‐17
budget, a cost neutral approach to funding the change will reduce the per school rate by $28,639
and increase the per student rate by $110.84. This results in funding shifts between school
divisions of ($451K) to $841K.
0
2,000,000
4,000,000
6,000,000
8,000,000
10,000,000
12,000,000
Instructional Resources 2014‐15 Funding Compared to 5 Year Average
Instructional Resources 2014‐15 AFS 5 Year Average
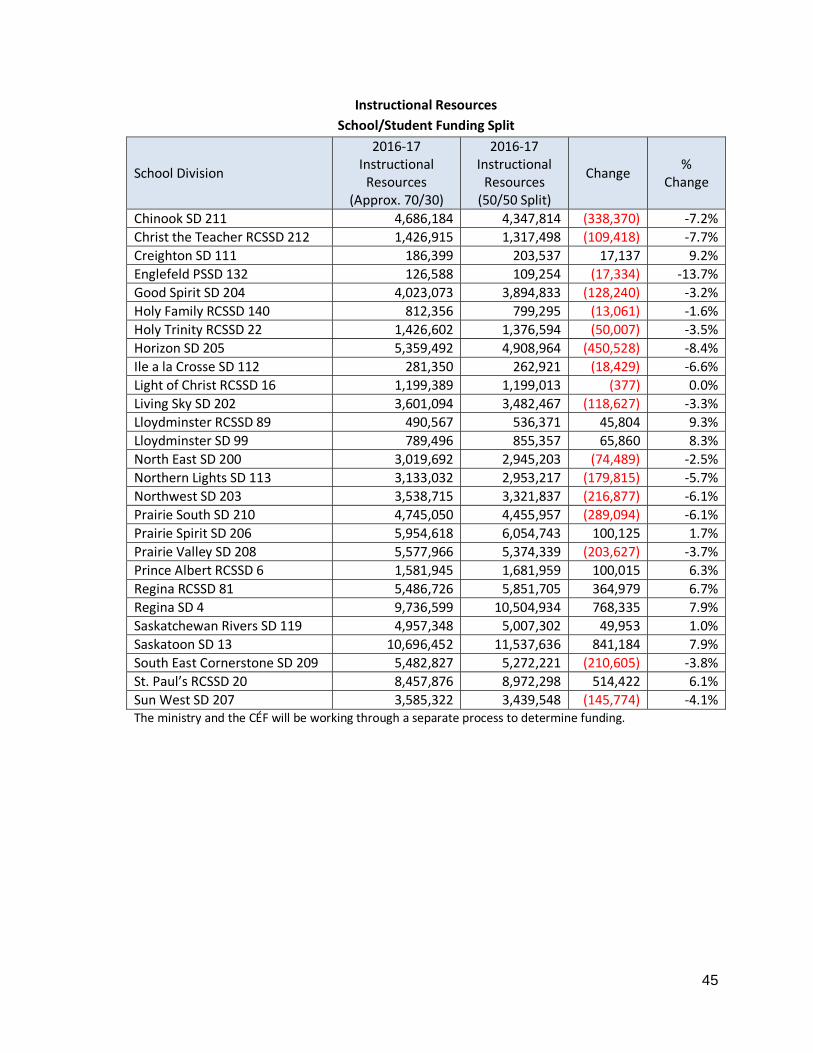
45
Instructional Resources
School/Student Funding Split
School Division
2016‐17 Instructional Resources
(Approx. 70/30)
2016‐17 Instructional Resources (50/50 Split)
Change %
Change
Chinook SD 211 4,686,184 4,347,814 (338,370) ‐7.2%
Christ the Teacher RCSSD 212 1,426,915 1,317,498 (109,418) ‐7.7%
Creighton SD 111 186,399 203,537 17,137 9.2%
Englefeld PSSD 132 126,588 109,254 (17,334) ‐13.7%
Good Spirit SD 204 4,023,073 3,894,833 (128,240) ‐3.2%
Holy Family RCSSD 140 812,356 799,295 (13,061) ‐1.6%
Holy Trinity RCSSD 22 1,426,602 1,376,594 (50,007) ‐3.5%
Horizon SD 205 5,359,492 4,908,964 (450,528) ‐8.4%
Ile a la Crosse SD 112 281,350 262,921 (18,429) ‐6.6%
Light of Christ RCSSD 16 1,199,389 1,199,013 (377) 0.0%
Living Sky SD 202 3,601,094 3,482,467 (118,627) ‐3.3%
Lloydminster RCSSD 89 490,567 536,371 45,804 9.3%
Lloydminster SD 99 789,496 855,357 65,860 8.3%
North East SD 200 3,019,692 2,945,203 (74,489) ‐2.5%
Northern Lights SD 113 3,133,032 2,953,217 (179,815) ‐5.7%
Northwest SD 203 3,538,715 3,321,837 (216,877) ‐6.1%
Prairie South SD 210 4,745,050 4,455,957 (289,094) ‐6.1%
Prairie Spirit SD 206 5,954,618 6,054,743 100,125 1.7%
Prairie Valley SD 208 5,577,966 5,374,339 (203,627) ‐3.7%
Prince Albert RCSSD 6 1,581,945 1,681,959 100,015 6.3%
Regina RCSSD 81 5,486,726 5,851,705 364,979 6.7%
Regina SD 4 9,736,599 10,504,934 768,335 7.9%
Saskatchewan Rivers SD 119 4,957,348 5,007,302 49,953 1.0%
Saskatoon SD 13 10,696,452 11,537,636 841,184 7.9%
South East Cornerstone SD 209 5,482,827 5,272,221 (210,605) ‐3.8%
St. Paul’s RCSSD 20 8,457,876 8,972,298 514,422 6.1%
Sun West SD 207 3,585,322 3,439,548 (145,774) ‐4.1% The ministry and the CÉF will be working through a separate process to determine funding.
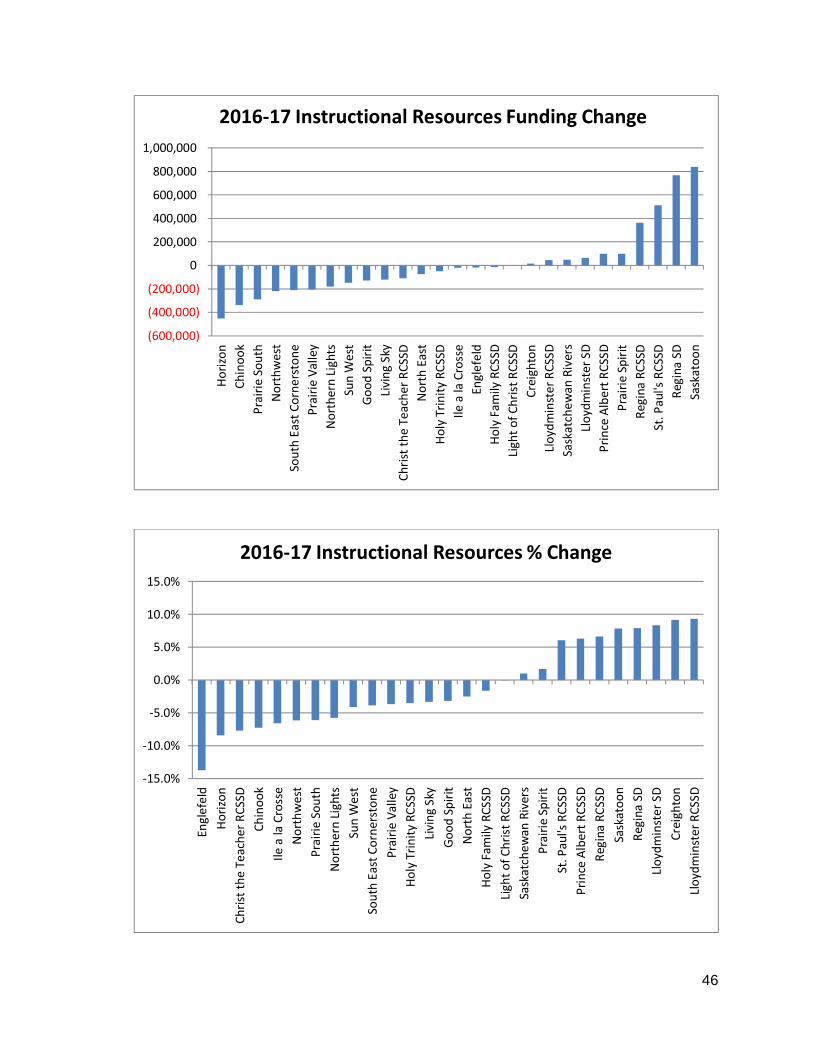
46
(600,000)
(400,000)
(200,000)
0
200,000
400,000
600,000
800,000
1,000,000
Horizon
Chinook
Prairie South
Northwest
South East Cornerstone
Prairie Valley
Northern Lights
Sun W
est
Good Spirit
Living Sky
Christ the Teacher RCSSD
North East
Holy Trinity RCSSD
Ile a la Crosse
Englefeld
Holy Fam
ily RCSSD
Light of Christ RCSSD
Creighton
Lloydminster RCSSD
Saskatchewan
Rivers
Lloydminster SD
Prince Albert RCSSD
Prairie Spirit
Regina RCSSD
St. Paul's RCSSD
Regina SD
Saskatoon
2016‐17 Instructional Resources Funding Change
‐15.0%
‐10.0%
‐5.0%
0.0%
5.0%
10.0%
15.0%
Englefeld
Horizon
Christ the Teacher RCSSD
Chinook
Ile a la Crosse
Northwest
Prairie South
Northern Lights
Sun W
est
South East Cornerstone
Prairie Valley
Holy Trinity RCSSD
Living Sky
Good Spirit
North East
Holy Fam
ily RCSSD
Light of Christ RCSSD
Saskatchewan
Rivers
Prairie Spirit
St. Paul's RCSSD
Prince Albert RCSSD
Regina RCSSD
Saskatoon
Regina SD
Lloydminster SD
Creighton
Lloydminster RCSSD
2016‐17 Instructional Resources % Change
47
Plant Operations and Maintenance
Issue The funding allocation for plant operations and maintenance is to address operating costs for
schools, and for maintaining school grounds, storage facilities, maintenance workshops and
warehouses. Not included in this component of the model are building operating costs for
administration and transportation, or costs for preventative maintenance and renewal, and major
capital. Total provincial funding allocated for plant operation and maintenance in 2016‐17 is
$209.9 million, or 10.9 per cent of the total provincial funding recognition.
The major area of concern identified by school divisions regarding plant operations is school
utilization. Particularly in rural school divisions, there is a high prevalence of under‐utilized
schools (although in many small communities, schools are used for broader community
purposes). As well, 21 per cent of the 700 schools across the province have utilization in excess of
115 per cent. Some school divisions indicate this leads to additional caretaking and maintenance
costs which are not provided for in the funding model.
Options Since April 2015, a Utilization Review Working Group has been examining options for changes to
the calculation of school utilization. The result of their work is not expected until 2017, and it
could impact Plant Operation and Maintenance funding. In the meantime, the Technical
Committee recognizes that there are additional costs for caretaking and maintenance in over‐
utilized schools. A cost‐neutral option was developed to reduce recognition for under‐utilized
space and add recognition for over‐utilization.
We Recommend: 13. That the funding model be adjusted to provide additional recognition for caretaking and
maintenance costs associated with over‐utilized schools (from 0 per cent currently, to up to 20 per cent), and to reduce recognition for underutilized schools (from 80 per cent to 71 per cent).
Implications The implications of adjusting the model to fund over‐utilized space at an additional 20 per cent
are presented below and are also displayed in concert with all review recommendations in the
Concurrent Analysis section of this report. To maintain a cost neutral approach, under‐utilized
space would be recognized at 71 per cent, a drop from 80 per cent in the current model. Funding
shifts between school divisions range from ($177K) to $275K.
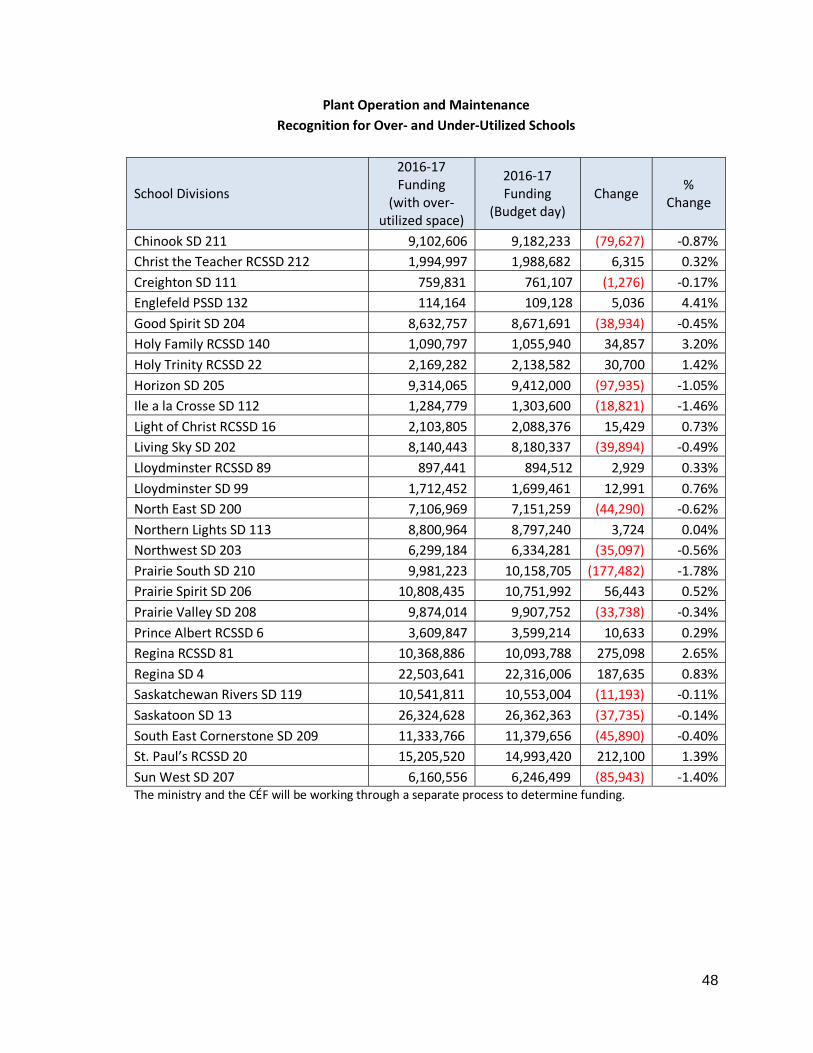
48
Plant Operation and Maintenance
Recognition for Over‐ and Under‐Utilized Schools
School Divisions
2016‐17 Funding
(with over‐utilized space)
2016‐17 Funding
(Budget day) Change
% Change
Chinook SD 211 9,102,606 9,182,233 (79,627) ‐0.87%
Christ the Teacher RCSSD 212 1,994,997 1,988,682 6,315 0.32%
Creighton SD 111 759,831 761,107 (1,276) ‐0.17%
Englefeld PSSD 132 114,164 109,128 5,036 4.41%
Good Spirit SD 204 8,632,757 8,671,691 (38,934) ‐0.45%
Holy Family RCSSD 140 1,090,797 1,055,940 34,857 3.20%
Holy Trinity RCSSD 22 2,169,282 2,138,582 30,700 1.42%
Horizon SD 205 9,314,065 9,412,000 (97,935) ‐1.05%
Ile a la Crosse SD 112 1,284,779 1,303,600 (18,821) ‐1.46%
Light of Christ RCSSD 16 2,103,805 2,088,376 15,429 0.73%
Living Sky SD 202 8,140,443 8,180,337 (39,894) ‐0.49%
Lloydminster RCSSD 89 897,441 894,512 2,929 0.33%
Lloydminster SD 99 1,712,452 1,699,461 12,991 0.76%
North East SD 200 7,106,969 7,151,259 (44,290) ‐0.62%
Northern Lights SD 113 8,800,964 8,797,240 3,724 0.04%
Northwest SD 203 6,299,184 6,334,281 (35,097) ‐0.56%
Prairie South SD 210 9,981,223 10,158,705 (177,482) ‐1.78%
Prairie Spirit SD 206 10,808,435 10,751,992 56,443 0.52%
Prairie Valley SD 208 9,874,014 9,907,752 (33,738) ‐0.34%
Prince Albert RCSSD 6 3,609,847 3,599,214 10,633 0.29%
Regina RCSSD 81 10,368,886 10,093,788 275,098 2.65%
Regina SD 4 22,503,641 22,316,006 187,635 0.83%
Saskatchewan Rivers SD 119 10,541,811 10,553,004 (11,193) ‐0.11%
Saskatoon SD 13 26,324,628 26,362,363 (37,735) ‐0.14%
South East Cornerstone SD 209 11,333,766 11,379,656 (45,890) ‐0.40%
St. Paul’s RCSSD 20 15,205,520 14,993,420 212,100 1.39%
Sun West SD 207 6,160,556 6,246,499 (85,943) ‐1.40% The ministry and the CÉF will be working through a separate process to determine funding.
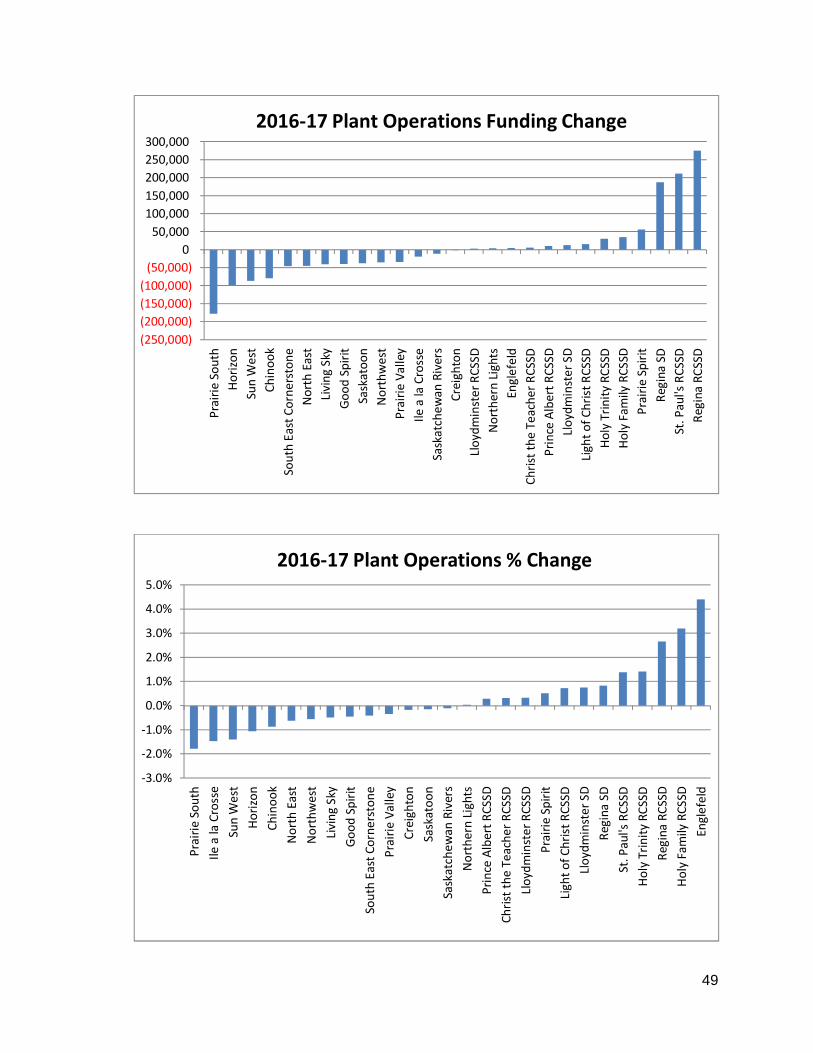
49
(250,000)
(200,000)
(150,000)
(100,000)
(50,000)
0
50,000
100,000
150,000
200,000
250,000
300,000
Prairie South
Horizon
Sun W
est
Chinook
South East Cornerstone
North East
Living Sky
Good Spirit
Saskatoon
Northwest
Prairie Valley
Ile a la Crosse
Saskatchewan
Rivers
Creighton
Lloydminster RCSSD
Northern Lights
Englefeld
Christ the Teacher RCSSD
Prince Albert RCSSD
Lloydminster SD
Light of Christ RCSSD
Holy Trinity RCSSD
Holy Fam
ily RCSSD
Prairie Spirit
Regina SD
St. Paul's RCSSD
Regina RCSSD
2016‐17 Plant Operations Funding Change
‐3.0%
‐2.0%
‐1.0%
0.0%
1.0%
2.0%
3.0%
4.0%
5.0%
Prairie South
Ile a la Crosse
Sun W
est
Horizon
Chinook
North East
Northwest
Living Sky
Good Spirit
South East Cornerstone
Prairie Valley
Creighton
Saskatoon
Saskatchewan
Rivers
Northern Lights
Prince Albert RCSSD
Christ the Teacher RCSSD
Lloydminster RCSSD
Prairie Spirit
Light of Christ RCSSD
Lloydminster SD
Regina SD
St. Paul's RCSSD
Holy Trinity RCSSD
Regina RCSSD
Holy Fam
ily RCSSD
Englefeld
2016‐17 Plant Operations % Change
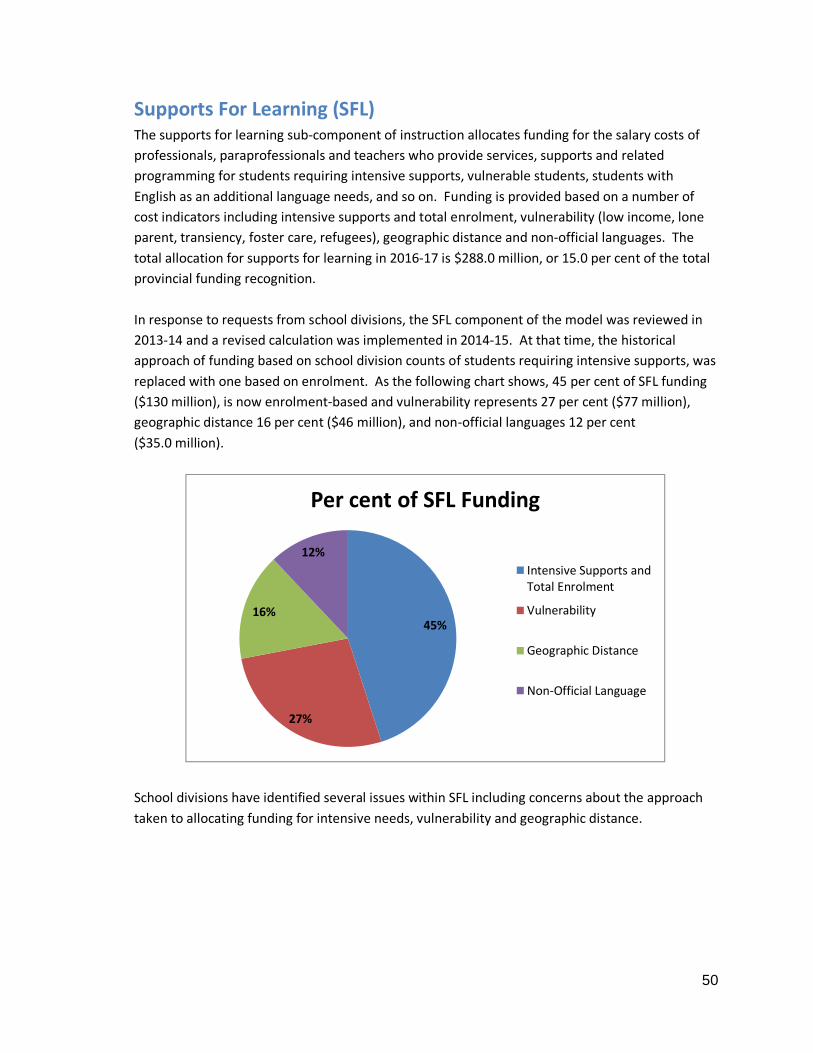
50
Supports For Learning (SFL) The supports for learning sub‐component of instruction allocates funding for the salary costs of
professionals, paraprofessionals and teachers who provide services, supports and related
programming for students requiring intensive supports, vulnerable students, students with
English as an additional language needs, and so on. Funding is provided based on a number of
cost indicators including intensive supports and total enrolment, vulnerability (low income, lone
parent, transiency, foster care, refugees), geographic distance and non‐official languages. The
total allocation for supports for learning in 2016‐17 is $288.0 million, or 15.0 per cent of the total
provincial funding recognition.
In response to requests from school divisions, the SFL component of the model was reviewed in
2013‐14 and a revised calculation was implemented in 2014‐15. At that time, the historical
approach of funding based on school division counts of students requiring intensive supports, was
replaced with one based on enrolment. As the following chart shows, 45 per cent of SFL funding
($130 million), is now enrolment‐based and vulnerability represents 27 per cent ($77 million),
geographic distance 16 per cent ($46 million), and non‐official languages 12 per cent
($35.0 million).
School divisions have identified several issues within SFL including concerns about the approach
taken to allocating funding for intensive needs, vulnerability and geographic distance.
45%
27%
16%
12%
Per cent of SFL Funding
Intensive Supports andTotal Enrolment
Vulnerability
Geographic Distance
Non‐Official Language
51
Students Requiring Intensive Supports
Issue The enrolment‐based approach adopted in 2014‐15 included an assumption that there is an equal
distribution of students requiring intensive supports across all school divisions. Some school
divisions are concerned that this does not appropriately capture the student population with
intensive needs in urban centres. They believe families of children requiring intensive supports
are more inclined to move to large cities where they can access specialized supports. As a result,
they believe these children to be disproportionately represented in urban centres and do not
believe the formula appropriately funds the need.
Action The Technical Committee reached out to the Saskatoon Health Region to explore the availability
of data regarding prevalence rates for children with intensive needs in urban versus rural parts of
the province. Unfortunately, data is not available and little is known about the distribution of
children with intensive needed across the province. Agreement has been reached to explore this
area further as additional data becomes available and, in the meantime, the Technical Committee
has concluded that the existing approach is based on the best information available.
Vulnerability
Issue The SFL component of the model uses a population health approach to capture student
vulnerability which typically results in a need for higher levels of supports and services for
students. When viewed in combination with one another, population indicators accumulate and
can reflect increasing levels of vulnerable circumstances for students. Some school divisions
express concern about the validity of data sources used to capture student vulnerability.
Action The Technical Committee completely reviewed all of the following data sources and concluded
the approach to capturing student vulnerability is rigorous and appropriate:
Social Services’ low income data including the Saskatchewan Assistance Plan, Saskatchewan
Assured Income for Disability Program, Saskatchewan Employment Supplement, Transitional
Employment Allowance and the Saskatchewan Housing Supplement;
Data from Indigenous and Northern Affairs Canada (INAC) regarding dependency rates on‐
reserve and applied to the Non‐Instructional Personnel and Administration (NIPA) counts
reported by school division;
Census data regarding lone parent status;
Student Data System (SDS) information regarding transiency;
Foster care data; and
Student refugee counts.

52
Geographic Distance
Issue Some school divisions express concerns about the geographic distance factor in the SFL
component of the funding model. A primary concern is that it focuses too heavily on the number
of schools (fixed costs), without adequately recognizing the importance of the number of students
in each school as a determinant of services and, therefore, costs. Several key issues related to
geographic distance have been identified:
Some divisions are more dispersed geographically than others [i.e., some have a higher
number of kilometers (kms) to travel overall than others];
Multiple trips to and from a school are required when enrolments are high;
There is less opportunity for efficiency in providing services to small schools since contact
time is spent behind a windshield travelling to the next school, rather than with students
providing services;
Small schools have lower internal capacity, therefore requiring more itinerant SFL supports;
and
There is increased efficiency related to geographic distance when there are two or more
schools within a community.
Questions have also been raised about the cost of Hutterian schools and whether school divisions
with a large number of these schools are receiving a disproportionate funding allocation. There
are 68 hutterian schools across the province located in ten of the twenty‐eight school divisions:
Chinook has 29, Sun West has 15, Prairie Spirit has 9 and the other 7 school divisions have 5 or
fewer.
Providing funding recognition for the costs associated with a geographically dispersed student
population is premised on the belief that all Saskatchewan students, regardless of their
circumstances, should have the opportunity to access a reasonably comparable range of learning
supports. This is consistent with the rationale for recognizing other significant differences among
school divisions; for example, high incidences of EAL students and building locations or footprints
that cannot easily be changed.
The geographic dispersion factor reflects that there are additional costs associated with delivering
supports and services in a geographically dispersed area. Supports required to meet the needs of
students (e.g. psychologists, speech‐language pathologists, occupational therapists) often must
travel to multiple school locations. As these supports must spend time in transit between
locations, they have less time available to work with students. Therefore, a geographically
dispersed school division requires more SFL staff to serve the same number of students as a less
dispersed school division. A distance factor recognizes the additional costs associated with
delivering supports and services in a geographically dispersed area.
Wherever possible, the education system service delivery model brings specialized professional
services to students, rather than requiring students to travel to an urban centre to receive them.
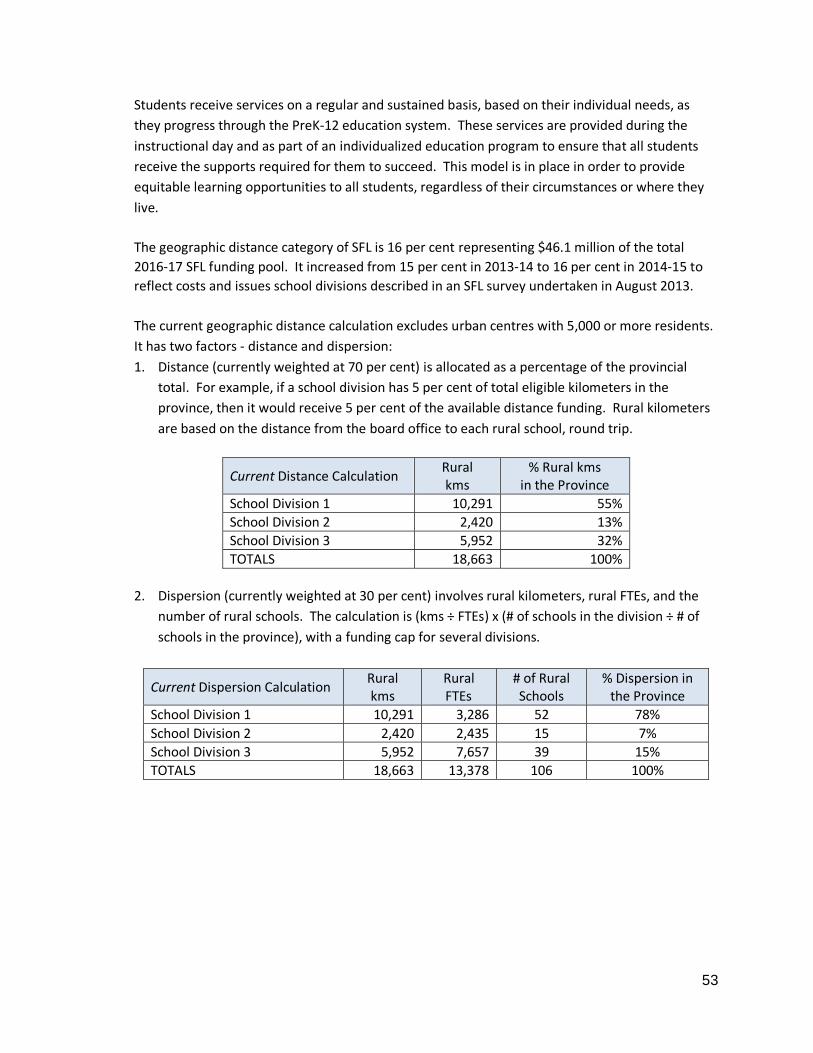
53
Students receive services on a regular and sustained basis, based on their individual needs, as
they progress through the PreK‐12 education system. These services are provided during the
instructional day and as part of an individualized education program to ensure that all students
receive the supports required for them to succeed. This model is in place in order to provide
equitable learning opportunities to all students, regardless of their circumstances or where they
live.
The geographic distance category of SFL is 16 per cent representing $46.1 million of the total
2016‐17 SFL funding pool. It increased from 15 per cent in 2013‐14 to 16 per cent in 2014‐15 to
reflect costs and issues school divisions described in an SFL survey undertaken in August 2013.
The current geographic distance calculation excludes urban centres with 5,000 or more residents.
It has two factors ‐ distance and dispersion:
1. Distance (currently weighted at 70 per cent) is allocated as a percentage of the provincial
total. For example, if a school division has 5 per cent of total eligible kilometers in the
province, then it would receive 5 per cent of the available distance funding. Rural kilometers
are based on the distance from the board office to each rural school, round trip.
Current Distance Calculation Rural kms
% Rural kms in the Province
School Division 1 10,291 55%
School Division 2 2,420 13%
School Division 3 5,952 32%
TOTALS 18,663 100%
2. Dispersion (currently weighted at 30 per cent) involves rural kilometers, rural FTEs, and the
number of rural schools. The calculation is (kms ÷ FTEs) x (# of schools in the division ÷ # of
schools in the province), with a funding cap for several divisions.
Current Dispersion Calculation Rural kms
Rural FTEs
# of Rural Schools
% Dispersion in the Province
School Division 1 10,291 3,286 52 78%
School Division 2 2,420 2,435 15 7%
School Division 3 5,952 7,657 39 15%
TOTALS 18,663 13,378 106 100%
54
Options Weighting
In 2014, as part of a review of SFL, school divisions expressed concern about the factor weighting
for distance. A SFL survey was sent out to all divisions, and included questions about how services
were delivered to geographically dispersed students, windshield time, and potential alternatives
to the existing distance calculation.
Windshield time was an important cost driver; however, school divisions also reported a number
of additional costs associated with geography, including accommodations costs, meals, lost time
due to road conditions, and additional costs for recruitment and retention of SFL professionals in
remote areas. Based on this feedback, the factor weighting was increased from 15 per cent to 16
per cent to address the high costs of serving geographically dispersed students.
As part of this review, the weighting associated with geographic distance was, once again,
examined. We considered moving SFL geographic dispersion funding to a new geographic
distance component to recognize that rural school divisions experience geographic distance costs
not only in SFL, but also in other cost areas. However, the Technical Committee and I decided
that since the distribution of these dollars would not change, we should leave all recognition of
distance costs within the SFL component. As a result, we decided to keep the weighting at 16 per
cent and we focused instead on the formula for geographic dispersion.
Estimating the Costs of Dispersion
To better understand the relationship of different cost drivers to distance and students, the
review committee created a costing model. The costing model was used as an estimate of costs
and assisted in the development of a new formula; it was not intended to identify the actual cost
of dispersion by school.
For analytical purposes, the review committee identified parameters for SFL dispersion, including
an estimate of 10 per cent of students requiring supports for learning, five hours of professional
staff‐student contact time per day, and one hour of service per student. Based on these
parameters, the number of trips required per school was calculated and translated into
windshield time. The amount of windshield time was then multiplied by the cost per km for
driving and by an average hourly wage for SFL professionals, to determine the cost to serve each
school. The analysis was run including and excluding these parameters. Because the parameters
are applied to all rural schools in the same way, the impact is neutral mathematically (i.e., the
number of hours per day and salaries act as a constant since the same numbers are used for every
school). As a result, the costing model was simplified into a formula that multiplies kms x FTEs for
each school.
55
KMs x FTEs Calculation
The kms x FTEs calculation continues to use rural kms and FTEs. Rural schools are defined as
those located outside of centres with a population of 5,000 or more, while kms are measured as
the round trip distance between the school and the board office.
In order to address small schools that are not eligible for closure, an adjustment to 50 FTEs
minimum was included for small schools of necessity (SSONs) and Hutterian schools. The 50 FTEs
was determined based on the assumptions about students requiring services stated above. Since
it was assumed that 10 per cent of students require support, and five students could be served in
a day, a school would need 50 students to generate one visit to a school within the calculation.
Since professionals need to travel to any student requiring supports, at least one visit would be
required regardless of the number of FTEs attending the school. The increase to 50 FTEs was
meant to ensure that one trip was counted for each school within the formula (to recognize the
fixed cost of delivering SFL services to a rural school).
When schools are grouped together in a community, there are increased efficiencies related to
geographic distance (e.g., the distance between schools is low and a separate measurement from
the board office to each school is not necessary). To address this issue, any schools within the
same community were grouped and counted as one school. This affects the kms portion of the
calculation only: school divisions still receive recognition for the total number of FTEs.
Since schools within a close proximity of urban centres do not experience significant geographic
distance costs, those schools are not eligible for additional funding through this factor. The
greatest distance between two urban schools within the same centre was chosen as the
measurement to determine which schools were eligible to be counted as rural schools.
Therefore, any schools within 18 kms of the board office (one way) were removed from the
calculation.
Because this funding is only meant to recognize the cost of windshield time, the kms x FTEs
calculation compares the estimate of distance funding per school to the number of additional SFL
professionals that could be hired. An average SFL professional salary of $90,000 per year was used.
The kms x FTE calculation was presented to school divisions in December 2015. Several divisions
raised concerns and, in January 2016, there was a follow up meeting with Chinook, Prairie South,
and Sun West school divisions. These school divisions felt that the kms x FTEs approach did not
provide appropriate recognition for small, remote schools and over‐recognized the impact of
enrolments.
These divisions articulated that smaller schools have less internal capacity, and more trips are
often required per student. For example, in larger schools there tends to be a broader
complement of teachers, some of whom have already been trained to provide supports for
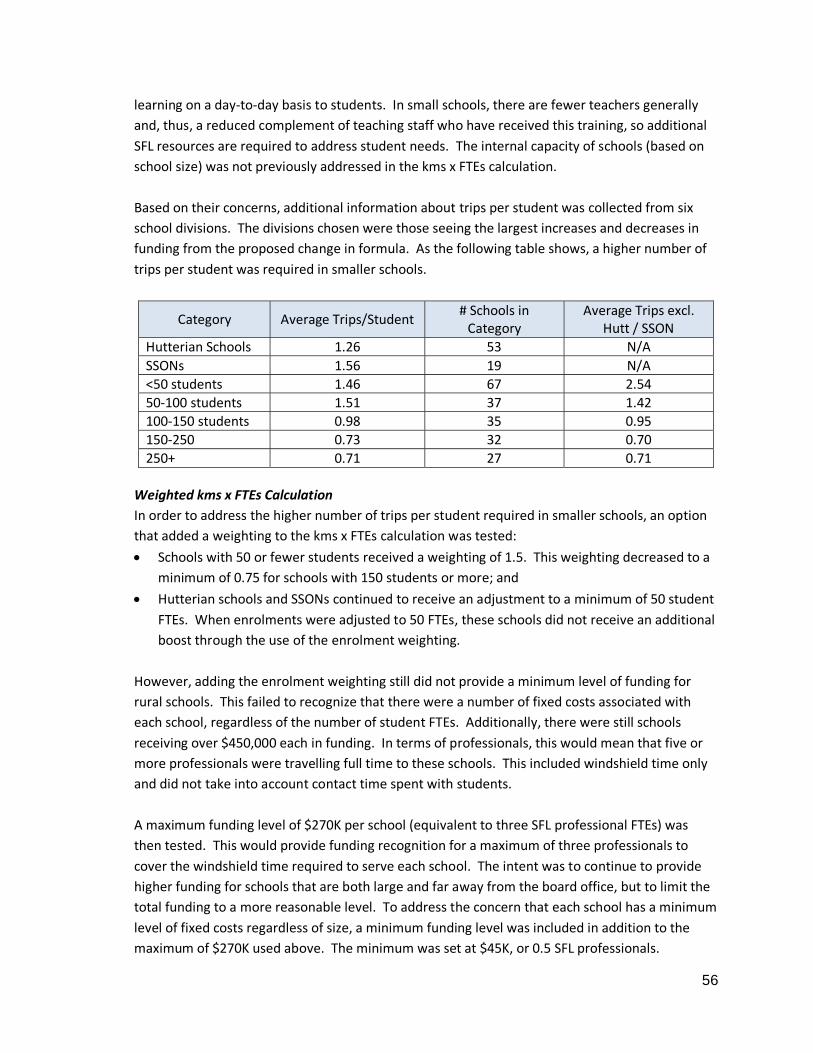
56
learning on a day‐to‐day basis to students. In small schools, there are fewer teachers generally
and, thus, a reduced complement of teaching staff who have received this training, so additional
SFL resources are required to address student needs. The internal capacity of schools (based on
school size) was not previously addressed in the kms x FTEs calculation.
Based on their concerns, additional information about trips per student was collected from six
school divisions. The divisions chosen were those seeing the largest increases and decreases in
funding from the proposed change in formula. As the following table shows, a higher number of
trips per student was required in smaller schools.
Category Average Trips/Student # Schools in Category
Average Trips excl. Hutt / SSON
Hutterian Schools 1.26 53 N/A
SSONs 1.56 19 N/A
<50 students 1.46 67 2.54
50‐100 students 1.51 37 1.42
100‐150 students 0.98 35 0.95
150‐250 0.73 32 0.70
250+ 0.71 27 0.71
Weighted kms x FTEs Calculation
In order to address the higher number of trips per student required in smaller schools, an option
that added a weighting to the kms x FTEs calculation was tested:
Schools with 50 or fewer students received a weighting of 1.5. This weighting decreased to a
minimum of 0.75 for schools with 150 students or more; and
Hutterian schools and SSONs continued to receive an adjustment to a minimum of 50 student
FTEs. When enrolments were adjusted to 50 FTEs, these schools did not receive an additional
boost through the use of the enrolment weighting.
However, adding the enrolment weighting still did not provide a minimum level of funding for
rural schools. This failed to recognize that there were a number of fixed costs associated with
each school, regardless of the number of student FTEs. Additionally, there were still schools
receiving over $450,000 each in funding. In terms of professionals, this would mean that five or
more professionals were travelling full time to these schools. This included windshield time only
and did not take into account contact time spent with students.
A maximum funding level of $270K per school (equivalent to three SFL professional FTEs) was
then tested. This would provide funding recognition for a maximum of three professionals to
cover the windshield time required to serve each school. The intent was to continue to provide
higher funding for schools that are both large and far away from the board office, but to limit the
total funding to a more reasonable level. To address the concern that each school has a minimum
level of fixed costs regardless of size, a minimum funding level was included in addition to the
maximum of $270K used above. The minimum was set at $45K, or 0.5 SFL professionals.
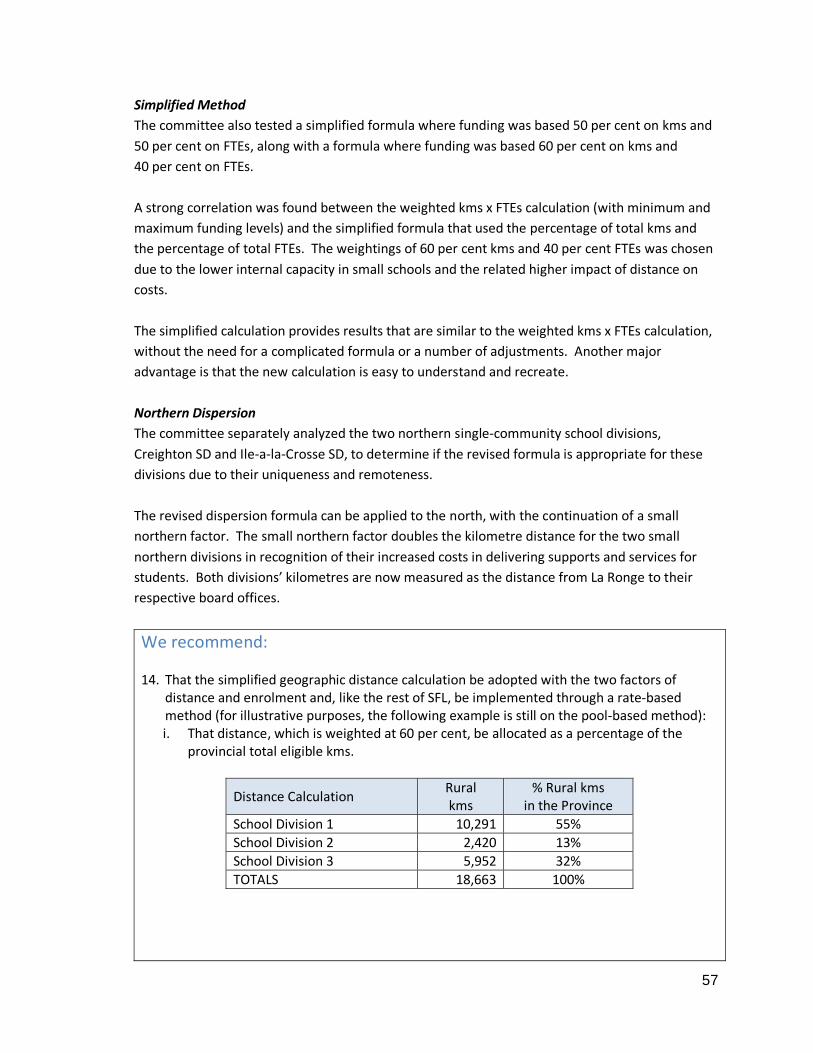
57
Simplified Method
The committee also tested a simplified formula where funding was based 50 per cent on kms and
50 per cent on FTEs, along with a formula where funding was based 60 per cent on kms and
40 per cent on FTEs.
A strong correlation was found between the weighted kms x FTEs calculation (with minimum and
maximum funding levels) and the simplified formula that used the percentage of total kms and
the percentage of total FTEs. The weightings of 60 per cent kms and 40 per cent FTEs was chosen
due to the lower internal capacity in small schools and the related higher impact of distance on
costs.
The simplified calculation provides results that are similar to the weighted kms x FTEs calculation,
without the need for a complicated formula or a number of adjustments. Another major
advantage is that the new calculation is easy to understand and recreate.
Northern Dispersion
The committee separately analyzed the two northern single‐community school divisions,
Creighton SD and Ile‐a‐la‐Crosse SD, to determine if the revised formula is appropriate for these
divisions due to their uniqueness and remoteness.
The revised dispersion formula can be applied to the north, with the continuation of a small
northern factor. The small northern factor doubles the kilometre distance for the two small
northern divisions in recognition of their increased costs in delivering supports and services for
students. Both divisions’ kilometres are now measured as the distance from La Ronge to their
respective board offices.
We recommend: 14. That the simplified geographic distance calculation be adopted with the two factors of
distance and enrolment and, like the rest of SFL, be implemented through a rate‐based method (for illustrative purposes, the following example is still on the pool‐based method): i. That distance, which is weighted at 60 per cent, be allocated as a percentage of the
provincial total eligible kms.
Distance Calculation Rural kms
% Rural kms in the Province
School Division 1 10,291 55%
School Division 2 2,420 13%
School Division 3 5,952 32%
TOTALS 18,663 100%
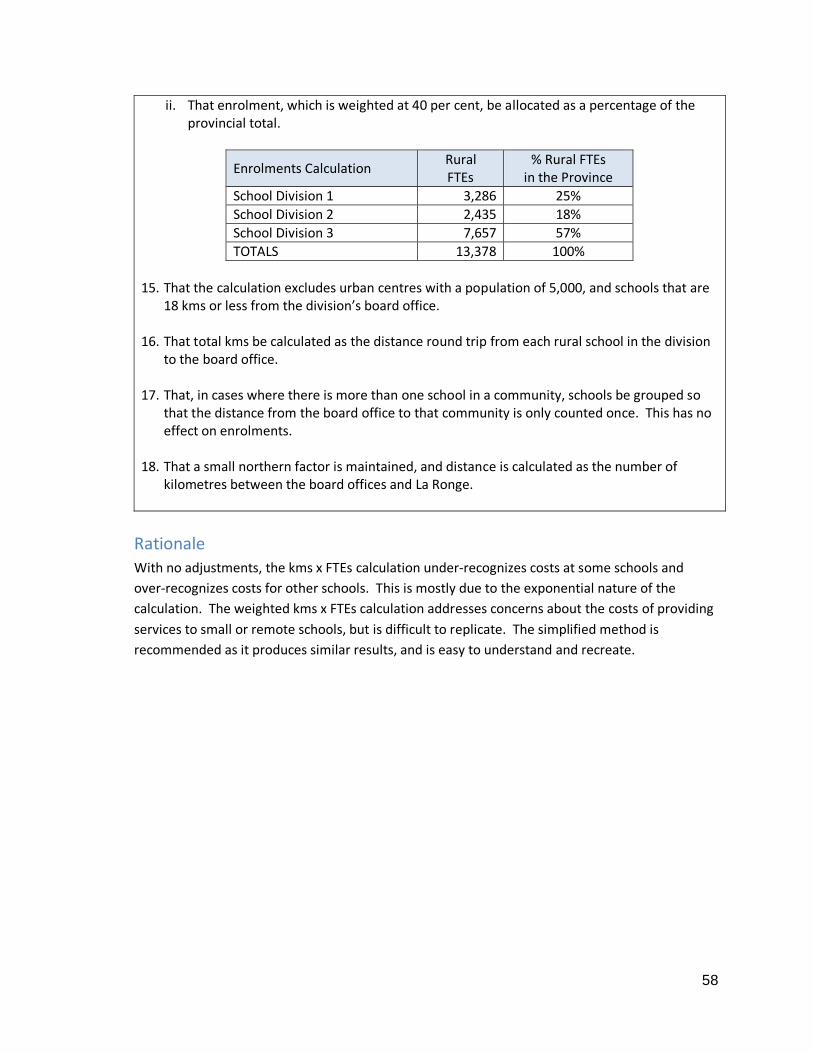
58
ii. That enrolment, which is weighted at 40 per cent, be allocated as a percentage of the provincial total.
Enrolments Calculation Rural FTEs
% Rural FTEs in the Province
School Division 1 3,286 25%
School Division 2 2,435 18%
School Division 3 7,657 57%
TOTALS 13,378 100%
15. That the calculation excludes urban centres with a population of 5,000, and schools that are
18 kms or less from the division’s board office.
16. That total kms be calculated as the distance round trip from each rural school in the division to the board office.
17. That, in cases where there is more than one school in a community, schools be grouped so
that the distance from the board office to that community is only counted once. This has no effect on enrolments.
18. That a small northern factor is maintained, and distance is calculated as the number of
kilometres between the board offices and La Ronge.
Rationale With no adjustments, the kms x FTEs calculation under‐recognizes costs at some schools and
over‐recognizes costs for other schools. This is mostly due to the exponential nature of the
calculation. The weighted kms x FTEs calculation addresses concerns about the costs of providing
services to small or remote schools, but is difficult to replicate. The simplified method is
recommended as it produces similar results, and is easy to understand and recreate.
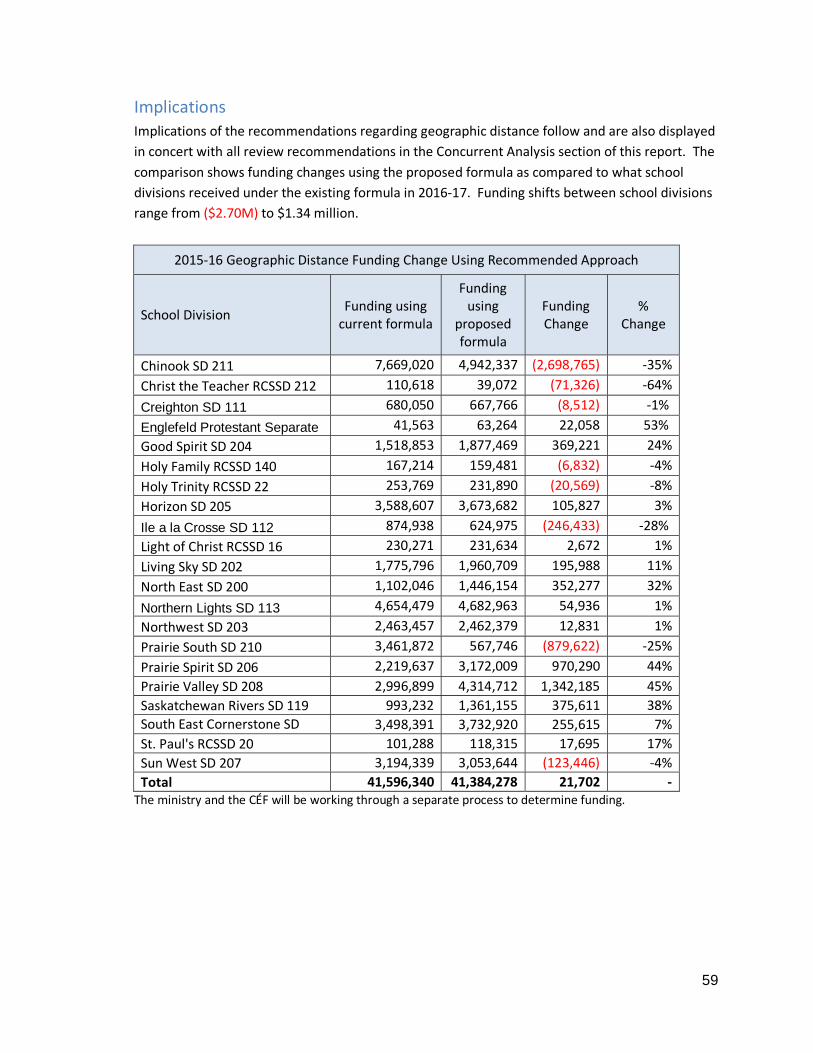
59
Implications Implications of the recommendations regarding geographic distance follow and are also displayed
in concert with all review recommendations in the Concurrent Analysis section of this report. The
comparison shows funding changes using the proposed formula as compared to what school
divisions received under the existing formula in 2016‐17. Funding shifts between school divisions
range from ($2.70M) to $1.34 million.
2015‐16 Geographic Distance Funding Change Using Recommended Approach
School Division Funding using current formula
Funding using
proposed formula
Funding Change
% Change
Chinook SD 211 7,669,020 4,942,337 (2,698,765) ‐35%
Christ the Teacher RCSSD 212 110,618 39,072 (71,326) ‐64%
Creighton SD 111 680,050 667,766 (8,512) ‐1%
Englefeld Protestant Separate 41,563 63,264 22,058 53%
Good Spirit SD 204 1,518,853 1,877,469 369,221 24%
Holy Family RCSSD 140 167,214 159,481 (6,832) ‐4%
Holy Trinity RCSSD 22 253,769 231,890 (20,569) ‐8%
Horizon SD 205 3,588,607 3,673,682 105,827 3%
Ile a la Crosse SD 112 874,938 624,975 (246,433) ‐28%
Light of Christ RCSSD 16 230,271 231,634 2,672 1%
Living Sky SD 202 1,775,796 1,960,709 195,988 11%
North East SD 200 1,102,046 1,446,154 352,277 32%
Northern Lights SD 113 4,654,479 4,682,963 54,936 1%
Northwest SD 203 2,463,457 2,462,379 12,831 1%
Prairie South SD 210 3,461,872 567,746 (879,622) ‐25%
Prairie Spirit SD 206 2,219,637 3,172,009 970,290 44%
Prairie Valley SD 208 2,996,899 4,314,712 1,342,185 45%
Saskatchewan Rivers SD 119 993,232 1,361,155 375,611 38%
South East Cornerstone SD 3,498,391 3,732,920 255,615 7%
St. Paul's RCSSD 20 101,288 118,315 17,695 17%
Sun West SD 207 3,194,339 3,053,644 (123,446) ‐4%
Total 41,596,340 41,384,278 21,702 ‐ The ministry and the CÉF will be working through a separate process to determine funding.
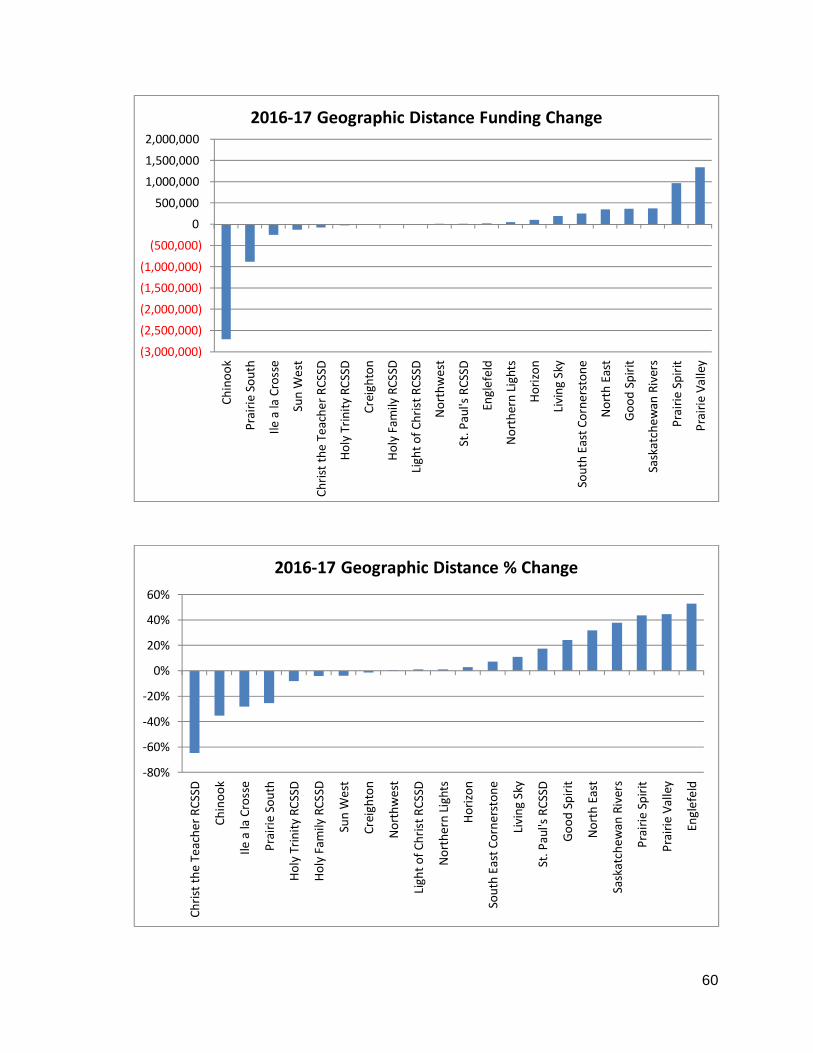
60
(3,000,000)
(2,500,000)
(2,000,000)
(1,500,000)
(1,000,000)
(500,000)
0
500,000
1,000,000
1,500,000
2,000,000
Chinook
Prairie South
Ile a la Crosse
Sun W
est
Christ the Teacher RCSSD
Holy Trinity RCSSD
Creighton
Holy Fam
ily RCSSD
Light of Christ RCSSD
Northwest
St. Paul's RCSSD
Englefeld
Northern Lights
Horizon
Living Sky
South East Cornerstone
North East
Good Spirit
Saskatchewan
Rivers
Prairie Spirit
Prairie Valley
2016‐17 Geographic Distance Funding Change
‐80%
‐60%
‐40%
‐20%
0%
20%
40%
60%
Christ the Teacher RCSSD
Chinook
Ile a la Crosse
Prairie South
Holy Trinity RCSSD
Holy Fam
ily RCSSD
Sun W
est
Creighton
Northwest
Light of Christ RCSSD
Northern Lights
Horizon
South East Cornerstone
Living Sky
St. Paul's RCSSD
Good Spirit
North East
Saskatchewan
Rivers
Prairie Spirit
Prairie Valley
Englefeld
2016‐17 Geographic Distance % Change
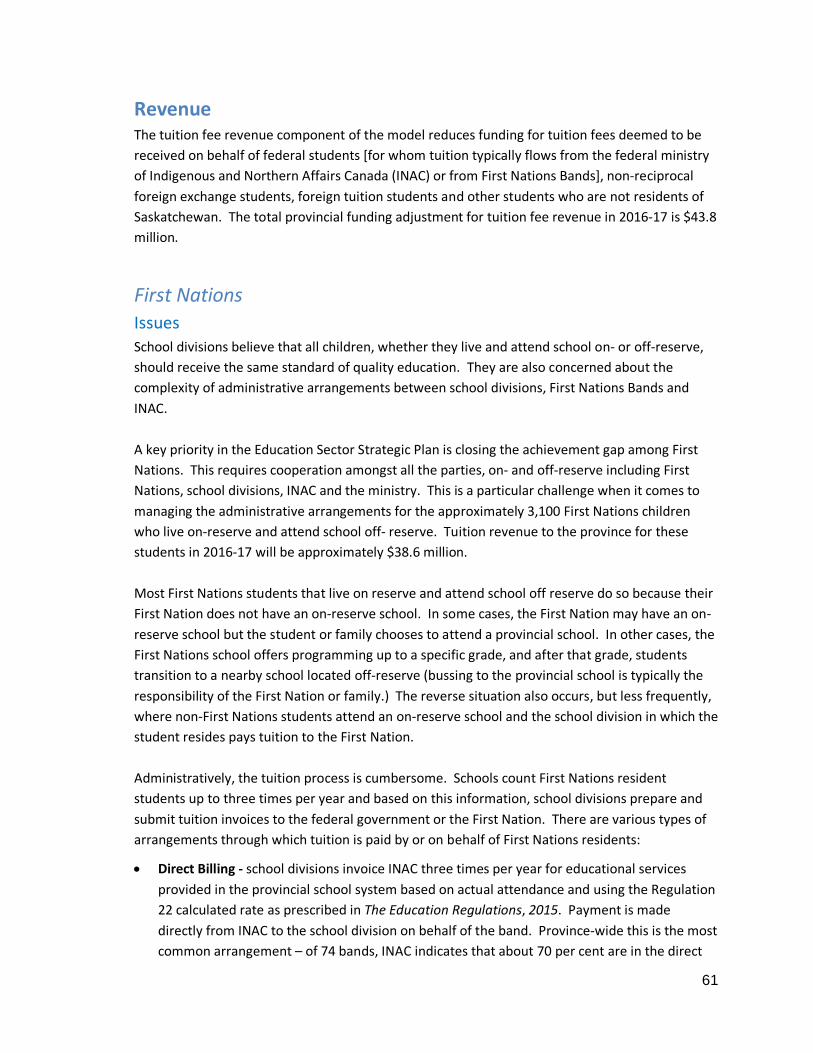
61
Revenue The tuition fee revenue component of the model reduces funding for tuition fees deemed to be
received on behalf of federal students [for whom tuition typically flows from the federal ministry
of Indigenous and Northern Affairs Canada (INAC) or from First Nations Bands], non‐reciprocal
foreign exchange students, foreign tuition students and other students who are not residents of
Saskatchewan. The total provincial funding adjustment for tuition fee revenue in 2016‐17 is $43.8
million.
First Nations
Issues School divisions believe that all children, whether they live and attend school on‐ or off‐reserve,
should receive the same standard of quality education. They are also concerned about the
complexity of administrative arrangements between school divisions, First Nations Bands and
INAC.
A key priority in the Education Sector Strategic Plan is closing the achievement gap among First
Nations. This requires cooperation amongst all the parties, on‐ and off‐reserve including First
Nations, school divisions, INAC and the ministry. This is a particular challenge when it comes to
managing the administrative arrangements for the approximately 3,100 First Nations children
who live on‐reserve and attend school off‐ reserve. Tuition revenue to the province for these
students in 2016‐17 will be approximately $38.6 million.
Most First Nations students that live on reserve and attend school off reserve do so because their
First Nation does not have an on‐reserve school. In some cases, the First Nation may have an on‐
reserve school but the student or family chooses to attend a provincial school. In other cases, the
First Nations school offers programming up to a specific grade, and after that grade, students
transition to a nearby school located off‐reserve (bussing to the provincial school is typically the
responsibility of the First Nation or family.) The reverse situation also occurs, but less frequently,
where non‐First Nations students attend an on‐reserve school and the school division in which the
student resides pays tuition to the First Nation.
Administratively, the tuition process is cumbersome. Schools count First Nations resident
students up to three times per year and based on this information, school divisions prepare and
submit tuition invoices to the federal government or the First Nation. There are various types of
arrangements through which tuition is paid by or on behalf of First Nations residents:
Direct Billing ‐ school divisions invoice INAC three times per year for educational services
provided in the provincial school system based on actual attendance and using the Regulation
22 calculated rate as prescribed in The Education Regulations, 2015. Payment is made
directly from INAC to the school division on behalf of the band. Province‐wide this is the most
common arrangement – of 74 bands, INAC indicates that about 70 per cent are in the direct
62
billing category. School divisions enter into a standard, federally determined Education
Services Agreement that articulates terms and conditions. For the most part, payments are
made routinely by the federal government to school divisions.
Set Contribution Funding ‐ school divisions invoice individual Bands and the Bands pay tuition
directly to the school division. Bands receive an advance on April 1 of each year for the
period April, May and June. As soon as the Band provides verification that tuition fees are
paid, INAC advances the funds for the next three month period. The final amounts for the
year are reconciled to actuals following year end. As with direct billing, payments are
generally made regularly by First Nations to school divisions.
Block Funding ‐ school divisions invoice individual Bands and the Bands pay tuition directly to
the school division. These Bands receive unconditional, annual indexed funding from the
federal government that is meant to cover all on‐reserve services (e.g., economic
development, social services, education, health and other). This type of arrangement can
sometimes result in payment arrears. In these circumstances, school divisions are left with a
temporary or permanent loss of revenue and related cash flow implications.
Arrangements relating to both Set Contribution and Block payments are set out in individual
Education Services Agreements (ESAs) between the school division and the First Nation. ESAs
specify business processes around tuition payments, reporting requirements from the school
division to the First Nation, dispute resolution mechanisms, reciprocal tuition arrangements and
any other terms and conditions that the parties agree upon. While Regulation 22 provides
needed consistency around tuition fees to be charged, the content of ESAs in terms of services
provided, accountability and other service provisions vary across school division even when
dealing with the same First Nation.
Under any of the three payment arrangements, additional charges may be levied directly to INAC
for students designated as having intensive needs. However, the federal government requires
specific reporting and documentation to access this funding and school divisions indicate they do
not recoup all costs associated with programming, leaving them with a permanent loss of cash
flow and revenue.
Managing the variety of complex financial and reporting requirements is time consuming and staff
intensive for school divisions, and this is not currently recognized in the funding model. School
divisions with larger numbers of First Nations bands carry greater administrative burden and
higher financial risk (payment arrears are not shared across the entire education system).
A few First Nations such as Whitecap and the Meadow Lake Tribal Council, are pursuing new
educational partnerships with INAC and select school divisions. Funding arrangements for these
pilots may depart from historical practice. An on‐reserve school on Whitecap Dakota First Nation,
for example, is funded by INAC in accordance with dollars allocated through the distribution
funding model, and is staffed by teachers employed by Saskatoon Public School Division.
63
Considerations This review is focused on enhancing equity in the Education PreK‐12 Funding Distribution Model
to support all students in reaching their full potential. But the principle of funding equity not only
applies to the Ministry of Education and school divisions; it also applies to the Government of
Canada (INAC) and First Nations. All children in the province, including First Nations children
living on reserve, have a right to access quality instruction, the supports they need to learn, a safe
and welcoming environment at school, and safe travel to and from school. All parties have a role
to play in supporting children to reach their full potential.
We Recommend: 19. That the Province, First Nations and INAC come together to negotiate a funding regime
that is consistent with the principles articulated in the Funding Distribution Model Guiding Principles; and
In the meantime: 20. That the ministry and INAC work together to simplify and streamline funding
arrangements for First Nations students attending school off‐reserve.
21. That the ministry and school divisions work together to determine a process for reconciling revenues related to First Nations tuition.
22. That INAC, First Nations and school divisions pursue innovative educational partnerships
that include application of the funding model (e.g. Whitecap, MLTC, and other innovative locally determined arrangements); and the Government of Saskatchewan support these approaches.
Implications Funding for First Nations education on‐ and off‐reserve has been an issue of contention for many
years. Building strong partnerships between First Nations, INAC, school divisions and the province
will enhance equity across the province and lead to improved educational outcomes for First
Nations people.
64
International Students
Issue In 2015‐2016, an estimated 550 international students will attend provincial schools. These
students are charged tuition fees that generate about $5.8 million in revenue annually. School
divisions invoice the family and typically require payment at the start (or prior to the start) of the
school year. The ministry then reduces funding to school divisions accordingly so they do not
receive funding twice since these students are counted in all components of the funding model
that use enrolment (this is the same arrangement as is used for on‐reserve First Nations students
who attend provincial schools). Some school divisions expressed concern that they are unable to
recoup all of the costs associated with the recruitment and education of international students.
International students can arrive with additional program needs related to language and social
factors. These are considered in the funding model; however, at least one school division
indicates other costs are not provided for including:
facilitators that travel around the world to build relationships with international
organizations, attend recruitment fairs, and connect with potential students;
commission costs for recruitment companies;
administrative costs associated with processing immigration paperwork for students; and
homestay programs, travel, advertising, supplies and equipment.
While school divisions have the ability to set tuition fees to cover these costs (these fees are not
covered by Regulation 22), they indicate they are unable to compete with international student
programs in other provincial jurisdictions. Even if they could, unlike in the advanced education
sector where the recruitment of international students is undertaken, in part, as a means of
generating additional revenue; school divisions believe that educating international students
should be cost neutral to school divisions to maintain equity across the province.
Those school divisions with international programs are in a conundrum. They indicate they are
unable to generate sufficient revenue through tuition to cover their costs, but they do not believe
Government or the advanced education sector would support cancellation of their international
program. This is due to the commitment in Saskatchewan’s Plan for Growth to increase the
number of international students studying at post‐secondary institutions by at least 50 per cent
by 2020. This raises a key policy question for the Province. Does the Government of
Saskatchewan want school divisions to actively promote, recruit and sustain international
programs at the elementary and high school level; or does it want them to simply accept those
students who arrive? If active recruitment is desired, school divisions believe associated costs
should be funded by the province outside of the education funding distribution model.
65
Education Regulations
Issue Throughout the review process a number of school divisions expressed concern that The
Education Regulations, 2015 contain disincentives to the efficient use of schools and impede their
ability to determine how to provide high‐quality education in rural areas. For example, when
small schools are located in towns adjacent to one another, or in close proximity to an urban
centre, it may make sense to close and amalgamate (both from the perspective of providing a
better quality education for students and from an efficiency point of view). School divisions
pointed to the 2014 motion passed by the Saskatchewan School Boards Association (SSBA) calling
for review of the Regulations as they relate to school review, enrolment thresholds and the
proximity of other schools in school divisions.
Considerations School divisions need to find the right balance between recognizing and responding to the needs
of students living in rural communities, and operating as efficiently as possible. This is a
significant challenge, especially for school divisions with a substantial dispersed population.
Section 92.2 of The Education Regulations contains a number of prohibitions which may run
counter to school divisions’ ability to deliver programs cost effectively and in accordance with
children’s educational interests (access The Education Regulations at
http://www.qp.gov.sk.ca/documents/English/Regulations/Regulations/E0‐2r24.pdf ).
We recommend: 23. Review and simplification of section 92.2 of The Education Regulations, 2015.
Implications Review of the Regulations is required to enable school divisions to respond quickly, effectively
and efficiently to the needs of students across the province.
66
Governance and Accountability Unconditional funding and Board autonomy have always been key cornerstones to governance
and accountability in the province’s education system. School divisions receive funding from the
province, and have the authority to make decisions about the allocation of those funds in
accordance with local priorities. Throughout the course of the review, the Technical Committee
found that we had to continually reinforce that the review was about distribution of the dollars
and not about how school divisions spend them.
Now that school divisions can no longer levy taxation, there is a new environment in
Saskatchewan education that is fundamentally changing the accountability relationship between
the Minister of Education, the ministry and school boards. One of the principles of the funding
distribution model is mutual responsibility. As elected officials, the minister and boards both
share responsibility for responding to the needs of constituents. However, now that almost all
school division funding comes from the province, there is even greater Ministerial responsibility
than ever before. This was recognized in 2009 when Government was deemed to have control,
from an accounting perspective, over school divisions; and it was made even more significant in
the 2014‐15 Budget when summary financial statements became the main reporting mechanism
of government financials. Government’s process to approve school division budgets and financial
statements is now much more stringent than in the past.
For school boards, there is an increased need to manage school division budgets with great care
as they no longer have the flexibility to raise revenue. Now, more than ever, it is critical for board
members, Directors and CFOs to understand the funding model and how it works. It is also
important that they have some appreciation of Government’s fiscal context as funds will flow,
more or less, accordingly. This is particularly challenging given reported increased turnover at the
board level as well as with Directors and CFOs. School divisions and ministry officials
acknowledge that the level of understanding about the funding distribution model and how it
works is not where it needs to be.
Communication is also increasingly important. The minister has overarching responsibility for
education in the province. The minister needs to continue to have predictable contact with
boards and, in particular, with board chairs. The ministry has a responsibility to convey provincial
direction on the minister’s behalf, and facilitate understanding of the funding model amongst
boards, Directors and CFOs. Because education is a mutual responsibility, all parties need to work
together to proactively identify issues, solve problems and ensure actions taken are in support of
the Education Sector Strategic Plan. Enhanced communication between the minister, ministry
officials, boards and school division staff is desired to strengthen understanding, transparency,
trust and mutual accountability across the system.
67
We recommend: 24. That, on an ongoing basis, the ministry provide training on the funding model for board
chairs, Directors, CFOs and other stakeholders; and 25. That all education stakeholders strengthen formal and informal communications to ensure
regular, ongoing dialogue at the school division level and provincially.
Sustaining the Model Throughout the funding review, school divisions expressed concern about the frequency with
which changes have been made to the model since its establishment in 2012‐13. Adjustments
have been made every year with some, such as revision to the supports for learning component in
2014‐15, impacting significantly on funding levels. Some school divisions express frustration that
changes have not always been transparent and that they have compromised school divisions’
ability to plan over multiple years.
Questions have also been raised about how, after this review, the integrity of the funding model
will be preserved into the future. There is a desire for a joint, ongoing mechanism for updating
the funding model whereby school divisions and the ministry can discuss concerns together and
make recommendations for updates and adjustments. It is recognized that while Government
“owns” the model, management of it would be enhanced by the greater involvement of school
divisions.
There is also a need for better, more consistent data analysis. School divisions exercise
judgement in the data reporting process leading to inaccuracies and a lack of consistency across
the system. As a result, data is not always comparable, undermining the ability to perform
analysis across the education system, and compromising the ability to track progress in support of
the Education Sector Strategic Plan.
We recommend: 26. That a joint ministry/school division mechanism be created to preserve the integrity of the
model by considering outstanding and newly identified issues (for example: distance education, treatment of multiple schools in a single community, intensive needs, principal and interest, etc.) and, when material, identify adjustments to the model which may be required
27. That formal review of the model occur on a regular basis, for example, every four years; and
28. That the ministry and school divisions improve the comparability of data collection, expense coding and accounting policies.
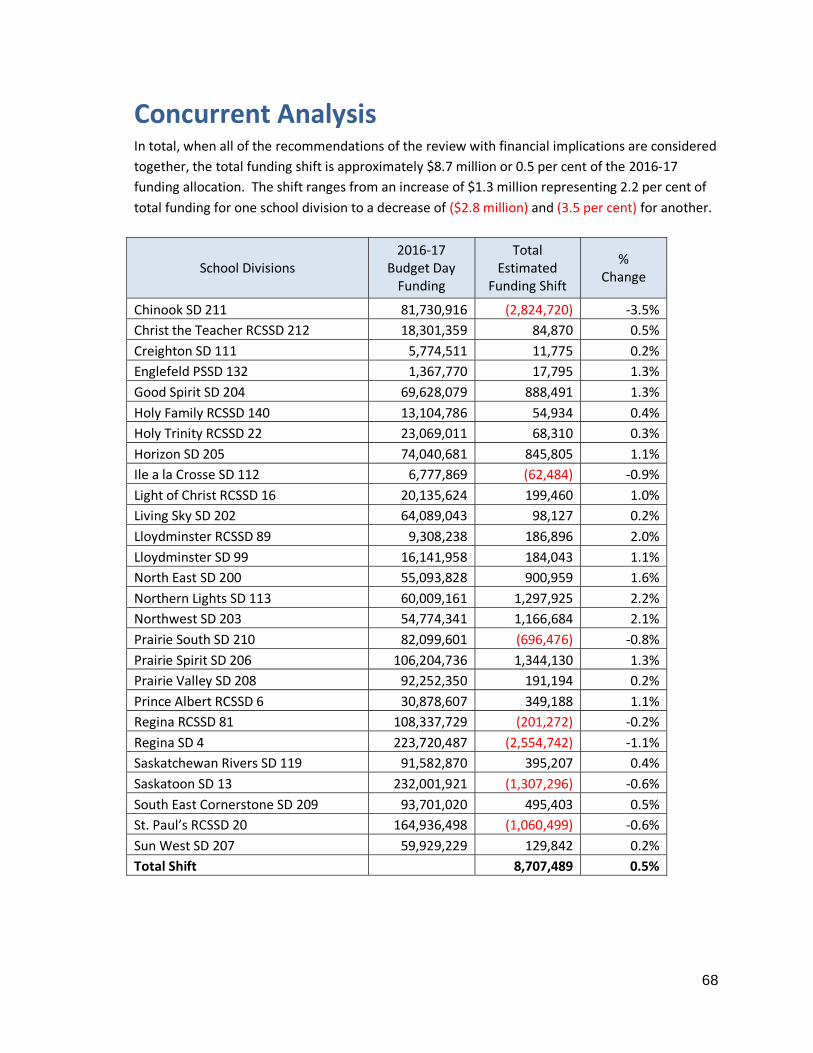
68
Concurrent Analysis In total, when all of the recommendations of the review with financial implications are considered
together, the total funding shift is approximately $8.7 million or 0.5 per cent of the 2016‐17
funding allocation. The shift ranges from an increase of $1.3 million representing 2.2 per cent of
total funding for one school division to a decrease of ($2.8 million) and (3.5 per cent) for another.
School Divisions 2016‐17
Budget Day Funding
Total Estimated
Funding Shift
% Change
Chinook SD 211 81,730,916 (2,824,720) ‐3.5%
Christ the Teacher RCSSD 212 18,301,359 84,870 0.5%
Creighton SD 111 5,774,511 11,775 0.2%
Englefeld PSSD 132 1,367,770 17,795 1.3%
Good Spirit SD 204 69,628,079 888,491 1.3%
Holy Family RCSSD 140 13,104,786 54,934 0.4%
Holy Trinity RCSSD 22 23,069,011 68,310 0.3%
Horizon SD 205 74,040,681 845,805 1.1%
Ile a la Crosse SD 112 6,777,869 (62,484) ‐0.9%
Light of Christ RCSSD 16 20,135,624 199,460 1.0%
Living Sky SD 202 64,089,043 98,127 0.2%
Lloydminster RCSSD 89 9,308,238 186,896 2.0%
Lloydminster SD 99 16,141,958 184,043 1.1%
North East SD 200 55,093,828 900,959 1.6%
Northern Lights SD 113 60,009,161 1,297,925 2.2%
Northwest SD 203 54,774,341 1,166,684 2.1%
Prairie South SD 210 82,099,601 (696,476) ‐0.8%
Prairie Spirit SD 206 106,204,736 1,344,130 1.3%
Prairie Valley SD 208 92,252,350 191,194 0.2%
Prince Albert RCSSD 6 30,878,607 349,188 1.1%
Regina RCSSD 81 108,337,729 (201,272) ‐0.2%
Regina SD 4 223,720,487 (2,554,742) ‐1.1%
Saskatchewan Rivers SD 119 91,582,870 395,207 0.4%
Saskatoon SD 13 232,001,921 (1,307,296) ‐0.6%
South East Cornerstone SD 209 93,701,020 495,403 0.5%
St. Paul’s RCSSD 20 164,936,498 (1,060,499) ‐0.6%
Sun West SD 207 59,929,229 129,842 0.2%
Total Shift 8,707,489 0.5%
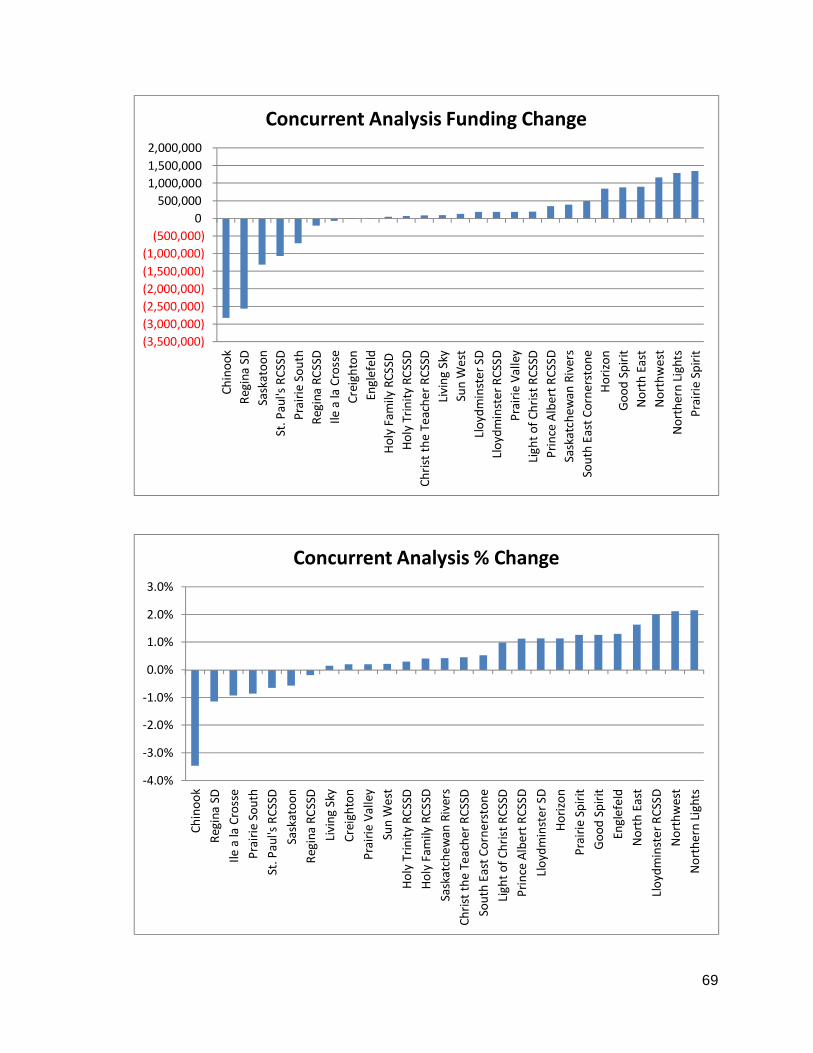
69
(3,500,000)
(3,000,000)
(2,500,000)
(2,000,000)
(1,500,000)
(1,000,000)
(500,000)
0
500,000
1,000,000
1,500,000
2,000,000
Chinook
Regina SD
Saskatoon
St. Paul's RCSSD
Prairie South
Regina RCSSD
Ile a la Crosse
Creighton
Englefeld
Holy Fam
ily RCSSD
Holy Trinity RCSSD
Christ the Teacher RCSSD
Living Sky
Sun W
est
Lloydminster SD
Lloydminster RCSSD
Prairie Valley
Light of Christ RCSSD
Prince Albert RCSSD
Saskatchewan
Rivers
South East Cornerstone
Horizon
Good Spirit
North East
Northwest
Northern Lights
Prairie Spirit
Concurrent Analysis Funding Change
‐4.0%
‐3.0%
‐2.0%
‐1.0%
0.0%
1.0%
2.0%
3.0%
Chinook
Regina SD
Ile a la Crosse
Prairie South
St. Paul's RCSSD
Saskatoon
Regina RCSSD
Living Sky
Creighton
Prairie Valley
Sun W
est
Holy Trinity RCSSD
Holy Fam
ily RCSSD
Saskatchewan
Rivers
Christ the Teacher RCSSD
South East Cornerstone
Light of Christ RCSSD
Prince Albert RCSSD
Lloydminster SD
Horizon
Prairie Spirit
Good Spirit
Englefeld
North East
Lloydminster RCSSD
Northwest
Northern Lights
Concurrent Analysis % Change
70
When discussing these shifts with the school divisions during the course of this review, the
committee noted that in many cases, the funding shifts determined through this process offset
funding shifts that occurred through the implementation of the funding model in 2012 and the
revision to supports for learning that occurred in 2014‐15.
Part of this change relates to certain elements that were not yet considered in the model, such as
transportation, over‐utilization of school buildings and a method to count students who have
already graduated. In addition, some of the funding shifts from the previous work may have over‐
adjusted, and the current changes may be viewed as a correction – for example, the previous
calculation for dispersion within supports for learning leaned too heavily on the number of
schools compared to the number of students.
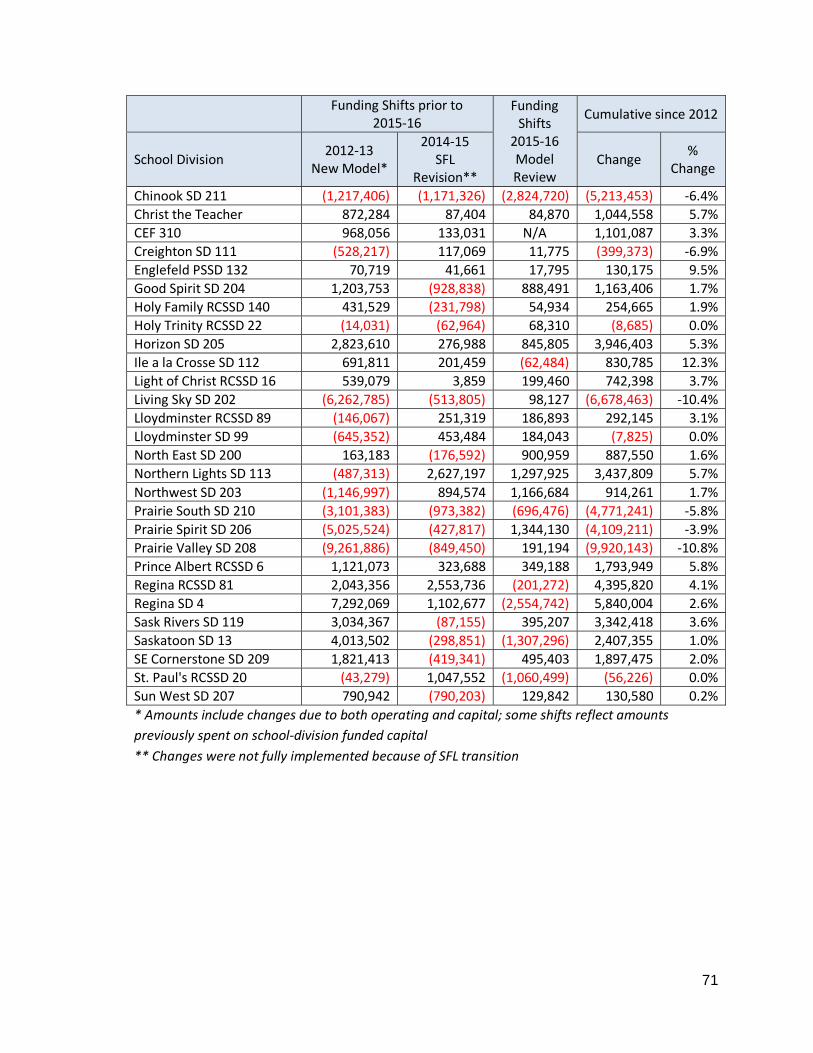
71
Funding Shifts prior to
2015‐16 Funding Shifts
2015‐16 Model Review
Cumulative since 2012
School Division 2012‐13
New Model*
2014‐15 SFL
Revision** Change
% Change
Chinook SD 211 (1,217,406) (1,171,326) (2,824,720) (5,213,453) ‐6.4%
Christ the Teacher 872,284 87,404 84,870 1,044,558 5.7%
CEF 310 968,056 133,031 N/A 1,101,087 3.3%
Creighton SD 111 (528,217) 117,069 11,775 (399,373) ‐6.9%
Englefeld PSSD 132 70,719 41,661 17,795 130,175 9.5%
Good Spirit SD 204 1,203,753 (928,838) 888,491 1,163,406 1.7%
Holy Family RCSSD 140 431,529 (231,798) 54,934 254,665 1.9%
Holy Trinity RCSSD 22 (14,031) (62,964) 68,310 (8,685) 0.0%
Horizon SD 205 2,823,610 276,988 845,805 3,946,403 5.3%
Ile a la Crosse SD 112 691,811 201,459 (62,484) 830,785 12.3%
Light of Christ RCSSD 16 539,079 3,859 199,460 742,398 3.7%
Living Sky SD 202 (6,262,785) (513,805) 98,127 (6,678,463) ‐10.4%
Lloydminster RCSSD 89 (146,067) 251,319 186,893 292,145 3.1%
Lloydminster SD 99 (645,352) 453,484 184,043 (7,825) 0.0%
North East SD 200 163,183 (176,592) 900,959 887,550 1.6%
Northern Lights SD 113 (487,313) 2,627,197 1,297,925 3,437,809 5.7%
Northwest SD 203 (1,146,997) 894,574 1,166,684 914,261 1.7%
Prairie South SD 210 (3,101,383) (973,382) (696,476) (4,771,241) ‐5.8%
Prairie Spirit SD 206 (5,025,524) (427,817) 1,344,130 (4,109,211) ‐3.9%
Prairie Valley SD 208 (9,261,886) (849,450) 191,194 (9,920,143) ‐10.8%
Prince Albert RCSSD 6 1,121,073 323,688 349,188 1,793,949 5.8%
Regina RCSSD 81 2,043,356 2,553,736 (201,272) 4,395,820 4.1%
Regina SD 4 7,292,069 1,102,677 (2,554,742) 5,840,004 2.6%
Sask Rivers SD 119 3,034,367 (87,155) 395,207 3,342,418 3.6%
Saskatoon SD 13 4,013,502 (298,851) (1,307,296) 2,407,355 1.0%
SE Cornerstone SD 209 1,821,413 (419,341) 495,403 1,897,475 2.0%
St. Paul's RCSSD 20 (43,279) 1,047,552 (1,060,499) (56,226) 0.0%
Sun West SD 207 790,942 (790,203) 129,842 130,580 0.2%
* Amounts include changes due to both operating and capital; some shifts reflect amounts
previously spent on school‐division funded capital
** Changes were not fully implemented because of SFL transition
72
Conclusion
On balance, the funding distribution model works as intended. The recommendations from this
review will strengthen it, thereby enhancing equity across the education system. The model itself
is a methodology for allocating available dollars to school divisions on an unconditional basis.
School boards have the autonomy to make budget decisions in accordance with local priorities.
The funding model should operate the same way regardless of the province’s fiscal circumstances
‐ in both good times and in bad. Government will determine available funding levels, and then
those dollars should be run through the model and allocated. There will be implications for
individual school divisions as the model is intended to distribute funds in the most equitable way
possible.
Ultimately, this is about enabling all children in the province to access quality instruction, the
supports they need to learn, have a safe and welcoming environment at school and be able to
travel safely to and from school every day. By preserving the integrity of the model, parents,
citizens and communities can be confident that public dollars are being allocated effectively and
efficiently in support of quality education outcomes; and school divisions will have some level of
predictability and stability within the context of Government’s fiscal circumstances.
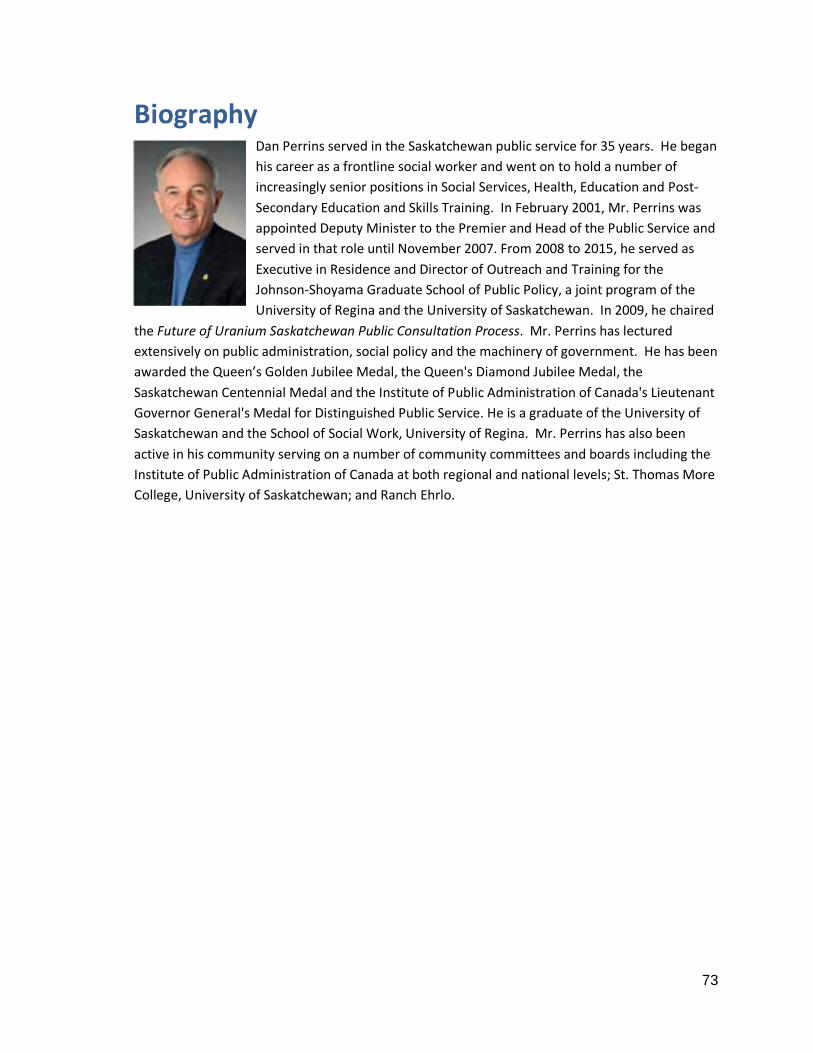
73
Biography Dan Perrins served in the Saskatchewan public service for 35 years. He began
his career as a frontline social worker and went on to hold a number of
increasingly senior positions in Social Services, Health, Education and Post‐
Secondary Education and Skills Training. In February 2001, Mr. Perrins was
appointed Deputy Minister to the Premier and Head of the Public Service and
served in that role until November 2007. From 2008 to 2015, he served as
Executive in Residence and Director of Outreach and Training for the
Johnson‐Shoyama Graduate School of Public Policy, a joint program of the
University of Regina and the University of Saskatchewan. In 2009, he chaired
the Future of Uranium Saskatchewan Public Consultation Process. Mr. Perrins has lectured
extensively on public administration, social policy and the machinery of government. He has been
awarded the Queen’s Golden Jubilee Medal, the Queen's Diamond Jubilee Medal, the
Saskatchewan Centennial Medal and the Institute of Public Administration of Canada's Lieutenant
Governor General's Medal for Distinguished Public Service. He is a graduate of the University of
Saskatchewan and the School of Social Work, University of Regina. Mr. Perrins has also been
active in his community serving on a number of community committees and boards including the
Institute of Public Administration of Canada at both regional and national levels; St. Thomas More
College, University of Saskatchewan; and Ranch Ehrlo.
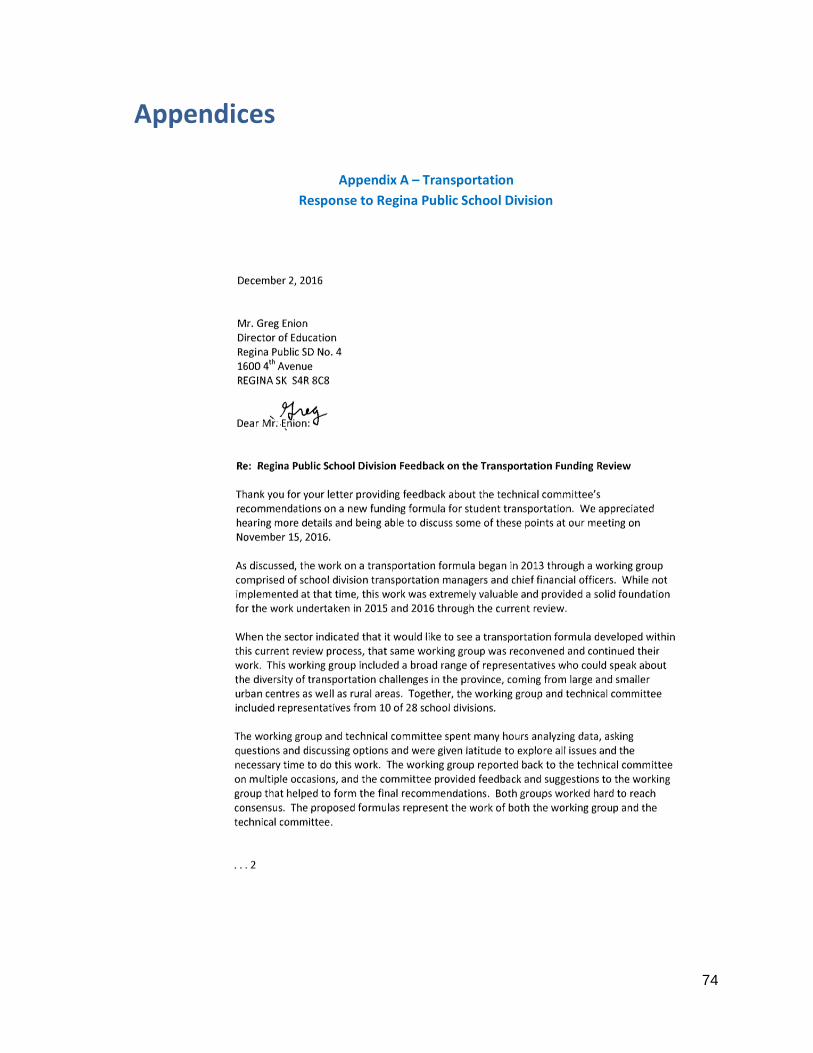
74
Appendices
Appendix A – Transportation
Response to Regina Public School Division
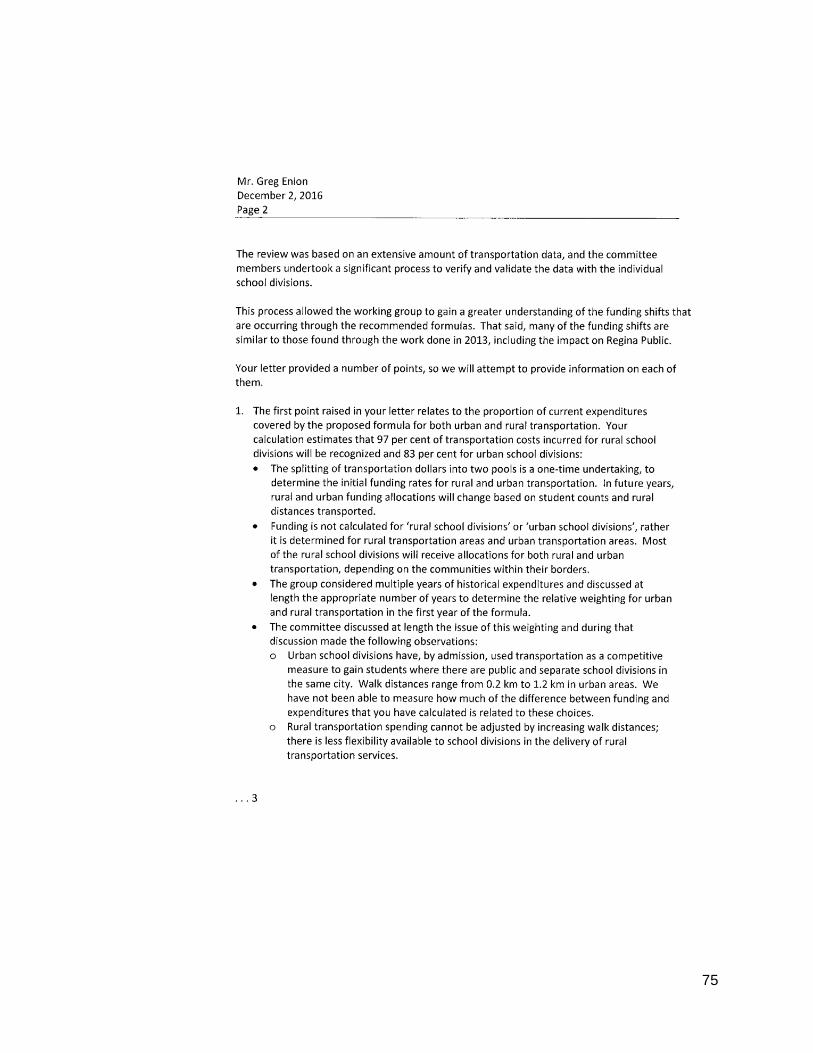
75
76
77
78
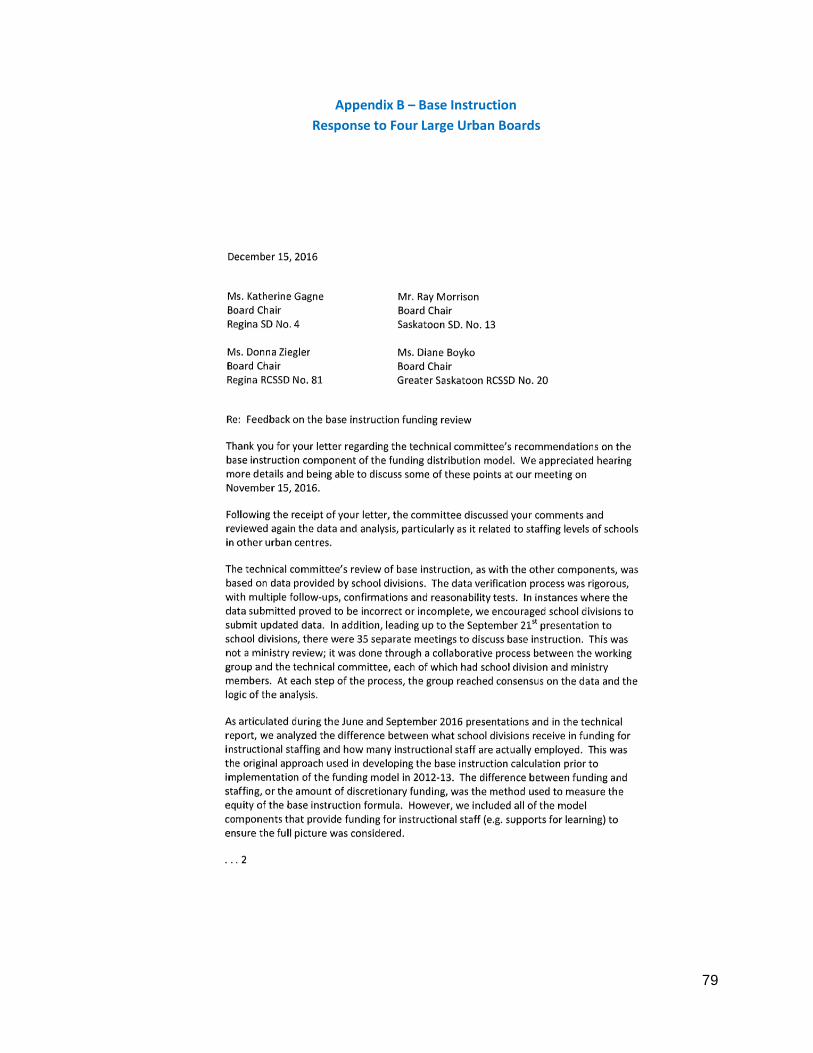
79
Appendix B – Base Instruction
Response to Four Large Urban Boards
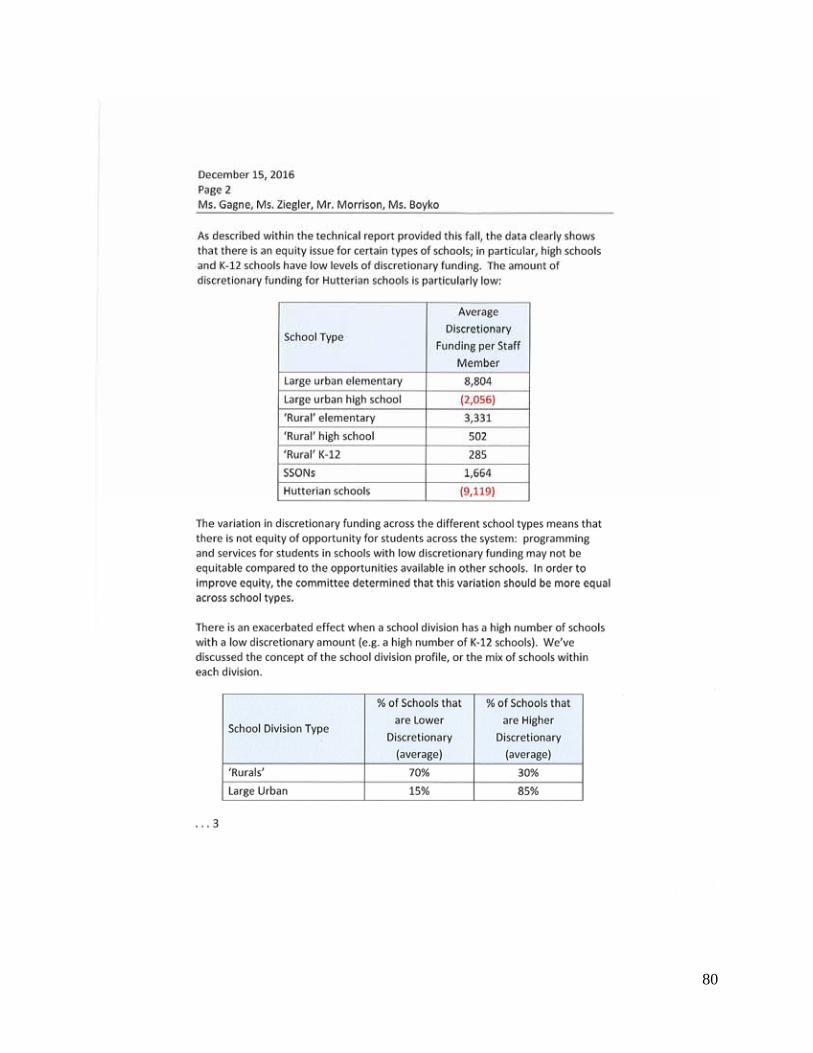
80
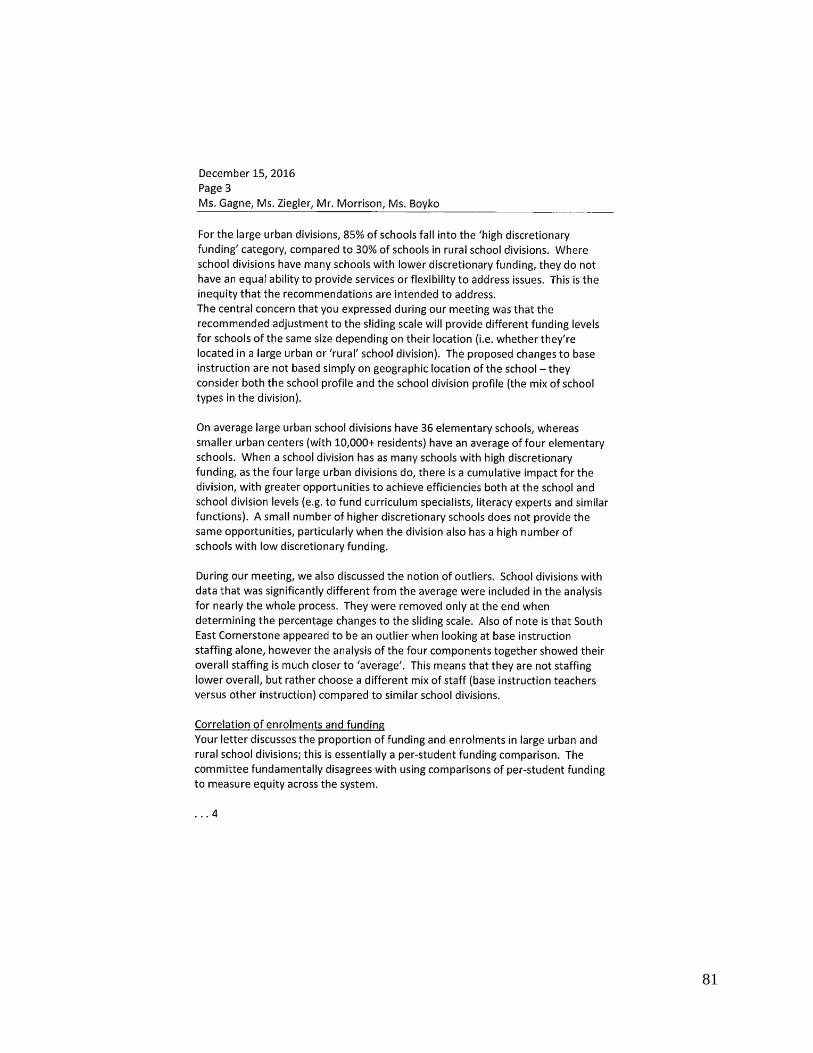
81
82
83
84
85
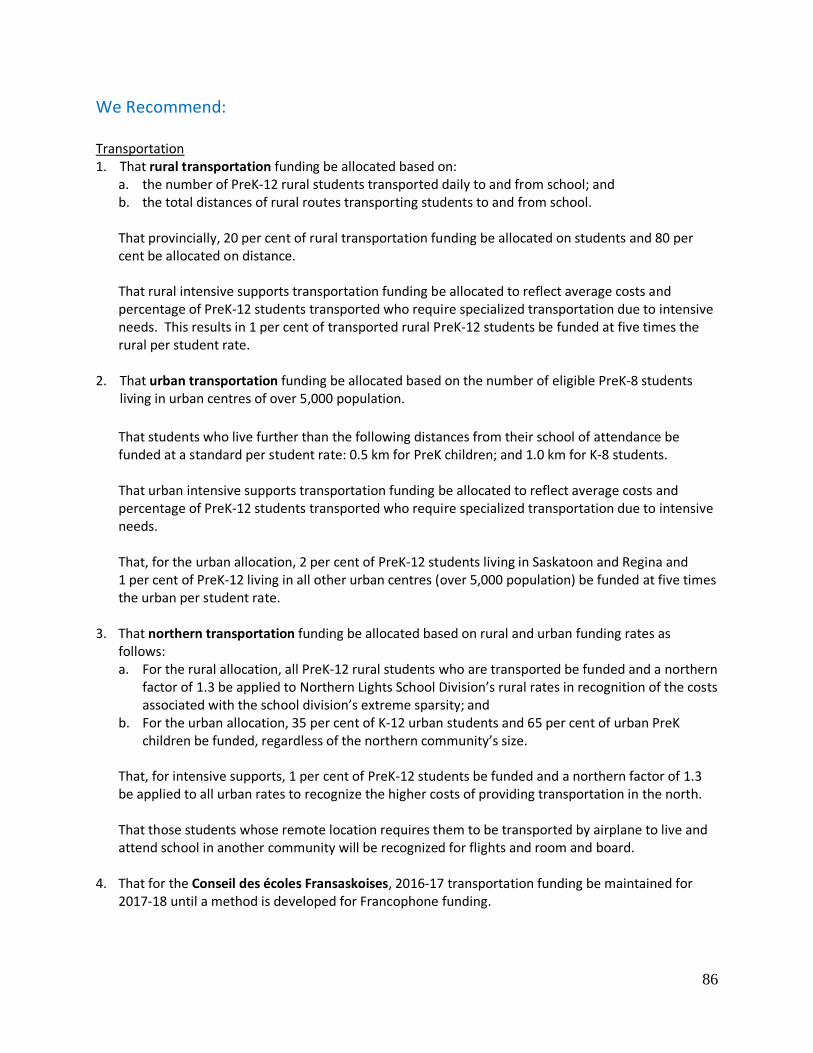
86
We Recommend: Transportation 1. That rural transportation funding be allocated based on:
a. the number of PreK‐12 rural students transported daily to and from school; and b. the total distances of rural routes transporting students to and from school.
That provincially, 20 per cent of rural transportation funding be allocated on students and 80 per cent be allocated on distance.
That rural intensive supports transportation funding be allocated to reflect average costs and percentage of PreK‐12 students transported who require specialized transportation due to intensive needs. This results in 1 per cent of transported rural PreK‐12 students be funded at five times the rural per student rate.
2. That urban transportation funding be allocated based on the number of eligible PreK‐8 students
living in urban centres of over 5,000 population.
That students who live further than the following distances from their school of attendance be funded at a standard per student rate: 0.5 km for PreK children; and 1.0 km for K‐8 students.
That urban intensive supports transportation funding be allocated to reflect average costs and percentage of PreK‐12 students transported who require specialized transportation due to intensive needs.
That, for the urban allocation, 2 per cent of PreK‐12 students living in Saskatoon and Regina and 1 per cent of PreK‐12 living in all other urban centres (over 5,000 population) be funded at five times the urban per student rate.
3. That northern transportation funding be allocated based on rural and urban funding rates as
follows: a. For the rural allocation, all PreK‐12 rural students who are transported be funded and a northern
factor of 1.3 be applied to Northern Lights School Division’s rural rates in recognition of the costs associated with the school division’s extreme sparsity; and
b. For the urban allocation, 35 per cent of K‐12 urban students and 65 per cent of urban PreK children be funded, regardless of the northern community’s size.
That, for intensive supports, 1 per cent of PreK‐12 students be funded and a northern factor of 1.3 be applied to all urban rates to recognize the higher costs of providing transportation in the north.
That those students whose remote location requires them to be transported by airplane to live and attend school in another community will be recognized for flights and room and board.
4. That for the Conseil des écoles Fransaskoises, 2016‐17 transportation funding be maintained for
2017‐18 until a method is developed for Francophone funding.
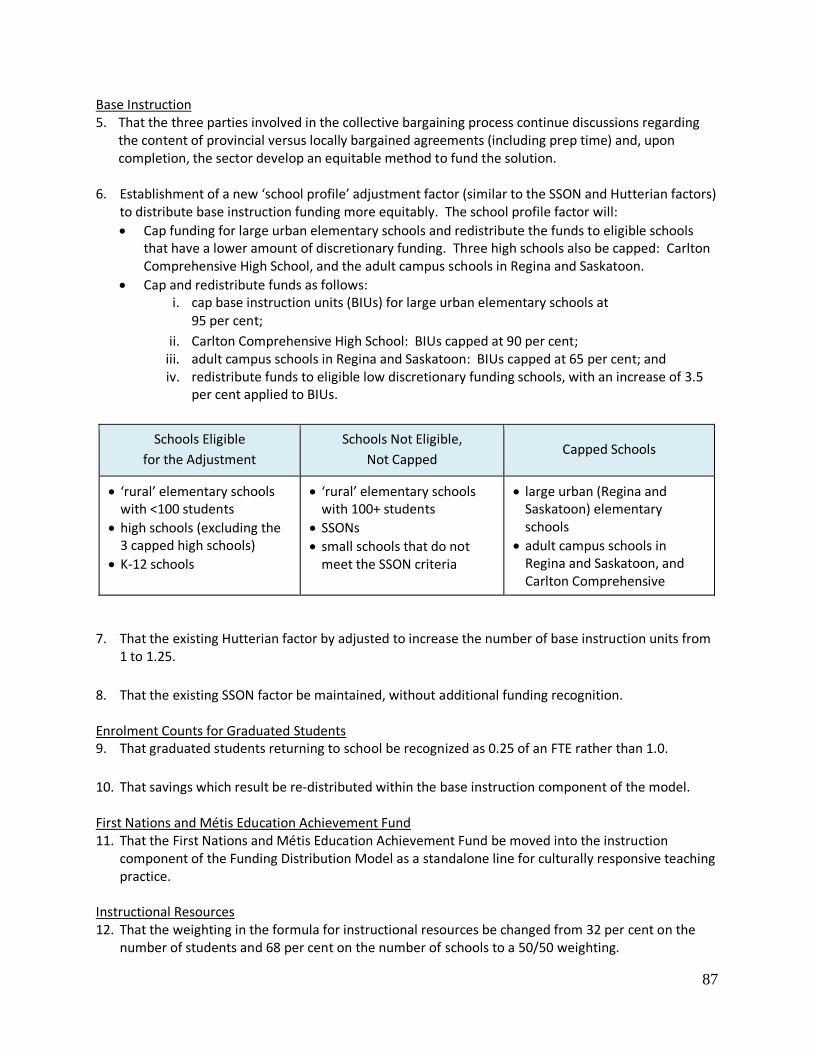
87
Base Instruction 5. That the three parties involved in the collective bargaining process continue discussions regarding
the content of provincial versus locally bargained agreements (including prep time) and, upon completion, the sector develop an equitable method to fund the solution.
6. Establishment of a new ‘school profile’ adjustment factor (similar to the SSON and Hutterian factors) to distribute base instruction funding more equitably. The school profile factor will:
Cap funding for large urban elementary schools and redistribute the funds to eligible schools that have a lower amount of discretionary funding. Three high schools also be capped: Carlton Comprehensive High School, and the adult campus schools in Regina and Saskatoon.
Cap and redistribute funds as follows: i. cap base instruction units (BIUs) for large urban elementary schools at
95 per cent;
ii. Carlton Comprehensive High School: BIUs capped at 90 per cent; iii. adult campus schools in Regina and Saskatoon: BIUs capped at 65 per cent; and iv. redistribute funds to eligible low discretionary funding schools, with an increase of 3.5
per cent applied to BIUs.
Schools Eligible
for the Adjustment
Schools Not Eligible,
Not Capped Capped Schools
‘rural’ elementary schools with <100 students
high schools (excluding the 3 capped high schools)
K‐12 schools
‘rural’ elementary schools with 100+ students
SSONs small schools that do not meet the SSON criteria
large urban (Regina and Saskatoon) elementary schools
adult campus schools in Regina and Saskatoon, and Carlton Comprehensive
7. That the existing Hutterian factor by adjusted to increase the number of base instruction units from 1 to 1.25.
8. That the existing SSON factor be maintained, without additional funding recognition. Enrolment Counts for Graduated Students 9. That graduated students returning to school be recognized as 0.25 of an FTE rather than 1.0.
10. That savings which result be re‐distributed within the base instruction component of the model. First Nations and Métis Education Achievement Fund 11. That the First Nations and Métis Education Achievement Fund be moved into the instruction
component of the Funding Distribution Model as a standalone line for culturally responsive teaching practice.
Instructional Resources 12. That the weighting in the formula for instructional resources be changed from 32 per cent on the
number of students and 68 per cent on the number of schools to a 50/50 weighting.
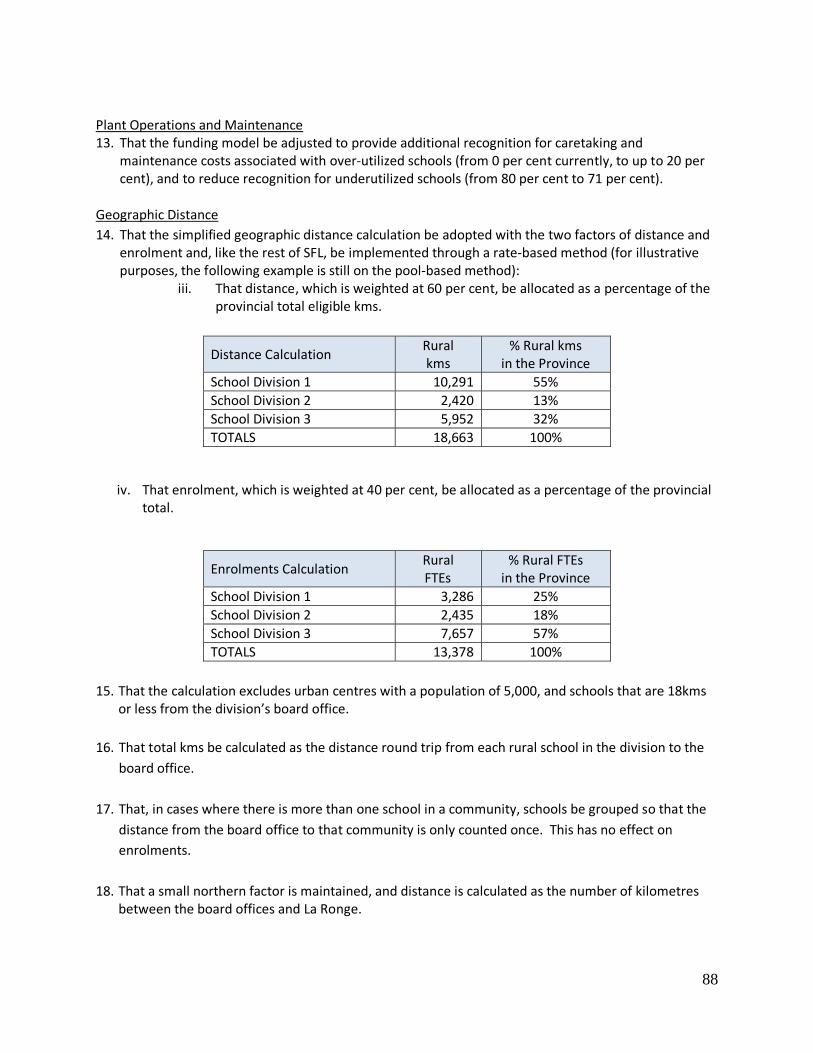
88
Plant Operations and Maintenance 13. That the funding model be adjusted to provide additional recognition for caretaking and
maintenance costs associated with over‐utilized schools (from 0 per cent currently, to up to 20 per cent), and to reduce recognition for underutilized schools (from 80 per cent to 71 per cent).
Geographic Distance
14. That the simplified geographic distance calculation be adopted with the two factors of distance and enrolment and, like the rest of SFL, be implemented through a rate‐based method (for illustrative purposes, the following example is still on the pool‐based method):
iii. That distance, which is weighted at 60 per cent, be allocated as a percentage of the provincial total eligible kms.
Distance Calculation Rural kms
% Rural kms in the Province
School Division 1 10,291 55%
School Division 2 2,420 13%
School Division 3 5,952 32%
TOTALS 18,663 100%
iv. That enrolment, which is weighted at 40 per cent, be allocated as a percentage of the provincial total.
Enrolments Calculation Rural FTEs
% Rural FTEs in the Province
School Division 1 3,286 25%
School Division 2 2,435 18%
School Division 3 7,657 57%
TOTALS 13,378 100%
15. That the calculation excludes urban centres with a population of 5,000, and schools that are 18kms or less from the division’s board office.
16. That total kms be calculated as the distance round trip from each rural school in the division to the
board office.
17. That, in cases where there is more than one school in a community, schools be grouped so that the
distance from the board office to that community is only counted once. This has no effect on
enrolments.
18. That a small northern factor is maintained, and distance is calculated as the number of kilometres between the board offices and La Ronge.
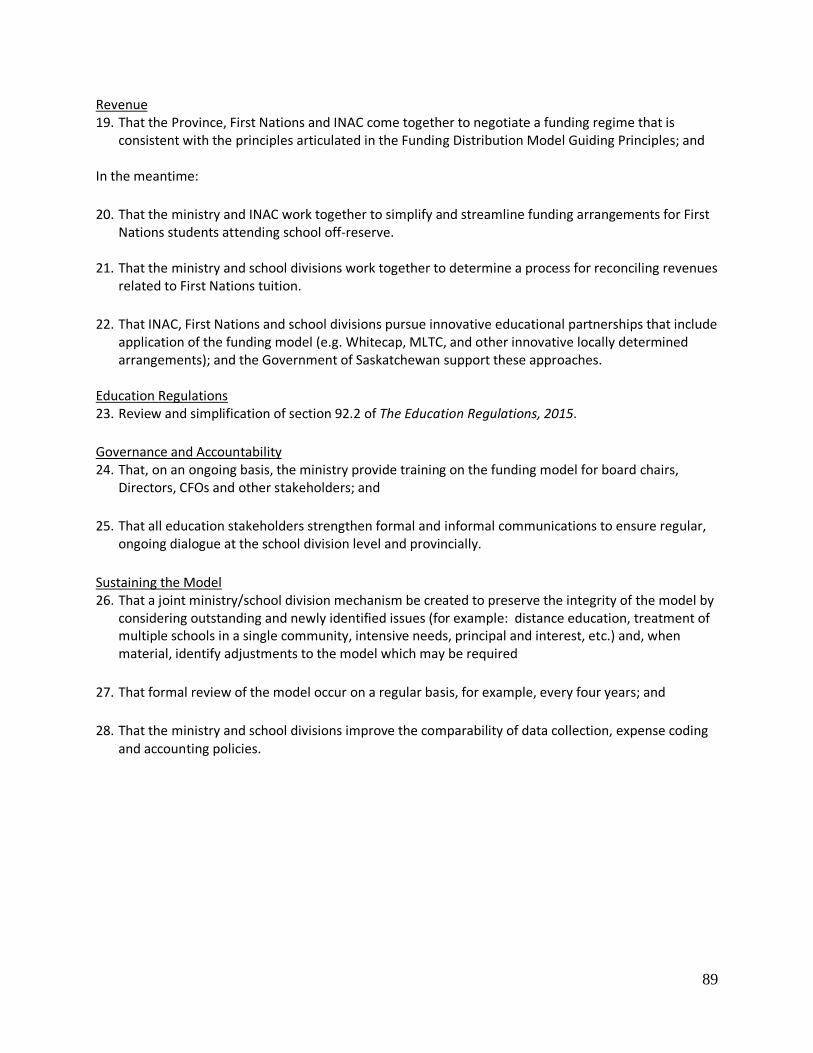
89
Revenue 19. That the Province, First Nations and INAC come together to negotiate a funding regime that is
consistent with the principles articulated in the Funding Distribution Model Guiding Principles; and In the meantime:
20. That the ministry and INAC work together to simplify and streamline funding arrangements for First Nations students attending school off‐reserve.
21. That the ministry and school divisions work together to determine a process for reconciling revenues related to First Nations tuition.
22. That INAC, First Nations and school divisions pursue innovative educational partnerships that include application of the funding model (e.g. Whitecap, MLTC, and other innovative locally determined arrangements); and the Government of Saskatchewan support these approaches.
Education Regulations 23. Review and simplification of section 92.2 of The Education Regulations, 2015.
Governance and Accountability 24. That, on an ongoing basis, the ministry provide training on the funding model for board chairs,
Directors, CFOs and other stakeholders; and
25. That all education stakeholders strengthen formal and informal communications to ensure regular, ongoing dialogue at the school division level and provincially.
Sustaining the Model 26. That a joint ministry/school division mechanism be created to preserve the integrity of the model by
considering outstanding and newly identified issues (for example: distance education, treatment of multiple schools in a single community, intensive needs, principal and interest, etc.) and, when material, identify adjustments to the model which may be required
27. That formal review of the model occur on a regular basis, for example, every four years; and
28. That the ministry and school divisions improve the comparability of data collection, expense coding and accounting policies.
Related Documents