TTEA (2014) 27-45 © STM Journals 2014. All Rights Reserved Page 27 Trends in Transport Engineering and Applications Volume 1, Issue 1 www.stmjournals.com Review of Simulation Techniques for Microscopic Mobility of Pedestrian Movement Pritikana Das 1 *, M. Parida 1 , V. K. Katiyar 2 1 Centre for Transportation Systems, CTRANS, IIT Roorkee-247667, India 2 IIT Roorkee-247667, India Abstract Simulation techniques are very useful for developing models or systems over time to represent the real-world scenarios. The model represents the key characteristics or behaviors/functions of the selected physical or abstract system or process. Simulation techniques are useful when the real system cannot be engaged, because of inaccessibility, or dangerous or is unacceptable to engage or does not exist. Microscopic characteristics of pedestrian traffic consider speeds, walking directions, distances between pedestrians, relative positions, passing behavior and group behavior. In microscopic approach individual pedestrians are evaluated in the study which is required for detailed design of pedestrian infrastructure. In this study various microsimulation models, tools and microscopic data collection techniques have been discussed briefly to encourage designers, policy planners to implement pedestrian facilities considering the microscopic approach. Level of service criterion and guidance for capacity manual can be implemented by including microscopic characteristics of pedestrians. Microscopic simulation models are broadly divided into five categories named cellular-based model, physical force-based model, behavioral modeling, queuing network model and agent- based model. Various simulation tools are basically based on these four models. Nowadays a new model combining cellular automata and social-force model has been proposed. This study is required to update designers or planners about various microscopic approaches and helpful for designing real situation with details of pedestrian movement to improve pedestrian traffic facilities. Keywords: Pedestrian flow, microscopic simulation, social force, cellular automata, magnetic force *Author for Correspondence Email: [email protected] INTRODUCTION Computer simulation is an efficient tool for analysis of real situation and also it is useful to test various conditions those are not possible to be observed in field, difficult to observe and expensive or hazardous for experimentation. “Simulation is the imitation of the operation of a real-world process or system over time” [1]. Microsimulation was started in mid-1980s with the rapid progress of computer technology. In microscopic simulation individual behavior of a person can be observed with interaction between various persons. Each pedestrian occupies certain space in time as an individual agent in the microscopic model. In macroscopic pedestrian simulation only behavior of a group can be observed but interaction between pedestrians cannot be considered. For detailed design purpose, there is a need to consider macroscopic pedestrian simulation such as lane changing behavior of pedestrians. In this study a review of past studies in this field has been covered. The study has been done on various microscopic simulation models and software. More realistic performance of pedestrian movement can be described using microscopic pedestrian simulation model. Simulation technique can be used to develop an optimal approach in design before implementation of any policy in pedestrian infrastructure. Walking has benefits on health, environment and economy. Safety and security, convenience and government policy should be

Welcome message from author
This document is posted to help you gain knowledge. Please leave a comment to let me know what you think about it! Share it to your friends and learn new things together.
Transcript
TTEA (2014) 27-45 © STM Journals 2014. All Rights Reserved Page 27
Trends in Transport Engineering and Applications
Volume 1, Issue 1
www.stmjournals.com
Review of Simulation Techniques for Microscopic
Mobility of Pedestrian Movement
Pritikana Das1*, M. Parida
1, V. K. Katiyar
2
1Centre for Transportation Systems, CTRANS, IIT Roorkee-247667, India
2IIT Roorkee-247667, India
Abstract Simulation techniques are very useful for developing models or systems over time to represent the real-world scenarios. The model represents the key characteristics or
behaviors/functions of the selected physical or abstract system or process. Simulation
techniques are useful when the real system cannot be engaged, because of inaccessibility, or dangerous or is unacceptable to engage or does not exist. Microscopic characteristics
of pedestrian traffic consider speeds, walking directions, distances between pedestrians,
relative positions, passing behavior and group behavior. In microscopic approach individual pedestrians are evaluated in the study which is required for detailed design of
pedestrian infrastructure. In this study various microsimulation models, tools and microscopic data collection techniques have been discussed briefly to encourage
designers, policy planners to implement pedestrian facilities considering the microscopic
approach. Level of service criterion and guidance for capacity manual can be implemented by including microscopic characteristics of pedestrians. Microscopic
simulation models are broadly divided into five categories named cellular-based model,
physical force-based model, behavioral modeling, queuing network model and agent-based model. Various simulation tools are basically based on these four models.
Nowadays a new model combining cellular automata and social-force model has been proposed. This study is required to update designers or planners about various
microscopic approaches and helpful for designing real situation with details of
pedestrian movement to improve pedestrian traffic facilities.
Keywords: Pedestrian flow, microscopic simulation, social force, cellular automata,
magnetic force
*Author for Correspondence Email: [email protected]
INTRODUCTION Computer simulation is an efficient tool for
analysis of real situation and also it is useful to
test various conditions those are not possible
to be observed in field, difficult to observe and
expensive or hazardous for experimentation.
“Simulation is the imitation of the operation of
a real-world process or system over time” [1].
Microsimulation was started in mid-1980s
with the rapid progress of computer
technology. In microscopic simulation
individual behavior of a person can be
observed with interaction between various
persons. Each pedestrian occupies certain
space in time as an individual agent in the
microscopic model. In macroscopic pedestrian
simulation only behavior of a group can be
observed but interaction between pedestrians
cannot be considered. For detailed design
purpose, there is a need to consider
macroscopic pedestrian simulation such as
lane changing behavior of pedestrians. In this
study a review of past studies in this field has
been covered. The study has been done on
various microscopic simulation models and
software. More realistic performance of
pedestrian movement can be described using
microscopic pedestrian simulation model.
Simulation technique can be used to develop
an optimal approach in design before
implementation of any policy in pedestrian
infrastructure.
Walking has benefits on health, environment
and economy. Safety and security,
convenience and government policy should be
Microscopic Mobility of Pedestrian Movement Das et al.
TTEA (2014) 27-45 © STM Journals 2014. All Rights Reserved Page 28
formulated to encourage pedestrians. The
provisions of pedestrian capacity in HCM
2012 are principally guided by macroscopic
approach and there is a definite possibility that
microscopic modeling can further fine-tune the
results.
Past Studies on Pedestrian Microsimulation
Microscopic pedestrian simulation depicts the
process of creating a virtual model of
pedestrian infrastructure to simulate the
interactions and other microscopic detail. This
involves treating each pedestrian in the model
as a unique entity with its own goals and
behavioral characteristics; each possessing the
ability to interact with other entities in the
model. It has two branches, simulation model
and simulation software. Microscopic
pedestrian simulation using computer started
since the mid-1980s [2]. An analytical
approach for microscopic pedestrian model
was proposed by Henderson in 1974 [3].
Gipps and Murksjo in 1985 proposed a
microsimulation model for interactions
between pedestrians considering existence of
repulsive forces between pedestrians [4]. In
1987, Reynolds studied microscopic-
pedestrian-simulation-model (MPSM) from
computer games and animations [5]. Two
classes of parameters were produced, first
class parameters (mean speed and flows of the
various classes of pedestrian) which were set
by the user to characterize the situation being
simulated and second class of parameters were
transparent to the user and consist of the
pattern of scores and maintain a straight-line
movement when approaching another
pedestrian too closely. Graphical computer
simulation was used in this study. A model
was proposed by Okazaki and Matsushita in
1993 to simulate pedestrian movement with
evacuation and queuing considering the
motion of a magnetized object in a magnetic
field [6]. EVACSIM simulation tool was
performed a process-oriented, discrete-event
simulation to model pedestrian as a queuing
network customer and the pedestrian
movement as the queuing network process by
Lovas in 1994 [7]. Helbing and Molnar in
1997 demonstrated the detailed design and
pedestrian interaction using microscopic
pedestrian simulation to determine the flow
performance of pedestrians [8]. Helbing et al.
described microscopic simulations of
pedestrian streams based on a behavioral force
model [9]. Teknomo et al. in 2000 reviewed
various microscopic simulation models [10]. A
two dimensional cellular automaton model
was proposed by Burstedde et al. in 2001 [11]
to simulate pedestrian behavior considering
particle attraction and repulsion between
identical and different particles respectively
and lane formation. Teknomo proposed a new
microscopic data collection system
considering αTXY database, used as a bridge
between microscopic pedestrian simulation
models, video data collection and microscopic
pedestrian characteristics in 2002 [12]. He
proposed the design of pedestrian facilities not
merely a space allocation but other forms of
flow controls in space, time and direction in
the microscopic level when pedestrian
interaction is considered. Microscopic
simulation of evacuation processes for
pedestrian dynamics was done in 2002 using
cellular automata by Kirchner and
Schadschneider [13].
Pedestrian flow has been simulated by
Hoogendoorn and Bovy considering optimal
control and differential games to observe
pedestrian walking behavior [14]. NOMAD
microsimulation tool was introduced by
Hoogendoorn [15]. Run-time parameters,
network topology, parameters describing
walking behavior, Activity scheduling and
route choice parameters, times and parameters
describing emergency conditions and location
of virtual detector loops were considered as
input parameters in the simulation model.
NOMAD is based on activity area, route
choice (tactical level) and walking behavior
(operational level). A cellular automata model
was proposed by Jian et al. to simulate bi-
direction pedestrian movement considering the
human flexibility and intelligence as well as
the virtual ‘‘force’’ among pedestrians [16].
Pedestrian movement mechanism was studied
using the proposed model. Teknomo described
possible application of the microscopic
pedestrian model [17]. A new model was
developed to improve the quality of pedestrian
movement by considering their interaction in a
microscopic level. Three microscopic
simulation scenarios were considered to
validate the model. Progress in simulation
studies for pedestrian traffic has been
described by Zhang et al. [2].
Trends in Transport Engineering and Applications
Volume 1, Issue 1
TTEA (2014) 27-45 © STM Journals 2014. All Rights Reserved Page 29
Zacharias et al. predicted pedestrian volume
along corridors in a shopping environment
which was based on the several simple
pedestrian-centered heuristics [18]. These
heuristics for the computer models are random
walk, distance-limited walk, connectivity walk
and connectivity walk. Discrete choice model
was proposed by various researchers to
determine direction and speed of pedestrians at
each time interval [19–21]. A numerical model
was proposed by Yamamoto et al. in 2007 to
simulate pedestrian dynamics based on Real
Coded Lattice Gas model [22]. A generic
approach was proposed by Hoogendoorn and
Daamen to identify parameters for
microscopic models and particular for walker
models [23]. Xianqiang et al. studied group
behavior of pedestrians based on
psychophysiology and behavior science [24].
Asano et al. proposed a microscopic
movement model to describe the decision-
making process of pedestrians trying to
minimize their travel times while avoiding
collisions using a multi-player game theory
[25]. A calibration methodology was proposed
for microscopic pedestrian models using
pedestrian trajectory data by Hoogendoorn and
Daamen [26]. All kinds of statistical tests, t-
test for parameters significance and likelihood-
ratio test was considered in this methodology.
A microscopic pedestrian simulation model
consisting of an operational model which
describes pedestrians’ avoidance behavior and
a tactical model, describes pedestrians’ route
choices has been proposed by Asano et al.
[27]. A simulation model has been proposed
for pedestrian collective behavior by Zhang
and Han considering follow effect, deterrent
effect and rejection effect to influence
pedestrian decisions [28]. Level of Service
scheme was proposed by Kretz considering
density of pedestrians, speed constant and
crowd pressure over the square of a second
speed constant for microscopic simulation of
pedestrians [29]. A model was developed
using social force model and cellular automata
model to determine movement method for
different groups of pedestrians by Kormanova
[30].
Overview on Microscopic Pedestrian
Simulation Models
Microscopic simulation models studied in past
are described in this section. Microscopic
simulation models are broadly divided into
four categories, cellular-based, physical force-
based, queuing network and agent-based
model. Various microscopic simulation
models, benefit cost cellular model, cellular
automata model, magnetic force model, social
force model, behavioral model, queuing
network model (CA-Ped model, floor field
model) and agent-based models are described
here.
Cellular-Based Model
Benefit Cost Cellular Model [5]
This model was proposed by Gipps and
Marksjo in 1985 considering pedestrian as a
particle in a cell. Area of a cell was considered
as 0.5 × 0.5 m2. They proposed a cell can be
occupied by only one pedestrian at a time and
score will be assigned based on proximity to
pedestrians considering repulsive effect of the
nearby pedestrians. The score in each cell is
the sum of the score generated by pedestrian
individually when the field of two pedestrians
overlaps. Pedestrian movement is based on the
net benefit. The score was calculated
considering eight-cell neighbor of the
pedestrian.
Score was assigned to each cell based on its
proximity to pedestrians. Repulsive effects of
nearby pedestrians with the balanced against
the gains that is the subject moving towards
his destination represent by the obtained score
of a cell individually. Gipps and Marksjo
define “scores in the surrounding cells are
approximately inversely proportional to the
square of the separation of pedestrians in the
two cells.” Movement of each pedestrian
obtained by net-benefit[S- ] value which
was obtained by subtracting the cost of
moving closer to other pedestrians (as
measured by the score in the cell) from the
gain the subject obtains by moving closer to
his destination. can be estimated using
Eq. (1) or Eq. (3) and using Eq. (2)
will be evaluated.
(1)
where,
K = A constant of proportionality to enable the
gain of moving in a straight-line to be
balanced against the costs of approaching
other pedestrians too closely.
Microscopic Mobility of Pedestrian Movement Das et al.
TTEA (2014) 27-45 © STM Journals 2014. All Rights Reserved Page 30
σi = Angle by which the pedestrian deviates
from a straight-line to his immediate
destination when moving to cell i.
(2)
where,
x = location of the target cell,
S = location of the subject
D = location of the destination
(3)
Cost score of cell was calculated by
considering Eq. (4),
(4)
Cellular Automata (CA) Model [31–35]
Cellular Automata is a discrete choice model
for microscopic simulation. A cellular
automaton consists of a regular grid of cells,
each in one of a possible finite number of
states, updation in discrete time steps with
local, identical interaction rules. There are two
types of cellular automata – stochastic cellular
automaton and asynchronous cellular
automaton based on the updating properties.
Evaluation of each cell is based on the
neighborhood of each cell in lattice. In one-
dimensional lattice, the neighborhood consists
of the cell itself plus its adjacent cells. There
are 23 = 8 possible combinations of cell values
in the neighborhood. There are three types of
neighborhoods used for two-dimensional
cellular automata – von Neumann
neighborhood, Moore neighborhood and
extended Moore neighborhood.
Cellular automata model was proposed by
Neumann and Ulam in early 1950. Cellular
automata are mathematical models for systems
to produce complicated patterns of behavior.
These models are discrete in space, time and
state variable. It consists of a regular grid of
cells with a finite number of k possible states
and updation of model is based on local
interaction rules. Conway’s (1970) “Game of
Life” is an application of cellular automata
microscopic simulation in two-dimensional
concept [36]. Wolfram (since 1983) worked in
this field. He worked on classification of CA
models as mathematical models for self-
organizing statistical systems and application
of CA in various fields like biology, sociology,
mathematics, physics, art and technology.
Nagel and Schrekenberg have done simulation
for freeway traffic using cellular automata
model [37]. A study was done by Packard and
Wolfram on two-dimensional cellular
automata with values of 0 and 1 at each side
considering k = 2. Quantitative
characterization of global properties of two-
dimensional cellular automata was discussed
by them [38]. Evolution of each cell can be
determined considering neighborhood for each
cell. Blue and Adler worked on CA to simulate
fundamental pedestrian flows considering
unidirectional movement [39]. Blue and Adler
proposed a microsimulation model, CA-Ped
model for modeling bi-directional pedestrian
walkways considering three modes of bi-
directional pedestrian flow flows in
directionally separated lanes, interspersed flow
and dynamic multi-lane (DML) flow [40]. A
bionics approach to describe the interaction
between the pedestrians in evacuation process
was described by Kirhner and Schadshneider
using cellular automata [13]. Two-dimensional
cellular automaton model for the simulation of
pedestrian dynamics was proposed by
Schadschneider to simulate large crowds faster
than real time considering nearest-neighbor
interactions and floor-field model was
introduced [41]. A new tool Real Coded
Cellular Automata invented by Yamamoto et
al. to describe pedestrian dynamics
considering Moore neighborhood for
movement of pedestrians [22]. Effect of back
stepping and phase transition of the bi-
direction pedestrian movement was studied
using cellular automata by Fang et al. [42].The
impact of the sensitivity parameters kS and kD
quantitatively during evacuation processes
described by Kirhner et al. using stochastic
cellular automaton [43]. The two-dimension
pedestrian movement in corridor, the phase
transition phenomenon of pedestrian
movement was simulated by Jian et al.
considering exchange position between face-
to-face pedestrians [16]. The considerable
probability of position-exchange is about 0.20
in this study. Various cellular automata rules
were simulated using Matlab by
Athanassopoulos et al. to provide an excellent
platform for performing complex
computations with the help of only local
information [44]. Other languages like C, C++,
Trends in Transport Engineering and Applications
Volume 1, Issue 1
TTEA (2014) 27-45 © STM Journals 2014. All Rights Reserved Page 31
and FORTRAN can be used for cellular
automata simulation.
CA-Ped Model [40, 45, 46] Model was proposed by Blue and Adler
considering emergent behavior for bi-
directional pedestrian walkways. Three modes
of bi-directional pedestrian flow modeling
flows in directionally separated lanes,
interspersed flow and dynamic multi-lane
(DML) flow were considered. Simulation
results were able to capture fundamental
properties of pedestrian movement.
Sidestepping, forward movement and conflict
mitigation were considered as fundamental
elements of pedestrian movements in bi-
directional microscopic pedestrian flow
modeling. CA rule set was applied with two
parallel update stages according to local rules
for each pedestrian. This parallel update
procedure was used by Rickert with other
researchers and is also used by Simon and
Gutowitz [46] for vehicular traffic.
A circular lattice of size 1000*10 with square
cells at 0.457 m per side was used (occupying
a minimum area of 0.21 m2) as input
parameters for simulation. 19 different
densities ranging from 5 to 95% lattice
occupancy in intervals of 5% was considered
in experiment to observe fundamental
parameters of pedestrian flow. Speed
distribution was done based on three different
types of walkers (fast, standard, and slow). Six
different directional splits were considered for
experiments, varied from uni-directional flow
to balanced flow.
In speed-density relationship linear
Greenshields model aligned with the
beginning and end-points of the CA-Ped-based
unidirectional curve divides the two halves of
the S-curve into two arcs positioned on either
side of the Greenshields line. In this model,
interspersed flow and DML bi-directional
curves differ from the unidirectional and bi-
directional separated flow S-curve. CA-Ped
model considers integer arithmetic
calculations. Maximum flow occurs within 0.2
to 0.5 density ranges in this model. In lane
changing condition, mode locking occurs at
low-density range and at high-density range
effects hinder overall flow and sidestepping
affect the shape of the S-curve for speed-
density. The inclusion of place exchange
allows the model to avoid deadlocks.
Floor Field Model [47] Floor field model is a cellular automaton
model for studying evacuation dynamics. The
static floor field describes the shortest distance
to an exit door and the dynamic floor field is a
virtual trace left by the pedestrians. Floor field
model was extended for modeling panic
behavior of people evacuating from a room by
Nishinari and others. Lane formation in a
corridor, herding and oscillation at a
bottleneck was simulated in the extended
model. The coupling to the static field and
dynamic field characterizes, friction
parameter, constants control diffusion and
decay of the dynamic floor field and maximum
distance from the wall or obstruction are used
input parameters in this study. In this paper to
calculate the visibility graph and Dijkstra’s
algorithm were used and the effect of the static
floor field was modified by a factor pw
(consider Eq. (5)) the wall effect is restricted
up to the distance Dmax from the walls,
pw = exp(kW min(Dmax, d)) (5)
where, d = Minimum distance from all the
walls,
kW = A sensitivity parameter.
Spatial adapted parameters were introduced in
intelligent floor field cellular automation
model by Kirik et al. to simulate different
types of pedestrian movement, from regular to
panic [48]. Pedestrian evacuation in rooms
with internal obstacles and multiple exits was
simulated by modified floor field model by
Huang et al. considering logit-based discrete
choice principle [49]. A modified floor field
cellular automata model for simulating the
pedestrian evacuation was proposed by Guo
and Huang considering a high-density crowd
is asymmetric, accumulative and transferable
[50]. The space for evacuation was discretized
into smaller cells; each pedestrian was allowed
to occupy multiple cells considering the
interaction among pedestrians as characterized
by their own inertia.
Microscopic Mobility of Pedestrian Movement Das et al.
TTEA (2014) 27-45 © STM Journals 2014. All Rights Reserved Page 32
Physical Force-Based Model
Magnetic Force Model [51, 6]
Magnetic Force Model was developed by
Okazaki (1979–93). Movement of each
pedestrian was simulated considering the
motion of a magnetized object in a magnetic
field. Magnetic forces were estimated
considering Coulomb’s law, depending on
intensity of magnetic load of a pedestrian and
distance between pedestrians. Another force
collision between pedestrians and pedestrian
with obstacles was also included in this model.
In this model each pedestrian in the system
had given a positive charge and destinations
such as doorways or service counters
considered as negative charge. This magnetic
effect means that pedestrians exert a repulsive
force upon each other.
This model was developed by Okazaki to
study pedestrian behavior during evacuation in
real architectural space using two kinds of
magnetic poles. A model was simulated by
Okazaki and Matsushita considering two
cases, evacuation from an office building and
movement of pedestrians in queue spaces.
Location of the starting point, walking
velocity, time to start walking, orientation,
destination and method to walk (indicated
route, shortest route, way finding) data were
collected for each pedestrian and location of
walls, openings, columns, exits, and queue
spaces data were observed for the plan of
study location as input for the model
simulation.
Magnetic forces were calculated according to
Coulomb’s law (Eq. (6)):
(6)
where,
F = Magnetic force (vector)
k = Constant value
q1 = Intensity of magnetic load of a pedestrian
q2 = Intensity of a magnetic pole
x = Vector from a pedestrian to a magnetic
pole
r = Length of r
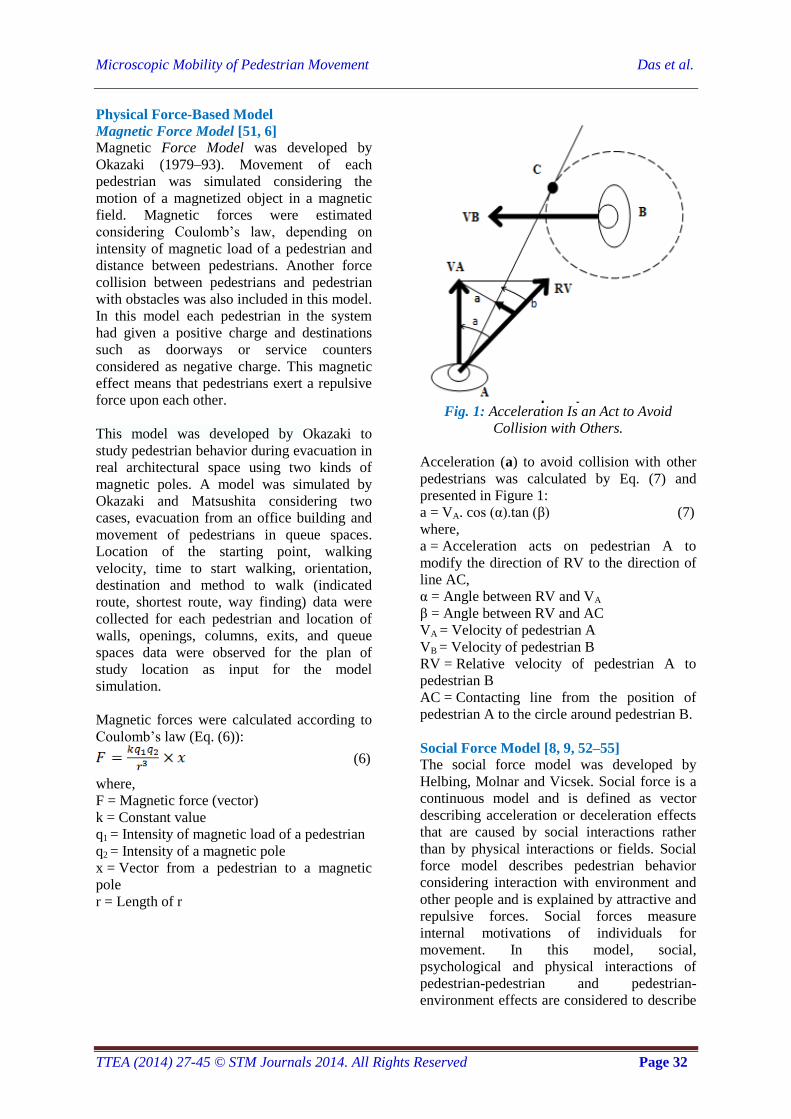
Fig. 1: Acceleration Is an Act to Avoid
Collision with Others.
Acceleration (a) to avoid collision with other
pedestrians was calculated by Eq. (7) and
presented in Figure 1:
a = VA. cos (α).tan (β) (7)
where,
a = Acceleration acts on pedestrian A to
modify the direction of RV to the direction of
line AC,
α = Angle between RV and VA
β = Angle between RV and AC
VA = Velocity of pedestrian A
VB = Velocity of pedestrian B
RV = Relative velocity of pedestrian A to
pedestrian B
AC = Contacting line from the position of
pedestrian A to the circle around pedestrian B.
Social Force Model [8, 9, 52–55]
The social force model was developed by
Helbing, Molnar and Vicsek. Social force is a
continuous model and is defined as vector
describing acceleration or deceleration effects
that are caused by social interactions rather
than by physical interactions or fields. Social
force model describes pedestrian behavior
considering interaction with environment and
other people and is explained by attractive and
repulsive forces. Social forces measure
internal motivations of individuals for
movement. In this model, social,
psychological and physical interactions of
pedestrian-pedestrian and pedestrian-
environment effects are considered to describe
Trends in Transport Engineering and Applications
Volume 1, Issue 1
TTEA (2014) 27-45 © STM Journals 2014. All Rights Reserved Page 33
social force. Self-organizing phenomenon can
be described using social force model.
A microscopic model similar to gas-kinetic
and fluid dynamic equations was proposed by
Helbing. Attractive and repulsive effects of
pedestrians were observed for constant
density, formation of groups, superposition of
attractive and repulsive effects, break of
symmetry for avoidance behavior by Helbing
to model pedestrian behavior mathematically.
A physical force is acting to reach a certain
destination at a certain time. Optimal behavior
of pedestrian movement was simulated by trial
and error process to give better behavioral
strategy in this model. Lewin’s theory was
followed to introduce psychic tension to act
towards its destination.
Systematic temporal changes of the preferred
velocity of a pedestrian were described by a
vectorial quantity interpreted as social
force [55]. Social force describes concrete
motivation to act. Social force model was
described by Helbing and Molnar in 1995 to
determine the motion of pedestrian α
considering following effects. Desired
direction of motion of pedestrian estimated
and acceleration of pedestrian due to
avoidance was estimated using Eqs. (8) and
(9). A repulsive effect due to other pedestrians
and borders was evaluated by Eqs. (10) and
(11). Using Eq. (12), attractive effects were
calculated for modeling. Total motivation for
walking model considering all effects is
presented in Eq. (13). Equation (14) represents
social force model.
i) is destination of a pedestrian α and
desired direction of motion of
pedestrian estimated using the following
equation,
(8)
where,
Actual position of pedestrian α at
time t.
Goals of a pedestrian are usually
rather gates or areas than points.
Acceleration due to avoidance processes was
calculated by:
(9)
where,
Actual velocity =
Desired velocity =
Deviated velocity =
Relaxation time =
ii) Repulsive effects of other pedestrians β
can be calculated by:
(10)
where,
Repulsive potential =
Location of the border B that is nearest
to pedestrian α
Repulsive effect from borders
(11)
where,
Repulsive and monotonic decreasing
potential =
iii) Attractive effects at places can be
modeled using the following formula:
(12)
where,
Attractive, monotonic increasing
potentials =
=
Repulsive affect and attractive effects on
pedestrian behavior are summarized below:
where,
Effective angle 2 of sight for effect of
perception
Total Motivation considering all the effects,
Microscopic Mobility of Pedestrian Movement Das et al.
TTEA (2014) 27-45 © STM Journals 2014. All Rights Reserved Page 34
(13)
The social force model is now defined by:
(14)
According to Lewin, behavioral changes can
be guided by social forces [56]. The computer
simulations assumed that the desired speeds
are Gaussian distributed with mean 1.34 m/s
and standard deviation 0.26 m/s by Helbing
and Molnar. To model pedestrian behavior
acceleration towards the desired velocity,
distance from other pedestrians and
obstructions and attractive effects were
considered as movement parameters by
Helbing and Molnar. “Computer simulations
of crowds of interacting pedestrians show that
the social force model is capable of describing
the self-organization of several observed
collective effects of pedestrian behavior very
realistically”[8]. A model for crowd
movement was proposed by Lakoba et al. [57]
as Helbing, Farkas, and Vicsek in 2000
considered each pedestrian a Newtonian
particle subject to both physical and social
forces. Dynamics of the crowd behavior were
captured by Mehran et al. using social force
model [58]. A computer vision method was
adopted in this study to detect and localize
abnormal crowd behavior. A grid was placed
over the image and moves them with the flow
field and extracts interaction forces. Social
Force model is used by various simulators
SIMWALK, VISSIM, VISWALK.
(i) SIMWALK
SIMWALK is flexible pedestrian simulation
software focused on evacuation, transportation
and urban planning applications. It is decision
support software for traffic engineers, transit
planners, architects and urban planners. It
provides a range of traffic-related analysis
tools like LOS, density, speed, person counts
or space utilization analysis. As a
microsimulation software, SIMWALK models
every pedestrian as a single person with its
behaviors which results in a realistic modeling
and simulation of pedestrians. It is based on
the (microscopic) social force model (SFM),
developed by Helbing which describes the
walking behavior of pedestrians at an
operational level. The impact of the model
simplifications on the simulation results was
investigated by Steiner et al. [59].
SIMWALK Pro and SIMWALK Transport are
used widely. SIMWALK Pro is a flexible and
very easy to use simulation software for
improving pedestrian logistics and flow issues
in urban planning, evacuation and traffic
management. Effectiveness of the model can
be measured by density, walking speed, person
counts, travel time, space, pedestrian trail and
level of service (LOS). SIMWALK is
applicable to any complex environment where
CAD plans or drawings are available: train
stations, airports, complex buildings, streets
and urban places. Based on CAD plans,
SIMWALK allows simulating any kind of
pedestrian scenario, depending on the desired
number of pedestrians, walking speeds,
behaviors, waiting times, etc. SIMWALK is
agent-based simulation software where every
agent simulates or acts as a pedestrian with
specific goals, walking speeds, delays and
avoidance of congestion.
SIMWALK Pro is used for safety evaluation
of stations, airports, sports stadiums, buildings,
etc., event management, urban planning,
integration of pedestrian scenarios in normal
traffic simulations (intersections) and
evacuation studies.
SIMWALK Transport work on integrate
timetables, simulation and analysis of
passenger movements in train, metro and bus
stations, design of stations and related objects
like platforms, stairs, ticket counters etc. to
optimize passenger safety and efficiency and
optimize train time table, passenger transfer
times and connections.
(ii) VISSIM
PTV VISSIM is a microscopic multi-modal
traffic flow simulation software package
developed by PTV Planung Transport Verkehr
AG in Karlsruhe, Germany. VISSIM is a
microscopic, time step and behavior-based
Trends in Transport Engineering and Applications
Volume 1, Issue 1
TTEA (2014) 27-45 © STM Journals 2014. All Rights Reserved Page 35
simulation model developed to model urban
traffic and public transport operations and
flows of pedestrians. The movement of
pedestrians is based on the social force model
in VISSIM. The basic idea is to model the
elementary impetus for motion with forces
analogously to Newtonian mechanics. The
forces which influence a pedestrian’s motion
are caused by his intention to reach his
destination as well as by other pedestrians and
obstacles. This simulation model was
validated in a threefold way according to
Helbing from ETH Zurich. Firstly,
macroscopic parameters were calculated and
compared to empirical data; secondly, it was
ensured that microscopic effects like lane
formation in counter flow situations and stripe
formation in crossing flow situations are
reproduced and thirdly, a realistic impression
of resulting animations was in the focus. The
social force model controls the operational
level and parts of the tactical level, whereas
the strategic level is defined by the user input.
Two modes are used in VISSIM namely
vehicle traffic mode and pedestrian traffic
mode.
Parameters considered to define the BASE
DATA menu are pedestrian types and
pedestrian classes, walking behavior parameter
sets, area behavior types, display types (of
areas) and level properties for multi-story
models. In the TRAFFIC menu pedestrian
compositions should be defined as a set of
default data (types of pedestrians, classes of
pedestrians, compositions of flows of
pedestrians) will be generated if VISSIM
installation includes the pedestrian’s
component. Sahaleh et al. studied adjustment
of various parameters having direct impact on
the driving force in VISSIM (social force
model) for model calibration [60].
(iii) VISWALK
VISWALK simulates and analyzes walking
behavior whether in free space, inside
buildings or in connection with mass gathering
environments. PTV VISWALK enables you to
simulate and model the human walking
behavior. Planners use this software tool
whenever pedestrian flows need to be
simulated and analyzed. Space optimization,
capacity planning, evacuation analysis, plan
and optimize mass attendee events, routing
and queuing analysis are various applications
of VISWALK.
NOMAD Model (Normative Pedestrian
Behavior Theory) [15, 61]
A microscopic pedestrian flow simulation
model NOMAD developed by Serge
Hoogendoorn in the project of “Collective
walking behavior of pedestrians in public
areas,” financed the Netherlands Organization
of Scientific Research (NWO), Delft
University of Technology. Input parameters
for this model are description of the walking
infrastructure, parameters describing behavior
of the different pedestrian types, activity and
location activity areas, description of the
demand for each activity pattern and the
composition of this demand into pedestrian
types, location of detectors, and run-time
parameters.
Collective pedestrian flow phenomenon, lane
formation, homogenous strips in crossing
pedestrian flows, behavior at bottlenecks can
be observed using NOMAD model. Optimal
routes and locations where activities are
performed, trajectories for each pedestrian in
the walking area, passage times, speeds, and
gaps of pedestrians passing the detectors and
contour plots of speeds and densities are the
output parameters of NOMAD model. There
are two levels in NOMAD, viz., activity area
and route choice level (tactical level) and
walking behavior (operational level). It is
based on activity and areas where activities are
performed and the routes between them can be
determined. In this model, route choice and
activity area choice depends on the prevailing
traffic conditions. Destination-route choice
model and walker models are included in
NOMAD model. Network topology, traffic
demand per activity pattern, special/incident
conditions, composition of pedestrian flow and
walking parameters are the input parameters in
this model. Theoretical assumptions and
modeling issues for the pedestrian activity
scheduling and route choice, as well as the
walking behavior have been described by
Hoogendoorn [15].
NOMAD model was implemented by
Hoogendoorn and Bovy [14] and they
Microscopic Mobility of Pedestrian Movement Das et al.
TTEA (2014) 27-45 © STM Journals 2014. All Rights Reserved Page 36
proposed for NOMAD Walker model. The
walking behavior of pedestrians can be
described by walker model. The walker model
can be described by Eqs (15) and (16).
(15)
(t) (16)
where, = Location
= Velocity
= Acceleration
The acceleration model for the basic Nomad
model can be described using Eq. (17):
(17)
where, = Deviation from the pedestrian’s
destination
= Avoidance of other pedestrians
(Repulsion)
= Avoidance of obstacles
= The contact forces that arise when
pedestrians are colliding
∈p= A stochastic noise for population
heterogeneity and unrepresented factor
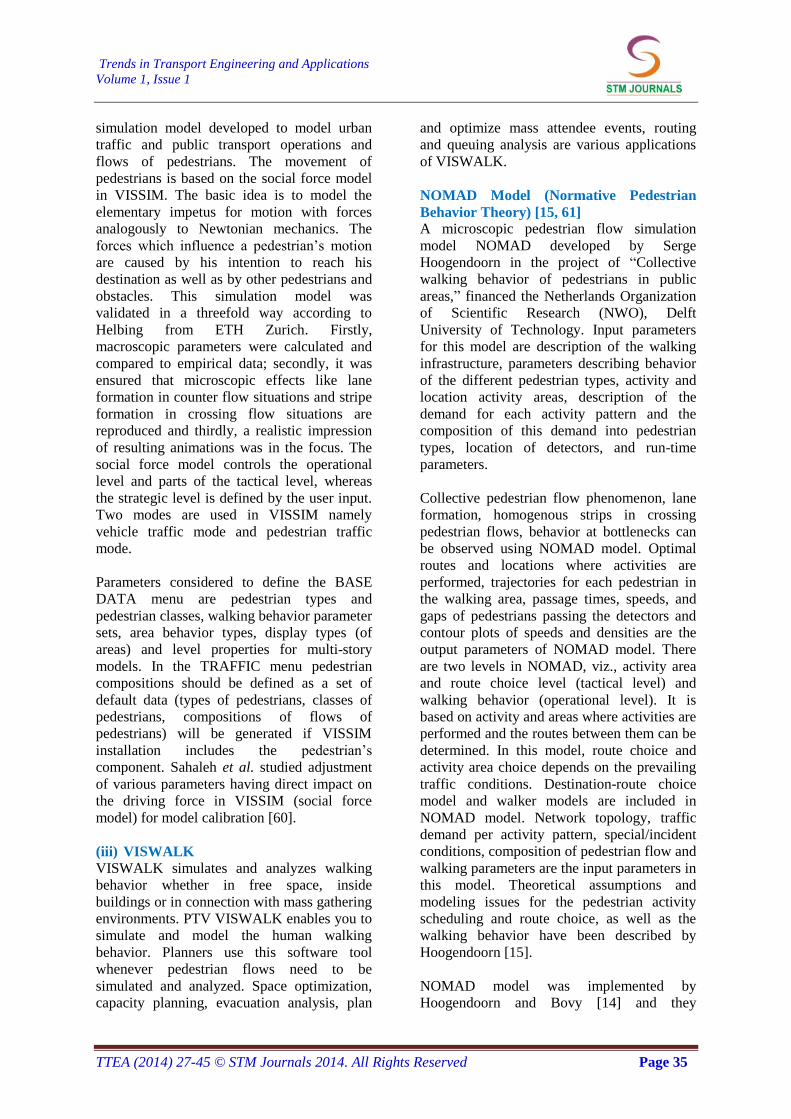
A modified microscopic NOMAD Walker
model was proposed by Campanella et al.
[62]. Modification in the NOMAD model was
done by improving pedestrian repulsion term
( given in Eq. (18). Perceived lateral
displacement of pedestrian q is shown in
Figure 2.
(18)
where,
= Set of pedestrians perceived by
pedestrian p walking in the front part of the
influence area and in opposing direction
= Interaction factor for opposing
pedestrians
= Perceived lateral distance from
pedestrian p towards pedestrian q
= Spatial discount of pedestrian p for
opposing pedestrians
Fig. 2: Perceived Lateral Displacement of
Pedestrian q.
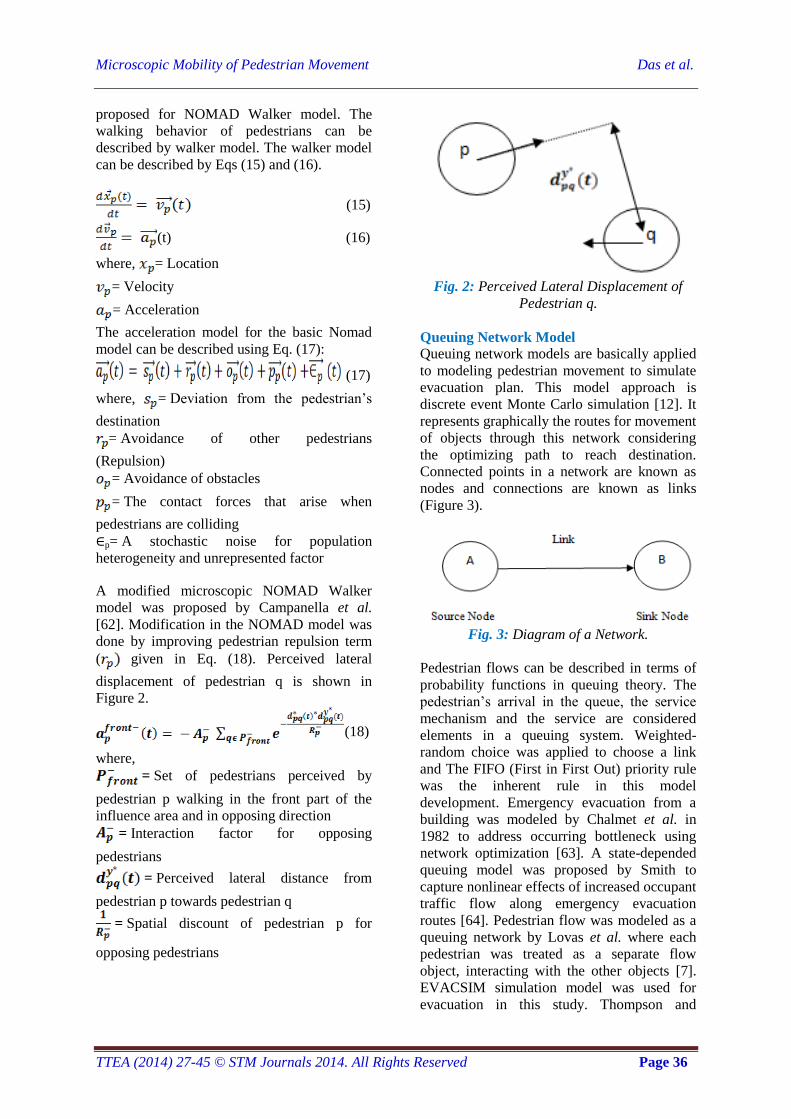
Queuing Network Model
Queuing network models are basically applied
to modeling pedestrian movement to simulate
evacuation plan. This model approach is
discrete event Monte Carlo simulation [12]. It
represents graphically the routes for movement
of objects through this network considering
the optimizing path to reach destination.
Connected points in a network are known as
nodes and connections are known as links
(Figure 3).
Fig. 3: Diagram of a Network.
Pedestrian flows can be described in terms of
probability functions in queuing theory. The
pedestrian’s arrival in the queue, the service
mechanism and the service are considered
elements in a queuing system. Weighted-
random choice was applied to choose a link
and The FIFO (First in First Out) priority rule
was the inherent rule in this model
development. Emergency evacuation from a
building was modeled by Chalmet et al. in
1982 to address occurring bottleneck using
network optimization [63]. A state-depended
queuing model was proposed by Smith to
capture nonlinear effects of increased occupant
traffic flow along emergency evacuation
routes [64]. Pedestrian flow was modeled as a
queuing network by Lovas et al. where each
pedestrian was treated as a separate flow
object, interacting with the other objects [7].
EVACSIM simulation model was used for
evacuation in this study. Thompson and
Trends in Transport Engineering and Applications
Volume 1, Issue 1
TTEA (2014) 27-45 © STM Journals 2014. All Rights Reserved Page 37
Marchant used SIMULEX model to simulate
escape movement from a large building [65].
Queuing network has been studied by Bolch et
al. [66]. Mathematical expressions of the
physical quantities for N-Parallel and N-Fork
and probability density distribution of service
time in N-Parallel and N-Fork was calibrated
by Bolch et al. and also other concepts were
used for other studies related to queuing
network modeling [67]. The evacuation time is
one of the performance measures. Simulation
for evacuation of a large room with one door
has been studied by Kirchner et al. considering
clogging and stucking phenomena of
pedestrians and as a result it was concluded
that friction has not only quantitative effects
but also qualitative changes [43]. A model was
proposed by Pairisi and Dorso considering
discrete nature of the pedestrian fluid allowing
to set individual physical parameters to study
microscopic dynamics of pedestrian
evacuation [68]. The microscopic mechanism
involved in the efficiency of the room
evacuation process has been studied by Song
et al. [69]. Yanagisawa et al. introduced the
effect of delay for walking from the head of
the queue to the service windows in the
queuing theory, and the suitable type of
queuing system under various conditions was
obtained for each kind of people separately
[70]. Yanagisawa et al. in 2010 improved
efficiency of queuing systems using theoretical
analysis and experiments by shortening the
moving time in queue [71]. Also they have
introduced in 2013 queuing model that means
waiting time in parallel becomes shorter when
both the arrival probability of pedestrians and
the effect of walking distance are large
considering simple distributions, geometric
and exponential distributions [72].
(i) SIMULEX [65, 73]
SIMULEX is a computer model for evacuation
of buildings. A series of tests were done by
Thompson and Marchant in 1995 to model the
large group of movements of people through
different numbers of exists of different widths
[65]. It can be used to model the effects of the
invasion of personal space considering the
movement of individual persons and represent
a psychological modeling.
(ii) PEDROUTE
PEDROUTE is a computer simulation system
which was originally developed by Gerry
Wetson at London Underground Limited. The
intellectual property rights were then sold to
Halcrow Fox. PEDROUTE has been used
extensively to model crowd parameters in
underground networks around the world. It is
actually the extension of Fruin’s level of
service and relies on that data being an
accurate representation of the crowd dynamics
with respect to local geometry that appeared as
limitation to the PEDROUTE system. To
assess passenger movement, behavior and
congestion level within the station, the
PEDROUTE pedestrian simulation model is
used. The various physical elements of the
station (concourses, passageways, platforms,
stairs, escalators, etc.) and the passenger
demand for each element of the station are
defined in PEDROUTE.
Agent-Based Model
Agent is an entity able to perform some
activities autonomously and also a part of
community. Pedestrian modeling concept
using agent-based model was traced from
flocking behavior of birds by considering
individual agents or boids were modeled by
Reynolds in 1987. Agent technologies are used
in a wide variety of applications, from robotics
to economic modeling [74]. This model
approach discrete in space and in time
considering the environment in which the
simulation takes place is a lattice of cells.
Agent-based models are general, flexible,
modular and able to take advantage of
distributed resources. This model is also
known as multi-agent system (MAS), agent-
based simulation (ABS), or individual-based
modeling (IBM). This model also uses grid of
cells as cellular automata invented simulating
grids’ interactions with neighbors [75]. Batty
studied spatial modeling changing to dynamic
simulations of the individual and collective
behavior of individual decision-making to
observe randomness and geometry of local
movement and spatial structures emerge from
such actions [76]. Three experiments were
done by him for modeling, first for local scale
street scenes where congestion and flocking is
all important, second for coarser scale
shopping centers such as malls where
Microscopic Mobility of Pedestrian Movement Das et al.
TTEA (2014) 27-45 © STM Journals 2014. All Rights Reserved Page 38
economic preference interferes much more
with local geometry, and finally for semi-
organized street festivals where management
and control by police and related authorities is
integral to the way crowds move. Turner and
Penn developed behavioral models
considering movement rules from Gibson’s
principle of affordance [77]. Both theoretical
issues such as ABM definition and
architecture, and practical issues such as ABM
applications and development platforms were
studied by Chen [78]. The behavior and
interactions of pedestrians were modeled as an
agent-based system by using a combination of
massively parallel processes simulating
individual pedestrians, and a series of
behaviors of these simulated pedestrians in the
interactions with each other and their
environment by Kerridge et al. [79]. Bandini
et al. studied an agent-based approach
encapsulating in the pedestrian’s behavioral
model effects, representing both proxemics
and a simplified account of influences related
to the presence of groups in the crowd [80].
Vizzari and Manenti have studied on an agent-
based model of pedestrians considering groups
as an influencing factor to the behavior of its
members [81].
(i) PEDFLOW [82]
PEDFLOW model was developed in Java.
This is a conceptual approach to represent
pedestrian environments and behaviors. In this
model, agents are represented as pedestrians
and objects. PEDFLOW model has the ability
to represent the microscopic details
considering movement of individual
pedestrian as a separate entity to produce a
more realistic representation of reality. Service
quality factors can be extracted directly from
the model. Current position of every
pedestrian, blockage, edge, and kerb were
considered in modeling. PEDFLOW uses a
hybrid simulation technique with a fixed-time
step and space was considered using grid
system. Rules are updated by parallel update
system. An agent contains data about
blockages, edges, and kerbs into the shared
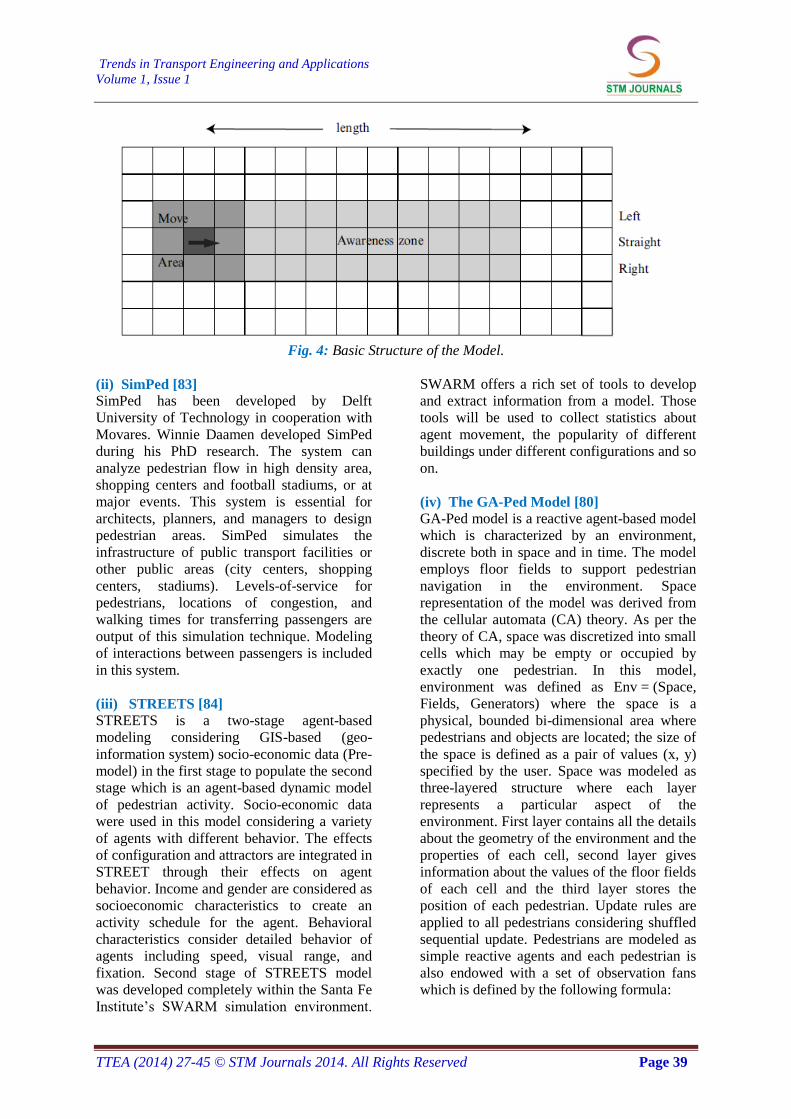
grid-based structure. Basic structure of the
model from the point of view of a single
pedestrian with grid size of 650 mm is given in
Figure 4. At a more congested situation, six
people per square meter (large crowd) can be
considered in modeling.
Data collection for this model has been done
by the authors’ own hand-held, digital
camcorders and city center CCTV cameras in
accordance with formal ethical codes of
conduct. Cameras will be mounted at vantage
point to maximize the field of view; the
current settings typically allow a viewing area
of approximately 10–15 m length of individual
pedestrian’s trajectories and walking speeds,
together with information about their gender,
group size and approximate age data will be
attracted from this study. Also aggregate
measures of pedestrian activity such as flow
and density will be calculated.
Five parameters were identified for decision-
making process of the person namely static
awareness (SA), preferred gap size (PGS),
desired walking speed (DWS), personal space
measure (PSM) and choice parameter. The
results of the rule activation are the direction
in which the pedestrian is to move and the
speed of movement. Evaluation of rule
depends on the entity value. Objective
(behavior of the pedestrian is that which is
directly observable and measurable) and
subjective (unobservable aspects: perceptions,
past experiences, and attitudes) aspects are
represented by the model. This model allows
determining practical uses of pavement or
general pedestrian spaces and the individual
differences that have an effect on behavior and
the levels of service useful for planning
purposes. The PEDFLOW model is able to
provide urban designers and planners with the
level of service and of measures of pedestrian
behavior at individual and aggregate levels.
The model also provides a systematic and
consistent framework to assess the efficacy of
street designs and traffic management
measures for pedestrians. A detailed study was
undertaken on multi-agent microsimulation
system (PEDFLOW) designed by Kerridge et
al. to represent conflicting pedestrian flows at
a detailed level on a section of sidewalk, or in
an open or enclosed space with obstructions
[79].
Trends in Transport Engineering and Applications
Volume 1, Issue 1
TTEA (2014) 27-45 © STM Journals 2014. All Rights Reserved Page 39
Fig. 4: Basic Structure of the Model.
(ii) SimPed [83]
SimPed has been developed by Delft
University of Technology in cooperation with
Movares. Winnie Daamen developed SimPed
during his PhD research. The system can
analyze pedestrian flow in high density area,
shopping centers and football stadiums, or at
major events. This system is essential for
architects, planners, and managers to design
pedestrian areas. SimPed simulates the
infrastructure of public transport facilities or
other public areas (city centers, shopping
centers, stadiums). Levels-of-service for
pedestrians, locations of congestion, and
walking times for transferring passengers are
output of this simulation technique. Modeling
of interactions between passengers is included
in this system.
(iii) STREETS [84]
STREETS is a two-stage agent-based
modeling considering GIS-based (geo-
information system) socio-economic data (Pre-
model) in the first stage to populate the second
stage which is an agent-based dynamic model
of pedestrian activity. Socio-economic data
were used in this model considering a variety
of agents with different behavior. The effects
of configuration and attractors are integrated in
STREET through their effects on agent
behavior. Income and gender are considered as
socioeconomic characteristics to create an
activity schedule for the agent. Behavioral
characteristics consider detailed behavior of
agents including speed, visual range, and
fixation. Second stage of STREETS model
was developed completely within the Santa Fe
Institute’s SWARM simulation environment.
SWARM offers a rich set of tools to develop
and extract information from a model. Those
tools will be used to collect statistics about
agent movement, the popularity of different
buildings under different configurations and so
on.
(iv) The GA-Ped Model [80]
GA-Ped model is a reactive agent-based model
which is characterized by an environment,
discrete both in space and in time. The model
employs floor fields to support pedestrian
navigation in the environment. Space
representation of the model was derived from
the cellular automata (CA) theory. As per the
theory of CA, space was discretized into small
cells which may be empty or occupied by
exactly one pedestrian. In this model,
environment was defined as Env = (Space,
Fields, Generators) where the space is a
physical, bounded bi-dimensional area where
pedestrians and objects are located; the size of
the space is defined as a pair of values (x, y)
specified by the user. Space was modeled as
three-layered structure where each layer
represents a particular aspect of the
environment. First layer contains all the details
about the geometry of the environment and the
properties of each cell, second layer gives
information about the values of the floor fields
of each cell and the third layer stores the
position of each pedestrian. Update rules are
applied to all pedestrians considering shuffled
sequential update. Pedestrians are modeled as
simple reactive agents and each pedestrian is
also endowed with a set of observation fans
which is defined by the following formula:
Microscopic Mobility of Pedestrian Movement Das et al.
TTEA (2014) 27-45 © STM Journals 2014. All Rights Reserved Page 40
Observation fan = < type, xsize, ysize, weight,
xoffset ,yoffset >
Pedestrian = < pedID, groupID, schedule >
The behavior of a pedestrian was represented
in four stages – sleep, context evaluation,
movement evaluation and movement.
Pedestrian movement was controlled by
Moore neighborhood. Pedestrian movement,
cell walkability floor field value, presence of
pedestrians belonging to a given group, goal-
driven component, group cohesion,
geometrical repulsion, proxemic repulsion,
and stochasticity were considered to explain
behavior and transmission rules.
Data Collection Techniques for Microscopic
Modeling
Cheung and Lam used time-lapse photography
technique for data collection which provides
microscopic analysis of flow characteristics
[85, 86]. Time-lapse photography technique
was used by Lam and Cheung to collect data
and images were processed manually which
was very labor-intensive [87]. Teknomo et al.
have collected data using NTXY database to
calculate the pedestrian traffic-flow
characteristic (flow rate, speed and area
module) [10]. Hoogendoorn et al. proposed an
approach to automatically detect and track
pedestrians from a sequence of high-quality
video images [88]. Lens corrections for pin-
cushion distortion and radiometric correction
were combined with dedicated techniques to
use the special features of the video data for
successful application of automated detection
and tracking of pedestrians. Data was collected
by Willis et al. using either a standard hand-
held digital camcorder mounted on a tripod, or
CCTV cameras operated by collaborators
within the local city councils for PEDFLOW
model [89]. Video recordings were converted
into digital format (.avi) using a standard
videocapture card housed in a PC. Also in this
study image analysis software was used to plot
the frame-by-frame position of selected
objects for the duration of the clip. Li et al.
proposed a computer vision technique for the
automated pedestrian data collection [90]. An
efficient pedestrian tracking algorithm, the
MMTrack, was used to detect and track
pedestrians. A homography matrix was used to
create a mapping from world coordinates to
image plane coordinates. Walking speed
measurements methodology and screen line
counts methodology were used for automatic
counting, tracking, and walking speed
measurements.
Comparative Analysis of Microsimulation
Models
Comparison of various microscopic pedestrian
simulation models described in this section is
made. Benefit cost cellular model and
magnetic force model are completely based on
arbitrary values of variables but magnetic
force model is developed in heuristic
approach. Social force model considers
attraction and repulsion effects of pedestrians
which has physical meaning. In social force
model, “Physical interactions are combined
with action of the social norm of keeping
distance to unknown persons.” Binary values
are assigned in cellular automata model. Social
force model and magnetic force model are
continuous models where benefit cost cellular
model and cellular automata model consider
discreet movement of pedestrians.
Macroscopic phenomena are explained in
cellular automata model. Fundamental
properties of pedestrian movements
completely explained in cellular automata
model. real understandable behavioral rules
are considered to explain interaction between
pedestrians and pedestrians with other
obstacles. Mostly models are based on
pedestrian moving toward the destination and
makes repulsive effect toward other pedestrian
or obstacles. Calibration and validation of
parameters have not been done considering
real pedestrian movement data.
CONCLUSIONS AND
RECOMMENDATIONS Various microscopic simulation models used
to simulate pedestrian movement have been
discussed in this paper. Brief descriptions of
software for microscopic simulation models
also have been discussed here. Benefit cost
cellular model was proposed by Gipps and
Marksjo in 1985. Social force model was
developed by Helbing (1991, 1992, and 1993).
Kormanova in 2012 proposed a model
combining cellular automata model and social
force model using agent-oriented architecture
(ABAsim architecture) and designed scene
infrastructure.
Trends in Transport Engineering and Applications
Volume 1, Issue 1
TTEA (2014) 27-45 © STM Journals 2014. All Rights Reserved Page 41
It can be concluded from this review that
various studies have been done on microscopic
simulation techniques for improving
pedestrian facilities but they have not been
applied in standard design guidelines to
improve the pedestrian facilities. In
microscopic approach, walking speeds,
walking directions, distances between
pedestrians, relative positions, passing
behavior and group-forming characteristics are
observed. Calibration and validation of various
constant parameters used in pedestrian
microscopic models should be implemented
using real data. Microscopic approaches can
be considered in HCM guidelines for LOS and
capacity estimation for pedestrian facilities.
This study will be helpful for designing of
pedestrian infrastructure considering
microscopic simulation techniques.
Various microscopic simulation tools were
proposed considering different situations,
these models are not studied in Indian
conditions and also for other developing
countries. These microscopic simulation
models and tools are required to be
experimented for developing country
conditions.
ACKNOWLEDGMENT The inputs received from MHRD fellowship at
CTRANS and the research project “Indo HCM
WP-7” sponsored by CSIR-CRRI are
thankfully acknowledged in the presentation of
this paper.
REFERENCES 1. Banks J, Carson J, Nelson B, et al.
Discrete-Event System Simulation.
Prentice Hall Inc. Third Edition. New
Jersey. 2001.
2. Zhang S, Author Yong, Luo Y, et al.
Progress of Simulation Studies of
Pedestrian Traffic (2596-2601).
International Conference on
Transportation Engineering. 2009.
3. Henderson LF. On the Fluid Mechanic of
Human Crowd Motions. Transportation
Research. 1974; 8: 509–15p.
4. Gipps PG, Marksjo B. A Micro-
Simulation Model for Pedestrian Flows
[J]. Mathematics and Computers in
Simulation. 1985; 27(2): 95–105p.
5. Reynolds CW. Flocks, Herds, and
Schools: A Distributed Behavioral Model.
Proceedings of SIGGRAPH '87, Computer
Graphics. 1987; 21(4): 25–34p.
6. Okazaki S, Matsushita S. A study of
simulation model for pedestrian movement
with evacuation and queuing [C].
Proceeding of the International
Conference on Engineering for Crowd
Safety. London: Elsevier; 1993; 271–80p.
7. Lovas GG. Modeling and simulation of
pedestrian traffic flow [J]. Transport
Research B. 1994; 28(3): 429–43p.
8. Helbing D, Molnár P. Self–organization
phenomena in pedestrian crowds. In F.
Schweitzer (Ed.). Self–Organization of
Complex Structures: From Individual to
Collective Dynamics. Gordon and Breach,
London; 1997; 569–77p.
9. Helbing D, Molnar P, Farkas IJ, & Bolay,
et al. Self–organizing pedestrian
movement. Environment and Planning B:
Planning and Design. 2001; 28: 361–83p.
doi:10.1068/b2697
10. Teknomo K, Takeyama Y, Inamura H.
Review on microscopic pedestrian
simulation model. Proceedings Japan
Society of Civil Engineering Conference,
Morioka, Japan. 2000 March.
11. Burstedde C, Klauck K, SchadschneiderA,
et al. Simulation of pedestrian dynamics
using a two–dimensional
cellularautomaton. Physica A. 2001; 295:
507–25p.
12. Teknomo K. Microscopic pedestrian flow
characteristics: development of an image
processing data collection and simulation
model. PhD. Thesis. Department of
Human Social Information Sciences
Graduate School of Information Sciences
Tohoku University Japan. 2002.
13. Kirchner A, Schadschneider A. Simulation
of evacuation processes using a bionics–
inspired cellular automata model for
pedestrian dynamics. Physica A. 2002;
312: 260–76p.
14. Hoogendoorn, S, Bovy PHL. Simulation
of pedestrian flows by optimal control and
differential games. Optimal Control
Applications and Methods. 2003; 24: 153–
72p. doi: 10.1002/oca.727.
15. Hoogendoorn SP. Microscopic simulation
of pedestrian flows. Transportation
Microscopic Mobility of Pedestrian Movement Das et al.
TTEA (2014) 27-45 © STM Journals 2014. All Rights Reserved Page 42
Research Board Annual Meeting.
Washington DC: National Academy Press.
2003; 1–11p.
16. Jian L, Lizhong Y, Daoliang Z. Simulation
of bi–direction pedestrian movement in
corridor. Physica A. 2005; 354: 619–28p.
doi:10.1016/j.physa.2005.03.007.
17. Teknomo K. Application of microscopic
pedestrian simulation model.
Transportation Research Part F. 2006;
9:15–27. doi:10.1016/j.trf.2005.08.006.
18. Zacharias J, Bernhardt T, Montigny LD.
Computer–simulated pedestrian behavior
in shopping environment. Journal of
Urban Planning and Development. 2005;
131: 195–200p.
doi:10.1061/(ASCE)0733–
9488(2005)131:3(195)
19. Antonini G. A discrete choice modeling
framework for pedestrian walking
behavior with application to human
tracking in video sequences. P.hD. Thesis.
EcolePolytechniqueFédérale de Lausanne;
2005; 3382.
20. Antonini G, Bierlaire M, Weber M.
Discrete choice models of pedestrian
walking behavior. Transportation
Research Part B. 2006; 40: 667–87p.
doi:10.1016/j.trb.2005.09.006.
21. Robin Th, Antonini G, Bierlaire M, et al.
Specification, estimation and validation of
a pedestrian walking behavior model.
Transportation Research Part B:
Methodological. 2009 January; 43(1): 36–
56. doi:10.1016/j.trb.2008.06.010.
22. Yamamoto K, Kokubo S, Nishinari K.
Simulation for pedestrian dynamics by
real–coded cellular automata (RCA).
Physica A. 2007; 379: 654–60p.
doi:10.1016/j.physa.2007.02.040
23. Hoogendoorn SP, Winnie Daamen. In
Andreas Schadschneider, Thorsten
Pöschel, Reinhart Kühne (Eds). Traffic
and Granular flow’05: Microscopic
Calibration and Validation of Pedestrian
Models: Cross–Comparison of Models
Using Experimental Data. Springer; 2007;
329–40p.
24. Xianqiang M, Mingjun L, Kaiying W, et
al. Group Behaviors in Pedestrian traffic
simulation model (1086–1091).
International Conference on
Transportation Engineering. 2009; doi:
10.1061/41039(345)180.
25. Asano M, Iryo T, Kuwahara M. In Lam
WHK, Wong SC, Lo HK, (Eds).
Transportation and Traffic Theory 2009:
Golden Jubilee: And a Pedestrian Model
Considering Anticipatory Behaviour for
Capacity Evaluation. Springer, New York;
2009; 28: 559–81p.
26. Hoogendoorn SP, Daamen W. In
Timmermans HJP (Ed.). Pedestrian
Behavior: Models, Data Collection and
Applications. Emerald Group Publishing
Limited.
27. Asano M, Iryo T, Kuwahara M.
Microscopic pedestrian simulation model
combined with a tactical model for route
choice behaviour. Transportation
Research Part C. 2010; 18: 842–55p.
doi:10.1016/j.trc.2010.01.005.
28. Zhang Q, Han B. Simulation model of
pedestrian interactive behavior. Physica A,
Statistical Mechanics and Its Applications.
2011; 390: 636–46p.
doi:10.1016/j.physa.2010.10.029.
29. Kretz T. A level of service scheme for
microscopic simulation of pedestrians that
integrates queuing, uni–and multi–
directional flow situations. Eur. Transp.
Res. Rev. 2011; 3: 211–20p. doi:
10.1007/s12544–011–0060–7.
30. Kormanova A. Combining social forces
and cellular automata models in
pedestrians’ movement simulation.
Journal of Information, Control and
Management Systems. 2012; 10(1): 61–
70p.
31. Wolfram S. Statistical mechanics of
cellular automata. Reviews of Modern
Physics. 1983; 55(3): 601–44p.
32. Wolfram S. Theory and application of
cellular automata. World Scientific
Singapore. 1986.
33. Wolfram S. Cellular Automata and
Complexity. Addison Wesley. 1994.
34. Wolf DE. Cellular automata for traffic
simulations. Physica A: Statistical
Mechanics and its Applications. 1999;
263(1): 438–51p.
35. Wolfram S. A New Kind of Science.
Wolfram Media, Inc; 2002. ISBN1–579–
955008–8.
36. Gardner M. Mathematical games—the
fantastic combinations of John Conway’s
new solitaire game ‘Life’. Scientific.
Trends in Transport Engineering and Applications
Volume 1, Issue 1
TTEA (2014) 27-45 © STM Journals 2014. All Rights Reserved Page 43
American. 1970; 223: 120–3p. doi:
10.1038/scientificamerican1070–120
37. Nagel K, Schrekenberg M. A Cellular
Automata for Freeway Traffic. Journal of
Physics I France. 1992; 2(12): 2221–9p.
doi:10.1051/jp1:1992277
38. Packard NH, Wolfram S. Two–
Dimensional Cellular Automata. Journal
of Statistical Physics. 1985; 38(5/6): 901–
46p.
39. Blue VJ, Adler JL. Emergent fundamental
pedestrian flows from cellular automata
microsimulation. Transportation Research
Record. 1998; 1644: 29–36p.
Doi:10.3141/1644–04
40. Blue V, Adler J. Cellular automata
microsimulation for modelling bi–
directional pedestrian walkways.
Transportation Research Part B. 2001; 35:
293–312p.
41. Schadschneider A. In Schreckenberg M,
Sharma SD, (Eds). Pedestrian and
Evacuation Dynamics: Cellular
Automaton Approach to Pedestrian
Dynamics–Theory. Springer, Berlin. 75–
86p.
42. Fang W, Yang L, Fan W. Simulation of
bi–direction pedestrian movement using a
cellular automata model. Physica A. 2003;
321: 633–640p.
43. Kirchner A, Nishinari K, Schadschneider
A. Friction effect and clogging in a
cellular automaton model for pedestrian
dynamics. Phys. Rev. E. 2003; 67–056122.
44. Athanassopoulos S, Kaklamanis C,
Kalfoutzos G, et al. Cellular Automata:
Simulations Using Matlab. The Sixth
International Conference on Digital
Society. 2012. ISBN: 978–1–61208–176–
2.
45. Rickert M, Nage, K, Schreckenberg M, et
al. Two–lane traffic simulations using
cellular automata. Los Alamos
Unclassified Report 95:4367, Los Alamos
National Laboratory, Los Alamos, New
Mexico; Physica A. 1996; 231: 534p.
46. Simon PM, Gutowitz HA. Cellular
automaton model for bidirectional traffic.
Physical Review E. 1998; 57: 2441–4p.
doi:10.1103/PhysRevE.57.2441.
47. Nishinari K, Kirchner A, Namazi A, et al.
Extended floor field CA model for
evacuation dynamics. IEICE Transactions
on Information and Systems. 2004; E87–D
(3): 726–32p.
48. Kirik E, Yan T, Krouglov D. An
intelligent floor field cellular automata
model for pedestrian dynamics.
Proceedings of the Summer Computer
Simulation Conference, San Diego,
California. 2007.
49. Huang HJ, Guo RY. Static floor field and
exit choice for pedestrian evacuation in
rooms with internal obstacles and multiple
exits. Physical Review E. 2008; 78:
021131p.
doi:10.1103/PhysRevE.78.021131.
50. Guo RY, Huang HJ. A modified floor
field cellular automata model for
pedestrian evacuation simulation. Journal
of Physics A: Mathematical and
Theoretical. 2008; 41: 385104.
doi:10.1088/1751–8113/41/38/385104.
51. Okazaki S. A study of simulation model
for pedestrian movement in architectural
space, Part 1: Pedestrian movement by the
application of magnetic models.
Transactions of Architectural Institute of
Japan. 1979; 283: 111–9p.
52. Helbing D. A mathematical model for the
behavior of pedestrians. Behavioral
Science. 1991; 36: 298–310p.
53. Helbing D. A fluid–dynamic model for the
movement of pedestrians. Complex
Systems. 1992; 6: 391–415p.
54. Helbing D, Molnár P. Social force model
for pedestrian dynamics. Physical Review
E. 1995; 51(5): 4282–6p.
55. Helbing D, Vicsek T. Optimal self–
organization. New Journal of Physics.
1999; 1: 13.1–13.17p.
56. Lewin K. Field Theory in Social Science.
Harper & Brothers, New York; 1951.
57. Lakoba TI, Kaup DJ, Finkelstein NM.
Modifications of the Helbing–Molnar–
Farkas–Vicsek Social Force Model for
Pedestrian Evolution. Simulation. 2005;
81(5):339–52p.
58. Mehran R, Oyama A, Shah M. Abnormal
crowd behavior detection using social
force model. IEEE International
Conference on Computer Vision and
Pattern Recognition. (CVPR), Miami.
2009.
59. Steiner A, Philipp M, Schmid A.
Parameter Estimation for a Pedestrian
Microscopic Mobility of Pedestrian Movement Das et al.
TTEA (2014) 27-45 © STM Journals 2014. All Rights Reserved Page 44
Simulation Model. 7th Swiss Transport
Research Conference. Monte
Verità/Ascona. 2007 September.
60. Sahaleh AS, Bierlaire M, Farooq B, et al.
Scenario analysis of pedestrian flow in
public spaces.12th Swiss Transport
Research Conference (STRC). Monte
Verità, Ascona, Switzerland. 2012, May.
61. Hoogendoorn SP. Normative Pedestrian
Flow Behavior: Theory and Applications.
Research Report Vk 2001–02.
Transportation and Traffic Engineering
Section, Delft University of Technology.
62. Campanella M, Hoogendoorn S, Daamen
W. Improving the Nomad Microscopic
Walker Model. 12th IFAC Symposium on
Transportation Systems. Redondo Beach,
CA, USA.
63. Chalmet LG, Francis RL, Saunders PB.
Network models for building evacuation.
Journal of Institute Research and
Management Science. January1982; 28:
86–105p.
64. Smith JM. State–dependent queuing
models in emergency evacuation
networks. Transportation Research Part
B: Methodological. 1991; 25: 373–89p.
65. Thompson PA, Marchant EW. Testing and
application of the computer model
SIMULEX. Fire Safety Journal. 1995; 24:
149–148p.
66. Bolch G, Greiner S, de Meer H, et al.
Queuing Networks and Markov Chains. A
John Wiley–Interscience Publication,
USA.
67. Bolch G, Greiner S, de Meer H, et al.
Queueing Networks and Markov Chains,
Modeling and Performance Evaluation
with Computer Science Applications. John
Wiley & Sons; 1998.
68. Parisi DR, Dorso CO. Microscopic
dynamics of pedestrian evacuation.
Physica A. 2005; 354: 606–18p.
doi:10.1016/j.physa.2005.02.040.
69. Song W, Xu X, Wang BH, et al.
Simulation of evacuation processes using
a multi–grid model for pedestrian
dynamics. Physica A. 2006; 363: 492–
500p. doi:10.1016/j.physa.2005.08.036.
70. Yanagisawa D, Tomoeda A, Kimura A, et
al. Walking–distance introduced queueing
theory. Cellular Automata 5191,
Proceedings of 8th International
Conference on Cellular Automata for
Reseach and Industry, ACRI. 2008,
September; 455–62p.
71. Yanagisawa D, Suma Y, Tanaka Y, et al.
Methods for improving efficiency of
queueing systems. Proceedings of the
Pedestrian and Evacuation Dynamics.
Springer; 2010; 297–306p.
72. Yanagisawa D, Suma Y, Tomoeda A, et
al. Walking–distance introduced queueing
model for pedestrian queueing system:
Theoretical analysis and experimental
verification. Transportation Research Part
C. xxx (2013) xxx–xxx.
73. Thompson PA, Marchant EW. A computer
model for the evacuation of large building
population. Fire Safety Journal. 1995; 24:
131–66p.
74. Hayes C. Agents in a nutshell – a very
brief introduction. IEEE Transactions on
Knowledge and Data Engineering. 1999;
11(1): 127–32p.
75. Neumann JV. This is a chapter. In: Jeffress
LA (Ed.). Cerebral Mechanisms in
Behavior – The Hixon Symposium: The
General and Logical Theory of Automata.
John Wiley and Sons, New York; 1951; 1–
31p.
76. Batty M. Agent based pedestrian modeling
(editorial). Environment and Planning B:
Planning and Design. 2001; 28: 321–6p.
doi:10.1068/b2803ed.
77. Turner A, Penn A. Encoding natural
movement as an agent–based system: An
investigation into human pedestrian
behaviour in the built environment.
Environment and Planning B: Planning
and Design. 2002; 29: 473–490p.
doi:10.1068/b12850.
78. Chen L. Agent–based modeling in urban
and architectural research: A brief
literature review. Frontiers of
Architectural Research. 2012; 1: 166–77p.
79. Kerridge J, Hine J, Wigan M. Agent–
based modelling of pedestrian movements:
The questions that need to be asked and
answered. Environment and Planning B:
Planning and Design. 2001; 28: 327–41p.
doi:10.1068/b2696.
80. Bandini S, Rubagotti F, Vizzari G, et al. In
Pirrone R, Sorbello F (Eds.). Artificial
Intelligence Around Man and Beyond: An
Agent Model of Pedestrian and Group
Dynamics: Experiments on Group
Trends in Transport Engineering and Applications
Volume 1, Issue 1
TTEA (2014) 27-45 © STM Journals 2014. All Rights Reserved Page 45
Cohesion. AI*IA Springer; 2011; 6934:
104–16p,
81. Vizzari G, Manenti L. An agent–based
model for pedestrian and group dynamics:
Experimental and real–world scenarios.
Proceedings of the 11th International
Conference on Autonomous Agents and
Multiagent Systems. 2012.
82. Willis A, Kukla R, Kerridge J. Developing
the behavioural rules for an agent–based
model of pedestrian movement. In: 25th
European Transport Congress,
Cambridge, UK. (Unpublished); 2000,
September.
83. Daamen W, Hoogendoorn SP. Pedestrian
traffic flow operations on a platform:
observations and comparison with
simulation tool SimPed. In Allen J,
Brebbia CA, Hill RJ, et al. (Eds).
Computers in Railways IX (Congress
Proceedings of CompRail 2004). Dresden,
Germany. Southampton: WIT Press; 2004;
125–34p.
84. Schelhorn T, O’Sullivan D, Haklay M, et
al. STREETS: An Agent Based Pedestrian
Model. CASA, Paper 9. 1999. ISSN:
1467–1298.
85. Cheung CY, Lam WHK. A study of the
bi–directional pedestrian flow
characteristics in Hong Kong mass transit
railway stations. Journal of the
EasternAsia Society for Transportation
Studies. 1997; 2(5): 1607–20p.
86. Cheung CY, Lam WHK. Pedestrian route
choices between escalator and stairway in
MTR stations. J. Transp. Engrg., ASCE.
1998; 124(3): 277–85p.
87. Lam WHK, Cheung CY. Pedestrian
speed–flow relationships for walking
facilities in Hong–Kong. Journal of
Transportation Engineering, ASCE. 2000;
126(4): 343–9p.
88. Hoogendoorn SP, Daamen W, Bovy PHL.
Extracting microscopic pedestrian
characteristics from video data. TRB 2003
Annual Meeting CD–ROM. 2003.
89. Willis A, Kukla R, Kerridge J, et al. laying
the foundations: The use of video footage
to explore pedestrian dynamics in
PEDFLOW. In: Pedestrian and
Evacuation Dynamics. Springer; 2002;
181–6p.
90. Li S, Sayed T, Zaki MH, et al. Automating
collection of pedestrian data using
computer vision techniques. TRB 2012
Annual Meeting. 2012.
Related Documents