ata on Soils and Geology in the Basin Area and eir Relevance to Groundwater in the Area PART I 1.1 Past Studies Carried Out on Rainfall, Landforms, Soils, Geology and Agro- Ecological Environments Under the Canada - Ceylon Colombo Plan Project, the Hunting Survey Corporation of Canada carried out the following studies during the period 1958-1961. (a) Rainfall Analysis was done for the whale country based on reliable rainfall data available for the period (1907 to 1956 inclusive), and which also covered all the river basins from Walawe through to Menik Ganga. Results of this study have been reported in the Hydrometeorology of Ceylon (1962). (b) Detailed rainfall analysis of long term data from 40 rainfall stations for the whk of the Walawe river basin was carried out in 1959-60 and results published in the Resources of the Walawe Ganga Basin (1960). ; Based on the foregoing studies, and assuming that no significant changes have taken place over the last forty years in respect of both annual and seasonal rainfall patterns, the annual rainfall isohyets covering all three basins is shown in Figure 1; and the maha, or the main wet season rainfall isohyets are shown in Figure 2. As could be seen in both figures, the annual rainfall ranges from 1000 mm in the low elevation areas to more than 2,000 mm in the higher elevation areas. The elevation map is shown in Figure 3. As could be seen in Figure 2, the north east monsoon season rainfall ranges from 400 to 600 mm. 1.1.2 Lanclforms An identification and characterization of the various landforms that make up the physiography of the individual river basins is basic to a proper understanding of the hydrogeology of this region. Here again, it has been fortunate that the very first landforms study of a river hasin in this country according to the accepted mthodology was first carried out in the Kirindi Oya basin by the Hunting Survey Corporation in collaboration with the national agencies in 1956-1957; and the results were reported by Hodges (1958) in Landforms of the Kirindi Oya Basin. Subsequently, the landforms of the Walawe Basin were identified, characterized and mapped by Hunting Survey Corporation using 1:40,000 air photos combined with supporting field studies. ' Director, Water Resources Board and Consultant, IWMI. 63

Welcome message from author
This document is posted to help you gain knowledge. Please leave a comment to let me know what you think about it! Share it to your friends and learn new things together.
Transcript

ata on Soils and Geology in the Basin Area and eir Relevance to Groundwater in the Area
PART I
1.1 Past Studies Carried Out on Rainfall, Landforms, Soils, Geology and Agro-Ecological Environments
Under the Canada - Ceylon Colombo Plan Project, the Hunting Survey Corporation of Canada carried out the following studies during the period 1958-1961.
(a) Rainfall Analysis was done for the whale country based on reliable rainfall data available for the period (1907 to 1956 inclusive), and which also covered all the river basins from Walawe through to Menik Ganga. Results of this study have been reported in the Hydrometeorology of Ceylon (1962).
(b) Detailed rainfall analysis of long term data from 40 rainfall stations for the w h k of the Walawe river basin was carried out in 1959-60 and results published in the Resources of the Walawe Ganga Basin (1960).
;
Based on the foregoing studies, and assuming that no significant changes have taken place over the last forty years in respect of both annual and seasonal rainfall patterns, the annual rainfall isohyets covering all three basins is shown in Figure 1; and the maha, or the main wet season rainfall isohyets are shown in Figure 2.
As could be seen in both figures, the annual rainfall ranges from 1000 mm in the low elevation areas to more than 2,000 mm in the higher elevation areas. The elevation map is shown in Figure 3.
As could be seen in Figure 2, the north east monsoon season rainfall ranges from 400 to 600 mm.
1.1.2 Lanclforms
An identification and characterization of the various landforms that make up the physiography of the individual river basins is basic to a proper understanding of the hydrogeology of this region.
Here again, it has been fortunate that the very first landforms study of a river hasin in this country according to the accepted mthodology was first carried out in the Kirindi Oya basin by the Hunting Survey Corporation in collaboration with the national agencies in 1956-1957; and the results were reported by Hodges (1958) in Landforms of the Kirindi Oya Basin.
Subsequently, the landforms of the Walawe Basin were identified, characterized and mapped by Hunting Survey Corporation using 1:40,000 air photos combined with supporting field studies.
' Director, Water Resources Board and Consultant, IWMI.
63
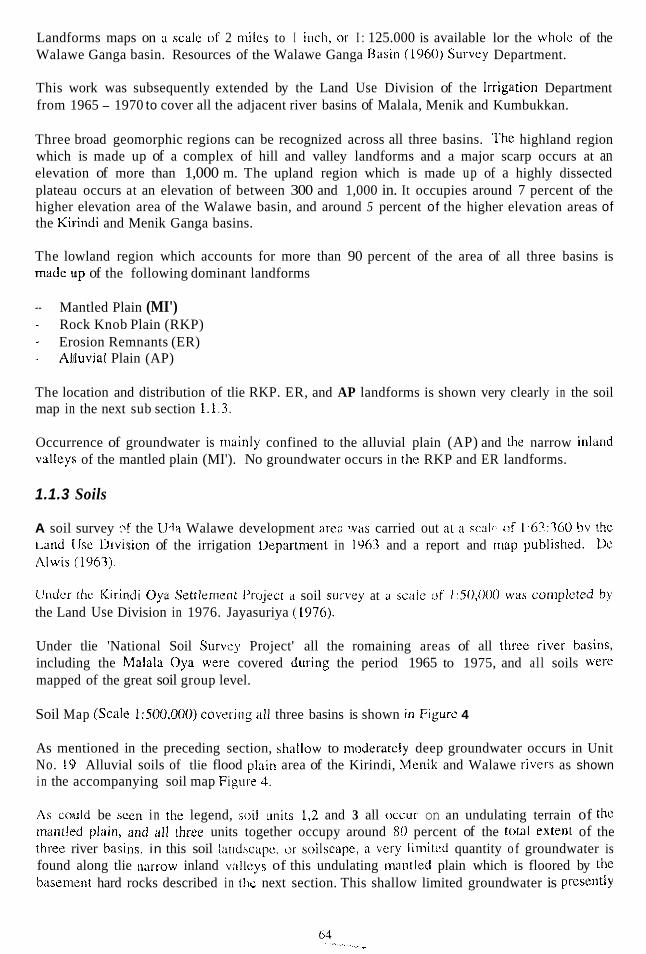
Landforms maps on ii scillc of 2 miles to I iiich, 0 1 I : 125.000 is available lor the W I I O I C of the Walawe Ganga basin. Resources of the Walawe Ganga 13asin (1960) Sui-vey Department.
This work was subsequently extended by the Land Use Division of the Irrigation Department from 1965 - 1970 to cover all the adjacent river basins of Malala, Menik and Kumbukkan.
Three broad geomorphic regions can be recognized across all three basins. The highland region which is made up of a complex of hill and valley landforms and a major scarp occurs at an elevation of more than 1,000 m. The upland region which is made up of a highly dissected plateau occurs at an elevation of between 300 and 1,000 in. It occupies around 7 percent of the higher elevation area of the Walawe basin, and around 5 percent of the higher elevation areas of the Kiiiiidi and Menik Ganga basins.
The lowland region which accounts for more than 90 percent of the area of all three basins is made up of the following dominant landforms
- Mantled Plain (MI') - Rock Knob Plain (RKP) - Erosion Remnants (ER) - Allluvial Plain (AP)
The location and distribution of tlie RKP. ER, and AP landforms is shown very clearly in the soil map in the next sub section 1.1.3.
Occurrence of groundwater is mainly confined to the alluvial plain (AP) and h e narrow inlaud valleys of the mantled plain (MI'). No groundwater occurs in the RKP and ER landforms.
1.1.3 Soils
A soil survey :-f the LJda Walawe development art% ',v'iis carried out zit ii cca1'- r f L.6?.:760 5 v t!ie L a d Use Ihvision of the irrigation Ikpartment in 1963 and a report and nlnp publistled. Lk Alwis (1963).
linilcr h c Kirindi Oya Settlerriznt Pruject ;I soil survey at rl sciilc u f 1 :SO,OOO w:ts coniplcted by the Land Use Division in 1976. Jayasuriya (1976).
Under tlie 'National Soil Survcy Project' all the romaining areas of all t ime trivet- basins, including the Malala Oya Were covered dui-ing the period 1965 to 1975, and al l soils %'ere mapped of the great soil group level.
Soil Map (Scale I:500,000) covering ;dl three basins is shown iii Figurc 4
As mentioned in the preceding section, sh:illow to moderatcly deep groundwater occurs in Unit No. L9 Alluvial soils of tlie flood p l i t i n area of the Kirindi, Menik and Walawe rivet-s as shown i n the accompanying soil map Figure 4.
As coiuld be seeti in tile legend, :;oil units 1.2 and 3 all occur on an undulating terrain of the rnarikd l~laiii, arid 1 1 1 tliree units together occupy around XI) percent of the totill extent of the three river hasins. in this soil I;itidscq~c. c r soilscape, ii wiry limitcd quantity o f groundwater is found along tlie iiarrow inland v:illcys of this undulating mantled plain which is floored by thc biisenicnt hard rocks described in the next section. This shallow limited groundwater is preseiitiy
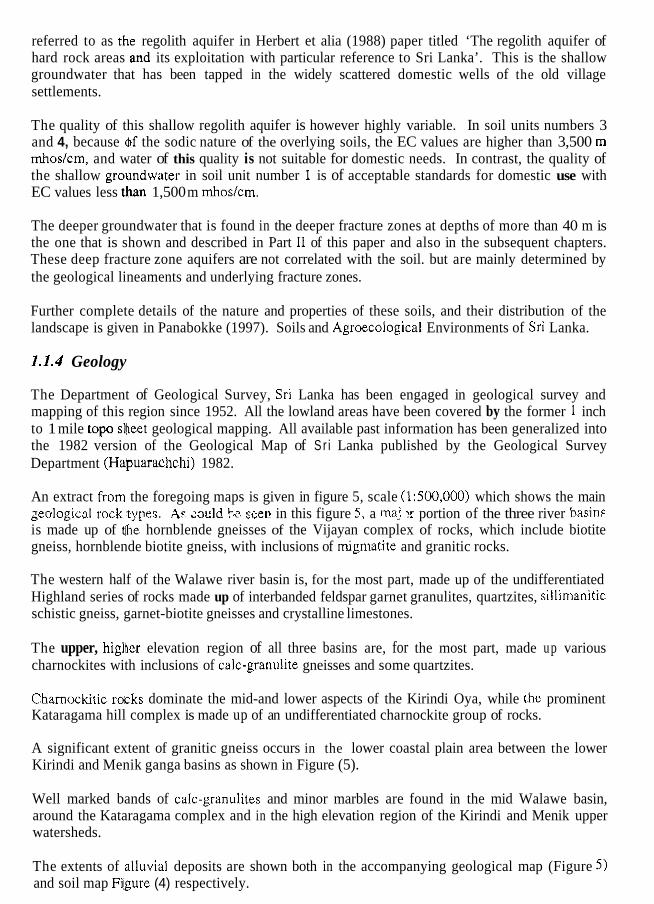
referred to as the regolith aquifer in Herbert et alia (1988) paper titled ‘The regolith aquifer of hard rock areas :and its exploitation with particular reference to Sri Lanka’. This is the shallow groundwater that has been tapped in the widely scattered domestic wells of the old village settlements.
The quality of this shallow regolith aquifer is however highly variable. In soil units numbers 3 and 4, because @f the sodic nature of the overlying soils, the EC values are higher than 3,500 rn mhos/cm, and water of this quality is not suitable for domestic needs. In contrast, the quality of the shallow grorndwater in soil unit number 1 is of acceptable standards for domestic use with EC values less @an 1,500 m mhoslcm.
The deeper groundwater that is found in the deeper fracture zones at depths of more than 40 m is the one that is shown and described in Part I1 of this paper and also in the subsequent chapters. These deep fracture zone aquifers are not correlated with the soil. but are mainly determined by the geological lineaments and underlying fracture zones.
Further complete details of the nature and properties of these soils, and their distribution of the landscape is given in Panabokke (1997). Soils and Agroecological Environments of Sri Lanka.
1.1.4 Geology
The Department of Geological Survey, Sri Lanka has been engaged in geological survey and mapping of this region since 1952. All the lowland areas have been covered by the former 1 inch to 1 mile top0 sheet geological mapping. All available past information has been generalized into the 1982 version of the Geological Map of Sr i Lanka published by the Geological Survey Department (Hapuarachchi) 1982.
An extract from, the foregoing maps is given in figure 5, scale (1:500,000) which shows the main 2eologica.l rocktypes. A?. a u l d tz, stiep in this figure 5 , a m.aj x portion of the three river basin9 is made up of Uhe hornblende gneisses of the Vijayan complex of rocks, which include biotite gneiss, hornblende biotite gneiss, with inclusions of migmatite and granitic rocks.
The western half of the Walawe river basin is, for the most part, made up of the undifferentiated Highland series of rocks made up of interbanded feldspar garnet granulites, quartzites, sillimanitic schistic gneiss, garnet-biotite gneisses and crystalline limestones.
The upper, higlher elevation region of all three basins are, for the most part, made up various charnockites with inclusions of calc-granulite gneisses and some quartzites.
Chamockitic rmks dominate the mid-and lower aspects of the Kirindi Oya, while thc prominent Kataragama hill complex is made up of an undifferentiated charnockite group of rocks.
A significant extent of granitic gneiss occurs in the lower coastal plain area between the lower Kirindi and Menik ganga basins as shown in Figure (5).
Well marked bands of calc-granulites and minor marbles are found in the mid Walawe basin, around the Kataragama complex and in the high elevation region of the Kirindi and Menik upper watersheds.
The extents of ,alluvial deposits are shown both in the accompanying geological map (Figure 5) and soil map Fiigure (4) respectively.

As to be expected the more promising areas for groundwater extraction are the alluvial deposits of the lower flood plain areas of the main rivers. As could be very clearly seen in the Soil Map figure (4), the flat alluvial plain of the Kirindi Oya which is around 7,000 ha in extent constitutes the most productive aquifer (both shallow and medium) followed by the Menik Ganga alluvial plain 3,500 ha in extent, and the Walawe 1,700 ha in extent. These aquifers hold up adequate quantities of groundwater throughout the dry season, and this has enab'led stable domestic settlements in this alluvial plain of the Kirindi and Walawe over the last 125 years.
The alluvial aquifer of the Menik Ganga flood plain has not been exploited to date because it encompasses the south western segment of the Yala National Park. The alluvial aquifer of the Walawe ganga flood plain has been intensively utilized for human settlement since the ancient period.
I . I . 5 Agroecological Environments (AER)
An aglroecological region AER in this country is characterized and defined in terms of its rainfall probability regimes, elevation, landforms and soils. Definitions, settings and distribution of AERS in Sri Lanka is given in adequate detail in Panabokke (1997). The main elements are briefly outlined below:
The highest demarcation level is wet zone (W) intermediate zone (I) and dry zone (D). The second stage of subdivision is elevation - low country (L) is demarcated as land below 300 m elevation, mid country (M). as land between 300 and 900 m elevation; and up-country (U) as land over 900 m elevation. The third stage is the subdivision into agro-ecological regions AERs, which represent homogeneous climatic conditions combined with soils, landforms and land use.
The first stage of demarcation into the dry (D) intermediate (I) and wet zone (W) is shown in Figure 6. The second stage of demarcation showing the mid (M) and Up-country (U) demarcation is shown in Figure 7.
The third stage of demarcation into the respective AERS is also shown in Figure 7. As could be seen in this figure, a grater part of all three basins fall within the agroecological region of DL1 and DL5; and the rest into lL2, IM2 and IU2, and a small portion of the upper Walawe Ganga basin into WM2
One of the most useful depictions of an AER is in terms of its monthly sequential rainfall probability at the 75% probability level matched against total evapotranspiration for the corresponding monthly period. This is shown in Figure 8 for the AER of DL 1 and DL 5.
1.1.6 Land Use
A reliable depiction of the prevailing land use categories within the three river basins areas could be had from the following Land Use Map of scale 1:100,000 published by the Centre for Remote Sensing (CRS) of the Survey Department on the following dates.
1. Hamhantota District Land Use 1983. Published December, 1986. 2. Moneragala District Land Use 1981 - 1884. 2 sheets Published March 1987 3. Ratnapura District Land Use 1981 - 1984 Published December 1987.
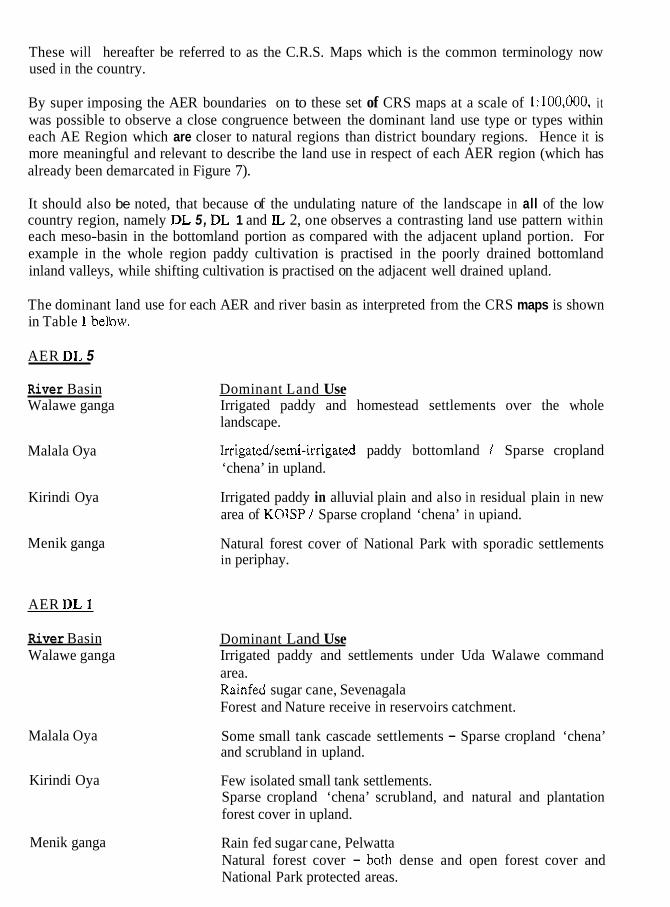
These will hereafter be referred to as the C.R.S. Maps which is the common terminology now used in the country.
By super imposing the AER boundaries on to these set of CRS maps at a scale of 1:100,000, it was possible to observe a close congruence between the dominant land use type or types within each AE Region which are closer to natural regions than district boundary regions. Hence it is more meaningful and relevant to describe the land use in respect of each AER region (which has already been demarcated in Figure 7).
It should also be noted, that because of the undulating nature of the landscape in all of the low country region, namely DL 5, DL 1 and IL 2, one observes a contrasting land use pattern within each meso-basin in the bottomland portion as compared with the adjacent upland portion. For example in the whole region paddy cultivation is practised in the poorly drained bottomland inland valleys, while shifting cultivation is practised on the adjacent well drained upland.
The dominant land use for each AER and river basin as interpreted from the CRS maps is shown in Table 1 berow.
AER DL 5
River Basin Walawe ganga
Malala Oya
Kirindi Oya
Menik ganga
AER DL 1
River Basin Walawe ganga
Malala Oya
Kirindi Oya
Menik ganga
Dominant Land Use Irrigated paddy and homestead settlements over the whole landscape.
Irrigatedkemi-irrigated paddy bottomland / Sparse cropland ‘chena’ in upland.
Irrigated paddy in alluvial plain and also in residual plain in new area of KOlSP I Sparse cropland ‘chena’ in upiand.
Natural forest cover of National Park with sporadic settlements in periphay.
Dominant Land Use Irrigated paddy and settlements under Uda Walawe command area. Rainfed sugar cane, Sevenagala Forest and Nature receive in reservoirs catchment.
Some small tank cascade settlements - Sparse cropland ‘chena’ and scrubland in upland.
Few isolated small tank settlements. Sparse cropland ‘chena’ scrubland, and natural and plantation forest cover in upland.
Rain fed sugar cane, Pelwatta Natural forest cover - both dense and open forest cover and National Park protected areas.

AERs IL2 and IM 2
Across all three basins the dominant land use is settled homestead with semi-perennial crops, some coconut, banana, papaw, sugarcane and mixed home-garden.
Small1 extent of forest reserves and some pinus plantations in the more step land. Some open natural forest and savannah and less steep land.
Soil erosion hazard is fairly high on badly aligned roadways, road banks and badly managed chena land.
AER$ IU 2 and WM 2
IU 2 covers the higher elevation areas, mainly the highland region of the Walawe basin, and a very small proportions of the upper Kirindi Oya. Well managed tea plantations, and some forest (Pinus) plantations together with some eucalyptus covers most of the IU2 area. Also some steep inaccessible lands occur along the Belihul Oya and Weli Oya sub-watersheds.
WM 2 is mainly confined to the upper and mid-western portion of the Walawe ganga basin. The dominant land use hcre is the typical mixed Kandyan forest garden type of settlement. Some terraced paddy fields on the moderately sloping land is also observed cast of Balangoda.
As could be seen from the above figure 8 in 1.1.5for the AER of DL 1, for the three months of October, November, December, and partly in the two months of January and April, the monthly rainfall1 probability value is balanced by the monthly evapotranspiration value. In contrast, for the AER of DL 5 , this balance obtains only for the month of November and part of December - January. The AER of DL 5 is therefore a drier regime than DL1.
1.2 Agroecology to Groundwater in the Area
The groundwater as described and discussed in this chapter relates exclusively to the ‘regolith’ or the shallow aquifer as it is now recognized for the so-called hard rock regions of Sri Lanka and also Africa by Herbert, Ball and Wright (1988) of the British Geological Survey, Wallingford. This shallow aquifer is mainly confined to the narrow inland valley systems of the undulating mantled plain topography of the DL 1 and DL 5 Agroecological Regions.
The deeper aquifer which occurs in the fracture zone of these basement rocks are more sporadic, and related to the lineaments that occur in this hard rock regions. This fracture zone aquifer occurs in the underlying fracture zone at depths of around 40 rn or more, and it is described and discussed separately in Section 3.3 of this paper.
A schematic section of a typical regolith profile according to Hcrbe~t et at (1988) is shown in Figure 9. The Three main sub-divisions of the regolith are the ‘collapsed zone’ below the soil zone, and which extends up to 3 m in thickness and generally lying above the water table; the “saprolilte” horizon which is commonly termed as highly weathered rock; and “saprock” which is slightly weathered and generally more open than fresh rock. The collapsed zone, saprolite and saprock together are called regolith. the thickness of which is variable, but usually not greder than 10 lm in this region.
Rebvance of Rainfall, Landforms, Soils, Geology, Land Use and

The traditional domestic wells and the more recent agrowells usually penetrate only up to the top of the saprock horizon because hand digging by conventional tools becomes more difficult beyond this layer or horizon. In a few instances these wells have excavated a portion of the underlying fresh bedrock.
The fracture zone occurs at depths of beyond 40 m in this hard metamorphic rock wherever the deeper tectonic forces have caused some degree of jointing or fracturing of the basement complex. The groundwater occurring in this zone of jointing or fracturing is referred to as the deep fracture groundwater.
The recharge to the regolith aquifer takes place during infiltration of rain water through the several soil horizons during the rainy season. In the DL I Agroecological regions of the north central province, the annual groundwater recharge on this same type of metamorphic hard rock is between 100 to 125 mm. A recharge figure of 100 mm could therefore be safely adopted for the DL 1 AER of the southern river basins as well.
For the DL 5 ,agroecological region, which has a lower annual and seasonal rainfall, the recharge depends on the amount of annual rainfall. De Silva (1998) has shown that for Angunakolapelessa in DL 5 , the estimate of recharge for the driest year 1989 is only 20 rnm when the annual rainfall was only 723 m; and for a normal year 1987 when the annual rainfall was 1040 mm the estimate of recharge is 60 mm.
The groundwater studies conducted by COW1 Consultants (1994) in the Anuradhaprua district DL 1 AER region, show that in some locations there is a interconnection between the regolith aquifer and the deep fracture zone aquifer based on the nitrate values in the pathway.
As could be inferred from the preceding subsections 1.1.2 to 1.1.6 that the main groundwater resources of all three river basins is mainly confined to the lowland region described in sub- section (1.12) landforms, which 1s stated earlier accounts for more than 90 percent of the area of all three basins. At the same time it is confined to the dominant landforms of the Alluvial Plain (AP) and the Mantled Plain (MP).
As could also be seen from the soil map Figure 4, Soil Unit No. 19, alluvial soils depict the Alluvial Plain (AP) area; and Soil Units Nos. 1,3 and 4 together depict the Mantled Plain (MP). One could also observe small extents of alluvial soils along the main river courses.
Occurrence of any kind of groundwater could be ruled out on land units Nos. 41 and 43 which depict Rock Knob Plain and Erosional Remnants (Inselbergs).
The nature of occurrence of groundwater in the alluvial plain (AP) and in the mantled plain (MP) is now discussed.
Sakthivadivel et.al (1994).
Alluvial Plain AP
The flat alluvial plain of the Kirindi Oya is located downstream of the present Lunugamvehera reservoir, and is bounded by the Wirawila wewa on its right bank, and the Tissa and Yodakandiya wewa on the left bank. The groundwater within this flat alluvial plain is regularly re-charged by the irrigation water releases from these tank reservoirs. The homestead settlements that dot this flat plain are situated at a slightly higher elevation of 1 m above the base level of the plain . They have been settled here since 1887, and they draw their water supply from the open wells where the water table is within 3 - 5 m below ground level.

In the Walawe alluvial plain around the Ambalanthota town and its environs, the situation is very similar to that described for the Kirindi Oya flat plain, except that this Walawc alluvial plain is more dissected and is less continuous as compared to the Krinidi plain.
Within 'the narrow deposits of alluvial soils along the main river courses, small quantities of shallow groundwater are exploited both for domestic use and small plot lift irrigation enterprises.
Mantled Plain MP
As could be seen in the soil map figure 4 the mantled plain (MP) is made up of the following three soil map units.
Soil Map Unit No. I -Reddish brown earths and low humic gley soils -undulating. Soil Map Unit No. 3 - Reddish brown earths with high amount of grave in sub soil - undulating terrain. Soil Map Unit No. 4 -Reddish brown earths and solcdized solonetz - undulating terrain.
Cross reference to the AER Map Figure 7, shows that most of Soil Map Unit Nos. 3 and 4 fall within the AER of DL 5 which is a semi-arid environment, while Soil Map Unit No. 1 falls within the AER of DL 1 which is a semi - humid environment.
Since both groundwater recharge as well as groundwater quality is poor within DL 5 and soil units 3 and 4, this area is discounted as any useful groundwater resource.
A schematic section of the soilscape of Soil Map Unit No. 1 which falls within DL 1 is shown in Figure 10. The regolith aquifer is mainly confined to valley bottom containing a narrow deposit of alluvial soils and extending to the whole of the low humic glley soil area. It is within this narrow inland valleys of this undulating landscape that the domestic wells of the village settkments we located. These wells are recharged during the w-t rainy season in October - January, and they have adequate quantity of shallow groundwater for domestic needs to tide over the long dry season from May to September. However, in years of unusually low rainfall such wells tend to go dry, and hence the usefulness of the several tube wells that have been constructed over the last twenty years by various donor agencies.
Wherever there is a small village tank in the upstream portion of the inland valley it helps to enhance the groundwater supply in the downstream portions. In fact, in the several small village tank cascades present within the Malala Oya basin, the groundwater supply in the village wells is significantly improved.
In the case of that part of the Malala Oya basin above the Badagiriya, tank one could identify fifteen discreet small tank cascade meso-basins. Within six of these cascades namely Mattala, Getakumbura, Ranmudu, Nikawewa, Indiwewa, and Gonnoruwa there have been permanent village settlements over the last 150 years. This has been possible because the shallow regolith aquifer within these cascades receives sufficient augmentation of the groundwater supply from the several small tanks that are present within the main valley of these cascades.
The highest density of abandoned small tanks is found within soil unit number 4, especially within lower half of the Menik Ganga basin. The highly dispersible nature of the sodic soil material used for construction of these small tank bunds accounts for this high percentage of abandoned tanks in this area.
PART I1
Groundwater
2.1. Data Review
2.1.1 Data Related Groundwater
Presently, the National Water Supply and Draingage Board (NWSDB) Kt Water Resources Board (WRB) are th& main institutions involved in groundwater development activities. Since, both institutions have carried out hydrogeological investigations in some parts of the study area, it is possible to gather the following data pertaining to groundwater resources.
Hydrogeological Data
Both institutions have conducted detailed hydrogeological studies under local and foreign funds. Among this, Inltegrated Rural Development Project (JRDP) Hambantota & Monaragala districts conducted by WRB are two of the main projects. Under these projects, about 365 numbers of tube wells were coqpleted for the study area and it was possible to collect data on depths, water levels. yields, overburden depths, fracture depths, etc. However, it should be noted that the water levels available in each wells are only at the time of drilling and not for time series.
In addition to above, about 120 numbers of data have been collected from NWSDB on the wells constructed under various projects. Most of these wells have been constructed mainly for the rural community and therefore, fitted with hand pumps. The yield required for these wells generally very low (less tlhan 5 Ipm) and located in close proximity to village settlements. Hence, the data such as fracturing and yield may not represent most hydrogeologically favourable geo-structural characteristics. However, using high yielding wells in cooperation with aerial photographs. i t was possible to carry out some interpretation works for groundwater potential studies, which will be described in the latter part of this report.
Data on pumping tests is essential to evaluate aquifer parameters in order to integrate with groundwater potential studies. In this context, data collection on pumping tests was possible in some places where test wells had been drilled by both WRB & NWSDB. Even though, the above pumping tests were carried out for short time periods, analytical results revealed reasonable parameter values.
Hydrogeochemdcal Dala
Chemical analysis for water samples of test wells drilled by both institutions is available for nearly about 70 % of the above wells. The main chemical parameters such as Electrical Conductivity, Hardness, Alkalinity, Fluoride, Sulphate, Sodium, Iron, etc. have been use to identify the variation of groundwater quality and suitability for different purposes.
Geophysical Dala
Selections of drilling sites are generally confirmed by geophysical surveys including geo- electrical resistivity profiling and soundings. Even though, these wells were constructed specially for hand pumps, they were selected based on geomorphological studies and field reconnaissance.

Therefore, it is possible to find about 40 % of geo-electrical resistivity data of constructed tube wells by both institutions.
2.2. Main Aquifers and Aquifer Units
Aquifers of the study area mainly of two types, namely (1) Hard Rock Aquifer and (2) Consolidated Aquifer consisting of river alluviums and coastal sands.
2.2.1 Hard Rock Aquifer
Geologically, this area belongs to both Highland and Vijayan series of Precambrian metamorphic rocks. As a metamorphic terrain, underlain by chamokites, granites, granitic gneisses, hornblende biotite gneisses, biotite gneisses, etc. revealed similar aquifer characteristics with respect to the fracturing and weathering. In addition, crystalline limestone traced mainly in Embilipitiya area traversing north - w a r direction act as a high potential aquifer due to high fracturing and weathering with solution cavities.
Analytical data of fracture depths revealed that all types of hard rocks are intensively fractured within the range of 20 to 30 meters below ground level. However, general variation of fracture depths could be identified within the depths of 10 to 40 meters below ground level.
From the above fracture analysis, crystalline limestone has shown comparatively high yields due to the openings of solution cavities within the fracture network. These fractured aquifers generally semi confined and few of them were observed as confined due to artesian conditions. For example, some tube wells located at Embilipitiya, Thanamalwila and Panamure areas.
Well Yields
According to the >iatistical data on we11 yields, a wide range of yield variations generally from i0 to over 100 litters per minute is measured. Also, 8 % of dry wells were noted among 475 number of tube well data. This could be due to selection of well sites without proper hydrogeological and geophysical surveys. However, data on dry wells and very poor yields have been incorporated when preparing hydrogeological maps showing very low groundwater potential zones.
About 35 % of existing tube wells show yields of more than 50 litters per minute. Most of these wells are constructed within the highly fractured joint and lineament zones and most of them are production wells. However, the locations of these wells are concentrated within the few places of the study area. The groundwater zonation maps prepared for the four separate basins prove this.

Figure A. Percentage of existing tube wells showing the water yields in the study area
40
35 30
g 25
s 20 ”.. 0 8 15
10
5
0
33.5
15.6
0 - 1 0 11 -20
16.4
21 - 50
12
51 -99
22.5
2.100
Range of Yields (Iprn)
2.2.2 Unconsolidated sediments
As main unconsolidated sediments, river alluvium and coastal sands are identified in all the river basins, mainly within the coastal zone and nearest area (Fig. 5).
In Walawe river basin, this river alluvium would be traced mainly down stream of Ridiyagama tank. It is demarcated within about 100 km2 towards southern coastal belt, which is nearly 6 - 7 km with extending along the coastal belt. However, groundwater quality of coastal sandy aquifer is saline with negligible fresh water lenses Therefore, no quantification was done due to its unproductively.
In addition, it was possible to demarcate river alluvium in both Kirindi Oya and Malala Ara river basins. In Kirindi Oya basin, Occurrence of sandy aquifer is proven by test drilling resulls obtained from WRL3. According to the data, distribution of sandy alluvium aquifer unit could be demarcated in the areas downstream of the Thissa tank and localities around Kirinda, Koththamalli yaya and Gangeyaya (Fig.5). Shallow boreholes drilled in these aquifer units are used as an additional water source for the present water supplies in Tissarnaharama area.
In Menik ganga basin river alluvium could be occurring within a very limited extent in Yala National Park area. Since no data available on these aquifer units, no quantification was done on groundwater potential. Further this has to be considered when detailed Hydrogeological studies be carried out in future. Finally, it should be noted that all the sandy alluvial aquifers mentioned above proven to be recharged by surface water bodies such as tanks (Ridiyagama in Walawa basin, Tissa & Weerawila in Kirindi Oya basin) in addition to seasonal rainfall recharge.

2.3 Nature of Occurrence of Regolith Aquifer and Fracture Zone Aquifer in Relation to Geology and Landforms
The main features and the mode of Occurrence of the regolith aquifer has been described and discussed in Section 1.2 of Part 1 of this report. Similarly the main features and mode of Occurrence of the fracture zone aquifer is described in Section 2.3.2 Part I1 of this report. In this sub-section the occurrence of each of these aquifers in relation to the geology and landforms is mainly discussed.
2.3.1 Regolith Aquifer
As previously indicated in section 1.2 of Part 1 of this report, the regolith aquifer is mainly confined to the landform of ‘mantled plain’ which is co-terminus with soil map units 1,3, and 4 as shown in soil map of Figure 4.
A schematic section of the soilscape was shown in figure 10 which indicates quite clearly that this regolith aquifer is mainly confined to the valley bottom position of this landscape which is undulating in nature. As a general rule, this inland valley part of the landscape does not occupy more than 15 to 20 percent of the areal extent of the whole landscape, depending on the degree of undulation. In effect it means, that the regolith aquifer is present only within an areal extent of around 15 percent of the whole landscape area.
This whole undulating landscape in soil map unit No 1 is made up of individual smaller meso- catchment basins that range in size from 5 to 10 square miles with a modal value of 8 sq. miles. Within each of these meso-catchment basins one could identify the main valley which is a second or third order inland valley, and its component side valleys which are fist order inland valleys. In a modall meso-catchment basin, this main valley will be around six miles in length, and the regolith aquifer is confined to a narrow band along the main axis of this main valley. This narrow band can be around 2.50 m wide in .he upper end of this main valley. 2nd around 600 to 700 m in the lower end of the main valley.
Wherever there are small village tanks located across the main valley of these meso-basins, the seepage of tank waters from these small storage tanks will help to augment the groundwater hydrology of this regolith aquifers.
These are now referred to as the small tank cascade systems of the dry zone. Some of the best examples of such small tank cascade systems are found in the Malala Oya basin. Examples are Mattala, Bodagama, Gannoruwa and Meegahajandura small tank cascade settlements that have been in existence over several centuries, and which have drawn their domestic water requirements from wetls located within this regolith aquifer.
As a general rule, the groundwater or the phreatic water table rises very rapidly with the onset of the rainy season in October-November. and by December the regolith aquifer is almost fully re- charged. After February, this water table recedes gradually and at the end of the dry season in July - August, phreatic water is present only in the lowest aspects of the inland valleys of the meso-basin.
Senaratue (1994) reports that in the north central province, the areas covered by quartzites and garnet biotite gneisses rocks have a better hydrogeological conditions for agrowell yields than
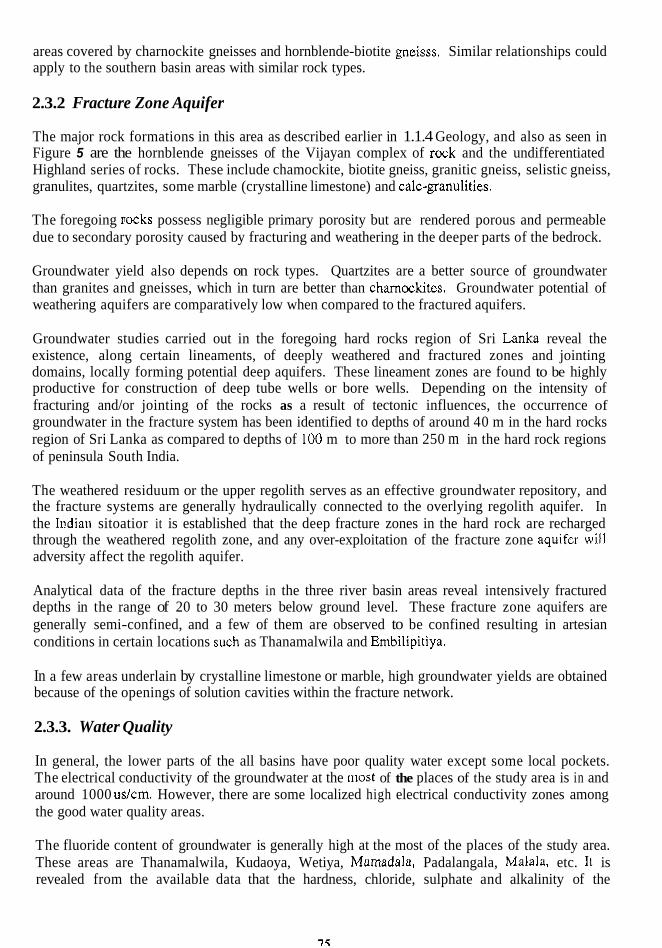
areas covered by charnockite gneisses and hornblende-biotite gneisss. Similar relationships could apply to the southern basin areas with similar rock types.
2.3.2 Fracture Zone Aquifer
The major rock formations in this area as described earlier in 1.1.4 Geology, and also as seen in Figure 5 are the hornblende gneisses of the Vijayan complex of rock and the undifferentiated Highland series of rocks. These include chamockite, biotite gneiss, granitic gneiss, selistic gneiss, granulites, quartzites, some marble (crystalline limestone) and calc-granulities.
The foregoing flocks possess negligible primary porosity but are rendered porous and permeable due to secondary porosity caused by fracturing and weathering in the deeper parts of the bedrock.
Groundwater yield also depends on rock types. Quartzites are a better source of groundwater than granites and gneisses, which in turn are better than chamockites. Groundwater potential of weathering aquifers are comparatively low when compared to the fractured aquifers.
Groundwater studies carried out in the foregoing hard rocks region of Sri Lanka reveal the existence, along certain lineaments, of deeply weathered and fractured zones and jointing domains, locally forming potential deep aquifers. These lineament zones are found to be highly productive for construction of deep tube wells or bore wells. Depending on the intensity of fracturing and/or jointing of the rocks as a result of tectonic influences, the occurrence of groundwater in the fracture system has been identified to depths of around 40 m in the hard rocks region of Sri Lanka as compared to depths of I 0 0 m to more than 250 m in the hard rock regions of peninsula South India.
The weathered residuum or the upper regolith serves as an effective groundwater repository, and the fracture systems are generally hydraulically connected to the overlying regolith aquifer. In the Icdian sitoatior it is established that the deep fracture zones in the hard rock are recharged through the weathered regolith zone, and any over-exploitation of the fracture zone aquifcr will adversity affect the regolith aquifer.
Analytical data of the fracture depths in the three river basin areas reveal intensively fractured depths in the range of 20 to 30 meters below ground level. These fracture zone aquifers are generally semi-confined, and a few of them are observed to be confined resulting in artesian conditions in certain locations such as Thanamalwila and Embilipitiya.
In a few areas underlain by crystalline limestone or marble, high groundwater yields are obtained because of the openings of solution cavities within the fracture network.
2.3.3. Water Quality
In general, the lower parts of the all basins have poor quality water except some local pockets. The electrical conductivity of the groundwater at the most of the places of the study area is in and around 1000 udcm. However, there are some localized high electrical conductivity zones among the good water quality areas.
The fluoride content of groundwater is generally high at the most of the places of the study area. These areas are Thanamalwila, Kudaoya, Wetiya, Mamadala, Padalangala, Malala, etc. I1 is revealed from the available data that the hardness, chloride, sulphate and alkalinity of the
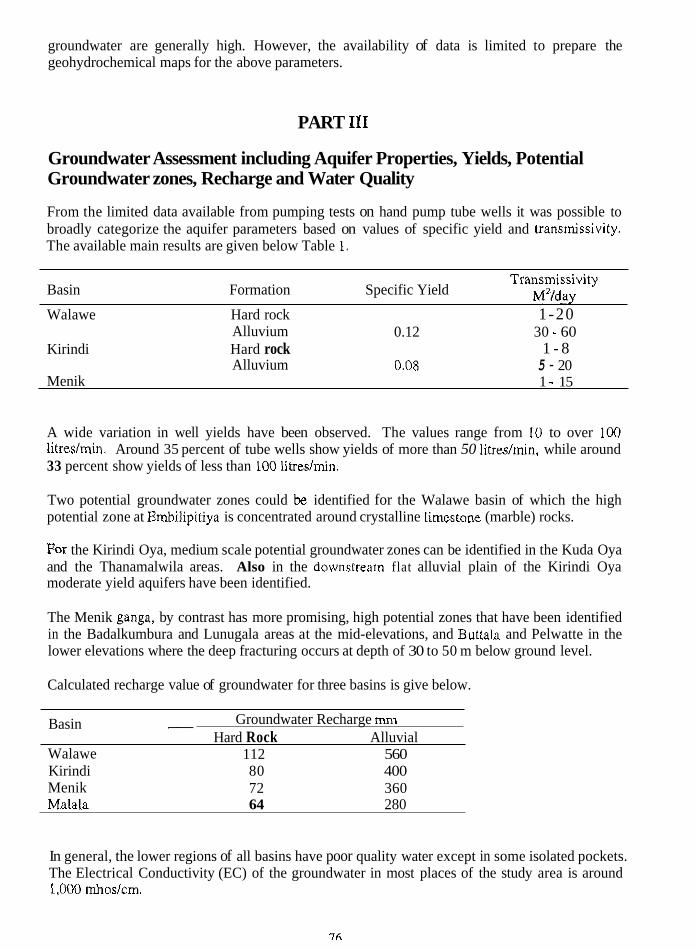
groundwater are generally high. However, the availability of data is limited to prepare the geohydrochemical maps for the above parameters.
PART I11
Groundwater Assessment including Aquifer Properties, Yields, Potential Groundwater zones, Recharge and Water Quality
From the limited data available from pumping tests on hand pump tube wells it was possible to broadly categorize the aquifer parameters based on values of specific yield and transmissivity. The available main results are given below Table 1.
Transmissivity M’fday Basin Formation Specific Yield
Walawe Hard rock 1-20 Alluvium 0.12 30 - 60
Kirindi Hard rock 1 - 8 Alluvium 0.08 5 - 20
Menik 1 - 15
A wide variation in well yields have been observed. The values range from 10 to over 100 litreslmin. Around 35 percent of tube wells show yields of more than 50 litredmin, while around 33 percent show yields of less than 100 litreslmin.
Two potential groundwater zones could be identified for the Walawe basin of which the high potential zone at Embilipitiya is concentrated around crystalline limestone (marble) rocks.
For the Kirindi Oya, medium scale potential groundwater zones can be identified in the Kuda Oya and the Thanamalwila areas. Also in the downstream flat alluvial plain of the Kirindi Oya moderate yield aquifers have been identified.
The Menik ganga, by contrast has more promising, high potential zones that have been identified in the Badalkumbura and Lunugala areas at the mid-elevations, and Buttala and Pelwatte in the lower elevations where the deep fracturing occurs at depth of 30 to 50 m below ground level.
Calculated recharge value of groundwater for three basins is give below.
Basin - Walawe 112 560 Kirindi 80 400 Menik 72 360 Malala 64 280
Groundwater Recharge mm Hard Rock Alluvial
In general, the lower regions of all basins have poor quality water except in some isolated pockets. The Electrical Conductivity (EC) of the groundwater in most places of the study area is around 1,000 mhoslcrn.
76
The fluoride content of groundwater is generally high at places such as Thanamalwila, Kuda Oya, Mamadala, Padalangala and Malala. Data available also show that hardness, chlorides, sulphate, and alkalinity values are also high in most areas.
References
Hydrometeorology of Ceylon (1962) Part I. Rainfall: Hunting Survey Corporation Canada and
Resources of the Walawe Ganga basin (1960) Hunting Survey Corporation Canada and Survey
Hodges, R. C. 1958. Landforms of the Kirindi Oya Basin Ceylon Geographer Vo. 12 No. 12.
de Alwis, K. A. 1963. Soil Survey Report of Uda Walawe Project, Land Use Division, Irrigation
Jayasuriya, E. 1976. Soil Survey Report of Kirindi Oya Project, Land Use Division, Irrigation
Herbert, R. Ball, D. and Wright E. 1988. The regolith aquifer of the hard rock areas of Sri Lanka
Panahokke, C. R. 1997. Soil and Agroecological Environments of Sri Lanka, NARESA
Hapuarachchi, D. J . 1982. Geological Map of Sri Lanka. Geological Survey Department, Sri
de Silva, C. S. Estimating groundwater recharge in dry zone of Sri Lanka, Open
Sakthivadivel, R. et aha. 19Y4. C;uidance package fnr small tank rehabilitation. I N - I F A D
COW1 Consultants. 1994. Water Supply Anurddhapura District.
Senaratne, A. 1994. consultancy Report to IIMI. Groundwater Under Tank Cascade Systems.
Survey Department, Ceylon.
Department, Ceylon.
Department.
Department.
JI . Geological Soc., Sri Lanka.
Lanka.
1998. University Review Vol. 4.
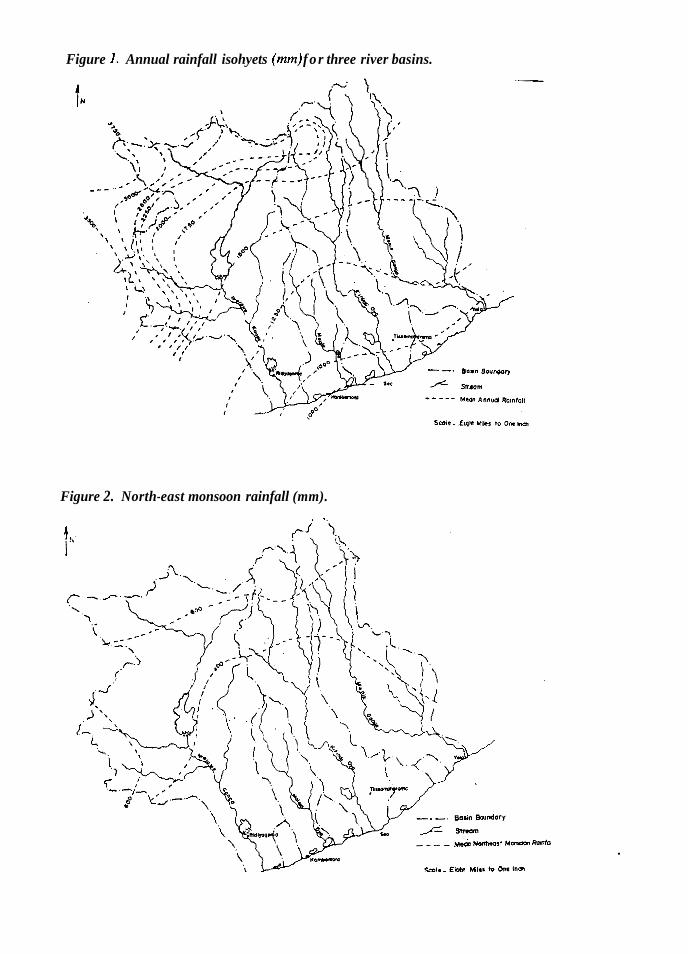
Figure 1. Annual rainfall isohyets (mm) for three river basins.
Figure 2. North-east monsoon rainfall (mm).
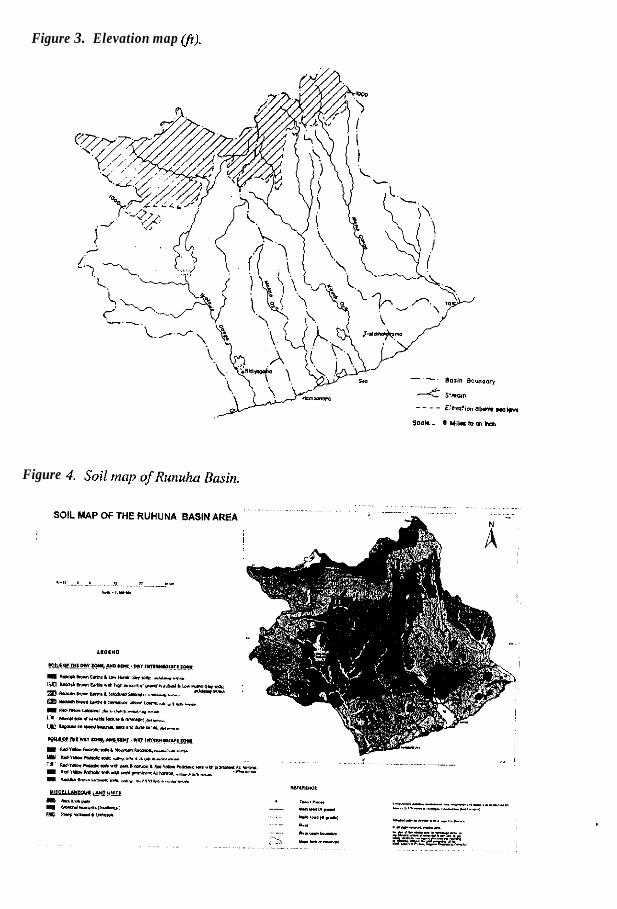
Figure 3. Elevation map Ifr).
Figure
.....
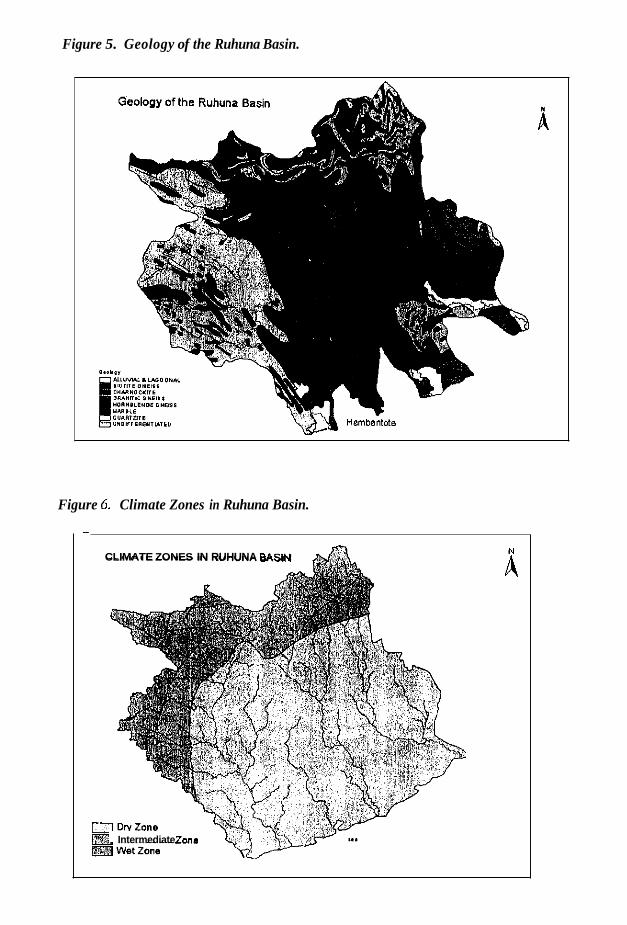
Figure 5. Geology of the Ruhuna Basin.
Figure 6. Climate Zones in Ruhuna Basin.
CLIMATE ZONES IN RUHUNA BASIN
Intermediate Zone
ii

Figure 7. Main Agroecological Regions.
L , Stream
Zonal Boundary
n.
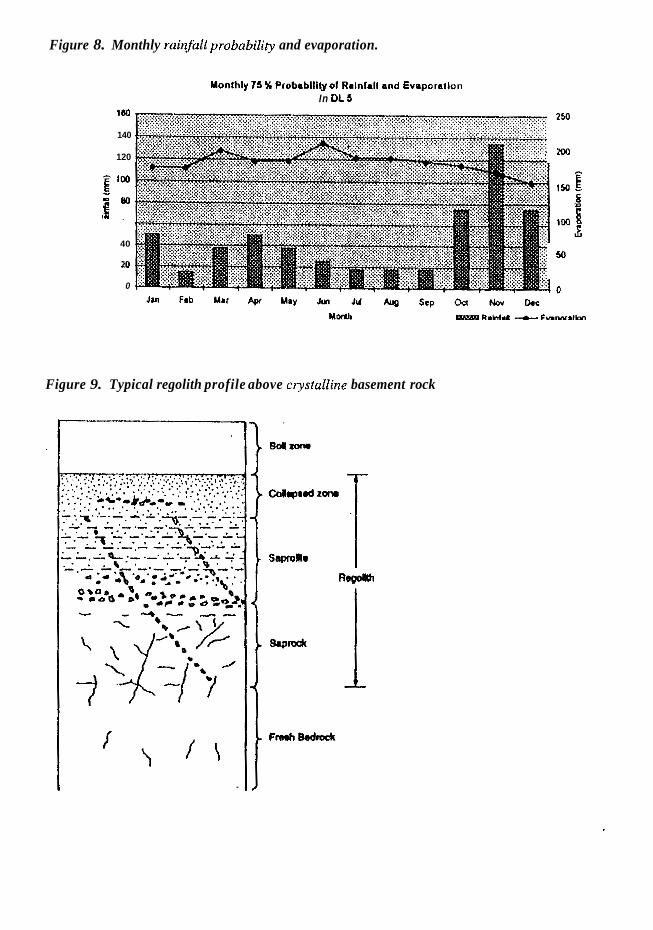
Figure 8. Monthly ruinfull probnbility and evaporation.
Yonlhly 75 X Probablllly 01 Rmlnlall and Evaporalkm In DL5
1W
140
120
E loo - K W f r n
40
10
0
264
ma
50
Figure 9. Typical regolith profile above ciystalline basement rock

Figure 10. Schematic section of soilscape.
110rn.
lOOm
90 rn.
80 m.
Reddish Brown EYth - Low Humic Gley Soitscape
Related Documents