November 28, 2013 REVIEW OF DATA AND ANALYTICAL INITIATIVES ON AGRICULTURAL PUBLIC EXPENDITURES An IFPRI/PIM-sponsored study, in close collaboration with: FAO, IDB, IMF, OECD, World Bank

Welcome message from author
This document is posted to help you gain knowledge. Please leave a comment to let me know what you think about it! Share it to your friends and learn new things together.
Transcript

November 28, 2013
REVIEW OF DATA AND
ANALYTICAL INITIATIVES
ON AGRICULTURAL PUBLIC
EXPENDITURES
An IFPRI/PIM-sponsored study, in close collaboration
with: FAO, IDB, IMF, OECD, World Bank
ii | R E V I E W O F D A T A A N D A N A L Y T I C A L I N I T I A T I V E S O N A G R I C U L T U R A L
P U B L I C E X P E N D I T U R E S
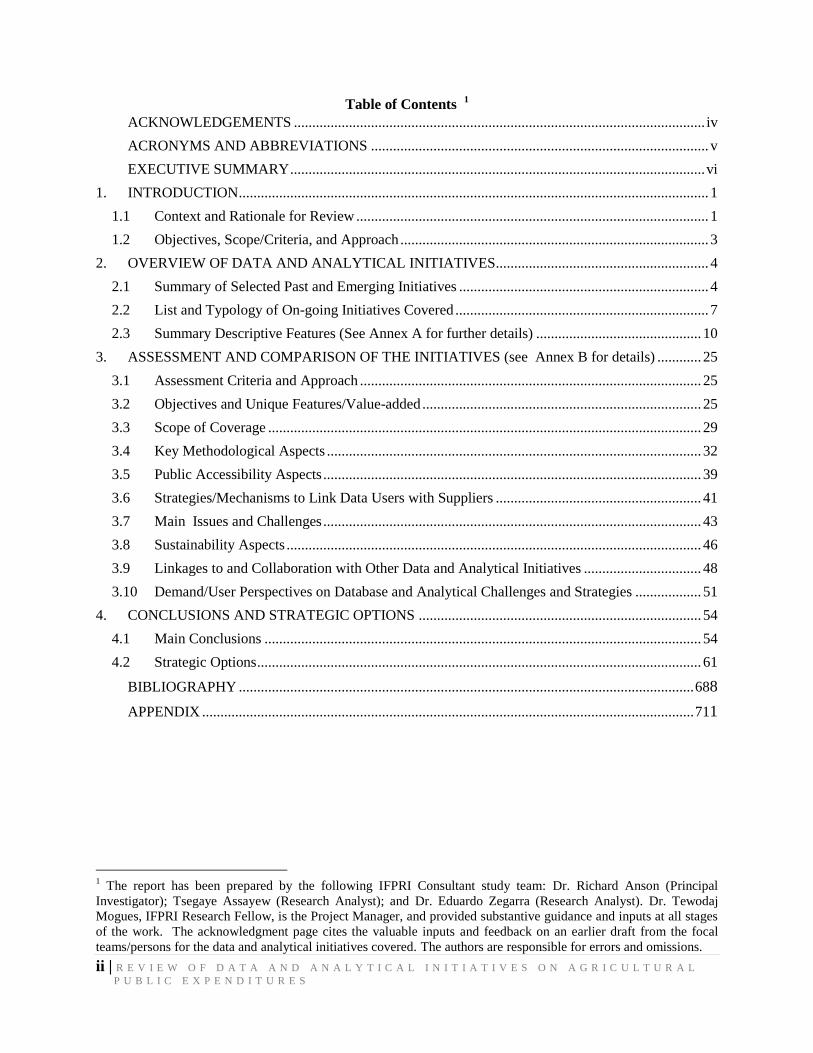
Table of Contents 1
ACKNOWLEDGEMENTS ................................................................................................................ iv
ACRONYMS AND ABBREVIATIONS ............................................................................................ v
EXECUTIVE SUMMARY ................................................................................................................. vi
1. INTRODUCTION ................................................................................................................................ 1
1.1 Context and Rationale for Review ................................................................................................ 1
1.2 Objectives, Scope/Criteria, and Approach .................................................................................... 3
2. OVERVIEW OF DATA AND ANALYTICAL INITIATIVES.......................................................... 4
2.1 Summary of Selected Past and Emerging Initiatives .................................................................... 4
2.2 List and Typology of On-going Initiatives Covered ..................................................................... 7
2.3 Summary Descriptive Features (See Annex A for further details) ............................................. 10
3. ASSESSMENT AND COMPARISON OF THE INITIATIVES (see Annex B for details) ............ 25
3.1 Assessment Criteria and Approach ............................................................................................. 25
3.2 Objectives and Unique Features/Value-added ............................................................................ 25
3.3 Scope of Coverage ...................................................................................................................... 29
3.4 Key Methodological Aspects ...................................................................................................... 32
3.5 Public Accessibility Aspects ....................................................................................................... 39
3.6 Strategies/Mechanisms to Link Data Users with Suppliers ........................................................ 41
3.7 Main Issues and Challenges ....................................................................................................... 43
3.8 Sustainability Aspects ................................................................................................................. 46
3.9 Linkages to and Collaboration with Other Data and Analytical Initiatives ................................ 48
3.10 Demand/User Perspectives on Database and Analytical Challenges and Strategies .................. 51
4. CONCLUSIONS AND STRATEGIC OPTIONS ............................................................................. 54
4.1 Main Conclusions ....................................................................................................................... 54
4.2 Strategic Options ......................................................................................................................... 61
BIBLIOGRAPHY ............................................................................................................................ 688
APPENDIX ...................................................................................................................................... 711
1 The report has been prepared by the following IFPRI Consultant study team: Dr. Richard Anson (Principal
Investigator); Tsegaye Assayew (Research Analyst); and Dr. Eduardo Zegarra (Research Analyst). Dr. Tewodaj
Mogues, IFPRI Research Fellow, is the Project Manager, and provided substantive guidance and inputs at all stages
of the work. The acknowledgment page cites the valuable inputs and feedback on an earlier draft from the focal
teams/persons for the data and analytical initiatives covered. The authors are responsible for errors and omissions.

iii | R E V I E W O F D A T A A N D A N A L Y T I C A L I N I T I A T I V E S O N A G R I C U L T U R A L
P U B L I C E X P E N D I T U R E S
List of Figures:
Figure 1: Framework of Data and Analytical Initiatives for Supporting Enhanced Agricultural
Expenditure Analyses, Budgetary Cycle, and Outcome and Impacts ............................................ 9
Figure 2: Initiatives within a Typology .......................................................................................... 9 Figure 3: Number of countries covered by each initiatives under Typology A. ........................... 30 Figure 4: Comparability of Agriculture Expenditure Statistics Across four Databases. ............ 344 Figure 5: Trend of Variation in Agriculture Expenditure Statistics across the Four Data
Initiatives....................................................................................................................................... 35
Figure 6: BOOST: Linkages between Organizational Location, Economic Expenditure Type
and functions. .............................................................................................................................. 388 Figure 7: BOOST: Example of How BOOST Can Help Compare Sectoral Budgetary Allocation
Changes (in Good and in the Bad Times – Example of Bulgaria). ............................................... 38
Figure 8: Strategic Options: Strengthening “Backward and Forward Linkages” ....................... 611
List of Tables:
Table 2. 1: List of Key Databases and Analytical Initiatives ........................................................ 7
Table 2. 2: Typology of Data and Analytical Initiatives on Agriculture Public Expenditures ....... 8
Table 3. 1: Table Used as Questionnaire for Country Level Ag. Expenditure Data: Mauritius) . 33
Table 3. 2: Proportion of GDP from basket used for MPS estimations in PSE/LAC initiative. .. 37 No table of figures entries found.
ANNEXES (AS SEPARATE FILES)
A) Tables with Key Descriptive and Assessment Information for each Data and Analytical
Initiative
B) Tables with Summary Comparisons of Data and Analytical Initiatives by Theme and Type
C) Summary Excerpts from Relevant Data Documentation Files
iv | R E V I E W O F D A T A A N D A N A L Y T I C A L I N I T I A T I V E S O N A G R I C U L T U R A L
P U B L I C E X P E N D I T U R E S
ACKNOWLEDGEMENTS
The preparation of this final report benefitted immensely by the collaboration and contributions
from focal persons/teams for each of the organizations which are carrying out data and analytical
initiatives on agricultural public expenditures in developing countries, and which were reviewed in this
exercise. Their inputs to and comments/suggestions on earlier drafts are greatly appreciated. The study
team takes responsibility for any errors and/or omissions.
CABRI (Collaborative Africa Budget Reform Initiative):
Nana Boateng and Anke Braumann
CEPAL:
Jose Arroyo and Diana Ramirez
FAO:
Statistics Division (ESS) FAOSTAT: Sangita Dubey, Carlota Fabi, and Erdgin Mane;
SOFA/Agricultural Development Economics Division (ESA) FAO Studies:
State of Food and Agriculture team: Sarah Lowder, Jacob Skoet, & Keith Wiebe (also Deputy Director);
MAFAP: Jean Baliée, Christian Derlagen, and Alban MasAparisi;
IFPRI:
Overall Strategic Aspects: Karen Brooks and Xinshen Diao
ASTI: Nienke Beintema
SPEED: Bingxin Yu
ReSAKSS: Sam Benin and Godfrey Bahiigwa
IMF:
Sage de Clerck
Gary Jones
InterAmerican Development Bank:
Overall Strategic Aspects: Hector Malarin
PSE for LAC:
Paul Trapido
Carmen Fernandez
OECD:
TAD - PSEs and Other Indicators:
Jonathan Brooks
Carmel Cahill
Dalila Cervantes-Godoy
Joanna Ilici-Komorowska
Andrzej Kwiecinski
CRS: Yasmin Ahmad
Overall Strategic Aspects on ODA: Bill Nicol
World Bank:
BOOST: Leif Jensen
RePEAA: Yurie Tanimichi-Hoberg
SNAPE for SSA: Stephen Mink
WDIs: Sup Lee
v | R E V I E W O F D A T A A N D A N A L Y T I C A L I N I T I A T I V E S O N A G R I C U L T U R A L
P U B L I C E X P E N D I T U R E S
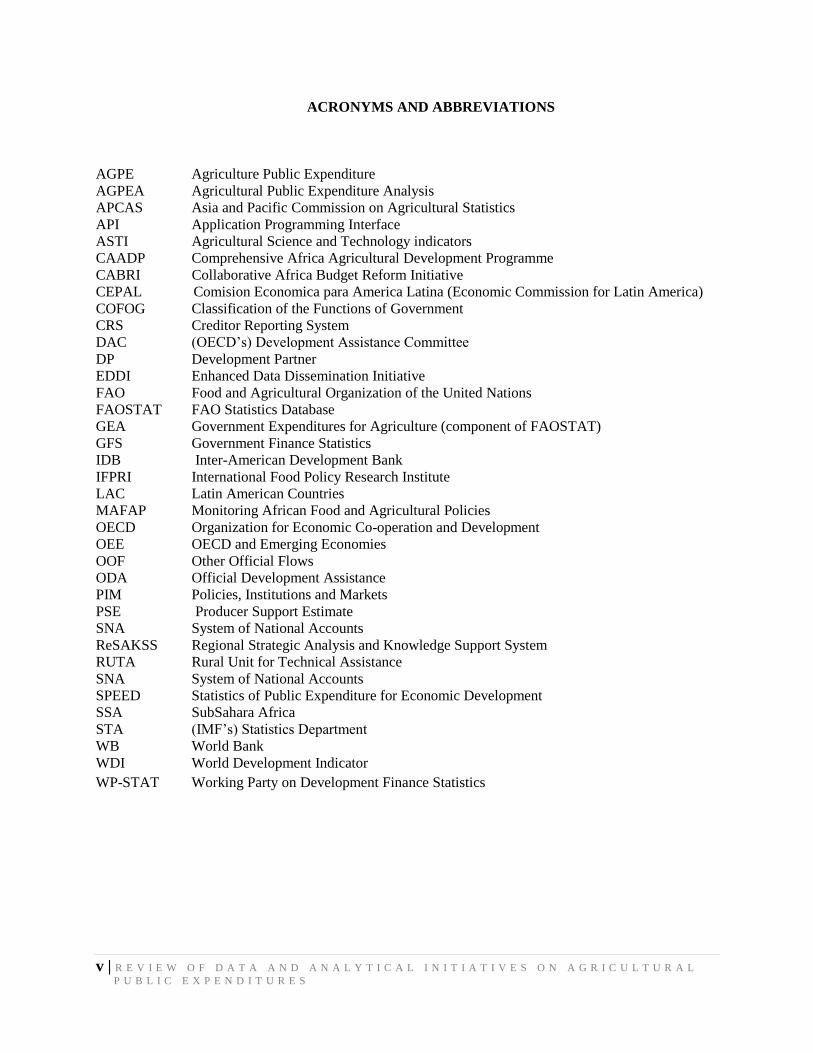
ACRONYMS AND ABBREVIATIONS
AGPE Agriculture Public Expenditure
AGPEA Agricultural Public Expenditure Analysis
APCAS Asia and Pacific Commission on Agricultural Statistics
API Application Programming Interface
ASTI Agricultural Science and Technology indicators
CAADP Comprehensive Africa Agricultural Development Programme
CABRI Collaborative Africa Budget Reform Initiative
CEPAL Comision Economica para America Latina (Economic Commission for Latin America)
COFOG Classification of the Functions of Government
CRS Creditor Reporting System
DAC (OECD’s) Development Assistance Committee
DP Development Partner
EDDI Enhanced Data Dissemination Initiative
FAO Food and Agricultural Organization of the United Nations
FAOSTAT FAO Statistics Database
GEA Government Expenditures for Agriculture (component of FAOSTAT)
GFS Government Finance Statistics
IDB Inter-American Development Bank
IFPRI International Food Policy Research Institute
LAC Latin American Countries
MAFAP Monitoring African Food and Agricultural Policies
OECD Organization for Economic Co-operation and Development
OEE OECD and Emerging Economies
OOF Other Official Flows
ODA Official Development Assistance
PIM Policies, Institutions and Markets
PSE Producer Support Estimate
SNA System of National Accounts
ReSAKSS Regional Strategic Analysis and Knowledge Support System
RUTA Rural Unit for Technical Assistance
SNA System of National Accounts
SPEED Statistics of Public Expenditure for Economic Development
SSA SubSahara Africa
STA (IMF’s) Statistics Department
WB World Bank
WDI World Development Indicator
WP-STAT Working Party on Development Finance Statistics

vi | R E V I E W O F D A T A A N D A N A L Y T I C A L I N I T I A T I V E S O N A G R I C U L T U R A L
P U B L I C E X P E N D I T U R E S
EXECUTIVE SUMMARY
CONTEXT
One of the most important instruments developing and transition countries possess to achieve the
transformation of their economies through meeting key development outcomes and impacts, especially
where the agricultural sector plays a key role, is efficient and effective agricultural public expenditures,
coupled with a conducive policy environment and dynamic private investments. However, developing
countries face considerable challenges in possessing sound and adequate databases and management
information systems, including robust field data. This would enable appropriate types of evidenced-based
agricultural public expenditure analysis which could facilitate expenditure priority setting and allocations.
Recently (June 2013), the OECD/IFPRI organized a workshop on “Shared Approaches to
Measuring the Agricultural Policy Environment”. The workshop brought together managers, researchers
and practitioners from numerous international development agencies to discuss specific aspects of the
measurement and related database issues and opportunities for greater collaboration. One of the topics
which were discussed involved finding practical ways to address many of the challenges involving
agricultural public expenditure data and related analytical initiatives which could contribute to enhanced
measurement of the agricultural policy environment. In the context of the agricultural public
expenditures part of the workshop, it was recognized that it may require several exercises/steps toward the
creation and maintenance of a community of practice of analysts located both in developing and
developed countries who are concerned with accurately and systematically measuring the quantity and
quality of public spending for agriculture. Accordingly, the present review focuses on one aspect of this
broader process and which is centered on agricultural public expenditures --- while steps would be taken
to address other key components of the agricultural policy measurement agenda.
FRAMEWORK FOR REVIEW
Objectives, Scope/Criteria, and Approach
Considering the above context, the present study aims to review relevant data collection and
analytical initiatives/activities that are focused on, or are inclusive of, agricultural public expenditure data
and studies on developing and transition countries. In addition to stocktaking of such initiatives, this
review endeavors to carryout a comparison of relevant features and identifies differences and similarities,
identify possible avenues for greater collaboration and complementarity, including the use of selected
empirical examples arising from the comparative review. The outcome of this review is to contribute to
the improved coordination and sharing of data on public resource allocations to agriculture in developing
countries, and to the improved communication and exchange on measurement approaches and
methodologies in compiling such data and conducting analytical studies which could contribute to
enhanced budgetary outcomes and impacts of agricultural public expenditures.
The review will be comprised of 3 major components:
a summary of key features on each initiative;
a comparison of the initiatives according to major types, covering strategic aspects, and giving
special attention to the methodological features; and
the main conclusions and recommended strategic options, especially which can promote
enhanced inter-agency collaboration in working together to address relevant challenges.

vii | R E V I E W O F D A T A A N D A N A L Y T I C A L I N I T I A T I V E S O N A G R I C U L T U R A L
P U B L I C E X P E N D I T U R E S
One or both of the following main criteria, among others, are used to identify the data and
analytic initiatives to be reviewed:
ongoing “major” databases involving agricultural public expenditures (AgPEs) in at least ten
developing countries, and which include diversity in terms of sponsoring organizations and
regional coverage, and a major global database which has the potential for including AgPE data;
on-going programs/projects which are supporting analytical studies and tools, and which also are
devoting attention to addressing data-related issues and strategies which can enhance the role of
AgPE analysis to better support evidenced-based decisions on expenditure priorities, allocations,
and management; and,
Based on the above criteria, fourteen on-going data and analytical initiatives/programs have been
identified for this review:
1) AGPE for LAC: Agricultural Public Expenditures for LAC
2) ASTI: Agricultural Science and Technology Indicators
3) BOOST: Making Expenditure Data Available for Analysis
4) CRS: Creditor Reporting System of ODA Resource Flows
5) FAOSTAT: Investment dataset (GEA & ODA)
6) GFS: Government Financial Statistics
7) MAFAP: Monitoring African Food and Agricultural Policies
8) PSE-OEE: Producer Support Estimates/PSE and Related Indicators for Agricultural Support (for
OECD & Emerging Economies)
9) PSE-LAC: Producer Support Estimates for Latin America & Caribbean/LAC
10) RePEAA: Resources for Public Expenditure Analysis in Agriculture
11) ReSAKSS: Regional Strategic Analysis and Knowledge Support System for Sub-Sahara Africa
(SSA)
12) SPEED: Statistics of Public Expenditure for Economic Development
13) SNAPE: Strengthening National Agricultural Public Expenditures SSA
14) WDIs: World Development Indicators
The study team worked out a detailed road map of activities, giving emphasis to engaging the relevant
focal teams/persons for each of the fourteen initiatives. Each of them was interviewed (most of them in
person), to compile key information and deeper discussion of key achievements, emerging challenges and
next steps for their enhancement.2 All of them showed keen interest and provided valuable inputs and
advice throughout the exercise.
Based on the main common orientations and features of the above initiatives, the study team derived
a typology of data and analytical initiatives (Types A – E) which was used to guide the comparative
review of diverse initiatives. Figure1 illustrates the inter-relationship between the various data and
analytical initiatives, and how they can enhance the budgetary cycle and contribute to enhanced budgetary
outcomes and impacts for the agriculture sector, if effectively managed and coordinated at the country
level.
2 Other past and emerging data and analytical initiatives are also reviewed for inputs to deriving both lessons
learned and opportunities for enhanced inter-agency collaboration, although with less or no detailed coverage in this
document, given their nature of existence.

viii | R E V I E W O F D A T A A N D A N A L Y T I C A L I N I T I A T I V E S O N A G R I C U L T U R A L
P U B L I C E X P E N D I T U R E S
Figure1: Framework of Data and Analytical Initiatives for Supporting Enhanced Agricultural
Expenditure Analyses, Budgetary Cycle, and Outcome and Impacts
MAIN CONCLUSIONS
The conclusions are synthesized according to six strategic crosscutting areas, covering the following
points (with further details in Chapters 3 and 4):
(1) Main Features and Emerging Patterns:
(a) Variation and Rationale of Objectives: the fourteen data and analytical initiatives
comprise five different types and reflect a wide variety of objectives, unique origins, and
diverse users.
(b) Variation in Scope and Disaggregation: The database initiatives witnessed differences
in the scope in terms of sectors covered, level of disaggregation, frequency of data and
their updated databases and analytical studies, and countries, regions and years covered.
Data gaps, especially the limited disaggregation of AGPE data according the main
functions, pose considerable constraints to analysts and policy-makers (who represent
the “demand”) in terms of not providing adequate information for better budgetary
allocations and accountability;
(c) Geographical Coverage and Focus: While most of the initiatives have a global
coverage, there are two initiatives which focus on SSA; there are two initiatives which
give special focus on the LAC countries. Other regions seems be somewhat neglected,
aside from the global data initiatives;
(d) Methodological Aspects: The initiatives exhibit a variety of important methodological
differences, and to a lesser extent, similarities, including:

ix | R E V I E W O F D A T A A N D A N A L Y T I C A L I N I T I A T I V E S O N A G R I C U L T U R A L
P U B L I C E X P E N D I T U R E S
narrow and wider definitions of the “agricultural sector”, which has important
implications for data compilation, comparisons and interventions (e.g., MAFAP
taking a wider definition of the agricultural sector;
the PSE expenditure classification system considers support to non-agricultural
sectors which can impact agricultural development, while measuring support to
producers or to various categories of “agricultural” more generally;
the PSE methodology was pioneered by the OECD, used by PSE for LAC and
by MAFAP. The LAC PSE database developed by IDB follows the OECD PSE
Manual for preparation and calculation of the PSE’s to insure compatibility with
OECD country PSE estimates while MAFAP has made relevant adaptations of
the PSE methodology to the African context (further discussed below);
various AgPE analytical initiatives have developed different methodological
toolkits, although there is high level of convergence of key concepts and tools.
There seems to be growing exchange and communications among focal persons
of these initiatives to enhance harmonization of key concepts and tools,
especially where it involves many of the same stakeholders (e.g., SNAPE and
MAFAP coordinating their AGPE-supported studies in SSA, and collaboration
to address common AGPE data constraints);
different instruments and approaches to compile standardized AgPE and PSE
data. The PSEs for OEE compile country level data, to comply with a well-
defined methodology. ReSAKSS compiles AgPE data from existing sources,
while filling key gaps at the country level; GFS and FAOSTAT-GEA use
questionnaires for nearly 200 countries, and face challenges to fill gaps and
limited level of disaggregation; there are legitimate concerns on the reliability of
the underlying data, which is another dimension which needs to be addressed;
most of the initiatives have prepared user documentation and guide manuals and
standards, although the newer initiatives are still preparing the complete
methodological documentation (e.g., PSE for LAC; AGPE for LAC);
(e) Public Accessibility: These two aspects are closely inter-related, where greater public
accessibility tends to encourage expanded use, although there are other factors
influencing usage. Most of the initiatives are publicly available, although some of them
have limited public accessibility for various reasons, and which is another issue to be
addressed (generally at the country level, and using benchmarking as an incentive for
countries to provide public accessibility to public expenditure data);
(f) Linkages between Users and Suppliers: Generally all of the initiatives show a clear
awareness and varied strategies to promote stronger usage by its target stakeholders,
although there appear to be varied levels of effort and effectiveness.
(2) Innovative Aspects and Improvements: Some of the initiatives demonstrate innovative
features, especially in terms of methodological and dissemination aspects which can provide
positive lessons for other initiatives.
(3) Complementarities and Synergies Between Initiatives: Several initiatives demonstrate that
there are emerging complementarities and synergies of varying degrees between data and
analytical initiatives which suggest the potential for being further stimulated.
(a) Figure1 illustrates the important complementarities between the different types of data
and analytical initiatives, which if well-coordinated, managed and integrated in the
budgetary cycle of developing countries, offer the potential for enhanced budgetary
outcomes and impacts from the agricultural public expenditures (coupled with other
appropriate policy reforms);

x | R E V I E W O F D A T A A N D A N A L Y T I C A L I N I T I A T I V E S O N A G R I C U L T U R A L
P U B L I C E X P E N D I T U R E S
(b) All of the initiatives which were reviewed are both users and/or suppliers of agricultural
expenditure data, and to a lesser extent, of the PSE indicators (at least for the countries
being covered). The study team was able to identify variable levels of collaboration and
inter-dependence across databases and analytical studies in terms of sharing resources,
data collection methodologies, and dissemination strategies.
(4) Emerging Challenges: The review of the initiatives have highlighted a wide range of
challenges, especially for each of them to achieve their stated institutional or program
objectives. From an analytical and policy maker perspective, the high level of aggregation of
AgPE data poses a serious constraint to assess AgPE allocation issues, given that different
spending has variable effects on agricultural performance. The report highlights some of the
more important common challenges, whose severity varies according to country. These
challenges adversely affects the ability of analysts to carry out sound AGPE studies,
calculation of robust PSEs, and also to conduct cross-country comparisons, as inputs for
better budgetary allocation priority-setting and decisions.
(5) Demand Aspects and Some Implications: An important aspect of addressing the underlying
incentive issues highlighted above which constrains the continued persistence of inadequate
disaggregation and full use of existing AgPE data is connected to better understanding the
demand aspects for enhanced data and analytical programs to support enhanced AgPE
analysis. There seems to be greater attention on the “supply” side, and insufficient attention
to addressing the demand aspects (especially by policy makers and directors of budget at the
country level). The review endeavors to unpack and highlight some these demand aspects
which arose during the course of conducting this review, reflecting perspectives and inputs
from various actors. There are three aspects which were reviewed:
(a) Response to Demand from Key Actors
(b) Expenditure Information/Reporting Systems
(c) Internalization of the Demand Aspects
(6) Nature and Extent of Intra and Inter-Agency Collaboration: This review identified the general
nature and type of intra and inter-agency collaboration in carrying out the fourteen data and
analytical initiatives. Overall, the focal teams from the various initiatives demonstrated a
variety of positive actions to promote enhanced collaboration, within their own organization
and increasingly with other relevant agencies. Notwithstanding these positive actions, the
report highlight potential scope for enhancing the effectiveness and results of more strategic
and systematic inter-agency collaboration.
STRATEGIC OPTIONS
Based on the results from the review and the above crosscutting conclusions, this review has
identified six strategic options which offer the potential for addressing some of the more critical
constraints. These strategic options are intended to better inform and facilitate discussion and consensus
among target audiences on the most appropriate options to pursue. This target audience includes the
practitioners who participated in the Agricultural Policy Measurement workshop held in June 2013, and
other practitioners who have participated in this review exercise and expressed keen interest get engaged
in a broader and deeper discussion with other practitioners and decision-makers. The overarching strategy
warrants an integrated and sequenced approach to reaching consensus on the main strategy elements and
supporting action plan(s) which can address the main issues highlighted in this report.
The proposed six strategy options comprise a suggested framework (covering both supply and
demand aspects) which could contribute to enhancing the role and effectiveness of data and analytical

xi | R E V I E W O F D A T A A N D A N A L Y T I C A L I N I T I A T I V E S O N A G R I C U L T U R A L
P U B L I C E X P E N D I T U R E S
initiatives for achieving enhanced budgetary outcomes and impacts of existing and increased AgPEs. The
substantive details and rationale which underpin these strategic elements are highlighted Chapter 3 and
the above section on conclusions.
1) Strategic Options for Enhanced AgPE Databases
There are eight AgPE databases which are being implemented. While the focal teams of each of
them are carrying sound improvements to better meet their institutional objectives, it could be useful for
each team to consider the following aspects, customized to each data initiative:
a) review the COFOG guidelines with respect to the agriculture sector, including a review and updated
definition of the “agricultural sector”, which can serve as a clear international standard for developing
countries;
b) explore the benefits of an enhanced integrated global AgPE database, which will seek to generate
more systematically AgPE data disaggregated beyond level 3 of COFOG, in a phased manner, with
global coverage and annual updating; at the same time, there is a need to consider the reliability and
credibility issues of the underlying expenditure data, and to encourage governments to take appropriate
steps to ensure reliability and accessibility;
c) encourage the relevant databases to update as needed their methodological user manuals which should
be made accessible to the public to encourage and greater and effective use of the AGPE database;
d) One possible way to curve the consequences of data inconsistency brought about by the difference in
methodology, in particular, is to put in place a more transparent and flexible system in order to better
track public resources allocation enabling customized and consistent aggregation, promote open data
access and provide information in a timely manner;
e) Enhance the public accessibility to the AGPE databases through ensuring user-friendly and efficient
websites and tools, and ensuring easy subscription and free of charge.
2) Enhanced Analytical Programs to be Driven by Ministries of Finance and Greater Focus on
Expenditure Efficiencies and Outcomes (for AgPEs and PSE and other Indicators).
a) Most of the AGPE analytical studies are funded by an external project. While the analytical initiatives
have sought to “involve” Ministries of Finance, it would appear that different approaches are needed to
secure their stronger ownership, toward the aim of getting them to institutionalize AgPEs (and a “liter”
version) as a requirement for enhancing the budgetary process;
b) The program of AgPEs funded and supported by SNAPE is coming to a close by the end of June,
2014. There was a recent workshop which shared emerging conclusions and good practices which can
provide an important inputs for a possible follow-up phase;
c) MAFAP has been successfully completed, and there are steps being take to formulate a second and
scaled-up phase, to be launched in mid-2014. It might be useful for the MAFAP preparation team to
convene a team of diverse peer reviewers to provide independent review and constructive feedback during
the formulation and launch phase of MAFAP (in line with their past consultative approach);
d) The stakeholder feedback on the ReSAKSS agenda, including a recently Continental-wide workshop
(Nov., 2013), is providing valuable inputs for enabling ReSAKSS to prioritize its portfolio of activities
involving strengthening the AGPE database for SSA, capacity development at various levels, the
strengthening of its network of regional and country level nodes, and the prioritization of analytical
studies, which would include AgPEs;
e) The Trade and Agriculture team of the OECD has formulated an agenda for enhancing its PSE and
related indicators agenda, which includes an increase in the number of developing countries which will
require assistance to carry out the required country assessment reports;
f) The PSE for LAC initiative is making important progress in completing the scope of PSE estimates for
eventually all LAC countries, with updated data to the latest year possible (2012), based on the OECD
methodology. Continued support is warranted to enable the full rollout of this initiative to the LACs.

xii | R E V I E W O F D A T A A N D A N A L Y T I C A L I N I T I A T I V E S O N A G R I C U L T U R A L
P U B L I C E X P E N D I T U R E S
3) Capacity Development Strategies
a) Many of the key issues and challenges highlighted in this report reflect the need to strengthen
institutional and technical capacities at various levels. There is a need to:
Assess the adequacy of the resources provided (in most cases, it has not been sufficient);
for each initiative to revisit the identification of priority and results-focused capacity
development requirements, and to prepare sound proposals to strengthen capacities;
include strategies for strengthening the demand for improved and more disaggregated AgPE data
by key country level actors.
b) There is an urgent need to formulate a strategy and phased plan for improving the Ministry of Finance
information and reporting systems and processes, coupled with stronger country demand for AgPEs as
part of the budgetary process, such that these “drivers” would lead to a stronger internal demand for
disaggregated AGPE data;
c) A complementary strategy could be oriented to researchers and practitioners who may use data more
intensively if proper incentives are present. It would be of high value to have competitive funds for
AGPE analysis using the available data, and seeking for potential interaction among databases and
approaches.
4) Intra-Agency and Inter-Agency Collaboration
All of the above strategic options will require some form of closer and more effective intra and
inter-agency coordination, to seek consensus on many of the proposals (and other proposals not covered
here), to provide technical guidance as a good practice group of AgPE and PSE practitioners, and to help
mobilize additional resources to support the priority interventions which comprise a “global public good”
in AgPE. There are other major themes, such as climate change, which have benefitted from an inter-
agency community of practice to help foster enhanced collaboration and sharing of good practices, and
possible joint initiatives. Accordingly, it is proposed that:
a) each agency covered in this review considers participating in a proposed “community of practice”
working group for AGPE, drawing on relevant staff members within the organization (combination of
senior and junior staff);
b) the various agencies covered in this review (6), the initiatives (14), in addition to several other relevant
entities (such as RUTA for Central America, ECLAC for South America, CABRI for SSA), should seek
to establish an inter-agency AgPE practice working group, with the focal person from each entity and
initiative being the representative for such a global working group. This working group can also foster
enhanced systematic and institutionalized collaboration among related initiatives;
c) Given that there is special focus on the AGPE requirements of SSA, there is also the option of there
being an AgPE sub-working group for SSA, to focus on specific agenda for SSA.
5) Demand Aspects
There are several components to strengthen the demand aspects, as discussed in the section on
conclusions, including:
a) supporting capacity development activities of key decision makers and technical analysts at various
levels, which will increase the demand for improved AgPE data base (disaggregated expenditures), for
improved and periodic AgPE and PSE analytical studies which can enhance agricultural policies, policy
change measurement, and expenditure priorities, based on comparative returns;
b) supporting the strengthening of expenditure reporting systems cited above will contribute to stronger
demand by key actors for more disaggregated expenditure data and analysis;

xiii | R E V I E W O F D A T A A N D A N A L Y T I C A L I N I T I A T I V E S O N A G R I C U L T U R A L
P U B L I C E X P E N D I T U R E S
c) promoting the internationalization of increased demand for enhanced AGPE databases (of
disaggregated data, using a consistent/standard classification system), for periodic AgPE and PSE
analytical studies, and effective dissemination to ensure the results are effectively utilized; and
d) For all of the DAI initiatives, there is scope for expanding the ownership and use of the data, results
and tools arising from these initiatives at the country implementation level, on the part of key decision-
makers, including Ministries of Finance, Parliament (e.g., agriculture and budget committees).
6) Sustainability Strategies
The above section highlighted that, aside from the initiatives which are part of the work plans of
international organizations, one of the major concerns was that many of the initiatives are project-and
donor-dependent funded, hence, this casts doubt on countries being able to sustain the improvements
which are introduced. It is of paramount importance for each data initiative to devise an explicit
sustainability strategy regarding the continuation of demand-driven public expenditure data and analytical
work (AgPEs and PSEs) in order to meet their short-term and long-term objectives. At the same time,
there is a need to recognize that the DAIs (which are cross-country in nature) are largely international
“public goods”, which warrant funding in the spirit of the CGIAR system. Various options are explored to
promote enhanced sustainability.

1 | R E V I E W O F D A T A A N D A N A L Y T I C A L I N I T I A T I V E S O N A G R I C U L T U R A L
P U B L I C E X P E N D I T U R E S
1. INTRODUCTION
1.1 Context and Rationale for Review
One of the most important instruments developing and transition countries possess to
achieve the transformation of their economies through achieving key development outcomes and
impacts, especially where the agricultural sector plays a key role, is efficient and effective
agricultural public expenditures, coupled with a conducive policy environment and dynamic
private investments. 3 There is a growing recognition among practitioners and policy makers that
public investment in agriculture is a key determinant of productivity growth and essential to
meeting the demands on and strategic role of the sector. 4 In order to ensure much needed
improvements in resource allocation decisions and complementary policy decisions, it is vital for
these countries and development partners to possess sound and adequate databases which would
enable appropriate types of evidenced-based agricultural public expenditure analysis. This also
needs to be complemented by other types of analyses and interventions to enhance the policy
environment and stimulate private sector investment flows to the sector. While recognizing the
importance of private sector investment flows and of non-agricultural public expenditures, this
review focuses on agricultural public expenditures, which is a key component of common interest
to development partners and policy makers in developing countries.
There is no single dataset which would enable a comprehensive and reliable assessment
of trends in investment to or resource flows to agriculture, including datasets on agricultural
public expenditures. 5 With regards to public expenditures, the data challenges include a number
3 A growing number of empirical studies show that public spending in agriculture has a strong and positive effect on
growth and poverty reduction efforts. Some of the relevant synthesis reports include (with detailed AgPERs
providing the foundation, with references contained in the synthesis reports): Impact of Public Investments in and
for Agriculture: Synthesis of Existing Evidence (IFPRI Discussion AgPER, 2012); Production, Productivity, and
Public Investment East Asian Agriculture. by F. Fan and Brzeska, IFPRI Discussion AgPER, 2010; Public
Investment, Growth and Rural Poverty (synthesizes the evidence from IFPRI research), by S. Fan and Rao (IFPRI
Discussion Note, 2008); Public Expenditures, Growth and Poverty: Lessons from Developing Countries. S. Fan.
Washington, DC: The Johns Hopkins University Press, 2008. The detailed country-level research AgPERs provide
the foundation for these reviews, and their detailed references are cited in the reviews.
For example, Fan, Mogues, and Benin (2009), show that for each unit of local currency public spending on the
agricultural sector, on average, 10 local currency units are returned in terms of increased agricultural productivity or
income across several African countries. See Mogues 2012 and the references therein for further information on the
nexus between public spending - agricultural growth - poverty reduction. A useful synthesis of good practices and
practitioner toolkit are: How do We Improve Public Expenditure in Agriculture? (World Bank/DFIP Partnership,
March 2011); and Practioners’ Toolkit for Agricultural Public Expenditure Analysis (World Bank/DFID
Partnership, March 2011).
4 See Cramon-Taubadel S von, Anríquez G, Haen H de, Nivyevskiy O. 2009. Investment in Developing Countries’
Food and Agriculture: Assessing Capital Stocks and their Impact on Productivity. Expert Meeting on How to Feed
the World in 2050. Rome: Food and Agriculture Organization of the United Nations. It is also noted that private
sector investments are the single most important source of investments in the agricultural sector, and therefore,
important to ensure that public investments generate potential synergies from private investments (see reference
below for further details).
5 There are two excellent background papers contributing to the preparation of the State of Food and Agriculture
Report (2012, FAO), which address these issues in greater depth. They include: Lowder, S., Carisma, B. & Skoet, J.
2012. Who invests in Agriculture and How Much? An Empirical Review of the Relative Size of Various
Investments in Agriculture in low- and middle-income Countries. ESA Working Paper No.12–09, Rome, FAO; and

2 | R E V I E W O F D A T A A N D A N A L Y T I C A L I N I T I A T I V E S O N A G R I C U L T U R A L
P U B L I C E X P E N D I T U R E S
of underlying and systemic weaknesses which also make it difficult to make sound comparisons
across time and countries, as well as comparisons across different data sets. The major data
challenges include, among others:
Varying definition of the “agricultural sector and sub-sector”, resulting in
varying country level classification systems for agricultural public expenditure
data. Although there are a large number of countries which have adopted the
Classification of Functions of Government (COFOG) system, 6 there is variable
application of this classification system;
Many countries draw on administrative classification to comprise agricultural
spending; however, in practice it is not just Ministries of Agriculture and related
agencies which spend on agriculture. Ministries of Land Planning, Rural
Development and others often are responsible for expenditures in some key
agricultural services or commodities. In addition, there are complementary
expenditures in rural areas which are important for agriculture like infrastructure
and social investment. This varies from country-to-country, and needs to be
considered to ensure transparency, accuracy and comparability of expenditures
based on standardized and comparable functions, such as COFOG;
Availability of varying levels of disaggregation of agricultural public expenditure
data, with most data available at a high level of aggregation (say, to level 2 of
COFOG --- the aggregate of “Agriculture, Forestry and Fisheries”) and at the
national level;
Extent to which sub national (e.g., state and local government) and donor grant
funding (e.g., often off-budget) agricultural public expenditures are captured in
aggregate country figures;
Varying time periods of available data;
Varying coverage of countries;
While various organizations have identified these data lacunae and challenges, thus far there does
not exist a systematic overview of the various data and analytic initiatives, how they can better
complement each other, what are the strategic gaps and possible avenues for inter-agency collaboration.
Some of the on-going data and analytical initiatives are endeavoring to contribute toward the construction
of different types of databases for enabling enhanced and more disaggregated agricultural expenditures
and analytical studies which could contribute toward better expenditure priorities and allocation
decisions. However, there are varying levels of harmonization, coordination, complementarity and
sustainability among these initiatives, given their underlying varying objectives. Accordingly, these
constraints and increased awareness of these challenges suggest the potential for exploring synergies and
complementarities among the totality of data and analytic initiatives.
Recently, the OECD – IFPRI/PIM (CGIAR program on Policies, Institutions and Markets)
organized a workshop on “Shared Approaches to Measuring the Agricultural Policy Environment”, 7 and
brought together managers, researchers and practitioners from numerous international development
agencies to discuss specific aspects of the issues and opportunities for greater collaboration. One of the
topics which were discussed involved finding practical ways to address many of the above-mentioned
Lowder, S. & Carisma, B. 2011. Financial Resource Flows to Agriculture: A Review of Data on Government
Spending, Official Development Assistance and Foreign Direct Investment. ESA Working Paper No. 11–18, Rome,
FAO.. 2011).
6 See Appendix 1 for the details of the COFOG classification of activities in the agricultural sector.
7 The conference was held in Paris, on June 24 and 25, 2013.
3 | R E V I E W O F D A T A A N D A N A L Y T I C A L I N I T I A T I V E S O N A G R I C U L T U R A L
P U B L I C E X P E N D I T U R E S
issues involving agricultural public expenditure data and related analytical initiatives which could
contribute to sound measurement of the agricultural policy environment. In the context of the agricultural
public expenditures part of the workshop, it was recognized that it may require several exercises/steps
toward the creation and maintenance of a community of practice of analysts located both in developing
and developed countries who are concerned with accurately and systematically measuring the quantity
and quality of public spending for agriculture. Accordingly, the present review focuses on one aspect of
this broader process and which is centered on agricultural public expenditures --- while steps would be
taken to address other key components of the agricultural policy measurement agenda. There is an
intention of the key actors from the participating international agencies to hold follow up
forums/platforms to address the emerging results of several parallel reviews and discussion arising from
the Paris workshop. 8
1.2 Objectives, Scope/Criteria, and Approach
Considering the above context, the present study aims to review relevant data collection and
analytical initiatives/activities that are focused on, or are inclusive of, agricultural public expenditure data
and studies on developing and transition countries. In addition to a stocktaking of such initiatives, this
review endeavors to carryout a comparison of relevant features and identifies differences and similarities,
identify possible avenues for greater collaboration and complementarity. The outcome of this review is to
contribute to the improved coordination and sharing of data on public resource allocations to agriculture
in developing countries, and to the improved communication and exchange on measurement approaches
and methodologies in compiling such data and conducting analytical studies.
The review will be comprised of 3 major components:
a summary of basic features on each initiative;
a comparison of the initiatives according to major types, covering strategic aspects, and giving
special attention to the methodological features; and
the main conclusions and emerging recommendations, especially which can promote enhanced
inter-agency collaboration.
The criteria which has been used to identify the data and analytic initiatives to be reviewed
include either one or both of the following main objectives, among others:
comprise an ongoing “major” databases involving agricultural public expenditures (AgPEs) in at
least ten developing countries, and which include diversity in terms of sponsoring organizations
and regional coverage; there was also consideration to including global data base which cover
public expenditure indicators/data, and have the potential to include AgPEs; and
on-going analytical studies and tools, including an active website, which also are devoting
attention to addressing data-related issues and strategies which can enhance the role of AGPE
analysis to better support evidenced-based decisions on expenditure priorities, allocations, and
management.
The approach involves the following sequential steps:
identifying the relevant past, on-going and emerging data and analytical initiatives which comply
with the above criteria;
developing a template table to focus compilation of relevant information for each initiative
(primarily on-going, since there is limited information on past and emerging initiatives);
8 For example in December, 2013, there is a Global Forum on Agricultural, which will include a technical sub-event
to review the progress of follow-actions of the June conference, such as the current review (and other follow-up
actions).

4 | R E V I E W O F D A T A A N D A N A L Y T I C A L I N I T I A T I V E S O N A G R I C U L T U R A L
P U B L I C E X P E N D I T U R E S
completing the template table for each initiative, based on available information and interviews
with the relevant focal persons, as well as obtaining their feedback/validation and further inputs
for each draft template table;
carrying out a comparative assessment of the various initiatives, based on a typology of initiatives
to ensure comparability, while also utilizing relevant empirical examples to illustrate similarities
and differences;
generating feedback/inputs from “strategic” users of AGPE analysis (e.g., Ministry of Finance
officials from selected developing countries, selected researchers on AGPE, specialists in
agricultural public expenditure analyses, and other international development practitioners);
deriving relevant conclusions and recommendations to foster enhanced relevance, effectiveness,
collaboration and complementarity among on-going and emerging/prospective initiatives.
2. OVERVIEW OF DATA AND ANALYTICAL INITIATIVES
In this section of the document, we first start by providing a summary of the different features of
certain selected past or emerging similar initiatives, in Section 2.1. We, then, provide a new typology
(categorization) of the selected fourteen initiatives based on their similarity in objectives and structures,
under Section 2.2. Finally, we present a summary of the different features of each of the fourteen
initiatives under consideration, in Sections 2.3. (Annex A of the document provides further details on
each of the initiatives.)
2.1 Summary of Selected Past and Emerging Initiatives
Taking into account the above criteria, there are three past initiatives and one “emerging” initiative,
which are highlighted below, based on limited available information
Past Initiatives (databases and analytical studies on AGPE/PSEs)
Expenditure Tracking of the Maputo Declaration target of each country allocating at least 10% of
total public expenditures for the “agricultural sector” (from about 2003 – 2009), FAO;
Regional database (1986-2001) for LAC countries using agricultural and rural development
expenditures, FAO-LAC;
Institutional Strengthening of Agriculture in Belize, Central America and Dominic Republic,
IDB;
A Growing Opportunity: Measuring Investments in African Agriculture, ONE Data Report.
1) Expenditure Tracking of the Maputo Declaration, FAO
Maputo Declaration (2003) refers to the formal commitment by the heads of State of SSA
countries to allocate at least 10% of their public budgets to the agricultural sector, together with a target
of 6% agricultural growth rate per year. In about 2004, FAO established a tracking system to monitor the
progress toward these key policy targets. This work supported by a World Bank-supported Institutional
Development Fund (IDF) Grant. The primary beneficiary was intended to be the NEPAD Secretariat and
member state Ministries of Agriculture. They were to benefit through the setting up of a method for
common and consistent measurement of public expenditure in national agricultural sectors. This would
enable consolidation of information and tracking at the continental level by the Secretariat, to enable
monitoring of progress on CAADP commitments. 9The completion report of this initiative included the
9 One of the main outputs of this activity included the following report: “National Compliance with 2003 AU-
Maputu Declaration to Allocate at least 10% of National Budget to Agriculture Development: 2007 Draft Survey
Report (by NEPAD Secretariat- Agriculture Unit, with FAO Support), August, 2008.

5 | R E V I E W O F D A T A A N D A N A L Y T I C A L I N I T I A T I V E S O N A G R I C U L T U R A L
P U B L I C E X P E N D I T U R E S
following overall conclusion: 10
“The overall outcome is rated as marginally unsatisfactory. Although the development objective remained
relevant, and the activity components were largely completed, the capacity did not get developed to
sustainably repeat survey-based tracking of country-level public expenditure on agriculture. When the
IDF activity and account closed, there were no further rounds of the AETS. Portions of the tools and
methodology developed under the IDF have subsequently proven useful to other initiatives, including the
separate ATOR (by ReSAKSS) that presents trends on public expenditure, and this is the basis for
attenuating the unsatisfactory rating to “marginally”.
The IDF activity completion memorandum highlighted the following substantive lesson: “On
sustainability, closer attention was needed in the final six months of the project activities to completion of
a continuation plan that was consistent with resources likely to be available. Closer supervision on the
part of the Bank, and better focus by the Recipient would have led to a better transition plan and
communication with member countries on the approach for continued monitoring of public expenditure
performance.”
2) Regional database 1986-2001, FAO-LAC In 2004-2005 the Latin American and Caribbean Regional Office of FAO based in Chile
developed and initiative to measure and analyze agricultural and rural development public expenditures in
18 selected LAC countries. The initiative commanded country studies to gather data on public
expenditures for years 1986-2001. The data was put together in a unique database which was made
available to a group of researchers for regional analyses. Later on, these studies were published in a
collective volume presenting the main findings and policy recommendations (Soto Barquero et al, 2006).
The collected data considered three main categories: (i) production promotion; (ii) rural
infrastructure; (iii) rural social investment. Item (i) was the closest to agriculture-related expenditures,
and the other two were ample and contributing to a supporting environment. However, large variation in
classification criteria was observed across countries in these categories, especially in social investment.
The constructed database also included some macroeconomic variables like sector and global GDP,
agricultural and rural population and employment, among others. Analytical studies used these and
additional variables to assess the impacts and relationships of agricultural and rural expenditure on
growth, poverty reduction and factor productivity using alternative conceptual models.
The initiative did not publish a methodological document explaining how the data was collected
and organized. Specific country reports were not made available to researchers so they could not evaluate
comparability and reliability of the data across specific countries. Data from federal countries was
particularly problematic. This undermined the potential additional use of the data, and the initiative did
not have further impacts on policy analysis and decision making after the volume publication in 2006.
Currently there are no activities related to this initiative at the FAO LAC regional office.
3) Institutional Strengthening of Agriculture in Belize, Central America and Dominic Republic, IDB
This was a technical assistance project (from 2009 to 2011) funded by the Inter-American Development
Bank (IDB), and was comprised of two components: two AgPEs (for Honduras, Costa Rica, and Belize);
and estimates of PSEs and related indicators for five Central American countries (which provided inputs
for the AGPE for LAC). 11
The AGPE studies applied a standard methodology (drawing on the AGPE
10
See Implementation Completion and Results Memorandum (IDF Grant: IDF-NEPAD/DBSA: Public
Expenditure Tracking in Agriculture, prepared by the World Bank, 2010. 11 In spanish, the TA name was: “Mejora lnstitucional Agrícola en Belice, Centroamérica, Panamá y la República Dominicana.
RUTA (Rural Unit for Technical Assistance) executed the TA Project, mainly in the form of contracting 5 separate country-level
studies on agricultural public expenditure analysis and one Producer Support Estimates for Dominican Republic, Guatemala and

6 | R E V I E W O F D A T A A N D A N A L Y T I C A L I N I T I A T I V E S O N A G R I C U L T U R A L
P U B L I C E X P E N D I T U R E S
toolkit cited above), customized according to the requirements of each country, including a section on
enhanced budgetary management processes and mechanisms, based on a systematic assessment of the
main constraints in each stage of the budgetary cycle. The studies developed a planning, budgeting,
implementation and governance cycle framework for enhanced budgetary management. The conduct of
the country level AgPEs encountered significant challenges in compiling reliable and comprehensive
agricultural public expenditure data to a level of disaggregation below level 3 (COFOG), especially
considering multiple implementing agencies. The PSE estimates were based on applying the OECD
methodology for PSEs and related indicators.
The studies identified data constraint issues and recommendations for enhanced AGPE databases,
and recommended institutionalizing a process whereby Ministries of Agriculture would carry out
periodic “light” budgetary assessments of past performance as a key input for formulating a sectoral
medium term and annual expenditure budgets, within which an annual budget would be drawn up. The
PSE estimates provided key results which were used for policy discussions with each of the
Governments, although the desired country ownership was not achieved for several reasons. At the end
of Project, there was an independent assessment of the project’s objectives, including lessons learned. 12
4) ONE Report
In late 2012/early 2013, ONE carried out a major review of progress of African governments’
efforts to invest in their own agricultural development.13
It is included because it highlights an important
initiative by a key stakeholder promoting sustainable development, and also highlights some of the data
constraints faced by all empirical studies. ONE looked at the 19 African countries with vetted, signed
national agriculture investment plans, developed through CAADP. For each of these countries, the ONE
team looked at progress on their commitments to reduce poverty, to spend 10% of national expenditures
on agriculture, to implement national plans, and to include citizens in decision-making. ONE analyzed
available public budget expenditure and allocation statements from individual countries and surveyed
Agriculture Ministries with the opportunity for feedback and verification. The ONE team developed a
methodology note which provides further details. Unfortunately, because there is no standard system for
reporting data, information must rely upon documented assumptions, sources and caveats.
The report continued to assess donors’ delivery of their L’Aquila commitments, and evaluated the
quantity and quality of their agriculture assistance. In addition, this year the report hones in on the first
Rome Principle of country ownership. For donors, the ONE team looked at four different indicators of
country ownership of national agriculture plans, from inclusion of non-state actors to donor support for
these plans. For African governments, the ONE team looked at whether budgetary and programme
information is available to citizens and whether a country’s national agriculture plan includes a structure
for the participation of non-state actors. The team also included case studies from Benin, Ghana, Kenya
and Tanzania to help illustrate the concept of country ownership and its impact on the CAADP national
process. Finally, given that this year is a turning point for both African and donor governments, ONE
offered some targeted recommendations on how to improve commitments to agriculture and food security
moving forward.
Honduras (based on the OECD methodology).
12 The report is in Spanish and internal for use by RUTA and the IDB (“Informe de Evaluacion del Proyecto: “Mejora
lnstitucional Agrícola en Belice, Centroamérica, Panamá y la República Dominicana” (consultant report prepared for RUTA,
2012).
13 ONE. A Growing Opportunity: Measuring Investments in African Agriculture (Data Report, March, 2013). It should be noted
that the review covered only national expenditures, and did not consider DP funding/expenditures, as part of total public
expenditures. Most initiatives monitor total public expenditures --- national + donor contributions.

7 | R E V I E W O F D A T A A N D A N A L Y T I C A L I N I T I A T I V E S O N A G R I C U L T U R A L
P U B L I C E X P E N D I T U R E S
Emerging Initiative in SSA
NEPAD/National Planning and Coordination Agency (NPCA) aims to establish and maintain a
database of key agricultural indicators which are connected with key output, outcome and impact
indicators, in support of meeting the strategic objectives of the Comprehensive African Agriculture
Development Programme (CAADP). The intention is to use the emerging CAADP results framework as a
guide for prioritizing the types of indicators which would be included in the database, giving special
attention to tracking the agricultural expenditure allocations and actuals. Overtime, it would aim to track
disaggregated expenditure data, especially if AGPE databases can be improved at the continental,
regional and country levels. This provides an opportunity for strengthening the on-going partnerships
with other key actors which are managing some of the current AGPE databases (e.g., SPEED, ReSAKSS,
FAOSTAT-GEA). As the proposal crystallizes in the next few months, it is timely for inter-agency
collaboration to support this proposal by NPCA on an important policy target.
2.2 List and Typology of On-going Initiatives Covered
Based on the above criteria, fourteen on-going data and analytical initiatives/programs have been
identified for this review. See Table 2.1 for further details.
Table 2. 1: List of Key Databases and Analytical Initiatives
NAME OF DATA/ANALYTICAL
INITIATIVE
HOSTING OR
MANAGING
ORGANIZATION
TYPE/FOCUS
(DCs = developing
countries; EEs=
emerging economies)
1) AGPE for LAC: Agricultural Public Expenditures
for LAC
UN/EC
Commission for
LAC (ECLAC)
Sub-Regional
Database/Central
America and Mexico
2) ASTI: Agricultural Science and Technology
Indicators
IFPRI Database and Analytical
(DCs)
3) BOOST: Making Expenditure Data Available for
Analysis (DCs and EEs)
World Bank Analytical Tool for
Public Expenditures
4) CRS: Creditor Reporting System of ODA Flows OECD Database (DCs and EEs)
5) FAOSTAT: Investment datasets
(focuses on two components: GEA and ODA)
FAO Database (DCs and EEs) sectoral:Investment Dataset
6) GFS: Government Financial Statistics IMF Global Database
7) MAFAP: Monitoring African Food and
Agricultural Policies
FAO Sub-Regional Database
and Analytical/in SSA)
8) PSE-OEE: Producer Support Estimates/PSE and
Related Indicators for Agricultural Support (for OECD
& Emerging Economies)
OECD Database and Analytical
(OECD and 5 emerging
economies)
9) PSE-LAC: Producer Support Estimates for Latin
America & Caribbean/LAC
IDB Regional Database/LAC
10) RePEAA: Resources for Public Expenditure
Analysis in Agriculture
World
Bank
Analytical Resources
(DCs and EEs)
11) ReSAKSS: Regional Strategic Analysis and
Knowledge Support System for Sub-Sahara Africa
IFPRI
(as “host”)
Database and Analytical
(in SSA)
12) SPEED: Statistics of Public Expenditure for
Economic Development
IFPRI Database (multi-sectoral)
(DCs and EEs)
13) SNAPE: Strengthening National Agricultural
Public Expenditures SSA
World
Bank
Regional Analytical/Agr.
PERs (SSA)
14) WDIs: World Development Indicators World Bank Database/multi-sectoral

8 | R E V I E W O F D A T A A N D A N A L Y T I C A L I N I T I A T I V E S O N A G R I C U L T U R A L
P U B L I C E X P E N D I T U R E S
Based on the main common orientations and features of the above initiatives, Table 2.2 summarizes the
typology of data and analytical initiatives which will be used to guide the comparative review of diverse
initiatives. It should be recognized that each initiative has specific and unique objectives, and hence this
needs to be well understood in the comparisons and conclusions. Accordingly, this review is not an
assessment par se of each initiative; rather the review endeavors to focus on highlighting key information
and relevant comparisons to enable practitioners (both suppliers and users) a better appreciation of each
initiative and to foster enhanced inter-agency collaboration which can respond better to user requirements
(researchers and policy makers).
Table 2. 2: Typology of Data and Analytical Initiatives on Agriculture Public Expenditures
Initiative
Databases
Covering
Public
Expenditures
and APEs
Analytical
Studies for
APEs *
Databases for
PSEs and
Related
Indicators*
Databases for
Overseas
Development
Assistance
(ODA) Flows
Software Data
and Analytic
Tool for Public
Expenditures
(A) (B) (C) (D) (E)
1. APE for LAC 2. ASTI
3. BOOST
4. CRS
5. ODA
6. GFS
7. MAFAP
8. PSE-OEE
9. PSE-LAC
10. RePEAA
11. ReSAKSS
12. SPEED
13. SNAPE
14. WDIs * It is recognized that some of the data base initiatives also support some analytical studies (e.g., ASTI). But inclusion in Type B
requires that the analytical studies be comprehensive in methodology and scope.
Figure 1 illustrates the inter-relationship between the various data and analytical initiatives, and
how they can enhance the budgetary cycle and contribute to enhanced budgetary outcomes and impacts
for the agriculture sector, if effectively managed and coordinated at the country level. This reflects a
results chain, whereby strong databases are the foundation of sound analyses which can help underpin
better budgetary allocations, which, in turn, feed into the databases,. Regions such as SSA, which are
implementing a strategic framework for the agricultural sector (CAADP) at the three levels (continental,

9 | R E V I E W O F D A T A A N D A N A L Y T I C A L I N I T I A T I V E S O N A G R I C U L T U R A L
P U B L I C E X P E N D I T U R E S
Figure 1: Framework of Data and Analytical Initiatives for Supporting Enhanced Agricultural
Expenditure Analyses, Budgetary Cycle, and Outcome and Impacts
regional and country), can generate synergies in the effective and complementary utilization of the
various types of database and analytical initiatives in AGPE. The following sections highlight some of
these key features and opportunities. Figure 2 provides another perspective of the initiatives and their
inter-relationships.
Figure 2: Initiatives within a Typology
10 | R E V I E W O F D A T A A N D A N A L Y T I C A L I N I T I A T I V E S O N A G R I C U L T U R A L
P U B L I C E X P E N D I T U R E S
2.3 Summary Descriptive Features (See Annex A for further details)
(1) Type A: Databases for Public Expenditures and Agricultural Public Expenditures
(a) Agricultural Public Expenditures for LAC
The UN Economic Commission for Latin America and the Caribbean (ECLAC) established and
manages a dataset on Agriculture Public Expenditures (AGPE) for its northern sub-region (Central
America, Caribbean and Mexico). There are only two indicators in the database (known as AGPE for
LAC): total public expenditure and agricultural public expenditure. These are part of the System of
Agricultural Information (SIAGRO--Sistema de Información Agropecuaria) which was developed by the
Unit of Agricultural Development (Unidad de Desarrollo Agrícola) of ECLAC´s Mexico sub-regional
office. It was developed in response to information needs from the public and private sectors from the
northern sub-region of LAC countries, complementing other regional and international existing databases
like FAOSTAT or World Bank WDI.
Data is compiled from official published sources, such as publications from Central Banks or Finance
Ministries. No questionnaires are sent specifically to governments. Currently SIAGRO covers Central
America countries (CAFTA+ Dominican Republic/DR), two Caribbean countries (Haiti and Cuba) and
Mexico. The main goals of SIAGRO are: (i) to generate national and regional diagnosis about the
evolution of the agricultural sector; (ii) to support in the formulation of agricultural development policies;
(iii) to give inputs for the preparation of specific socio-economic research in the agricultural sector; (iv) to
help in the decision making of the public and private sectors.
Some unique and value-added features are that the AGPE for LAC database has a long time series
1980-2010, which makes it attractive for comparative research and analysis with other long-term
macroeconomic variables, like GDP, productivity or credit.
The main limitations are its limited geographical coverage ---among 10 counties covered, AGPE data
for Cuba and Haiti are not covered currently --- and it does not have any disaggregation for types of
agricultural expenditures or levels of government. In addition, it does not have a comparable and
standard method for data collection as it is based only on official publications from the countries covered.
(b) Agricultural Science and Technology Indicators (ASTI) Initiative
The Agricultural Science and Technology Indicators (ASTI) initiative is managed by IFPRI and
compiles, analyzes, and disseminates data on institutional developments, investments, and capacity in
agricultural research and development (R&D) in low- and middle-income countries with the objectives of
assisting R&D managers and policymakers in improved policy formulation and decision-making at
country, regional, and international levels. The origin of ASTI traces back to 1981, when two of the
Consultative Group on International Agricultural Research (CGIAR) member institutes—the International
Food Policy Research Institute (IFPRI) and the former International Service for National Agricultural
Research (ISNAR)—initiated a joint venture on agricultural R&D data indicators, and published the best
available data from secondary sources for an ad hoc group of national agricultural research systems.
ISNAR continued this work during the next two decades, involving various institutional survey rounds to
collect primary data for various countries and the developing world and linking this data with secondary
data sources as well as S&T indicators for OECD countries. Since mid-1990s IFPRI and ISNAR Later on
(in 2001), IFPRI and ISNAR collaborated together again in collecting agricultural R&D indicators, which
led to the official establishment of the ASTI initiative in 2001. The initiative, to this end, has identified

11 | R E V I E W O F D A T A A N D A N A L Y T I C A L I N I T I A T I V E S O N A G R I C U L T U R A L
P U B L I C E X P E N D I T U R E S
four objectives in fulfilling its mission: (i) provide up-to-date, high-quality datasets on agricultural R&D;
(ii) conduct further analysis of agricultural R&D datasets; (iii) communicate data results and analysis for
policy formulation and advocacy; and (iv) build capacity for data collection and analysis.
ASTI has limited itself to measuring inputs into agricultural R&D rather than expanding to include
indicators on the multiple dimensions of the agricultural innovation process, but is currently piloting the
collection of output/performance indicators. It is, however, piloting an agricultural innovation system
framework for use as an analytical tool at the sector and commodity level. ASTI groups “performers” of
agricultural R&D into two sector categories (public sector and private sector) and five four institutional
categories (Government, Higher education, Nonprofit, Business, Public enterprises). The level of data
disaggregation also varies according to the indicators. The ASTI initiative, currently, compiles data from
about 87 developing countries in Sub-Saharan Africa (SSA), the Asia–Pacific (APC), Latin America and
the Caribbean (LAC), and the West Asia and North Africa (WANA) through national institutional survey
rounds, which capture primary data of hundreds of agencies involved in agricultural R&D. surveys. Time-
series data are collected for three main indicators: “research investments spending,” “research funding
sources,” and “research staff totals.” Benchmark data are collected for other indicators such “researcher
staff by degree, gender, age”, “support staff”, and “research focus by commodity and theme”.
ASTI collects and process the data on agricultural R&D going back to the early 1970s using
internationally accepted definitions and statistical procedures for compiling R&D statistics developed by
the Organization for Economic Co-operation and Development (OECD) and United Nations Educational,
Scientific and Cultural Organization (UNESCO).
(c) FAOSTAT: Government Expenditure on Agriculture Component
As part of the global effort in creating a world free from hunger and malnutrition, the Statistics
Division of FAO (FAOSTAT) develops a Global Investment Dataset (GID) comprised of four main
components: Credit to Agriculture; Government Expenditure on Agriculture and Rural Development
(GEA); Official Development Assistance to Agriculture; and Foreign Direct Investment in Agriculture.
The collection and dissemination of the GEA data, in particular, aims at providing researchers,
policymakers (in-country, and supporting analysts) and development partners relevant data to facilitate
the assessment of governments’ role in and contribution to agriculture, rural development and
environmental protection services, in a manner which enables comparability across countries and
harmonization with other international organizations compiling relevant datasets.
There are two important anchors which underpin the FAOSTAT GID’s addition of the Investment
Domain: the FAO charter which calls on FAO to compile basic statistical information on agricultural and
food security, and whereby the Investment Domain has gained status of being a “core” part of FAO’s
statistical information for cross-country monitoring and comparisons; and the Maputo Declaration by the
Heads of State of Sub-Saharan African Countries (in 2003), calling on each Government to allocate at
least 10% of total public expenditures to the agricultural sector.
In 2004, FAO started an initiative to track the progress in allocating public expenditures to the
agricultural sector for SSA, as part of supporting the Maputo Declaration. This initiative contributed to
triggering the inclusion of the GEA in the Investment domain. Under the umbrella of the Global Strategy
to Improve Agricultural and Rural Statistics, GEA was adopted by the United Nations Statistical
Commission in February 2010. In 2012, the GEA database was launched tracking expenditure on
agriculture and rural Development since 2001 through 2011. FAOSTAT used a questionnaire based on
the IMF’s Government Finance Statistics Manual methodology (GFSM 2001) , in particular, the Function
of Government (COFOG, Level 3). This approach was to help ensure comparable data that are aligned
12 | R E V I E W O F D A T A A N D A N A L Y T I C A L I N I T I A T I V E S O N A G R I C U L T U R A L
P U B L I C E X P E N D I T U R E S
with international statistical standards. Reporting countries and focal persons (within the Ministry of
Finance, Agriculture, or Central Statistics Bureau) are requested to complete the annual FAO
questionnaire, which has additional disaggregation (of expenditure into its recurrent and capital
components) and includes supplemental / cross reference data) introduced by FAO beyond the COFOG
classification. The database, currently, publicly avails annual data for 134 countries across 33 (FAO’s)
geographic (and economic) regions.
The main methodological features of the FAOSTAT GEA include:
The first (2012) FAO’s Government Expenditure on Agriculture (GEA) questionnaire is mainly
developed based on the IMF’s Government Finance Statistics Manual, 2001 (GFSM 2001)
methodology, in particular Table 7: Outlays by Function of Government, in an effort to ensure
comparable data that are aligned with international standards;
The questionnaire is designed to collect key data series for tracking the allocation of
government expenditures to agriculture and rural development and related metadata, requesting
a General Government (and its subsectors) time series for the period 2001 to 2012 (and each
year thereafter, according to an established cycle of compilation, adjustment and release. The
questionnaire is distributed to reporting organs of member countries in about September of each
year, such that it follows about 2 months after the IMF/GFS questionnaire is issued to help
ensure consistency with the GFS data, although at a higher level of aggregation. (Release of the
published data of compiled data is normally at mid-year of the following year);
The revised questionnaire on government expenditure on agriculture (2013) and related
functions by source of funds also includes Supplemental / Cross reference data, on further
disaggregation of outlays on subsidies and grants;
While FAOSTAT team reviews the data sent by each country, there are limitations to which
FAOSTAT team can validate and adjust the data, and fill data gaps. The FAOSTAT team is
devising cost-effective ways to help ensure the data from the countries is complete, timely and
accurate.
(d) Government Financial Statistics/GFS:
The GFS system compiles detailed annual statistical data on revenue, expense, transactions in assets
and liabilities, and stocks of assets and liabilities of general government and its subsectors as reported by
the IMF member countries. The IMF originated the GFS data collection system in 1976 to support
internationally comparable country level fiscal reporting. In the system, provision is made for three levels
of government: central; state, provincial, or regional; and local. It covers all aggregate fiscal data, and
includes major subsectors and functions, in accordance with the Classification of Functions of
Government. (COFOG) to Levels 1 and 2. The system also records two types of flows: transactions and
other economic flows.
The GFS is the most internationally recognized source of data for policymakers and analysts to
examine specific areas of government operations (taxation, grants, subsidies, etc.), developments in the
financial operations, financial position, liquidity situation of the general government or the public sector
as well as the socio-economic objectives of fiscal policy in a consistent and systematic manner. About
130 member countries report to the GFS with varying degrees of institutional and transactions coverage
across the globe (gradually increasing). The electronic database contains COFOG time series data for
approximately 80 countries since 1972 to current. The data can also found in print, online or in CD-ROM
formats.
The main methodological references/features include:

13 | R E V I E W O F D A T A A N D A N A L Y T I C A L I N I T I A T I V E S O N A G R I C U L T U R A L
P U B L I C E X P E N D I T U R E S
GFS Manual (2001), which provides the economic and statistical reporting principles to be used
in compiling the statistics and guidelines for the presentation of fiscal statistics within an
analytic framework that includes appropriate balancing items.
Public Sector Debt Statistics: Guide for Compilers and Users (2013) -- is the first global guide
on public sector debt statistics prepared under the joint responsibility of nine organizations,
through the mechanism of the Inter-Agency Task Force on Finance Statistics (TFFS). It
provides guidance on (1) concepts, definitions, and classifications of public sector debt
statistics, (2) the sources and techniques for compiling these data, and (3) some analytical tools
that may be used to analyze these statistics
GFS: Compilation Guide for Developing Countries, which represents a new approach by the
IMF’s Statistics Department (STA) to assist developing countries to compile GFS in
accordance with the guidelines of the GFSM 2001. 14
The guideline was stimulated by the
recent economic and financial crises, which highlighted the need for more and better data to
monitor and evaluate economic developments.
Preparation of the GFSM2013 is underway. It is expected to be released by early 2014. One of
the main features the new manual expected to include better alignment with the 2008 System of
National Accounts.
(e) MAFAP: Monitoring African Food and Agriculture Policies
FAO has established a sustainable system for monitoring the impact of food and agricultural policies
(known as MAFAP) in response to the declining agricultural investment and serious food crisis observed
in the continent, in particular, for decades. Although decision makers recognize that appropriate policies
and adequate public spending are critical for closing this gap, evidence to support decision-making is
often limited in Africa. MAFAP, therefore, emerged as a response to this recurrent crisis and growing
data demand to monitor key agricultural policies and expenditures focusing on ten SSA countries:
Burkina Faso, Ghana, Mali, Kenya, Tanzania, Uganda, Ethiopia, Malawi, Mozambique and Nigeria.
The MAFAP Database, in particular, aims at providing access to data and common indicators to African
policymakers and their development partners on public expenditure on food, agriculture and rural
development. (The database also compiles data on market incentives and disincentives for key
commodities, using the OECD methodology for measuring price distortions and will be discussed with
Type B initiatives below.) The initiative’s first phase (2010 – 2013) has been successfully completed,
compiling data from 2005 to 2011. There are steps being taken to prepare a second and expanded phase
(2014 -2019).
With regard to data compilation and dissemination of methodological aspects, MAFAP endeavored to
follow common quantitative methodology and indicators in order to increase transparency and to enable
comparison of agricultural policies across countries. With respect to the public expenditure database, it
provides high level of disaggregation of agricultural expenditure data although the actual level,
availability and reliability of data varied according to country.
The following synthesizes the methodological concepts, based on an explicit classification of
agricultural public expenditures, which reflects the OECD method for estimating PSEs and other
indicators:
14
For further details see: http://www.imf.org/external/pubs/ft/gfs/manual/compil.pdf) (refers to “Compilation Guide
for Developing Countries)

14 | R E V I E W O F D A T A A N D A N A L Y T I C A L I N I T I A T I V E S O N A G R I C U L T U R A L
P U B L I C E X P E N D I T U R E S
The main variables capture all public expenditures that are undertaken in support of food and
agriculture sector development(from national budget, either central, regional, or any ministry) and
external aid (provided by international organizations or NGOs);
the main focus is on food and agriculture sector, and expenditures in support of forestry and
fishery sectors are also captured;
It also captures all public expenditures in rural areas, such as rural infrastructure, rural education,
rural health;
Expenditure measures generate explicit or implicit monetary transfers to supported individuals or
groups, according to two categories of expenditures:
o agricultural specific expenditures (or transfers to agricultural agents or sector as a whole, in
two further categories: payment to agents individually (producers and consumers) in the
agro-food sector, as a proxy for “private” goods; and general sector support to agro-food
sector agents, collectively), as a proxy for “public” goods;
o agricultural supportive expenditures – public expenditures that are not specific to
agriculture, but have strong influence on agriculture sector development, such as rural
education, health and infrastructure;
Expenditure measures are considered and classified according to the way in which they are
implemented, and not on the basis of their objectives or economic impacts.
The detailed classification of support follows OECD’s principle of classifying policies according
their economic characteristics (the way they are implemented). The particular expenditure categories, are
designed to reflect the types of policies which are applied in African countries, and reflect the experience
of FAO working on public expenditures in developing countries. Furthermore, the classification system
attempts to distinguish policies providing private goods, as opposed to public goods, given different
effects (e.g., decoupling issues were not relevant in the SSA context).
MAFAP seeks to develop a set of measures of value to policymakers in African countries. The
three core types of policy indicators are: (i) measures of explicit policy incentives and disincentives and
market development gap in key agricultural value chains; (ii) measures of budgetary expenditures, and
(iii) measures of policy coherence. MAFAP is based on the OECD PSE approach to measure support to
the food and agricultural sector. The methodology has been adjusted for application in African countries,
but remains complementary with the OECD´s PSE indicators.
(f) ReSAKSS: Regional Strategic Analysis and Knowledge Support System (for SSA)
The ReSAKSS database, facilitated by IFPRI, in partnership with the Africa-based CGIAR centers,
the NEPAD Planning and Coordinating Agency (NPCA), the African Union Commission (AUC), and the
Regional Economic Communities (RECs), tracks agricultural performance in support of the
implementation of the CAADP agenda. The database covers only Africa, disaggregated according to five
regions (Africa-wide, Eastern and Central Africa, Southern Africa, West Africa, North Africa) with a
focus on Sub-Sahara Africa (SSA).
ReSAKSS is developing several databases – notably, involving the tracking of the policy target
arising from the Maputo Declaration – of agriculture public expenditures as a share of total public
expenditures. Its latest Annual Trends and Outlook Report (ATOR) for 2012 presents available
agricultural public expenditure data (since 1980s), at various levels (continental, regional and country
levels), including disaggregation of public expenditures below level 3 of COFOG for selected countries,
namely Congo, Rep. CAR, Congo, D. R., S. T. & Principe, Burundi, Chad, Djibouti, Seychelles, Uganda,
Madagascar, Tanzania, Mauritania, Namibia, Malawi, Zambia, Lesotho, Swaziland, Senegal, Togo, Cote
d'Ivoire, Sierra Leone, Mali.

15 | R E V I E W O F D A T A A N D A N A L Y T I C A L I N I T I A T I V E S O N A G R I C U L T U R A L
P U B L I C E X P E N D I T U R E S
There is a recognition of the usefulness of generating disaggregated expenditures which can be
compared across countries to help underpin better resource allocation decisions. Accordingly, the
ReSAKSS team, working with and through the regional and country-level nodes, plans to expand the
number of countries for which it will generate disaggregated agricultural expenditures.
The ATOR for 2012 illustrates the type of methodology that is used by ReSAKSS to compile the
required data (using multiple sources/per item):
1) obtained from the SPEED database total expenditures from 1980 onwards;
2) compiled data on the share of PAE in total expenditure based on available data from all the
different sources, using more recent sources where there are competing sources for any data point.
These two were used to obtain the amount of PAE by multiplying the total amount with the shares.
For missing observations in the total expenditure and PAE, the missing values were estimated using
extrapolations based on annual average growth rates that were estimated with the observed data.
These were then used to fill in missing observations in the shares of PAE. To remove the influence of
inflation over time and to more reliably compare expenditures across countries, total expenditures and
PAE were converted into constant 2005 purchasing power parity (2005 PPP$) using PPP conversion
factors from the World Development Indicators (WDI) (World Bank 2013).
Moreover,:
The Guide to the ReSAKSS website is a clear and useful tool to encourage users to use the
available data;
The ReSAKSS 2010 Data Notes are being updated
The ATORs for 2010 and 2012 provide useful public agricultural expenditure data, including
disaggregation of data (subsectoral level) for various countries
The ATOR for 2012 illustrates the type of methodology that is used by ReSAKSS to compile
the required data (using multiple sources/per item):
(g) SPEED: Statistics of Public Expenditure for Economic Development
IFPRI’s SPEED initiative aims at creating the most comprehensive and publicly available public
expenditure information to researchers, policymakers, donors, and the broader development community to
support a variety of economic and policy applications, a better understanding of the linkages between
public expenditures and development; and enhanced insights for promoting overall poverty reduction
strategies and other key economic development objectives.
Stimulated by IFPRI’s research focus on and increasing policymaker demand for clearer
assessments of public expenditure-outcome-impact linkages, the SPEED team at IFPRI started
compilation of data in the early 2000s. The database currently covers 147 countries: 113 developing
countries and 34 developed countries. In close collaboration with other international data initiatives and
different stakeholders, the team continued to draw on available expenditure data from relevant
international agencies such as the IMF’s GFS, and domestic/country-level sources and in July 2010, the
public expenditure database was expanded and formally launched as “SPEED”. In addition to collecting
relevant data from IMF’s GFS and Statistical Appendices and Selected Issues, World Bank’s Public
Expenditure Reviews and various national publications, the SPEED team also uses partners to compile
expenditure data at the country level (e.g., especially in SSA where the ReSAKSS network has regional
and country nodes which facilitate data collection of closing data gaps).
Currently, the SPEED database complies and provides publicly available public expenditure
information on 147 developing countries, in six regions across the globe, and eight sectors: agriculture,

16 | R E V I E W O F D A T A A N D A N A L Y T I C A L I N I T I A T I V E S O N A G R I C U L T U R A L
P U B L I C E X P E N D I T U R E S
education, health, defense, social protection, mining, transportation and communication, and total
expenditure for the period 1980-2010. While SPEED provides aggregate expenditure data at COFOG
Level-2 disaggregation (for agriculture, for forestry and for fisheries), it provides data at COFOG Level-1
for other key sectors (including health and education). The database also avails data at sub-national level
for some countries, but more work is needed to be incorporated in SPEED, or presented in a separate
project.
The main methodological features include:
A systematic data collection process is used to compile the SPEED Database from multiple
data sources (published and in-country, especially in SSA, drawing on various on-going
initiatives for generating expenditure data and analysis (CAADP/ReSAKSS in SSA). SPEED
does not use a questionnaire;
Certain adjustments were made to the data for various factors including currency
redenomination in order for the figures to be consistent and comparable over time;
Imputations are also estimated for missing values in the database;
Three methods are used to calculate the imputation: Average, linear trend and 5 year average
growth rate.
Desk work to collect local level data from national sources that’s available via internet, forms
one of the supplementary methods for filling data gaps
(h) World Development Indicators
WDI is the World Bank's flagship statistical database and establishes the benchmark against which
development progress is measured. WDI is a high quality, and internationally comparable statistics about
global development, compiled from officially-recognized international sources. It presents the most
current and accurate global development data available, and includes national, regional and global
estimates. The database contains more than 1,200 time series indicators for 214 economies and more than
30 country groups, with data for many indicators going back more than 50 years. This includes indicators
on public expenditures, although not on agricultural public expenditures.
The objective of WDI is to provide data for policymakers, development specialists, students, and
the public, so that they may use the data to reduce poverty and solve the world’s most pressing
development challenges. WDI aims to provide relevant, high-quality, internationally comparable
statistics about development and the quality of people’s lives around the globe.
The data involving public expenditures is part of public finance indicators, which includes
aggregate public expenditure indicators (and some selected sectors, but excluding agriculture and rural
development). One of the eighteen major thematic areas covered by separate databases refers to
Agriculture and Rural Development, which has a database of 22 indicators on key aspects of the
agricultural sector for all countries. However, at this time, none of these indicators include reference to
agricultural public expenditures. The WDI team has 4 criteria for determining the priority indicators for
inclusion in its expanding database (drawing from existing databases): availability, coverage and
timeliness, and “demand” from users. This review has triggered some discussion within the WDI team to
determine whether to add agricultural public expenditures as one of the “core” indicators for ARD.
The main methodological aspects for WDI database include the following features:
The WDI dataset contains data that generally obtained from official sources, although some
adjustments are made in the balance of payments to account for fiscal/calendar-year
differences. An attempt is made to present data that are consistent in definition, timing and
17 | R E V I E W O F D A T A A N D A N A L Y T I C A L I N I T I A T I V E S O N A G R I C U L T U R A L
P U B L I C E X P E N D I T U R E S
methods. Even so, updates and revisions over time may introduce discrepancies from one
edition to the next.
National accounts and balance of payment, which are the main sources of WDI, data come
from two sources: current reports gathered by the Bank's country management units and data
obtained from official sources.
Following statistical practice, the World Bank has adopted the following terminology in line
with the 1993 System of National Accounts (SNA). The changes are:
i. Gross national product (GNP) to Gross national income (GNI);
ii. GNP per capita to GNI per capita;
iii. Private consumption to Household final consumption expenditure;
iv. General government consumption to General government final consumption expenditure;
and,
v. Gross domestic investment to Gross capital formation
Aggregates are based on the World Bank’s regional and income classification of economies.
(The World Bank’s main criterion for classifying economies is gross national income (GNI)
per capita.)
Growth rates are calculated as annual averages and represented as percentages. Except where
noted, growth rates of values are computed from constant price series. Three principal
methods are used to calculate growth rates: least squares, exponential endpoint, and
geometric endpoint.
The Bank ensures the data work and products are of the highest quality by using standards,
methodologies, sources, definitions, and classifications that are internationally accepted.
General Data Dissemination System (GDDS) is a framework for assessing national statistical
systems and promoting improved dissemination and effectiveness that has been developed by
the International Monetary Fund (IMF), in close collaboration with the World Bank.
Data Quality Assessment Framework (DQAF) has been developed by the IMF, in
collaboration with the World Bank, as a methodology for assessing data quality that brings
together best practices and internationally accepted concepts and definitions in statistics,
including those of the United Nations Fundamental Principles of Official Statistics and the
GDDS.
(2) Type B: Analytical Studies for Agricultural Public Expenditures
(a) Monitoring African Food and Agriculture Policies (MAFAP)
As part of FAO’s mandate to focus on food security, working with national partners, FAO has
established for the first time a sustainable system for monitoring the impact of food and agricultural
policies in Africa (known as MAFAP). MAFAP is implemented by FAO, in collaboration with OECD
and national partners in the participating ten target countries of SSA (Ministries of Agriculture,
Researchers/academia, as well as Ministries of Finance).
The objective of MAFAP is to supply African policymakers and their development partners with
solid evidence on the impacts of policies and investments affecting agriculture and food security, and
enabling the comparison of results across countries and over time (for the target countries). MAFAP also
emphasizes participatory processes to ensure ownership, sustainability and enhanced capacity of the
target countries.
The MAFAP database aims at providing access to data and common indicators on:
price incentives and disincentives for key commodities, using the OECD methodology for
measuring market price support; and
public expenditure on food, agriculture and rural development.

18 | R E V I E W O F D A T A A N D A N A L Y T I C A L I N I T I A T I V E S O N A G R I C U L T U R A L
P U B L I C E X P E N D I T U R E S
In response to the global food price crisis, the increasing attention to supporting the
implementation of the CAADP agenda for SSA and a renewed focus on the importance of agricultural
policy in creating enabling environments for agricultural development, MAFAP was established and
launched/implemented by FAO in 2010, for an initial phase (2010 – 2013). This phase has been
successfully completed and there are steps being taken to prepare a second and expanded phase (2014 -
2019).
MAFAP endeavored to follow common quantitative methodology and indicators in order to
increase transparency and to enable comparison of agricultural policy effects across countries, over time
and between different commodities and commodity groups (exports, imports, food security crops)..
Having objective evidence strengthens the quality of decisions made by policy-makers, and empowers
people affected by policies, and farmers in particular, in their interaction with governments and donors.
Further details on the MAFAP methodology are outlined above, which also has helped to underpin
MAFAP’s solid work on APE and its country level commodities studies.
(b) Resources for Public Expenditure Analysis in Agriculture (RePEAA)
This initiative was developed by the Agriculture and Rural Development (ARD) of the World
Bank, as part a partnership with and funding from the Department for International Development (DFID)
on Public Expenditure in Agriculture,
The objective is to compile/generate and make available various resources on:
- available tools and methods that may be used in analyzing public expenditures in the agriculture
sector;
- many published studies that have analyzed expenditures in the agricultural sector.
While this analytic initiative does not involve the construction of a database on agricultural public
expenditures, it provides a comprehensive source of valuable resources/references and toolkit for
supporting evidenced-based agricultural public expenditure analysis, and thereby contributing to
enhanced resource allocations and supporting policy decisions. Its references include tools for better
understanding AgPE data, and tools for policymakers on how to classify and organize AgPE data?
The active phase of this initiative which was completed in 2011 generated and compiled various
resources, including a comprehensive website which is currently active. 15
The current phase is continued
through making available the resources in the WB-sponsored website, and providing advisory assistance
and ad-hoc training sessions to teams within the World Bank which are conducting agricultural public
expenditure analysis. This web site provides a comprehensive resource base for supporting Agriculture
Public Expenditure Reviews (AgPERs).
The main methodological resource generated by this initiative was the Practitioners’ Toolkit for
Agricultural Public Expenditure Analysis,16
complemented by a large array of other resources on specific
methodologies and country-level expenditure reports, which illustrate diverse practices. Many of the
other resources included in the website address various methodological issues and practices in carrying
agric. expenditure analysis, including addressing different aspects of data issues and challenges.
15
See: http://www.worldbank.org/AgPER 16
See: Practitioners’ Toolkit for Agricultural Public Expenditure Analysis (World Bank, 2011).
19 | R E V I E W O F D A T A A N D A N A L Y T I C A L I N I T I A T I V E S O N A G R I C U L T U R A L
P U B L I C E X P E N D I T U R E S
(c) Regional Strategic Analysis and Knowledge Support System (ReSAKSS)
The Regional Strategic Analysis and Knowledge Support System (ReSAKSS) is an Africa-wide
network of regional nodes supporting implementation of the Comprehensive Africa Agriculture
Development Programme (CAADP). ReSAKSS offers high-quality analyses and knowledge products to
improve policymaking, track progress, document success, and derive lessons for the enhanced
implementation of the CAADP agenda and other agricultural and rural development policies and
programs in Africa.
ReSAKSS is facilitated by the International Food Policy Research Institute (IFPRI) in partnership
with the Africa-based CGIAR centers, the NEPAD Planning and Coordinating Agency (NPCA), the
African Union Commission (AUC), and the Regional Economic Communities (RECs).
ReSAKSS has four main inter-related objectives:
i. To respond to the growing demand for credible information and analysis during the design and
implementation of agricultural-led development strategies, especially in support of the CAADP
agenda;
ii. ReSAKSS nodes are being established (in a few countries, with more being added in 2013 and 2014)
to provide: timely access to relevant information on agricultural investment options and priorities;
benchmarks and best practices; statistical information to monitor progress in achieving key targets
(hence the emerging data base on agricultural expenditures, covered under Type A); and other
relevant technical information to help guide and inform the CAADP implementation process;
iii. The goal is to: promote enhanced evidence-based articulation of investment priorities and associated
decision making; improve awareness of the role of agriculture for development in Africa; and to fill
knowledge gaps, promote dialogue, and facilitate the benchmarking and review processes associated
with the CAADP agenda; and
iv. To strengthen national systems and capacities to implement the CAADP agenda at the country level.
ReSAKSS is currently in its second phase (2011 – 2015), following a successful first phase (2007 –
2010).
The main methodological features are summarized above, which covers both the database and
analytical aspects.
(d) Strengthening National Agricultural Public Expenditures in SSA (SNAPE)
The overall purpose of SNAPE in SSA is to contribute toward improving the impact of scarce
public resources spent by Sub-Saharan African governments on agricultural sector development activities,
hence improving the welfare of rural ( predominantly poor) populations.
There are two operational objectives in providing two levels of analytical support to national
teams of selected SSA countries working on agriculture sector expenditure programming: (a) to support
the conduct of a basic agriculture sector public expenditure review (AGPER) in countries where such a
review has not been undertaken recently; and (b) support countries to carry out specialized agricultural
public expenditure analyses in situations where an adequate understanding of the nature and magnitude of
public expenditures in the agriculture sector already exists (e.g, thematic and subsectoral, and generally
more rigorous type of analyses). Also, analysis is being undertaken to clarify agricultural public
expenditure links to aggregate sector outcomes (although in practice, there has been less emphasis on this
broader component).
20 | R E V I E W O F D A T A A N D A N A L Y T I C A L I N I T I A T I V E S O N A G R I C U L T U R A L
P U B L I C E X P E N D I T U R E S
A secondary objective is to enhance capacity at the country level to conduct and manage these
and periodic agricultural public expenditure reviews, to contribute to enhanced decisions on resource
allocations priorities. The initiative provides training modules on various topics of AGPE and which are
targeted to analysts in SSA countries.
The two types of Ag PE studies being supported (basic and specialized, covering a total of 17
countries in SSA) have involved varying degrees of disaggregation in analysis, endeavoring to rely on
existing expenditure data, which in practice, many of the teams for the basic diagnostic had to completely
construct and integrate off-budget expenditure data, and other considerable data cleaning and
manipulation, as a basis for meaningful analysis (e.g., consistent time series of actual expenditures). To
varying degrees, each study is giving serious attention to addressing the data requirements, issues and
strategies to address the data requirements and reliability in a more systemic manner.
All of the country-level studies provide some rich examples of the types of data-related issues
emerging from specific expenditure studies. The findings are generating some recommendations on
strategies to address the systemic data issues in SSA, and the need for “lite” approaches to sustainable and
periodic expenditure analysis which can have applicable messages for other regions.
The Program has been funded by the Bill & Melinda Gates Foundation (BMGF), and under
implementation since 2010 and is expected to be completed by the end of June, 2014. Given high
country-level demand for this type of agricultural expenditure analysis, there are discussions underway
for possible extension of the program to provide support in other countries, and possibly also to address
more systematically and in collaboration with others some of the emerging underlying data-related issues.
The Agricultural Public Expenditure study initiative has developed training modules on the
various types of AgPE analysis envisioned to be supported, which includes methodological aspects in
supporting the formulation and conduct of such analyses. The suggested methodologies build on the
Practitioners’ Toolkit for Agricultural Public Expenditure Analysis. The application of these principles
and tools are being adapted and carried out by each country AgPE study to fit the specific country level
requirements (in line with the specific TOR). The dissemination workshops are sharing results and
address comparability issues across country studies (including relevant AgPE data issues) (for example,
the recent workshop held in Tanzania, in 2013).
(3) Type C: Databases for Producer Support Estimates and Related Indicators
(a) Monitoring African Food and Agricultural Policies (MAFAP)
MAFAP initiative adapted the PSE-OECD methodology to the African context. One of the main
features is its treatment of the Market Price Support (MPS) analysis, complementing it with value-chain
analysis which enables the measurement of "development gap" indicators related to market failures and
externalities, which is of crucial importance for developing countries. The initiative also gives special
attention to foreign aid, both through government and directly aimed to NGOs or farmers
organizations/private sector. The MAFAP methodology also distinguishes budgeted and allocated
transfers, which enables the measurement of allocation efficiency (or effectiveness) in government
expenditures --- actual expenditures versus intended goals.
A key innovation of the MAFAP initiative is that it allows for a fruitful interaction between MPS
or policy impacts on prices and AGPE analysis, since “development gaps” identify public good problems
which can be tackled with GSSE expenditures in infrastructure, roads and market improvement. This
feature is of particular interest for AGPE methodologies and interactions with policy analysis.

21 | R E V I E W O F D A T A A N D A N A L Y T I C A L I N I T I A T I V E S O N A G R I C U L T U R A L
P U B L I C E X P E N D I T U R E S
(b) PSEs and Related Indicators for Supporting the Agriculture Sector (for OECD and Emerging
Economies)
The Producer Support Estimate (PSE) approach followed by OECD has two main objectives: (i)
To monitor agricultural policies in the OECD countries and key emerging countries, with a focus on
measuring aggregate policy transfers – including budgetary transfers – to the agricultural sector; (ii) To
provide inputs for agricultural policy impact analyses, including the use of a policy evaluation model
(PEM), which is using a dataset covering agricultural public expenditures;
The OECD PSE framework and related indicators are based on a conceptual model of transfers
among farmers, consumers and taxpayers in the economy in order to measure incentives/disincentives for
the agriculture sector and assessing their underlying factors. Accordingly, the PSE methodology seeks to
integrate agriculture public expenditures (APE) as one of the important policy tools in which governments
seek to generate incentives (support) to agriculture, but in a general context in which other incentives and
disincentives are created by policies and real market operations.
Two main PSE indicators are: i. Producer Support Estimate (PSE) and ii. Total Support Estimate
(TSE) to agriculture. The first measures the transfers to (or from) producers from (to) the rest of the
economy, including Market Price Support (MPS) and government transfers and subsidies which go
directly to individual producers. The second indicator measures the total value of support received by
agriculture, including government expenditure in non-specific general services in support of agricultural
sector (GSSE). Part of the support in the PSE is APE, and all GSSE involves APE, therefore there is an
important relationship between PSE/TSEE and APE analyses. The composition of APE among NPA-
related items and GSSE is similar to identifying interventions in “private” and “public” goods in
agriculture. Also, the proportion of GSSE in total TSE comprises an important indicator of the extent of
public good investments in total support to agriculture.
This approach, applied dynamically, enables policy analysts and policy makers to assess changes
in agriculture policies in an integrated and systematic way. The method is currently used by 39 OECD
members (EU, with 27 countries, is considered one unit). Also, currently there is PSE monitoring of
seven emerging economies (Brazil, China, Indonesia, Kazakhstan, Russia, South Africa and Ukraine).
An increased number of developing emerging economies is envisioned to be included in OECD.
Colombia and Vietnam are currently undergoing country level agricultural policy studies and estimates of
PSEs and related indicators.
A general approach of the OECD approach has been to collecting data from multiple sources in
order to address a specific analytical need. PSE/TSE measurement does not requires development of data
systems in any way, but rather collect information on expenditures in each of the categories identified in
the methodology, from whatever source contains that information. When OECD undertakes a country
review, the task is basically a sort of detective exercise, finding out what the policies are and who has
information on the associated public expenditures.
Another important caveat about OECD method in relation to APE is that the budgetary element in
PSE/TSE seeks purely to meet the needs of the method. If a budgetary expenditure such as an export
subsidy creates a price gap then it is not included on the expenditure side as that would be double
counting. This prevents the approach of compiling an exhaustive system of public accounts that contain
all expenditures fitting, say, a COFOG definition of agriculture.
22 | R E V I E W O F D A T A A N D A N A L Y T I C A L I N I T I A T I V E S O N A G R I C U L T U R A L
P U B L I C E X P E N D I T U R E S
(c) PSEs for LAC countries-
The Inter American Development Bank (IDB) has been devoting increased attention to tracking
and promoting sound agricultural policies in order to enhance the impacts of providing increased
agricultural investments to its member countries. As part of this broader effort, over the last several
years, IDB commissioned studies in different LAC countries to assess and measure Producer Support
Estimates (PSE), including General Services Support Expenditure (GSSE), using standard OECD
methodology.
After country studies were completed, IDB has generated country-level databases on PSE
estimates, plus the data from OECD members Mexico, Chile and Brazil. An important part of the
calculations is related to public expenditures in the agricultural sector, both through direct or indirect
payments to individual farmers (in the PSE) and/or financing public goods via general services (GSSE).
The IDB has applied the PSE in 18 countries to date. These include Argentina, Belize, Bolivia, Colombia,
Costa Rica, Dominican Republic, Ecuador, Guatemala, Haiti, Honduras, Jamaica, Nicaragua, El Salvador,
Panama, Paraguay, Peru, Uruguay and Suriname. In 2013 13 countries plus OECD-3 were stored on a
beta web-site testing environment for a pilot use, located in an external server. The LAC PSE design and
data was tested with the participation of a broad experts and potential users including policy makers,
researchers and other beneficiaries. Countries included in the preliminary data base were: Argentina,
Bolivia, Brazil, Chile, Colombia, Costa Rica, Ecuador, Honduras, Jamaica, Mexico, Nicaragua, Peru and
El Salvador. Eight remaining countries, under revision, will be uploaded for the public release of the data
base in December 2013 or in 2014 including Suriname, Dominican Republic, Paraguay, Guatemala,
Uruguay, Belize, Panama and Haiti.
This initiative started in about 2006. It is currently in a pilot phase, and is expected to be
publically accessible in 2014. In the near term, IDB also intends expanding the estimation of PSEs and
related indicators to more LAC countries, while extending coverage of years (currently, it runs from 2006
to 2010, for most countries).
Regarding the methodological aspects, the initiative has a strong commitment to applying the
original OECD methodology as close and rigorously as possible, in order to assure comparability.
Following OECD approach, this effort seek the best available information at each country in order to fill
up the main categories of PSE and collective GSSE expenditures related to agriculture. Nevertheless, the
IDB has been developing expansion for regional needs. In that sense, in 2012 a valuable approach to
understanding how public policy, the private sector and institutional arrangements are related and create
obstacles to competitiveness were studied in Central America and the Caribbean by combining PSE and
Value Chain Analysis (VCA). IDB also has developed a framework to use the PSE framework to address
issues in agriculture and climate change, considering a) mitigation of emission, b) adaptation and c)
vulnerability by commodity and region. The extension of the PSE methodology to address issues in
climate change and agriculture will be discussed in a symposium in early 2014.
Increased IDB administrative and external sources are being sought to expand the PSE
estimations for LAC countries, which could also enable increased efforts to increase capacities at the
country level to sustain the updating of estimates and to respond to the demand for PSE estimates from
country authorities.

23 | R E V I E W O F D A T A A N D A N A L Y T I C A L I N I T I A T I V E S O N A G R I C U L T U R A L
P U B L I C E X P E N D I T U R E S
(4) Type D: Databases for Overseas Development Flows
(a) Creditor Reporting System
The OECD’s Creditor Reporting System (CRS) data initiative provides data on three aspects: (i)
Official development assistance (ODA); (ii) Official export credits (Private loans and credits under
official guarantee or insurance) and (iii) Other official flows. The objective of the CRS database is to
facilitate the study of sectoral and geographical distribution of aid and other official flows. The CRS aid
activity database, in particular, comprises data on ODA activities in recipient developing countries that
enables analyses on where aid goes, what purposes it serves and what policies it aims to implement, on a
comparable basis for all Development Assistance Committee (DAC) member countries and non-DAC
members and foundations.
Since its establishment in 1967 jointly by the OECD and the World Bank -- with the aim of
supplying the participants with a regular flow of data on indebtedness and capital flows -- the CRS has
evolved to respond to changing needs over the years. The database provides data on developing countries
or territories eligible to receive ODA covering the period from 1973 to 2012. Data consist of approved
commitments and disbursements, focusing on financial data but some descriptive information on each
project are also made available. The CRS sector classification, in general, contains five broad categories:
Social infrastructure and services, Economic infrastructure and services; Production; Multi-sector/cross-
cutting; and Non-sector allocable.
The CRS is an ongoing data initiative and forms a core function of the OECD’s DAC, since its
members provide about 95% of development assistance to developing countries. The OECD Creditor
Reporting System (CRS), which records ODA and Other Official Flows (OOF) at the project level, is
currently the most comprehensive and only source, when considering the allocation of assistance to
agriculture as well as other relevant sectors by recipient country and region. Other international agencies,
such as FAO, build on the CRS database (see below). Major methodological features of the CRS data
compilation strategy includes:
Reporting institutions report according to a set of directives that have been agreed on by DAC;
There is also a reporting format known as CRS++ that contains all data items needed for
reporting to the DAC aggregates. The data items are based on definitions and statistical
classifications established by the Working Party on Development Finance Statistics (WP-
STAT) and endorsed by the DAC. All ODA commitments and disbursements – both bilateral
and multilateral ODA – are reported in CRS++ at the activity-level, applying the agreed
classifications of aid by sector (and subsector), type of aid (e.g. budget support, project-type
intervention, technical assistance), type of finance (e.g. grant, loan and their terms, equity),
policy objective (e.g. gender equality, climate change mitigation and adaptation), channel of
delivery (e.g. NGO, PPP, UN agency, IFI, other multilateral institution), tied/untied aid status.
A number of integrity or reliability checks within the CRS are designed to help reporters avoid
inconsistencies. Members are encouraged to implement these integrity checks in their systems.
They are invited to review their reports using the Checklist prior to sending them to the
Secretariat.
The DAC Secretariat assesses the quality of aid activity data each year by verifying both the
coverage (completeness) of each donor’s reporting and the conformity of reporting with definitions (so as
to ensure the comparability of data between donors). Prior to any statistical analysis, users are advised to
examine the “coverage ratios” available on the website.

24 | R E V I E W O F D A T A A N D A N A L Y T I C A L I N I T I A T I V E S O N A G R I C U L T U R A L
P U B L I C E X P E N D I T U R E S
(b) FAOSTAT’s: Official Development Assistance (ODA) to Agriculture
Further to the summary above, FAOSTAT’s investment domain database is comprised of various
components, of which ODA to agriculture in broad sense is one component, hence this initiative is
covered under two types (A and D).
Given that most of the donors report their aid activities to the OECD, FAO has decided to move
towards harvesting ODA data from the CRS, with a specific focus on agriculture. FAO Statistics
Division, in consultation with OECD, is developing a comprehensive CRS-based dataset that supports
analysis of the destination of these flows worldwide and allows investigating the role of such investment-
financing source in developing countries. This approach will reduce duplication of efforts across
international organizations, and allow for greater specialization of statistical activities in areas of
comparative advantage.
(5) Type E: BOOST: Analytical and Database Tool for Supporting Public Expenditure
Databases/Analysis
The World Bank has been the entity which has carried out the largest number of aggregate and
sectoral public expenditure reviews in the developing world. Given that Governments are intensifying
their efforts to rationalize public expenditures, given fiscal constraints, and in the light of data constraints
as a constant challenges in these reviews, the Bank sought and developed a new software tool
(“BOOST”) to help enhance public sector performance, especially through compiling/organizing and
analyzing different aspects of public expenditures (aggregate and sectoral levels). BOOST collects and
compiles detailed data on public expenditures from national treasury systems, makes data available in a
format ready for granular analysis, and presents it in a simple user-friendly format.
BOOST has two main objectives:
- it is designed to help researchers, government officials to help improve public expenditure
management decisions, by examining trends in allocations of public resources, analyzing potential sources
of inefficiencies, and informing how governments can better finance the delivery of enhanced public
services. In countries where the BOOST database is public available, the BOOST enables civil society
and researchers to take informed views and positions on public expenditure allocations, efficiency and
effectiveness.
- BOOST aims at improving the quality of public expenditure analysis, dialogue, decisions, and
monitoring.
BOOST is at its infant stage. It was launched in 2008 and country engagements have been
undertaken in some 42-45 countries, of which 25 BOOSTs already delivered. Some 10-14 BOOSTs are
expected to become public available on a new Open Budget Portal which the Bank plans to launch later in
FY14. BOOST has been generally used to support country level public expenditure reviews, covering all
major sectors. More recently, there has been a growing application of BOOST to key sectors (thus far,
education and health), as part of in-depth sectoral expenditure reviews, and with interest from colleagues
in the agriculture sector articulated.
In summary, the main methodological aspects include:
World Bank works with Ministry of Finance to collect and compile data on all public
expenditures (budgeted and executed) in a given Country or Federal State (i.e., all expenditures
recorded by the country’s treasury system);

25 | R E V I E W O F D A T A A N D A N A L Y T I C A L I N I T I A T I V E S O N A G R I C U L T U R A L
P U B L I C E X P E N D I T U R E S
The BOOST team (consists of World Bank staff/consultant/Govt. counterparts) prepares a
comprehensive easy-to-use database covering expenditures across all sectors, all levels of
government and multiple years; and
The World Bank and Government counterparts use the database to develop new ways of
analyzing public expenditures and provide better policy advice across a variety of sectors. The
BOOST team is developing an online platform that will allow users to analyze public expenditure
data through web-based PivotTable and mapping interfaces to make the analysis of public
expenditures easy and accessible for a non-technical audience, as well as to get citizens and
policymakers thinking about the linkages between spending and results.
3. ASSESSMENT AND COMPARISON OF THE INITIATIVES
3.1 Assessment Criteria and Approach
The section above has summarized the main features for each of the data and analytic initiatives
being reviewed in this exercise. This chapter will focus on a comparative review, based on the following
criteria/approach:
according to the type of initiative, based on the typology framework outlined in Chapter 2, to
ensure comparability, while also recognizing that some inter-type comparisons may also provide
relevant insights;
focus on the following strategic aspects which could foster enhanced data and analytical quality
and inter-agency collaboration
o Objectives and unique features/value-added
o Scope of Coverage (in terms of period, frequency, level of disaggregation)
o Key Methodological Aspects (including comparison on key aspects, such as classification
system (where relevant), data compilation methodologies and documentation, approach
to making data adjustments, metadata documentation, other)
o Public Accessibility
o Strategies/mechanisms to link data users with suppliers
o Main issues and challenges
o Sustainability aspects
o Linkages to and Collaboration with Other Data and Analytic Initiatives
3.2 Objectives and Unique Features/Value-added
(1) Type A: Databases for Public Expenditures and Agricultural Public Expenditures
Although the central objective of each of the eight initiatives’ database is providing a wide range of
socio-economic data, which include public expenditure on agriculture and related activities, for
diverse stakeholders, there are certain attributes -- depth and breadth -- which differentiate one
databases’ objective from the other. In summary:
a) Four of the databases (ASTI, FAOSTAT- GEA, MAFAP , and ReSAKSS) aim in compiling and
disseminating highly disaggregated data that can be used to facilitate the assessment of
governments’ role in and contribution to agriculture and other activities that affect the agriculture
sector enabling comparability among countries and harmonization with other international
organizations compiling similar datasets;

26 | R E V I E W O F D A T A A N D A N A L Y T I C A L I N I T I A T I V E S O N A G R I C U L T U R A L
P U B L I C E X P E N D I T U R E S
b) Two of them (GFS and SPEED) endeavors to building and making available a comprehensive
and wide range of (general) public expenditure information to researchers, policymakers, donors,
and the broader development community;
c) Two of the databases (AGPE-LAC and WDI) aim in providing a wide range of relevant, high-
quality, internationally comparable statistics about development and the quality of people’s lives
for policymakers, development specialists, students, and the public, so that they may use the data
to reduce poverty and solve the world’s most pressing development;
d) Some of the databases are designed to complement the information obtained from the others by:
e) providing further disaggregation of information (e.g. FAOSTAT: GEA enhances and provides
additional “value-added” to the data already collected by IMF according to COFOG through the
disaggregation of IMF aggregates pertaining to government expenditure on agriculture (to level 3,
recurrent and capital expenditures); MAFAP adopts a broad definition of the agricultural sector,
and endeavors to use FAOSTAT data where possible, while compiling more disaggregated data
from country-level sources based on an expenditure classification system for the agricultural
public expenditure
f) tracking specific projects (e.g ReSAKSS tracks the progress of CAADP);
g) Compiling scattered publication of PE statistics into one platform (e.g. SPEED is the largest
publicly available public expenditure database. It incorporates local data from a large selection of
countries);
h) Providing primary data through institutional survey rounds that are not captured elsewhere, (e.g.
ASTI compiles information on inputs into agricultural R&D, rather than outputs or outcomes;
although the program is currently piloting the latter in a number of countries);
i) ASTI’s central objective, for example, is limited only to providing as much disaggregated data as
possible on the R&D strand of public agricultural expenditure. This makes it difficult for parallel
cross-referencing of aggregate information (such as overall share of agricultural public
expenditure out of general public expenditure, which ASTI does not compile, but an important
indicator in the assessment of public expenditure on the agricultural sector) across different data
sources. The same is true with other data initiatives, which provide certain aggregate information
on AGPE but not further disaggregation of relevant information on the performance of the
agriculture sector, in general;
j) This calls for further efforts to putting an integrated system in place that can draw relevant
agricultural public expenditure information from all data sources in one platform and ensure
complementarity of objectives of the data sources and two-way flow of readily available and
reliable information -- from aggregate to more disaggregated information and the other way
round.
(2) Type B: Analytical Studies for Agricultural Public Expenditures
As can be noted, there are both differences and similarities in their objectives, where each initiative
exhibits noteworthy value-added features:
all of the four initiatives focus on carrying out and disseminating analytical studies on agricultural
public expenditures;
three of the four initiatives focus on SSA countries, reflecting high priority on supporting the
implementation of the CAADP agenda through enhanced agricultural expenditure levels,
priorities/composition and management;
all studies endeavor to focus on generating and disseminating evidenced-based outcome and,
where possible, impact-level results;
although tracking of the Maputo targets is done by nearly all initiatives, ReSAKSS unique feature
is its explicit mandate to do it;
AgPER and RePEAA’s unique features include their strong capacity building materials.

27 | R E V I E W O F D A T A A N D A N A L Y T I C A L I N I T I A T I V E S O N A G R I C U L T U R A L
P U B L I C E X P E N D I T U R E S
MAFAP’s uniqueness lies in the level of disaggregation in expenditure analysis, as well as its
focus on country-level institutionalization;
all initiatives emphasize participatory approaches and strong in-country ownership, with a
concerted orientation to developing/promoting in-country capacities to sustain these type of
studies and expenditure “agenda” over time (although RePEAA takes a broader and global
dissemination/capacity development approach, with a focus on practitioners from development
organizations);
each initiative exhibits distinct unique features which distinguish it from other initiatives, and
therefore complement each other, although not an intentional strategy (e.g., MAFAP adopts a
broad definition of the agricultural sector, and executed by FAO; ReSAKSS focuses on
supporting the tracking and implementation of CAADP, and has a unique linkage with IFPRI;
SNAPE focuses on supporting basic agricultural PE analysis, supported by training modules, and
executed by the World Bank; RePEAA has a global coverage, developed a comprehensive
toolkit, and developed a comprehensive website with valuable resources, including global good
practice documents on country-level agricultural expenditure analysis).
(3) Type C: Databases for Producer Support Estimates and Related Indicators
The comparative assessment of the objectives and value-added of the PSE-related initiatives
highlights the following main findings:
a) These three initiatives share the goal of generating relevant data for agricultural policy analysis,
with a focus on measuring price distortions and AGPE structure and efficiencies. The use of
OECD methodology is clearly key for having a sound and consistent conceptual model in which
AGPE and other supports are classified according to policy considerations (the way in which
incentives are generated);
b) MAFAP was more clearly related to policy monitoring in the SubSahara African (or developing
countries context, more generally), so it shows important adaptations and expansions of OECD
approach in order to meet country needs (e.g.,value-chain analysis, key additional disaggregation,
expanded agriculture-related and supportive expenses).
c) The PSE for LAC initiative originated in a different policy context and requirements than the
PSEs for OECD countries, while still endeavoring to serve as a tool for enhanced policy
monitoring and measurement of a key sector of the LAC countries. It has tended to follow as
closely as possible the OECD PSE method, as comparability is considered a key element. IDB
PSE was generated as a result of work initiated in 2003 as part of its support to the agricultural
sector negotiations of the Central American Free Trade Agreement, and subsequently in other
regions in Latin America. The IDB has since used the PSE analysis to support policy dialog in
many countries in LAC to date, and its’ use for this purpose is established in the IDB Sector
Framework on Agricultural; and
d) Natural Resources Management document, approved by the Board of Directors.
(http://www.IDB.org/en/publications/publication-
etail,7101.html?id=69354%20&dcLanguage=es&dcType=All ;
e) It is therefore expected that the PSE database will contribute over time to a more to a better
understanding and basis for policy dialog on the objectives of food security, trade integration,
rural poverty reduction and competitiveness and adaptation to climate change. Some countries
28 | R E V I E W O F D A T A A N D A N A L Y T I C A L I N I T I A T I V E S O N A G R I C U L T U R A L
P U B L I C E X P E N D I T U R E S
like Haiti and Suriname have already committed to integrate this policy tool into their agricultural
information systems.
(4) Type D: Databases for ODA Flows
The common dominant feature of the two initiatives’ objective in this category is compiling and
providing a set of readily available data on ODA and Other Official Flows that enable analysis on where
aid goes, what purposes it serves and what policies it aims to implement, on a comparable basis. The
ODA (FAOSTAT) database, in particular, tracks flows of ODA and Other Official Flows worldwide in
order to show whether external assistance to agriculture as well as other relevant sectors distribution is
aligned with need or concentrated in a small number of countries. To this end, it compiles more detailed
data than the OECD’s CRS information on some agricultural activities/purposes and it refers to both
narrow and broad definitions of agriculture. Moreover, it augments the CRS data by continuing to collect
and maintain data for the activities related to agriculture provided by non-CRS reporters included in the
FAO broad definition of agriculture.
Currently, FAOSTAT is in the process of enhancing its database on external flows, and once the
relevant information is available (during 2013), the relevant aspects need to be considered, especially with
regards to the complementarities between the CRS and FAOSTAT/EFF databases. Some particular
attributes of the FAOSTAT ODA database includes that it has relatively broader coverage of:
Donors: more data/info on contributions, priorities, etc.
Purpose codes (primary and secondary activities in agriculture)
Definitions and concepts of narrow and broad of agriculture
Types of aid flows (e.g., concessional and non‐concessional)
(5) Type E: BOOST: Public Expenditure Analytical and Database Tool
BOOST is a unique initiative which is included in this review because it offers a promising and
innovative software tool which can integrate the generation of an agricultural public expenditure data base
(with sector disaggregated data) with facilitating expenditure analytical studies at the macro and sectoral
levels. Since BOOST is unique among other initiatives, and therefore there are not other comparable
initiatives, the following sections summarize the main features of BOOST. Where linkages can be made
with other initiatives, this will be highlighted below.
BOOST has the following objectives:
BOOST is designed to help researchers, government officials and ordinary citizens to examine trends
in allocations of public resources, analyze potential sources of inefficiencies, and inform how
governments can better finance the delivery of enhanced public services.
BOOST aims at improving the quality of public expenditure analysis, dialogue, decisions, and
monitoring.
The value-added features include:
BOOST is a new approach to collecting, combining, analyzing and sharing public expenditure data
aimed at improving the quality of public expenditure analysis by linking spending to results ;
A platform for expenditure dialog for client countries and WB engagement with clients; and
BOOST can provide information on how money is spent and by whom it is spent. Standard tables
showing trends in spending - broken down by the economic, functional, or administrative
classification of the budget (or any combination of each) - can be generated in a matter of hours
instead of weeks or months.

29 | R E V I E W O F D A T A A N D A N A L Y T I C A L I N I T I A T I V E S O N A G R I C U L T U R A L
P U B L I C E X P E N D I T U R E S
3.3 Scope of Coverage
(1) Type A: Databases for Public Expenditures and Agricultural Public Expenditures
The comparison of the scope of the eight databases under consideration reflects the following
common similarities and differences:
a) Although all of the databases contain certain information on public expenditure on agriculture,
the scope (sectors covered, level of disaggregation, updates and frequency of data, countries
and years considered) and depth of the information they provide varies to a higher extent.
While four of the databases (AGPE-LAC, GFS, SPEED and WDI) cover a wide range of data
besides expenditure information, four of the initiatives (ASTI, FAOSTAT- GEA, MAFAP and
ReSAKSS) focus only on expenditure in agriculture, rural development and related activities;
b) Three of the databases (GFS, SPEED and WDI) provide public expenditure data on agriculture
only up to the level of COFOG Level 2 classification, if not less (e.g., WDI17
). The rest (AGPE-
LAC, ASTI, GEA-FAOSTAT, MAFAP and ReSAKSS) go further and provide highly
disaggregated data beyond COFOG Level 2;
c) Five of the databases (FAOSTAT/GEA, ReSAKSS, ASTI, AGPE for LAC and WDI) provide a
wide range of non-expenditure data on different aspects of agriculture and food security. The
two of them (GFS and SPEED) do not cover such information. ASTI generates a wide range of
non-expenditure data including research staff, research focus, and funding sources
disaggregated at different levels and categories, generally, does not cover non-expenditure
information unless it is an important contextual matter which affects total expenditures in
support of food and agriculture sector. Databases such as ASTI should also consider including
relevant agricultural expenditure indicators, such as PAE as a share of total government
expenditure, which are pertinent to the analyses of allocation of resources in the agricultural
sector;
d) The countries or territories, thereby the regions, covered by the databases also varies across
initiatives. (See Figure 3, for the number of countries covered by each initiative in the group.)
Given the objectives of the initiatives and the organizational structures of the organizations that
host the initiatives, while half of them (WDI: 188; SPEED: 147; GEA: 134; GFS: 130) cover
more than 100 countries across the globe, the rest half covers less countries focusing only on
certain target regions – developing countries where agriculture plays a central role in their
economies;
e) Three of the long standing databases, except that of FAOSTAT’s GAE, for example,
collect/provide data going back to the 1960s, whereas, the other (relatively young initiatives)
collect/provide data since the early 2000s, except ASTI and ReSAKSS which go back to 1980
(ASTI also dates back to the 1960s for some countries);
f) All of the initiatives in this group, in general, compile/provide data at annual frequency;
g) The WDI database is included in this category only because it also supplies aggregate public
expenditure information for a large number of countries, and over time. There is potential scope
for WDI to include more disaggregated agricultural expenditure data (compiled from other
relevant and reliable sources);
h) The disparities in the scope, coverage and depth of information across the data sources have a
limiting effect on the effort of researchers and data users in their search for a comprehensive
datasets to conduct their studies. The data compilation work alone requires an inefficient use of
professional time hunting (searching) for a complete and relevant set of data from the dispersed

30 | R E V I E W O F D A T A A N D A N A L Y T I C A L I N I T I A T I V E S O N A G R I C U L T U R A L
P U B L I C E X P E N D I T U R E S
and fragmented sources. (We have faced this challenge even at the time of conducting this
review);
i) It is important to consolidate progress on annual data, before proceeding to compile data on a
shorter frequency (such as seasonal price fluctuations, expenditure outturns per quarter);
j) Initiatives should strive to cover as much countries and regions possible (while recognizing the
resource constraints faced by all of the initiatives);
k) Data initiatives also have to consider compiling budget information in addition to the
expenditure data they collect as it has paramount importance in the evaluation of commitment
of countries to live up to their promises in enhancing the agriculture sector.
Figure 3: Number of countries covered by each initiative under Typology A.
(2) Type B: Analytical Studies for Agricultural Public Expenditures
As can be observed, there both similarities and unique differences in the scope of each initiative,
including:
a) three of the four initiatives focus exclusively on SSA, and with MAFAP initiative focused on ten
target countries in SSA;
b) all initiatives endeavored to compile and analyze disaggregated expenditure data, to the extent
possible, with MAFAP and ReSAKSS making more progress in compiling and analyzing
disaggregated expenditure data for selected countries (and some of the same ones); many of the
country-level studies supported by SNAPE achieved varying levels of disaggregated expenditure
analysis, due to data constraints; and
c) There has been limited overlap of country-level agricultural expenditure studies involving some
of the same countries (e.g., MAFAP and the SNAPE studies have involved the same following
four countries --- Burkina Faso, Malawi, Mozambique and Nigeria; ReSAKSS (and its regional
nodes) covering most of the SSA countries. Where this overlap has occurred, the studies and
tracking activities have involved engaging and coordinating with many of the same “core”
country-level counterparts, and there have been some differences in methodological approaches.
There have not been major differences, and the outputs are generally well received by the main

31 | R E V I E W O F D A T A A N D A N A L Y T I C A L I N I T I A T I V E S O N A G R I C U L T U R A L
P U B L I C E X P E N D I T U R E S
counterparts (from the Ministry of Agriculture), and therefore, it appears that the studies have
been complementary to each other in these countries.
(3) Type C: Databases for Producer Support Estimates and Related Indicators
The comparative assessment of the scope of coverage of the PSE-related initiatives highlights the
following main findings:
a) Before 2006, the PSE for LAC database only has three OECD members (Brazil, Chile and
Mexico)18
. The IDB has applied the PSE in 18 countries to date. Some countries are under
revision, and the estimations will be uploaded for the public release of the data base in December
2013 or in 2014. Most of the calculations started in 2006 until 2010/11/12, and updates are being
considering annually. There are plans for building historical series for all countries in the
database for the past decade to increase the potential use of the database for time series and cross
country comparisons; and
b) MAFAP is focused on 10 SAA countries, with more intensive data collection and analysis in six
of them. The time span for PSE data is currently 2005-2011. There are plans for building
historical series with less aggregation, using 2005 as base year (based on CRS database of ODA
which starts that year).
(4) Type D: Databases for ODA Flows
CRS Aid Activity database is currently the most comprehensive when considering the allocation
of assistance to agriculture, as well as other relevant sectors, by recipient country and region at the
activity level. The dataset covers the flows recorded in both commitment and disbursement basis from
1973 to present, although the progressive improvement in donors’ reporting since the 90s should be taken
into consideration during the analyses.“CRS data provide only a partial estimate of ODA to agriculture
because they do not include all donors; many multilaterals are excluded as are emerging donors such as
China. There is a need for a more comprehensive dataset describing development assistance to
agriculture,” (Lowder and Carisma, 2011, p. 29).
(5) Type E: BOOST: Public Expenditure Software and Database Tool
The content of each BOOST is country-specific. By requesting raw data at the most
disaggregated sector level available in a country’s treasury/expenditure system, the resulting BOOST
database takes advantage of the full breadth and depth of the country’s budget classification system and
corresponding data. The data on expenditures, organized using all of the country’s budget classification
codes, is then compiled in one database that covers all sectors, all spending units, and all types of
expenditures recorded in the treasury system.
Nonetheless, all BOOSTs (referring to when the BOOST analytics are applied to a particular
country/sector) have some common features and contain expenditure information on the approved budget,
revised budget, and actual expenditure amounts.
The types of expenditure amounts are broken down by:
government level (central or local);
18 IDB database takes official OECD data for the three OECD members, Brazil, Chile and Mexico, therefore no duplication and
discrepancies may occur.
32 | R E V I E W O F D A T A A N D A N A L Y T I C A L I N I T I A T I V E S O N A G R I C U L T U R A L
P U B L I C E X P E N D I T U R E S
administrative unit (typically a ministry, department, agency, university, hospital, or school);
sub-national spending unit (such as districts, municipalities, towns and villages);
economic classification (wages, goods and services, capital expenses, etc.);
functional classification (sector and sub-sector);
program classification (if the country uses program based budgeting);
financing source (budget revenue, domestic or foreign borrowing, etc.); and
other classification
3.4 Key Methodological Aspects
(1) Type A: Databases for Public Expenditures and Agricultural Public Expenditures
In summary, the methodologies applied by each data initiative in compiling and disseminating data
exhibit the following similarities, and to a lesser extent, some differences:
a) Most initiatives develop user guide manuals and useful links to support and to encourage users
to understand the technical details of the methodologies, and to use the available data easily,
while some do not have this documentation available (e.g., AGPE for LAC). ASTI, for
instance, provides all relevant resources, such as operational and work plans, user guild manual,
background information of the project, etc., to the public without restriction. The GFS and
WDI, in particular, provide a thorough list of standards and codes (which includes the General
Data Dissemination System (GDDS), Special Data Dissemination Standard (SDDS)), manuals
and guilds, on their websites. In MAFAP, some capacity development/user guide material
is already online and a full capacity development package will be available at the start
of phase II (preparations ongoing). AgPE for LAC, GEA-FAOSTAT, MAFAP, ReSAKSS
and SPEED should also endeavor to publicly provide such relevant resources together with
their databases online;
b) While most of the initiatives use a questionnaire to collect data (see Table 3.1 which illustrates
the enhanced questionnaire used by FAO to collect AGPE data, with greater disaggregation
than the GFS), some initiatives (SPEED and AgPE for LAC) do not use a questionnaire; rather
they use different (secondary) sources of data. A systematic data collection process is used to
compile the SPEED Database from multiple data sources;
c) The timing of sending questionnaires for reporting countries and institutions or the data
collection effort, in general, should be carried out cautiously/wisely as it may have a critical
implication in gathering quality and comparable data at a reasonable cost of resources. Certain
data initiatives try to insure consistency of data collection by rearranging the timing for sending
questionnaires to reporting countries in accordance with other initiatives. The lesson from
FAOSTAT’s GEA data initiative worth consideration. FAOSTAT’s issues the questionnaire on
government expenditures to agriculture, rural development and related activities in about
September of each year, such that it follows about 2 months after the GFS questionnaire is
issued by IMF, to help ensure consistency with the GFS data;

33 | R E V I E W O F D A T A A N D A N A L Y T I C A L I N I T I A T I V E S O N A G R I C U L T U R A L
P U B L I C E X P E N D I T U R E S
Table 3. 1: Table Used as Questionnaire for Country Level Ag. Expenditure Data/ex.: Mauritius)
Note: Table was taken from a presentation made by FAO (Inter-Agency Collaboration in Fiscal
Statistics, 2013).
d) All initiatives have endeavored to compile time series agricultural expenditure data, primarily
at national level, with some databases attempting to compile sub-national expenditure data
(e.g., ReSAKSS);
e) The data initiatives also make different adjustments to the data they compile to adjust for
various factors including currency redenomination, inflation, etc. (e.g., GFS, FAOSTAT/GEA,
SPEED, ReSAKSS). This may suggest the need for closer collaboration across initiatives to
ensure consistency, complementarities and enhanced usage by analysts and policy-makers;
f) There is also a growing trend toward enhanced collaboration to ensure improved data quality
and consistency across initiatives. For example, Data Quality Assessment Framework (DQAF)
has been developed by the IMF, in collaboration with the World Bank, as a methodology for
assessing data quality that brings together best practices and internationally accepted concepts
and definitions in statistics. Such collaboration should be inclusive such that other data
initiatives who rely (or supply) for data to (on) these initiatives would be benefitted;
g) Although all data initiatives attempt to follow internationally accepted definitions and statistical
procedures to compile their data, we observe variations in the approaches to defining the
agricultural sector. Whereas some of the databases use a COFOG definition of the agricultural
sector (e.g., GFS, FAOSTAT/GEA, SNAPE), others (e.g., supported by MAFAP) have used a

34 | R E V I E W O F D A T A A N D A N A L Y T I C A L I N I T I A T I V E S O N A G R I C U L T U R A L
P U B L I C E X P E N D I T U R E S
broader definition of the agricultural sector (which also was influenced by the expenditure
classifications for estimating PSEs in accordance with the OECD methodology). This, coupled
with the other methodological divides mentioned above, resulted in data variation and
inconsistency across the different data sources;
h) As Lowder and Carisma (2011) noted, comparisons across the different datasets capturing
AGPE remain problematic because of the persisting variation in sector definition (whether it
includes forestry and fisheries, agro-processing, rural infrastructure, etc), usage of indicator
(e.g. levels, shares, intensities, per capita, etc.), adjustments made, time period and countries
covered. We reviewed four international datasets (GEA-FAOSTAT, GFS, ReSAKSS and
SPEED) to assess comparability in magnitude and trends in government spending on
agriculture, forestry and fishing, and other activities that may affect the agricultural sector.
These datasets represent the most current and comprehensive data available on resource flows
to agriculture;
i) The evidence we obtain from the four data sources, focusing on eight countries (Egypt,
Ethiopia, Ghana, Kenya, Lesotho, Mauritius, Tunisia, Uganda, Zambia) where we can find data
on the share of PAE out of the total public expenditure from these databases, reinforces the
following patterns: ReSAKSS database seems to have higher estimates; SPEED tends to
understate the share of PAE information; FAOSTAT-GEA (also shown as GES in the figure),
and GFS, on the other hand, tend to have greater convergence with their datasets, reflecting that
the FAOSTAT GAE database endeavors to work within the aggregates estimated by the GFS
(See Figure 4 for further details on the comparisons). The variation in information contained
among the four databases show minor change from 2006 to 2007 for these selected countries
except for Zambia, where the variation between SPEED and RESAKSS statistics, for example,
grows by 8% from 2006 to 2007 (see Figure 4).
Figure 4: Comparability of Agriculture Expenditure Statistics Across four Databases.
Sources: Authors’ computation based on data obtained GEA-FAOSTAT, GFS, ReSAKSS and SPEED databases.
05
1015
20
% s
hare
Egypt Ethiopia Kenya Lesotho Mauritius Tunisia Uganda Zambia
Share of Public Agricultural Expenditure (2006)
FAOSTAT_GES GFS
ReSAKSS SPEED
05
1015
20
% s
hare
Egypt Ethiopia Kenya Lesotho Mauritius Tunisia Uganda Zambia
Share of Public Agricultural Expenditure (2007)
FAOSTAT_GES GFS
ReSAKSS SPEED

35 | R E V I E W O F D A T A A N D A N A L Y T I C A L I N I T I A T I V E S O N A G R I C U L T U R A L
P U B L I C E X P E N D I T U R E S
Figure 5: Trend of Variation in Agriculture Expenditure Statistics across the Four Data Initiatives
Sources: Authors’ computation based on data obtained GEA-FAOSTAT, GFS, ReSAKSS and SPEED
databases.
(j) It has been well recognized that the aggregate government expenditure statistics provided by the
most referred and internationally recognized databases (such as the GFS and WDI), and even the
relatively young databases such as SPEED, has reduced importance to assess the allocation of
resources within agricultural expenditure. To this end, different researchers are proposing a more
transparent and flexible system in order to better track public resources allocation enabling
customized and consistent aggregation, promote open data access and provide information in a
timely manner to support evidence-based policymaking process. One of the possible way to meet
this objective is to develop a well-defined expenditure coding system, for example, by adopting the
chart of accounts, which organizes spending data according to numeric, alphabetic or a combination
of both codes, together with a flexible aggregation model or program;
(k) In Kenya, for e.g., the chart of accounts for the government expenditure is organized according
to a numerical coding system. The first 2-digit code represents the highest level of government
administration category, e.g., ministries or other ministry level government agencies. The following
3-digit code forms the second level of government administrative category, while the last 3-digits
seems to represent the programs or units within a department. For example, the code 10.103.260
represents the Farmers Training Center (a Unit), where the first 2-digit (10) stands for Ministry of
Agriculture and the first 3-digit (103) represents the Facilitation and Supply of Agriculture
Extension Service Department.
Such coding system allows more flexibility to aggregate data in addition to easing explicit mapping
relationship between the countries government finance statistics system and COFOG or any other
aggregation of classification. This makes sure that the aggregate data is no longer a black-box that
is unlikely to be inconsistent across countries and hence difficult for comparison.
-,8.0
-,6.0
-,4.0
-,2.0
,0.0
,2.0
,4.0
,6.0
,8.0
SPE
ED
-ReS
AK
SS
SPE
ED
-GE
A (
06
)
SPE
ED
-GF
S
ReS
AK
SS-
GE
A
ReS
AK
SS-
GF
S
GE
A-G
FS
Variation between 2006 and 2007
(% C
han
ge)
Nature of variation in share of PAE information across databases from 2006 to 2007
Egypt
Ethiopia
Kenya
Lesotho
Mauritius
Tunisia
Uganda
Zambia

36 | R E V I E W O F D A T A A N D A N A L Y T I C A L I N I T I A T I V E S O N A G R I C U L T U R A L
P U B L I C E X P E N D I T U R E S
(2) Type B: Analytical Studies for Agricultural Public Expenditures
The methodologies applied by each analytical initiative exhibit the following similarities, and to a
lesser extent, some differences:
a) All initiatives have endeavored to compile and analyze agricultural expenditure data, primarily
time series data at primarily at the national level, with some studies attempting to compile sub-
national expenditure data (e.g., RESAKSS);
b) There have been some variations in the approaches to defining the agricultural sector, with some
of the studies using a COFOG definition of the agricultural sector (e.g., supported by SNAPE),
whereas others (supported by MAFAP) have used a broader definition of the agricultural sector;
these latter one was influenced by the expenditure classifications for estimating PSEs in
accordance with the OECD methodology);
c) All initiatives applied “basic” type of descriptive analysis, analyzing historical trends and
composition (by major subsectors and capital/recurrent), and institutional budgetary management
processes according to the budgetary cycle, with resulting recommendations to improve
agricultural expenditure efficiencies;
d) In practice there have limited specialized expenditure analyses/results which have assessed the
quantitative impacts of agricultural expenditures on key target variables, such as agricultural
GDP, incomes and poverty reduction. This reflects data, capacity and resource constraints.
ReSAKSS country level and cross-country studies, together with IFPRI-sponsored research
studies, have tended to carry out more rigorous empirical studies, with an emphasis on assessing
expenditure-outcome linkages, and using quantitative methods to determine public investment
priorities and public investment requirements.19
This kind of quantitative analysis, which would
be useful to carry out periodically, illustrates the rationale for improving the expenditure database
and in-country analytical capacities. Since all of the analytical initiatives tend to include a
capacity building dimension, it would be important for future data and analytic initiatives to
ensure close coordination and complementarity of efforts, responding to the demands of country-
level decision-makers.
(3) Type C: Databases for Producer Support Estimates and Related Indicators
The comparative assessment of the methodological aspects of the PSE-related initiatives highlights
the following main findings, including some important methodological caveats:
a) Product basket for MPS estimations. In the PSE OECD methodology a basket of agricultural
goods must be selected to carry out PSE calculations (specifically for the Market Producer
Support-MPS estimation). This basket has to be representative of sectoral output, representing at
least 70% of the value of production, according to the OECD manual. Table 3.2 shows the
average values of this proportion in both databases. In LAC non OECD countries the rule of 70%
has also been adopted, although the exception is Honduras (57%). New updates and historical
revision for Central American countries will address this exception. OECD countries have
consistently values above 70% for the value of the basket20
. In the MAFAP initiative, the rule of
19
For example, several country level studies have been carried out by ReSAKSS researchers, since 2008 (e.g., S.
Kanyarukiga and B. Yu, “Agricultural Growth and Investment Options for Poverty Reduction in Rwanda
(ReSAKSS Working PAgPER No. 21, 2008). An on-going analytical study which is compiling available public
expenditure data for helping to assess updated public investment requirements and targets at the country level and
which will involve collaboration with ReSAKSS (and the regional and country-level nodes) refers to: “Analyzing
CAADP Targets and Agricultural Public Investment Areas “, concept note prepared by ESARO-IFPRI for AUC
grant, March, 2013). 20
It should be said that LAC countries tend to have a more diversified agriculture, with a production base which is
more diverse than the agricultures of industrialized countries and so it is more complicated to achieve the 70% of the

37 | R E V I E W O F D A T A A N D A N A L Y T I C A L I N I T I A T I V E S O N A G R I C U L T U R A L
P U B L I C E X P E N D I T U R E S
70% has been adopted and selected baskets generally surpass that proportion of agricultural GDP.
In contrast to LAC countries, African agriculture is not as diverse, so the target of 70% is more
feasible with a manageable number of commodities.
Table 3. 2: Proportion of GDP from basket used for MPS estimations in PSE/LAC initiative.
b) Links between MPS estimations and Public Expenditure Analysis. Both PSE for OECD
economies and PSE for LAC countries use a basic model for the law of one price for the MPS
estimation. It has the problem of not identifying how market failures and imperfections distort
incentives and disincentives to agriculture and the way in which these are received by agents.
The MAFAP proposal is to distinguish in the MPS estimation the "market development gap”,
which measures the extent at which market imperfections contribute to the price gap at different
parts of the value-chain. This approach allows for a very interesting interplay between MPS and
AGPE analysis, enabling one to observe if governments are orienting public resources to tackle
these imperfections, which generally affect severely farmers' income and agricultural
development. This seems to be a very promising avenue for supporting the efforts in LAC
countries through using an “expanded” OECD approach, as introduced and used by MAFAP;
c) The role of External Assistance and AGPE analysis. An important feature of MAFAP is that it
explicitly tackles the issue of external assistance (or ODA) and its impact on budgeted and non-
budgeted support to agriculture in the African context. This issue could be of particular
importance for some LAC countries, for instance in Central America and Caribbean countries in
which external assistance continues to be important. MAFAP uses the Creditor Reporting
System (CRS) from OECD to get and classify external assistance and integrate it in the AGPE
analysis, but for non-CRS donors data collection is more complicated;
GDP requirement using a manageable number of commodities for the estimations (no more than 10 or 12, for
instance).
% GDP % GDP
Argentina 73 Brazil 79
Bolivia 63 Chile 76
Colombia 69 Mexico 67
Costa Rica 40 AVG 74
Eduador 80
El Salvador 60 Canada 84
Honduras 57 European Union 73
Jamaica 65 United States 74
Nicaragua 79 AVG 77
Peru 69
AVG 65

38 | R E V I E W O F D A T A A N D A N A L Y T I C A L I N I T I A T I V E S O N A G R I C U L T U R A L
P U B L I C E X P E N D I T U R E S
d) Other expenditures. MAFAP has included separate modules for measuring public expenditures
which are not agriculture-specific, but important for food and agriculture sector. This approach is
very important and useful for a better assessment of government policies and their impact on
rural-based agriculture. Expenses on education, health and roads in rural areas are important
decisions which affect agricultural and rural development in the medium and long terms.
Managing these expenditures in a separate module allows one to ensure comparability of public
expenditures with traditional GSSE measurements;
e) Other useful disaggregation for AGPE analysis. An important disaggregation is between
allocated and actually expended resources, which allows to measure "expenditure capacity"; this
is a commonly notion of efficiency used in many countries for assessing how policy goals are
being addressed, using the budget. Equally important is to register administrative costs (which
are not considered in the OECD method) as a separate entity, which allows comparison and also
constructing indicators on the importance of these costs in agricultural expenditure. Finally,
MAFAP also allows for including Fishery and Forestry expenditure data, but separated in
independent modules. This flexibility is useful, while preserving the core method, expanding it to
useful areas for policy purposes.
(4) Type D: Databases for ODA Flows
FAO harvests ODA directly from the CRS, developed and maintained by the OECD. In
consultation with OECD, FAO is developing a dataset that supports analysis of the destination of these
flows world-wide and allows investigating the role of such investment financing source in developing
countries. Data compiled to the CRS are collected by CRS++, a reporting format, which consists of a
number of integrity or reliability checks within the CRS and is designed to help reporters avoid
inconsistencies.
(5) Type E: BOOST: Public Expenditure Software and Database Tool
As highlighted in the previous sections, the BOOST team at the World Bank prepares a comprehensive
easy-to-use database covering expenditures across all sectors, all levels of government and multiple years.
Figure 6 illustrates the three core dimensions of BOOST, in terms of: administrative/organizational
location of expenditure agencies; functional/programmatic areas covered; and economic classification.
This same methodology can be applied to a specific sector, such as agriculture. See Annex A, Table 3
(item 1 (o)) for further details on the methodological aspects used for BOOST.21
Figure 6: BOOST: Linkages between Organizational Location, Economic Expenditure Type and functions.
Figure 7: BOOST:
21
For further details/links on the methodological aspects and country examples, see
http://web.worldbank.org/WBSITE/EXTERNAL/TOPICS/EXTPUBLICSECTORANDGOVERNANCE/0,,content
MDK:23150652~pagePK:148956~piPK:216618~theSitePK:286305,00.html (BOOST and Government and Public
Sector Management home page.); http://www.opendata.go.ke/ (Kenya’s BOOST, a country example applying
BOOST);
http://data.gov.md/data/?did=107 (Moldova’s BOOST, another country example).

39 | R E V I E W O F D A T A A N D A N A L Y T I C A L I N I T I A T I V E S O N A G R I C U L T U R A L
P U B L I C E X P E N D I T U R E S
Example of How BOOST Can Help Compare Sectoral Budgetary Allocation Changes (in Good and in the
Bad Times – Example of Bulgaria).
The steps involved in engaging with and delivering to Government the BOOST methodology and
country-level package (developed jointly with them) include the following (also applicable if working
with the Ministry of Agriculture):
Final draft version of the database, for clearance of the Government;
A User Manual, and technical supporting documentation on how the database was constructed;
Training sessions on how to construct, maintain and update the database;
Joint training – Policy dialog where Bank and government explore the database, in support of
expenditure analytics; and
Standard Tables for Bank’ PER or for the client, supporting, as example, the annual budget
preparation
Thus far, of the 20 countries which have applied BOOST, they have been applied at the country level,
including agriculture as one of the sectors. The BOOST methodology can be applied to the agriculture
sector (or other sectors).
3.5 Public Accessibility Aspects
(1) Type A: Databases for Public Expenditures and Agricultural Public Expenditures
In summary, the public accessibility aspects highlight the following main patterns and conclusions:
a) Nowadays access to data is one of the most pressing development issues in the development
arena. Information gather by any organ has no or little use unless citizens have access to the
data at an affordable price. To this end, except the AGPE-LAC and GFS databases, all are
publicly and freely accessible either in the form of printout, CD-ROM, Data-Catalog, or online.
While certain data can be retrieved from the IMF’s databank on GFS, it is, in general, available

40 | R E V I E W O F D A T A A N D A N A L Y T I C A L I N I T I A T I V E S O N A G R I C U L T U R A L
P U B L I C E X P E N D I T U R E S
by subscription with a fee. On the other hand, the AGPE-LAC database system is still being
developed, and there is limited accessibility to the database (on request).
b) In support of enhanced transparency and usage, IMF should endeavor to make their data on
public expenditure, in particular, publicly available for free.
c) Currently, the AGPE-LAC database system is still being developed, and there is limited
accessibility to the database (on request), and there is public accessibility to the documentation
(until after the launch stage)
d) Allowing citizens to obtain data by principle alone is nothing by itself unless data initiatives
employ innovative data presentation and extraction techniques to allow easy and optimal usage
of data by their clients. Most of the young databases, in particular SPEED, should endeavor to
employ innovative data presentation and extraction techniques to allow easy and optimal use of
their datasets by users. ASTI and GEA-FAOSTAT, for example, can include a feature that
allows selection of all countries at a sign click to avoid a separate selection of each and every
country, which is unwise and time inefficient. ASTI has also to make sure users can extract data
in a friendly spreadsheet so that they can be able to do further analyses with the data.
e) The initiatives have also to devise different strategies (such as through distribution of published
datasets on different events where potential users but who has not the luxury of internet and IT
facilities may participate, though advertisement about their database) so that their data can be
easily and readily consumed by the large public, researchers and policy makers at different
levels of national authorities (e.g. the Ministries of Agriculture). (It is evident that most
government offices in the developing countries have not at all (or poor) Internet access. Hence,
availing published data for these people worth consideration.)
(2) Type B: Analytical Studies for Agricultural Public Expenditures
In summary, the comparative assessment reveals the following public accessibility aspects:
a) all analytical initiatives endeavor to make publicly available the final report, once it is cleared by
the relevant Government. It appears that the time required to secure Government clearance varies
considerably according to Government and initiative;
b) all of the four initiatives have a sound and comprehensive website, which are all publically
accessible. ReSAKSS has a website with more updated resources on a broad range of agricultural
development topics vis-à-vis the other initiatives;
c) only the World Bank’s RePEAA website requires a sign-in password for accessing the various
training materials, which is accessible only to World Bank staff members.
(3) Type C: Databases for Producer Support Estimates and Related Indicators
The comparative assessment of the public accessibility of the PSE-related initiatives highlights
the following main findings:
a) The PSE for LAC initiative is starting a phase of dissemination which must attract interest from
policy makers and researchers.. MAFAP seems to be transiting in that direction, which is also a feature
of the long standing PSE approach promoted by the OECD;
b) It is important to have databases with solid country assessment reports which are key for policy
analysis and guidance. This practice is taken from the original OECD method and has been improved by
MAFAP, and to a lesser extent by the PSE for LAC;
c) Methodological documents are key for attracting researchers and policy makers to the use of
these data, so efforts in that direction in MAFAP and PSE for LAC are crucial for improving the
relationship with users;

41 | R E V I E W O F D A T A A N D A N A L Y T I C A L I N I T I A T I V E S O N A G R I C U L T U R A L
P U B L I C E X P E N D I T U R E S
d) The use of webpages and websites are very important for the three initiatives, allowing rapid
access by users. In all cases, however, users cannot access the original databases, which are of particular
importance for comparative policy analysis. It is always difficult to download data case-by-case.
(4) Type D: Databases for ODA Flows
a) Both CRS and FAOSTAT provide their databases on ODA activities to the public without any
charge. Currently (at the time of this draft report preparation), the FAOSTAT ODA data is
working to make publicly available their database, which is expected to go live on November,
2011;
b) The CRS does not share other information such as the export credit to the public. OECD has,
therefore, to broaden the coverage of datasets it publicly available;
c) The two initiatives have also to devise different strategies (such as through distribution of
published datasets on different events where potential users but who has not the luxury of
internet and IT facilities may participate, though advertisement about their database) so that
their data can be easily and readily consumed by the large public, researchers and policy
makers at different levels of national authorities (e.g. the Ministries of Agriculture). (It is
evident that most government offices in the developing countries have not at all (or poor)
internet access. Hence, availing such published data for these people worth consideration.
(5) Type E: BOOST: Public Expenditure Software and Database Tool
No expenditure data generated using BOOST is disclosed without governments' consent. At the same
time, making such data publicly available signals a government’s strong commitment to enhanced
transparency. By early 2014, the World Bank expects to launch an Open Budget Portal of available
BOOST databases. The first batch of countries includes 14 BOOST databases.
3.6 Strategies/Mechanisms to Link Data Users with Suppliers
(1) Type A: Databases for Public Expenditures and Agricultural Public Expenditures
In summary, the strategies/mechanisms the eight data initiatives follow to link data users with
suppliers highlights the following main patterns and conclusions:
2. In line with making data accessible to users for all of the initiatives, in general, exert different
efforts to link data users with producers by:
promoting expanded usage of their database through enhanced communication strategies
and a variety of channels, such as by organizing and participating in country and regional
workshops. The aim of these diverse mechanisms is to create awareness about their
database, actively disseminating their data, and encouraging greater use of their database by
target audiences/users; using innovative and effective approaches (such as API, Bulk
download, Query tool, Mobile app and web portal system receiving questions and
suggestions from the public) and keeping an updated, comprehensive and user-friendly
database;
fostering expanded collaboration with strategic groups, international agencies, regional
development banks, donors, and other partners; and;
offering technical assistance and financial support for statistical development; and,
providing training and seminars to target groups/users.

42 | R E V I E W O F D A T A A N D A N A L Y T I C A L I N I T I A T I V E S O N A G R I C U L T U R A L
P U B L I C E X P E N D I T U R E S
3. At the same time, there appears to be some differences in approaches and style, which reflect
some of the unique features of each initiative and the specific stakeholders which have been
targeted by each initiative. While the matured (long standing) data initiatives such as the IMF
and WDI focus on continuing making enhancements to their databases based on improved data
accessibility policies, the young data initiatives employ versatile strategies including organizing
and participating in workshops and disseminate their datasets and through developing
comprehensive website and extensive publications to ensure awareness and optimal use of their
databases.
(2) Type B: Analytical Studies for Agricultural Public Expenditures
The following comparative patterns on linkages emerge from the above initiatives:
a) All of the initiatives include specific and common mechanisms and processes to link
suppliers of the analytical studies with users, mainly through report dissemination workshops
and user friendly websites;
b) Most of the initiatives have targeted both users and suppliers in their dissemination
workshops, including key actors/decision-makers from sectoral Ministries (Agriculture, other
relevant ones) and central Ministries, most notably, Ministry of Finance;
c) There are some relatively minor differences in approaches and styles to fostering linkages
among users and suppliers, which reflect some of the unique features of each initiative, the
sponsoring organization(s), and the specific stakeholders which have been targeted by each
initiative;
d) It appears that all initiatives have had limited systematic follow-up to the large number of
workshops convened, which suggests there is scope for enhancing the linkages in a more
institutionalized and continuous manner, especially according to the budgetary cycle of the
relevant countries. Such enhancements, to the extent they actively engage policy-makers
(especially from the Ministry of Finance), can contribute to institutionalizing processes for
identifying and designing more policy-relevant agricultural expenditure studies, and helping
to create stronger incentives to strengthen expenditure data systems.
(3) Type C: Databases for Producer Support Estimates and Related Indicators
The comparative assessment of the strategies/mechanisms to link data users with suppliers of the
PSE-related initiatives highlights the following main findings:
a) PSE for OECD and emerging economies method of measuring support to agriculture has a long
trajectory of almost three decades and has been tested and analyzed by many researchers and policy
makers. Therefore, it has a strong methodological basis with easy public access to official manuals and
documentation. In this case, there was limited previous discussion with governments or policy
makers/researchers about the more specific goals and needs to be addressed and to engage them actively
in the methodology from the outset, but there was a clear commitment to apply the OECD method as
closely and rigorously as possible in order to take advantage of comparability across countries and
regions; and
b) MAFAP had substantive upfront discussions and orientation with key country-level actors on
goals and methods before applying the OECD method to African countries. This has enabled MAFAP to
secure ownership and to introduce important adaptations and innovations which are useful and attractive
for policy makers and researchers. This participatory approach can be fruitfully taken up by the IDB
initiative in its next phase, now that its pilot phase is being completed, thereby involving policy makers
and researchers in the required adaptation and expansion to LAC agriculture realities.

43 | R E V I E W O F D A T A A N D A N A L Y T I C A L I N I T I A T I V E S O N A G R I C U L T U R A L
P U B L I C E X P E N D I T U R E S
(4) Type D: Databases for ODA Flows
Both data initiative use different strategies to promote the optimal usage of their databases.
a) FAOSTAT conveys workshops with key practitioners and suppliers of expenditure data to
inform and seek further inputs on the Investment Dataset initiative, and inputs to improve its
design, implementation aspects, usefulness, and is seeking ways to strengthen the linkages
among the four components of the Investment database (Credit to Agriculture, Government
Expenditure on Agriculture and Rural Development, Official Development Assistance to
Agriculture, Foreign Direct Investment in Agriculture), as well as to strengthen users and
with suppliers.
b) The OECD endeavors to link CRS data users with suppliers though improving its website,
providing an on-line tutorial, organizing regional and national training workshops and
collaborating with other initiatives. OECD is working to establish a CRS Learning Center
which is facilitating the links between users and suppliers of the CRS database.
(5) Type E: BOOST: Public Expenditure Analytical and Database Tool
BOOST is using various modalities to promote its use by key decision-makers. It is still in its early stages
of application, with 21 countries having applied it for their expenditure reviews (as of end June, 2013).
The participatory approach followed has included, orientation, training and dissemination workshops
involving a large group of stakeholders, including key policy and budget decision-makers. A web-based
application has been developed that allows citizens easily access to public expenditure data. There is a
demonstration video of the BOOST Excel Pivot Table on the BOOST’s home website.22
Twelve
countries have agreed to make their BOOST data available, in support of public expenditure debates and
discussions with civil society organizations in the countries. Currently, four countries – Kenya, Moldova,
Paraguay and Togo have published BOOST data sets on country portals. Annex 3, Table 3 includes an
appendix table which lists the 21 countries which have delivered BOOST datasets/analyses, the countries
which have made their BOOST publicly available, and the countries which are in the pipeline.
3.7 Main Issues and Challenges
(1) Type A: Databases for Public Expenditures and Agricultural Public Expenditures
The scrutiny of different attributes of each and every data initiative under consideration highlights
the following main conclusions regarding the challenges to further enhancing their databases and
making available quality and timely data for their users:
a) It is vivid that compiling, organizing and disseminating sensitive information such as
government expenditure of diversified countries, found at different level of socio-economic,
political and technological development, is confronted with serious challenges and obstacles.
The data initiatives under review, nevertheless, exert efforts to provide as quality data as
possible withstanding all these challenges. The most pressing challenges the emerging and
young data initiatives under review encounters includes, among others:
constraints in resources and capacities, lack of incentives and commitment of countries
(including the crucial Ministries of Finance) to compile and disseminate relevant data at the
desired level of disaggregation, coverage and frequency;
22 http://web.worldbank.org/WBSITE/EXTERNAL/TOPICS/EXTPUBLICSECTORANDGOVERNANCE/0,,contentMDK:231506
52~pagePK:148956~piPK:216618~theSitePK:286305,00.html.

44 | R E V I E W O F D A T A A N D A N A L Y T I C A L I N I T I A T I V E S O N A G R I C U L T U R A L
P U B L I C E X P E N D I T U R E S
lack of awareness among senior government officials on the importance of internationally
comparable data;
uneven quality of underlying source data, including accounting systems, across reporting
countries;
fragmented sources of expenditure data, which sometimes are not reconciled;
difficulty in measuring some indicators (e.g., R&D outputs are notoriously difficult to
measure at the national level and over time);
inadequate and unsustainable funding strategy to implement and sustain the databases of
the initiatives, since many of them are project-based (e.g. ASTI, ReSAKSS, SPEED);
b) All of the data initiatives highlight the challenges of obtaining reliable and disaggregated
agricultural expenditure data at regular bases. This suggest the need for a global coordinated
effort in addressing the problem;
c) These challenges calls for the need for a global coordinated effort and efficient use of
resources. There is a recognition that compiling and disseminating agricultural expenditure data
require continued external funding, while at the same time the need to find improved modalities
for strengthening the active engagement of key agencies and actors in Government (especially
Finance and Agriculture) structures to address data gaps and ensure a timely flow of data series.
The need to enhance the relevance and user-friendliness of databases at national levels (e.g.,
ASTI has been less successful in reaching national-level stakeholders, for a variety of reasons;
(2) Type B: Analytical Studies for Agricultural Public Expenditures
The above initiatives highlight the following similarities and differences involving future challenges:
a) All of the analytical initiatives highlight the challenges of obtaining reliable and disaggregated
agricultural expenditure data to underpin their evidenced-based expenditure studies;
b) While none of the initiatives have addressed frontally the data constraints, several of them are in
the process of developing strategies and actions to address the issues in a next phase (e.g.,
MAFAP, SNAPE, ReSAKSS). This suggest the need for a coordinated approach;
c) All of the analytical initiatives were carried out by external consultants, with concerted efforts
to engage key local counterparts (from MOAs). This reflects the capacity constraints at the
country level, and highlights the challenges to increase the demand, capacities and incentives at
the country level to carry out periodic analytical studies (“lite” approach) to help underpin the
budgetary planning and resource allocation decisions (as part of the budgetary cycle);
d) There is growing recognition of the vital role of the Ministry of Finance to get more actively
engaged in promoting and funding analytical studies to help underpin resource allocations
proposals and decisions (e.g., SNAPE);
e) There is a recognition that the agricultural expenditure studies, especially specialized ones,
require continued external funding, while at the same time the need to find improved modalities
for strengthening the active engagement of key agencies and actors in Government (especially
Finance and Agriculture) in the design and carrying out of such studies (e.g., SNAPE’s efforts
to promote a “lite” approach to the expenditure studies which could support the budgetary
planning cycle, which was done successfully in Tanzania);
f) There is the need for external agencies to coordinate closely in the design and conduct of
analytical studies where they involve the same countries to avoid duplication of efforts and to
foster complementarity and synergies, where there are distinct unique objectives (e.g.,
ReSAKSS to coordinate closely with NEPAD/NPCA; MAFAP and SNAPE held a workshop in
June 2013, to exchange lessons learned);
45 | R E V I E W O F D A T A A N D A N A L Y T I C A L I N I T I A T I V E S O N A G R I C U L T U R A L
P U B L I C E X P E N D I T U R E S
g) External agencies will need to play an important role in supporting analytical studies in
agricultural expenditure work, especially in sharing and promoting the application of sound
methodologies, good practices and cross-country comparisons and lessons, and building local
in-country capacities. At the same, all of the initiatives face challenges in mobilizing the
resources to sustain such efforts.
(3) Type C: Databases for Producer Support Estimates/PSEs and Related Indicators
The comparative assessment of the issues and challenges of coverage of the PSE-related initiatives
highlights the following main findings:
a) The three initiatives face different challenges according to their level of maturity. The PSE for
OECD economies is a long standing system which seeks to expand the number of countries
(especially important emerging economies) in order to be more useful for policy discussions at
multilateral levels, such as the WTO;
b) The PSE for LAC initiative has been effective in opening a dialog on the structure of support
for agriculture in the region, and the need to increase expenditure on General Services, while
addressing high levels of Market Price Support, which create distortions to producers and
increase costs for basic foods, affecting primarily low income consumers. As the use of the PSE
analysis is expanded in the region, it is expected that more effort will be made to use
complementary kinds of tools, such as Value Chain Analysis, and to strengthen the reliability of
governments’ data collection on production, trade and prices to improve the capacity for
agricultural policy analysis in the region;
c) MAFAP is in a crucial stage in which it requires to show its potential, especially in terms of the
interplay between PSE and AGPE analysis, and to advance in the acceptance and use of the
analysis by governments and policy makers in Africa so it can be institutionalized and
supported also by expanded resources in its next phase.
(4) Type D: Databases for ODA Flows
The following issues are highlighted as challenges for both data initiatives under review:
a) Constraints in resources and capacities, lack of incentives and commitment of countries to
compile and disseminate relevant data at the desired level of disaggregation, coverage and
regular basis;
b) There are some donors which do not report their aid data through the CRS system. Only one of
the top ten bilateral donors to Burkina Faso, China Taipei, reports to Aid Management
Platform. The Chinese Taipei does report its aggregate DAC statistics to the DAC Secretariat,
and not the activity level data.
(5) Type E: BOOST: Public Expenditure Software and Database Tool
The main issues/challenges being faced and addressed to varying degrees by the BOOST team (in the
World Bank, working together with country-level counterparts), include:
a) BOOST tool and database does not address underlying data quality issues, and rather tends to
compile existing data, which can be of varying levels of quality and reliability; these issues
would need to be addressed as a separate exercise/process, whereby BOOST often facilitates this

46 | R E V I E W O F D A T A A N D A N A L Y T I C A L I N I T I A T I V E S O N A G R I C U L T U R A L
P U B L I C E X P E N D I T U R E S
process; at the same time, BOOST has developed various quality standards (see website for
further details);
b) Since the BOOST is applied/adapted to each country situation, it is intended more for application
on a country level basis, rather than to compare expenditure analysis/results across countries; to
the extent there is a common budget classification system/format used for different countries, this
will facilitate comparability across countries;
c) BOOST is in the early stages of scaling-up, and efforts to ensure sustainability are prioritized.
This includes training and capacity building activities to government officials to maintain and
sustain the data sets..
3.8 Sustainability Aspects
(1) Type A: Databases for Public Expenditures and Agricultural Public Expenditures
The following sustainability patterns and strategic options emerge from the above 8 data initiatives:
a) Ensuring the sustainability of the data initiatives should be at the core of governments’,
development partners’ and other stakeholders’ tasks and priorities who aspire to see a long-term
positive impact on the development of the agriculture sector in the developing economies, in
particular. As a consequence of the number of challenges the data initiatives face, as outlined in
section (6) above, the young and project-funded initiatives, in particular, have to design and put in
place a sound sustainability strategies;
b) Currently half (four) of the eight data initiatives (ASTI, MAFAP, ReSAKSS and SPEED) in
this category are project-funded, and do not have clear sustainability strategies for their
continuation, except for helping to build initial capacities at the country level (in the case of
ReSAKSS, building capacities at the sub-regional/Regional Economic Commissions and
Continental levels (NEPAD). The other four data initiatives are well established and included in
the core part of the permanent programs of the hosting organizations and have no sustainability
issues, at least, in the short-run;
c) Three of the project-funded data initiatives plan to have follow-up phases to continue and to
expand their on-going activities, including supporting public expenditure analytical studies in
expanded target countries. These initiatives also are focused on SSA countries, and aim to
support the implementation of the CAADP agenda;
d) A close observation of the origin of the four project-funded databases reveals that, except in the
case of SPEED, they all were initiated in response to strong data needs by other emerging
regional and global initiatives. While SPEED was established by internal demand from the
IFPRI’s research focus on and increasing policymaker demand for clearer assessments of public
expenditure-outcome-impact linkages, the ReSAKSS database and its structural and
organizational evolution at the continental, regional and country levels, on the other hand, was
stimulated in response to the implementation requirements of CAADP. The success of CAADP
will, therefore, influence the success of the ReSAKSS database and the entire initiative one way
or the other;
e) The survival of the four project-funded data initiatives still depends on the generous funding of
donors. They need to design a strategy to secure sustainable funding to meet their short-term
and long-term objectives. They have to prove themselves as important sources of information
to different stakeholders to guarantee their sustainability. The ASTI data initiative could be a
good example for this. It was at an ad hoc level at IFPRI until it proves significant
achievements and evolves to a sustainable system of up-to-date data compilation and analysis
in agricultural R&D since 2001, thanks to the generous support of donors;

47 | R E V I E W O F D A T A A N D A N A L Y T I C A L I N I T I A T I V E S O N A G R I C U L T U R A L
P U B L I C E X P E N D I T U R E S
f) It will be important for each data initiative to devise an explicit “exit”/sustainability strategy
regarding the continuation of demand-driven public expenditure data, preferably as part of the
budgetary cycle at the country level and explicit capacity development strategies/interventions
with established organizations at the country, regional and continental levels;
(2) Type B: Analytical Studies for Agricultural Public Expenditures
The following sustainability patterns and strategic options emerge from the above 4 analytical
initiatives:
a) Currently three of the four initiatives are project-funded (MAFAP, ReSAKSS and SNAPE),
and do not have clear exit and sustainability strategies for their continuation, except for
helping to build initial capacities at the country level (and in the case of ReSAKSS, building
capacities at the sub-regional/Regional Economic Commissions and Continental levels
(NEPAD);
b) Three of the four initiatives plan to have follow-up phases to continue and to expand their on-
going activities, including supporting public expenditure analytical studies in expanded target
countries. These initiatives also are focused on SSA countries, and aim to support the
implementation of the CAADP agenda;
c) As the analytical programs move into their expanded phase, there is scope for closer
collaboration and coordination of efforts among the various agencies (FAO, ReSAKSS/IFPRI
and WB), especially with regards to strengthening the disaggregated agricultural public
expenditure data bases which would be of common benefit;
d) It will be important for each initiative to devise an explicit “exit”/sustainability strategy
regarding the continuation of demand-driven public expenditure studies, preferably as part of
the budgetary cycle at the country level and explicit capacity development
strategies/interventions with established organizations at the country, regional and continental
levels; and
e) It is understood that as development partners (DPs) carry out their public expenditure reviews
to help underpin their future assistance strategies, the DPs can build on the relevant public
expenditure work stimulated by the above (and other) analytical initiatives.
(3) Type C: Databases for Producer Support Estimates and Related Indicators
The comparative assessment of the sustainability of the PSE-related initiatives highlights the
following main findings:
a) Sustainability of the PSE methodology will increase in LAC if it is more linked to the demand
which has emerged from the key government entities (Finance, Planning, Agriculture) involved in
agriculture policy for better analytical tools to monitor their performance and make comparisons
across time and in a regional context; and
b) MAFAP may face the highest challenges for sustainability as it is a relatively high cost
initiative23
and its dependence on external financial support. It is very important that this
initiative finds clear support from African governments which see it as a useful tool for policy
analysis and decision making at country and regional level. In the IDB case the challenge is to
23
It is estimated an initial average cost of about US750, 000 per country, although the cost is expected to be
lowered in the next phase, given the first phase had to invest in vital developmental costs to develop the
methodologies and modalities for operation.

48 | R E V I E W O F D A T A A N D A N A L Y T I C A L I N I T I A T I V E S O N A G R I C U L T U R A L
P U B L I C E X P E N D I T U R E S
get support for the initiative from policy makers and researchers so governments start to see it as
important for policy making which can be replicated and used.
(4) Type D: Databases for ODA Flows
Both data initiatives are ongoing data compilation efforts and part of the core functions of their
respective host organizations. Their foundation is well established on strong data demand from
within their organization and other stakeholders outside their organizations. Consequently, there is
no immediate treat or concern on their sustainability.
(5) Type E: BOOST: Public Expenditure Software and Database Tool
With the increased successful use of BOOST to support the World Bank’s operational programs,
this tool is in the process of becoming institutionalized within World Bank operations. Thus far, there are
early signs that counterpart governments appear to be adopting BOOST as their own tool to support
enhanced public expenditure analysis and budgetary allocations decisions. Moldova, Paraguay, Kenya
and Togo can be mentioned as good examples. There is still no instance where BOOST has been used
exclusively to support agricultural public expenditure analyses, hence its sustainability for the sector is
still untested.
It is suggested that practitioners in carrying out public expenditure analysis may wish to adapt the
BOOST software to support public expenditure reviews, while at the same time taking steps to transfer
this tool to country-level counterparts. Given the active engagement in SSA, it would be appear that one
of the above initiatives may wish to include BOOST as one of its data-gathering and analytic tools, to test
the value-added of applying this tool for the agricultural sector (there has been reported successful
applications in the health and education sectors).
3.9 Linkages to and Collaboration with Other Data and Analytical Initiatives
(1) Type A: Databases for Public Expenditures and Agricultural Public Expenditures
The comparison of the eight database initiatives highlights the following conclusions:
a) One of the panaceas for the multifaceted challenges, sustainability issues, provision of reliable
and comprehensive datasets at regular periods, and efficient use of resources is enhancing linkage
and collaboration between and within data initiative. Since all of the initiatives under
consideration are both users and/or suppliers of agricultural expenditure data, there are reasonable
and variable levels of collaboration and inter-dependence across their databases in terms of
sharing resources, data collection and dissemination methodologies, and channels of
dissemination, among others. At the same time, there is scope for further enhancing more direct
and proactive collaboration to improve efficiencies and completeness among the databases, while
recognizing the specific objectives of each initiative. For example:
FAOSTAT’s government expenditure on agriculture database heavily depends and builds on
the format of the standard IMF’s Government Finance Statistics Manual;
SPEED has varying links with several data expenditure initiatives (e.g., GFS, ReSAKSS,
FAOSTAT, especially as SPEED endeavors to disaggregate agriculture expenditure data
below level 2 of COFOG);

49 | R E V I E W O F D A T A A N D A N A L Y T I C A L I N I T I A T I V E S O N A G R I C U L T U R A L
P U B L I C E X P E N D I T U R E S
MAFAP collaboration with the World Bank’s strengthening of Ag. PE Analysis in SSA,
ReSAKSS, AU/NEPAD for monitoring CAADP implementation, especially the budget
allocation target; and
IMF/STA, in collaboration with the World Bank and the OECD, has established an online
database with access to public sector debt statistics; ASTI’s, in particular, relies on a
“network” approach by establishing and cultivating partnerships at national, regional and
international levels for data collection. It establishes “collaborative agreements” with national
research centers
b) Despite the encouraging efforts by some of the data initiatives, there is still a room for further
enhancement of more direct and proactive collaboration to improve efficiencies and completeness
among the databases, while recognizing the specific objectives of each initiative. We have, for
example, shown in the Comparative Analyses part of the methodologies that while ReSAKSS
exaggerates information, SPEED understates the share of PAE information although there is close
collaboration between the two initiatives and among other initiatives where they both draw the
AGPE information. The prevailing data inconsistencies, incompleteness, and difference in the
depth and coverage across the databases of the different initiatives dictate the need for further
collaboration and optimal harnessing of resources.
(2) Type B: Analytical Studies for Agricultural Public Expenditures
The above initiatives demonstrate the following main patterns of similarities and differences in
collaboration linkages:
a) All of the analytical initiatives have endeavored to collaborate with at least one other initiative,
although limited in scope (e.g., informal discussion of data bases; workshop to exchange relevant
challenges and lessons, such as SNAPE and MAFAP identifying strategies for addressing the data
constraint issues). It appears that much of this collaboration takes place on an informal basis, on
the initiative of specific individuals, rather than an institutionalized approach, with some
exceptions (e.g., MAFAP has reached out to the World Bank for systematic collaboration). There
are positive signs that this is gradually changing, whereby each institution is seeking to formalize
greater collaboration where there are common interests in enhancing expenditure data bases and
the carrying out of relevant and demand-driven expenditure studies, while fostering greater
ownership and leadership by the host countries. Accordingly, the key actors from most of the
initiatives recognize that it is preferable that country-level actors (especially Ministries of Finance
and Agriculture) take a more proactive lead in fostering and ensuring coordination and
collaboration among external actors in carrying out expenditure analyses (e.g., trying to avoid
multiple expenditure studies, preferably supported as joint efforts, led by Government or regional
bodies, such as NEPAD);
b) There is expressed interest and commitment by major external agencies (FAO, OECD, WB,
IFPRI, IDB) to strengthen coordination and collaboration mechanisms to improve the scope and
reliability of agricultural expenditure databases, especially to help ensure more disaggregated
expenditure data (below COFOG level 3). It is widely recognized that these improvements are a
“global public good” which would enable enhanced and more in-depth country and cross-country
expenditure analyses, and thereby contribute to enhanced expenditure priorities and allocations.
There seems to be relatively less of a commitment/orientation to jointly carrying out agricultural
expenditure analysis, although there is a clear recognition of the need to better coordinate and to
engage key stakeholders at the country level. At the same time, a positive example of joint work

50 | R E V I E W O F D A T A A N D A N A L Y T I C A L I N I T I A T I V E S O N A G R I C U L T U R A L
P U B L I C E X P E N D I T U R E S
was IFPRI’s (and ReSAKSS’) analytical contributions on agricultural public expenditure analyses
to FAO’s SOFA for 2012, which devoted strong attention to agricultural public and private
investment messages;
c) All of the initiatives (MAFAP, ReSAKSS, SNAPE) are taking concrete steps to enhance the
commitment and capacities of the countries to improve their expenditure databases and to
undertake expenditure analyses (“lite” version/approach) as part of strengthening their budgetary
planning processes and allocation priorities (e.g., organizing toolkit training and study results
dissemination workshops);
d) One initiative (RePEAA) has given impetus to the launching of a regional initiative within the
same WB organization (SNAPE covering selected countries in SSA);
e) Strengthening the linkages among these analytical initiatives along the lines outlined above could
facilitate sound exit and sustainability strategies for demand-driven analytical activities (ref.
section above on sustainability);
f) The analytical initiatives are quite strong in SSA countries, but not in other regions. As
agricultural public expenditures still play an important role in these other regions in contributing
to macro and sectoral objectives, it would be useful for development partners to consider
promoting and supporting in a coordinated manner a program of demand-driven analytical
expenditure studies in these regions, and integrated in the budgetary cycles of the respective
countries.
(3) Type C: Databases for Producer Support Estimates and Related Indicators
The comparative assessment of the linkages to and collaboration with other data initiatives of the
PSE-related initiatives highlights the following main findings:
a) There are clear beneficial opportunities for collaboration among these three initiatives. In the
case of LAC countries, IDB initiative can be highly enriched using some of the adaptations and
expansions of MAFAP to the OECD method in the African context. For example, it would be
important to include for lAC countries the expenditure on agricultural support sectors (rural
health and education, national and regional roads) in a more systematic way. It should be
mentioned also that in LAC countries there is also important heterogeneity, i.e. Central America,
Caribbean, Andean, South Cone, MERCOSUR, Federal countries like Mexico, Argentina and
Brazil. Furthermore, FAOSTAT initiative, classified as type A in this report, will also be an
important reference for collaboration, assuring consistency and comparability in aggregate AGPE
data across time, countries and regions; and
b) It is very important that these three initiatives may be coordinated in order to improve quality and
coverage of data. As these share the same methodological framework it is very useful and
beneficial to share difficulties and strategies for tackling these.
(4) Type D: Databases for ODA Flows
Both initiatives highlighted the following similarities with regard to linkages to and collaboration
with other data initiatives:

51 | R E V I E W O F D A T A A N D A N A L Y T I C A L I N I T I A T I V E S O N A G R I C U L T U R A L
P U B L I C E X P E N D I T U R E S
a) Both data initiatives have collaboration with each other, whereby OECD provided technical
support from the outset; and the Eva’s data methodology and analysis is consistent with
OECD’s principles of classification of purpose codes;
b) FAO is also augmenting the Creditor Reporting System (CRS) data generated by OECD, by
providing more disaggregated data for the agricultural sector; and
c) Both should extend further collaboration and harmonization of ODA data for agriculture
collected by OECD with other donors and initiatives (such as the World Bank’s Aid Flows
database, Development Gateway Aid Data) to ensure consistent reporting of aid data.
(5) Type E: BOOST: Public Expenditure Analytical and Database Tool
BOOST exhibits the following collaboration linkages (which can be transferable to the agricultural
sector, if and when applied)
a) BOOST is being increasingly utilized and integrated as a tool for supporting the conduct of public
expenditure reviews in different regions of the World Bank, and then transferred to participating
Governments;
b) Thus far, BOOST has not been used as a tool for supporting a separate/specialized agricultural
expenditure analysis. Nevertheless, BOOST is being used increasingly for supporting expenditure
reviews in the health and education sectors, and gaining enthusiastic adoption by country
counterparts. See Annex A, Table 3/Appendix 1 for a list of the 21 countries which have applied
the BOOST tool, countries which have made the data publicly available, and those in the pipeline.
3.10 Demand/User Perspectives on Database and Analytical Challenges and Strategies
There are three main groups of “users” who play an important role in demand (or not demanding)
enhanced AGPE data bases and analytical studies: policy makers (e.g., including Ministers and Directors
of Budget/Planning of Ministries of Finance, Agriculture, and other key entities); development partner
managers, and AGPE analysts. It is useful to get a deeper understanding of the nature of “demand” by
these three groups, which can influence the incentives and push to generate more reliable and
disaggregated AGPE data.
First, the feedback obtained during the course of this review suggests that the real need for the
country to have more reliable and disaggregated AGPE are not sufficiently internalized by key actors in
Government (especially from the Ministry of Finance). There is a strong tendency by Ministries of
Finance to focus on tracking expenditure rates (actuals vs. allocations), rather than focusing on outcomes
and “value for money”, which would require disaggregated data. Also, public expenditure reviews are
generally driven by external donors, and the Ministries of Finance (and Ministry of Agriculture) are not
carrying them out as part of their internal budget process. Also, oversight committees, such as Parliament
committees, are not requiring more disaggregated analysis to address value-for-money issues.
Focal persons managing the data and analytical initiatives reviewed in this exercise appear to be
aware of these aspects. Many of the workshops which have been convened to disseminate the findings
from the AGPE and PSE analytical studies have invited key actors from the Ministry of Finance, and
other relevant Ministries, to review the findings and policy implications (e.g., ReSAKSS, MAFAP,
SNAPE, PSE for OEEs). However, it appears that attending workshops is not sufficient, and the

52 | R E V I E W O F D A T A A N D A N A L Y T I C A L I N I T I A T I V E S O N A G R I C U L T U R A L
P U B L I C E X P E N D I T U R E S
persisting data problems highlighted in this review suggest the need for more systematic follow-up and
in-depth discussions to trigger stronger demand, and therefore specific and appropriate actions. Various
practitioners interviewed during this review emphasized the importance of finding effective approaches
and processes to pose the “right questions” and engaging key actors in these discussions and follow up.
Second, there is growing evidence that DP managers are seeking AGPE data and analysis to help
underpin and justify their assistance strategies. Many of them are willing to spend their administrative
resources to support various types of AgPEs, and other relevant analytical work, in partnership with other
DPs.
Third, there are a growing number of AGPE specialists, given the demand for their analytical
skills. They can play an important role in articulating the rationale for better AGPE, including their own
professional incentives for better data. Accordingly, the use of AGPE data for policy purposes is
increasingly important in developing countries. During last three decades, AGPE has varied widely in
many developing countries, 24
as other priorities have occupied the policy agenda, especially expansion in
social sectors. Ministries of Agriculture and agricultural programs in many countries have seen their
budgets shrink, often well beyond what an equilibrated approach would suggest (i.e. looking at the
economic weight of agriculture, which is between 7 and 40 % for most developing countries, whereas
sectors receive less than 2% of budgets, see footnote). This situation seems to be generalized in many
countries and requires rethinking the role of AGPE for agriculture development, for which AGPE data
collection and analysis is crucial.
A first important issue for AGPE data in developing countries is the issue of general importance
and impacts on agricultural growth. Long term aggregated data is of key importance for assessing the
long term impacts and relationship between AGPE and agriculture growth. Given the heterogeneity of
developing countries, this type of analysis must be carried out among categories of countries with
structural similarities (e.g., Caribbean, Central America, Andean, South Cone for LAC countries, etc.),
and large federal countries like Mexico, Argentina and Brazil may need a special treatment. It is clear
that AGPE data is more complex in federal countries, so this is an additional reason for separate analysis.
Having elasticities of agriculture growth/AGPE in developing countries can be an important tool for
convincing Ministry of Finance authorities of the importance of investing more in agriculture at the
aggregate level, especially when its share in total budget is well below the sector economic importance as
seems to be the norm currently across many developing countries. Therefore, having a solid database
with AGPE long-term data (combined with other agricultural and macroeconomic variables) is of clear
usefulness for many developing countries to have estimations of aggregate importance of this type of
expenditure. This appears as an important need to be fulfilled for developing countries in the short term.
Going deeper in this line, AGPE data will be more useful for developing countries as some key
levels of disaggregation are considered for wider efforts of data collection and analysis. A first and basic
distinction in AGPE, which is easy to record and follow, is the relationship between allocated and
expended budget. This ratio is used for a quick assessment of efficiency in government action, and may
be compared with other sectors within the country and with other countries in AGPE databases. This
information is a high importance for most Finance Ministries which use this indicator as an important
measure of sector absorptive capacity, an important consideration for allocating budgets.
Other important distinctions in AGPE which are important for policy purposes in developing
countries are to be able to distinguish between current and capital expenditure. This distinction is
24
In the SIAGRO database of AGPE for LAC countries in Central America and Mexico, the share of agriculture
expenditure in total budgets was and average of 9.4% in the 1980s, of 4.8% in the 1990s, and only of 2.6% in the
2000's. In 2010 and 2011 the share even declined more, to 1.9%.
53 | R E V I E W O F D A T A A N D A N A L Y T I C A L I N I T I A T I V E S O N A G R I C U L T U R A L
P U B L I C E X P E N D I T U R E S
complicated in the overall budget as where to put the line is often difficult. An initial assessment of
current versus capital expenditure in agriculture expenditures in some representative developing countries
during last decade may be useful to see the state of the variable. It is clear that this distinction is of great
importance for policy analysis, as the economic impacts of these are very different. In this issue the main
problem is the treatment of large projects financed by external credit, which are generally considered as
capital investment, whereas important shares go to recurrent expenditures. This discussion may also
allow to assess what are levels of recurrent expenditure which are required for sustaining effective
agriculture services (like extension, sanitary services, technical assistance, training), which have
deteriorated in the midst of budget decline in many developing countries.
The OECD/PSE type of disaggregation of AGPE, although highly demanding, seems one of the
more promising for policy analysis in many developing countries as it allows looking a three instruments:
price protection, investment in private and in public goods in the agriculture sector. This basic distinction
is key for assessing how these tri-dimensional structure may distinctively impact on agriculture growth
and other agriculture-related variables in the short and long run, and also suggest policy reorientations for
achieving better results. Investing in this type of data would be of high return for most developing
countries in which agriculture policies have lost presence in the general policy decisions.
Budget accounting in many developing countries follows the COFOG system and the charts of
account which are harmonized by international institutions. The main challenge for AGPE analysis in
this case is how to account for expenditures which are agriculture-related but are made by other ministries
or sectors, especially when functional lines are overlapping (like having three ministries working with
farmers). The key point here is to have clarity about what agriculture-related expenditure means. The
core is to have production-related expenditures well defined and covered across sectors, and after that, to
be able to identify some agriculture-support activities which may also be considered. However, it is key
to distinguish expenditures which go to supporting farmers in their main economic activity from those
which go to improving or keeping their economic environments. This separation is of importance for a
proper policy discussion in developing countries.
Some recent trends in the management of public budgets in developing countries is the use of
"results-based budgeting" This budget practice links diverse types of expenditures to some specific
outcome or set of outcomes, which will attend some specific need or service to the population. AGPE
data may be also organized by this methodology in countries using this approach, and in this case it will
be important to generate data that allows to assess the impacts of these expenditures not only on the
products but also in broader development outcomes which are pursued. In the agriculture sector this will
allow to see an "expanded" expenditure for achieving development goals, which highlights synergies
among different sectors for getting better results in agriculture.
Another key distinction of importance for developing countries is to have sub-national level expenditures
for analytical purposes. In this case, it is worthwhile to have the disaggregation level in order to link
AGPE data with other development variables which are measured at the same level, like regional growth,
regional poverty reduction or/and change in productivity. If those complementary variables are not
measured at that level it is of little use the disaggregated AGPE data. Having regional data may be very
important for policy purposes, within countries a differentiated effectiveness of AGPE by regions may
help to design better agricultural policies.

54 | R E V I E W O F D A T A A N D A N A L Y T I C A L I N I T I A T I V E S O N A G R I C U L T U R A L
P U B L I C E X P E N D I T U R E S
4. CONCLUSIONS AND STRATEGIC OPTIONS
4.1 Main Conclusions
This review exercise, in close collaboration with focal persons from diverse hosting
organizations, has endeavored to identify and highlight important aspects of fourteen diverse and
complementary data and analytical initiatives. To facilitate the comparative review, it has grouped and
analyzed the initiatives according to five types of initiatives: data bases for public expenditures;
analytical studies of AgPEs; PSEs and related indicators; databases for ODA flows; and software data and
analytical tool. The conclusions are synthesized below according to six strategic cross-cutting areas (with
further details outlined in Chapter 3 and Annexes A and B, according to each type).
(1) Summary of Main Features and Emerging Patterns of the Fourteen Initiatives:
(a) Variation and Rationale of Objectives: the fourteen data and analytical initiatives comprise
five different types and reflect a wide variety of objectives, unique origins, and diverse users.
Some of the initiatives respond to specific policy requirements (e.g., the PSE for OEE is an
instrument which complies with OECD member requirements; ReSAKSS tracks a major
policy target of agricultural public expenditures in SSA, in addition to contributing to other
broader analytical and capacity building objectives). Other initiatives are driven by fulfilling
the mandates of various organizations (GFS for IMF; FAOSTAT for FAO), and/or objectives
to promote enhanced AGPE analysis and expenditure allocations and management (SNAPE,
ReSAKSS, MAFAP). Accordingly, the review has demonstrated that each initiative has its
specific features, undergoes continuous improvements (to varying degrees) in response to a
dynamic context and endeavors to support the perceived priority needs of their generally
multiple stakeholders. All of these aspects tend to justify their role and enhanced
continuation, provided they are being responsive to changing needs and opportunities
(discussed further below);
(b) Variation in Scope and Disaggregation: The database initiatives witnessed difference in the
scope in terms of sectors covered, level of disaggregation, frequency of data and their
updated data bases and analytical studies, and countries, regions and years covered. For
example. Two of the databases (GFS, SPEED) provide public expenditure data on
agriculture only up to the level of COFOG Level 2 classification. MAFAP has defined the
agricultural sector more broadly, and has endeavored to generate more disaggregated data,
but this has required considerable efforts for a small number of countries in SSA. ASTI
focuses its data base on a strategic subsector of agricultural research and development. The
countries covered by the databases vary across the data initiatives. Most of them, including
the long standing GFS database, are not able to generate complete information for a number
of reasons (discussed below), even at COFOG Level 2 or 3. These data gaps, especially the
limited disaggregation of AGPE data according to the main functions, pose considerable
constraints to analysts and policy-makers in terms of not providing adequate information for
better budgetary allocations and accountability;
(c) Geographical Coverage and Focus: While most of the initiatives have a global coverage,
there are two initiatives which focus on SSA (e.g., ReSAKSS and MAFAP); there are two
initiatives which give special focus on the LAC countries (e.g., AGPE for LAC; and PSE for
LAC). Other regions seems be somewhat neglected, aside from the global data initiatives;
(d) Methodological Aspects: The initiatives exhibit a variety of important methodological
differences, and to a lesser extent, similarities, including:
55 | R E V I E W O F D A T A A N D A N A L Y T I C A L I N I T I A T I V E S O N A G R I C U L T U R A L
P U B L I C E X P E N D I T U R E S
narrow and wider definitions of the “agricultural sector”, which has important
implications for data compilation and interventions (e.g., MAFAP taking a wider
definition of the agricultural sector; FAOSTAT restricting itself to the COFOG
definition);
the MAFAP extension to the PSEs expenditure classification system considers support
to non-agricultural sectors which can impact agricultural development (like rural
education, health and roads);
the PSE methodology was pioneered by the OECD, used by PSE for LAC countries and
by MAFAP for SSA, where MAFAP has made relevant adaptations of the PSE
methodology to the African context (further discussed below);
various AGPE analytical initiatives have developed different methodological toolkits,
although there is high level of convergence of key concepts and tools. There seems to be
growing exchange and communications among focal persons of these initiatives to
enhance harmonization of key concepts and tools, especially where it involves many of
the same stakeholders (e.g., SNAPE and MAFAP coordinating their AGPE-supported
studies in SSA, and collaboration to address common AGPE data constraints);
different instruments and approaches to compile standardized AGPE and PSE data. The
PSEs for OE economies compile country level data, to comply with a well-defined
methodology. ReSAKSS compiles AGPE data from existing sources, while filling key
gaps at the country level; GFS and FAOSTAT-GEA use questionnaires for nearly 200
countries, and face challenges to fill gaps and limited level of disaggregation;
most of the initiatives have prepared user documentation and guild manuals and
standards, although the newer initiatives are still preparing the complete methodological
documentation (e.g., PSE for LAC; AGPE for LAC);
(e) Public Accessibility: Two aspects are closely inter-related ---, where greater public
accessibility tends to encourage expanded use, although there are other factors influencing
usage. Most of the initiatives are publicly available, although some of them are limited for
various reasons (e.g., AGPE for LAC has limited accessibility; PSE for LAC is still in the
development stages, before being fully launched; PSE for OEE has a comprehensive data
base of PSE and other indicators easily accessible on its website). Some of the databases
require subscription and a user fee, which may limited wider usage (e.g., GFS), while
recognizing some of the arguments in favor of a user fee;
(f) Linkages between Users and Suppliers: Generally all of the initiatives show a clear
awareness and varied strategies to promote stronger usage by its target stakeholders, although
there appear to be varied levels of effort and effectiveness. For example, most of the
initiatives use various ways to promote expanded usage of their database and analytical
outputs through their websites (the most common method), enhanced communication
strategies and a variety of channels, such as by organizing and participating in country and
regional workshops (including “piggybacking” on other major events), trainings and
seminars;
(2) Innovative Aspects and Improvements: Some of the initiatives demonstrate innovative
features, especially in terms of methodological and dissemination aspects which can provide
positive lessons for other initiatives. For example:
a) The MAFAP initiative in Africa is a good example of a solid methodological design applied
to a specific reality with important challenges. MAFAP used the well established PSE
approach developed by OECD, with appropriate adaptation to the African context: measuring

56 | R E V I E W O F D A T A A N D A N A L Y T I C A L I N I T I A T I V E S O N A G R I C U L T U R A L
P U B L I C E X P E N D I T U R E S
MPS type of "development gap" indicators due to market failures and relating it to public
investment or disinvestment on public goods which may ameliorate these market failures. For
example, if the development gap indicator points out to severe market distortions due to lack
of post-harvest infrastructure, and GSSE shows none or very little investment in these key
investments, policy makers can reorient resources in order to reduce the negative impact of
this market failure. The LAC experience so far led by IDB has made important progress in
applying the PSE method to address consistency in collection and analysis of data and allow
comparability over time within country and across the region.
b) Data compiled by the CRS initiative are collected by CRS++, a reporting format, which
consists of a number of integrity or reliability checks within the CRS. This tool is designed to
help reporters avoid inconsistencies. The continued methodological inter-dependence and
collaboration between the two data initiatives (FAOSTAT-EEA and CRS) is vital to insure
comparable and reliable data on ODA and OOF;
c) CRS is devising an innovative dissemination strategy through it CRS Training Center. In
addition, CRS is improving its website, providing an on-line tutorial, organizing regional and
national trainings, workshops and collaborating with other initiatives, which are some of the
strategies the CRS data initiatives employ to establish the links between users and suppliers
of the CRS;
d) Most of the data and analytical initiatives demonstrated on-going efforts to further improve
their methodologies and relevance of their outputs for their targeted stakeholders, and also to
strengthen their complementarity with other initiatives. For example, at this time, CRS is
making enhancements to their user manual. FAOSTAT-EAA is also reviewing various ways
to improve the scope and user of its database. ASTI and SPEED have developed various
enhancements in terms of scope of country coverage and approaches to filling data gaps and
more effective use of its data (e.g., for example, ASTI is giving stronger attention for greater
usage of information at the national level through an enhanced dissemination strategy).
MAFAP convened a workshop with stakeholders to distill key lessons as inputs for a
proposed next phase. SNAPE coordinator is taking proactive role to address the underlying
reasons for the data challenges which most of the AGPE country study team faced, which
could be addressed in a possible next phase of the AGPE-supported studies.
(3) Complementarities and Synergies between and within Initiatives: Several initiatives
demonstrate that there are emerging complementarities and synergies of varying degrees
between data and analytical initiatives which suggest the potential for being further
stimulated.
a) Figure 1 illustrates the important complementarities between the different types of data and
analytical initiatives, which if well-coordinated and integrated in the budgetary cycle of
developing countries (by each initiative and also between DAI initiatives, where relevant),
offer the potential for enhanced budgetary outcomes and impacts from the agricultural public
expenditures (coupled with other appropriate policy reforms). The greater integration of the
relevant initiative to enhance the actual budgetary planning and implementation cycle will
enhance the value-added of the initiative(s).
b) All of the initiatives which were reviewed are both users and/or suppliers of agricultural
expenditure data, and to a lesser extent, of the PSE indicators (at least for the countries being
covered). The study team was able to identify variable levels of collaboration and inter-
dependence across databases and analytical studies in terms of sharing resources, data
collection methodologies, and dissemination strategies. For example:
FAOSTAT’s government expenditure on agriculture database heavily depends and builds
on the format of the internationally agreed standards for compiling and reporting fiscal
statistics as outlined in the IMF’s Government Finance Statistics Manual;

57 | R E V I E W O F D A T A A N D A N A L Y T I C A L I N I T I A T I V E S O N A G R I C U L T U R A L
P U B L I C E X P E N D I T U R E S
SPEED has varying links with several data expenditure initiatives (e.g., GFS, ReSAKSS,
FAOSTAT-GEA), especially as SPEED endeavors to disaggregate agriculture
expenditure data below level 2 of COFOG). Its strong collaboration with ReSAKSS in
SSA (given that ReSAKSS plays a role in monitoring expenditure data in SSA, and
supports SPEED in terms of data gaps and validation) can be mention as an example.
MAFAP collaboration with the SNAPE in exchanging methodological approaches and
country results, and addressing common country-level data challenges in SSA;
ReSAKSS, AU/NEPAD are working together to track CAADP implementation,
especially the budget allocation target of 10%);
FAO-ODA database draws most of its information from the comprehensive CRS
database and is currently reviewing various aspects for further improvements and
complementarities, expected later in 2013.
c) PSE analysis shows high synergy with APE analysis, especially for policy purposes and
helping to ensure an efficient use of total public resources, combined with sound agricultural
policies. PSE incorporates most APEs as an important part of measuring support for
agriculture in the from of “private” and “public goods”. Contrasting this support with other
policy-induced market price distortions allows the analyst to monitor the most important
policy instruments for the agricultural sector of countries or regions. Thus a PSE-APE
approach allows going from database type to analytical type of initiatives, which are more
powerful for policy making and implementation. Recent innovations in the PSE estimation,
such as those applied by MAFAP, suggest a key relationship between PSE and APE analyses,
as the distortions of development gaps may be also addressed by agriculture public
expenditures, for instance. Some specific issues required by APE analysis can be
incorporated into the PSE analysis without altering the basic method, like disaggregating of
allocated versus expended budget; giving special attention to ODA data, and measuring
administrative costs. These variables are important from the APE perspective and enrich the
policy analysis. Also, both enhanced PSE and APE analysis require more disaggregated
public expenditure data, based on common and clear definition and classification system;
d) The MAFAP initiative in Africa is a good example of a solid methodological design applied
to a specific reality with important challenges. The PSE for LAC experience has made
important progress in applying the PSE method to address consistency in collection and
analysis of data and allow comparability over time within country and across the region; and
e) APE data can be improved basically in term of better classification and a better use of
definitions in specific situations (for instance, how to classify sanitary services expenditures
between private services in PSE or collective services in GSSE). Challenges for improving
PSE data in the MPS component are more daunting as these require knowledge of market
functioning and the extent of market failures and market distortions.
(4) Emerging Challenges: The review of the initiatives have highlighted a wide range of
challenges, especially for each of them to achieve their stated institutional or program
objectives. Either from an analytical or policy maker perspective, the high level of
aggregation of AGPE data poses a serious constraint to assess AGPE allocation issues, given
that different spending has variable effects on agricultural performance (see further
discussion below). The following section highlights some of the more important common
challenges, whose severity varies according to country. These challenges adversely affects
the ability of analysts to carry out sound AGPE studies, calculation of robust PSEs, and also
to conduct cross-country comparisons, as inputs for better budgetary allocation priority-
setting and decisions (with further details presented in Chapter 3 and Annexes A and B):

58 | R E V I E W O F D A T A A N D A N A L Y T I C A L I N I T I A T I V E S O N A G R I C U L T U R A L
P U B L I C E X P E N D I T U R E S
a) resources and capacity constraints (at various levels, including Ministry of Finance,
Ministry of Agriculture, National Statistical Offices);
b) unclear definition of the “agricultural sector”, coupled with multiple ministries involved in
the agriculture sector, which also complicates the scope of applying the COFOG definition at
various levels;
c) lack of incentives and commitment of countries (including the crucial Ministries of
Finance, Agriculture, etc.) to compile and disseminate relevant data at the desired level of
disaggregation, coverage and frequency;
d) uneven quality of underlying source data, including accounting systems, sub national data,
off-budget expenditures (e.g., development partner grant funds), and across reporting
countries;
e) fragmented sources of expenditure data, which sometimes are not reconciled (especially
between allocations and actual expenditures);
f) with regards to the two ODA databases, there is the challenge of getting reporting countries
and donors to follow a common classification system of ODA flows;
g) deficient coding systems and capacities to facilitate classification and aggregation of
AGPE data in a systematic manner, as part of a bigger challenge --- deficient Ministry of
Finance information systems and reporting, which, if effectively addressed, can also support
more effective budgetary planning and execution processes (for example, along the lines
illustrated in Figure 1);
h) There are important sustainability challenges faced by most initiatives. Currently almost
half (six) of the fourteen data and analytical initiatives (ASTI, BOOST, MAFAP, ReSAKSS,
SPEED and SNAPE) are project-funded, and do not have clear sustainability strategies for
their continuation, except for helping to build initial capacities at the country level (in the
case of ReSAKSS, building capacities at the sub-regional/Regional Economic Commissions
and Continental levels (NEPAD). The other eight data initiatives are well established and are
included in the core part of the permanent programs of the hosting organizations, but also
face varying degrees of challenges to mobilizing sufficient resources to manage the databases
to the desired standard, as well as needed improvements.
(5) Demand Aspects and Some Implications: An important aspect of addressing the underlying
disincentive issues highlighted above, which constrains availability of more disaggregated
data and full use of existing AGPE data, is connected to better understanding the demand
aspects for enhanced data and analytical programs to support enhanced AGPE analysis. There
seems to be greater attention on the “supply” side, and insufficient attention to addressing the
demand aspects. The following points unpack and highlight some these demand aspects
which arose during the course of conducting this review, reflecting perspectives and inputs
from various actors (representing Ministry of Finance, AGPE researchers, development
practitioners from various organizations).

59 | R E V I E W O F D A T A A N D A N A L Y T I C A L I N I T I A T I V E S O N A G R I C U L T U R A L
P U B L I C E X P E N D I T U R E S
a) Response to Demand from Key Users: It is vital that the data and analytical initiatives
(which are proxies for the “supply” side) are responding to and promoting the demand from
policy makers (especially from Ministries of Finance and Parliamentarians), development
partner managers who influence aid allocations. The teams which manage all of the
initiatives appeared to be generally aware of the importance of devising appropriate and
effective strategies/mechanisms/interventions to better link the suppliers with the users (with
the latter referring to Government officials who influence resource allocation decisions. The
most common approach used by most of the initiatives was to develop and disseminate
information through relevant websites, and to ensure they are user friendly. Not all websites
were found to be fully satisfactory. (For example, two of the initiatives – ASTI and FAO-
GEA -- can introduce a simple feature that would allow selection of all countries at a single
click to avoid a separate selection of each country, which is time consuming; ensuring that
data can be extracted in a proper spreadsheet.) There is also scope for diversifying the
approaches to strengthen ownership and to reach the key actors which could help contribute
to a deeper understanding of why better and more disaggregated expenditure data is needed
for the country’s decision-makers, in order to affect expenditure planning and implementation
(and not driven only by a questionnaire asking for more detailed expenditure data);
b) Expenditure Information/Reporting Systems: Among AgPE practitioners there is a growing
recognition that some of the above mentioned constraints are related to weak expenditure
information and reporting systems typically driven and managed by the Ministry of Finance.
Some of the underlying reasons include:
Lack of adequate understanding by key Ministry of Finance actors why disaggregated
AgPE data (and others sectors, too) is important for their own management and
accountability requirements (aside from the accounting aspects). Accordingly, this
entrenched orientation and patterns contribute to a lack of Ministries of Finance not
demanding such disaggregated data and supporting analysis from the sectoral ministries
and the Government reporting system. At the same time, most Directors of Budget (of
Ministries of Finance) would recognize that this data can be used to better underpin MOA
budget proposals. Accordingly, there is a need to intensify the increased awareness of
Ministries of Finance of the value-added of greater disaggregated data (and using the
agricultural sector as an “entry” point, since they would need to be convinced of the need
for covering other sectors too).
Off-budget development aid, not captured by the Ministry of Finance;
Weak capacities of budget data management staff
c) Internalization of the Demand Aspects: Some of the key aspects highlighted in Chapter 3
(Section J) regarding the rationale for better AGPE and PSE data and related analysis to help
underpin budget monitoring and formulation (medium term and annual basis) are not
sufficiently internalized by key actors in Government (especially from the Ministry of
Finance, which would be both a supplier and user of the disaggregated data). 25
There is a
strong tendency by Ministries of Finance to focus on tracking expenditure rates (actuals vs.
25 Some of the key points outlined in this subsection were shared by Nana Boateng (staff member for the CABRI). For example,
the need to convey clear messages (in non-technical language) to key decision-makers that long term disaggregated AGPE data is
of key importance for assessing: the long term impacts and relationship between AGPE and agriculture growth, overall growth,
and poverty reduction; expenditure priorities in terms of relative returns to different types of AGPE spending; for tracking
differences between budgetary allocations and actual spending in terms of the composition of spending and spending capacities
of implementing agencies; finding a better balance between recurrent and capital spending for different types of public services
and goods; how different AGPE instruments (measured through PSEs and detailed classification) can impact important policy
variables; to enable outcome-based budgeting, to enhance incentives for improved design and implementation of AgPEs;
strategies and interventions to reduce regional disparities.

60 | R E V I E W O F D A T A A N D A N A L Y T I C A L I N I T I A T I V E S O N A G R I C U L T U R A L
P U B L I C E X P E N D I T U R E S
allocations), rather than focusing on outcomes and “value for money”, which would require
disaggregated data. Also, public expenditure reviews are generally driven by external donors,
and the Ministries of Finance (and Ministry of Agriculture) are not carrying them out as part
of their internal budget process. The main issue here is how to institutionalize an internal
demand for APE analysis in which local authorities and local users are the demanders, and
the supply is also provided by local actors with support from external sources. Also,
oversight committees, such as Parliament committees, are not requiring more disaggregated
analysis to address value-for-money issues. Focal persons managing the data and analytical
initiatives reviewed in this exercise appear to be aware of these aspects and patterns. Many of
the AGPE workshops, generally externally driven, which have been convened to disseminate
the findings from the AGPE and PSE analytical studies have invited key actors from the
Ministry of Finance, and other relevant Ministries, to review the findings and policy
implications (e.g., ReSAKSS, MAFAP, SNAPE, PSE for OEEs). However, it appears that
attending workshops is not sufficient, and the persisting data problems highlighted in this
review suggest the need for more systematic follow-up and in-depth discussions to trigger
specific and appropriate actions. Various practitioners interviewed during this review
emphasized the importance of finding effective approaches and processes to pose the “right
questions” and engaging key actors in these discussions and follow up.
(6) Nature and Extent of Intra and Inter-Agency Collaboration: This review identified the general
nature and type of intra and inter-agency collaboration in carrying out the fourteen data and
analytical initiatives. Overall, the focal teams from the various initiatives demonstrated a
variety of positive actions to promote enhanced collaboration, within their own organization
and with other relevant agencies (see item (2) above which highlights positive
complementarities, Chapter 3, and Annexes A and B for further details and examples).
Notwithstanding these positive actions, the following points highlight potential scope for
enhancing the effectiveness and results of more strategic and systematic collaboration:
First, the nature and extent of collaboration and enhanced quality standards varied. Most of
the collaboration occurred as a result of individual initiative, rather than being mandated or
institutionalized. The notable exception was the OECD which has various internal rigorous
processes and mechanisms across its different departments for reviewing and validating PSE
methodological issues, estimates and policy implications. While the IDB has been working
on the PSEs for LAC for some years, it was only recently that it reached out to the OECD for
technical exchange and advice, especially now that the OECD will be including four LAC
countries in its PSE estimates and dialogue.
Second, there does not exist any type of technical working group among the various agencies
to review common concerns regarding methodological issues and developments, work plans
which could include inter-agency collaboration, and proposals to address some of the
underlying issues highlighted in this report. Even within the same institution, the exchange of
ideas and practices tends to be the results of individual initiatives, rather than being facilitated
by intra-agency working groups (for example, in the World Bank, there was some informal
discussion of establishing a public expenditure working group to discuss good practices and
strategic issues of broader interest to both macroeconomists and sector economists).
Third, the Workshop convened by the OECD and IFPRI/PIM highlighted some of these
issues and the need for more systematic inter-agency collaboration in addressing data base
issues for enhanced policy measurement and tracking. This review was triggered by some of
the next steps highlighted in this conference.

61 | R E V I E W O F D A T A A N D A N A L Y T I C A L I N I T I A T I V E S O N A G R I C U L T U R A L
P U B L I C E X P E N D I T U R E S
4.2 Strategic Options
Based on the results from the review and the above cross-cutting conclusions, this review has
identified six strategic options which offer the potential for addressing some of the more critical
constraints. These strategic options are intended to better inform and facilitate discussion and consensus
among target audiences on the most appropriate options to pursue. This target audience includes the
practitioners who participated in the Agricultural Policy Measurement workshop held in June 2013, and
other practitioners who have participated in this review exercise and expressed keen interest to get a copy
of the report and to get engaged in a broader and deeper discussion with other practitioners and decision-
makers. The overarching strategy warrants an integrated and sequenced approach to reaching consensus
on the main strategy elements and supporting action plan(s) which can address the main issues
highlighted in this report.
The proposed six strategy options comprise a suggested framework (covering both supply and
demand aspects) which could contribute to enhancing the role and effectiveness of data and analytical
initiatives for achieving enhanced budgetary outcomes and impacts of existing and increased AgPEs (in
line with the underlying logic of Figure 1). The substantive details and rationale which underpin these
strategic elements are highlighted Chapter 3 and the above section on conclusions. It should be noted that
the strategic options cover specific recommendations for individual DAIs covered in this review, and
some of the recommendations have broader implications for the DAI community as a whole.
Figure 8 below illustrates various strategic options amongst key institutional actors and involving
supply and demand aspects and backward and forward linkages. Some of the strategic options which the
data and analytical initiatives and the following sections address include:
Strengthening country-level expenditure reporting systems—What ongoing support is already
being provided? How can it be improved? Strengthening agriculture-specific versus general
reporting systems?
Analytical capacity support for ‘frontline’ users of country-level data; and
Building demand for cross-country databases on the part of country-level policy analysts and
decision makers
Figure 8: Strategic Options: Strengthening “Backward and Forward Linkages”

62 | R E V I E W O F D A T A A N D A N A L Y T I C A L I N I T I A T I V E S O N A G R I C U L T U R A L
P U B L I C E X P E N D I T U R E S
1) Strategic Options for Enhanced AgPE Data Bases
There are eight AGPE databases which are being implemented. While the focal teams of each of
them are carrying sound improvements to better meet their institutional objectives, it could be useful for
each team to consider the following aspects, customized to each data initiative:
a) review the COFOG guidelines with respect to the agriculture sector, including a review and updated
definition of the “agricultural sector”, considering both a narrow and wide definition, which can serve as a
clear international standard for developing countries. It would be important to draw on relevant technical
discussions, for example, which have taken place as part of the implementation of the CAADP agenda for
SSA. It is envisaged that this review may results in refinements of the existing classification of functions
for the agricultural sector, rather than substantial changes;
b) explore the benefits of an enhanced integrated global AGPE database, which will seek to generate
more systematically AGPE data disaggregated beyond level 3 of COFOG, in a phased manner, with
global coverage and annual updating. FAOSTAT-GEA would seem to offer a good foundation to build
upon, given that it has a wide coverage of countries (134 countries), and is consistent with and
complementary to the GFS framework, which is well established and accepted by developing countries.
This enhancement should build on on-going improvements being carried out by FAOSTAT, including the
recent introduction of the breakdown of capital and recurrent expenditures for level 3 AGPE data. It is
recognized that FAOSTAT would need to be supported with additional resources to support the phased
implementation of this enhancement, which should include other well identified parallel supporting
actions to take place at the country level (e.g., actions to promote stronger demand by key actors at the
country level, especially the Ministry of Finance, well defined expenditure coding systems, enhanced
expenditure information and reporting systems in the Ministry of Finance; enhanced budgetary proposals
by Ministry of Agriculture, which should be underpinned with better expenditure analysis of past
performance and relative returns from different spending subsectors/functions);
c) encourage the relevant data bases to update as needed their methodological user manuals which should
be made accessible to the public to encourage and greater and effective use of the AgPE database. Some
of the databases are currently completing their updating (e.g., SPEED, ASTI, GFS, FAOSTAT, AGPE for
LAC);
d) One possible way to curve the consequences of data inconsistency brought about by the difference in
methodology, in particular, is to put in place a more transparent and flexible system in order to better
track public resources allocation enabling customized and consistent aggregation, promote open data
access and provide information in a timely manner. This system may include developing a well-defined
expenditure coding system by adopting the chart of accounts, which organizes spending data according to
numeric, alphabetic or a combination of both codes, together with a flexible aggregation model or
program. (As discussed in the note by Diao and Yu, IFPRI, 2013). Such an enhanced coding system could
allow more flexibility to aggregate data, in addition to easing explicit mapping relationship between the
countries government finance statistics system and COFOG or any other aggregation classification
becomes explicit. This makes sure that the aggregate data is no longer a black-box that is unlikely to be
consistent across countries and hence difficult for comparison (Diao and Yu, 2013). It would appear that
these improvements would be more relevant for more detailed data at the country level, as opposed to
cross-country dataset (since they are so aggregated that the lack of codes is not the problem).
e) Enhance the public accessibility to the AGPE databases through ensuring user-friendly and efficient
websites and tools (with built-in tutorials), and ensuring easy subscription and free of charge (and
assumes that the data bases have adequate and sustainable funding) (for example, currently, the GFS
requires a paid subscription to access their data base).

63 | R E V I E W O F D A T A A N D A N A L Y T I C A L I N I T I A T I V E S O N A G R I C U L T U R A L
P U B L I C E X P E N D I T U R E S
2) Enhanced Analytical Programs to be Driven by Ministries of Finance and Greater Focus on
Expenditure Efficiencies and Outcomes (for AgPEs and PSE and other Indicators).26
a) Most of the AGPE analytical studies are funded by an external project. While the analytical initiatives
have sought to “involve” Ministries of Finance, it would appear that different approaches are needed to
secure their stronger ownership, toward the aim of getting them to institutionalize AgPEs (and other
sectoral reviews) as a requirement for the budgetary process. The growing trend toward program-based
budgeting may provide an opportunity to strengthen the focus toward results and AgPEs as key inputs,
which would demand more disaggregated. Therefore, there is a need for each of these analytical
initiatives to develop an explicit “engagement” strategy from the outset, supported by well-designed
capacity building and “exit” strategies to enhance the chances that the relevant countries (led by
Ministries of Finance) continue to carry out periodic and well-designed AGPE studies (preferably as an
input to their medium term and annual expenditure proposals). While some of these analytical initiatives
included a training program (e.g., MAFAP, SNAPE), it would appear that larger efforts and resources are
needed to reach a “critical mass” of government ownership and capacity for the countries to sustain
appropriately designed studies. There is also a need to devise “lite” methodologies which are not costly
and which are more realistic with existing and likely analytical in-country capacities. The AGPE toolkit
used and promoted by SNAPE can be further disseminated to support the exit and sustainability strategy,
including a more active program of “training-the-trainers”, using existing regional and country level
institutions (e.g., SSA has 8 RECs which could potentially play a more active role; there are regional
research and/or training institutes with existing capacities in different regions, which can be identified and
engaged in these tools);
b) As a specific example, the program of AgPEs funded and supported by SNAPE is coming to a close
by the end of June, 2014. The implementation experience demonstrated a high level of country demand
for these AgPEs, together with the training support provided (which was insufficient, due to limited
resources). There are plans to formulate a second phase proposal. It would be useful for the proposal to
reflect the relevant lessons learned from the current phase, including the training component, the country
level studies (basic and specialized AgPE studies, and data constraints, lessons and strategies). 27
c) MAFAP has been successfully completed, and there are steps being take to formulate a second and
scaled-up phase, to be launched in mid-2014. Similar to SNAPE, MAFAP included an integrated
approach, providing capacity development coupled, with AGPE and PSE analytical studies. In mid-2013,
the MAFAP team convened a workshop with stakeholders to review the main lessons learned. These
lessons are being incorporated in the design formulation stage of the next stage. MAFAP has developed
various methodological notes for the AGPE, PSE/price distortion analysis and policy alignment studies.
While there was a relatively high cost to carry out each country level program of activities, 28
the next
phase will seek to lower these costs, while it embarks on a larger number of countries, including SSA and
26
The following section uses specific DAIs covered in this review as examples. 27
For example, SNAPE and ReSAKSS practitioners/team members collaborated in preparing a discussion note
which highlighted some of the main AGPE data difficulties and some “observations” on strategic responses to these
data issues (January, 2013). 28
Costs per country are estimated at around US$ 500,000 per country for a five-year period. During phase I, the
costs per country were approximately US$ 350,000 for a four-year period, on average. A significant share of the
MAFAP budget also covered development of the methodology as well as global tasks at the secretariat level--
outreach, database development, development of capacity development material, formulation of methodology
guidelines, etc-- which cannot be allocated to individual countries but are to be considered contributions to a global
public good produced by FAO.
64 | R E V I E W O F D A T A A N D A N A L Y T I C A L I N I T I A T I V E S O N A G R I C U L T U R A L
P U B L I C E X P E N D I T U R E S
other regions. It might be useful for the MAFAP preparation team to convene a team of diverse peer
reviewers to provide independent review and constructive feedback during the formulation and launch
phase of MAFAP. This can help add value to building on the relevant experiences and lessons from the
first phase.
d) ReSAKSS is making significant contributions to the tracking of the CAADP agenda, at three levels, as
well as to carrying out analytical studies involving AgPEs in numerous SSA countries. The ATOR for
2012 included some important empirical contributions to the tracking of the expenditure target of 10% of
total budgetary allocations. It would be useful for the ReSAKSS team to update its work plan to ensure it
reflects some of the more relevant recommendations arising from this review, as well as incorporating an
action plan to support recent initiatives, including support to the implementation of the CAADP results
frameworks (at continental, regional and country levels). In November, 2013, ReSAKSS convened a
continental workshop to review the ReSAKSS achievements and priority work program. The stakeholder
feedback provides valuable inputs for enabling ReSAKSS to prioritize its portfolio of activities involving
strengthening the AGPE database for SSA, capacity development at various levels, the strengthening of
its network of regional and country level nodes, and the prioritization of analytical studies, which would
include AgPEs. This work plan could also strengthen its partnerships with key actors, especially
including AU, NEPAD and the RECs.
e) The Trade and Agriculture team of the OECD has formulated an agenda for enhancing its PSE and
related indicators agenda, which includes an increase in the number of developing countries which will
require assistance to carry out the required country assessment reports, PSE estimates (e.g., Columbia,
Vietnam, others). This agenda includes enhancing its expenditure classification system, the GSSE
expenditures.
f) The PSE for LAC initiative is making important progress in completing the scope of PSE estimates for
eventually all LAC countries, with updated data to the latest year possible (2012), based on the OECD
methodology. IDB is planning to conduct regional specific workshops. Regional entities such as CARDI,
RUTA, CIAT, are very interested in supporting the dissemination of the PSE studies and database. IDB
has been conducting national workshops and PSE presentation to the governments (Ministries of Finance
and Agriculture) and public agencies at national level each year. IDB is seeking additional resources to
support these needed improvements.
3) Capacity Development Strategies
a) Many of the key issues and challenges highlighted in this report reflect the need to strengthen
institutional and technical capacities at various levels involving: the construction and management of
enhanced AGPE databases; carrying out analytical studies using sound tools of AGPE and PSE analyses;
using effective approaches to dissemination of the results, coupled with implementation support, on a
demand basis. While most of the data and analytical initiatives include a portion of capacity development
resources, there is a need to:
Assess the adequacy of the resources provided (in most cases, it has not been sufficient);
for each initiative to revisit the identification of priority and results-focused capacity
development requirements, and to prepare sound proposals to strengthen capacities.
include strategies for strengthening the demand for improved and more disaggregated AGPE
data by key country level actors, including the promotion of requiring periodic AGPE reviews as
inputs for the budgetary process (see above). This would complement the proposed supply side
enhancements cited under (1) (e.g., the proposed expansion of the FAOSTAT-GAE activities
for generating more disaggregated data, below COFOG Level 3);
65 | R E V I E W O F D A T A A N D A N A L Y T I C A L I N I T I A T I V E S O N A G R I C U L T U R A L
P U B L I C E X P E N D I T U R E S
b) There is an urgent need to formulate a strategy and phased plan for improving the Ministry of Finance
information and reporting systems and processes, coupled with stronger country demand for AgPEs as
part of the budgetary process (see below), such that these “drivers” would lead to a stronger internal
demand for disaggregated AGPE data. These latter aspects could include: adding information coding
capacity to Ministry of Finance budget systems; training approaches/modules for training budget data
management staff, to handle an improved well defined expenditure coding system, with a flexible
aggregation model or program which will allow public expenditure data analysis to be routinely
conducted in developing countries;
c) A complementary strategy could be oriented to researchers and practitioners who may use data more
intensively if proper incentives are present. It would be of high value to have competitive funds for
AGPE analysis using the available data, and seeking for potential interaction among databases and
approaches. This may be an important source of future improvements in data collection, organization and
collaboration.
4) Intra-Agency and Inter-Agency Collaboration
The above conclusions section highlighted some of the current constraints on the ad-hoc nature and extent
of intra-and inter-agency collaboration to address the various challenges identified in this review. Also,
all of the above strategic options will require some form of closer and more effective intra and inter-
agency coordination, to seek consensus on many of the proposals (and other proposals not covered here),
to provide technical guidance as a good practice group of AGPE and PSE practitioners, and to help
mobilize additional resources to support the priority interventions which comprise a “global public good”
in AGPE. There are other major themes, such as climate change, which have benefitted from inter-
agency community of practice to help foster enhanced collaboration and sharing of good practices, and
possible joint efforts. Accordingly, it is proposed that:
a) each agency covered in this review consider participating in a proposed “community of practice”
working group for AGPE, drawing on relevant staff members within the organization (combination of
senior and junior staff). The participating organizations should seek to select a “focal person” for this
working group, which in turn should formulate an agreed role and framework work plan; 29
b) the various agencies covered in this review (6), the initiatives (14), in addition to several other relevant
entities (such as RUTA for Central America, ECLAC for South America, CABRI for SSA), should seek
to establish an inter-agency AGPE practice working group, with the focal person from each entity and
initiative being the representative for such a global working group. The main mandate/role would be to:
(i) review and exchange information on on-going and proposed initiatives in AGPE and PSE data and
analytical work; (ii) to review and provide practitioner feedback on important methodological proposals
on AGPE and PSE database and analytical aspects; and (iii) to support priority initiatives with global
significance. The coordination could be conducted on a rotating basis. It is understood that most of the
exchanges would take place virtually, and periodically (say, once every two years), there could be a
workshop to review substantive matters and proposals. One item on the agenda would be review specific
proposals to enhance the AGPE global public good, and to reach consensus on some priority initiatives to
be supported by this inter-agency working group (e.g., such as the above proposal to expand the scope of
29
Possible first step outputs from the coordination of the group could include: (i) Better and clearer data
documentation across DAIs; (ii) More easily accessible data (perhaps through joint website linking to datasets and
studies in respective organisations); (iii) Easily digestible comparison of commonalities and differences in the
methodologies of the DAIs. In addition, given the active engagement of various DAIs in SSA, it could also be
useful to consider a SSA sub-group.

66 | R E V I E W O F D A T A A N D A N A L Y T I C A L I N I T I A T I V E S O N A G R I C U L T U R A L
P U B L I C E X P E N D I T U R E S
FAOSTAT-GEA, for promoting enhanced disaggregated AGPE data, coupled with other parallel actions
cited above, especially to promote sustainable “incentives” at the country level to pursue enhanced AGPE
data bases and analytical studies). This working group can also foster more systematic and
institutionalized collaboration among related initiatives, given that thus far, the collaboration has tended
to be “ad-hoc”. 30
c) Given that there is special focus on the AGPE requirements of SSA, there is also the option of there
being an AGPE sub-working group for SSA, to focus on specific agenda for SSA. The results of this (and
maybe other) sub-groups (e.g, organized according to “type”) could feed into the agenda and periodic
exchanges of the above global working group.
5) Strengthening Demand Aspects
There are several components to strengthen the demand aspects, as discussed in the section on
conclusions, including:
a) supporting capacity development activities of key decision makers and technical analysts at various
levels, which will increase the demand for improved AGPE data base (disaggregated expenditures), for
improved and periodic AGPE and PSE analytical studies which can enhance agricultural policies, policy
change measurement, and expenditure priorities, based on comparative returns. While such capacity
development can be provided in SSA, given the various ongoing programs, it is less clear how this
capacity development will be achieved in other regions. Similar AGPE study programs need to be
promoted in other regions, which can include capacity development funds and TA activities;
b) supporting the strengthening of expenditure reporting systems cited above will contribute to stronger
demand by key actors for more disaggregated expenditure data and analysis. These aspects need to be
concretized and phased, in different regions, building on on-going initiatives. For example, to the extent
the proposed expanded support for FAOSTAT-GEA is launched, this could serve as an instrument for
promoting this strengthening at the country level (perhaps in collaboration and coordination with the
GFS, which includes periodic training);
c) promoting the internationalization of increased demand for enhanced AGPE databases (of
disaggregated data, using a consistent/standard classification system), for periodic AGPE and PSE
analytical studies, and effective dissemination to ensure the results are effectively utilized. It would be
important to link this strategy to supporting the budgetary planning and implementation cycle, while
requiring Ministries of Agriculture to underpin their budgetary submission with an expenditure
assessment of the previous year(s), to be done periodically. The AGPE “mini-reviews” should give
greater attention to assessing expenditure efficiencies and “value for money”, rather than the traditional
focus on expenditure outturns. 31
d) For all of the DAI initiatives, there is scope for expanding the ownership and use of the data,
results and tools arising from these initiatives at the country implementation level, on the part of key
decision-makers, including Ministries of Finance, Parliament (e.g., agriculture and budget committees).
This expanded demand/use, effectively cultivated, can enhance the value-added of DAIs for better
30
There have been some recent examples where such a practitioner working group can play a productive role (e.g.,
various working groups have been formed to address climate change issues). Further follow up will be made to
draw on some specific lessons, of what worked well and what did not work well. 31
For example, the CABRI team is endearing to promote similar type of incentives for stronger internal demand on
the part of Ministries of Finance to require Ministries of Agriculture to compile and submit more detailed budgetary
proposals (as communicated to R. Anson, by Nana Boateng (CABRI staff member, in early October, 2013).

67 | R E V I E W O F D A T A A N D A N A L Y T I C A L I N I T I A T I V E S O N A G R I C U L T U R A L
P U B L I C E X P E N D I T U R E S
expenditure planning and implementation. It would be useful if each of the DAIs devise a dissemination
and utilization strategy, with an aim of integrating it as part of the budgetary cycle.
6) Sustainability Strategies
The above section highlighted that, aside from the initiatives which are part of the work plans of
international organizations (e.g., GFS, PSE for OEE, FAOSTAT), one of the major concerns was that
many of the initiatives are project-and donor-dependent funded, hence, this casts doubt on countries being
able to sustain the improvements which are introduced. 32
It is of paramount importance for each data
initiative to devise an explicit sustainability strategy regarding the continuation of demand-driven public
expenditure data and analytical work (AgPEs and PSEs) in order to meet their short-term and long-term
objectives. At the same time, there is a need to recognize that the DAIs (which are cross-country in
nature) are largely international “public goods”, which warrant funding in the spirit of the CGIAR system.
One option at the country level is to strengthen the data systems as part of supporting the budgetary cycle
at the country level and explicit capacity development strategies/interventions with established
organizations at the country, regional and continental levels. Given the priority being accorded to
accelerating agricultural growth in SSA as part of the CAADP agenda, it would appear there is scope for
exploring this option for SSA.33
32
It should be noted BOOST, MAFAP, SNAPE (and CABRI/Value for Money in Agriculture) are all funded by
BMGF, which has played a crucial catalyst role in moving forward this agenda of enhanced and results-focused
agricultural public expenditures.
33
For example, there is a major workshop of development/analytical practitioners in addressing AgPE agenda,
sponsored by ReSAKSS, in Dakar (November 12 and 13, 2013). Perhaps some of the follow up actions can
consider an appropriate initiative which would help address some of these sustainability issues.

68 | R E V I E W O F D A T A A N D A N A L Y T I C A L I N I T I A T I V E S O N A G R I C U L T U R A L
P U B L I C E X P E N D I T U R E S
BIBLIOGRAPHY
- APCAS, 2012. Statistics on Private and Public investment in agriculture: government expenditure,
capital stocks and other FAOSTAT datasets. Twenty-fourth Session, Da Lat, Viet Nam, 8-12 October
2012, Agenda Item 10.
- Arias Diego, 2007. Agricultural Support Programs and Policies in Central America and Dominican
Republic in light of Trade Liberalization. Economic and Sector Studies Series RE-2-07-001. Inter-
American Development Bank.
- ASTI, 2011. ASTI’s Operational Plan, 2011–2015. Transitioning From Ad Hoc Data Collection
Activities to a Sustainable System of Data Compilation and Analysis. IFPRI, Washington, D.C.
(http://www.asti.cgiar.org/pdf/2011-15OperationalPlan.pdf, accessed 31 Aug. 2013.)
- ASTI ________. Practitioner’s Guide for National and Regional Focal Points. ASTI Methodology
and Data Collection Standards. IFPRI, Washington, D.C.
(http://www.asti.cgiar.org/sites/default/files/pdf/methodology/ASTI-Practioners-Guide-complete-
version.pdf, accessed 31 Aug. 2013.)
- Benin, S. and Yu, B., 2013. Complying the Maputo Declaration Target: trends in public agricultural
expenditures and implications for pursuit of optimal allocation of public agricultural spending.
ReSAKSS Annual Trends and Outlook Report 2012. International Food Policy Research Institute
(IFPRI).
- Fan, S., and J. Brzeska, 2010. Production, Productivity, and Public Investment East Asian
Agriculture. pp. 3401–3434. In: P. Pingali and R. Evenson (eds.), Handbook of Agricultural
Economics, Vol. 4. Amsterdam: North-Holland.
- Fan, S., and N. Rao, 2008. Public Investment, Growth and Rural Poverty. In Public Expenditures,
Growth, and Poverty, 56–108, edited by S. Fan. Baltimore, MD: Johns Hopkins University Press
- FOA, _______. FAO Expenditure Questionnaire. The GFSM 2001 System - Classification of
Functions of Government (COFOG) Supporting FAO Analytical Needs. [ORGANISATION DES
NATIONS-UNIES POUR L’AGRICULTURE ET L’ALIMENTATION Département du
Développement Économique et Social, Division de la statistique.] (Power point).
- FAO, ____. Revised Government Expenditure Questionnaire. (Carola).
- FAOSTAT, 2011. External Assistance to Agriculture. FAO Statistics Division Food and Agriculture
Organization of the United Nations, Rome, July 2011.
(http://www.fao.org/fileadmin/templates/ess/ess_test_folder/documents/Economic/External_assistanc
e_to_agriculture_AUG2011.pdf, accessed Oct. 2, 2013.)
- http://idbdocs.IDB.org/wsdocs/getDocument.aspx?DOCNUM=922858
- IDB, _______. Mejora lnstitucional Agrícola en Belice, Centroamérica, Panamá y la República
Dominicana. (Technical Assistance Project, funded by IDB (2009-2011), and executed by RUTA
(Rural Unit for Technical Assistance).
- IMF, 2001. Government Finance Statistics Manual 2001 (GFSM 2001). Washington, D.C.: IMF.

69 | R E V I E W O F D A T A A N D A N A L Y T I C A L I N I T I A T I V E S O N A G R I C U L T U R A L
P U B L I C E X P E N D I T U R E S
- IMF, 2012. Recent Developments and Current Initiatives.
- IMF, 2013a. http://www.imf.org/external/data.htm#sc, accessed on Aug. 13, 2013.
- IMF 2013b. Public Sector Debt Statistics: Guide for Compilers and Users. Washington, D.C.:
International Monetary Fund, 2011. (Revised Second Printing 2013)
- IFPRI, 2010. ReSAKSS 2010 Data Notes. Washington, D.C.: International Food Policy Research
Institute.
- Jones, G., Mane, E., Fabi, C., _____. Inter-Agency Collaboration in Fiscal Statistics. The GFSM
2001 System - Classification of Functions of Government (COFOG). Supporting FAO, IFPRI,
OECD, World Bank, and UN-SEEA Analytical Needs. (PPT presentation.)
- Kheyfets, Igor; Mastruzzi, Massimo; Merotto, Dino; Sondergaard, Lars. 2011. A new data tool to
BOOST public spending efficiency. Europe and Central Asia knowledge brief ; issue no. 43.
Washington D.C. - The World Bank.
http://documents.worldbank.org/curated/en/2011/09/15978127/new-data-tool-boost-public-spending-
efficiency.
- Lowder, S. K., and Carisma, B., 2011. Financial resource flows to agriculture A review of data on
government spending, official development assistance and foreign direct investment. ESA Working
Paper AgPER No. 11-19, December 2011. Agricultural Development Economics Division Food and
Agriculture Organization of the United Nations. (accessed from
http://www.fao.org/docrep/015/an108e/an108e00.pdf on Sept. 3, 2013.)
- MAFAP. 2011. A review of relevant policy analysis works in Africa. Main document Draft January
2011 http://www.fao.org/fileadmin/templates/mafap/documents/MAFAP_Synthesis-Maindoc-22-02-
2011.pdf.
- MAFAP, 2013. Project methodology. Concept Paper AgPER.
http://www.fao.org/fileadmin/templates/mafap/documents/MAFAP-
Methodology_PAgPER__Preliminary_Draft__29_April.pdf.
- MAFAP, _______. Monitoring of African Food and Agricultural Policies. (accessed from
http://www.fao.org/fileadmin/templates/mafap/documents/MAFAP_Brochure_EN.pdf, on 26 Apr.
2013.)
- MAFAP, ________. Monitoring African Food and Agricultural Policies. Report of a Scoping
Project.
- Malaiyandi, S., 2010. A database user manual for SPEED: statistics for public expenditure for
economic development. Washington, D.C.: International Food Policy Research Institute.
- Mogues, T., et.al, 2013. Tracking Agricultural Expenditures using Existing Government Public
Accounts: Selected African Country Case Studies. Shared Approaches To Measuring the Agricultural
Policy Environment. 24-25 June 2013, OECD Headquarters, Paris.
- OECD, 2007. Reporting Directives for the Creditor Reporting System. DCD/DAC (2007)39/FINAL,
04-Sep-2007, OECD, Paris.

70 | R E V I E W O F D A T A A N D A N A L Y T I C A L I N I T I A T I V E S O N A G R I C U L T U R A L
P U B L I C E X P E N D I T U R E S
- OECD, 2011. General government expenditures, in Government at a Glance 2011, OECD Publishing.
http://dx.doi.org/10.1787/gov_glance-2011-10-en.
- OECD, 2013. OECD.Stat Web Browser User Guide March 2013. March 2013, Paris, France.
- Olubode-Awosola Femi, Pius Chilonda and Isaac Minde (eds.), 2007. Report of technical meeting on
“Monitoring trends and spatial analysis of public spending in agriculture”, May 29-30, Lusaka,
Zambia, 2007. ReSAKSS-SA, IWMI and ICRISAT, Pretoria, South Africa.
- RUTA, Informe de Evaluacion del Proyecto: Mejora lnstitucional Agrícola en Belice, Centroamérica,
Panamá y la República Dominicana (consultant report prepared for RUTA, 2012)
- Soto Barquero F. J Santos y J. Ortega eds. (2006) “Políticas públicas y desarrollo rural en América
Latina y el Caribe: El pAgPEl del gasto público”. Oficina Regional de la FAO para América Latina y
el Caribe, FAO, Santiago.
- World Bank, 1997. The Global Strategy to Improve Agricultural and Rural Statistics. Economic and
Sector Works. Report Number 56719-GLB. The World Bank, 1818 H Street NW, Washington, DC
20433, USA, fax 202-522-2422, e-mail [email protected].
- World Bank, 1997. World development indicators 1997. World Development Indicators. Washington,
D.C.: The World Bank. http://documents.worldbank.org/curated/en/1997/03/731887/world-
development-indicators-1997.
- World Bank, 2011. Practitioners’ Toolkit for Agricultural Public Expenditure Analysis. (World
Bank/DFID Partnership, March 2011.) The World Bank, 1818 H Street NW, Washington, DC 20433,
USA.
- World Bank, 2012. Step-by-step guide to developing a BOOST. Washington D.C. - The World Bank.
http://documents.worldbank.org/curated/en/2012/01/15987974/step-by-step-guide-developing-boost.
- World Bank. 2013. Agriculture Public Expenditure Analysis Country Experience Sharing Workshop,
Dar es Salaam, Tanzania, June 13-14, 2013 (sponsored by NPCA, FAO, World Bank, BMGF, and
CAADP MDTF). (Workshop Proceedings, November, 2013).
- World Bank, 2013. World Development Indicators 2013. Washington, DC: World Bank. doi:
10.1596/978-0-8213-9824-1. License: Creative Commons Attribution CC BY 3.0
- ________, 2012. FAO Statistical Initiatives in Measuring Investment in Agriculture. Discussion draft.
Investment Days, Invest in sharing. Rome, December 17, 2012.
- __________. Monitoring of African Food and Agricultural Policies (MAFAP). (Accessed from
http://www.fao.org/fileadmin/templates/mafap/documents/MAFAP_Brochure_EN.pdf, on 26 Apr.
2013.)
- ________. ReSAKSS Phase II (2011-2015) Work Plan, (Accessed from
http://www.resakss.org/sites/default/files/pdfs//resakss-2011-work-plan-50784.pdf, Aug 19, 2013.)

71 | R E V I E W O F D A T A A N D A N A L Y T I C A L I N I T I A T I V E S O N A G R I C U L T U R A L
P U B L I C E X P E N D I T U R E S
APPENDIX
Classification of Functions of Government (Functional Classification of Expenditures)
Code Description
Relation to
agriculture-related
functions
01 General public services Not ag. f.
02 Defense Not ag. f.
03 Public order and safety Not ag. f.
04 Economic Affairs Encompasses ag. f.
041 General economic affairs Encompasses ag. f.
042 Agriculture, forestry, fishing and hunting Ag. f
0421 Agriculture Ag. f - Administration of agricultural affairs and services; conservation,
reclamation, or expansion of arable land; agrarian reform and
land settlement; supervision and regulation of the agricultural
industry
- Construction or operation of flood control, irrigation, and drainage
systems, including grants, loans, or subsidies for such works
- Operation or support of programs or schemes to stabilize or
improve farm prices and farm incomes; operation or support of
extension services or veterinary services to farmers, pest control
services, crop inspection services, and crop grading services
- Production and dissemination of general information, technical
documentation, and statistics on agricultural affairs and services
- Compensation, grants, loans, or subsidies to farmers in connection
with agricultural activities, including payments for restricting or
encouraging output of a particular crop or for allowing land to
remain uncultivated
0422 Forestry Ag. f - Administration of forestry affairs and services; conservation,
extension, and rationalized exploitation of forest reserves;
supervision and regulation of forest operations and issuance of
tree-felling licenses
- Operation or support of reforestation work, pest and disease
control, forest fire-fighting and fire-prevention services, and
extension services to forest operators
- Production and dissemination of general information, technical
documentation, and statistics on forestry affairs and services
- Grants, loans, or subsidies to support commercial forest activities
0423 Fishing and hunting Ag. f - Administration of fishing and hunting affairs and services;
protection, propagation, and rationalized exploitation of fish and
wildlife stocks; supervision and regulation of freshwater fishing,
coastal fishing, ocean fishing, fish farming, wildlife hunting, and
issuance of fishing and hunting licenses
- Operation or support of fish hatcheries, extension services,
stocking, or culling activities
- Production and dissemination of general information, technical
documentation, and statistics on fishing and hunting affairs and
services
- Grants, loans, or subsidies to support commercial fishing and
hunting activities, including the construction or operation of fish
hatcheries
043 Fuel and energy Not ag. f.
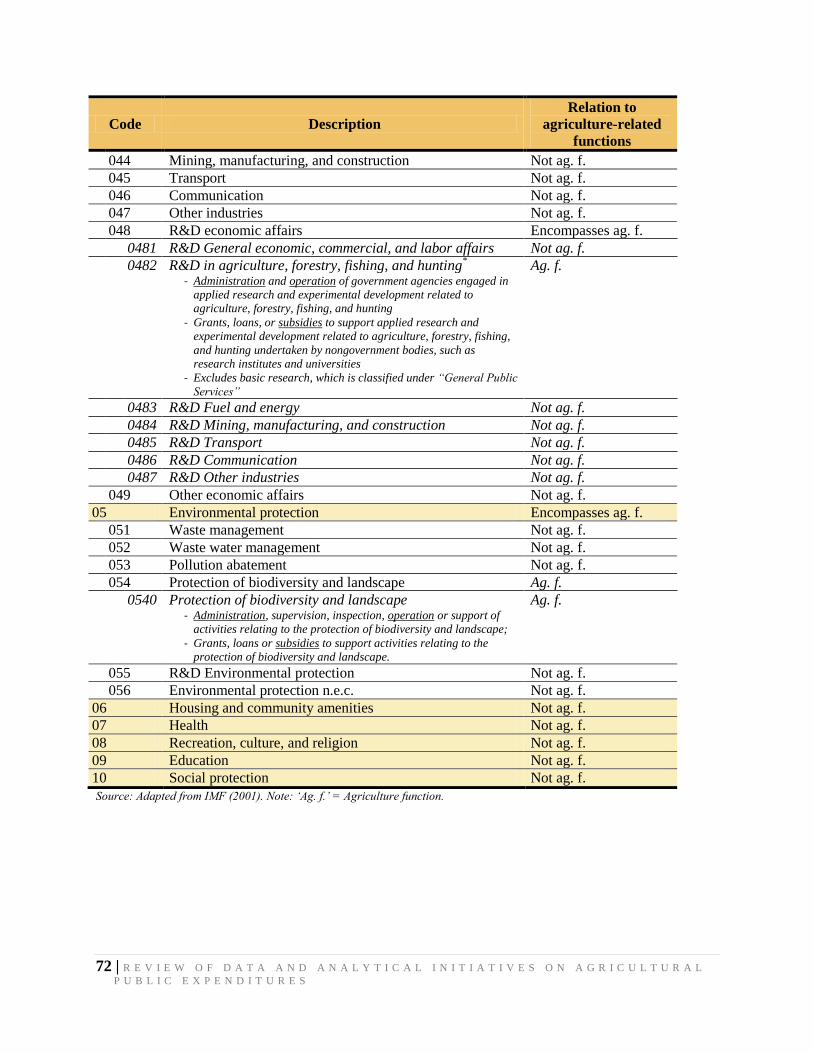
72 | R E V I E W O F D A T A A N D A N A L Y T I C A L I N I T I A T I V E S O N A G R I C U L T U R A L
P U B L I C E X P E N D I T U R E S
Code Description
Relation to
agriculture-related
functions
044 Mining, manufacturing, and construction Not ag. f.
045 Transport Not ag. f.
046 Communication Not ag. f.
047 Other industries Not ag. f.
048 R&D economic affairs Encompasses ag. f.
0481 R&D General economic, commercial, and labor affairs Not ag. f.
0482 R&D in agriculture, forestry, fishing, and hunting* Ag. f.
- Administration and operation of government agencies engaged in
applied research and experimental development related to
agriculture, forestry, fishing, and hunting
- Grants, loans, or subsidies to support applied research and
experimental development related to agriculture, forestry, fishing,
and hunting undertaken by nongovernment bodies, such as
research institutes and universities
- Excludes basic research, which is classified under “General Public
Services”
0483 R&D Fuel and energy Not ag. f.
0484 R&D Mining, manufacturing, and construction Not ag. f.
0485 R&D Transport Not ag. f.
0486 R&D Communication Not ag. f.
0487 R&D Other industries Not ag. f.
049 Other economic affairs Not ag. f.
05 Environmental protection Encompasses ag. f.
051 Waste management Not ag. f.
052 Waste water management Not ag. f.
053 Pollution abatement Not ag. f.
054 Protection of biodiversity and landscape Ag. f.
0540 Protection of biodiversity and landscape Ag. f. - Administration, supervision, inspection, operation or support of
activities relating to the protection of biodiversity and landscape;
- Grants, loans or subsidies to support activities relating to the
protection of biodiversity and landscape.
055 R&D Environmental protection Not ag. f.
056 Environmental protection n.e.c. Not ag. f.
06 Housing and community amenities Not ag. f.
07 Health Not ag. f.
08 Recreation, culture, and religion Not ag. f.
09 Education Not ag. f.
10 Social protection Not ag. f.
Source: Adapted from IMF (2001). Note: ‘Ag. f.’ = Agriculture function.
Related Documents