Review of Rural Affairs Five papers discuss diverse themes relevant to agriculture and the rural economy, such as the impact of heatwaves and droughts on agricultural production in India over three and a half decades; the drivers and constraints determining the participation of small farmers in two types of marketing chains; the transition of agricultural labourers in Punjab over three decades using longitudinal surveys; the labour market implications of growth in the agricultural sector, specifically on the female labour force participation rate in rural Punjab; and the causes of stagnation in the agricultural sector in Maharashtra. Climate Change and Agriculture Agricultural adaptation and resilience to extreme events over the last three and a half decades are analysed using secondary data. page 5 Farmers and Organised Retail The drivers and constraints determining small farmers’ participation in two different types of marketing chains in Haryana are examined. page 13 Agricultural Labourers in Transition The transition in agricultural labour households in Punjab is presented by assessing the changes in the structure of rural employment over the periods 1987–88 and 2018–19. page 21 Employment of Rural Women To tackle the issue of low female labour force participation in rural Punjab, policies need to address the constraints imposed by gender norms. page 29 Agriculture in Crisis The agricultural sector in Maharashtra is reeling under acute distress due to long-term policy neglect and misplaced priorities. page 36 A SAMEEKSHA TRUST PUBLICATION www.epw.in PUBLISHED ON SATURDAY, JUNE 27, 2020 Vol LV Nos 26 & 27 Supplement 1 ECONOMIC & POLITICAL WEEKLY

Welcome message from author
This document is posted to help you gain knowledge. Please leave a comment to let me know what you think about it! Share it to your friends and learn new things together.
Transcript

Review of Rural AffairsFive papers discuss diverse themes relevant to agriculture and the rural economy, such as the impact of heatwaves and droughts on agricultural production in India over three and a half decades; the drivers and constraints determining the participation of small farmers in two types of marketing chains; the transition of agricultural labourers in Punjab over three decades using longitudinal surveys; the labour market implications of growth in the agricultural sector, specifically on the female labour force participation rate in rural Punjab; and the causes of stagnation in the agricultural sector in Maharashtra.
Climate Change and AgricultureAgricultural adaptation and resilience to extreme events over the last three and a half decades are analysed using secondary data. page 5
Farmers and Organised RetailThe drivers and constraints determining small farmers’ participation in two different types of marketing chains in Haryana are examined. page 13
Agricultural Labourers in TransitionThe transition in agricultural labour households in Punjab is presented by assessing the changes in the structure of rural employment over the periods 1987–88 and 2018–19. page 21
Employment of Rural WomenTo tackle the issue of low female labour force participation in rural Punjab, policies need to address the constraints imposed by gender norms. page 29
Agriculture in CrisisThe agricultural sector in Maharashtra is reeling under acute distress due to long-term policy neglect and misplaced priorities. page 36
a sameeksha trust publication www.epw.in
PUBLISHED ON SATURDAY, JUNE 27, 2020 Vol LV Nos 26 & 27 Supplement 1
ECO
NOM
IC &
PO
LITI
CAL
WEE
KLY

Published on Saturday, JUNE 27, 2020 vol lV nos 26 & 27 EPW Economic & Political Weekly2
Institute of Economic Growth (IEG)Delhi University Enclave, North Campus, Delhi 110007
Post-Doctoral Fellowships in Economics 2020
IEG invites applications for two Post Doctoral Fellowships in Economics. We invite applications from all fi elds in economics. This is a full-time position and the consolidated salary will be in the range of Rs. 65,000-80, 000 per month. IEG has limited campus accommodation, which the Fellow can apply for. These fellowships are initially for a period of one year, renewable for another year at the end of the fi rst year with a suitable increment.
ResponsibilitiesThe Fellow is expected to pursue high-quality research, leading to publications in good journals and other collections. He/She is expected to deliver independent as well as collaborate research. He/She will engage with and contribute to the IEG seminars and workshops, in addition to participation in recognised conferences.
EligibilityThe suitable candidate must hold a PhD degree in Economics. Candidates who have submitted their theses but are waiting for the result can also apply. Good analytical and writing skills are essential.
Please apply electronically in one pdf.-document with: (1) cover letter; (2) CV (max. 3 pages, including publications, education, research experience); (3) a copy of your best research paper (published or unpublished); (4) names and contact details of three referees; (5) a research proposal.
Applications should reach the Academic Programmes Offi cer, Institute of Economic Growth, University of Delhi Enclave, Delhi 110007 (Email: [email protected]) by August 05, 2020. Informal queries can be made by writing to diroffi [email protected].
DIRECTOR
ECO
NOM
IC &
PO
LITI
CAL
WEE
KLY

Economic & Political Weekly EPW Published on Saturday | june 27–July 4, 2020 | vol LV Nos 26 & 27 3
Economic & Political Weekly SUPPLEMENT
Printed and published by Gauraang Pradhan, for and on behalf of Sameeksha Trust and printed at Modern Arts and Industries, 151, A–Z Industrial Estate, Ganpatrao Kadam Marg, Lower Parel, Mumbai–400 013 and published at 320–322, A–Z Industrial Estate, Ganpatrao Kadam Marg, Lower Parel, Mumbai–400 013
Editor: Gopal Guru (Editor responsible for selection of news under the PRB Act)
Review of Rural AffairsThis edition of the Review of Rural Affairs brings together a set of fi ve papers that traverse diverse themes related to agriculture and the rural economy in India. These papers present interesting insights, both from the analysis of secondary data as well as from longitudinal surveys and fi eld-based studies, on the transitions underway in the agricultural sector and also provide suggestions for policymaking.
Droughts, Heatwaves and Agricultural Adaptation: A Historical Account for India5 There has been an escalation in the frequency and intensity of extreme events such as droughts and heatwaves that are
attributed to climate change. The paper examines the impact of heatwaves and drought on agricultural production in India, over 1981–2015 on 10 crops, namely paddy, jowar, bajra, maize, tur, groundnut, soybean, wheat, mustard, and gram. It fi nds that the adaptation to climate variability has happened on account of advancements in technology, increased awareness, institutional learning, and other strategies to cope with droughts. However, it shows that there exists considerable variation across crops regarding the adaptability to climatic variability based on the sensitivity of the crop to water stress and heat, crop responsiveness to irrigation and cost of adaptation in relation to value of the crop. — Ashutosh Kumar Tripathi, Sumita Sindhi
Small Farmers and Organised Retail Chains in India13 To assess the drivers and constraints determining the participation in two types of marketing chains, the farmers selling
vegetables to Mother Dairy, an organised retail chain, are compared with those selling to the local mandi in Haryana. The fi ndings point to the signifi cance of farm size in determining farmers’ participation in organised retail chains. Using the Heckman selection–correction model, it is found that though the income of participating farmers increases, this depends on the farm size. The Ginni coeffi cient shows that the inequality in income distribution is more among the participating rather than the non-participating farmers. — Jitender Singh
Punjab’s Agricultural Labourers in Transition: A Longitudinal Study of Three Decades21 The transition of agricultural labour households over three decades in the rural economy of Punjab is elucidated using
longitudinal surveys conducted in 1978–88 and 2018–19. The extent and the magnitude of this transition are analysed, revealing that, with time, the income pattern of households has changed, which is mainly attributed to changes in the pattern of employment. Further, policy measures are suggested to improve the levels of living of this stratum of the rural society. — Sukhpal Singh, Shruti Bhogal
Employment of Women in Rural Punjab: Deconstructing Agricultural Growth Policy 29 The labour market implications of growth in the agricultural sector, specifi cally on the female labour force participation
rate in rural Punjab are assessed. Using both secondary and primary sources of data, it is argued that agricultural growth and crop diversifi cation strategies are not enough to improve the labour force participation rate. Although the employment policies focusing on faster growth, that are based on growth models in economics assuming zero transaction costs, expected that growth itself would generate employment, the paper points out that these policies ignored the social, demographic, and economic constraints faced by women. — Ashapurna Baruah, Indervir Singh
Development Challenges for Agriculture in Maharashtra36 The agricultural sector has been under tremendous stress in Maharashtra. Arguing that the state policy has dished out a raw
deal to the agricultural sector, the path of this retrogression and the reasons behind the trends are traced. It is found that the agricultural sector is losing cultivable land to other uses as stagnation has set in, which is also accompanied by a sharp increase in small and marginal holdings. The state has no agricultural policy document in place and the sector largely depends on sporadic fi refi ghting approaches. — Khalil Shaha, S Yogeshwari & R S Deshpande
ECO
NOM
IC &
PO
LITI
CAL
WEE
KLY

LETTERS
Published on Saturday, JUNE 27, 2020 vol lV nos 26 & 27 EPW Economic & Political Weekly4
Print Edition – For India Web Edition/Digital ArchivesThe full content of the EPW and the entire archives are also available to those who do not wish to subscribe to the print edition.
India (in Rs) SAARC (in US $) Rest of the World (in US $)
Category Number of Number of Number of Concurrent Users Concurrent Users Concurrent Users
Institutions Up to Five 6,490 Up to Five 300
More than 5 14,160 More than 5 250 More than 5 750
Individuals Single User 2,360 Single User 100 Single User 150
Rates for Six Months (in Rs)Category Print Print + Digital Archives
Individuals 1,900 2,655
Rates for One Year (in Rs)Category Print Print + Digital Archives (According to Number of Concurrent Users)
Up to 5 More than 5 Single User
Institutions 5,500 11,800 17,700
Individuals 3,300 4,720
Students 1,800 3,068
Rates for Three Years (in Rs)
Category Print Print + Digital Archives Single User
Individuals 9,000 11,800
Concessional rates are restricted to students in India. To subscribe at concessional rates, please submit proof of eligibility from an institution.
Print Edition: Subscriber receives the print copy by post to the address given.
Print plus Digital Archives: Subscriber receives the print copy and has access to the entire archives on the EPW web site.
Print Edition — For SAARC and Rest of the World (Air Mail)
Airmail Subscription for One Year (in US $) Print Print + Digital Archives (According to Number of Concurrent Users)
Institutions Up to 5 More than 5 Single User
SAARC 215 500
Rest of the World 430 600 1,000 IndividualsSAARC 175 200
Rest of the World 250 300
Types of Web Access to the Digital Archives Individual subscribers can access the site by a username and a password, while institutional subscribers get access by specifying IP ranges. To know more about online access to the archives and how to access the archives send us an email at [email protected] and we will be pleased to explain the process.
How to Subscribe: Payment can be made by either sending a demand draft/cheque in favour of Economic and Political Weekly or by making online payment with a credit card/net banking on our secure site at www.epw.in.
Address for communication: Economic & Political Weekly 320–322, A to Z Industrial Estate, Ganpatrao Kadam Marg, Lower Parel, Mumbai 400 013, India
Subscription Rates(Revised rates effective April, 2019)
Increase in Subscription RatesI
The EPW is compelled to raise the Digital Subscription Rates on account of Goods and Service Tax (GST) being applicable to Digital Subscriptions. The GST rate for Online Information Data Base Access and Retrieval (OIDAR) is 18%. The category Print plus Digital will also attract 18% as GST.The subscription rates quoted are inclusive of the 18% GST rate.
Submission GuidelinesEPW welcomes original contributions that have not been submitted, published, or accepted for publication elsewhere. Contributors must specify the same in the article submission email. Contributors are urged to follow EPW’s stylesheet (https://www.epw.in/style-sheet.html). All contributions must be accompanied by:• An abstract of 150–200 words• Six to eight keywords • Author name, email address and contact number for
correspondence, one-line author note for each author stating current designation and affiliation, and author photographs (optional). We include the provided email address in the author note.
Contributors are cautioned against plagiarism and excessive self-referencing. Figures, graphs and tables must be used sparingly to avoid repetition of content. All supplementary files such as figures, tables, maps, etc, must be provided in MS Office (Word/ Excel) or other editable formats, wherever possible.The EPW editorial team reserves the right to slot an article in a specific section, as deemed fit.Receipt of articles is immediately acknowledged by email. If contributors have not received an acknowledgement and reference number within a week of submission, they are requested to check their spam folders for the mail and write to us at [email protected]. Every effort is taken to complete early processing of the articles we receive. Given the high volume of articles received daily, it can take up to six months for a final decision on whether an article is accepted for publication. Articles accepted for publication can take up to 12 months from the date of acceptance to appear in print.
Letters (Word limit: 500–800) Readers are encouraged to comment on current affairs and/or respond to published articles in EPW. Letters must contain the author’s full name and postal address.
Commentary (Word limit: 2,000–3,000)Short, analytical articles on topical and contemporary social, economic and political developments will be considered for this section.
Book Reviews (Word limit: 1,500–2,000)EPW commissions book reviews. However, on occasion, unsolicited reviews may be considered for publication.
Insight (Word limit: 4,000–5,000)Innovative and focused analyses of social, economic, and political phenomena would be considered for this section.
Perspectives (Word limit: 4,000–5,000)Articles presenting unique viewpoints and standpoints on existing scholarship and contemporary phenomena are welcome for this section.
Special Articles (Word limit: Upto 7,000) Original, unpublished research papers in any of the humanities and social sciences are welcome.
Notes (Word limit: 4,000–5,000)Short, original articles covering preliminary research in any of the humanities and social sciences would be considered for this section.
Discussion (Word limit: 1,500–2,000)In order to foster debate and discussion, responses to articles published in EPW are encouraged.
Postscript (Word limit: 800–1,200)Short accounts or reflections on different aspects of culture (travel, literature, dance, music and film) will be considered under this section.
EngageContributions to this section may be in the form of articles (2,500–3,000 words), photo essays, podcasts and videos on topical social, cultural, economic and political developments. For more details, visit: https://www.epw.in/notes-contributors-epw-engage.
CopyrightEPW posts all published articles on its website as well as on select databases. Published articles may be considered for translation into Indian languages under our ongoing project.
The copyright of all articles published in EPW belongs to the author or to the organisation where the author is employed, as determined by the author’s terms of employment.
Permission for Reproduction1. EPW has no objection to authors republishing or
revising their articles for other publications. However, the republished article must mention prominently that a version of the article first appeared in Economic & Political Weekly. It must also include the publication details along with the URL of the original EPW article.
2. No published article or part thereof should be reproduced in any form without prior permission of the author(s). A soft/hard copy of the author(s)’s approval should be sent to EPW.
Please refer to the detailed Notes for Contributors (https://www.epw.in/notes-contributors.html) and Frequently Asked Questions (https://www.epw.in/frequently-asked-questions) section on the EPW website.Send us your submissions on [email protected].
Notes for Contributors
ECO
NOM
IC &
PO
LITI
CAL
WEE
KLY

REVIEW OF RURAL AFFAIRS
Economic & Political Weekly EPW Published on Saturday, june 27, 2020 vol lV nos 26 & 27 5
Ashutosh Kumar Tripathi ([email protected]) and Sumita Sindhi ([email protected]) are with the Indian Institute of Management Sambalpur.
Droughts, Heatwaves and Agricultural Adaptation A Historical Account for India
Ashutosh Kumar Tripathi, Sumita Sindhi
Extreme events as floods, droughts and heat waves
ensue from climate change. There has been an increase
in the frequency and intensity of such events in the past
two decades. Some of the recent events have caused
substantial damage to agricultural crops and loss to
human lives. The recurrence of such events is a threat to
social welfare, economy and humanity as a whole.
Adaptation to climate change is the key and the way
forward. It is observed that agriculture has historically
adapted to shocks and extreme events. Agricultural
adaptation and resiliency to extreme events over the
last three and a half decades is gauged using
secondary data.
A n increase in the incidence of extreme events as fl oods, droughts, heatwaves and forest fi res has been recorded over the years. The escalation in frequency and inten-
sity of these events is attributed to climate change. The Inter-governmental Panel on Climate Change (hereafter IPCC) in its fi fth assessment report has elaborately documented the vulner-ability to extreme events and their impact on human health, economic development and agricultural systems globally (IPCC 2014). The heatwave of 2015 over Indian subcontinent is ranked as one of the deadliest in the recent past impairing hu-man and agricultural systems (NOAA 2015; UNESCAP 2016). Satellite data suggests that there has been an increase of around 1 degree Celsius (°C) in maximum temperatures across India in the last 50 years (between 1951–60 and 2001–10) and projections deeper into the future paint a more alarming pic-ture. For instance, IPCC predicts that temperatures are likely to rise by 3°C–4°C by the end of the 21st century (Pathak et al 2012). Increase in the mean temperature and increases in the number of hot days have been documented across the country as well (IMD 2018; Kumar et al 1994).
Climate change has disruptive consequences on food pro-duction processes, and hence, research focus on the same is primal. The developing world based on its geographical loca-tion is more vulnerable to climate change;1 however, most of the empirical research is concentrated on the developed world. A small but growing literature has focused on estimating the impact of climate on the performance of Indian agriculture. Pingali et al (2019) summarises the recent projections for dif-ferent crops in India, which show differences in outcomes both by crops and by region. Using district-level data on tempera-ture, rainfall and crop production, Economic Survey 2017–18 (GOI 2018) yields three key fi ndings. First, climate change im-pact in terms of temperature and rainfall is non-linear and is felt in the extreme, that is, when temperatures are higher, rainfall is substantially lower, and the number of dry days are higher than normal. Second, is that these extreme shocks have highly divergent effects between unirrigated and irrigated ar-eas, almost twice as high in the former compared with the lat-ter. Third, it relates to the impacts on agricultural yields. The estimate shows that the extreme temperature shock reduces yields by 4% and 4.7% for kharif and rabi, respectively, while the extreme rainfall shocks reduce yields by 12.8% and 6.7% for kharif and rabi, respectively.
Climate change poses the greatest threat to Indian agricul-ture. The frequency, intensity and area under extreme events,
ECO
NOM
IC &
PO
LITI
CAL
WEE
KLY

REVIEW OF RURAL AFFAIRS
Published on Saturday, june 27, 2020 vol lV nos 26 & 27 EPW Economic & Political Weekly6
such as droughts and heatwaves have seen an upsurge over the last three decades. The probability of occurrence of a drought is about 35%, that is, once in three years (Pandey et al 2007). India has experienced 13 major droughts since 1966, the year of introduction of green revolution in the country. Four of these have occurred quite recently, that is, between 2001 and 2012. One of the worst heatwaves in the last fi ve decades that took a toll on 1,300 human lives occurred in 1998 (De and Mukhopadhyay 1998). Since then, the Indian Meteorological Department (IMD) has recorded fi ve such events having an im-pact on environment and society (Met Offi ce 2011; IMD 2015).
It is generally agreed that the vulnerability to climate change is a function of both the sensitivity of a system to changes in climate, and the ability to adapt the system to such changes (Watson et al 1998). Historically, agriculture has adapted to climate change shocks, majorly having an impact on the pro-duction. Emanuele and Mendelsohn (2018) provide a review of cross-sectional studies on how climate affects management choices in agriculture. Ecosystem scientists argue that this change in management choices reveals how ecosystems sur-vived the many large climate shifts that have occurred in the earth’s history since the ice ages (Prentice et al 2011). Further, the sensitivity of a system to changes in climate depends on many factors. For instance, rise in temperature (up to a certain range) is found to have benefi cial impacts in certain crop groups if combined with other optimal growing conditions like enough access to irrigation and adequate groundwater man-agement system (Misra 2014; Qadir et al 2008; Taylor et al 2013). Climate models project that adequate irrigation in paddy will increase its production but the crops, such as wheat and maize ,will see a decrease (Challinor et al 2014; Nelson et al 2014). Therefore, it is extremely challenging to quantify the impact of the increase in temperature on crop yield.
In this context, the present paper examines the impact of heatwaves and drought on agricultural production in India over the last three and a half decades, that is, 1981–2015 with the following objectives. First, to chronologically assess and detect the impacts over time and, second, to draw observations useful for future adaptation in agricultural systems. While analysing the extent to which adaptations are made, similar type of events over time are compared. The hypothesis is that the farmers learn and adapt to recurring events, thus minimis-ing the impact on production with each successive event.
Approaches to Assess Climate Change Impacts
Most of the impact assessment studies of climate change tend to make simple assumptions about adaptation. They either ignore adaptation completely or assume arbitrary adaptation or complete changes in behaviour (Tol et al 1998). Agricultural adaptation during extreme events in the past is a key to predict future behaviour. There are generally three broad approaches in the literature aimed at assessing the impact of climate change on agriculture, commonly known as the production function approach, the Ricardian approach and the panel data approach.
In the case of production function approach (also known as crop modelling), the impact of climate change relies upon
empirical or experimental production functions to predict environmental damage. In this approach, some of the input variables, such as temperature, precipitation and carbon diox-ide, are varied to estimate the impacts. Sophisticated crop-yield models as CERES/SOY–GRO are employed to ascertain the impacts on the yield. The forecasts mostly reveal reduction in yields due to global warming. This approach has the advan-tage of careful control and randomised application of environ-mental conditions and provides a useful baseline for estimat-ing the impact of climate change. However, it does not incor-porate any potential adaptations made by farmers. These cli-mate change models and estimates on impact in agriculture do not consider the prospects of adaptation (Rosenzweig and Parry 1994; Parry et al 2004, 2005). This omission is impor-tant because it may bias impact estimates. Mendelsohn et al (1994) refer to this bias as the “dumb farmer” scenario, argu-ing that studies that omit adaptation overestimate the nega-tive effects of climate change and underestimate the possible benefi ts when conditions improve.
Alternatively, the Ricardian approach2 (also known as cross-sectional analysis), allows for the full range of compensatory or mitigating behaviours since they assume that farmers at dif-ferent locations have had time to “adapt” to their local climate. Instead of studying yields of specifi c crops, the app roach relies upon examining the relationship between cross-sectional cli-mate data and land value, as a measure of agricultural produc-tivity (Mendelsohn et al 1994; Reilly et al 1996). The land pric-es will indicate the present discounted value of land based on its adaptability and use, that is, it depicts the impact of climate on crop yields taking into account the various adaptations. The Ricardian approach provides the fi rst order estimate of the economic impact, but does not refl ect on specifi c adaptation options and associated issues (Rosenzweig and Tubiello 2007).
The panel data method uses random yearly weather fl uctua-tions across space to estimate the effect of weather on crop yields (Olivier and Greenstone 2007; Wolfram and Roberts 2009). The method has an advantage in controlling the unobservables such as farmer and/or soil quality. The approach uses the data based on actual fi eld outcomes rather than laboratory experi-ment. Therefore, the analysis takes into account intra-year adjust-ments, such as input variability or cultivation technique adopted by farmers. As the panel data approach measures annual fl uc-tuations, it does not refl ect the possibility of long-term adapta-tions as change in crops, cropping patterns, or farmer exit.
Other climate change impact assessment analysis has incor-porated the adaptation into the analysis at some arbitrary level to compare costs.3 For instance, Easterling et al (1993) and Rosenzweig and Parry (1994)4 provide estimates of the poten-tial of various arbitrary levels of adaptation to reduce the dam-ages of climate change in the agriculture sector. This type of analysis can be very useful and may provide important infor-mation regarding the upper and lower bounds of costs and form the basis for more realistic adaptation patterns and policy analysis and advice.
Observed adaptation uses spatial or temporal analogues as predictions of adaptation in the current situation. Spatial
ECO
NOM
IC &
PO
LITI
CAL
WEE
KLY

REVIEW OF RURAL AFFAIRS
Economic & Political Weekly EPW Published on Saturday, june 27, 2020 vol lV nos 26 & 27 7
analogues look into practices and actions in one location to predict the action in another similar situation. It can provide valuable insights but the process of how adaptation takes place and the costs incurred are ignored (Tol et al 1998). Mendel-sohn et al (1994) use this method to estimate climate change impacts on United States (US) agriculture. Another form of analogues are temporal which examine how adaptation has occurred historically (Carter et al 1994). The implicit assump-tion is that the adaptations observed in different spatial loca-tions or in the past may be used as a prediction of adaptation to climate change.
It is observed that impact assessment studies are based on various assumptions regarding adaptations. These assumptions stress that adaptation is either completely ignored or largely expounded in anticipation of the impacts. The assumptions in these approaches either overestimate or underestimate the adaptation parameters. Through this study, an attempt is made to understand farmers’ adaptation to extreme events in the Indian context by using historical analogues and utilising this to comprehend agricultural adaptation to future extreme events. The study puts forth farmers’ response and adaptation to climate change.
Methodology
This study relies on the historical analogue approach to ex-amine how agriculture has adopted to changes in climate extremes in the past. It is hypothesised that as an event occurs more regularly, farmers learn from the past events and take action (make adaptation) to minimise future effects. The study involves, fi rst, identifying the major droughts and heatwave events in India during 1981–2015, and then analy-ses the agricultural production data to determine the impact on production in the years identifi ed as being drought or heatwave years. Archival meteorological data is used to determine the main drought and heatwave years and the as-sociated characteristics of those events. The impact of those events on crop production is examined. Meteorologically, droughts and heatwaves have different characteristics. How-ever, they may occur simultaneously and can also be observed separately. Some of the major drought episodes lasted for months or even years, whereas, heatwaves last for a few days or a week. Nonetheless, a heatwave lasting for a week or two can simulate drought conditions (Chang and Wallace 1987). Therefore, in this research, both droughts and heatwaves are considered.
Several drought and/or heatwave events have been recorded during the period 1981 to 2015. Major meteorological droughts occurred in 1986–88, 2000–03, 2009–10, and 2015–17.5 The
severity score of these events suggest that they can be categorised as “extreme” drought,6 which makes these years relatively com-parable with each other (Mishra 2019). Table 1 des cribes the main characteristics of these major drought events.
The fi rst major drought spell (of the period 1981–2015) started from September 1986 and ended in June 1988 with maximum intensity and mean area extent of −1.81% and 12.25%, respec-tively. In 2000–03 drought spell, a rainfall defi cit of 56% was observed during the month of July 2002. The drought spell led to agricultural failure and food crisis—critically affecting the country’s economy (Bhat 2006). The rainfall defi cit of 47% in the month of June followed by another monsoon break in July led to a severe drought in 2009 with extreme dry conditions (Samantha et al 2015). The last meteorological drought spell started in July 2015 and continued till December 2018 with a longest duration of 41 months in the entire record of 1981–2018. It affected the mean area of 9% of the country. The drought of 2015 caused enormous damage to crops and affect-ed various sectors of society (Mishra et al 2016). Severe and prolonged droughts have signifi cant adverse effects on agri-culture and food security (Kumar et al 2014). From a study in eastern India, Pandey et al (2007) have estimated that during a drought year household income falls by 25%–60% and head-count poverty ratio rises by 12%–33%.
Most of the post-1998 heatwaves in India are associated with major droughts. For instance, droughts of 2002, 2009 and 2015 were associated with heatwaves during the month of May/June. The same was observed in 2003 in Europe, 2010 in Russia, and 2011 in Texas (Fischer et al 2007; Barriopedro et al 2011; Hoerling et al 2013; Hauser et al 2016). However, in other cases, such as 1995, 1998, and 2012, it was a severe heatwave rather than an ongoing drought.
Mishra et al (2017) estimated the severity (for example, magni-tude) and duration of heatwaves by constructing the Heat Wave Magnitude Index daily (HWMId) during 1951–2015. It was observed that most heatwaves in India have occurred in the month of May, and nearly all of them have occurred between April and June. Based on the heatwave magnitude (an indicator of heatwave severity), the four most severe heatwaves out of the top 10 heatwaves during 1951 to 2015 occurred af-ter 1990. The top four heatwaves occurred in 1995, 1998, 2012, and 2003 with a magnitude of 18.40, 17.92, 11.60, and 10.70, respectively (Table 2).
As the heatwaves are estimated using the gridded maxi-mum temperature data based on the all India average, the 2015 heatwave which had a remarkable impact does not fea-ture in the top four events. The 1998 heatwave was widely spread, whereas the heatwave during 2015 was mainly centred
Table 1: Characteristics of Major Meteorological Drought Spells (based on 12-month SPI)
Start Start End End Duration Mean Max Overall PeakYear Month Year Month (Months) Area (%) Intensity Severity Score Year
1986 9 1988 6 21 12.252 −1.810 218.10 1987
2000 9 2003 9 36 14.839 −2.6921 737.65 2003
2009 3 2010 7 16 12.742 −2.1636 253.47 2009
2015 7 2018 12 41 8.688 −10002 245.56 2016
Source: Adapted from Mishra (2019).
Table 2: Characteristics of Top 10 Heat Wave Years in India since 1981S Year Duration Magnitude Start End No (Days) Date Date
1 1995 13 18.40 29 May 10 June
2 1998 15 17.90 20 May 3 June
3 2012 11 11.60 23 May 2 June
4 2003 7 10.70 30 May 5 June
5 1984 10 9.90 18 May 27 May
6 2013 9 9.30 17 May 25 May
7 2015 8 7.50 20 May 27 May
8 1988 7 7.20 08 May 14 May
9 2010 9 6.80 10 May 18 May
10 2014 5 5.20 4 June 8 June
Source: Adapted from Mishra et al (2017).
ECO
NOM
IC &
PO
LITI
CAL
WEE
KLY

REVIEW OF RURAL AFFAIRS
Published on Saturday, june 27, 2020 vol lV nos 26 & 27 EPW Economic & Political Weekly8
in the east-central region of India. Nonetheless, in terms of heatwave mortality, the 2015 event ranked second (after 1998) indicating that localised heatwaves can also be detrimental (Rohini et al 2016; Ratnam et al 2016; Pattanaik et al 2017). The major El Nino event in 1997–98 was a worldwide phenom-enon causing severe heatwave in the east coast of India in 1998. This was the severest heatwave in the past 50 years, resulting in more than 2,500 human casualties (De et al 2005).
Based on the above discussion, Table 3 shows the drought and heatwaves years selected for the analysis purpose. Though, the effect of the drought and heatwaves varies signifi cantly not only by region, but even within a region as well, the analysis at this stage focuses on India rather than disaggregating it spatially. The national-level data presents a comprehensive image of the sector while concealing the regional variation. This may present a misleading picture of the impacts.
The impacts of droughts and heatwaves are reviewed on 10 crops, namely paddy, jowar, bajra, maize, tur, groundnut, soy-bean, wheat, mustard, and gram. National annual production data for each commodity is sourced from Agricultural Statis-tics at a Glance, 2018, Ministry of Agriculture and Farmers Welfare, Government of India. The crop production in the “event years” are compared to the fi ve-year moving average production data. While calculating the moving average, the data from event years are excluded.
Estimation Results
The analysed results of crop production during the drought and/or heatwave years selected are presented herein. The objective is to determine whether there is any consistent pro-duction pattern indicating the adaptation to drought and heat-wave event over the time.
Figure 1(A)–(J) depicts the percentage deviation from the fi ve-year moving average (excluding the event years) for the major droughts and heatwave occurrence years as mentioned in Table 3. The results suggest a mixed pattern. For paddy, bajra, maize, groundnut, and rapeseed/mustard, there is a dis-tinct pattern of decreasing deviation from the mean over suc-cessive events. This is in line with the hypothesis that with the occurrence of regular extreme events, actions are taken to mitigate the damage or losses. This demonstrates the adapta-bility to extreme events over time. By 2015–16, production was hardly affected in the case of paddy and maize. The deviation
from the mean production for these crops was very minimal, that is, in the range of 2%–4.50%.
However, tur (arhar) and soybean show a deviant pattern. In both the crops, production was more severely affected in 2015–16 than in 2009–10, and more in 2000–03 than in 1986–88. This does not signify any systematic minimisation or adapta-bility efforts to the events. On the other hand, wheat and gram does not show any strong pattern. The 2009–10 drought resulted in positive deviation from the mean, while 1986–88, 2000–03 and 2015–16 showed a decrease below the average. Nonetheless,
Table 3: Major Drought and Heat Wave Years Selected for StudyYears Duration Period Characteristics
1986–88 21 months September 1986 to Drought and heat waves of June 1988 seven days duration (8 May to 14 May 1988)
2000–03 36 months September 2000 to Drought and heat waves of September 2003 seven days duration (30 May to 5 June 2003)
2009–10 16 months March 2009 to Drought and heat waves of July 2010 nine days duration (10 May to 18 May 2010)
2015–18 41 months July 2015 to Drought and heat waves of December 2018 eight days duration (20 May to 27 May 2015)
Figure 1: Deviation from Five Year Moving Average for D
0
-2
-4
-6
-8
-10
-12
-14
-16
-18
-20
(A) Rice
1987–88 2002–03 2009–10 2015–16
0
-2
-4
-6
-8
-10
-12
-14
-16
-18
-20
(B) Jowar
1986–87 2002–03 2009–10 2015–17
0
-5
-10
-15
-20
-25
-30
-35
-40
-45
(C) Bajra
1985–88 2002–03 2009–10 2015–16
0
-5
-10
-15
-20
-25
-30 1987–88 2002–03 2009–10 2015–16
(D) Maize
ECO
NOM
IC &
PO
LITI
CAL
WEE
KLY

REVIEW OF RURAL AFFAIRS
Economic & Political Weekly EPW Published on Saturday, june 27, 2020 vol lV nos 26 & 27 9
on the positive side, the deviation below the average did de-crease over the three drought years in the case of wheat.
The above discussion does not intend to claim with statisti-cal certainty that the changes in production are due to climate change or weather variables. As mentioned, the objective of the research is to examine the impact on production during drought and heatwave years and establish farmers’ adaptabil-ity to the same. As the series of drought years is just four for the study, it is not possible to carry out regression analysis with a small set. Therefore, we cannot ascertain that the impact during those particular years is due to drought or heat-wave. But, the interest lies in knowing the impact on produc-tion of occurrence of drought or heatwave.
Discussion
This section provides a discussion of the implications of these fi ndings in light of the ability of Indian agriculture to adapt to future extreme events.
What happened after the events? Farmers adjust their agri-cultural practices to cope up with climate change in a variety of ways. These potential adaptations include intra-crop and inter-crop. In the case of intra-crop adaptation, farmers adjust their agricultural practices to cope up with climate change
while growing the same crop as before. For instance, provid-ing irrigation facilities by making investment in irrigation to protect the crop against heat stress and drought (Lobell and Gourdji 2012; Tack et al 2017; Taraz 2017); avoiding the hottest time of the year by shifting the sowing date (Waha et al 2013); and adjusting the fertiliser or other agricultural inputs to deal with heat (Dufl o et al 2011; Jagnani et al 2018). As a part of their adaptation strategy, farmers sometimes plant heat-resist-ant or drought-tolerant varieties of the crop. In the case of in-ter-crop adaptation, farmers grow the crops that are more tol-erant to heat/drought on a greater portion of their land. For example, sorghum and maize are more heat-tolerant than rice. Switching to crops that grow in the cooler part of the year, such as wheat, that grows in the winter months in India, also constitutes an inter-crop adaptation.
The expansion of irrigation facilities undoubtedly is the single biggest adaptation strategy to reduce the impact of droughts and heatwaves. In India, since independence, the successive governments have made massive investments in irrigation facilities. By the end of Eleventh Five Year Plan, public invest-ment in the sector was over `4,819 billion, of which 73% was on major and medium irrigation (MMI) alone (Planning Commission 2013). Consequently, the area under irrigation increased substantially from 22.56 million ha in 1950–51 to
0
-5
-10
-15
-20
-25 1986–88 2002–03 2009–10 2015–16
(E) Tur/Arhar
0
-5
-10
-15
-20
-25
-30
-35
-40
-45
(F) Groundnut
1985–88 2002–03 2009–10 2015–16
0
-5
-10
-15
-20
-25
-30
-35
(G) Soybean
1986–88 2000–03 2009–10 2015–16
4
3
2
1
0
-1
-2
-3
-4
(H) Wheat
1986–88 2000–03 2009–10 2015–16
0
-5
-10
-15
-20
-25
-30
(I) Rapeseed and Mustard
1985–87 2002–03 2009–10 2015–16
20
15
10
5
0
-5
-10
-15
-20
-25
(J) Gram
1986–88 2000–03 2009–10 2014–16
ECO
NOM
IC &
PO
LITI
CAL
WEE
KLY

REVIEW OF RURAL AFFAIRS
Published on Saturday, june 27, 2020 vol lV nos 26 & 27 EPW Economic & Political Weekly10
over 92 million ha in 2012–13. During the same period, the surface irrigated area also witnessed an expansion from 11.92 million ha to about 18 million ha (for details, see Kumar et al 2009; Narayanamoorthy 2007).
The responsiveness to irrigation varies from crop to crop. Crops like paddy and wheat gives much better response in terms of yield and quality, if they get water at specifi c times in their growing cycle. With the introduction of the green revolu-tion technology, large public investments were made in irriga-tion projects in the state of Punjab, Haryana and western Uttar Pradesh (states where green revolution technologies were originally introduced). As a result, there was substantial in-crease in percentage of area under irrigation of rice, wheat and maize. For instance, in 1971–72, only around 38% of the paddy area was under irrigation, but by 1981–82 this fi gure had risen to 42%. This witnessed further steady increase from the mid-1980s, reaching 46% in 1991–92 and 55% in 2001–02. Signifi cant progress has been made with regard to expansion of irrigation over the period of time in the case of other crops as well, as evident from Table 4.
However, in the case of long-term droughts or droughts that occur over successive seasons, irrigation as a potential adapta-tion strategy is constrained by physical water availability. This factor is likely to become increasingly binding due to the exh austion of renewable water supply and depletion of non- renewable resources (Konikow and Kendy 2005; Wada et al 2010; Famiglietti 2014; Zaveri et al 2016).
In this context, as an alternative, short-duration and drought-tolerant varieties of crops become an important consideration to mitigate the impact of the extreme climate and contribute towards potential adaptation. For example, to deal with defi -cient rainfall situations in Aurangabad district of Maharashtra, short-duration and drought-tolerant varieties of pigeon pea (BDN-708), green gram (BM 2002-1), and chick pea (Digvijay and Vijay) were introduced that gave 20%–25% higher yield than the local varieties. Similarly, in the case of rice, short-duration and drought-tolerant varieties that can survive up to two weeks of exposure to dry spells were developed. For in-stance, Sahbhagi dhan (105–110 days) for plain areas of Jharkhand state, Naveen (115–120 days) for Odisha, and Anjali (90 days) for Jharkhand (Prasad et al 2015).
Apart from this, other adaptive measures used in many drought-prone areas of the country include intercropping sys-tems with the predominant crops of the region, water harvesting and storage to avoid delay in the onset of monsoon. In the case of intercropping, it occurred with soybean + pigeon pea (4:2), pearl millet + pigeon pea (3:3), pigeon pea + green gram (1:2), and cotton + green gram (1:1). The system has performed
signifi cantly better than the respective sole crops at Aurangabad, Maharashtra, which receives an average rainfall of 645 mm (Prasad et al 2015).
Implications under current climate: The analysis made in this paper indicates that the adaptation to current climate variability has occurred across most of the studied commodities. The adap-tation to climate variability was on account of several factors, including advancement in technology, increased awareness, in-stitutional learning, practical strategies to cope with droughts and so on. However, there exists considerable variation across crops regarding the adaptability to climatic variability. This vari-ation is based on the sensitivity of the crop to water stress and heat, crop responsiveness to irrigation and cost of adaptation in relation to the value of crop. In addition, as the analysis in this paper made at the national level, the regional variations in weather are ignored. For instance, based on the variability of weather conditions, the impact of a drought will be much harsh-er in some regions than in others. The variation in timing and duration of the events will also have variable effects on crops, thereby making the direct comparison of events more diffi cult.
Most importantly, the analysis results are in no way intend-ed to claim that the past rate of adaptation can be maintained in the future as well. This is because some of the adaptation strategies used over the last couple of decades were relatively easy to implement and were not having much binding con-straints. This, however, may not be the case in the future. For example, the expansion of irrigation facilities that has been a promising adaptation strategy to climate change is constrained by physical water availability and is likely to become increas-ingly binding due to the depletion of groundwater aquifers and exhaustion of renewable water supply. Furthermore, water availability will be affected and irrigation may not be feasible if there is an increase in intensity, duration or frequency in droughts or heatwaves in future.
Ensuring effi cient adaptation: The model used in this paper assumes that adaptation is free of cost, that is, there is no associated cost of adaptation as it looks into the overall effect of extreme events on production. However, in reality this may be true in some routine changes that can be part of day-to-day management practices, but in the majority of the cases adaptations incur signifi cant costs. Additionally, this study does not distinguish between planned and autonomous adap-tation, implying that the costs and outcomes can differ de-pending on the type of adaptation. Autonomous adaptation is the reaction of farmers to climate variability by changing crops or adjusting harvest and planting/sowing times, where-as, planned adaptation measures are conscious policy options or response strategies, often multisectoral in nature, aimed at altering the adaptive capacity of the agricultural system or facilitating specifi c adaptations. Deliberate crops selection and distribution across different agroclimatic zones, substitution of new crops for old ones and resource substitution induced by scarcity are some of the examples of planned adaptation (Easterling 1996). Therefore, to make adaptation more
Table 4: Expansion of Irrigation (% irrigated area)Year Rice Bajra Maize Groundnut Wheat
1971−72 37.93 3.94 16.14 6.86 53.29
1981−82 41.68 5.82 21.30 13.20 69.66
1991−92 46.31 5.96 20.98 18.24 81.70
2001−02 54.67 7.51 21.55 17.55 88.04
2011−12 58.09 8.44 24.81 23.38 92.33
2014−15 59.41 9.23 26.56 25.91 93.74
Source; Directorate of Economics and Statistics, Ministry of Agriculture, GoI.
ECO
NOM
IC &
PO
LITI
CAL
WEE
KLY

REVIEW OF RURAL AFFAIRS
Economic & Political Weekly EPW Published on Saturday, june 27, 2020 vol lV nos 26 & 27 11
effi cient and realistic, it is important to consider the associated costs and benefi ts.
The process of adaptation and infl uencing parameters are cru-cial compared to the impact of climate change. The overarching suggestions are to diagnose and understand adaptation strate-gies against climate variability with a focus on the dyna mics, di-versity and fl exibility of adaptations. The idea is to search and promote approaches and options and to harness them in the changing economic, technological and institutional scenario. This needs capacity building, reorientation, facilitation and sup-porting innovations for the farmers and the larger community.
Adaptive capacity in Indian agriculture: Adaptive capacity is a blend of resources and assets that form the base for adapt-ability. In the Third Assessment Report of IPCC, it is recog-nised that adaptive capacity may be latent and become active only when systems get exposure. Vulnerability is the sum total of exposure, sensitivity and adaptive capacity (IPCC 2001). Adaptive capacity being a component of vulnerability (Kelly and Adger 2000), has diverse elements encompassing the abil-ity to modify exposure, absorb and recover from losses, and exploit new opportunities in the process of adaptation.
The analysis in this paper indicates that Indian agriculture is relatively well-adapted to climate variability. Apparently, there are many paradoxes on the ability of agriculture to adapt to climate change. It is assumed that the capacity to adapt to climate risk depends on the level of economic development. The more economically developed a society is, greater will be the access to technology and resources facilitating adaptation (Adger and Vincent 2005). However, high income per capita is considered neither a necessary nor a suffi cient indicator of the capacity to adapt to climate change (Moss et al 2001). Charac-teristics such as social capital and networks, values, percep-tions, traditions and cognition levels infl uence the adaptive capacity of communities. Certain dimensions of adaptive capacity are generic, such as wealth, education, skills, access
to resources and management capabilities. Indicators specifi c to an impact, such as drought or fl oods, may relate to institu-tions, knowledge and technology (Yohe and Tol 2002; Downing 2003; Brooks et al 2005; Tol and Yohe 2007).
There are several potential barriers to adaptation. Some of these barriers may be structural or physical in nature such as physical characteristics of the land. Other barriers are social cap-ital and behavioural and attitudinal characteristics of producers to risk. Behavioural and attitudinal limits are infl uenced by the social and cultural upbringing. Individuals and communities vary in risk tolerance depending on their world views, values and beliefs. Confl icts, power differences and access to decision-makers have differential outcomes on adaptability.
Conclusions
This paper examines the impact of heatwaves and droughts on agricultural production. It is based on the presumption that as an event occurs regularly, farmers learn from the past and adapt to mitigate future effects. Consequently, the impact of each successive drought and heatwaves would be less than the previous one. The analysis indicates that the adaptation to climate variability has occurred across most of the studied commodities. Several factors, including advancement in tech-nology, increased awareness, institutional learning, practical strategies to cope, support by government and society, are accounted for. Apart from this, the Indian agriculture has the technological and fi nancial capacity to adapt to challenges posed by climate change.
Despite the relatively high adaptive capacity, the adaptation to future climate change will depend upon the farmers’ choices and the factors infl uencing these choices. Or in other words, the way in which agriculture will respond to climate change and the suc-cess of actions will depend upon various structural and physical barriers to adaptation. Spontaneity to respond and prioritisation of challenges faced by farmers and the ability to implement the changes are other factors impelling adaptation.
Notes
1 Developed world is concentrated in temperate zone where temperature increase will result in greater agricultural production. Countries in tropical zone (mostly developing countries) are more vulnerable to increase in temperature and have unfavourable impact on food production.
2 This approach draws on Ricardo’s (1817) notion that land values reflect land productivity (which is determined by its intrinsic characteristics).
3 Include “no adaptation, some level of adapta-tion and full adaptation” as various options .
4 Distinguished three arbitrary levels of adap-tation. In the “without adaptation” scenario, farmers continue to behave as they currently do, that is they completely ignore that climate has changed. Under “level 1 adaptation,” small adjustments in behaviour and modest capital investments (within the capacity of an individ-ual farm) are allowed. “Level 2 adaptation” assumes large adjustments and investment.
5 Lack of precipitation over a period of time re-sults in meteorological drought, whereas inad-equate surface and sub-surface water results into hydrological drought.
6 Using all-India average Standardised Precipi-tation Index (SPI), only those drought spells were selected that lasted for more than six
months and had maximum intensity higher than -1.6, which is used as a threshold to cate-gorise an “extreme” drought (Mishra 2019) .
References
Adger, W N and K Vincent (2005): “Uncertainty in Adaptive Capacity,” Comptes Rendus Geosci-ence, Vol 337, No 4, pp 399–410.
Barriopedro, D, E M Fischer, J Luterbacher, R M Trigo and R Garcia-Herrera (2011): “The Hot Summer of 2010: Redrawing the Tempera-ture Record Map of Europe,” Science, Vol 332, No 6026, pp 220–24.
Bhat, G S (2006): “The Indian Drought of 2002: A Sub-seasonal Phenomenon?,” Quarterly Jour-nal of Royal Meteorological Society, Vol 132, No 621, pp 2583–602.
Brooks, N, W N Adger and P M Kelly (2005): “The Determinants of Vulnerability and Adaptive Cap acity at the National Level and the Implica-tions for Adaptation,” Global Environmental Change, Vol 15, No 2, pp 151–63.
Carter, T R, M L Parry, H Harasawa and S Nishioka (1994): “IPCC Technical Guidelines for Assess-ing Climate Change Impacts and Adaptations,” Department of Geography, University College London.
Challinor, A J, J Watson, D B Lobell, S M Howden, D R Smith and N Chhetri (2014): “A Meta-analysis of Crop Yield under Climate Change and Adapta-tion,” Nature Climate Change, Vol 4, No 4, pp 287.
Chang, F C and J M Wallace (1987): “Meteorological Conditions during Heat Waves and Droughts in the United States Great Plains,” American Mete-orological Society, July, pp 1253–69.
De, U S and R K Mukhopadhyay (1998): “Severe Heat Wave Over Indian Subcontinent in 1998 in a Perspective of Global Climate,” Current Science, Vol 75, pp 1308–11.
De, U S, R K Dube and G S Prakasa Rao (2005): “Extreme Weather Events Over India in the Last 100 Years,” Journal of Indian Geophysics Union, Vol 9, No 3, pp 173–87.
Downing, T (2003): “Toward a Vulnerability/Adap-tation Science: Lessons from Famine Early Warning and Food Security,” Climate Change Adaptive Capacity and Development, J B Smith, R J T Klein and S Huq (eds), Imperial College Press, London.
Dufl o, E, M Kremer and J Robinson (2011): “Nudg-ing Farmers to Use Fertiliser: Theory and Ex-perimental Evidence from Kenya,” American Economic Review, Vol 101, No 6, pp 2350–90.
Easterling, W E, P R Crosson, N J Rosenberg, M S McKenney, L A Katz and K M Lemon
ECO
NOM
IC &
PO
LITI
CAL
WEE
KLY

REVIEW OF RURAL AFFAIRS
Published on Saturday, june 27, 2020 vol lV nos 26 & 27 EPW Economic & Political Weekly12
(1996): “Agricultural Impacts of and Responses to Climate Change in the Missouri-Iowa-Nebraska-Kansas (MINK) Region,” Climatic Change, Vol 24, pp 23–61.
Emanuele, M and R Mendelsohn (2018): “Measur-ing Climate Adaptation: Methods and Evidence,” Review of Environmental Economics and Policy, Vol 12, No 2, pp 324–41.
Famiglietti, J (2014): “The Global Groundwater Crisis,” Nature Climate Change, Vol 4, No 11, pp 945–48.
Fischer, E M, S I Seneviratne, P L Vidale, D Lüthi and C Schär (2007): “Soil Moisture–atmos-phere Interactions during the 2003 European Summer Heat Wave,” Journal of Climate, Vol 20, No 20, pp 5081–99
GoI (2018): “Economic Survey of India, 2017–18,” Government of India, Chapter 6.
Hauser, M, R Orth and S I Seneviratne (2016): “Role of Soil Moisture Versus Recent Climate Change for the 2010 Heat Wave in Russia,” Geophysical Research Letter, Vol 43, No 06, pp 2819–26.
Hoerling, M, A Kumar, R Dole, J W Nielsen-Gam-mon, J Eischeid, J Perlwitz, X Quan, T Zhang, P Pegion and M Chen (2013): “Anatomy of an Extreme Event,” Journal of Climate, Vol 26, No 9, pp 2811–32.
IMD (2015): “Annual Climate Summary 2015,” The Meteorological Offi ce Press, Pune, India, Indi-an Meteorological Department, http://www.imdpune.gov.in/Links/annual%20summa-ry%202015.pdf.
— (2018): “Seasonal Outlook for the Tempera-tures during March to May 2018,” Indian Mete-orological Department, http://www.imd.gov.in/pages/press_release_view.php?ff =20180228_pr_205.
IPCC (2001): “Climate Change 2001: Impacts, Ad-aptation, and Vulnerability,” Report of Work-ing Group II, Summary for Policy Makers, Intergovernmental Panel on Climate Change, New York: Cambridge University Press.
— (2014): “Mitigation of Climate Change,” Contri-bution of Working Group III to the Fifth Assess-ment Report of the Intergovernmental Panel on Climate Change, Cambridge, UK and New York.
Jagnani, M, C Barrett, Y Liu and L You (2018): “Within-Season Producer Response to Warmer Temperatures: Defensive Investments by Ken-yan Farmers,” https://papers.ssrn.com/sol3/papers.cfm?abstractid=3056840.
Kelly, P M and W N Adger (2000): “Theory and Practice in Assessing Vulnerability to Climate Change and Facilitating Adaptation,” Climate Change, Vol 47, No 4, pp 325–52.
Konikow, L F and E Kendy (2005): “Groundwater Depletion: A Global Problem,” Hydrogeology Journal, Vol 13, No 1, pp 317–20.
Kumar, K R, K K Kumar and G B Pant (1994): “Diur-nal Asymmetry of Surface Temperature Trends over India,” Geophysical Research Letters, Vol 21, No 8, pp 677–80.
Kumar, P, P K Joshi and P K Aggarwal (2014): “Pro-jected Effect of Droughts on Supply, Demand, and Prices of Crops in India,” Economic & Politi-cal Weekly, Vol 49, No 52, pp 54–63.
Kumar, M D, A Narayanamoorthy and O P Singh (2009): “Groundwater Irrigation versus Sur-face Irrigation,” Economic & Political Weekly, Vol 44, pp 72–73.
Lobell, D B and S M Gourdji (2012): “The Infl uence of Climate Change on Global Crop Productivity,” Plant Physiology, Vol 160, No 4, pp 1686–97.
Mendelsohn, R, W D Nordhaus and D Shaw (1994): “The Impact of Global Warming on Agricul-ture,” American Economic Review, Vol 84, No 4, pp 753–71.
Met Offi ce (2011): “Climate: Observations, Projec-tions and Impacts: India,” Met Offi ce Exeter, UK, http://www.metoffi ce.gov.uk/media/pdf /7/ i/India.pdf.
Mishra, V, S Aadhar, A Asoka, S Pai and R Kumar (2016): “On the Frequency of the 2015 Monsoon
Season Drought in the Indo-Gangetic Plain,” Geophysical Research Letters, Vol 43, No 23, pp 12102–112.
Mishra, V, S Mukherjee, R Kumar and A D aith ı Stone (2017): “Heat Wave Exposure in India in Current, 1.5◦C, and 2.0◦C Worlds,” Environ-mental Research Letter, Vol 12, No 12, 124012.
Mishra, Vimal (2019): “Long-term (1870–2018) Drought Reconstruction in Context of Surface Water Security in India,” Journal of Hydrology, 580 (2020), 124228.
Misra, A K (2014): “Climate Change and Challenges of Water and Food Security,” International Journal of Sustainable Built Environment, Vol 3, No 1, pp 153–65.
Moss, R H, A L Brenkert and E L Malone (2001): “Vulnerability to Climate Change: A Quantita-tive Approach,” Pacifi c Northwest National Laboratory, Richland Washington.
Narayanamoorthy, A (2007): “Tank Irrigation in India: A Time Series Analysis,” Water Policy, Vol 9, pp 193–216.
Nelson, G C, D Mensbrugghe, H Ahammad, E Blanc, K Calvin, T Hasegawa and H Lotze-Campen (2014): “Agriculture and Climate Change in Global Scenarios: Why Don’t the Models Agree,” Agricultural Economics, Vol 45, No 1, pp 85–101.
NOAA (2015): “India Heat Wave Kills Thousands,” https://www.climate.gov/news-features/event-tracker/india-heat-wave-killsthousands.
Olivier, Deschênes and Michael Greenstone (2007): “The Economic Impacts of Climate Change: Evidence from Agricultural Profi ts and Ran-dom Fluctuations in the Weather,” American Economic Review, Vol 97, No 1, pp 354–85.
Pandey S, H Bhandari and B Hardy (2007): “Eco-nomic Costs of Drought and Rice Farmers’ Cop-ing Mechanisms: A Cross-country Comparative Analysis from Asia,” International Rice Research Institute, Manila.
Parry, M L, C Rosenzweig, A Iglesias, M Livermore and G Fischer (2004): “Effects of Climate Change on Global Food Production under SRES Emissions and Socio-economic Scenarios,” Global Environmental Change, Vol 14, pp 53–67.
Parry, M L, C Rosenzweig and M Livermore (2005): “Climate Change, Global Food Supply and Risk of Hunger,” Philosophical Transactions of the Royal Society: Biological Sciences, 360, pp 2125–38.
Pathak H, P K Aggarwal and S D Singh (2012): “Cli-mate Change Impact, Adaptation and Mitiga-tion in Agriculture: Methodology for Assess-ment and Applications,” Indian Agricultural Research Institute, New Delhi.
Pattanaik, D R, M Mohapatra, A K Srivastava and A Kumar (2017): “Heat Wave over India during Summer 2015: An Assessment of Real Time Ex-tended Range Forecast,” Meteorology and Atmospheric Physics, Vol 129, No 4, pp 375–93.
Pingali, P, A Aiyar, M Abraham and A Rahman (2019): Transforming Food Systems for a Rising India, Palgrave Studies in Agricultural Economics and Food Policy, Palgrave Macmillan (Open Access).
Planning Commission (2013): Twelfth fi ve-year plan: 2012–17, Government of India,New Delhi.
Prasad, Y G, Ch Srinivasarao, J V N S Prasad, K V Rao, D B V Ramana, K A Gopinath, I Srinivas, B S Reddy, R Adake, V U M Rao, M Maheswari, A K Singh and A K Sikka (2015): “Techno logy Demonstra-tions: Enhancing Resilience and Adaptive Ca-pacity of Farmers to Climate Variability,” Na-tional Innovations in Climate Resilient Agricul-ture (NICRA) Project, ICAR-Central Research Institute for Dryland Agriculture, Hyderabad.
Prentice, I C, S P Harrison and P J Bartlein (2011): “Global Vegetation and Terrestrial Carbon Cycle Changes after the Last Ice Age,” New Phy-tologist, Vol 189, No 4, pp 988–98.
Qadir, M, A Tubeileh, J Akhtar, A Larbi, P S Minhas and M A Khan (2008): “Productivity Enhance-ment of Salt-affected Environments through
Crop Diversifi cation,” Land Degradation and Development, Vol 19, No 4, pp 429–53.
Ratnam, J V, S K Behera, S B Ratna, M Rajeevan and T Yamagata (2016): “Anatomy of Indian Heat Waves,” Scientifi c Reports 6, Article No 24395.
Reilly, J N, W Baethgen and F E Chege (1996): “Agri-culture in a Changing Climate: Impacts and Ad-aptations,” Climate Change 1995: Impacts, Adap-tations and Mitigation of Climate Change, R T Watson, M C Zinyowera, R H Moss (eds), Cam-bridge: Cambridge University Press, pp 427–67.
Ricardo, D (1817): On the Principles of Political Economy and Taxation, 3rd ed, London: John Murray.
Rohini, P, M Rajeevan and A K Srivastava (2016): “On the Variability and Increasing Trends of Heat Waves over India,” Scientifi c Reports 6, Article No 26153.
Rosenzweig, C and M L Parry (1994): “Potential Im-pact of Climate Change on World Food Supply,” Nature, Vol 367, pp 133–38.
Rosenzweig, C and F N Tubiello (2007): “Metrics for Assessing the Economic Benefi ts of Climate Change Policies in Agriculture,” Rep No ENV/EPOC/GSP (2006)12/FINAL, OECD, Paris.
Samanta, D, M K Dash, B N Goswami and P C Pan-dey (2015): “Extratropical Anticyclonic Rossby Wave Breaking and Indian Summer Monsoon Failure,” Climate Dynamics, Vol 46, Nos 5–6, pp 1547–62.
Tack, J, A Barkley and N Hendricks (2017): “Irriga-tion Offsets Wheat Yield Reductions from Warming Temperatures,” Environmental Re-search Letters, Vol 12, No 11, 114027–10.
Taraz, V (2017): “Adaptation to Climate Change: Historical Evidence from the Indian Monsoon,” Environment and Development Economics, Vol 22, No 5, pp 517–45.
Taylor, R G, B Scanlon, P Döll, M Rodell, R Van Beek, Y Wada, … M Edmunds (2013): “Ground Water and Climate Change,” Nature Climate Change, Vol 3, No 4, pp 322.
Tol, R S J and G W Yohe (2007): “The Weakest Link Hypothesis for Adaptive Capacity: An Empiri-cal Test,” Global Environmental Change, Vol 17, No 02, pp 218–27.
Tol, R, S Fankhauser and J B Smith (1998): “The Scope for Adaptation to Climate Change: What Can We Learn from the Impact Literature,” Global Environmental Change, Vol 8, pp 109–23.
UNESCAP (2016): “Disasters in Asia and the Pacifi c: 2015 Year in Review,” United Nations Economic and Social Commission for Asia and the Pacifi c, http://www.unescap.org/sites/default/fi les/2015_Year%20in%20Review_fi nal_PDF_1.pdf.
Waha, K, C Müller, A Bondeau, J P Dietrich, P Ku-rukulasuriya, J Heinke and H Lotze-Campen (2013): “Adaptation to Climate Change through the Choice of Cropping System and Sowing date in Sub-Saharan Africa,” Global Environ-mental Change, Vol 23, No 1, pp 130–43.
Watson, R T, M C Zinyowera and R H Moss (1998): “The Regional Impacts of Climate Change. An Assessment of Vulnerability,” A Special Report by the Intergovernmental Panel on Climate Change, Geneva.
Wolfram, Schlenker and Michael J Roberts (2009): “Nonlinear Temperature Effects Indicate Se-vere Damages to US Crop Yields under Climate Change,” Proceedings of the National Academy of Sciences, Vol 106, No 37, pp 15594–98.
Yohe, G and R S J Tol (2002): “Indicators for Social and Economic Coping Capacity: Moving Toward a Working Defi nition of Adaptive Capacity,” Glob-al Environmental Change, Vol 12, No 1, pp 25–40.
Zaveri, E, D S Grogan, K Fisher-Vanden, S Frolking, R B Lammers, D H Wrenn, A Prusevich, R E Nicholas (2016): “Invisible Water, Visible Im-pact: Groundwater Use and Indian Agriculture under Climate Change,” Environmental Research Letter, Vol 11, No 8.
ECO
NOM
IC &
PO
LITI
CAL
WEE
KLY

REVIEW OF RURAL AFFAIRS
Economic & Political Weekly EPW Published on Saturday, june 27, 2020 vol lV nos 26 & 27 13
The author is thankful to R K Sharma and Seema Bathala for their supervision and guidance for the study.
Jitender Singh ( [email protected]) is with the Indian Economic Service, Government of India.
Small Farmers and Organised Retail Chains in India
Jitender Singh
This study compares farmers selling vegetables to
Mother Dairy, an organised retail chain, with those
selling to the local mandi in Haryana to find out the
drivers and constraints determining their participation in
these two types of marketing chains, particularly for the
small farmers. The findings suggest the significance of
farm size in determining farmers’ participation in
organised retail chains. Using Heckman selection–
correction model, the study found that though the
income of participating farmers increases, the increase
depends on farm size, while the Ginni coefficient shows
that the inequality in income distribution is more among
the participants than the non-participating farmers.
The world over rapid rise of organised retail chains (ORCs)1 has been transforming the agricultural food marketing system progressively (Dries et al 2004).2 However, this
transformation in India has been slow, both at the upstream and downstream of the supply chain. The size of the food retail market in India was estimated to be large, where the share of agricultural food retailing is growing faster (GoI 2007; NABARD 2011). On the one hand, ORCs are seen as an effective channel to link farmers with markets, while, on the other, concerns have also been raised about its impacts on the farmers, particularly the smallholders.
One of the concerns is that agribusiness fi rms deal mostly with relatively large farmers and exclude the smaller ones. The exclusion of the small farmer from relatively liberalised markets and contract farming can lead to more concentrated landownership and displacement of the rural poor (Key and Runsten 1999).3 The benefi ts distribution within the rural community by new marketing channels like contract farming can have important implications for their economic and social differentiations (Korovkin 1992). This concern is particularly relevant in case of India where, number of small farmers is on the rise and their farm sizes are shrinking,4 which is resulting in decline of marketable surplus capacity. The small and mar-ginal farmer households earn less than what they spend,5 and half of them are indebted, and most of them live in severe poverty (Kumar et al 2011). Although farmers’ participation neither guarantees its benefi ts nor insures them against its risks, non- participation excludes them from its potential ben-efi ts, thus increasing inequalities.
Further, the issues, such as high quality standards, high rejection rate, procurement of few crops, partial procurement of produce, and delay in payments, may affect income of the participating farmers. The counter-view is that higher prices for better quality, low waste, diversifi cation towards high value crops and reduction in marketing cost may improve in-come of the participating farmers. Besides, inputs and other services by ORCs to farmers can improve their productivity, thus improving their income.
Some of the agriculture produce marketing challenges in Indian agriculture have been listed in government reports, including the inter-ministerial committee of the government of India and the working groups for the Twelfth Five Year Plan. Inadequate provisioning of regulated markets forces farmers to bear dis-proportionately higher marketing cost.6 Long distance travels and poor logistic support create huge wastage of agricultural produce. Large number of rural markets are still deprived of weighting, measuring, sorting and packaging facilities.7
ECO
NOM
IC &
PO
LITI
CAL
WEE
KLY

REVIEW OF RURAL AFFAIRS
Published on Saturday, june 27, 2020 vol lV nos 26 & 27 EPW Economic & Political Weekly14
Moreover, the tax and licencing has increased the trans-action cost and put barriers to entry for market agents.8 The undue regulation of markets has also prevented private invest-ment in marketing infrastructure, post-harvest management, grading and packaging. Regulation has also hampered devel-opment of alternative marketing channels in India (Patnaik 2011). Overall, the price effi ciency in India has also been low, especially in case of the vegetables.9 The agriculture markets in India are also not well integrated, regionally, vertically and temporally (Acharya 2004). Reforms in agriculture marke ting in India have been slow.
Since 1950, agriculture and agriculture marketing being a states subject, states have enacted Agricultural Produce Market Committee (APMC) Acts to regulate agriculture markets. Its objective was to protect farmers from the exploi-tation of intermediaries and traders to ensure better prices and timely payment for their produce. The National Com-mission on Agriculture, 1976 reviewed the performance of regulations of agriculture markets and found that regulated markets (70% of secondary or terminal markets) have bene-fi tted farmers by preventing trading malpractices, such as unautho rised market charges, falsifi cation of weights and measures. The commission therefore inter alia recom mended: (i) establishing a market within a radius of 5 kilometres (km); (ii) bringing unregulated assembly, terminal and even primary markets under regulation; (iii) constitution of a market committee to supervise the market as per rules and regulation; (iv) providing facilities of weighting, grading and storing in each regulated market; and (v) licensing market functionar-ies, like commission agents and trader. But, over the year reg-ulated markets have failed to yield the desired results. As per the Shankerlal Guru Committee, 2001, the regulated agricul-ture market has res tricted marketing in India. Later on, efforts have been made to reform the APMC Act, in 2003, and also to promote the direct marketing as an alternative marketing structure. Recently, many organised retail chains, both pri-vate and public, have started operations. Of these, Mother Dairy, is a government enterprise, working since 1985.
Against this backdrop, this study compares farmers selling vegetables to Mother Dairy, an organised retail chain, with those selling to local mandi in Haryana, to fi nd out the driv-ers on their participation in the Mother Dairy chain and con-sequently the impact on their income, particularly for the small farmers. The study provides evidences that may help in policy decisions on providing institutional mechanisms to make the supply chains inclusive. Besides, it contributes in the debate on impact of ORCs on farmers’ income, which may help in policy decisions to devise appropriate institutional framework to restrain the exploitative character of the ORCs. Moreover, the study, unlike many studies in the case of India, uses improved methods to remove the possible selection bias in the sample. The study also discusses the sources of the income impact along with a comparison of income distribu-tion between the farmers participating in the farmers market association (FMA farmers henceforth) and those not participating therein (non-FMA farmers henceforth).
BackgroundKumar (2006) observed that private agribusiness fi rms in Punjab operated contract farming more effectively, with posi-tive outcomes for the farmers irrespective of the farm size, that while the state corporation-led contract farming seems to favour only those farmers with larger farm who do not benefi t as much as direct contract farmers. In absence of representa-tive farmer organisations, contract farming has limited region-al and local impact in terms of the inclusion of small farmers (Porter and Howard 1997; Key and Runsten 1999).
The participation of the small farmers in the supply chain depends on their relative advantage or disadvantages. Among advantages, a small farmer operating predominantly with family labour can save on the cost of labour supervision, cost of monitoring, screening of hired labour, cost of contract enforcement and cost of negotiation (Key and Runsten 1999). On the other hand, there are disadvantages for small farmers that arise out of their low marketable surplus, low bargaining power and low capacity to invest. Ghezan et al (2002) argued that the factors affecting a small farmer’s access to new mar-keting channels include low marketable surplus, diffi culties in meeting volume, quality and delivery requirements, lack of liquidity to withstand the long payment delays and lack of access to market information.
The small farmer would be interested in contract farming because it facilitates modern inputs, which are normally una-vailable or are more expensively obtained through other sources (Porter and Howard 1997). On the other hand, a fi rm would prefer dealing with large growers to avoid the complexities of deal-ing with a large number of small farmers (Glover and Kusterer 1990) and by looking at the large farmers’ investment capacity, risk bearing ability and relatively uniform quality of land.
Ghezan et al (2002) found that in Argentina, supply chains dominated by multinational fi rms producing frozen French fries, tended to favour medium and large potato farmers, excluding the smallholders. High quality standards imposed on the suppliers work as an entry barrier for small growers (Gutman 2002). Deshingkar et al (2003) found that the benefi ts of gov-ernment-sponsored schemes in horticulture are reaching the bigger farmers rather than the smaller farmers and landless households. Similar observations about the challenges for the small farmers have been made in Costa Rica by Alvarado and Charmel (2002). It has also been witnessed in Africa that produc-ers faced challenges in meeting the tough quality and safety standards, and the requirements to make investments and adopting new practices (Weatherspoon and Reardon 2003; Faiguenbaum et al 2002).
Meeting high quality standards set by ORCs hampers partici-pation of the small producer. The rise in the fi xed cost compo-nent of the cost of exchange also works as an entry barrier for the small farmer. The exclusion becomes more pronounced when the credit market is imperfect and the cost of borrowing is high for the small farmers (Page and Slater 2003). But new institutions, for example, fair trade companies and coopera-tives are helpful in improving the participation of the small producer (Page and Slater 2003).
ECO
NOM
IC &
PO
LITI
CAL
WEE
KLY

REVIEW OF RURAL AFFAIRS
Economic & Political Weekly EPW Published on Saturday, june 27, 2020 vol lV nos 26 & 27 15
Reardon and Swinnen (2004) argue that the rise of ORCs brings opportunities for small farmers because these offer a path into high-quality and high-value markets. Their observation also hints that the transformation in the agricultural food system is in-clusive of more small farms than it was expected. The exclusion was expected based on the arguments of transaction costs and requirement conditions. The assistance by processing fi rms to large and small suppliers is overcoming the obstacles in investing and improving quality because few farms can deliver the required quality, which is forcing the retail chains to integrate vertically to secure a high-quality supply base (Reardon and Swinnen 2004).
Glover (1984) surveys literature on contract farming to examine its bearing on farmers’ welfare, including the issue of participation of the farmer. The study remains inconclusive and argues that in general agribusiness fi rms prefer large farmers, but most deal with whoever is available, while some look for small farmers. Neven and Reardon (2004) found that super-markets were not excluding small farmers from supplying to the markets in Kenya in the initial stages of inception. Sutrad-har (2014) found that farm size was not a signifi cant entry barrier in the participation in Reliance Fresh retail chain in Rajasthan in 2011. Miyata et al (2009) conducted a survey of 162 farmer households in Shandong province in China during 2005 to study the impact of contract farming on income of small farmers. They found little evidence to support the hypothesis that fi rms prefer larger farmers over small ones.
Minot (1986) found positive impact of contract farming on in-come of farmers. Similar observations have also been made by Porter and Howard (1997), in a review of studies conducted on contract farming in Africa. In the Indian context also, a study by Birthal et al (2005) for dairy products found signifi cant improve-ment in the gross margin of those farmers who participated in ORC. Singh (2002) studied models of contract farming in Punjab and highlighted that despite problems in the models of contract farming, the income of the participants has improved. Studies by the Joseph et al (2008) and Chengappa and Nagraj (2005) pro-vide some leading observations on the impact of ORC on income. In a more rigorous analysis, Sutradhar (2014), found that cauli-fl ower farmers in Rajasthan selling through Reliance Fresh have been able to raise their net revenue per acre signifi cantly, while no such impact was seen for other crops.
The literature on participation of small farmers in ORCs broadly indicates that contracting fi rms/ORCs prefer to deal with relatively large farmers. However, studies have also indi-cated that farm size is not a signifi cant barrier in participation. Similarly, there is a broad consensus that income of the far mers participating in the ORCs would improve, however, evidences to support the case for small farmers are not prominent.
Data and Methodology
A fi eld survey of 398 farmer households—255 linked to Mother Dairy and the rest dependent on local mandi—from 19 villages from Haryana was conducted through structured questionnaire during the summer of 2009 (see Table 1 for details).10 The sur-veyed districts—Sonipat, Panipat, Karnal and Kurukshetra—are mostly connected to Delhi through National Highway 1
(NH-1), where most of the retail outlets of Mother Dairy are located. The surveyed villages are mostly located around 5 km to 30 km distance from NH-1, and in proximity of a town, having a vegetable mandi within a maximum radius of 20 km. The state, districts, and villages were purposively selected keeping the procurement operation of Mother Dairy into con-sideration. The farmer households linked to Mother Dairy and the other farmer households were selected randomly from list of farmer households. Mother Dairy was preferred for the study because of its wide network and long-standing and stabilised operations.
A non-FMA village is a nearest located village to FMA village where farmers were supplying vegetables to local mandi. For the selection of the non-FMA farmers, farmers are listed in each non-FMA village recording their basic characteristics and a sample of farmer households was drawn randomly.
Income is defi ned comprehensively, as net household income (NHI), which includes not only farm business income11 but also subsidiary income or non-farm income.12 Because growing more of contracted crops may result in withdrawal of resour-ces from other crops or non-farm activities, which could result in income forgone. Moreover, it is the overall household income which determines expenditure of household on food, clothing, etc, which determines the level of poverty. Since, the expenditure by a household increases with the household size, thus, to pin down the impact of income on poverty, the per capita income of a household is preferred over per acre or per household income.
The econometrics procedure of estimation includes estima-tion of PROBIT, ordinary least square (OLS) regression and Heckman selection–correction model. The PROBIT model is estimated to identify the factors determining the partici-pation of farmers in ORC. Thereafter, OLS regression and Heckman selection–correction model estimated to know the impact of participation on income of the farmers. The Heckman selection–correction model is used to know the bias, if any, in the results, as the sample is not random. Besides, to overcome the possibility of bias in impact arising out of some unobserv-able characteristics of the farmers Heckman selection–cor-rection model is used along with regression. The model is specifi ed as follows:
Yi = Xiβ + μ1i outcome equation ... (1)
Ti = (Ziγ + μ2i>0) participation equation .. (2)
where Y is the outcome (per capita income) and X is a vector of the independent variables, while in participation equation Ti is the binary variable take value 1 if participated and 0 otherwise; while Z includes variables that predict whether or not a farmer would participate in ORC. It may be noted that the Z and X may include common variable, and which are taken identical in some studies (Gronau 1974). The selectivity prob-lem is defi ned as:
E[Yi | Xi ,Ti = 1] = Xi β +E[μ1i|μ2i > - Ziγ] ... (3)
Expected value of Yi for observations where farmers have participated into Mother Dairy is defi ned above. The joint
ECO
NOM
IC &
PO
LITI
CAL
WEE
KLY

REVIEW OF RURAL AFFAIRS
Published on Saturday, june 27, 2020 vol lV nos 26 & 27 EPW Economic & Political Weekly16
distribution of random disturbance term of outcome (µ1i) and participation equation (µ2i) can be written as follows:
μ1i = (σ21/ σ22)* μ2i + υi ... (4)
where σ21 is the covariance of the unobservables of the out-come and participation equations (σ2
2) is the variance of the unobservable in the participation equation, and υi is assumed to be uncorrelated with the unobservable of participation equation (µ2i). Now since we know the unobservable for out-come equation (µ1i), we can also calculate its expected value which is defi ned as follow:
E[μ1i | μ2i> - Ziγ] = (σ21/ σ22) E[ (μ2i /σ
22) | (μ2i / σ
22 )> - Ziγ/ σ2
2] = (σ21) ф (Ziγ/ σ
22)/ σ
22Ф (Ziγ/ σ2
2) ... (5)
where ф(.) is the standard normal density and Ф(.) is its cumulative distribution function. The selectivity bias is said to occur wherever σ21 is not zero. The presence of this bias in the models arises due to presence of omitted variables into the original model (1), where the quantity is the omitted variables, also called the Inverse Mills Ratio (IMR), which is defi ned as:
IMR = ф (Ziγ/ σ22)/ Ф (Ziγ/ σ
22) ... (6)
The treated equation, or Heckman selection–correction model, is defi ned as
Yi = Xiβ + [ф (Ziγ/ σ22)/ Ф (Ziγ/ σ2
2)]σ ... (7)
where σ = (σ21/ σ
22) which is coeffi cient of IMR
The estimated coeffi cients are consistent in Heckman selec-tion–correction model. The Stata software reports lambda, sigma and rho. Rho is correlation coeffi cient between the un-observable that determines selection equation and the unob-servable that determines outcome in outcome equation. Sigma is the adjusted standard error for the outcome equation and
lambda is the selection coeffi cient = sigma * rho. The Average Treatment Effect (ATE) is computed as lambda *average IMR [or exp (ATE) -1)*100 if variable in log form] which is inter-preted as how much conditional outcome is shifted up (or down) due to selection or truncated effect. The ATE depends on the statistically signifi cant value of the Chi-square.
The inequality of income distribution is measured using Gini coeffi cients and Lorenz curve. The value of Gini coefi cent ranges between zero and one, where zero shows perfect equality, while one means the most unequal distribution of the variable.
Results and Discussion
Mother Dairy Fruit & Vegetable is a wholly owned subsidiary of National Dairy Development Board (NDDB). It procures large a number of seasonal fruits and vegetables from thou-sands of farmers across a number of states in India. In Haryana, fruits and vegetables are procured through farmers’ marketing associations (FMA) at the upstream level of the chain, which are sold through Safal outlets spread across National Capital Region (NCR) at downstream. Mother Dairy has distribution centres at Pallabakhtavarpur and Mangolpuri in NCR, which are main coordinating locations having installed a huge infra-structure for storage, processing and logistic facilities.
Most of the procurement centres in villages are maintained by the FMAs in Haryana. Any farmer who has land (no restric-tion of size), grows fruits or vegetables and is ready to supply, can become member of the association. The objectives of the association are to enhance productivity of fruits and vegeta-bles by provi ding modern techniques, machines, access to in-puts, information, crop protection and crop production pro-grammes. It orga nises farmers, takes decisions, monitors their actions, enables procurement operations, builds trust and en-sures quality. The association is also responsible for procure-ment of fresh and quality vegetables from growers and trans-porting it to Mother Dairy. The member farmer of the associa-tion elects one president, whereas the secretary, who oversees all procurement operations and maintains records, is appoint-ed by Mother Dairy. On daily basis, the produce brought by farmers is loaded in a vehicle after quality check, weighing and packaging, and then transported to the distribution centre of Mother Dairy. The fi nal quality check is carried out by Mother Dairy at its distribution centre, and the status about rejected percentage and price assigned to the consignment is conveyed to the farmers usually next day of the procurement. Payments are made through the bank account, and usually take more than a week’s time.
Characteristics of surveyed households: The household characteristics are presented in Table 2 (p 17). There are about six persons in an average household; the difference between fma and non-fma farmers is statistically signifi cantly. Propor-tion of adult (more than 18 years) members is also signifi cantly larger in non-fma group than fma. Average age of fma farmers’ household head is than less compared to the non-fma group. However, education in both the groups is low and does not differ much. These groups also do not differ in terms of agricultural
Table 1: Number of Household SurveyedDistricts Farm Size# Small Medium Large All(1) (2) (3) (4) (5)
FMA Sonepat 48 (36) 41(31) 44 (33) 133 (100)
Panipat 20 (54) 12 (32) 5 (14) 37 (100)
Karnal 17 (38) 13(29) 15(33) 45(100)
Kurukshetra 15(38) 13(33) 12(30) 40(100)
Total of FMA 100(39) 79(31) 76(30) 255(100)
Non-FMA Sonepat 30(64) 9(19) 8 (17) 47 (100)
Panipat 12 (50) 5(21) 7(29) 24 (100)
Karnal 19(51) 5(14) 13(35) 37(100)
Kurukshetra 22(61) 8(22) 6(17) 36(100)
Total of Non-FMA 83 (58) 27(19) 34(24) 144 (100)
All (FMA + Non-FMA Sonepat 78 (43) 50 (28) 52 (29) 180 (100)
Panipat 32 (53) 17 (28) 12 (20) 61 (100)
Karnal 36 (44) 18 (22) 28 (34) 82 (100)
Kurukshetra 37 (49) 21 (28) 18 (24) 76 (100)
Grand Total 183 (46) 106 (27) 110 (27) 398 (100)# A small farmer is having net operated area of up to five acres, a medium having more than five acres up to 10 acres, and large farmer having net operated area more than 10 acres.Figures in parenthesis are percentage share in total households in a district.Source: Field Survey.
ECO
NOM
IC &
PO
LITI
CAL
WEE
KLY

REVIEW OF RURAL AFFAIRS
Economic & Political Weekly EPW Published on Saturday, june 27, 2020 vol lV nos 26 & 27 17
fi xed assets (other than land), ownership of cattle and vehicle. The fma farmers have some advantages in terms of net oper-ated area, leased in land and area under vegetables. The leased-in area seems to be playing a role in increasing operat-ed area for fma farmers. The cropping intensity is signifi cantly higher for non-fma farmers. The use of inputs such as family labour and biochemicals is higher in fma farmers, while ma-chine labour, irrigation is higher in non-fma farmers, the dif-ferences are statistically signifi cant. Marketing cost is lower for fma farmers than the compared group. The value of out-put is higher and statistically signifi cant for the fma farmers. However, their productivity does not differ signifi cantly from non-fma farmers. The area and value share of vegetables is sig-nifi cantly higher in the case of fma farmers than others. Simi-larly, the net household income and farm business income are higher for fma farmers, and so is the net household per capita income, and these are statistically signifi cant, too. Off-farm income, however, is higher in non-fma farmers.
The above analysis shows that there are some characteris-tics which are statistically different between the two groups,
especially in terms of household size, land profi le, etc. These differences in characteristics between fma farmers and non-fma farmers may play a role in determining the participation.Probit model is estimated to fi nd out the factor determining the participation.
Econometric analysis of participation: The participation of small farmer in ORCs has been a big challenge. This section using PROBIT model examines the questions: what are the factors determining participation of the farmers in ORC; and does the farm size work as a barrier for entry in Mother Dairy? The depen dent variables include household characteristics such as family size, age and education of household head, propor-tion of adults in family, proportion of leased-in area, farm size and a dummy for vehicles.13 The results of PROBIT model are presented in Table 3.
The explanatory power of the PROBIT model is low but sta-tistically signifi cant. Result shows that the farm size is one of the strong predictors of participation in ORCs, which means farmers with large farm size are preferred by the ORCs. Although owning a large plot of land is not a condition for par-ticipation in the FMA, the dominance of large farmers in the associations might have played a role in their selection. Further, leasing-in relatively larger percentage of area is another im-portant predictor of participation in the ORCs. Probably because these farmers diversify more towards vegetables in order to maximise their profi ts, thus improving their chances of partici-pating in the ORCs. Besides, availability of labour, as refl ected in terms of household size and proportion of adult members, tend to decrease probability of participation. Probably low opportunity cost of a member in larger family may enable to depute a member to market the produce to local mandi.
Younger household heads are more receptive to change, as also refl ected in the results, where relatively younger heads are more likely to participate in the ORCs. Low education of household head seems to have no signifi cant impact on partici-pation decision. Owning a vehicle reduces the chances of a farmer to participate, because its use can enable farmers to deal with higher transportation cost and enable farmers to ac-cess information about the local market, however, it is not
Table 2: Household CharacteristicsVariable FMA Non-FMA All t Test of Difference Farmers Farmers Farmers t-Stat Prob>t
Demographic and assets profile Household (HH) size (persons) 6.08 7.21 6.49 -4.07 0.00***
Adults in the family (numbers) 4.14 5.28 4.56 -5.57 0.00***
Adults in the family (%) 70.35 74.33 71.82 -1.83 0.06*
Age of HH head (years) 43.45 49.02 45.51 -4.33 0.00***
Education of HH head (years) 6.93 7.14 7.01 -0.41 0.67
Value of agri fixed assets (`) 1,67,191.80 1,77,015.10 1,70,815.1 -0.38 0.70
Value of cattle (`) 59,078.19 57,313.38 58,427.27 0.36 0.72
Value of vehicles (`) 39,168.70 25,066.90 33,967.5 1.44 0.15
Household having vehicle (%) 36.21 45.070 39.48 -1.71 0.08*
Land and its utilisation profile Net operated area (acres) 7.79 6.34 7.26 2.08 0.03**
Leased-in area (acres) 3.27 1.23 2.52 4.85 0.00***
Leased-in area (%) 43.10 14.04 32.38 7.40 0.00***
Irrigated net-operated area (%) 99.98 99.03 99.63 1.64 0.09*
Cropping intensity (%) 174.00 189.00 179.00 -2.11 0.03**
Area under vegetable (acres) 4.31 2.64 3.65 2.94 0.00***
Input profile Family labour (person days) 435.18 323.26 393.92 3.73 0.00***
Hired labour (person days) 129.64 107.64 121.53 1.43 0.15
Irrigation cost per acre (`) 1,305.57 1,517.93 1,383.89 -3.02 0.00***
Machine labour per acre (`) 1,670.12 1,782.61 1,711.61 -2.97 0.00***
Biochemical per acre (`) 5,642.97 5,138.97 5,457.08 1.76 0.07*
Marketing cost per 100 of output (`) 2.18 3.17 2.25 -2.73 0.00***
Output profile
Value of output (`) 3,55,491.7 2,57,242.0 3,19,254.1 3.20 0.00***
Value of output per acre (`) 47,047.57 43,920.28 4,58,94.13 1.45 0.14
Value of marketed output (`) 3,34,400.4 2,26,807.5 2,94,716.8 3.58 0.00***
Vegetable area share (%) 40.20 20.58 32.79 6.95 0.00***
Vegetable value share (%) 51.93 25.61 41.58 8.33 0.00***
Income profile Net household income (NHI) (`) 1,79,672.3 1,34,105.0 1,62,896.9 2.22 0.02**
Farm business income (`) 1,59,626.5 1,04,034.9 1,39,122.6 2.87 0.00***
Off-farm income (`) 20,148.76 28,672.34 23,286.34 -2.07 0.03*
NHI per capita 33,164.26 20,724.64 28,584.66 3.15 0.00***
Number of observations 242 141 383
*Significant at the 10% level; **Significant at the 5% level; ***Significant at the 1% level.Source: Field survey.
Table 3: PROBIT Regression Results (marginal change)Variable Coefficient Std Err z P>z
Dependent variable participation =1, otherwise =0 HH size (persons) -0.078 0.027 -2.84 0.01**
Age of HH head (years) -0.017 0.006 -2.69 0.01**
Education of HH head (years) 0.005 0.017 0.28 0.78
Adults in family (%) -0.006 0.004 -1.60 0.11
Farm size (acres) 0.030 0.012 2.48 0.01**
Leased-in area (%) 0.012 0.002 5.52 0.00***
Vehicle dummy (1= having vehicle; 0 otherwise) -0.120 0.155 -0.77 0.44
Constant 1.540 0.458 3.36 0.00***
Number of observations 385
Pseudo R2 16.80
Log likelihood -212.68
LR chi2 85.53***
* p<.1; ** p<.05; *** p<.001.Source: Field survey.
ECO
NOM
IC &
PO
LITI
CAL
WEE
KLY

REVIEW OF RURAL AFFAIRS
Published on Saturday, june 27, 2020 vol lV nos 26 & 27 EPW Economic & Political Weekly18
found statistically signifi cant. The above analyses show that labour availability, young household heads, contract in land market and size of operation have played play a crucial role in participation of farmers in the ORCs. This also indicates the possibility of selection bias in the sample.
Determinants of income: Table 2 records that an FMA farmer earns signifi cantly higher per capita income than a non-FMA
farmer, and most of their income is contributed by crop income. Within FMA farmers’ crop income, about 42% is con-tributed by vegetables. During the survey, farmers reported that about 60% of their vegetable produce is supplied to Moth-er Dairy. In view of presence of selection bias in the data, Heckman sample correction model results, as in Table 5, have also been presented along with OLS regression results (Table 4).
As per Heckman’s model, the value of “Rho” is estimated at 0.88, which is high but not statistically signifi cant, and indi-cates the absence of selection bias in the sample.
The coeffi cient of dummy FMA is found positive and statisti-cally signifi cant, which suggests that participation of a farmer contributes `1,094 in per capita income of household for every additional acres of land. The comparable value of the coeffi cient in treatment regression estimates is `1,520. For additional one acre, the income increases by 3%–4% for FMA-farmers compared to non-FMA farmers.
The impact on income is translated through price and non-price channels. The price channels include price effi ciency and marketing cost. Among non-price channels, crop diversifi cation, farm productivity and profi tability are the prominent ones. The net farmer prices14 between Mother Dairy and local market are compared and found that Mother Dairy paid higher net price
Table 4: OLS regression Estimates Coefficient Std Err t P>t
Dependent variable: per capita income (`) HH size (persons) -4,377.9 600.39 -7.29 0.00***
Age of HH head (years) 242.8 132.02 1.84 0.067*
Education of the HH head (years) 482.9 345.40 1.4 0.163
Adults in HH (%) 47.5 74.57 0.64 0.524
Lease-in area (%) 6.3 40.66 0.16 0.875
Farm size (acres) 2,567.9 335.92 7.64 0.00***
Dummy FMA (FMA=farm size, otherwise 0) 1,094.6 335.00 3.27 0.00***
Constant 14,956.5 9,202.94 1.63 0.105
R2 0.44
Number of observations 383
Probability value >F 0.00***
Source: Field survey. *** significant at 1%, ** significant at 5% and * significant at 10 %.
Table 5: Treatment-effects Model-Two-step Estimates Coefficient Std Err z P>z
Outcome equation: dependent variable Net household per capita income
HH size (person) -5,955.66 1,249.56 -4.77 0.00***
Age of HH head (years) -45.93 252.49 -0.18 0.86
Education of the HH head (years) 642.70 455.94 1.41 0.16
Adults in HH (%) -65.19 117.79 -0.55 0.58
Lease-in area (%) 218.05 142.09 1.53 0.13
Farm size 2,805.10 576.44 4.87 0.00***
Dummy FMA (if FMA = farm size, otherwise 0) 1,520.92 461.49 3.30 0.00***
Constant 72,567.51 36,938.34 1.96 0.05*
Participation equation Dependent: 1 if participated in FMA otherwise zero Family size (numbers) -0.08 0.03 -2.88 0.00***
Age of HH head (years) -0.02 0.01 -2.59 0.01**
Education of the HH head (years) 0.00 0.02 0.28 0.78
Adults in family (%) -0.01 0.00 -1.63 0.10
Lease-in land (%) 0.01 0.00 5.47 0.00***
Farm size 0.03 0.01 2.45 0.01**
Dummy (having vehicle =1, otherwise 0) -0.12 0.16 -0.80 0.42
Constant 1.54 0.46 3.36 0.00***
lambda 31,965.70 21,663.96 1.48 0.14
Riho 0.88
sigma 36,242.51
Wald chi2(14) 257.34***
Number of observations 383
*** significant at 1%, ** significant at 5% and * significant at 10 %.Source: Field survey.
Figure 1: Lorenz Curve for All Households
% H
ouse
ho
lds
100
90
80
70
60
50
40
30
20
10
0
% of land and income 0 20 40 60 80 100
Perfect equality
Land distributiobn
Income distributiobn
Figure 2: Lorenz Curve for Non-FMA Households
% H
ouse
ho
lds
100
90
80
70
60
50
40
30
20
10
0 0 20 40 60 80 100
% of land and income
Land distributiobn
Perfect equality
Income distributiobn
Figure 3: Lorenz Curve for FMA Households
% H
ouse
ho
lds
100
90
80
70
60
50
40
30
20
10
0 0 20 40 60 80 100
% of land and income
Perfect equality
Land distributiobn
Income distributiobn
ECO
NOM
IC &
PO
LITI
CAL
WEE
KLY

REVIEW OF RURAL AFFAIRS
Economic & Political Weekly EPW Published on Saturday, june 27, 2020 vol lV nos 26 & 27 19
to farmers for selected vegetables than the local markets. Along with the price, Mother Dairy also saves marketing cost15 for the farmers. The farm productivity16 is higher for the FMA farmers than the other group. The diversifi cation of FMA farmers, too, is double than the other group and the difference is statistically signifi cant (Table 2).17
Inequality in income and land distribution: Key and Runsten (1999) and Korovkin (1992) indicated implication of exclusion of small farmers from new marketing channels inter alia on inequalities. The skewed participation in the ORCs may accen-tuate income inequalities. The Gini coefi cient is calculated for land and income distribution for FMA and non-FMA farmers saparately and for all sample hosueholds (Table 6). The result shows that the land is relatively unequally distributed among FMA farmers than the non-FMA farmers. Further, the income is also found relatively unequally distributed among the FMA
farmers than the other group. This indicates that participation is likely to worsen the income distribution, however, there is a need for rigorous analysis to establish a cause and effect rela-tion. One can also observe the same looking at the Lorenz curves presented in Figures 1, 2 and 3 (p 18).
Conclusions
This study compares farmers selling vegetables to Mother Dairy with those selling to local mandi in Haryana to fi nd out con-straints on their participation in the chain and impact on their income, particularly on small farmers’ income. The study also compares the income distribution of the participant and
non-participant farmers. The two groups, FMA and non-FMA, differ signifi cantly in terms of characteristics, where FMA has an advantage in land and its utilisation profi le, while non-FMA has an advantage in terms of demographic characteristics such as availability of family labour.
The participation of farmers in Mother Dairy is mainly de-termined by labour availability, age of household head, con-tract in land market and size of operations. Despite a farmer marketing association at upstream of the Mother Dairy supply chain in Haryana, the participation is determined by the size of operational holdings. This may be because of dominance of large farmers in the association. Apart from this, contract in land market, age and availability of family labour explains participation of farmers in Mother Dairy. Further, their partici-pation contributes `1,094–`1,520 (3%–4% of average income) in per capita income for every additional acres of land. This in-crease in income is probably on account of better price, diversi-fi cation towards vegetables and reduced marketing cost. In a preliminary examination, the distribution of the income is found more unequal in the case of the farmer, who participated in Mother Dairy compared to the others. The causes for wors-ening income distribution may need further examination.
These results have important policy implications. First, the farmers’ association is an important institutional innovation for inclusion of farmers in new marketing channels. Having far mers’ associations in supply chain, Mother Dairy is proba-bly a more inclusive chain than those operating without as-sociations. However, it is equally important that the associa-tion ensures equal opportunities to farmers irrespective of their size of operation, and is able to counter the infl uence of a few. Second, the results support the policy of promotion of direct marketing chains to improve the income of farmers and indicate that schemes like Mother Dairy have the poten-tial to yield benefi ts if scaled up.
Table 6: Gini Coefficient FMA Non-FMA All
Land distribution 0.5000 0.4800 0.4901
Income distribution 0.6318 0.5702 0.6165
Source: Calculated from field survey data.
Notes
1 An ORC consolidates the whole supply chain from procurement to retailing under a single management.
2 In general, based on socio-economic factors and a degree of advancement in policy re-forms, waves of development are visible in northern half of the Central Europe, most of the southern Central Europe, and all of Eastern Europe, including the Russian Federation. See IFPRI (2008) also. Schwentesius and Cruz (2002), examines the case of supply chains pro-curing fruit and vegetables in Mexico over the decade through contractual arrangements with growers for agro-export and agro indus-try fi rms.
3 Shah (2011) raises a question on exclusion of the poor from the chain. See also Cacho (2003).
4 In India, 85% of landholding is either small or marginal categories—marginal (0.01−1 ha), small (1.01−2.00 ha).
5 As refl ected in the survey by National Sample Survey Offi ce (NSSO) in 2003.
6 The number of regulated markets in India increased to 7,157 in 2010 from 286 in 1950 along with about 21,221 rural primary markets being recorded in the same year. Out of these,
284 regulated markets and 189 rural primary markets were in Haryana. On an average, each market serves 460 sq km area in India com-pared to 155 sq km in Haryana. However, the density of regulated markets remains highly in-adequate compared to 80 sq km (or within 5 km) the norm set by National Commission on Farmers, 1976.
7 As per the Working Group of the Twelfth Five Year Plan, only around 7% of the total quantity sold by farmers is graded before sale. The grading facilities were available only in 1,368 out of about 7,157 regulated markets. The storage capacity was estimated to be only 30% of the required capacity and cold storage was availa-ble only for 10% of the fruits and vegetables.
8 As per the Working Group of the Twelfth Five Year Plan, market fee ranging from 0.50% to 2.0%, commission charges vary from 1% to 2.5% in foodgrains and 4% to 8% in fruits and vegetables, other charges, such as, purchase tax, weighing charges of the sale value of the produce. In some states, total charges in-creased upto 15% which is excessive.
9 Price effi ciency in vegetables such as tomato, caulifl ower, capsicum and peas in Himachal Pradesh was estimated between 46% and 52% during 1991−92 (Thakur et al 1994). In another
study of Karnataka during 1985–86 by Kiresur et al (1989) estimated the farmers’ share between 36% and 51% in tomato and brinjal, while in case of potato and onion, which are relatively durable, the price effi ciency ranges between 60% and 67%.
10 The questionnaire recorded the household’s characteristics such as demographic, land, crop, assets, cost and income, and terms and condition of the contract, experience of farm-ers with Mother Dairy, etc.
11 Farm business income is equal to gross agricul-tural output minus all paid-out costs. The paid-out costs are costs paid to buy inputs such as fertilisers, pesticides, hired machinery, hired labour, irrigation charges, seeds, etc, net value added is calculated deducting intermediate costs from gross value of output like seeds, fer-tiliser, pesticides, irrigation and transaction cost. The gross agricultural output includes output from all crops and their by products. By-product income includes stalks, straw, etc, at their market price.
12 Non-farm income computed as income/re-ceipts from animal husbandry, agriculture wage employment, non-agriculture wage em-ployment, salary and pension, other household enterprise income and rent on leased-out land. Animal husbandry income includes income
ECO
NOM
IC &
PO
LITI
CAL
WEE
KLY

REVIEW OF RURAL AFFAIRS
Published on Saturday, june 27, 2020 vol lV nos 26 & 27 EPW Economic & Political Weekly20
from milk, milk products and poultry. Agricul-ture wage employment income includes the receipt from wage employment in agriculture. Non-agriculture wage employment income in-cludes wage from non-employment income. Other household income includes income from self-employment. Some of the income sources are monthly such as pension and salary, etc, so to arrive at annual fi gures these are multiplied by 12.
13 Vehicle dummy, a farmer having vehicles such as four-wheeler, three-wheeler, motorcycle, etc, takes value one and zero otherwise. It has also been used in literature as it indicates reduction in transaction cost by facilitating transport of produce to mandi. In this study, the vehicle dummy is included for identifying the model as well as a variable to show impact of vehicle.
14 Mother Dairy price net of marketing cost.15 Marketing cost includes transportation cost,
loading and unloading charges, packaging, commission of agents and taxes. As refl ected in Table 2, the marketing cost is signifi cantly lower in FMA farmers compared to non-FMA farmers.
16 The difference in productivity, value of output per acre of net operated area, between FMA and non-FMA is `3,127, which is not statistically signifi cant.
17 Diversifi cation is defi ned as percentage of area of vegetables in gross cropped area.
References
Acharya, S S (2004): “Agricultural Marketing in India,” Millennium Study of Indian Farmers, Government of India, New Delhi: Academic Foundation, Vol 17.
Alvarado, Irene and Kiupssy Charmel (2002): “The Rapid Rise of Supermarkets in Costa Rica: Im-pact on Horticulture Markets,” Development Policy Review, Vol 20, No 4, pp 473–85.
Birthal, P S, P K Joshi and A Gulati (2005): Vertical Coordination in High Value Food Commodities: Implications for Smallholders, International Food Policy Research Institute, Discussion Paper, No 85.
Chavez, Manuel (2002): “The Transformation of Mexican Retailing with NAFTA,” Development Policy Review, Vol 20, No 4, pp 503−13.
Chengappa, P G and N Nagaraj (2005): Marketing of Major Fruits and Vegetables in and Around Bangalore, Report, Department of Agricultural Economics, University of Agricultural Scienc-es, Bengaluru.
Deshingkar, Priya, Usha Kulkarni, Laxman Rao and Sreenivas Rao (2003): “Changing Food Systems in India: Resource-sharing and Mar-keting Arrangements for Vegetable Production in Andhra Pradesh, Development Policy Review, Vol 21, No 5–6, pp 627–39.
Dries, L, T Reardon and J F M Swinnen (2004): “The Rapid Rise of Supermarkets in Central and Eastern Europe: Implications for the Agri-food Sector and Rural Development,” Develop-ment Policy Review, Vol 22, No 5, pp 525−56.
Faiguenbaum, S, J A Berdegue and T Reardon (2002): “The Rapid Rise of Supermarkets in Chile: Effects on Dairy, Vegetable, and Beef Chains,” Development Policy Review, Vol 20, No 4, pp 457–71.
Ghezan, Graciela, Monica Mateos and Laura Viteri (2002): “Impact of Supermarkets and Fast-Food Chains on Horticulture Supply Chains in Argentina,” Development Policy Review, Vol 20, No 4, pp 389–408.
Glover, David J (1984): “Contract Farming and Smallholder Outgrower Schemes in Less-Devel-oped Countries,” World Development, Vol 12, Is-sue 11–12, pp 1143–57.
Glover, D J, and K Kusterer (1990): Small Farmers, Big Business: Contract Farming and Rural De-velopment, London: MacMillan Press.
GoI (2007): The India Retail Report, Ministry of Commerce and Industry, Government of India.
Gronau, Reuben (1974): “Wage Comparisons: A Selectivity Bias,” Journal of Political Economy, Novernber/Deccniber, 1974.
Gutman, G E (2002): “Impact of the Rapid Rise of Supermarkets on Dairy Products Systems in Argentina,” Development Policy Review, Vol 20, No 4, pp 409–27.
Heckman, J (1979): “Sample Selection Bias as a Specifi cation Error,” Econometrica, Vol 47, No 1, pp 153−61.
Joseph, Mathew, Nirupama Soundararajan, Manisha Gupta and Sanghamitra Sahu (2008): “Impact of Organized Retailing on the Unorganized Sector,” Indian Council for Research on Interna-tional Economic Relations, New Delhi, Working Paper No 222, September, http://icrier.org/pdf/Working_Paper222.pdf.
Kerisur, V R, K C Hiremath and Sarad Kiresur (1989): “Economics of Production and Market-ing of Vegetables in Karnataka a Comparison of Organized and Unorganised Sector of Market-ing,” Indian Journal of Agriculture Marketing, Vol 3, No 3, Conference Special.
Key, N and D Runsten (1999): “Contract Farming, Smallholders, and Rural Development in Latin America: the Organization of Agro Processing Firms and the Scale of Out grower Production,” World Development, Vol 27, No 2, pp 381−401.
Korovkin, Tanya (1992): “Peasants, Grapes and Corporations: The Growth of Contract Farming in a Chilean Community,” Journal of Peasant Studies, Vol 19, No 2.
Kumar, Parmod (2006): “Contract Farming through Agribusiness Firms and State Corporation: A Case Study in Punjab,” Economic & Political Weekly, Vol 41, No 52.
Kumar, A, P S Kumar and N Alakh (2011): “Rural Poverty and Agricultural Growth in India: Implications for the Twelfth Five Year Plan,” Indian Journal of Agriculture Economics, July−September, Vol 66, No 3.
Livingstone, M C (1938): “Agricultural Marketing in India,” Journal of the Royal Society of Arts, Vol 86, No 4477, pp 1029–44.
Minot, Nicholas and Devesh Roy (2007): Impact of High-value Agriculture and Modern Marketing Channels on Poverty: An Analytical Framework, Markets, Trade, and Institutions Division, International Food Policy Research Institute, Washington, DC.
Miyata, S, N Minot and D Hu (2009): “Impact of Contract Farming on Income: Linking Small Farmers, Packers, and Supermarkets in China,” World Development, Vol 37, No 11, pp 1781–90.
NABARD Study (2011): “Organized Agri-Food Re-tailing in India,” Mumbai, http://indiamicrofi -nance.com/wp-content/uploads/2011/06/Na-bard-agri-food-ebook.pdf.
Neven, D and T Reardon (2004): “The Rise of Kenyan Supermarkets and the Evolution of their Horticulture Product Procurement Sys-tems,” Development Policy Review, Vol 22, No 6, pp 669–99.
Page, Sheila and Rachel Slater (2003): “Small Producer Participation in Global Food Systems:
Policy Opportunities and Constraints,” Devel-opment Policy Review, Vol 21, Nos 5 and 6, pp 641−54.
Patnaik, G (2011): Status of Agricultural Marketing Reforms—Policy Options and Investment Priorities for Accelerating Agricultural Produc-tivity and Development in India, Indira Gandhi Institute of Development Research (IGIDR), Proceedings/Projects Series, pp 069−11b.
Pingali, Prabhu and Yasmeen Khwaja (2004): Globalisation of Indian Diets and the Transfor-mation of Food Supply Systems, ESA Working Paper Nos 04 and 05, Agricultural and Devel-opment Economics Division, Food and Agricul-ture Organization.
Planning Commission (2006): Report of the Work-ing Group on Agricultural Marketing Infra-structure and Policy Required for Internal and External Trade for the XI’: Five Year Plan 2007−12, http://planningcommission.nic.in/aboutus/committee/wrkgrp11/wg11_agrpm.pdf.
— (2011): Report of the Working Group on Agricul-tural Marketing Infrastructure, Secondary Agri-culture and Policy Required for Internal and Ex-ternal Trade, For Twelfth Five Year Plan, http://planningcommission.gov.in/aboutus/com-mittee/wrkgrp12/agri/weg_rep_market.pdf.
Porter, G and K P Howard (2000): “Comparing Contracts: An Evaluation of Contract Farming Schemes in Africa,” World Development, Vol 25, No 2, pp 227−38.
Reardon, T and J F M Swinnen (2004): “Agrifood Sector Liberalisation and the Rise of Super-markets in Former State-controlled Econo-mies: A Comparative Overview,” Development Policy Review, Vol 22, No 5, pp 515–23.
Schwentesius, Rita and Manuel Ángel Gómez Cruz (2002): “Supermarkets in Mexico: Impacts on Horticulture Systems,” Development Policy Review, Vol 20, No 4, pp 487−502.
Singh, Aruna and Prasanna and R Chand (2011): “Farm Size and Productivity: Understanding the Strengths of Smallholder and Improving Their Livelihoods,” Economic & Political Weekly, Vol 46, Nos 26 and 27, pp 5–11.
Singh, S (2002): “Deceleration of Economic Growth in Punjab,” Economic & Political Weekly, Vol 37, No 6.
Sutradhar, Rajib (2014): “Procurement of Fresh Produce by Modern Marketing Channels and their impact on Farming Household—Evidence from India,” Paper presented at the Agricultur-al and Applied Economics Association (AAEA), Annual meeting to be held at Minneapolis, US, on 28 July.
Thakur, D S, D R Sanjay and K D Sharma (1994): “Economics of Off Season Vegetable Produc-tion and Marketing in Hills,” Indian Journal of Agricultural Marketing, Vol 8, No 1, pp 77−78.
Weatherspoon, D D and T Reardon (2003): “The Rise of Supermarkets in Africa: Implications for Agrifood Systems and the Rural Poor,” Development Policy Review, No 3, 21 May.
available at
Delhi Magazine Distributors Pvt Ltd
110, Bangla Sahib Marg New Delhi 110 001
Ph: 41561062/63
ECO
NOM
IC &
PO
LITI
CAL
WEE
KLY

REVIEW OF RURAL AFFAIRS
Economic & Political Weekly EPW Published on Saturday, june 27, 2020 vol lV nos 26 & 27 21
Sukhpal Singh ([email protected]) is with Punjab Agricultural University, Ludhiana. Shruti Bhogal ([email protected]) is with Centers for International Projects Trust, New Delhi.
Punjab’s Agricultural Labourers in TransitionA Longitudinal Study of Three Decades
Sukhpal Singh, Shruti Bhogal
Agricultural labourers are undergoing a socio-economic
transition due to the intensified capitalisation of
agriculture. The change in structure of rural employment
in Punjab, over a period, has two prominent facets: shift
of agricultural labour to non-farm sector, and conversion
of permanent/attached labour in agriculture to casual
labour. This longitudinal study, in 1987–88 and 2018–19,
presents the transition in agricultural labour households
in the state. While the agricultural labour households,
solely depending on meagre income from the
agricultural sector are struggling, the ones shifting to the
non-farm sector are switching over to menial jobs. Rural
agro-industrialisation for overall improvement in the
employment situation along with enhanced wages,
liberal institutional credit and debt waiver specific to
workers are vital aspects that need attention.
The green revolution facilitated food self-suffi ciency for India, and was imperative at the time for a food defi cit nation. Characterised by the capital-intensive mode of
production, it modernised agricultural practices while increas-ing the capital–land ratio. Combined with the existing abun-dance of labour in the rural economy, this modernisation gen-erated a boom in the agricultural sector that sustained for a few decades. Soon, the growing capitalisation constrained gainful employment opportunities for labour, leading to un-employment and disguised unemployment. The surge in capi-tal intensity in the agricultural sector caused reduction in the elasticity of labour, thus squeezing out the labour absorption capacity of agriculture (Devi et al 2013: 278). It is pertinent here to note that agricultural labour constitutes about 27% of the total workers in India (GoI 2011). The need for modernisa-tion of agriculture and resultant creation of surplus labour is often explained as a facet of the normal course of economic development. It is generally propounded that this army of la-bour becomes the labour pool for other sectors of the econo-my—secondary and tertiary. The Lewis model of transition caters to the aspects of modernisation in agriculture and the resultant movement of surplus labour to other sectors, primarily from agriculture to industry and rural to urban (Lewis 1954). However, in India, though capitalisation of agriculture—often perceived as an indicator of development—did lead to the dis-placement of labour from agriculture, it could not be accom-modated in other sectors, with sustained and rewarding liveli-hood opportunities. Consequently, labour is succumbing to poverty (Dutta 2019: 36).
A discussion about progressive agriculture in the country generally encompasses the model of agriculture in Punjab, as it pioneered the green revolution for India. As a ramifi cation of modernisation that was brought about by the green revolution, agricultural labour in Punjab underwent a transition. Agricul-tural labour comprises a signifi cant 16.3% of the total workers in the state (GoI 2011). Permanent agricultural labourers in the state had transformed to casual labourers, mainly due to reductions in the demand for labour. This can further be at-tributed to the mechanisation of major farm operations, mono-culture of wheat–paddy crops and infl ow of migrant labour in the state (Rangi et al 2004: 961). Further, agricultural labourers managed only short periods of employment. Hence, their problem to a large extent is that of unemployment rather than underemployment. The availability of abundant labour and decreasing demand for agricultural labourers has engendered
ECO
NOM
IC &
PO
LITI
CAL
WEE
KLY

REVIEW OF RURAL AFFAIRS
Published on Saturday, june 27, 2020 vol lV nos 26 & 27 EPW Economic & Political Weekly22
a worrisome employment situation, especially in the rural economy. Based on the per hectare labour use in a crop year, demand for labour in the state fell from 479.3 million person-days in 1983–84 to 421.93 in 2000–01 (Sidhu and Singh 2004: 4134).
To make matters worse, in addition to the existing army of marginalised and unemployed agricultural labourers, unsus-tainable and non-viable farming has pushed a large chunk of cultivators to the labour market, subjecting them to further deprivation and pauperisation (Sidhu and Singh 2004: 4132; Singh and Singh 2010: 113). As per a study, the 28% of farmers who left farming in Punjab became labourers and took up unskilled jobs for survival (Singh and Bhogal 2014b: 99). Regrettably, informal non-farm sector is becoming their prime employment destination. Bare minimum wages, irregular employ ment, unsatisfactory working conditions, poor job sati-sfaction, and so on add to their misery. The strengthening of pull factors of the rural non-farm sector is generally believed to promote socio-economic welfare as it absorbs surplus agri-cultural labourers. Unfortunately, in Punjab, this sector is incapable of providing gainful employment to such surplus labour. As a result, they are forced to take up informal and seasonal casual work that is equally less promising. Various empirical studies highlight that the economic conditions of the poorer sections of the rural economy were so inexorable that few resorted to suicides to extricate themselves from distress (Singh et al 2012; Singh 2018: 16). Of the total agricultural la-bourer suicides in Punjab, around 59% were committed due to the heavy debt burden. More so, females of these households had higher susceptibility to economic distress as compared to their counterparts from farm households, since about 14% of the females from agricultural labourer households committed suicides in comparison to 8% of the females from farm house-holds (Singh et al 2012). This stratum of landless labour house-holds is miserable and uncared for.
The transition of labour in an economy from one sector to another is crucial for growth and development. Sadly, the real conditions of transitioning labour as well as the push-and-pull factors that infl uence transition are not paid heed to by policy-makers. This paper presents the transition of agricultural labour in the rural economy of Punjab over three decades and attempts to understand the extent and magnitude of this tran-sition and suggests policy measures to improve the level of living of this weaker stratum of rural society.
Sampling Design
The present study is a longitudinal study in which the fi eld-level data were collected from agricultural labour households through personal interviews during two time periods, that is, 1987–88 and 2018–19, from Ludhiana district, the central region of Punjab. There were four subdivisions and 1,004 villages in the district in 1987–88. Out of these, four villages were selected, choosing one from each subdivision during 1987–88. Further, 100 agricultural labour households were selected, taking 25 agricultural labour households from each village. After three decades, a fi eld survey of agricultural labour households was again undertaken in 2018–19 to study
the same families in order to analyse the changing scenario. Although all agricultural labour households that were studied in 1987–88 could not be located as full families in 2018–19. As some families had undergone division, migrated and so on, a sample of 100 families was taken from the same or part of the same family for the study.
Process of Transformation of Agricultural Labourers
The capital-intensive farm sector reduces human labour emp loy ment in farming. As a result, the surplus labour shifts towards the non-farm sector. The Lewis model of transforma-tion revealed that the shift of labour from agriculture to in-dustry is inevitable with the increase in capitalisation in agri-culture (Lewis 1954). The process of transformation of agri-cultural labourers can be analysed in light of occupational shifts of labour households, changing employment, income, consumption pattern, along with poverty and debt position of these households.
Occupational Shift in Labour Households
The growth of the agricultural sector in Punjab has become unsustainable, which is visible from the low agricultural growth rate of about 2%. Also, the state is experiencing rampant de-peasantisation as peasants are giving up agriculture as a means of livelihood (Singh and Bhogal 2014a: 1365). Resultantly, the agricultural sector seems to be shrinking in terms of gain-ful employment opportunities. Thus, the population dependent on agriculture, especially the agricultural labour community, the weakest economic strata in the rural society, is mired into a state of vulnerability and desolation. This process pushed many households towards non-farm activities. A comparison of occ upations of the same agricultural households during 1987–88 and 2018–19 highlights an occupational shift in agricultural labour households in Punjab over three decades (Table 1).
In 1987–88, out of a total sample of 100 households, 88 households were solely agricultural labour households, whereas the remaining 12 households were mixed households, compris-ing at least one family member engaged in non-farm activities. However, the proportion of solely agricultural labour house-holds declined from 88% in 1987–88 to just 7% in 2018–19, while for mixed households, this increased from 12% in 1987–88 to 37% in 2018–19. The shift of labour from farm to non-farm sector is quite robust since, over three decades, 56% of these households turned as solely non-farm households, with none of the workers of these households engaged in agriculture. This situation clearly brings out the magnitude of occupational shift in farm labour households in the rural economy of Punjab during three decades.
Table 1: Occupational Shift in Agricultural Labour Households in PunjabType of Household 1987–88 2018–19 No of Percentage No of Percentage Households Households
Solely agricultural labour 88 88 7 7
Solely non-farm – – 56 56
Mixed (agriculture and non-farm) 12 12 37 37
Total 100 100 100 100
Source: Field survey, 1987–88 and 2018–19.ECO
NOM
IC &
PO
LITI
CAL
WEE
KLY

REVIEW OF RURAL AFFAIRS
Economic & Political Weekly EPW Published on Saturday, june 27, 2020 vol lV nos 26 & 27 23
Shifts in employment pattern: The demographic details of any economy give an indication about its growth drivers. It was observed that the average family size of these labourer house-holds declined from 5.66 in 1987–88 to 4.97 in 2018–19 (Table 2). However, the number of workers per household increased marginally from 1.73 to 1.81 during the same time period. Sub-sequently, the dependency ratio in these households also declined from 227.17% to 174.66% during the period of study.
Of all the workers, a further categorisation revealed that during 1987–88, about 92% (1.59) of the total workers per household were engaged in agricultural activities, and about 8% (0.14) were engaged in non-agricultural activities. The number of workers from each household engaged in these re-spective activities changed during 2018–19. About 34% (0.61) of the total workers of the family were now engaged in agricul-tural activities, while about 66% (1.21) were engaged in non-agricultural activities. It was estimated that the total number of days that the households could have been available for work during a year, considering that 365 were the number of work-ing days per worker per annum, were 631.45 in 1987–88, which increased to 660.65 in 2018–19. An average agricultural labour household got work for about 65% of the total estimat-ed annual working days in 1987–88, which declined to about 62% in 2018–19.
Due to the reducing number of work days in farm sector, the labourers are compelled to look out for other work or stay unemployed, which further exerts fi nancial stresses on this stratum of society. Though the role of the non-farm sector, an alternative employment stood out prominently during the study period; however, the availability of sustainable and gainful employment opportunities in this sector is debatable. The number of days of work that a household managed to get in this sector increased from about 51 days per annum in 1987–88 to about 326 days per annum in 2018–19. However, per worker number of days of employment in this sector declined from 365 days in 1987–88 to 270 days in 2018–19. Likewise, the share of agricultural sector declined with time. Such a scenario points towards a bleak chance for growth of labour in the
agricultural sector relative to the non-agricultural sector. This also hints that the agricultural labour market seems to have lesser potential for gainful labour absorbability. In addition, it can also be inferred that the non-farm sector provided lesser promising sustainable employment as the workers could not be engaged for the entire year relative to the sce-nario during 1987–88.
The changing scenario of the prospect of generation of live-lihood from agriculture alone induced transition in the rural economy. The details of the magnitude of the shift of the total agricultural workforce towards other sectors over a period of three decades is shown in Table 3. Of the total workers, about 92% (159) were engaged in agricultural activities during 1987–88 which reduced to 33.7% (61) in 2018–19.
It is pertinent to know that one-fi fth (13) of total permanent agricultural labourers (62) during 1987–88 were engaged on crop-sharing basis (sharecroppers). This type of employment ceased to exist in 2018–19. To elaborate, currently no share-croppers are found in agriculture in Punjab. Although a negli-gible number (1.10%) of total workers were engaged as wage earners on a permanent basis, they were being paid fi xed cash remunerations on an annual basis. The shift of employment was seen in favour of menial jobs generally in the private sector as the members of agricultural labour households engaged in this sector increased from 2.31% to 10.50%. None of the family members of the sampled agricultural labour households were engaged as industry and construction labour, helpers in shops/workshops and brick kiln workers in 1987–88, but as many as 14.92%, 9.39% and 9.94% of the labourers from these agricultural labour households were found to be engaged in the respective employment activities in 2018–19. The proportion of workers engaged as self-employed was found to be almost the same during both the periods of study. The nature of work undertaken by the self-employed, such as repair and maintenance, barber, electrician, vendor, and so on, was often less remunerative. Over the period, the non-farm sector has absorbed more of the working population of these households as compared to the farm sector, as the proportion
Table 2: Changing the Employment Pattern of Agricultural Labour Households in PunjabDescription 1987–88 2018–19
Family size (No) 5.66 4.97
No of workers/household 1.73 1.81
Agricultural workers/household 1.59 (91.9) 0.61 (33.7)
Non-agricultural workers/household 0.14 (8.09) 1.21 (66.29)
Dependency ratio (%) 227.17 174.58
Estimated annual working days/household 631.45 660.65
Total actual days worked/household (annual) 409.45 401.76
Days worked per household (%) 64.84 60.81
Days worked per capita (annual) 72.34 80.84
Days worked per worker (annual) 236.68 221.97Days worked in agricultural and Agri- Non- Agri- Non-non-agricultural sector cultural agricultural cultural agricultural
Per household 775.35 51.1 75.45 326.31
Per capita 136.99 9.03 15.18 65.66
Per worker 228.72 365 123.69 269.68
Figures in parenthesis indicate percentages.Source: Field survey, 1987–88 and 2018–19.
Table 3: Distribution of Shift of Agricultural Labour Workforce in PunjabType of Labour/Work 1987–88 2018–19 No % No %
(a) Permanent/attached labourer in agriculture 62 35.83 2 1.10 ( i) As sharecropper 13 7.51 - - (ii) As wage labourer on fixed cash basis 59 28.32 2 1.10
(b) Casual labourer in agriculture 97 56.07 59 32.60 (I) Total farm workers (a+b) 159 91.91 61 33.70
(c) Industry and construction labourer - - 27 14.92
(d) Serviceman 4 2.31 19 10.50
(e) Domestic labourer 2 1.16 13 7.18
(f) Workshop/shop helper - - 17 9.39
(g) Brick kiln labourer - - 18 9.94
(h) Self-employed* 8 4.62 8 4.42 (i) Others** - - 18 9.94 (II) Total non-farm workers (c+d+e+f+g+h+i) 14 8.09 120 66.30
Total (I+II) 173 100.00 181 100.00
* Includes activities like dairy and poultry, street hawking, petty shops.** Includes sale of manure, work under MGNREGA. Source: Primary survey, 1987–88 and 2018–19.
ECO
NOM
IC &
PO
LITI
CAL
WEE
KLY

REVIEW OF RURAL AFFAIRS
Published on Saturday, june 27, 2020 vol lV nos 26 & 27 EPW Economic & Political Weekly24
of workers engaged in this sector increased from about 8% in 1987–88 to 66% in 2018–19.
Overall, the transformation process can be understood by observing the change in the nature of the workforce and its shift from one sector towards others. In the present context, the labour engaged in agriculture underwent three types of changes. The fi rst and most prominent was the shift of nature of employment from permanent to casual, since almost all the labourers that were engaged as permanent labour (on an an-nual basis) were now employed as casual workers (on a daily basis) in agriculture. The second type of transformation was the one wherein permanent agricultural labour based on share-cropping were converted to permanent wage labour based on fi xed cash remunerations. And, the third type of transfor-mation was the shift of agricultural labourers engaged in the farm sector to the non-farm sector.
Changing Pattern of Household Income
The study reveals that, with time, the income pattern of house-holds has changed, which is mainly attributed to changes in the pattern of employment. An agricultural labourer earns income from the farm sector by working as permanent/ attached labour (for the year) or casual labour (on a daily basis). Table 4 shows the changing income situation of agricultural households over a period of three decades. It can be seen that per annum in-come from hiring out as permanent labour in agriculture in 1987–88 was `3,378, which declined to `1,143 in 2018–19, mainly due to lesser engagement of labour in this sector. In other words, this income declined from about 43% of the total income of the agricultural labour households in 1987–88, to merely 1% in 2018–19. Further, if compared at constant prices
of 1987, there is a drastic decline as the income from perma-nent labour reduced to merely 124 per annum/household.
The monocropping culture and capital-intensive green-rev-olution model have narrowed down the cropping season and reduced the working days, and this transformed permanent agricultural labour into casual labour. Furthermore, the situa-tion of employment of the casual labourers seemed to be no better. The study highlights a decline of annual real income from engagement as casual labour in agriculture from `3,393 in 1987–88 to `2,754 in 2018–19 at constant prices. Similarly, the proportionate contribution of this source in total income also declined from 43.18% in 1987–88 to 20.84% in 2018–19.
It is notable that the sampled households were not earning any income by hiring out their labour in industry and con-struction, brick kiln and shop/workshop in 1987–88 whereas these households were earning 19.17%, 9.95% and 9.52% of their total income from these respective activities, in 2018–19 (see Table 4). The total annual income of these labourers from agriculture declined from about `7,276 in 1987–88 to `2,878 in 2018–19 at constant prices. The share of income from agri-culture in total income (permanent and casual labour) also declined from 86.17% in 1987–88 to 21.78% in 2018–19. With the agricultural sector becoming less remunerative, agricul-tural labourers depended upon non-farm activities. The in-come from non-farm sources increased from `582 in 1987–88 to `10,335 in 2018–19 at constant prices. The overall income increased from `7,856 in 1987–88 to `13,213 in 2018–19 at constant prices. This clearly exhibits that over a period of three decades, agriculture has become less opportune for lab ourers since the real income and the employment situation of the agricultural sector has been deteriorating. The depend-
ents are under severe constraints of the job market. Even if some are fi nd-ing employment in the agricultural sector, it is mainly of casual nature.
Due to the paucity of work in the ag-ricultural sector on the one hand, and the ineffective implementation of la-bour-friendly policies like Mahatma Gandhi National Rural Employment Guarantee Act (MGNREGA) on the oth-er, the rural labourers are depending upon the meagrely remunerative non-farm sector. Construction, mainte-nance and cleaning of public infr-astructure, petty shopkeeping, vend-ing, menial private jobs, activities of gram panchayat, domestic servants/help, and so on, were some of the other options. Also, the rural society has changed, and this has further isolated agricultural labourers based on socio-economic norms. Earlier, due to sim-plistic social norms, farmer households were seen to be managing their house-hold chores themselves even if the
Table 4: Changing Income level of Agricultural Labour Households in Punjab (`/annum) (1987=100)Source of Income Per Household Per Capita 1987–88 2018–19 1987–88 2018–19 Constant Current Constant Current Prices Prices Prices Prices
(a) Permanent/attached labour in agriculture 3,378 124.29 1,143 596.80 25.01 229.98 (42.99) (0.94)
(b) Casual labour in agriculture 3,393 2,753.62 25,322 599.47 554.05 5,094.97 (43.18) (20.84)
(I) Farm income (a+b) 7276 2,877.91 26,465 1,285.42 579.06 5,324.95 (86.17) (21.78)
(c) Industry and construction labour -(19.17) 2,533.01 23,293 – 509.66 4,686.78
(d) Serviceman and pensioner 81 2,030.91 18,676 14.31 408.63 3,757.75 (1.03) (15.37)
(e) Domestic helper 118 835.05 7,679 20.83 168.02 1,545.07 (1.5) (6.32)
(f) Shop/workshop helper – 1,257.84 11,567 0.00 253.09 2,327.36 (9.52)
(g) Brick kiln labour – 1,314.72 12,090 0.00 264.53 2,432.60 (9.95)
(h) Self-employed 806 1,023.49 9,412 142.38 205.93 1,893.75 (10.25) (7.75)
(i) Others* 82 1,339.84 12,321 14.52 269.58 2,479.07 (1.05) (10.14)
(II) Non-farm income (c+d+e+f+g+h+i) 582 10,334.85 95,038 102.89 2,079.45 19,122.38 (13.83) (78.22)
Total income (I+II) 7,856 13,213.17 1,21,507 1,388.31 2,658.59 24,448.09 (100) (100)
* Includes income from remittances and work under MGNREGA. Figures in parenthesis indicate percentages.Source: Primary survey, 1987–88 and 2018–19.
ECO
NOM
IC &
PO
LITI
CAL
WEE
KLY

REVIEW OF RURAL AFFAIRS
Economic & Political Weekly EPW Published on Saturday, june 27, 2020 vol lV nos 26 & 27 25
work was to collect and clean the cow dung. But now, farmer families rarely perform this work as they consider such activi-ties as undignifi ed and are performed only by the labour class.
Changing Income Level per Worker
The changing employment scenario among the farm and non-farm sectors explains the change in income generated from employment in these sectors for the sampled households. This change in income was biased more towards the non-farm sector. The rising absorption of labour by the non-farm sector cannot overshadow the reality of the wide disparity between income earned by workers engaged in the farm and non-farm sector. The pattern of change in the income generated per worker from the farm and non-farm sector exhibits that the farmers who were still engaged in agricultural activities were far worse than those engaged in the non-farm sector, with re-gard to improvements in income over three decades. It can be understood from Table 5 that the annual income per worker per household from the non-farm sector increased more than double, from `4,157 in 1987–88 to `8,612 (constant prices) in 2018–19. On the contrary, the annual income per workers per household from the farm sector that was 4,576 in 1987–88 in-creased marginally to `4,718 after three decades in 2018–19. This feature of the farm sector is highly worrisome from the viewpoint of gainful employment and depicts the vulnerability and plight of those still engaged in this sector.
Changing Pattern of Consumption Expenditure
A comparison of pattern of consumption expenditure over a period of three decades helps to analyse the the levels of living of an individual. In fact, one of the larger social dimensions of the agrarian crisis witnessed in Punjab is mirrored through the change in income and consumption levels of the agricul-tural labourers. In 1987–88, the annual average consumption expenditure of an agricultural labour household on food items like foodgrains, milk and milk products, sugar/gur, edible oil, vegetables and fruits, condiments, meat/eggs, intoxicants, fuel and light, clothing/bedding, footwear, and so on was `5,525, which increased to `8,388 at constant prices in 2018–19 (Table 6). However, the analysis of the proportion of the budget spent on consumption of varied items exhibits that food items accounted for 56.61% of the total consumption expenditure in 1987–88, which was almost the same (56.17%) in 2018–19. Further, though the annual expenditure on
non-durables like fuel and light, clothing and bedding, foot-wear, washing and toilet increased over three decades from `1,320 in 1987–88 to `1,449 in 2018–19 at constant prices, the overall share in expenditure budget of these items declined from 13.53% to 9.7%.
The annual expenditure on durables like house construc-tion, radios/tape recorders, phones and televisions, watches and clocks, electric fans, utensils, and so on, exhibited an increase as these items, accounted for 6.17% of the total con-sumption expenditure in 1987–88, which increased to 16.53% in 2018–19. It is notable that the consumption of durables has changed over this period; not only the type of such durables has changed but many new items have been added to the list that have become almost a necessity. For instance, phones were a luxury back in 1987–88 but have become an essential part of life now. Similarly, means of transportation have changed due to the increase in distances to be covered for work that infl uenced the change in the pattern and the subsequent
Table 5: Changing per Worker Annual Income of Agricultural Labour Households in Punjab Source of Income 1987–88 2018–19 No of Annual Annual No of Annual Annual Workers/ Income/ Income/ Workers/ Income/ Income/ Household Household Worker Household Household Workers (`) (`) (`) (`)
Farm sector 1.59 7,276 4,576 0.61 26,465 43,385 (2,878) (4,718)
Non-farm sector 0.14 582 4,157 1.20 95,038 79,198 (10,335) (8,612)
Total 1.73 7,856 4,541 1.81 1,21,507 67,131 (13,213) (7,300)Figures in parenthesis denote real income at 1987 prices.
Table 6: Changing Consumption Pattern of Agricultural Labour Households in Punjab (`/annum) (1987=100)Description Per Household Percentage 1987–88 2018–19 1987–88 2018–19 Constant Prices Current Prices
Non-durables (food + non-food items) 6,845.82 9,836.10 90,451.82 70.15 66.51
Food items 5,525.04 8,387.60 77,131.52 56.61 56.71
Cereals 2,902.47 2,418.24 22,237.88 29.74 16.35
Pulses 179.88 1,219.79 11,217.09 1.84 8.25
Milk/milk products 1,003.63 1,846.46 16,979.87 10.28 12.48
Sugar/gur 475.36 442.18 4,066.2 4.87 2.99
Edible oils 183.8 169.25 1,556.37 1.88 1.14
Fruits/vegetables 77.24 343.07 3,154.81 0.79 2.32
Condiments/spices 57.34 243.96 2,243.42 0.59 1.65
Pickles 15.27 108.26 995.52 0.16 0.73
Tea leaves 152.58 259.21 2,383.63 1.56 1.75
Biscuits/bread/sweets 30.68 306.47 2,818.29 0.31 2.07
Meat/eggs 32.59 564.15 5187.9 0.33 3.81
Intoxicants 414.2 466.57 4,290.54 4.24 3.15
Non-food Items 1,320.78 1,448.50 1,3320.3 13.53 9.79
Fuel/light 200.92 518.41 4,767.26 2.06 3.51
Clothing/bedding 900.21 335.44 3,084.7 9.22 2.27
Footwear 162.67 320.20 2,944.49 1.67 2.16
Washing/toilet articles 56.98 274.45 2,523.85 0.58 1.86
Durables 601.85 2,444.16 22,476.24 6.17 16.53
House construction 384.72 466.57 4,290.54 3.94 3.15
Radio/stereo/phone/television 27.75 190.59 1,752.67 0.28 1.29
Watches/clocks 30.38 172.30 1,584.41 0.31 1.16
Electric fans 77.85 390.33 3,589.47 0.80 2.64
Sewing machines 22.3 221.09 2,033.1 0.23 1.49
Cots/bed/sofa 5.81 33.54 308.47 0.06 0.23
Utensils 11.55 373.56 3,435.23 0.12 2.53
Bicycles/bike 41.49 596.17 5,482.35 0.43 4.03
Services 438.48 1,640.62 15,086.98 4.49 11.09
Education 25.01 228.71 2,103.2 0.26 1.55
Healthcare 291.77 548.91 5,047.69 2.99 3.71
Conveyance 114.1 548.91 5,047.69 1.17 3.71
Entertainment 7.6 314.10 2,888.4 0.08 2.12
Socio-religious ceremonies 1,873.26 869.10 7,992.18 19.19 5.88
Total consumption expenditure 9,759.41 14,789.98 1,36,007.22 100.00 100.00
Source: Primary survey, 1987–88 and 2018–19.
ECO
NOM
IC &
PO
LITI
CAL
WEE
KLY

REVIEW OF RURAL AFFAIRS
Published on Saturday, june 27, 2020 vol lV nos 26 & 27 EPW Economic & Political Weekly26
expenditure on durables. Furthermore, the share of services, like healthcare, education, entertainment, and so on, in the total household consumption expenditure of agricultural labourers was 4.49% in 1987–88, which increased to 11.09% in 2018–19. This primarily happened due to the privatisation of these services that are very expensive now. In the case of expenditure on marriages and other social ceremonies, the share of such expenditure to the total expenditure declined from 19.19% in 1987–88 to 5.88% in 2018–19. According to a study, in the rural society, there is a rising trend of expen-diture on socio-religious ceremonies by farmer households, which could be one of the reasons for the destitution of these households (Sharma et al 2015: 441–43). It is often assumed that the same trend prevailed for agricultural labourers also. However, the declining proportion of the expenditure budget being spent on such ceremonies by these labourers breaks the myth of the irrationality in spending by agricul-tural labourers.
Declining Poverty Level
The term “poverty” is defi ned, in terms of head count ratios as the inability of an individual to meet a certain minimum, desirable level of living. Dandekar and Rath (1971) estimated that the persons whose per capita consumption/income in rural areas is 180/annum at 1960–61 prices are considered as below the poverty line. Based on this criterion, an estimate was generated of the percentage of the agricultural labourers below the poverty line in 1987–88 and 2018–19, using the con-sumer price index for agricultural labourers. It was found that 35.87% of agricultural labourer households in Punjab were liv-ing below the poverty line during 1987–88, which decreased to 8.20% in 2018–19 (Table 7).
The declined poverty ratio is an estimation of the average economic health of agricultural labourers. Along with pov-erty, the average propensity to consume (APC) is another important indicator that reveals the economic health of households. While the per capita income increased from `1,279/annum in 1987–88 to `2,659/annum at constant prices in 2018–19, the per capita consumption expenditure of the agricultural labour household during 1987–88 was `1,589/annum, which increased to `2,976/annum during 2018–19 at constant prices. Resultantly, the APC that was 1.24 in 1987–88 declined marginally to 1.12 in 2018–19. Though the APC of these households had declined, even then their average spending on consumption was more than that they were earning, which reveals that these families used bor-rowed funds to cater to their food defi cit. Resultantly,
indebtedness—both formal and informal credit—among these households becomes inevitable.
Increasing Magnitude of Debt
On an average, the economic condition of agricultural labour households was weak as these households earned less than their consumption expenditure and, thus, indebtedness foll owed. Table 8 reveals that the magnitude of the debt of agricultural labourers has increased over the three decades. On an aver-age, the amount of debt of an agricultural labourer household was `5,068 during 1987–88, which increased to `8,178 at con-stant prices in 2018–19. With regard to the extent of indebted-ness, it was observed that the proportion of indebted house-holds declined during the study period from 89% to 81%. This is mainly attributed to the shift of the workforce from the farm to the non-farm sector, which was relatively more remunerative. Despite the decline in the extent of indebtedness, the magni-tude of debt of indebted households increased from `5,769 in 1987–88 to `10,096 at constant prices in 2018–19. This indicates that a signifi cant shift towards the non-farm sector could not avert indebtedness, pointing towards the insuffi ciency of earnings.
The source of credit is also an important factor that affects the level of its repayment due to different interest rates and other terms and conditions of the funding agency. Sourcing of debt was inclined more towards non-institutional sources dur-ing the study period. Since these labourers could not access institutional sources easily (non-availability of collaterals), they were totally dependent or bound to their respective land-lords or employers. On an average, the agricultural labour household borrowed 72.40% of the total debt during 1987–88 from such non-institutional sources, which increased to 89.89% in 2018–19. The fact is that these asset-poor households could not borrow from institutional sources, which led to them avail-ing loans from non-institutional sources. Earlier, the govern-ment provided fi nancial and physical assistance to labour households through various schemes like the Marginal Farmers and Agricultural Labourers (MFAL) scheme, the Training of
Table 7: Changing Incidence of Poverty among Agricultural Labour Households in PunjabParameters 2018–19 1987–88 At 1987 At Current Prices Prices
Per capita income (`) 1,388 2,659 24,448
Per capita consumption (`) 1,724 2,976 27,366
Average propensity to consume 1.24 1.12
Persons below poverty line (%) 35.87 8.20
Source: Primary survey, 1987–88 and 2018–19.
Table 8: Changing Debt Position of Agricultural Labour Households in Punjab (1987=100) Description 1987–88 2018–19
Debt amount/ household (`) 5,068 8,178 [75,200]
Indebted households (%) 89.00 81.00
Debt amount/indebted household (`) 5,769 10,096 [92,840]
Source of finance (`) Institutional sources (`) 1,399 809 [7,438] (27.60) (10.11)
Non-institutional sources (`) 3,669 7,369 [67,762] (72.40) (89.89)
Purpose of credit (%) Productive purpose 13.98 12.3
Consumption purpose 86.02 87.7
Rate of interest (%) Institutional sources 13.75 10.2
Non-institutional sources 24.9 20.6
Figures in square brackets exhibit values at current prices, Figure in parentheses exhibit percentages.Source: Primary survey, 1987–88 and 2018–19.
ECO
NOM
IC &
PO
LITI
CAL
WEE
KLY

REVIEW OF RURAL AFFAIRS
Economic & Political Weekly EPW Published on Saturday, june 27, 2020 vol lV nos 26 & 27 27
Rural Youth for Self Employment (TRYSEM), and so on. How-ever, with time, such government intervention declined, which resulted in an enhanced dependence of these labour families on non-institutional sources of credit.
Another aspect of indebtedness is the rate of interest, which was observed to have declined over the three decades. In 1987–88, the institutional rate of interest charged was 13.75%, which dec lined to 10.2% in 2018–19. Likewise, the non-institu-tional rate of interest also declined from 24.9% to 20.6% dur-ing the same time period. It is important to note that the rate of interest charged by non-institutional sources is still double than that charged by institutional sources. Despite the fact that the government has doubled the credit amount to farm sector in 2005, agricultural labourers are still deprived of loans from institutional sources. Over the period, institutional sources accounted for 27.6% of the total debt during 1987–88, which declined to 10.11% during 2018–19, thereby pointing towards vulnerability to fi nancial exploitation and misery, which is vicious in nature. A larger proportion (86% to 87%) of the loan was used by these labourers for consumption pur-poses like food, meeting daily expenses, healthcare and socio-religious celebrations. This reveals that despite the transition of households from farm to non-farm activities, these families could not come out of the debt trap.
An Overview and Policy Measures
The capital-intensive mode of production, an axis of the green-revolution model, although ensured enormous growth of farm productivity, also led to the subsequent shrinkage of farm em-ployment, which resulted in the structural shift of employment from the agricultural sector to other sectors. Declining work opportunities in agriculture and the shift towards non-gainful employment in other less opportune sectors is an aftermath of the uneven transition of these workers, and such changes are to be considered as an integral part of the extensive process of the transformation of an economy. The present study highlights the symptoms of the structural change in the rural economy of Punjab that is divulged through the transformation of agricul-tural labour households into mixed or solely non-farm labour households. This change comprises three main aspects: fi rst, conversion of permanent/attached agricultural labourers into casual agricultural labourers; second, transformation of the permanent/attached labour that was earlier engaged as share-croppers into permanent/attached wage labour; and third, the shift of agricultural labourers towards the non-farm sector.
There is a need to mull over the situation of transitioning agricultural labour, both in the agricultural and non-farm sectors. On the one hand, those agricultural labour house-holds that are solely depending on income from agricultural labour are struggling, and on the other, the ones shifting to the non-farm sector are changing over to menial jobs. As a result, a sizeable change in the income of agricultural labour (both permanent and casual) households has been noticed. However, the increase in the per worker annual income generated from the farm sector and the non-farm sector, over the three decades, was disparate. The per worker annual income from the non-farm
sector increased by more than double as compared to the marginal increase in agricultural sector. This created a wide income gap in the two sectors and also raises concerns about the plight of the labour engaged in this sector. This calls for government attention in order to enhance the livelihood of labour families. Policies to fi x higher minimum wages, rela-tive to those existing for agricultural labourers, by taking into consideration the lesser number of effective days of employ-ment in farming, need to be framed. Also, effective inclusion of these labourers under MGNREGA, the especially during the lean farming season, could supplement the income of these households. Considering that this employment scheme lacks effective implementation in the state, as the average number of days of employment that a labourer gets under this scheme is one-third of the assured number of days of employment, increasing the effective number of days of employment under the existing scheme will be helpful for improving the eco-nomic well-being of these households. In addition, there have been arguments in favour of increasing the current minimum days of employment from 100 to 150 days, along with bringing the wage rates at par with the wages in the non-farm sector. Village panchayats need to be empowered and made more accountable for the village-level management of labour and public works for widespread impacts.
The transition of the workforce has also changed the level and pattern of consumption expenditure of these households. The proportion of expenditure budget spent on comforts— durables and services—has increased, which indicates that the economic conditions of these households have improved with time. This is further affi rmed by the declining incidence of poverty. However, consumption being more than income points towards inevitable indebtedness. In order to tackle the problem of lesser earnings of agricultural labour relative to their expenditures, it is imperative to increase their real wag-es. The amount of debt on an average agricultural labour household in 2018–19 increased in comparison to 1987–88. Evidently, the role of non-institutional sources of lending, es-pecially landlords or employers in the case of these house-holds, continues to be signifi cant. The poor, illiterate and destitute labourers often fall prey to these lending sources that charge high rates of interest. The crucial role of non-institutional sources of credit in the lives of these households is argued as unavoidable, as these asset-poor households can-not provide collateral to the institutional sources of lending.
EPW Index
An author-title index for EPW has been prepared for the years from 1968 to 2012. The PDFs of the Index have been uploaded, year-wise, on the EPW website. Visitors can download the Index for all the years from the site. (The Index for a few years is yet to be prepared and will be uploaded when ready.)
EPW would like to acknowledge the help of the staff of the library of the Indira Gandhi Institute of Development Research, Mumbai, in preparing the index under a project supported by the RD Tata Trust.
ECO
NOM
IC &
PO
LITI
CAL
WEE
KLY

REVIEW OF RURAL AFFAIRS
Published on Saturday, june 27, 2020 vol lV nos 26 & 27 EPW Economic & Political Weekly28
In such a scenario, the crafting of special lending policies ca-tering to the economic realities of these labourers is the need of the hour. Further, extensive networks of institutional sources of credit, and easy and realistic terms and conditions of lending are crucial towards shielding resource-poor fami-lies from fi nancial distress. Regularisation of private money-lenders and monitoring their lending practi ces is another way to check fi nancial exploitation. Special credit institutions and specifi c schemes that extend credit to such labourers can help reduce their dependency on informal lenders. Also, there is a need to introduce effective and all-encompassing debt waiver schemes for this section of population.
There is dearth of well-thought-out developmental schemes and policy interventions to improve the economic conditions of agricultural labour. As a result, these households are un-dergoing a process of transformation, wherein they are leaving the agricultural wage market due to crisis-led push factors. In
such a situation, it is imperative to make the transformation through development-oriented pull factors. For this purpose, there is a need to develop rural industrialisation with special emphasis on agro-based industries that would help preserve the natural balance of employment in the rural economy. This development-led transitional strategy would enable the pull-ing of people towards higher remunerative sectors through gainful employment at their doorsteps. Consequently, the ru-ral economy would be propelled forward through the effi cient utilisation of localised resources and the strengthening of the backward and forward linkages. Above all, the productive ca-pacity of the rural economy would be reinforced through pro-cessing and value addition. This strategy would further lead to the growth-based transition of the rural workforce, ena-bling improvement in the living standard of the rural masses. As a ripple effect, such a smooth transition would facilitate the inclusive growth of the society.
References
Dandekar, V M and Nilakantha Rath (1971): Pover-ty in India, Pune: Indian School of Political Economy.
Devi, Y L, J Singh, K Vatta and S Kumar (2013): “Dynamics of Labour Demand and Its Deter-minants in Punjab Agriculture,” Agricultural Economic Research Review, Vol 26, No 2, pp 267–73.
Dutta, Subrata (2019): “Capitalist Development and Rural Livelihoods in Search of a Cohesive Development Approach,” Economic & Political Weekly, Vol 56, Nos 26 and 27, pp 36–43.
GoI (2011): Census of India, Distribution of Workers by Category, Government of India, New Delhi.
Lewis, W A (1954): “Economic Development with Unlimited Supplies of Labour,” Manchester
School of Economic and Social Studies, Vol 22, No 2, pp 139–91.
Rangi, P S, M S Sidhu and Harjit Singh (2004): “Casualisation of Agricultural Labour in Punjab,” Indian Journal of Labour Economics, Vol 44, No 4, pp 957–70.
Sidhu, R S and Sukhpal Singh (2004): “Agricultural Wages and Employment in Punjab,” Economic & Political Weekly, Vol 39, No 37, pp 4132–35.
Singh, Sukhpal (2018): “Death in the Midst of Plenty: Farmer Suicides in Punjab,” Economic & Political Weekly, Vol 53, No 19, pp 15–17.
Singh, R and B Singh (2010): “Extent and Attri butes of Withdrawn Agriculture Labour in District Mansa: A Case Study,” Journal of Agricultural Development and Policy, Vol 20, No 1, pp 107–15.
Singh, Sukhpal, R S Sidhu, S K Sidhu, H S Kingra and M S Sidhu (2012): “Farmers’ and Agricultural
Labourers’ Suicides Due to Indebtedness in the Punjab State,” Research Report, Department of Economics and Sociology, Punjab Agricultural University, Ludhiana, pp 1–171.
Singh, Sukhpal and Shruti Bhogal (2014a): “De-peasantisation in Punjab: Status of Farmers Who Left Farming,” Current Science, Vol 106, No 10, pp 1363–68.
— (2014b): “Punjab’s Small Peasantry: Thriving or Deteriorating?” Economic & Political Weekly, Vol 49, Nos 26 and 27, pp 95–100.
Sharma, V K, H S Kingra, Shruti Bhogal and Sukhpal Singh (2015): “Sustainable Agricul-tural Development and Pattern of Domestic Consumption Expenditure of Punjab Farmers,” Indian Journal of Economics and Development, Vol 11, No 1, pp 439–47.
National Family Health Survey-4February 8, 2020
Twenty-five Years of the NFHS: Lessons for the Future —S Irudaya Rajan
Quality of Data in NFHS-4 Compared to Earlier Rounds: An Assessment —K Srinivasan, Rakesh Mishra
Demographic and Health Diversity in the Era of SDGs —K S James, S Irudaya Rajan, Srinivas Goli
Trends, Differentials and Determinants of Child Marriage in India: Evidences from Large-scale Surveys —Sanjay Kumar
Frequently Asked Questions on Child Anthropometric Failures in India —Sunil Rajpal, Rockli Kim, Rajan Sankar, Alok Kumar, William Joe, S V Subramanian
Stagnancy in the Unmet Need for Family Planning in India —Purushottam M Kulkarni
Intimate Partner Violence: Effects on Maternity Care and Pregnancy Outcomes in India —Srinivas Goli, Md Juel Rana, Jitendra Gouda
Household Assets and Wealth Quintiles, India 2006–16: Insights on Economic Inequalities —Udaya Shankar Mishra, William Joe
For copies write to: Circulation Manager,Economic & Political Weekly,
320–322, A to Z Industrial Estate, Ganpatrao Kadam Marg, Lower Parel, Mumbai 400 013.email: [email protected]
ECO
NOM
IC &
PO
LITI
CAL
WEE
KLY

REVIEW OF RURAL AFFAIRS
Economic & Political Weekly EPW Published on Saturday, june 27, 2020 vol lV nos 26 & 27 29
Employment of Women in Rural Punjab Deconstructing Agricultural Growth Policy
Ashapurna Baruah, Indervir Singh
High economic growth has failed to improve the status
or the participation of women in the labour market in
developing countries. Taking into account the case of
low labour force participation among women in rural
Punjab, an analysis of existing policy prescriptions—of
improving agricultural growth and crop diversification
as a panacea to the problem—is revealed to be
insufficient in improving the female labour force
participation rate. In order for policy to successfully
address these issues, it must consider the constraints
imposed by gender norms.
Most mainstream economic theories consider the gross domestic product (GDP) and employment to be synonymous. The various economic models focus on
GDP growth and assume that an increase in GDP automatically leads to full employment. However, these models are often built in the context of the developed Western countries that have different social and economic responses to economic growth. In a country like India, the policies pursued using these models may lead to undesirable results when it comes to employment generation, especially for women. Some macroe-conomic models do focus on the implications of market imper-fections due to factors like search costs, but they also fail to take into account costs that arise due to gender-based norms (Diamond 1989). These costs may lead to long-term hidden un-employment or underemployment in the economy. This hid-den unemployment or underemployment is not visible in data, and workers may be counted as voluntarily unemployed or a part of the workforce.
Economic growth in India has not been able to improve the status or the participation of women in the labour market (Fletcher et al 2017). The worsened employment conditions among women remain a characteristic feature of the process of rural transformation in the Indian economy, accentuating the labour market vulnerabilities among women. This is refl ected in women’s low employment participation, concentration in low productive sectors, low earnings, and irregularity of employ-ment in rural areas (Chowdhury 2011; Kannan and Raveen-dran 2012; Mazumdar and Neetha 2011; Rangarajan et al 2011).
This trend is even visible in more developed states like Pun-jab. The expansionary phase of development and high-income growth of Punjab’s economy has its source in capitalistic agri-culture. Punjab provides the ideal case of an agrarian econo-my that has transitioned from a traditional to a modernised one, which is highly market-oriented and commercialised. Despite the high-income growth in Punjab, the female labour force participation rate (FLFPR) has been low in rural areas (Baruah 2016). Researchers have often recommended increasing the growth of the agricultural sector and crop diversifi cation to improve the FLFPR in rural areas (Toor et al 2007). These sug-gestions are based on the premise that higher agricultural growth and diversifi cation will inevitably take care of the employment problem for all sections, including women. Even those studies that recognise the importance of diversifying to the rural non-farm sector ignore the issues that pertain to female labour (Sidhu 2002). The evidence suggests that in
The authors thank Atul Sood for his insights and encouragement that led to this paper. All omissions and errors are the authors’ own.
Ashapurna Baruah ([email protected]) is an independent researcher based in Dharamshala, Himachal Pradesh. Indervir Singh ([email protected]) is with the Department of Economics, Central University of Himachal Pradesh, Dharamshala, Himachal Pradesh.
ECO
NOM
IC &
PO
LITI
CAL
WEE
KLY

REVIEW OF RURAL AFFAIRS
Published on Saturday, june 27, 2020 vol lV nos 26 & 27 EPW Economic & Political Weekly30
both the high-growing or slow-growing agricultural sector, there is a dearth of employment generation for women, let alone creation of better conditions and quality of work (Baruah 2016). Even an increase in non-farm activities, which are often concentrated in urban areas, may not help the rural women.
In this context, the present paper examines the possibility of improving agricultural growth and crop diversifi cation in order to increase the FLFPR in rural areas of Punjab. The paper argues that the nature of the growth construct in the agricul-tural sector in Punjab has not kept the issue of women’s labour as central to growth and its outcomes. As a result, women’s participation and status in the labour market is deplorable, despite signifi cant growth in this sector. Even the existing FLFPR is misleading, as majority of the women in rural areas are only marginally employed. It is argued that the existing focus on growth in agriculture alone will not generate employ-ment, especially for women. There may indeed be a further reduction of demand for labour over time.
Agricultural Growth since the Green Revolution
Punjab saw rapid strides in agricultural growth with the adop-tion of the green revolution technology in the mid-1960s. The high growth in agriculture was a result of the huge increase in production and productivity following the adoption of an in-tensive system of cultivation. A comparison of yield in wheat and paddy between the pre- and post-green revolution periods gives a vivid picture of this growth. During the 1952–53 to 1964–65 period, the yield in wheat grew annually at a rate of 2%, which increased to 2.6% from 1967–68 to 1984–85; paddy registered a much higher yield, from an annual growth of 1.7% during the pre-green revolution period to 5.7% in the post-rev-olution period (Bhalla et al 1990). The primary sector of the state registered an annual growth rate of 4.1% from 1960–61 to 1983–84 as compared to the national average of 2.2%. The overall economy of Punjab grew at an annual rate of 5% during the same period relative to the 3.5% growth at the national level (Bhalla et al 1990).
The agricultural sector in Punjab has undergone sig-nifi cant changes since 1962. The total cropped area under irrigation increased from 58% in 1962–65 to 98% in 2010–13 (Table 1). In compari-son, the total irrigated area in India increased from 19% to 46% during this period. Most of the improvement in area under irrigation in Punjab was the result of considerable private investment by the farmers in tube wells. The cropping intensity in Punjab has also gone up from 129% in 1962–65 to 189% in 2015–18, compared to an increase from 115% to 142% for India.
The intensifi cation in agriculture took place through both biochemical and mechanical technology. The biochemical technol-ogy was in the form of adoption of high-yielding variety (HYV)
crops, the use of fertilisers to enhance productivity, and the use of pesticides to protect crops from infestation. The number of pumpsets in Punjab increased from 8 per 1,000 hectares (ha) in 1962 to 170 in 2003 and further to 307 per 1,000 ha in 2017 (Table 2). Punjab had more pumpsets per 1,000 ha in 1982 than all other Indian states had in 2017. The number of tractors per 10,000 ha increased from just 24 to 790 between 1961 and 2018. The fertiliser consumption also went up between 1962 and 2003 from 8 kilograms (kg)/ha to 412 kg/ha, which again decreased to 245 kg/ha in 2016–17. Despite this decline, the per hectare consumption of fertilisers in Punjab was almost twice that of the consumption at the all-India level. There was also a considerable increase in the yield of all crops in Punjab. During 1981–82 and 2011–12, the yield per hectare of wheat, paddy, and cotton in-creased by 61%, 98.1%, and 434.8%, respectively (Table 4 , p 32).
Growth, Mechanisation and Labour
The agricultural sector in Punjab has experienced a signifi cant increase in cropping intensity, area under irrigation, input use and productivity, leading to its growth over the years. One of the obvious questions that arise from this trend is with regard to the role of mechanisation in this growth and its effect on human labour.
The impact of mechanisation on labour in Punjab is ana-lysed mainly through the aspects of farm size, agricultural operations, crops, and types of labour (family, permanent, and hired). All these aspects, either individually or in conjunction, bring out the differential impact of mechanisation on labour use. In terms of labour use, mechanisation in Punjab can be broadly divided into two phases. The fi rst phase constitutes the period from the inception of the green revolution in the 1960s to the mid-1980s, and the period thereafter defi nes the second phase.
In the fi rst phase, the nature of mechanisation by itself led to high demand for labour. Mechanisation took place largely through the use of tractors. There were over 20,000 tractors in Punjab during 1970–71, constituting more than 20% of the tractors in India (Chopra 1974). The adoption of HYV crops intensifi ed cultivation, and it was easier and faster to prepare the land for cultivation with tractors. Thus, farmers started preferring tractors to till the land. The use of tractors replaced the draught animals that were earlier used to plow the fi elds (Table 2).
This increased use of tractors did not replace human labour in the fi rst phase. On the contrary, there was a huge increase in the demand for agricultural labour during this period. There are two reasons for this increase. First, with the increase
Table 1: Irrigated Area and Cropping Intensity in Punjab (%)Year Percentage Share Cropping of Gross Cropped Intensity Area Irrigated Punjab India Punjab India
1962–65 58 19 129 115
1980–83 87 29 158 124
1990–93 95 36 180 130
2003–06 97 41 189 135
2010–13 98 46 190 139
2015–18 99 49* 189 142*This data refers to the provisional figure for the year 2014–15.Source: Bhalla and Singh (2010); GoP (2018). Table 2: Input Usage in Punjab vis-à-vis India
Tractors (per 10,000 ha) Pumpsets (per 1,000 ha) Fertiliser Consumption (kg/ha)Year Punjab India Year Punjab India Year Punjab India
1962 24 3 1962 8 5 1962–63 8 4
1982 254 37 1982 158 49 1980–81 209 44
1992 508 86 1992 170 79 1990–91 318 91
2003 704 167 2003 170 111 2003–04 412 136
2014 750 270 2017 307 148 2009–10 237 135
2018 790 546 2016–17 245 123
Source: Bhalla and Singh (2010); GoP (2014, 2018).
ECO
NOM
IC &
PO
LITI
CAL
WEE
KLY

REVIEW OF RURAL AFFAIRS
Economic & Political Weekly EPW Published on Saturday, june 27, 2020 vol lV nos 26 & 27 31
in cropping intensity, the quantum of time needed for agricul-tural operations had gone up. Therefore, the farmers had to increase the number of labourers working in the fi elds. Second, with the increase in production and productivity, the farmers’ incomes soared. The increased income in turn increased the marginal utility of leisure in comparison to marginal utility of income saved from employing family labour. Hence, those farmers, who used to carry out agricultural operations using family labour, started employing a greater number of hired labourers. In addition, as social and cultural norms restrict women from working outside the home, the higher income led to the replacement of women family labour with hired labour.
Empirical evidence showed that labour use on an average was higher on tractor-operated farms as compared to the bull-ock-operated farms. There was no evidence of labour displace-ment, whereas the labour use increased with the increase in the size of farms. During 1975–76, the average labour employ-ment per farm on fully tractorised farms was 10,411 person hours as compared to 8,342 person hours and 7,177 person hours in partly bullock- and tractor-operated farms, and pure-ly bullock- operated farms respectively (Prihar and Sidhu 1984). Labour time and the displacement of type of labour depend on the agricultural operations that are mechanised. Moreover, a tractor is used for multiple purposes, such as the preparation of land, sowing, manuring, to power irrigation pumps, harvesting, and threshing.
Agarwal (1981), using data1 for 1971–72 on HYV wheat in Punjab, brings out the differential impact of mechanised tech-niques by operations and farm size on labour time usage and type of labour. The tractor use for sowing, harvesting, and threshing has the effect of reducing labour requirements. However, if tube well irrigation is combined with tractor use in these agricultural operations, then it offsets the negative labour displacement effect of tractors. For instance, in the case of tractor use for plowing or sowing, as the farm size increases, the proportion of family labour time displaced tends to decrease, whereas that of permanent and casual labour time displaced increases. However, in irrigation, mechanisation (use of tube wells and not canal irrigation) has the effect of increasing labour time irrespective of the farm sizes. Among the farms, the extent of mechanisation was found to be the highest for threshing (nearly 73% of the farms were completely mechanised). While harvesting was largely manual, plowing and sowing were done with both traditional and modern methods, with an inclination towards the former.
An aggregative analysis showed that the hired (both casual and permanent) labour was higher for tractorised farms as compared to non-tractorised farms, whereas the use of family labour was marginally high in bullock-operated farms (Prihar and Sidhu 1984). This fi nding could have implications on women’s work. Considering it is the women of the house-hold who mostly worked as family help in their own fi elds, with the spread of tractorisation, they may have been replaced with hired labour by the big farming households. Though labour displacement per se might have not taken place, it
could be that the women of the households were replaced with hired help.
To know the effect of mechanisation on female labour, the analysis has to be done not in aggregation, but operation-wise for individual crops. This is because women were neither engaged in all agricultural operations nor in the cultivation of all the crops. In the case of wheat, it was found that mechani-sation did not adversely affect the employment of female la-bour during the fi rst phase (Agarwal 1981). The engagement of women in wheat cultivation activities was low, as less than 28% of the farms studied used female labour. Among these women workers, the share of family labour was much lower at 16.5%, and the remaining 83.5% were casually hired, with no female labour hired permanently. Sowing and harvesting were the only two activities where some involvement of fe-male labour was seen. In sowing, women were found to con-tribute about 19% of the labour time, whereas in harvesting, nearly 16% of the labour time was contributed by women. For harvesting, all women were casually hired, and for sowing, almost all female labour constituted family workers. Of the total female labour time, in these two activities, harvesting had the major share, accounting for nearly 88%. All these fi g-ures hint that since wheat harvesting in Punjab was done man-ually, mechanisation adopted in this crop is unlikely to have displaced women labour and their wage employment at least for the concerned crop.
With the deepening of the green revolution leading to the further intensifi cation of cultivation during the mid-1990s and afterwards, almost all agricultural operations, from sowing, to threshing and harvesting, became mechanised along with widespread use of tractors for tilling. The use of combine har-vesters replaced manual harvesting of crops. Over time, even other agricultural operations such as sowing were mecha-nised. During 1985–86 and 2006–07, the use of labour by farms in Punjab reduced by nearly 23%, from 1,089 person hours/ha in 1985–86 to 840 person hours/ha in 2006–07 (Devi et al 2013). If we look at the impact of mechanisation by the type of labour in the second phase, we fi nd the highest reduction in the use of family labour (38%), followed by per-manent labour (21%) and casual hired labour (10%). The pattern of labour use has also undergone a change during the last two decades, with a sharp decline in the dominance of family labour in the farms. Among the three, it was casual labour that constituted the largest share in total labour use in 2006–07. The mecha-nisation of most agricul-tural operations signifi cantly reduced the use of labour. The use of combine harvester and irrigation machines also surged
Table 3: Use of Labour and Machines in Punjab Agriculture, 1985–86 and 2006–07 (per ha)Particulars 1985–86 2006–07
Labour (person-hours) Family 511 319
Permanent 193 153
Casual 385 368
Hired (permanent + casual) 578 521
Total labour 1,089 840
Bullock labour (hours) 68 27
Machine (hours) Tractor 14.01 31.83
Combine harvester 0.13 1.89
Irrigation machines 186.95 281.77
Source: Devi et al (2013); The Commission for Agricultural Costs and Prices, various reports.
ECO
NOM
IC &
PO
LITI
CAL
WEE
KLY

REVIEW OF RURAL AFFAIRS
Published on Saturday, june 27, 2020 vol lV nos 26 & 27 EPW Economic & Political Weekly32
during this period from 0.13 hours to 1.89 hours and 186.95 hours to 281.77 hours, respectively (Table 3, p 31).
Shift in Cropping Patterns
The inception of the green revolution led to a shift from the erstwhile multi-cropping system to a system of commercia lised farming. Earlier, farming involved the cultivation of different crops as per the need of the households. The crops were to be produced at different times of the year, and so the farming households required hired labour throughout the year. This provided suffi cient days of wage employment to the local la-bourers belonging to the landless households. However, the commercialisation of agriculture lured the farmers to produce crops, such as wheat, rice, and cotton, to cater the needs of the market. Thus, labour demand was confi ned to a few peak periods in a year, thereby providing emp loyment only in those periods.
The new agricultural technology at the outset introduced HYV seeds in the cultivation of wheat, as a result of which the green revolution is often termed as the wheat revolution. Rice was the next crop for which HYV seeds were introduced. Pun-jab was not a rice-cultivating state before the advent of the green revolution. With the higher productivity accruing from the crop, a major part of the net sown area came under rice cultivation. While mechanisation gradually took over the manual harvesting in the case of wheat and rice, the same did not take place for cotton harvesting. Sowing of cotton could still be done with machines, but picking of cotton re-quired the use of labour. Despite mechanised sow-ing, the cotton crop re-quires 88.44 human labour days per ha in 2011–12 (Table 4). In comparison, wheat and paddy only re-quired 20.24 and 48.24 human labour days per ha in the same year. In fact, cotton picking is one activi-ty in which women were largely employed. Women belonging to the cultiva-tor’s household also worked in the fi elds during the cotton-picking season.
During the green revolution, some area under cotton was replaced by rice due to the minimum support price (MSP), which made rice cultivation relatively risk-free. The area un-der cotton declined considerably after the mid-1990s with the failure of cotton crop (Appendix Table A1, p 35). In the mid-1990s, the cotton fi elds were hugely infested by bollworms. The large number of farmer suicides in the southern districts of Punjab, where cotton was the main crop, was the result of the failure of the cotton crop for many consecutive years (Gill and Singh 2006). Since the land in these areas was less suita-ble for rice cultivation, farmers did not shift from cotton culti-vation in the earlier green-revolution days when HYV rice was
introduced. The infestation sharply reduced the productivity of cotton, and hence lowered the earnings of the farmers. Due to such adversity, many farmers withdrew from cultivating cotton. The land where cotton was grown earlier was shifted to growing rice, thereby reducing the net sown area under cot-ton cultivation.
A change in the cropping pattern had two major implica-tions: on rural labour and on the extent of mechanisation. First, the fall in the area under cotton meant that the labourers who were earlier employed during the cotton season lost their days of employment. Second, the shift to wheat and rice incre ased the extent of mechanisation in the state, which fur-ther reduced labour requirement. The shift from cotton culti-vation hit the women workers the most. The female labour in those cultivator households who would earlier go out in the fi elds remained confi ned to household chores. Several female wage labourers from landless households were deprived of a source of earning and had to lose a number of wage days in agriculture as well.
Declining FLFPR
The previous section has shown that agriculture has been growing over the years at a signifi cant rate since the green-revolution period. After the 1990s, the growth in the agricul-tural sector was accompanied by declining labour force par-ticipation in agriculture. This was owing to the reduction of labour hours requirement as a result of high mechanisation. The state of women’s employment over the course of this shift has been much worse. The FLFPR is lower than the male labour force participation rate (MLFPR) for all the years evaluated, but the gap between female and male rates was declining until 2004–05. The period between 1993–94 and 2004–05 seemed to be especially better for non-Scheduled Caste (SC) women as there was a 20 percentage points increase in their labour force participation rate (LFPR), in comparison to 10 percentage points rise in LFPR amongst SC women. However, the trend reversed in 2011–12 and the gap widened due to a fall in the participa-tion rate among women. In 2011–12, the FLFPR of SC and non-SC women declined even below the 1993–94 rate. The FLFPR of non-SC women remained higher than the FLFPR of SC women in 2011–12, although the difference is only marginal as com-pared to their difference in 1999–2000 and 2004–05.
A look at Table 5 depicts that the participation rates amongst women, which showed some boost in the mid-periods, reversed in the latest period. However, a deeper probe into employment by principal status and usual status (includes workers under principal and subsidiary status) reveals the extent of the
Table 4: Crop-wise Use of Human Labour and Yield in Punjab AgricultureCrop Year Human Labour Yield Days (Per Ha) (Qt/Ha)
Wheat 1981–82 47.99 30.75
1991–92 40.36 38.34
2000–01 33.86 45.63
2011–12 20.24 49.51
Paddy 1981–82 107.19 29.57
1991–92 73.13 32.57
2000–01 53.19 35.06
2011–12 48.24 58.57
Cotton 1981–82 97.32 3.16
1991–92 107.74 5.88
2000–01 91.04 4.30
2010–11 88.44 6.41
Source: Toor et al (2007), Commission for Agricultural Costs and Prices, various reports.
Table 5: Labour Force Participation Rates among Male and Female and SC and Non-SC Females in Rural Punjab, 15–59 Years (%)Year LFPR WFPR* FLFPR FWFPR** Female Male Female Male SC Non-SC SC Non-SC
1993–94 35.2 88.5 34.7 87.3 34.9 35.3 34.8 34.6
1999–2000 45.4 86.8 44.9 84.7 42.2 47.3 41.9 46.8
2004–05 51.1 88 48.5 85 44.4 55.7 41.6 53.2
2011–12 33.4 83.1 32.9 81.1 32.6 33.9 32.4 33.2
*Workforce participation rate.**Female workforce participation rate.Source: Computed from NSS unit-level data, various years.
ECO
NOM
IC &
PO
LITI
CAL
WEE
KLY

REVIEW OF RURAL AFFAIRS
Economic & Political Weekly EPW Published on Saturday, june 27, 2020 vol lV nos 26 & 27 33
problem (see NSSO 2001 for detailed defi nitions). Once the share of persons working in subsidiary status is excluded from the usual status, the extent of the problem is found to be even higher. While for men, the difference (between usual status and principal status) is only marginal (1% or less), for women, the results are more striking (Table 6). If one considers only the principal status, the percentage share of women in the labour force declines to just between 5.4% and 6.6% for all years, and the improvements in the FLFPR during 1999–2000 and 2004–05 almost disappear. Surprisingly, the FLFPR in principal status shows an increase (instead of decline) of 0.5% in 2011–12. To understand the extent of the decline, take the example of 2004–05. In this year, FLFPR and MLFPR were 48.5% and 85%, respectively. However, considering principal status alone, the participation rates declined to 6.1% for females and 84% for males.
Across caste groups, it is found that the difference between usual status and principal status is relatively lower for SC women as compared to non-SC women (Table 7). In principal status, these two groups show different trends in labour force participation. While there was a decline in the LFPR of SC women from 7.8% to 6.5% between 1993–94 and 2004–05, the same period saw a rise in LFPR of non-SC women from 4.1% to 5.9%. In 2011–12, there was an increase in LFPR of SC women to 8.9%, whereas the LFPR of non-SC women dropped to 5%.
This striking difference seems to be the outcome of the dif-ferential impact of shocks and economic opportunities for SC and non-SC women. Improvement in the income of the house-holds increases the reservation wage of women. As a result, women work only if they are getting better paid jobs with bet-ter working conditions. The SC women, who generally hail from poorer households, are often at a disadvantageous posi-tion in terms of education and social capital, compared to their non-SC counterparts. Hence, they are less likely to be able to reap the benefi ts of better opportunities even if such opportunities exist. As a result, they may choose to withdraw from the labour force with improvement in the economic sta-tus of the households. Women from well-off families, on the
other hand, are in a better position to benefi t from the oppor-tunities arising out of the expanding economy. The opposite is likely to occur if the economic condition worsens; the women from well-off households may withdraw from the labour force, whereas women from poorer families may increase their em-ployment participation, as observed in 2011–12. This may be happening in Punjab as well. Improved economic conditions may have provided better job opportunities between 1999–2000 and 2004–05. Non-SC women, being in a better position to avail these jobs, benefi ted during this period. Women from the SC community, on the other hand, chose to withdraw from the labour force. The trend, however, was reversed in 2011–12, possibly because 2008–09 and 2009–10 witnessed a slowdown and were particularly bad years for the Indian agricultural sector.
Besides the difference in participation rate between SC and non-SC women, the questions remain: Why only a small frac-tion of women are engaged in the principal status employment and what is the nature of work in the subsidiary status where most women are engaged? The answer to both the questions lies in the nature of growth that Punjab has experienced since the green revolution. The growth has remained completely disconnected from employment creation. The growth policies based on mainstream economics expected growth in itself to take care of employment generation. These policies ignored the social, demographic, and economic constraints faced by women and, like most mainstream economic models, were based on the assumption of zero transaction cost.
As previously discussed, growth in agriculture was a result of the high degree of mechanisation. The rate of mechanisation
Table 6: Labour Force Participation Rate by Work Status in Rural Punjab, Age 15–59 YearsYear Principal Status Usual Status# Female Male Difference Female Male Difference
1993–94 5.4 86.6 81.2 34.7 87.3 52.6
1999–2000 6.0 84.2 78.2 44.9 84.7 39.8
2004–05 6.1 84.0 77.9 48.5 85.0 36.5
2011–12 6.6 80.5 73.9 32.9 81.1 48.2
# Usual status includes all those who have been workers under either principal status or subsidiary status. Usual status is also the labour force participation rate in this case. Source: Computed from NSS unit-level data, various years.
Table 7: Labour Force Participation Rate of SC and Non-SC Women by Work Status, Age 15–59 YearsYear Principal Status Usual Status SC Non-SC Difference SC Non-SC Difference
1993–94 7.8 4.1 3.8 34.8 34.6 0.2
1999–2000 6.3 4.9 1.5 41.9 46.8 -4.9
2004–05 6.5 5.9 0.7 41.6 53.2 -11.5
2011–12 8.9 5.0 3.8 22.6 32.5 -9.9
Source: Computed from NSS unit-level data, various years.
Table 8: Labour Force Participation Rate of Workers across Industries in Rural PunjabYear Male Female SC female Non-SC Female Total
Agriculture 1993–94 64.6 23.6 29.6 20.1 53.7
1999–2000 61.7 9.6 12.1 7.9 44.5
2004–05 49.6 5.6 7.9 4.3 34.2
2011–12 39.2 10.9 20.0 3.6 31.3
Livestock and other allied agricultural activities 1993–94 3.6 69.2 60.2 74.3 21.0
1999–2000 3.1 82.0 76.4 85.6 29.1
2004–05 5.3 84.1 79.4 86.7 32.9
2011–12 4.3 64.5 47.2 78.3 21.0
Manufacturing 1993–94 7.7 1.5 3.3 0.5 6.1
1999–2000 8.6 2.1 2.4 1.9 6.5
2004–05 10.5 3.7 5.3 2.9 8.1
2011–12 12.8 10.9 14.7 7.8 12.3
Construction 1993–94 4.6 0.0 0.0 0.0 3.4
1999–2000 7.4 0.2 0.4 0.0 5
2004–05 13.5 0.1 0.1 0.1 8.8
2011–12 22.1 0.9 2.0 0.0 16.2
Services 1993–94 19.5 5.7 6.8 5.0 15.8
1999–2000 19.3 6.2 8.8 4.6 15.0
2004–05 21.1 6.5 7.3 6.1 16.0
2011–12 21.6 12.8 16.1 10.3 19.2
Source: Computed from NSS unit-level data, various rounds.
ECO
NOM
IC &
PO
LITI
CAL
WEE
KLY

REVIEW OF RURAL AFFAIRS
Published on Saturday, june 27, 2020 vol lV nos 26 & 27 EPW Economic & Political Weekly34
further increased post-1990s when human labour was re-placed at a greater rate. The farmers’ shift from labour-intensive to more capital-intensive crops accelerated the rate of mechanisation. While agriculture was undergoing these chang-es, the state policies including those relating to infrastructure creation directed capital to the major urban centres, and the rural areas were neglected. The gender-based constraints restricted women from moving to these urban locations for employment. The non-availability of work along with the nature of growth in agriculture resulted in these women re-maining in the labour market as subsidiary workers in agricul-ture or livestock rearing (Table 8, p 33). The National Sample Survey (NSS) data shows that 26.3% of the rural women in 2011–12 had a subsidiary status. This share was much higher at 42.4% in 2004–05.
Excessive focus on growth that created this problem has also impeded the growth itself by keeping a sizeable portion of the workforce unemployed or underemployed. One of the authors of this paper, in their fi eld study in rural Punjab, found that a sizeable portion of women in the rural area get just a few days of employ-ment in each cropping season (Table 9). Around 66% of the surveyed women chose to stay out of the labour force for most of the year due to the non-availability of work with-in the village (Table 10). All these women have shown interest in working. If provided the availability of gainful employment in nearby areas, these wom-en would prefer to work throughout the year and would have signifi cantly contributed to the growth of the economy.
Alternative Approach
In recent times, there has been a focus on higher agricultural growth and crop diversifi cation to absorb more female labour into the workforce (Toor et al 2007). Many have argued for moving away from the wheat–rice cycle (Singh and Sidhu 2004). However, agricultural growth, crop diversifi cation or shifting away from the wheat–rice cycle cannot generate enough employment to reverse the trend.
Since the 1990s, agricultural growth has been associated with higher levels of mechanisation. This mechanisation has been replacing labour at a much higher rate than the rate at
which the higher agriculture growth, increase in cropping in-tensity, or increase in agricultural diversifi cation (assuming that it takes place) can accommodate them. The growing mechanisation is replacing human labour in most of the agri-cultural activities in almost all crops, leaving little scope for employment generation.
Even though cotton is a relatively labour-intensive crop, the same cannot be said for all the substitutes of wheat and paddy. One may also argue that the whole area under less labour-in-tensive crops can be shifted to more labour-intensive crops. For example, the entire area under paddy can be shifted to cot-ton. However, there are many practical hurdles (such as the availability of market and price risk) in such a shift. Moreover, the data shows a decline in human labour days for all major crops like wheat, rice, and cotton in Punjab (Table 4). Further, it cannot be ascertained whether cotton will remain a labour-intensive crop in the future. Also, such a shift may not be desirable as it will result in a big fall in farmers’ incomes in the state as well as adversely affect the food security of the country (Shergill 2007).
Even if we assume that the demand for human labour will not further decline with mechanisation, shifting a large area from a capital-intensive crop such as rice to a labour-intensive crop like cotton will increase the demand for labour just for the harvesting period. A few additional days of labour will neither signifi cantly change the work status of rural women nor will these women be contributing to the economy in a meaningful way.
Thus, a change requires the adoption of a policy that focuses on the creation of gainful employment in rural areas through-out the year and takes into account the existing gender norms. One way to accomplish this is through incentivising the setting up of industries, especially small and marginal, in rural areas. Similarly, promoting businesses run by women may help more women get employment. Developing infrastructure in rural areas will further motivate entrepreneurs to set up their busi-ness in rural areas. Therefore, a policy that has employment generation at its centre is desirable to achieve high and inclu-sive growth in the economy.
Conclusions
Changes in agricultural production have eroded women’s labour from the sector over time. In the early phase of the green revolution, it was family labour that was displaced by hired labour, whereas in the latter phase, there was a further displacement even of hired labour through rapid mecha-nisation. These developments led to high underemployment among rural women. The failure of agricultural growth to provide gainful employment was the result of policies that excessively focused on growth while neglecting the employ-ment aspect altogether. Such policies have resulted in not only a low employment outcome, but also lower-than-optimal growth in rural Punjab. Course correction requires a policy that emphasises employment generation, keeping in mind the numerous constraints that women workers face due to social institutions.
Table 9: Average Days in Different Activities of Women During the Last One YearActivity SC Non-SC
Wage labour
Wheat harvesting 11 8
Rice transplantation 21 18
Cotton-picking 35 22
MGNREGA* 22 12
Self-employment
Family labour in agriculture 18 37
Others
Collection of scattered grains 14 10
* Mahatma Gandhi National Rural Employment Guarantee Act.Source: Primary survey.
Table 10: Share of SC Women by Reason for Not Working throughout the YearReason Share (%)
Non-availability of work within the village 66.0
Work available but at distant locations 1.0
Ailing health 11.0
Willing to work but not getting work 4.0
Other reasons 18.0
Total 100 (100)
The figure in parenthesis denotes the total number of respondents.Source: Primary survey.
ECO
NOM
IC &
PO
LITI
CAL
WEE
KLY

REVIEW OF RURAL AFFAIRS
Economic & Political Weekly EPW Published on Saturday, june 27, 2020 vol lV nos 26 & 27 35
Note
1 Both Prihar and Sidhu (1984) and Agarwal (1981) use the same data set. The data used was collected under the “Comprehensive Scheme for Studying the Cost of Cultivation of Princi-pal Crops” by the Punjab Agricultural Univer-sity (PAU), Ludhiana, for the Directorate of Economics and Statistics (DES), New Delhi. However, in Prihar and Sidhu (1984), data per-tains to 1975–76, and in Agarwal (1981), data pertains to 1971–72.
References
Agarwal, Bina (1981): “Agricultural Mechanisation and Labour Use: A Disaggregated Approach,” International Labour Review, Vol 120, No 1, pp 115–27.
Baruah, Ashapurna (2016): “Occupational Pattern and Workforce Participation of Women in Indi-an Rural Punjab: A Caste Perspective,” Millen-nial Asia, Vol 7, No 2, pp 153–83.
Bhalla, G S, G K Chadha, S P Kashyap and R K Sharma (1990): Agricultural Growth and Structural Changes in the Punjab Economy: An Input-Out-put Analysis, Washington, DC: IFPRI.
Bhalla, G S and Gurmail Singh (2010): Growth of Indian Agriculture: A District Level Study, New Delhi: Sage.
Chopra, Kusum (1974): “Tractorisation and Chang-es in Factor Inputs: A Case Study of Punjab,” Economic & Political Weekly, Vol 9, No 52, pp A119–27.
Chowdhury, S (2011): “Employment in India: What Does the Latest Data Show?” Economic & Political Weekly, Vol 46, No 32, pp 23–26.
Devi, Y L, J Singh, K Vatta and S Kumar (2013): “Dynamics of Labour Demand and its Deter-minants in Punjab Agriculture,” Agricultural Economics Research Review, Vol 26, No 2, pp 267–73.
Diamond, P (1989): “Search Theory,” Allocation, Information and Markets, John Eatwell, Mur-ray Milgate and Peter Newman (eds), London: New Palgrave, pp 271–86.
Fletcher, E K, Rohini Pande and Charity Troyer Moore (2017): Women and Work in India: Descriptive Evidence and a Review of Potential Policies, Harvard Kennedy School, Faculty Re-search Working Paper Series No RWP18-004, https://www.hks.harvard.edu/publications/women-and-work-india-descriptive-evidence-and-review-potential-policies.
GoP (2014): “Statistical Abstract of Punjab,” Publi-cation No 948, Economic and Statistical Org-anisation, Government of Punjab, https://es-opb.gov.in/static/PDF/Abstract2014.pdf.
— (2018): “Statistical Abstract of Punjab,” Publi-cation No 958, Economic and Statistical Organ-isation, Government of Punjab, https://www.esopb.gov.in/static/PDF/Abstract2018.pdf.
Gill, Anita and Lakhwinder Singh (2006): “Farm-ers’ Suicides and Response of Public Policy: Evidence, Diagnosis and Alternatives from Punjab,” Economic & Political Weekly, Vol 41, No 26, pp 2762–68.
Kannan, K P and G Raveendran (2012): “Counting and Profi ling the Missing Labour Force,” Economic & Political Weekly, Vol 47, No 6, pp 77–80.
Mazumdar, I and N Neetha (2011): “Gender Dimen sions: Employment Trends in India,
1993 –94 to 2009–10,” Economic & Political Weekly, Vol 46, No 43, pp 118–26.
NSSO (2001): “Concepts and Defi nitions Used in NSS, Golden Jubilee Publication,” National Sample Survey Organisation, Ministry of Sta-tistics and Programme Implementation, Gov-ernment of India, http://www.mospi.nic.in/sites/default/fi les/publication_reports/con-cepts_golden.pdf.
Prihar, R S and D S Sidhu (1984): “Impact of Mech-anization on Labour Employment in Punjab Agriculture,” Indian Journal of Industrial Rela-tions, Vol 19, No 3, pp 379–87.
Rangarajan, C, Padma Iyer Kaul and Seema (2011): “Where Is the Missing Labour Force?” Economic & Political Weekly, Vol 46, No 39, pp 68–72.
Shergill, H S (2007): “Sustainability of Wheat–Rice Production in Punjab: A Re-examination,” Economic & Political Weekly, Vol 42, No 52, pp 81–85.
Sidhu, H S (2002): “Crisis in Agrarian Economy in Punjab: Some Urgent Steps,” Economic & Politi-cal Weekly, Vol 37, No 30, pp 3132–38.
Singh Inderjit, Sukhwinder Singh and Lakhwinder Singh (2014): Punjab’s Economic Development in the Era of Globalisation, Delhi: LG Publishers.
Singh, Joginder and R S Sidhu (2004): “Factors in Declining Crop Diversifi cation: Case Study of Punjab,” Economic & Political Weekly, Vol 39, No 52, pp 5607–10.
Toor, M S, A S Bhullar and Inderpreet Kaur (2007): “Agriculture-led Diversifi cation and Labour Use in Punjab: Potentials and Constraints,” Indian Journal of Labour Economics, Vol 50, No 4, pp 737–46.
AppendixTable A1: Shifts in Cropping Pattern in Punjab, 1960–61 to 2016–17 (%) Wheat Rice Maize Total Cereals Pulses Rapeseed and Total Oilseeds Cotton Sugar Cane Potato Other Crops Gross Cropped Mustard Area
1960–61 29.58 4.8 6.91 45.65 19.08 2.26 3.91 9.45 2.81 0.19 18.9 100
1970–71 40.49 6.87 9.77 61.89 7.29 1.81 5.20 6.99 2.25 0.30 16.1 100
1975–76 38.99 9.06 9.22 62.21 7.05 1.95 5.03 9.27 1.82 0.43 14.2 100
1980–81 41.58 17.49 5.65 66.73 5.04 2.01 3.52 9.60 1.05 0.59 13.5 100
1985–86 43.48 23.95 3.63 72.21 3.14 2.11 2.95 7.81 1.09 0.60 12.2 100
1990–91 43.63 26.86 2.51 73.65 1.91 0.92 1.39 9.34 1.35 0.31 12.1 100
1995–96 41.55 28.19 2.21 72.56 1.23 1.30 3.06 9.57 1.75 0.50 11.3 100
2000–01 42.92 32.89 2.07 78.35 0.69 0.69 1.08 5.96 1.52 0.81 11.6 100
2005–06 44.03 33.64 1.89 79.95 0.37 0.60 1.02 7.08 1.08 0.90 9.6 100
2009–10 44.72 35.58 1.76 82.28 0.24 0.38 0.79 6.49 0.76 1.05 8.4 100
2016–17 44.78 39.03 1.48 85.43 0.47 0.41 0.53 3.65 1.13 1.17 7.62 100
Source: Singh et al (2014); GoP (2018).
Review of Urban AffairsNovember 30, 2019
The Lives of Waste and Pollution —Amita Baviskar, Vinay GidwaniBecoming Waste: Three Moments in the Life of Landfills in Mumbai City —Shireen MirzaUrban Waste and the Human–Animal Interface in Delhi —Nishant Kumar, Aparajita Singh, Barbara Harriss-WhiteFrom Balmikis to Bengalis: The ‘Casteification’ of Muslims in Delhi’s Informal Garbage Economy —Dana KornbergNumbing Machines: Manual Scavenging’s Reconstitution in 21st-century Bengaluru —Shreyas SreenathNeo-liberalising Inclusion? Waste Picking, Data Activism, and the State —Harsha AnantharamanThe Colonial Roots of India’s Air Pollution Crisis —D Asher Ghertner
For copies write to: Circulation Manager,Economic & Political Weekly,
320–322, A to Z Industrial Estate, Ganpatrao Kadam Marg, Lower Parel, Mumbai 400 013.email: [email protected]
ECO
NOM
IC &
PO
LITI
CAL
WEE
KLY

REVIEW OF RURAL AFFAIRS
Published on Saturday, june 27, 2020 vol lV nos 26 & 27 EPW Economic & Political Weekly36
Development Challenges for Agriculture in Maharashtra
Khalil Shaha, S Yogeshwari, R S Deshpande
Khalil Shaha ([email protected]) is a researcher at and R S Deshpande ([email protected]) is honorary visiting professor at the Institute for Social and Economic Change, Nagarbhavi, Bengaluru. S Yogeshwari ([email protected]) teaches at the School of Business Studies and Social Sciences, Christ (Deemed to be University), Bengaluru.
Maharashtra is confronting a critical economic col-lapse due to the impact of COVID-19. A simple ques-tion crops up here, whether this severe collapse
could have been avoided by selecting a more balanced indus-trial and regional development model. Immediately after the reorganisation of the state, the economic development policy was engrossed with industrial and urban development as their vanguards. The fi rst step was the formation of the Board of Industrial Development and the Maharashtra Industrial Deve-lopment Corporation (MIDC) in 1962. Irrigation development was recognised with the appointment of the Barve Committee in 1962 (GoM 1962). The state’s prominent development chal-lenges were the predominance of rainfed areas, fl uctuating climatic conditions, and acute underdevelopment in Vidarbha, Marathwada, and Konkan. Agriculture was the mainstay of the population. Over the last six decades, except sugar cane, precious little has been achieved in the sector relative to other regions of the country (Sawant et al 1999; World Bank 2003).
Right from the beginning, the agricultural sector of the state was in need of proper policy interventions. The devastating droughts of 1965–66 and their subsequent residual effect brought forth the pathetic condition of the sector (GoM 1960; Subramanian 1975). Conditions did not improve over the years and 1972–73 confronted another severe drought that was ana-lysed by the Sukthankar Committee Report (GoM 1973). The neighbouring state of Karnataka established a Drought Moni-toring Cell and achieved advances in drought preparedness. No doubt, Maharashtra government sought advices through the appointment of many expert committees, but these reports were neatly stacked without systematically implementing them. It is unfortunate that the most industrially progressive state of the country has, as yet, no systematic agricultural policy document.
Confronting Long-run Stagnation
Agriculture in Maharashtra is currently going through a criti-cal phase with farmer suicides continuing unabatedly, coupled with threatening stagnation in productivity and farm income. The politicians, irrespective of political parties, swear in every election to improve the conditions of farmers with little change translating into reality. Between 2014 and 2018, as many as 14,034 farmers have died by suicides (NCRB 2020). This is an outcome surely of the long-term neglect infl icted on the sector. The state accounts for about 9.3% of India’s population (2011), 13.72% in India’s industrial output (2018–19), 11.6% in India’s gross cropped area (GCA) (2015–16), and 13.9% in India’s gross
Maharashtra is heralded as one of the economically
advanced states, but this illusion crashed under the
attack of COVID-19 virus and economic deterioration is
expected to follow. It is argued here that the state policy
dished out a raw deal to the agricultural sector and set
the sector under severe stress. The path of this
retrogression, reasons behind the trends and the
possible policy platform for the last six decades are
traced. Stagnation has gripped the agricultural sector,
and it is losing cultivable land to other uses. This is
accompanied by a sharp increase in small and marginal
holdings. Surprisingly, the state has no agricultural
policy document in place and the sector largely
depends on only sporadic firefighting approaches
with a policy paralysis.
ECO
NOM
IC &
PO
LITI
CAL
WEE
KLY

REVIEW OF RURAL AFFAIRS
Economic & Political Weekly EPW Published on Saturday, june 27, 2020 vol lV nos 26 & 27 37
domestic product (GDP) (2018–19). Over the last 50 years, the agricultural sector of Maharashtra has undergone signifi cant changes, but what one sees is more a move towards stagnation.
In a long-term perspective, the state has not performed re-ally well in the agricultural sector, and the stagnation is quite visible when we look at the depiction of rolling growth trends (Figure 1). It is well known that the agricultural output has yearly fl uctuations and, therefore, long-term trends get affect-ed by the outliers or extreme values. Given the estimates of the probability of failures (NCA 1976), the growth rates in produc-tivity are worked out on a fi ve-year rolling basis (based on the methodology developed for the Government of Karnataka). It can be seen that the production growth rates tend to be close to the axis. The productivity growth is only seen among oil-seeds. Overall, the stagnation in productivity is quite clear.
Navigating Development through Constraints
Maharashtra has confronted staggered development initia-tives for the agricultural sector, and regional imbalances emerged as major hurdles in the way of overall development. More than 12 districts and about 90 talukas are continuously under the threat of drought. The state falls under a severely drought-prone region, but that was known since 1962. The sit-uation in Indian agriculture changed after the introduction of the green revolution, but not in Maharashtra till 1973–74, with the shock of two severe droughts. Surely, the production of foodgrains has increased for a short period, but so has the pop-ulation. The production of commercial crops like oilseeds, cot-ton, and sugar cane increased rapidly (GoM 2002). Commer-cialisation dominated the agricultural scenario albeit without preparing for conducive market conditions. Almost every hec-tare of incremental irrigated land was moved under commer-cial crops, led by sugar cane.
The overall development model of the state was tuned to-wards the primacy of non-agricultural sectors (Dev 1996), which infl icted severe distress among agriculturists, resulting in farmers’ agitations (Brass 1995). The agricultural workforce was getting drawn towards urban construction works, eroding the availa-bility of workers in rural areas. The lure of commercialisation caused large-scale rural–urban migration and a shift towards commercial crops (Sawant et al 1999; World Bank 2003). Agricultural lands were being acquired for non-agricultural
purposes, the peri-urban areas spread rapidly around every town, and during 1992–2018, more than a million hectares of the net sown area have gone out of agriculture. That would mean that during this period, the state has lost about 1.3 mil-lion tonnes of foodgrains per year.
Maharashtra is not an exception for the pan-India phenom-enon, where the share of agriculture in gross state domestic product (GSDP) is declining, but what is worrisome is that the rate of decline in Maharashtra is sharper. The share of agriculture and allied sectors declined from 26.01% to 17.90% during 1960–61 to 1990–91 respectively and further to 9.9% in 2018–19 (GoM 2020). The share of the industrial sector increased during 1960–61 to 1990–91, but has shown a sharp decline, particu-larly during 1990–91 to 2000–01 and 2011–12 to 2018–19. An important aberration is that the industrial sector of Mahara-shtra has reduced its share in the GSDP, even after market-centric economic reforms. Only the shares of the services sector in-creased from 49.40% to 59.7% during 1960–61 and 2018–19. Therefore, in the overall development scenario, the state is not performing even in the industrial sector, and the service sector as an emerging powerful growth engine also seems to be depressed.
It is disheartening to see that the share of the agricultural sector in the state domestic product (SDP) continues to decline at a faster rate than that of the workforce in the sector. Besides that, the productivity of most of the crops remained stagnant. The situation is worsened, coupled with the declining size of operational holdings. The average size of operational holdings has reached 1.3 ha (2015–16) from 4.3 ha in 1970–71. This de-cline is faster than demographically explainable trends. It is an intricate situation for the agricultural sector in the state, in which the process of marginalisation of both cultivated land and that of the agricultural profession is getting deeper, lead-ing to severe distress. Added to this, the commercialisation process in the state economy as also in agriculture causes re-duction in land use for agriculture.
Carrying Capacity and Changes in Land Use Pattern
Any analysis on the changing workforce not only reveals the proportion of rural population depending for their livelihoods on agriculture, but also the changes in carrying capacity of the sector. The changes in the density of the rural workforce of Maharashtra indicate that the workforce (cultivators and agri-cultural labourers) has declined marginally (by 10.29 percent-age points) between 1981 and 2011 as compared to the reduc-tion observed at the country level (25.73 percentage points). A relatively high share of the workforce relying on agriculture in the state is mainly because of lower growth in non-farm rural/Table 1: Rural Workforce Distribution: Maharashtra and IndiaParticulars Maharashtra India 1981 1991 2001 2011 1981 1991 2001 2011
Cultivators* (%) 47.93 46.72 41.69 39.86 50.84 48.68 40.14 33.00
Agricultural labourers* (%) 36.31 37.42 39.39 34.09 31.10 32.66 33.20 23.21
Non-agricultural workers* (%) 15.76 15.86 18.92 26.05 18.06 18.66 26.66 43.79
Total workers (million) 19.65 24.03 28.11 30.65 197.31 249.03 310.66 348.74
Total rural population (million) 40.79 48.38 55.73 61.56 523.90 628.90 742.60 833.75Figures for workforce are of both main and marginal workers. * Figures are percentages to total workers. Sources: GOI (various years; “Primary Census Abstract”).
Figure 1: Five-year Rolling Growth Rates of Cereals, Foodgrains and Oilseeds Productivity in Maharashtra30
25
20
15
10
5
0
-5
-10
-15
Source: Authors’ representation based on data from Directorat of Economics and Statistics, Ministry of Agricultue and Farmers Welfare, Government of India (https://eands.dacnet.nic.in/APY_96_To_07.htm)
Figure1: Five Year Rolling Growth Rates of Cereals, Foodgrains and Oilseeds Productivity in Maharashtra
1960
–61
1962
–63
1964
–65
1966
–67
1968
–69
1970
–71
1972
–73
1974
–75
1976
–77
1978
–79
1980
–81
1982
–83
1984
–85
1986
–87
1988
–89
1990
–91
1992
–93
1994
–95
1996
–97
1998
–99
2000
–01
2002
–03
2004
–05
2006
–07
2008
–09
2010
–11
2012
–13
2014
–15
2016
–17
Total foodgrains
Total cereals
Total oilseeds
ECO
NOM
IC &
PO
LITI
CAL
WEE
KLY

REVIEW OF RURAL AFFAIRS
Published on Saturday, june 27, 2020 vol lV nos 26 & 27 EPW Economic & Political Weekly38
urban employment opportunities (Narayanamoorthy 2002; Visaria 1995). The share of cultivators int total agricultural workers has come down from 47.93% (1981) to 39.86% (2011) (Table 1, p 37). This is an indicator of more numbers of farm workers shifting towards non-farm activities, while land is slipping out of agriculture and income from agriculture is in-suffi cient to sustain in farming (NSSO 2003). This shows a gloomy situation, and the fear of survival becomes fodder for the political operators.
In any development scenario, it is expected that the work-force from the traditional sector would shift to the non-tradi-tional emerging sector (Dev 1996; Fisher et al 1997; Hazell and Haggblade 1991). In Maharashtra, this process could not be stimulated due to misplaced development priorities and lack of planned direction. But, this did not happen in Maharashtra; rather, rural Maharashtra witnessed an increase in absolute headcounts of cultivators from 9.42 million to 12.22 million, and of agricultural labourers from 7.13 million to 10.45 million during 1981–2011. This resulted in an increase in non-viable small and marginal holdings and stress on land. When the size of the workforce in a sector increases, and the production of the sector stagnates, the net income generated surely declines, and that is exactly what happened in the sector, causing severe distress. Interestingly, the changes in landholdings and use pat-tern show expected trends. These are direct outcomes of the misplaced policies over the decades. On the one hand, the land base of the sector is shrinking, and on the other, the incomes are shrinking.
The land use pattern explains changes in the use of land re-sources (Table 2). It is clear that the carrying capacity of land in the agricultural sector is under stress. First, about 8.98 lakh ha of land has gone out of agriculture to non-agricultural uses since 1962–63. In the last two decades, almost 4.56 lakh ha have gone out of agriculture, and this is higher in quantum during 1962–92. Second, there is a sizeable barren and uncul-tivable wasteland that could be used for various pur poses, in-cluding housing, construction storages, dryland horticulture, rural industrialisation (the China model; Zhau 2002) with proper land utilisation policies. But, that has been marginal. Third, the net sown area has gone down by more than
9 lakh ha (between 1962 and 2018) leading to intensive culti-vation of land (increase in area cropped more than once). Land utilisation indicates a complete absence of land use planning policy and the entire work is handled by the Directorate of Town Planning and similar bodies at village panchayats. A substantial increase in small and marginal farmers has led to the proliferation of non-viable farms, land going out of agricul-ture, the increase of land under non-agricultural purposes, and a defi nite decline in the net cropped area, thus leading to a strain on the carrying capacity. All of these problems contrib-ute to the rural distress.
Forces of Commercialisation
The land use pattern indicates an overall trend as well as mi-cro changes in land use. Broadly, the crop pattern has three components, namely the area allocated to food crops, com-mercial crops, and plantation crops. Forces of commercialisa-tion, availability of technology, and market trends are the main determinants of changes in the cropping pattern. One of the important factors that determine changes in the cropping pattern is the availability of irrigation. Owing to the limited availability of irrigation for less than 18% of the GCA, the re-maining 2% is rainfed (GoM 2020). The area under cereal crops declined by nearly 23.2 percentage points between triennium ending (TE) 1982–83 (55.60%) and TE 2018–19 (32.94%), mainly because of substantial reduction in the area under jowar and bajra (19.5% and 4.9%), which refl ects the future food availa-bility. Though the productivity of pulse crops has been lower in the state, the area under pulse crops has increased from 13.6% in TE 1982–83 to 18.55% in TE 2018–19. Recently, soya bean (another commercial crop) has come in a strong way and a large area has been allocated to this crop. The varieties avail-able are suitable to the regional characteristics, and the prices are also quite attractive to farmers. More than all this, the sys-tem of marketing of soya bean is well developed. This pulled-in area from other crops is affecting foodgrain crops.
Despite severe water scarcity in the state, the area under sugar cane has increased nearly fi ve times between 1982–83 and 2018–19. The share of sugar cane in the GCA has also in-creased from just 1.83% to 3.87% during this period. Though the net returns per unit of water generated by sugar cane is very low when compared to most other foodgrain crops, esti-mates show that this crop alone consumes nearly two-thirds of irrigation water available in the state (World Bank 2002). The continued support of the sugar industries (through the state government) encourages the farmers to cultivate this water-intensive crop. Sugar cane is a politically sensitive crop in Maha-rashtra and the political career of many leaders is tagged to the roots of sugar cane. This compels the state to spend huge amounts for the survival of the sugar sector and the factories that are governed by the rural political bosses.
In an overall analysis, the process of commercialisation is quite evident in Maharashtra. The centrally sponsored schemes of crop-specifi c subsidies provoked the changes in area allocation across crops, at the cost of the area under staple foodgrains. There is another strange argument that the shortage of
Table 2: Land Use Pattern in Maharashtra (Area in lakh ha)Particular TE TE TE TE TE
1962–63 1972–73 1992–93 2001–02 2017–18
Forest 54.21 53.95 51.36 52.96 52.20
Barren and uncultivable land 17.98 17.87 16.16 17.05 17.96
Land under non-agricultural use 7.06 8.81 11.48 13.06 16.04
Cultivable waste land 9.23 13.60 9.60 9.02 9.11
Permanent pastures and grazing land 14.23 16.56 11.48 13.11 12.96
Land under misc tree crops and grooves 1.83 2.05 2.91 2.32 2.53
Current fallow 11.62 16.28 12.07 11.88 14.14
Other fallow 11.72 9.23 10.94 11.69 12.58
Net area sown 179.89 169.21 181.60 176.49 170.14
Area sown more than once 9.79 10.23 29.01 46.81 61.04
Total cropped area 189.69 179.44 210.61 223.29 231.18
Reported area for land use statistics 307.76 307.58 307.58 307.58 307.58
TE= Triennium Ending Years.
Sources: GoI (2020); GoM (2020).
ECO
NOM
IC &
PO
LITI
CAL
WEE
KLY

REVIEW OF RURAL AFFAIRS
Economic & Political Weekly EPW Published on Saturday, june 27, 2020 vol lV nos 26 & 27 39
foodgrain production is made good by increased yields through high-yielding varieties (HYVs), and therefore, the reduction in area is nothing to worry about. It is true that, initially, in the early 1970s this process did take place, but it lost its cadence during the 1980s, and today’s foodgrain production of Maha-rashtra may not sustain the ever-increasing population.
Table 3: Production of Principal Crops in Maharashtra (Production in lakh tonnes)Crops TE 1992–93 TE 2001–02 TE 2010–11 TE 2018–19
Rice 22.84 23.80 23.90 31.96
Jowar 53.45 41.97 34.56 20.42
Wheat 7.79 11.54 18.52 17.83
Bajra 12.68 10.17 8.50 6.00
Total cereals 101.44 94.31 106.88 105.12
Tur 4.57 7.66 8.33 13.91
Gram 2.88 4.67 10.63 17.96
Total pulses 14.11 19.08 23.76 36.50
Foodgrains 115.56 113.39 130.64 141.62
Groundnuts 7.59 5.11 3.92 3.35
Soyabean 2.01 11.42 27.84 43.34
Safflower 4.21 1.45 1.03 0.28
Total oilseeds 15.76 23.31 34.51 47.35
Sugar cane 352.41 492.83 701.66 757.15
Cotton 16.41 25.31 57.79 78.14
TE= Triennium ending average. Sources: GoM (various years; Season and Crop Report of Maharashtra State) and GoM (2020).
Table 4: Crop Productivity of Maharashtra and India: 1990 to 2019 Maharashtra (kg/ha) India (kg/ha) Relative Productivity (%) 1990–91* 2000–01* 2010–11* 2018–19* 1990–91* 2000–01* 2010–11* 2018–19* 1990–91* 2000–01* 2010–11* 2018–19*
Rice 1,464 1,276 1,588 2,150 1,740 1,901 2,181 2,535 84.1 67.1 72.8 84.8
Jowar 940 783 842 628 814 764 978 884 115.5 102.5 86.1 71.0
Wheat 1,053 1,257 1,618 1,631 2,281 2,708 2,895 3,284 46.2 46.4 55.9 49.7
Bajra 578 604 864 783 658 688 938 1,268 87.8 87.8 92.1 61.7
Total cereals 964 865 1,228 1,361 1,570 1,844 2,172 2,591 61.4 46.9 56.5 52.5
Tur 418 602 730 1,009 673 618 679 940 62.1 97.4 107.5 107.3
Gram 532 519 815 916 712 744 902 1,026 74.7 69.8 90.3 89.3
Total pulses 443 460 669 842 578 544 659 819 76.6 84.6 101.5 102.8
Foodgrains 846 757 1,068 1,172 1,380 1,626 1,879 2,184 61.3 46.6 56.8 53.7
Groundnuts 1,132 958 1,174 1,115 904 977 1,141 1,645 125.2 98.1 102.9 67.8
Soyabean 947 1,109 970 1,119 1,015 822 1,130 1,118 93.3 134.9 85.8 100.1
All oilseeds 666 820 914 899 771 810 1,041 1,239 86.4 101.2 87.8 72.6
Sugar cane (tonnes) 86 83 84 85 65 69 68 75 132.4 121.5 124.3 114.4
Cotton 117 100 278 313 225 190 439 477 52.0 52.6 63.3 65.6
Relative productivity is the ratio of Maharashtra’s productivity of the crop to that of India’s average; *TE = averages of Triennium Ending. Source: GOI (2012), GOM (2020), and GOI (various years; “Area and Production of Principal Crops in India”).
The production of various crops has increased in the state over the years (Table 3), but so has the population and the food demand. It is necessary to bear in mind that the productivity of different crops is relatively lower in the state as compared to the other states and the all-India average (Table 4). The trends in production and productivity are stagnating in the state, as revealed from the fi ve-year rolling growth rate graphs. The long-term trends show very little sustained growth over the years (Figure 1) (Sawant et al 1999; Dev 1996). The constraints are neither new nor are the intensities of climatic aberrations; these were continuously present on the scene for decades, un-attended by any effective policy. There seems to be precious little done towards charting a long-term policy for the state towards sustainable agriculture.
Development Priorities: Missing Targets
Industrial development was taken as an engine of develop-ment right from the beginning in the state. Primacy for indus-try was quite high and the focus was on industrial classifi ca-tion, balanced regional development, and the policy state-ments of 1973, 1977, and 1996. These steps strengthened the industrial sector, but unfortunately introduced truncated de-velopment, shadowing agriculture. Unfortunately, while pro-
viding the primacy to the industrial sector, agriculture took a back seat in development thinking. The shocks of 1965–66 1nd 1972–73 broke the poli-cy slumber, and briefl y, agriculture primacy crawled in to take a serious note about the sector. That was a very short-lived attempt. The plan alloca-tions across the fi ve year plan peri-ods make this trend very clear. It is observed that the state plan expend-iture on the agricultural sector as the share of total expenditure has de-clined over plan periods. The receding allocation of plan expenditures dur-ing different plan periods in Maha-rashtra on agriculture, rural devel-opment and irrigation is quite visible.
Altogether from the Third Plan to Twelfth Plan period, about `1,47,267 crore (current prices) have been spent on agriculture, rural develop-ment and irrigation. Though these three heads altogether accounted for about 45.79% to 34.50% in the total plan expenditure from the Third Plan to Twelfth Plan period, the share of agriculture and allied services has sharply declined from 30.87% to 7.12% during the Third to Eleventh plan periods (based on source of Table 5). Unlike the agriculture and allied services and rural development, the
Table 5: Sectoral Plan Expenditure per Hectare in the FYP of Maharashtra (At 2004–05 constant prices; in crore; GCA/ha*; GIA/ha**)Sr Five Year Agriculture and Rural Irrigation and TotalNo Plan Schemes Allied Services Development Flood Control (1) (2) (3) (4) (5) (6) = (3+4+5) ` Crore `/ha* ` Crore ` /ha* `Crore `/ha** ` Crore ` /ha*
1 Third Plan (1961–66) 2,872 1,523 - - 1,388 10,554 4,260 2,258
2 Fourth Plan (1969–74) 2,536 1,367 - - 1,899 11,822 4,435 2,391
3 Fifth Plan (1974–79) 2,813 1,425 - - 4,110 18,497 6,923 3,507
4 Sixth Plan (1980–85) 1,980 1,009 4,505 2,295 7,237 29,829 13,723 6,991
5 Seventh Plan (1985–90) 2,098 999 5,382 2,563 7,649 27,976 15,129 7,205
6 Eighth Plan (1992–97) 4,709 2,191 5,429 2,525 10,594 30,967 20,732 9,644
7 Ninth Plan (1997–2002) 3,852 1,777 3,411 1,574 5,485 14,429 12,747 5,882
8 Tenth Plan (2002–07) 3,437 1,534 4,181 1,866 12,180 30,202 19,799 8,834
9 Eleventh Plan (2007–12) 2,413 1,058 1,888 828 8,411 19,376 12,712 5,575
10 Twelfth Plan (2012–17) 12,037 5,195 3,162 1,365 13,814 31,396 29,014 12,522
Source: Authors’ estimates based on information provided in GoM (various years; Economic Survey of Maharashtra) and the recent year 2019–20 (in current prices), GoM (2020).
ECO
NOM
IC &
PO
LITI
CAL
WEE
KLY

REVIEW OF RURAL AFFAIRS
Published on Saturday, june 27, 2020 vol lV nos 26 & 27 EPW Economic & Political Weekly40
plan expenditure in irrigation and fl ood control has sharply increased from 14.92% in the Third Plan to nearly 24.84% in the Eleventh Plan in Mahara shtra and got a reduced share in the Twelfth Plan. The picture becomes intriguing when we arrive at the per hectare expenditure on these components (Table 5). Initially, the plan expenditure on agriculture was `1,523 per ha (for fi ve years), which touched 2,191 only during the Eighth Plan and again slid down to recover in the 12th plan. Of course, one must note the inclusion of the rural development sector during the Sixth Plan period. As such, it is clear that agriculture did not receive the allocation that it needs to sustain the growth trends.
Considering the predominant nature of rainfed cultivation and the wide variation in rainfall across regions, rightly the emphasis has been given for the development of irrigation. Area under irrigation (gross irrigated area [GIA]) increased from 1.24 million ha in TE 1962–63 to 4.26 million ha in TE 2013–14 in Maharashtra (Figure 2), an increase of about 2.48% per annum. However, the utilisation percentage of irrigation is very low in the state (GOM 1999). As of 30 June 2019, about 5.12 million ha of irrigation potential has been created in the state (GOM 2020). Of this, only about 70% (3.59 million ha, net irrigated area) has been utilised (Figure 3). This is very low as compared to the utilisation percentage at the national level, which was about 89.45% at the end of the Eighth Plan. Ex-penditure on irrigation has increased substantially, but not the area or the irrigated crop productivity. In fact, the productivi-ty of these crops has clearly stagnated during the last plan pe-riod. Inadequate availability of funds for developing hardware aspects of irrigation, such as construction of main canals and distribution systems, are often cited as the reasons for low uti-lisation (Rath 1989; Mishra and Chand 1995). The fact remains that irrigation strategy has not given the expected boost to the sector, barring sugar cane.
In terms of investment on irrigation, Maharashtra stands high on the ladder across the states in India. Up to the Ninth Plan period, for which we have comparable data, altogether `236.22 billion (in current prices) has been spent only on irri-gation development. As a result of the large investment in irri-gation, Maharashtra accounts for about 34% (1,229 dams) of the total number of large dams constructed in the country, as per the latest information available from the CWC (2002). But, still the state is among the low-irrigated regions. Despite having the largest number of dams and also storage capacity (second
highest in the country) of 22.10 cubic kilometre from the com-pleted projects, in terms of achievements, the proportion of cultivated area under irrigation is only about 17% of the GCA as of today, which is one of the lowest among the states in the country. During the Sixth Plan period, the state has spent `11.87 billion on micro and medium irrigation (MMI) and cre-ated irrigation potential for about 0.507 million ha, by spending only about `23,416/ha. But, this changed during the Seventh and Eighth Plan periods. With an investment of `23.92 billion during the Eighth Plan period, the state could create irrigation potential for only about 0.283 million ha from MMI source. This means that the average investment required to create one hectare of irrigation potetntial increased to 84,505 during the eighth plan period. Projects not being completed in time due to paucity of funds is identifi ed as the main reason for poor cost effi ciency (Gulati et al 1994; Abbie et al 1982; Deshpande and Narayanamoorthy 2001).
One of the important reasons for the low proportion of irri-gated area is that two-thirds of the water available in the state is used only for sugar cane, which accounts for less than 3% of the GIA in the state. The state has a distinction of having two irrigation commission reports, fi ve expert committee reports on droughts, many expert reports on agriculture, fi ve well-estab-lished agricultural universities, irrigation research institutes, various crop research institutes, the highest number of irrigation dams, and the highest quantum of water impounded (Deshpande and Narayanamoorthy 2001), but it is among the states with the lowest productivity across crops and a low share of area irrigated. Can we, then, not question the mis comprehended policies of the state or do we still blame natural calamities?
Farmers’ income cannot be increased unless the productivi-ty of crops is increased along with sustained price trends. While it may not be possible to provide irrigation for more than 30% of the cropped area at any point of time (GOM 1999) because of limited availability of irrigation potential in the state, moisture availability can be improved in the rainfed areas only through rainwater harvesting systems and water-shed development programmes. It is needless to mention that water shed development programmes under operation in different parts of the state did not make any signifi cant change in the productivity of crops by increasing the water availa-bility. The programmes have also not helped in drought proof-ing as was expected. Presently, the state has undertaken a recent initiative titled Maharashtra Village Social Transforma-tion Foundation, spearheading the Jal Shakti Abhiyan and Jalyukt Shivar Abhiyan with the chief secretary of the state at
0.48 0.58 0.79 0.97 1.02 1.15 1.080.61
0.751.12
1.712.18 2.14
2.67
1.09 1.33
1.91
2.69
3.2 3.29 3.75
1.22 1.57
2.41
3.34
3.794.02 4.26
TE 1962-63 TE 1972-73 TE 1982-83 TE 1992-93 TE 2002-03 TE 2009-10 TE 2013-14
(in M
illio
n ha
)
Fig. 2: Trends in Irrigated Areas in Maharashtra - 1960-2014
SIA WIA NIA GIA
Figure 2: Trends in Irrigated Areas in Maharashtra—1960–2014
4.5
4
3.5
3
2.5
2
1.5
1
0.5
0
SIA—surface irrigated area; WIA—well and tube well irrigated area. Sources: Based on GoM (2020) and https://eands.dacnet.nic.in/LUS_2000_2005.htm.
(in
mill
ion
ha)
80
60
40
20
0
Figure 3: Change in the Nature of Irrigation in Maharashtra
(% to
Net
Irri
gat
ed A
rea)
(% to
Net
Irrig
ated
Are
a)
Fig.3: Change in the Nature of Irrigation in Maharashtra
SIA
WIA
TE 1962–63 TE 1972–73 TE 1982–83 TE 1992–93 TE 2002–03 TE 2009–10 TE 2013–14
Sources: Same as figure 2.
ECO
NOM
IC &
PO
LITI
CAL
WEE
KLY

REVIEW OF RURAL AFFAIRS
Economic & Political Weekly EPW Published on Saturday, june 27, 2020 vol lV nos 26 & 27 41
the helm of affairs (Khapre 2016). The state government start-ed this programme in 850 villages. The programme was a fl ag-ship programme of the earlier government, which slowed down after the change of guard. Not much changed after this initiative.
Marginalisation of Peasantry
Land has been a major issue for debates and the rock bed of the politicisation process in Maharashtra. Land reforms in Ma-harashtra were certainly not as successful as in Kerala or in West Bengal, and that created puzzling results in the agrarian structure; rather the state plundered the opportunity to get ahead on this front (Deshpa nde 1998, 2007). About 13 enact-ments were included to eliminate landed intermediaries in Maharashtra and the discussion on the limits to landholding was too long-drawn. Tenancy abolition was plagued with a large number of loopholes and the Government of Maharash-tra declared 1 April 1957 as “Tillers Day” (quite an ironic day to give justice to the tillers). As a result, the landholding pattern of Maharashtra has emerged differently compared to the rest of the country. The leadership of Maharashtra was quite aware of the best land reform models in the country, but still evolved its own with in-built fl aws. Though the proportion of marginal and small holdings has been increasing both at the state and the national level, the share of these groups in the total num-ber of holdings is relatively lower in Maharashtra as compared to the all-India level (Figure 4). For instance, during 2015–16, marginal and small holdings accounted for about 79.5% of the total holdings in Maharashtra, whereas the same group ac-counted for nearly 86.1% at the all-India level.
The presence of a large share of marginal holdings in the country is quite explainable and it was due to the large share of marginal holdings in the hilly areas. The process of margin-alisation of landholdings in Maharashtra shows a sharp increase from 25.1% in 1970–71 to 51.1% in 2015–16, a sharp increase of 26 percentage points compared to the all-India in-crease of 50.6% (in 1970–71) to 68.5 % (in 2015–16), register-ing an increase of 17.9 percentage points. This is a clear indica-tion of proliferation of marginal holdings, and consequently, marginalisation of the sector. Besides, the average size of hold-ings has reduced from 4.28 ha to 1.3 ha over the last four and a half decades, and this decline is sharper than observed at the all-India level (GOI 2019). This must sound a shrill alarm in the ears of policymakers of the state.
Five important observations emerge out of the analysis of the changes in the agrarian structure of Maharashtra. First, the process of marginalisation is increasing at a faster rate than explainable by demographic changes in the state. The shrinking size of holdings is an indication of the sneaking in of non-viability among the peasants. This is enhanced by the in-creasing cost of cultivation and technology. It is no wonder the farmers indicate a clear preference of quitting farming in favour of any other profession, and many of them preferring to sell their land to land sharks. Second, the non-viability of the small size of holdings compelled the peasants to undertake commercial crops promising good returns and creating a false
ambition. They are attracted towards the new crops and varie-ties, not recognising the market-engineered instability causing a sudden fall in the net income. Third, the land market was more in favour of the large owners, and that created the mar-ginalisation of the farmers from weaker sections. A large num-ber of farmers from socially deprived castes lost land under the pressure of this non-viable and non-affordable technology.
Fourth, the restrictions on tenancy created an undercover tenancy market, and this is fi ercely exploitative than the tenant exploitation before the abolition of tenancy. The small holder tenants can neither claim benefi ts from the state-led schemes nor abandon cultivation (as a Marathi proverb goes, “Mother does not allow to eat and father is prohibiting begging”). Fifth, the large landowners and corporate sector struck exactly at this red hot critical situation by offering good prices for the land. When cultivation is not even allowing bare survival, the peasants were left with no other choice than selling the land at the “attractive” prices and join the band of landless labourers. The census of Maharashtra clearly shows the increase in agricultural labourers disproportionately to the expected demographic trends.
Concluding Remarks
The economy of Maharashtra is crumbling rapidly under the pressure of a closing industrial sector and economically inac-tive metro cities. COVID-19 has crippled the backbone of Maha-rashtra’s economy and the only saviour looks to be the agricul-tural sector. However, the agricultural sector of Maharashtra is also in a critical phase with acute distress. The state has been undergoing this stress for the last two decades with patchwork policy solutions like “Vidarbha package.” Long-term continued neglect on the policy front and misplaced priorities have already brought the sector into a distressful condition. This paper brings out eight points explaining the pathetic condition of the agricultural sector of the state.
25.1 28.1 34.647.3 49.0 51.1 50.6 56.4 59.0 63.0 67.0 68.517.7
22.5
28.8
28.1 29.6 28.419.1
18.1 19.018.9
17.9 17.6
Figure 4: Distribution of Operational Holdings across Different Sizes in Maharashtra and India—1970–71 to 2015–16
Marginal (below 1.0 ha); Small (1.00–1.99 ha); Semi-medium (2.00–3.99 ha); Medium (4.00–9.99 ha); Large (10.00 and above); Sources: Based on GoI (2019).
100
90
80
70
60
50
40
30
20
10
0
1970–71 1980–81 1990–91 2000–01 2010–11 2015–16 1970–71 1980–81 1990–91 2000–01 2010–11 2015–16 Maharashtra India
Marginal Small Semi-medium Medium Large
available atUniquality
83, Janapath, Bapujee Bazar, Bhubaneshwar 751 009, OrissaPh: 2530064, 2530024
ECO
NOM
IC &
PO
LITI
CAL
WEE
KLY

REVIEW OF RURAL AFFAIRS
Published on Saturday, june 27, 2020 vol lV nos 26 & 27 EPW Economic & Political Weekly42
First, right after its formation, Maharashtra accepted a deve-lopment model that focused primarily on two sectors, namely industrial development and irrigation. This is visible from the analyses of the plan allocations over the 12 fi ve year plans. This strategic failure created two divergent development scenarios in the state: one with prosperity brought in by the industrial development or irrigation, and another contrasted by the economically weak, rural hinterlands striving through severe agrarian distress.
Second, it is quite clear from the plan allocations that the agricultural sector received low priority in development think-ing till the severe shock of the 1972–73 drought. The develop-ment initiatives emphasised primarily irrigation, by putting large amounts of scarce resources in this unitarily focused development initiative for agriculture. Irrigation has surely helped sugar cane development in Maharashtra, but it is also undoubtedly true that the sugar economy feeds only the haves and neglects the have-nots, besides gobbling up huge state resources. A few other crops also got the benefi t of irrigation, but the benefi ts of irrigation were more truncated towards the sugar economy of the state.
Third, as a result of these policies, the share of the SDP origi-nating from agriculture is sliding down at a faster rate. More worrisome is that this rate of decline is lower than the rate of change in the workforce in the sector, thereby affecting income trends. The hiatus between these two growth trends is increas-ing the density of dependents on each hectare of cultivated
land. Presently, the distress is located only in a few spots, but it will not be long before this spread takes another ugly turn. Policymakers must take this as a red warning.
Fourth, right from the time of reorganisation, the develop-ment policy of the state has always been truncated in favour of certain regions and groups of farmers. Not recognising the fact that the major portion of the state is under rainfed condi-tions and it is of utmost importance to focus on drought-prone and rainfed areas of the state, the policies bypassed these re-gions. Poverty is densely located in this region both as cause and effect. The state follows an interesting ritual of getting expert committee reports done for issues that bare open the policy gaps and, after a lot of euphoria, silently burying these reports deep and forgetting the recommendations. It started with the Barve Committee report (GOM 1962) to the Chitale Committee (GOM 1999), and from the Pardasani Committee (GOM 1960) to the Sukthankar Committee report (GOM 1973). More recently, too, on 7 February 2017, the Bombay High Court directed the state government to reconstitute the ex-pert committee aimed at making Maharashtra drought-free. After that, the issue was put to rest, possibly as the issue of drought died down.
Fifth, the carrying capacity of the agricultural sector is becoming critical. There is signifi cant rural outmigration due to higher wages on ever-increasing construction activities. Also, the size of holdings has been shrinking due to economic non-viability and demographic pressure. The number of marginal
Appeal for Donations to the Corpus of the Sameeksha Trust
This is an appeal to the subscribers, contributors, advertisers and well-wishers of Economic and Political Weekly (EPW), published by
Sameeksha Trust, a public charitable trust registered with the office of the Charity Commissioner, Mumbai, India. EPW has completed
50 years of publications. We have become what we are at present because of your support and goodwill. Week after week, EPW publishes
at least 80,000 words by a wide range of writers: veteran and young scholars, senior journalists and public commentators, political and
social activists; elected representatives of the people, policy practitioners, and concerned citizens.
In order to meet new editorial challenges, confront technological changes, provide adequate remuneration to our employees and
contributors, enhance our reputation and grow in stature and scale while zealously maintaining our editorial independence and autonomy,
we seek your support. Given the growing uncertainty in flows of advertising income and the fast-changing nature of publishing, it is our
endeavour to increase interest income by enlarging the corpus of the Sameeksha Trust. We seek active support from both institutions and
individuals in this endeavour.
Do donate to the corpus of the Sameeksha Trust. The Sameeksha Trust, which owns EPW and the EPW Research Foundation,
is a public charitable trust registered under the Bombay Public Trusts Act, 1950. Donations to Sameeksha Trust enjoy tax exemption under
Section 80G of the Income Tax Act, 1961. We welcome donations to the corpus not less than Rs 1,000 per individual. Donations in foreign
currency and donations from political parties are not accepted. We welcome donations from non-resident Indians (NRIs) and persons of
Indian origin (PIOs), but only in Indian currency and through regular banking channels. All donors must provide details of their Permanent
Account Number (PAN) and a covering letter, stating that this donation is to the corpus of the Sameeksha Trust. Please note that a covering
letter and photocopy of the PAN card is mandatory.
If you need more information on how to support us, please email us at [email protected] and we shall be happy to provide you with details.
— From the Trustees of Sameeksha Trust and the Editor of EPW
ECO
NOM
IC &
PO
LITI
CAL
WEE
KLY

REVIEW OF RURAL AFFAIRS
Economic & Political Weekly EPW Published on Saturday, june 27, 2020 vol lV nos 26 & 27 43
References
Abbie, L, J Q Harrison and J M Wall (1982): “Eco-nomic Returns to Investment in Irrigation in India,” World Bank Staff Working Papers No 336, World Bank, Washington, DC.
Brass, Tom (1995): New Farmers Movements in India, London: Taylor and Francis.
CWC (2002): “Water and Related Statistics,” Cen-tral Water Commission, New Delhi.
Deshpande, R S (1998): “Land Reforms and Agrari-an Structure in Maharashtra,” Journal of Indian School of Political Economy, Vol 10, No 1.
— (2007): “Emerging Issues in Land Policy,” INRM Policy Brief No 16, Asian Development Bank, Bangkok.
Deshpande, R S and A Narayanamoorthy (2001): “Issues before the Second Irrigation Commis-sion of Maharashtra,” Economic & Political Weekly, Vol 36, No 12, pp 1034–43.
Dev, Mahendra (1996): “Agricultural Policy Frame-work for Maharashtra: Issues and Options,” Proceeding/Projects Report, Indira Gandhi Institute of Development Research, Mumbai.
Fisher, T, V Mahajan and A Singha (1997): The For-gotten Sector: Non-Farm Employment Enterpris-es in Rural India, New Delhi: Oxford and IBH Publishing Company.
GOI (various years): “Primary Census Abstract,” Census of India, Offi ce of the Registrar General and Census Commissioner, Government of India, New Delhi.
— (2012): “Agricultural Statistics at Glance 2011,” Directorate of Economics and Statistics, Minis-try of Agriculture, Government of India, New Delhi, http://agricoop.nic.in/Agristatistics.htm.
— (2019): “Agricultural Census 2015–16: All India Report on Number and Area of Operational Holdings,” Ministry of Agriculture, Govern-ment of India, New Delhi.
— (2020): “Land Use Statistics at a Glance: 2006-07 to 2015-16,” Directorate of Economics and Statistics, Department of Agriculture, Coopera-tion & Farmers Welfare, Ministry of Agriculture and Farmers Welfare, Government of India, New Delhi, http://eands.dacnet.nic.in/LUS_1999_2004.htm.
— (various years): “Area and Production of Prin-cipal Crops in India,” Ministry of Agriculture,
Government of India, New Delhi, (https://ean-ds.dacnet.nic.in/APY_96_To_06.htm.
GoM (1960): “Report of the Fact Finding Commit-tee or the Survey of Scarcity Areas in Bombay State,” Vols I and II, Government of Maharash-tra, Bombay (Pardasani Committee).
— (1962): “Report of the Irrigation Commission 1962,” Department of Irrigation and Power, Government of Maharashtra, Bombay (Barve Committee).
— (1973): “Report of the Fact Finding Committee for Survey of the Scarcity Areas—Maharashtra State,” Government of Maharashtra, Bombay (Sukhatankar Committee).
— (1999): “Report of the Maharashtra and Irriga-tion Commission (Maharashtra Second Irriga-tion Commission, also known as Chitale Com-mittee),” Water & Land Management Institute, Aurangabad.
— (2002): “Maharashtra Human Development Report,” Government of Maharashtra, Mumbai.
— (2020): “Economic Survey of Maharashtra 2019–20,” Directorate of Economics & Statis-tics, Planning Department, Government of Maharashtra, Mumbai.
— (various years): “Season and Crop Report of Maharashtra State,” Commissionerate of Agri-culture, Government of Maharashtra, Pune.
— (various years): “Economic Survey of Maha-rashtra,” Directorate of Economics and Statis-tics, Planning Department, Government of Maharashtra, Mumbai.
Gulati, Ashok, Mark Svendsen and Nandini Roy Choudhury (1994): “Major and Medium Irriga-tion Schemes: Towards Better Financial Perfor-mance,” Economic & Political Weekly, Vol 29, No 26, pp A72–79.
Hazell, Peter B R and S Haggblade (1991): “Rural–Urban Growth Linkages in India,” Indian Jour-nal of Agricultural Economics, Vol 46, No 4, pp 515–29.
Khapre, Shubhangi (2016): “Maharashtra: Premon-soon Boon for Jalayukt Shivar Projects,” Indian Express, 12 May.
Mishra, S N and Ramesh Chand (1995): “Public and Private Capital Formation in Indian Agricul-ture: Comments on the Complementarily Hy-pothesis and Others,” Economic & Political Weekly, Vol 30, No 25, pp A65–79.
NCA (1976): “Report on the National Commission on Agriculture,” National Commission on Agri-culture, Ministry of Agriculture and Irrigation, Government of India, New Delhi.
NCRB (2020): “Accidental Deaths and Suicides in India 2018,” National Crime Records Bureau, Ministry of Home Affairs, Government of India, New Delhi.
NSSO (2003): “Situation Assessment Survey of Farmers, 2003,” 59th NSS Round, National Sample Survey Organisation, Government of India, New Delhi.
Narayanamoorthy, A (2002): “Indian Irrigation: Five Decades of Development,” Water Resour-ces Journal, No 212, June, pp 1–29.
Rath, Nilakantha (1989): “Agricultural Growth and Investment in India,” Journal of Indian School of Political Economy, Vol 1, No 1, pp 64–83.
Subramanian, V (1975): Parched Earth: Maha-rashtra Drought 1970–73, Mumbai: Orient Longman.
Sawant, S D, B N Kulkarni, C V Achuthan and K J S Satyasai (1999): “Agricultural Development in Maharashtra—Problems and Prospects,” Occa-sional Paper 7, National Bank for Agriculture and Rural Development, Mumbai.
Vasaria, Pravin (1995): “Rural Non-Farm Employ-ment in India: Trends and Issues for Research,” Indian Journal of Agricultural Economics, Vol 50, No 3, pp 398–409.
World Bank (2002): “INDIA, Maharashtra: Reori-enting Government to Facilitate Growth and Reduce Poverty,” Vol I and II, Report No 25053–IN, Poverty Reduction and Economic Manage-ment Unit, South Asia Region, World Bank, Washington, DC.
— (2003): “Promoting Agricultural Growth—Ma-harashtra,” Rural Development Unit, South Asia Region, World Bank, Washington, DC.
Zhau, Yinghua (2002): “Report on China’s Develop-ment and Investment in Land and Water,” Pro-ceedings of Regional Consultation on Invest-ment in Land and Water, Bangkok, Thailand, 3–5 October 2001, RAP Publication: 2002/09, Food and Agriculture Organization, Bangkok, pp 187–208, viewed on 15 April 2020, http://www.fao.org/3/ac623e/ac623e0d.htm#bm13.
holdings increased by 26 lakh during the last four decades. This is aggravated by the fact that a large chunk of agricultural land (about 7.29 lakh ha) has gone out of cultivation and is being used for non-agricultural purposes. The increase in the amount of land going to non-agricultural uses, as refl ected even by the secondary data, is another warning bell.
Sixth, all this happened mainly due to the policy of margin-alising the peasantry under the pressure of technology and market on the one hand, and the increasing cost of cultivation on the other. The non-viability of the small and marginal farm-ers compels them to get out of cultivation as a profession. Be-sides, there is a clear attraction for rural workers to migrate to urban centres as industrial workers or for construction works. This gave them better income levels, but worse living condi-tions. The exodus of urban casual workers to their native plac-es due to COVID-19 exposed this situation and their living con-ditions. Many migrating workers, with the lure of attractive offer prices for their land, were induced to sell the land and join the folds of the urban casual labour force. This trend
unfortunately originated at the doorstep of the policy that gave primacy for urban industrial development and fl awed land reforms. The returning rural labour force will now create new issues soon, and that is another warning signal.
Seventh, the exodus of labour from urban locations out of Maharashtra and back to the villages in rural Maharashtra un-der the COVID-19 threat is going to create signifi cant economic stress in rural areas.
Eighth, Maharashtra, being a very progressive state in leading industrial development and promotion of human re-sources, surprisingly has not attempted any agricultural pol-icy, unlike Karnataka. It is time now to do away with patchy solutions to deal with the farmers’ distress and move towards long-term policy thinking for the next decade. This should include crop husbandry, market, technology, land, and input delivery systems as the major components. The deterioration of the livelihood system in rural Maharashtra is visible, and now, the only choice left is to arrest its rate to prevent the situation from worsening.
ECO
NOM
IC &
PO
LITI
CAL
WEE
KLY

Registered Offi ce: ‘Trishul’, 3rd fl oor, Opp. Samartheshwar Temple, Law Garden, Ellisbridge, Ahmedabad - 380 006.
Published on Saturday, JUNE 27, 2020 vol lV nos 26 & 27 EPW Economic & Political Weekly44
AXIS BANK LIMITED
INDEPENDENT AUDITOR’S REPORT
To the Members of Axis Bank LimitedReport on the Audit of the Standalone Financial Statements
OpinionWe have audited the accompanying standalone fi nancial statements of Axis Bank Limited (“the Bank”), which comprise the Standalone Balance Sheet as at March 31, 2020, the Standalone Profi t and Loss Account and the Standalone Cash Flow Statement for the year then ended and notes to the standalone fi nancial statements including a summary of signifi cant accounting policies and other explanatory information (hereinafter referred to as “the standalone fi nancial statements”).In our opinion and to the best of our information and according to the explanations given to us, the aforesaid standalone fi nancial statements give the information required by the Banking Regulation Act, 1949 as well as the Companies Act, 2013 (“the Act”) in the manner so required for banking companies and give a true and fair view in conformity with the accounting principles generally accepted in India, of the state of affairs of the Bank as at March 31, 2020, its profi t and its cash fl ows for the year ended on that date.
Basis for OpinionWe conducted our audit in accordance with Standards on Auditing (SAs) specifi ed under Section 143(10) of the Act. Our responsibilities under those Standards are further described in the Auditor’s Responsibilities for the Audit of the Standalone Financial Statements section of our report. We are independent of the Bank in accordance with the Code of Ethics issued by the Institute of Chartered Accountants of India (“ICAI”) together with the ethical requirements that are relevant to our audit of the standalone fi nancial statements under the provisions of the Act and Rules thereunder and we have fulfi lled our other ethical responsibilities in accordance with these requirements and the Code of Ethics. We believe that the audit evidence we have obtained is suffi cient and appropriate to provide a basis for our opinion on the standalone fi nancial statements.
Key Audit Matters Key audit matters are those matters that, in our professional judgment, were of most signifi cance in our audit of the standalone fi nancial statements of the current year. These matters were addressed in the context of our audit of the standalone fi nancial statements as a whole, and in forming our opinion thereon, and we do not provide a separate opinion on these matters. We have determined the matters described below to be the key audit matters to be communicated in our report.
SSr. No.
Key audit matters Audit Matter How our audit addressed the key audit matter How o
1. Information Technology (IT) Controls FrameworkThe Bank has a complex IT architecture to support its day to day business operations. The volume of transactions processed and recorded is huge. Moreover, a transaction may be required to be recorded across multiple applications depending upon the process and each application has different rules and a different set of user access and authority matrix. These applications are interlinked using different technologies so that data transfer happens in real time or at a particular time of the day; in batches or at a transaction level and in an automated manner or manually. The Core Banking Solution (CBS) itself has many interfaces. All these data streams directly affect the fi nancial accounting and reporting process of the Bank. The Bank has a process for identifying the applications where the controls are embedded. It also has a process to ensure that systems, processes and controls remain relevant. The Bank’s IT control framework includes automated, semi-automated and manual controls designed to address identifi ed risks. IT controls are stated in Entity Level Controls (ELC), IT General Controls (ITGC) and IT Application Controls (ITAC). We have identifi ed IT Controls Framework as a Key Audit Matter as the Bank’s business is highly dependent on technology, the IT environment is complex and the design and operating effectiveness of IT controls have a direct impact on its fi nancial reporting process. Review of these controls allows us to provide assurance on the integrity and completeness of data processed through various IT applications which are used for the preparation of fi nancial reports.
IT audit specialists are an integral part of our engagement team. Our approach of testing IT General Controls (ITGC) and IT Application Controls (ITAC) is risk based and business centric.As part of our IT controls testing, we have tested ITGC as well as ITAC. The focus of testing of ITGCs was based on the various parameters such as Completeness, Validity, Identifi cation, Authentication Authorization, Integrity and Accountability. On the other hand, focus of testing automated controls from applications was whether the controls prevent or detect unauthorized transactions and support fi nancial objectives including completeness, accuracy, authorization and validity of transactions.We gathered a comprehensive understanding of IT applications landscape implemented at the Bank. It was followed by process understanding, mapping of applications to the same and understanding fi nancial risks posed by people-process and technology. In ITGC testing we reviewed, on sample basis, control areas such as User Management, Change Management, Systems Security, Incident Management, Physical & Environmental Security, Backup and Restoration, Business Continuity and Disaster Recovery, Service Level Agreement. For ITAC, we carried out on sample basis, compliance tests of system functionality in order to assess the accuracy of system calculations. We also carried out procedures such as validations and limit checks on data entered into applications, approvals, process dependencies and restriction on time period in which transactions may be recorded. We tested the control environment using various techniques such as inquiry, review of documentation/record/reports, observation and re-performance. We also tested few controls using negative testing technique. We had taken adequate samples of instances for our tests.Wherever deviations were noted either the same were explained to our satisfaction or we tested compensating controls and performed alternate procedures, where necessary, to draw comfort.
ECO
NOM
IC &
PO
LITI
CAL
WEE
KLY

Registered Offi ce: ‘Trishul’, 3rd fl oor, Opp. Samartheshwar Temple, Law Garden, Ellisbridge, Ahmedabad - 380 006.
Economic & Political Weekly EPW Published on Saturday, JUNE 27, 2020 vol lV nos 26 & 27 45
2. Classifi cation, Provisioning and Write off of Advances(Refer note 5.2 of schedule 17 and note 1.2, 2.1.1 and 2.1.5 of schedule 18 to the standalone fi nancial statements)The Bank’s portfolio of advances to customers amounts to Rs 571,424.16 crores as at March 31, 2020 comprising of wholesale banking and Retail banking customer. As required under Income Recognition, Asset Classifi cation and provisioning norms (IRAC norms), guidelines on COVID 19 related Regulatory Package dated March 27, 2020 and April 17, 2020 issued by the Reserve Bank of India (the “RBI”) (‘Regulatory Package’) and other circulars, notifi cations and directives issued by the RBI, the Bank classifi es advances into performing and non-performing advances which consists of Standard, Sub-standard, Doubtful and Loss and makes appropriate provisions. The Bank, as per its governing framework, identifi es standard advances which require higher provision based on its evaluation of risk and internal ratings. The Bank also makes provisions against identifi ed categories of non-fund based facilities, basis the internal assessment and evaluation. The Bank identifi es sectors wherein the Bank perceives stress and makes higher provisions. The Bank also identifi es accounts which are to be technically written off based on the framework approved by the Bank’s Board of Directors. The classifi cation, provisioning and write off of advances is a Key Audit Matter as the Bank has signifi cant credit risk exposure to a large number of borrowers across a wide range of borrowers, products, industries and geographies and there is a high degree of complexity, uncertainty and judgment involved in recoverability of advances, estimation of provisions thereon and identifi cation of accounts to be written off. The same resulted in signifi cant audit efforts to address the risks around loan recoverability and the determination of related provisions and write off.
Our audit procedures included, but were not limited to the following:Provisions for Corporate advances against specifi c individual loans (Wholesale banking customer)1. Tested the key controls over borrower risk grading for wholesale
loans (larger customer exposures that are monitored individually) for classifi cation of such loans as performing or non-performing advances.
Tested on sample basis, the approval of new lending facilities against the Bank’s credit policies, the performance of annual loan assessments, and controls over the monitoring of credit quality.
Assessed the process for classifi cation by the Management including identifi cation of non-performing assets.
Tested loans on sample basis to form our own assessment as to whether impairment events had occurred and to assess whether impairments had been identifi ed in a timely manner.
For the selected non-performing loans, assessed Management’s forecast and inputs of recoverable cash fl ows, comments of auditor on the fi nancial statements, valuation of underlying security and collaterals, estimates of recoverable amounts on default and other sources of repayment.
Holding specifi c discussions with the credit and risk departments to ascertain if there were indicators of stress or an occurrence of an event of default in a particular loan account or any product category which need to be considered as NPA.
This included testing controls over the identifi cation of exposures showing signs of stress, either due to internal factors specifi c to the borrower or external macroeconomic factors, and testing the timeliness of and the accuracy of risk assessments and risk grading against the requirements of the Bank’s lending policies and RBI IRAC norms.
2. Performed credit assessments of a sample of corporate loans managed by a specialized group assessed as high risk or impaired, focusing on larger exposures assessed by the Bank as showing signs of deterioration, or in areas of emerging risk (assessed against external market conditions). We reviewed the Bank’s risk grading of the loan, their assessment of loan recoverability and the impact on the credit provision. To do this, we used the information on the Borrowers loan fi le, discussed the case with the concerned offi cials and senior management, and performed our own assessment of recoverability.
Provisions for Retail advances against specifi c individual loans (Retail banking customer)a. For retail loans (smaller customer exposures not monitored
individually), tested controls over the systems which record lending arrears, delinquency buckets based on the number of days loans are overdue, and calculate individual provisions.
b. Tested automated calculation and change Management controls and evaluated the Bank’s oversight of the portfolios, with a focus on controls over delinquency statistics monitoring.
c. Tested on sample basis the level of provisions held against different loan products based on the delinquency profi le and assumptions made in respect of expected recoveries, primarily from collateral held. We also carried out extensive data analytics procedures to identify exceptions and outliers.
Provisions estimated across loan portfolios (collective provision)1. Tested the Bank’s processes for making collective provision;2. Reviewed the Policy for higher provision for weak standard
advances and stressed sectors adopted by the Bank;3. Reviewed the Policy for provision on non-fund facilities adopted
by the Bank;4. Validated the parameters used to calculate collective provisions
with reference to IRAC norms, internal policy on higher provisions on weak standard advances, provisions on non-fund facilities;
5. Tested the completeness and accuracy of data transferred from underlying source systems used for computing collective provision;
6. Re-performed, for a sample of retail and wholesale portfolios, the calculation of collective provisions, to determine the accuracy of the same;
AXIS BANK LIMITED
ECO
NOM
IC &
PO
LITI
CAL
WEE
KLY

Registered Offi ce: ‘Trishul’, 3rd fl oor, Opp. Samartheshwar Temple, Law Garden, Ellisbridge, Ahmedabad - 380 006.
Published on Saturday, JUNE 27, 2020 vol lV nos 26 & 27 EPW Economic & Political Weekly46
7. Reviewed the Bank’s process for granting moratorium to borrow-ers as per the Regulatory Package announced by RBI. We tested the completeness and accuracy of data used for computing general provision in line with Regulatory package issued by RBI. With respect to additional provision made by the Bank on account of the impact of Covid-19 pandemic, we broadly reviewed the un-derlying assumptions and estimates used by the management for the same but as the extent of impact is dependent on future devel-opments which are highly uncertain, we primarily relied on those assumptions and estimates. These assumptions and estimates are a subject matter of periodic review by the Bank.
Technical write off across loan portfolios The Bank has adopted a framework for technical write off. We reviewed the framework and understood the process for identifi cation of loan portfolios to be technically written off. We tested on sample basis, the accounts identifi ed during the year to be written off for compliance with the aforesaid framework.Disclosure We assessed the appropriateness and adequacy of disclosures against the relevant RBI requirements relating to NPAs including the additional disclosures required to be made in accordance with the Regulatory Package.
Emphasis of Matter We draw attention to Note 1.2 of Schedule 18 to the standalone fi nancial statements which explains that the extent to which COVID-19 pandemic will impact the fi nancial statements, is dependent on future developments, which are highly uncertain.Our opinion is not modifi ed in respect of this matter.
Other InformationThe Bank’s Board of Directors is responsible for the other information. The other information comprises the information included in the Directors’ Report and Management Discussion and Analysis forming part of the Annual Report, but does not include the standalone fi nancial statements, consolidated fi nancial statements and our auditor’s report thereon and the Pillar III Disclosures under the New Capital Adequacy Framework (Basel III disclosures). The other information is expected to be made available to us after the date of this report. Our opinion on the standalone fi nancial statements does not cover the other information and the Basel III disclosures and accordingly, we do not express any form of assurance conclusion thereon.In connection with our audit of the standalone fi nancial statements, our responsibility is to read the other information identifi ed above when it becomes available and, in doing so, consider whether the other information is materially inconsistent with the standalone fi nancial statements or our knowledge obtained in the audit or otherwise appears to be materially misstated.When we read the other information, if we conclude that there is a material misstatement therein, we are required to communicate the matter to those charged with governance.
Responsibilities of Management and Those Charged with Governance for the Standalone Financial StatementsThe Bank’s Board of Directors is responsible for the matters stated in Section 134(5) of the Act with respect to the preparation of these standalone fi nancial statements that give a true and fair view of the fi nancial position, fi nancial performance and cash fl ows of the Bank in accordance with the accounting principles generally accepted in India, including the Accounting Standards prescribed under Section 133 of the Act, read with the relevant rules issued thereunder, provision of Section 29 of the Banking Regulation Act, 1949 and the circulars, guidelines and directions issued by Reserve Bank of India (“RBI”) from time to time. This responsibility also includes maintenance of adequate accounting records in accordance with the provisions of the Act for safeguarding of the assets of the Bank and for preventing and detecting frauds and other irregularities; selection and application of appropriate accounting policies; making judgments and estimates that are reasonable and prudent; and design, implementation and maintenance of adequate internal fi nancial controls that were operating effectively for ensuring the accuracy and completeness of the accounting records, relevant to the preparation and presentation of the standalone fi nancial statements that give a true and fair view and are free from material misstatement, whether due to fraud or error.In preparing the standalone fi nancial statements, Management is responsible for assessing the Bank’s ability to continue as a going concern, disclosing, as applicable, matters related to going concern and using the going concern basis of accounting unless Management either intends to liquidate the Bank or to cease operations, or has no realistic alternative but to do so.The Board of Directors are also responsible for overseeing the Bank’s fi nancial reporting process.
Auditor’s Responsibilities for the Audit of the Standalone Financial StatementsOur objectives are to obtain reasonable assurance about whether the standalone fi nancial statements as a whole are free from material misstatement, whether due to fraud or error, and to issue an auditor’s report that includes our opinion. Reasonable assurance is a high level of assurance, but is not a guarantee that an audit conducted in accordance with SAs will always detect a material misstatement when it exists. Misstatements can arise from fraud or error and are considered material if, individually or in the aggregate, they could reasonably be expected to infl uence the economic decisions of users taken on the basis of this standalone fi nancial statements. As part of an audit in accordance with SAs, we exercise professional judgment and maintain professional skepticism throughout the audit. We also:• Identify and assess the risks of material misstatement of the standalone fi nancial statements, whether due to fraud or error, design and
perform audit procedures responsive to those risks, and obtain audit evidence that is suffi cient and appropriate to provide a basis for our opinion. The risk of not detecting a material misstatement resulting from fraud is higher than for one resulting from error, as fraud may involve collusion, forgery, intentional omissions, misrepresentations, or the override of internal control.
AXIS BANK LIMITED
ECO
NOM
IC &
PO
LITI
CAL
WEE
KLY

Registered Offi ce: ‘Trishul’, 3rd fl oor, Opp. Samartheshwar Temple, Law Garden, Ellisbridge, Ahmedabad - 380 006.
Economic & Political Weekly EPW Published on Saturday, JUNE 27, 2020 vol lV nos 26 & 27 47
• Obtain an understanding of internal control relevant to the audit in order to design audit procedures that are appropriate in the circumstances. Under Section 143(3)(i) of the Act, we are also responsible for expressing our opinion on whether the Bank has adequate internal fi nancial controls with reference to fi nancial statements in place and the operating effectiveness of such controls.
• Evaluate the appropriateness of accounting policies used and the reasonableness of accounting estimates and related disclosures made in the standalone fi nancial statements by Management.
• Conclude on the appropriateness of Management’s use of the going concern basis of accounting and, based on the audit evidence obtained, whether a material uncertainty exists related to events or conditions that may cast signifi cant doubt on the Bank’s ability to continue as a going concern. If we conclude that a material uncertainty exists, we are required to draw attention in our auditor’s report to the related disclosures in the standalone fi nancial statements or, if such disclosures are inadequate, to modify our opinion. Our conclusions are based on the audit evidence obtained up to the date of our auditor’s report. However, future events or conditions may cause the Bank to cease to continue as a going concern.
• Evaluate the overall presentation, structure and content of the standalone fi nancial statements, including the disclosures, and whether the standalone fi nancial statements represent the underlying transactions and events in a manner that achieves fair presentation.
We communicate with those charged with governance regarding, among other matters, the planned scope and timing of the audit and signifi cant audit fi ndings, including any signifi cant defi ciencies in internal control that we identify during our audit.We also provide those charged with governance with a statement that we have complied with the relevant ethical requirements regarding independence, and to communicate with them all relationships and other matters that may reasonably be thought to bear on our independence, and where applicable, related safeguards.From the matters communicated with those charged with governance, we determine those matters that were of most signifi cance in the audit of the standalone fi nancial statements of the current year and are therefore the key audit matters. We describe these matters in our auditor’s report unless law or regulation precludes public disclosure about the matter or when, in extremely rare circumstances, we determine that a matter should not be communicated in our report because the adverse consequences of doing so would reasonably be expected to outweigh the public interest benefi ts of such communication.
Report on Other Legal and Regulatory Requirements(1) The standalone Balance Sheet and the Standalone Profi t and Loss Account have been drawn up in accordance with the provisions of Section
29 of the Banking Regulation Act, 1949 read with Section 133 of the Act read with relevant rules issued thereunder.(2) As required under Section 143 (3) of the Act and Section 30 (3) of the Banking Regulation Act, 1949, we report that:
a. We have sought and obtained all the information and explanations which, to the best of our knowledge and belief, were necessary for the purpose of our audit and have found them to be satisfactory;
b. In our opinion, the transactions of the Bank, which have come to our notice, have been within the powers of the Bank;c. The fi nancial accounting systems of the Bank are centralized and therefore, accounting returns for the purpose of preparing fi nancial
statements are not required to be submitted by the branches; we have visited 129 branches for the purpose of our audit. d. In our opinion, proper books of account as required by law have been kept by the Bank so far as it appears from our examination of
those books;e. The standalone Balance Sheet, the standalone Profi t and Loss Account and the standalone Cash Flow Statement dealt with by this
report are in agreement with the books of account;f. In our opinion, the aforesaid standalone fi nancial statements comply with the Accounting Standards prescribed under Section 133 of the
Act read with relevant rules issued thereunder to the extent they are not inconsistent with the accounting policies prescribed by RBI;g. On the basis of the written representations received from the directors as on March 31, 2020, and taken on record by the Board of Directors,
none of the directors is disqualifi ed as on March 31, 2020 from being appointed as a director in terms of Section 164(2) of the Act;h. With respect to the adequacy of the internal fi nancial controls with reference to fi nancial statements of the Bank and the operating
effectiveness of such controls, refer to our separate report in “Annexure”; i. With respect to the other matters to be included in the Auditor’s Report in accordance with the requirements of Section 197(16) of the Act;
In our opinion and to the best of our information and according to the explanations given to us, requirements prescribed under Section 197 of the Act is not applicable by virtue of Section 35B (2A) of the Banking Regulation Act, 1949.
j. With respect to the other matters to be included in the Auditor’s Report in accordance with Rule 11 of the Companies (Audit and Auditors) Rules, 2014, in our opinion and to the best of our information and according to the explanations given to us:
i. The Bank has disclosed the impact of pending litigations on its fi nancial position in its standalone fi nancial statements – Refer Schedule 12 read with note 2.2.16 of Schedule 18 - Contingent Liabilities to the standalone fi nancial statements;
ii. The Bank has made provision, as required under the applicable law or accounting standards, for material foreseeable losses, if any, on long-term contracts including derivative contracts - Refer schedule 5 read with note 2.2.16 of Schedule 18 to the standalone fi nancial statements in respect of such items as it relates to the Bank; and
iii. There has been no delay in transferring amounts, required to be transferred, to the Investor Education and Protection Fund by the Bank.
For Haribhakti & Co. LLPChartered AccountantsICAI Firm Registration No.103523W / W100048
Purushottam Nyati PartnerMembership No. 118970UDIN No. 20118970AAAABJ7471
Place: MumbaiDate: April 28, 2020
AXIS BANK LIMITED
ECO
NOM
IC &
PO
LITI
CAL
WEE
KLY

Registered Offi ce: ‘Trishul’, 3rd fl oor, Opp. Samartheshwar Temple, Law Garden, Ellisbridge, Ahmedabad - 380 006.
Published on Saturday, JUNE 27, 2020 vol lV nos 26 & 27 EPW Economic & Political Weekly48
ANNEXURE TO THE INDEPENDENT AUDITOR’S REPORT [Referred to in paragraph 2(h) under ‘Report on Other Legal and Regulatory Requirements’ section in our Independent Auditor’s Report of even date to the members of Axis Bank Limited on the Standalone fi nancial statements for the year ended March 31, 2020]Report on the Internal Financial Controls with reference to Financial Statements under clause (i) of sub-section 3 of Section 143 of the Companies Act, 2013 (“the Act”)We have audited the internal fi nancial controls with reference to fi nancial statements of Axis Bank Limited (“the Bank”) as of March 31, 2020 in conjunction with our audit of the standalone fi nancial statements of the Bank for the year ended on that date.Management’s Responsibility for Internal Financial ControlsThe Bank’s management is responsible for establishing and maintaining internal fi nancial controls based on the internal control with reference to fi nancial statements criteria established by the Bank considering the essential components of internal control stated in the Guidance Note on Audit of Internal Financial Controls Over Financial Reporting (the “Guidance Note”) issued by the Institute of Chartered Accountants of India (“ICAI”). These responsibilities include the design, implementation and maintenance of adequate internal fi nancial controls that were operating effectively for ensuring the orderly and effi cient conduct of its business, including adherence to Bank’s policies, the safeguarding of its assets, the prevention and detection of frauds and errors, the accuracy and completeness of the accounting records, and the timely preparation of reliable fi nancial information, as required under the Act.Auditors’ ResponsibilityOur responsibility is to express an opinion on the Bank’s internal fi nancial controls with reference to fi nancial statements based on our audit. We conducted our audit in accordance with the Guidance Note and the Standards on Auditing specifi ed under Section 143(10) of the Act to the extent applicable to an audit of internal fi nancial controls, both issued by the ICAI. Those Standards and the Guidance Note require that we comply with ethical requirements and plan and perform the audit to obtain reasonable assurance about whether adequate internal fi nancial controls with reference to fi nancial statements was established and maintained and if such controls operated effectively in all material respects.Our audit involves performing procedures to obtain audit evidence about the adequacy of the internal fi nancial controls with reference to fi nancial statements and their operating effectiveness.Our audit of internal fi nancial controls with reference to fi nancial statements included obtaining an understanding of internal fi nancial controls with reference to fi nancial statements, assessing the risk that a material weakness exists, and testing and evaluating the design and operating effectiveness of internal controls based on the assessed risk. The procedures selected depend on the auditor’s judgement, including the assessment of the risks of material misstatement of the standalone fi nancial statements, whether due to fraud or error.We believe that the audit evidence we have obtained is suffi cient and appropriate to provide a basis for our audit opinion on the Bank’s internal fi nancial controls with reference to fi nancial statements.Meaning of Internal Financial Controls with reference to Financial StatementsA Bank’s internal fi nancial control with reference to fi nancial statements is a process designed to provide reasonable assurance regarding the reliability of fi nancial reporting and the preparation of fi nancial statements for external purposes in accordance with generally accepted accounting principles. A Bank’s internal fi nancial control with reference to fi nancial statements includes those policies and procedures that (1) pertain to the maintenance of records that, in reasonable detail, accurately and fairly refl ect the transactions and dispositions of the assets of the Bank; (2) provide reasonable assurance that transactions are recorded as necessary to permit preparation of fi nancial statements in accordance with the generally accepted accounting principles, and that receipts and expenditures of the Bank are being made only in accordance with authorisations of the management and directors of the Bank; and (3) provide reasonable assurance regarding prevention or timely detection of unauthorised acquisition, use, or disposition of the Bank’s assets that could have a material effect on the fi nancial statements.Inherent Limitations of Internal Financial Controls with reference to Financial Statements Because of the inherent limitations of internal fi nancial controls with reference to fi nancial statements, including the possibility of collusion or improper management override of controls, material misstatements due to error or fraud may occur and not be detected. Also, projections of any evaluation of the internal fi nancial controls with reference to fi nancial statements to future periods are subject to the risk that the internal fi nancial controls with reference to fi nancial statements may become inadequate because of changes in conditions, or that the degree of compliance with the policies or procedures may deteriorate.OpinionIn our opinion, the Bank has, in all material respects, adequate internal fi nancial controls with reference to the fi nancial statements and such internal fi nancial controls with reference to fi nancial statements were operating effectively as at March 31, 2020, based on the internal control with reference to fi nancial statements criteria established by the Bank considering the essential components of internal controls stated in the Guidance Note issued by the ICAI.
For Haribhakti & Co. LLPChartered AccountantsICAI Firm Registration No.103523W / W100048
Purushottam Nyati PartnerMembership No. 118970UDIN No. 20118970AAAABJ7471
Place: MumbaiDate: April 28, 2020
AXIS BANK LIMITED
ECO
NOM
IC &
PO
LITI
CAL
WEE
KLY
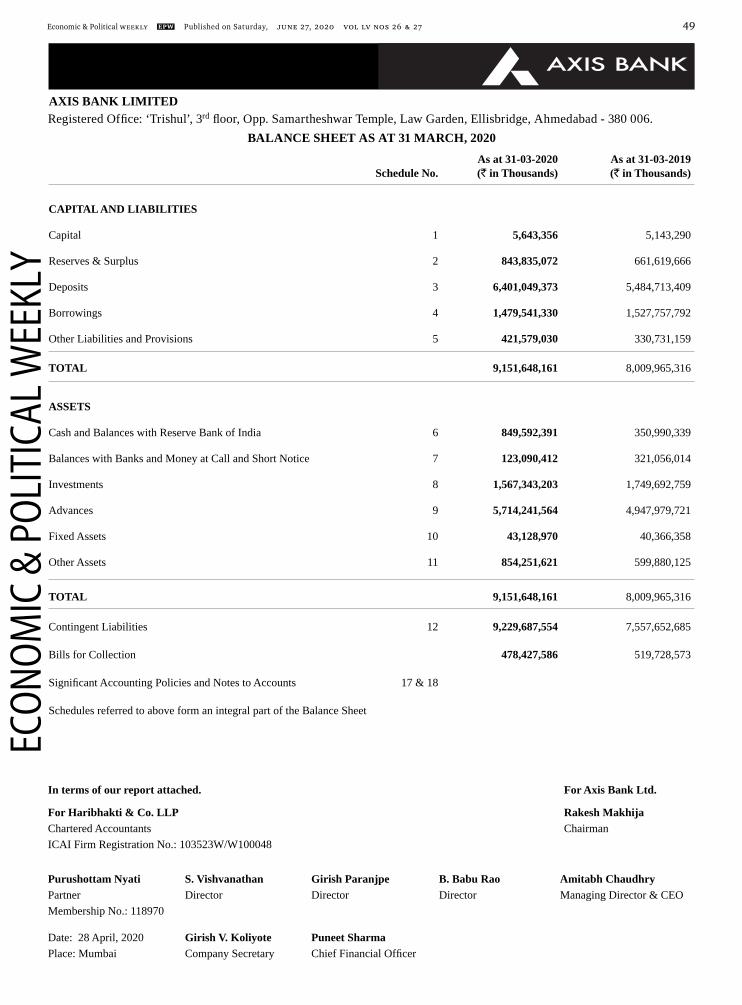
Registered Offi ce: ‘Trishul’, 3rd fl oor, Opp. Samartheshwar Temple, Law Garden, Ellisbridge, Ahmedabad - 380 006.
Economic & Political Weekly EPW Published on Saturday, JUNE 27, 2020 vol lV nos 26 & 27 49
As at 31-03-2020 As at 31-03-2019 Schedule No. (` in Thousands) (` in Thousands)
CAPITAL AND LIABILITIES
Capital 1 5,643,356 5,143,290
Reserves & Surplus 2 843,835,072 661,619,666
Deposits 3 6,401,049,373 5,484,713,409
Borrowings 4 1,479,541,330 1,527,757,792
Other Liabilities and Provisions 5 421,579,030 330,731,159
TOTAL 9,151,648,161 8,009,965,316
ASSETS
Cash and Balances with Reserve Bank of India 6 849,592,391 350,990,339
Balances with Banks and Money at Call and Short Notice 7 123,090,412 321,056,014
Investments 8 1,567,343,203 1,749,692,759
Advances 9 5,714,241,564 4,947,979,721
Fixed Assets 10 43,128,970 40,366,358
Other Assets 11 854,251,621 599,880,125
TOTAL 9,151,648,161 8,009,965,316
Contingent Liabilities 12 9,229,687,554 7,557,652,685 Bills for Collection 478,427,586 519,728,573 Signifi cant Accounting Policies and Notes to Accounts 17 & 18 Schedules referred to above form an integral part of the Balance Sheet
AXIS BANK LIMITED
BALANCE SHEET AS AT 31 MARCH, 2020
In terms of our report attached. For Axis Bank Ltd.
For Haribhakti & Co. LLP Rakesh MakhijaChartered Accountants ChairmanICAI Firm Registration No.: 103523W/W100048
Purushottam Nyati S. Vishvanathan Girish Paranjpe B. Babu Rao Amitabh ChaudhryPartner Director Director Director Managing Director & CEOMembership No.: 118970
Date: 28 April, 2020 Girish V. Koliyote Puneet SharmaPlace: Mumbai Company Secretary Chief Financial Offi cer
ECO
NOM
IC &
PO
LITI
CAL
WEE
KLY
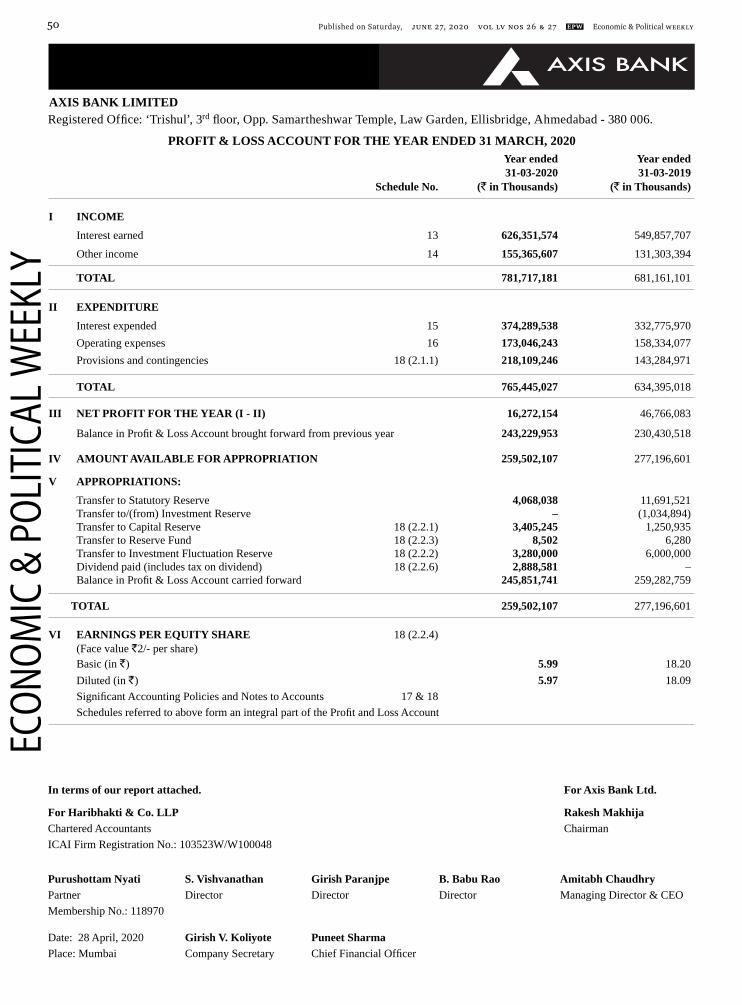
Registered Offi ce: ‘Trishul’, 3rd fl oor, Opp. Samartheshwar Temple, Law Garden, Ellisbridge, Ahmedabad - 380 006.
Published on Saturday, JUNE 27, 2020 vol lV nos 26 & 27 EPW Economic & Political Weekly50
Year ended Year ended 31-03-2020 31-03-2019 Schedule No. (` in Thousands) (` in Thousands)
I INCOME Interest earned 13 626,351,574 549,857,707 Other income 14 155,365,607 131,303,394
TOTAL 781,717,181 681,161,101
II EXPENDITURE Interest expended 15 374,289,538 332,775,970 Operating expenses 16 173,046,243 158,334,077 Provisions and contingencies 18 (2.1.1) 218,109,246 143,284,971
TOTAL 765,445,027 634,395,018
III NET PROFIT FOR THE YEAR (I - II) 16,272,154 46,766,083
Balance in Profi t & Loss Account brought forward from previous year 243,229,953 230,430,518 IV AMOUNT AVAILABLE FOR APPROPRIATION 259,502,107 277,196,601
V APPROPRIATIONS:
Transfer to Statutory Reserve 4,068,038 11,691,521 Transfer to/(from) Investment Reserve – (1,034,894) Transfer to Capital Reserve 18 (2.2.1) 3,405,245 1,250,935 Transfer to Reserve Fund 18 (2.2.3) 8,502 6,280 Transfer to Investment Fluctuation Reserve 18 (2.2.2) 3,280,000 6,000,000 Dividend paid (includes tax on dividend) 18 (2.2.6) 2,888,581 – Balance in Profi t & Loss Account carried forward 245,851,741 259,282,759 TOTAL 259,502,107 277,196,601
VI EARNINGS PER EQUITY SHARE 18 (2.2.4) (Face value `2/- per share) Basic (in `) 5.99 18.20 Diluted (in `) 5.97 18.09 Signifi cant Accounting Policies and Notes to Accounts 17 & 18 Schedules referred to above form an integral part of the Profi t and Loss Account
AXIS BANK LIMITED – PROFIT & LOSS ACCOUNT
PROFIT & LOSS ACCOUNT FOR THE YEAR ENDED 31 MARCH, 2020
In terms of our report attached. For Axis Bank Ltd.
For Haribhakti & Co. LLP Rakesh MakhijaChartered Accountants ChairmanICAI Firm Registration No.: 103523W/W100048
Purushottam Nyati S. Vishvanathan Girish Paranjpe B. Babu Rao Amitabh ChaudhryPartner Director Director Director Managing Director & CEOMembership No.: 118970
Date: 28 April, 2020 Girish V. Koliyote Puneet SharmaPlace: Mumbai Company Secretary Chief Financial Offi cer
ECO
NOM
IC &
PO
LITI
CAL
WEE
KLY

Registered Offi ce: ‘Trishul’, 3rd fl oor, Opp. Samartheshwar Temple, Law Garden, Ellisbridge, Ahmedabad - 380 006.
Economic & Political Weekly EPW Published on Saturday, JUNE 27, 2020 vol lV nos 26 & 27 51
AXIS BANK LIMITED – CASH FLOW STATEMENT
CASH FLOW STATEMENT FOR THE YEAR ENDED 31 MARCH, 2020 Year ended Year ended 31-03-2020 31-03-2019 (` in Thousands) (` in Thousands)
Cash fl ow from operating activities
Net profi t before taxes 49,042,266 69,740,881
Adjustments for:
Depreciation on fi xed assets 7,729,508 7,097,249
Depreciation on investments 1,359,912 3,000,160
Amortisation of premium on Held to Maturity investments 3,538,847 3,207,410
Provision for Non Performing Assets (including bad debts) 127,555,268 102,214,828
Provision on standard assets 14,513,249 8,097,890
Provision on unhedged foreign currency exposure (106,800) 187,900
Profi t/(loss) on sale of land, buildings and other assets (net) 44,813 229,014
Provision for country risk 121,721 –
Provision for restructured assets/strategic debt restructuring/sustainable structuring (154,980) (196,572)
Provision for other contingencies 42,050,763 7,005,966
Dividend from Subsidiaries (2,402,561) (1,311,000)
243,292,006 199,273,726
Adjustments for:
(Increase)/Decrease in investments 242,642,832 (40,070,291)
(Increase)/Decrease in advances (869,492,216) (649,869,997)
Increase /(Decrease) in deposits 916,335,964 948,486,186
(Increase)/Decrease in other assets (257,994,454) (106,579,694)
Increase/(Decrease) in other liabilities & provisions 49,702,444 52,991,110
Direct taxes paid (28,353,805) (28,561,806)
Net cash fl ow from operating activities 296,132,771 375,669,234
Cash fl ow from investing activities
Purchase of fi xed assets (10,719,744) (8,316,648)
(Increase)/Decrease in Held to Maturity investments (89,455,847) (178,957,069)
Increase in Investment in Subsidiaries (67,000) (1,934,115)
Proceeds from sale of fi xed assets 169,658 531,616
Dividend from Subsidiaries 2,402,561 1,311,000
Net cash used in investing activities (97,670,372) (187,365,216)
ECO
NOM
IC &
PO
LITI
CAL
WEE
KLY

Registered Offi ce: ‘Trishul’, 3rd fl oor, Opp. Samartheshwar Temple, Law Garden, Ellisbridge, Ahmedabad - 380 006.
Published on Saturday, JUNE 27, 2020 vol lV nos 26 & 27 EPW Economic & Political Weekly52
Cash fl ow from fi nancing activities
Proceeds/(Repayment) from issue of subordinated debt, perpetual debt & upper Tier II instruments (net) (20,000,000) (17,000,000)
Increase/(Decrease) in borrowings (excluding subordinated debt, perpetual debt & upper Tier II instruments) (net) (28,216,462) 64,596,346
Proceeds from issue of share capital 500,066 10,212
Proceeds from share premium (net of share issue expenses) 151,784,664 1,706,853
Payment of dividend (including dividend distribution tax) (2,888,581) –
Net cash generated from fi nancing activities 101,179,687 49,313,411
Effect of exchange fl uctuation translation reserve 994,364 (119,982)
Net increase in cash and cash equivalents 300,636,450 237,497,447
Cash and cash equivalents at the beginning of the year 672,046,353 434,548,906
Cash and cash equivalents at the end of the year 972,682,803 672,046,353
Notes to the Cash Flow Statement:
1. Cash and cash equivalents includes the following
Cash and Balances with Reserve Bank of India (Refer Schedule 6) 849,592,391 350,990,339
Balances with Banks and Money at Call and Short Notice (Refer Schedule 7) 123,090,412 321,056,014
Cash and cash equivalents at the end of the year 972,682,803 672,046,353
2. Amount of Corporate Social Responsibility related expenses spent during the year in cash `95.61 crores (previous year `137.02 crores)
AXIS BANK LIMITED – CASH FLOW STATEMENT
CASH FLOW STATEMENT FOR THE YEAR ENDED 31 MARCH, 2020 Year ended Year ended 31-03-2020 31-03-2019 (` in Thousands) (` in Thousands)
In terms of our report attached. For Axis Bank Ltd.
For Haribhakti & Co. LLP Rakesh MakhijaChartered Accountants ChairmanICAI Firm Registration No.: 103523W/W100048
Purushottam Nyati S. Vishvanathan Girish Paranjpe B. Babu Rao Amitabh ChaudhryPartner Director Director Director Managing Director & CEOMembership No.: 118970
Date: 28 April, 2020 Girish V. Koliyote Puneet SharmaPlace: Mumbai Company Secretary Chief Financial Offi cer
ECO
NOM
IC &
PO
LITI
CAL
WEE
KLY

Registered Offi ce: ‘Trishul’, 3rd fl oor, Opp. Samartheshwar Temple, Law Garden, Ellisbridge, Ahmedabad - 380 006.
Economic & Political Weekly EPW Published on Saturday, JUNE 27, 2020 vol lV nos 26 & 27 53
As at 31-03-2020 As at 31-03-2019 (` in Thousands) (` in Thousands)
SCHEDULE 1 – CAPITAL Authorised Capital 4,250,000,000 (Previous year - 4,250,000,000) Equity Shares of `2/- each 8,500,000 8,500,000
Issued, Subscribed and Paid-up capital2,821,677,934 (Previous year - 2,571,644,871) Equity Shares of `2/- each fully paid-up 5,643,356 5,143,290
SCHEDULE 2 – RESERVES AND SURPLUSI. Statutory Reserve Opening Balance 127,451,247 115,759,726 Additions during the year 4,068,038 11,691,521 131,519,285 127,451,247 II. Share Premium Account Opening Balance 259,597,373 257,890,520 Additions during the year 152,488,174 1,706,853 Less: Share issue expenses (703,510) – 411,382,037 259,597,373 III. Investment Reserve Account Opening Balance – 1,034,894 Additions during the year – – Deductions during the year – (1,034,894) – –IV. General Reserve Opening Balance 3,543,100 3,543,100 Additions during the year – – 3,543,100 3,543,100 V. Capital Reserve Opening Balance 20,923,889 19,672,954 Additions during the year [Refer Schedule 18 (2.2.1)] 3,405,245 1,250,935 24,329,134 20,923,889 VI. Foreign Currency Translation Reserve [Refer Schedule 17 (5.6)] Opening Balance 792,850 912,832 Additions during the year 994,363 – Deductions during the year – (119,982) 1,787,213 792,850 VII. Reserve Fund Opening Balance 81,254 74,974 Additions during the year [Refer Schedule 18 (2.2.3)] 8,502 6,280 89,756 81,254 VIII. Investment Fluctuation Reserve Opening Balance 6,000,000 – Additions during the year [Refer Schedule 18 (2.2.2)] 3,280,000 6,000,000 9,280,000 6,000,000 IX. Balance in Profit & Loss Account brought forward 245,851,741 259,282,759 Adjustments during the year* 16,052,806 (16,052,806) Balance in Profit & Loss Account 261,904,547 243,229,953 TOTAL 843,835,072 661,619,666
*During the previous year ended 31 March, 2019, the Bank had made a provision amounting to 1,605.28 crores towards Land held as non-banking asset through the reserves and surplus, as permitted by RBI. During the year ended 31 March, 2020, the said provision has been recognised as part of provisions & contingencies in the profit and loss account with consequential reversal in the reserves and surplus, as advised by RBI. Refer Schedule 18 (2.1.43)
AXIS BANK LIMITED – SCHEDULES
SCHEDULES FORMING PART OF THE BALANCE SHEET AS AT 31 MARCH, 2020
ECO
NOM
IC &
PO
LITI
CAL
WEE
KLY

Registered Offi ce: ‘Trishul’, 3rd fl oor, Opp. Samartheshwar Temple, Law Garden, Ellisbridge, Ahmedabad - 380 006.
Published on Saturday, JUNE 27, 2020 vol lV nos 26 & 27 EPW Economic & Political Weekly54
As at 31-03-2020 As at 31-03-2019 (` in Thousands) (` in Thousands)
SCHEDULE 3 – DEPOSITSA. I. Demand Deposits (i) From banks 38,888,253 47,219,608 (ii) From others 862,256,063 845,433,682 II. Savings Bank Deposits 1,735,916,234 1,541,288,064 III. Term Deposits (i) From banks 343,218,323 232,371,412 (ii) From others 3,420,770,500 2,818,400,643
TOTAL 6,401,049,373 5,484,713,409
B. I. Deposits of branches in India 6,357,696,472 5,466,197,810 II. Deposits of branches outside India 43,352,901 18,515,599
TOTAL 6,401,049,373 5,484,713,409
SCHEDULE 4 – BORROWINGSI. Borrowings in India (i) Reserve Bank of India 116,190,000 144,000,000 (ii) Other banks # 650,000 2,785,000 (iii) Other institutions & agencies ** 808,092,100 683,583,472 II. Borrowings outside India 554,609,230 697,389,320
TOTAL 1,479,541,330 1,527,757,792
Secured borrowings included in I & II above 119,035,398 144,000,000
# Borrowings from other banks include Subordinated Debt of 15.00 crores (previous year 35.00 crores) in the nature of Non-Convertible Debentures and Perpetual Debt of Nil (previous year `50.00 crores) [Also refer Note 18 (2.1.2)]
** Borrowings from other institutions & agencies include Subordinated Debt of `17,490.00 crores (previous year `19,470.00 crores) in the nature of Non-Convertible Debentures and Perpetual Debt of `7,000 crores (previous year `6,950.00 crores) [Also refer Note 18 (2.1.2)]
SCHEDULE 5 – OTHER LIABILITIES AND PROVISIONSI. Bills payable 36,897,894 37,854,366
II. Inter-offi ce adjustments (net) – –
III. Interest accrued 31,008,096 45,522,438
IV. Proposed dividend (includes tax on dividend) [Refer Schedule 17 (5.20) and Schedule 18 (2.2.6)] – –
V. Contingent provision against standard assets [Refer Schedule 18 (2.1.8)] 45,197,371 30,404,383
VI. Others (including provisions) 308,475,669 216,949,972
TOTAL 421,579,030 330,731,159
SCHEDULE 6 – CASH AND BALANCES WITH RESERVE BANK OF INDIA
I. Cash in hand (including foreign currency notes) 79,878,972 42,132,147 II. Balances with Reserve Bank of India (i) in Current Account 209,713,419 263,858,192 (ii) in Other Accounts 560,000,000 45,000,000
TOTAL 849,592,391 350,990,339
AXIS BANK LIMITED – SCHEDULES
SCHEDULES FORMING PART OF THE BALANCE SHEET AS AT 31 MARCH, 2020
ECO
NOM
IC &
PO
LITI
CAL
WEE
KLY

Registered Offi ce: ‘Trishul’, 3rd fl oor, Opp. Samartheshwar Temple, Law Garden, Ellisbridge, Ahmedabad - 380 006.
Economic & Political Weekly EPW Published on Saturday, JUNE 27, 2020 vol lV nos 26 & 27 55
As at 31-03-2020 As at 31-03-2019 (` in Thousands) (` in Thousands)
SCHEDULE 7 – BALANCES WITH BANKS AND MONEY AT CALL AND SHORT NOTICE
I. In India (i) Balance with Banks
(a) in Current Accounts 605,423 2,419,842
(b) in Other Deposit Accounts 25,668,577 31,712,577
(ii) (ii) Money at Call and Short Notice
(a) With banks – –
(b) With other institutions – 191,610,699
TOTAL 26,274,000 225,743,118
II. Outside India
(i) in Current Accounts 42,990,128 42,478,364
(ii) in Other Deposit Accounts 725,119 5,177,257
(iii) Money at Call & Short Notice 53,101,165 47,657,275
TOTAL 96,816,412 95,312,896
GRAND TOTAL (I+II) 123,090,412 321,056,014
SCHEDULE 8 – INVESTMENTS
I. Investments in India in -
(i) Government Securities ## 1,219,180,739 1,168,229,051
(ii) Other approved securities – –
(iii) Shares 11,552,354 9,594,584
(iv) Debentures and Bonds 205,529,143 392,845,209
(v) Investment in Subsidiaries/Joint Ventures 18,094,821 18,027,821
(vi) Others (Mutual Fund units, CD/CP, PTC etc.) 59,704,124 112,641,005
Total Investments in India 1,514,061,181 1,701,337,670
II. Investments outside India in -
(i) Government Securities (including local authorities) 40,634,795 34,164,807
(ii) Subsidiaries and/or joint ventures abroad 4,833,428 4,833,428
(iii) Others (Equity Shares and Bonds) 7,813,799 9,356,854
Total Investments outside India 53,282,022 48,355,089
GRAND TOTAL (I+II) 1,567,343,203 1,749,692,759
## Includes securities costing `34,501.78 crores (previous year `29,283.94 crores) pledged for availment of fund transfer facility, clearing facility and margin requirements
AXIS BANK LIMITED – SCHEDULES
SCHEDULES FORMING PART OF THE BALANCE SHEET AS AT 31 MARCH, 2020
ECO
NOM
IC &
PO
LITI
CAL
WEE
KLY

Registered Offi ce: ‘Trishul’, 3rd fl oor, Opp. Samartheshwar Temple, Law Garden, Ellisbridge, Ahmedabad - 380 006.
Published on Saturday, JUNE 27, 2020 vol lV nos 26 & 27 EPW Economic & Political Weekly56
As at 31-03-2020 As at 31-03-2019 (` in Thousands) (` in Thousands)
SCHEDULE 9 – ADVANCESA. (i) Bills purchased and discounted 145,282,883 155,366,966 (ii) Cash credits, overdrafts and loans repayable on demand 1,578,453,784 1,503,567,259 (iii) Term loans # 3,990,504,897 3,289,045,496
TOTAL 5,714,241,564 4,947,979,721
B. (i) Secured by tangible assets $ 4,127,706,073 3,535,163,307 (ii) Covered by Bank/Government Guarantees && 17,284,147 33,887,710 (iii) Unsecured 1,569,251,344 1,378,928,704
TOTAL 5,714,241,564 4,947,979,721
C. I. Advances in India (i) Priority Sector 1,438,593,307 1,188,930,411 (ii) Public Sector 134,270,813 65,894,406 (iii) Banks 21,809,078 43,110,224 (iv) Others 3,673,182,725 3,268,892,314
TOTAL 5,267,855,923 4,566,827,355
II. Advances Outside India (i) Due from banks 25,828,342 20,815,655 (ii) Due from others - (a) Bills purchased and discounted 28,288,691 23,843,213 (b) Syndicated loans 26,001,299 47,840,704 (c) Others 366,267,309 288,652,794
TOTAL 446,385,641 381,152,366
GRAND TOTAL (CI+CII) 5,714,241,564 4,947,979,721
# Net of borrowings under Inter Bank Participation Certifi cate (IBPC) `1,500.00 crores (previous year `2,750.00 crores), includes lending under IBPC `2,900.10 crores (previous year `3,529.50 crores)
$ Includes advances against book debts&& Includes advances against L/Cs issued by other banks
SCHEDULE 10 – FIXED ASSETSI. Premises Gross Block At cost at the beginning of the year 17,917,015 18,330,983 Additions during the year 460,004 169,308 Deductions during the year – (583,276)
TOTAL 18,377,019 17,917,015
Depreciation As at the beginning of the year 1,640,399 1,470,027 Charge for the year 276,438 292,302 Deductions during the year – (121,930)
Depreciation to date 1,916,837 1,640,399
Net Block 16,460,182 16,276,616
AXIS BANK LIMITED – SCHEDULES
SCHEDULES FORMING PART OF THE BALANCE SHEET AS AT 31 MARCH, 2020
ECO
NOM
IC &
PO
LITI
CAL
WEE
KLY

Registered Offi ce: ‘Trishul’, 3rd fl oor, Opp. Samartheshwar Temple, Law Garden, Ellisbridge, Ahmedabad - 380 006.
Economic & Political Weekly EPW Published on Saturday, JUNE 27, 2020 vol lV nos 26 & 27 57
As at 31-03-2020 As at 31-03-2019 (` in Thousands) (` in Thousands)
SCHEDULE 10 – FIXED ASSETS (Contd.)II. Other fi xed assets (including furniture & fi xtures) Gross Block At cost at the beginning of the year 60,352,942 52,204,387 Additions during the year* 8,243,588 8,999,163 Deductions during the year (972,208) (850,608) TOTAL 67,624,322 60,352,942
Depreciation As at the beginning of the year 38,990,122 32,809,459 Charge for the year 7,453,067 6,804,946 Deductions during the year (744,585) (624,283)
Depreciation to date 45,698,604 38,990,122
Net Block 21,925,718 21,362,820
III. CAPITAL WORK-IN-PROGRESS (including capital advances) 4,743,070 2,726,922
GRAND TOTAL (I+II+III) 43,128,970 40,366,358
* includes movement on account of exchange rate fl uctuation
SCHEDULE 11 - OTHER ASSETSI. Inter-offi ce adjustments (net) – – II. Interest Accrued 71,528,813 70,941,386 III. Tax paid in advance/tax deducted at source (net of provisions) 15,353,273 15,911,960 IV. Stationery and stamps 1,056 3,057 V. Non banking assets acquired in satisfaction of claims$ – 87,276 VI. Others #@ 767,368,479 512,936,446
TOTAL 854,251,621 599,880,125
# Includes deferred tax assets of `7,254.97 crores (previous year `7,640.73 crores) [Refer Schedule 18 (2.2.11)]@ Includes Priority Sector Shortfall Deposits of `46,462.92 crores (previous year `28,161.77 crores)$ Represents balance net of provision of `2,068.24 crores on Land held as non-banking asset. (previous year represents balance net of
provision of `2,208.61 crores on Land held as non-banking asset and provision of `2.09 crores on other non-banking assets)
SCHEDULE 12 – CONTINGENT LIABILITIESI. Claims against the Bank not acknowledged as debts 17,338,059 6,235,275 II. Liability for partly paid investments 1,387,700 18,000 III. Liability on account of outstanding forward exchange and derivative contracts: a) Forward Contracts 4,559,787,377 3,296,537,608 b) Interest Rate Swaps, Currency Swaps, Forward Rate Agreement & Interest Rate Futures 3,015,972,169 2,375,871,342 c) Foreign Currency Options 451,140,999 464,047,739
Total (a+b+c) 8,026,900,545 6,136,456,689
IV. Guarantees given on behalf of constituents In India 664,796,899 680,528,970 Outside India 74,340,067 75,358,146 V. Acceptances, endorsements and other obligations 251,649,846 324,394,652 VI. Other items for which the Bank is contingently liable 193,274,438 334,660,953
GRAND TOTAL (I+II+III+IV+V+VI) [Refer Schedule 18 (2.2.16)] 9,229,687,554 7,557,652,685
AXIS BANK LIMITED – SCHEDULES
SCHEDULES FORMING PART OF THE BALANCE SHEET AS AT 31 MARCH, 2020
ECO
NOM
IC &
PO
LITI
CAL
WEE
KLY

Registered Offi ce: ‘Trishul’, 3rd fl oor, Opp. Samartheshwar Temple, Law Garden, Ellisbridge, Ahmedabad - 380 006.
Published on Saturday, JUNE 27, 2020 vol lV nos 26 & 27 EPW Economic & Political Weekly58
Year ended Year ended 31-03-2020 31-03-2019 (` in Thousands) (` in Thousands)
SCHEDULE 13 - INTEREST EARNED
I. Interest/discount on advances/bills 483,029,726 413,220,214 II. Income on investments 112,460,254 113,490,713 III. Interest on balances with Reserve Bank of India and other inter-bank funds 10,952,634 6,933,458 IV. Others 19,908,960 16,213,322
TOTAL 626,351,574 549,857,707
SCHEDULE 14 - OTHER INCOME
I. Commission, exchange and brokerage 96,919,415 88,536,507 II. Profi t/(Loss) on sale of investments (net) [Refer Schedule 18(2.2.1)] 21,723,011 7,581,014 III. Profi t/(loss) on sale of land, buildings and other assets (net)* (44,813) (229,013)IV. Profi t on exchange/derivative transactions (net) 15,744,570 14,867,360 V. Income earned by way of dividends etc. from subsidiaries/companies and/or joint venture abroad/in India 2,402,561 1,311,000 VI. Miscellaneous Income 18,620,863 19,236,526 [including recoveries on account of advances/investments written off in earlier years `1,552.99 crores (previous year `1,867.45 crores) and net profi t on account of portfolio sell downs/securitisation `25.50 crores (previous year net profi t of `7.96 crores)]
TOTAL 155,365,607 131,303,394
* includes provision for diminution in value of fi xed assets
SCHEDULE 15 - INTEREST EXPENDED
I. Interest on deposits 293,690,561 237,075,125 II. Interest on Reserve Bank of India/Inter-bank borrowings 19,988,994 29,543,171 III. Others 60,609,983 66,157,674
TOTAL 374,289,538 332,775,970
SCHEDULE 16 - OPERATING EXPENSES
I. Payments to and provisions for employees 53,210,007 47,473,218 II. Rent, taxes and lighting 11,361,948 10,468,677 III. Printing and stationery 1,629,184 1,951,435 IV. Advertisement and publicity 1,125,564 1,018,137 V. Depreciation on bank's property 7,729,508 7,097,249 VI. Directors' fees, allowance and expenses 20,709 27,553 VII. Auditors' fees and expenses 19,207 14,616 VIII. Law charges 1,236,169 1,175,771 IX. Postage, telegrams, telephones etc. 2,739,490 2,962,177 X. Repairs and maintenance 11,429,098 10,549,779 XI. Insurance 7,510,955 6,003,052 XII. Other expenditure 75,034,404 69,592,413
TOTAL 173,046,243 158,334,077
AXIS BANK LIMITED
SCHEDULES FORMING PART OF THE PROFIT & LOSS ACCOUNT FOR THE YEAR ENDED 31 MARCH, 2020
ECO
NOM
IC &
PO
LITI
CAL
WEE
KLY

Registered Offi ce: ‘Trishul’, 3rd fl oor, Opp. Samartheshwar Temple, Law Garden, Ellisbridge, Ahmedabad - 380 006.
Economic & Political Weekly EPW Published on Saturday, JUNE 27, 2020 vol lV nos 26 & 27 59
AXIS BANK LIMITED
1 BackgroundAxis Bank Limited (‘the Bank’) was incorporated in 1993 and provides a complete suite of banking and fi nancial services including retail banking, wholesale banking and treasury operations. The Bank is primarily governed by the Banking Regulation Act, 1949. The Bank has overseas branches at Singapore, Hong Kong, DIFC - Dubai, Shanghai and Colombo and an Offshore Banking Unit at International Financial Service Centre (IFSC), Gujarat International Finance Tec-City (GIFT City), Gandhinagar, India.
2 Basis of preparationThe standalone fi nancial statements (‘fi nancial statements’) have been prepared and presented under the historical cost convention on the accrual basis of accounting in accordance with the generally accepted accounting principles in India, unless otherwise stated by the Reserve Bank of India (‘RBI’), to comply with the statutory requirements prescribed under the Third Schedule of the Banking Regulation Act, 1949, the circulars, notifi cations, guidelines and directives issued by RBI from time to time and the Accounting Standards notifi ed under Section 133 of the Companies Act, 2013 read together with paragraph 7 of the Companies (Accounts) Rules, 2014 and the Companies (Accounting Standards) Amendment Rules, 2016 to the extent applicable and practices generally prevalent in the banking industry in India. Accounting policies applied have been consistent with the previous year except otherwise stated.
3 Use of estimatesThe preparation of the fi nancial statements in conformity with the generally accepted accounting principles requires the Management to make estimates and assumptions that affect the reported amounts of assets and liabilities (including contingent liabilities) at the date of the fi nancial statements, revenues and expenses during the reporting period. Actual results could differ from those estimates. The Management believes that the estimates and assumptions used in the preparation of the fi nancial statements are prudent and reasonable. Any revisions to the accounting estimates are recognised prospectively in the current and future periods.
4 Change in accounting policies/estimates Provision on Non-fund based outstanding
During the year, the Bank has adopted a policy of maintaining provision on non-funded outstanding in NPAs, prudentially written off accounts, corporate standard advances rated ‘BB and Below’ and all SMA-2 advances as reported to CRILC. As a result, the provisions and contingencies for the year are higher by `410.52 crores with a consequent reduction to the profi t before tax.
5 Significant accounting policies5.1 Investments Classification In accordance with the RBI guidelines, investments are classified at the time of purchase as: Held for Trading (‘HFT’); Available for Sale (‘AFS’); and Held to Maturity (‘HTM’).
Investments that are held principally for sale within a short period are classifi ed as HFT securities. As per the RBI guidelines, HFT securities, which remain unsold for a period of 90 days are transferred to AFS securities.Investments that the Bank intends to hold till maturity are classifi ed under the HTM category. Investments in the equity of subsidiaries/joint ventures are categorised as HTM in accordance with the RBI guidelines. All other investments are classifi ed as AFS securities.However, for disclosure in the Balance Sheet, investments in India are classifi ed under six categories - Government Securities, Other approved securities, Shares, Debentures and Bonds, Investment in Subsidiaries/Joint Ventures and Others. Investments made outside India are classifi ed under three categories - Government Securities, Subsidiaries and/or Joint Ventures abroad and Others.All investments are accounted for on settlement date, except investments in equity shares which are accounted for on trade date.Transfer of security between categories Transfer of security between categories of investments is accounted as per the RBI guidelines.Acquisition costCosts including brokerage and commission pertaining to investments, paid at the time of acquisition, are charged to the Profi t and Loss Account.Broken period interest is charged to the Profi t and Loss Account.Cost of investments is computed based on the weighted average cost method.ValuationInvestments classifi ed under the HTM category: Investments are carried at acquisition cost unless it is more than the face value, in which case the premium is amortised over the period remaining to maturity on a constant yield to maturity basis. Such amortization of premium is adjusted against interest income under the head ‘Income from Investments’ under Schedule 13 in Profi t and Loss Account. In terms of RBI guidelines, discount on securities held under HTM category is not accrued and such securities are held at the acquisition cost till maturity.Investments in subsidiaries/joint ventures are categorised as HTM and assessed for impairment to determine permanent diminution, if any, in accordance with the RBI guidelines and suitable provisions are made.Investments classifi ed under the AFS and HFT categories: Investments under these categories are marked to market. The market/fair value of quoted investments included in the ‘AFS’ and ‘HFT’ categories is the market price of the scrip as available from the trades/quotes on the stock exchanges or prices declared by Primary Dealers Association of India (‘PDAI’) jointly with Fixed Income Money Market and Derivatives Association of India (‘FIMMDA’)/Financial Benchmark India Private Limited (‘FBIL’), periodically. Net depreciation, if any, within each category of each investment classifi cation is recognised in the Profi t and Loss Account. The net appreciation if any, under each category of each investment classifi cation is ignored. The depreciation on securities acquired by way of conversion of outstanding loans is provided in accordance with the RBI guidelines. The book value of individual securities is not changed consequent to the periodic valuation of investments.
17 Signifi cant accounting policies for the year ended 31 March, 2020
ECO
NOM
IC &
PO
LITI
CAL
WEE
KLY

Registered Offi ce: ‘Trishul’, 3rd fl oor, Opp. Samartheshwar Temple, Law Garden, Ellisbridge, Ahmedabad - 380 006.
Published on Saturday, JUNE 27, 2020 vol lV nos 26 & 27 EPW Economic & Political Weekly60
Non-performing investments are identified and provision is made thereon as per RBI guidelines. The provision on such non-performing investments is not set off against the appreciation in respect of other performing securities. Interest on non-performing investments is not recognised in the Profit and Loss Account until received.Treasury Bills, Exchange Funded Bills, Commercial Paper and Certificate of Deposits being discounted instruments, are valued at carrying cost which includes discount amortised over the period to maturity. Units of mutual funds are valued at the latest repurchase price/net asset value declared by the mutual fund.Market value of investments where current quotations are not available, is determined as per the norms prescribed by the RBI as under: The market/fair value of unquoted government securities which are in the nature of Statutory Liquidity Ratio (‘SLR’) securities
included in the AFS and HFT categories is computed as per the rates published by FIMMDA/FBIL. In case of special bonds issued by Government of India that do not qualify for SLR, unquoted bonds, debentures, preference shares
where interest/dividend is received regularly (i.e. not overdue beyond 90 days), the market price is derived based on the YTM for Government Securities as published by FIMMDA/PDAI/FBIL and suitably marked up for credit risk applicable to the credit rating of the instrument. The matrix for credit risk mark-up for each category and credit ratings along with residual maturity issued by FIMMDA/FBIL is adopted for this purpose.
In case of bonds & debentures where interest is not received regularly (i.e. overdue beyond 90 days), the valuation is in accordance with prudential norms for provisioning as prescribed by RBI.
Pass Through Certificates (‘PTC’) and Priority Sector PTCs are valued as per extant FIMMDA guidelines. Equity shares, for which current quotations are not available or where the shares are not quoted on the stock exchanges, are valued
at break-up value (without considering revaluation reserves, if any) which is ascertained from the company’s latest Balance Sheet. In case the latest Balance Sheet is not available, the shares are valued at `1 per company;
Units of Venture Capital Funds (‘VCF’) held under AFS category where current quotations are not available are valued based on the latest audited financials of the fund. In case the audited financials are not available for a period beyond 18 months, the investments are valued at 1 per VCF. Investment in unquoted VCF after 23 August, 2006 may be categorised under HTM category for the initial period of three years and are valued at cost as per RBI guidelines.
In case of investments in security receipts on or after 1 April, 2017 which are backed by more than 50 percent of the stressed assets sold by the Bank, provision for depreciation in value is made at the higher of - provisioning rate required in terms of net asset value declared by the Reconstruction Company (‘RC’)/Securitisation Company (‘SC’) or the provisioning rate as per the extant asset classification and provisioning norms as applicable to the underlying loans, assuming that the loan notionally continued in the books of the bank. All other investments in security receipts are valued as per the NAV obtained from the issuing RC/SCs.
Disposal of investmentsInvestments classified under the HTM category: Realised gains are recognised in the Profit and Loss Account and subsequently appropriated to Capital Reserve account (net of taxes and transfer to statutory reserves) in accordance with the RBI guidelines. Losses are recognised in the Profit and Loss Account. Investments classified under the AFS and HFT categories: Realised gains/losses are recognised in the Profit and Loss Account.Repurchase and reverse repurchase transactionsRepurchase and reverse repurchase transactions in government securities and corporate debt securities including those conducted under the Liquidity Adjustment Facility (‘LAF’) and Marginal Standby Facility (‘MSF’) with RBI are accounted as collateralised borrowing and lending respectively. Accordingly, securities given as collateral under an agreement to repurchase them continue to be held under the investment account and the Bank continues to accrue the coupon/discount on the security during the repo period. Further, the Bank continues to value the securities sold under repo as per the investment classification of the security. Borrowing cost on repo transactions is accounted as interest expense and revenue on reverse repo transactions is accounted as interest income. Short SalesIn accordance with the RBI guidelines, the Bank undertakes short sale transactions in Central Government dated securities. The short positions are reflected in ‘Securities Short Sold (‘SSS’) A/c’, specifically created for this purpose. Such short positions are categorised under HFT category and netted off from investments in the Balance Sheet. These positions are marked-to-market along with the other securities under HFT portfolio and the resultant mark-to-market gains/losses are accounted for as per the relevant RBI guidelines for valuation of investments discussed earlier.
5.2 AdvancesAdvances are classified into performing and non-performing advances (‘NPAs’) as per the RBI guidelines and are stated net of bills rediscounted, inter-bank participation certificates, specific provisions made towards NPAs, interest in suspense for NPAs, claims received from Export Credit Guarantee Corporation, provisions for funded interest on term loan classified as NPAs, provisions in lieu of diminution in the fair value of restructured assets and floating provisions. NPAs are classified into sub-standard, doubtful and loss assets based on the criteria stipulated by the RBI. Advances held at the overseas branches that are identified as impaired as per host country regulations for reasons other than record of recovery, but which are standard as per the RBI guidelines, are classified as NPAs to the extent of amount outstanding in the host country. Provisions for NPAs are made for sub-standard and doubtful assets at rates as prescribed by the RBI with the exception for agriculture advances and schematic retail advances. In respect of schematic retail advances, provisions are made in terms of a bucket-wise policy upon reaching specified stages of delinquency (90 days or more of delinquency) under each type of loan, which satisfies the RBI prudential norms on provisioning. Provisions in respect of agriculture advances classified into sub-standard and doubtful assets are made at rates which are higher than those prescribed by the RBI. Provisions for advances booked in overseas branches, which are standard as per the RBI guidelines but are classified as NPAs based on host country guidelines, are made as per the host country regulations. In case of NPAs referred to National Company Law Tribunal (‘NCLT’) under Insolvency and Bankruptcy Code (‘IBC’) where resolution plan or liquidation order has been approved by NCLT, provision is maintained at higher of the requirement under RBI guidelines or the likely haircut as per resolution plan or liquidation order.Restructured assets are classified and provided for in accordance with the guidelines issued by RBI from time to time. Loss assets and unsecured portion of doubtful assets are provided/written off as per the extant RBI guidelines. Amounts recovered against debts written off are recognised in the Profit and Loss account and included under “Other Income”.
AXIS BANK LIMITED
17 Signifi cant accounting policies for the year ended 31 March, 2020 (Continued)
ECO
NOM
IC &
PO
LITI
CAL
WEE
KLY

Registered Offi ce: ‘Trishul’, 3rd fl oor, Opp. Samartheshwar Temple, Law Garden, Ellisbridge, Ahmedabad - 380 006.
Economic & Political Weekly EPW Published on Saturday, JUNE 27, 2020 vol lV nos 26 & 27 61
AXIS BANK LIMITED
17 Signifi cant accounting policies for the year ended 31 March, 2020 (Continued)In case of EMI based standard retail advances, funds received from customers are appropriated in the order of chronology as towards interest, principal, penal interest and charges. In case of other standard advances, funds received from customers are appropriated in the order of chronology as towards charges, penal interest, interest and principal.The Bank makes additional provisions as per RBI’s guidelines on ‘Prudential Framework on Resolution of Stressed Assets’ dated 7 June, 2019 on accounts in default and with aggregate exposure above the threshold limits as laid down in the said framework where the resolution plan is not implemented within the specified timelines.In respect of borrowers classified as non-cooperative and willful defaulters, the Bank makes accelerated provisions as per extant RBI guidelines.Loans reported as fraud are classified as loss assets, and fully provided immediately without considering the value of security.For entities with Unhedged Foreign Currency Exposure (‘UFCE’), provision is made in accordance with the guidelines issued by RBI, which requires to ascertain the amount of UFCE, estimate the extent of likely loss and estimate the riskiness of unhedged position. This provision is classified under Schedule 5 – Other Liabilities in the Balance Sheet. Further, Incremental capital is maintained in respect of borrower counter parties in the highest risk category, in line with stipulations by RBI.The Bank maintains provisions for incremental exposure of the banking system to specified borrowers beyond Normally Permitted Lending Limit (‘NPLL’) in proportion to Bank’s funded exposure to the specified borrowers as per RBI guidelines. This provision is classified under Schedule 5 – Other Liabilities in the Balance Sheet. The Bank maintains a general provision on standard advances at the rates prescribed by RBI other than for corporate standard advances rated ‘BB and Below’ and all SMA-2 advances as reported to CRILC, where general provision is maintained at rates that are higher than those prescribed by RBI. In case of overseas branches, general provision on standard advances is maintained at the higher of the levels stipulated by the respective overseas regulator or RBI. The Bank also maintains general provision on positive Mark-to-Market (MTM) on derivatives at the rates prescribed by RBI.The Bank maintains provision on non-funded outstanding in NPAs, prudentially written off accounts, corporate standard advances rated ‘BB and Below’ and all SMA-2 advances as reported to CRILC. This provision is classified under Schedule 5 – Other Liabilities in the Balance Sheet. Under its home loan portfolio, the Bank offers housing loans with certain features involving waiver of Equated Monthly Installments (‘EMIs’) of a specific period subject to fulfilment of a set of conditions by the borrower. The Bank makes provision against the probable loss that could be incurred in future on account of waivers to eligible borrowers in respect of such loans based on actuarial valuation conducted by an independent actuary. This provision is classified under Schedule 5 – Other Liabilities in the Balance Sheet.
5.3 Country riskIn addition to the provisions required to be held according to the asset classification status, provisions are held for individual country exposure (other than for home country as per the RBI guidelines). Such provisions are held only in respect of those countries where the net funded exposure of the Bank exceeds 1% of its total assets. For this purpose the countries are categorized into seven risk categories namely insignificant, low, moderate, high, very high, restricted and off-credit as per RBI guidelines. Provision is made on exposures exceeding 180 days on a graded scale ranging from 0.25% to 100%. For exposures with contractual maturity of less than 180 days, 25% of the normal provision requirement is held. If the net funded exposure of the Bank in respect of each country does not exceed 1% of the total assets, no provision is maintained on such country exposure in accordance with RBI guidelines. This provision is classified under Schedule 5 – Other Liabilities in the Balance Sheet.
5.4 Securitisation and transfer of assetsThe Bank enters into purchase/sale of corporate and retail loans through direct assignment/Special Purpose Vehicle (‘SPV’). In most cases, post securitisation, the Bank continues to service the loans transferred to the assignee/SPV. The Bank also provides credit enhancement in the form of cash collaterals and/or by subordination of cash flows to Senior Pass through Certificate holders. In respect of credit enhancements provided or recourse obligations (projected delinquencies, future servicing etc.) accepted by the Bank, appropriate provision/disclosure is made at the time of sale in accordance with AS-29, Provisions, Contingent Liabilities and Contingent Assets as notified under Section 133 of the Companies Act, 2013 read together with paragraph 7 of the Companies (Accounts) Rules, 2014 and the Companies (Accounting Standards) Amendment Rules, 2016.In accordance with RBI guidelines of 7 May, 2012, on ‘Guidelines on Securitisation of Standard Assets’, gain on securitisation transaction is recognised over the period of the underlying securities issued by the SPV. Loss on securitisation is immediately debited to the Profit and Loss Account.The Bank transfers advances through inter-bank participation with and without risk. In accordance with the RBI guidelines, in the case of participation with risk, the aggregate amount of the participation issued by the Bank is reduced from advances and where the Bank is participating, the aggregate amount of the participation is classified under advances. In the case of participation without risk, the aggregate amount of participation issued by the Bank is classified under borrowings and where the Bank is participating, the aggregate amount of participation is shown as due from banks under advances.
5.5 Priority Sector Lending CertificatesThe Bank enters into transactions for the sale or purchase of Priority Sector Lending Certificates (‘PSLCs’). In the case of a sale transaction, the Bank sells the fulfilment of priority sector obligation and in the case of a purchase transaction the Bank buys the fulfilment of priority sector obligation through the RBI trading platform. There is no transfer of loan assets in PSLC transactions.
5.6 Foreign currency transactionsIn respect of domestic operations, transactions denominated in foreign currencies are accounted for at the rates prevailing on the date of the transaction. Monetary foreign currency assets and liabilities are translated at the Balance Sheet date at rates notified by Foreign Exchange Dealers Association of India (‘FEDAI’). All profits/losses resulting from year end revaluations are recognised in the Profit and Loss Account.Financial statements of foreign branches classified as non-integral foreign operations as per the RBI guidelines are translated as follows: Assets and liabilities (both monetary and non-monetary as well as contingent liabilities) are translated at closing exchange rates
notified by FEDAI at the Balance Sheet date. Income and expenses are translated at the rates prevailing on the date of the transactions. All resulting exchange differences are accumulated in a separate ‘Foreign Currency Translation Reserve’ till the disposal of the net
investments. Any realised gains or losses on such disposal are recognised in the Profit and Loss Account.
ECO
NOM
IC &
PO
LITI
CAL
WEE
KLY

Registered Offi ce: ‘Trishul’, 3rd fl oor, Opp. Samartheshwar Temple, Law Garden, Ellisbridge, Ahmedabad - 380 006.
Published on Saturday, JUNE 27, 2020 vol lV nos 26 & 27 EPW Economic & Political Weekly62
Outstanding forward exchange contracts including tom/spot contracts (excluding currency swaps undertaken to hedge foreign currency assets/liabilities and funding swaps which are not revalued) are revalued at year end on PV basis by discounting the forward value till spot date and converting the FCY amount using the respective spot rates as notified by FEDAI. The resulting gains or losses on revaluation are included in the Profit and Loss Account in accordance with RBI/FEDAI guidelines.Premium/discount on currency swaps undertaken to hedge foreign currency assets and liabilities and funding swaps is recognised as interest income/expense and is amortised on a pro-rata basis over the underlying swap period. Contingent liabilities on account of forward exchange and derivative contracts, guarantees, acceptances, endorsements and other obligations denominated in foreign currencies are disclosed at closing rates of exchange notified by FEDAI.
5.7 Derivative transactions Derivative transactions comprise of forward contracts, swaps and options which are disclosed as contingent liabilities. The forwards, swaps and options are categorised as trading or hedge transactions. Trading derivative contracts are revalued at the Balance Sheet date with the resulting unrealised gain or loss being recognised in the Profit and Loss Account and correspondingly in other assets (representing positive Mark-to-Market) and in other liabilities (representing negative Mark-to-Market (MTM)) on a gross basis. For hedge transactions, the Bank identifies the hedged item (asset or liability) at the inception of transaction itself. The effectiveness is ascertained at the time of inception of the hedge and periodically thereafter. Hedge swaps are accounted for on accrual basis except in case of swaps designated with an asset or liability that is carried at market value or lower of cost or market value in the financial statements. In such cases the swaps are marked-to-market with the resulting gain or loss recorded as an adjustment to the market value of designated asset or liability. Hedge transactions that are entered after 26 June, 2019 through rupee interest rate derivatives are accounted for as per the guidance note issued by ICAI on accounting for derivative contracts. Pursuant to the RBI guidelines any receivables under derivative contracts comprising of crystallised receivables as well as positive Mark-to-Market (MTM) in respect of future receivables which remain overdue for more than 90 days are reversed through the Profit and Loss account and are held in separate Suspense Account. Premium on options is recognized as income/expense on expiry or early termination of the transaction.Currency futures contracts are marked-to-market using daily settlement price on a trading day, which is the closing price of the respective futures contracts on that day. While the daily settlement price is computed based on the last half an hour weighted average price of such contracts, the final settlement price is taken as the RBI reference rate on the last trading day of the futures contracts or as may be specified by the relevant authority from time to time. All open positions are marked-to-market based on the settlement price and the resultant marked-to-market profit/loss is daily settled with the exchange.Valuation of Exchange Traded Currency Options (ETCO) is carried out on the basis of the daily settlement price of each individual option provided by the exchange and valuation of Interest Rate Futures (IRF) is carried out on the basis of the daily settlement price of each contract provided by the exchange.
5.8 Revenue recognitionInterest income is recognised on an accrual basis in accordance with AS–9, Revenue Recognition as notified under Section 133 of the Companies Act, 2013 read together with paragraph 7 of the Companies (Accounts) Rules, 2014, the Companies (Accounting Standards) Amendment Rules, 2016 and the RBI guidelines, except in the case of interest income on non-performing assets where it is recognised on receipt basis if overdue for more than 90 days. Income on non-coupon bearing discounted instruments or low-coupon bearing instruments is recognised over the tenor of the instrument on a constant yield basis.Guarantee commission is recognized on a pro-rata basis over the period of the guarantee. Locker rent and annual fees for credit cards are recognised on a straight-line basis over the period of contract. Arrangership/syndication fee is accounted for on completion of the agreed service and when right to receive is established. Other fees and commission income are recognised when due, where the Bank is reasonably certain of ultimate collection.Interest income on investments in discounted PTCs is recognized on a constant yield basis.Dividend is accounted on an accrual basis when the right to receive the dividend is established. Gain/loss on sell down of loans and advances through direct assignment is recognised at the time of sale.Fees paid for purchase of Priority Sector Lending Certificates (‘PSLC’) is amortised on straight-line basis over the tenor of the certificate as ‘Other Expenditure’ under Schedule 16 of Profit and Loss Account. Fees received on sale of PSLC is amortised on straight-line basis over the tenor of the certificate as ‘Miscellaneous Income’ under Schedule 14 of Profit and Loss Account.In accordance with RBI guidelines on sale of non-performing advances, if the sale is at a price below the net book value (i.e. book value less provisions held), the shortfall is charged to the Profit and Loss Account. If the sale is for a value higher than the net book value, the excess provision is credited to the Profit and Loss Account in the year the amounts are received.The Bank deals in bullion business on a consignment basis. The difference between the price recovered from customers and cost of bullion is accounted for at the time of sale to the customers. The Bank also deals in bullion on a borrowing and lending basis and the interest paid/received is accounted on an accrual basis.
5.9 Fixed assets and depreciation/impairmentFixed assets are carried at cost of acquisition less accumulated depreciation and impairment, if any. Cost includes initial handling and delivery charges, duties, taxes and incidental expenses related to the acquisition and installation of the asset. Subsequent expenditure incurred on assets put to use is capitalised only when it increases the future economic benefit / functioning capability from / of such assets.Capital work-in-progress includes cost of fixed assets that are not ready for their intended use and also includes advances paid to acquire fixed assets. Depreciation is provided over the estimated useful life of a fixed asset on the straight-line method from the date of addition. The management believes that depreciation rates currently used, fairly reflect its estimate of the useful lives and residual values of fixed assets based on historical experience of the Bank, though these rates in certain cases are different from lives prescribed under Schedule II of Companies Act, 2013. Whenever there is a revision of the estimated useful life of an asset, the unamortised depreciable amount is charged over the revised remaining useful life of the said asset.
AXIS BANK LIMITED
17 Signifi cant accounting policies for the year ended 31 March, 2020 (Continued)
ECO
NOM
IC &
PO
LITI
CAL
WEE
KLY

Registered Offi ce: ‘Trishul’, 3rd fl oor, Opp. Samartheshwar Temple, Law Garden, Ellisbridge, Ahmedabad - 380 006.
Economic & Political Weekly EPW Published on Saturday, JUNE 27, 2020 vol lV nos 26 & 27 63
AXIS BANK LIMITED
17 Signifi cant accounting policies for the year ended 31 March, 2020 (Continued)
Asset Estimated useful lifeLeased Land As per the term of the agreementOwned premises 60 yearsLocker cabinets/cash safe/strong room door 10 yearsEPABX, telephone instruments 8 yearsModem, scanner, routers, hubs, switches, racks/cabinets for IT equipment 5 yearsUPS, VSAT, fax machines 5 yearsCheque book/cheque encoder, currency counting machine, fake note detector 5 yearsApplication software 5 yearsElectronic Data Capture (EDC)/ Point of Sale (POS) machines 5 yearsVehicles 4 yearsComputer hardware including printers 3 yearsCCTV and video conferencing equipment 3 yearsAssets at staff residence 3 yearsMobile phone 2 yearsAll other fixed assets 10 years
Assets costing less than `5,000 individually are fully depreciated in the year of purchase.Depreciation on assets sold during the year is recognised on a pro-rata basis to the Profit and Loss Account till the date of sale. Gain or losses arising from the retirement or disposal of Fixed Assets are determined as the difference between the net disposal proceeds and the carrying amount of assets and recognised as income or expense in the Profit and Loss Account. Further, profit on sale of premises is appropriated to Capital Reserve account (net of taxes and transfer to statutory reserve) in accordance with RBI instructions.The carrying amounts of assets are reviewed at each Balance Sheet date to ascertain if there is any indication of impairment based on internal/external factors. An impairment loss is recognised wherever the carrying amount of an asset exceeds its recoverable amount. The recoverable amount is the greater of the asset’s net selling price and value in use. In assessing value in use, the estimated future cash flows are discounted to their present value at the weighted average cost of capital. After impairment, depreciation is provided on the revised carrying amount of the asset over its remaining useful life.
5.10 Non-banking assets Non-banking assets (‘NBAs’) acquired in satisfaction of claims include land. In the case of land, the Bank creates provision and follows the accounting treatment as per specific RBI directions.
5.11 Lease transactionsLeases where the lessor effectively retains substantially all the risks and benefits of ownership over the lease term are classified as operating lease. Lease payments for assets taken on operating lease are recognised as an expense in the Profit and Loss Account on a straight-line basis over the lease term. Lease income from assets given on operating lease is recognized as income in profit and loss account on a straight line basis over the lease term.
5.12 Retirement and other employee benefits Provident Fund
Retirement benefit in the form of provident fund is a defined benefit plan wherein the contributions are charged to the Profit and Loss Account of the year when the contributions to the fund are due and when services are rendered by the employees. Further, an actuarial valuation is conducted by an independent actuary using the Projected Unit Credit Method as at 31 March each year to determine the deficiency, if any, in the interest payable on the contributions as compared to the interest liability as per the statutory rate. Actuarial gains/losses are immediately taken to the Profit and Loss Account and are not deferred.GratuityThe Bank contributes towards gratuity fund (defined benefit retirement plan) administered by various insurers for eligible employees. Under this scheme, the settlement obligations remain with the Bank, although various insurers administer the scheme and determine the contribution premium required to be paid by the Bank. The plan provides a lump sum payment to vested employees at retirement or termination of employment based on the respective employee’s salary and the years of employment with the Bank. Liability with regard to gratuity fund is accrued based on actuarial valuation conducted by an independent actuary using the Projected Unit Credit Method as at 31 March each year. In respect of employees at overseas branches (other than expatriates) liability with regard to gratuity is provided on the basis of a prescribed method as per local laws, wherever applicable. Actuarial gains/losses are immediately taken to the Profit and Loss Account and are not deferred.Compensated AbsencesCompensated absences are short term in nature for which provision is held on accrual basis. SuperannuationEmployees of the Bank are entitled to receive retirement benefits under the Bank’s Superannuation scheme either under a cash-out option through salary or under a defined contribution plan. Through the defined contribution plan, the Bank contributes annually a specified sum of 10% of the employee’s eligible annual basic salary to LIC, which undertakes to pay the lump sum and annuity benefit payments pursuant to the scheme. Superannuation contributions are recognised in the Profit and Loss Account in the period in which they accrue.New Pension Scheme (‘NPS’)In respect of employees who opt for contribution to the ‘NPS’, the Bank contributes certain percentage of the total basic salary of employees to the aforesaid scheme, a defined contribution plan, which is managed and administered by pension fund management companies. NPS contributions are recognised in the Profit and Loss Account in the period in which they accrue.
5.13 Reward pointsThe Bank runs a loyalty program which seeks to recognize and reward customers based on their relationship with the Bank. Under the program, eligible customers are granted loyalty points redeemable in future, subject to certain conditions. In addition, the Bank continues to grant reward points in respect of certain credit cards (not covered under the loyalty program). The Bank estimates the probable
ECO
NOM
IC &
PO
LITI
CAL
WEE
KLY

Registered Offi ce: ‘Trishul’, 3rd fl oor, Opp. Samartheshwar Temple, Law Garden, Ellisbridge, Ahmedabad - 380 006.
Published on Saturday, JUNE 27, 2020 vol lV nos 26 & 27 EPW Economic & Political Weekly64
redemption of such loyalty/reward points using an actuarial method at the Balance Sheet date by employing an independent actuary, which includes assumptions such as mortality, redemption and utilization. Provision for the said reward points is then made based on the actuarial valuation report as furnished by the said independent actuary.
5.14 TaxationIncome tax expense is the aggregate amount of current tax and deferred tax charge. Current year taxes are determined in accordance with the relevant provisions of Income tax Act, 1961 and considering the material principle set out in Income Computation and Disclosure Standards to the extent applicable. Deferred income taxes reflect the impact of current year timing differences between taxable income and accounting income for the year and reversal of timing differences of earlier years.Deferred tax is measured based on the tax rates and the tax laws enacted or substantively enacted at the Balance Sheet date. Deferred tax assets and deferred tax liabilities are offset, if a legally enforceable right exists to set off assets against liabilities representing current tax and the deferred tax assets and deferred tax liabilities relate to the taxes on income levied by same governing taxation laws. Deferred tax assets are recognised only to the extent that there is reasonable certainty that sufficient future taxable income will be available against which such deferred tax assets can be realised. The impact of changes in the deferred tax assets and liabilities is recognised in the Profit and Loss Account.Deferred tax assets are recognised and reassessed at each reporting date, based upon the Management’s judgement as to whether realisation is considered as reasonably certain. Deferred tax assets are recognised on carry forward of unabsorbed depreciation and tax losses only if there is virtual certainty supported by convincing evidence that such deferred tax asset can be realised against future profits.
5.15 Share issue expensesShare issue expenses are adjusted from Share Premium Account in terms of Section 52 of the Companies Act, 2013.
5.16 Corporate Social ResponsibilityExpenditure towards corporate social responsibility, in accordance with Companies Act, 2013, is recognised as operating expenditure or capital expenditure as applicable.
5.17 Earnings per shareThe Bank reports basic and diluted earnings per share in accordance with AS-20, Earnings per Share, as notified under Section 133 of the Companies Act, 2013 read together with paragraph 7 of the Companies (Accounts) Rules, 2014 and the Companies (Accounting Standards) Amendment Rules, 2016. Basic earnings per share is computed by dividing the net profit after tax by the weighted average number of equity shares outstanding for the year. Diluted earnings per share reflect the potential dilution that could occur if securities or other contracts to issue equity shares were exercised or converted during the year. Diluted earnings per share is computed using the weighted average number of equity shares and dilutive potential equity shares outstanding at the year end except where the results are anti-dilutive.
5.18 Employee stock option schemeThe 2001 Employee Stock Option Scheme (‘the Scheme’) provides for grant of stock options on equity shares of the Bank to employees and Directors of the Bank and its subsidiaries. The Scheme is in accordance with the Securities and Exchange Board of India (SEBI) (Employees Stock Option Scheme and Employee Stock Purchase Scheme) Guidelines, 1999 (‘the Guidelines’). These Guidelines have been repealed in the month of October, 2014 and were substituted by Securities and Exchange Board of India (Share Based Employee Benefits) Regulations, 2014. The Scheme is in compliance with the said regulations. The Bank follows the intrinsic value method to account for its stock based employee compensation plans as per the Guidelines. Options are granted at an exercise price, which is equal to/less than the fair market price of the underlying equity shares. The excess of such fair market price over the exercise price of the options as at the grant date, if any, is recognised as a deferred compensation cost and amortised on a straight-line basis over the vesting period of such options. The fair market price is the latest available closing price, prior to the date of grant, on the stock exchange on which the shares of the Bank are listed. If the shares are listed on more than one stock exchange, then the stock exchange where there is highest trading volume on the said date is considered.
5.19 Provisions, contingent liabilities and contingent assetsIn accordance with AS-29 “Provisions, Contingent Liabilities and Contingent Assets”, provision is recognised when the Bank has a present obligation as a result of past event where it is probable that an outflow of resources will be required to settle the obligation, in respect of which a reliable estimate can be made. Provisions are not discounted to its present value and are determined based on best estimate required to settle the obligation at the Balance Sheet date. These are reviewed at each Balance Sheet date and adjusted to reflect the current best estimates.A disclosure of contingent liability is made when there is: a possible obligation arising from a past event, the existence of which will be confirmed by occurrence or non-occurrence of one or
more uncertain future events not within the control of the Bank; or a present obligation arising from a past event which is not recognised as it is not probable that an outflow of resources will be
required to settle the obligation or a reliable estimate of the amount of the obligation cannot be made.When there is a possible obligation or a present obligation in respect of which the likelihood of outflow of resources is remote, no provision or disclosure is made.Contingent assets are not recognised in the financial statements. However, contingent assets are assessed continually and if it is virtually certain that an inflow of economic benefits will arise, the asset and related income are recognised in the period in which the change occurs.
5.20 Accounting for dividendAs per AS-4 ‘Contingencies and Events occurring after the Balance sheet date’ as notified by the Ministry of Corporate Affairs through amendments to Companies (Accounting Standards) Amendment Rules, 2016, dated 30 March, 2016, the Bank does not account for proposed dividend (including tax) as a liability through appropriation from the profit and loss account. The same is recognised in the year of actual payout post approval of shareholders. However, the Bank reckons proposed dividend in determining capital funds in computing the capital adequacy ratio.
5.21 Cash and cash equivalentsCash and cash equivalents include cash in hand, balances with RBI, balances with other banks and money at call and short notice.
AXIS BANK LIMITED
17 Signifi cant accounting policies for the year ended 31 March, 2020 (Continued)
ECO
NOM
IC &
PO
LITI
CAL
WEE
KLY

Registered Offi ce: ‘Trishul’, 3rd fl oor, Opp. Samartheshwar Temple, Law Garden, Ellisbridge, Ahmedabad - 380 006.
Economic & Political Weekly EPW Published on Saturday, JUNE 27, 2020 vol lV nos 26 & 27 65
1.1 During the year ended 31 March, 2020, the Bank allotted 45,357,385 equity shares at a price of `565 per share pursuant to exercise of convertible share warrants by the warrant holders. As a consequence, the paid-up share capital of the Bank has increased by `9.07 crores and the reserves of the Bank have increased by `2,551.03 crores after charging off issue related expenses.
Further, during the year ended 31 March, 2020, the Bank raised additional equity capital through a Qualifi ed Institutional Placement of 19,87,28,139 shares at a price of `629 per share. As a consequence, the paid-up share capital of the Bank has increased by `39.75 crores and the reserves of the Bank have increased by `12,392.50 crores after charging off issue related expenses. The funds mobilised from equity raising were utilised for enhancing the capital adequacy ratio and for general corporate purpose.
1.2 COVID-19 virus, a global pandemic has affected the world economy including India leading to signifi cant decline and volatility in fi nancial markets and decline in economic activities. On 24 March, 2020, the Indian Government announced a strict 21-day lock-down which was further extended by 19 days across the country to contain the spread of the virus. The extent to which the COVID-19 pandemic will impact the Bank’s provision on assets will depend on the future developments, which are highly uncertain, including among the other things any new information concerning the severity of the COVID-19 pandemic and any action to contain its spread or mitigate its impact whether government mandated or elected by the Bank.
The RBI on 27 March, 2020 and 17 April, 2020, announced ‘COVID-19 Regulatory Package’ on asset classifi cation and provisioning. In terms of the RBI guidelines, the lending institutions have been permitted to grant a moratorium of three months on payment of all instalments/interest, as applicable, falling due between 1 March, 2020 and 31 May, 2020 (‘moratorium period’). As such, in respect of all accounts classifi ed as standard as on 29 February, 2020, even if overdue, the moratorium period, wherever granted, shall be excluded by the lending institutions from the number of days past-due for the purpose of asset classifi cation under RBI’s Income Recognition and Asset Classifi cation norms. The Bank holds provisions as at 31 March, 2020 against the potential impact of COVID-19 based on the information available at this point in time. The provisions held by the Bank are in excess of the RBI prescribed norms.
2.1 Statutory disclosures as per RBI2.1.1 ‘Provisions and contingencies’ recognised in the Profi t and Loss Account comprise of: (` in crores)
For the year ended 31 March, 2020 31 March, 2019 Provision for income tax – Current tax 2,891.25 3,009.84 – Deferred tax1 (Refer 2.2.11) 385.76 (712.36) 3,277.01 2,297.48 Provision for non-performing assets (including bad debts written off and write backs) 12,755.53 10,221.48 Provision for restructured assets/strategic debt restructuring/sustainable structuring (15.50) (19.66) Provision towards standard assets2 1,451.32 809.79 Provision for depreciation in value of investments 135.99 300.02 Provision for unhedged foreign currency exposure (10.68) 18.79 Provision for country risk 12.17 – Provision for other contingencies3 4,205.08 700.60 Total 21,810.92 14,328.50
1. The Bank has elected to exercise the option permitted under Section 115BAA of the Income Tax Act, 1961 as introduced by the Taxation Laws (Amendment) Act, 2019. The Bank has recognised provision for income tax for the year ended 31 March, 2020 in line with the above option. This has necessitated a restatement of the opening balance of deferred tax assets as at 1 April, 2019, basis the rate prescribed in the aforesaid section. The restatement has resulted in a write down of `2,137.59 crores which has been fully charged to the Profi t and Loss account during the year.
2. Including provision on loans under moratorium as per RBI guidelines on COVID-19 regulatory package of `1,117.72 crores. 3. Includes provision for non-banking assets, legal cases, other contingencies and provision of `1,882.28 crores for COVID-19 over
and above regulatory requirement.2.1.2 The capital adequacy ratio of the Bank, calculated as per the RBI guidelines (under Basel III) is set out below: (` in crores) 31 March, 2020 31 March, 2019 Common Equity Tier I 81,449.04 62,238.37 Tier I 88,449.04 69,238.37 Tier II 18,556.08 18,221.21 Total capital 107,005.12 87,459.58
Total risk weighted assets and contingents 610 527.33 552,048.06 Capital ratios Common Equity Tier I 13.34% 11.27% Tier I 14.49% 12.54% Tier II 3.04% 3.30% CRAR 17.53% 15.84%
AXIS BANK LIMITED
18 Notes forming part of the fi nancial statements for the year ended 31 March, 2020 (Currency: In Indian Rupees)
ECO
NOM
IC &
PO
LITI
CAL
WEE
KLY

Registered Offi ce: ‘Trishul’, 3rd fl oor, Opp. Samartheshwar Temple, Law Garden, Ellisbridge, Ahmedabad - 380 006.AXIS BANK LIMITED
18 Notes forming part of the fi nancial statements for the year ended 31 March, 2020 (Currency: In Indian Rupees)
Published on Saturday, JUNE 27, 2020 vol lV nos 26 & 27 EPW Economic & Political Weekly66
Amount of equity capital raised 48.82* – Amount of additional Tier I capital raised of which: Perpetual Non-Cumulative Preference Shares (PNCPS) – – Perpetual Debt Instruments (PDI) (details given below) – – Amount of Tier II capital raised of which: Debt capital instrument (details given below) – – Preferential capital instrument – –
*excluding securities premium of `15,013.88 crores
During the year ended 31 March, 2020 and 31 March, 2019, the Bank has not raised debt instruments eligible for Tier-I/Tier-II capital.
During the year ended 31 March, 2020, the Bank redeemed debt instruments eligible for Tier-I/Tier-II capital, the details of which are set out below:
Instrument Capital Date of maturity Period Coupon Amount
Subordinated debt Tier II 16 June, 2019 120 months 9.15% p.a. `2,000 crores
During the year ended 31 March, 2019, the Bank redeemed debt instruments eligible for Tier-I/Tier-II capital, the details of which are set out below:
Instrument Capital Date of maturity Period Coupon Amount
Subordinated debt
Subordinated debt
Tier II
Tier II
7 November, 2018
28 March, 2019
120 months
120 months
11.75% p.a.
9.95% p.a.
`1,500 crores
`200 crores
2.1.3 The key business ratios and other information is set out below:
As at 31 March, 2020%
31 March, 2019%
Interest income as a percentage to working funds# 7.56 7.38Non-interest income as a percentage to working funds# 1.87 1.76Operating profi t$$ as a percentage to working funds# 2.83 2.55Return on assets (based on working funds#) 0.20 0.63Business (deposits less inter-bank deposits plus advances) per employee** `17.27 crores `16.53 croresProfi t per employee** `2.40 lacs `7.61 lacsNet non-performing assets as a percentage of net customer assets * 1.56 2.06
# Working funds represent average of total assets as reported to RBI in Form X under Section 27 of the Banking Regulation Act, 1949 during the year
* Net Customer assets include advances and credit substitutes** Productivity ratios are based on average employee numbers for the year$$ Operating profi t represents total income as reduced by interest expended and operating expenses
2.1.4 The provisioning coverage ratio of the Bank computed in terms of the RBI guidelines as on 31 March, 2020 was 82.69% (previous year 76.78%).
2.1.5 Asset Quality i) Net non-performing advances to net advances is set out below:
31 March, 2020 31 March, 2019 % %
Net non-performing advances as a percentage of net advances 1.62 2.20
(` in crores)
31 March, 2020 31 March, 2019
ECO
NOM
IC &
PO
LITI
CAL
WEE
KLY

Registered Offi ce: ‘Trishul’, 3rd fl oor, Opp. Samartheshwar Temple, Law Garden, Ellisbridge, Ahmedabad - 380 006.AXIS BANK LIMITED
18 Notes forming part of the fi nancial statements for the year ended 31 March, 2020 (Currency: In Indian Rupees)
Economic & Political Weekly EPW Published on Saturday, JUNE 27, 2020 vol lV nos 26 & 27 67
ii) Movement in gross non-performing assets is set out below: (` in crores) 31 March, 2020 Advances Investments Total
Gross NPAs as at the beginning of the year 27,146.45 2,642.99 29,789.44 Intra Category Transfer – – – Additions (fresh NPAs) during the year 17,350.64 2,564.37 19,915.01 Sub-total (A) 44,497.09 5,207.36 49,704.45
Less:- (i) Upgradations 6,411.62 174.52 6,586.14 (ii) Recoveries (excluding recoveries made from upgraded accounts)# 2,462.83 252.39 2,715.22 (iii) Technical/Prudential Write-offs 7,503.38 206.49 7,709.87 (iv) Write-offs other than those under (iii) above 1,515.16 944.24 2,459.40 Sub-total (B) 17,892.99 1,577.64 19,470.63 Gross NPAs as at the end of the year (A-B) 26,604.10 3,629.72 30,233.82
# including sale of NPAs (` in crores)
31 March, 2019 Advances Investments Total
Gross NPAs as at the beginning of the year 30,876.32 3,372.32 34,248.64
Intra Category Transfer (2.60) 2.60 –
Additions (fresh NPAs) during the year 13,510.75 360.34 13,871.09
Sub-total (A) 44,384.47 3,735.26 48,119.73
Less:-
(i) Upgradations 4,982.66 90.94 5,073.60
(ii) Recoveries (excluding recoveries made from upgraded accounts)# 3,977.11 50.13 4,027.24
(iii) Technical/Prudential Write-offs 6,655.40 843.46 7,498.86
(iv) Write-offs other than those under (iii) above# 1,622.85 107.74 1,730.59
Sub-total (B) 17,238.02 1,092.27 18,330.29
Gross NPAs as at the end of the year (A-B) 27,146.45 2,642.99 29,789.44
# including sale of NPAs
iii) Movement in net non-performing assets is set out below: (` in crores)
31 March, 2020 Advances Investments Total
Opening balance at the beginning of the year 10,874.76 400.84 11,275.60 Additions during the year 7,418.38 246.62 7,665.00 Effect of exchange rate fl uctuation (236.26) 8.84 (227.42) Reductions during the year (8,785.05) (660.04) (9,445.09) Interest Capitalisation – Restructured NPA Accounts (19.84) 112.16 92.32
Closing balance at the end of the year# 9,251.99 108.42 9,360.41
# net of balance outstanding in interest capitalisation-restructured NPA accounts amounting to 70.73 crores
ECO
NOM
IC &
PO
LITI
CAL
WEE
KLY

Registered Offi ce: ‘Trishul’, 3rd fl oor, Opp. Samartheshwar Temple, Law Garden, Ellisbridge, Ahmedabad - 380 006.AXIS BANK LIMITED
18 Notes forming part of the fi nancial statements for the year ended 31 March, 2020 (Currency: In Indian Rupees)
Published on Saturday, JUNE 27, 2020 vol lV nos 26 & 27 EPW Economic & Political Weekly68
(` in crores)
31 March, 2019 Advances Investments Total
Opening balance at the beginning of the year 16,004.42 587.29 16,591.71 Additions during the year 3,958.27 (63.98) 3,894.29 Effect of exchange rate fl uctuation (76.29) (8.74) (85.03) Reductions during the year (9,120.94) (142.36) (9,263.30) Interest Capitalisation – Restructured NPA Accounts 109.30 28.63 137.93
Closing balance at the end of the year# 10,874.76 400.84 11,275.60
# net of balance outstanding in interest capitalisation-restructured NPA accounts amounting to `163.05 crores iv) Movement in provisions for non-performing assets is set out below: (` in crores)
31 March, 2020 Advances Investments Total
Opening balance at the beginning of the year 16,253.17 2,097.62 18,350.79 Intra Category Transfer – – – Provisions made during the year 9,926.33 2,317.75 12,244.08 Effect of exchange rate fl uctuation 236.26 (8.84) 227.42 Transfer from restructuring provision 5.93 – 5.93 Write-offs/(write back) of excess provision* (9,107.94) (917.60) (10,025.54)
Closing balance at the end of the year 17,313.75 3,488.93 20,802.68
* includes provision utilised for sale of NPAs amounting to `408.93 crores
(` in crores) 31 March, 2019 Advances Investments Total Opening balance at the beginning of the year 14,744.08 2,611.87 17,355.95 Intra Category Transfer (2.60) 2.60 – Provisions made during the year 9,552.47 424.32 9,976.79 Effect of exchange rate fl uctuation 76.29 8.74 85.03 Transfer from restructuring provision – – – Write-offs/(write back) of excess provision* (8,117.07) (949.91) (9,066.98)
Closing balance at the end of the year 16,253.17 2,097.62 18,350.79
* includes provision utilised for sale of NPAs amounting to 469.58 crores
v) Movement in technical/prudential written off accounts is set out below: (` in crores)
31 March, 2020 31 March, 2019 Opening balance at the beginning of the year 18,771.85 13,221.26 Add: Technical/Prudential write-offs during the year 7,709.87 7,498.86 Add: Effect of exchange rate fl uctuation 416.42 192.23
Sub-total (A) 26,898.14 20,912.35 Less: Recovery made from previously technical/prudential written-off accounts during the year 1,384.03 1,724.46 Less: Sacrifi ce made from previously technical/prudential written-off accounts during the year 1,670.04 416.04
Sub-total (B) 3,054.07 2,140.50
Closing balance at the end of the year (A-B) 23,844.07 18,771.85
ECO
NOM
IC &
PO
LITI
CAL
WEE
KLY

Registered Offi ce: ‘Trishul’, 3rd fl oor, Opp. Samartheshwar Temple, Law Garden, Ellisbridge, Ahmedabad - 380 006.AXIS BANK LIMITED
18 Notes forming part of the fi nancial statements for the year ended 31 March, 2020 (Currency: In Indian Rupees)
Economic & Political Weekly EPW Published on Saturday, JUNE 27, 2020 vol lV nos 26 & 27 69
vi) Total exposure (funded and non-funded) to top four non-performing assets is given below:(` in crores)
31 March, 2020 31 March, 2019
Total exposure (funded and non-funded) to top four NPA accounts 4,060.55 4,513.63
vii) Sector-wise advances: (` in crores)
Sr. No. Sector 31 March, 2020 31 March, 2019Outstanding
Total Advances
GrossNPAs
%of GrossNPAs to
TotalAdvances
in that sector
OutstandingTotal
Advances
Gross NPAs
%of GrossNPAs to
TotalAdvances
in that sector
A Priority Sector1 Agriculture and allied activities 32,454.55 1,575.93 4.86% 27,829.60 1,533.92 5.51%2 Advances to industries
sector eligible as priority sector lending 27,953.55 1,237.85 4.43% 26,871.04 901.97 3.36%– Chemical & Chemical products 2,306.23 62.74 2.72% 2,539.72 54.26 2.14%– Basic Metal & Metal Products 2,346.61 56.34 2.40% 2,585.52 28.08 1.09%– Infrastructure 561.94 41.55 7.39% 618.69 33.49 5.41%
3 Services 21,240.75 874.42 4.12% 21,122.23 707.41 3.35%– Banking and Finance other than
NBFCs and MFs 1,617.28 13.46 0.83% 2,082.82 14.64 0.70%– Non-banking fi nancial
companies (NBFCs) 371.68 - - 1,091.99 - -– Commercial Real Estate 270.22 15.54 5.75% 377.24 18.82 4.99%– Trade 11,074.55 718.76 6.49% 12,464.07 564.13 4.53%
4 Personal loans 64,190.85 525.20 0.82% 44,740.94 376.42 0.84%– Housing* 45,987.55 272.12 0.59% 36,873.80 271.41 0.74%– Vehicle Loans 11,654.72 211.28 1.81% 4,496.31 60.98 1.36%Sub-total (A) 145,839.70 4,213.40 2.89% 120,563.81 3,519.72 2.92%
B Non-Priority Sector1 Agriculture and allied activities 166.08 18.19 10.95% - - -2 Industry 163,800.40 16,248.24 9.92% 145,127.78 18,512.21 12.76%
– Chemical & Chemical products 19,451.17 1,264.78 6.50% 18,345.25 1,304.13 7.11%– Basic Metal & Metal Products 21,677.64 969.21 4.47% 20,510.98 1,095.61 5.34%– Infrastructure 53,712.35 7,514.69 13.99% 44,367.96 10,863.83 24.49%
3 Services 95,904.00 4,923.83 5.13% 91,160.11 3,912.57 4.29%– Banking and Finance other than
NBFCs and MFs 27,135.89 316.51 1.17% 27,735.77 190.55 0.69%– Non-banking fi nancial
companies (NBFCs) 16,502.49 182.31 1.10% 14,374.90 5.49 0.04%– Commercial Real Estate 17,279.94 1,698.52 9.83% 15,925.72 1,689.73 10.61%– Trade 13,641.42 795.41 5.83% 10,852.94 378.75 3.49%
4 Personal loans 183,087.52 1,200.44 0.66% 154,244.74 1,201.95 0.78%– Housing* 87,433.64 701.70 0.80% 78,327.84 753.18 0.96%– Vehicle Loans 20,234.86 186.58 0.92% 19,371.98 164.77 0.85%Sub-total (B) 442,958.00 22,390.70 5.05% 390,532.63 23,626.73 6.05%Total (A+B) 588,797.70 26,604.10 4.52% 511,096.44 27,146.45 5.31%
* includes loan against propertyClassifi cation of advances into sector is based on Sector wise Industry Bank Credit return submitted to RBI.Figures in italics represent sub-sectors where the outstanding advance exceeds 10% of total outstanding advance to that sector.
ECO
NOM
IC &
PO
LITI
CAL
WEE
KLY

Registered Offi ce: ‘Trishul’, 3rd fl oor, Opp. Samartheshwar Temple, Law Garden, Ellisbridge, Ahmedabad - 380 006.AXIS BANK LIMITED
18 Notes forming part of the fi nancial statements for the year ended 31 March, 2020 (Currency: In Indian Rupees)
Published on Saturday, JUNE 27, 2020 vol lV nos 26 & 27 EPW Economic & Political Weekly70
viii) Divergence in Asset Classifi cation and Provisioning for NPAs In terms of the RBI circular no. DBR.BP.BC.No.32/21.04.018/2018-19 dated 1st April, 2019, banks are required to disclose the
divergences in asset classifi cation and provisioning consequent to RBI’s annual supervisory process in their notes to accounts to the fi nancial statements, wherever either or both of the following conditions are satisfi ed: (a) the additional provisioning for NPAs assessed by RBI exceeds 10 per cent of the reported profi t before provisions and contingencies for the reference period and (b) the additional Gross NPAs identifi ed by RBI exceed 15 per cent of the published incremental Gross NPAs for the reference period.
Based on the above, no disclosure on divergence in asset classifi cation and provisioning for NPAs is required with respect to RBI’s annual supervisory process for the year ended 31 March, 2019.
ix) Disclosure with regard to accounts where moratorium has been granted under COVID-19 Regulatory Package (` in crores)
For the year ended 31 March, 2020
Respective amounts in SMA/overdue categories, where the moratorium/deferment was extended*$ 11,177.22Respective amount where asset classifi cation benefi t is extended as on 31.3.2020 735.10Provisions made as on 31.3.2020 1,117.72Provisions adjusted during the respective accounting periods against slippages –Residual provisions as on 31.3.2020 1,117.72
* represents total outstanding as on 31 March, 2020 $ amounts covered relate to cases where asset classifi cation benefi t would have been availed over the moratorium period, based on
interpretation of extant regulatory requirements on the date of adoption of fi nancial statements by the Board2.1.6 During the years ended 31 March, 2020 and 31 March, 2019 none of the loans and advances held at overseas branches of the Bank have
been classifi ed as NPA by any host banking regulator for reasons other than record of recovery.2.1.7 Movement in fl oating provision is set out below: (` in crores) For the year ended 31 March, 2020 31 March, 2019 Opening balance at the beginning of the year 3.25 3.25 Provisions made during the year – – Draw down made during the year – – Closing balance at the end of the year 3.25 3.25
2.1.8 Provision on Standard Assets (` in crores)
31 March, 2020 31 March, 2019 Provision towards Standard Assets 4,519.74 3,040.44 [includes provision on loans under moratorium as per RBI guidelines on COVID-19 regulatory package of `1,117.72 crores (previous year Nil); also includes `68.30 crores (previous year `38.14 crores) of standard provision on derivative exposures]
2.1.9 Details of Investments are set out below: i) Value of Investments: (` in crores)
31 March, 2020 31 March, 2019 1) Gross value of Investments a) In India 155,333.07 172,597.47 b) Outside India 5,539.37 5,029.73
2) (i) Provision for Depreciation a) In India (642.44) (560.31) b) Outside India (6.76) –
(ii) Provision for Non-Performing Investments a) In India (3,284.52) (1,903.39) b) Outside India (204.41) (194.22)
3) Net value of Investments a) In India 151,406.12 170,133.77 b) Outside India 5,328.20 4,835.51
ECO
NOM
IC &
PO
LITI
CAL
WEE
KLY
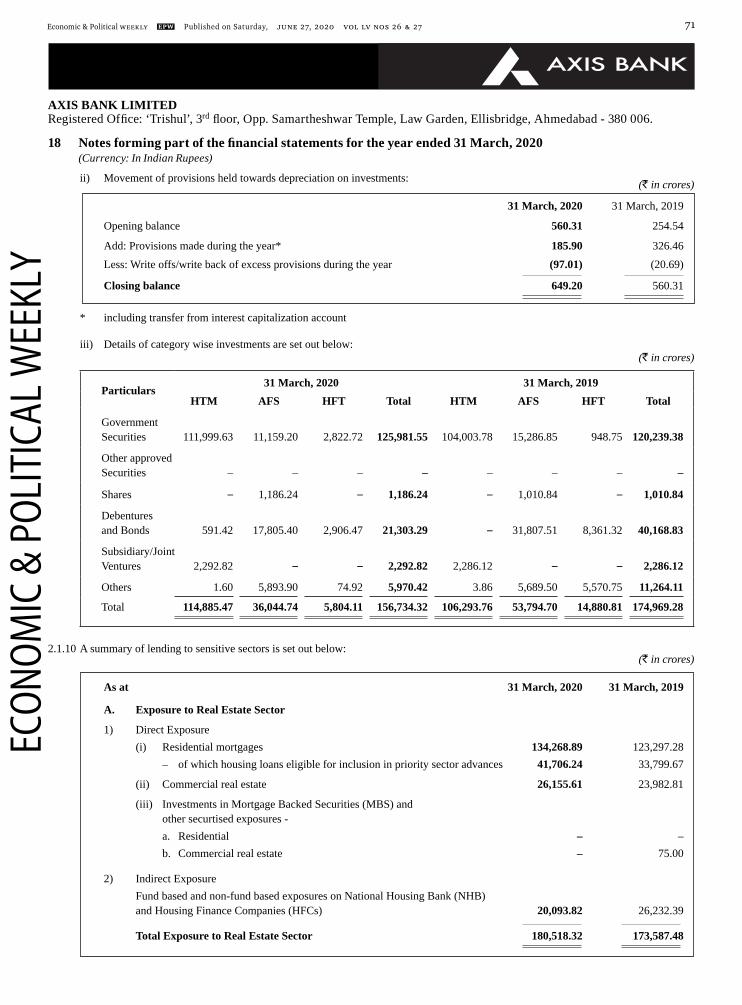
Registered Offi ce: ‘Trishul’, 3rd fl oor, Opp. Samartheshwar Temple, Law Garden, Ellisbridge, Ahmedabad - 380 006.AXIS BANK LIMITED
18 Notes forming part of the fi nancial statements for the year ended 31 March, 2020 (Currency: In Indian Rupees)
Economic & Political Weekly EPW Published on Saturday, JUNE 27, 2020 vol lV nos 26 & 27 71
ii) Movement of provisions held towards depreciation on investments: (` in crores)
31 March, 2020 31 March, 2019
Opening balance 560.31 254.54
Add: Provisions made during the year* 185.90 326.46
Less: Write offs/write back of excess provisions during the year (97.01) (20.69)
Closing balance 649.20 560.31
* including transfer from interest capitalization account
iii) Details of category wise investments are set out below: (` in crores)
Particulars31 March, 2020 31 March, 2019
HTM AFS HFT Total HTM AFS HFT Total
Government Securities 111,999.63 11,159.20 2,822.72 125,981.55 104,003.78 15,286.85 948.75 120,239.38
Other approved Securities – – – – – – – –
Shares – 1,186.24 – 1,186.24 – 1,010.84 – 1,010.84
Debentures and Bonds 591.42 17,805.40 2,906.47 21,303.29 – 31,807.51 8,361.32 40,168.83
Subsidiary/Joint Ventures 2,292.82 – – 2,292.82 2,286.12 – – 2,286.12
Others 1.60 5,893.90 74.92 5,970.42 3.86 5,689.50 5,570.75 11,264.11
Total 114,885.47 36,044.74 5,804.11 156,734.32 106,293.76 53,794.70 14,880.81 174,969.28
2.1.10 A summary of lending to sensitive sectors is set out below:(` in crores)
As at 31 March, 2020 31 March, 2019
A. Exposure to Real Estate Sector
1) Direct Exposure (i) Residential mortgages 134,268.89 123,297.28 – of which housing loans eligible for inclusion in priority sector advances 41,706.24 33,799.67
(ii) Commercial real estate 26,155.61 23,982.81
(iii) Investments in Mortgage Backed Securities (MBS) and other securtised exposures - a. Residential – – b. Commercial real estate – 75.00
2) Indirect Exposure Fund based and non-fund based exposures on National Housing Bank (NHB) and Housing Finance Companies (HFCs) 20,093.82 26,232.39
Total Exposure to Real Estate Sector 180,518.32 173,587.48
ECO
NOM
IC &
PO
LITI
CAL
WEE
KLY

Registered Offi ce: ‘Trishul’, 3rd fl oor, Opp. Samartheshwar Temple, Law Garden, Ellisbridge, Ahmedabad - 380 006.AXIS BANK LIMITED
18 Notes forming part of the fi nancial statements for the year ended 31 March, 2020 (Currency: In Indian Rupees)
Published on Saturday, JUNE 27, 2020 vol lV nos 26 & 27 EPW Economic & Political Weekly72
As at 31 March, 2020 31 March, 2019
B. Exposure to Capital Market 1. Direct investments in equity shares, convertible bonds, convertible debentures
and units of equity-oriented mutual funds the corpus of which is not exclusively invested in corporate debt* 2,003.55 1,726.94
2. Advances against shares/bonds/debentures or other securities or on clean basis to individuals for investment in shares (including IPOs/ESOPs), convertiblebonds, convertible debentures, and units of equity-oriented mutual funds 3.20 4.68
3. Advances for any other purposes where shares or convertible bonds or convertible debentures or units of equity-oriented mutual funds are taken as primary security 1,554.52 1,414.36
4. Advances for any other purposes to the extent secured by the collateral security of shares or convertible bonds or convertible debentures or units of equity-oriented mutual funds i.e. where primary security other than shares/convertible bonds/convertible debentures/units of equity-oriented mutual funds does not fully cover the advances 242.45 2,566.92
5. Secured and unsecured advances to stockbrokers and guarantees issued on behalf of stockbrokers and market makers 6,208.70 5,115.79
6. Loans sanctioned to corporates against the security of shares/bonds/debentures or other securities or on clean basis for meeting promoter’s contribution to the equity of new companies in anticipation of raising resources – 10.83
7. Bridge loans to companies against expected equity fl ows/issues – 1.44 8. Underwriting commitments taken up in respect of primary issue of shares or
convertible bonds or convertible debentures or units of equity-oriented mutual funds – – 9. Financing to stock brokers for margin trading – – 10. All exposures to Venture Capital Funds (both registered and unregistered) 161.43 112.45
Total exposure to Capital Market (Total of 1 to 10) 10,173.85 10,953.41
* excludes investment in equity shares on account of conversion of debt into equity as part of restructuring amounting to `991.59 crores as on 31 March, 2020 (previous year `1,694.02 crores) which are exempted from exposure to Capital Market
2.1.11 As on 31 March, 2020, outstanding receivables acquired by the Bank under factoring stood at `591.17 crores (previous year `419.39 crores) which are reported under ‘Bills Purchased and Discounted’ in Schedule 9 of the Balance Sheet.
2.1.12 During the years ended 31 March, 2020 and 31 March, 2019 there are no unsecured advances for which intangible securities such as charge over the rights, licenses, authority etc. have been taken as collateral by the Bank.
2.1.13 Details of Non-SLR investment portfolio are set out below: (i) Issuer composition as at 31 March, 2020 of non-SLR investments*: (` in crores)
No. Issuer Total Amount Extent of private
placement
Extent of “below
investment grade”
securities
Extent of “unrated” securities
Extent of “unlisted” securities
(1) (2) (3) (4) (5) (6) (7)i. Public Sector Units 6,300.05 4,735.07 154.70 - 13.62ii. Financial Institutions 2,002.19 1,402.80 77.24 - -iii. Banks 1,089.35 981.04 - - 88.91iv. Private Corporates 16,874.54 13,222.36 2,067.37 601.14 5,034.88v. Subsidiaries 2,292.82 2,292.82 - - 2,292.82vi. Others 10,395.43 6,441.03 - - 6,597.07vii. Provision held towards
depreciation on investments (649.20) N.A. N.A. N.A. N.A.
viii Provision held towards non performing investments (3,488.93) N.A. N.A. N.A. N.A.
Total 34,816.25 29,075.12 2,299.31 601.14 14,027.30
Amounts reported under columns (4), (5), (6) and (7) above are not mutually exclusive.
ECO
NOM
IC &
PO
LITI
CAL
WEE
KLY

Registered Offi ce: ‘Trishul’, 3rd fl oor, Opp. Samartheshwar Temple, Law Garden, Ellisbridge, Ahmedabad - 380 006.AXIS BANK LIMITED
18 Notes forming part of the fi nancial statements for the year ended 31 March, 2020 (Currency: In Indian Rupees)
Economic & Political Weekly EPW Published on Saturday, JUNE 27, 2020 vol lV nos 26 & 27 73
Issuer composition as at 31 March, 2019 of non-SLR investments*: (` in crores)No. Issuer Total
AmountExtent of
privateplacement
Extent of “below
investment grade”
securities
Extent of “unrated” securities
Extent of “unlisted” securities
(1) (2) (3) (4) (5) (6) (7)i. Public Sector Units 9,489.66 5,411.68 657.56 0.98 2,038.79ii. Financial Institutions 5,400.64 3,883.90 50.30 – 26.87iii. Banks 1,716.72 1,151.67 – – 14.00iv. Private Corporates 33,243.43 22,749.72 1,059.05 753.04 9,365.44v. Subsidiaries 2,286.12 2,286.12 – – 2,286.12vi. Others 8,667.72 5,676.37 – – 5,787.92vii. Provision held towards
depreciation on investments (560.31) N.A. N.A. N.A. N.A.
viii. Provision held towards non- performing investments (2,097.61) N.A. N.A. N.A. N.A.
Total 58,146.37 41,159.46 1,766.91 754.02 19,519.14 Amounts reported under columns (4), (5), (6) and (7) above are not mutually exclusive. * excludes investments in non-SLR government securities amounting to `5,000.00 (previous year `42.54 crores) (ii) Movement in non-performing non SLR investments are set out below: (` in crores) 31 March, 2020 31 March, 2019 Opening balance 2,642.99 3,372.32 Additions during the year 2,564.37 362.94 Reductions during the year (1,577.64) (1,092.27) Closing balance 3,629.72 2,642.99 Total provisions held 3,488.93 2,097.62
2.1.14 Details of securities sold/purchased (in face value terms) under repos/reverse repos including LAF and MSF transactions (including triparty repos):
Year ended 31 March, 2020 (` in crores)
Minimum outstanding
during the year
Maximum outstanding
during the year
Daily Average outstanding
during the year
As at 31 March, 2020
Securities sold under reposi. Government Securities – 14,761.55 1,386.37 11,269.61ii. Corporate debt Securities – 2,261.12 732.34 363.19Securities purchased under reverse reposi. Government Securities 342.65 56,973.93 14,186.14 52,656.69ii. Corporate debt Securities - 25.00 0.07 -
There have been no defaults in making the same set of securities available at the time of 2nd leg settlement of the Term Reverse Repo during the year ended 31 March, 2020.
Year ended 31 March, 2019 (` in crores)
Minimum outstanding
during the year
Maximum outstanding
during the year
Daily Average outstanding
during the year
As at 31 March, 2019
Securities sold under reposi. Government Securities – 14,687.58 1,219.73 14,687.58ii. Corporate debt Securities – – – –Securities purchased under reverse reposi. Government Securities – 23.514.53 5,109.53 23,514.53ii. Corporate debt Securities – 100.00 0.31 –
There have been no defaults in making the same set of securities available at the time of 2nd leg settlement of the Term Reverse Repo during the year ended 31 March, 2019.
ECO
NOM
IC &
PO
LITI
CAL
WEE
KLY

Registered Offi ce: ‘Trishul’, 3rd fl oor, Opp. Samartheshwar Temple, Law Garden, Ellisbridge, Ahmedabad - 380 006.AXIS BANK LIMITED
18 Notes forming part of the fi nancial statements for the year ended 31 March, 2020 (Currency: In Indian Rupees)
Published on Saturday, JUNE 27, 2020 vol lV nos 26 & 27 EPW Economic & Political Weekly74
2.1.15 Details of fi nancial assets sold to Securitisation/Reconstruction companies for Asset Reconstruction: (` in crores)
31 March, 2020 31 March, 2019 Number of accounts* 3 5 Aggregate value (net of provisions) of accounts sold 7.92 159.29 Aggregate consideration 28.80 236.61 Additional consideration realised in respect of accounts transferred in earlier years – – Aggregate net gain/(loss) over net book value 20.88 77.32
*Excludes 1 account already written-off (previous year 3 accounts)
Excess provision reversed to the profi t and loss account from sale of NPAs amounts to `20.88 crores (previous year `85.83 crores)
(` in crores)
Backed by NPAs sold by the Bank as underlying
Backed by NPAs sold by other banks/fi nancial institutions/non-banking fi nancial companies as
underlying
Total
Particulars As on 31 March,
2020
As on 31March, 2019
As on 31 March,
2020
As on 31March, 2019
As on 31 March,
2020
As on 31March, 2019
Book value of investments in Security Receipts (‘SRs’) 2,197.31 2,908.00 2.26 2.26 2,199.57 2,910.26
(` in crores)
As on 31 March, 2020Particulars SRs issued
within past 5 years
SRs issued more than 5 years ago but
within past 8 years
SRs issued more than 8 years ago Total
(i) Book value of SRs backed by NPAs sold by the bank as underlying 1,953.26 243.72 0.33 2,197.31Provisions held against (i)* (183.20) (241.52) (0.33) (425.05)
(ii) Book value of SRs backed by NPAs sold by other banks / fi nancial institutions / non-banking fi nancial companies as underlying 0.22 1.38 0.66 2.26Provisions held against (ii)* – (0.29) (0.66) (0.95)
Total (i) + (ii), net of provisions 1,770.28 3.29 – 1,773.57
* represents provision for depreciation on SRs and is net off appreciation, if any against other SRs (` in crores)
As on 31 March, 2019Particulars SRs issued
within past 5 years
SRs issued more than 5 years ago but
within past 8 years
SRs issued more than 8 years ago Total
(i) Book value of SRs backed by NPAs sold by the bank as underlying 2,664.02 243.98 – 2,908.00Provisions held against (i) – (220.83) – (220.83)
(ii) Book value of SRs backed by NPAs sold by other banks / fi nancial institutions / non-banking fi nancial companies as underlying 0.22 1.38 0.66 2.26Provisions held against (ii) – – (0.66) (0.66)
Total (i) + (ii), net of provisions 2,664.24 24.53 – 2,688.77
* represents provision for depreciation on SRs and is net off appreciation, if any against other SRs
ECO
NOM
IC &
PO
LITI
CAL
WEE
KLY

Registered Offi ce: ‘Trishul’, 3rd fl oor, Opp. Samartheshwar Temple, Law Garden, Ellisbridge, Ahmedabad - 380 006.AXIS BANK LIMITED
18 Notes forming part of the fi nancial statements for the year ended 31 March, 2020 (Currency: In Indian Rupees)
Economic & Political Weekly EPW Published on Saturday, JUNE 27, 2020 vol lV nos 26 & 27 75
2.1.16 Details of the Non-Performing Financial Assets sold to other banks (excluding securitisation/reconstruction companies): (` in crores)
31 March, 2020 31 March, 2019
Number of accounts sold 1 4
Aggregate outstanding* 616.93 755.39
Aggregate consideration received 170.55 481.52
*Represents principal outstanding as on date of sale
During the years ended 31 March, 2020 and 31 March, 2019 there were no Non-Performing Financial Assets purchased by the Bank from other banks (excluding securitisation/reconstruction companies).
2.1.17 Details of securitisation transactions undertaken by the Bank are as follows:(` in crores)
Sr. No. Particulars 31 March, 2020 31 March, 2019
1 No. of SPVs sponsored by the bank for securitisation transactions – –
2 Total amount of securitised assets as per books of the SPVs sponsored by the Bank – –
3 Total amount of exposures retained by the bank to comply with MRR as on the date of balance sheet
a) Off-balance sheet exposures First loss – – Others – –
b) On-balance sheet exposures First loss – – Others – –
4 Amount of exposures to securitisation transactions other than MRR
a) Off-balance sheet exposures i) Exposure to own securitizations First loss – – Loss – – ii) Exposure to third party securitisations First loss – – Others – –
b) On-balance sheet exposures
i) Exposure to own securitizations First loss – – Loss – –
ii) Exposure to third party securitisations First loss – – Others – –
ECO
NOM
IC &
PO
LITI
CAL
WEE
KLY

Registered Offi ce: ‘Trishul’, 3rd fl oor, Opp. Samartheshwar Temple, Law Garden, Ellisbridge, Ahmedabad - 380 006.AXIS BANK LIMITED
18 Notes forming part of the fi nancial statements for the year ended 31 March, 2020 (Currency: In Indian Rupees)
Published on Saturday, JUNE 27, 2020 vol lV nos 26 & 27 EPW Economic & Political Weekly76
2.1.18 The information on concentration of deposits is given below:(`in crores)
31 March, 2020 31 March, 2019
Total deposits of twenty largest depositors 58,674.60 64,899.05
Percentage of deposits of twenty largest depositors to total deposits 9.17 11.83
2.1.19 The information on concentration of advances* is given below: (` in crores)
31 March, 2020 31 March, 2019
Total advances to twenty largest borrowers 74,849.03 62,677.26
Percentage of advances to twenty largest borrowers to total advances of the Bank 8.65 8.56
* Advances represent credit exposure (funded and non-funded) including derivative exposure as defi ned by RBI
2.1.20 The information on concentration of exposure* is given below: (` in crores)
31 March, 2020 31 March, 2019
Total exposure to twenty largest borrowers/customers 92,264.51 84,341.85
Percentage of exposures to twenty largest borrowers/customers to total exposure on borrowers/customers 10.08 10.55
* Exposure includes credit exposure (funded and non-funded), derivative exposure, investment exposure (including underwriting and similar commitments) and deposits placed for meeting shortfall in Priority Sector Lending
2.1.21 During the year ended 31 March, 2020 and 31 March, 2019, the Bank’s credit exposure to single borrower and group borrowers was within the prudential exposure limits prescribed by RBI.
2.1.22 Details of Risk Category wise Country Exposure: (` in crores)
Risk Category Exposure (Net) Provision Held Exposure (Net) Provision Held as at as at as at as at 31 March, 2020 31 March, 2020 31 March, 2019 31 March, 2019
Insignifi cant – – – –
Low 19,223.10 12.17 22,233.01 –
Moderate 5,304.97 – 2,948.18 –
High 95.91 – 1,038.47 –
Very High 1,219.26 – 2,827.57 –
Restricted 1.69 – – –
Off-Credit – – – –
Total 25,844.93 12.17 29,047.23 –
ECO
NOM
IC &
PO
LITI
CAL
WEE
KLY

Registered Offi ce: ‘Trishul’, 3rd fl oor, Opp. Samartheshwar Temple, Law Garden, Ellisbridge, Ahmedabad - 380 006.AXIS BANK LIMITED
18 Notes forming part of the fi nancial statements for the year ended 31 March, 2020 (Currency: In Indian Rupees)
Economic & Political Weekly EPW Published on Saturday, JUNE 27, 2020 vol lV nos 26 & 27 77
2.1.23 A maturity pattern of certain items of assets and liabilities at 31 March, 2020 and 31 March, 2019 is set out below: As at 31 March, 2020 (` in crores)
Deposits1 Advances12 Investments1 Borrowings1 Foreign Currency
Assets3
Foreign Currency
Liabilities3
1 day 9,393.22 4,373.19 34,818.51 - 8,783.77 319.492 days to 7 days 29,764.93 4,380.02 1,510.13 72.06 5,827.00 3,477.568 days to 14 days 15,065.83 3,956.05 4,695.30 463.34 628.87 667.6715 days to 30 days 18,598.50 10,947.57 4,399.54 6,302.02 4,683.82 2,548.1131 days and upto 2 months 27,305.18 15,526.78 4,419.81 7,814.64 2,669.03 9,095.83Over 2 months and upto 3 months 24,411.64 15,015.80 3,538.71 4,412.42 3,233.05 6,854.61Over 3 months and upto 6 months 53,506.32 30,319.38 6,743.15 17,592.82 8,109.22 18,744.94Over 6 months and upto 1 year 83,932.89 51,919.47 10,037.31 26,182.68 15,510.51 30,201.76Over 1 year and upto 3 years 23,586.16 114,606.88 15,369.43 50,425.65 12,960.38 15,689.63Over 3 years and upto 5 years 2,688.28 69,495.45 7,207.81 13,783.50 3,911.41 3,846.53Over 5 years 351,851.99 250,883.57 63,994.62 20,905.00 31,522.80 7,114.42Total 640,104.94 571,424.16 156,734.32 147,954.13 97,839.86 98,560.55
1. Includes foreign currency balances 2. For the purpose of disclosing the maturity pattern, advances that have been subject to risk participation vide Inter-Bank Participation
Certifi cates (‘IBPCs’) and Funded Risk Participation (‘FRPs’) have been classifi ed in the maturity bucket corresponding to the contractual maturities of such underlying loans and advances gross of any risk participation. The IBPC and FRP amounts have been classifi ed in the respective maturities of the corresponding underlying loans.
3. Maturity profi le of foreign currency assets and liabilities excludes off balance sheet items. 4. The maturity profi le disclosed above does not factor in the effect of changes due to postponement of cash fl ows on account of loans
under 3 months moratorium period as permitted under RBI’s COVID-19 Regulatory Package notifi ed on 27 March, 2020. 5. During the year ended 31 March, 2020, pursuant to the approval of the Board of Directors, the Bank changed the behavioural
methodology for determining the maturity pattern of term deposits of ticket size less than 2 crores from account level to constituent level. As a result, the above fi gures for deposits are strictly not comparable with the previous year. Further, the Bank reports core deposits largely as part of ‘over 5 years’ bucket based on the results of the behavioural analysis.
As at 31 March, 2019 (` in crores)
Deposits1 Advances12 Investments1 Borrowings1 Foreign Currency
Assets3
Foreign Currency
Liabilities3
1 day 8,854.09 3,179.52 31,440.58 - 9,025.92 245.772 days to 7 days 22,294.97 5,234.97 4,660.62 15,062.95 4,964.20 1,418.328 days to 14 days 15,394.97 5,107.99 8,025.69 1,024.36 3,041.63 1,294.7315 days to 30 days 19,159.42 13,573.13 6,803.41 5,275.12 7,739.23 4,116.1231 days and upto 2 months 36,696.06 9,656.92 7,569.10 10,457.24 2,218.20 10,542.55Over 2 months and upto 3 months 35,984.16 14,524.37 7,972.16 11,602.82 3,146.91 11,797.01Over 3 months and upto 6 months 55,550.20 22,578.92 10,247.36 16,315.61 5,867.26 14,577.87Over 6 months and upto 1 year 107,987.13 29,784.41 20,195.62 22,525.88 4,102.00 28,803.38Over 1 year and upto 3 years 37,116.54 94,599.36 23,031.65 29,480.21 8,148.93 14,285.41Over 3 years and upto 5 years 10,036.96 59,808.46 9,773.49 17,369.91 8,329.96 6,562.59Over 5 years 199,396.84 236,749.92 45,249.60 23,661.68 41,488.00 4,528.35Total 548,471.34 494,797.97 174,969.28 152,775.78 98,072.24 98,172.10
1. Includes foreign currency balances. 2. For the purpose of disclosing the maturity pattern, advances that have been subject to risk participation vide Inter-Bank Participation
Certifi cates (‘IBPCs’) and Funded Risk Participation (‘FRPs’) have been classifi ed in the maturity bucket corresponding to the contractual maturities of such underlying loans and advances gross of any risk participation. The IBPC and FRP amounts have been classifi ed in the respective maturities of the corresponding underlying loans.
3. Maturity profi le of foreign currency assets and liabilities excludes off balance sheet items. Classifi cation of assets and liabilities under the different maturity buckets is based on the same estimates and assumptions as used
by the Bank for compiling the return submitted to the RBI, which has been relied upon by the auditors.
ECO
NOM
IC &
PO
LITI
CAL
WEE
KLY

Registered Offi ce: ‘Trishul’, 3rd fl oor, Opp. Samartheshwar Temple, Law Garden, Ellisbridge, Ahmedabad - 380 006.AXIS BANK LIMITED
18 Notes forming part of the fi nancial statements for the year ended 31 March, 2020 (Currency: In Indian Rupees)
Published on Saturday, JUNE 27, 2020 vol lV nos 26 & 27 EPW Economic & Political Weekly78
2.1.24 Disclosure on Restructured Assets
Details of loans subjected to restructuring during the year ended 31 March, 2020 are given below: (` in crores)
Type of Restructuring Under CDR Mechanism Under SME Debt Restructuring Mechanism
Asset Classifi cation Standard Sub- Doubtful Loss Total Standard Sub- Doubtful Loss Total Standard Standard
Restructured No. of borrowers 4 – 4 4 12 – – – – – accounts as on Amount Outstanding April 1 of the – Restructured facility 267.63 – 467.93 97.86 833.42 – – – – – FY (Opening Amount Outstanding Balance) – Other facility 0.55 – 89.42 35.76 125.73 – – – – – Provision thereon 6.06 – – – 6.06 – – – – –
Fresh No. of borrowers – – – – – – – – – – Restructuring Amount Outstanding during the – Restructured facility 0.54 – 32.29 10.16 42.99 – – – – – year 1,2 Amount Outstanding – Other facility 141.80 – 4.72 27.14 173.66 – – – – –
Provision thereon 2.39 – – – 2.39 – – – – –
Upgradation to No. of borrowers – – – – – – – – – – restructured Amount Outstanding standard – Restructured facility – – – – – – – – – – category during Amount Outstanding the FY – Other facility – – – – – – – – – – Provision thereon – – – – – – – – – –
Restructured No. of borrowers (1) (1) – – – – – Standard Amount Outstanding Advances – Restructured facility (4.08) (4.08) – – – – – which cease to Amount Outstanding attract higher – Other facility – – – – – – – provisioning Provision thereon (0.26) (0.26) – – – – – and/or additional risk weight at the end of FY
Downgradation No. of borrowers (2) – (1) 3 – – – – – – of restructured Amount Outstanding accounts during – Restructured facility (125.17) – (275.52) 400.69 – – – – – – the FY3 Amount Outstanding – Other facility (142.35) – 80.68 61.67 – – – – – – Provision thereon (8.19) – (8.19) – – – – – – –
Write-offs of No. of borrowers – – (1) – (1) – – – – – restructured Amount Outstanding accounts during – Restructured facility (138.32) – (99.52) (13.11) (250.95) – – – – – the FY4,5,6 Amount Outstanding – Other facility – – (32.46) – (32.46) – – – – –
Restructured No. of borrowers 1 – 2 7 10 – – – – – accounts as on Amount Outstanding March 31 of – Restructured facility 0.60 – 125.18 495.60 621.38 – – – – – the FY Amount Outstanding (closing fi gures) – Other facility – – 142.36 124.57 266.93 – – – – – Provision thereon – – 8.19 – 8.19 – – – – –
ECO
NOM
IC &
PO
LITI
CAL
WEE
KLY

Registered Offi ce: ‘Trishul’, 3rd fl oor, Opp. Samartheshwar Temple, Law Garden, Ellisbridge, Ahmedabad - 380 006.AXIS BANK LIMITED
18 Notes forming part of the fi nancial statements for the year ended 31 March, 2020(Currency: In Indian Rupees)
Economic & Political Weekly EPW Published on Saturday, JUNE 27, 2020 vol lV nos 26 & 27 79
(` in crores)
Type of Restructuring Others Total
Asset Classifi cation Standard Sub- Doubtful Loss Total Standard Sub- Doubtful Loss Total Standard Standard
Restructured No. of borrowers 745 103 33 5 886 749 103 37 9 898 accounts as on Amount Outstanding April 1 of the – Restructured facility 690.09 16.79 3,284.63 159.69 4,151.20 957.72 16.79 3,752.56 257.55 4,984.62 FY (Opening Amount Outstanding Balance) – Other facility 19.47 0.14 1,310.61 85.02 1,415.24 20.02 0.14 1,400.03 120.78 1,540.97 Provision thereon 10.54 - 2.08 - 12.62 16.60 - 2.08 - 18.68
Fresh No. of borrowers 249 - - - 249 249 - - - 249 Restructuring Amount Outstanding during the – Restructured facility 121.14 1.96 76.57 18.93 218.60 121.68 1.96 108.86 29.09 261.59 year1, 2 Amount Outstanding – Other facility 72.74 0.02 24.07 14.47 111.30 214.54 0.02 28.79 41.61 284.96 Provision thereon 2.48 - (2.08) - 0.40 4.87 - (2.08) - 2.79
Upgradation to No. of borrowers 15 (15) - - - 15 (15) - - - restructured Amount Outstanding standard category – Restructured facility 1.94 (1.94) - - - 1.94 (1.94) - - - during the FY Amount Outstanding – Other facility - - - - - - - - - - Provision thereon - - - - - - - - - -
Restructured No. of borrowers (48) (48) (49) (49) Standard Amount Outstanding Advances – Restructured facility (249.86) (249.86) (253.94) (253.94) which cease to Amount Outstanding attract higher – Other facility (33.93) (33.93) (33.93) (33.93) provisioning Provision thereon (8.86) (8.86) (9.12) (9.12) and/or additional risk weight at the end of FY
Downgradation No. of borrowers (96) 11 81 4 - (98) 11 80 7 - of restructured Amount Outstanding accounts – Restructured facility (11.76) (3.45) 14.07 1.14 - (136.93) (3.45) (261.45) 401.83 - during the FY3 Amount Outstanding – Other facility (5.41) 5.19 0.22 - - (147.76) 5.19 80.90 61.67 - Provision thereon - - - - - (8.19) - 8.19 - -
Write-offs of No. of borrowers (1) (5) (33) (3) (42) (1) (5) (34) (3) (43) restructured Amount Outstanding accounts during – Restructured facility (51.22) (2.16) (1,752.36) (71.24) (1,876.98) (189.54) (2.16) (1,851.88) (84.35) (2,127.93) the FY4,5, 6 Amount Outstanding – Other facility (0.75) (0.05) (853.48) (9.29) (863.57) (0.75) (0.05) (885.94) (9.29) (896.03)
Restructured No. of borrowers 864 94 81 6 1,045 865 94 83 13 1,055 accounts as on Amount Outstanding March 31 of – Restructured facility 500.33 11.20 1,622.91 108.52 2,242.96 500.93 11.20 1,748.09 604.12 2,864.34 the FY (closing Amount Outstanding fi gures) – Other facility 52.12 5.30 481.42 90.20 629.04 52.12 5.30 623.78 214.77 895.97 Provision thereon 4.16 - - - 4.16 4.16 - 8.19 - 12.35
Amount outstanding under restructuring facilities and other facilities is as on 31 March, 2020:1. Amount reported here represents outstanding as on 31 March, 2020. Actual amount subjected to restructuring determined as on the
date of approval of restructuring proposal is `38.06 crores for the FY 2019-20 2. Includes `3.13 crores of fresh/additional sanction to existing restructured accounts (entirely under restructured facility)3. Includes accounts which were not attracting higher provisioning and/or additional risk weight at the beginning of FY4. Includes accounts partially written-off during the year5. Amount outstanding under restructuring facilities and other facilities is as on the date of write-off in the books6. Includes `148.39 crores of reduction from existing restructured accounts by way of sale/recovery (`144.28 crores from restructured
facility and `4.11 crores from other facility)7. The cumulative value of net restructured advances after reducing the provision held for diminution in fair value and balance in
interest capitalization account upto 31 March, 2020 aggregated `472.14 crores8. Information appearing under substandard, doubtful and loss category also include accounts slipped into NPAs from restructured
standard advances along with restructured NPAs
ECO
NOM
IC &
PO
LITI
CAL
WEE
KLY

Registered Offi ce: ‘Trishul’, 3rd fl oor, Opp. Samartheshwar Temple, Law Garden, Ellisbridge, Ahmedabad - 380 006.AXIS BANK LIMITED
18 Notes forming part of the fi nancial statements for the year ended 31 March, 2020 (Currency: In Indian Rupees)
Published on Saturday, JUNE 27, 2020 vol lV nos 26 & 27 EPW Economic & Political Weekly80
Details of loans subjected to restructuring during the year ended 31 March, 2019 are given below: (` in crores)Type of Restructuring Under CDR Mechanism Under SME Debt Restructuring
Mechanism
Asset Classifi cation Standard Sub- Doubtful Loss Total Standard Sub- Doubtful Loss Total Standard Standard
Restructured No. of borrowers 7 - 18 6 31 - - - - - accounts as on Amount Outstanding April 1 of the – Restructured facility 427.80 – 1,370.79 124.65 1,923.24 – – – – – FY (Opening Amount Outstanding Balance) – Other facility 279.33 – 350.31 34.10 663.74 – – – – – Provision thereon 11.28 – 28.37 – 39.65 – – – – –
Movement in No. of borrowers – – – – – – – – – – balance for Amount Outstanding accounts – Restructured facility 8.72 – 11.69 – 20.41 – – – – – appearing under Amount Outstanding opening – Other facility – – 10.50 23.97 34.47 – – – – – balance Provision thereon 0.64 – (28.19) – (27.55) – – – – –
Fresh No. of borrowers – – – – – – – – – – Restructuring Amount Outstanding during the – Restructured facility – – – – – – – – – – year 1, 2 Amount Outstanding – Other facility – – – – – – – – – – Provision thereon – – – – – – – – – –
Upgradation to No. of borrowers 1 – (1) – – – – – – – restructured Amount Outstanding standard – Restructured facility 15.97 – (15.97) – – – – – – – category during Amount Outstanding the FY – Other facility – – – – – – – – – – Provision thereon 0.18 – (0.18) – – – – – – –
Restructured No. of borrowers (4) (4) – – Standard Amount Outstanding Advances – Restructured facility (178.19) (178.19) – – which cease to Amount Outstanding attract higher – Other facility (278.78) (278.78) – – provisioning Provision thereon (6.05) (6.05) – – and/or additional risk weight at the end of FY
Downgradation No. of borrowers – – (1) 1 – – – – – – of restructured Amount Outstanding accounts during – Restructured facility – – (22.74) 22.74 – – – – – – the FY3 Amount Outstanding – Other facility – – (5.51) 5.51 – – – – – – Provision thereon – – – – – – – – – –
Write-offs of No. of borrowers – – (12) (3) (15) – – – – – restructured Amount Outstanding accounts during – Restructured facility (6.67) – (875.84) (49.54) (932.05) – – – – – the FY4,5,6 Amount Outstanding – Other facility – – (265.88) (27.82) (293.70) – – – – –
Restructured No. of borrowers 4 – 4 4 12 – – – – – accounts as on Amount Outstanding March 31 of – Restructured facility 267.63 – 467.93 97.86 833.42 – – – – – the FY Amount Outstanding (closing fi gures) – Other facility 0.55 – 89.42 35.76 125.73 – – – – – Provision thereon 6.06 – – – 6.06 – – – – –
ECO
NOM
IC &
PO
LITI
CAL
WEE
KLY

Registered Offi ce: ‘Trishul’, 3rd fl oor, Opp. Samartheshwar Temple, Law Garden, Ellisbridge, Ahmedabad - 380 006.AXIS BANK LIMITED
18 Notes forming part of the fi nancial statements for the year ended 31 March, 2020(Currency: In Indian Rupees)
Economic & Political Weekly EPW Published on Saturday, JUNE 27, 2020 vol lV nos 26 & 27 81
(` in crores)Type of Restructuring Others Total
Asset Classifi cation Standard Sub- Doubtful Loss Total Standard Sub- Doubtful Loss Total Standard Standard
Restructured No. of borrowers 516 18 191 87 812 523 18 209 93 843 accounts as on Amount Outstanding April 1 of the – Restructured facility 757.33 4.55 3,902.96 151.90 4,816.74 1,185.13 4.55 5,273.75 276.55 6,739.98 FY (Opening Amount Outstanding Balance) – Other facility 268.82 0.33 1,390.05 3.75 1,662.95 548.15 0.33 1,740.36 37.85 2,326.69 Provision thereon 7.35 – 36.97 – 44.32 18.63 – 65.34 – 83.97 Movement in No. of borrowers – – – – – – – – – – balance for Amount Outstanding accounts – Restructured facility 0.85 – 67.59 (1.23) 67.21 9.57 – 79.28 (1.23) 87.62 appearing under Amount Outstanding opening – Other facility (0.17) – 5.74 – 5.57 (0.17) – 16.24 23.97 40.04 balance Provision thereon (2.31) – (26.69) – (29.00) (1.67) – (54.88) – (56.55) Fresh No. of borrowers 457 1 5 – 463 457 1 5 – 463 Restructuring Amount Outstanding during the – Restructured facility 289.27 0.01 0.20 – 289.48 289.27 0.01 0.20 – 289.48 year1, 2 Amount Outstanding – Other facility 18.84 0.01 0.01 – 18.86 18.84 0.01 0.01 – 18.86 Provision thereon – – – – – – – – – – Upgradation to No. of borrowers 32 (22) (10) – – 33 (22) (11) – –
restructured Amount Outstanding standard category – Restructured facility 338.52 (5.16) (333.36) – – 354.49 (5.16) (349.33) – – during the FY Amount Outstanding – Other facility 0.25 (0.09) (0.16) – – 0.25 (0.09) (0.16) – – Provision thereon 8.19 – (8.19) – – 8.37 – (8.37) – – Restructured No. of borrowers (90) (90) (94) (94) Standard Amount Outstanding Advances – Restructured facility (537.26) (537.26) (715.45) (715.45) which cease to Amount Outstanding attract higher – Other facility (235.70) (235.70) (514.48) (514.48) provisioning Provision thereon (2.70) (2.70) (8.75) (8.75) and/or additional risk weight at the end of FY Downgradation No. of borrowers (163) 107 50 6 – (163) 107 49 7 – of restructured Amount Outstanding accounts – Restructured facility (154.37) 17.59 (23.92) 160.70 – (154.37) 17.59 (46.66) 183.44 – during the FY3 Amount Outstanding – Other facility (32.46) (0.04) (52.25) 85.02 – (32.46) (0.04) (58.03) 90.53 – Provision thereon – – – – – – – – – – Write-offs of No. of borrowers (7) (1) (203) (88) (299) (7) (1) (215) (91) (314) restructured Amount Outstanding accounts during – Restructured facility (4.24) (0.20) (328.83) (151.67) (484.94) (10.91) (0.20) (1,204.67) (201.21) (1,416.99) the FY4,5, 6 Amount Outstanding – Other facility (0.11) (0.07) (32.52) (3.75) (36.45) (0.11) (0.07) (298.40) (31.57) (330.15) Restructured No. of borrowers 745 103 33 5 886 749 103 37 9 898 accounts as on Amount Outstanding March 31 of – Restructured facility 690.09 16.79 3,284.63 159.69 4,151.20 957.72 16.79 3,752.56 257.55 4,984.62 the FY (closing Amount Outstanding fi gures) – Other facility 19.47 0.14 1,310.61 85.02 1,415.24 20.02 0.14 1,400.02 120.78 1,540.96 Provision thereon 10.54 – 2.08 – 12.62 16.60 – 2.08 – 18.67
Amount outstanding under restructuring facilities and other facilities is as on 31 March, 2019:1. Amount reported here represents outstanding as on 31 March, 2019. Actual amount subjected to restructuring determined as on the
date of approval of restructuring proposal is `285.58 crores for the FY 2018-19 2. Includes `12.56 crores of fresh/additional sanction to existing restructured accounts (entirely under restructured facility)3. Includes accounts which were not attracting higher provisioning and/or additional risk weight at the beginning of FY4. Includes accounts partially written-off during the year5. Amount outstanding under restructuring facilities and other facilities is as on the date of write-off in the books6. Includes `212.80 crores of reduction from existing restructured accounts by way of sale/recovery (`151.00 crores from restructured
facility and `61.80 crores from other facility)7. The cumulative value of net restructured advances after reducing the provision held for diminution in fair value and balance in
interest capitalization account upto 31 March, 2019 aggregated `886.54 crores8. Information appearing under substandard, doubtful and loss category also include accounts slipped into NPAs from restructured
standard advances along with restructured NPAs
ECO
NOM
IC &
PO
LITI
CAL
WEE
KLY

Registered Offi ce: ‘Trishul’, 3rd fl oor, Opp. Samartheshwar Temple, Law Garden, Ellisbridge, Ahmedabad - 380 006.AXIS BANK LIMITED
18 Notes forming part of the fi nancial statements for the year ended 31 March, 2020 (Currency: In Indian Rupees)
Published on Saturday, JUNE 27, 2020 vol lV nos 26 & 27 EPW Economic & Political Weekly82
2.1.25 Details of MSME advances subjected to restructuring: (` in crores)
Particulars As at 31 March, 2020
As at 31 March, 2019
No. of accounts restructured 9 -
Amount outstanding 16.35 -
2.1.26 Disclosure with regard to implementation of resolution plan as required under RBI circular of 7 June, 2019 on Prudential Framework for Resolution of Stressed Assets: (` in crores)
Particulars Resolution plan implemented
Resolution plan not implemented
No. of borrowers where timeline for implementation of resolution plan was before 31.3.2020 (without reckoning the extended resolution period provided through the RBI circular of 17 April, 2020)
6 35
Fund based outstanding as on 31.3.2020* 640.09 8,185.42
Additional provisions held as per RBI circular of 7 June, 2019 474.89
* excluding outstanding for cases which have be subject to prudential write-off and outstanding in equity shares
2.1.27 Disclosure in respect of Interest Rate Swaps (‘IRS’), Forward Rate Agreement (‘FRA’) and Cross Currency Swaps (‘CCS’) outstanding is set out below:
An ‘IRS’ is a fi nancial contract between two parties exchanging or swapping a stream of interest payments for a ‘notional principal’ amount on multiple occasions during a specifi ed period. The Bank deals in interest rate benchmarks like Mumbai Inter-Bank Offered Rate (MIBOR), Indian Government Securities Benchmark Rate (INBMK), Mumbai Inter-Bank Forward Offer Rate (MIFOR) and LIBOR of various currencies.
A ‘FRA’ is a fi nancial contract between two parties to exchange interest payments for ‘notional principal’ amount on settlement date, for a specifi ed period from start date to maturity date. Accordingly, on the settlement date cash payments based on contract rate and the settlement rate, which is the agreed bench-mark/reference rate prevailing on the settlement date, are made by the parties to one another. The benchmark used in the FRA contracts of the Bank is London Inter-Bank Offered Rate (LIBOR) of various currencies.
A ‘CCS’ is a fi nancial contract between two parties exchanging interest payments and principal, wherein interest payments and principal in one currency would be exchanged for an equally valued interest payments and principal in another currency.
(` in crores)
Sr. Items As at As at No. 31 March, 2020 31 March, 2019
i) Notional principal of swap agreements 301,276.40 236,685.35
ii) Losses which would be incurred if counterparties failed to fulfi ll their obligations under the agreements 6,935.72 4,223.33
iii) Collateral required by the Bank upon entering into swaps 837.94 523.97
iv) Concentration of credit risk arising from the swaps Maximum single industry exposure with Banks (previous year with Banks) – Interest Rate Swaps/FRAs 3,890.55 2,201.10 – Cross Currency Swaps 4,196.42 3,112.72
v) Fair value of the swap book (hedging & trading) – Interest Rate Swaps/FRAs (588.68) (794.06) – Currency Swaps 907.85 1,475.34
ECO
NOM
IC &
PO
LITI
CAL
WEE
KLY

Registered Offi ce: ‘Trishul’, 3rd fl oor, Opp. Samartheshwar Temple, Law Garden, Ellisbridge, Ahmedabad - 380 006.AXIS BANK LIMITED
18 Notes forming part of the fi nancial statements for the year ended 31 March, 2020 (Currency: In Indian Rupees)
Economic & Political Weekly EPW Published on Saturday, JUNE 27, 2020 vol lV nos 26 & 27 83
The nature and terms of the IRS as on 31 March, 2020 are set out below: (` in crores)
Nature Nos. Notional Principal Benchmark Terms
HedgingHedgingTradingTradingTradingTradingTradingTradingTradingTradingTradingTrading
302
217825646
112898903632844
3,309
12,446.90 3,783.25
34,240.7941,163.3342,574.001,000.00
41,341.5742,921.2326,472.008,852.81
64.6964.69
254,925.26
LIBORLIBORLIBORMIBORMIFORINBMKLIBORMIBORMIFORLIBORLIBORLIBOR
Fixed Receivable v/s Floating PayableFloating Receivable v/s Fixed PayableFixed Receivable v/s Floating PayableFixed Receivable v/s Floating PayableFixed Receivable v/s Floating PayableFloating Receivable v/s Fixed PayableFloating Receivable v/s Fixed PayableFloating Receivable v/s Fixed PayableFloating Receivable v/s Fixed PayableFloating Receivable v/s Floating PayablePay CapReceive Cap
The nature and terms of the IRS as on 31 March, 2019 are set out below: (` in crores)
Nature Nos. Notional Principal Benchmark Terms
HedgingHedgingTradingTradingTradingTradingTradingTradingTradingTradingTradingTradingTrading
3323
25056438018
2855971831644
2,339
12,413.32 1,901.76
175.0036,486.3434,822.6620,724.001,559.00
43,149.7330,858.549,945.003,679.05
106.33111.51
195,932.24
LIBORLIBORINBMKLIBORMIBORMIFORINBMKLIBORMIBORMIFORLIBORLIBORLIBOR
Fixed Receivable v/s Floating PayableFloating Receivable v/s Fixed PayableFixed Receivable v/s Floating PayableFixed Receivable v/s Floating PayableFixed Receivable v/s Floating PayableFixed Receivable v/s Floating PayableFloating Receivable v/s Fixed PayableFloating Receivable v/s Fixed PayableFloating Receivable v/s Fixed Payable Floating Receivable v/s Fixed PayableFloating Receivable v/s Floating PayablePay CapReceive Cap
The nature and terms of the FRA as on 31 March, 2020 are set out below:
Nature Nos. Notional Principal Benchmark Terms
– – – – – – –
The nature and terms of the FRA as on 31 March, 2019 are set out below:
Nature Nos. Notional Principal Benchmark Terms
– – – – – – –
ECO
NOM
IC &
PO
LITI
CAL
WEE
KLY

Registered Offi ce: ‘Trishul’, 3rd fl oor, Opp. Samartheshwar Temple, Law Garden, Ellisbridge, Ahmedabad - 380 006.AXIS BANK LIMITED
18 Notes forming part of the fi nancial statements for the year ended 31 March, 2020 (Currency: In Indian Rupees)
Published on Saturday, JUNE 27, 2020 vol lV nos 26 & 27 EPW Economic & Political Weekly84
The nature and terms of the CCS as on 31 March, 2020 are set out below: (` in crores)
Nature Nos. Notional Principal Benchmark Terms Trading 77 8,094.31 Principal & Coupon Swap Fixed Payable v/s Fixed Receivable Trading 85 8,709.42 LIBOR Fixed Receivable v/s Floating Payable Trading 69 13,381.28 LIBOR Floating Receivable v/s Fixed Payable Trading 29 10,380.16 LIBOR/MIFOR/MIBOR Floating Receivable v/s Floating Payable Trading 38 4,197.61 Principal Only Fixed Receivable Trading 13 1,588.36 Principal Only Fixed Payable 311 46,351.14
The nature and terms of the CCS as on 31 March, 2019 are set out below: (` in crores)
Nature Nos. Notional Principal Benchmark Terms Trading 93 7,416.32 Principal & Coupon Swap Fixed Payable v/s Fixed Receivable Trading 74 7,294.53 LIBOR Fixed Receivable v/s Floating Payable Trading 70 11,333.58 LIBOR Floating Receivable v/s Fixed Payable Trading 13 6,694.33 LIBOR/MIFOR/MIBOR Floating Receivable v/s Floating Payable Trading 48 4,932.27 Principal Only Fixed Receivable Trading 32 3,082.09 Principal Only Fixed Payable 330 40,753.12
Details of Exchange Traded Interest Rate Derivatives for the year ended 31 March, 2020 are set out below: (` in crores)
Sr. No.
Particulars As at 31 March, 2020
i) Notional principal amount of exchange traded interest rate derivatives undertaken during the year
EDM9 – 90 Days Euro Futures – June 2019 TUM9 – 2 years US Note – June 2019FVM9 – 5 years US Note – June 2019TYM9 – 10 years US Note – June 2019TUU9 – 2 years US Note – September 2019FVU9 – 5 years US Note – September 2019TYU9 – 10 years US Note – September 2019TUZ9 – 2 years US Note – December 2019FVZ9 – 5 years US Note – December 2019TYZ9 – 10 years US Note – December 2019TUH0 – 2 years US Note – March 2020FVH0 – 5 years US Note – March 2020TYH0 – 10 years US Note – March 2020TUM0 – 2 years US Note – June 2020FVM0 – 5 years US Note – June 2020TYM0 – 10 years US Note – June 2020EDM0 – 90 Days Euro Futures – June 2020
1,513.301,876.493,238.462,148.891,059.311,436.12
272.39251.21768.76295.09142.25567.49606.8327.24
308.71172.52
1,543.5716,228.63
ii) Notional principal amount of exchange traded interest rate derivatives outstanding as on 31 March, 2020TUM0 – 2 Years US Note – June 2020FVM0 – 5 Years US Note – June 2020TYM0 – 10 Years US Note – June 2020
27.24151.33 142.25320.82
iii) Notional principal amount of exchange traded interest rate derivatives outstanding as on 31 March, 2020 and “not highly effective” N.A.
iv) Mark-to-market value of exchange traded interest rate derivatives outstanding as on 31 March, 2020 and “not highly effective” N.A.
ECO
NOM
IC &
PO
LITI
CAL
WEE
KLY

Registered Offi ce: ‘Trishul’, 3rd fl oor, Opp. Samartheshwar Temple, Law Garden, Ellisbridge, Ahmedabad - 380 006.AXIS BANK LIMITED
18 Notes forming part of the fi nancial statements for the year ended 31 March, 2020 (Currency: In Indian Rupees)
Economic & Political Weekly EPW Published on Saturday, JUNE 27, 2020 vol lV nos 26 & 27 85
Details of Exchange Traded Interest Rate Derivatives for the year ended 31 March, 2019 are set out below: (` in crores)
Sr. No. Particulars As at
31 March, 2019i) Notional principal amount of exchange traded interest rate derivatives undertaken during
the year
717GS2028 – 7.17% GOI 2028 FVM8 – 5 years US Note – June 2018TYM8 – 10 years US Note – June 2018FVU8 – 5 years US Note – September 2018TYU8 – 10 years US Note – September 2018TYZ8 – 10 years US Note – December 2018FVZ8 – 5 years US Note – December 2018EDZ8 – 90 Days Euro Futures – December 2018EDM9 – 90 Days Euro Futures – June 2019TUZ8 – 2 years US Note – December 2018EDZ9 – 90 Days Euro Futures – December 2019TYH9 – 10 years US Note – March 2019FVH9 – 5 Years US Note – March 2019TUH9 – 2 Years US Note – March 2019TUM9 – 2 Years US Note – June 2019FVM9 – 5 Years US Note – June 2019TYM9 – 10 Years US Note – June 2019EDZ0 – 90 Days Euro Futures – December 2020
77.2869.15
345.77459.19
1,136.911,569.821,064.995,532.402,863.02
276.629,681.703,380.307,898.88
926.68110.65
2,636.19207.46
2,766.20
41,003.21
ii) Notional principal amount of exchange traded interest rate derivatives outstanding as on 31 March, 2019FVM9 – 5 Years US Note – June 2019TUM9 – 2 Years US Note – June 2019
818.79 82.99
901.78
iii) Notional principal amount of exchange traded interest rate derivatives outstanding as on 31 March, 2019 and “not highly effective” N.A.
iv) Mark-to-market value of exchange traded interest rate derivatives outstanding as on 31 March, 2019 and “not highly effective” N.A.
The Bank has not undertaken any transactions in Credit Default Swaps (CDS) during the year ended 31 March, 2020 and 31 March, 2019.
2.1.28 Disclosure on risk exposure in Derivatives
Qualitative disclosures: (a) Structure and organisation for management of risk in derivatives trading, the scope and nature of risk measurement, risk reporting
and risk monitoring systems, policies for hedging and/or mitigating risk and strategies and processes for monitoring the continuing effectiveness of hedges/mitigants:Derivatives are fi nancial instruments whose characteristics are derived from an underlying asset, or from interest and exchange rates or indices. The Bank undertakes over the counter and Exchange Traded derivative transactions for Balance Sheet management and also for proprietary trading/market making whereby the Bank offers OTC derivative products to the customers to enable them to hedge their interest rate and currency risks within the prevalent regulatory guidelines.
ECO
NOM
IC &
PO
LITI
CAL
WEE
KLY

Registered Offi ce: ‘Trishul’, 3rd fl oor, Opp. Samartheshwar Temple, Law Garden, Ellisbridge, Ahmedabad - 380 006.AXIS BANK LIMITED
18 Notes forming part of the fi nancial statements for the year ended 31 March, 2020 (Currency: In Indian Rupees)
Published on Saturday, JUNE 27, 2020 vol lV nos 26 & 27 EPW Economic & Political Weekly86
Proprietary trading includes Exchange Traded Currency Options, Interest Rate Futures, Currency Futures and Rupee Interest Rate Swaps under different benchmarks (viz. MIBOR, MIFOR and INBMK), Currency Options and Currency Swap. The Bank also undertakes transactions in Cross Currency Swaps, Principal Only Swaps, Coupon Only Swaps, Currency Option, Interest Rate Swap and Long Term Forex Contracts (LTFX) for hedging its Balance Sheet and also offers them to its customers. These transactions expose the Bank to various risks, primarily credit, market, legal, reputation and operational risk. The Bank has adopted the following mechanism for managing risks arising out of the derivative transactions.There is a functional separation between the Treasury Front Offi ce, Treasury Mid Offi ce and Treasury Back Offi ce to undertake derivative transactions. The customer and interbank related derivative transaction are originated by Derivative sales and Treasury Front Offi ce team respectively which ensures compliance with the trade origination requirements as per the bank’s policy and the RBI guidelines. The Market Risk Group within the Bank’s Risk Department independently identifi es measures and monitors the market risks associated with derivative transactions and apprises the Asset Liability Management Committee (ALCO) and the Risk Management Committee of the Board (RMC) on the compliance with the risk limits. The Treasury Back Offi ce undertakes activities such as trade validation, confi rmation, settlement, ISDA documentation, accounting, valuation and other MIS reporting.The derivative transactions are governed by the Derivative policy, Suitability and Appropriateness Policy for derivative products, Market risk management policy, Hedging policy and the Asset Liability Management (ALM) policy of the Bank as well as by the extant RBI guidelines. The Bank has implemented policy on customer suitability & appropriateness to ensure that derivatives transactions entered into are appropriate and suitable to the customer. The Bank has put in place a detailed process fl ow on documentation for customer derivative transactions for effective management of operational/reputation/compliance risk.Various risk limits are set up and actual exposures are monitored vis-à-vis the limits allocated. These limits are set up taking into account market volatility, risk appetite, business strategy and management experience. Risk limits are in place for risk parameters viz. PV01, VaR, Stop Loss, Delta, Gamma and Vega. Actual positions are monitored against these limits on a daily basis and breaches, if any, are dealt with in accordance with board approved Risk Appetite Statement. Risk assessment of the portfolio is undertaken periodically. The Bank ensures that the Gross PV01 (Price value of a basis point) position arising out of all non-option rupee derivative contracts are within 0.25% of net worth of the Bank as on Balance Sheet date.Hedging transactions are undertaken by the Bank to protect the variability in the fair value or the cash fl ow of the underlying Balance Sheet item. These deals are accounted on an accrual basis except the swap designated with an asset/liability that is carried at market value or lower of cost or market value. In that case, the swap is marked to market with the resulting gain or loss recorded as an adjustment to the market value of designated asset or liability. These transactions are tested for hedge effectiveness and in case any transaction fails the test, the same is re-designated as a trading deal and appropriate accounting treatment is followed.
(b) Accounting policy for recording hedge and non-hedge transactions, recognition of income, premiums and discounts, valuation of outstanding contractsThe Hedging Policy of the Bank governs the use of derivatives for hedging purpose. Subject to the prevailing RBI guidelines, the Bank deals in derivatives for hedging fi xed rate and fl oating rate coupon or foreign currency assets/liabilities. Transactions for hedging and market making purposes are recorded separately. For hedge transactions, the Bank identifi es the hedged item (asset or liability) at the inception of the transaction itself. The effectiveness is ascertained at the time of inception of the hedge and periodically thereafter. Hedge derivative transactions are accounted for in accordance with the hedge accounting principles. Derivatives for market making purpose are marked to market and the resulting gain/loss is recorded in the Profi t and Loss Account. The premium on option contracts is accounted for as per FEDAI guidelines. Derivative transactions are covered under International Swaps and Derivatives Association (ISDA) master agreements with respective counterparties. The exposure on account of derivative transactions is computed as per the RBI guidelines and is marked against the credit limits approved for the respective counterparties.
(c) Provisioning, collateral and credit risk mitigationDerivative transactions comprise of swaps, FRAs, futures, forward contracts and options which are disclosed as contingent liabilities. Trading swaps/FRAs/futures/options/forward contracts are revalued at the Balance Sheet date with the resulting unrealised gain or loss being recognised in the Profi t and Loss Account and correspondingly in other assets or other liabilities respectively. Hedged swaps are accounted for as per the RBI guidelines. In accordance with RBI guidelines, any receivables (crystallised receivables and positive MTM) under derivatives contracts, which remain overdue for more than 90 days, are reversed through the Profi t and Loss Account and are held in a separate Suspense account. Collateral requirements for derivative transactions are laid down as part of credit sanction terms on a case by case basis. Such collateral requirements are determined, based on usual credit appraisal process. The Bank retains the right to terminate transactions as a risk mitigation measure in certain cases.The credit risk in respect of customer derivative transactions is sought to be mitigated through a laid down policy on sanction of Loan Equivalent Risk (LER) limits, monitoring mechanism for LER limits and trigger events for escalation/margin calls/termination.
ECO
NOM
IC &
PO
LITI
CAL
WEE
KLY

Registered Offi ce: ‘Trishul’, 3rd fl oor, Opp. Samartheshwar Temple, Law Garden, Ellisbridge, Ahmedabad - 380 006.AXIS BANK LIMITED
18 Notes forming part of the fi nancial statements for the year ended 31 March, 2020 (Currency: In Indian Rupees)
Economic & Political Weekly EPW Published on Saturday, JUNE 27, 2020 vol lV nos 26 & 27 87
Quantitative disclosure on risk exposure in derivatives1: (` in crores) As at 31 March, 2020 Currency Derivatives Interest rate Derivatives Sr. Particulars Forward CCS Options No. Contracts4
1 Derivatives (Notional Principal Amount) a) For hedging 43,612.28 – – 16,230.14 b) For trading 412,366.46 46,351.14 45,114.10 238,695.12 2 Marked to Market Positions2 a) Asset (+) 7,665.93 3,077.72 1,676.86 3,692.90 b) Liability (-) (7,228.49) (2,169.87) (1,620.33) (4,428.26) 3 Credit Exposure3 21,166.53 7,811.75 1,373.69 6,428.92 4 Likely impact of one percentage change in interest rate (100*PV01) (as at 31 March, 2020) a) on hedging derivatives 12.33 – – 1.32 b) on trading derivatives 12.31 5.77 13.02 52.98 5 Maximum and Minimum of 100*PV01 observed during the year a) on hedging i) Minimum 3.94 – – 1.27 ii) Maximum 12.33 – – 31.49 b) on Trading i) Minimum 0.30 2.25 10.67 52.33 ii) Maximum 12.31 10.79 57.72 68.11 1. only Over The Counter derivatives included 2. only on trading derivatives 3. includes accrued interest 4. excluding Tom/Spot contracts
(` in crores) As at 31 March, 2019 Currency Derivatives Interest rate Derivatives Sr. Particulars Forward CCS Options No. Contracts4 1 Derivatives (Notional Principal Amount) a) For hedging 56,970.61 – – 14,315.09 b) For trading 272,683.15 40,753.12 46,404.77 181,617.15 2 Marked to Market Positions2 a) Asset (+) 3,764.51 2,698.28 1,485.72 1,509.36 b) Liability (-) (3,907.80) (1,222.94) (1,425.22) (2,146.16) 3 Credit Exposure3 13,477.22 6,709.64 1,603.96 3,743.38 4 Likely impact of one percentage change in interest rate (100*PV01) (as at 31 March, 2019) a) on hedging derivatives 3.81 – – 49.80 b) on trading derivatives 8.76 2.56 298.94 57.93 5 Maximum and Minimum of 100*PV01 observed during the year a) on hedging i) Minimum 1.02 – – 29.67 ii) Maximum 12.34 – – 60.55 b) on Trading i) Minimum 0.56 2.46 20.91 53.63 ii) Maximum 8.76 5.71 306.14 78.97
1. only Over The Counter derivatives included 2. only on trading derivatives 3. includes accrued interest 4. excluding Tom/Spot contracts
The outstanding notional principal amount of Exchange Traded Currency Options as at 31 March, 2020 was Nil (previous year Nil) and the mark-to-market value was Nil (previous year Nil).
ECO
NOM
IC &
PO
LITI
CAL
WEE
KLY
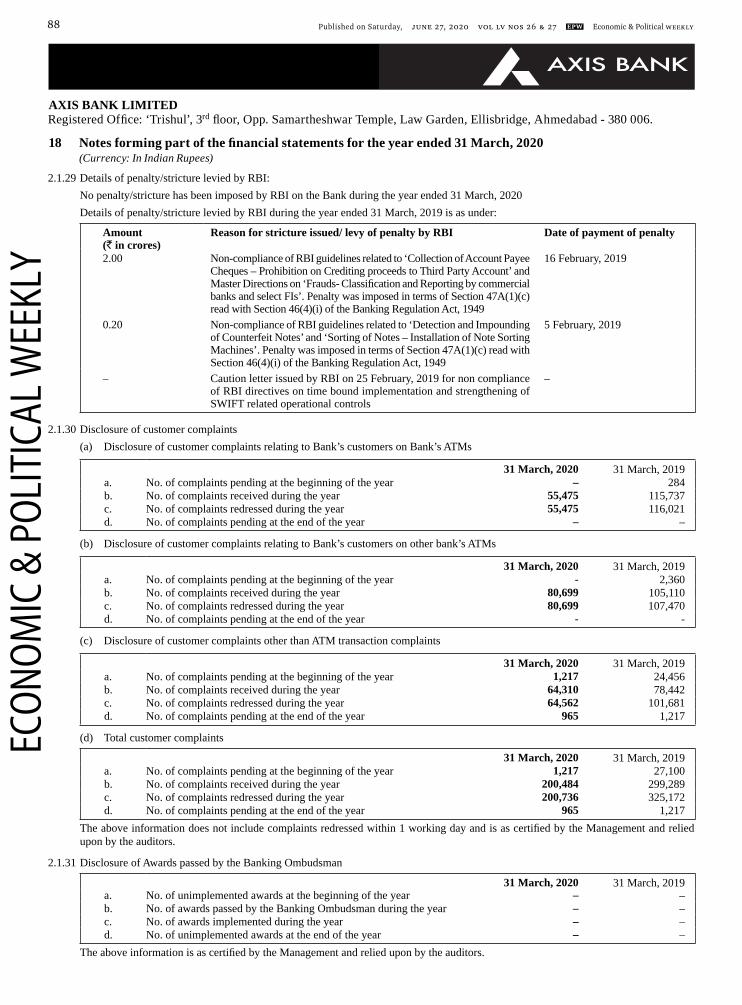
Registered Offi ce: ‘Trishul’, 3rd fl oor, Opp. Samartheshwar Temple, Law Garden, Ellisbridge, Ahmedabad - 380 006.AXIS BANK LIMITED
18 Notes forming part of the fi nancial statements for the year ended 31 March, 2020 (Currency: In Indian Rupees)
Published on Saturday, JUNE 27, 2020 vol lV nos 26 & 27 EPW Economic & Political Weekly88
2.1.29 Details of penalty/stricture levied by RBI:No penalty/stricture has been imposed by RBI on the Bank during the year ended 31 March, 2020Details of penalty/stricture levied by RBI during the year ended 31 March, 2019 is as under:
Amount (` in crores)
Reason for stricture issued/ levy of penalty by RBI Date of payment of penalty
2.00 Non-compliance of RBI guidelines related to ‘Collection of Account Payee Cheques – Prohibition on Crediting proceeds to Third Party Account’ and Master Directions on ‘Frauds- Classifi cation and Reporting by commercial banks and select FIs’. Penalty was imposed in terms of Section 47A(1)(c) read with Section 46(4)(i) of the Banking Regulation Act, 1949
16 February, 2019
0.20 Non-compliance of RBI guidelines related to ‘Detection and Impounding of Counterfeit Notes’ and ‘Sorting of Notes – Installation of Note Sorting Machines’. Penalty was imposed in terms of Section 47A(1)(c) read with Section 46(4)(i) of the Banking Regulation Act, 1949
5 February, 2019
– Caution letter issued by RBI on 25 February, 2019 for non compliance of RBI directives on time bound implementation and strengthening of SWIFT related operational controls
–
2.1.30 Disclosure of customer complaints (a) Disclosure of customer complaints relating to Bank’s customers on Bank’s ATMs
31 March, 2020 31 March, 2019a. No. of complaints pending at the beginning of the year – 284b. No. of complaints received during the year 55,475 115,737c. No. of complaints redressed during the year 55,475 116,021d. No. of complaints pending at the end of the year – –
(b) Disclosure of customer complaints relating to Bank’s customers on other bank’s ATMs
31 March, 2020 31 March, 2019a. No. of complaints pending at the beginning of the year - 2,360b. No. of complaints received during the year 80,699 105,110c. No. of complaints redressed during the year 80,699 107,470d. No. of complaints pending at the end of the year - -
(c) Disclosure of customer complaints other than ATM transaction complaints
31 March, 2020 31 March, 2019a. No. of complaints pending at the beginning of the year 1,217 24,456b. No. of complaints received during the year 64,310 78,442c. No. of complaints redressed during the year 64,562 101,681d. No. of complaints pending at the end of the year 965 1,217
(d) Total customer complaints
31 March, 2020 31 March, 2019a. No. of complaints pending at the beginning of the year 1,217 27,100b. No. of complaints received during the year 200,484 299,289c. No. of complaints redressed during the year 200,736 325,172d. No. of complaints pending at the end of the year 965 1,217
The above information does not include complaints redressed within 1 working day and is as certifi ed by the Management and relied upon by the auditors.
2.1.31 Disclosure of Awards passed by the Banking Ombudsman
31 March, 2020 31 March, 2019a. No. of unimplemented awards at the beginning of the year – –b. No. of awards passed by the Banking Ombudsman during the year – –c. No. of awards implemented during the year – –d. No. of unimplemented awards at the end of the year – –
The above information is as certifi ed by the Management and relied upon by the auditors.
ECO
NOM
IC &
PO
LITI
CAL
WEE
KLY

Registered Offi ce: ‘Trishul’, 3rd fl oor, Opp. Samartheshwar Temple, Law Garden, Ellisbridge, Ahmedabad - 380 006.AXIS BANK LIMITED
18 Notes forming part of the fi nancial statements for the year ended 31 March, 2020 (Currency: In Indian Rupees)
Economic & Political Weekly EPW Published on Saturday, JUNE 27, 2020 vol lV nos 26 & 27 89
2.1.32 Draw Down from Reserves
During the year ended 31 March, 2020 the Bank has not undertaken any draw from reserves, except towards issue expenses incurred for equity raising through Qualifi ed Institutional Placement and conversion of share warrants, which has been adjusted against the share premium account.
During the year ended 31 March, 2019 the Bank has made a draw down out of the Investment Reserve account towards depreciation on investments in AFS and HFT categories in terms of RBI guidelines.
2.1.33 Letter of Comfort
The Bank has not issued any Letter of Comfort on behalf of its subsidiaries during the current and previous year.2.1.34 Disclosure on Remuneration Qualitative disclosures a) Information relating to the bodies that oversee remuneration: Name, composition and mandate of the main body overseeing remuneration:
The Nomination and Remuneration Committee of the Board oversees the framing, review and implementation of the compensation policy of the Bank on behalf of the Board. The Committee works in close co-ordination with the Risk Management Committee of the Bank, in order to achieve effective alignment between remuneration and risks.As at 31 March, 2020, the Nomination and Remuneration Committee comprises of the following Non-Executive Directors:1. Shri Rohit Bhagat - Chairman2. Shri Rakesh Makhija 3. Shri Stephen PagliucaIn respect of Remuneration/HR matters, the Nomination and Remuneration Committee of the Board, functions with the following main objectives:a. Review and recommend to the Board for approval, the overall remuneration framework and associated policy of the Bank
(including remuneration policy for Directors and key managerial personnel) including the level and structure of fi xed pay, variable pay, perquisites, bonus pool, stock-based compensation and any other form of compensation as may be included from time to time to all the employees of the Bank including the Managing Director & CEO (MD & CEO), other Whole-Time Directors (WTD) and senior managers one level below the Board.
b. Recommend to the Board the compensation payable to the Chairman of the Bank.c. Review and recommend to the Board for approval, the talent management and succession policy and process in the Bank
for ensuring business continuity, especially at the level of MD & CEO, the other WTDs, senior managers’ one level below the Board and other key roles and their progression to the Board.
d. Formulate the criteria and the manner for effective evaluation of performance of the Board as a whole, its Committees and individual directors, including independent directors of the Bank, which may be carried out either by the Committee or by the Board or with the help of an independent external agency and to review its implementation, compliance and outcomes.
e. Set the goals, objectives and performance benchmarks for the Bank and for MD & CEO, WTDs and Group Executives for the fi nancial year and over the medium to long term. Review adequacy and appropriateness of HR strategy of the Bank in the broader areas of code of conduct, ethics, confl ict of interest, succession planning, talent management, performance management, remuneration and HR risk management.
f. Review and recommend to the Board for approval: the creation of new positions one level below MD & CEO appointments, promotions and exits of senior managers one level below the MD & CEO
g. Set the goals, objectives and performance benchmarks for the Bank and for MD & CEO, WTDs and Group Executives for the fi nancial year and over the medium to long term.
h. Review the performance of the MD & CEO and other WTDs at the end of each year. i. Perform such other duties as may be required to be done under any law, statute, rules, regulations etc. enacted by
Government of India, Reserve Bank of India or by any other regulatory or statutory body. External consultants whose advice has been sought, the body by which they were commissioned, and in what areas of
the remuneration process:The Nomination and Remuneration Committee has commissioned Aon Hewitt, a globally renowned compensation benchmarking fi rm, to conduct market benchmarking of employee compensation. The Bank participates in the salary benchmarking survey conducted by Aon Hewitt every year. Aon Hewitt collects data from multiple private sector peer banks across functions, levels and roles which is then used by the Bank to assess market competitiveness of remuneration offered to Bank employees.
ECO
NOM
IC &
PO
LITI
CAL
WEE
KLY
Registered Offi ce: ‘Trishul’, 3rd fl oor, Opp. Samartheshwar Temple, Law Garden, Ellisbridge, Ahmedabad - 380 006.AXIS BANK LIMITED
18 Notes forming part of the fi nancial statements for the year ended 31 March, 2020 (Currency: In Indian Rupees)
Published on Saturday, JUNE 27, 2020 vol lV nos 26 & 27 EPW Economic & Political Weekly90
A description of the scope of the Bank’s remuneration policy, including the extent to which it is applicable to foreign subsidiaries and branches:The Committee monitors the remuneration policy for both domestic and overseas branches of the Bank on behalf of the Board. However, it does not oversee the compensation policy for subsidiaries of the Bank.
A description of the type of employees covered and number of such employees:Employees are categorised into following three categories from remuneration structure and administration standpoint:Category 1MD & CEO and WTDs. This category includes 4 employees.Category 2All the employees in the Grade of Vice President and above engaged in the functions of Risk Control and Compliance. This category includes 34 employees.Category 3: Other Staff‘Other Staff’ has been defi ned as a “group of employees who pose a material risk”. This category includes all the employees of the Bank in the grade of Executive Vice President (EVP) and above and also few other key business roles in case they are below the grade of Executive Vice President. This category includes 46 employees.
b) Information relating to the design and structure of remuneration processes: An overview of the key features and objectives of remuneration policy:
The compensation philosophy of the Bank aims to attract, retain and motivate professionals in order to enable the Bank to attain its strategic objectives and develop a strong performance culture in the competitive environment in which it operates. To achieve this, the following principles are adopted: – Affordability: Pay to refl ect productivity improvements to retain cost-income competitiveness – Maintain competitiveness on fi xed pay in talent market – Pay for performance to drive meritocracy through variable pay – Employee Stock Options for long-term value creation – Benefi ts and perquisites to remain aligned with market practices and provide fl exibility Apart from the above, the compensation structure for MD & CEO and WTDs is aligned to RBI’s guidelines for sound compensation practices (effective FY 2012-13) and addresses the general principles of: – Effective and independent governance and monitoring of compensation– Alignment of compensation with prudent risk-taking through well designed and consistent compensation structures– Clear and timely disclosure to facilitate supervisory oversight by all stakeholdersAccordingly, the compensation policy for MD & CEO and WTDs seeks to:a) Ensure that the compensation, in terms of structure and total amount, is in line with the best practices, as well as competitive
vis-à-vis that of peer banksb) Establish the linkage of compensation with individual performance as well as achievement of the corporate objectives of
the Bankc) Include an appropriate variable pay component tied to the achievement of pre-established objectives in line with Bank’s
scorecard while ensuring that the compensation is aligned with prudent risk takingd) Encourage attainment of long term shareholder returns through inclusion of equity linked long-term incentives as part of
compensationCompensation is structured in terms of fi xed pay, variable pay and employee stock options (for selective employees), with a strong linkage of variable pay to performance. The compensation policy of the Bank is approved by the Nomination and Remuneration Committee. Additional approval from Shareholders and RBI is obtained specifi cally for compensation of MD & CEO and WTDs.
Whether the remuneration committee reviewed the fi rm’s remuneration policy during the past year, and if so, an overview of any changes that were made:There were no changes made in the remuneration policy for FY 2019-20.
A discussion of how the Bank ensures that risk and compliance employees are remunerated independently of the businesses they oversee:The Bank ensures that risk and compliance employees are remunerated independently of the businesses they oversee and is guided by the individual employee performance. The remuneration is determined on the basis of relevant risk measures included in the Balanced Scorecard / key deliverables of staff in these functions. The parameters reviewed for performance based rewards are independent of performance of the business area they oversee and commensurate with their individual role in the Bank. Additionally, the ratio of fi xed and variable compensation is weighed towards fi xed compensation.
ECO
NOM
IC &
PO
LITI
CAL
WEE
KLY

Registered Offi ce: ‘Trishul’, 3rd fl oor, Opp. Samartheshwar Temple, Law Garden, Ellisbridge, Ahmedabad - 380 006.AXIS BANK LIMITED
18 Notes forming part of the fi nancial statements for the year ended 31 March, 2020 (Currency: In Indian Rupees)
Economic & Political Weekly EPW Published on Saturday, JUNE 27, 2020 vol lV nos 26 & 27 91
c) Description of the ways in which current and future risks are taken into account in the remuneration processes: An overview of the key risks that the Bank takes into account when implementing remuneration measures:
The business activity of the Bank is undertaken within the limits of the following risk measures to achieve the fi nancial plan. The Financial Perspective in the Bank’s BSC contains metrics pertaining to growth, profi tability and asset quality. These metrics along with other metrics in customer, internal process and compliance and people perspective are taken into account while arriving at the remuneration decisions. The metrics on internal process and compliance ensure due weightage to non- fi nancial risk that bank may be exposed to.
An overview of the nature and type of key measures used to take account of these risks, including risk diffi cult to measure:The Bank has a robust system of measuring and reviewing these risks. The risk parameters are a part of the Balanced Scorecard used for setting of performance objectives and for measuring performance which includes, besides fi nancial performance, adherence to internal processes, compliance and people perspectives. Weightage is placed on not only fi nancial or quantitative achievement of objectives but also on qualitative aspects detailing how the objectives were achieved.
A discussion of the ways in which these measures affect remuneration:The relevant risk measures are included in the scorecards of MD & CEO and WTDs. Inclusion of the above mentioned measures ensures that performance parameters are aligned to risk measures at the time of performance evaluation. The Nomination and Remuneration Committee takes into consideration all the above aspects while assessing organisational and individual performance and making compensation related recommendations to the Board.
A discussion of how the nature and type of these measures have changed over the past year and reasons for the changes, as well as the impact of changes on remuneration:The Bank continued to track key metrics across fi nancial, customer, internal process and compliance and people perspective as part of FY20 BSC. During FY2019-20, metrics on digitizing customer journeys and strengthening of internal processes were incorporated to reinforce focus on delivering superior customer experience. Further, critical deliverables were included to drive progress on the Bank’s GPS strategy.
d) Description of the ways in which the Bank seeks to link performance during a performance measurement period with levels of remuneration:The Bank’s performance management and compensation philosophies are structured to support the achievement of the Bank’s on-going business objectives by rewarding achievement of objectives linked directly to its strategic business priorities. These strategic priorities are cascaded through annualised objectives to the employees. The Bank follows the Balanced Scorecard approach in designing its performance management system. Adequate attention is given to the robust goal setting process to ensure alignment of individual objectives to support the achievement of business strategy, fi nancial and non-fi nancial goals across and through the organisation. The non-fi nancial goals for employees includes customer service, process improvement, adherence to risk and compliance norms, operations and process control, learning and knowledge development.
An overview of main performance metrics for Bank, top level business lines and individuals:The Bank follows a Balanced Scorecard approach for measuring performance for the Bank, top business lines and individuals. The approach broadly comprises fi nancial, customer, internal processes, compliance, and people perspectives and includes parameters on revenue and profi tability, business growth, customer initiatives, operational effi ciencies, regulatory compliance, risk management and people management.
A discussion of how amounts of individual remuneration are linked to the Bank-wide and individual performance:The Bank’s remuneration practices are underpinned by principles of meritocracy and fairness. The remuneration system strives to maintain the ability to attract, retain, reward and motivate the talent in order to enable the Bank to attain its strategic objectives within the increasingly competitive context in which it operates. The Bank’s pay-for-performance approach strives to ensure both internal and external equity in line with emerging market trends. However, the business model and affordability form the overarching boundary conditions.The Bank follows a Balanced Scorecard approach for measuring performance at senior levels. The Balanced Scorecard parameters for individuals are cascaded from the Bank’s Balanced Scorecard. The Management Committee or the Nomination and Remuneration Committee reviews the achievements against the set of parameters which determines the performance of the individuals. For all other employees, performance appraisals are conducted annually and initiated by the employee with self-appraisal. The immediate supervisor reviews the appraisal ratings in a joint consultation meeting with the employee and assigns the performance rating. The fi nal ratings are discussed by a Moderation Committee comprising of senior offi cials of the Bank. Both relative and absolute individual performances are considered for the moderation process. Individual fi xed pay increases, variable pay and ESOPs are linked to the fi nal performance ratings.
A discussion of the measures the Bank will in general implement to adjust remuneration in the event that performance metrics are weak:In cases where the performance metrics are weak or not well defi ned to measure the performance effectively, the Bank uses discretion to reward such employees. The remuneration is then infl uenced by the operational performance parameters of the Bank along with individual performance achievement.
ECO
NOM
IC &
PO
LITI
CAL
WEE
KLY

Registered Offi ce: ‘Trishul’, 3rd fl oor, Opp. Samartheshwar Temple, Law Garden, Ellisbridge, Ahmedabad - 380 006.AXIS BANK LIMITED
18 Notes forming part of the fi nancial statements for the year ended 31 March, 2020 (Currency: In Indian Rupees)
Published on Saturday, JUNE 27, 2020 vol lV nos 26 & 27 EPW Economic & Political Weekly92
Whilst determining fi xed and variable remuneration, relevant risk measures are included in scorecards of senior employees. The Financial Perspective in the Bank’s BSC contains metrics pertaining to growth, profi tability and asset quality. These metrics along with other metrics in customer, internal process and compliance and people perspective are taken into account while arriving at the remuneration decisions. The metrics on internal process and compliance ensure due weightage to non- fi nancial risk that bank may be exposed to.As a prudent measure, a portion of variable pay if it exceeds a certain threshold is deferred and is paid proportionately over a period of 3 years. The deferred variable pay amount of reference year would be held back in case of any misrepresentation or gross inaccuracy resulting in a wrong risk assessment.
e) Description of the ways in which the Bank seeks to adjust remuneration to take account of the longer term performance: A discussion of the Bank’s policy on deferral and vesting of variable remuneration and, if the fraction of variable
remuneration that is deferred differs across employees or groups of employees, a description of the factors that determine the fraction and their relative importance:
The deferral of the Variable Pay for the three categories of employees as stated earlier is given below:Category 1: MD & CEO and WTDsVariable Pay will not exceed 70% of the Fixed Pay To ensure that risk measures do not focus only on achieving short term goals, variable payout is deferred. If the variable pay exceeds 40% of fi xed pay, 45% of the variable pay to be deferred proportionately over a period of three years.Category 2: All the employees in the Grade of Vice President and above engaged in the functions of Risk Control and Compliance
– Variable Pay will be paid on the basis of laid down risk control, compliance and process improvement parameters in the balanced scorecard / key deliverables of staff in this function
– The parameters will be independent of performance of the business area they oversee and will commensurate with their key role in the Bank
– The ratio of fi xed and variable compensation will be weighed towards fi xed compensation – Percentage of variable pay to be capped at 70% of fi xed pay – Appropriate deferral structure as approved by the Nomination and Remuneration Committee will be applicable to this
category of employees Category 3: Other Staff – Variable Pay will be paid on the basis of performance against key deliverables and overall business performance for the
fi nancial year – Percentage of variable pay to be capped at 70% of fi xed pay – Appropriate deferral structure as approved by the Nomination and Remuneration Committee will be applicable to this
category of employees A discussion of the Bank’s policy and criteria for adjusting deferred remuneration before vesting and (if permitted by
national law) after vesting through claw back arrangements: The deferred portion of the variable pay may be delayed in the event of an enquiry determining gross negligence or breach of integrity. The deferred portion is withheld by the Bank till the completion of such enquiries, if any. As a result, no claw back arrangements are made on the deferred portion of the variable pay.
f) Description of the different forms of variable remuneration that the Bank utilizes and the rationale for using these different forms: An overview of the forms of variable remuneration offered: Variable Pay: Variable Pay is linked to corporate performance, business performance and individual performance and
ensures differential pay based on the performance levels of employees Employee Stock Options (ESOPs): ESOPs are given to selective set of employees at senior levels based on their level of
performance and role. ESOP scheme has an inbuilt deferred vesting design which helps in directing long term performance orientation among employees
A discussion of the use of different forms of variable remuneration and, if the mix of different forms of variable remuneration differs across employees or group of employees, a description of the factors that determine the mix and their relative importance: Variable pay in the form of performance based bonus is paid out annually and is linked to performance achievement against balanced performance measures and aligned with the principles of meritocracy. The proportion of variable pay in total pay shall be higher at senior management levels. The payment of all forms of variable pay is governed by the affordability of the Bank and based on profi tability and cost income ratios. At senior management levels (and for certain employees with potential to cause material impact on risk exposure), a portion of variable compensation may be paid out in a deferred manner in order to drive prudent behaviour as well as long term & sustainable performance orientation. Long term variable pay is administered in the form of ESOPs with an objective of enabling employee participation in the business as an active stakeholder and to usher in an ‘owner-manager’ culture. The quantum of grant of stock options is determined and approved by the Nomination and Remuneration Committee, in terms of the said Regulations and in line with best practices, subject to the approval of RBI. The current ESOP design has an inbuilt deferral intended to spread and manage risk.
ECO
NOM
IC &
PO
LITI
CAL
WEE
KLY

Registered Offi ce: ‘Trishul’, 3rd fl oor, Opp. Samartheshwar Temple, Law Garden, Ellisbridge, Ahmedabad - 380 006.AXIS BANK LIMITED
18 Notes forming part of the fi nancial statements for the year ended 31 March, 2020 (Currency: In Indian Rupees)
Economic & Political Weekly EPW Published on Saturday, JUNE 27, 2020 vol lV nos 26 & 27 93
Quantitative disclosures a) The quantitative disclosures pertaining to the MD & CEO, Whole Time Directors and other risk takers for the year ended 31
March, 2020 and 31 March, 2019 are given below. Other risk takers include all employees in the grade of Executive Vice President (EVP) and above and also cover certain select roles in case they are below the grade of EVP.
31 March, 2020 31 March, 2019a. i) Number of meetings held by the Remuneration Committee
(main body overseeing remuneration) during the fi nancial year 6 16ii) Remuneration paid to its members (sitting fees) `12,00,000 `29,50,000
b. Number of employees having received a variable remuneration award during the fi nancial year 36* 29*
c. Number and total amount of sign-on awards made during the fi nancial year N.A. N.A.d. Number and total amount of guaranteed bonus awarded during the fi nancial
year, if any N.A. N.A.e. Details of severance pay, in addition to accrued benefi ts, if any N.A. N.A.f. Total amount of outstanding deferred remuneration, split into cash, shares and
share-linked instruments and other forms - -g. Total amount of deferred remuneration paid out in the fi nancial year Nil `0.34 croresh. Breakdown of amount of remuneration awards for the fi nancial year to show
fi xed and variable, deferred and non-deferred, different forms usedFixed -
`66.53 crores#Fixed -
`49.80 crores#
Variable - `14.23 crores*
Variable - `9.41 crores*
Deferred – Nil Deferred – NilNon-deferred - `14.23 crores*
Non-deferred - `9.41 crores*
Number of stock options granted
during the fi nancial year – 3,718,000
Number of stock options granted
during the fi nancial year – 2,479,000
i. Total amount of outstanding deferred remuneration and retained remuneration exposed to ex-post explicit and/or implicit adjustments N.A. N.A.
j. Total amount of reductions during the fi nancial year due to ex-post explicit adjustments N.A. N.A.
k. Total amount of reductions during the fi nancial year due to ex-post implicit adjustments N.A. N.A.
* pertains to FY 2018-19 paid to MD & CEO, WTDs and other risk takers (previous years pertains to FY 2016-17 paid to MD & CEO and WTDs and for FY 2017-18 paid to other risk takers)# Fixed Remuneration includes basic salary, fi xed allowance, leave fare concession, house rent allowance, super annuation allowance, certain other allowances, gratuity payout, leave encashment and contribution towards provident fund and superannuation fund. Payments in nature of reimbursements have been excluded from fi xed remuneration.
b) Disclosure for compensation of Non-executive Directors (Except Part-time Chairman): (` in crores)
31 March, 2020 31 March, 2019 a. Amount of remuneration paid during the year (pertains to preceding year) 0.95 –
2.1.35 The details of fees / brokerage earned in respect of insurance broking, agency and bancassurance business undertaken by the Bank are as under: (` in crores)
Sr. No. Nature of Income 31 March, 2020 31 March, 2019 1. For selling life insurance policies 692.02 640.50 2. For selling non-life insurance policies 76.17 68.62 3. For selling mutual fund products 291.94 416.09 4. Others (wealth advisory, RBI and other bonds etc.) 57.07 99.11 Total 1,117.20 1,224.32
ECO
NOM
IC &
PO
LITI
CAL
WEE
KLY

Registered Offi ce: ‘Trishul’, 3rd fl oor, Opp. Samartheshwar Temple, Law Garden, Ellisbridge, Ahmedabad - 380 006.AXIS BANK LIMITED
18 Notes forming part of the fi nancial statements for the year ended 31 March, 2020 (Currency: In Indian Rupees)
Published on Saturday, JUNE 27, 2020 vol lV nos 26 & 27 EPW Economic & Political Weekly94
2.1.36 The Bank has not sponsored any special purpose vehicle which is required to be consolidated in the consolidated fi nancial statements as per accounting norms.
2.1.37 Amount of total assets, non-performing assets and revenue of overseas branches is given below: (` in crores)
Particulars 31 March, 2020 31 March, 2019
Total assets 53,673.52 47,941.15
Total NPAs 4,420.07 3,727.06
Total revenue 2,058.04 3,416.09
2.1.38 During the years ended 31 March, 2020 and 31 March, 2019 the value of sales/transfers of securities to/from HTM category (excluding one-time transfer of securities and sales to RBI under OMO auctions) did not exceed 5% of the book value of investments held in HTM category at the beginning of the year.
2.1.39 Disclosure on transfers to Depositor Education and Awareness Fund (DEAF)(` in crores)
Particulars 31 March, 2020 31 March, 2019
Opening balance of amounts transferred to DEAF 161.53 97.14
Add : Amounts transferred to DEAF during the year 73.92 66.85
Less : Amounts reimbursed by DEAF towards claims (2.94)* (2.46)*
Closing balance of amounts transferred to DEAF 232.51 161.53
*includes `0.38 crores (previous year `0.16 crores) of claim raised and pending settlement with RBI
2.1.40 Disclosure on Intra-Group Exposures(` in crores)
Particulars 31 March, 2020 31 March, 2019
Total amount of intra-group exposures 3,377.94 6,895.64
Total amount of top-20 intra-group exposures 3.377.89 6,895.64
Percentage of intra-group exposures to total exposure of the Bank on borrowers/customers 0.31 0.85
During the years ended 31 March, 2020 and 31 March, 2019, the intra-group exposures were within the limits specifi ed by RBI.The above information is as certifi ed by the Management and relied upon by the auditors.
2.1.41 Unhedged Foreign Currency Exposure
The Bank’s Corporate Credit Policy lays down the framework to manage credit risk arising out of unhedged foreign currency exposures of the borrowers. Both at the time of initial approval as well as subsequent reviews/renewals, the assessment of credit risk arising out of foreign currency exposure of the borrowers include details of imports, exports, repayments of foreign currency borrowings, as well as hedges done by the borrowers or naturally enjoyed by them vis-a-vis their intrinsic fi nancial strength, history of hedging and losses arising out of foreign currency volatility. The extent of hedge/cover required on the total foreign currency exposure including natural hedge and hedged positions, is guided through a matrix of internal ratings. The hedging policy is applicable for existing as well as new clients with foreign currency exposures above a predefi ned threshold. The details of un-hedged foreign currency exposure of customers for transactions undertaken through the Bank are monitored periodically. The Bank also maintains additional provision and capital, in line with RBI guidelines.
During the year ended 31 March, 2020, the Bank made write back of provision of `10.68 crores (previous year provision made of `18.79 crores) towards un-hedged foreign currency exposures. As on 31 March, 2020, the Bank held cumulative provision towards un-hedged foreign currency exposures of `120.21 crores (previous year `130.89 crores).
As on 31 March, 2020, the Bank held incremental capital of `490.15 crores (previous year `191.52 crores) towards borrowers having un-hedged foreign currency exposures.
ECO
NOM
IC &
PO
LITI
CAL
WEE
KLY

Registered Offi ce: ‘Trishul’, 3rd fl oor, Opp. Samartheshwar Temple, Law Garden, Ellisbridge, Ahmedabad - 380 006.AXIS BANK LIMITED
18 Notes forming part of the fi nancial statements for the year ended 31 March, 2020 (Currency: In Indian Rupees)
Economic & Political Weekly EPW Published on Saturday, JUNE 27, 2020 vol lV nos 26 & 27 95
2.1.42 Disclosure on provisioning pertaining to fraud accounts (` in crores)
Particulars 31 March, 2020 31 March, 2019 Number of frauds reported during the year** 52 145 Amounts involved 2,030.60 529.04 Provisions held at the beginning of the year 752.23 353.96 Provisions made during the year 1,272.93 172.45 Balance held in interest capitalisation accounts 5.44 2.63 Provisions held at the end of the year 2,030.60 529.04 Unamortised provision debited from ‘other reserves’ as at the end of the year – –
disclosure covers only frauds relating to advances** excluding 72 cases (previous year 22 cases) amounting to `2,515.37 crores (previous year `540.46 crores) reported as fraud during the year and subsequently prudentially written off within the fi nancial year
2.1.43 Disclosure on provisioning pertaining to Land held under ‘Non-Banking assets acquired in satisfaction of claims’ (` in crores) Particulars 31 March, 2020 31 March, 2019 Amount of Land held under ‘Non-Banking assets acquired in satisfaction of claims’* 2,068.24 2,208.61 Provisions made during the year by debiting profi t and loss account 1,605.28 603.33 Provisions reversed during the year* (140.37) – Provisions held at the end of the year by debiting profi t and loss account 2,068.24 603.33 Unamortised provision debited from ‘Balance in profi t and loss account’ under ‘Reserves and Surplus’ – 1,605.28
*during the year Bank sold a parcel of land with a book value of `140.37 crores2.1.44 Detail of Priority Sector Lending Certifi cates (PSLC) purchased by the Bank are set out below: (` in crores) Category 31 March, 2020 31 March, 2019 PSLC – Small & Micro Farmers 23,830.00 – PSLC – General 9,900.00 17,470.00 PSLC – Micro Enterprises 8,790.50 2,375.00 PSLC – Agriculture 5,800.00 – Total 48,320.50 19,845.00
Details of PSLCs sold by the Bank are set out below: (` in crores) Category 31 March, 2020 31 March, 2019 PSLC – General 44,320.00 385.00 PSLC – Micro Enterprises 4,000.00 – Total 48,320.00 385.002.1.45 Disclosure on Liquidity Coverage Ratio
Qualitative disclosureThe Bank has adopted the Basel III framework on liquidity standards as prescribed by RBI and has put in place requisite systems and processes to enable periodical computation and reporting of the Liquidity Coverage Ratio (LCR). The mandated regulatory threshold is embedded into the Risk Appetite Statement of the Bank thus subjecting LCR maintenance to Board oversight and periodical review. The Bank computes the LCR and reports the same to the Asset Liability Management Committee (ALCO) every month for review as well as to the Risk Management Committee of the Board. The Bank computes LCR on a daily basis and in accordance with RBI guidelines the quarterly disclosures of LCR contain data on the simple average calculated on daily observations over a period of 90 days.The Bank follows the criteria laid down by RBI for calculation of High Quality Liquid Assets (HQLA), gross outfl ows and infl ows within the next 30-day period. HQLA predominantly comprises Government securities viz. Treasury Bills, Central and State Government securities. A relatively smaller part of HQLA is accounted for by the corporate bonds with mandated haircuts applied thereto.The Bank monitors the concentration of funding sources from signifi cant counterparties, signifi cant instruments/products as part of the asset liability management framework. The Bank adheres to the regulatory and internal limits on Inter-bank liability and call money borrowings which form part of the ALM policy. The Bank’s funding sources are fairly dispersed across sources and maturities.Expected derivative cash outfl ows and infl ows are calculated for outstanding contracts in accordance with laid down valuation methodologies. Cash fl ows, if any, from collaterals posted against derivatives are not considered.Apart from the LCR position in all currencies put together, the Bank monitors the LCR in US Dollar currency which qualifi es as a signifi cant currency as per RBI guidelines. The liquidity risk management of the Bank is undertaken by the Asset Liability Management group in the Treasury in accordance with the Board approved policies and ALCO approved funding plans. The Risk department measures and monitors the liquidity profi le of the Bank with reference to the Board approved limits, for both domestic as well as overseas operations, on a static as well as on a dynamic basis by using the gap analysis technique supplemented by monitoring of key liquidity ratios and periodical liquidity stress testing. Periodical reports are placed before the Bank’s ALCO for perusal and review. All signifi cant outfl ows and infl ows determined in accordance with RBI guidelines are included in the prescribed LCR computation template.
ECO
NOM
IC &
PO
LITI
CAL
WEE
KLY

Registered Offi ce: ‘Trishul’, 3rd fl oor, Opp. Samartheshwar Temple, Law Garden, Ellisbridge, Ahmedabad - 380 006.AXIS BANK LIMITED
18 Notes forming part of the fi nancial statements for the year ended 31 March, 2020 (Currency: In Indian Rupees)
Published on Saturday, JUNE 27, 2020 vol lV nos 26 & 27 EPW Economic & Political Weekly96
Quantitative disclosure (` in crores)
Quarter ended 31 March, 2020
Quarter ended 31 December, 2019
Quarter ended 30 September, 2019
Quarter ended 30 June, 2019
Total Unweighted
Value (average)
Total Weighted
Value (average)
Total Unweighted
Value (average)
Total Weighted
Value (average)
Total Unweighted
Value (average)
Total Weighted
Value (average)
Total Unweighted
Value (average)
Total Weighted
Value (average)
High Quality Liquid Assets1 Total High Quality Liquid
Assets (HQLAs) 1,53,367.16 136,689.42 131,204.91 131,403.54Cash Outfl ows2 Retail Deposits and deposits
from small business customers, of which: 343,438.06 29,290.56 332,402.80 30,483.28 316,993.94 29,016.38 308,585.60 28,213.84
(i) Stable Deposits 101,064.99 5,053.25 55,139.77 2,756.99 53,660.26 2,683.01 52,894.53 2,644.73(ii) Less Stable Deposits 242,373.07 24,237.31 277,263.03 27,726.29 263,333.68 26,333.37 255,691.07 25,569.113 Unsecured wholesale funding,
of which: 188,919.86 106,484.32 173,900.62 87,383.69 158,269.16 79,179.07 163,736.68 82,229.45(i) Operational deposits
(all counterparties) 12,446.47 3,091.07 40,926.39 10,219.61 40,975.45 10,232.28 45,252.80 11,301.58(ii) Non-operational deposits
(all counterparties) 176,473.39 103,393.25 132,974.23 77,164.08 117,293.71 68,946.79 118,483.88 70,927.87(iii) Unsecured debt - - - - - - - -4 Secured wholesale funding 205.42 30.76 - -5 Additional requirements,
of which: 41,661.37 37,484.42 29,064.70 23,845.67 29,973.51 24,432.21 31,272.56 25,562.49(i) Outfl ows related to derivative
exposures and other collateral requirements 35,283.57 35,283.57 20,856.03 20,856.03 19,769.56 19,769.56 24,356.76 24,356.76
(ii) Outfl ows related to loss of funding on debt products - - - - - - - -
(iii) Credit and liquidity facilities 6,377.80 2,200.85 8,208.67 2,989.64 10,203.95 4,662.65 6,915.80 1,205.736 Other contractual funding
obligations 5,186.45 5,186.45 5,329.08 5,329.08 5,567.56 5,567.56 5,993.94 5,993.947 Other contingent funding
obligations 259,508.03 10,958.57 260,446.40 10,975.47 263,394.18 11,116.33 240,539.04 9,882.598 TOTAL CASH OUTFLOWS 189,609.74 158,047.95 149,311.55 151,882.31Cash Infl ows9 Secured lending (eg. reverse
repo) 28,920.03 - 15,742.82 - 6,085.12 - 7,475.08 -10 Infl ows from fully performing
exposures 29,834.23 20,486.21 26,837.93 18,100.37 29,440.23 21,375.26 32,929.08 23,639.6611 Other cash infl ows 33,896.15 33,896.15 19,463.48 19,463.48 18,595.27 18,595.27 23,694.78 23,694.7812 TOTAL CASH INFLOWS 92,650.41 54,382.36 62,044.23 37,563.85 54,120.62 39,970.53 64,098.94 47,334.44
Total adjusted Value Total adjusted Value Total adjusted Value Total adjusted Value
21 TOTAL HQLA 153,367.16 136,689.42 131,204.91 131,403.5422 TOTAL NET CASH
OUTFLOWS 135,227.38 120,484.10 109,341.02 104,547.8723 LIQUIDITY COVERAGE
RATIO % 113.41% 113.45% 120.00% 125.69%
Notes: 1) Average for all the quarters is simple average of daily observations for the quarter. 2) Classifi cation of infl ows and outfl ows for determining the run off factors is based on the same estimates and assumptions
as used by the Bank for compiling the return submitted to the RBI, which has been relied upon by the auditors. 3) In compliance with the RBI directive received, the Bank has computed LCR as per the revised defi nition of ‘Operational
Deposits’ with effect from 20 December, 2019. As a result, the LCR for the quarter ended 31 March, 2020 is strictly not comparable with the LCR reported for previous quarters.
ECO
NOM
IC &
PO
LITI
CAL
WEE
KLY

Registered Offi ce: ‘Trishul’, 3rd fl oor, Opp. Samartheshwar Temple, Law Garden, Ellisbridge, Ahmedabad - 380 006.AXIS BANK LIMITED
18 Notes forming part of the fi nancial statements for the year ended 31 March, 2020 (Currency: In Indian Rupees)
Economic & Political Weekly EPW Published on Saturday, JUNE 27, 2020 vol lV nos 26 & 27 97
(` in crores)Quarter ended 31 March, 2019
Quarter ended 31 December, 2018
Quarter ended 30 September, 2018
Quarter ended 30 June, 2018
Total Unweighted
Value (average)
Total Weighted
Value (average)
Total Unweighted
Value (average)
Total Weighted
Value (average)
Total Unweighted
Value (average)
Total Weighted
Value (average)
Total Unweighted
Value (average)
Total Weighted
Value (average)
High Quality Liquid Assets1 Total High Quality Liquid
Assets (HQLAs) 122,173.58 112,336.65 98,417.24 82,905.66Cash Outfl ows2 Retail Deposits and deposits
from small business customers, of which: 288,756.01 26,298.55 276,752.92 25,082.62 262,954.38 23,773.05 250,441.74 22,587.17
(i) Stable Deposits 51,541.11 2,577.06 51,853.44 2,592.67 50,447.68 2,522.38 49,140.03 2,457.00(ii) Less Stable Deposits 237,214.90 23,721.49 224,899.48 22,489.95 212,506.70 21,250.67 201,301.71 20,130.173 Unsecured wholesale
funding, of which: 156,131.98 79,803.19 147,846.47 74,665.27 138,551.93 71,267.03 133,534.29 68,572.86
(i) Operational deposits (all counterparties) 45,839.18 11,448.44 45,614.30 11,396.72 42,070.15 10,511.43 41,286.10 10,315.38
(ii) Non-operational deposits (all counterparties) 110,292.80 68,354.75 102,232.17 63,268.55 96,481.78 60,775.60 92,248.19 58,257.48
(iii) Unsecured debt - - - - - - - -4 Secured wholesale funding - 489.13 - 1,315.085 Additional requirements,
of which: 33,663.94 22,274.62 44,959.20 31,958.57 39,442.47 27,091.98 37,859.76 25,588.32(i) Outfl ows related to
derivative exposures and other collateral requirements 20,690.63 20,690.63 30,309.69 30,309.69 25,518.93 25,518.93 23,839.39 23,839.39
(ii) Outfl ows related to loss of funding on debt products 35.28 35.28 112.93 112.93 179.59 179.59 136.23 136.23
(iii) Credit and liquidity facilities 12,938.03 1,548.71 14,536.58 1,535.95 13,743.95 1,393.46 13,884.14 1,612.706 Other contractual funding
obligations 5,481.21 5,481.21 5,347.92 5,347.92 4,303.74 4,241.13 4,115.59 4,025.597 Other contingent funding
obligations 229,362.92 9,296.33 232,701.55 9,189.17 236,628.98 9,380.16 226,614.14 8,914.068 TOTAL CASH
OUTFLOWS 143,153.90 146.732.68 135,753.34 131,003.08Cash Infl ows9 Secured lending (eg. reverse
repo) 9,018.11 - 4,657.91 - 3,172.41 - 2,130.44 -10 Infl ows from fully
performing exposures 34,209.85 24,150.15 34,751.35 24,671.71 36,368.55 24,909.84 31,469.06 20,819.6511 Other cash infl ows 20,164.89 20,164.89 30,454.88 30,454.88 25,478.59 25,478.59 23,503.92 23,503.9212 TOTAL CASH INFLOWS 63,392.85 44,315.04 69,864.14 55,126.59 65,019.55 50,388.43 57,103.42 44,323.57
Total adjusted Value Total adjusted Value Total adjusted Value Total adjusted Value21 TOTAL HQLA 122,173.58 112,336.65 98,417.24 82,905.6622 TOTAL NET CASH
OUTFLOWS 98,838.86 91,606.09 85,364.91 86,679.5123 LIQUIDITY COVERAGE
RATIO % 123.61% 122.63% 115.29% 95.65%
Notes: 1) Average for all the quarters is simple average of daily observations for the quarter. 2) Classifi cation of infl ows and outfl ows for determining the run off factors is based on the same estimates and assumptions as used by the Bank for
compiling the return submitted to the RBI, which has been relied upon by the auditors.
2.2 Other disclosures2.2.1 During the year, the Bank has appropriated 340.46 crores (previous year 124.93 crores) to the Capital Reserve, net of taxes and transfer
to Statutory Reserve, being the gain on sale of HTM investments in accordance with RBI guidelines. As advised by RBI, the Bank has also appropriated `0.06 crores (previous year `0.16 crores) to the Capital Reserve, net of taxes and transfer to Statutory Reserve, being the profi t on sale of immovable property.
2.2.2 During the year, the Bank has appropriated `328.00 crores (previous year `600.00 crores) to the Investment Fluctuation Reserve in accordance with RBI guidelines.
2.2.3 During the year, the Bank has appropriated `0.85 crores (previous year `0.63 crores) to Reserve Fund account towards statutory reserve in accordance with guidelines issued by Central Bank of Sri Lanka in respect of Colombo branch operations.
ECO
NOM
IC &
PO
LITI
CAL
WEE
KLY

Registered Offi ce: ‘Trishul’, 3rd fl oor, Opp. Samartheshwar Temple, Law Garden, Ellisbridge, Ahmedabad - 380 006.AXIS BANK LIMITED
18 Notes forming part of the fi nancial statements for the year ended 31 March, 2020 (Currency: In Indian Rupees)
Published on Saturday, JUNE 27, 2020 vol lV nos 26 & 27 EPW Economic & Political Weekly98
2.2.4 Earnings Per Share (‘EPS’)The details of EPS computation is set out below:
31 March, 2020 31 March, 2019 Basic and Diluted earnings for the year (Net profi t after tax) (` in crores) 1,627.22 4,676.61 Basic weighted average no. of shares (in crores) 271.51 256.90 Add: Equity shares for no consideration arising on grant of stock options under ESOP (in crores) 0.98 1.58 Diluted weighted average no. of shares (in crores) 272.49 258.48 Basic EPS (`) 5.99 18.20 Diluted EPS (`) 5.97 18.09 Nominal value of shares (`) 2.00 2.00
Dilution of equity is on account of 8,395,776 stock options and 1,420,559 warrants (previous year 9,813,655 stock options and 6,033,509 warrants).
2.2.5 Employee Stock Options Scheme (‘the Scheme’)Pursuant to the approval of the shareholders in February 2001, the Bank approved an Employee Stock Option Scheme under which eligible employees are granted an option to purchase shares subject to vesting conditions. Over the period till March 2020, pursuant to the approval of the shareholders, the Bank approved ESOP schemes for options aggregating 265,087,000 that vest in a graded manner over 3 years. The options can be exercised within three/fi ve years from the date of the vesting as the case may be. Within the overall ceiling of 265,087,000 stock options approved for grant by the shareholders as stated earlier, the Bank is authorised to issue options to eligible employees and Whole Time Directors of the subsidiary companies.259,613,700 options have been granted under the Schemes till the previous year ended 31 March, 2019. Pursuant to the approval of the Nomination and Remuneration Committee on 27 March, 2019, the Bank granted 8,650,150 stock options (each option representing entitlement to one equity share of the Bank) to its eligible employees/directors of the Bank/subsidiary companies at a grant price of `757.10. Further, during FY2019-20, the Bank granted stock options (each option representing entitlement to one equity share of the Bank) to its eligible employees/directors of the Bank/subsidiary companies, the details of which are as under:
Date of grant No. of options granted Grant price (` per option) 25 April, 2019 430,000 752.85 29 July, 2019 90,000 729.85 21 January, 2020 330,000 727.20
Stock option activity under the Scheme for the year ended 31 March, 2020 is set out below:
Options Range of exercise Weighted Weighted average outstanding prices (`) average exercise remaining price (`) contractual life
(Years) Outstanding at the beginning of the year 30,132,874 288.96 to 619.60 465.06 4.13 Granted during the year 9,500,150 727.20 to 757.10 755.61 - Forfeited during the year (1,018,650) 306.54 to 757.10 623.71 - Expired during the year (950) 288.96 288.96 - Exercised during the year (5,947,539) 288.96 to 535.00 397.02 -
Outstanding at the end of the year 32,665,885 306.54 to 757.10 557.01 4.15
Exercisable at the end of the year 20,373,840 306.54 to 757.10 505.98 3.03
The weighted average share price in respect of options exercised during the year was `715.09.Stock option activity under the Scheme for the year ended 31 March, 2019 is set out below:
Options Range of exercise Weighted Weighted average outstanding prices (`) average exercise remaining price (`) contractual life
(Years) Outstanding at the beginning of the year 29,554,909 217.33 to 535.00 432.45 4.22 Granted during the year 6,455,000 504.85 to 619.60 516.05 - Forfeited during the year (748,700) 306.54 to 535.00 500.67 - Expired during the year (22,400) 288.96 288.96 - Exercised during the year (5,105,935) 217.33 to 535.00 336.29 - Outstanding at the end of the year 30,132,874 288.96 to 619.60 465.06 4.13
Exercisable at the end of the year 17,138,224 288.96 to 535.00 436.22 2.87
The weighted average share price in respect of options exercised during the year was `623.15.
ECO
NOM
IC &
PO
LITI
CAL
WEE
KLY

Registered Offi ce: ‘Trishul’, 3rd fl oor, Opp. Samartheshwar Temple, Law Garden, Ellisbridge, Ahmedabad - 380 006.AXIS BANK LIMITED
18 Notes forming part of the fi nancial statements for the year ended 31 March, 2020 (Currency: In Indian Rupees)
Economic & Political Weekly EPW Published on Saturday, JUNE 27, 2020 vol lV nos 26 & 27 99
Fair Value Methodology On applying the fair value based method in Guidance Note on ‘Accounting for Employee Share-based Payments’ the impact on reported
net profi t and EPS would be as follows:
31 March, 2020 31 March, 2019Net Profi t (as reported) (` in crores) 1,627.22 4,676.61Add: Stock based employee compensation expense included in net income
(` in crores) – –Less: Stock based employee compensation expense determined under fair value
based method (proforma) (` in crores) (137.07) (95.04)Net Profi t (Proforma) (` in crores) 1,490.15 4,581.57Earnings per share: Basic (in `)As reported 5.99 18.20Proforma 5.49 17.83Earnings per share: Diluted (in `)As reported 5.97 18.09Proforma 5.47 17.77
During the years ended, 31 March, 2020 and 31 March, 2019, no cost has been incurred by the Bank on ESOPs issued to the employees of the Bank and employees of subsidiaries under the intrinsic value method.The fair value of the options is estimated on the date of the grant using the Black-Scholes options pricing model, with the following assumptions:
31 March, 2020 31 March, 2019Dividend yield 0.54% 0.76%Expected life 1.82-3.82 years 2.57-4.57 yearsRisk free interest rate 5.99% to 6.96% 7.07% to 7.63%Volatility 28.07% to 28.60% 28.78% to 30.82%
Volatility is the measure of the amount by which a price has fl uctuated or is expected to fl uctuate during a period. The measure of volatility used in the Black-Scholes options pricing model is the annualised standard deviation of the continuously compounded rates of return on the stock over a period of time. For calculating volatility, the daily volatility of the stock prices on the National Stock Exchange, over a period prior to the date of grant, corresponding with the expected life of the options has been considered.The weighted average fair value of options granted during the year ended 31 March, 2020 is `200.15 (previous year `164.10).On 18 March, 2020, the Nomination and Remuneration Committee of the Board of Directors of the Bank has approved the grant of upto 12,500,000 stock options to eligible employees. As on 31 March, 2020, there have been no allotments of options under this grant. Accordingly, these options have not been considered in the above disclosure and for disclosure of proforma net profi t and EPS under fair value method for FY 2019-20.
2.2.6 Proposed DividendThe Reserve Bank of India, vide its circular dated 17 April, 2020, has advised that banks shall not make any further dividend payouts from profi ts pertaining to the fi nancial year ended 31 March, 2020 until further instructions, with a view that banks must conserve capital in an environment of heightened uncertainty caused by COVID-19. Accordingly, the Board of Directors of the Bank has not proposed any dividend for the year ended 31 March, 2020.
2.2.7 Segmental reportingThe business of the Bank is divided into four segments: Treasury, Retail Banking, Corporate/Wholesale Banking and Other Banking Business. These segments have been identifi ed based on the RBI’s revised guidelines on Segment Reporting issued on 18 April, 2007 vide Circular No. DBOD.No.BP.BC.81/21.04.018/2006-07. The principal activities of these segments are as under.
Segment Principal ActivitiesTreasury Treasury operations include investments in sovereign and corporate debt, equity and mutual
funds, trading operations, derivative trading and foreign exchange operations on the proprietary account and for customers. The Treasury segment also includes the central funding unit.
Retail Banking Constitutes lending to individuals/small businesses through the branch network and other delivery channels subject to the orientation, nature of product, granularity of the exposure and the quantum thereof. Retail Banking activities also include liability products, card services, internet banking, mobile banking, ATM services, depository, fi nancial advisory services and NRI services.
Corporate/Wholesale Banking Includes corporate relationships not included under Retail Banking, corporate advisory services, placements and syndication, project appraisals, capital market related services and cash management services.
Other Banking Business Includes para banking activities like third party product distribution and other banking transactions not covered under any of the above three segments.
ECO
NOM
IC &
PO
LITI
CAL
WEE
KLY

Registered Offi ce: ‘Trishul’, 3rd fl oor, Opp. Samartheshwar Temple, Law Garden, Ellisbridge, Ahmedabad - 380 006.AXIS BANK LIMITED
18 Notes forming part of the fi nancial statements for the year ended 31 March, 2020 (Currency: In Indian Rupees)
Published on Saturday, JUNE 27, 2020 vol lV nos 26 & 27 EPW Economic & Political Weekly100
Unallocated assets and liabilities - All items which are reckoned at an enterprise level are classifi ed under this segment such as deferred tax, money received against share warrants, tax paid in advance net of provision, etc.Revenues of the Treasury segment primarily consist of fees and gains or losses from trading operations and interest income on the investment portfolio. The principal expenses of the segment consist of interest expense on funds borrowed from external sources and other internal segments, premises expenses, personnel costs, other direct overheads and allocated expenses.Revenues of the Corporate/Wholesale Banking segment consist of interest and fees earned on loans given to customers falling under this segment and fees arising from transaction services and merchant banking activities such as syndication and debenture trusteeship. Revenues of the Retail Banking segment are derived from interest earned on loans classifi ed under this segment, fees for banking and advisory services, ATM interchange fees and cards products. Expenses of the Corporate/Wholesale Banking and Retail Banking segments primarily comprise interest expense on deposits and funds borrowed from other internal segments, infrastructure and premises expenses for operating the branch network and other delivery channels, personnel costs, other direct overheads and allocated expenses.Segment income includes earnings from external customers and from funds transferred to the other segments. Segment result includes revenue as reduced by interest expense and operating expenses and provisions, if any, for that segment. Segment-wise income and expenses include certain allocations. Inter segment interest income and interest expense represent the transfer price received from and paid to the Central Funding Unit (CFU) respectively. For this purpose, the funds transfer pricing mechanism presently followed by the Bank, which is based on historical matched maturity and internal benchmarks, has been used. Operating expenses other than those directly attributable to segments are allocated to the segments based on an activity-based costing methodology. All activities in the Bank are segregated segment-wise and allocated to the respective segment. Effective 1 April 2019, the Bank has reported inter segment revenue and inter segment expense in the Central Funding Unit (which forms part of Treasury segment) on a net basis as against earlier practice of reporting revenue and expenses on a gross basis. Accordingly, segmental revenue numbers for the previous period have been restated to make them comparable with current period numbers. There is no impact of this change on the segmental profi t before tax.Segmental results are set out below: (` in crores)
31 March, 2020Treasury Corporate/
Wholesale Banking
Retail Banking
Other Banking Business
Total
Segment RevenueGross interest income (external customers) 14,574.22 18,538.09 29,522.85 - 62,635.16Other income 3,988.16 3,852.72 6,453.32 1,242.36 15,536.56
Total income as per Profi t and Loss Account 18,562.38 22,390.81 35,976.17 1,242.36 78,171.72Add/(less) inter segment interest income 4,813.04 6,524.53 25,323.09 0.01 36,660.67
Total segment revenue 23,375.42 28,915.34 61,299.26 1,242.37 114,832.39Less: Interest expense (external customers) 16,345.72 1,241.93 19,841.31 - 37,428.96Less: Inter segment interest expense 2,299.55 14,464.23 19,896.23 0.66 36,660.67Less: Operating expenses 302.09 4,413.50 12,267.84 321.19 17,304.62
Operating profi t 4,428.06 8,795.68 9,293.88 920.52 23,438.14
Less: Provision for non-performing assets/others* 2,599.64 9,726.06 4,325.55 0.38 16,651.63Less: Unallocated Provision for other contingencies# 1,882.28Segment result 1,828.42 (930.38) 4,968.33 920.14 4,904.23
Less: Provision for tax 3,277.01Extraordinary profi t/loss -Net Profi t 1,627.22Segment assets 320,153.31 257,557.11 328,156.61 283.88 906,150.91Unallocated assets 9,013.91Total assets 915,164.82Segment liabilities 291,911.84 132,443.67 403,812.82 63.49 828,231.82Unallocated liabilities 1,985.15Total liabilities 830,216.97Net assets 28,241.47 125,113.44 (75,656.21) 220.39 84,947.85Capital expenditure for the year 6.89 229.82 624.99 8.66 870.36Depreciation on fi xed assets for the year 6.12 204.10 555.04 7.69 772.95
*represents material non-cash items other than depreciation # represents provision for COVID-19 over and above regulatory requirement, per extant guidelines as on date of adoption of fi nancial statements by the Board
ECO
NOM
IC &
PO
LITI
CAL
WEE
KLY

Registered Offi ce: ‘Trishul’, 3rd fl oor, Opp. Samartheshwar Temple, Law Garden, Ellisbridge, Ahmedabad - 380 006.AXIS BANK LIMITED
18 Notes forming part of the fi nancial statements for the year ended 31 March, 2020 (Currency: In Indian Rupees)
Economic & Political Weekly EPW Published on Saturday, JUNE 27, 2020 vol lV nos 26 & 27 101
(` in crores)31 March, 2019
Treasury Corporate/Wholesale Banking
Retail Banking
Other Banking Business
Total
Segment RevenueGross interest income (external customers) 13,848.40 17,439.94 23,697.43 - 54,985.77Other income 2,355.65 4,320.54 5,224.37 1,229.78 13,130.34Total income as per Profi t and Loss Account 16,204.05 21,760.48 28,921.80 1,229.78 68,116.11Add/(less) inter segment interest income 6,680.96 6,175.11 20,249.77 0.01 33,105.85Total segment revenue 22,885.01 27,935.59 49,171.57 1,229.79 101,221.96 Less: Interest expense (external customers) 16,884.94 1,170.08 15,222.58 - 33,277.60Less: Inter segment interest expense 3,048.35 13,520.57 16,536.06 0.87 33,105.85Less: Operating expenses 414.52 3,800.03 11,265.40 353.45 15,833.40Operating profi t 2,537.20 9,444.91 6,147.53 875.47 19,005.11Less: Provision for non-performing assets/others* 690.12 9,026.31 2,248.59 66.00 12,031.02Segment result 1,847.08 418.60 3,898.94 809.47 6,974.09Less: Provision for tax 2,297.48Extraordinary profi t/loss -Net Profi t 4,676.61Segment assets 283,985.76 238,692.89 268,642.17 337.05 791,657.87Unallocated assets 9,338.66Total assets 800,996.53Segment liabilities 274,441.80 129,036.23 329,975.67 53.89 733,507.59Unallocated liabilities 812.64Total liabilities 734,320.23Net assets 9,543.96 109,656.66 (61,333.50) 283.16 66,676.30Capital expenditure for the year 15.52 200.43 674.32 14.80 905.07Depreciation on fi xed assets for the year 12.17 157.17 528.78 11.60 709.72
*represents material non-cash items other than depreciation Geographic Segments (` in crores)
Domestic International Total31 March,
202031 March,
201931 March,
202031 March,
201931 March,
202031 March,
2019Revenue 76,113.68 64,700.02 2,058.04 3,416.09 78,171.72 68,116.11Assets 861,491.30 753,055.38 53,673.52 47,941.15 915,164.82 800,996.53Capital Expenditure for the year 869.05 902.89 1.31 2.18 870.36 905.07Depreciation on fi xed assets for the year 771.16 707.05 1.79 2.67 772.95 709.72
2.2.8 Related party disclosure The related parties of the Bank are broadly classifi ed as: a) Promoters The Bank has identifi ed the following entities as its Promoters. Administrator of the Specifi ed Undertaking of the Unit Trust of India (SUUTI) Life Insurance Corporation of India (LIC) General Insurance Corporation, New India Assurance Co. Limited, National Insurance Co. Limited, United India Insurance Co.
Limited and The Oriental Insurance Co. Limited. b) Key Management Personnel Mr. Amitabh Chaudhry (MD & CEO) Ms. Shikha Sharma (MD & CEO) (upto 31 December, 2018) Mr. V. Srinivasan (Deputy Managing Director) (upto 20 December, 2018) Mr. Rajesh Dahiya [Executive Director (Corporate Centre)] Mr. Rajiv Anand [Executive Director (Wholesale Banking)] Mr. Pralay Mondal [Executive Director (Retail Banking)] (w.e.f. 1 August, 2019)
ECO
NOM
IC &
PO
LITI
CAL
WEE
KLY
Registered Offi ce: ‘Trishul’, 3rd fl oor, Opp. Samartheshwar Temple, Law Garden, Ellisbridge, Ahmedabad - 380 006.AXIS BANK LIMITED
18 Notes forming part of the fi nancial statements for the year ended 31 March, 2020 (Currency: In Indian Rupees)
Published on Saturday, JUNE 27, 2020 vol lV nos 26 & 27 EPW Economic & Political Weekly102
c) Relatives of Key Management Personnel Ms. Preeti Chaudhry, Mr. Anagh Chaudhry, Mr. Aruj Chaudhry, Mr. Aryan Chaudhry, Ms. Chhavi Kharb, Mr. Om Singh Chaudhry, Ms. Kusum Chaudhry, Mr. Sanjaya Sharma, Ms. Usha Bharadwaj, Mr. Tilak Sharma, Ms. Tvisha Sharma, Dr. Sanjiv Bharadwaj, Dr. Prashant Bharadwaj, Dr. Brevis Bharadwaj, Dr. Reena Bharadwaj, Ms. Gayathri Srinivasan, Mr. V. Satish, Ms. Camy Satish, Ms. Ananya Srinivasan, Ms. Anagha Srinivasan, Ms. Geetha N., Ms. Chitra R., Ms. Sumathi N., Mr. S. Ranganathan, Mr. R. Narayan, Ms. Gitanjali Anand, Ms. Tara Anand, Ms. Nandita Anand, Mr. P.L. Narain, Mr. P. Srinivas, Ms. Ratna Rao Shekar, Ms. P. Kamashi, Ms. Hemant Dahiya, Ms. Arooshi Dahiya, Ms. Mallika Dahiya, Ms. Jal Medha, Ms. Pooja Rathi, Mr. Jai Prakash Dahiya, Ms. Mahasweta Mondal, Ms. Pritha Mondal, Ms. Trina Mondal, Mr. Biplab Mondal, Ms. Anima Mondal.
d) Subsidiary Companies Axis Capital Limited Axis Private Equity Limited Axis Trustee Services Limited Axis Asset Management Company Limited Axis Mutual Fund Trustee Limited Axis Bank UK Limited Axis Finance Limited Axis Securities Limited A.Treds Limited Accelyst Solutions Private Limited Freecharge Payment Technologies Private Limited
e) Step down subsidiary companies Axis Capital USA LLC
Based on RBI guidelines, details of transactions with step down subsidiaries are not disclosed since there is only one entity/party in this category.
The details of transactions of the Bank with its related parties during the year ended 31 March, 2020 are given below: (` in crores)
Items/Related Party Promoters Key Management
Personnel
Relatives of Key
Management Personnel#
Subsidiaries Total
Dividend paid 46.04 0.04 – – 46.08Dividend received – – – 240.26 240.26Interest paid 551.48 1.07 0.15 15.57 568.27Interest received 0.19 0.26 – 53.95 54.40Investment of the Bank – – – 6.70 6.70Investment in non-equity instruments of related party – – – 45.00 45.00Investment of related party in the Bank – 5.44 – – 5.44Redemption of Hybrid capital/Bonds of the Bank 55.00 – – – 55.00Purchase of investments – – – 369.16 369.16Sale of investments 1,318.04 – – – 1,318.04Management contracts – – – 12.87 12.87Remuneration paid – 15.84 – – 15.84Contribution to employee benefi t fund 15.42 – – – 15.42Repayment of security deposits by related party – – – – –Non-funded commitments (issued) – – – – –Call/Term lending to related party – – – 55.61 55.61Repayment of Call/Term lending by related party – – – 55.61 55.61Swaps/Forward contracts – – – 79.34 79.34Advance granted (net) – – – 0.45 0.45Advance repaid 5.31 6.01 – 86.47 97.79Purchase of loans – – – – –Sell down of loans (including undisbursed loan commitments) – – – – –Receiving of services 202.74 – – 178.55 381.29Rendering of services 29.38 0.01 – 50.60 79.99Sale of foreign exchange currency to related party – 1.48 0.03 – 1.51Royalty received – – – 3.03 3.03Other reimbursements from related party – – – 37.77 37.77Other reimbursements to related party 0.19 – – 10.53 10.72
# Details of transactions of the Bank with relatives of KMP are for the period during which the KMP are related parties of the Bank.
ECO
NOM
IC &
PO
LITI
CAL
WEE
KLY

Registered Offi ce: ‘Trishul’, 3rd fl oor, Opp. Samartheshwar Temple, Law Garden, Ellisbridge, Ahmedabad - 380 006.AXIS BANK LIMITED
18 Notes forming part of the fi nancial statements for the year ended 31 March, 2020 (Currency: In Indian Rupees)
Economic & Political Weekly EPW Published on Saturday, JUNE 27, 2020 vol lV nos 26 & 27 103
The balances payable to/receivable from the related parties of the Bank as on 31 March, 2020 are given below: (` in crores)
Items/Related Party Promoters Key Relatives of Subsidiaries Total Management Key Personnel Management Personnel#
Call/Term lending to related party - - - - - Deposits with the Bank 7,119.06 16.01 5.99 565.88 7,706.94 Placement of security deposits 0.31 - - - 0.31 Advances 1.31 4.85 0.03 351.56 375.75 Investment of the Bank - - - 2,292.82 2,292.82 Investment in non-equity instruments of related party - - - - - Investment of related party in the Bank 88.56 0.08 - - 88.64 Non-funded commitments 3.32 - - - 3.32 Investment of related party in Hybrid capital/Bonds of the Bank 2,760.00 - - - 2,760.00 Payable under management contracts - - - - - Other receivables (net) - - - 6.13 6.13 Other payables (net) - - - 26.64 26.64
# Details of transactions of the Bank with relatives of KMP are for the period during which the KMP are related parties of the Bank.
The maximum balances payable to/receivable from the related parties of the Bank during the year ended 31 March, 2020 are given below:
(` in crores)
Items/Related Party Promoters Key Relatives of Subsidiaries Total Management Key Personnel Management Personnel#
Deposits with the Bank 16,652.92 20.86 5.99 1,106.09 17,785.86
Placement of deposits 0.31 – – – 0.31
Advances 11.51 10.99 0.06 1,473.93 1,496.49
Investment of the Bank – – – 2,292.82 2,292.82
Investment of related party in the Bank 93.60 0.09 – – 93.69
Investment in non-equity instruments of related party 290.05 – – – 290.05
Non-funded commitments 3.33 – – – 3.33
Call lending – – – 55.61 55.61
Swaps/Forward contracts – – – 1.51 1.51
Investment of related party in Hybrid Capital/Bonds of the Bank 2,815.00 – – – 2,815.00
Payable under management contracts – – – – –
Other receivables (net) – – – 17.94 17.94
Other payables (net) – – – 88.19 88.19
ECO
NOM
IC &
PO
LITI
CAL
WEE
KLY

Registered Offi ce: ‘Trishul’, 3rd fl oor, Opp. Samartheshwar Temple, Law Garden, Ellisbridge, Ahmedabad - 380 006.AXIS BANK LIMITED
18 Notes forming part of the fi nancial statements for the year ended 31 March, 2020 (Currency: In Indian Rupees)
Published on Saturday, JUNE 27, 2020 vol lV nos 26 & 27 EPW Economic & Political Weekly104
The details of transactions of the Bank with its related parties during the year ended 31 March, 2019 are given below: (` in crores)
Items/Related Party Promoters Key Relatives Subsidiaries Total Management of Key Personnel Management Personnel Dividend paid - – – – – Dividend received – – – 131.10 131.10 Interest paid 554.78 0.41 0.12 17.41 572.72 Interest received 0.13 1.09 – 22.19 23.41 Investment of the Bank – – – 197.17 197.17 Investment in non-equity instruments of related party 341.26 – – 50.00 391.26 Investment of related party in the Bank – 17.93 – – 17.93 Redemption of Hybrid capital/Bonds of the Bank 1,510.00 – – – 1,510.00 Purchase of investments 205.00 – – – 205.00 Sale of investments 857.07 – – – 857.07 Management contracts – – – 18.64 18.64 Remuneration paid – 18.49 – – 18.49 Contribution to employee benefi t fund 16.53 – – – 16.53 Repayment of security deposits by related party 0.12 – – – 0.12 Non-funded commitments (issued) – – – – – Repayment of Call/Term lending by related party – – – 352.14 352.14 Swaps/Forward contracts – – – 138.31 138.31 Advance granted (net) – – – 22.15 22.15 Advance repaid 0.45 7.38 – 621.41 629.24 Purchase of loans – – – – – Sell down of loans (including undisbursed loan commitments) – – – – – Receiving of services 120.46 – – 969.90 1,090.36 Rendering of services 27.88 0.03 – 195.79* 223.70 Sale of foreign exchange currency to related party – 1.35 0.01 – 1.36 Other reimbursements from related party – – – 22.68 22.68 Other reimbursements to related party 0.66 – – 1.09 1.75
Details of transactions of the Bank with relatives of KMP are for the period during which the KMP are related parties of the Bank.* Net of reversal of `46 crores towards fees receivable from Axis Asset Management Company Limited, pursuant to change in SEBI guidelines.The balances payable to/receivable from the related parties of the Bank as on 31 March, 2019 are given below: (` in crores)
Items/Related Party Promoters Key Relatives Subsidiaries Total Management of Key Personnel Management Personnel#
Call/Term lending to related party – – – – – Deposits with the Bank 9,146.04 13.91 0.55 378.75 9,539.25 Placement of security deposits 0.31 – – – 0.31 Advances 6.62 10.90 0.03 437.58 455.13 Investment of the Bank – – – 2,286. 12 2,286.12 Investment in non-equity instruments of related party 290.05 – – – 290.05 Investment of related party in the Bank 93.60 0.08 – – 93.68 Non-funded commitments 3.33 – – – 3.33 Investment of related party in Hybrid capital/Bonds of the Bank 2,790.00 – – – 2,790.00 Payable under management contracts – – – – – Other receivables (net) – – – 17.94 17.94 Other payables (net) – – – 88.19 88.19
# Details of transactions of the Bank with relatives of KMP are for the period during which the KMP are related parties of the Bank.
ECO
NOM
IC &
PO
LITI
CAL
WEE
KLY

Registered Offi ce: ‘Trishul’, 3rd fl oor, Opp. Samartheshwar Temple, Law Garden, Ellisbridge, Ahmedabad - 380 006.AXIS BANK LIMITED
18 Notes forming part of the fi nancial statements for the year ended 31 March, 2020 (Currency: In Indian Rupees)
Economic & Political Weekly EPW Published on Saturday, JUNE 27, 2020 vol lV nos 26 & 27 105
The maximum balances payable to/receivable from the related parties of the Bank during the year ended 31 March, 2019 are given below:
(` in crores)
Items/Related Party Promoters Key Relatives Subsidiaries Total Management of Key Personnel Management Personnel Deposits with the Bank 17,078.36 22.86 5.49 890.52 17,997.23 Placement of deposits 0.43 – – – 0.43 Advances 154.79 19.66 0.17 1,172.33 1,346.95 Investment of the Bank – – – 2,286.12 2,286.12 Investment of related party in the Bank 135.32 0.52 – – 135.84 Investment in non-equity instruments of related party 290.05 – – – 290.05 Non-funded commitments 3.35 – – 0.05 3.40 Call lending – – – 340.78 340.78 Swaps/Forward contracts – – – 3.03 3.03 Investment of related party in Hybrid Capital/Bonds of the Bank 4,300.00 – – – 4,300.00 Payable under management contracts – 3.70 – – 3.70 Other receivables (net) – – – 55.02 55.02 Other payables (net) – – – 88.19 88.19
The transactions with Promoters and Key Management Personnel excluding those under management contracts are in nature of the banker-customer relationship.Details of transactions with Axis Mutual Fund the fund fl oated by Axis Asset Management Company Ltd., the Bank’s subsidiary has not been disclosed since the entity does not qualify as Related Parties as defi ned under the Accounting Standard 18, Related Party Disclosure, as notifi ed under Section 2(2) and Section 133 of the Companies Act, 2013 and as per RBI guidelines.The signifi cant transactions between the Bank and related parties during the year ended 31 March, 2020 and 31 March, 2019 are given below. A specifi c related party transaction is disclosed as a signifi cant related party transaction wherever it exceeds 10% of the aggregate value of all related party transactions in that category:
(` in crores)
Particulars Year ended31 March, 2020
Year ended31 March, 2019
Dividend paid Life Insurance Corporation of India 26.32 - Administrator of the Specifi ed Undertaking of the Unit Trust of India 13.69 -
Dividend received Axis Securities Limited 33.23 -Axis Bank UK Limited 31.07 -Axis Finance Limited 120.19 - Axis Capital Limited 42.26 117.60 Axis Trustee Services Limited 13.50 13.50
Interest paid Life Insurance Corporation of India 433.28 503.97
Interest received Axis Finance Limited 52.28 10.93 Axis Bank UK Limited 0.06 10.12
Investment in Subsidiaries A Treds Limited 6.70 13.40Axis Bank UK Limited - 183.77
ECO
NOM
IC &
PO
LITI
CAL
WEE
KLY

Registered Offi ce: ‘Trishul’, 3rd fl oor, Opp. Samartheshwar Temple, Law Garden, Ellisbridge, Ahmedabad - 380 006.AXIS BANK LIMITED
18 Notes forming part of the fi nancial statements for the year ended 31 March, 2020 (Currency: In Indian Rupees)
Published on Saturday, JUNE 27, 2020 vol lV nos 26 & 27 EPW Economic & Political Weekly106
Particulars Year ended31 March, 2020
Year ended31 March, 2019
Investment in non-equity instruments of related party United India Insurance Co. Limited – 241.26 Oriental Insurance Co. Limited – 100.00 Axis Finance Limited 45.00 50.00
Investment of related party in the Bank Ms. Shikha Sharma N.A. 8.67Mr. Rajiv Anand 2.62 4.05Mr. Rajesh Dahiya 2.82 5.22
Purchase of InvestmentsAxis Bank UK Limited 369.16 –Oriental Insurance Co. Limited – 205.00
Redemption of Hybrid capital/Bonds of the Bank Life Insurance Corporation of India – 1500.00 General Insurance Corporation Co. Limited 10.00 –National Insurance Co. Limited 20.00 – United India Insurance Co. Limited 25.00 10.00
Sale of investments New India Assurance Co. Limited 490.00 195.00 General Insurance Corporation Co. Limited 556.00 335.02 United India Insurance Co. Limited 112.18 141.29 Oriental Insurance Co. Limited 99.85 145.76
Management contracts Axis Securities Limited 3.97 6.61 A Treds Limited 4.52 6.53Axis Capital Limited 2.09 2.68Axis Trustee Services Limited 2.29 2.80
Remuneration paid Mr. Amitabh Chaudhry 6.26 1.28Ms. Shikha Sharma N.A. 6.83 Mr.. V. Srinivasan N.A. 4.53 Mr. Rajiv Anand 4.16 3.18Mr. Rajesh Dahiya 3.75 2.68Mr. Pralay Mondal 1.67 N.A.
Contribution to employee benefi t fund Life Insurance Corporation of India 15.42 16.53
Repayment of Call/Term lending by related party Axis Bank UK Limited 55.61 352.14
Swaps/Forward contracts Axis Bank UK Limited 79.34 138.31
Advance granted (net) Axis Capital Limited – 19.43Accelyst Solutions Private Limited – 2.60Axis Asset Management Company Limited 0.37 –Axis Securities Limited 0.08 –
Advance repaid Axis Capital Limited 19.54 0.02Axis Bank UK Limited – 183.77Axis Finance Limited 64.32 427.61
ECO
NOM
IC &
PO
LITI
CAL
WEE
KLY

Registered Offi ce: ‘Trishul’, 3rd fl oor, Opp. Samartheshwar Temple, Law Garden, Ellisbridge, Ahmedabad - 380 006.AXIS BANK LIMITED
18 Notes forming part of the fi nancial statements for the year ended 31 March, 2020 (Currency: In Indian Rupees)
Economic & Political Weekly EPW Published on Saturday, JUNE 27, 2020 vol lV nos 26 & 27 107
Particulars Year ended31 March, 2020
Year ended31 March, 2019
Receiving of services New India Assurance Co. Limited 88.90 52.72Oriental Insurance Co. Limited 93.87 55.84Freecharge Payment Technologies Private Limited 109.67 84.79Accelyst Solutions Private Limited 46.09 0.33Axis Securities Limited 10.39 878.80
Rendering of services Life Insurance Corporation of India 28.22 26.60Axis Securities Limited 10.95 1.32Axis Asset Management Company Limited 24.75 226.47
Sale of foreign exchange currency to related party Ms. Shikha Sharma N.A. 1.14Mr. Amitabh Chaudhry 0.40 0.15Mr. Rajiv Anand 0.36 0.06Mr. Pralay Mondal 0.72 N.A.
Royalty receivedAxis Asset Management Company Limited 0.70 -Axis Capital Limited 0.36 -Axis Finance Limited 1.51 -
Other reimbursements from related party Axis Securities Limited 29.10 0.44Axis Capital Limited 3.90 3.90 Accelyst Solutions Private Limited 0.49 14.40
Other reimbursements to related party Axis Securities Limited 5.85 0.13 Life Insurance Corporation of India 0.19 0.66 Axis Capital Limited 0.26 0.22Axis Bank UK Limited 4.40 0.57
2.2.9 LeasesDisclosure in respect of assets taken on operating lease
This comprise of offi ce premises/ATMs, cash deposit machines, staff quarters, electronic data capturing machines and IT equipment. (` in crores)
31 March, 2020 31 March, 2019Future lease rentals payable as at the end of the year:– Not later than one year 850.65 775.07– Later than one year and not later than fi ve years 2,787.14 2,444.94
– Later than fi ve years 3,008.19 2,235.49
Total of minimum lease payments recognised in the Profi t and Loss Account for the year 914.17 833.95
Total of future minimum sub-lease payments expected to be received under non-cancellable subleases
28.51 5.50
Sub-lease payments recognised in the Profi t and Loss Account for the year 1.33 2.08
The Bank has sub-leased certain of its properties taken on lease. There are no provisions relating to contingent rent.The terms of renewal/purchase options and escalation clauses are those normally prevalent in similar agreements. There are generally no undue restrictions or onerous clauses in the agreements.
ECO
NOM
IC &
PO
LITI
CAL
WEE
KLY

Registered Offi ce: ‘Trishul’, 3rd fl oor, Opp. Samartheshwar Temple, Law Garden, Ellisbridge, Ahmedabad - 380 006.AXIS BANK LIMITED
18 Notes forming part of the fi nancial statements for the year ended 31 March, 2020 (Currency: In Indian Rupees)
Published on Saturday, JUNE 27, 2020 vol lV nos 26 & 27 EPW Economic & Political Weekly108
Disclosure in respect of assets given on operating lease (` in crores)
31 March, 2020 31 March, 2019Gross carrying amount of premises at the end of the year 157.91 157.91Accumulated depreciation at the end of the year 11.26 8.63Total depreciation charged to profi t and loss account for the year 2.63 0.65Future lease rentals receivable as at the end of the year:– Not later than one year 29.50 28.99– Later than one year and not later than fi ve years 118.16 116.54– Later than fi ve years 65.36 100.08
There is no provision relating to contingent rent.
2.2.10 Movement in fi xed assets capitalised as application software (included in other Fixed Assets) (` in crores)
Particulars 31 March, 2020 31 March, 2019At cost at the beginning of the year 1,610.96 1,291.64Additions during the year* 207.34 319.54Deductions during the year (26.92) (0.22)Accumulated depreciation as at 31 March (1,260.53) (1,056.47)Closing balance as at 31 March 530.85 554.49Depreciation charge for the year 224.28 198.72
*includes movement on account of exchange rate fl uctuation
2.2.11 The major components of deferred tax assets and deferred tax liabilities arising out of timing differences are as under: (` in crores)
As at 31 March, 2020 31 March, 2019Deferred tax assets on account of provisions for loan losses 5,932.33 7,072.93Deferred tax assets on account of amortisation of HTM investments 5.01 8.35Deferred tax assets on account of provision for employee benefi ts 9.05 97.12Deferred tax assets on account of other items 1,366.12 547.26
Deferred tax assets 7,312.51 7,725.66
Deferred tax liabilities on account of depreciation on fi xed assets 43.41 61.14Deferred tax liabilities on account of other items 14.13 23.79
Deferred tax liabilities 57.54 84.93
Net Deferred tax assets 7,254.97 7,640.73
The Bank has elected to exercise the option permitted under Section 115BAA of the Income Tax Act, 1961 as introduced by the Taxation Laws (Amendment) Act, 2019. The Bank has recognised provision for Income tax for the year ended 31 March, 2020 in line with the above option. This has necessitated a restatement of the opening balance of deferred tax assets as at 1 April, 2019, basis the rate prescribed in the aforesaid section. The restatement has resulted in a write down of `2,137.59 crores which has been fully charged to the Profi t and Loss account during the year.
2.2.12 Employee Benefi ts
Provident Fund
The rules of the Bank’s Provident Fund administered by a Trust require that if the Board of Trustees are unable to pay interest at the rate declared for Employees’ Provident Fund by the Government under para 60 of the Employees’ Provident Fund Scheme, 1952 for the reason that the return on investment is less or for any other reason, then the defi ciency shall be made good by the Bank. Based on an actuarial valuation conducted by an independent actuary, there is no defi ciency as at the Balance Sheet date.The following tables summarise the components of net benefi t expenses recognised in the Profi t and Loss Account and funded status and amounts recognised in the Balance Sheet for the Provident Fund benefi t plan (including staff deputed at subsidiaries).
ECO
NOM
IC &
PO
LITI
CAL
WEE
KLY

Registered Offi ce: ‘Trishul’, 3rd fl oor, Opp. Samartheshwar Temple, Law Garden, Ellisbridge, Ahmedabad - 380 006.AXIS BANK LIMITED
18 Notes forming part of the fi nancial statements for the year ended 31 March, 2020 (Currency: In Indian Rupees)
Economic & Political Weekly EPW Published on Saturday, JUNE 27, 2020 vol lV nos 26 & 27 109
Profi t and Loss AccountNet employee benefi t expenses (recognised in payments to and provisions for employees)
(` in crores)
31 March, 2020 31 March, 2019Current Service Cost* 109.92 98.60Interest on Defi ned Benefi t Obligation 168.87 159.70Expected Return on Plan Assets (205.73) (189.59)Net Actuarial Losses/(Gains) recognised in the year 36.86 29.89Total included in “Employee Benefi t Expense” [Schedule 16(I)] 109.92 98.60Actual Return on Plan Assets 173.11 132.30
* includes contribution of `0.40 crores towards staff deputed at subsidiaries (previous year `0.52 crores)Balance SheetDetails of provision for provident fund
(` in crores)
31 March, 2020 31 March, 2019Fair Value of Plan Assets 2,494.37 2,245.71Present Value of Funded Obligations (2,494.37) (2,245.71)Net Asset – –Amounts in Balance SheetLiabilities – –Assets – –Net Asset – –
Changes in the present value of the defi ned benefi t obligation are as follows: (` in crores)
31 March, 2020 31 March, 2019Change in Defi ned Benefi t ObligationOpening Defi ned Benefi t Obligation 2,245.71 2,006.65Current Service Cost 109.92 98.60Interest Cost 168.87 159.70Actuarial Losses/(Gains) 4.24 (27.40)Employees Contribution 276.90 217.42Liability transferred from/to other companies (14.90) (16.45)Benefi ts Paid (296.37) (192.81)Closing Defi ned Benefi t Obligation 2,494.37 2,245.71
Changes in the fair value of plan assets are as follows: (` in crores)
31 March, 2020 31 March, 2019Change in the Fair Value of AssetsOpening Fair Value of Plan Assets 2,245.71 2,006.65Expected Return on Plan Assets 205.73 189.59Actuarial Gains/(Losses) (32.62) (57.29)Employer contribution during the period 109.92 98.60Employee contribution during the period 276.90 217.42Assets transferred from/to other companies (14.90) (16.45)Benefi ts Paid (296.37) (192.81)
Closing Fair Value of Plan Assets 2,494.37 2,245.71
ECO
NOM
IC &
PO
LITI
CAL
WEE
KLY

Registered Offi ce: ‘Trishul’, 3rd fl oor, Opp. Samartheshwar Temple, Law Garden, Ellisbridge, Ahmedabad - 380 006.AXIS BANK LIMITED
18 Notes forming part of the fi nancial statements for the year ended 31 March, 2020 (Currency: In Indian Rupees)
Published on Saturday, JUNE 27, 2020 vol lV nos 26 & 27 EPW Economic & Political Weekly110
Experience adjustments (` in crores)
31 March, 2020 31 March, 2019 31 March, 2018 31 March, 2017 31 March, 2016
Defi ned Benefi t Obligations 2,494.37 2,245.71 2,006.65 1,688.78 1,439.02Plan Assets 2,494.37 2,245.71 2,006.65 1,688.78 1,439.02Surplus/(Defi cit) – – – – –Experience Adjustments on Plan Liabilities 4.24 (27.40) 12.10 20.83 12.08Experience Adjustments on Plan Assets (32.62) (57.29) (30.95) 0.58 (6.16)
Major categories of plan assets (managed by Insurers) as a percentage of fair value of total plan assets
31 March, 2020 31 March, 2019(in percentage) (in percentage)
Government securities 55 56Bonds, debentures and other fi xed income instruments 15 40Equity shares 4 3Others 26 1
31 March, 2020 31 March, 2019Discount rate for the term of the obligation 6.45% 7.65%Average historic yield on the investment portfolio 8.83% 8.88%Discount rate for the remaining term to maturity of the investment portfolio 6.85% 7.55%Expected investment return 8.43% 8.98%Guaranteed rate of return 8.50% 8.65%
The contribution to the employee’s provident fund (including Employee Pension Scheme) amounted to `197.75 crores (previous year `161.28 crores) for the year.
The Hon’ble Supreme Court of India (“SC”) by an order dated 28 February, 2019 in one case, set out the principles based on which allowances paid to the employees should be identifi ed for inclusion in basic wages for the purposes of computation of Provident Fund contribution. Basis subsequent clarifi cation provided by the Employees’ Provident Fund Organisation on the said order and an independent legal opinion, the Bank has implemented the principles laid down in the order effective 1 April, 2019.
SuperannuationThe Bank contributed `15.24 crores (previous year `16.29 crores) to the employees’ superannuation plan for the year.
National Pension Scheme (NPS)During the year, the Bank contributed 6.35 crores (previous year 5.19 crores) to the NPS for employees who have opted for the scheme.
Leave EncashmentThe liability of compensated absences of accumulated privileged leave of employees of the Bank is given below:
(` in crores)
31 March, 2020 31 March, 2019Liability – Privilege Leave 58.10 247.35Total included in “Employee Benefi t Expense” [Schedule 16(I)] (8.99) 46.62
GratuityThe following tables summarise the components of net benefi t expenses recognised in the Profi t and Loss Account and funded status and amounts recognised in the Balance Sheet for the Gratuity benefi t plan.
ECO
NOM
IC &
PO
LITI
CAL
WEE
KLY

Registered Offi ce: ‘Trishul’, 3rd fl oor, Opp. Samartheshwar Temple, Law Garden, Ellisbridge, Ahmedabad - 380 006.AXIS BANK LIMITED
18 Notes forming part of the fi nancial statements for the year ended 31 March, 2020 (Currency: In Indian Rupees)
Economic & Political Weekly EPW Published on Saturday, JUNE 27, 2020 vol lV nos 26 & 27 111
Profi t and Loss AccountNet employee benefi t expenses (recognised in payments to and provisions for employees)
(` in crores)
31 March, 2020 31 March, 2019
Current Service Cost 50.81 44.67
Interest on Defi ned Benefi t Obligation 32.95 29.15
Expected Return on Plan Assets (29.60) (24.61)
Net Actuarial Losses/(Gains) recognised in the year 40.95 7.86
Past Service Cost 0.78 –
Total included in “Employee Benefi t Expense” [Schedule 16(I)] 95.89 57.07
Actual Return on Plan Assets 22.86 33.97
Balance Sheet Details of provision for gratuity
(` in crores)
31 March, 2020 31 March, 2019
Fair Value of Plan Assets 467.75 391.91
Present Value of Funded ObligationsUnrecognised past service cost
(469.30)1.55
(402.15)2.33
Net Asset – (7.91)
Amounts in Balance SheetLiabilities – 7.91
Assets – –
Net Liability (included under Schedule 5 – Other Liabilities) – (7.91)
Changes in the present value of the defi ned benefi t obligation are as follows: (` in crores)
31 March, 2020 31 March, 2019Change in Defi ned Benefi t ObligationOpening Defi ned Benefi t Obligation 402.15 342.56Current Service Cost 50.81 44.67Interest Cost 32.95 29.15Actuarial Losses/(Gains) 34.21 17.22Past service cost – 2.33Benefi ts Paid (50.82) (33.78)
Closing Defi ned Benefi t Obligation 469.30 402.15
Changes in the fair value of plan assets are as follows: (` in crores)
31 March, 2020 31 March, 2019Change in the Fair Value of AssetsOpening Fair Value of Plan Assets 391.91 323.72Expected Return on Plan Assets 29.60 24.61Actuarial Gains/(Losses) (6.74) 9.36Contributions by Employer 103.80 68.00Benefi ts Paid (50.82) (33.78)
Closing Fair Value of Plan Assets 467.75 391.91
ECO
NOM
IC &
PO
LITI
CAL
WEE
KLY
Registered Offi ce: ‘Trishul’, 3rd fl oor, Opp. Samartheshwar Temple, Law Garden, Ellisbridge, Ahmedabad - 380 006.AXIS BANK LIMITED
18 Notes forming part of the fi nancial statements for the year ended 31 March, 2020 (Currency: In Indian Rupees)
Published on Saturday, JUNE 27, 2020 vol lV nos 26 & 27 EPW Economic & Political Weekly112
Experience adjustments (` in crores)
31 March, 2020
31 March, 2019
31 March, 2018
31 March, 2017
31 March, 2016
Defi ned Benefi t Obligations 469.30 402.15 342.56 284.83 232.55Plan Assets 467.75 391.91 323.72 279.65 232.56Surplus/(Defi cit) (1.55) (10.24) (18.84) (5.18) 0.01Experience Adjustments on Plan Liabilities (8.33) 7.50 4.39 6.64 2.78Experience Adjustments on Plan Assets (6.74) 9.36 4.59 (1.64) (5.36)
Major categories of plan assets (managed by Insurers) as a percentage of fair value of total plan assets
31 March, 2020 31 March, 2019(in percentage) (in percentage)
Government securities 30 38Bonds, debentures and other fi xed income instruments 42 48Money market instruments 2 5Equity shares 2 2Others 24 7
Principal actuarial assumptions at the Balance Sheet date:
31 March, 2020 31 March, 2019
Discount Rate 6.45% p.a. 7.65% p.a.Expected Rate of Return on Plan Assets 7.50% p.a. 7.50% p.a.Salary Escalation Rate 7.00% p.a. 7.00% p.a.
Employee Turnover – 18 to 30 (age in years) 24.00% 20.00% – 31 to 44 (age in years) 14.00% 10.00% – 45 & above (age in years) 8.00% 5.00%
The estimates of future salary increases considered in actuarial valuation take account of infl ation, seniority, promotion and other relevant factors.
The expected rate of return on plan assets is based on the average long-term rate of return expected on investments of the Fund during the estimated term of the obligations.
As the contribution expected to be paid to the plan during the annual period beginning after the balance sheet date is based on various internal/external factors, a best estimate of the contribution is not determinable.
The above information is as certifi ed by the actuary and relied upon by the auditors.
2.2.13 Provisions and contingencies a) Movement in provision for frauds included under other liabilities is set out below: (` in crores)
31 March, 2020 31 March, 2019
Opening balance at the beginning of the year 53.58 60.98Additions during the year 25.10 0.78Reductions on account of payments during the year (1.02) -Reductions on account of reversals during the year - (8.18)
Closing balance at the end of the year 77.66 53.58
ECO
NOM
IC &
PO
LITI
CAL
WEE
KLY

Registered Offi ce: ‘Trishul’, 3rd fl oor, Opp. Samartheshwar Temple, Law Garden, Ellisbridge, Ahmedabad - 380 006.AXIS BANK LIMITED
18 Notes forming part of the fi nancial statements for the year ended 31 March, 2020 (Currency: In Indian Rupees)
Economic & Political Weekly EPW Published on Saturday, JUNE 27, 2020 vol lV nos 26 & 27 113
b) Other liabilities include provision for reward points made on actuarial basis, the movement of which is set out below: (` in crores)
31 March, 2020 31 March, 2019
Opening provision at the beginning of the year 205.90 143.94Provision made during the year 214.56 127.22Reductions during the year (154.36) (65.26)
Closing provision at the end of the year 266.10 205.90
c) Movement in provision for other contingencies is set out below: (` in crores)
31 March, 2020 31 March, 2019
Opening provision at the beginning of the year 187.99 150.66Provision made during the year 2,655.00 655.26Reductions during the year – (617.93)
Closing provision at the end of the year 2,842.99 187.99
Closing provision includes provision for legal cases, other contingencies and provision for COVID-19 over and above regulatory requirement
2.2.14 Small and Micro Enterprises
Under the Micro, Small and Medium Enterprises Development Act, 2006 which came into force from 2 October, 2006, certain disclosures are required to be made relating to Micro, Small and Medium enterprises. There have been no reported cases of delays in payments to micro and small enterprises or of interest payments due to delays in such payments. The above is based on the information available with the Bank which has been relied upon by the auditors.
2.2.15 Corporate Social Responsibility (CSR)
a) Amount required to be spent by the Bank on CSR during the year `100.62 crores (previous year `127.94 crores).
b) Amount spent towards CSR during the year and recognized as expense in the statement of profi t and loss on CSR related activities is `100.96 crores (previous year `137.59 crores), which comprise of following –
(` in crores)
31 March, 2020 31 March, 2019
In cash Yet to be paid in cash (i.e. provision)
Total In cash Yet to be paid in cash (i.e. provision)
Total
Construction/ acquisition of any asset 0.28 – 0.28 11.89 – 11.89
On purpose other than above 95.33 5.35 100.68 125.13 0.57 125.70
2.2.16 Description of contingent liabilities a) Claims against the Bank not acknowledged as debts
These represent claims fi led against the Bank in the normal course of business relating to various legal cases currently in progress. These also include demands raised by income tax authorities and disputed by the Bank. In addition, the Bank holds provision of `68.88 crores as on 31 March, 2020 (previous year `56.06 crores) towards claims assessed as probable.
b) Liability for partly paid investmentsThis represents amounts remaining unpaid towards liability for partly paid investments.
c) Liability on account of forward exchange and derivative contracts The Bank enters into foreign exchange contracts, currency options/swaps, interest rate/currency futures and forward rate agreements on its own account and OTC for customers. Forward exchange contracts are commitments to buy or sell foreign currency at a future date at the contracted rate. Currency swaps are commitments to exchange cash fl ows by way of interest/principal in two currencies, based on ruling spot rates. Interest rate swaps are commitments to exchange fi xed and fl oating interest rate cash fl ows. Interest rate futures are standardised, exchange-traded contracts that represent a pledge to undertake a certain interest rate transaction at
ECO
NOM
IC &
PO
LITI
CAL
WEE
KLY

Registered Offi ce: ‘Trishul’, 3rd fl oor, Opp. Samartheshwar Temple, Law Garden, Ellisbridge, Ahmedabad - 380 006.AXIS BANK LIMITED
18 Notes forming part of the fi nancial statements for the year ended 31 March, 2020 (Currency: In Indian Rupees)
Published on Saturday, JUNE 27, 2020 vol lV nos 26 & 27 EPW Economic & Political Weekly114
a specifi ed price, on a specifi ed future date. Forward rate agreements are agreements to pay or receive a certain sum based on a differential interest rate on a notional amount for an agreed period. A foreign currency option is an agreement between two parties in which one grants to the other the right to buy or sell a specifi ed amount of currency at a specifi c price within a specifi ed time period or at a specifi ed future time. An Exchange Traded Currency Option contract is a standardised foreign exchange derivative contract, which gives the buyer the right, but not the obligation, to exchange money denominated in one currency into another currency at a pre-agreed exchange rate on a specifi ed date on the date of expiry. Currency Futures contract is a standardised, exchange-traded contract, to buy or sell a certain underlying currency at a certain date in the future, at a specifi ed price. The amount of contingent liability represents the notional principal of respective forward exchange and derivative contracts.
d) Guarantees given on behalf of constituents As a part of its banking activities, the Bank issues guarantees on behalf of its customers to enhance their credit standing. Guarantees represent irrevocable assurances that the Bank will make payments in the event of the customer failing to fulfi ll its fi nancial or performance obligations.
e) Acceptances, endorsements and other obligationsThese include documentary credit issued by the Bank on behalf of its customers and bills drawn by the Bank’s customers that are accepted or endorsed by the Bank.
f) Other items Other items represent outstanding amount of bills rediscounted by the Bank, estimated amount of contracts remaining to be executed on capital account, notional principal on account of outstanding Tom/Spot foreign exchange contracts, contracts for purchase of investments where settlement is due post balance sheet date, commitments towards underwriting and investment in equity through bids under Initial Public Offering (IPO) of corporates as at the year end, demands raised by statutory authorities (other than income tax) and disputed by the Bank and amount transferred to Depositor Education and Awareness Fund (DEAF).
During earlier years, the Bank, through one of its overseas branches, had arranged Trade Credit (Buyers Credit loans) against Letters of Undertaking (LOUs) issued by Punjab National Bank (PNB), which were subsequently alleged as fraudulent by PNB. Prior to this declaration by PNB, such buyer’s credit loans were sold down in the secondary market by the overseas branch to various participating banks under Risk Participation Agreements. As on 31 March, 2020, there is no funded exposure outstanding in the overseas branch pursuant to such sell down. PNB has repaid the aggregate amount of all LOUs due upto 31 March, 2020, pursuant to an undertaking issued to PNB, and made remittance to the overseas branch which has been passed on for onward payment to the participating banks. Based on the facts and circumstances of the case, internal fi ndings and legal opinion, the Bank does not expect PNB has any valid right at this point in time, for refund by the Bank of the aggregate amount paid by PNB towards LOUs due upto 31 March, 2020. However, as a matter of prudence, the aggregate amount of LOUs issued by PNB to the overseas branch against which buyer’s credit was extended, aggregating to `4,466.83 crores has been disclosed as part of Contingent Liabilities in the Balance Sheet.
The Bank has a process whereby periodically all long term contracts (including derivative contracts) are assessed for material foreseeable losses. At the year end, the Bank has reviewed and recorded adequate provision as required under any law/accounting standards for material foreseeable losses on such long term contracts (including derivative contracts) in the books of account and disclosed the same under the relevant notes in the fi nancial statements, where applicable.
2.2.17 Previous year fi gures have been regrouped and reclassifi ed, where necessary to conform to current year’s presentation.
In terms of our report attached. For Axis Bank Ltd.
For Haribhakti & Co. LLP Rakesh MakhijaChartered Accountants ChairmanICAI Firm Registration No.: 103523W/W100048
Purushottam Nyati S. Vishvanathan Girish Paranjpe B. Babu Rao Amitabh ChaudhryPartner Director Director Director Managing Director & CEOMembership No.: 118970
Date: 28 April, 2020 Girish V. Koliyote Puneet SharmaPlace: Mumbai Company Secretary Chief Financial Offi cer
ECO
NOM
IC &
PO
LITI
CAL
WEE
KLY

Economic & Political Weekly EPW Published on Saturday, june 27, 2020 vol lV nos 26 & 27 115EC
ONO
MIC
& P
OLI
TICA
L W
EEKL
Y

(Incorporated in France with limited liability)INDIAN BRANCHES
Published on Saturday, june 27, 2020 vol lV nos 26 & 27 EPW Economic & Political Weekly116
Report on audit of the Financial StatementsOpinion1. We have audited the accompanying fi nancial statements of Credit Agricole Corporate & Investment Bank – Indian Branches (‘the
Bank’), which comprise the Balance Sheet as at 31st March 2020, the Profi t and Loss Account, the Cash Flow Statement for the year then ended, and notes to the fi nancial statements including a summary of signifi cant accounting policies and other explanatory information.
2. In our opinion and to the best of our information and according to the explanations given to us, the aforesaid fi nancial statements give the information required by the Banking Regulation Act, 1949 as well as the Companies Act, 2013 in the manner so required for banking companies and are in conformity with accounting principles generally accepted in India and give a true and fair view of the state of affairs of the Bank as at 31st March 2020, and its profi t and its cash fl ows for the year ended on that date.
Basis for Opinion3. We conducted our audit in accordance with the Standards on Auditing (SAs) specifi ed under section 143(10) of the Companies Act, 2013. Our
responsibilities under those Standards are further described in the Auditor’s Responsibilities for the Audit of the Financial Statements section of our report. We are independent of the Bank in accordance with the Code of Ethics issued by the Institute of Chartered Accountants of India together with the ethical requirements that are relevant to our audit of the fi nancial statements under the provisions of the Companies Act, 2013 and the Rules there under, and we have fulfi lled our other ethical responsibilities in accordance with these requirements and the Code of Ethics. We believe that the audit evidence we have obtained is suffi cient and appropriate to provide a basis for our opinion.
Emphasis of Matter4. We draw attention to Note 18.7.6 of the fi nancial statements which describes the extent to which the COVID-19 pandemic will have impact on
Bank’s fi nancial performance. Our opinion is not modifi ed in respect of this matter.Information Other Than Financial Statements and Auditor’s Report Thereon 5. The Bank’s Management is responsible for the other information. The other information obtained at the date of this auditor’s report is
information included in the Basel III Pillar 3 disclosures, but does not include the fi nancial statements and our auditor’s report thereon. Our opinion on the fi nancial statements does not cover such other information and we do not express any form of assurance conclusion thereon.
6. Our responsibility in connection with the audit of the fi nancial statements is to read the other information and in doing so, examine if the other information is materially inconsistent with the fi nancial statements or our knowledge obtained in the audit, or otherwise appears to be materially misstated.If based on our examination, we conclude that there is material misstatement of this other information, we are required to report the fact. We have nothing to report in this regard.
Responsibilities of Management and Those Charged with Governance for the Financial Statements7. The Bank’s Management is responsible for the matters stated in section 134(5) of the Companies Act, 2013 with respect to the preparation of
these fi nancial statements that give a true and fair view of the fi nancial position, fi nancial performance and cash fl ows of the Bank in accordance with the accounting principles generally accepted in India, including the Accounting Standards specifi ed under Section 133 of the Companies Act, 2013, provisions of Section 29 of the Banking Regulation Act, 1949 and circulars and guidelines issued by the Reserve Bank of India (‘RBI’) from time to time. This responsibility also includes maintenance of adequate accounting records in accordance with the provisions of the Act for safeguarding of the assets of the Bank and for preventing and detecting frauds and other irregularities; selection and application of appropriate accounting policies; making judgments and estimates that are reasonable and prudent; and design, implementation and maintenance of adequate internal fi nancial controls, that were operating effectively for ensuring the accuracy and completeness of the accounting records, relevant to the preparation and presentation of the fi nancial statements that give a true and fair view and are free from material misstatement, whether due to fraud or error.
8. In preparing the fi nancial statements, management is responsible for assessing the Bank’s ability to continue as a going concern, disclosing, as applicable, matters related to going concern and using the going concern basis of accounting unless management either intends to liquidate the Bank or to cease operations, or has no realistic alternative but to do so. Bank’s management is also responsible for overseeing the Bank’s fi nancial reporting process.
Auditor’s Responsibilities for the audit of the Financial Statements9. Our objectives are to obtain reasonable assurance about whether the fi nancial statements as a whole are free from material misstatement,
whether due to fraud or error, and to issue an auditor’s report that includes our opinion. Reasonable assurance is a high level of assurance, but is not a guarantee that an audit conducted in accordance with SAs will always detect a material misstatement when it exists. Misstatements can arise from fraud or error and are considered material if, individually or in the aggregate, they could reasonably be expected to infl uence the economic decisions of users taken on the basis of these fi nancial statements.
10. As part of an audit in accordance with SAs, we exercise professional judgment and maintain professional skepticism throughout the audit. We also: • Identify and assess the risks of material misstatement of the fi nancial statements, whether due to fraud or error, design and perform audit
procedures responsive to those risks, and obtain audit evidence that is suffi cient and appropriate to provide a basis for our opinion. The risk of not detecting a material misstatement resulting from fraud is higher than for one resulting from error, as fraud may involve collusion, forgery, intentional omissions, misrepresentations, or the override of internal control.
• Obtain an understanding of internal control relevant to the audit in order to design audit procedures that are appropriate in the circumstances. Undersection 143(3)(i) of the Companies Act, 2013, we are also responsible for expressing our opinion on whether the Bank has adequate internal fi nancial controls system in place and the operating effectiveness of such controls.
• Evaluate the appropriateness of accounting policies used and the reasonableness of accounting estimates and related disclosures made by management.
Independent Auditor’s ReportToThe Senior Country Offi cer- India,Credit Agricole Corporate & Investment Bank– Indian Branches
ECO
NOM
IC &
PO
LITI
CAL
WEE
KLY

(Incorporated in France with limited liability)INDIAN BRANCHES
Economic & Political Weekly EPW Published on Saturday, june 27, 2020 vol lV nos 26 & 27 117
• Conclude on the appropriateness of management’s use of the going concern basis of accounting and, based on the audit evidence obtained, whether a material uncertainty exists related to events or conditions that may cast signifi cant doubt on the Bank’s ability to continue as a going concern. If we conclude that a material uncertainty exists, we are required to draw attention in our auditor’s report to the related disclosures in the fi nancial statements or, if such disclosures are inadequate, to modify our opinion. Our conclusions are based on the audit evidence obtained up to the date of our auditor’s report. However, future events or conditions may cause the Bank to cease to continue as a going concern.
• Evaluate the overall presentation, structure and content of the fi nancial statements, including the disclosures, and whether the fi nancial statements represent the underlying transactions and events in a manner that achieves fair presentation.
11. We communicate with those charged with governance regarding, among other matters, the planned scope and timing of the audit and signifi cant audit fi ndings, including any signifi cant defi ciencies in internal control that we identify during our audit. We also provide those charged with governance with a statement that we have complied with relevant ethical requirements regarding independence, and to communicate with them all relationships and other matters that may reasonably be thought to bear on our independence, and where applicable, related safeguards.
Report on Other Legal and Regulatory Requirements12. The Balance Sheet and the Profi t and Loss Account have been drawn up inaccordance with the provisions of Section 29 of the Banking
Regulation Act, 1949 and Section 133 of the Companies Act, 2013.13. As required by sub-section (3) of section 30 of the Banking Regulation Act, 1949, we report that: (a) we have obtained all the information and explanations which, to the best of our knowledge and belief, were necessary for the purpose of
our audit and have found them to be satisfactory; (b) the transactions of the Bank, which have come to our notice, have been within the powers of the Bank; (c) During the course of our audit we have performed select relevant procedures at one branch. Since the Bank’s key operations are
automated, with the key application largely integrated to the core banking systems, it does not require its branches to submit any fi nancial returns. Accordingly, our audit is carried out centrally at the Head Offi ce, based on the necessary records and data required for the purpose of the audit being made available to us.
14. Further, as required by section 143(3) of the Act, we report that: a) we have sought and obtained all the information and explanations which to the best of our knowledge and belief were necessary for the
purpose of our audit; b) in our opinion, proper books of account as required by law have been kept by the Bank so far as it appears from our examination of those books; c) the fi nancial accounting systems of the Bank are centralized and therefore, accounting returns for the purpose of preparation of fi nancial
statement are not required to be submitted by the branches; d) the Balance Sheet, the Profi t and Loss Account and the Cash Flow Statement dealt with by this report are in agreement with the books of
account; e) in our opinion, the aforesaid fi nancial statements comply with the Accounting Standards specifi ed under Section 133 of the Companies
Act, 2013, to the extent they are not inconsistent with the accounting policies prescribed by RBI; f) the requirements of section 164(2) of the Companies Act,2013 are not applicable considering the Bank is a branch of Credit Agricole
Corporate & Investment Bank, which is incorporated with limited liability in France; g) with respect to the adequacy of the internal fi nancial controls over fi nancial reporting of the Bank and the operating effectiveness of
such controls, refer to our separate Report in “Annexure A”; h) with respect to the other matters to be included in the Auditor’s Report in accordance with Rule 11 of the Companies (Audit and
Auditors) Rules, 2014, in our opinion and to the best of our information and according to the explanations given to us: i. the Bank has disclosed the impact of pending litigations on its fi nancial position in its fi nancial statements - Refer Schedule 12 and
Note 18.9.8 of Schedule 18 to the fi nancial statements; ii. the Bank has made provision, as required under the applicable law or accounting standards, for material foreseeable losses, if any,
on long term contracts including derivative contracts - Refer Note 18.14 of Schedule 18 to the fi nancial statements; iii. there were no amounts which were required to be transferred to the Investor Education and Protection Fund by the Bank. iv. with respect to the matter to be included in the Auditor’s Report under section 197(16), the requirements of Section 197 of the
Companies Act, 2013 are not applicable considering the Bank is a branch of Credit Agricole Corporate & Investment Bank, which is incorporated in France.
15. The fi nancial statements of the Bank for the year ended 31st March 2019, were audited by another auditor who expressed an unmodifi ed opinion on these statements on 28th May 2019.
For and on behalf ofA P Sanzgiri & CoChartered AccountantsFirm Regn. No. 116293W
Sd/-Ankush GoyalPartner(Membership No. 146017)
UDIN: 20146017AAAABD5956Place: MumbaiDate: June 16, 2020
ECO
NOM
IC &
PO
LITI
CAL
WEE
KLY

(Incorporated in France with limited liability)INDIAN BRANCHES
Published on Saturday, june 27, 2020 vol lV nos 26 & 27 EPW Economic & Political Weekly118
Annexure A to the Independent Auditor’s report of even date on the fi nancial statements of Credit Agricole Corporate & Investment Bank – Indian BranchesReport on the Internal Financial Controls Over Financial Reporting under Clause (i) of sub-section 3 of Section 143 of the Companies Act, 20131. We have audited the internal fi nancial controls over fi nancial reporting of Credit Agricole Corporate & Investment Bank – Indian
Branches (‘the Bank’) as at 31 March 2020 in conjunction with our audit of the standalone fi nancial statements of the Bank for the year ended on that date.
Management’s Responsibility for Internal Financial Controls over Financial Reporting2. The Bank’s Management is responsible for establishing and maintaining internal fi nancial controls based on the internal control over
fi nancial reporting criteria established by the Bank considering the essential components of internal control stated in the Guidance Note on Audit of Internal Financial Controls Over Financial Reporting (‘the Guidance Note’) issued by the Institute of Chartered Accountants of India (‘the ICAI’). These responsibilities include the design, implementation and maintenance of adequate internal fi nancial controls that were operating effectively for ensuring the orderly and effi cient conduct of its business, including adherence to Bank’s policies, the safeguarding of its assets, the prevention and detection of frauds and errors, the accuracy and completeness of the accounting records, and the timely preparation of reliable fi nancial information, as required under the Companies Act, 2013.
Auditor’s Responsibility3. Our responsibility is to express an opinion on the Bank’s internal fi nancial controls over fi nancial reporting based on our audit. We conducted
our audit in accordance with the Guidance Note and the Standards on Auditing (‘the Standards’), issued by the ICAI and deemed to be prescribed under section 143(10) of the Companies Act, 2013 to the extent applicable to an audit of internal fi nancial controls, both issued by the ICAI. Those Standards and the Guidance Note require that we comply with ethical requirements and plan and perform the audit to obtain reasonable assurance about whether adequate internal fi nancial controls over fi nancial reporting was established and maintained and if such controls operated effectively in all material respects.
4. Our audit involves performing procedures to obtain audit evidence about the adequacy of the internal fi nancial controls system over fi nancial reporting and their operating effectiveness. Our audit of internal fi nancial controls over fi nancial reporting included obtaining an understanding of internal fi nancial controls over fi nancial reporting, assessing the risk that a material weakness exists, and testing and evaluating the design and operating effectiveness of internal control based on the assessed risk. The procedures selected depend on the auditor’s judgement, including the assessment of the risks of material misstatement of the fi nancial statements, whether due to fraud or error.
5. We believe that the audit evidence we have obtained is suffi cient and appropriate to provide a basis for our audit opinion on the Bank’s internal fi nancial controls system over fi nancial reporting.
Meaning of Internal Financial Controls Over Financial Reporting6. A bank’s internal fi nancial control over fi nancial reporting is a process designed to provide reasonable assurance regarding the reliability
offi nancial reporting and the preparation of fi nancial statements for external purposes in accordance with generally accepted accounting principles. A bank’s internal fi nancial control over fi nancial reporting includes those policies and procedures that (1) pertain to the maintenance of records that, in reasonable detail, accurately and fairly refl ect the transactions and dispositions of the assets of the bank; (2) provide reasonable assurance that transactions are recorded as necessary to permit preparation of fi nancial statements in accordance with generally accepted accounting principles, and that receipts and expenditures of the bank are being made only inaccordance with authorizations of management of the bank; and (3) provide reasonable assurance regarding prevention or timely detection of unauthorized acquisition, use, or disposition of the bank’s assets that could have a material effect on the fi nancial statements.
Inherent Limitations of Internal Financial Controls Over Financial Reporting7. Because of the inherent limitations of internal fi nancial controls over fi nancial reporting, including the possibility of collusion or improper
management override of controls, material misstatements due to error or fraud may occur and not be detected. Also, projections of any evaluation of the internal fi nancial controls over fi nancial reporting to future periods are subject to the risk that the internal fi nancial control over fi nancial reporting may become inadequate because of changes in conditions, or that the degree of compliance with the policies or procedures may deteriorate.
Opinion8. In our opinion, the Bank has, in all material respects, an adequate internal fi nancial controls system over fi nancial reporting and such internal
fi nancial controls over fi nancial reporting were operating effectively as at 31 March 2020, based on the internal control over fi nancial reporting criteria established by the Bank considering the essential components of internal control stated in the Guidance Note issued by the ICAI.
For and on behalf ofA P Sanzgiri & CoChartered AccountantsFirm Regn. No. 116293W
Sd/-Ankush GoyalPartner(Membership No. 146017)
UDIN: 20146017AAAABD5956Place: MumbaiDate: June 16, 2020
ECO
NOM
IC &
PO
LITI
CAL
WEE
KLY

(Incorporated in France with limited liability)INDIAN BRANCHES
Economic & Political Weekly EPW Published on Saturday, june 27, 2020 vol lV nos 26 & 27 119
BALANCE SHEET AS AT MARCH 31, 2020 PROFIT AND LOSS ACCOUNT FOR THE YEAR ENDED MARCH 31, 2020
Schedules For the For the year ended year ended March 31, March 31, 2020 2019
INCOME
Interest earned 13 5,696,823 5,277,702 Other income 14 464,021 81,505
6,160,844 5,359,207
EXPENDITURE
Interest expended 15 3,057,822 3,019,059Operating expenses 16 1,595,638 1,660,450Provisions and contingencies 18.10.1 514,899 (919,077)
5,168,359 3,760,432
PROFIT
Net profi t for the year 992,485 1,598,775Profi t brought forward (3,198,624) (4,372,787)
(2,206,139) (2,774,012)
APPROPRIATIONS
Transfer to Statutory Reserve 248,121 399,694Remitted to Head Offi ce _ –Remittable profi t retained for capital adequacy – –Transfer to Investment Reserve 28,458 24,918Transfer to Capital Reserve – – Balance carried forward (2,482,718) (3,198,624)
(2,206,139) (2,774,012)
Signifi cant Accounting policies 17
Notes to Accounts 18
Schedules As at As at March 31, March 31, 2020 2019
CAPITAL AND LIABILITIES
Capital 1 10,971,666 9,783,701 Reserves and surplus 2 8,308,286 7,315,801 Deposits 3 65,506,423 27,048,614 Borrowings 4 8,524,945 34,464,271 Other liabilities and provisions 5 119,818,961 75,819,952
Total Liabilities 213,130,281 154,432,339
ASSETS
Cash and balances with Reserve Bank of India 6 10,170,876 2,340,786 Balances with banks and money at call and short notice 7 5,506,872 8,990,402 Investments 8 35,010,343 23,021,469 Advances 9 50,409,872 50,309,614 Fixed assets 10 208,149 229,842 Other assets 11 111,824,169 69,540,226
Total Assets 213,130,281 154,432,339 Contingent liabilities 12 7,099,239,533 5,473,299,419
Bills for collection 38,555,974 33,848,941
Signifi cant Accounting policies 17
Notes to Accounts 18
All amounts in thousands of Indian Rupees All amounts in thousands of Indian Rupees
The accompanying schedules are an integral part of the fi nancial statements
As per our attached report of even date For A P Sanzgiri & Co CREDIT AGRICOLE CORPORATE & INVESTMENT BANKChartered Accountants Indian Branches ICAI Firm Registration No: 116293W Sd/- Sd/- Sd/- Ankush Goyal Ravinarayanan Iyer Loic BorreyPartner Chief Financial Offi cer - India Chief Operating Offi cer - IndiaMembership Number - 146017
Mumbai June 16, 2020
ECO
NOM
IC &
PO
LITI
CAL
WEE
KLY

(Incorporated in France with limited liability)INDIAN BRANCHES
Published on Saturday, june 27, 2020 vol lV nos 26 & 27 EPW Economic & Political Weekly120
CASH FLOW STATEMENT FOR THE YEAR ENDED MARCH 31, 2020
(All amounts in thousands of Indian Rupees)
For the For the year ended year ended March 31, 2020 March 31, 2019
Cash fl ow from operating activities Net Profi t after taxes 992,485 1,598,775Adjustments for : Depreciation on fi xed assets 56,716 42,067Provision for other liabilities 1,039 (50,835)Provision for taxes 238,273 – Provision for depreciation on investments (67,371) (58,993)Provisions for country risk, standard assets, bad and doubtful debts (Funded/Non Funded) & write off 123,958 (863,248)Provisions for CVA 219,000 54,000(Profi t)/ Loss on sale of fi xed assets 3,792 36
1,567,892 721,802Adjustments for : (Increase)/Decrease in Investments (11,921,503) (5,030,732)(Increase)/Decrease in Advances (100,258) (10,708,516)Increase/(Decrease) in Borrowings (20,199,461) 19,469,434Increase/(Decrease) in Deposits 38,457,809 26,233(Increase)/Decrease in Other Assets (42,267,117) (39,999,591)Increase/(Decrease) in Other Liabilities and Provisions 43,655,012 42,282,087
7,624,482 6,038,915Direct Taxes Paid (Net) (255,098) –
Net Cash fl ow from operating activities (A) 8,937,276 6,760,717Cash fl ow from investing activities Purchase of fi xed assets (41,946) (94,102)Proceeds from sale of fi xed assets 3,130 2,572
Net cash fl ow from investing activities (B) (38,816) (91,530)
Cash fl ow from fi nancing activities Capital remittance from Head Offi ce 1,187,965 – Profi ts remitted to Head Offi ce – – Subordinated debt taken/(repaid) from/to Head Offi ce (5,739,865) –
Net Cash fl ow from fi nancing activities (C) (4,551,900) –
Net increase in cash and cash equivalents (A + B + C ) 4,346,560 6,669,187
Cash and cash equivalents at the beginning of the year as per Schedules 6 & 7 11,331,188 4,662,001Cash and cash equivalents at the end of the year as per Schedules 6 & 7 15,677,748 11,331,188 The accompanying schedules are an integral part of the fi nancial statements As per our attached report of even date For A P Sanzgiri & Co CREDIT AGRICOLE CORPORATE & INVESTMENT BANKChartered Accountants Indian Branches ICAI Firm Registration No: 116293W Sd/- Sd/- Sd/- Ankush Goyal Ravinarayanan Iyer Loic BorreyPartner Chief Financial Offi cer - India Chief Operating Offi cer - IndiaMembership Number - 146017
Mumbai June 16, 2020
ECO
NOM
IC &
PO
LITI
CAL
WEE
KLY

(Incorporated in France with limited liability)INDIAN BRANCHES
Economic & Political Weekly EPW Published on Saturday, june 27, 2020 vol lV nos 26 & 27 121
As at As at March 31, March 31, 2020 2019
4 BORROWINGS In India Reserve Bank of India – 920,000 Banks other than Reserve Bank of India 4,000,000 14,000,000 Other institutions and agencies – 1,898,657 Outside India From Head Offi ce and its Branches (Incl export refi nance) 1,120,020 8,793,774 Subordinated Debt from Head Offi ce in foreign currency 3,404,925 8,851,840 8,524,945 34,464,271 Secured borrowings included in above 180,680 11,612,431 (Repos and Export Refi nance are secured)
5 OTHER LIABILITIES AND PROVISIONS Interoffi ce adjustments/transactions – – Bills payable 4,231 6,190 Interest accrued 319,479 289,252 Mark-to-market (MTM) adjustments on Foreign Exchange and Derivative contracts (Gross) 115,419,402 73,408,467 Others 4,075,849 2,116,043 [includes CSA margin received Rs. 1,642,400 (P.Y. NIL) Provision for standard assets Rs 905,300 (P.Y. Rs.786,900) Provision for CVA Rs.424,000 (P.Y. Rs. 205,000)] 119,818,961 75,819,952
6 CASH AND BALANCES WITH RESERVE BANK OF INDIA Cash in hand 89 43 Balances with Reserve Bank of India In current accounts 1,600,787 2,340,743 In other accounts (Reverse repo under LAF) 8,570,000 – 10,170,876 2,340,786
7 BALANCES WITH BANKS AND MONEY AT CALL AND SHORT NOTICE In India Balances with banks In Current accounts 16,580 52,508 Money at call and short notice With Other institutions – – Outside India In Current accounts 5,490,292 8,937,894 In other deposit accounts – – Money at call and short notice – – 5,506,872 8,990,402
All amounts in thousands of Indian Rupees All amounts in thousands of Indian Rupees
As at As at March 31, March 31, 2020 2019
1 CAPITAL Capital Opening balance 9,783,701 9,783,701 Additions during the year 1,187,965 – 10,971,666 9,783,701
10,971,666 9,783,701
Deposit kept with the Reserve Bank of India under section 11(2)(b) of the Banking Regulation Act, 1949 (Face Value) 4,180,000 3,780,000
2 RESERVES AND SURPLUS Statutory reserve Opening balance 4,012,465 3,612,771 Additions during the year 248,121 399,694 Closing balance 4,260,586 4,012,465
Investment Reserve Opening balance 246,950 222,032 Additions during the year 28,458 24,918 Closing balance 275,408 246,950
Capital reserve Opening balance 174,731 174,731 Closing balance 174,731 174,731
General Reserve Opening balance 250,670 250,670 Closing balance 250,670 250,670
Remittable profi t retained for capital adequacy Opening balance 5,829,609 5,829,609 Closing balance 5,829,609 5,829,609
Balance in profi t and loss account (2,482,718) (3,198,624)
8,308,286 7,315,801
3 DEPOSITS Demand deposits From banks 82,262 55,839 From others 5,714,150 5,610,406 Savings bank deposits 9,847 18,804 Term deposits From banks 3,060,000 – From others 56,640,164 21,363,565
Total Deposits 65,506,423 27,048,614
Deposits of branches in India 65,506,423 27,048,614
65,506,423 27,048,614
SCHEDULES TO THE FINANCIAL STATEMENTS AS AT MARCH 31, 2020
ECO
NOM
IC &
PO
LITI
CAL
WEE
KLY

(Incorporated in France with limited liability)INDIAN BRANCHES
Published on Saturday, june 27, 2020 vol lV nos 26 & 27 EPW Economic & Political Weekly122
All amounts in thousands of Indian Rupees All amounts in thousands of Indian Rupees
SCHEDULES TO THE FINANCIAL STATEMENTS AS AT MARCH 31, 2020
As at As at March 31, March 31, 2020 2019
Other than premises (including furniture & fi xtures) Cost - beginning of the year 318,951 271,567 Additions during the year 41,946 94,102 Deductions during the year (18,628) (46,718) Gross book value 342,269 318,951 Depreciation to date (231,480) (192,857) Net book value 110,789 126,094
208,149 229,842
11 OTHER ASSETS Interoffi ce adjustments/ transactions – – Interest accrued 717,538 462,621 Mark-to-market (MTM) adjustments on Foreign Exchange and Derivative contracts (Gross) 107,492,496 65,765,954 Advance tax/Tax deducted at source ( net of provisions) 2,240,244 2,223,419 Deferred tax asset ( Net ) (Refer Schedule 18 - Note 18.9.5) – – Others (Initial/Variable Margin:INR 976,510; P.Y.INR 697,747) 1,373,891 1,088,232
111,824,169 69,540,226
12 CONTINGENT LIABILITIES Transfers to Depositor Education and Awareness Fund 42,140 41,293 Claims against the bank not acknowledged as debts 55,000 55,000 Liability on account of outstanding: a) Forward exchange contracts 5,322,668,940 4,092,857,288 b) Currency option contracts 14,771,662 18,863,174 c) Other Derivative contracts (including currency futures) 1,692,830,156 1,285,766,586 Guarantees given on behalf of constituents : In India 21,812,079 18,927,995 Outside India 28,898,078 43,026,037 Letter of credit 4,600,054 5,428,942 Acceptances, endorsements and other obligations 12,510,669 7,366,793 Other items for which the bank is contingently liable 1,050,755 966,311
7,099,239,533 5,473,299,419
As at As at March 31, March 31, 2020 2019
8 INVESTMENTS Investments in India in Government securities 35,010,343 23,088,840 Shares – – Others – – Gross Investments in India 35,010,343 23,088,840 Less : Depreciation in the value of investments – (67,371) Net Investments in India 35,010,343 23,021,469 Investments outside India – – 35,010,343 23,021,469
Government securities includes the following at Face Value (amounts in INR ‘000):
a) Securities kept as collateral under ‘Securities Segment’ of 8,427,000 & Default Fund of 5,000 with Clearing Corporation of India Ltd (CCIL) (PY 3,490,000 and 5,000 respectively)
b) Securities kept as collateral for ‘Triparty Repo’ of 6,000,000 & Default Fund of 6,000 with CCIL. (PY 5,200,000 and 3,800 respectively)
c) Securities kept as Default Fund for ‘Forex Forward’ of 777,000 & for ‘Forex Settlement’ of 117,000 with CCIL.(PY 430,700 and 128,000 respectively)
d) Securities deposited with RBI under repo NIL (PY 889,670)
9 ADVANCES Bills purchased and discounted 6,927,233 22,137,996 Cash credits, overdrafts and loans repayable on demand 37,201,884 25,826,618 Term loans 6,280,755 2,345,000 50,409,872 50,309,614 Secured by tangible assets (includes secured against book debts) 2,703,496 2,581,697 Covered by bank/ government guarantees 7,893,703 20,419,083 Unsecured 39,812,673 27,308,834 50,409,872 50,309,614 Advances in India Priority sectors 6,226,511 12,867,628 Banks – – Others 44,183,361 37,441,986 50,409,872 50,309,614 The Bank has purchased Priority Sector Lending Certifi cates
with Face Value Rs. 15,372,500 (P.Y. 5,787,500) to meet PSL needs. The same is not included as part of advances
10 FIXED ASSETS Premises Cost – beginning of the year 212,938 212,938 Additions during the year – – Deductions during the year – – Gross book value 212,938 212,938 Depreciation to date (115,578) (109,190) Net book value 97,360 103,748
ECO
NOM
IC &
PO
LITI
CAL
WEE
KLY

(Incorporated in France with limited liability)INDIAN BRANCHES
Economic & Political Weekly EPW Published on Saturday, june 27, 2020 vol lV nos 26 & 27 123
All amounts in thousands of Indian Rupees All amounts in thousands of Indian Rupees
For the For the year ended year ended March 31, March 31, 2020 2019
13 INTEREST EARNED Interest /discount on advances/bills 3,375,743 3,470,117 Income on investments 2,090,768 1,556,567 Interest on balances with the Reserve Bank of India and other interbank funds (includes income from tri party reverse repo) 165,287 111,743 Others (including on margin placements with QCCPs/ Credit Support Annexe margin and on income tax refunds) 65,025 139,275 5,696,823 5,277,702
14 OTHER INCOME Commission, exchange and brokerage 426,329 224,556 Profi t/(Loss) on sale of investments (134,107) (67,516) PSLC premium expenses (83,829) (30,641) Profi t/(Loss) on sale of Fixed assets (3,792) (36) Income on Exchange & Derivative transactions 257,765 (48,553) Miscellaneous Income (net) 1,655 3,695 464,021 81,505
SCHEDULES TO THE FINANCIAL STATEMENTS AS AT MARCH 31, 2020
For the For the year ended year ended March 31, March 31, 2020 2019
15 INTEREST EXPENDED Interest on deposits 2,321,476 1,802,618 Interest on Reserve Bank of India/ interbank borrowings (includes Triparty repo interest expense) 406,143 712,601 Others (includes interest on Sub-Debt and interest on collateral received under Credit Support Annex) 330,203 503,840 3,057,822 3,019,059
16 OPERATING EXPENSES Payments to and provisions for employees 648,129 601,697 Rent, taxes & lighting 53,757 54,077 Printing & stationery 2,564 2,627 Advertisement & publicity 994 2,973 Depreciation on bank’s property 56,716 42,067 Auditors’ fees & expenses (incl. Tax Audit) 2,640 3,500 Law charges 43,636 24,990 Postage, telegrams, telephone etc. 24,891 16,846 Repairs & maintenance 50,710 41,355 Insurance 38,671 31,520 Other expenditure [Please refer Note 18.8.2 for signifi cant items] 672,930 838,798 1,595,638 1,660,450
17. SIGNIFICANT ACCOUNTING POLICIES17.1 General 17.1.1 Background The fi nancial statements for the year ended March 31, 2020 comprise the accounts of the Indian branches of Credit Agricole
Corporate & Investment Bank (‘the Bank’) which is incorporated in France with Limited Liability. 17.1.2 Basis of preparation The fi nancial statements have been prepared in accordance with requirements prescribed under the Third Schedule of the
Banking Regulation Act, 1949. The accounting policies used in the preparation of these fi nancial statements, in all material aspects, conform to Generally Accepted Accounting Principles in India (Indian GAAP), the guidelines issued by Reserve Bank of India (RBI) from time to time, the Accounting Standards (AS) issued by the Institute of Chartered Accountants of India (ICAI) and prescribed under Section 133 of the Companies Act, 2013 (‘Act’) and the Companies (Accounting Standards) Amendment Rules 2016, read with Rule 7 of the Companies (Account) Rules, 2014, the provisions of the Act and practices generally prevalent in the banking industry in India. The Bank follows the accrual method of accounting, except where otherwise stated, and the historical cost convention.
17.1.3 Use of estimates The preparation of fi nancial statements requires the management to make estimates and assumptions to be considered in the
reported amounts of assets and liabilities (including contingent liabilities) as of the date of the fi nancial statements and the reported income and expense during the reporting period. Management believes that the estimates used in the preparation of the fi nancial statements are prudent and reasonable. Future results could differ from these estimates.
17.2 Transactions involving foreign exchange and derivatives 17.2.1 Foreign currency assets and liabilities are translated at the spot exchange rates prevailing at the close of the year as notifi ed by
the Foreign Exchange Dealers’ Association of India (FEDAI) and the resultant gain or loss is accounted in Profi t and Loss Account.
17.2.2 Income and expenditure items in foreign currency are translated at the exchange rates prevailing on the date of the transaction.
ECO
NOM
IC &
PO
LITI
CAL
WEE
KLY

(Incorporated in France with limited liability)INDIAN BRANCHES
Published on Saturday, june 27, 2020 vol lV nos 26 & 27 EPW Economic & Political Weekly124
17.2.3 Outstanding forward foreign exchange contracts designated as ‘Trading’ as at balance sheet date are fair valued based on the exchange rates notifi ed by FEDAI for specifi ed maturities. The marked to market assets/liabilities as at the reporting date are shown at gross value in the balance sheet.
17.2.4 Outstanding forward foreign exchange contracts designated as ‘Hedging’ and spot exchange contracts as at balance sheet date are revalued at the spot exchange rates, prevailing at the close of the year as notifi ed by FEDAI. Premium / discount on these forward foreign exchange contracts are evenly spread over the tenor of the contract and are recognized as income / expense.
17.2.5 Outstanding derivatives contracts, designated as ‘Trading’, are measured at their fair value. The resulting profi t / losses are recognized in the Profi t & Loss Account. The marked to market assets/liabilities as at the reporting date are shown at gross value in the balance sheet.
17.2.6 Outstanding derivatives contracts, designated as ‘Hedging’, are undertaken for hedging interest rate risks and the income/expenditure on these derivative contracts is accounted for on an accrual basis over the life of the contract. The hedge contracts are marked to market in case the underlying is marked to market.
17.2.7 Contingent liabilities on account of guarantees, acceptances, endorsements and other obligations are stated at the spot exchange rates prevailing at the close of the year as notifi ed by FEDAI.
17.2.8 In respect of derivative transactions, any overdue receivables representing positive Marked to Market (MTM) value due to the Bank, which remains unpaid for a period of 90 days from the specifi ed due date for payment, as well as the recognized positive MTM in respect of future receivables, as per RBI guidelines are reversed from the Profi t & Loss Account.
17.3 Investments 17.3.1 Investments are classifi ed as “Available for Sale (AFS)”, “Held for Trading (HFT)” or “Held to Maturity (HTM)” based on
intent at the time of its purchase, in accordance with the RBI guidelines. The Bank follows the settlement date method of accounting (the Bank records an off balance sheet commitment for the purchase / sale of the security on the trade date). Cost of investments is determined on the FIFO cost basis. In determining cost of investment, brokerage, commission etc. paid at the time of purchase/sale is charged to the Profi t and Loss Accounts. Broken period interest paid at the time of acquisition of security is not capitalized.
17.3.2 Profi t/Loss on sale of Investment under aforesaid three categories are recognized in Profi t and Loss Account to the extent specifi ed in RBI circular.
17.3.3 The investment held under the “Held for Trading”, “Available for sale” and “Held to Maturity” categories are valued in accordance with the guidelines issued by the RBI. Investments under ‘Available for Sale’ and ‘Held for Trading’ categories are valued monthly at the market price or fair value as declared by Financial Benchmark India Pvt. Ltd. (FBIL). Securities under each category are valued scrip-wise and depreciation/appreciation is aggregated for each category. Net depreciation, if any, is provided for in the Profi t & Loss Account and net appreciation (if any) is ignored per category. Treasury bills and certifi cates of deposits, being discounted instruments, are valued at carrying cost. Investments classifi ed under “Held to Maturity (HTM)” are carried at their acquisition cost or amortized cost, if acquired at a premium/discount to the face value.
17.3.4 In accordance with the RBI’s Master Circular DBR No.BP.BC.6/21.04.141/2015-16 dated 1st July 2015, and FIMCIR/2017-18/001 dated April 03, 2017, any reversal of provision on account of depreciation in the HFT and AFS categories in excess of the required amount in any fi nancial year is credited to the Profi t & Loss Account and an equivalent amount (net of taxes if any and net of transfer to Statutory Reserve) is appropriated to an Investment Reserve Account (IRA) shown under Reserves and Surplus in Schedule 2. IRA is utilized on an event of provision creation on account of depreciation in HFT and AFS categories by debiting to the Profi t and Loss Account and an equivalent amount (net of tax benefi t, if any, and net of consequent reduction in the transfer to Statutory Reserve), is transferred from the IRA to the P&L Account.
17.3.5 In accordance with the RBI regulations, repurchase and reverse repurchase transactions are accounted for as secured borrowing and lending transaction respectively. The expenditure/ income in respect of such transactions are treated as interest expense/income.
17.4 Advances 17.4.1 Advances are classifi ed into performing and non-performing advances based on the management’s periodic internal assessment
and RBI’s prudential norms on classifi cation, including the COVID-19 Regulatory Package – Asset Classifi cation and Provisioning circular RBI/2019-20/220 DOR.No.BP.BC.63/21.04.048/2019-20 dated April 17,2020.
17.4.2 Provisions for non-performing advances are made as per the guidelines prescribed by the RBI. The related interest on such non performing advances is not recognized as income until received.
17.4.3 In addition to the specifi c provision on NPAs, the Bank maintains a general provision on standard assets (including on positive mark to market gain on derivatives portfolio) as per RBI guidelines. This general provision also includes the incremental provisioning requirement towards un-hedged foreign currency exposures introduced vide RBI’s Circular DBOD No.BP.BC.85/21.06.200/2013-14 dated 15th January 2014 effective 1st April 2014.
The Bank also considers the RBI circular RBI/2016-17/282, DBR.No.BP.BC.64/21.04.048/2016-17 dated April 18, 2017 and titled Additional Provisions for Standard Advances at higher than the prescribed rates and RBI/2016-17/50 DBR.BP.BC.No.8/21.01.003/2016-17 dated August 25, 2016 titled Guidelines on Enhancing Credit Supply for Large Borrowers through Market Mechanism.
17.5 Fixed assets and depreciation 17.5.1 Fixed assets are stated at cost less accumulated depreciation.
ECO
NOM
IC &
PO
LITI
CAL
WEE
KLY

(Incorporated in France with limited liability)INDIAN BRANCHES
Economic & Political Weekly EPW Published on Saturday, june 27, 2020 vol lV nos 26 & 27 125
17.5.2 Depreciation has been provided on straight line method, over the estimated useful lives, as determined by the management, at the rates mentioned below per annum:
Premises* 33 Years Furniture and Fixtures 10 Years Offi ce and Residential Equipment* 4 Years Motor Vehicles* 5 Years Computers and Software 3 Years 17.5.3 The useful lives of fi xed assets marked with * above are different than those specifi ed under schedule II of Companies Act 2013.
The management believes that useful life of fi xed assets currently considered for the purpose of depreciation fairly refl ect its estimate of the useful lives and residual values of fi xed assets.
17.5.4 Depreciation to the extent of the original cost is charged to the Profi t & Loss Account starting from the month of purchase. 17.5.5 Depreciation of assets with original cost below INR 5,000 is provided at 100% 17.6 Revenue recognition and related matters Interest income is recognized on an accrual basis except interest income on non-performing assets on a case by case basis, which is
recognized upon realization as per the applicable RBI guidelines. Income on discounted instrument is recognized over the tenor of the instrument on a straight-line basis. Commission received on Guarantees /Letter of Credit issued is amortized on a straight-line basis over the period of the Guarantees / Letter
of Credit. Other fees and commission income are recognized on accrual basis. Fees paid for purchase of Priority Sector Lending Certifi cate are recognized in accordance with the RBI guidelines.17.7 Employees benefi ts 17.7.1 Provident Fund The Bank contributes to a recognized provident fund. These contributions are accounted for on an accrual basis and recognized
in the Profi t & Loss Account. 17.7.2 Gratuity The Bank makes an annual contribution to an insurance company for amounts notifi ed by the said insurance company. The
Bank provides for gratuity based on an independent external actuarial valuation at the balance sheet date using the Projected Unit Credit Method.
17.7.3 Leave Encashment/Compensated Absences The Bank does not have a policy of encashment of un-availed leave, except at the time of separation of an eligible employee. The Bank
provides for leave encashment/compensated absences based on an independent external actuarial valuation at the balance sheet date. 17.7.4 Long service award The Bank rewards its eligible employees under the long service award pay plan, which is a non-contributory defi ned benefi t
plan. The Bank provides for this plan based on an independent external actuarial valuation at the balance sheet date. 17.7.5 Actuarial gains/losses Actuarial gains/losses are immediately recognized/provided for in the Profi t & Loss Account. 17.8 Operating lease transactions Leases, where the lessor effectively retains substantially all the risks and benefi ts of ownership are classifi ed as operating leases. Operating
lease payments are recognized as an expense in the Profi t & Loss Account on a straight line basis over the lease term.17.9 Taxation Provision for corporate tax is arrived at after due consideration of the applicable law, judicial pronouncements and / or legal counsels’
opinion on the issues. The charge for taxation during the year comprises current tax charge and the net change in the deferred tax asset and liability during the year. The Bank accounts for deferred taxes in accordance with provisions of Accounting Standard (AS) 22 “Accounting for Taxes on Income” issued by Institute of Chartered Accountants of India (ICAI). Deferred taxation is provided on timing differences between accounting and tax treatment of income/expenditure. Deferred tax assets are recognized only to the extent there is reasonable certainty that the assets can be realized in the future. However, where there is unabsorbed depreciation or carried forward loss under taxation laws, deferred tax assets are recognized only if there is virtual certainty of realization of such assets. Deferred tax assets/liabilities are measured using tax rates that have been substantially enacted as on balance sheet date.
Minimum Alternative Tax (‘MAT’) under the provisions of the Income-tax Act, 1961 is recognized as current tax in the Profi t and Loss Account. The credit available under the Act in respect of MAT paid is recognized as an asset only when and to the extent there is convincing evidence that the Bank will pay normal income tax during the period for which the MAT credit can be carried forward for set-off against the normal tax liability. MAT credit recognized as an asset is reviewed at each Balance Sheet date and written down to the extent the aforesaid convincing evidence no longer exists.
17.10 Accounting for Provisions, Contingent Liabilities and Contingent Assets The Bank estimates the probability of any loss that might be incurred on outcome of contingencies on the basis of information available up to the date
on which the fi nancial statements are prepared. A provision is recognized when the Bank has a present obligation as a result of past event and it is probable that an outfl ow of resources will be required to settle the obligation, in respect of which a reliable estimate can be made. Provisions are determined based on management’s estimate required to settle the obligations at the balance sheet date, supplemented by experience of similar transactions. These are reviewed at each balance sheet date and adjusted to refl ect the management’s current estimates. In cases where the available information indicates that the loss on the contingency is reasonably possible but the amount of loss cannot be reasonably estimated, a disclosure is made in the fi nancial statements. In case of remote possibility, neither provisions nor disclosure is made in the fi nancial statements.
17.11 Cash and Cash Equivalents Cash and cash equivalents include cash in hand, balances with RBI, balances with other banks and money at call and short notice.
ECO
NOM
IC &
PO
LITI
CAL
WEE
KLY

(Incorporated in France with limited liability)INDIAN BRANCHES
Published on Saturday, june 27, 2020 vol lV nos 26 & 27 EPW Economic & Political Weekly126
18. Notes to Accounts18.1 Capital As per the RBI guidelines on Capital to Risk Weighted Assets Ratio (CRAR) issued, banks are required to compute their capital
requirement under Basel III effective June 30, 2013. The CRAR as per Basel III is 12.43% (Previous year 12.74%). The CRAR of the Bank, calculated as per RBI Basel III guidelines is given below. (Amount in crore) S. No. Particulars 2020 2019 (i) Common Equity Tier I Capital Ratio (%) 10.17% 10.26% (ii) Tier I Capital Ratio (%) 10.17% 10.26% (iii) Tier II Capital Ratio (%) 2.26% 2.48% (iv) Total Capital Ratio (%) 12.43% 12.74% (v) Amount of Interest free funds raised from HO in the year 118.80 Nil (vi) Amount of Additional Tier I capital raised from HO in the year Nil Nil (vii) Amount of Tier II capital raised from HO in the year Nil Nil Details of Sub-Debt raised from CA-CIB Head offi ce outstanding as of 31.03.2020 are as follows: Date of Receipt Maturity date Amount Tenor October 13, 2016 October 13, 2026* USD 45 millions 10 years * With a call option after 5 years exercisable only after prior RBI approval. Details of Sub-Debt raised from CA-CIB Head offi ce outstanding as of 31.03.2019 are as follows: Date of Receipt Maturity date Amount Tenor September 18, 2009 September 18, 2019 USD 43 millions 10 years August 3, 2011 August 5, 2019 USD 40 millions 8 years October 13, 2016 October 13, 2026* USD 45 millions 10 years * With a call option after 5 years exercisable only after prior RBI approval. 18.2 Investments 18.2.1. Value of investments (Amount in crore) 2020 2019 (1) Value of Investments Gross Value of Investments 3,501.03 2,308.89 In India 3,501.03 2,308.89 Outside India – – Provisions for Depreciation – (6.74) In India – (6.74) Outside India – – Net Value of Investments 3,501.03 2,302.15 In India 3,501.03 2,302.15 Outside India – – (2) Movement of provisions held towards depreciation on investments Opening balance 6.74 12.64 Add: Provisions made during the year – – Less: Write-off, excess provisions written back during the year (6.74) (5.90) Closing balance – 6.74
18.2.2. Repo and Reverse Repo transactions (including LAF) (Amount in crore) Particulars Minimum Maximum Daily average Outstanding outstanding outstanding outstanding as at during the year during the year during the year March 31, 2020 Securities sold under repo i. Government securities – 878.69 286.03 – (–) (585.35) (53.91) (281.87) ii. Corporate debt securities – – – – (–) (–) (–) (–) Securities bought under reverse repo i. Government securities – 857.00 183.97 857.00 (–) (649.95) (45.42) (–) ii. Corporate debt securities – – – – (–) (–) (–) (–) 1. The above transactions are inclusive of repos and reverse repos done with RBI and under tri-party repo with the Clearing Corporation
of India. 2. The previous year’s fi gures are shown in brackets. 3. Amounts are based on actual borrowing and lending under repo and reverse repo respectively 4. Minimum & Average outstanding during the year includes days with Nil outstanding.
ECO
NOM
IC &
PO
LITI
CAL
WEE
KLY

(Incorporated in France with limited liability)INDIAN BRANCHES
Economic & Political Weekly EPW Published on Saturday, june 27, 2020 vol lV nos 26 & 27 127
18.2.3. Non-SLR investment portfolio i) Issuer composition of Non-SLR investments There were no Non-SLR investments as on March 31, 2020 and March 31, 2019. ii) Non performing Non-SLR investments There were no non performing Non-SLR investments as on March 31, 2020 and March 31, 2019. 18.2.4. Sale and Transfers to/from HTM Category The Bank does not have any investments in the HTM category as on March 31, 2020 and March 31, 2019. As such, there were no
sale and transfer to/from HTM category during the year ending March 31, 2020 and March 31, 2019.18.3 Derivatives 18.3.1. Forward rate agreements/Interest rate swaps (Amount in crore) Particulars 2020 2019 i) The notional principal of swap agreements 149,873.67 111,054.71 Of which: • IRS 149,873.67 111,054.71 • FRA NIL NIL ii) Losses which would be incurred if counter parties failed to fulfi ll their obligations under the agreements 1,659.44 856.79 iii) Collateral required by the Bank upon entering into swaps 150.67 18.78 iv) Concentration of credit risk arising from the swaps* 95.17% 93.51% v) The fair value of the swap book -341.77 -254.04 * Based on total credit exposure amount, the maximum single industry exposure lies with the banking industry (incl. interbank deals
novated to CCIL). The nature and terms of the IRS as on March 31, 2020 are set out below (Amount in crore)
Nature No. of Trades Notional Principal Benchmark Term Trading 733 32,305.81 OIS Fixed Receivable v/s Floating Payable Trading 731 33,338.63 OIS Floating Receivable v/s Fixed Payable Trading 300 15,183.00 MIFOR Fixed Receivable v/s Floating Payable Trading 306 16,746.00 MIFOR Floating Receivable v/s Fixed Payable Trading 7 1,754.51 LIBOR Floating Receivable v/s Floating Payable Trading 150 26,110.47 LIBOR Floating Receivable v/s Fixed Payable Trading 120 24,435.25 LIBOR Fixed Receivable v/s Floating Payable 2,347 149,873.67 The nature and terms of the IRS as on March 31, 2019 are set out below
(Amount in crore)
Nature No. of Trades Notional Principal Benchmark Term Trading 486 19,634.44 OIS Fixed Receivable v/s Floating Payable Trading 397 21,065.40 OIS Floating Receivable v/s Fixed Payable Trading 207 10,418.00 MIFOR Fixed Receivable v/s Floating Payable Trading 233 13,679.28 MIFOR Floating Receivable v/s Fixed Payable Trading 6 1,798.03 LIBOR Floating Receivable v/s Floating Payable Trading 120 22,203.50 LIBOR Floating Receivable v/s Fixed Payable Trading 119 22,256.06 LIBOR Fixed Receivable v/s Floating Payable 1,568 111,054.71
18.3.2. Exchange traded interest rate derivatives (Amount in crore) Sr. No. Particulars 2020 2019 1 Notional principal amount of exchange traded interest rate derivatives undertaken during the year NIL NIL 2 Notional principal amount of exchange traded interest rate derivatives outstanding as on 31st March NIL NIL 3 Notional principal amount of exchange traded interest rate derivatives outstanding and not “highly effective”. NIL NIL 4 Mark-to-market value of exchange traded interest rate derivatives outstanding and not “highly effective”. NIL NIL
18.3.3. Credit Default Swap The bank does not deal in Credit Default Swap transactions
ECO
NOM
IC &
PO
LITI
CAL
WEE
KLY

(Incorporated in France with limited liability)INDIAN BRANCHES
Published on Saturday, june 27, 2020 vol lV nos 26 & 27 EPW Economic & Political Weekly128
18.3.4. Disclosures on risk exposure in derivatives Qualitative Disclosure: Products The Bank offers derivative products to its customers for hedging various types of risk exposures. The Bank is also an active
market maker in the derivative market. The derivative transactions expose the Bank primarily to counterparty credit risk, market risk, operational risk, interest rate, liquidity risk and foreign exchange risk.
Organization architecture The Bank has a derivative desk within the Global Markets front offi ce in India, which deals in derivative transactions. The Bank has
independent back-offi ce and mid-offi ce as per regulatory guidelines. The Bank has a credit and market risk department that processes various counterparty and market risks limit assessments, within the risk architecture and processes of the bank. The back-offi ce is part of the operations and mid-offi ce is under the control of Risk, thus providing segregation of functions and effective controls.
Policies for hedging risk The derivative transactions entered are as per the internal policy framed by head offi ce of the Bank and also in accordance with
the guidelines issued by Reserve Bank of India. Separately, the Bank has also a policy on “Suitability and Customer Appropriateness” put in place as per the group norms. The head offi ce of the Bank has formulated New Activities and Product guidelines to identify, evaluate, monitor and to control key risks for all derivative products before undertaking any transaction. Towards this end, the Bank has a New Activities and Product Committee which validates these products taking into account various risks and local requirements for dealing in such products.
All the transactions undertaken by the Bank for trading purpose are classifi ed under trading book, which are marked to market on daily basis. Other transactions are classifi ed as part of banking book. Derivative transactions in the nature of balance sheet hedges are identifi ed at inception and the hedge effectiveness is measured periodically.
Risk measurement and monitoring The Bank uses Value at Risk (VaR) to measure and monitor all market risk related activities. Back testing of VaR models are
carried out to ensure pre-determined levels of accuracy are maintained. In addition to VaR, other sensitivity measures like PV01, stress testing and limits specifi c to instruments and currency are placed and applied as risk management tools. Option risks are controlled through full revaluation limits in conjunction with limits on underlying variables that determine option’s value. This monitoring is done by the treasury mid-offi ce (Market Activity Monitoring department) on a daily basis through system reports and advised to senior management as appropriate. The Bank ensures that the gross PV01 of all non-option rupee derivative contracts are within 0.25 percent of the net worth, of the Bank as on the last day of the balance sheet.
The Bank enters into derivative deals within credit limits set for each counterparty by the risk department. These limits are set based on the Bank’s credit risk assessment for the counterparty which inter alia considers the ability of the counterparty to honor its obligations in the event of crystallization of the exposure. Exposures against these limits are monitored on day to day basis by an independent risk department at local as well as at head offi ce level. The Bank applies the current exposure methodology to manage credit risk associated with derivative transactions. This is calculated by taking the cost of replacing the contract, where its mark-to-market value is positive together with an estimate of the potential future change in the market value of the contract, refl ecting the volatilities that affect it. The credit risk on contracts with a negative mark-to-market value is restricted to the potential future change in their market value. Bank obtains standard ISDA documentation from the counterparties to cover the derivative transactions.
Provisioning, collateral and credit risk mitigation The exposure taken on derivative contracts are also subject to provisioning and asset classifi cation as per Bank’s internal guidelines
and assessment subject to minimum RBI norms on provisioning. Appropriate credit covenants and collaterals are stipulated where required for risk mitigation and termination events to call for collaterals or for reducing the risk by terminating the contracts.
For accounting policies on derivatives please refer Schedule 17.2 Quantitative Disclosure (Amount in crore) 2020 2019 Sr. No Particulars Currency Interest Rate Currency Interest Rate Derivatives* Derivatives# Derivatives* Derivatives# (i) Derivatives (Notional Principal) a) For hedging – – – – b) For trading 20,886.52 149,873.67 19,408.27 111,054.71 (ii) Marked to Market Positions (net) a) Assets (+) 343.20 1,659.44 393.12 856.79 b) Liability (–) -801.72 -2,001.21 -648.45 -1,110.83 (iii) Credit Exposure 2,116.01 2,926.77 1,710.98 1,902.20 (iv) Likely impact of one percentage change in interest rate (100*PV01) a) On hedging derivatives – – – – b) On trading derivatives (96.81) 113.91 (62.55) 42.01 (v) Maximum and minimum of 100*PV01 observed during the year a) On hedging Minimum – – – – Maximum – – – – b) On trading Minimum (53.79) 41.78 (62.83) 10.45 Maximum (96.81) 130.10 (14.18) 53.61
* Currency Derivatives include exchange traded currency futures and FX options. # Interest Rate Derivatives include interest rate options, if any.
ECO
NOM
IC &
PO
LITI
CAL
WEE
KLY

(Incorporated in France with limited liability)INDIAN BRANCHES
Economic & Political Weekly EPW Published on Saturday, june 27, 2020 vol lV nos 26 & 27 129
18.4 Asset quality 18.4.1. Non-performing assets** (Amount in crore) 2020 2019 (i) Net NPAs to Net Advances 0.00% 0.00% (ii) Movement of NPAS (gross) Opening balance 3.17 383.56 Additions during the year – 13.45 Reductions during the year (0.24) (393.84) Exchange rate movement – – Closing balance 2.93 3.17 (iii) Movement of net NPAs Opening balance – 56.99 Additions during the year – – Reductions during the year – (56.99) Exchange rate movement – – Closing balance – – (iv) Movement of provisions for NPAs (excluding provisions on standard assets) Opening balance 3.17 326.56 Provisions made during the year – 70.45 Write-off/write-back of excess provisions during the year (including recovery) (0.24) (393.84) Exchange rate movement – – Closing balance 2.93 3.17
** The information disclosed pertains to only advances (as reported in Schedule 9 of the Balance Sheet) 18.4.2. Divergence in the asset classifi cation and provisioning The RBI vide circular no. DBR.BP.BC.No.63/21.04.018/2016-17 & DBR.BP.BC.No.32/21.04.018/2018-19, titled “Disclosure in
the Notes to Accounts to the Financial Statements - Divergence in the asset classifi cation and provisioning” released on April 18, 2017 & April 01, 2019 respectively has advised banks to include a disclosure with respect to the additional provisioning requirement or the additional gross NPA assessed by RBI for the fi nancial year.
There has been no NPA divergence observations/comments for the FY 2018-19 and FY 2017-18 and accordingly disclosures as required vide the above circular are not applicable.
18.4.3. Non-Performing Assets (Mark to Market on Derivative deals) As per the guidelines issued by RBI vide notifi cation DBOD.No.BP.BC.28/21.04.157/2011-12 dated August 11, 2011,
Crystallized Receivables – Positive MTM on terminated derivative deals overdue for more than 90 days have been reported under “Schedule 11- Other Assets” after netting of the “Suspense crystallized receivables”. The Gross value of crystallized receivables as on March 31, 2020 is Nil (Previous year: -Nil) and the Net value is Nil (Previous year: Nil).
18.4.4. Particulars of accounts restructured During the year, the Bank has not subjected any loans/assets to restructuring (Previous year Nil). 18.4.5. Details of fi nancial assets sold to Securitisation/Reconstruction Company for Asset Reconstruction (Amount in crore) Sr. No. Particulars 2020 2019 1 No. of accounts – 3 2 Aggregate value (net of provisions) of accounts sold to SC/RC – – 3 Aggregate consideration – 139.04 4 Additional consideration realized in respect of accounts transferred in earlier years – – 5 Aggregate gain/(loss) over net book value – 139.04 18.4.6. Details of non-performing fi nancial assets purchased/sold to/from banks The Bank has not sold or purchased non-performing assets to/from banks in India during the year (Previous year Nil). 18.4.7. Provisions towards standard assets (Amount in crore) Particulars 2020 2019 Provisions towards standard assets (including provision for derivative, un-hedged foreign currency exposure & additional provision at higher than prescribed rates) 90.53 78.69
18.5 Business Ratios (Amount in crore unless otherwise stated) Sr. No. Particulars 2020 2019 (i) Interest Income as a percentage to working funds 3.93% 3.88% (ii) Non-Interest income as a percentage to working funds 0.32% 0.06% (iii) Operating Profi t as a percentage to working funds 1.04% 0.50% (iv) Return on Assets 0.68% 1.17% (v) Business (Deposits + Advances) per employee 115.08 78.88 (vi) Profi t per employee 1.01 1.63 Notes:- a) Employees as of balance sheet date are considered for computation of ratios. b) Deposit & Advances (excluding interbank) outstanding as of balance sheet date are taken for calculating ratios in (v) above. c) Working funds is average of total assets of Form X as reported to RBI. d) Operating profi t = Interest Income + Other Income – Interest Expenses – Operating Expenses
ECO
NOM
IC &
PO
LITI
CAL
WEE
KLY

(Incorporated in France with limited liability)INDIAN BRANCHES
Published on Saturday, june 27, 2020 vol lV nos 26 & 27 EPW Economic & Political Weekly130
18.6 Asset liability management: Maturity pattern of assets and liabilities Year ended March 31, 2020 (D/M/Y indicate days/months/years respectively) (Amount in crore)
Particulars 1D 2D to 8D to 15D to 31D to Over 3M Over 6M Over 1Y Over 3Y Over Total 7D 14D 30D 3M & up to & up to & up to & up to 5Y 6M 1Y 3Y 5Y Advances 199.76 307.05 866.18 728.54 1,227.87 434.04 895.51 377.04 5.00 – 5,040.99 Investments 1,728.98 655.49 100.54 205.79 242.48 202.00 65.22 157.84 – 142.69 3,501.03 Deposits 48.38 1,434.68 489.06 2,518.51 1,253.57 180.75 173.77 451.92 – – 6,550.64 Borrowings – 93.93 – 4.41 400.00 13.66 – – – 340.49 852.49 Foreign currency assets 549.03 54.32 183.02 32.17 122.14 67.58 – 29.12 – 40.70 1,078.08 Foreign currency liabilities 8.40 101.01 7.02 11.89 22.23 25.04 12.79 78.36 – 340.49 607.23
Year ended March 31, 2019 (D/M/Y indicate days/months/years respectively) (Amount in crore)
Particulars 1D 2D to 8D to 15D to 31D to Over 3M Over 6M Over 1Y Over 3Y Over Total 7D 14D 30D 3M & up to & up to & up to & up to 5Y 6M 1Y 3Y 5Y Advances 119.18 513.45 811.76 552.63 1,391.88 1,108.91 332.03 131.62 69.50 – 5,030.96 Investments 746.30 602.38 268.50 84.49 175.22 154.30 88.03 79.44 – 103.49 2,302.15 Deposits 50.71 627.45 306.73 231.76 948.10 70.32 32.26 437.53 – – 2,704.86 Borrowings – 1,186.21 301.40 173.57 808.23 633.18 32.64 – – 311.20 3,446.43 Foreign currency assets 894.00 3.47 301.67 178.81 460.04 255.80 132.95 26.62 – 496.19 2,749.55 Foreign currency liabilities 8.51 12.92 309.90 180.31 336.42 642.98 57.79 79.93 – 311.20 1,939.96 Classifi cation of assets and liabilities under the different maturity buckets are compiled by management based on the guidelines issued by
the RBI and are based on the same assumptions as used by the Bank for compiling the return submitted to the RBI and which have been relied upon by the Auditors.
18.7 Exposures 18.7.1. Exposure to real estate sector (Amount in crore) Particulars 2020 2019 Direct exposure – – Residential Mortgages – – Residential Mortgages – Individual housing loans up to INR 20 lakh – – Residential Mortgages – All Others – – Commercial Real Estate – – Investments in MBS and other securitized exposures – – Residential Real Estate – – Commercial Real Estate – – Any Other-Direct Exposure – Please Specify – – Indirect Exposure 150.00 – Funded and Non-Funded exposures NHB and Housing Finance Companies (HFCs) 150.00 – Any Other-Indirect Exposure – Please Specify – – Total Exposure to Real Estate Sector (A + B) 150.00 –
18.7.2. Exposure to capital market (Amount in crore) 2020 2019 (i) Direct investment in equity shares, convertible bonds, convertible debentures
and units of equity-oriented mutual funds the corpus of which is not exclusively invested in corporate debt; – – (ii) Advances against shares/bonds/debentures or other securities or on clean basis
to individual for investment in shares (including IPOs/ESOPs), convertible bonds, convertible debentures, and units of equity-oriented mutual fund; – – (iii) Advances for any other purpose where shares or convertible bonds or convertible debenture or units of equity-oriented mutual fund are taken as primary security; – – (iv) Advance for any other purpose to the extent secured by the collateral security
of shares or convertible bonds or convertible debentures or units of equity oriented mutual fund i.e. where the primary security other than shares/convertible bonds/ convertible debentures/units of equity oriented mutual
fund does not fully cover the advances; – –
ECO
NOM
IC &
PO
LITI
CAL
WEE
KLY

(Incorporated in France with limited liability)INDIAN BRANCHES
Economic & Political Weekly EPW Published on Saturday, june 27, 2020 vol lV nos 26 & 27 131
18.7.2. Exposure to capital market (Continued) (Amount in crore) 2020 2019 (v) Secured and unsecured advances to stockbrokers and guarantees issued on behalf of stockbrokers and market makers; – – (vi) Loan sanctioned to corporate against security of share/ bonds/ debentures
or other security or on clean basis for meeting promoter’s contribution to the equity of new companies in anticipation of raising resources; – – (vii) Bridge loan to companies against expected equity fl ows/issues; – – (viii) Underwriting commitments taken up by the banks in respect of primary issue
of shares or convertible bonds or convertible debenture or units of equity oriented mutual fund; – – (ix) Financing to stockbrokers for margin trading; – – (x) All exposures to Venture Capital Funds (both registered and unregistered) – – Total exposure to capital market – – 18.7.3. Risk category wise country exposure (Amount in crore)
Risk category Exposure(net) as at Provision held as at Exposure(net) as at Provision held as at March 31, 2020 March 31, 2020 March 31, 2019 March 31, 2019 Insignifi cant 4,149.22 3.31 3,487.00 2.44 Low 188.11 0.00 298.36 0.15 Moderate – – 5.53 – High – – – – Very High – – – – Restricted – – – – Off-Credit – – – – Total 4,337.33 3.31 3,790.89 2.59 Note: Exposures computed on a net basis i.e., gross exposure ‘minus’ for cash collaterals, bank guarantees and credit insurance available
in/ issued by countries in a lower risk category than the country on which exposure is assumed 18.7.4. Details of Single Borrower Limit (SBL)/Group Borrower Limit (GBL) exceeded by the bank During FY 2019-20, the Bank has taken group borrower exposure above 25% of capital funds with the approval of the bank’s
local credit committee in the below cases: Name of Borrower During the year 2019-20 As at 31.3.2020 FORD GROUP 25.49% 18.08% TATA GROUP 26.03% 20.54% During FY 2018-19, the Bank has taken single borrower exposure above 15% of capital funds with the approval of the Bank’s local credit
committee in the below cases: Name of Borrower During the year 2018-19 As at 31.3.2019 AUROBINDO PHARMA LTD 17.16% 14.96% HINDALCO INDUSTRIES LTD 17.00% 14.96% DR REDDYS LABORATORIES LTD 16.17% 14.96% SIEMENS GAMESA RENEWABLE POWER PVT LTD 15.88% 14.96% DAIMLER INDIA COMMERCIAL VEHICLES PVT LTD 15.26% 15.00% 18.7.5. Unsecured Advances – advances granted against intangible securities There are no advances granted against intangible securities such as charge over the rights, licenses, authority, etc. during the
year (Previous year Nil). 18.7.6. COVID19 Regulatory Package – Asset Classifi cation and Provisioning (Amount in crore) Sr No. Particulars Amounts (i) Respective amounts in SMA/overdue categories, where the moratorium/deferment was extended NIL (ii) Respective amount where asset classifi cation benefi ts is extended NIL (iii) Provisions made during the Q4FY2020 and Q1FY2021 NIL (iv) Provisions adjusted during the respective accounting periods against slippages and the residual provisions NIL Assessment of COVID-19 impact: The banking services being under essential services, the operations of the bank continued during the lock down period due to
COVID-19. The bank has been constantly reviewing the evolution due to COVID-19 and the related impact on business including that of regulatory evolutions. As of 31st March 2020, there are no impacts of material nature due to the same. There remains a level of uncertainty about the time required for business operations to normalize but the bank management does not estimate any signifi cant impact on its business and fi nancial results on long term basis at this juncture considering the composition of its credit portfolio and borrowers credit worthiness and also the constant review of borrowers undertaken by the bank management.
ECO
NOM
IC &
PO
LITI
CAL
WEE
KLY

(Incorporated in France with limited liability)INDIAN BRANCHES
Published on Saturday, june 27, 2020 vol lV nos 26 & 27 EPW Economic & Political Weekly132
18.8 Regulatory Disclosures related to Profi t and Loss Account 18.8.1. Penalties imposed by the Reserve Bank of India (RBI) There have been no instances of penalty imposed and other actions taken by the Reserve Bank of India. (Previous year: NIL). 18.8.2. Other Operating Expenses Details of signifi cant expenses included in other operating expenses (Schedule 16) are as follows:
(Amount in crore) Sr No. Particulars March 31, 2020 March 31, 2019 (i) HO expenses (allocated expenses excl. taxes) 12.81 15.07 (ii) IT expenses - HO/Branches (excl. taxes) 23.85 28.59 (iii) Back Offi ce and other Support Costs (excl. taxes) 9.54 8.72
18.9 Disclosures as per Accounting Standards (AS) 18.9.1. Accounting Standard 15 - Employee benefi ts 18.9.1.1. Provident fund The Guidance Note on implementing AS 15 states that benefi ts involving employer established provident funds,
which requires interest shortfalls to be provided, are to be considered as defi ned benefi t plans. As per the information available with the bank, there is no interest shortfall to be provided as at March 31, 20 (Previous year Nil). The amount charged to P&L in the current year is INR 1.99 crore (PY INR 1.60 crore).
18.9.1.2. Gratuity The following table gives the disclosures regarding the Gratuity Scheme in accordance with Accounting Standard 15
(Revised) as notifi ed by the Companies (Accounting Standards) Rules 2006. (Amount in crore) (1) Changes in Defi ned Benefi t Obligation during the year Particulars 2020 2019 Opening Defi ned Benefi t Obligation 5.71 5.43 Interest cost 0.37 0.40 Current service cost 0.63 0.62 Benefi ts paid (0.55) (0.29) Actuarial (gain)/losses (0.26) (0.45) Closing Defi ned Benefi t Obligation 5.90 5.71
(2) Changes in fair value of Plan Assets Particulars 2020 2019 Opening fair value of Plan Assets 5.80 5.50 Expected return on Plan Assets 0.40 0.42 Contributions 0.20 0.16 Benefi ts paid (0.55) (0.29) Transfer Out (0.51) – Actuarial gain/(losses) (0.01) 0.01 Closing fair value of Plan Assets 5.33 5.80
(3) Net (Asset) /Liability recognised in the Balance Sheet Particulars 2020 2019 Present value of obligations as at year end 5.90 5.71 Fair value of Plan Assets as at year end (5.33) (5.80) Net (Asset)/Liability recognised in Balance Sheet 0.57 (0.09)
(4) Amount recognised in the Profi t & Loss Account Particulars 2020 2019 Current service cost 0.63 0.62 Interest cost 0.37 0.40 Expected return on Plan Assets (0.40) (0.42) Net actuarial losses/(gain) recognised in the year (0.25) (0.46) Past service cost – – Amount recognised in the Profi t & Loss Account 0.35 0.14
(5) Experience Adjustments Particulars 2020 2019 2018 2017 2016 Value of Obligation 5.90 5.71 5.43 5.79 6.06 Fair Value of Plan Assets 5.33 5.80 5.50 4.86 4.94 Experience Adjustment on Plan Liabilities (Gain)/Loss (0.16) (0.01) (0.11) (0.88) 0.15 Experience Adjustment on Plan Assets Gain/(Loss) (0.03) 0.00 0.39 (0.38) 0.02
ECO
NOM
IC &
PO
LITI
CAL
WEE
KLY
(Incorporated in France with limited liability)INDIAN BRANCHES
Economic & Political Weekly EPW Published on Saturday, june 27, 2020 vol lV nos 26 & 27 133
18.9.1.3. Other Long Term Employee Benefi ts Amount of INR 0.28 crore [Previous year INR 0.10 crore] is charged in Profi t & Loss Account towards provision for
Long Term Employee Benefi ts included under the head “Payments to and provisions for employees”. Details of Provisions outstanding for various long Term Employees’ Benefi ts are as below:
(Amount in crore) Sr. No. Long Term Employees’ Benefi ts 2020 2019 1 Compensated absences including Leave Encashment at the time of separation/retirement 1.55 1.38 2 Long Service Award 0.69 0.58 Total 2.24 1.96
18.9.1.4. Principal actuarial assumptions 31st March 2020 Long Service Award Gratuity Leave Encashment Discount rate 6.84% 6.84% 6.84% Expected rate of return on plan assets N.A. 7.25% N.A. Salary escalation rate N.A. 5.00% 5.00% Mortality rate Indian Assured Lives Mortality (2012-14) Ultimate Attrition Rate 6.00% 6.00% 6.00%
31st March 2019 Long Service Award Gratuity Leave Encashment Discount rate 7.54% 7.54% 7.54% Expected rate of return on plan assets N.A. 7.50% N.A. Salary escalation rate N.A. 6.00% 6.00% Mortality rate Indian Assured Lives Mortality (2012-14) Ultimate Attrition Rate 7.00% 7.00% 7.00% 18.9.1.5. Superannuation The Superannuation fund of the Bank has been discontinued effective April 01, 2010. An application to wind up the
fund was made to the Income tax authorities and we have received approval from them on Jan 07, 2014. We received approval on Superannuation withdrawal from LIC on July 29, 2015. There has been withdrawal from the fund by employees during the year, though few employees are yet to revert and as such the Superannuation Fund Account continues to have balance.
18.9.2. Accounting Standard 17 – Segment reporting i. In line with the RBI guidelines, the Bank has identifi ed “Global Market Operations”, “Corporate/Wholesale Banking” and
“Other Banking Operations” as the primary reporting segments. ii. Global Market Operations includes foreign exchange (merchant and inter-bank), money market, derivatives trading
and liquidity management. Corporate/Wholesale Banking includes commercial client relationships, structured & international fi nance, debt/local syndications, trade fi nance, correspondent banking, cash management activities, corporate fi nance/advisory and Distressed Assets. Other Banking Operations comprises activities other than Global Market Operations and Corporate/Wholesale Banking (mainly internal capital management).
iii. The methodology of funds transfer pricing between the segments, which is essentially based on market rates, is determined by the Bank’s Assets & Liabilities Committee from time to time.
iv. The Bank operates only in domestic segment. Year ended March 31, 2020 (Amount in ` crore) Business Segments Global Market Corporate/ Other Banking Total Operations Wholesale Banking Operations** Revenue 147.71 351.53 116.84 616.08 Result 39.75 12.47 83.67 135.89 Unallocated expenses (12.81) Operating Profi t/Loss 123.08 Income taxes (23.83) Net Profi t/Loss 99.25 Other Information Segment assets 15,990.58 5,048.55 49.88 21,089.01 Unallocated assets# 224.02 Total Assets 21,313.03 Segment liabilities 12,299.65 6,692.46 392.92 19,385.03 Unallocated Liabilities* 1,928.00 Total Liabilities 21,313.03
ECO
NOM
IC &
PO
LITI
CAL
WEE
KLY

(Incorporated in France with limited liability)INDIAN BRANCHES
Published on Saturday, june 27, 2020 vol lV nos 26 & 27 EPW Economic & Political Weekly134
Year ended March 31, 2019 (Amount in crore) Business Segments Global Market Corporate/ Other Banking Total Operations Wholesale Banking Operations** Revenue 144.07 274.49 117.37 535.92 Result 29.08 83.20 62.66 174.95 Unallocated expenses (15.07) Operating Profi t/Loss 159.88 Income taxes – Net Profi t/Loss 159.88 Other Information Segment assets 10,140.74 5,038.87 41.28 15,220.89 Unallocated assets# 222.34 Total Assets 15,443.23 Segment liabilities 9,085.87 3,703.11 944.30 13,733.28 Unallocated Liabilities* 1,709.95 Total Liabilities 15,443.23 (Segment details as compiled by Management and relied upon by the Auditors) # Unallocated assets represent advance tax net of provision & deferred tax assets if any * Unallocated liabilities represent capital & reserves ** Subordinated Borrowing & related interest expenses are reported under other banking operations. 18.9.3. Accounting Standard 18 - Related party disclosures: As per AS 18 “Related Party Disclosures”, notifi ed under section 133 of the Companies Act 2013, read together with paragraph 7
of the Companies (Accounts) Rules 2014, the Bank’s related parties for the year ended March 31, 2020 are disclosed below: i. Related party relationships with whom transactions have occurred during the year including outstanding: Sr. No. Relationships Party Name 1. Parent The bank is a branch of Credit Agricole Corporate & Investment Bank SA,
a limited liability company in France headquartered at Paris and Credit Agricole SA is the ultimate Holding Company.
2. Fellow subsidiaries Companies which have a common ultimate holding company for year ended 2020 a) Credit Agricole Friuladria SPA b) Credit Agricole Italia SPA c) Banca Popolare Friuladria SPA d) Le Credit Lyonnais e) CRCAM De Champagne Bourgogne f) CRCAM Des Savoie g) Bankoa SA h) Credit Agricole Egypt. SAE i) CRCAM Atlantique Vendee j) CRCAM Centre Est k) CRCAM Nord de France l) Credit Agricole Alpes Provence m) CAISSE Regionale de Credit Agricole n) Credit Agricole Cariparma SPA o) Union De Banques Arabes Et Francaises Other related party for year ended 2020 a) Grameen Credit Agricole Microfi nance Foundation* * Created in 2008 at the joint initiative of Crédit Agricole’s Directors and
Professor Yunus, founder of the Grameen Bank Companies which have a common ultimate holding company for year ended 2019 a) Credit Agricole Srbija Ad Novi SAD b) Banca Popolare Friuladria SPA c) Le Credit Lyonnais d) CRCAM Sud Rhone Alpes e) CRCAM Des Savoie f) Bankoa SA g) BNI Madagascar h) Credit Du Maroc S.A. i) CRCAM De L Anjou Et Du Maine j) Credit Agricole Egypt. SAE k) CRCAM Atlantique Vendee l) CRCAM Centre Est m) CRCAM Nord de France n) Credit Agricole Alpes Provence o) CAISSE Regionale de Credit Agricole p) Credit Agricole Bank Polska SA q) Credit Agricole Cariparma SPA
ECO
NOM
IC &
PO
LITI
CAL
WEE
KLY

(Incorporated in France with limited liability)INDIAN BRANCHES
Economic & Political Weekly EPW Published on Saturday, june 27, 2020 vol lV nos 26 & 27 135
18.9.3. Accounting Standard 18 - Related party disclosures: (Continued) Sr. No. Relationships Party Name
Subsidiaries of Head Offi ce for year ended 2020 a) Credit Agricole CIB (China) Limited b) Credit Agricole CIB Services Pvt Ltd c) CA Indosuez Switzerland SA d) Credit Agricole CIB Algerie SPA e) Indosuez W I Carr Securities India Private Limited f) CA Indosuez Wealth Europe Union de Banques Arabes et Francaises Subsidiaries of Head Offi ce for year ended 2019 a) Credit Agricole CIB (China) Limited b) Credit Agricole CIB Services Pvt Ltd c) CA Indosuez Switzerland SA d) Credit Agricole CIB Algerie SPA e) Indosuez W I Carr Securities India Private Limited f) CA Indosuez Wealth Europe Union de Banques Arabes et Francaises g) Banque Saudi Fransi 3. Key Management Mr. Aymeric DE REYNIES, SCO as at 31st Mar 20 Personnel Mr. Emmanuel BOUVIER D’YVOIRE, SCO as at 31st Mar 19 Related parties are identifi ed by the management and relied upon by the auditors. ii. The details of transactions/ fi nancial dealings of the Bank with the above related parties are detailed below except
where there is only one related party (i.e. Parent, overseas branches of parent and Key Management Personnel), or where the Bank has an obligation under law to maintain confi dentiality in respect of their customer transactions.
(Amount in crore) Items/Related party Fellow Subsidiaries 2020 Fellow Subsidiaries 2019 Outstanding Maximum Outstanding Maximum outstanding outstanding Advances – – 6.05 411.85 Deposit 4.68 9.43 4.62 5.54 Net Other Liabilities 0.44 NA 0.12 NA Net Other Assets – NA – NA Non-funded commitments 44.50 125.22 118.67 333.11 For the year For the year For the year Interest expenses 0.08 NA 0.05 NA Interest income – NA 1.24 NA Charges paid 11.78 NA 9.71 NA Non-interest income 0.27 NA 0.37 NA Purchase of fi xed assets – – – – Sale of fi xed assets – – – – The information is compiled by the Management and relied upon by the auditors. 18.9.4. Accounting Standard 19 – Leases Lease payments for assets taken on operating lease are recognized in the Profi t & Loss Account over the term of the lease
in accordance with the AS-19 on Leases. The Bank has entered into non-cancellable operating leases only for vehicles and rented premises.
The total of future minimum lease payments under non-cancellable operating leases as determined by the lease agreements are as follows:
(Amount in crore) Particulars 2020 2019 Not later than one year 0.46 0.21 Later than one year and not later than fi ve years 1.33 0.40 Later than fi ve years – – Total 1.79 0.61 Total minimum lease payments recognized in the P&L 0.31 0.22
18.9.5. Accounting standard 22 – Accounting for taxes on income No deferred taxes have been recorded for FY 2019-20 and FY 2018-19 since the bank is having carry forward of losses in the
tax books.
ECO
NOM
IC &
PO
LITI
CAL
WEE
KLY

(Incorporated in France with limited liability)INDIAN BRANCHES
Published on Saturday, june 27, 2020 vol lV nos 26 & 27 EPW Economic & Political Weekly136
18.9.6. Accounting Standard 26 – Intangible Assets The Bank holds intangible assets, primarily software, which is reported as part of Schedule 10. Details of the same are given below.
(Amount in crore) Particulars 2020 2019 Opening Gross Block 4.72 1.62 Additions during the year 0.66 3.43 Deductions during the year – (0.33) Depreciation till date (2.92) (1.68) Net Block 2.46 3.04 Intangibles under development (CWIP) 0.85 1.29 18.9.7. Accounting Standard 28 – Impairment of assets As at March 31, 2020 there were no events or changes in circumstances which indicate any material impairment in the carrying
value of the assets covered by AS 28 on “Impairment of Assets” (Previous year Nil). 18.9.8. Accounting Standard 29 - Provisions, contingent liabilities and assets Sr. No Contingent Liability Brief description 1 Claims against the Bank not The Bank is a party to various legal proceedings in the normal course of acknowledged as debts business. The Bank does not expect the outcome of these proceedings to
have a material adverse effect on the Bank’s fi nancial conditions, results of operations or cash fl ows.
2 Liability on account of The Bank enters into foreign exchange contracts, currency options, forward outstanding forward foreign rate agreements, currency swaps and interest rate swaps with inter-bank exchange contracts and other participants on its own account and for customers. Forward foreign exchange derivative contracts contracts are commitments to buy or sell foreign currency at a future date at the
contracted rate. Currency swaps are commitments to exchange cash fl ows by way of interest/principal in one currency against another, based on predetermined rates. Interest rate swaps are commitments to exchange fi xed and fl oating interest rate cash fl ows. The notional amounts that are recorded, as contingent liabilities are typically amounts used as a benchmark for the calculation of the interest component of the contracts.
3 Guarantees given on behalf of As a part of its commercial banking activities the Bank issues documentary constituents, acceptances, credit and guarantee on behalf of its customers. Documentary credits such endorsements and other as letter of credit enhance the credit standing of the customers of the Bank. obligations Guarantees generally represent irrevocable assurances that the Bank will
make payment in the event of the customer failing to fulfi ll its fi nancial or performance obligations. Acceptances, endorsements and other obligations include undrawn committed credit lines.
4 Other items for which the Bank The Bank is a party to various taxation matters in respect of which appeals is contingently liable are pending. This is being disputed by the Bank and not provided for. This also includes contingent liability corresponding to amount transferred
to Depositor Education and Awareness Fund. There are numerous interpretative issues relating to the Supreme Court
(SC) judgement on Provident Fund (PF) dated 28th February, 2019 on the issue of whether certain allowances should be treated as wages for the purposes of PF. As a matter of caution, the Bank has evaluated the amount to be provided on a prospective basis from the date of the Supreme Court order. As per the Bank’s assessment, the amount is immaterial and no provision will be made in the current Financial Year (Previous Year: NIL). The Bank will re- evaluate its position after receiving further clarity on the subject in subsequent Financial Years.
18.10 Miscellaneous disclosures 18.10.1. Breakup of provisions and contingencies Break of provisions and contingencies charged to the Profi t & Loss Account: (Amount in crore) Particulars 2020 2019 Provision for Taxation Current Tax 23.83 – Deferred Tax – – Provision on Depreciation on Investments (6.74) (5.90) Provisions on NPA (including Write-offs) – (72.37) Provision on CVA (Credit Valuation Adjustment)* 21.90 5.40 Provision on Country Risk 0.72 1.37 Provision on Non-Funded Commitments (0.17) (15.33) Provision on Standard Advances 11.84 – Provision on Other Assets (including Write-offs) 0.11 (5.08) Total 51.49 (91.91) * Pursuant to CVA guidelines provided in the master circular of RBI on Basel III – Capital Regulations
ECO
NOM
IC &
PO
LITI
CAL
WEE
KLY

(Incorporated in France with limited liability)INDIAN BRANCHES
Economic & Political Weekly EPW Published on Saturday, june 27, 2020 vol lV nos 26 & 27 137
18.10.2. Floating provisions The fl oating provisions as on March 31, 2020 is Nil (Previous year Nil). 18.10.3. Draw down from Reserves The Bank has not drawn down from Reserves during the current year (Previous year Nil). 18.10.4. Customer complaints and unimplemented awards of Banking Ombudsman A. Customer complaints Particulars 2020 2019 (a) No. of complaints pending at the beginning of the year – – (b) No. of complaints received during the year – 1 (c) No. of complaints redressed during the year – 1 (d) No. of complaints pending at the end of the year – –
B. Awards passed by the Banking Ombudsman
Particulars 2020 2019 (a) No. of unimplemented awards at the beginning of the year – – (b) No. of awards passed by the Banking Ombudsmen during the year – – (c) No. of awards implemented during the year – – (d) No. of unimplemented awards at the end of the year – –
The above details (A & B) has been based on the information provided by the Management and relied upon by the auditor. 18.10.5. Letters of comfort (LoCs) issued by banks The Bank did not issue any LoCs during the year (Previous year Nil). 18.10.6. Provision Coverage Ratio The Provision coverage ratio of the Bank as at March 31, 2020 computed as per the RBI guidelines is 100% (Previous year 100%). 18.10.7. Provision pertaining to Fraud Accounts No fraud has been reported during FY 2019-20 (Previous year Nil) 18.10.8. Bancassurance Business The Bank has not earned any income from bancassurance business during the year ended March 31, 2020 (Previous year Nil). 18.10.9. Concentration of Deposits, Advances, Exposures and NPA Concentration of Deposits (Amount in crore) Particulars 2020 2019 Total Deposits of twenty largest depositors 5,110.91 2,270.41 % of Deposits of twenty largest depositors to Total deposits of the bank 78.02% 83.94%
Concentration of Advances** (Amount in crore) Particulars 2020 2019 Total Advances of twenty largest borrowers* 1,549.06 1,083.09 % of Advances to twenty largest borrowers to Total Advances of the bank 34.77% 35.98% * Excluding Inter-bank exposure and based on actual outstanding. ** Advances are computed as per defi nition of Credit Exposure including derivatives furnished in the Master Circular on
Exposure Norms. Concentration of Exposures (Amount in crore) Particulars 2020 2019 Total Exposure to twenty largest borrowers/customers* 6,260.45 5,874.19 % of Exposures to twenty largest borrowers/customers to Total Exposure of the bank on borrowers/customers 35.39% 36.76%
* Excluding Inter-bank exposure and based on higher of actual outstanding or limits.
Concentration of NPAs** (Amount in crore)
Particulars 2020 2019 Total Exposure to top four NPA accounts 2.93 3.17
** The information disclosed pertains to only advances (as reported in Schedule 9 of the Balance Sheet). Also, there is only 1 case of NPA outstanding as of 31st Mar 2020 (P.Y. 2 cases).
ECO
NOM
IC &
PO
LITI
CAL
WEE
KLY

(Incorporated in France with limited liability)INDIAN BRANCHES
Published on Saturday, june 27, 2020 vol lV nos 26 & 27 EPW Economic & Political Weekly138
18.10.10. Sector-wise Advances (Amount in crore)
Sl. Sector 2020 2019 No. Total Gross % of Total Gross % of Advances NPAs Gross Advances NPAs Gross (Gross) NPAs to (Gross) NPAs to total total advances advances in that in that sector sector A Priority Sector 1 Agriculture and allied activities – – – – – – 2 Advances to industries sector eligible as priority sector lending 555.08 – – 1286.76 – – 3 Services 67.57 – – – – – 4 Personal loans – – – – – – Sub-total (A) 622.65 – – 1286.76 – – B Non Priority Sector 1 Agriculture and allied activities – – – – – – 2 Industry 2,723.00 2.93 0.11% 2388.43 3.17 0.13% 3 Services 1,698.27 – – 1358.94 – – 4 Personal loans – – – – – – Sub-total (B) 4,421.27 2.93 0.07% 3,747.37 3.17 0.08% Total (A+B) 5,043.92 2.93 0.06% 5,034.13 3.17 0.06%
18.10.11. Movement of NPAs** (Amount in crore) Particulars 2020 2019 Gross NPAs – Opening 3.17 383.56 Additions (Fresh NPAs) during the year – 13.45 Sub-total (A) 3.17 397.01 Less:- (i) Up-gradations – – (ii) Recoveries (excluding recoveries made from upgraded accounts) – 142.81 (iii) Write-offs 0.24 251.03 (iv) Exchange rate movement – – Sub-Total (B) 0.24 393.84 Gross NPAs – Closing (A-B) 2.93 3.17 ** The information disclosed pertains to only advances (as reported in Schedule 9 of the Balance Sheet) 18.10.12. Overseas Assets, NPAs and Revenue The Bank does not have any Overseas Assets and NPAs as at March 31, 2020 and hence related revenues for the year ended
March 31, 2020 is Nil (Previous year Nil). 18.10.13. Off-balance Sheet sponsored Special Purpose Vehicles (SPVs) The Bank does not have any off balance sheet sponsored SPVs as at March 31, 2020 (Previous year Nil). 18.10.14. Remuneration In terms of guidelines issued by RBI vide circular no. DBOD. No. BC. 72/29.67.001/2011-12 dated 13th Jan 2012 on
“Compensation of Whole Time Directors/Chief Executive Offi cers/Risk takers and Control function staff, etc.”, the Bank has submitted a declaration received from its Head Offi ce to RBI to the effect that the compensation structure in India, including that of CEO’s, is in conformity with the Financial Stability Board principles and standards.
18.10.15. Disclosures relating to Securitization The Bank does not have any securitized assets as of March 31, 2020 and March 31, 2019. 18.10.16. Intra-Group Exposures The intra-group exposure comprises of Bank’s transactions and exposures to the entities belonging to the bank’s own group
(group entities). The Bank’s exposure to their Head Offi ce and overseas branches of the parent bank, except for proprietary derivative transactions undertaken with them, are excluded from intra-group exposure.
(a) Total amount of intra-group exposures – INR 57.46 crore (Previous year INR 121.34 crore). (b) Total amount of top-20 intra-group exposures - INR 57.46 crore (Previous year INR 121.34 crore). (c) Percentage of intra-group exposures to total exposure of the bank on borrowers/customers – 0.13% (Previous year 0.40%). (d) Details of breach of limits on intra-group exposures and regulatory action thereon, if any – NIL (Previous year Nil)
ECO
NOM
IC &
PO
LITI
CAL
WEE
KLY

(Incorporated in France with limited liability)INDIAN BRANCHES
Economic & Political Weekly EPW Published on Saturday, june 27, 2020 vol lV nos 26 & 27 139
18.10.17. Transfer to Depositor Education and Awareness Fund (DEAF) (Amount in crore) Particulars 2020 2019 Opening balance of amounts transferred to DEAF 4.13 3.58 Add Amounts transferred to DEAF during the year 0.34 0.64 Less Amounts reimbursed by DEAF towards claims (0.26) (0.09) Closing balance of amounts transferred to DEAF 4.21 4.13
The amount transferred to DEAF is also shown as contingent liability under Schedule 12.
18.10.18. Unhedged Foreign Currency Exposure The Bank has in place a policy on managing credit risk arising out of unhedged foreign currency exposures (UFCE) of its
borrowers. UFCE exposes the borrowers to the risk of exchange rate fl uctuation, impacting the corporate’s profi tability and ability to service debt. The objective of the Bank’s policy is to monitor & review the UFCE of the borrowers, encouraging the borrowers to hedge their UFCE and evaluate the risks arising out of UFCE of the borrowers while approving the credit facilities and price them in the credit risk premium. The Bank has also stipulated threshold limits for mandatory hedging in respect of foreign currency loans given by the Bank. The credit analysis critically evaluates the risks arising out of UFCE of the borrowers and its impact on the corporate’s profi tability and fi nancial profi le, with due consideration given to the foreign currency receivables generated by the borrower’s export activities and the extent to which this might mitigate the foreign currency exposure.
The Bank reviews the UFCE across its portfolio on a periodic basis. The Bank also maintains incremental provision and capital towards the UFCE of its borrowers in line with the extant RBI guidelines.
In accordance with the RBI’s Circular DBOD No.BP.BC.85/21.06.200/2013-14 dated 15th January 2014 effective 1st April 2014, the Bank has maintained incremental provision of INR 28.21 crores (Previous year INR 19.87 crores) and additional capital of INR 168.94 crores (Previous year INR 144.81 crores) on account of unhedged foreign currency exposure of its borrowers as at 31 Mar 2020.
18.11 Liquidity Coverage Ratio (LCR) The RBI basis the circular titled “Basel III Framework on Liquidity Standards – Liquidity Coverage Ratio (LCR), Liquidity Risk
Monitoring Tools and LCR Disclosure Standards” released on June 09, 2014 (DBOD.BP.BC.No.120/21.04.098/2013-14) & Master circular on Disclosure in Financial Statements - Notes to Accounts has advised banks to measure and report LCR.
The LCR guidelines aims to ensure that the bank maintains an adequate level of unencumbered High Quality Liquid Assets (HQLAs) that can be converted into cash to meet its liquidity needs for a 30 calendar day time horizon under a signifi cantly severe liquidity stress scenario specifi ed by RBI. At a minimum, the stock of liquid assets should enable the bank to survive until day 30 of the stress scenario, by which time it is assumed that appropriate corrective actions can be taken.
As per the RBI guidelines the minimum LCR required to be maintained shall be implemented in the phased manner from January 01, 2015. The minimum LCR requirement from 2019 is 100%.
The ratio is defi ned as the amount of High Quality Liquid Assets (“HQLA”) that could be used to raise liquidity, measured against the total volume of net cash outfl ows, arising from both actual and contingent exposures, in a stressed scenario. Below are the details of each component:
a) Composition of HQLA The HQLA of the bank mainly consist of government securities in excess of minimum SLR requirements apart from regulatory
dispensation allowed up to 18% of NDTL in the form of borrowings limit available through Marginal Standing Facility (MSF) @3% and Facility to Avail Liquidity for Liquidity Coverage Ratio (FALLCR) @ 14.5%. The bank does not hold any FCY HQLA.
b) Composition of Cash Outfl ows The total cash outfl ows mainly comprise of deposits from small business customers, unsecured wholesale funding in the form
of corporate term deposits, secured funding in the form of repo (including Treps) borrowings backed by Level 1 assets, other outfl ows in the form of net derivative exposures and credit & liquidity facilities, and other contractual and contingent funding obligations. Other contractual funding obligations consist of borrowings & overdrawn nostros and contingent funding obligations consist of outfl ows from credit & liquidity facilities, letters of credit, guarantees and trade fi nance facilities granted to corporate customers.
c) Composition of Cash Infl ows The total cash infl ows comprise of secured lending transaction backed by Level 1 assets collateral and other cash infl ows
comprises mainly of loans extended to corporate customers, interest receivable, reciprocal lines unutilized, nostros etc. The framework for funding the balance sheet is well defi ned in the ALCO policy which is supplemented with stress testing
policy. All relevant aspects of liquidity measurement and monitoring are covered in the aforesaid policies. The liquidity for the bank is managed centrally from its Mumbai Offi ce by the Treasurer.
Given the business profi le (Corporate Banking), the bank relies/concentrates more on corporate deposits and money market for its funding requirements which has a short term maturity cycle. It is the bank’s conscious strategy to comply with the LCR mandate within the business and regulatory environment it is operating.
ECO
NOM
IC &
PO
LITI
CAL
WEE
KLY

(Incorporated in France with limited liability)INDIAN BRANCHES
Published on Saturday, june 27, 2020 vol lV nos 26 & 27 EPW Economic & Political Weekly140
The tables below highlight the position of LCR computed based on simple average of daily position for each quarter. (Amount in crore) Sl. Sector Quarter ended Mar 31, 2020 No. Total Total Un-Weighted Weighted Value Value High Quality Liquid Assets 1 Total High Quality Liquid Assets (HQLA) 2,534.65 2,534.65 Cash Outfl ows 2 Retail deposits and deposits from small business customers, of which: 24.52 2.45 (i) Stable deposits 0.14 0.01 (ii) Less stable deposits 24.38 2.44 3 Unsecured wholesale funding, of which: 3,441.55 1,576.04 (i) Operational deposits (all counterparties) 0.00 0.00 (ii) Non-operational deposits (all counterparties) 3,441.55 1,576.04 (iii) Unsecured debt – – 4 Secured wholesale funding 359.38 – 5 Additional requirements, of which 1,162.43 648.65 (i) Outfl ows related to derivative exposures and other collateral requirements* 478.73 478.73 (ii) Outfl ows related to loss of funding on debt products – – (iii) Credit and liquidity facilities 683.70 169.92 6 Other contractual funding obligations 178.37 178.37 7 Other contingent funding obligations 6,198.59 185.96 8 Total Cash Outfl ows 11,364.84 2,591.47 Cash Infl ows 9 Secured lending 330.74 – 10 Infl ows from fully performing exposures – – 11 Other cash infl ows 2,376.35 1,539.01 12 Total Cash Infl ows 2,707.09 1,539.01 13 TOTAL HQLA 2,534.65 2,534.65 14 Total Net Cash Outfl ows 8,657.75 1,052.46 25% of Total Cash Outfl ow 2,841.21 647.87 15 Liquidity Coverage Ratio (%) 240.83%
(Amount in crore) Sl. Sector Quarter ended Dec 31, 2019 No. Total Total Un-Weighted Weighted Value Value High Quality Liquid Assets 1 Total High Quality Liquid Assets (HQLA) 2,401.64 2,401.64 Cash Outfl ows 2 Retail deposits and deposits from small business customers, of which: 25.14 2.51 (i) Stable deposits 0.07 – (ii) Less stable deposits 25.07 2.51 3 Unsecured wholesale funding, of which: 3,339.31 1,436.27 (i) Operational deposits (all counterparties) – – (ii) Non-operational deposits (all counterparties) 3,339.31 1,436.27 (iii) Unsecured debt – – 4 Secured wholesale funding 226.65 – 5 Additional requirements, of which 1,264.54 709.70 (i) Outfl ows related to derivative exposures and other collateral requirements* 520.39 520.39 (ii) Outfl ows related to loss of funding on debt products – – (iii) Credit and liquidity facilities 744.15 189.31 6 Other contractual funding obligations 386.14 386.14 7 Other contingent funding obligations 6,618.17 198.55 8 Total Cash Outfl ows 11,859.95 2,733.17 Cash Infl ows 9 Secured lending 146.14 – 10 Infl ows from fully performing exposures – – 11 Other cash infl ows 2,394.38 1,625.55 12 Total Cash Infl ows 2,540.52 1,625.55 13 TOTAL HQLA 2,401.64 2,401.64 14 Total Net Cash Outfl ows 9,319.43 1,107.62 25% of Total Cash Outfl ow 2,964.99 683.29 15 Liquidity Coverage Ratio (%) 216.83%
ECO
NOM
IC &
PO
LITI
CAL
WEE
KLY

(Incorporated in France with limited liability)INDIAN BRANCHES
Economic & Political Weekly EPW Published on Saturday, june 27, 2020 vol lV nos 26 & 27 141
(Amount in crore) Sl. Sector Quarter ended Sep 30, 2020 No. Total Total Un-Weighted Weighted Value Value High Quality Liquid Assets 1 Total High Quality Liquid Assets (HQLA) 2,253.20 2,253.20 Cash Outfl ows 2 Retail deposits and deposits from small business customers, of which: 26.33 2.86 (i) Stable deposits 0.08 0.23 (ii) Less stable deposits 26.25 2.63 3 Unsecured wholesale funding, of which: 3,157.23 1,314.07 (i) Operational deposits (all counterparties) – – (ii) Non-operational deposits (all counterparties) 3,157.23 1,314.07 (iii) Unsecured debt – – 4 Secured wholesale funding 227.55 – 5 Additional requirements, of which 1,105.96 630.80 (i) Outfl ows related to derivative exposures and other collateral requirements* 488.62 488.62 (ii) Outfl ows related to loss of funding on debt products – – (iii) Credit and liquidity facilities 617.34 142.18 6 Other contractual funding obligations 514.06 514.06 7 Other contingent funding obligations 6,795.20 203.86 8 Total Cash Outfl ows 11,826.33 2,665.65 Cash Infl ows 9 Secured lending 194.99 – 10 Infl ows from fully performing exposures – – 11 Other cash infl ows 2,427.10 1,554.26 12 Total Cash Infl ows 2,622.09 1,554.26 13 TOTAL HQLA 2,253.20 2,253.20 14 Total Net Cash Outfl ows 9,204.24 1,111.39 25% of Total Cash Outfl ow 2,956.58 666.41 15 Liquidity Coverage Ratio (%) 202.74%
(Amount in crore) Sl. Sector Quarter ended June 30, 2019 No. Total Total Un-weighted Weighted Value Value High Quality Liquid Assets 1 Total High Quality Liquid Assets (HQLA) 1,731.75 1,731.75 Cash Outfl ows 2 Retail deposits and deposits from small business customers, of which: 26.03 2.60 (i) Stable deposits 0.08 0.00 (ii) Less stable deposits 25.95 2.60 3 Unsecured wholesale funding, of which: 2,248.67 934.65 (i) Operational deposits (all counterparties) 0.00 0.00 (ii) Non-operational deposits (all counterparties) 2,248.67 934.65 (iii) Unsecured debt – – 4 Secured wholesale funding 324.80 – 5 Additional requirements, of which 1,016.42 701.10 (i) Outfl ows related to derivative exposures and other collateral requirements* 587.06 587.07 (ii) Outfl ows related to loss of funding on debt products – – (iii) Credit and liquidity facilities 429.36 114.03 6 Other contractual funding obligations 789.03 789.03 7 Other contingent funding obligations 6,826.20 204.79 8 Total Cash Outfl ows 11,231.15 2,632.17 Cash Infl ows 9 Secured lending 83.70 – 10 Infl ows from fully performing exposures – – 11 Other cash infl ows 2,429.35 1,578.87 12 Total Cash Infl ows 2,513.05 1,578.87 13 TOTAL HQLA 1,731.75 1,731.75 14 Total Net Cash Outfl ows 8,718.10 1,053.30 25% of Total Cash Outfl ow 2,807.79 658.04 15 Liquidity Coverage Ratio (%) 164.41%
ECO
NOM
IC &
PO
LITI
CAL
WEE
KLY

(Incorporated in France with limited liability)INDIAN BRANCHES
Published on Saturday, june 27, 2020 vol lV nos 26 & 27 EPW Economic & Political Weekly142
(Amount in crore) Sl. Sector Quarter ended March 31, 2019 No. Total Total Un-Weighted Weighted Value Value High Quality Liquid Assets 1 Total High Quality Liquid Assets (HQLA) 1,557.27 1,557.27 Cash Outfl ows 2 Retail deposits and deposits from small business customers, of which: 26.13 2.61 (i) Stable deposits 0.08 0.00 (ii) Less stable deposits 26.05 2.61 3 Unsecured wholesale funding, of which: 2,101.38 875.45 (i) Operational deposits (all counterparties) – – (ii) Non-operational deposits (all counterparties) 2,101.38 875.45 (iii) Unsecured debt – – 4 Secured wholesale funding 135.06 – 5 Additional requirements, of which 913.41 709.45 (i) Outfl ows related to derivative exposures and other collateral requirements* 645.12 645.12 (ii) Outfl ows related to loss of funding on debt products – – (iii) Credit and liquidity facilities 268.29 64.33 6 Other contractual funding obligations 1,008.00 1,008.00 7 Other contingent funding obligations 7,215.82 216.47 8 Total Cash Outfl ows 11,399.81 2,811.98 Cash Infl ows 9 Secured lending 8.44 – 10 Infl ows from fully performing exposures – – 11 Other cash infl ows 3,944.69 1,863.37 12 Total Cash Infl ows 3,953.13 1,863.37 13 TOTAL HQLA 1,557.27 1,557.27 14 Total Net Cash Outfl ows 7,446.68 948.62 25% of Total Cash Outfl ow 2,849.95 703.00 15 Liquidity Coverage Ratio (%) 164.16% (Amount in crore) Sl. Sector Quarter ended December 31, 2018 No. Total Total Un-Weighted Weighted Value Value High Quality Liquid Assets 1 Total High Quality Liquid Assets (HQLA) 1,822.70 1,822.70 Cash Outfl ows 2 Retail deposits and deposits from small business customers, of which: 26.65 2.66 (i) Stable deposits 0.08 0.00 (ii) Less stable deposits 26.57 2.66 3 Unsecured wholesale funding, of which: 2,481.21 1,027.53 (i) Operational deposits (all counterparties) – – (ii) Non-operational deposits (all counterparties) 2,481.21 1,027.53 (iii) Unsecured debt – – 4 Secured wholesale funding 142.03 – 5 Additional requirements, of which 922.65 744.65 (i) Outfl ows related to derivative exposures and other collateral requirements* 683.21 683.21 (ii) Outfl ows related to loss of funding on debt products – – (iii) Credit and liquidity facilities 239.44 61.44 6 Other contractual funding obligations 987.91 987.91 7 Other contingent funding obligations 7,553.58 226.61 8 Total Cash Outfl ows 12,114.04 2,989.36 Cash Infl ows 9 Secured lending 26.88 – 10 Infl ows from fully performing exposures – – 11 Other cash infl ows 3,559.61 1,928.62 12 Total Cash Infl ows 3,586.49 1,928.62 13 TOTAL HQLA 1,822.70 1,822.70 14 Total Net Cash Outfl ows 8,527.55 1,060.75 25% of Total Cash Outfl ow 3,028.51 747.34 15 Liquidity Coverage Ratio (%) 171.83%
ECO
NOM
IC &
PO
LITI
CAL
WEE
KLY

(Incorporated in France with limited liability)INDIAN BRANCHES
Economic & Political Weekly EPW Published on Saturday, june 27, 2020 vol lV nos 26 & 27 143
(Amount in crore) Sl. Sector Quarter ended September 30, 2018 No. Total Total Un-Weighted Weighted Value Value High Quality Liquid Assets 1 Total High Quality Liquid Assets (HQLA) 1,722.74 1,722.74 Cash Outfl ows 2 Retail deposits and deposits from small business customers, of which: 25.83 2.58 (i) Stable deposits 0.08 – (ii) Less stable deposits 25.75 2.58 3 Unsecured wholesale funding, of which: 2,016.76 858.40 (i) Operational deposits (all counterparties) – – (ii) Non-operational deposits (all counterparties) 2,016.76 858.40 (iii) Unsecured debt – – 4 Secured wholesale funding 116.46 – 5 Additional requirements, of which 739.47 664.93 (i) Outfl ows related to derivative exposures and other collateral requirements* 624.94 624.94 (ii) Outfl ows related to loss of funding on debt products – – (iii) Credit and liquidity facilities 114.53 39.99 6 Other contractual funding obligations 1,423.76 1,423.76 7 Other contingent funding obligations 7,144.67 214.34 8 Total Cash Outfl ows 11,466.95 3,164.01 Cash Infl ows 9 Secured lending 52.64 – 10 Infl ows from fully performing exposures – – 11 Other cash infl ows 3,268.21 1,721.82 12 Total Cash Infl ows 3,320.85 1,721.82 13 TOTAL HQLA 1,722.74 1,722.74 14 Total Net Cash Outfl ows 8,146.10 1,442.19 25% of Total Cash Outfl ow 2,866.74 791.00 15 Liquidity Coverage Ratio (%) 119.45%
(Amount in crore) Sl. Sector Quarter ended June 30, 2018 No. Total Total Un-Weighted Weighted Value Value High Quality Liquid Assets 1 Total High Quality Liquid Assets (HQLA) 1,637.73 1,637.73 Cash Outfl ows 2 Retail deposits and deposits from small business customers, of which: 25.51 2.55 (i) Stable deposits 0.08 0.00 (ii) Less stable deposits 25.42 2.55 3 Unsecured wholesale funding, of which: 1,931.12 812.42 (i) Operational deposits (all counterparties) – – (ii) Non-operational deposits (all counterparties) 1,931.12 812.42 (iii) Unsecured debt – – 4 Secured wholesale funding 75.96 – 5 Additional requirements, of which 643.27 541.60 (i) Outfl ows related to derivative exposures and other collateral requirements* 492.65 492.65 (ii) Outfl ows related to loss of funding on debt products – – (iii) Credit and liquidity facilities 150.62 48.95 6 Other contractual funding obligations 1,245.10 1,245.10 7 Other contingent funding obligations 7,114.17 213.43 8 Total Cash Outfl ows 11,035.12 2,815.10 Cash Infl ows 9 Secured lending 57.53 – 10 Infl ows from fully performing exposures – – 11 Other cash infl ows 2,743.04 1,198.42 12 Total Cash Infl ows 2,800.57 1,198.42 13 TOTAL HQLA 1,637.73 1,637.73 14 Total Net Cash Outfl ows 8,234.56 1,616.68 25% of Total Cash Outfl ow 2,758.78 703.78 15 Liquidity Coverage Ratio (%) 101.30% * Represents Net MTM on derivatives Note: In computing the above data, estimates/assumptions used by the management have been relied upon by the auditor.
ECO
NOM
IC &
PO
LITI
CAL
WEE
KLY

(Incorporated in France with limited liability)INDIAN BRANCHES
Published on Saturday, june 27, 2020 vol lV nos 26 & 27 EPW Economic & Political Weekly144
Below is the quarter wise summary of the ratios for both the years: Quarter FY 2019-20 FY 2018-19 Actual Limit Actual Limit March 240.83% 100% 164.16% 100% December 216.83% 100% 171.83% 90% September 202.74% 100% 119.45% 90% June 164.41% 100% 101.30% 90%18.12 Micro, Small and Medium Enterprises Development Act, 2006 (MSMED) (Amount in crore) March 31, 2020 March 31, 2019 The principal amount and the interest due thereon remaining unpaid to any supplier
as at the end of each accounting year Principal amount due to micro and small enterprises – – Interest due on above – – March 31, 2020 March 31, 2019 The amount of interest paid by the buyer in terms of section 16 of the MSMED Act 2006
along with the amounts of the payment made to the supplier beyond the appointed day during each accounting year – – The amount of interest due and payable for the period of delay in making payment
(which have been paid but beyond the appointed day during the year) but without adding the interest specifi ed under the MSMED Act 2006. – – The amount of interest accrued and remaining unpaid at the end of each accounting year – – The amount of further interest remaining due and payable even in the succeeding years,
until such date when the interest dues as above are actually paid to the small enterprise for the purpose of disallowance as a deductible expenditure under section 23 of the
MSMED Act 2006 – – To the extent of the information received by the Bank from its vendors, there are three payment transactions (fi ve payment transactions in
previous year) with MSMED registered vendors as defi ned under the Micro, Small and Medium Enterprises Development Act, 2006 during the fi nancial year.
18.13 Corporate Social Responsibility (CSR) The details of CSR expenditure are given below: Gross amount required to be spent by the company during the year: NIL (Previous year NIL) Expenses incurred during the year ended March 31, 2020 (Amount in ` crore) Sr No. Particulars In Cash Yet to be paid Total in Cash (i) Construction/Acquisition of any asset 0.00 – 0.00 (ii) On purposes other than (i) above 1.25 – 1.25 Expenses incurred during the year ended March 31, 2019 (Amount in ` crore) Sr No. Particulars In Cash Yet to be paid Total in Cash (i) Construction/Acquisition of any asset 0.27 – 0.27 (ii) On purposes other than (i) above 0.73 – 0.7318.14 Provision for Long Term Contracts The Bank has a process whereby periodically all long term contracts (including derivative contracts) are assessed for material foreseeable
losses. At the year end, the Bank has reviewed and recorded adequate provision as required under any law/accounting standards for material foreseeable losses on such long term contracts (including derivative contracts) in the books of account and disclosed the same under the relevant notes in the fi nancial statements.
18.15 Priority Sector Lending Certifi cates (PSLCs) The Bank has purchased PSLCs during the year. Stock of PSLCs held at year end is detailed below in face value terms. (Amount in crore) Sr No. Particulars 2020 2019 (i) PSLC - General 987.50 124.25 (ii) PSLC - Micro Enterprises 549.75 285.00 (iii) PSLC - Agriculture – 169.50 Total 1,537.25 578.75
ECO
NOM
IC &
PO
LITI
CAL
WEE
KLY

(Incorporated in France with limited liability)INDIAN BRANCHES
Economic & Political Weekly EPW Published on Saturday, june 27, 2020 vol lV nos 26 & 27 145
18.16 Transfer to Investment Reserve and Investment Fluctuation Reserve.
In terms of RBI circular DBR.No.BP.BC.102/21.04.048/2017-18 dated April 02, 2018 on creation of Investment Fluctuation Reserve (IFR), the Bank has not transferred any amount for the FY 2019-20 (P.Y: NIL) as the Bank is having loss from sale of investment. The Bank will create the fund in coming years.
Transfers to Investment Reserve Account has been made as per extant RBI guidelines and disclosed in Schedule No. 2.
18.17 Sexual Harassment of Women at Workplace
The bank has received no complaints for its disposal under the provisions of “The Sexual Harassment of Women at Workplace (Prevention, Prohibition and Redressal) Act, 2013.
18.18 Update on IND AS Implementation
The Institute of Chartered Accountants of India has issued IND AS (a revised set of accounting standards) which largely converge the Indian accounting standards with International Financial Reporting Standards (IFRS). The same have since been notifi ed by the Ministry of Corporate Affairs (MCA). The RBI has issued a circular applicable to all commercial banks (RBI/2015-16/315 DBR.BP.BC. No.76/21.07.001/2015-16 dated 11th Feb 2016) on Implementation of Indian Accounting Standards (IND AS).
IND AS was required to be fully implemented from 1st April 2018 onwards with comparatives required for periods beginning 1st April 2017, subsequently this was deferred for one year by RBI vide their press release dated April 05, 2018 on “Statement on Developmental & Regulatory Policies”.
In FY 2018-19 RBI has deferred the IND AS implementation again as per RBI Circular No. RBI/2018-2019/146 DBR.BP.BC.No.29/21.07.001/2018-19 dated 22nd Mar 2019 until further notice.
The Bank has undertaken the following actions:
Considering the nature and size of business of the bank, the responsibility for implementation of IND AS, primarily stemming from relevant RBI circulars, is with the following Committees:
i. Management Committee
ii. Audit Committee
iii. Steering Committee constituted for IND – AS implementation
The Steering Committee primarily consists of the CFO and Representatives from Finance Control, Risk & Other Support Functions. Any other representation will be included in the committee on a need basis.
The Steering Committee provides updates on a regular basis to the Audit Committee and Management Committee with regard to the progress of the IND AS implementation.
Pro-forma IND AS fi nancial statements are being submitted to RBI on a quarterly basis in line RBI’s email dated 20th July 2018 for the same.
18.19 Previous Year’s Comparatives
Prior year amounts have been re-classifi ed/re-stated wherever necessary to conform to the current year’s presentation.
As per our attached report of even date
For A P Sanzgiri & Co CREDIT AGRICOLE CORPORATE & INVESTMENT BANKChartered Accountants Indian Branches ICAI Firm Registration No: 116293W Sd/- Sd/- Sd/- Ankush Goyal Ravinarayanan Iyer Loic BorreyPartner Chief Financial Offi cer - India Chief Operating Offi cer - IndiaMembership Number - 146017
Mumbai June 16, 2020
ECO
NOM
IC &
PO
LITI
CAL
WEE
KLY
(Incorporated in France with limited liability)INDIAN BRANCHES
Published on Saturday, june 27, 2020 vol lV nos 26 & 27 EPW Economic & Political Weekly146
BASEL III DISCLOSURES as at March 31, 2020 (Indian Branches)1. SCOPE OF APPLICATION The Basel III disclosures contained herein relate to the Indian Branches of Credit Agricole Corporate & Investment Bank (‘the Bank’) for
the year ended Mar 31, 2020. These are primarily in the context of the disclosures required under Annex 18 – Pillar 3 disclosure requirements of the Reserve Bank of India (‘the RBI’) Master Circular – Basel III Capital Regulations dated 1st July 2015. The Bank has implemented the requirements laid down by RBI for Pillar 3 disclosure, covering both the qualitative and quantitative items. The information provided has been reviewed by senior management and is in accordance with the guidelines prescribed by the RBI. All table DF references relate to those mentioned in Annex 18 – Pillar 3 of the above mentioned circular.
Qualitative & Quantitative disclosures as per table DF 1 The Bank does not have any interest in subsidiaries/associates/Joint Ventures or Insurance entities. As such this disclosure is not applicable
to the bank.2. CAPITAL ADEQUACY Qualitative Disclosures as per table DF 2 The Capital to Risk Weighted Assets Ratio (CRAR) of the bank is 12.43% as of Mar 31, 2020 computed under Basel III norms, higher than
the minimum regulatory CRAR requirement of 10.875% including Capital Conservation Buffer (CCB) of 1.875%. The bank’s capital management approach is driven by its desire to maintain a strong capital base to support the development of its business
and to meet regulatory capital requirements at all times. It is overseen by the Bank’s Asset and Liability Committee (ALCO) and Local Credit Committee (LCC). It has a process for assessing its overall capital adequacy in relation to the risk profi le. The Bank has a comprehensive Internal Capital Adequacy Assessment Process (‘ICAAP’). The Bank’s ICAAP document covers the capital management framework of the Bank, sets the process for assessment of the adequacy of capital to support current and future activities/risks and a report on the capital projections for a period of 3 years. The framework has been created by way of an approved ICAAP Manual which ensures existence of a good governance model to identify, assess, monitor and manage all material risks. This framework is supplemented by the existence of an approved stress testing framework which is an integral part of the ICAAP.
In the normal course of events, management reviews the adequacy of capital quarterly or with increased frequency, if circumstances demand. The capital requirement of the Bank is assessed after considering the Bank’s strategy, its business model as well as opportunities for growth. The capital assessment by the Bank factors in the credit, operational and market risks associated with its current and future activities as well as the effective management of these risks to optimize the utilization of capital.
Quantitative Disclosures as per table DF 2 A summary of the bank’s capital requirement for credit, market and operational risk and the capital adequacy ratio is presented below: (Amount in crore) Particulars March 31, 2020 March 31, 2019
A Capital Requirement for Credit Risk (Standardized Approach) 1,537.59 1,420.00 • On B/s excl securitization exposures 579.34 540.60 • Off B/s excl securitization exposures 958.25 879.40 1. Non - Market Related 345.65 386.76 2. Market Related 612.60 492.64 • Securitization Exposures – – B Capital Requirement for Market Risk (Standardized Duration Approach) 291.11 229.02 • Interest Rate Risk 255.11 211.02 • Foreign Exchange Risk 36.00 18.00 • Equity Risk – – C Capital Requirement for Operational Risk (Basic Indicator Approach) 27.54 7.26 D Total Capital Requirement 1,856.24 1,656.28 E Total Risk Weighted Assets of the Bank 18,654.94 16,418.96 • Credit Risk 14,671.72 13,465.58 • Market Risk 3,638.93 2,862.68 • Operational Risk 344.29 90.70 F Total Capital Ratio 12.43% 12.74% • Common Equity Tier I 10.17% 10.26% • Tier I 10.17% 10.26% • Tier II 2.26% 2.48%
3. RISK EXPOSURE AND ASSESSMENT Risk Management The management of risk lies at the heart of the Bank’s business. The businesses undertaken by the Bank requires it to identify, measure,
control, monitor and report risks effectively and to allocate capital among businesses appropriately. The key components of the Bank’s risk management are the risk policies, comprehensive processes, integrated risk management systems
and internal control mechanism. The Bank’s risk policies focus attention on key areas of risks such as counterparty, market, country, portfolio and operational risk and identifi cation, analysis, measurement and control of these risks for effective and continuous monitoring.
ECO
NOM
IC &
PO
LITI
CAL
WEE
KLY

(Incorporated in France with limited liability)INDIAN BRANCHES
Economic & Political Weekly EPW Published on Saturday, june 27, 2020 vol lV nos 26 & 27 147
Categories of Risk The key risks the Bank assumes are: – Credit risk is the risk of fi nancial loss if a borrower or counterparty fails to honor commitments under an agreement and any such
failure has an adverse impact on the fi nancial performance of the Bank. Credit risk arises mainly from direct lending and certain off-balance sheet products such as Guarantees, Letters of Credits, Foreign Exchange Forward Contracts & Derivatives and also from the Bank’s holding of assets in the form of debt securities.
– Market Risk arising from the uncertainty concerning changes in market prices and rates (including interest rates, equity prices, foreign exchange rates and commodity prices), the correlations among them and their levels of volatility.
– Interest rate risk in the banking book is primarily the change in the net interest income and the value of the bank’s assets and liabilities due to changes in interest rates. Interest rate risk arises on account of banking products (non-trading nature) offered to retail and corporate customers.
– Liquidity risk arising from the potential inability to meet all payment obligations when they become due. – Operational risk is the potential for incurring losses in relation to employees, process failures, project management, contractual
specifi cations and documentations, technology, infrastructure failure and disasters, external infl uences and customer relationships. This defi nition includes legal and regulatory risk.
Risk management components and policies The key components of the Bank’s risk management are the risk policies, comprehensive processes, integrated risk management systems
and internal control mechanism. The Bank’s risk policies focus attention on key areas of risk such as counterparty, market, country, portfolio and operational risks and identifi cation, analysis, measurement and control of these risks for effective and continuous monitoring.
The Bank’s risk management processes are guided by well-defi ned policies appropriate for various risk categories, independent risk oversight and periodic monitoring. Head Offi ce of the Bank approves the overall risk appetite and strategy for the Bank’s operations. Locally, various senior management committees mainly, Asset-Liability Committee (ALCO), Internal Control Committee (ICC), and Local Credit Committee (LCC) operate within the broad policy set up by Head Offi ce.
The Bank has formulated a local credit policy consistent with the Head Offi ce policy and Reserve Bank of India regulations and guidelines on risk management. The Bank has also formulated a comprehensive Stress Testing policy to measure impact of adverse stress scenarios on the adequacy of capital.
Risk management organization Risk Management function is organized functionally on a global basis as the Risk & Permanent Control (RPC) Division. The Local Head of
Risk Management Functions reports functionally to the Regional Chief Risk Offi cer, Asia Pacifi c Offi ce in Hong Kong. The Local Head of Risk Management is responsible for credit, market and operational risk management activities for the Bank. The Bank has a Local Credit Committee comprising of the Senior Country Offi cer and other senior personnel representing Global Markets, Corporate Banking and Credit Risk Analysis. As per the scheme of delegations for credit approvals laid down by the Head Offi ce, all credit applications from India of corporate clients are discussed in the local credit committee and approved by the Front Offi ce delegate/Senior Country Offi cer (SCO) subject to a favorable opinion from local RPC if the size of credit limits are within his delegation and in other cases by the Risk Committee at Regional Offi ce or Head Offi ce, based on the recommendation from FO Delegate/SCO and analysis/conclusion provided by local RPC.
In case of Banks & Financial Institutions, the credit analysis of the counterparties is done by RPC in Regional Offi ce, Hong Kong, based on the request from the Branch. The credit limits are assessed by the Branch and recommended to RPC Regional Offi ce, and it requires a favorable recommendation from the Senior Country Offi cer of India. The fi nal decision on the request for credit limits for Banks & Financial Institutions is made by Head Offi ce.
The Risk Management function is responsible for the quality and performance of the credit portfolios and for monitoring and controlling all credit risks in the portfolio, including those subject to approval by the Regional Offi ce and Head Offi ce.
Treasury is responsible for the management of liquidity risk. The liquidity risk policies relating to the identifi cation, measurement and management of liquidity risk as well as the actual status are reviewed on a regular basis by the ALCO.
The Bank’s Finance, Audit and Legal departments support the risk management function. The role of Finance department is to quantify the risk assumed and ensure the quality and integrity of the risk related data. The Bank’s Audit department reviews the compliance of the internal control procedures with internal and regulatory standards. The Legal department provides legal advice and support on topics including collateral arrangements and netting.
Scope and Nature of Risk Reporting and Measurement Systems The Bank has globally adopted an internal rating system to rate the borrowers/counterparties. The internal rating model is a combination of
quantitative and qualitative factors. It is comprehensive in terms of identifi cation and assessment of all risks faced by a counter party. The rating model enables assessment of the possibility of delinquency over a one-year time horizon. Each internal rating grade corresponds to a distinct probability of default. Validation of Internal Rating Model is carried out at Head Offi ce level periodically by objectively assessing its calibration accuracy and stability of ratings.
The local Credit Risk Management team manages the regular reporting to senior management on credit risk portfolio, including information on large credit exposures, concentrations, industry exposures, levels of impairment, provisioning and country exposures. The portfolio is also reviewed annually by the Country & Portfolio Review team of the Head Offi ce Risk Department.
Policies for Credit Risk Mitigants Credit Risk Mitigants (CRM) like fi nancial collateral, non-fi nancial collateral including guarantees are used to mitigate credit risk exposure.
Availability of CRM either reduces effective exposure on the borrower (in case of collaterals) or transfers the risk to the more creditworthy party (in case of guarantees).
ECO
NOM
IC &
PO
LITI
CAL
WEE
KLY

(Incorporated in France with limited liability)INDIAN BRANCHES
Published on Saturday, june 27, 2020 vol lV nos 26 & 27 EPW Economic & Political Weekly148
4. CREDIT RISK: GENERAL DISCLOSURES Qualitative Disclosures as per table DF 3 Credit Risk Management Policy The Bank’s credit risk management process integrates risk management into the business management processes, while preserving the
independence and integrity of risk assessment. There is a clear segregation of duties between transaction originators in the businesses and the approvers in the Risk functions. All credit exposure limits are approved within a defi ned credit approval authority framework.
The Head Offi ce of the Bank establishes the parameters for risk appetite, which is defi ned quantitatively and qualitatively in accordance with the laid-down strategic business plan for the country. Group policies/procedures are customized locally to incorporate any local regulatory and governance needs. This is laid down through a combination of organizational structures and credit risk policies, control processes and credit systems embedded into an integrated risk management framework.
The Bank regularly monitors credit exposures, portfolio performance and external trends which may impact risk management outcomes. Internal risk management reports are presented to risk committees, containing information on key environmental, political and economic trends across major portfolios, portfolio delinquency and loan impairment performance.
Identifi cation & Management of Doubtful Assets & Provisioning The Bank has laid down a global policy for identifi cation and management of Doubtful Assets and provisioning. In addition, the Bank’s non-
performing advances are identifi ed by regular review of the portfolio by senior management in accordance with RBI guidelines on asset classifi cation and provisioning. Specifi c provision is made on a case by case basis based on the management’s assessment of impairment of the advance with approval from the Head Offi ce, subject to the minimum provisioning levels prescribed by the RBI. All non performing advances are monitored by a specialized department called Distressed Assets Services at Regional Offi ce, Hong Kong. The Bank engages with customers closely to work out of distress situations.
Concentration Risk The Bank controls and limits concentration risk by means of appropriate borrower limits based on creditworthiness. These include: Large exposures to individual clients or group: The exposure limits on various categories of borrowers/counterparties and group of borrowers/counterparties shall be in accordance with
the Large Exposure (LE) Framework of RBI. The Bank has adopted the limits prescribed in the LE Framework as prudential exposure limit: Single Borrower/counterparty: The sum of all the exposure values to a single counterparty must not be higher than 20% of the Bank’s
available eligible capital base at all time (i.e. Tier I capital). Groups of connected Borrowers/counterparties: The sum of all the exposure values of a bank to a group of connected counterparties (as defi ned in
the RBI regulation on Large Exposure Framework) must not be higher than 25% of the Bank’s available eligible capital base at all times. Interbank exposures: The interbank exposures, except intra-day interbank exposures, will be subject to the large exposure limit of 25% of Bank’s
Tier 1 capital. Additionally, in case of exposure to a G-SIB (including branch) and a non-bank G-SIFI, the exposure limit is further restricted to 20% of capital base (noting that CACIB is a not a G-SIB). For this purpose, Indian branches of a foreign G-SIB is treated as non-GSIB.
Exposure to Head Offi ce: The sum of all the exposure values to Head offi ce (including other overseas branches/subsidiaries/parent/group entities) must not be higher than 25% of the Bank’s available eligible capital base at all time.
Exposure to NBFCs: Exposure Ceilings proposed under LE Framework: (i) Exposures to NBFCs: Banks’ exposures to a single NBFC will be restricted to 15 percent of the eligible capital base. However, for
NBFCs having signifi cant exposure to unsecured personal loans in its portfolio, the exposure be restricted to 10% of eligible capital base.
(ii) Banks’ exposures to a group of connected NBFCs or groups of connected counterparties having NBFCs in the group will be restricted to 25 percent of their Tier I Capital.
Industries Industry analysis plays an important part in assessing the concentration risk within the loan portfolio. Particular attention is given to
industry sectors where the Bank believes there is a high degree of risk or potential for volatility in the future. The Bank has fi xed internal limits for aggregate commitments to different sectors so that the exposures are evenly spread over various sectors.
Quantitative Disclosures as per table DF 3 CREDIT RISK EXPOSURES Total Net Credit Risk Exposure (Amount in crore) Particulars As at Mar 31, 2020 As at Mar 31, 2019 Fund Based 5,040.98 5,030.96 Non Fund Based 6,927.61 7,462.85 Total 11,968.59 12,493.81 Note 1: Fund-based exposure represents funded loans & advances including overdrafts, cash credits and bill discounting. Note 2: Non-fund based exposures are guarantees given on behalf of constituents, Letters of Credit, Undrawn binding commitments,
acceptances and endorsements. Note 3: The exposure amount is the net outstanding (i.e. net of provisions and credit risk mitigants, if any). Note 4: The increase in exposures by 25% due to unhedged foreign currency exposure is not considered in the above fi gures.
ECO
NOM
IC &
PO
LITI
CAL
WEE
KLY

(Incorporated in France with limited liability)INDIAN BRANCHES
Economic & Political Weekly EPW Published on Saturday, june 27, 2020 vol lV nos 26 & 27 149
The Bank does not have overseas operations and hence exposures are restricted to the domestic segment. Distribution of credit risk exposure by industry sector as at Mar 31, 2020 (Amount in crore) Industry code Industry Name Funded Non Funded Total 1 A. Mining and Quarrying (A. 1 & A.2) – 2.15 2.15 1.1 A.1 Coal – – – 1.2 A.2 Others – 2.15 2.15 2 B. Food Processing (Sumof B.1 to B.5) 1.85 – 1.85 2.1 B.1 Sugar – – – 2.2 B.2 Edible Oils and Vanaspati – – 2.3 B.3 Tea – – – 2.4 B.4 Coffee – – – 2.5 B.5 Others 1.85 – 1.85 3 C. Beverages (excluding Tea & Coffee) and Tobbacco (sum of C.1 & C.2) – 1.27 1.27 3.1 C.1 Tobacco and Tobacco products – – – 3.2 C.2 Others – 1.27 1.27 4 D. Textiles (Sum of D.1 to D.6) – 8.20 8.20 4.1 D.1 Cotton – – – 4.2 D.2 Jute – – – 4.3 D.3 Handicraft/Khadi (Non priority) – – – 4.4 D.4 Silk – – – 4.5 D.5 Woolen – – – 4.6 D.6 Others – 8.20 8.20 4.7 Out of D (i.e Total Textiles) to Spinning Mills – – – 5 E. Leather and Leather products – – – 6 F. Wood and Wood products – – – 7 G. Paper and paper products – – 8 H. Petroleum (non-infra), Coal products (non-mining) and Nuclear Fuels 267.94 – 267.94 9 I Chemicals & Chemical products (Dyes, Paints, etc.) (Sum of 1.1 to 1.4) 100.05 16.51 116.56 9.1 I.1 Fertilisers – – – 9.2 I.2 Drugs and Pharmaceuticals 81.30 15.97 97.27 9.3 I.3 Petro-chemicals (Excluding under Infrastructure) – – – 9.4 I.4 Others 18.75 0.54 19.29 10 J Rubber, Plastic and their Products 192.55 30.17 222.72 11 K Glass & Glassware 35.00 3.55 38.55 12 L Cement and Cement products – 9.16 9.16 13 M Basic Metal and Metal products (M.1 + M.2) 400.29 625.07 1,025.36 13.1 M.1 Iron and Steel 87.71 339.29 427.00 13.2 M.2 Other Metal and Metal Products. 312.58 285.78 598.36 14 N All Engineering (N.1+ N.2) 981.98 1,019.88 2,001.86 14.1 N.1 Electronics 150.96 – 150.96 14.2 N.2 Others 831.02 1,019.88 1,850.90 15 O Vehicles, Vehicles Parts and Transport Equipments 623.55 251.36 874.91 16 P Gems and Jewellery – – – 17 Q Construction 88.89 592.31 681.20 18 R Infrastructure (Sum of R1 to R4) 267.66 599.23 866.89 18.1 R.1 Transport ((Sum of R.1.1 to R.1.5) – – – 18.1.1 R.1.1 Railways – – – 18.1.2 R.1.2 Roadways – – – 18.1.3 R.1.3 Airport – – – 18.1.4 R.1.4 Waterways – – – 18.1.5 R.1.5 Others – – – 18.2 R.2 Energy (Sum of R.2.1 to R.2.4) 177.10 197.90 375.00 18.2.1 R.2.1 Electricity (generation-transportation and distribution) 177.10 197.90 375.00 18.2.1.1 R.2.1.1 State Electricity Boards – – – 18.2.1.2 R.2.1.2 Others 177.10 197.90 375.00 18.2.2 R.2.2 Oil (Storage and Pipeline) – – – 18.2.3 R.2.3 Gas/LNG (Storage and Pipeline) – – – 18.2.4 R.2.4 Others – – – 18.3 R.3 Telecommunication – – – 18.4 R.4 Others (Sum of R.4.1 to R.4.3) 90.56 401.33 491.89 18.4.1 R.4.1 Water Sanitation – 18.4.2 R.4.2 Social & Commercial Infrastructure – – – 18.4.3 R.4.3 Others 90.56 401.33 491.89 19 S Others Industries 181.82 93.86 275.68 20 All Industries (Sum of A to S) 3,141.58 3,252.85 6,394.43 21 Residuary other Advances (to tally with gross advances) [a+b+c] 1,899.40 3674.89 5,574.29 21.1 a Education Loan – – – 21.2 b Aviation Sector – – – 21.3 c Other Residuary Advances 1,899.40 3,674.89 5,574.29 22 Total Loans and Advances 5,040.98 6,927.61 11,968.59
ECO
NOM
IC &
PO
LITI
CAL
WEE
KLY

(Incorporated in France with limited liability)INDIAN BRANCHES
Published on Saturday, june 27, 2020 vol lV nos 26 & 27 EPW Economic & Political Weekly150
Residual contractual maturity breakdown of total assets (Amount in crore)
Maturity bucket Mar 31, 2020 Mar 31, 2019 1day 2,485.70 1,826.27 2 to 7 days 1,877.66 1,160.35 8 to 14 days 995.77 1,125.92 15 to 30 days 959.59 658.05 31 days to 3 months 1,546.48 1,618.80 3 to 6 months 665.48 1,295.41 6 to 12 months 968.82 434.22 1 to 3 years 877.07 520.62 3 to 5 years 5.00 69.49 Over 5 years 10,931.46 6,734.10 Total 21,313.03 15,443.23 Movement of NPAs and Provision for NPAs (excludes NPAs on derivatives) (Amount in crore) Mar 31, 2020 Mar 31, 2019 A Amount of NPAs (Gross) 2.93 3.17 – Substandard – – – Doubtful 1 – – – Doubtful 2 – – – Doubtful 3 – – – Loss 2.93 3.17 B Net NPAs – – C NPA Ratios – Gross NPAs to gross advances (%) 0.06% 0.06% – Net NPAs to net advances (%) 0.00% 0.00% D Movement of NPAs (Gross) – Opening balance 3.17 383.56 – Additions – 13.45 – Reductions (0.24) (393.84) – Exchange rate movement – – – Closing balance 2.93 3.17 E Movement of Provision for NPAs – Opening balance 3.17 326.56 – Provision made – 70.45 – Write-off/write-back of excess provisions during the year (including recovery) (0.24) (393.84) – Exchange rate movement – – – Closing balance 2.93 3.17 NPIs and movement of provision for depreciation on investments (Amount in crore) Mar 31, 2020 Mar 31, 2019 A Amount of Non-Performing Investments – – B Amount of provision held for Non-Performing Investments – – C Movement of provision for depreciation on investments – Opening balance 6.74 12.64 – Provision made – – – Write-offs – – – Write-back of excess provision (6.74) (5.90) – Closing balance – 6.745. CREDIT RISK – Disclosures for portfolios under the standardized approach Qualitative Disclosures as per table DF 4 Use of external ratings issued by Rating Agencies under the Standardized Approach The Bank uses the issuer ratings and short-term and long-term instrument/bank facilities’ ratings which are assigned by the accredited rating
agencies viz. CRISIL, CARE, ICRA, India Ratings (FITCH group company), Brickwork and SMERA, and published in the public domain to assign risk-weights in terms of RBI guidelines. In respect of claims on non-resident corporates and foreign banks, ratings assigned by international rating agencies i.e. Standard & Poor’s, Moody’s and Fitch are used. For exposures with contractual maturity of less than one year, a short-term rating is used. For cash credit facilities and exposures with contractual maturity of more than one year, long-term rating is used.
ECO
NOM
IC &
PO
LITI
CAL
WEE
KLY

(Incorporated in France with limited liability)INDIAN BRANCHES
Economic & Political Weekly EPW Published on Saturday, june 27, 2020 vol lV nos 26 & 27 151
Issue ratings would be used if the Bank has an exposure in the rated issue and this would include fund-based and non-fund based working capital facilities as well as loans and investments. In case the Bank does not have exposure in a rated issue, the Bank would use the issue rating for its comparable unrated exposures to the same borrower, provided that the Bank’s exposures are pari-passu or senior and of similar or lesser maturity as compared to the rated issue. If an issuer has a long-term or short-term exposure with an external rating that warrants a risk weight of 150%, all unrated claims on the same counterparty, whether short-term or long-term, also receive 150% risk weight, unless the Bank uses recognized credit risk mitigation techniques for such claims.
The unrated short term claim on counterparty is assigned risk weight of at least one level higher than the risk weight applicable to the rated short term claim on that counterparty. Thus, if a short term rated facility to a counter party attracts a 20% or a 50% risk weight, unrated short-term claims on the same counterparty is assigned a risk weight of 30% or 100% respectively.
Risk Weight mapping of long term corporate ratings Domestic rating agencies AAA AA A BBB BB & below Unrated Risk weight (%) 20 30 50 100 150 100
Risk weight mapping of short term corporate ratings Short term claim on Corporates Risk Weight CARE CRISIL India Ratings ICRA Brickwork SMERA (%) CARE A1+ CRISIL A1+ IND A1+ ICRA A1+ Brickwork A1+ SMERA A1+ 20 CARE A1 CRISIL A1 IND A1 ICRA A1 Brickwork A1 SMERA A1 30 CARE A2 CRISIL A2 IND A2 ICRA A2 Brickwork A2 SMERA A2 50 CARE A3 CRISIL A3 IND A3 ICRA A3 Brickwork A3 SMERA A3 100 CARE A4 &D CRISIL A4 & D INDA4 & D ICRA A4 & D Brickwork A4 & D SMERA A4 & D 150 Unrated Unrated Unrated Unrated Unrated Unrated 100 Note: Risk weight on claims on AFCs would continue to be governed by credit rating of the AFCs, except that claims that attract a risk
weight of 150 per cent under NCAF shall be reduced to a level of 100 per cent. Claims classifi ed as “Commercial Real Estate Exposure” will attract risk weight of 100%. Note: a) In accordance with RBI circular # DBR.No.BP.BC.6/21.06.001/2016-17 dated 25 Aug 2016, any counterparty having aggregate exposure
from banking system of more than INR 1 Bio which were externally rated earlier and subsequently not rated will attract Risk Weight of 150%. b) Further, with effect from 30 Jun 2017, following two additional regulations have come into force: – All unrated claims on corporates, AFCs, and NBFC-IFCs having aggregate exposure from banking system of more than INR 2
Bio attract a risk weight of 150% with effect from Financial Year ending March 31, 2019; and – As per the Guidelines on Enhancing Credit Supply for Large Borrowers through Market Mechanism, with effect from 1 Apr
2017, an additional Risk Weight of 75 percentage points over and above the applicable Risk Weight is to be applied on the exposure of borrowers having fund based credit facilities above INR 250 Bio from banking system at any time in FY 2017-18; INR 150 bio in FY 2018-19 and INR 100 bio from 1 Apr 2019 onwards.
c) Exposure to Qualifying Central Counterparties (QCCPs): risk weight of 2% to be applied to the Bank’s trade exposure to QCCP where the Bank acts as a clearing member of a QCCP for its own purposes.
The claims on banks incorporated in India and foreign banks branches in India, excluding investment in equity shares and other instruments eligible for capital status are risk weighted as under:
Level of Common Equity Tier 1 capital (CET1) including applicable capital Scheduled Banks Other Banks conservation buffer (CCB) (%) of the counterparty bank (where applicable)
Applicable Minimum CET1 + Applicable CCB and above 20% 100% Applicable Minimum CET1 + CCB = 75% and <100% of applicable CCB 50% 150% Applicable Minimum CET1 + CCB = 50% and <75% of applicable CCB 100% 250% Applicable Minimum CET1 + CCB = 0% and <50% of applicable CCB 150% 350% Minimum CET1 less than applicable minimum 625% 625%
Risk weight mapping of foreign banks:
S&P/FITCH ratings AAA to AA A BBB BB to B Below B Unrated Moody’s ratings Aaa to Aa A Baa Ba to B Below B Unrated Risk Weight (%) 20 50 50 100 150 50 Risk weight mapping of foreign sovereigns:
S&P/FITCH ratings AAA to AA A BBB BB to B Below B Unrated Moody’s ratings Aaa to Aa A Baa Ba to B Below B Unrated Risk Weight (%) 0 20 50 100 150 100
ECO
NOM
IC &
PO
LITI
CAL
WEE
KLY
(Incorporated in France with limited liability)INDIAN BRANCHES
Published on Saturday, june 27, 2020 vol lV nos 26 & 27 EPW Economic & Political Weekly152
Risk weight mapping of foreign public sector entities and non-resident corporates:
S&P/FITCH ratings AAA to AA A BBB Below B Unrated Moody’s ratings Aaa to Aa A Baa Below B Unrated Risk Weight (%) 20 50 100 150 100
Quantitative Disclosures as per table DF 4 Amount of credit RWA outstanding under various risk buckets: (Amount in crore) Particulars Mar 31, 2020 Mar 31, 2019 Below 100% risk weight 3,370.02 4,423.66 100% risk weight 2,747.77 6,362.84 More than 100% risk weight 8,553.93 2,679.08 Deductions Total risk weighted assets 14,671.72 13,465.58
Note: Credit Risk Exposure for foreign exchange contracts and derivatives has been calculated as per Current Exposure Method in accordance with RBI guidelines.
6. CREDIT RISK MITIGATION Qualitative Disclosures as per table DF 5 The Bank uses various collaterals both fi nancial as well as non-fi nancial as credit risk mitigants (CRM). The main collateral recognized by
the Bank for RWA purpose comprises of bank deposits/cash margin. The Bank has in place a Credit Risk Mitigants management policy, which underlines the eligibility requirements for credit risk mitigants for
capital computation as per Basel III guidelines. The Bank reduces its credit exposure to a counter party with the value of eligible fi nancial collateral to take account of the risk mitigating effect of the collateral. To account for the volatility in the value of collateral, haircut is applied based on the type, issuer, maturity and rating of the collateral/collateral provider.
Quantitative Disclosures as per table DF 5 The quantum of the credit portfolio which benefi ts from fi nancial collaterals and/or guarantees as credit risk mitigants is an insignifi cant
portion of our customer advances. Therefore, the credit and/or market concentration risks are not material. The total exposure that is covered by eligible fi nancial collateral, after the application of haircuts is INR 30.99 crores (March 31, 2019:- INR
15.41 crores). Break-down of exposure covered by eligible fi nancial collateral: (Amount in crore) Facility Mar 31, 2020 Mar 31, 2019 Funded – – Non-Funded - Letters of Credit – – Non-funded - Guarantees 30.99 15.41 Non-funded - FX/Derivative – – Total 30.99 15.41
7. SECURITIZATION EXPOSURES Qualitative & Quantitative disclosures as per table DF 6 The Bank has not undertaken any securitization activity either as an originator or as credit enhancer. Details of exposure securitized by the
Bank and subject to securitization framework is thus NIL.8. MARKET RISK IN TRADING BOOK Qualitative Disclosures as per table DF 7 Market risk is the risk to the Bank’s earnings and capital due to changes in the market level of interest rates or prices of securities and foreign
exchange as well as the volatilities of those changes. Bank’s market risk objectives are to understand and control market risk by robust measurement and the setting of position limits, facilitate
business growth within a controlled and transparent risk management framework and minimize non-traded market risk. The Bank is exposed to market risk through its trading activities, which are carried out for customers. The Bank adopts a comprehensive
approach to market risk management for its trading, investment and asset/liability portfolios. The Bank uses various risk metrics, both statistical and non-statistical, including:
– Value at Risk (VaR) – Non-statistical measures like position, gaps and sensitivities i.e. PV01, Duration and Option Greeks
ECO
NOM
IC &
PO
LITI
CAL
WEE
KLY

(Incorporated in France with limited liability)INDIAN BRANCHES
Economic & Political Weekly EPW Published on Saturday, june 27, 2020 vol lV nos 26 & 27 153
The Bank uses Historical Simulation method for calculation of VaR at 99% confi dence interval and holding period of 1 day. The 261 days historical market data (rate + volatility) are used. The shocks are applied to market data to calculate mark to market value of each scenario in a portfolio at each level of consolidation. The VaR models are back-tested at regular intervals and results are used to maintain and improve the effi cacy of the model. VaR is calculated for trading and non-trading portfolio on daily basis and reported to senior management of the Bank. Stress test is also conducted on quarterly basis as per RBI methodology. Similarly stress test is also performed as per internal methodology on the total portfolio on weekly basis, which shows impact of extreme market movements on Bank’s portfolio.
Different risk limits such as Overnight position, maximum maturity, Profi t and Loss alert and Annual stop loss alerts are set up according to a number of criteria including relevant market analysis, business strategy, management experience and risk appetite for market risk exposures. These limits are monitored on daily basis and exceptions are reported to management and put up to ALCO. Market risk limits are reviewed at least once a year or more frequently if deemed necessary to maintain consistency with trading strategies and material developments in market conditions.
Concentration Risk The Bank has allocated internal risk limits in order to avoid concentrations, wherever relevant. The Bank has allocated PVO1 limits
currency wise/bucket wise, which are monitored on daily basis for any possible concentration risk. Quantitative Disclosures as per table DF 7 Capital Requirement for Market Risk (Amount in crore) Particulars Mar 31, 2020 Mar 31, 2019 – Interest rate risk 255.11 211.01 – Equity position risk – – – Foreign exchange risk (including gold) 36.00 18.00 Total 291.11 229.01
9. OPERATIONAL RISK
Qualitative Disclosures as per table DF 8
Operational Risk - Defi nition
Operational risk is defi ned as the risk of loss resulting from inadequate or failed internal processes, people and systems or from external events. Operational risk is the risk of direct or indirect losses resulting from human factors, external events, inadequate or failed internal processes and systems. Major sources of operational risk include: operational process reliability, IT security, outsourcing of operations, dependence on key suppliers, implementation of strategic change, integration of acquisition, fraud, human error, customer service quality, regulatory compliance, recruitment, training and retention of staff and social and environmental impacts. This defi nition includes legal risk, but excludes business and reputation risk.
Strategies and Processes
The Bank has set up a Permanent Control Department within Risk to manage operational risk through identifi cation, assessment and monitoring. Simultaneously, a framework has been laid to capture loss data which can be mapped to operational risk events to measure the impact quantitatively. The Bank has put in place a structure to effectively manage operational risk through the formation of several Internal Committees viz., Internal Control Committee (ICC), New Products and Activities Committee. The functioning of these committees is well defi ned. The Risk and Permanent Control Department acts as the convener of ICC.
Structure and Organization
The Bank has an Internal Control Committee (ICC) which is responsible for implementation of the Operational Risk policies of the Bank. This Internal Control Committee supervises effective monitoring of operational risk and the implementation of measures for enhanced capability to manage operational risk.
Internal Vigilance System
As mandated by Reserve Bank of India the Bank has setup an Internal Vigilance Committee chaired by the Senior Country Offi cer (the other members being Chief Operating Offi cer, Heads of Risk, HR, Audit and Compliance with the Permanent Control Offi cer as the Chief Vigilance Offi cer) that is responsible for implementing anti-corruption measures and looking into acts of misconduct, alleged or committed, by employees within its control and take appropriate punitive action. The Committee also takes appropriate measures to prevent commission of misconducts/malpractices by employees. The Committee meets on a quarterly basis.
Operational Risk Reporting and Measurement Systems
A systematic centralized process for reporting losses, “near misses” issues relating to operational events is implemented. Based upon the information gathered, control measures would be introduced. All operational loss events and potential loss events are reported to HO and reviewed by the Local ICC.
An Operational Risk Mapping project has been undertaken within the Bank to identify and assess the operational risk inherent in all material products, activities, processes and systems. The objective of the Operational Risk Mapping is to map the various business lines, organizational functions or process fl ows by risk type to reveal areas of weakness so to prioritize subsequent management actions.
ECO
NOM
IC &
PO
LITI
CAL
WEE
KLY

(Incorporated in France with limited liability)INDIAN BRANCHES
Published on Saturday, june 27, 2020 vol lV nos 26 & 27 EPW Economic & Political Weekly154
Policies for Managing Operational risk
An Operational Risk Management Policy approved by the Internal Control Committee of the Bank details the framework for reducing/controlling operational risk in the Bank. As per the policy, all new products are being vetted by the New Products and Activities Committee to identify and assess potential operational risks involved and suggest control measures to mitigate the risks. A review of the approved products is being done by the Compliance Department on a regular basis.
Operational Risk Capital Assessment
As per the RBI guidelines, the Bank has followed the Basic Indicator Approach for the year ending 31st Mar 2020.
10. INTEREST RATE RISK IN THE BANKING BOOK
Qualitative Disclosures as per table DF 9
Interest rate risk in the banking book is primarily the change in the net interest income and the value of the bank’s assets and liabilities due to changes in interest rates. Treasury desk under the supervision of the Asset/Liability Committee (ALCO) manages interest rate risk within the ALM guidelines set up at Bank level and within the limits set up by the Department of Risk Management. The bank has ALCO approved funds transfer pricing policy between various product lines in the bank and also details about the interest rate risk management framework. As part of the policy interest rate risk originated due to commercial banking activities are transferred to Treasury – Fund Management desk, which is in charge of managing the interest rate risk within the banking book. The Treasury desk manages interest rate risk on ongoing basis by dealing in various approved fi nancial products and is subject to same VaR & stress tests as that for the trading book.
Quantitative Disclosures as per table DF 9
The bank has uses the modifi ed duration approach to measure potential impact on the capital fund (MVE) for upward and downward interest rate shocks of 200 bps on quarterly basis. The bank also has prescribed shocks to calculate impact arising out of the basis risk in the banking book.
The impact on the capital funds for upward/downward interest rate shock of 200 bps as at Mar 31,2020 is as below:- (Amount in crore)
Currency Upward Interest rate shock Downward Interest rate shock INR 73.57 -73.57 USD -9.63 9.63 Others -2.20 2.20 Total 61.74 -61.74
Earnings at risk (EaR) measure the interest rate risk from earnings perspective. This is computed based on the net gaps for each bucket up to 1 year with a 1% parallel shift in the yield curve on the bank’s earning. The impact from earnings perspective as at Mar 31,2020 is INR 9.04 crores.
11. GENERAL DISCLOSURE FOR EXPOSURES RELATED TO COUNTERPARTY CREDIT RISK
Qualitative Disclosures as per table DF 10
The Bank stipulates limits as per the norms on exposure stipulated by RBI for both fund and non-fund based products including derivatives. Limits are set as a percentage of the capital funds and are monitored. The utilization against specifi ed limits is reported to the Credit Committee on a periodic basis. The analysis of the composition of the portfolio is presented to the Local Management Committee on a half yearly basis.
Credit Control Department monitors the credit excess (including FX/ Derivatives exceeding approved limit) on a daily basis. The ‘credit exposure’ arising on account of interest rate and foreign exchange derivative transactions is computed using the “Current Exposure Method” as laid down by RBI.
The Bank has entered into Credit Support Annex (CSA) agreement with local banks. CSA defi nes the terms or rules under which collateral is posted or transferred between derivative counterparties to mitigate the credit risk arising from “in the money” derivative positions on OTC Derivative contracts.
Exposure to Central counterparties arising from over-the-counter derivative trades, exchange traded derivatives transactions and security fi nancing transactions (SFTs), attracts capital charges applicable to Central Counterparty.
Applicable risk weights for trades, guaranteed by central counterparties, which are recognized as qualifying central counterparty (QCCP) by Reserve Bank of India or SEBI, are comparatively lower than OTC deals.
In India, presently there are four QCCPs viz. Clearing Corporation of India (CCIL), National Securities Clearing Corporation Ltd (NSCCL), Indian Clearing Corporation Ltd (ICCL) and MCX-SX Clearing Corporation Ltd (MCX-SXCCL). These CCPs are subjected, on an ongoing basis, to rules and regulations that are consistent with CPSS-IOSCO Principles for Financial Market Infrastructures.
The bank has also computed the incurred Credit Valuation Adjustment (CVA) loss as per Basel III master circular and the same has been considered for reduction in derivative exposure computation. The provision amount outstanding as on Mar 31, 2020 is INR 42.40 crores.
ECO
NOM
IC &
PO
LITI
CAL
WEE
KLY

(Incorporated in France with limited liability)INDIAN BRANCHES
Economic & Political Weekly EPW Published on Saturday, june 27, 2020 vol lV nos 26 & 27 155
Quantitative Disclosures as per table DF 10
The derivative exposure outstanding as of Mar 31, 2020 is given below: (Amount in crore)
Particulars Notional Amount Positive MTM Add-On Current Exposure
Interest Rate Swaps 149,873.67 1,659.44 1,267.33 2,926.77 Currency Swaps (CIRS) 19,401.75 323.02 1,721.93 2,044.95 Currency Options 1,477.17 20.18 50.73 70.91 Currency Future 7.60 0.00 0.15 0.15 Foreign Exchange Contract 532,266.89 8,460.83 11,616.02 20,076.85
Total 703,027.08 10,463.47 14,656.16 25,119.63
There are no Forward Rate Agreements outstanding as on date. The bank does not deal in Credit Default Swaps. The above table does not include the impact of CVA provision which is used to reduce the exposure computation.
12. COMPOSITION OF CAPITAL DISCLOSURE TEMPLATES (CAPITAL STRUCTURE)
Common Equity Tier I Capital: primarily comprises of interest free capital funds received from Head Offi ce, statutory reserves, capital reserve, general reserves and remittable surplus retained for meeting capital adequacy requirements.
Additional Tier I Capital: The bank does not have any Additional Tier I capital.
Tier II Capital mainly comprises of the subordinated debt raised from Head Offi ce, investment reserve, provision for country risk, provision towards standard assets (including on positive marked to market and un-hedged foreign currency exposures).
Quantitative Disclosures as per table DF 11, table DF 12, table DF 13 and DF 14
The composition of capital as on Mar 31, 2020 as per Table DF 11, Composition of Capital- Reconciliation Requirements as of Mar 31, 2020 (Step 1 to 3) as per Table DF 12 and Main Features of Regulatory Capital Instruments as per Table DF 13 are provided as separate annexures to this disclosure.
The Bank has received only interest free capital funds & also raised subordinated debt from Head Offi ce. The terms & condition of same is already disclosed under DF 13. The Bank has not issued any regulatory capital instruments in India. Accordingly, no specifi c disclosure is required under DF 14.
13. REMUNERATION
As per section C of RBI circular DBOD.No.BC.72/29.67.001/2011-12 dated January 13, 2012 – Guidelines on compensation of Whole Time Directors /Chief Executive Offi cers/Risk takers and Control function staff, etc. on “Compensation guidelines for foreign banks”, foreign banks operating in India through branch mode of presence and having their compensation policy governed by their respective Head Offi ce policies are expected to align the policy (In the light of the initiative taken by the FSB, G-20 and the BCBS endorsement of the FSB principles) in line with the Financial Stability Board (FSB) principles. As the bank’s compensation structure is in conformity with the FSB principles and standards, no specifi c qualitative and quantitative disclosure as per table DF 15 is required.
14. Equities –Banking Book Positions
Qualitative & Quantitative disclosures as per table DF 16
The Bank does not have any equity exposure and disclosure under this section is NIL.
15. Leverage Ratio Disclosures
As on Mar 31, 2020 the leverage ratio is 4.75%. The summary comparison of accounting assets vs. leverage ratio exposure measure as per Table DF 17 and leverage ratio common disclosure as per Table DF 18 are provided as separate annexures to this disclosure.
Ravinarayanan Iyer Loic Borrey Chief Financial Offi cer - India Chief Operating Offi cer - India
Mumbai Date: Jun 16, 2020
ECO
NOM
IC &
PO
LITI
CAL
WEE
KLY

(Incorporated in France with limited liability)INDIAN BRANCHES
Published on Saturday, june 27, 2020 vol lV nos 26 & 27 EPW Economic & Political Weekly156
Table DF - 11 : Composition of Capital as of March 31, 2020 (Rs. in million) Basel III common disclosure template to be used during the transition of regulatory adjustments Amounts Ref No. Subject to Pre-Basel III Treatment
Common Equity Tier 1 capital: instruments and reserves1 Directly issued qualifying common share capital plus related stock surplus
(share premium) 10,971.67 A= A1+A2 2 Retained earnings 10,515.59 3 Accumulated other comprehensive income (and other reserves) – B=B1+B2+
B3+B4+B5 4 Directly issued capital subject to phase out from CET1 (only applicable to
non-joint stock companies) – Public sector capital injections grandfathered until January 1, 2018 NA 5 Common share capital issued by subsidiaries and held by third parties
(amount allowed in group CET1) – 6 Common Equity Tier 1 capital before regulatory adjustments 21,487.26 Common Equity Tier 1 capital : regulatory adjustments 7 Prudential valuation adjustments – 8 Goodwill (net of related tax liability) – 9 Intangibles other than mortgage-servicing rights (net of related tax liability) 2,515.78 10 Deferred tax assets – 11 Cash-fl ow hedge reserve – 12 Shortfall of provisions to expected losses – 13 Securitisation gain on sale – 14 Gains and losses due to changes in own credit risk on fair valued liabilities – 15 Defi ned-benefi t pension fund net assets – 16 Investments in own shares (if not already netted off paid-up capital on reported balance sheet) – 17 Reciprocal cross-holdings in common equity – 18 Investments in the capital of banking, fi nancial and insurance entities that are outside the
scope of regulatory consolidation, net of eligible short positions, where the bank does not own more than 10% of the issued share capital (amount above 10% threshold) –
19 Signifi cant investments in the common stock of banking, fi nancial and insurance entities that are outside the scope of regulatory consolidation, net of eligible short positions (amount above 10% threshold) –
20 Mortgage servicing rights (amount above 10% threshold) – 21 Deferred tax assets arising from temporary differences (amount above 10% threshold,
net of related tax liability) – 22 Amount exceeding the 15% threshold – 23 of which : signifi cant investments in the common stock of fi nancial entities – 24 of which : mortgage servicing rights – 25 of which : deferred tax assets arising from temporary differences – 26 National specifi c regulatory adjustments (26a+26b+26c+26d) – 26a of which : Investments in the equity capital of unconsolidated insurance subsidiaries – 26b of which : Investments in the equity capital of unconsolidated non-fi nancial subsidiaries – 26c of which : Shortfall in the equity capital of majority owned fi nancial entities which have
not been consolidated with the bank – 26d of which : Unamortised pension funds expenditures – Regulatory Adjustments Applied to Common Equity Tier 1 in respect of
Amounts Subject to Pre-Basel III Treatment – of which : [INSERT TYPE OF ADJUSTMENT] For example: fi ltering out of unrealised
losses on AFS debt securities (not relevant in Indian context) – of which : [INSERT TYPE OF ADJUSTMENT] – of which : [INSERT TYPE OF ADJUSTMENT] –
ECO
NOM
IC &
PO
LITI
CAL
WEE
KLY

(Incorporated in France with limited liability)INDIAN BRANCHES
Economic & Political Weekly EPW Published on Saturday, june 27, 2020 vol lV nos 26 & 27 157
Table DF - 11 : Composition of Capital as of March 31, 2020 (Rs. in million) Basel III common disclosure template to be used during the transition of regulatory adjustments Amounts Ref No. Subject to Pre-Basel III Treatment
27 Regulatory adjustments applied to Common Equity Tier 1 due to insuffi cient Additional Tier 1 and Tier 2 to cover deductions –
28 Total regulatory adjustments to Common equity Tier 1 2,515.78 29 Common Equity Tier 1 capital (CET1) 18,971.48
Additional Tier 1 capital : instruments 30 Directly issued qualifying Additional Tier 1 instruments plus related stock surplus
(share premium) (31+32) – 31 of which : classifi ed as equity under applicable accounting standards
(Perpetual Non-Cumulative Preference Shares) – 32 of which : classifi ed as liabilities under applicable accounting standards
(Perpetual debt Instruments) – 33 Directly issued capital instruments subject to phase out from Additional Tier 1 – 34 Additional Tier 1 instruments (and CET1 instruments not included in row 5)
issued by subsidiaries and held by third parties (amount allowed in group AT1) – 35 of which : instruments issued by subsidiaries subject to phase out – 36 Additional Tier 1 capital before regulatory adjustments – Additional Tier 1 capital: regulatory adjustments 37 Investments in own Additional Tier 1 instruments – 38 Reciprocal cross-holdings in Additional Tier 1 instruments – 39 Investments in the capital of banking, fi nancial and insurance entities that are
outside the scope of regulatory consolidation, net of eligible short positions, where the bank does not own more than 10% of the issued common share capital of the entity (amount above 10% threshold) –
40 Signifi cant investments in the capital of banking, fi nancial and insurance entities that are outside the scope of regulatory consolidation (net of eligible short positions) –
41 National specifi c regulatory adjustments (41a+41b) – 41a Investments in the Additional Tier 1 capital of unconsolidated insurance subsidiaries – 41b Shortfall in the Additional Tier 1 capital of majority owned fi nancial entities which
have not been consolidated with the bank – Regulatory Adjustments Applied to Additional Tier 1 in respect of Amounts Subject
to Pre-Basel III Treatment - of which : [INSERT TYPE OF ADJUSTMENT e.g. DTAs] – of which : [INSERT TYPE OF ADJUSTMENT e.g. existing adjustments which are
deducted from Tier 1 at 50%] – of which : [INSERT TYPE OF ADJUSTMENT] – 42 Regulatory adjustments applied to Additional Tier 1 due to insuffi cient Tier 2
to cover deductions – 43 Total regulatory adjustments to Additional Tier 1 capital – 44 Additional Tier 1 capital (AT1) – 44a Additional Tier 1 capital reckoned for capital adequacy – 45 Tier 1 capital (T1 = CET1 + Admissible AT1) (29 + 44a) 18,971.48 Tier 2 capital : instruments and provisions46 Directly issued qualifying Tier 2 instruments plus related stock surplus 3,009.95 D=D1 47 Directly issued capital instruments subject to phase out from Tier 2 – – C=C1 48 Tier 2 instruments (and CET1 and AT1 instruments not included in rows 5 or 34)
issued by subsidiaries and held by third parties (amount allowed in group Tier 2) – 49 of which : instruments issued by subsidiaries subject to phase out – 50 Provisions 1,213.81 E=E1+E2+E3
ECO
NOM
IC &
PO
LITI
CAL
WEE
KLY

(Incorporated in France with limited liability)INDIAN BRANCHES
Published on Saturday, june 27, 2020 vol lV nos 26 & 27 EPW Economic & Political Weekly158
Table DF - 11 : Composition of Capital as of March 31, 2020 (Rs. in million) Basel III common disclosure template to be used during the transition of regulatory adjustments Amounts Ref No. Subject to Pre-Basel III Treatment
51 Tier 2 capital before regulatory adjustments 4,223.76 Tier 2 capital: regulatory adjustments 52 Investments in own Tier 2 instruments – 53 Reciprocal cross-holdings in Tier 2 instruments – 54 Investments in the capital of banking, fi nancial and insurance entities that are outside
the scope of regulatory consolidation, net of eligible short positions, where the bank does not own more than 10% of the issued common share capital of the entity (amount above the 10% threshold) –
55 Signifi cant investments in the capital banking, fi nancial and insurance entities that are outside the scope of regulatory consolidation (net of eligible short positions) –
56 National specifi c regulatory adjustments (56a+56b) – 56a of which : Investments in the Tier 2 capital of unconsolidated insurance subsidiaries – 56b of which : Shortfall in the Tier 2 capital of majority owned fi nancial entities which
have not been consolidated with the bank – Regulatory Adjustments Applied To Tier 2 in respect of Amounts Subject to
Pre-Basel III Treatment – of which : [INSERT TYPE OF ADJUSTMENT e.g. existing adjustments which are
deducted from Tier 2 at 50%] – of which : [INSERT TYPE OF ADJUSTMENT] – 57 Total regulatory adjustments to Tier 2 capital – 58 Tier 2 capital (T2) 4,223.76 58a Tier 2 capital reckoned for capital adequacy 4,223.76 58b Excess Additional Tier 1 capital reckoned as Tier 2 capital – 58c Total Tier 2 capital admissible for capital adequacy (58a + 58b) 4,223.76 59 Total capital (TC = T1 + Admissible T2) (45 + 58c) 23,195.23 Risk Weighted Assets in respect of Amounts Subject to Pre-Basel III Treatment – of which : [INSERT TYPE OF ADJUSTMENT] – of which : … – 60 Total risk weighted assets (60a + 60b + 60c) 186,549.42 60a of which : total credit risk weighted assets 146,717.19 60b of which : total market risk weighted assets 36,389.31 60c of which : total operational risk weighted assets 3,442.92 Capital ratios 61 Common Equity Tier 1 (as a percentage of risk weighted assets) 10.17% 62 Tier 1 (as a percentage of risk weighted assets) 10.17% 63 Total capital (as a percentage of risk weighted assets) 12.43% 64 Institution specifi c buffer requirement (minimum CET1 requirement plus capital
conservation and countercyclical buffer requirements, expressed as a percentage of risk weighted assets) 7.375%
65 of which : capital conservation buffer requirement 1.875% 66 of which : bank specifi c countercyclical buffer requirement 0.00% 67 of which : G-SIB buffer requirement 0.00% 68 Common Equity Tier 1 available to meet buffers (as a percentage of
risk weighted assets) 2.79% National minima (if different from Basel III) 69 National Common Equity Tier 1 minimum ratio (if different from Basel III minimum) 5.50% 70 National Tier 1 minimum ratio (if different from Basel III minimum) 7.00%
ECO
NOM
IC &
PO
LITI
CAL
WEE
KLY

(Incorporated in France with limited liability)INDIAN BRANCHES
Economic & Political Weekly EPW Published on Saturday, june 27, 2020 vol lV nos 26 & 27 159
Table DF - 11 : Composition of Capital as of March 31, 2020 (Rs. in million) Basel III common disclosure template to be used during the transition of regulatory adjustments Amounts Ref No. Subject to Pre-Basel III Treatment
71 National total capital minimum ratio (if different from Basel III minimum) 9.00% Amounts below the thresholds for deduction (before risk weighting)72 Non-signifi cant investments in the capital of other fi nancial entities – 73 Signifi cant investments in the common stock of fi nancial entities – 74 Mortgage servicing rights (net of related tax liability) – 75 Deferred tax assets arising from temporary differences (net of related tax liability) – Applicable caps on the inclusion of provisions in Tier 276 Provisions eligible for inclusion in Tier 2 in respect of exposures subject to
standardised approach (prior to application of cap) 1,213.81 E=E1+E2+E3 77 Cap on inclusion of provisions in Tier 2 under standardised approach 1,833.96 78 Provisions eligible for inclusion in Tier 2 in respect of exposures subject to
internal ratings-based approach (prior to application of cap) – 79 Cap for inclusion of provisions in Tier 2 under internal ratings-based approach – Capital instruments subject to phase-out arrangements (only applicable between March 31, 2017 and March 31, 2022) 80 Current cap on CET1 instruments subject to phase out arrangements – 81 Amount excluded from CET1 due to cap (excess over cap after redemptions and maturities) – 82 Current cap on AT1 instruments subject to phase out arrangements – 83 Amount excluded from AT1 due to cap (excess over cap after redemptions and maturities) – 84 Current cap on T2 instruments subject to phase out arrangements – C185 Amount excluded from T2 due to cap (excess over cap after redemptions and maturities) – C1
Notes to templateRow No. of Particular (Rs. in million)the template
10 Deferred tax assets associated with accumulated losses – Deferred tax assets (excluding those associated with accumulated losses) net of
Deferred tax liability – Total as indicated in row 10 – 19 If investments in insurance subsidiaries are not deducted fully from capital and
instead considered under 10% threshold for deduction, the resultant increase in the capital of bank NA
of which : Increase in Common Equity Tier 1 capital NA of which : Increase in Additional Tier 1 capital NA of which : Increase in Tier 2 capital NA 26b If investments in the equity capital of unconsolidated non-fi nancial subsidiaries are not
deducted and hence, risk weighted then : NA (i) Increase in Common Equity Tier 1 capital NA (ii) Increase in risk weighted assets NA 44a Excess Additional Tier 1 capital not reckoned for capital adequacy (difference between
Additional Tier 1 capital as reported in row 44 and admissible Additional Tier 1 capital as reported in 44a) –
of which : Excess Additional Tier 1 capital which is considered as Tier 2 capital under row 58b – 50 Eligible Provisions included in Tier 2 capital 1,213.81 Eligible Revaluation Reserves included in Tier 2 capital – Total of row 50 1,213.81 58a Excess Tier 2 capital not reckoned for capital adequacy (difference between Tier 2 capital as
reported in row 58 and T2 as reported in 58a) –
ECO
NOM
IC &
PO
LITI
CAL
WEE
KLY

(Incorporated in France with limited liability)INDIAN BRANCHES
Published on Saturday, june 27, 2020 vol lV nos 26 & 27 EPW Economic & Political Weekly160
Table DF-12 : Composition of Capital- Reconciliation Requirements as of March 31, 2020 (Step 1) (Rs. in million) Balance sheet Balance sheet under as in fi nancial regulatory scope of statements consolidation As on reporting date As on reporting date
A Capital & Liabilities i. Paid-up Capital 10,971.67 10,971.67 Reserves & Surplus 8,308.29 8,308.29 Minority Interest – – Total Capital 19,279.96 19,279.95 ii. Deposits 65,506.42 65,506.42 of which : Deposits from banks 3,142.26 3,142.26 of which : Customer deposits 62,364.16 62,364.16 of which : Other deposits (pl. specify) – – iii. Borrowings 8,524.94 8,524.94 of which : From RBI – – of which : From banks 4,000.00 4,000.00 of which : From other institutions & agencies – – of which : Others (Banks Outside India) 1,120.02 1,120.02 of which : Capital instruments 3,404.92 3,404.92 iv. Other liabilities & provisions 119,818.96 119,818.96 Total 213,130.28 213,130.28 B Assets i. Cash and balances with Reserve Bank of India 10,170.88 10,170.88 Balance with banks and money at call and short notice 5,506.87 5,506.87 ii. Investments : 35,010.34 35,010.34 of which : Government securities 35,010.34 35,010.34 of which : Other approved securities – – of which : Shares – – of which : Debentures & Bonds – – of which : Subsidiaries / Joint Ventures / Associates – – of which : Others (Commercial Papers, Mutual Funds etc.) – – iii. Loans and advances 50,409.87 50,409.87 of which : Loans and advances to banks – – of which : Loans and advances to customers 50,409.87 50,409.87 iv. Fixed assets 208.15 208.15 v. Other assets 111,824.17 111,824.17 of which : Goodwill and intangible assets – – of which : Deferred tax assets – – vi. Goodwill on consolidation – – vii. Debit balance in Profi t & Loss account – – Total Assets 213,130.28 213,130.28
Table DF-12 : Composition of Capital- Reconciliation Requirements as of March 31, 2020 (Step 2) (Rs. in million) Balance sheet as Balance sheet under Ref in fi nancial regulatory scope No. statements of consolidation As on reporting date As on reporting date A Capital & Liabilities i. Paid-up Capital 10,971.67 10,971.67 of which : Amount eligible for CET1 10,971.67 10,971.67 A1 of which : Amount eligible for AT1 – – A2 Reserves & Surplus 8,308.29 8,308.29 of which : Statutory Reserves 4,260.59 4,260.59 B1 of which : Investment Reserves 275.41 275.41 E1 of which : General Reserves 250.67 250.67 B2 of which : Remittable profi t retained for Capital Adequacy 5,829.61 5,829.61 B3 of which : Balance in P&L A/c (2,482.72) (2,482.72) B4 Minority Interest – – B5 Total Capital 19,279.96 19,279.96
ECO
NOM
IC &
PO
LITI
CAL
WEE
KLY

(Incorporated in France with limited liability)INDIAN BRANCHES
Economic & Political Weekly EPW Published on Saturday, june 27, 2020 vol lV nos 26 & 27 161
Table DF-12 : Composition of Capital-Reconciliation Requirements as of March 31, 2020 (Step 2) (Rs. in million) Balance sheet as Balance sheet under Ref in fi nancial regulatory scope No. statements of consolidation As on reporting date As on reporting date A ii. Deposits 65,506.42 65,506.42 of which : Deposits from banks 3,142.26 3,142.26 of which : Customer deposits 62,364.16 62,364.16 of which : Other deposits (pl. specify) – – iii. Borrowings 8,524.94 8,524.94 of which : From RBI – – of which : From banks 4,000.00 4,000.00 of which : From other institutions & agencies – – of which : Others (Banks outside India) 1,120.02 1,120.02 of which : Capital instruments 3,404.92 3,404.92 of which : Eligible Tier II Instruments (Phase Out) – – C1 of which : Eligible Tier II Instruments (No Phase Out) – 3,009.95 D1 iv. Other liabilities & provisions 119,818.96 119,818.96 of which : DTLs related to goodwill – – of which : DTLs related to intangible assets – – of which : Provision for Standard Assets 905.30 905.30 E2 of which : Provision for Country Risk 33.10 33.10 E3 Total Capital and Liabilities 213,130.28 213,130.28 B Assets i. Cash and balances with Reserve Bank of India 10,170.88 10,170.88 Balance with banks and money at call and short notice 5,506.87 5,506.87 ii. Investments : 35,010.34 35,010.34 of which : Government securities 35,010.34 35,010.34 of which : Other approved securities – – of which : Shares – – of which : Debentures & Bonds – – of which : Subsidiaries / Joint Ventures / Associates – – of which : Others (Commercial Papers, Mutual Funds etc.) SIDBI Deposits – – iii. Loans and advances 50,409.87 50,409.87 of which : Loans and advances to banks – – of which : Loans and advances to customers 50,409.87 50,409.87 iv. Fixed assets 208.15 208.15 v. Other assets 111,824.17 111,824.17 of which : Goodwill and intangible assets – – Out of which : – – Goodwill – – Other intangibles (excluding MSRs) – – Deferred tax assets – – vi. Goodwill on consolidation – – vii. Debit balance in Profi t & Loss account – – Total Assets 213,130.28 213,130.28
Extract of Basel III common disclosure template (with added column) – Table DF-11 (Step 3)Common Equity Tier 1 capital: instruments and reserves
Component of Source based on reference regulatory capital numbers/letters of the balance reported by bank sheet under the regulatory scope of consolidation from step 2
1 Directly issued qualifying common share (and equivalent for non-joint stock companies) capital plus related stock surplus 10,971.67 A1
2 Retained earnings – 3 Accumulated other comprehensive income (and other reserves) – B1+B2+B3+B54 Directly issued capital subject to phase out from CET1 (only applicable to
non-joint stock companies) – 5 Common share capital issued by subsidiaries and held by third parties
(amount allowed in group CET1) – 6 Common Equity Tier 1 capital before regulatory adjustments 10,971.67 7 Prudential valuation adjustments – 8 Goodwill (net of related tax liability) –
ECO
NOM
IC &
PO
LITI
CAL
WEE
KLY

(Incorporated in France with limited liability)INDIAN BRANCHES
Published on Saturday, june 27, 2020 vol lV nos 26 & 27 EPW Economic & Political Weekly162
Table DF-13: Main Features of Regulatory Capital InstrumentsDisclosure template for main features of regulatory capital instruments
1 Issuer CA-CIB India CA-CIB India
Branches Branches2 Unique identifi er (e.g. CUSIP, ISIN or Bloomberg identifi er for
private placement) NA NA3 Governing law(s) of the instrument Indian Laws Indian Laws Regulatory treatment 4 Transitional Basel III rules Common Equity Tier I Tier II5 Post-transitional Basel III rules Common Equity Tier I Tier II6 Eligible at solo / group / group & solo * Solo Solo7 Instrument type Head Offi ce Capital Subordinated Debt8 Amount recognised in regulatory capital (Rs. in actual, as of most recent
reporting date) INR 10,971,665,394.00 INR 3,009,949,500.00 9 Par value of instrument NA USD 45,000,000.0010 Accounting classifi cation Capital Borrowings11 Original date of issuance Various 13-Oct-1612 Perpetual or dated Perpetual Dated13 Original maturity date NA 13-Oct-2614 Issuer call subject to prior supervisory approval No Yes15 Optional call date, contingent call dates and redemption amount No After 13-Oct-21 or Tax
Event or Regulatory Event16 Subsequent call dates, if applicable No No Coupons/dividends 17 Fixed or fl oating dividend / coupon NA Floating18 Coupon rate and any related index NA LIBOR 6M + 2.57%19 Existence of a dividend stopper NA No20 Fully discretionary, partially discretionary or mandatory NA Mandatory21 Existence of step up or other incentive to redeem No No22 Noncumulative or cumulative Non cumulative Non cumulative23 Convertible or non-convertible NA Yes24 If convertible, conversion trigger(s) NA On Occurrence of
Non-Viability Event25 If convertible, fully or partially NA Both26 If convertible, conversion rate NA On the day of occurrence
of the Non-Viability Event27 If convertible, mandatory or optional conversion NA Mandatory28 If convertible, specify instrument type convertible into NA Common Equity Tier I
Capital29 If convertible, specify issuer of instrument it converts into NA NA30 Write-down feature NA Yes31 If write-down, write-down trigger(s) NA On Occurrence of
Non-Viability Event32 If write-down, full or partial NA Both33 If write-down, permanent or temporary NA Permanent34 If temporary write-down, description of write-up mechanism NA NA35 Position in subordination hierarchy in liquidation (specify instrument Perpetual Debt All other depositors
type immediately senior to instrument) and creditors of the bank36 Non-compliant transitioned features No No37 If yes, specify non-compliant features NA NA
* The bank is present in India as branches of a foreign bank and as such only has solo reporting (i.e. no difference between solo and group)
ECO
NOM
IC &
PO
LITI
CAL
WEE
KLY

(Incorporated in France with limited liability)INDIAN BRANCHES
Economic & Political Weekly EPW Published on Saturday, june 27, 2020 vol lV nos 26 & 27 163
Table DF-17: Summary comparison of accounting assets vs. leverage ratio exposure measure as of March 31, 2020
Item (Rs. in Million) 1 Total consolidated assets as per published fi nancial statements 213,130.28
2 Adjustment for investments in banking, fi nancial, insurance or commercial entities that are consolidated for accounting purposes but outside the scope of regulatory consolidation –
3 Adjustment for fi duciary assets recognised on the balance sheet pursuant to the operative accounting framework but excluded from the leverage ratio exposure measure –
4 Adjustments for derivative fi nancial instruments (107,492.50)
5 Adjustment for securities fi nancing transactions (i.e. repos and similar secured lending) 149.96
6 Adjustment for off-balance sheet items (i.e. conversion to credit equivalent amounts of off-balance sheet exposures) 293,503.13
7 Other adjustments (33.07)
8 Leverage ratio exposure 399,257.80
Table DF-18: Leverage ratio common disclosure template as of March 31, 2020
Item (Rs. in Million) On-balance sheet exposures 1 On-balance sheet items (excluding derivatives and SFTs, but including collateral) 105,637.78 2 (Asset amounts deducted in determining Basel III Tier 1 capital) 33.07 3 Total on-balance sheet exposures (excluding derivatives and SFTs) (sum of lines 1 and 2) 105,670.85 Derivative exposures 4 Replacement cost associated with all derivatives transactions (i.e. net of eligible cash variation margin) 104,210.68 5 Add-on amounts for PFE associated with all derivatives transactions 146,561.65 6 Gross-up for derivatives collateral provided where deducted from the balance sheet assets
pursuant to the operative accounting framework – 7 (Deductions of receivables assets for cash variation margin provided in derivatives transactions) – 8 (Exempted CCP leg of client-cleared trade exposures) – 9 Adjusted effective notional amount of written credit derivatives – 10 (Adjusted effective notional offsets and add-on deductions for written credit derivatives) – 11 Total derivative exposures (sum of lines 4 to 10) 250,772.33 Securities fi nancing transaction exposures 12 Gross SFT assets (with no recognition of netting), after adjusting for sale accounting transactions 8,570.00 13 (Netted amounts of cash payables and cash receivables of gross SFT assets) – 14 CCR exposure for SFT assets 149.96 15 Agent transaction exposures – 16 Total securities fi nancing transaction exposures (sum of lines 12 to 15) 8,719.96 Other off-balance sheet exposures 17 Off-balance sheet exposure at gross notional amount 67,820.88 18 (Adjustments for conversion to credit equivalent amounts) (25,090.07) 19 Off-balance sheet items (sum of lines 17 and 18) 42,730.81 Capital and total exposures 20 Tier 1 capital 18,971.48 21 Total exposures (sum of lines 3, 11, 16 and 19) 399,257.80 Leverage ratio 22 Basel III leverage ratio 4.75%
ECO
NOM
IC &
PO
LITI
CAL
WEE
KLY

Paytm Payments Bank Limited
Published on Saturday, JUNE 27, 2020 vol lV nos 26 & 27 EPW Economic & Political Weekly164
INDEPENDENT AUDITOR’S REPORT To the Members of Paytm Payments Bank LimitedReport on the Audit of the Financial StatementsOpinion We have audited the fi nancial statements of Paytm Payments Bank Limited (“the Bank”), which comprise the Balance Sheet as at March 31, 2020, the Profi t and Loss Account and Cash Flow Statement for the year then ended, and notes to the fi nancial statements, including a summary of signifi cant accounting policies and other explanatory information. In our opinion and to the best of our information and according to the explanations given to us, the aforesaid fi nancial statements give the information required by the Banking Regulation Act, 1949 as well as the Companies Act, 2013 (“the Act”) in the manner so required for banking companies and give a true and fair view in conformity with the accounting principles generally accepted in India, of the state of affairs of the Bank as at March 31, 2020, and its profi t and its cash fl ows for the year ended on that date.
Basis for Opinion We conducted our audit in accordance with the Standards on Auditing (SAs) specifi ed under section 143(10) of the Act. Our responsibilities under those Standards are further described in the Auditor’s Responsibilities for the Audit of the Financial Statements section of our report. We are independent of the Company in accordance with the Code of Ethics issued by the Institute of Chartered Accountants of India (“ICAI”) together with the ethical requirements that are relevant to our audit of the fi nancial statements under the provisions of the Act and the Rules thereunder, and we have fulfi lled our other ethical responsibilities in accordance with these requirements and the Code of Ethics. We believe that the audit evidence we have obtained is suffi cient and appropriate to provide a basis for our opinion.
Information Other Than the Financial Statements and Auditor’s Report ThereonThe Bank’s Board of Directors is responsible for the other information. The other information comprises the Director’s report but does not include fi nancial statements and our report thereon. The Director’s report is expected to be made available to us after the date of the auditor’s report.Our opinion on the fi nancial statements does not cover the other information and we do not express any form of assurance conclusion thereon.In connection with our audit of the fi nancial statements, our responsibility is to read the other information and, in doing so, consider whether the other information is materially inconsistent with the fi nancial statements or our knowledge obtained in the audit or otherwise appears to be materially misstated. If, based on the work we have performed, we conclude that there is a material misstatement of this other information, we are required to report that fact. We have nothing to report in this regard.
Responsibilities of Management and Those Charged with Governance for Financial Statements The Bank’s Board of Directors is responsible for the matters stated in section 134(5) of the Act with respect to the preparation of these fi nancial statements that give a true and fair view of the fi nancial position, fi nancial performance and cash fl ows of the Bank in accordance with the accounting principles generally accepted in India, including the Accounting Standards specifi ed under section 133 of the Act and provisions of section 29 of the Banking Regulation Act, 1949 and circulars, guidelines and directions issued by the Reserve Bank of India from time to time as applicable to Bank. This responsibility also includes maintenance of adequate accounting records in accordance with the provisions of the Act for safeguarding of the assets of the Company and for preventing and detecting frauds and other irregularities; selection and application of appropriate of accounting policies; making judgments and estimates that are reasonable and prudent; and design, implementation and maintenance of adequate internal fi nancial controls, that were operating effectively for ensuring the accuracy and completeness of the accounting records, relevant to the preparation and presentation of the fi nancial statement that give a true and fair view and are free from material misstatement, whether due to fraud or error. In preparing the fi nancial statements, the Board of Directors is responsible for assessing the Bank’s ability to continue as a going concern, disclosing, as applicable, matters related to going concern and using the going concern basis of accounting unless the Board of Directors either intends to liquidate the Company or to cease operations, or has no realistic alternative but to do so. Those Board of Directors are also responsible for overseeing the Bank’s fi nancial reporting process.
Auditor’s Responsibilities for the Audit of the Financial Statements Our objectives are to obtain reasonable assurance about whether the fi nancial statements as a whole are free from material misstatement, whether due to fraud or error, and to issue an auditor’s report that includes our opinion. Reasonable assurance is a high level of assurance, but is not a guarantee that an audit conducted in accordance with SAs will always detect a material misstatement when it exists. Misstatements can arise from fraud or error and are considered material if, individually or in the aggregate, they could reasonably be expected to infl uence the economic decisions of users taken on the basis of these fi nancial statements. As part of an audit in accordance with SAs, we exercise professional judgment and maintain professional skepticism throughout the audit. We also: Identify and assess the risks of material misstatement of the fi nancial statements, whether due to fraud or error, design and perform audit procedures
responsive to those risks, and obtain audit evidence that is suffi cient and appropriate to provide a basis for our opinion. The risk of not detecting a material misstatement resulting from fraud is higher than for one resulting from error, as fraud may involve collusion, forgery, intentional omissions, misrepresentations, or the override of internal control.
Obtain an understanding of internal control relevant to the audit in order to design audit procedures that are appropriate in the circumstances. Under Section 143(3)(i) of the Act, we are also responsible for expressing our opinion on whether the Bank has internal fi nancial controls with reference to fi nancial statements in place and the operating effectiveness of such controls.
Evaluate the appropriateness of accounting policies used and the reasonableness of accounting estimates and related disclosures made by Management. Conclude on the appropriateness of Management’s use of the going concern basis of accounting and, based on the audit evidence obtained, whether
a material uncertainty exists related to events or conditions that may cast signifi cant doubt on the Bank’s ability to continue as a going concern. If we conclude that a material uncertainty exists, we are required to draw attention in our Auditor’s report to the related disclosures in the fi nancial statements or, if such disclosures are inadequate, to modify our opinion. Our conclusions are based on the audit evidence obtained up to the date of our auditor’s report. However, future events or conditions may cause the Bank to cease to continue as a going concern.
Evaluate the overall presentation, structure and content of the fi nancial statements, including the disclosures, and whether the fi nancial statements represent the underlying transactions and events in a manner that achieves fair presentation.
We communicate with those charged with governance regarding, among other matters, the planned scope and timing of the audit and signifi cant audit fi ndings, including any signifi cant defi ciencies in internal control that we identify during our audit.We also provide those charged with governance with a statement that we have complied with relevant ethical requirements regarding independence, and to communicate with them all relationships and other matters that may reasonably be thought to bear on our independence, and where applicable, related safeguards.
ECO
NOM
IC &
PO
LITI
CAL
WEE
KLY

Paytm Payments Bank Limited
Economic & Political Weekly EPW Published on Saturday, JUNE 27, 2020 vol lV nos 26 & 27 165
Report on Other Legal and Regulatory Requirements 1. The Balance sheet and Profi t and Loss Account have been drawn up in accordance with the provisions of Section 29 of the Banking Regulation
Act, 1949 read with Section 133 of the Companies Act, 2013 read with Rule 7 of the Companies (Accounts) Rules, 2014. 2. As required by sub-section (3) of section 30 of Banking Regulation Act, 1949, we report that: a. We have sought and obtained all the information and explanations which to the best of our knowledge and belief were necessary for the
purposes of our audit and found them to be satisfactory; b. The transactions of the Bank, which have come to our notice during the course of our audit, have been within the powers of Bank; c. Since the key operations of the Bank are automated with the key applications integrated to the core banking system, the audit is carried out centrally
as all the necessary records and data required for the purposes of our audit are available therein. 3. As required by Section 143(3) of the Act, we report that: a. We have sought and obtained all the information and explanations which to the best of our knowledge and belief were necessary for the purposes
of our audit; b. In our opinion, proper books of account as required by law have been kept by the Bank so far as it appears from our examination of those books; c. The Balance Sheet, the Profi t and Loss Account and the Cash Flow Statement dealt with by this Report are in agreement with the books of
account; d. In our opinion, the aforesaid fi nancial statements comply with the Accounting Standards specifi ed under Section 133 of the Act, read with
Rule 7 of the Companies (Accounts) Rules, 2014 to the extent they are not inconsistent with the accounting policies prescribed by the Reserve Bank of India;
e. On the basis of the written representations received from the directors as on March 31, 2020 taken on record by the Board of Directors, none of the directors is disqualifi ed as on 31st March, 2020 from being appointed as a director in terms of Section 164 (2) of the Act;
f. With respect to the adequacy of the internal fi nancial controls with reference to fi nancial statements of the Company and the operating effectiveness of such controls, refer to our separate Report in “Annexure A”;
g. With respect to the other matters to be included in the Auditor’s Report in accordance with the requirements of section 197(16) of the Act, as amended;
The Bank is a Banking Company as defi ned under Banking Regulation Act, 1949. Accordingly, the requirements prescribed under section 197 of the Companies Act, 2013 do not apply; and
h. With respect to the other matters to be included in the Auditor’s Report in accordance with Rule 11 of the Companies (Audit and Auditors) Rules, 2014, in our opinion and to the best of our information and according to the explanations given to us:
i. The Bank has disclosed the impact of pending litigations on its fi nancial position in its fi nancial statements – Refer Note 32 to the fi nancial statements;
ii. The Bank did not have any long-term contracts including derivative contracts for which there were any material foreseeable losses. Refer Note 30 to the fi nancial statements;
iii. There were no amounts which were required to be transferred to the Investor Education and Protection Fund by the Bank.
For MSKA & AssociatesChartered AccountantsICAI Firm Registration No. 105047W
Sd/-Swapnil KalePartnerMembership No. 117812UDIN: 20117812AAAAGI9530
MumbaiMay 20 , 2020
ECO
NOM
IC &
PO
LITI
CAL
WEE
KLY

Paytm Payments Bank Limited
Published on Saturday, JUNE 27, 2020 vol lV nos 26 & 27 EPW Economic & Political Weekly166
ANNEXURE A TO THE INDEPENDENT AUDITORS’ REPORT OF EVEN DATE ON THE FINANCIAL STATEMENTS OF PAYTM PAYMENTS BANK LIMITED
[Referred to in paragraph (2f) under ‘Report on Other Legal and Regulatory Requirements’ in the Independent Auditors’ Report] Report on the Internal Financial Controls under Clause (i) of Sub-section 3 of Section 143 of the Companies Act, 2013 (“the Act”)We have audited the internal fi nancial controls with reference to fi nancial statements of Paytm Payments Bank Limited (“the Bank”) as of March 31, 2020 in conjunction with our audit of the fi nancial statements of the Bank for the year ended on that date.Management’s Responsibility for Internal Financial ControlsThe Bank’s Management is responsible for establishing and maintaining internal fi nancial controls based on the internal control with reference to fi nancial statements criteria established by the Bank considering the essential components of internal control stated in the Guidance Note on Audit of Internal Financial Controls Over Financial Reporting issued by the Institute of Chartered Accountants of India (ICAI) (the “Guidance Note”). These responsibilities include the design, implementation and maintenance of internal fi nancial controls that were operating effectively for ensuring the orderly and effi cient conduct of its business, including adherence to Bank’s policies, the safeguarding of its assets, the prevention and detection of frauds and errors, the accuracy and completeness of the accounting records, and the timely preparation of reliable fi nancial information, as required under the Act.Auditors’ ResponsibilityOur responsibility is to express an opinion on the Bank’s internal fi nancial controls with reference to fi nancial statements based on our audit. We conducted our audit in accordance with the Guidance Note and the Standards on Auditing, issued by ICAI and deemed to be prescribed under section 143(10) of the Act, to the extent applicable to an audit of internal fi nancial controls. Those Standards and the Guidance Note require that we comply with ethical requirements and plan and perform the audit to obtain reasonable assurance about whether internal fi nancial controls with reference to fi nancial statements was established and maintained and if such controls operated effectively in all material respects.Our audit involves performing procedures to obtain audit evidence about the adequacy of the internal fi nancial controls with reference to fi nancial statements and their operating effectiveness. Our audit of internal fi nancial controls with reference to fi nancial statements included obtaining an understanding of internal fi nancial controls with reference to fi nancial statements, assessing the risk that a material weakness exists, and testing and evaluating the design and operating effectiveness of internal control based on the assessed risk. The procedures selected depend on the auditor’s judgement, including the assessment of the risks of material misstatement of the fi nancial statements, whether due to fraud or error.We believe that the audit evidence we have obtained is suffi cient and appropriate to provide a basis for our audit opinion on the Bank’s internal fi nancial controls with reference to fi nancial statements.Meaning of Internal Financial Controls With Reference to Financial StatementsA Bank’s internal fi nancial control with reference to fi nancial statements is a process designed to provide reasonable assurance regarding the reliability of fi nancial reporting and the preparation of fi nancial statements for external purposes in accordance with generally accepted accounting principles. A Bank’s internal fi nancial control with reference to fi nancial statements includes those policies and procedures that (1) pertain to the maintenance of records that, in reasonable detail, accurately and fairly refl ect the transactions and dispositions of the assets of the Bank; (2) provide reasonable assurance that transactions are recorded as necessary to permit preparation of fi nancial statements in accordance with generally accepted accounting principles, and that receipts and expenditures of the Bank are being made only in accordance with authorizations of management and directors of the Bank; and (3) provide reasonable assurance regarding prevention or timely detection of unauthorized acquisition, use, or disposition of the Bank’s assets that could have a material effect on the fi nancial statements.Inherent Limitations of Internal Financial Controls With Reference to Financial StatementsBecause of the inherent limitations of internal fi nancial controls with reference to fi nancial statements, including the possibility of collusion or improper management override of controls, material misstatements due to error or fraud may occur and not be detected. Also, projections of any evaluation of the internal fi nancial controls with reference to fi nancial statements to future periods are subject to the risk that the internal fi nancial control with reference to fi nancial statements may become inadequate because of changes in conditions, or that the degree of compliance with the policies or procedures may deteriorate.OpinionIn our opinion, the Bank has, in all material respects, adequate internal fi nancial controls with reference to fi nancial statements and such internal fi nancial controls with reference to fi nancial statements were operating effectively as at March 31, 2020, based on the internal control with reference to fi nancial statements criteria established by the Bank considering the essential components of internal control stated in the Guidance Note.
For MSKA & AssociatesChartered AccountantsICAI Firm Registration No. 105047W
Sd/-Swapnil KalePartnerMembership No. 117812
Place: MumbaiDate: May 20 , 2020
ECO
NOM
IC &
PO
LITI
CAL
WEE
KLY

Paytm Payments Bank Limited
Economic & Political Weekly EPW Published on Saturday, JUNE 27, 2020 vol lV nos 26 & 27 167
BALANCE SHEET AS AT MARCH 31, 2020
(Rs. in ‘000) As at As at Schedule March 31, March 31, 2020 2019
CAPITAL AND LIABILITIES
Capital 1 4,000,000 4,000,000 Reserves & surplus 2 (23,982) (322,144)Deposits 3 28,697,032 21,425,146 Borrowings 4 – – Other liabilities & provisions 5 12,229,617 11,415,652
Total 44,902,667 36,518,654
ASSETS
Cash and balances with Reserve Bank of India 6 5,972,768 4,509,176 Balances with banks and money at call and short notice 7 9,224,198 4,492,196 Investments 8 25,354,433 20,922,309 Advances 9 – – Fixed assets 10 608,123 812,751 Other assets 11 3,743,145 5,782,222
Total 44,902,667 36,518,654
Contingent Liabilities 12 219,046 53,811 Bills for collection
Summary of signifi cant accounting policies 19.1
PROFIT AND LOSS ACCOUNT FOR THE YEAR ENDED MARCH 31, 2020
(Rs. in ‘000, except per share data)
Schedule For the year For the year ended ended March 31, March 31, 2020 2019
I. INCOME Interest earned 13 1,922,440 1,424,754 Other Income 14 20,140,310 15,248,728 Total 22,062,750 16,673,482
II. EXPENDITURE Interest expended 15 272,438 145,839 Operating expenses 16 21,426,696 16,162,472 Provisions and contingencies 17 65,454 172,977 Total 21,764,588 16,481,288
III. PROFIT/(LOSS) Net Profi t for the year 298,162 192,194 Loss brought forward (370,193) (514,338)
Total (72,031) (322,144)
IV. APPROPRIATIONS Transfer to statutory reserves 74,540 48,049 Transfer to other reserves – – Transfer to government/ proposed dividend – – Balance carried over to balance sheet (146,571) (370,193)
Total (72,031) (322,144)
V. EARNINGS PER EQUITY SHARE (Face value Rs. 10 per share) Basic 0.75 0.48 Diluted 0.75 0.48
Summary of signifi cant accounting policies 19.1
The schedules referred to above form an integral part of the fi nancial statementThis is the Balance Sheet referred to in our report of even date
The schedules referred to above form an integral part of the fi nancial statementThis is the Profi t and Loss Account referred to in our report of even date
For MSKA & Associates For and on behalf of the Board of Directors ofICAI Firm Regn. No. 105047W Paytm Payments Bank LimitedChartered Accountants
Sd/- Sd/- Sd/-Swapnil Kale Vijay Shekhar Sharma Satish Kumar Gupta Partner (Part time Chairman & Director) (Managing Director & CEO) Membership No. 117812 (DIN : 00466521) (DIN : 08190146) Place: Mumbai Place: Delhi Place: Mumbai
Sd/- Sd/- Vaibhav Goel Sanjay Saxena (Director) (Chief Financial Offi cer) (DIN : 06658218) Place: Delhi Place: Gurugram Sd/- Sachin Jain (Company Secretary)Date: May 20, 2020 Place: Noida
ECO
NOM
IC &
PO
LITI
CAL
WEE
KLY

Paytm Payments Bank Limited
Published on Saturday, JUNE 27, 2020 vol lV nos 26 & 27 EPW Economic & Political Weekly168
CASH FLOW STATEMENT FOR THE YEAR ENDED MARCH 31, 2020 (Rs. in ‘000)For the Year
ended March 31, 2020
For the year ended
March 31, 2019
A. Cash fl ow from operating activitiesProfi t before tax 290,407 324,140 Adjustments for:
Add: Depreciation on fi xed assets 746,259 762,954 Add: Loss/(Profi t) on sale/discard of fi xed assets (net) (145) 6,361 Add: Provision for dimunition in the value of investment 15,235 –
Operating profi t before working capital changes 1,051,756 1,093,455
Movements in working capital:Increase/(Decrease) in deposits 7,271,887 6,975,793 (Increase)/Decrease in other assets 2,527,977 (4,281,659)(Increase)/Decrease in investments (4,447,359) (7,652,341)Increase/(Decrease) in other liabilities and provisions 1,207,510 6,227,331
Cash generated from operations 7,611,771 2,362,579 Direct taxes paid (net of refunds) (464,966) (334,006)Net cash from operating activities (A) 7,146,805 2,028,573
B. Cash fl ow from investing activitiesPurchase of fi xed assets (1,000,420) (383,761)Proceeds from sale of assets 49,209 –
Net cash used in investing activities (B) (951,211) (383,761)
C. Cash fl ow from fi nancing activitiesNet cash from fi nancing activities (C) – – Net increase/(decrease) in cash and cash equivalents (A+B+C) 6,195,594 1,644,812 Cash and cash equivalents at the beginning of the year 9,001,372 7,356,560 Cash and cash equivalents at the end of the year 15,196,966 9,001,372
Notes:1. The above Cash Flow Statement has been prepared under the indirect method as set out in Accounting Standard 3 on Cash Flow Statements2. Figures in bracket indicate cash outfl ow.3. Cash and cash equivalents include the following
Particulars As atMarch 31, 2020
As atMarch 31, 2019
Cash and Balances with Reserve Bank of India (Schedule 6) 5,972,768 4,509,176 Balances with Banks and Money at Call and Short Notice (Schedule 7) 9,224,198 4,492,196
Total 15,196,966 9,001,372
This is the Cash Flow Statement referred to in our report of even date
For MSKA & Associates For and on behalf of the Board of Directors ofICAI Firm Regn. No. 105047W Paytm Payments Bank LimitedChartered Accountants
Sd/- Sd/- Sd/-Swapnil Kale Vijay Shekhar Sharma Satish Kumar Gupta Partner (Part time Chairman & Director) (Managing Director & CEO) Membership No. 117812 (DIN : 00466521) (DIN : 08190146) Place: Mumbai Place: Delhi Place: Mumbai
Sd/- Sd/- Vaibhav Goel Sanjay Saxena (Director) (Chief Financial Offi cer) (DIN : 06658218) Place: Delhi Place: Gurugram Sd/- Sachin Jain (Company Secretary)Date: May 20, 2020 Place: Noida
ECO
NOM
IC &
PO
LITI
CAL
WEE
KLY
Paytm Payments Bank Limited
Economic & Political Weekly EPW Published on Saturday, JUNE 27, 2020 vol lV nos 26 & 27 169
Schedule 5 - Other liabilities and provisions I. Bills payable – – II. Inter-offi ce adjustments (net) – – III. Interests accrued – – IV. Others (including provisions) 12,229,617 11,415,652
Total 12,229,617 11,415,652
Schedule 6 - Cash and balances with Reserve Bank of IndiaI. Cash in hand (including foreign currency notes) 16,353 4,786 II. Balance with Reserve Bank of India (i) in current account 5,956,415 4,504,390 (ii) in other accounts – –
Total 5,972,768 4,509,176
Schedule 7 - Balances with banks and money at call & short notice I. In India (i) Balances with banks: (a) in current accounts 1,429,426 1,732,296 (b) in other deposit accounts 7,794,772 2,759,900 Sub total (A) 9,224,198 4,492,196
(ii) Money at call and short notices (a) with banks – – (b) with other institutions – –
Sub total (B) – –
Total (A+B) (I) 9,224,198 4,492,196
II. Outside India (a) in current accounts – (b) in other deposit accounts – – (c) Money at call and short notices – – Total (II) – –
Total (I+II) 9,224,198 4,492,196
Schedule 8 - InvestmentsI. Investments in India (net of provisions) in : (i) Government securities 25,369,668 20,922,309 (ii) Other approved securities – – (iii) Shares – – (iv) Debentures and bonds – – (v) Subsidiaries and/or joint ventures – – (vi) Others – – Sub total (A) 25,369,668 20,922,309
II. Investments outside India (net of provisions) in : (i) Government securities (including local authorities) – – (ii) Subsidiaries and/or joint ventures abroad – – (iii) Other investments – – Sub total (B) – –
Total (A+B) 25,369,668 20,922,309 Provision for Depreciation on Performing Investments 15,235 – Provision for Depreciation on Non-Performing Investments – – Total 25,354,433 20,922,309
Schedule 1 - CapitalAuthorised Capital 400,000,000 (previous year: 400,000,000) equity share of Rs. 10 each 4,000,000 4,000,000
Issued, subscribed and paid up - capital400,000,000 (previous year : 400,000,000) equity shares of Rs. 10 each 4,000,000 4,000,000Total 4,000,000 4,000,000
Schedule 2 - Reserves and SurplusI. Statutory Reserves Opening balance 48,049 – Additions during the year 74,540 48,049 Deductions during the year – – Sub total (A) 122,589 48,049II. Capital Reserves Opening balance – – Additions during the year – – Deductions during the year – – Sub total (B) – –III. Share Premium Opening balance – – Additions during the year – – Deductions during the year – – Sub total (C) – –IV. Revenue and Other Reserves Opening balance – – Additions during the year – – Deductions during the year – – Sub total (D) – –
V. Balance in statement of Profi t & Loss (146,571) (370,193) Sub total (E) (146,571) (370,193)
Total (A+B+C+D+E) (23,982) (322,144)
Schedule 3 - Deposits A. I. Demand Deposits (i) From banks – – (ii) From others* 19,011,312 16,944,172 19,011,312 16,944,172 II. Savings bank deposits 9,685,720 4,480,974 III. Term Deposits (i) From banks – – (ii) From others – – Sub total (I, II, III) 28,697,032 21,425,146B. (i) Deposits of branches in India 28,697,032 21,425,146 (ii) Deposits of branches outside India – – 28,697,032 21,425,146
Total 28,697,032 21,425,146
* includes balances in semi-closed wallets
Schedule 4 - BorrowingsI. Borrowing in India (i) Reserve Bank of India – – (ii) Other Banks – – (iii) Other institutions and agencies – – Sub total (A) – –II. Borrowings outside India – –
Sub total (B) –
Total (A+B) – –
Schedules forming part of the fi nancial statements for the year ended March 31, 2020 (Rs. in ‘000) As at As at As at As at March 31, March 31, March 31, March 31, 2020 2019 2020 2019
ECO
NOM
IC &
PO
LITI
CAL
WEE
KLY

Paytm Payments Bank Limited
Published on Saturday, JUNE 27, 2020 vol lV nos 26 & 27 EPW Economic & Political Weekly170
III. Intangible assets Gross block At cost on 31 March of the preceding year 1,191,873 1,079,143 Additions during the year 348,667 112,730 Deductions during the year – – Total (A) 1,540,540 1,191,873 Amortisation As at 31 March of the preceding year 883,041 250,887 Charge for the year 512,632 632,154 On deductions during the year – – Total (B) 1,395,673 883,041
Net block (A-B) (III) 144,867 308,832
IV. Assets on lease Gross block At cost on 31 March of the preceding year – – Additions during the year – – Deductions during the year – – Total (A) – – Depreciation As at 31 March of the preceding year – – Charge for the year – – On deductions during the year – – Total (B) – –
Net block (A-B) (IV) – –
V. Capital-work-in progress 6,444 20,848 Total (V) 6,444 20,848
Total (I+II+III+IV+V) 608,123 812,751
Schedule 11 - Other assetsI. Inter-offi ce adjustment (net) – – II. Interest accrued 417,464 114,538 III. Tax paid in advance/ tax deducted at source 826,411 664,821 IV. Stationery and stamps – – V. Non-banking assets acquired in satisfaction of claims – – VI. Others 2,499,270 5,002,863 Total 3,743,145 5,782,222
Schedule 12 - Contingent liabilitiesI. Claims against the bank not acknowledged as debts – – II. Liability for partly paid investments – – III. Liability on account of outstanding forward exchange contracts – – IV. Guarantees given on behalf of constituents (a) In India – – (b) Outside India – – V. Acceptances, endorsements and other obligations – – VI. Other items for which the bank is contingently liable 219,046 53,811
Total 219,046 53,811
Schedule 9 - AdvancesA. (i) Bills Purchased and Discounted (ii) Cash credits, overdrafts and loans repayable on demand – – (iii) Term loans – – Sub total (A) – –B. (i) Secured by tangible assets (including advances against book debt) (ii) Covered by Bank/ Government guarantees – – (iii) Unsecured – – Sub total (B) – –C. (I) Advances in India (i) Priority sectors (including export fi nance) – – (ii) Public sector – – (iii) Banks – – (iv) Others – – Sub total (C) – –D. (I) Advances in India – – (i) Due from banks – – (ii) Due from others – – (iii) Bills purchased and discounted – – (iv) Syndicate loans – – (v) Others – – Sub total (D) – –
Total (A+B+C+D) – –
Schedule 10 - Fixed AssetsI. Premises (including land) Gross block At cost on 31 March of the preceding year – – Additions during the year – – Deductions during the year – – Total (A) – – Depreciation As at 31 March of the preceding year – – Charge for the year – – On deductions during the year – – Total (B) – –
Net block (A-B) (I) – –II. Other fi xed assets (including furniture and fi xtures) Gross block At cost on 31 March of the preceding year 688,739 245,547 Additions during the year 272,611 443,230 Deductions during the year (83,253) (38) Total (A) 878,097 688,739 Depreciation As at 31 March of the preceding year 205,668 74,884 Charge for the year 233,627 130,801 On deductions during the year (18,010) (17) Total (B) 421,285 205,668
Net block (A-B) (II) 456,812 483,071
Schedules forming part of the fi nancial statements for the year ended March 31, 2019 (Rs. in ‘000)
As at As at As at As at March 31, March 31, March 31, March 31, 2020 2019 2020 2019
ECO
NOM
IC &
PO
LITI
CAL
WEE
KLY

Paytm Payments Bank Limited
Economic & Political Weekly EPW Published on Saturday, JUNE 27, 2020 vol lV nos 26 & 27 171
18. Corporate informationPaytm Payments Bank Limited (“Bank”) was incorporated on August 22, 2016. The Bank received Payments Bank license as required under Section 22(1) of the Banking Regulation Act, 1949 on January 3, 2017. The Bank commenced its operations from May 23, 2017. The Bank is primarily engaged in the business of accepting demand deposits in the form of current and saving bank deposits, to provide payment and remittance services through Automated Teller Machines (ATMs), Business Correspondent (BCs), semi-closed wallet, Mobile Banking and such other manner available. The Bank is also engaged in acceptance of remittances and payments from multiple banks under payment mechanism such as NEFT/RTGS/IMPS or any other permitted payment mechanism under the law.
19. Basis of preparationThe fi nancial statements have been prepared and presented under the historical cost convention and accrual basis of accounting, except where otherwise stated, and are in accordance with the generally accepted accounting principles (‘GAAP’) in India and statutory requirements prescribed under the Banking Regulation Act, 1949, circulars and guidelines issued by the Reserve Bank of India (‘RBI’), Accounting Standards (‘AS’) prescribed under section 133 of the Companies Act, 2013 read together with Paragraph 7 of the Companies (Accounts) Rules 2014 and the relevant provisions of the Companies Act 2013 to the extent applicable and current practices prevailing within the banking industry in India.
Schedules forming part of the fi nancial statements for the year ended March 31, 2020
19.1 Summary of signifi cant accounting polices(a) Use of estimates
The preparation of fi nancial statements in conformity with Indian GAAP requires the management to make judgments, estimates and assumptions that affect the reported amounts of revenues, expenses, assets and liabilities and the disclosure of contingent liabilities, at the end of the reporting period. Although these estimates are based on the management’s best knowledge of current events and actions, uncertainty about these assumptions and estimates could result in the outcomes requiring a material adjustment to the carrying amounts of assets or liabilities in future years.
(b) Fixed assetsFixed assets are stated at cost less accumulated depreciation and impairment losses, if any. Cost comprises the purchase price and any attributable cost of bringing the asset to its working condition for its intended use.
(c) DepreciationDepreciation is provided on straight line basis and charged to profi t and loss account as per the useful life under schedule II to the Companies Act, 2013 (Refer Schedule 34) Further in case of “Computers” the estimated useful life is as per the circular no. DBOD.No.BP.BC.37/21.04.018/2000, dated October 20, 2000 issued by the RBI. The estimated useful life is mentioned below:
Schedule 16 - Operating expensesI. Payments to and provisions for employees 1,677,299 773,691 II. Rent, taxes and lighting 55,393 16,539 III. Printing and stationery 2,237 1,133 IV. Advertisement and publicity 1,206,721 338,028 V. Depreciation on Bank’s property (refer schedule 34) 746,259 762,954 VI. Director’s fees, allowances and expenses 6,600 4,785 VII. Auditors’ fees and expenses (including branch auditors) 5,175 3,539 VIII. Law charges – – IX. Postages, Telegrams, Telephones, etc. 690 207 X. Repairs and maintenance 348,641 246,295 XI. Insurance 29,747 10,238 XII. Other expenditure * 17,347,934 14,005,063
Total 21,426,696 16,162,472
* includes payment gateway charges
Schedule 17 - Provisions and contingenciesProvision for income tax 171,431 131,945 Deferred tax expenses (refer schedule 42) (179,186) – Provisions for depreciation on investment 15,235 – Provision for operational losses (net) 57,974 41,032
Total 65,454 172,977
Schedule 13 - Interest earnedI. Interest/discount on advance/bills – – II. Income on investments 1,507,886 1,246,767 III. Interest on balances with Reserve Bank of India and other inter-bank funds 8,362 – IV. Others 406,192 177,987
Total 1,922,440 1,424,754
Schedule 14 - Other income I. Commission, exchange and brokerage * 20,143,682 15,254,615 II. Profit/(loss) on sale of investments (net) (63) 2,240 III. Profit/(loss) on revaluation of investments (net) – – IV. Profit/(loss) on sale of land, buildings and other assets (net) 145 (6,361)V. Profit/(loss) on exchange transactions (net) (3,551) (1,773)VI. Income earned by way of dividends etc. – – VII. Miscellaneous Income 97 7
Total 20,140,310 15,248,728
* includes income earned from wallet utilisation
Schedule 15 - Interest expendedI. Interest on deposits 249,950 112,844 II. Interest on Reserve Bank of India/ Inter-bank borrowings – – III. Others 22,488 32,995
Total 272,438 145,839
Schedules forming part of the fi nancial statements for the year ended March 31, 2020 (Rs. in ‘000)
For the year For the year For the year For the year ended ended ended ended March 31, March 31, March 31, March 31, 2020 2019 2020 2019
ECO
NOM
IC &
PO
LITI
CAL
WEE
KLY

Paytm Payments Bank Limited
Published on Saturday, JUNE 27, 2020 vol lV nos 26 & 27 EPW Economic & Political Weekly172
Assets Estimated useful life
Computers (including servers and networking equipments) 3 years
Offi ce equipment 5 yearsFurniture and fi ttings 10 yearsVehicles 8 years
Leasehold improvements are depreciated over lower of the period of the lease and useful life.
(d) Intangible assetsSeparately acquired intangible assets, such as software are measured initially at cost. Following initial recognition, intangible assets are carried at cost less accumulated amortization and accumulated impairment losses, if any. Internally generated intangible assets, excluding capitalized development costs, are not capitalized and expenditure is refl ected in the profi t and loss account in the year in which the expenditure is incurred. Intangible assets with fi nite useful lives are carried at cost and are amortised on a written down value basis over their estimated useful lives and charged to profi t and loss account.Software and licenses acquired are amortized over a period of 3 years on straight line basis. Goodwill is amortized on a straight line basis over the period of 2 years.The amortization period and the amortization method are reviewed at least at each fi nancial year end. Changes in the expected useful life or the expected pattern of consumption of future economic benefi ts embodied in the asset are considered to modify the amortisation period or method, as appropriate, and are treated as changes in accounting estimates. The amortisation expense on intangible assets is recognised in profi t and loss account unless such expenditure forms part of carrying value of another asset.Gains or losses arising from de-recognition of an intangible asset are measured as the difference between the net disposal proceeds and the carrying amount of the asset and are recognized in the statement of profi t and loss when the asset is derecognized.
(e) Impairment of assetsThe carrying amounts of assets are reviewed at each balance sheet date if there is any indication of impairment based on internal/external factors. An impairment loss is recognised wherever the carrying amount of an asset exceeds its recoverable amount. The recoverable amount is the greater of the assets net selling price and value in use. In assessing value in use, the estimated future cash flows are discounted to their present value using a pre-tax discount rate that reflects current market assessments of the time value of money and risks specifi c to the asset.After impairment, tangible assets/intangibles are depreciated/amortised on the revised carrying amount over its remaining useful life.
(f) LeasesThe determination of whether an arrangement is (or contains) a lease is based on the substance of the arrangement at the inception of the lease. The arrangement is, or contains, a lease if fulfi lment of the arrangement is dependent on the use of a specifi c asset or assets and the arrangement conveys a right to use the asset or assets, even if that right is not explicitly specifi ed in an arrangement
Bank as a lessee A lease that transfers substantially all the risks and rewards incidental to ownership to the Bank is classifi ed as a fi nance lease. All other leases are classifi ed as operating leases.
(g) Investments Classifi cation:
In accordance with the RBI guidelines on Investment classifi cation and valuation, all investments, are categorized as “Held for trading” (‘HFT’), “Available for sale” (‘AFS’) or “Held to maturity” (‘HTM’) at the time of its purchase. Investments are further classifi ed under
six groups (a) government securities, (b) other approved securities, (c) shares, (d) bonds and debentures, (e) subsidiaries and joint ventures, and (f) others.
Basis of Classifi cation: Securities that are held principally for resale within 90 days from the date of purchase are classifi ed under the HFT category. Investments that the Bank intends to hold till maturity are classifi ed under the HTM category, or as per RBI guidelines. Securities which are not classifi ed in the above categories are classifi ed under the AFS category.
Acquisition cost: In determining acquisition cost of an investment, brokerage and commission paid at the time of acquisition are charged to Profi t and Loss Account. Further, cost of investments is determined based on weighted average cost method.
Valuation:Treasury Bills being discounted instruments are valued at carrying cost.Government Securities are valued at cost at which they have been issued by the RBI. The broken period interest paid to seller as part cost is not capitalised and the same has been charged to profi t & loss account in respect of investment in Government and other approved securities.
h) Revenue recognitionRevenue is recognised to that extent that is probable that the economic benefi ts will fl ow to the Bank and the revenue can be reliably measured. (i) Interest IncomeInterest income is recognised on a time proportion basis taking into account the amount outstanding and the rate applicable. (ii) Commission Income:Commission income is recognised on accrual basis and to the extent that it is probable that the economic benefi ts will fl ow to the Bank and the revenue can be reliably measured, regardless of when the payment is being made.
(iii) Debit Card:The annual/renewal fee for debit cards are amortised on a straight line basis over 1 year.
(iv) Preferred partner fees:Income received from Business Correspondent (BC’s) as preferred partner fees will be recognised over a period of 2 years.
(i) Foreign currency transactions
(i) Initial recognitionForeign currency transactions are recorded in the reporting currency, by applying to the foreign currency amount the exchange rate between the reporting currency and the foreign currency at the date of the transaction.
(ii) ConversionForeign currency monetary items are reported using the closing rate. Non-monetary items which are carried in terms of historical cost denominated in a foreign currency are reported using the exchange rate at the date of the transaction.
(iii) Exchange differencesExchange differences arising on the settlement of monetary items or on reporting monetary items of the Bank at rates different from those at which they were initially recorded during the year, or reported in previous fi nancial statements, are recognised as income or as expenses in the year in which they arise.
(j) Retirement and other employee benefi tsProvident Fund and Employee State Insurance Scheme (Defi ned Contribution Scheme) - Retirement benefi ts mainly in the form of provident fund and employee state Insurance schemes are a defi ned contribution schemes and the contributions are charged to the profi t and loss account of the year when the contributions to the respective
ECO
NOM
IC &
PO
LITI
CAL
WEE
KLY

Paytm Payments Bank Limited
Economic & Political Weekly EPW Published on Saturday, JUNE 27, 2020 vol lV nos 26 & 27 173
funds are due. There are no other obligations of the Bank other than the contribution to the Fund.Gratuity (Defi ned Benefi t Scheme) - Gratuity liability is defi ned benefi t obligations and is provided on the basis of an actuarial valuation based on projected unit credit method made at end of each fi nancial year.Compensated Absences - Short term compensated absences are provided for based on estimates. Long term compensated absences are provided for based on actuarial valuation. The actuarial valuation is done as per projected unit credit method.Actuarial gains/losses are immediately taken to statement of profi t and loss and are not deferred.
(k) Income taxes Tax expense comprises current and deferred tax. Current income tax is measured at the amount expected to be paid to the tax authorities in accordance with the Income-tax Act, 1961 enacted in India. Deferred income taxes refl ects the impact of current year timing differences between taxable income and accounting income for the year and reversal of timing differences of earlier years.Deferred tax is measured based on the tax rates and the tax laws enacted or substantively enacted at the balance sheet date. Deferred tax assets and deferred tax liabilities are offset, if a legally enforceable right exists to set off current tax assets against current tax liabilities and the deferred tax assets and deferred tax liabilities relate to the taxes on income levied by same governing taxation laws. Deferred tax assets are recognised only to the extent that there is reasonable certainty that suffi cient future taxable income will be available against which such deferred tax assets can be realized. In situations where the Bank has unabsorbed depreciation or carry forward tax losses, all deferred tax assets are recognised only if there is virtual certainty supported by convincing evidence that they can be realized against future taxable profi ts. At each balance sheet date the Bank re-assesses unrecognized deferred tax assets. It recognizes unrecognized deferred tax assets to the extent that it has become reasonably certain or virtually certain, as the case may be that suffi cient future taxable income will be available against which such deferred tax assets can be realized.The carrying amount of deferred tax assets are reviewed at each balance sheet date. The Bank writes-down the carrying amount of a deferred tax asset to the extent that it is no longer reasonably certain or virtually certain, as the case may be, that suffi cient future taxable income will be available against which deferred tax asset can be realized. Any such write-down is reversed to the extent that it becomes reasonably certain or virtually certain, as the case may be, that suffi cient future taxable income will be available.Minimum Alternate Tax (MAT) Credit is recognized as an asset only when and to the extent there is convincing evidence that the company will pay normal income tax during specifi ed period. The year in which the MAT credit becomes eligible, it is to be recognised as an asset. In accordance with recommendation contained in the guidance note issued by ICAI, said asset is created by way of credit/reversal of provisions of Profi t and Loss A/c and included as MAT Credit Entitlements in other assets. The company reviews the same at each balance sheet date and writes down the carrying amount of MAT Credit Entitlement to the extent there is no longer convincing evidence to the effect that company will pay normal Income Tax during the specifi ed period.
(l) Earnings per share Basic earnings per share are calculated by dividing the net profi t or loss for the year attributable to equity shareholders by the weighted average number of equity shares outstanding during the year. The weighted average number of equity shares outstanding during the period and for all periods presented is adjusted for events, such as bonus shares, other than the conversion of potential equity shares that have changed the number of equity shares outstanding, without a corresponding change in resources. For the purpose of calculating
diluted earnings per share, the net profi t or loss for the period attributable to equity shareholders and the weighted average number of shares outstanding during the period is adjusted for the effects of all dilutive potential equity shares.
(m) Cash and cash equivalentsCash and cash equivalents include cash in hand, balances with RBI, balances with other banks and money at call and short notice.
(n) Accounting for provisions, contingent liabilities and contingent assetsThe Bank estimates the probability of any loss that might be incurred on outcome of contingencies on the basis of information available up to the date on which the fi nancial statements are prepared. A provision is recognised when an enterprise has a present obligation as a result of a past event and it is probable that an outfl ow of resources will be required to settle the obligation, in respect of which a reliable estimate can be made. Provisions are not discounted to their present value and are determined based on management estimates of amounts required to settle the obligation at the Balance Sheet date, supplemented by experience of similar transactions. These are reviewed at each Balance Sheet date and adjusted to refl ect current management estimate. In case of remote possibility neither provision nor disclosure is made in the fi nancial statements. The Bank does not recognise or disclose contingent assets. However, contingent assets are assessed continually and if it is virtually certain that an infl ow of economic benefi ts will arise, the asset and related income are recognized in the year in which the change occurs.
20. Capital adequacyThe following table shows computation of capital adequacy ratio (Bank’s capital to risk weighted assets ratio) as per Basel II framework of RBI.
(Rs. in ‘000)
Particulars As atMarch 31,
2020
As atMarch 31,
2019
Common Equity Tier 1 CRAR (%) 62.41 45.41
Tier-1 CRAR (%) 62.41 45.41
Tier-2 CRAR (%) – –
Total CRAR (%) 62.41 45.41
Amount of equity capital raised Nil Nil
Amount of Additional Tier-1 capital raised; of which
Perpetual Non-Cumulative Preference Shares
Nil Nil
Perpetual Debt Instruments Nil Nil
Amount of Tier-2 capital raised; of which
Debt capital instrument Nil Nil
Preference Share Capital Instruments[Perpetual Cumulative Preference Shares (PCPS)/Redeem-able Non-Cumulative Preference Shares (RNCPS)/Redeemable Cumu-lative Preference Shares (RCPS)]
Nil Nil
The Bank has followed Basel II standardized approach for credit risk in accordance with the Operating Guidelines issued by the Reserved Bank of India. Further, the RBI vide its circular No. DBR.NBD.No. 4503/16.13.218/2017-18 dated November 8, 2017 has provided an exemption to all Payments banks. whereby no separate capital charge is prescribed for market risk and operational risk. Accordingly, CAR ratio compute considers only RWA for credit risk
ECO
NOM
IC &
PO
LITI
CAL
WEE
KLY

Paytm Payments Bank Limited
Published on Saturday, JUNE 27, 2020 vol lV nos 26 & 27 EPW Economic & Political Weekly174
21. Investments (i) The following table sets forth, for the periods indicated, the details of investments and the movement of provision held towards depreciation on
investments of the Bank. (Rs. in ‘000)
Particulars As atMarch 31, 2020
As atMarch 31, 2019
(1) Value of Investments (i) Gross Value of Investments (a) In India 25,369,668 20,922,309 (b) Outside India – – (ii) Provisions for depreciation (a) In India 15,235 – (b) Outside India – – (iii) Net Value of Investments (a) In India 25,354,433 20,922,309 (b) Outside India – –(2) Movement of provisions held towards depreciation on investments (i) Opening balance – – (ii) Add: Provisions made during the year 15,235 – (iii) Less: Write off/write back of excess provisions during the year – – Closing balance 15,235 –
(ii) The following table sets forth, for the periods indicated, the details of investments categorization in accordance with RBI guidelines. (Rs. in ‘000)
Security As at March 31, 2020 As at March 31, 2019
HTM HFT AFS Total HTM HFT AFS Total
Govt. Securities – – 25,354,433 25,354,433 – – 20,922,309 20,922,309Other Approved Securities – – – – – – – –Shares – – – – – – – –Debentures/Bonds – – – – – – – –Other –Mutual funds – – – – – – – –Other –Joint Venture – – – – – – – –
HTM – Held till Maturity, HFT – Held for Trade, AFS – Available for Sale (iii) During the year ended March 31, 2020 and March 31, 2019, there is no inter category movement in respect of investments held by the Bank and
no Investment in Non SLR Investment Portfolio. (iv) The bank did not have purchased /sell any securities under repo/reverse repo during the year ended March 31, 2020 and March 31, 2019.
22. DerivativesThe Bank has not entered into any derivative transactions (Forward rate agreement/Interest Rate Swap/ Exchange Traded Interest Rate Derivatives) during the year ended March 31, 2020 & March 31, 2019. Therefore, qualitative and quantitative disclosures under RBI guidelines with respect to derivative transactions are not required.
23. Asset qualityAs per the guidelines issued by Reserve Bank of India for licensing of Payments Bank, the payment banks are not allowed to give any advance or lend to any person including their directors. Therefore, the disclosures required for asset quality (movements in NPA’s, disclosure on accounts subjected to restructuring, provisioning of standard assets etc.) are not applicable to the bank.
24. Business/information ratios The following table sets forth, for the periods indicated, the business/information ratios.
Particulars For the year ended March 31, 2020
For the year ended March 31, 2019
Interest income to working funds 4.72% 4.76%Non-interest income to working funds 49.48% 50.93%Operating Profi t to working funds 0.75% 1.08%Return on assets 0.73% 0.64%Net Profi t per employee (Rs. in ‘000s) 184 284Business (average deposits plus average advances) per employee (Rs. in ‘000s) 15,159 27,882
Note: 1. Working funds is calculated as average of total assets (excluding accumulated losses, if any) as reported to Reserve Bank of India in Form X under
Section 27 of the Banking Regulation Act, 1949, during the 12 months of the fi nancial year.
ECO
NOM
IC &
PO
LITI
CAL
WEE
KLY

Paytm Payments Bank Limited
Economic & Political Weekly EPW Published on Saturday, JUNE 27, 2020 vol lV nos 26 & 27 175
25. Maturity Pattern of Key Assets and Liabilities The maturity pattern of key assets and liabilities for the year ended March 31, 2020 is as below:
(Rs. in ‘000)
Particulars Day 1 2-7 Days
8-14 Days
15-30 Days
31 Days & up to
2 months
Over 2Months& up to
3 months
Over 3 months & up to
6 months
Over 6 months & up to 1 year
Over 1 year
& up to 3 years
Over 3 years
& up to 5 years
Over 5 years
Total
Deposits 1,029,437 207,080 378,064 651,637 1,234,882 1,459,060 2,579,952 4,361,980 14,879,925 1,721,234 193,781 28,697,032Advances – – – – – – – – – – – –Investments 2,119,668 – – 1,919,764 2,459,149 3,265,750 4,173,629 11,416,473 – – – 25,354,433Borrowings – – – – – – – – – – – –Foreign Currency assets – – – – – – – – – – – –Foreign Currency Liabilities – – – – – – – – – – – –
The maturity pattern of key assets and liabilities for the year ended March 31, 2019 is as below: (Rs. in ‘000)
Particulars Day 1 2-7 Days
8-14 Days
15-30 Days
31 Days & up to
2 months
Over 2Months& up to
3 months
Over 3 months & up to
6 months
Over 6 months & up to 1 year
Over 1 year
& up to 3 years
Over 3 years
& up to 5 years
Over 5 years
Total
Deposits 526,065 272,798 494,765 838,728 1,548,682 1,758,788 2,910,980 4,273,278 8,233,437 548,986 18,639 21,425,146Advances – – – – – – – – – – – –Investments – 549,725 – – 5,978,158 1,332,278 2,633,853 10,428,295 – – – 20,922,309Borrowings – – – – – – – – – – – –Foreign Currency assets – – – – – – – – – – – –Foreign Currency Liabilities – – – – – – – – – – – –
Note: (i) The Classifi cation of assets and liabilities under the different maturity buckets is based on the same estimates and assumptions as used by
the Bank for compiling the return submitted to the RBI. (ii) The maturity pattern of wallet deposit under different time bucket is based on experience and estimates of Bank which has been approved
by Asset & Liability Committee (ALCO).
26. Details of exposures to real estate and capital market sectors, risk category-wise country exposures, factoring exposures, single/group borrower exposures, unsecured advances and concentration of deposits, advances, exposures and NPA’s: As per the guidelines issued by Reserve Bank of India for licensing of Payments Bank, the payment banks are not allowed to give any advance or lend to any person including their directors. Therefore, the disclosures required in respect to exposure to real estate sector, capital market, category wise country risk, single & group borrower limits and unsecured advances are not applicable to the bank.
27. Disclosure of Penalties imposed by RBI
Particulars For the year endedMarch 31, 2020
For the year endedMarch 31, 2019
Penalty imposed by RBI Nil NilStrictures by RBI on the basis of adverse fi ndings Nil 6 months *
*The bank had been prohibited by Reserve Bank of India (RBI) from opening any new accounts and wallets from June 20, 2018 on account of supervisory concerns, which were lifted by RBI w.e.f. December 31, 2018. However, no restrictions as imposed by RBI on the existing customers of the bank for operating their accounts as per the applicable operating guidelines.
28. Earnings per share (EPS): (Rs in ‘000)
Particulars For the year endedMarch 31, 2020
For the year endedMarch 31, 2019
Net Profi t/(Loss) after tax (Rs.) 298,162 192,194Weighted average number of equity shares for calculating Basic and Diluted EPS (in’000) 400,000 400,000Basic (Nominal value of share Rs. 10) 0.75 0.48Diluted (Nominal value of share Rs. 10) 0.75 0.48
29. Employees benefi ts: The bank has defi ned benefi t gratuity plan. Every employee who has completed fi ve years or more of service gets a gratuity on departure at 15 days salary (last drawn basic salary) for each completed year of service. The scheme of the bank is non-funded. Disclosures are as per actuarial report of independent actuary.
ECO
NOM
IC &
PO
LITI
CAL
WEE
KLY

Paytm Payments Bank Limited
Published on Saturday, JUNE 27, 2020 vol lV nos 26 & 27 EPW Economic & Political Weekly176
The following table summarizes the components of net benefi t expense recognized in the profi t and loss account and amount recognized in the balance sheet.
(Rs in ‘000)
Particulars For the year endedMarch 31, 2020
For the year endedMarch 31, 2019
Current service cost 14,994 8,799Past Service Cost including curtailment Gains/Losses – –Interest cost on benefi t obligation 1,769 462Expected return on plan assets – –Net actuarial (gain)/loss recognized in the year 1,272 (4,756)Net employee benefi t expense 18,035 4,505
Details of defi ned benefi t gratuity plan (Rs in ‘000)
Particulars As at March 31, 2020 As at March 31, 2019
Present value of defi ned benefi t obligation 42,790 23,099Fair value of planned assets – –Plan assets/(liability) – –
Changes in the present value of the defi ned benefi t obligation are as follows: (Rs in ‘000)
Particulars As at March 31, 2020 As at March 31, 2019
Opening defi ned benefi t obligation 23,099 5,928Acquisition adjustment 1,784 12,666Interest cost 1,769 462Current service cost 14,994 8,799Past Service Cost including curtailment Gains/Losses – –Benefi ts paid (128) –Actuarial loss/(gain) on obligations 1,272 (4,756)Closing defi ned benefi t obligation 42,790 23,099
The principal assumptions used in determining defi ned benefi t plan obligations are shown below:
Particulars For the year endedMarch 31, 2020
For the year endedMarch 31, 2019
Discount rate 6.76% 7.66%Salary Escalation Rate 10.00% 10.00%Attrition rate As per table below As per table below
Attrition rate used are as per the table below:
Age (Years) For the year endedMarch 31, 2020
For the year endedMarch 31, 2019
Up to 30 Years 30% 30%From 31 to 44 years 30% 30%Above 44 years 30% 30%
The estimates of future salary increases takes into account the inflation, seniority, promotion and other relevant factors.
30. Provision for long term contracts:The Bank has a process whereby periodically all long term contracts are assessed for material foreseeable losses. At the year end, the Bank has reviewed and recorded adequate provision as required under applicable RBI laws/accounting standards for material foreseeable losses on such long term contracts, where applicable, in the books of account and disclosed the same under the relevant notes in the fi nancial statements.
31. Segment Information: Business Segments:
For the purpose of segment reporting as per Accounting Standard -17 on ‘Segment Reporting’ issued by Institute of Chartered Accountants of India and as prescribed in Reserve Bank of India guidelines, the business of the Bank has been classifi ed into four segments i.e. a) Treasury Operations, b) Retail Banking, c) Wholesale Banking and d) Other Banking Operations.Segmental Revenue, Results, Assets & Liabilities in respect of Wholesale and Retail Banking segment have been bifurcated on the basis of exposure to these segments. Assets & Liabilities wherever directly related to segments have been accordingly allocated to segments and wherever not directly related have been allocated on systematic basis.
• Treasury Operations: Treasury Operations consist of dealing in securities and other investments. • Retail Banking Business Operations: Includes all other banking operations not covered under treasury & other banking operations. • Other Banking Operations: Other Banking Operations consist of activities which are not in the nature of core banking operations
ECO
NOM
IC &
PO
LITI
CAL
WEE
KLY

Paytm Payments Bank Limited
Economic & Political Weekly EPW Published on Saturday, JUNE 27, 2020 vol lV nos 26 & 27 177
Geographical segments:The Bank does not have any overseas branch therefore disclosure as required under Accounting Standard -17, reporting under geographic segment is not applicable.The following table provides required information for the primary segments for the year ended March 31, 2020 and March 31, 2019 respectively:
(Rs. in ‘000)
Particulars Treasury Retail banking Wholesale banking
Other banking operations
Total
March 31, March 31, March 31, March 31, March 31,
2020 2019 2020 2019 2020 2019 2020 2019 2020 2019
Segment revenue 1,922,378 1,426,994 16,840,802 14,203,968 – – 3,299,570 1,042,520 22,062,750 16,673,482Segment result 1,593,452 1,315,687 (1,095,178) (1,050,513) – – (207,867) 58,965 290,407 324,139Unallocated expenses – –Operating Profi t 290,407 324,139Income tax (expense)/reversal
7,755 (131,945)
Net profi t 298,162 192,194Segment assets 41,096,313 30,046,734 2,392,103 4,966,837 – – 408,657 840,261 43,897,073 35,853,832Income tax assets (net) 1,005,594 664,822Total Assets 41,096,313 30,046,734 2,392,103 4,966,837 – – 408,657 840,261 44,902,667 36,518,654Segment liabilities 45,110 22,188 39,547,256 31,837,399 – – 1,334,283 849,264 40,926,649 32,708,851Unallocated liabilities 3,976,018 3,677,858Income tax liabilities – 131,945Total Liabilities 45,110 22,188 39,547,256 31,837,399 – – 1,334,283 849,264 44,902,667 36,518,654
32. Provisions and Contingencies (Rs in ‘000)
Particulars For the year endedMarch 31, 2020
For the year endedMarch 31, 2019
Provision for income tax 171,431 131,945Deferred tax expenses (refer schedule 42) (179,186) NilProvisions for depreciation on investment 15,235 NilProvision for operational losses (net) 57,974 41,032
The Bank has assessed its obligations arising in the normal course of business, including pending litigations, and other contracts long term contracts in accordance with the provision of Accounting Standard – 29 on ‘Provisions, Contingent Liabilities and Contingent Assets’.
33. Disclosures as per Micro, Small and Medium Enterprises Development Act, 2006The Bank has no dues to suppliers registered under micro, small, medium enterprises Development Act 2006 (‘MSMED Act’). The disclosures pursuant to the said MSMED Act are as:
(Rs in ‘000)
Particulars As at March 31, 2020 As at March 31, 2019
Principal amount due to suppliers registered under the MSMED Act and remaining unpaid as at year end
26,056 Nil
Interest due to suppliers registered under the MSMED Act and remaining unpaid as at period end
– Nil
Principal amounts paid to suppliers registered under the MSMED Act, beyond the appointed day during the period
767 Nil
Interest paid, other than under Section 16 of MSMED Act, to suppliers registered under the MSMED Act, beyond the appointed day during the period
– Nil
Interest paid, under Section 16 of MSMED Act, to suppliers registered under the MSMED Act, beyond the appointed day during the period
– Nil
Interest due and payable towards suppliers registered under MSMED Act, for payments already made
– Nil
34. Change in estimates:During the year ended March 31, 2020, the Bank has changed the method of charging the depreciation and amortization (“depreciation”) from written down value (WDV) to Straight line method (SLM). The Bank has also reassessed the estimated useful life of Computer Hardware and Software.The Bank has accounted the above changes in accordance with the Accounting Standard -10 “Property, Plant & Equipment” and Accounting Standard-5 on “Net Profi t or Loss for the Period, Prior Period Items and Changes in Accounting Policies”.Due to this change in estimates, the depreciation expense for the year ended March 31, 2020 has been increased by Rs. 25.23 crores.
ECO
NOM
IC &
PO
LITI
CAL
WEE
KLY

Paytm Payments Bank Limited
Published on Saturday, JUNE 27, 2020 vol lV nos 26 & 27 EPW Economic & Political Weekly178
35. Related Party Disclosure:Name and descriptions of related parties where control exists irrespective of whether transactions have occurred or not:
a) Enterprise which exercise signifi cant infl uence in voting power and power to direct the fi nancials and operating policies of the Bank.
One 97 Communications Limited
b) Enterprise over which director exercise signifi cant infl uence in voting power and power to direct the fi nancials and operating policies of the enterprise.
Paytm E-Commerce Private LimitedApplied Life Private LimitedPaytm Money Limited
c) Key Management Personnel Satish Kumar Gupta (Managing Director & CEO) (Appointed on October 23rd, 2018)Renu Satti (Managing Director & CEO) (Resigned on July 26th, 2018)
As per master circular no. DBR.BP.BC No.23/21.04.018/2015-16, dated July 01, 2015 issued by RBI, Where there is only one entity in any category of related party, banks need not disclose any details pertaining to that related party other than the relationship with that related party.
(i) Details of transactions with related parties during the year ended March 31, 2020 and March 31, 2019 respectively:-(Rs. in ‘000)
Items/Related Party For the year ended March 31, 2020
For the year ended March 31, 2019
Availing of services from enterprise as mentioned in clause (b) in table above 600 600
Total 600 600
Reimbursement for purchase of assets to enterprise as mentioned in clause (b) in table above – 60,720
Total – 60,720
Reimbursement for sale of assets from enterprise as mentioned in clause (b) in table above 65,341 –
Total 65,341 –
(ii) Balance outstanding with related parties as at March 31, 2020 and March 31, 2019 respectively:- (Rs. in ‘000)
Items/Related Party As atMarch 31, 2020
As atMarch 31, 2019
Amount receivable towards reimbursement for sale of fi xed assets from enterprise as mentioned in clause (b) in table above 19,068 –
Total 19,068 –
Advance given for operational expenses to enterprise as mentioned in clause (b) in table above 519 –
Total 519 –
Amount payable towards reimbursement for purchase of fi xed assets to enterprise as mentioned in clause (b) in table above – 4,720
Total – 4,720
36. Disclosure on Remuneration:
Compensation Policy and practices
(I) Qualitative Disclosure:
(a) Information relating to the composition and mandate of the Remuneration Committee:The Nomination and Remuneration Committee comprised of Non-Executive Directors, including Independent Directors of the Bank. Key mandate of the Nomination & Remuneration Committee is to oversee the appointment, terms of engagement and fi xation of remuneration of Directors & KMP’s and other Key employees. Compensation policy governing all employees of the Bank is approved by the Committee.
(b) Information relating to the design and structure of remuneration processes and the key features and objectives of remuneration policy:The Nomination and Remuneration Committee of the Board oversees the remuneration aspects. The function of the Committee includes recommending appointments of Directors to the Board and other key managerial personnel, lay down criteria for their performance evaluation and also recommend their remuneration (including performance bonus). It also approves the quantum and frequency of bonus payable to members of other staff including senior management. Further, the compensation of staff engaged in control functions like Risk and Compliance depends on their performance, which is based on achievement of the key results of their respective functions and are not linked to any business targets.The remuneration process of the Bank is in accordance with the defi ned Compensation policy objectives
ECO
NOM
IC &
PO
LITI
CAL
WEE
KLY

Paytm Payments Bank Limited
Economic & Political Weekly EPW Published on Saturday, JUNE 27, 2020 vol lV nos 26 & 27 179
(c) Description of the ways in which current and future risks are taken into account in the remuneration processes:The Board approves the risk framework for the bank and the business activities of the bank are undertaken within this framework to achieve the fi nancial plan. The risk framework includes the Bank’s risk appetite, limits framework and policies and procedures governing various types of risk. The annual performance (AOP) targets and performance evaluation incorporate both qualitative and quantitative aspects that other than targeted growth and profi t numbers include aspects like adherence to regulatory norms and effective risk management.
(d) Description of the ways in which the bank seeks to link performance during a performance measurement period with levels of remuneration:Key result area is defi ned for all employees in which their key performance indicators are also defi ned. The weightage will vary for all employees depending on their level.The performance assessment of employees is undertaken quarterly/annually based on achievements compared to the KRA assigned to them as stated above. In case the employee fails to achieve his/her KRA and the desired level, the company may decide not to release the variable compensation to the employees.
(e) A discussion of the bank’s policy on deferral and vesting of variable remuneration and a discussion of the bank’s policy and criteria for adjusting deferred remuneration before vesting and after vesting:The quantum of bonus does not exceed a certain percentage (as stipulated in compensation policy) of the total fi xed pay in the year. The portion of variable pay would not be paid in a situation where the Bank fi nds case of gross negligence, breach of code of conduct or in the event of a reasonable evidence of deterioration in fi nancial performance or individual performance.
(f) Description of the different forms of variable remuneration (i.e. cash, shares, ESOPs and other forms) that the bank utilizes and the rationale for using these different forms:Variable remuneration includes the following:
• Performance Linked Incentive – paid at defi ned intervals (quarterly/annually or any other agreed frequency) • Deferred Remuneration The form and quantum of variable remuneration depends on the job level, associated risks involved and time spent in the organization.
(II) Quantitative Disclosure:
(g) Number of meetings held by the Remuneration Committee during the fi nancial year and remuneration paid to its members:No. of meetings: 5 meetings (Previous Year: 6 meetings)Remuneration paid to the members: Rs. 9 lakhs (Previous Year: Rs. 9 Lakhs)
(h) (i) Number of employees having received a variable remuneration award during the fi nancial year : 1 employee (Previous Year: Nil) (ii) Number and total amount of sign on awards made during the fi nancial year: Nil (Previous Year: Nil) (iii) Details of guaranteed bonus, if any, paid as joining/sign on bonus : Nil (Previous Year : Nil) (iv) Details of severance pay, in addition to accrued benefi ts, if any : Nil (Previous Year : Nil)
(i) (i) Total amount of outstanding deferred remuneration, split into cash, shares and share linked instruments and other forms : Nil (Previous Year : Nil)
(ii) Total amount of deferred remuneration paid out in the fi nancial year: Nil (Previous Year: Nil)
(j) Breakdown of amount of remuneration awards for the fi nancial year to show fi xed and variable, deferred and non deferred:Fixed pay (Rs. in ‘000) – Rs. 12,998 (Previous Year: Rs. 6,851), Variable pay for FY 2018-2019 paid during the year ended March 31, 2020 (Rs. in ‘000) - Rs. 2,000 (Previous year Nil)Variable Pay for FY 2019-20 – This is yet to be reviewed and approved by the Bank’s remuneration committee for the year ended March 31, 2020.
(k) (i) Total amount of outstanding deferred remuneration and retained remuneration exposed to ex post explicit and/or implicit adjustments: Nil (Previous Year : Nil)
(ii) Total amount of reductions during the fi nancial year due to ex post explicit adjustments: Nil (Previous Year: Nil) (iii) Total amount of reductions during the fi nancial year due to ex post implicit adjustments: Nil (Previous Year: Nil)
37. Disclosure of Complaints
A. Customer Complaints
Particulars For the year endedMarch 31, 2020
For the year endedMarch 31, 2019
No. of complaints pending at the beginning of the year 87 254No. of complaints received during the year 14,369 11,416No. of complaints redressed during the year 13,689 11,583No. of complaints pending at the end of the year 767 87
ECO
NOM
IC &
PO
LITI
CAL
WEE
KLY

Paytm Payments Bank Limited
Published on Saturday, JUNE 27, 2020 vol lV nos 26 & 27 EPW Economic & Political Weekly180
B. Awards passed by the Banking Ombudsman
Particulars For the year endedMarch 31, 2020
For the year endedMarch 31, 2019
No. of unimplemented Awards at the beginning of the year Nil NilNo. of Awards passed by the Banking Ombudsmen during the year Nil NilNo. of Awards implemented during the year Nil NilNo. of unimplemented Awards at the end of the year Nil Nil
C. Complaints relating to the Bank’s customers on other banks’ ATMs
Particulars For the year endedMarch 31, 2020
For the year endedMarch 31, 2019
No. of complaints pending at the beginning of the year 1 NilNo. of complaints received during the year 82 38No. of complaints redressed during the year 78 37No. of complaints pending at the end of the year 5 1
38. Letter of Comfort (LOC) and Bancassurance: Bank has not issued any Letter of Comfort and not engaged in any insurance broking, agency or bank assurance business during the year ended March
31, 2020 and March 31, 2019.
39. Concentration of Deposits (Rs. in ‘000)
Particulars For the year endedMarch 31, 2020
For the year endedMarch 31, 2019
Total deposits of twenty largest depositors 2,000 2,000
Percentage of deposits of twenty largest depositors to total deposits of the bank 0.01% 0.01%
40. Concentration of Exposure (Rs. in ‘000)
Particulars For the year endedMarch 31, 2020
For the year endedMarch 31, 2019
Total Exposure to twenty largest borrowers/customers Nil NilPercentage of Exposures to twenty largest borrowers/customers to total exposure of the bank on borrowers/customers Nil Nil
Exposure is defi ned as credit and investment exposure as prescribed in Master Circular on exposure Norms. Considering that PPBL did not extend any credit or did not provide any line of credit to either customers or to related parties, there is no fund/non-fund based exposure. Further, since PPBL didn’t taken any risk on behalf of its customers or related parties, investment exposure is also Nil.
41. Transfers to Depositor Education and Awareness Fund (DEAF) : (Rs. in ‘000)
Particulars As at March 31, 2020 As at March 31, 2019
Opening balance of amounts transferred to DEAF Nil NilAdd : Amounts transferred to DEAF during the year Nil NilLess : Amounts reimbursed by DEAF towards claims Nil NilClosing balance of amounts transferred to DEAF Nil Nil
42. Deferred Tax :During the fi nancial year ending year March 31, 2020, the Bank has recognised the deferred tax in accordance with the principle laid down in Accounting Standard 22 “Accounting for Taxes on Income”.
As this is the fi rst fi nancial year of the Bank for recognition of deferred tax therefore deferred tax assets for previous years amounting to Rs. 9.46 crore has been recognised in the fi nancial year ending March 31, 2020.
ECO
NOM
IC &
PO
LITI
CAL
WEE
KLY

Paytm Payments Bank Limited
Economic & Political Weekly EPW Published on Saturday, JUNE 27, 2020 vol lV nos 26 & 27 181
43. Details of provisioning related to fraud accounts : (Rs. in ‘000)
Particulars As at March 31, 2020 As at March 31, 2019
No. of frauds reported 9 NilAmount involved in such frauds(net of recovery) 80 NilQuantum of provisions made * Nil NilQuantum of unamortised provision debited from “other Reserves” at the end of the year Nil Nil
*Excludes amount written off.
44. Liquidity Coverage ratio (LCR) : Liquidity Coverage Ratio (LCR) standard has been introduced with the objective that a bank maintains an adequate level of unencumbered High Quality Liquid Assets (HQLA) that can be converted into cash to meet its liquidity needs for a 30 calendar day time horizon under a signifi cantly severe liquidity stress scenario. The shock of liquid assets should enable the bank to survive until day 30 of the stress scenario, by which time it is assumed that appropriate corrective actions can be taken. LCR has been defi ned as Stock of High Quality assets than can be readily sold or used a collateral to obtain funds in a range of stress scenarios. There are two categories of assets: Level 1 with 0% haircut and level 2A with minimum 15% haircut and level 2B assets with a minimum 50% haircut. Though RBI has not mandated the preparation of LCR for Payments Banks, the same has been prepared and disclosed below on a conservative basis. Beginning Jan 2015, LCR has been mandated at 60% which is to rise to 100% in equal steps by 2019. Accordingly LCR has been set at 100%. As per RBI guidelines on Basel III framework dated April 17, 2020, LCR is not yet mandated for payments banks. The Bank is complying to LCR voluntarily and being disclosed as a best practice
(Rs. in ’000)
Unweighted value(Average)
Weighted value(Average)
Total High-Quality Liquid Assests (HQLA) 22,760,000 Cash Outfl ows Retail deposits and deposits from small business customers, of which : Stable deposits 830,000 83,000 Less stable deposits 27,933,703 5,586,700 Unsecured Wholesale Funding of which : Operational deposits (all counterparts) 3,627,264 3,413,100Non-Operational Deposits (all counterparties) – – Unsecured Debt – – Secured Wholesale funding – – Additional requirements, of which : Oufl ows related to derivative exposures and collateral requirements – – Outfl ows related to loss of funding on debt products – – Credit & Liquidity facilities – – Other contractual funding obligations 1,660,900 1,660,900 Other contingent funding obligations – –
Total Cash Outfl ows (A) 34,051,867 10,743,700
(Rs. in ’000)
Unweighted value(Average)
Weighted value(Average)
Cash Infl ows
Secured Lending (eg reverse repos) – – Infl ows from fully performing exposures 3,128,045 3,030,000Other cash infl ows – –
Total Cash Infl ows (B) 3,128,045 3,030,000Total Adjusted Value Total HQLA 22,760,000 Net Cash Outfl ow (A-B) 7,713,700Liquidity Coverage Ratio 295%
ECO
NOM
IC &
PO
LITI
CAL
WEE
KLY

Paytm Payments Bank Limited
Published on Saturday, JUNE 27, 2020 vol lV nos 26 & 27 EPW Economic & Political Weekly182
For MSKA & Associates For and on behalf of the Board of Directors ofICAI Firm Regn. No. 105047W Paytm Payments Bank LimitedChartered Accountants
Sd/- Sd/- Sd/-Swapnil Kale Vijay Shekhar Sharma Satish Kumar Gupta Partner (Part time Chairman & Director) (Managing Director & CEO) Membership No. 117812 (DIN : 00466521) (DIN : 08190146) Place: Mumbai Place: Delhi Place: Mumbai
Sd/- Sd/- Vaibhav Goel Sanjay Saxena (Director) (Chief Financial Offi cer) (DIN : 06658218) Place: Delhi Place: Gurugram Sd/- Sachin Jain (Company Secretary)Date: May 20, 2020 Place: Noida
45. Drawn from Reserves :The Bank has not drawn any amount from reserves during the year ended March 31, 2020.
46. Operating Lease : The Bank has operating lease for offi ce premises. The future minimum rentals payable under non-cancellable operating leases period as at year-end are as follows: (Rs. in ‘000 )
Particulars As at March 31, 2020 As at March 31, 2019
Not later than one year 48,466 22,456Later than one year and not later than fi ve years 28,124 26,884Later than fi ve years – –
The operating lease arrangements extend for a maximum period of 5 years from their respective dates of inception. Some of the operating lease arrangements have price escalation and option of renewal clause as mutually agreed between the parties and there are no restrictions imposed on lease arrangements
47. Additional Disclosures Remuneration of Directors ((Non-executive)
(Rs. in ‘000 )
Particulars For the year endedMarch 31, 2020
For the year endedMarch 31, 2019
Sitting Fees 6,600 4,785
48. Corporate Social Responsibility:As per Section 135(1) of the Companies Act 2013, “Every Company having net worth of rupees fi ve hundred crore or more, or turnover of rupees one thousand crore or more or a net profi t of rupees fi ve crore or more during any fi nancial year shall constitute Corporate Social Responsibility Committee of the Board consisting of three or more directors, out of which at least one director shall be independent director”. Further, the Company should spend, in every fi nancial year at least two percent of the average net profi ts of the Company made during the three immediately preceding fi nancial years, in pursuance of its Corporate Social responsibility policy.
For the fi nancial year ending March 31, 2020, the turnover of the Bank exceeds the threshold limit of turnover as mentioned in above para therefore requirement of Section 135(1) of Companies Act, 2013 is applicable to bank. However, the Bank has incurred average net loss during three immediately preceding fi nancial years therefore provision of CSR relating to spending is not applicable.
49. Impact of COVID-19:The World Health Organization announced a global health emergency because of a new strain of coronavirus (“COVID-19”) and classifi ed its outbreak as a pandemic on March 11, 2020. On March 24, 2020, the Indian government announced a strict 21-day lockdown across the country to contain the spread of the virus, which has been further extended till May 17, 2020. This pandemic and government response are creating disruption in global supply chain and adversely impacting most of the industries which has resulted in global slowdown.
The management has made an assessment of the impact of COVID-19 on the Company’s operations, fi nancial performance and position as at and for the year ended March 31, 2020 and has concluded that no there is no impact which is required to be recognised in the fi nancial statements. Accordingly, no adjustments have been made to the fi nancial statements.
50. Previous year fi gures have been regrouped/reclassifi ed where necessary to make them comparable to the current year classifi cation.
ECO
NOM
IC &
PO
LITI
CAL
WEE
KLY

Economic & Political Weekly EPW Published on Saturday, june 27, 2020 vol lV nos 26 & 27 183
Readings on the Economy, Polity and SocietyEssays from the Economic and Political Weekly
.
Gender and EducationEdited by VIMALA RAMACHANDRAN AND KAMESHWARI JANDHYALA
Education of women and girls in India has been widely debated and discussed since the mid-1900s. While the last century has seen a considerable shift in the status of women in Indian society, gender equality in education continues to be influenced by three sets of issues: economy, society and culture; accessibility and availability of formal education; and gender norms.
This volume brings together wide-ranging debates on the social, political and economic realities affecting the education of women across the country, and vividly analyses the different axes of inequality in education through a study of textbooks.
Pp xvi + 392 ` 645ISBN 978-93-5287-740-92019
g y yEssays from the Economic and Political We
Gender and EducationEdited by VIMALA RAMACHANDRAN AND KAMESHWARI JANDHYALA
omen and girls in India has been widely debated and discussed since the mid-1900s. While ift in the status of women in Indian society, gender equality in education continues to be
y, society and culture; accessibility and availability of formal education; and gender norms.
ngs together wide-ranging debates on the social, political and economic realities affecting thed vividly analyses the different axes of inequality in education through a study of textbooks
Social PolicyEdited by JEAN DRÈZE
e of social programmes is far from ideal, Economic Gro
dbook of Rural Indiaed by SURINDER S JODHKA
an’ are the foremost categories through e has been visualised and engaged with
contemporary times.
ovides a historical perspective on the rural’ and covers a wide range of topics critical to the imaginings and empirics contemporary India.
Water: Growing UndEmerging Persp
Edited by MIHIR SHAH AND P
For decades after independence, Indian planninthe need for sustainability and equity in watedevelopment and management. It was only inthat serious questions began to be raiseunderstanding and approach to rivers.
This collection of essays, reflecting the multi-dimmulti-disciplinary character of water, is thematically and chronologically.
NEW
The Adivasi QuestionEdited by INDRA MUNSHI
Depletion of forests has eroded the survival base of Adivasis, displacing them and leading to systematic alienation. This volume discusses questions of community rights and ownership, management of forests, the state’s rehabilitation policies, and the Forest Rights Act.
Pp xiv + 538 | Rs 745ISBN 978-81-250-5131-22013
Social PolicyEdited by JEAN DRÈZE
The performance of social programmes is far from ideal, with still a long way to go in directly addressing the interests, demands and rights of the unprivileged, despite some benefits now taking the form of enforceable legal entitlements.
This collection of essays is clustered around six major themes: health, education, food security, employment guarantee, pensions and cash transfers, and inequality and social exclusion.
Pp xiv + 478 | Rs 795ISBN 978-81-250-6284-42016
The Problem of CasteEdited by SATISH DESHPANDE
The general perception about caste changed irrevoc -ably in the 1990s post the Mandal Commission recom -mendations. This volume discusses estab lished perspectives in relation to emergent concerns, dis ci plinary responses, the interplay between caste, class and politics, challenges in law and policy, emergent research areas, and post-Mandal innovations in caste studies.
Pp xi + 425 | Rs 595ISBN 978-81-250-5501-32014
Economic Growth and Its Distribution in India
Edited by PULAPRE BALAKRISHNAN
India has witnessed a macroeconomic reversal, a slow-down in growth last a little longer than the boom pre-ceding it. This volume represents a range of perspectives: a long view of growth, a macro view of recent history, a study of the economy covering agriculture, industry and services, and the inclusiveness of recent growth.
Pp xvi + 497 | Rs 745ISBN 978-81-250-5901-12015
Mumbai • Chennai • New Delhi • Kolkata • Bengaluru • Bhubaneshwar •Ernakulam • Guwahati • Jaipur • Lucknow • Patna • Chandigarh • Hyderabad
Contact: [email protected]
Orient Blackswan Pvt Ltdwww.orientblackswan.com
A Handbook of Rural IndiaEdited by SURINDER S JODHKA
‘Rural’ and ‘urban’ are the foremost categories through which social life has been visualised and engaged with in modern and contemporary times.
This volume provides a historical perspective on the subject of the ‘rural’ and covers a wide range of topics that have been critical to the imaginings and empirics of village life in contemporary India.
Orient BlackSwan
A Handbook of
Rural India
SURINDER S. JODHKA
Edited by
RE
AD
ING
SO
NT
HE
EC
ON
OM
Y,
PO
LI T
YA
ND
SO
CIE
TY
Essays from Economic and Political Weekly
Pp xvi + 472 | Rs 825ISBN 978-93-5287-198-82018
march 24, 2012 vol xlviI no 13 EPW Economic & Political Weekly10
Readings on the Economy, Polity and SocietyEssays from the Economic and Political Weekly
Gender and EducationEdited by VIMALA RAMACHANDRAN AND KAMESHWARI JANDHYALA
Education of women and girls in India has been widely debated and discussed since the mid-1900s. While the last century has seen a considerable shift in the status of women in Indian society, gender equality in education continues to be influenced by three sets of issues: economy, society and culture; accessibility and availability of formal education; and gender norms.
This volume brings together wide-ranging debates on the social, political and economic realities affecting the education of women across the country, and vividly analyses the different axes of inequality in education through a study of textbooks.
Pp xvi + 392 ` 645ISBN 978-93-5287-740-92019
NEW
The Adivasi QuestionEdited by INDRA MUNSHI
Depletion of forests has eroded the survival base of Adivasis, displacing them and leading to systematic alienation. This volume discusses questions of community rights and ownership, management of forests, the state’s rehabilitation policies, and the Forest Rights Act.
Higher Education in IndiaEdited by JANDHYALA B G TILAK
The story of higher education has seen many challenges over the decades, the most serious being a high degree of inequity. The articles in this volume discuss, issues of inclusiveness, impact of reservation, problems of mediocrity, shortage of funds, dwindling numbers of faculty, and unemployment of the educated young.
Pp xiv + 538 | Rs 745ISBN 978-81-250-5131-22013
Social PolicyEdited by JEAN DRÈZE
The performance of social programmes is far from ideal, with still a long way to go in directly addressing the interests, demands and rights of the unprivileged, despite some benefits now taking the form of enforceable legal entitlements.
This collection of essays is clustered around six major themes: health, education, food security, employment guarantee, pensions and cash transfers, and inequality and social exclusion.
Pp xiv + 478 | Rs 795ISBN 978-81-250-6284-42016
The Problem of CasteEdited by SATISH DESHPANDE
The general perception about caste changed irrevoc - ably in the 1990s post the Mandal Commission recom -mendations. This volume discusses estab lished perspectives in relation to emergent concerns, dis ci plinary responses, the interplay between caste, class and politics, challenges in law and policy, emergent research areas, and post-Mandal innovations in caste studies.
Pp xi + 425 | Rs 595ISBN 978-81-250-5501-32014
Economic Growth and its Distribution in India
Edited by PULAPRE BALAKRISHNAN
India has witnessed a macroeconomic reversal, a slow-down in growth last a little longer than the boom pre-ceding it. This volume represents a range of perspectives: a long view of growth, a macro view of recent history, a study of the economy covering agriculture, industry and services, and the inclusiveness of recent growth.
Pp xvi + 497 | Rs 745ISBN 978-81-250-5901-12015
Mumbai • Chennai • New Delhi • Kolkata • Bengaluru • Bhubaneshwar •Ernakulam • Guwahati • Jaipur • Lucknow • Patna • Chandigarh • Hyderabad
Contact: [email protected]
Orient Blackswan Pvt Ltdwww.orientblackswan.com
A Handbook of Rural IndiaEdited by SURINDER S JODHKA
‘Rural’ and ‘urban’ are the foremost categories through which social life has been visualised and engaged with in modern and contemporary times.
This volume provides a historical perspective on the subject of the ‘rural’ and covers a wide range of topics that have been critical to the imaginings and empirics of village life in contemporary India.
Orient BlackSwan
A Handbook of
Rural India
SURINDER S. JODHKA
Edited by
RE
AD
ING
SO
NT
HE
EC
ON
OM
Y,
PO
LIT
YA
ND
SO
CIE
TY
Essays from Economic and Political Weekly
Pp xvi + 472 | Rs 825ISBN 978-93-5287-198-82018
Pp xii + 394 | Rs 645ISBN 978-81-250-4777-32012
Women and WorkEdited by PADMINI SWAMINATHAN
For women, the notion of work is a complex interplay of economic, cultural, social and personal factors. This volume analyses the concept of ‘work,’ the economic contribution of women and gendering of work, while focusing on women engaged in varied work all over India.
Water: Growing Understanding, Emerging Perspectives
Edited by MIHIR SHAH AND P S VIJAYSHANKAR
For decades after independence, Indian planning ignored the need for sustainability and equity in water resource development and management. It was only in the 1990s that serious questions began to be raised on our understanding and approach to rivers.
This collection of essays, reflecting the multi-dimensional, multi-disciplinary character of water, is arranged thematically and chronologically.
Pp xi + 408 | Rs 695ISBN 978-81-250-4716-22012
Pp xiii + 559 | Rs 895ISBN 978-81-250-6292-92016
Higher Education in IndiaEdited by JANDHYALA B G TILAK
The story of higher education has seen many challenges over the decades, the most serious being a high degree of inequity. The articles in this volume discuss, issues of inclusiveness, impact of reservation, problems of mediocrity, shortage of funds, dwindling numbers of faculty, and unemployment of the educated youngEC
ONO
MIC
& P
OLI
TICA
L W
EEKL
Y

(Incorporated in Korea, With Limited Liability)
Published on Saturday, JUNE 27, 2020 vol lV nos 26 & 27 EPW Economic & Political Weekly184
INDEPENDENT AUDITOR’S REPORTTo the Chief Executive Offi cer- Kookmin Bank- Gurugram Branch
Report on the Audit of the Financial Statements
Opinion1. We have audited the accompanying fi nancial statements of KOOKMIN BANK- Gurugram Branch in India (“the Bank”) which comprise
the Balance Sheet as at March 31, 2020, the Profi t and Loss Account, the Cash Flow Statement for the year then ended, and notes to the fi nancial statements, including a summary of signifi cant accounting policies and other explanatory information.
2. In our opinion and to the best of our information and according to the explanations given to us, the aforesaid fi nancial statements give the information required by the Banking Regulation Act, 1949 and the Companies Act, 2013, as amended (“the Act”) in the manner so required for the banking companies and give a true and fair view in conformity with the accounting principles generally accepted in India, of the state of affairs of the Bank as at March 31, 2020, its profi t and its cash fl ows for the year ended on that date.
Basis for Opinion3. We conducted our audit in accordance with the Standards on Auditing (SAs) as specifi ed under section 143(10) of the Act. Our responsibilities
under those Standards are further described in the Auditor’s Responsibilities for the Audit of the Financial Statement’s section of our report. We are independent of the Bank in accordance with the Code of Ethics issued by the Institute of Chartered Accountants of India together with the ethical requirements that are relevant to our audit of the fi nancial statements in India, and we have fulfi lled our other ethical responsibilities in accordance with these requirements and the Code of Ethics. We believe that the audit evidence we have obtained is suffi cient and appropriate to provide a basis for our audit opinion on the fi nancial statements.
Information other than fi nancial statements and auditor’s report thereon 4. The Bank’s Management is responsible for the other information. The other information comprises the information included in the Basel
III- Pillar 3 disclosures but does not include the fi nancial statements and our auditor’s report thereon. 5. Our opinion on the fi nancial statements does not cover the other information and we do not express any form of assurance conclusion thereon. 6. In connection with our audit of the fi nancial statements, our responsibility is to read the other information and in doing so, examine if the
other information is materially inconsistent with the fi nancial statements or our knowledge obtained in the audit, or otherwise appears to be materially misstated. If based on our examination, we conclude that there is material misstatement of this other information, we are required to report the fact. We have nothing to report in this regard.
Responsibility of Management and Those Charged with Governance for the Financial Statements7. The Bank’s Management is responsible for the matters stated in section 134(5) of the Companies Act, 2013 with respect to the preparation
of these fi nancial statements that give a true and fair view of the fi nancial position, fi nancial performance and cash fl ows of the Bank in accordance with the accounting principles generally accepted in India, including the Accounting Standards specifi ed under Section 133 of the Companies Act, 2013, provisions of Section 29 of the Banking Regulation Act, 1949 and circulars and guidelines issued by the Reserve Bank of India (‘RBI’) from time to time.
8. This responsibility also includes maintenance of adequate accounting records in accordance with the provisions of the Act for safeguarding of the assets of the Bank and for preventing and detecting frauds and other irregularities; selection and application of appropriate accounting policies; making judgments and estimates that are reasonable and prudent; and design, implementation and maintenance of adequate internal fi nancial controls, that were operating effectively for ensuring the accuracy and completeness of the accounting records, relevant to the preparation and presentation of the fi nancial statements that give a true and fair view and are free from material misstatement, whether due to fraud or error.
9. In preparing the fi nancial statements, management is responsible for assessing the Bank’s ability to continue as a going concern, disclosing, as applicable, matters related to going concern and using the going concern basis of accounting unless management either intends to liquidate the Bank or to cease operations, or has no realistic alternative but to do so. Bank’s management is also responsible for overseeing the Bank’s fi nancial reporting process.
Auditor’s Responsibility for the Audit of the Financial Statements10. Our objectives are to obtain reasonable assurance about whether the fi nancial statements as a whole are free from material misstatement,
whether due to fraud or error, and to issue an auditor’s report that includes our opinion. Reasonable assurance is a high level of assurance, but is not a guarantee that an audit conducted in accordance with SAs will always detect a material misstatement when it exists. Misstatements can arise from fraud or error and are considered material if, individually or in the aggregate, they could reasonably be expected to infl uence the economic decisions of users taken on the basis of these fi nancial statements.
11. As a part of an audit in accordance with SAs, we exercise professional judgment and maintain professional skepticism throughout the audit. We also:• Identify and assess the risk of material misstatement of the fi nancial statement, whether due to fraud or error, design and perform audit
procedure responsive to those risk, and obtain audit evidence that is suffi cient and appropriate to provide a basis for our opinion. The risk of not detecting a material misstatement resulting from fraud is higher than for one resulting from error, as fraud may involve collusion, forgery, intentional omissions, misrepresentations, or the override of internal control.
• Obtain an understanding of internal control relevant to the audit in order to design audit procedures that are appropriate in the circumstances. Under section 143(3)(i) of the Companies Act, 2013, we are also responsible for expressing our opinion on whether the Bank has adequate internal fi nancial controls system in place and the operating effectiveness of such controls.
• Evaluate the appropriateness of accounting policies used and the reasonableness of accounting estimates and related disclosures made by management.
ECO
NOM
IC &
PO
LITI
CAL
WEE
KLY

(Incorporated in Korea, With Limited Liability)
Economic & Political Weekly EPW Published on Saturday, JUNE 27, 2020 vol lV nos 26 & 27 185
• Conclude on the appropriateness of management’s use of the going concern basis of accounting and, based on the audit evidence obtained, whether a material uncertainty exists related to events or conditions that may cast signifi cant doubt on the Bank’s ability to continue as a going concern. If we conclude that a material uncertainty exists, we are required to draw attention in our auditors’ report to the related disclosures in the fi nancial statements or, if such disclosures are inadequate, to modify our opinion. Our conclusions are based on the audit evidence obtained up to the date of our auditors’ report. However, future events or conditions may cause the Bank to cease to continue as a going concern
• Evaluate the overall presentation, structure and content of fi nancial statements, including the disclosures, and whether the fi nancial statements represent the underlying transactions and events in a manner that achieves fair representation.
12. We communicate with those charged with governance regarding, among other matters, the planned scope and timing of the audit and signifi cant audit fi ndings, including any signifi cant defi ciencies in internal control that we identify during our audit. We also provide with those charged with governance with a statement that we have complied with relevant ethical requirements regarding independence, and to communicate with them all relationships and other matters that may reasonably be thought to bear on our independence, and where applicable, related safeguards.
Report on Other Legal and Regulatory Requirements13. The Balance Sheet and the Profi t & Loss Account have been drawn in accordance with the provisions of Section 29 of Banking Regulation
Act, 1949 read with the Companies (Accounting Standards) Rules, 2006 (as amended) specifi ed under section 133 of the Act, read with the Companies (Accounts) Rules, 2014.
14. As required by sub-section (3) of section 30 of the Banking Regulation Act,1949, we report that:a) we have obtained all the information and explanations which, to the best of our knowledge and belief, were necessary for the purposes
of our audit and have found them to be satisfactory;b) the transactions of the Bank, which have come to our notice, have been within the powers of Bank; and c) the Bank has only one branch and therefore, accounting returns for the purpose of preparing fi nancial statements are not required to be
submitted; we have visited Bank’s Gurugram Branch offi ce for the purpose of our audit.
15. Further, as required by section 143(3) of the Act, we report that:a) we have sought and obtained all the information and explanations which to the best of our knowledge and belief were necessary for the
purpose of our audit; b) in our opinion, proper books of account as required by law have been kept by the Bank so far as it appears from our examination of
those books;c) the Balance Sheet, the Profi t and Loss Account and the Cash Flow Statement dealt with by this report are in agreement with the books
of account;d) in our opinion, the aforesaid fi nancial statements comply with the Accounting Standards specifi ed under Section 133 of the Companies
Act, 2013, to the extent they are not inconsistent with the accounting policies prescribed by RBI;e) the requirements of Section 164(2) of the Companies Act, 2013 are not applicable considering the Bank is a branch of Kookmin Bank,
which is incorporated with limited liability in Seoul, Korea;f) with respect to the adequacy of the internal fi nancial controls over fi nancial reporting of the Bank with reference to these fi nancial
statements and the operating effectiveness of such controls, refer to our separate Report in “Annexure A” to this report;g) with respect to the other matters to be included in the Auditor’s Report in accordance with Rule 11 of the Companies (Audit and Audi-
tors) Rules, 2014, as amended in our opinion and to the best of our information and according to the explanations given to us: i. the Bank has nothing to report in terms of impact of pending litigations on its fi nancial position in its fi nancial statements; ii. the bank did not have any long-term contracts, including derivative contracts, for which there were any material foreseeable
losses;iii. there were no amounts which were required to be transferred to the Investor Education and Protection Fund by the Bank.
For Surender Kr. Singhal & Co.Chartered AccountantsFirm’s Registration No. 009156N
Sd/-Pankaj GuptaPartnerMembership No. 501398
New DelhiJune 22, 2020
ECO
NOM
IC &
PO
LITI
CAL
WEE
KLY

(Incorporated in Korea, With Limited Liability)
Published on Saturday, JUNE 27, 2020 vol lV nos 26 & 27 EPW Economic & Political Weekly186
ANNEXURE A TO THE INDEPENDENT AUDITOR’S REPORT OF EVEN DATE ON THE FINANCIAL STATEMENTS OF KOOKMIN BANK- GURUGRAM BRANCHReport on the Internal Financial Controls under Clause (i) of Sub-section 3 of Section 143 of the Companies Act, 2013 (“the Act”)
To the Chief Executive Offi cer- Kookmin Bank- Gurugram Branch1. We have audited the internal fi nancial controls over fi nancial reporting of KOOKMIN BANK-Gurugram Branch in India (“the Bank”) as
of March 31, 2020 in conjunction with our audit of the fi nancial statements of the Bank for the year ended on that date.
Management’s Responsibility for Internal Financial Controls2. The Bank’s management is responsible for establishing and maintaining internal fi nancial controls based on the internal control over fi nancial
reporting criteria established by the Bank considering the essential components of internal control stated in the Guidance Note on Audit of Internal Financial Controls Over Financial Reporting (“Guidance Note”) issued by the Institute of Chartered Accountants of India (“the ICAI”). These responsibilities include the design, implementation and maintenance of adequate internal fi nancial controls that were operating effectively for ensuring the orderly and effi cient conduct of its business, including adherence to Bank’s policies, the safeguarding of its assets, the prevention and detection of frauds and errors, the accuracy and completeness of the accounting records, and the timely preparation of reliable fi nancial information, as required under the Companies Act, 2013.
Auditors’ Responsibility3. Our responsibility is to express an opinion on the Bank’s internal fi nancial controls over fi nancial reporting based on our audit conducted
in accordance with the Guidance Note on Audit of Internal Financial Controls Over Financial Reporting (the “Guidance Note”) and the Standards on Auditing as specifi ed under section 143(10) of the Companies Act, 2013, to the extent applicable to an audit of internal fi nancial controls, both applicable to an audit of Internal Financial Controls and, both issued by the Institute of Chartered Accountants of India. Those Standard and Guidance Note require that we comply with the ethical requirements and plan and perform the audit to obtain reasonable assurance about whether adequate internal controls over fi nancial reporting was established and maintained and if such controls operated effectively in all material respects.
4. Our audit involves performing procedures to obtain audit evidence about the adequacy of the internal fi nancial controls system over fi nancial reporting and their operating effectiveness. Our audit of internal fi nancial controls over fi nancial reporting included obtaining an understanding of internal fi nancial controls over fi nancial reporting, assessing the risk that a material weakness exists, and testing and evaluating the design and operating effectiveness of internal control based on the assessed risk. The procedures selected depend on the auditor’s judgement, including the assessment of the risks of material misstatement of the fi nancial statements, whether due to fraud or error.
5. We believe that the audit evidence we have obtained, is suffi cient and appropriate to provide a basis for our audit opinion on the Company’s internal fi nancial controls system over fi nancial reporting.
Meaning of Internal Financial Controls over Financial Reporting6. A Bank’s internal fi nancial control over fi nancial reporting is a process designed to provide reasonable assurance regarding the reliability
of fi nancial reporting and the preparation of fi nancial statements for external purposes in accordance with generally accepted accounting principles. A Bank’s internal fi nancial control over fi nancial reporting includes those policies and procedures that (1) pertain to the maintenance of records that, in reasonable detail, accurately and fairly refl ect the transactions and dispositions of the assets of the Bank; (2) provide reasonable assurance that transactions are recorded as necessary to permit preparation of fi nancial statements in accordance with generally accepted accounting principles, and that receipts and expenditures of the Bank are being made only in accordance with authorisations of management and directors of the Bank; and (3) provide reasonable assurance regarding prevention or timely detection of unauthorised acquisition, use, or disposition of the Bank’s assets that could have a material effect on the fi nancial statements.
Inherent Limitations of Internal Financial Controls Over Financial Reporting7. Because of the inherent limitations of internal fi nancial controls over fi nancial reporting, including the possibility of collusion or improper
management override of controls, material misstatements due to error or fraud may occur and not be detected. Also, projections of any evaluation of the internal fi nancial controls over fi nancial reporting to future periods are subject to the risk that the internal fi nancial control over fi nancial reporting may become inadequate because of changes in conditions, or that the degree of compliance with the policies or procedures may deteriorate.
Opinion8. In our opinion, the Bank has, in all material respects, an adequate internal fi nancial controls system over fi nancial reporting and such internal
fi nancial controls over fi nancial reporting were operating effectively as at March 31, 2020, based on the internal control over fi nancial reporting criteria established by the Bank considering the essential components of internal control stated in the Guidance Note on Audit of Internal Financial Controls Over Financial Reporting issued by the Institute of Chartered Accountants of India”.
For Surender Kr. Singhal & Co.Chartered AccountantsFirm’s Registration No. 009156N
Sd/-Pankaj GuptaPartnerMembership No. 501398
New DelhiJune 22, 2020
ECO
NOM
IC &
PO
LITI
CAL
WEE
KLY

(Incorporated in Korea, With Limited Liability)
Economic & Political Weekly EPW Published on Saturday, JUNE 27, 2020 vol lV nos 26 & 27 187
The Schedules referred to herein form an integral part of the Balance Sheet. In terms of our report of even date attached
The Schedules referred to herein form an integral part of the Profi t and Loss Account. In terms of our report of even date attached
BALANCE SHEET AS AT 31ST MARCH 2020
Particulars Schedules As atMarch 31,
2020
As atMarch 31,
2019
Amount in INR ‘000
Amount in INR ‘000
CAPITAL AND LIABILITIES
Capital 1 3,558,625 3,558,625 Reserves & Surplus 2 2,376 471 Deposits 3 2,902,071 22,479 Borrowings 4 – – Other Liabilities and Provisions 5 61,266 8,870
TOTAL 6,524,338 3,590,445
ASSETS
Cash and Balances with Reserve Bank of India 6 125,120 2,600 Balances with banks and money at call and short notice 7 4,221,644 3,452,692 Investments 8 565,003 – Advances 9 1,380,000 – Fixed Assets 10 110,709 76,421 Other Assets 11 121,862 58,732
TOTAL 6,524,338 3,590,445
Contingent Liabilities 12 11,487 – Bills for Collection – –
Significant Accounting Policies and Notes forming part of accounts
18
PROFIT AND LOSS ACCOUNT FOR THE YEAR ENDED MARCH 31, 2020
Particulars Schedules For the year ended March 31,
2020
For the period February 20,
2019 to March 31, 2019
Amount in INR ‘000
Amount in INR ‘000
I. INCOMEInterest earned 13 263,557 28,246 Other income 14 2,436 –TOTAL 265,993 28,246
II. EXPENDITUREInterest expended 15 39,354 52 Operating expenses 16 204,985 25,193 Provisions and contingencies
17 19,749 2,530
TOTAL 264,088 27,775
III. PROFIT Net Profit /(Loss) for the period
1,905 471
Profit /(Loss) brought forward
471 –
TOTAL 2,376 471
IV. APPROPRIATIONS Transfer to Statutory Reserve
476 118
Transfer to Other Reserves
– –
Transfer to Government/proposed dividend
– –
Balance carried over to Balance Sheet
1,429 353
TOTAL 1,905 471 Significant Accounting Policies and Notes forming part of accounts
18
For Surender Kr. Singhal & Co. For and on Behalf of Kookmin Bank Chartered Accountants (Gurugram Branch)Firm Registration No. 009156N
sd/ sd/-Pankaj Gupta Hyung Soo ByunPartner Chief Executive Offi cerMembership No. 501398
Place : New Delhi Place : GurugramDated : June 22, 2020 Dated : June 22, 2020
ECO
NOM
IC &
PO
LITI
CAL
WEE
KLY

(Incorporated in Korea, With Limited Liability)
Published on Saturday, JUNE 27, 2020 vol lV nos 26 & 27 EPW Economic & Political Weekly188
In terms of our report of even date attached
For Surender Kr. Singhal & Co. For and on Behalf of Kookmin Bank Chartered Accountants (Gurugram Branch)Firm Registration No. 009156N
sd/ sd/-Pankaj Gupta Hyung Soo ByunPartner Chief Executive Offi cerMembership No. 501398
Place : New Delhi Place : GurugramDated : June 22, 2020 Dated : June 22, 2020
Particulars For the year ended March 31, 2020
For the period February 20, 2019 to March 31, 2019
Amount in INR ‘000 Amount in INR ‘000
A. Cash fl ow from operating activitiesNet Profi t/(Loss) before taxes 11,888 3,002
Adjustments for: – – Depreciation on fi xed assets 14,250 498 Provision for Rent straightlining reserve 4,740 – Provision for standard advances 9,720 – Provision for guarantees 46 –
Operating Profi t/(Loss) before changes in working capital 40,644 3,500 Changes in Working capital(Increase)/decrease in Investments (565,003) – (Increase)/decrease in Advances (1,380,000) – (Increase)/decrease in Other Assets (42,103) (55,536)Increase/(decrease) in Deposits 2,879,592 22,479 Increase/(decrease) in Other Liabilities & provisions 24,037 6,339 Refund/(Payment ) of direct taxes (including tax deducted at source) (17,158) (3,196)
Net cash from/(used in) operating activities 940,009 (26,415)
B. Cash fl ow from investing activitiesPurchase of fi xed assets including CWIP (48,537) (76,918)
Net cash from/(used in) investing activities (48,537) (76,918)
C. Cash fl ow from fi nancing activitiesAmount brought in as start up capital (Head Offi ce) – 3,558,625 Net cash from/(used in) fi nancing activities – 3,558,625
– Net increase/(decrease) in cash & cash equivalents (A+B+C) 891,472 3,455,292
Cash & cash equivalents at beginning of year 3,455,292 – Cash & cash equivalents at end of year 4,346,764 3,455,292
– –
NOTES:1 The above cash fl ow statement has been prepared under the “Indirect method” as set out in the Accounting Standard 3 on Cash Flow Statements.2 Cash and cash equivalents at the end of the year consist of cash in hand and balance with banks as follows:
balance with banks as follows:
Particulars March 31, 2020 March 31, 2019
Cash 2,045 500
Balance with banks – – Current account 153,824 7,792 Fixed Deposit Receipts 4,190,895 3,447,000
4,346,764 3,455,292
CASH FLOW STATEMENT FOR THE YEAR ENDED MARCH 31, 2020
ECO
NOM
IC &
PO
LITI
CAL
WEE
KLY

(Incorporated in Korea, With Limited Liability)
Economic & Political Weekly EPW Published on Saturday, JUNE 27, 2020 vol lV nos 26 & 27 189
SCHEDULE 1 - CAPITAL Amount of deposit kept with RBI under
section 11(2) of the Banking Regulation Act, 1949 1,500 1,500
Amount brought in by Bank from Head Offi ce Opening Balance 3,558,625 – Additions during the year – 3,558,625 Closing Balance 3,558,625 3,558,625
SCHEDULE 2 - RESERVES AND SURPLUSI. Statutory Reserve Opening Balance 118 – Additions during the year 476 118 Deductions during the year – – Closing Balance 594 118II. Capital Reserves Opening Balance – – Additions during the year – – Deductions during the year – – Closing Balance – –III. Share Premium Opening Balance – – Additions during the year – – Deductions during the year – – Closing Balance – –IV. Revenue and other reserves Opening Balance – – Additions during the year – – Deductions during the year – – Closing Balance – –V. Balance in Profi t and Loss Account – Opening Balance 353 – Additions during the year 1,429 353 Deductions during the year – – Closing Balance 1,782 353 Total (I to V) 2,376 471
SCHEDULE 3 - DEPOSITSA I. Demand Deposits i) From banks – – ii) From others 33,083 – Total (I) 33,083 –
II. Savings Bank Deposits 29,288 615 Total (II) 29,288 615 III. Term Deposits i) From banks – – ii) From others 2,839,700 21,864 Total (III) 2,839,700 21,864 Total (I, II & III) 2,902,071 22,479B i) Deposits of branches in India 2,902,071 22,479 ii) Deposits of branches outside India. – – Total (B) 2,902,071 22,479SCHEDULE 4 - BORROWINGSI. Borrowings in India : i) Reserve Bank of India – – ii) Other banks – – iii) Other institutions and agencies – – Total I – –II. Borrowings outside India – – Total II – – Total (I & II) – – Secured borrowings included in I & II above Rs.-Nil
SCHEDULE 5 - OTHER LIABILITIES AND PROVISIONSI. Bills payable – –II. Inter-offi ce adjustments (net) – –III. Interest accrued 19,895 35IV. Others (including provisions) 41,371 8,835 Total (I to IV) 61,266 8,870SCHEDULE 6 - CASH AND BALANCES WITH RESERVE BANK OF INDIAI. Cash in hand (including foreign currency notes) 2,045 500 Total (I) 2,045 500II. Balances with Reserve Bank of India i) In Current Account 123,075 2,100 ii) In Other Accounts – – Total (II) 123,075 2,100 Total (I & II) 125,120 2,600SCHEDULE 7 - BALANCES WITH BANKS AND MONEY AT CALL AND SHORT NOTICEI. In India i) Balance with banks a) In Current accounts 26,395 5,692 b) In Other Deposit accounts 4,164,500 3,447,000 ii) Money at call and short notice a) With Banks – – b) With Other Institutions – – Total (I) 4,190,895 3,452,692II. Outside India i) In Current Accounts 30,749 – ii) In Other Deposit Accounts – – iii) Money at Call and Short Notice – – Total (II) 30,749 – Total (I &II) 4,221,644 3,452,692SCHEDULE 8 - INVESTMENTI. Investments in India in i) Government Securities (Treasury Bills) 565,003 – ii) Other approved Securities – – iii) Shares – – iv) Debentures and Bonds – – v) Subsidiaries and/or joint ventures – – vi) Others – – Total (I) 565,003 –II. Investments outside India in i) Government Securities (including local authorities) – – ii) Subsidiaries and/ or joint ventures abroad – – iii) Other investments – – Total II – – Total (I & II) 565,003 –
SCHEDULE 9 - ADVANCESA. i) Bills Purchased and discounted – – ii) Cash C redits, Overdrafts and Loans repayable on demand 680,000 – iii) Term Loans 700,000 – Total (A) 1,380,000 –B. i) Secured by tangible assets – – ii) Covered by Bank/Government Guarantees 700,000 – iii) Unsecured 680,000 – Total (B) 1,380,000 –
Schedules forming part of the fi nancial statements for the year ended March 31, 2020 (Amount in Rs. ‘000)
Particulars As at As at March 31, March 31, 2020 2019
Particulars As at As at March 31, March 31, 2020 2019
ECO
NOM
IC &
PO
LITI
CAL
WEE
KLY

(Incorporated in Korea, With Limited Liability)
Published on Saturday, JUNE 27, 2020 vol lV nos 26 & 27 EPW Economic & Political Weekly190
SCHEDULE 13 - INTEREST EARNEDI. Interest/Discount on advances/Bills 16,728 –II. Income on investments 7,316 –III. Interest on balances with Reserve Bank of – India and other inter-bank funds 239,320 28,246IV. Others 193 –
Total (I to IV) 263,557 28,246
SCHEDULE 14 - OTHER INCOMEI. Commission, Exchange and Brokerage 332 –II. Profi t/(Loss) on sale of investments (Net) – –III. Profi t/(Loss) on revaluation of investments (Net) – –IV. Profi t/(loss) on sale of land, buildings and other assets (Net) – –V. Profi t on exchange transactions (Net) 889 –VI. Income earned by way of dividends, etc. from subsidiary companies and/or joint ventures abroad/ in India – –VII. Miscellaneous Income 1,215 –
Total (I to VII) 2,436 –
SCHEDULE 15 - INTEREST EXPENDEDI. Interest on deposits 39,354 52II. Interest on Reserve Bank of India/ Inter-bank borrowings – –III. Others – –
Total (I to III) 39,354 52
SCHEDULE 16 - OPERATING EXPENSESI. Payments to and provisions for employees 124,196 13,506II. Rent, taxes and lighting 35,676 2,705III. Printing and stationery 1,057 217IV. Advertisement and publicity 52 –V. Depreciation on bank’s property 14,250 498VI. Director’s fees, allowances and expenses – –VII. Auditors’ fees and expenses 790 382VIII. Law Charges 779 71IX. Postage, Telegrams, Telephones, etc. 409 68X. Repairs and maintenance 3,964 283XI. Insurance 147 –XII. Other expenditure (Refer Note 11) 23,665 7,463
Total (I to XII) 204,985 25,193
SCHEDULE 17 - PROVISION AND CONTINGENCIESI. Provision for standard assets 9,720 –II. Provision for bank guarantees 46 –III. Provision for income tax – – Current tax Liability 15,083 1,301 Deferred Tax (credit)/ charge (5,100) 1,230
Total (I to IV) 19,749 2,531
Schedules forming part of the fi nancial statements for the year ended March 31, 2020 (Amount in Rs. ‘000)
Particulars As at As at March 31, March 31, 2020 2019
Particulars For the For the year ended period March 31, Feb 20, 2019
2020 to March 31, 2019
C. I. Advances in India i) Priority sectors – – ii) Public sector – – iii) Banks – – iv) Others 1,380,000 – Total (I) 1,380,000 – II. Advances outside India (i) Due from banks – – (ii) Due from others (a) Bills purchased and discounted – – (b) Syndicated loans – – (c) Others – – Total (II) – – Total (I+II) 1,380,000 –
SCHEDULE 10 - FIXED ASSETSI. Premises At cost as on 31st March of the preceding year – – Additions during the year – – Deductions during the year – – Depreciation to date – – Net Book Value Total (I) – –
II. Other Fixed Assets (including furniture and fi xtures) At cost as on 31st March of the preceding year 52,915 – Additions during the year 35,338 52,915 Deductions during the year – – Depreciation to date (14,748) (498) Net Book Value Total (II) 73,505 52,417
III. Capital work in progress 37,204 24,004 Total (III) 37,204 24,004 Total (I, II & III) 110,709 76,421
SCHEDULE 11 - OTHER ASSETSI. Inter-offi ce adjustment (net) – –II. Interest accrued 52,342 21,015III. Tax paid in advance/tax deducted at source 20,354 3,196IV. Stationery and Stamps – –V. Non-banking assets acquired in satisfaction of claims – –VI. Deferred Tax Assets (Net) (Previous year 3,871 – Deferred Tax Liabilty Rs. 12,29,174)VII. Others 45,295 34,521 Total (I to VII) 121,862 58,732
SCHEDULE 12 - CONTINGENT LIABILITIESI. Claims against the bank not acknowledged as debts – –II. Liability for partly paid investments – –III. Liability on account of outstanding Forward exchange contracts – –IV. Guarantees given on behalf of constituents a) In India 11,487 – b) Outside India – –V. Acceptances, endorsements and other obligations – –VI. Other items for which the Bank is contingently liable – – Total (I to VI) 11,487 –
SCHEDULE 9 - ADVANCES (Continued)
ECO
NOM
IC &
PO
LITI
CAL
WEE
KLY

(Incorporated in Korea, With Limited Liability)
Economic & Political Weekly EPW Published on Saturday, JUNE 27, 2020 vol lV nos 26 & 27 191
I. Signifi cant Accounting Policies1. Background
Kookmin Bank, incorporated in Seoul, Korea (hereinafter referred as ‘Kookmin Bank’) has started operations, as a representative offi ce at Mumbai vide Reserve Bank of India Approval letter no. DBOD.IBD.No.14085/23.13.157/2011-12 dated March 19, 2012.Kookmin Bank has received an in-principle approval from Reserve bank for upgrading its representative offi ce into branch offi ce vide approval DBR.IBD.No.141/23.13.157/2018-19 dated July 5, 2018. Further, the Bank has received an approval from Reserve bank of India for opening the branch vide approval letter no. DBR.IBD.No. 3666/23.13.157/2018-19 dated October 31, 2018. Accordingly, India Representative offi ce of Kookmin bank was upgraded into a maiden branch at Unit No. 2B/2, 2nd Floor, Two Horizon Centre, Golf Course Road, DLF Phase 5, Sector 43, Gurugram 122002, Haryana, India. w.e.f. February 20, 2019.
2. Basis of PreparationThe fi nancial statements are prepared and presented under the historical cost convention and accrual basis of accounting, except where otherwise stated, and in accordance with the generally accepted accounting principles in India and statutory provisions prescribed under the Banking Regulation Act, 1949, circulars and guidelines issued by the Reserve Bank of India (‘RBI’) from time to time, Accounting Standards notifi ed under section 133 of the Companies Act 2013, read together with paragraph 7 of the Companies (Accounts) Rule, 2014, Companies (Accounting Standards) Amended Rules 2016, to the extent applicable and current practices prevailing within the banking industry in India. The accounting policies have been consistently applied by the Bank.
3. Use of EstimatesThe preparation of the fi nancial statements, in conformity with generally applicable accepted accounting principles, requires management to make estimates and assumptions that affect the reported amount of assets, liabilities, revenues and expenses and disclosure of contingent liabilities as at the date of the fi nancial statements. Actual results could differ from those estimates. Management believes that the estimates used in the preparation of the fi nancial statements are prudent and reasonable. Any revision to the accounting estimates is recognized prospectively in the current and future periods.
4. Investment The classifi cation, recognition and disclosure of the investments will be in accordance with management’s policies and relevant prudential norms prescribed by RBI.Investments are categorized as “Held to Maturity” (HTM), “Held for Trading” (HFT), “Available for Sale” (AFS) in accordance with RBI guidelines based on intent at the time of acquisition. However, for disclosure in balance sheet, these are classifi ed as government security, other approved security, shares, debentures and bonds, investment in subsidiaries/joint venture and other investment. These are valued in accordance with RBI guidelines.Investment classifi ed as HFT are marked to market on daily basis and under AFS at monthly interval. The net depreciation, if any, in each classifi cation is recognized in the profi t and loss account. Net appreciation if any, is ignored. Treasury bills being discounted instruments are valued at carrying cost. Transfer of investments between the categories is accounted in accordance with the RBI guidelines. Profi t or loss on the sale/redemption of such investments is included in the profi t and loss account.
5. AdvancesAdvances are classifi ed as per prudential norms on “Income Recognition and Asset Classifi cation and provisions are pertaining to Advances” as issued by RBI, into performing and non-performing assets and are stated net of specifi c provisions.
6. Transaction Involving Foreign ExchangeTransactions denominated in foreign currencies are recorded at the rates prevailing on the date of the transactions.Monetary assets and liabilities denominated in foreign currencies are restated, as at the balance sheet date, at the closing rates notifi ed by Foreign Exchange Dealers Association of India (‘FEDAI’) and resultant exchange differences are recognized in the profi t and loss account. Contingent liability denominated in foreign currency is disclosed in balance sheet at the rates notifi ed by FEDAI.Exchange differences arising on settlement of foreign currency transactions settled during the period are recognized in the profi t and loss account of the period.
7. Revenue Recognitioni. Revenue is recognized to the extent that it is probable that the economic benefi t will fl ow to the bank and the revenue can be reliably measured.ii. Interest income is recognized in the profi t and loss account on an accrual basis, except in the case of interest on Non-performing assets, which
is recognized in the profi t and loss account on receipt basis as per the income recognition and assets classifi cation norms of RBI.iii. The bank recognized commission on guarantee over the period of the facility.iv. All other fees and charges are recognized as and when services are rendered by the bank.
8. Employee Benefi ts a) Gratuity Gratuity, which is a defi ned benefi t scheme, is provided for based on an actuarial valuation done by an independent actuary as at the year-end,
using the projected unit credit method. Actuarial gains/losses are taken to the profi t and loss account.b) Compensated Absences Employees are not entitled to encashment of sick leave and casual leave or carry forward the same. Privilege leave, which is cashable, is settled
at the calendar year end. Provision for the three months from January to March is made based on internal policy of the bank.c) Provident Fund The bank contributes an amount equal to the employee’s contribution on a monthly basis to the Regional Provident Fund Commissioner (RPFC).
The Bank has no liability for the future provident fund benefi ts apart from its monthly contribution which is charged to the Profi t & loss Account. 9. Fixed Assets and Depreciation
Fixed assets are stated at acquisition cost less accumulated depreciation less impairment provision. Cost comprises the purchase price and any attributable cost of bringing the assets to its working condition for its intended use. Depreciation is provided on a straight-line basis over the estimated useful life of the asset as per the Straight Line method at the rates specifi ed in the Schedule II of the Companies Act, 2013 except for:
o Computer systems, which are being depreciated on straight-line basis at the rate of 33.33 per cent as per RBI guidelines. o Items (including computer systems), the purchase value of which is up to Rs. 40,000 are fully depreciated in the year of purchase itself. There is no change in the depreciation rates as compared to previous year.10. Accounting for leases
Leases where the lessor effectively retains substantially all the risk and benefi t of the ownership of the leased item are classifi ed as operating leases. Operating leases payments are recognized in the profi t and loss account on a straight-line basis over the lease term.
Schedule 18Signifi cant Accounting Policies and notes to accounts forming part of the accounts for the year ended March 31, 2020.
ECO
NOM
IC &
PO
LITI
CAL
WEE
KLY

(Incorporated in Korea, With Limited Liability)
Published on Saturday, JUNE 27, 2020 vol lV nos 26 & 27 EPW Economic & Political Weekly192
11. Taxes on IncomeTax expense comprises of current and deferred taxes. Current income tax is measured at the amount expected to be paid to the tax authorized in accordance with the Income-tax act, 1961.Deferred income taxes refl ected the impact of the current year timing differences between taxable income and accounting income for the year and reversal of timing difference of earlier years.Deferred tax is measured based on the tax rates and the tax laws enacted or substantially enacted at the balance sheet date. In situations where the bank has unabsorbed depreciation and carry forward tax losses, deferred tax assets are recognized only if there is virtual certainty supported by convincing evidence that unabsorbed depreciation or carry forward tax losses can be realized against future taxable profi ts.At each balance sheet date, the bank re-assesses unrecognized deferred tax assets. It recognizes unrecognized deferred tax assets to the extent that it has become reasonably certain, as the case may be, that suffi cient future taxable income will be available against which such deferred tax assets can be realized.
12. Net Profi tThe Net Profi t/Loss disclosed in the Profi t and Loss account is after considering:
a) Provision for taxes on income in accordance with statutory requirements. b) Provision for non-performing advances. c) Provision for depreciation on investments. d) Other usual and necessary provisions and contingencies.
13. Provisiona) Provisions for non-performing assets are made in accordance with the prudential norms on “Income recognition and asset classifi cation and
provisioning pertain to advances” as issued by RBI.b) Provision on standard assets is made in line with the existing RBI guidelines and included in Schedule 5 (“Other liabilities and provisions)”.c) The bank assesses the unhedged foreign currency exposure (UFCE) of corporate customers and adequate provisions are maintained as required
by RBI guidelines. These provisions are part of standard asset provision mentioned above.
14. Provision, contingent liabilities and contingent assetsProvisions are recognized in terms of Accounting Standard-29 on “Provisions, Contingent Liabilities and Contingent Assets” issued by the ICAI, when there is a present legal or statutory obligation as a result of past events leading to probable outfl ow of resources, where a reliable estimate can be made to settle the same. Provisions are not discounted to its present value and are determined based on best estimate required to settle the obligation at the balance sheet date. Provisions are to be reviewed at each balance sheet date and adjusted to refl ect the current best estimate. If it is no longer probable that an outfl ow of resources would be required to settle the obligation, the provision is reversed.Contingent Liabilities are recognized only when there is a possible obligation arising from past events due to occurrence or non-occurrence of one or more uncertain future events, not wholly within the control of the Bank, or where obligation cannot be measured in terms of future outfl ow of resources, or where a reliable estimate of the obligation cannot be made. Obligations are assessed on an ongoing basis and only those having a largely probable outfl ow of resources are provided for.Contingent Assets are not recognized in the fi nancial statements. However, contingent assets are assessed continually and if it is virtually certain that an infl ow of economic benefi ts will arise, the asset and related income are recognized in the period in which the change occurs.
15. Impairment of assetsThe carrying amount of assets is reviewed at each balance sheet date, if there is any indication of impairment based on internal or external factors. An impairment loss is recognized whenever the carrying amount of an asset exceeds its recoverable amount. The recoverable amount is the greater of the assets net selling price and value in use. In assessing value in use, the estimated future cash fl ows are discounted to their present value using pre-tax discount rate that refl ects current market assessment of the time value of money and risk specifi ed to the assets.
16. Cash and Cash equivalentsCash and cash equivalent for the purpose of cash fl ow statements comprise of cash in hand, balance with RBI, balance with other banks and money at call and short notice.
17. Cash fl ows statementCash fl ows are reported using indirect method, whereby profi t/(loss) before tax is adjusted for the effect of transaction of non-cash nature and any deferrals of accruals of past or future cash receipts and payments. The cash fl ows from operating, investing, fi nancing activities of the bank are segregated based on the available information.
18. Others Expenses incurred on stationery and stamps are charged off to profi t and loss account at the time of purchase.
II NOTES TO FINANCIAL STATEMENTS Background and Key Notes
1. Kookmin Bank, incorporated in Seoul, Korea (hereinafter referred as ‘Kookmin Bank’) has started operations, as a representative offi ce at Mumbai vide Reserve Bank of India Approval letter No. DBOD.IBD.No.14085/23.13.157/2011-12 dated March 19, 2012.
2. Kookmin Bank has received an in-principle approval from Reserve bank for upgrading its representative offi ce into branch offi ce vide approval DBR.IBD.No.141/23.13.157/2018-19 dated July 5, 2018. Further, the Bank has received an approval from Reserve bank of India for opening the branch vide approval letter No. DBR.IBD.No. 3666/23.13.157/2018-19 dated October 31, 2018. Accordingly, India Representative offi ce of Kookmin bank was upgraded into a maiden branch at Unit No. 2B/2, 2nd Floor, Two Horizon Centre, Golf Course Road, DLF Phase 5, Sector 43, Gurugram 122002, Haryana, India. w.e.f. February 20, 2019.
3. The fi nancial statements of the Kookmin Bank Gurugram Branch (the Bank ) have been prepared and presented under the historical cost convention on the accrual basis of accounting, unless otherwise stated, and comply with generally accepted accounting principles, statutory requirements prescribed under the Banking Regulation Act, 1949, circulars and guidelines issued by the Reserve Bank of India (‘RBI’) from time to time, the Accounting Standards (‘AS’) issued by the Institute of Chartered Accountants of India (‘ICAI’) and notifi ed by Companies Accounting Standards Rules, 2014 to the extent applicable and current practices prevailing within the banking industry in India.
4. The fi nancial statements of the Kookmin Bank are for the year ended March 31, 2020. The comparative period for the previous fi nancial year is from February 20, 2019 to March 31, 2019 as the Bank has started the operations from February 20, 2019.
5. The Bank has initiated the process of getting itself notifi ed as a Scheduled Commercial Bank under the Reserve Bank of India Act, 1934 and this process was not completed as on March 31, 2019. Pending notifi cation by Reserve bank of India as a Scheduled Bank, the bank was carrying on the banking business as a Non-Scheduled bank. Further, Bank has been notifi ed as Scheduled Commercial Bank vide notifi cation dated June 6, 2019.
ECO
NOM
IC &
PO
LITI
CAL
WEE
KLY

(Incorporated in Korea, With Limited Liability)
Economic & Political Weekly EPW Published on Saturday, JUNE 27, 2020 vol lV nos 26 & 27 193
Other Notes as per Regulatory requirements1. Capital
Particulars As at March 31, 2020
As at March 31, 2019
(i) Common Equity Tier 1 Capital Ratio (%) 109.83% 456.57% (ii) Tier 1 Capital Ratio (%) 109.83% 456.57% (iii) Tier 2 Capital Ratio (%) 0.30% – (iv) Total Capital Ratio (CRAR) (%) 110.13% 456.57% (v) Percentage of the shareholding of the Government of
India in Nationalized Banks – –
(vi) Amount of Equity Capital Raised – – (vii) Amount of Additional Tier 1 capital raised; of which
PNCPS: Perpetual Non-Cumulative Preference Shares PDI: Perpetual Debt Instruments
– – –
(viii) Amount of Additional Tier 2 capital raised; of whichDebt Capital Instrument: Preference Share Capital Instruments: (Perpetual Cumulative Preference Shares (PCPS) / Redeemable Non-Cumulative Preference Shares (RNCPS) / Redeemable Cumulative Preference Shares (RCPS))
–
–
2. Investments
(1) Value of investments
(Amount in Rs. Crores)
As at March 31, 2020
As at March 31, 2019
(i) Gross Value of Investmentsa. In India 56.50 –b. Outside India – –
(ii) Provisions for Depreciationa. In India – –b. Outside India – –
(iii) Net Value of Investmentsa. In India 56.50 –b. Outside India – –
(2) Movement of provisions held towards depreciation on investments (Amount in Rs. Crores)
As at March 31, 2020
As at March 31, 2019
(i) Opening balance – –
(ii) Add: Provisions made during the year – –
(iii) Less: Write-off/write-back of excess provisionsduring the year
– –
(iv) Closing balance – –
2.1 Repo Transactions (in Face Value Terms)The bank has not undertaken any repo transactions or reverse repo transaction during the year ended March 31, 2020 and during the period ended March 31, 2019.
(Amount in Rs. Crores)
Particulars Minimum Outstanding
During the Year
Maximum Outstanding
During the Year
Daily Average Outstanding
During the Year
Outstanding as on March 31, 2020
Securities sold under the Repoi. Government Securitiesii. Corporate Debt Securities
– – – –
Securities purchased under Reverse Repoi. Government Securitiesii. Corporate Debt Securities
– – – –
Signifi cant Accounting Policies and Notes to Financial Statements for the year ended March 31, 2020. (Continued)
ECO
NOM
IC &
PO
LITI
CAL
WEE
KLY

(Incorporated in Korea, With Limited Liability)
Published on Saturday, JUNE 27, 2020 vol lV nos 26 & 27 EPW Economic & Political Weekly194
Signifi cant Accounting Policies and Notes to Financial Statements for the year ended March 31, 2020. (Continued)
2.2 Non-SLR Investment Portfolio i) Issuer composition of Non-SLR Investments
The bank did not have any non-SLR investments as at March 31, 2020 and as at March 31, 2019. (Amount in Rs. Crores)No. Issuer Amount Extent of
Private Placement
Extent of ‘Below
Investment Grade’
Securities
Extent of ‘Unrated’ Securities
Extent of ‘Unlisted’ Securities
(1) (2) (3) (4) (5) (6) (7) (i) PSUs – – – – – (ii) FIs – – – – – (iii) Banks – – – – – (iv) Private Corporate – – – – – (v) Subsidiaries/ Joint Ventures – – – – – (vi) Others – – – – – (vii) Provisions held towards Depreciation – – – – –
Total – – – – – ii) Non-Performing Non-SLR investments The bank did not have any Non-Performing Non-SLR investments as at March 31, 2020 and as at March 31, 2019.
(Amount in Rs. Crores)Particulars For the
year ended March 31, 2020
For the period ended
March 31, 2019Opening Balance – –Addition during the Year – –Reduction during the above period – –Closing Balance – –Total Provisions Held – –
2.3 Sale and transfers to/ from HTM Category There were no sale and transfer to/from HTM Category during the year ended March 31, 2020 and during the period ended March 31, 2019.3. Derivatives3.1 Forward Rate Agreements/Interest Rate Swap
The bank has not made any forward rate agreement/ interest rate swap during the year ended March 31, 2020 and during the period ended March 31, 2019.
S. no Items (Amount in Rs. Crores)
31.03.2020 31.03.2019
(i) The notional principal of swap agreements – – (ii) Losses which would be incurred if the counterparties failed to
fulfi ll their obligations under the agreements – –
(iii) Collateral required by the Bank upon entering into swaps – – (iv) Concentration of credit risk arising from the swaps – – (v) The fair value of the swap book – –
Nature and terms swap As the bank has not entered any forward rate agreement/ interest rate swap during the period, therefore, the disclosure is not applicable.
Items (Amount in Rs. Crores)OIS/IRS swaps –Inter Bank (back to back) –Swap done on behalf of customers (Back to back) –Total –
3.2 Exchange Traded Interest Rate DerivativesThe bank has no exchange traded interest rate derivative transactions to report during the year ended on March 31, 2020 and during the period ended March 31, 2019. (Amount in Rs. Crores)
S. No. Particulars As atMarch 31, 2020
As atMarch 31, 2019
(i) Notional principal amount of exchange traded interest rate derivatives Undertaken during the year (instrument-wise)
– – (ii) Notional principal amount of exchange traded interest rate derivatives
Outstanding as on March 31, 2020 (instrument-wise) – –
(iii) Notional principal amount of exchange traded interest rate derivatives Outstanding and not “highly effective” (instrument-wise)
– – (iv) Mark-to-market value of exchange traded interest rate derivatives
Outstanding and not “highly effective” (instrument-wise) – –
ECO
NOM
IC &
PO
LITI
CAL
WEE
KLY

(Incorporated in Korea, With Limited Liability)
Economic & Political Weekly EPW Published on Saturday, JUNE 27, 2020 vol lV nos 26 & 27 195
3.3 Disclosures on risk exposures in derivatives During the year ended 31st March 2020 and during the period ended March 31, 2019, there were no derivative transaction entered into by the bank. 4. Asset Quality4.1 Non-Performing Assets and its movement There are no ‘Non-Performing Assets’ (NPA) during the year ended March 31, 2020 and during the period ended March 31, 2019.
(Amount in Rs. Crores)Particulars As at
March 31, 2020As at
March 31, 2019 (i) Net NPAs to Net Advances (%) – –Movement Of NPAs (Gross) (a) Opening Balance – – (b) Additions During the Year – (c) Reductions During the year – – (d) Closing Balance – –Movement of Net NPAs (a) Opening Balance – – (b) Additions During the Year – (c) Reductions During the year – – (d) Closing Balance – –Movement of Provisions for NPAs (excluding provisions on Standard Assets) (a) Opening Balance – – (b) Provision made during the year – – (c) Write off/write back of excess provision – – (d) Closing Balance – –
4.2 Particulars of Accounts RestructuredNo standard assets/substandard assets were subject to restructuring during the year ended March 31, 2020 and during the period ended March 31, 2019.
4.3 Details of fi nancial assets sold to Securitization / Reconstruction Company for Asset ReconstructionNo fi nancial assets have been sold to securitization/Reconstruction Company for Asset Reconstruction during the year ended March 31, 2020 and during the period ended March 31, 2019.
(Amount in Rs. Crores)Particulars For the year ended
March 31, 2020For the period
ended March 31, 2019
(i) Number of accounts – –(ii) Aggregate value (net of provisions) of accounts sold to SC/RC – –(iii) Aggregate consideration – –(iv) Additional consideration realized in respect of accounts transferred in earlier years – –(v) Aggregate gain/loss over net book value – –
4.4 Details of Non-Performing Financial Asset purchased/soldA. Details of Non-Performing Financial Assets purchased:
The bank has not purchased or sold any no-performing fi nancial assets during the year ended March 31, 2020 and during the period ended March 31, 2019.
(Amount in Rs. Crores)Particulars For the
year ended March 31, 2020
For the period ended
March 31, 20191 (a) No of Accounts Purchased during the year – –
(b) Aggregate outstanding – –2 (a) Of these, numbers of Accounts restructured during the year – –
(b) Aggregate Outstanding – –
B. Details of Non-Performing Financial Assets sold: (Amount in Rs. Crores)
Particulars For the year ended
March 31, 2020
For the period ended
March 31, 20191 No. of Accounts sold – –2 Aggregate Outstanding – –3 Aggregate Consideration received – –
Signifi cant Accounting Policies and Notes to Financial Statements for the year ended March 31, 2020. (Continued)
ECO
NOM
IC &
PO
LITI
CAL
WEE
KLY

(Incorporated in Korea, With Limited Liability)
Published on Saturday, JUNE 27, 2020 vol lV nos 26 & 27 EPW Economic & Political Weekly196
4.5 Provisions on Standard Assets (Amount in Rs. Crores)
Particulars As at March 31, 2020
As at March 31, 2019
Provisions towards Standard Assets 0.98 –
5. Business RatiosItems As at
March 31, 2020As at
March 31, 2019 (i) Interest income as a percentage to working funds
(Not Annualized in Previous Period)5.96% 0.80%
(ii) Non-interest income as a percentage to working funds 0.06% 0.00% (iii) Operating profi t as a percentage to working funds
(Not Annualized in Previous Period)0.49% 0.09%
(iv) Return on Assets (Not Annualized in Previous Period) 0.04% 0.01% (v) Business (Deposits plus Advances) per employee (Rs. in thousands) 178,420 1,124 (vi) Profi t per employee (Rs. in thousands) 79 24
6. Asset Liability Management 2019-20 (Amount in Rs. Crores)
Particulars Day 1 2 to 7 days
8 to 14
Days
15 to 28 Days
29 Days to 3
Months
3 to 6 Months
6 Month to 1 Year
1 to 3 Year
3 to 5 Years
Above 5 Years
Total
Advances – – – – 68.00 – – 70.00 – – 138.00Investments – – 2.72 24.46 24.56 4.76 0.00 – – 56.50Deposits 0.77 1.00 10.08 32.59 226.05 1.72 0.24 17.75 – – 290.21Borrowings – – – – – – – – – – –Foreign Currency Assets
3.07 – – – – – – – – – 3.07
Foreign Currency Liabilities
– – – – – – – – – – –
2018-19 (Amount in Rs. Crores)Particulars Day 1 2 to 7
days8 to
14 Days
15 to 28 Days
29 Days to 3
Months
3 to 6 Months
6 Month to 1 Year
1 to 3 Year
3 to 5 Years
Above 5 Years
Total
Advances – – – – – – – – – – 0.00Investments – – – – – – – – – 0.00Deposits 0.06 – – – – – 0.02 2.17 – – 2.25Borrowings – – – – – – – – – – 0.00Foreign Currency Assets
– – – – – – – – – – 0.00
Foreign Currency Liabilities
– – – – – – – – – – 0.00
7. Exposures7.1 Exposure to Real Estate Sector The bank has exposure of Rs. 70 cr. in the Real estate sector backed by Stand by Letter of credit issued by the Bank.
(Amount in Rs. Crores)
Category As at 31.03.2020 As at 31.03.2019
a) Direct Exposure (i) Residential Mortgages – Lending fully secured by mortgages on
residential property that is or will be occupied by the borrower or that is rented
– –
(ii) Commercial Real Estate – Lending secured by mortgages on commercial real estate (including non-fund based limits) – –
(iii) Investments in Mortgage Backed Securities and other securitized exposures (a) Residential – – (b) Commercial Real Estate – –
b) Indirect ExposureFund based and non-fund based exposures on National Housing Bank and Housing Finance Companies. – –
Total Exposure to Real Estate Sector – –
Signifi cant Accounting Policies and Notes to Financial Statements for the year ended March 31, 2020. (Continued)
ECO
NOM
IC &
PO
LITI
CAL
WEE
KLY

(Incorporated in Korea, With Limited Liability)
Economic & Political Weekly EPW Published on Saturday, JUNE 27, 2020 vol lV nos 26 & 27 197
7.2 Exposures to Capital Market The bank has no exposure to the Capital Markets during the year ended March 31, 2020 and during the period ended March 31, 2019.
(Amount in Rs. Crores)
Item As at 31.03.2020 As at 31.03.2019 (i) Direct investment in equity shares, convertible bonds, convertible debentures
and units of equity-oriented mutual funds the corpus of which is not exclusively invested in corporate debt; Investments made in equity shares
– –
(ii) Advances against shares/bonds/debentures or other securities or on clean basis to individuals for investment in Shares (including IPOs/ESOPs), convertible bonds, convertible debentures, and units of equity-oriented mutual funds;
– –
(iii) Advances for any other purposes where shares or convertible bonds or convertible debentures or units of equity oriented mutual funds are taken as primary security;
– –
(iv) Advances for any other purposes to the extent secured by the collateral security of shares or convertible bonds or convertible debentures or units of equity oriented mutual funds i.e. where the primary security other than shares/convertible bonds/convertible debentures/units of equity oriented mutual funds does not fully cover the advances;
– –
(v) Secured and unsecured advances to stockbrokers and guarantees issued on behalf of stockbrokers and market makers;
– –
(vi) Loans sanctioned to corporate against the security of shares/bonds/debentures or other securities or on clean basis for meeting promoter’s contribution to the equity of new companies in anticipation of raising resources;
– –
(vii) Bridge loans to companies against expected equity fl ows/issues; – – (viii) Underwriting commitments taken up by the banks in respect of primary issue of
shares or convertible bonds or convertible debentures or units of equity oriented mutual funds;
– –
(ix) Financing to stockbrokers for margin trading; – – (x) All exposures to Venture Capital Funds (both registered and unregistered) will
be deemed to be on par with equity and hence will be reckoned for compliance with the capital market exposure ceilings (both direct and indirect)
– –
Total Exposure to Capital Market NIL NIL
7.3 Risk Category wise Country ExposureIn terms of RBI guidelines on Country Risk Management, since the net funded exposures in respect of any country (except home country i.e. India) is less than 2% of total assets, hence provision for country risk is not required.
(Amount in Rs. Crores)
Risk Category Exposure (net) as at March 31,2020
Provision held as at March 31,2020
Exposure (net) as at March 31,2019
Provision held as at March 31,2019
Insignifi cant – – – –Low – – – –Moderate – – – –High – – – –Very High – – – –Restricted – – – –Off-Credit – – – –Total – – – –
7.4 Details of Single Borrower Limit (SBL)/ Group Borrower Limit (GBL) exceeded by the Bank.RBI issued circular on “Large Exposure Framework” vide its circular no. DBR.No.BP.BC.43/21.01.003/2018-19 dated June 03, 2019 has prescribed the maximum exposure limit on consolidated and solo counter party basis. During the year, the bank has not exceeded the prescribed Single Borrower Limit (SBL) and Group Borrower Limit (GBL) during the year ended on March 31, 2020 and during the period ended March 31, 2019.
7.5 Unsecured Advances (Amount in Rs. Crores)
Item As at 31.03.2020 As at 31.03.2019 (i) Unsecured Advances for which intangible securities such as charge over the
rights, licenses, authority, etc. have been taken 70.00 –
(ii) Other Unsecured Advances 68.00 –
8. Disclosure of Penalties imposed by RBINo penalties have been imposed by the Reserve Bank of India under the provisions of section 46 (4) of the Banking Regulation Act, 1949 during the year ended March 31, 2020 and during the period ended March 31, 2019.
Signifi cant Accounting Policies and Notes to Financial Statements for the year ended March 31, 2020. (Continued)
ECO
NOM
IC &
PO
LITI
CAL
WEE
KLY

(Incorporated in Korea, With Limited Liability)
Published on Saturday, JUNE 27, 2020 vol lV nos 26 & 27 EPW Economic & Political Weekly198
Signifi cant Accounting Policies and Notes to Financial Statements for the year ended March 31, 2020. (Continued)
9. Disclosure Requirements as per applicable Accounting Standards
9.1 Accounting Standard 5 – Net Profi t or Loss for the period, prior period items and changes in accounting policies Unsecured Advances. (i) Prior Period Items: There are no material prior period items during the year. (ii) Change in Accounting Policy (AS-5): There is no change in accounting policy.
9.2 Accounting Standard 9 – Revenue Recognition (i) Interest income is recognized in the Profi t and Loss Account on an accrual basis. (ii) Commission on Bank Guarantee is recognized in the Profi t and Loss Account over the tenure of the guarantee provided to the customers. (iii) Loan processing fee is booked as upfront on the basis of due and realized in accordance with terms and conditions as provided in the
loan agreement.No unresolved signifi cant uncertainties have been identifi ed during the fi nancial year ended on March 31, 2020 and during the period ended March 31, 2019 for postponement of revenue recognition to future years.
9.3 Accounting Standard 15 – Employee Benefi ts 1) Provident Fund The Bank has contributed an amount of Rs. 0.16 Crores as employer’s contribution for the year ended on 31st March 2020 (Previous
period from 20th February to March 31, 2019 was Rs. 0.02 Crore). 2) Gratuity Gratuity is payable to eligible employees as per the bank’s Policy and Payment of Gratuity Act, 1972. The liability with respect to the
gratuity is determined based on an Actuarial valuation done by an independent actuary at the year end. The following table sets out the unfunded status of the gratuity plan and the amount recognized in the bank’s fi nancial statement
2.1 Table Showing Changes in Present Value of Obligations: (Amount in Rs.)
Period From: 01-04-2019 To: 31-03-2020
From: 20-02-2019 To: 31-03-2019
Present value of the obligation at the beginning of the period 1,34,779 –Interest cost 9,435 –Current service cost 3,61,329 –Past Service Cost – –Benefi ts paid (if any) – –Actuarial (gain)/loss 26,109 –Present value of the obligation at the end of the period 5,31,652 1,34,779
2.2 Key results (The amount to be recognized in the Balance Sheet): (Amount in Rs.)
Period As on: 31.03.2020 As on: 31.03.2019Present value of the obligation at the end of the period 5,31,652 1,34,779Fair value of plan assets at end of period – –Net liability/(asset) recognized in Balance Sheet and related analysis 5,31,652 1,34,779Funded Status - Surplus/ (Defi cit) (5,31,652) (1,34,779)
2.3 Summary of membership data at the date of valuation and statistics based thereon: (Amount in Rs.)
Period As on: 31.03.2020 As on: 31.03.2019
Number of employees 18 14Total monthly salary 10,70,581 8,53,313Average Past Service (Years) 1.1 0.4Average Future Service (yr) 22.4 21.4Average Age (Years) 35.6 36.6Weighted average duration (based on discounted cash fl ows) in years 17 15Average monthly salary 59,447 60,951
2.4 The assumptions employed for the calculations are tabulated:
Discount rate 7.00 % per annum 7.75 % per annumSalary Growth Rate 5.00 % per annum 5.00 % per annumMortality IALM 2012-14 IALM 2006-08 UltimateExpected rate of return – –Withdrawal rate (Per Annum) 5.00% p.a. 5.00% p.a.
ECO
NOM
IC &
PO
LITI
CAL
WEE
KLY

(Incorporated in Korea, With Limited Liability)
Economic & Political Weekly EPW Published on Saturday, JUNE 27, 2020 vol lV nos 26 & 27 199
2.5 Benefi ts valued: (Amount in Rs.)
Normal Retirement Age 58 Years 58 YearsSalary Last drawn qualifying
salaryLast drawn qualifying
salaryVesting Period 5 Years of service 5 Years of serviceBenefi ts on Normal Retirement 15/26 * Salary * Past
Service (yr) 15/26 * Salary * Past
Service (yr) Benefi t on early exit due to death and disability As above except that no
vesting conditions applyAs above except that no vesting conditions apply
Limit 20,00,000 20,00,000
2.6 Current Liability (*Expected payout in next year as per schedule III of the Companies Act, 2013): (Amount in Rs.)
Period As on: 31.03.2020 As on: 31.03.2019Current Liability (Short Term)* 1,552 428Non Current Liability (Long Term) 5,30,100 1,34,351Total Liability 5,31,652 1,34,779
2.7 Projection for next period: (Amount in Rs.)
Best estimate for contribution during next Period 4,67,821 – 2.8 Sensitivity Analysis: Signifi cant actuarial assumptions for the determination of the defi ned benefi t obligation are discount rate and
expected salary increase rate. Effect of change in mortality rate is negligible. Please note that the sensitivity analysis presented below may not be representative of the actual change in the defi ned benefi t obligation as it is unlikely that the change in assumption would occur in isolation of one another as some of the assumptions may be correlated. The results of sensitivity analysis are given below:Period As on: 31.03.2020 As on: 31.03.2019Defi ned Benefi t Obligation (Base) 5,31,652 @ Salary Increase Rate :
5%, and discount rate :7%1,34,779 @ Salary Increase Rate :
5%, and discount rate :7.75%Liability with x% increase in Discount Rate 4,84,038; x=1.00% [Change (9)% ] 1,23,795; x=1.00% [Change (8)% ]Liability with x% decrease in Discount Rate 5,87,061; x=1.00% [Change 10% ] 1,47,334; x=1.00% [Change 9% ]Liability with x% increase in Salary Growth Rate 5,87,628; x=1.00% [Change 11% ] 1,47,550; x=1.00% [Change 9% ]Liability with x% decrease in Salary Growth Rate 4,82,748; x=1.00% [Change (9)% ] 1,23,426; x=1.00% [Change (8)% ]Liability with x% increase in withdrawal Rate 5,21,010; x=1.00% [Change (2)% ] 1,31,461; x=1.00% [Change (2)% ]Liability with x% decrease in withdrawal Rate 5,41,086; x=1.00% [Change 2% ] 1,37,799; x=1.00% [Change 2% ]
2.9 Reconciliation of liability in balance sheet (Amount in Rs.)
Period From: 01.04.2019 To: 31.03.2020Opening gross defi ned benefi t liability/ (asset) 1,34,779Expenses to be recognized in P&L 3,96,873Benefi ts paid (if any) –Closing gross defi ned benefi t liability/ (asset) 5,31,652
3) Compensated absences The bank has made a provision of Rs. 0.03 crores for leave encashment in the current year ended on March 31, 2020 (Previous period
fi gure was Rs. 0.03 crores in respect of provision for leave encashment for the period ended March 31, 2019).
9.4 Accounting Standard 17 – Segment Reporting A. Primary (Business Segment) The Following are the Primary segments of the Bank: – Treasury – Corporate/ Wholesale Banking – Other Banking Operations
The present accounting and information system of the bank does not capture and allow extraction of the data in respect of the above segments separately. However, based on the present internal, organizational and management reporting structure and the nature of their risk and returns, the data on the primary segments have been computed as under:
a) Treasury- The Treasury segments includes the entire investment portfolio and trading in foreign exchange contracts and derivative Contracts. The Revenue of the treasury segment primary consists of fees and gains or losses from trading operations and interest income on investment portfolio and Fixed Deposits placed with Other Banks.
b) Corporate/Wholesale Banking- The Corporate/ Wholesale Banking segment comprises of the lending activities of the corporate accounts group.
c) Other Banking business- Segment not classifi ed under (a) and (b)are classifi ed under this primary segment.
Signifi cant Accounting Policies and Notes to Financial Statements for the year ended March 31, 2020. (Continued)
ECO
NOM
IC &
PO
LITI
CAL
WEE
KLY

(Incorporated in Korea, With Limited Liability)
Published on Saturday, JUNE 27, 2020 vol lV nos 26 & 27 EPW Economic & Political Weekly200
Signifi cant Accounting Policies and Notes to Financial Statements for the year ended March 31, 2020. (Continued)
B. Secondary (Geographical Segment) i) Domestic Operations- Branches/ Offi ces having operation in India ii) Foreign Operations- Branches/ Offi ces having operation outside IndiaC. Allocation of Expenses, Assets and Liabilities Expenses are allocated on the basis of the ratio of number of employees in each segment.
Part A: Business Segments (Amount in Rs. Crores)
Business Segments TREASURY COPORATE/WHOLESALE BANKING
OPERATIONS
OTHER BANKING
TOTAL
Particulars Current Year
Previous Year
Current Year
Previous Year
Current Year
Previous Year
Current Year
Previous Year
Revenue 24.77 – 1.67 – 0.15 – 26.60 –Less :Inter segment – – – – – – – –Net revenue 24.77 – 1.67 – 0.15 – 26.60 –Result 18.82 – (2.60) – 0.15 – 16.38 –Unallocated expenses 14.68 –Operating profi t 1.70 –Income taxes 1.51 –Extra ordinary profi t or loss – – – – – – – –Net profi t - 0.19 –Other information:Segment assets 483.90 – 138.00 – 12.51 – 634.41 –Unallocated assets 18.02 –Total assets 652.43 –Segment liabilities 290.21 – 0.98 – – – 291.18 –Unallocated liabilities 361.25 –Total liabilities 652.43 –
Part B: Geographic SegmentsDomestic International Total
31.03.2020 31.03.2019 31.03.2020 31.03.2019 31.03.2020 31.03.2019Revenue 26.60 – – – 26.60 –Assets 652.43 – – – 652.43 –
Corresponding previous year fi gures have not been provided because the bank had a single reportable segment which had similar risk and return for the purpose of AS-17.
9.5 Accounting Standard 18 – Related Party DisclosuresIn terms of Accounting Standard 18 (‘AS-18’) on ‘Related Party Disclosures’ notifi ed under the companies (Accounting Standards) Rules, 2006 and the related guidelines issued by RBI, the Related parties are identifi ed by the management and relied upon by the auditors.
Details pertaining to related parties are as under: (i) Related Party relationships:
S. No. Relationship Party Name1 Head Offi ce Kookmin Bank, Seoul, Korea and its Branches 2 Key Management Personnel IL Hwang, Chief Executive Offi cer
Hyung Soo Byun, Interim Chief Executive Offi cer (From January 30, 2020 to April 19, 2020)Chief Executive Offi cer w.e.f. April 20, 2020.
(ii) The details of the related party relationship/ fi nancial dealings of the bank with the above related parties as defi ned under AS-18 are as follows:
(Amount in Rs. crore)Nature of Transactions For the year ended
March 31, 2020For the period ended
March 31, 2019Infl ow of Capital from Head offi ce, Kookmin Bank, Seoul, Korea – 355.86Salary paid to Mr. IL Hwang -CEO 1.60 0.25Salary paid to Mr. Hyun Soo Byun- CEO 0.36 –Interest received on Nostro balance from Head Offi ce 0.02 –Reimbursement of Expenses 0.17 –Standby Letter of Credit received from Kookmin Seoul Branch for Guarantee issued by Bank
1.14 –
ECO
NOM
IC &
PO
LITI
CAL
WEE
KLY

(Incorporated in Korea, With Limited Liability)
Economic & Political Weekly EPW Published on Saturday, JUNE 27, 2020 vol lV nos 26 & 27 201
9.6 Accounting Standard 19- LeasesThe Lease agreements entered into by the bank pertains to use of premises of the bank. The Lease agreements do not have any undue restrictive or onerous clauses other than those normally prevalent in similar agreement regarding use of assets, lease escalation, renewals and a restriction on sub-leases.Details of future minimum lease payments under non –cancellable operating leases are given below;
(Amount in Rs. crore)S.No Period As at 31st March 2020 As at 31st March 20191 Not later than 1 year 2.62 -2 Later than 1 year and not later than 5 years 12.17 -3 Later than 5 years 12.15 -
9.7 Accounting Standard 20 – “Earning per share”Being a branch of a Foreign Bank, the capital of the bank comprises of interest free funds received from its head offi ce and as such does not have share capital. Hence, the computation of Earnings per share is not applicable. Accordingly, the disclosure as required by AS-20 ‘Earning per Share’ is not applicable in case of the bank.
9.8 Accounting Standard 22 – Accounting for Taxes Deferred tax assets and liabilities are recognised on a prudent basis for the future tax consequences of timing differences arising between the carrying values of assets and liabilities and their respective tax basis, and carry forward losses. Deferred tax assets and liabilities are measured using tax rates and tax laws that have been enacted or substantially enacted prior to the balance sheet date. The impact of changes in the deferred tax assets and liabilities is recognised in the profi t and loss account.The major composition of Deferred tax assets and deferred tax liabilities is as under:
(Amount in Rs. crore)
Particulars 31.03.2020 DTA/(DTL) 31.03.2019 DTA/(DTL)Depreciation (0.27) (0.15)Provision for Gratuity 0.01 0.01Provision for Leave Encashment 0.02 0.01Provision for Bonus 0.02 0.01Provision for Standard Assets (Loans & bank guarantee) 0.41 –Other Provisions and contingencies 0.20 –Deferred Tax Asset/(liability) as shown in Balance Sheet 0.39 (0.12)
9.9 Accounting Standard 23 (Accounting for Investment in Associates in Consolidated Financial Statements): Not Applicable 9.10 Accounting Standard 24 (Discontinuing Operations): Not applicable 9.11 Accounting Standard 25: (Interim Financial statements): Not Applicable 9.12 Accounting Standard 28: (Impairment of Assets): Not Applicable
10. Additional Disclosures10.1 Provisions and Contingencies
(Amount in Rs. crore) Break-up of Provisions & Contingencies shown under the head Expenditure in Profi t & Loss A/c
As at31.03.2020
As at31.03.2019
Provision for depreciation on investments – –Provision towards NPA – –Provision towards Standard Assets 0.98 –Provision made towards income tax (including deferred taxes) 1.00 0.25Provision for Country Risk – –Total 1.98 0.25
10.2 Floating Provisions The bank has not made any fl oating provisions during the period ended March 31, 2020.
Particulars As at March 31, 2020
As at March 31, 2019
(a) Opening Balance in the Floating Provisions Account NIL NIL(b) The Quantum of fl oating provisions made in the Accounting Year NIL NIL(c) Amount of draw down made during the Accounting Year NIL NIL(d) Closing Balance in the Floating Provisions Account NIL NIL
10.3 Draw Down from Reserves There was no drawdown from Reserves to report for the year ended March 31, 2020 and for the period ended March 31, 2019.
10.4 Disclosure of Complaints- Customer Complaints & Awards passed by the banking OmbudsmanThere have been no customer complaints during the year ended March 31, 2020 and during the period ended March 31, 2019. Further, there have been no awards passed by the Banking Ombudsman during the above-mentioned period.
Signifi cant Accounting Policies and Notes to Financial Statements for the year ended March 31, 2020. (Continued)
ECO
NOM
IC &
PO
LITI
CAL
WEE
KLY

(Incorporated in Korea, With Limited Liability)
Published on Saturday, JUNE 27, 2020 vol lV nos 26 & 27 EPW Economic & Political Weekly202
A. Customer Complaints
S. No. Particulars As at March 31, 2020
As at March 31, 2019
(a) No. of complaints pending at the beginning of the year Nil Nil (b) No. of complaints received during the year Nil Nil (c) No. of complaints redressed during the year Nil Nil (d) No. of complaints pending at the end of the year Nil Nil
B. Awards passed by the Banking Ombudsman
S. No. Particulars As at March 31, 2020
As at March 31, 2019
(a) No. of unimplemented awards at the beginning of the year Nil Nil (b) No. of awards passed by the Banking Ombudsmen during the year Nil Nil (c) No. of awards implemented during the year Nil Nil (d) No. of unimplemented awards at the end of the year Nil Nil
10.5 Letter of Comfort (LoCs)No Letter of Comfort was issued by the bank during the year ended March 31, 2020 and during the period ended March 31, 2019 & the Outstanding Letter of Comfort as on March 31, 2020 was Nil.
10.6 Provisioning Coverage Ratio (PCR)Since the bank has no NPA exposure as on March 31, 2020 and as on March 31, 2019, hence this disclosure is not applicable on bank.
10.7 Insurance BusinessBank does not handle insurance business. Therefore, the fees & remuneration received in respect of insurance Business for the year ended March 31, 2020 and for the period ended March 31, 2019 is Nil.
10.8 Concentration of Deposits, Advances, Exposures and NPAs
10.8.1 Concentration of Deposits (Amount in Rs. crores)
For the year ended March 31, 2020
For the period ended March 31, 2019
Total Deposits of twenty largest depositors 288.58 2.25Percentage of Deposits of twenty largest depositors to Total Deposits of the bank 99.44% 100%
10.8.2 Concentration of Advances (Amount in Rs. Crores)
Particulars As at March 31, 2020 As at March 31, 2019
Total Advances of twenty largest borrowers 138.00 NilPercentage of Advances of twenty largest borrowers to Total Advances of the bank
100% Nil
10.8.3 Concentration of Exposures (Amount in Rs. Crores)
Particulars As at March 31, 2020 As at March 31, 2019
Total Exposure of twenty largest borrowers/customers 138.00 NilPercentage of Exposures of twenty largest borrowers/customers to Total Exposures of the bank on borrows/customers
100% Nil
#for calculation of total exposure and top 20 exposures, balance with other banks have been excluded in above.
10.8.4 Concentration of NPA’s (Amount in Rs. Crores)
Particulars As at March 31, 2020 As at March 31, 2019
Total Advances to top four NPA accounts Nil Nil
Signifi cant Accounting Policies and Notes to Financial Statements for the year ended March 31, 2020. (Continued)
ECO
NOM
IC &
PO
LITI
CAL
WEE
KLY
(Incorporated in Korea, With Limited Liability)
Economic & Political Weekly EPW Published on Saturday, JUNE 27, 2020 vol lV nos 26 & 27 203
10.9 Sector wise Advances
Sector As at March 31, 2020 As at March 31, 2019
Gross Advances
Gross NPAs
% of gross NPAS to gross advances
in this sector
Gross Advances
Gross NPAs
% of gross NPAS to gross advances
in this sector A. Priority Sector1. Agriculture & allied activities – – – –2. Advances to industries sector
eligible as priority sector lending (MSME)
– – – –
3. Services – – – –4. Personal Loans – – – –Sub-total (A) – – – –
B. Non Priority Sector1. Agriculture & allied activities – – – –2. Industry 138.00 – – – a Real Estate 70.00 b Trading of Steel Items 68.003. Services – – – –4. Personal Loans – – – –Sub-total (B) 138.00 – – –
– – – –Total (A+B) 138.00 – – –
10.10 Movement of NPA’s (Amount in Rs. Crores)
Particulars For the year ended March 31, 2020
For the period ended March 31, 2019
Gross NPAs as on 1st April of particular year (Opening Balance) – –Additions (Fresh NPAs) during the year – –Sub-total (A) – –
Less:- (i) Up gradations – – (ii) Recoveries (excluding recoveries made from upgraded accounts) – – (iii) Write-offs – –Sub-total (B) – –Gross NPAs as on 31st March of following year (closing balance) (A-B) – –
10.11 Overseas Assets, NPA’s and Revenue Bank is not having any overseas assets and hence above disclosure is not applicable to us.
(Amount in Rs. Crores)
Particulars For the year ended March 31, 2020
For the period ended March 31, 2019
Total Assets – –Total NPAs – –Total Revenue – –
10.12 Off balance Sheet SPV’s Sponsored- Rs Nil
10.13 Unamortized Pension and Gratuity liabilities- Rs Nil
10.14 Disclosure on RemunerationThe Banks compensation policy including that of CEO’s, is in conformity with Financial Stability Board principles and standards. In accordance with the requirements of RBI circular no. DBOD No. BC.72/229.67/001/2011-12 dated January 13, 2012; the bank has submitted a declaration to RBI regarding confi rmation of the above matter.
Signifi cant Accounting Policies and Notes to Financial Statements for the year ended March 31, 2020. (Continued)
ECO
NOM
IC &
PO
LITI
CAL
WEE
KLY

(Incorporated in Korea, With Limited Liability)
Published on Saturday, JUNE 27, 2020 vol lV nos 26 & 27 EPW Economic & Political Weekly204
10.15 Disclosure relating to SecuritizationThere is no securitization transaction during the year ended March 31, 2020 and during the period ended March 31, 2019. Hence, this disclosure is not applicable.
S.No. Particulars
1. No. of SPVs sponsored by the bank for securitization transactions NIL2. Total amount of securitized assets as per books of the SPVs sponsored by the bank NIL3. Total amount of exposures retained by the bank to comply with MRR as on the date of
balance sheet (a) Off-balance sheet exposures First loss Others (b) On-balance sheet exposures First loss Others
NILNILNILNIL
4. Amount of exposures to securitization transactions other than MMR (a) Off-balance sheet exposures (i) Exposure to own securitization First loss Others (ii) Exposure to third party securitization First loss Others (b) On-balance sheet exposures (i) Exposure to own securitization First loss Others (ii) Exposure to third party securitization First loss Others
NILNILNILNILNILNILNILNIL
10.16 Credit Default Swaps The bank has not entered into any credit default swaps during the year ended March 31, 2020 and during the period ended March 31, 2019.10.17 Intra group Exposures Bank has no intra group exposure during the year ended March 31, 2020 and during the period ended March 31, 2019.10.18 Transfers to Depositors Education and Awareness Fund (DEAF) The bank has not transferred any fund to Depositors Education and Awareness Fund (DEAF) (Amount in Rs. Crores)
Particulars For the Year ended March 31, 2020
For the period ended March 31, 2019
Opening balance of amounts transferred to DEAF – –Add : Amounts transferred to DEAF during the year – –Less : Amounts reimbursed by DEAF towards claims – –Closing balance of amounts transferred to DEAF – –
10.19 Unhedged foreign currency exposureIn view of the impact of exchange rates on fi nancial profi le/debt servicing ability of borrowers, it has become imperative to assess borrower’s susceptibility to adverse exchange rate movements to price in the associated risk and manage exposure to these counterparts. Reserve Bank of India (RBI) has introduced requirements w.r.t. additional capital and provisioning for exposure to entities with Unhedged Foreign Currency Exposures (UFCE). Bank has internal policy for assessment of such additional capital and provisions. The process for computation of additional capital and provisions is being followed as per RBI guidelines.In accordance with the RBI’s Circular DBOD No. BP.BC.85/21.06.200/2013-14 dated January 15, 2014 effective April 1, 2014, the bank is not required to create any provision against the unhedged foreign currency exposures (UFCE) of its borrowers as at March 31, 2020.
11. Other Expenditure-Operating Expenses Expenditure exceeding 1% of the total revenue included in other expenditure in Schedule 16 are as below:
Nature of Expense Amount in Rs.
Professional fees- Consultants 36,98,987Car hire charges 38,13,293
12. Liquidity Coverage Ratio (LCR)Qualitative Disclosure-Reserve Bank of India has issued Basel III framework on Liquidity Coverage Ratio (LCR) on June 09, 2014. The standards include guidelines on minimum liquidity coverage ratio (LCR), liquidity risk monitoring tools and LCR disclosure standards. LCR is designed to address short-term liquidity risk by ensuring banks hold suffi cient cash and other liquid assets to meet obligations in a 30-day market stress scenarios. The requirement creates a credit positive incentive for banks to focus on growing their retail deposits and reducing reliance on short term wholesale funding.
Signifi cant Accounting Policies and Notes to Financial Statements for the year ended March 31, 2020. (Continued)
ECO
NOM
IC &
PO
LITI
CAL
WEE
KLY

(Incorporated in Korea, With Limited Liability)
Economic & Political Weekly EPW Published on Saturday, JUNE 27, 2020 vol lV nos 26 & 27 205
Liquidity Coverage Ratio (LCR) related information for the quarter ending March 31, 2020 is given as under: (Amount in Rs. Crore)
Particulars 2019-20 2018-19Total
Unweighted value
Total weighted
value
Total Unweighted
value
Total weighted
valueHigh Quality Liquid Assets1. Total high quality liquid assets (HQLA) 11.51 11.51 0.25 0.25Cash outfl ows2. Retail deposits and deposits from small business
customers, of which6.09 0.61 2.24 0.22
(i) Stable deposits - - 0.06 - (ii) Less stable deposits 6.09 0.61 2.19 0.223. Unsecured wholesale funding, of which 46.11 4.61 - - (i) Operational deposits (all counterparties) - - - - (ii) Non-operational deposits (all counterparties) 46.11 4.61 - - (iii) Unsecured debt - - - -4. Secured Wholesale funding - - - -5. Additional requirement, of which 0.44 0.44 (i) Outfl ows related to derivative exposures
and other collateral requirements- - - -
(ii) Outfl ows related to derivative exposures and other collateral requirements
- - - -
(iii) Credit and liquidity facilities - - - -6. Other contractual funding obligations - - - -7. Other contingent funding obligations - - 0.44 0.448. Total cash outfl ows 52.20 5.22 2.69 0.66Cash Infl ows - -9. Secured lending - - - -10. Infl ows from fully performing exposures - - - -11. Other cash infl ows 135.92 145.07 145.0712. Total Cash Infl ows 135.92 145.07 145.07Total Adjusted Value - -13. TOTAL HQLA - 11.51 0.25 0.2514. Total net cash outfl ow - 1.31 0.67 0.1615. Liquidity coverage ratio (%) - 881.86% - 152.73%
13. Micro Small and Medium EnterprisesThere are no amounts that need to be disclosed pursuant to micro small and medium enterprise development act, 2006 (the ‘MSMED’) for the year ended 31st March 2020 and previous period ended on March 31, 2019.No supplier has intimated the bank about its status as micro small and medium enterprises or its registration with the appropriate authorities under MSMED.
14. Transfer PricingThe bank has a comprehensive system of maintenance of information and documents required by transfer pricing legislation under section 92-92F of income tax Act, 1961. The management is of the opinion that international transactions are at arm’s length so that the above legislation will not have material impact on the fi nancial statement, particularly on the amount of tax expense and that of provision of taxes.
15. Implementation of Indian accounting standard (IND AS)In January 2016, the Ministry of Corporate Affairs (MCA) issued the roadmap for the implementation of new Indian Accounting Standards (IND AS) for scheduled commercial banks, insurance companies and non –banking fi nancial companies (NBFC). The RBI has also issued a circular DBR.BP.BC.NO.76/21.001/2015-16 dated February 11, 2016 advising that the banks in India be required to implement IND AS from April 1, 2018. Subsequently, RBI in its press release issued on 5 April 2018 and vide notifi cation RBI/2018-2019/146 DBR.BP.BC.NO.29/21.07.001/2018-19 dated March 22, 2019 has deferred the applicability of IND AS for scheduled commercial banks.Based on RBI directions, the bank has submitted IND AS proforma based fi nancial statements to the RBI on quarterly basis.
16. Previous period fi gures have been regrouped and revised wherever considered necessary.
Signifi cant Accounting Policies and Notes to Financial Statements for the year ended March 31, 2020. (Continued)
For Surender Kr. Singhal & Co. For and on Behalf of Kookmin Bank Chartered Accountants (Gurugram Branch)Firm Registration No. 009156N
sd/- sd/-Pankaj Gupta Hyung Soo Byun(Partner) (Chief Executive Offi cer)Membership No. 501398
Place : New Delhi Place : GurugramDated : June 22, 2020 Dated : June 22, 2020
ECO
NOM
IC &
PO
LITI
CAL
WEE
KLY

(Incorporated in Korea, With Limited Liability)
Published on Saturday, JUNE 27, 2020 vol lV nos 26 & 27 EPW Economic & Political Weekly206
KOOKMIN BANK, GURUGRAM BRANCHDISCLOSURE UNDER PILLAR-3 OF BASEL-3, FOR THE YEAR ENDED MARCH 31, 2020
1. Scope of Application and capital adequacy
Table DF-1: Scope of Application Name of the head of the banking group to which the framework applies: Kookmin Bank Gurugram
(i) Qualitative Disclosures:
a) List of group entities considered for consolidation
The Bank is operating through single branch in India, hence there is no consolidation requirement applicable to bank for accounting and regulatory purposes.
b) List of group entities not considered for consolidation both under the accounting and regulatory scope of consolidation
Name of the entity / country of incorporation
Principle activity of the entity
Total balance sheet equity (as stated in the accounting balance sheet of the legal entity)
% of bank’s holding in the total equity
Regulatory treatment of bank’s investments in the capital instruments of the entity
Total balance sheet assets (as stated in the accounting balance sheet of the legal entity)
As on 31st March 2020, The bank has been operating through single branch in India, hence there are no group entities for group consolidation.
(ii) Quantitative Disclosures:
c) List of group entities considered for consolidation
Name of the entity / country of incorporation (as indicated in (i)a. above)
Principle activity of the entity
Total balance sheet equity (as stated in the accounting balance sheet of the legal entity)
Total balance sheet assets (as stated in the accounting balance sheet of the legal entity)
As on 31st March 2020, The bank has been operating through single branch in India, hence there are no group entities for group consolidation.
d) The aggregate amount of capital defi ciencies in all subsidiaries which are not included in the regulatory scope of consolidation i.e. that are deducted:
Name of the subsidiaries / country of incorporation
Principle activity of the entity
Total balance sheet equity (as stated in the accounting balance sheet of the legal entity)
% of bank’s holding in the total equity
Capital defi ciencies
Not applicable.
e) The aggregate amounts (e.g. current book value) of the bank’s total interests in insurance entities, which are risk-weighted:
Name of the insurance entities / country of incorporation
Principle activity of the entity
Total balance sheet equity (as stated in the accounting balance sheet of the legal entity)
% of bank’s holding in the total equity / proportion of voting power
Quantitative impact on regulatory capital of using risk weighting method versus using the full deduction method
f) Any restrictions or impediments on transfer of funds or regulatory capital within the banking group: NIL
Table DF-2: Capital Adequacy
(1) Qualitative disclosures
a. Banks’s approach to assessing the adequacy of its capital to support current and future activities.
The bank maintains a strong base of capital to comply with the local regulatory requirements and also to adequately support its current and future activities.
Capital requirements is assessed taking into account: business growth plans, capital fund available with bank after accounting for redeployment of projected internal accruals, minimum regulatory capital required, buffer above minimum capital required to take care of non-pillar risk, etc. The bank has adopted following approaches for the purpose of its capital adequacy assessment in line with the guidelines of Reserve Bank Of India.
Credit Risk: - Standardized Approach
Market Risk - Standardized Duration Approach
Operational Risk - Basic Indicator Approach
ECO
NOM
IC &
PO
LITI
CAL
WEE
KLY

(Incorporated in Korea, With Limited Liability)
Economic & Political Weekly EPW Published on Saturday, JUNE 27, 2020 vol lV nos 26 & 27 207
DISCLOSURE UNDER PILLAR-3 OF BASEL-3, FOR THE YEAR ENDED MARCH 31, 2020 (Continued)
2. Quantitative disclosures Capital requirement for credit, market and operational risks on March 31, 2020 is given below:
Risk area Rs. (in Crores)Credit Risk 300.20Capital required– for Portfolio subject to standardized approach 27.02– for securitization exposure –Market Risk (Standardized Duration Approach)Capital required– for interest rate risk –– for foreign exchange (including gold) risk –– for equity portion risk –Operational risk (Basic Indicator Approach) 23.90Capital required 2.15Minimum Capital requirement at 9% 29.17Minimum CRAR +CCB at 11.5% 37.27Total capital funds of the Bank 356.94Total risk weighted assets 324.10Capital adequacy ratio 110.13%
Risk Exposure & assessment General qualitative disclosure requirement: The bank has identifi ed following risks as material to its nature of operations:
Credit Risk (including credit concentration risk) Market Risk Liquidity Risk Interest rate Risk in the banking book Operational RiskThe risk management policies and procedures of the bank ensures that all type of risks are systematically identifi ed, measured, analysed and actively managed. Risk management is the responsibility of every member of the management as well as part of job of each staff members of the bank. Individual risk management efforts are coordinated and supervised by the CEO. The HO has responsibility for coordination of overall risk management with respect to business of bank. Risk Management Framework The risk management framework aims to integrate the sound principles of risk management system and practices into overall functioning of the bank. The bank has created in its organizational structure a Risk Management Council (RMC) to oversee and discharge effi ciently the risk management functions. The RMC is responsible for formulations of the policies and the procedures for the risk management of the branch, Supervision of the appropriateness of the execution of the risk management activities of the branch. Review of limit management as applicable to different types of risk to the Bank. The examination of the risk measurement results based on the process defi ned in the ‘Risk Management Guidelines of Gurugram Branch’. The activities of the asset-liability management (ALM), including the decision on the interest rates and others of the like. The Council will oversee the implementation of an effective process for managing the Branch’s interest rate, liquidity, and similar market risks relating to the Branch’s balance sheet and associated activities, including the adoption from time to time of policies, risk limits and capital levels and other matters related to the risk management which the Manager of the branch recognizes to be necessary. Credit Risk Credit risk is the risk of loss that may occur from the failure of any counterparty to abide by the terms and conditions of any fi nancial contract with the Bank, principally the failure to make required payments as per the terms and conditions of the contract.The Kookmin Bank Head Offi ce formulates policies rules and procedure for all branches worldwide. The branch has put in place credit policy for local operations in line with Kookmin bank HO guidelines as well as RBI Circulars, guidelines, notifi cations and directives. The credit policy stipulates guidelines for adherence to prudential limits as well as outlines RBI directives in the form of Master Circulars/Directions. The Credit policy for local operations is reviewed periodically to abide by the RBI directions. The Bank also has an independent committee for evaluation of credit proposals. Market Risk/ Liquidity Risk Liquidity risk is the risk that the bank is unable to meet its obligations when they fall due without adversely affecting its fi nancial condition. Liquidity is managed through the bank’s Liquidity policy, which is designed to maintain high quality liquid assets to protect against adverse funding conditions and to support day-to-day operations while maintaining a diversifi ed funding profi le.Operational riskOperational risk is the risk of loss resulting from inadequate or failed internal processes, people, systems and external events. The objective of operational risk management at the Bank is to manage and control operational risk in a cost effective manner within targeted levels as defi ned in the risk appetite. Operational Risk in the branch is managed through comprehensive HO rules and Kookmin Bank India internal policies and procedures to monitor transactions. The control framework is designed based on categorization of functions into operational department, treasury, back offi ce comprising Operations, Credit department, Trade Finance Department, Finance and Accounting Department and Human Resource and General Administration Department. The risk policy is applicable across all the functions in the branch ensuring a clear accountability and responsibility for management and mitigation of operational risk, developing a common understanding of operational risk and helping the business and operation groups to improve internal controls.
ECO
NOM
IC &
PO
LITI
CAL
WEE
KLY

(Incorporated in Korea, With Limited Liability)
Published on Saturday, JUNE 27, 2020 vol lV nos 26 & 27 EPW Economic & Political Weekly208
DISCLOSURE UNDER PILLAR-3 OF BASEL-3, FOR THE YEAR ENDED MARCH 31, 2020 (Continued)
Table DF-3: Credit Risk: General Disclosures for All BanksQualitative DisclosuresThe bank is following standardized approach and the bank has an internal credit rating system that facilitates decision making by taking into account quantitative and qualitative aspects of the proposal for credit facilities. All Credit risk related aspects are governed by “Risk Management Guidelines of Gurugram Branch”. The Guidelines outlines the type of products that can be offered, customer categories, target customer profi le, credit approval process and limits. Bank has got approved credit procedures from H.O. and a comprehensive Credit Policy for its Operations, which broadly takes care of RBI guidelines on Risk Management Systems. Bank undertakes the revision of the credit Guidelines in view of the guidelines issued by the Head Offi ce within the framework provided by RBI from time to time. Prudential exposure norms, industry exposure limits, loan review mechanism are some of the yardsticks used by the bank for overcoming credit risk. Loan loss provision is being monitored and provided for on a yearly basis.
Non Performing Assets Bank has adopted the defi nitions of ‘past due’ and ‘impaired’ (for accounting purposes) as defi ned by the regulatory authority for Income Recognition and Asset Classifi cation. An account becomes Non Performing Asset if it remains overdue for a period as defi ned by the Reserve Bank of India. An impaired asset is an asset which has suffered a provision in accordance with the guidelines defi ned by the Reserve Bank of India on its becoming a Non Performing Asset.Quantitative Disclosures1. The total gross credit risk exposures (March 31, 2020) i) Fund Based- INR 138.00 Crores (Previous period Nil) ii) Non Fund Based- INR 1.15 Crores (Previous period Nil) Fund based portfolio represents funded loans and advances Non fund portfolio is guarantee given on behalf of constituents
The geographic distribution of exposures (March 31, 2020) (Rs in Crores)Particulars March 2020 -Domestic March 2020- Overseas March 2020- Total Fund Based 138.00 – 138.00Non Fund Based 1.15 – 1.15Total 139.15 – 139.15
Industry-wise distribution of gross advances and NPA exposures - Fund-based (March 31, 2020) (Rs in Crores)INDUSTRY Gross Exposure Gross NPA Net NPA Standard AdvancesTextile – – – –Steel 68.00 NIL NIL 68.00Food and Beverages
– – – –
Real Estate 70.00 NIL NIL 70.00Others – – – –
2. The residual contractual maturity break-down of assets The maturity pattern of assets at March 31, 2020 is detailed in the table below. (Rs in Crores)
Particulars Day 1 2 to 7 days
8 to 14 days
15 to 28 days
29 days and
up to 3 months
Over 3 months
and upto 6
months
Over 6 months
and upto 1
year
Over 1 year
and upto 3 years
Over 3 years
and upto 5 years
Over 5 years
Total
Investments – – 2.72 – 24.46 24.56 4.76 – – – 56.50Loans and Advances
68.00 70.00 – – 138.00
Foreign Currency Assets
3.07 – – – – – – – – 3.07
*The aforesaid disclosure is in accordance with the revised maturity buckets as per the RBI circular no. DBOD.BP.BC no.22/21.04.018/2009-10 dated July 1, 2009.
3. Amount of non-performing loans (NPL’s) (March 31, 2020) (Rs. in Crores)
NPL Classifi cation Gross NPL’s Net NPL’sSub–standard – –Doubtful – –– Doubtful 1 – –– Doubtful 2 – –– Doubtful 3 – –Loss – –Total – –NPL ratio – –
ECO
NOM
IC &
PO
LITI
CAL
WEE
KLY

(Incorporated in Korea, With Limited Liability)
Economic & Political Weekly EPW Published on Saturday, JUNE 27, 2020 vol lV nos 26 & 27 209
4. Movement of NPA’s (Rs. in Crores)Particulars Gross NPA’s Net NPA’sOpening balance at March 31, 2019 – –Addition during the period – –Reduction during the period – –Closing balance at March 31, 2020 – –
5. Movement of Provision for NPA’s(Rs. in Crores)
Particulars Amount
Opening balance at March 31, 2019 –Provision made during the period –Write-off’s during the period –Write-back of excess provision during the period –Closing balance at March 31, 2020 –
6. Amount of non-performing investments (NPA’s) in securities, other government and other approved securities (Rs. in Crores)
Particulars Amount
Gross NPI’s at March 31, 2020 –Total provision held on NPI’s –Net NPI’s at March 31, 2020 –
7. Movement of provision for depreciation on investments (Rs. in Crores)
Particulars Amount
Opening balance at March 31, 2019 –Provision/ depreciation/ (appreciation) made during the year –(Write-off) / (write-back) of excess provision during the year –Closing balance at March 31, 2020 –
Table DF-4 - Credit Risk: Disclosures for Portfolios Subject to the Standardized ApproachQualitative DisclosuresBank has decided to use the ratings of the following domestic/international credit rating agencies for the Credit Exposure of Indian Operations, in line with RBI guidelines:Domestic(i) Credit Analysis and Research Ltd.(ii) CRISIL Ltd.(iii) FITCH India(iv) ICRA Ltd.International(i) Fitch(ii) Moody’s(iii) Standard & Poor’sQuantitative DisclosuresThe exposure amounts after risk mitigation (subject to the standardized approach) in different risk buckets are as under
(Rs. in Crores)
Exposure category Amount outstandingLess than 100% risk weight 496.60100% risk weight 6.57More than 100% risk weight 138.03Deducted from capital –Total 641.50
Table DF-5: Credit Risk Mitigation: Disclosures for Standardized Approaches Qualitative DisclosuresCollection of collateral and valuation of property, is being determined by the policies and procedures laid out by Head Offi ce.The collaterals commonly used by the bank for risk mitigation are fi nancial collaterals comprising of bank deposits and other categories comprising of movable and immovable assets/landed properties.Banks credit priorities are being determined by Head Offi ce taking Indian market realities and RBI Directives into consideration.
DISCLOSURE UNDER PILLAR-3 OF BASEL-3, FOR THE YEAR ENDED MARCH 31, 2020 (Continued)
ECO
NOM
IC &
PO
LITI
CAL
WEE
KLY

(Incorporated in Korea, With Limited Liability)
Published on Saturday, JUNE 27, 2020 vol lV nos 26 & 27 EPW Economic & Political Weekly210
Exposure limits to single and group borrowers/various industries are well defi ned and Industry review is being conducted for management review and risk mitigation. Funding strategies are in alignment with the Asset Liability Management position.
Table DF-6: Securitisation Exposures: Disclosure for Standardised ApproachQualitative DisclosuresBank does not have any securitization exposure.
Quantitative DisclosuresNot applicable
Table DF-7: Market Risk in Trading Book
Qualitative DisclosuresBank has adopted the Standardized Approach for computation of capital charge for market risk. The Forex transactions were not undertaken during the period ended March 31, 2020.
Quantitative DisclosureNot Applicable
Table DF-8: Operational Risk
Qualitative DisclosuresCapital charge for Operations Risk is computed as per the Basic Indicator Approach. The average of the gross income, as defi ned in the New Capital Adequacy Framework guidelines, for the current period is considered for computing the capital charge. The required capital is Rs. 2.15 Crores.
Table DF-9: Interest Rate Risk in the Banking Book (IRRBB)
Qualitative DisclosuresInterest rate risk in Banking Book refers to the risk of loss in earning or economic value of the Bank’s Banking Book as a consequences of movement in interest rates. Interest rate risk is managed through gap analysis and the same is being considered in the management of the Assets and Liabilities of the bank.
Quantitative DisclosureThere is no interest rate risk in the banking book of the bank as of March 31, 2020.
Table DF-10: General Disclosure for Exposures Related to Counterparty Credit Risk
Qualitative DisclosuresCounterparty Credit Risk (CCR) Limits for the banking counterparties are assessed by our HO based on an internal model that considers the parameters viz. credit rating and net worth of counterparties, net worth of the Bank and business requirements. Capital for CCR exposure is assessed based on Standardized Approach.
Quantitative DisclosuresThe Bank doesn’t recognize bilateral netting. The Credit Equivalent amounts of derivatives that are subject to risk weighting are calculated as per the Current Exposure Method. The balance outstanding for forward contracts is as follows:
(Rs in crores)Nature Notional amount Current ExposureForeign Exchange contracts Nil Nil
Table DF-11: Composition of Capital1. Common Equity Tier 1 and Total Capital ratios of the bank comprises:
Sr. No.
Tier-1 Capital elements Rs. (in Crores)
i Paid-up Share Capital (Capital received from Head Offi ce) 355.86ii Reserves (excluding revaluation reserves) 0.24iii Innovative Tier-1 Capital Instruments –iv Minority Interest –
Gross Tier-1 Capital 356.10Deductions:Investments in instruments eligible for regulatory capital of fi nancial subsidiaries / associates
v Other Eligible Deduction under CET 1 0.13vi Others-Losses carried forward –
Net Tier-1 Capital 355.97
DISCLOSURE UNDER PILLAR-3 OF BASEL-3, FOR THE YEAR ENDED MARCH 31, 2020 (Continued)
ECO
NOM
IC &
PO
LITI
CAL
WEE
KLY
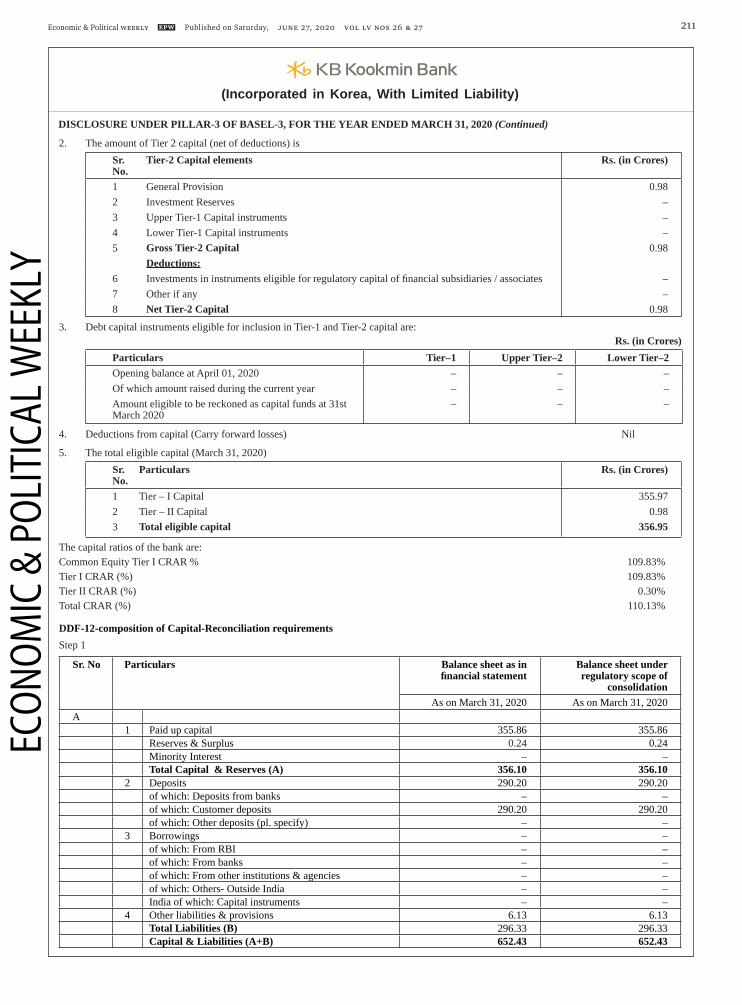
(Incorporated in Korea, With Limited Liability)
Economic & Political Weekly EPW Published on Saturday, JUNE 27, 2020 vol lV nos 26 & 27 211
2. The amount of Tier 2 capital (net of deductions) isSr. No.
Tier-2 Capital elements Rs. (in Crores)
1 General Provision 0.982 Investment Reserves –3 Upper Tier-1 Capital instruments –4 Lower Tier-1 Capital instruments –5 Gross Tier-2 Capital 0.98
Deductions:6 Investments in instruments eligible for regulatory capital of fi nancial subsidiaries / associates –7 Other if any –8 Net Tier-2 Capital 0.98
3. Debt capital instruments eligible for inclusion in Tier-1 and Tier-2 capital are:Rs. (in Crores)
Particulars Tier–1 Upper Tier–2 Lower Tier–2Opening balance at April 01, 2020 – – –Of which amount raised during the current year – – –Amount eligible to be reckoned as capital funds at 31st March 2020
– – –
4. Deductions from capital (Carry forward losses) Nil
5. The total eligible capital (March 31, 2020)Sr. No.
Particulars Rs. (in Crores)
1 Tier – I Capital 355.972 Tier – II Capital 0.983 Total eligible capital 356.95
The capital ratios of the bank are:Common Equity Tier I CRAR % 109.83%Tier I CRAR (%) 109.83%Tier II CRAR (%) 0.30%Total CRAR (%) 110.13%
DDF-12-composition of Capital-Reconciliation requirementsStep 1
Sr. No Particulars Balance sheet as in fi nancial statement
Balance sheet under regulatory scope of
consolidationAs on March 31, 2020 As on March 31, 2020
A1 Paid up capital 355.86 355.86
Reserves & Surplus 0.24 0.24Minority Interest – –Total Capital & Reserves (A) 356.10 356.10
2 Deposits 290.20 290.20of which: Deposits from banks – –of which: Customer deposits 290.20 290.20of which: Other deposits (pl. specify) – –
3 Borrowings – –of which: From RBI – –of which: From banks – –of which: From other institutions & agencies – –of which: Others- Outside India – –India of which: Capital instruments – –
4 Other liabilities & provisions 6.13 6.13Total Liabilities (B) 296.33 296.33Capital & Liabilities (A+B) 652.43 652.43
DISCLOSURE UNDER PILLAR-3 OF BASEL-3, FOR THE YEAR ENDED MARCH 31, 2020 (Continued)
ECO
NOM
IC &
PO
LITI
CAL
WEE
KLY

(Incorporated in Korea, With Limited Liability)
Published on Saturday, JUNE 27, 2020 vol lV nos 26 & 27 EPW Economic & Political Weekly212
DISCLOSURE UNDER PILLAR-3 OF BASEL-3, FOR THE YEAR ENDED MARCH 31, 2020 (Continued)
Sr. No Particulars Balance sheet as in fi nancial statement
Balance sheet under regulatory scope of
consolidationAs on March 31, 2020 As on March 31, 2020
B Assets1 Cash and balances with RBI 12.51 12.51
Balance with banks and money at call and short notice 422.16 422.162 Investments: 56.50 56.50
of which: Government securities 56.50 56.50of which: Other approved securities – –of which: Shares – –of which: Debentures & Bonds – –of which: Subsidiaries/Joint Ventures/Associates – –Associates of which: Others (Commercial Papers, Mutual Funds, PTCs etc.)
– –
3 Loans and advances 138.00 138.00of which: Loans and advances to banks – –of which: Loans and advances to customers 138.00 138.00
4 Fixed assets 11.07 11.075 Other assets 12.19 12.19
of which: Goodwill and intangible assets – –of which: Deferred tax assets 0.39 0.39
6 Goodwill on consolidation – –7 Debit balance in Profi t & Loss account – –
Total Assets 652.43 652.43
Step 2
Sr. No. Particulars Balance sheet as in fi nancial statements
Balance sheet under regulatory scope of
consolidation
Ref No.
As on March 31, 2020 As on March 31, 2020 Capital & Liabilities 1 Paid-up Capital 355.86 355.86 A
Of which amount eligible for CET-I 355.86 355.86 Of which amount eligible for AT-I – – Reserves & Surplus 0.24 0.24 BOf which Statutory Reserve 0.06 0.06 Of which Investment Fluctuation Reserve – – Of which balance in profi t & Loss A/c – – Minority Interest – – Total Capital 356.10 356.10
2 Deposits 290.20 290.20 of which: Deposits from banks – – of which: Customer deposits 290.20 290.20 of which: Other deposits – –
3 Borrowings – – of which: From RBI – – of which: From banks – – of which: From other institutions & agencies – – of which: Others (pl. specify) – – of which: Capital instruments – –
5 Other liabilities & provisions 6.13 6.13 Cof which: DTLs related to goodwill – – of which: DTLs related to intangible assets – – Total Liabilities 296.33 296.33
Total of capital and liabilities 652.43 652.43
ECO
NOM
IC &
PO
LITI
CAL
WEE
KLY

(Incorporated in Korea, With Limited Liability)
Economic & Political Weekly EPW Published on Saturday, JUNE 27, 2020 vol lV nos 26 & 27 213
Sr. No. Particulars Balance sheet as in fi nancial statements
Balance sheet under regulatory scope of
consolidation
Ref No.
As on March 31, 2020 As on March 31, 2020 Assets 1 Cash and balances with Reserve Bank of India 12.51 12.51
Balance with banks and money at call and short notice
422.16 422.16
2 Investments 56.50 56.50 of which: Government securities 56.50 56.50 of which: Other approved securities – – of which: Shares – – of which: Debentures & Bonds – – of which: Subsidiaries/Joint Ventures/Associates – – of which: Others (SIDBI, NABARD, NHB) – –
3 Loans and advances 138.00 138.00 of which: Loans and advances to banks – – of which: Loans and advances to customers 138.00 138.00
4 Fixed assets 11.07 11.07 5 Other assets 12.19 12.19
Out of which: Goodwill and other intangible assets
– –
Out of which: Deferred tax assets 0.39 0.39 6 Goodwill on consolidation – – 7 Debit balance in Profi t & Loss account – – Total Assets 652.43 652.43
Extract of Basel Ill common disclosure template (with added column) — Table DF-IIStep3Tier-I & Tier-2 Capital: Instruments and Provisions
Component of regulatory capital/amount reported
by bank
source based on reference numbers/letters of the balance
sheet under the regulatory scope of consolidation from step 2
1 directly issued qualifying common share (and equivalent for non-joint stock companies) capital plus related stock surplus
355.86 A
2 Retained earnings * 0.24 B3 Provisions (eligible for Tier-2 capital) 0.98 C
DF-13 - Main features of Regulatory Capital InstrumentsThe bank has not issued any Regulatory Capital Instruments forming part of Capital Funds. The Capital Funds of the bank mainly consist of interest free funds received from Head Offi ce, Reserves & Surplus and General Provisions on Standard Assets.
DF-14 - Full Terms & Conditions of Regulatory Capital InstrumentsThe bank has not issued any Regulatory Capital Instruments forming part of Capital Funds. The Capital Funds of the bank mainly consist of interest free funds received from Head Offi ce, Reserves & Surplus and General Provisions on Standard Assets.
DF-15 - Disclosure Requirements for RemunerationIn accordance with the requirements of the RBI circular DBOD No BC. 72/29.67.001/2011-12 dated 13 January 2012; the Bank has a letter from its head offi ce, which states that the compensation policies in India, including that for the CEO, are in line with the FSB requirement.
For and on Behalf of Kookmin Bank(Gurugram Branch)
sd/Hyung Soo ByunChief Executive Offi cer
GurugramJune 22, 2020
DISCLOSURE UNDER PILLAR-3 OF BASEL-3, FOR THE YEAR ENDED MARCH 31, 2020 (Continued)
ECO
NOM
IC &
PO
LITI
CAL
WEE
KLY

SOCIETE GENERALE(Incorporated in France as a Public Limited Company)
CORPORATE & INDIAN BRANCHESINVESTMENT BANKING
Published on Saturday, JUNE 27, 2020 vol lV nos 26 & 27 EPW Economic & Political Weekly214
INDEPENDENT AUDITOR’S REPORT
To the Apex Committee,Societe Generale – Indian Branches
Report on audit of the Financial StatementsOpinion1. We have audited the accompanying fi nancial statements of Societe Generale – Indian Branches (‘the Bank’), which comprise the Balance
Sheet as at 31st March 2020, the Profi t and Loss Account, the Cash Flow Statement for the year then ended, and notes to the fi nancial statements including a summary of signifi cant accounting policies and other explanatory information.
2. In our opinion and to the best of our information and according to the explanations given to us, the aforesaid fi nancial statements give the information required by the Banking Regulation Act, 1949 as well as the Companies Act, 2013 in the manner so required for banking companies and are in conformity with accounting principles generally accepted in India and give a true and fair view of the state of affairs of the Bank as at 31st March 2020, and its profi t and its cash fl ows for the year ended on that date.
Basis for Opinion3. We conducted our audit in accordance with the Standards on Auditing (SAs) specifi ed under section 143(10) of the Companies Act, 2013.
Our responsibilities under those Standards are further described in the Auditor’s Responsibilities for the Audit of the Financial Statements section of our report. We are independent of the Bank in accordance with the Code of Ethics issued by the Institute of Chartered Accountants of India together with the ethical requirements that are relevant to our audit of the fi nancial statements under the provisions of the Companies Act, 2013 and the Rules there under, and we have fulfi lled our other ethical responsibilities in accordance with these requirements and the Code of Ethics. We believe that the audit evidence we have obtained is suffi cient and appropriate to provide a basis for our opinion.
Emphasis of Matter4. We draw attention to Note 8 of Schedule 18 to the fi nancial statements which describes the extent to which the COVID-19 pandemic will
have impact on Bank’s fi nancial performance. Our opinion is not modifi ed in respect of this matter.Information other than fi nancial statements and auditor’s report thereon 5. The Bank’s Apex Committee is responsible for the other information. The other information obtained at the date of this auditor’s report is
information included in the Basel III Pillar 3 disclosures, but does not include the fi nancial statements and our auditor’s report thereon. Our opinion on the fi nancial statements does not cover such other information and we do not express any form of assurance conclusion thereon.
6. Our responsibility in connection with the audit of the fi nancial statements is to read the other information and in doing so, examine if the other information is materially inconsistent with the fi nancial statements or our knowledge obtained in the audit, or otherwise appears to be materially misstated. If based on our examination, we conclude that there is material misstatement of this other information, we are required to report the fact. We have nothing to report in this regard.
Responsibilities of Management and Those Charged with Governance for the Financial Statements7. The Bank’s Apex Committee is responsible for the matters stated in section 134(5) of the Companies Act, 2013 with respect to the preparation
of these fi nancial statements that give a true and fair view of the fi nancial position, fi nancial performance and cash fl ows of the Bank in accordance with the accounting principles generally accepted in India, including the Accounting Standards specifi ed under Section 133 of the Companies Act, 2013, provisions of Section 29 of the Banking Regulation Act, 1949 and circulars and guidelines issued by the Reserve Bank of India (‘RBI’) from time to time. This responsibility also includes maintenance of adequate accounting records in accordance with the provisions of the Act for safeguarding of the assets of the Bank and for preventing and detecting frauds and other irregularities; selection and application of appropriate accounting policies; making judgments and estimates that are reasonable and prudent; and design, implementation and maintenance of adequate internal fi nancial controls, that were operating effectively for ensuring the accuracy and completeness of the accounting records, relevant to the preparation and presentation of the fi nancial statements that give a true and fair view and are free from material misstatement, whether due to fraud or error.
8. In preparing the fi nancial statements, Apex Committee is responsible for assessing the Bank’s ability to continue as a going concern, disclosing, as applicable, matters related to going concern and using the going concern basis of accounting unless Apex Committee either intends to liquidate the Bank or to cease operations, or has no realistic alternative but to do so. Bank’s Apex Committee is also responsible for overseeing the Bank’s fi nancial reporting process.
Auditor’s Responsibilities for the audit of the Financial Statements9. Our objectives are to obtain reasonable assurance about whether the fi nancial statements as a whole are free from material misstatement,
whether due to fraud or error, and to issue an auditor’s report that includes our opinion. Reasonable assurance is a high level of assurance, but is not a guarantee that an audit conducted in accordance with SAs will always detect a material misstatement when it exists. Misstatements can arise from fraud or error and are considered material if, individually or in the aggregate, they could reasonably be expected to infl uence the economic decisions of users taken on the basis of these fi nancial statements.
10. As part of an audit in accordance with SAs, we exercise professional judgment and maintain professional skepticism throughout the audit. We also: • Identify and assess the risks of material misstatement of the fi nancial statements, whether due to fraud or error, design and perform
audit procedures responsive to those risks, and obtain audit evidence that is suffi cient and appropriate to provide a basis for our opinion. The risk of not detecting a material misstatement resulting from fraud is higher than for one resulting from error, as fraud may involve collusion, forgery, intentional omissions, misrepresentations, or the override of internal control.
• Obtain an understanding of internal control relevant to the audit in order to design audit procedures that are appropriate in the circumstances. Undersection 143(3)(i) of the Companies Act, 2013, we are also responsible for expressing our opinion on whether the Bank has adequate internal fi nancial controls system in place and the operating effectiveness of such controls.
• Evaluate the appropriateness of accounting policies used and the reasonableness of accounting estimates and related disclosures made by Apex Committee.
ECO
NOM
IC &
PO
LITI
CAL
WEE
KLY

SOCIETE GENERALE(Incorporated in France as a Public Limited Company)
CORPORATE & INDIAN BRANCHESINVESTMENT BANKING
Economic & Political Weekly EPW Published on Saturday, JUNE 27, 2020 vol lV nos 26 & 27 215
• Conclude on the appropriateness of Apex Committee’s use of the going concern basis of accounting and, based on the audit evidence obtained, whether a material uncertainty exists related to events or conditions that may cast signifi cant doubt on the Bank’s ability to continue as a going concern. If we conclude that a material uncertainty exists, we are required to draw attention in our auditor’s report to the related disclosures in the fi nancial statements or, if such disclosures are inadequate, to modify our opinion. Our conclusions are based on the audit evidence obtained up to the date of our auditor’s report. However, future events or conditions may cause the Bank to cease to continue as a going concern.
• Evaluate the overall presentation, structure and content of the fi nancial statements, including the disclosures, and whether the fi nancial statements represent the underlying transactions and events in a manner that achieves fair presentation.
11. We communicate with those charged with governance regarding, among other matters, the planned scope and timing of the audit and signifi cant audit fi ndings, including any signifi cant defi ciencies in internal control that we identify during our audit. We also provide those charged with governance with a statement that we have complied with relevant ethical requirements regarding independence, and to communicate with them all relationships and other matters that may reasonably be thought to bear on our independence, and where applicable, related safeguards.
Report on Other Legal and Regulatory Requirements12. The Balance Sheet and the Profi t and Loss Account have been drawn up inaccordance with the provisions of Section 29 of the Banking Regulation
Act, 1949 and Section 133 of the Companies Act, 2013.13. As required by sub-section (3) of section 30 of the Banking Regulation Act, 1949, we report that: (a) we have obtained all the information and explanations which, to the best of our knowledge and belief, were necessary for the purpose of
our audit and have found them to be satisfactory; (b) the transactions of the Bank, which have come to our notice, have been within the powers of the Bank; (c) during the course of our audit we have performed select relevant procedures at one branch. Since the Bank’s key operations are automated,
with the key application largely integrated to the core banking systems, it does not require its branches to submit any fi nancial returns. Accordingly, our audit is carried out centrally at the Head Offi ce, based on the necessary records and data required for the purpose of the audit being made available to us.
14. Further, as required by section 143(3) of the Act, we report that: a) we have sought and obtained all the information and explanations which to the best of our knowledge and belief were necessary for the
purpose of our audit; b) in our opinion, proper books of account as required by law have been kept by the Bank so far as it appears from our examination of those
books; c) the fi nancial accounting systems of the Bank are centralized and therefore, accounting returns for the purpose of preparation of fi nancial
statement are not required to be submitted by the branches; d) the Balance Sheet, the Profi t and Loss Account and the Cash Flow Statement dealt with by this report are in agreement with the books
of account; e) in our opinion, the aforesaid fi nancial statements comply with the Accounting Standards specifi ed under Section 133 of the Companies
Act, 2013, to the extent they are not inconsistent with the accounting policies prescribed by RBI; f) the requirements of section 164(2) of the Companies Act, 2013 are not applicable considering the Bank is a branch of Societe Generale,
which is incorporated with limited liability in France; g) with respect to the adequacy of the internal fi nancial controls over fi nancial reporting of the Bank and the operating effectiveness of
such controls, refer to our separate Report in “Annexure A”; h) with respect to the other matters to be included in the Auditor’s Report in accordance with Rule 11 of the Companies (Audit and Auditors)
Rules, 2014, in our opinion and to the best of our information and according to the explanations given to us: i. the Bank has disclosed the impact of pending litigations on its fi nancial position in its fi nancial statements - Refer Schedule 12 and
Note 24 (i) of Schedule 18 to the fi nancial statements; ii. the Bank has made provision, as required under the applicable law or accounting standards, for material foreseeable losses, if any,
on long term contracts including derivative contracts - Refer Note 24(vii) of Schedule 18 to the fi nancial statements; iii. there were no amounts which were required to be transferred to the Investor Education and Protection Fund by the Bank. iv. with respect to the matter to be included in the Auditor’s Report under section 197(16), the requirements of Section 197 of the
Companies Act, 2013 are not applicable considering the Bank is a branch of Societe Generale, which is incorporated in France.
For and on behalf ofA P Sanzgiri & CoChartered AccountantsFirm Regn. No. 116293W
Mehul ShahPartner(Membership No. 100909)UDIN: 20100909AAAAAF4291
Place: MumbaiDate: June 23, 2020
ECO
NOM
IC &
PO
LITI
CAL
WEE
KLY

SOCIETE GENERALE(Incorporated in France as a Public Limited Company)
CORPORATE & INDIAN BRANCHESINVESTMENT BANKING
Published on Saturday, JUNE 27, 2020 vol lV nos 26 & 27 EPW Economic & Political Weekly216
Annexure A to the Independent Auditor’s report of even date on the fi nancial statements of Societe Generale – Indian Branches
Report on the Internal Financial Controls Over Financial Reporting under Clause (i) of sub-section 3 of Section 143 of the Companies Act, 20131. We have audited the internal fi nancial controls over fi nancial reporting of Societe Generale – Indian Branches (‘the Bank’) as at 31 March
2020 in conjunction with our audit of the standalone fi nancial statements of the Bank for the year ended on that date.Management’s Responsibility for Internal Financial Controls over Financial Reporting2. The Bank’s Apex Committee is responsible for establishing and maintaining internal fi nancial controls based on the internal control over
fi nancial reporting criteria established by the Bank considering the essential components of internal control stated in the Guidance Note on Audit of Internal Financial Controls Over Financial Reporting (‘the Guidance Note’) issued by the Institute of Chartered Accountants of India (‘the ICAI’)”. These responsibilities include the design, implementation and maintenance of adequate internal fi nancial controls that were operating effectively for ensuring the orderly and effi cient conduct of its business, including adherence to Bank’s policies, the safeguarding of its assets, the prevention and detection of frauds and errors, the accuracy and completeness of the accounting records, and the timely preparation of reliable fi nancial information, as required under the Companies Act, 2013.
Auditor’s Responsibility3. Our responsibility is to express an opinion on the Bank’s internal fi nancial controls over fi nancial reporting based on our audit. We conducted
our audit in accordance with the Guidance Note and the Standards on Auditing (‘the Standards’), issued by the ICAI and deemed to be prescribed under section 143(10) of the Companies Act, 2013 to the extent applicable to an audit of internal fi nancial controls, both issued by the ICAI. Those Standards and the Guidance Note require that we comply with ethical requirements and plan and perform the audit to obtain reasonable assurance about whether adequate internal fi nancial controls over fi nancial reporting was established and maintained and if such controls operated effectively in all material respects.
4. Our audit involves performing procedures to obtain audit evidence about the adequacy of the internal fi nancial controls system over fi nancial reporting and their operating effectiveness. Our audit of internal fi nancial controls over fi nancial reporting included obtaining an understanding of internal fi nancial controls over fi nancial reporting, assessing the risk that a material weakness exists, and testing and evaluating the design and operating effectiveness of internal control based on the assessed risk. The procedures selected depend on the auditor’s judgement, including the assessment of the risks of material misstatement of the fi nancial statements, whether due to fraud or error.
5. We believe that the audit evidence we have obtained is suffi cient and appropriate to provide a basis for our audit opinion on the Bank’s internal fi nancial controls system over fi nancial reporting.
Meaning of Internal Financial Controls Over Financial Reporting6. A Bank’s internal fi nancial control over fi nancial reporting is a process designed to provide reasonable assurance regarding the
reliability of fi nancial reporting and the preparation of fi nancial statements for external purposes in accordance with generally accepted accounting principles. A Bank’s internal fi nancial control over fi nancial reporting includes those policies and procedures that (1) pertain to the maintenance of records that, in reasonable detail, accurately and fairly refl ect the transactions and dispositions of the assets of the Bank; (2) provide reasonable assurance that transactions are recorded as necessary to permit preparation of fi nancial statements in accordance with generally accepted accounting principles, and that receipts and expenditures of the bank are being made only inaccordance with authorizations of Apex Committee of the Bank; and (3) provide reasonable assurance regarding prevention or timely detection of unauthorized acquisition, use, or disposition of the Bank’s assets that could have a material effect on the fi nancial statements.
Inherent Limitations of Internal Financial Controls Over Financial Reporting7. Because of the inherent limitations of internal fi nancial controls over fi nancial reporting, including the possibility of collusion or improper
management override of controls, material misstatements due to error or fraud may occur and not be detected. Also, projections of any evaluation of the internal fi nancial controls over fi nancial reporting to future periods are subject to the risk that the internal fi nancial control over fi nancial reporting may become inadequate because of changes in conditions, or that the degree of compliance with the policies or procedures may deteriorate.
Opinion8. In our opinion, the Bank has, in all material respects, an adequate internal fi nancial controls system over fi nancial reporting and such internal
fi nancial controls over fi nancial reporting were operating effectively as at 31 March 2020, based on the internal control over fi nancial reporting criteria established by the Bank considering the essential components of internal control stated in the Guidance Note issued by the ICAI.
For and on behalf ofA P Sanzgiri & CoChartered AccountantsFirm Regn. No. 116293W
Mehul ShahPartner(Membership No. 100909)UDIN: 20100909AAAAAF4291
Place: MumbaiDate: June 23, 2020
ECO
NOM
IC &
PO
LITI
CAL
WEE
KLY

SOCIETE GENERALE(Incorporated in France as a Public Limited Company)
CORPORATE & INDIAN BRANCHESINVESTMENT BANKING
Economic & Political Weekly EPW Published on Saturday, JUNE 27, 2020 vol lV nos 26 & 27 217
PROFIT AND LOSS ACCOUNT FOR THE YEAR ENDED MARCH 31, 2020
` (000’s)
Schedule For the Year For the Year Ended March Ended March 31, 2020 31, 2019
INCOMEInterest Earned 13 3,156,015 3,071,316 Other Income 14 795,290 1,065,046 3,951,305 4,136,362
EXPENDITURE Interest Expended 15 1,402,012 1,845,202 Operating Expenses 16 1,431,389 1,277,397 Provisions and Contingencies 692,657 958,689
3,526,058 4,081,288
PROFIT Net Profi t/(Loss) for the year 425,247 55,074 Profi t/(Loss) Brought Forward 184,615 172,975
609,862 228,049
APPROPRIATIONS Transfer to Statutory Reserve 106,312 13,769 Transfer to Capital Reserve 40,846 10,953 Transfer to Investment Fluctuation Reserve Account 124,336 18,712 Remittance to H.O. during the year 137,177 - Transfer to surplus retained for Capital Adequacy (CRAR) – – Balance carried over to Balance Sheet 201,191 184,615
609,862 228,049 Signifi cant Accounting Policies and Notes to Accounts 17 & 18
Schedules referred to herein form an integral part of the Financial Statements.
BALANCE SHEET AS ON MARCH 31, 2020
` (000’s)
Schedule As at March As at March 31, 2020 31, 2019
CAPITAL & LIABILITIES
Capital 1 14,493,748 14,493,748 Reserves and Surplus 2 3,007,032 2,718,960 Deposits 3 27,451,332 23,121,395 Borrowings 4 3,037,737 6,295,314 Other Liabilities and Provisions 5 53,979,930 24,297,698
TOTAL: 101,969,779 70,927,115
ASSETS
Cash and balances with Reserve Bank of India 6 2,987,804 1,705,698 Balances with Banks and Money at Call and Short Notice 7 2,183,255 4,302,683 Investments 8 30,615,100 22,400,038 Advances 9 15,744,312 14,949,858 Fixed Assets 10 506,566 552,328 Other Assets 11 49,932,742 27,016,510
TOTAL: 101,969,779 70,927,115
Contingent Liabilities 12 2,428,932,382 1,746,156,400 Bills for Collection 2,617,380 3,031,576
Signifi cant Accounting Policies and Notes to Accounts 17 & 18
Schedules referred to herein form an integral part of the Financial Statements.
As per our attached report of even date For Societe Generale – Indian Branches
For A.P. Sanzgiri & Co., Antoine CastelChartered Accountants Chief Executive and Chief Country Offi cer - IndiaFirm Registration No. 116293W
Mehul Shah Ashok KrishnamoorthyPartner Chief Operating and Chief Financial Offi cer - IndiaMembership No. 100909
Place : MumbaiDate : June 23, 2020
ECO
NOM
IC &
PO
LITI
CAL
WEE
KLY

SOCIETE GENERALE(Incorporated in France as a Public Limited Company)
CORPORATE & INDIAN BRANCHESINVESTMENT BANKING
Published on Saturday, JUNE 27, 2020 vol lV nos 26 & 27 EPW Economic & Political Weekly218
` (000’s)
CASH FLOW STATEMENT FOR THE YEAR ENDED 31 MARCH 2020
Particulars For the Year Ended For the Year Ended March 31, 2020 March 31, 2019
Cash fl ows from operating activities
Net Profi t as per Profi t and Loss Statement 425,247 55,074 Add: Income Tax Provision 490,764 482,753 Add: Deferred Tax (Asset)/Liability (158,377) (378,705)Net profi t before taxation and extraordinary items 757,634 159,122 Adjustments for:Depreciation on Fixed Assets 64,249 85,147 (Profi t)/Loss on sale of fi xed assets (including write-off) 26,865 1,280 Interest paid on sub-ordinated debt during the year - 84,725 Addition to/(Write-back) of provision for Loan Losses (245,534) 859,712 Addition to/(Write-back) of Standard Assets 551,138 85,978 Provision on Country Risk (1,339) (4,501)Provision for Unhedged Foreign Currency Exposure 20,938 (726)Provision for Sundry Assets (Net of Write back) (800) (7,733)Other Losses/write-offs - - Provision for Large Exposure 38,107 (19,711)Provision for Stressed Assets 428 (6,782)Provision on Investments (2,668) (51,596)Operating profi t before working capital changes 1,209,018 1,184,914 (Increase)/Decrease in Investments (9,112,394) (9,262,078)(Increase)/Decrease in Advances (548,920) 11,391,186 (Increase)/Decrease in Other Assets (22,654,614) (18,995,866)Increase/(Decrease) in Deposits 4,329,938 (3,830,227)Increase/(Decrease) in Other Liabilities & Provisions 29,073,755 16,772,267 Income taxes (paid)/received (594,000) (424,985)Net Cash Flow generated from Operating Activities A 1,702,783 (3,164,787)Cash fl ows from investing activities Purchase of fi xed assets (45,990) (17,624)Proceeds from sale of fi xed assets 639 3,324 Proceeds from maturity of Held to Maturity Investments 900,000 350,000 Net Cash Flow generated from Investing Activities B 854,649 335,700 Cash fl ows from fi nancing activities Effect of exchange fl uctuation on sub-ordinated debt - (3,717,145)Interest paid on sub-ordinated debt during the year - (84,725)Fresh capital infusion - 6,666,780 Remittance to H.O. during the year (137,177) - Increase/(Decrease) in Borrowings other than Sub-ordinated debt (3,257,577) 1,369,319 Net Cash Flow generated used in Financing Activities C (3,394,754) 4,234,229 Net increase/(decrease) in cash and cash equivalents (A+B+C) (837,322) 1,405,141 Cash and Cash equivalents at the beginning of the year 6,008,381 4,603,240 Cash and Cash equivalents at the end of the year 5,171,059 6,008,381 Notes: Cash and Cash Equivalents represent Cash and Balances with Reserve Bank of India (As per Schedule 6) 2,987,804 1,705,698 Balances with Banks & Money at Call and Short Notice (As per Schedule 7) 2,183,255 4,302,683 5,171,059 6,008,381 Signifi cant Accounting Policies and Notes to Accounts 17 & 18Schedules referred to herein form an integral part of the Financial Statements.
As per our attached report of even date For Societe Generale – Indian Branches
For A.P. Sanzgiri & Co., Antoine CastelChartered Accountants Chief Executive and Chief Country Offi cer - IndiaFirm Registration No. 116293W
Mehul Shah Ashok Krishnamoorthy Partner Chief Operating and Chief Financial Offi cer - IndiaMembership No. 100909
Place : MumbaiDate : June 23, 2020
ECO
NOM
IC &
PO
LITI
CAL
WEE
KLY

SOCIETE GENERALE(Incorporated in France as a Public Limited Company)
CORPORATE & INDIAN BRANCHESINVESTMENT BANKING
Economic & Political Weekly EPW Published on Saturday, JUNE 27, 2020 vol lV nos 26 & 27 219
As at March As at March 31, 2020 31, 2019
SCHEDULE 4BORROWINGSI Borrowings in India (i) Reserve Bank of India – – (ii) Other Banks – – (iii) Other institutions and agencies 2,999,904 6,295,314 2,999,904 6,295,314 II Borrowings outside India (i) Subordinated Debt from Head Offi ce – – (ii) From Head Offi ce and its Branche 37,833 – 37,833 – Total (I+II) 3,037,737 6,295,314 Secured borrowings included in I & II above 2,999,904 6,295,314
SCHEDULE 5OTHER LIABILITIES AND PROVISIONSI Bills Payable 589 3,202 II Inter-Offi ce Adjustment (Net) – – III Interest Accrued 257,291 191,086 IV Provision for standard assets (this also includes provision for Diminution in Fair value of `104,211 (PY `134,246) and stressed standard assets of `591,085 (PY `160,109) 1,190,228 639,090 V Deferred Tax Liability (Net) – – VI Others (including provisions) 52,531,822 23,464,320 Total 53,979,930 24,297,698
SCHEDULE 6CASH AND BALANCES WITH RESERVE BANK OF INDIAI Cash in hand (including foreign currency notes) 164 152 II Balances with Reserve Bank of India (i) In Current Account 2,987,640 1,705,546 (ii) In Other Account – – Total (I+II) 2,987,804 1,705,698
SCHEDULE 7BALANCES WITH BANKS AND MONEY AT CALL AND SHORT NOTICEI In India (i) Balances with Banks (a) In Current Account 4 110 (b) In Other Deposit Account – – (ii) Money at Call and Short Notice (a) With Banks (including LAF with RBI) – 3,600,000 (b) With Other Institutions 1,997,264 – 1,997,268 3,600,110 II Outside India (i) In Current Account 185,987 176,995 (ii) In Other Deposit Accounts – – (iii) Money at Call and Short Notice – 525,578 185,987 702,573
Total (I+II) 2,183,255 4,302,683
SCHEDULES FORMING PART OF FINANCIAL STATEMENTS AS AT MARCH 31, 2020
As at March As at March 31, 2020 31, 2019 SCHEDULE 1CAPITAL(i) Amount brought in by Bank by way of Capital As per Last Balance Sheet 14,493,748 7,826,968 Add: Capital infusion during the year from the Head Offi ce – 6,666,780 Total 14,493,748 14,493,748 (ii) Amount of deposit kept with the Reserve Bank of India under section 11(2)(b) of the Banking Regulation Act, 1949 1,300,000 1,300,000 SCHEDULE 2RESERVES AND SURPLUSI STATUTORY RESERVE As per Last Balance Sheet 1,141,584 1,127,816 Add: Transfer from Profi t & Loss Account 106,312 13,768 1,247,896 1,141,584 II CAPITAL RESERVE As per Last Balance Sheet 264,212 253,258 Add: Transfer from Profi t & Loss Account 40,846 10,953 305,058 264,212 III SURPLUS RETAINED FOR CAPITAL ADEQUACY (CRAR) As per Last Balance Sheet 1,018,465 1,018,465 Add: Transfer from Profi t & Loss Account – – 1,018,465 1,018,465 IV INVESTMENT RESERVE ACCOUNT (IRA) As per Last Balance Sheet 91,373 91,373 Add: Transfer from Profi t & Loss Account – – 91,373 91,373 V INVESTMENT FLUCTUATION ACCOUNT (IFR) As per Last Balance Sheet 18,712 – Add: Transfer from Profi t & Loss Account 124,336 18,712 143,048 18,712 VI BALANCE IN PROFIT AND LOSS ACCOUNT Balance carried forward from Profi t and Loss Account 201,191 184,615 Total 3,007,032 2,718,960 SCHEDULE 3DEPOSITSA I Demand Deposits (i) From Banks 1,160,068 16,709 (ii) From Others 2,714,962 1,563,052 3,875,030 1,579,761 II Saving Bank Deposits 40,786 34,097 III Term Deposits (i) From Banks – – (ii) From Others 23,535,516 21,507,537 23,535,516 21,507,537 Total 27,451,332 23,121,395
B (i) Deposits of branches in India 27,451,332 23,121,395 (ii) Deposits of branches outside India – – Total 27,451,332 23,121,395
` (000’s) ` (000’s)
ECO
NOM
IC &
PO
LITI
CAL
WEE
KLY

SOCIETE GENERALE(Incorporated in France as a Public Limited Company)
CORPORATE & INDIAN BRANCHESINVESTMENT BANKING
Published on Saturday, JUNE 27, 2020 vol lV nos 26 & 27 EPW Economic & Political Weekly220
As at March As at March 31, 2020 31, 2019 SCHEDULE 10 (Contd.)II.b Asset held for sale/disposal At book value At cost as per last Balance Sheet – – Additions during the year – – Deductions during the year – – – – Depreciation to date Beginning of the year – – Additions during the year – – Deductions during the year – – – – Total (I) 447,142 485,501 II Other fi xed assets (including Furniture and Fixtures) At book value Beginning of the year 695,741 809,280 Additions during the year 25,788 16,168 Deductions during the year (14,914) (129,707) 706,615 695,741 Depreciation to date Beginning of the year 630,370 704,918 Additions during the year 31,527 52,009 Deductions during the year (12,215) (126,557) 649,682 630,370 Total (II) 56,933 65,372 III Capital work in progress 2,491 1,456 Total 506,566 552,328
SCHEDULE 11OTHER ASSETSI Inter-Offi ce Adjustment (Net) – – II Interest accrued 791,703 447,504 III Tax paid in advance/ tax deducted at source (net of provisions) 311,067 207,827 IV Deferred Tax Assets (Net) 758,385 600,008 V Stationery and stamps 42 8 VI Others* 48,071,545 25,761,163 Total 49,932,742 27,016,510 * includes Deposit kept with NABARD `455,887 (P. Y. NIL); with SIDBI `247,184 (P. Y. `NIL) for meeting shortfall in Priority Sector Lending.
SCHEDULE 12CONTINGENT LIABILITIES ((refer note 18.23.iii))I Claims against the bank not acknowledged as debts – – II Liability for partly paid investments – – III Liabilities on account of outstanding forward exchange contracts 655,208,535 424,998,253 IV Liabilities on account of outstanding derivative contracts 1,748,502,411 1,287,347,483 V Guarantees given on behalf of constituents – (a) In India 20,500,655 22,034,256 (b) Outside India – – VI Acceptances, endorsements and other obligations 3,445,172 4,708,670 VII Other items for which the Banks is contingently liable 1,275,609 7,067,738 Total 2,428,932,382 1,746,156,400
SCHEDULES FORMING PART OF FINANCIAL STATEMENTS AS AT MARCH 31, 2020
` (000’s) ` (000’s)
As at March As at March 31, 2020 31, 2019
SCHEDULE 8INVESTMENTSI Investments in India in (i) Government securities (*) 29,984,121 21,742,191 (ii) Other approved securities – – (iii) Shares – – (iv) Debentures and bonds 630,979 657,847 (v) Subsidiaries / Joint Ventures – – (vi) Others – – 30,615,100 22,400,038 II Investments outside India – – 30,615,100 22,400,038 III Investments in India Gross Value 30,787,229 22,574,836 Less:- Provision on Investments (172,129) (174,798)
Net Value 30,615,100 22,400,038
* includes Securities kept with CCIL as margin for securities segment of book value of `5,914,039 (P. Y. BV 4,191,116); for securities under triparty repo book value of `5,598,914 (P. Y. BV `6,287,804); for Forex segment book value of `322,798 (P. Y. BV `217,493); and with RBI under section 11(2)(b)(ii) of Banking Regulation Act, 1949 of Face Value of `1,300,000 (P. Y. Face Value `1,300,000).SCHEDULE 9ADVANCESA (i) Bills purchased and discounted 138,131 1,141,403 (ii) Cash credits, Overdrafts & Loans 15,306,181 12,838,455 (iii) Term Loans 300,000 970,000 Total 15,744,312 14,949,858 B (i) Secured by tangible assets* 2,146,657 2,673,392 (ii) Covered by Bank/ Government Guarantees 138,131 1,141,403 (iii) Unsecured 13,459,524 11,135,062 *includes advances against book debts Total 15,744,312 14,949,857 C I Advances in India (i) Priority Sector 138,131 3,895,767 (ii) Public Sector – (iii) Banks – (iv) Others 15,606,181 11,054,091 Sub-total 15,744,312 14,949,858 II Advances outside India – – Sub-total – – Total 15,744,312 14,949,858 SCHEDULE 10FIXED ASSETSI.a Premises At book value Beginning of the year 618,243 618,243 Additions during the year 19,169 – Deductions during the year (51,086) – Adjustments during the year – – 586,326 618,243 Depreciation to date Beginning of the year 132,742 99,604 Additions during the year 32,722 33,138 Deductions during the year (26,280) – 139,184 132,742
ECO
NOM
IC &
PO
LITI
CAL
WEE
KLY

SOCIETE GENERALE(Incorporated in France as a Public Limited Company)
CORPORATE & INDIAN BRANCHESINVESTMENT BANKING
Economic & Political Weekly EPW Published on Saturday, JUNE 27, 2020 vol lV nos 26 & 27 221
` (000’s) For the Year For the Year Ended March Ended March 31, 2020 31, 2019
SCHEDULE 16OPERATING EXPENSESI Payment to and provisions for employees 603,358 543,103II Rent, Taxes and Lighting 22,206 23,137III Printing and Stationery 1,428 2,314IV Advertisement and Publicity (1,390) 9,766V Depreciation on Bank’s Property 64,249 85,147VI Directors’ Fees, Allowances and Expenses – –VII Auditors’ Fees and Expenses 2,242 2,289VIII Law Charges 2,579 3,139IX Postage, Telegrams, Telephones etc. 9,139 4,421X Repairs and Maintenance 58,675 50,082XI Insurance 26,442 29,859XII Head Offi ce Charges 38,269 115,227XIII Intra-Group Service Fee 221,548 115,439XIV Inter-unit recharges 91,499 105,561XV Fee paid for Priority Sector Lending Certifi cates 36,901 29,177XVI CSR Expenditure 4,339 (163)XVII Other Expenditure (refer note 18.22.iv) 249,905 158,899 Total 1,431,389 1,277,397
PROVISIONS AND CONTINGENCIESI Current Tax Expense (refer note 18.22.i) 490,764 482,753II Deferred tax expense/ (benefi t) (158,377) (378,705)III Provision / (Writeback) for loan losses (245,534) 859,712IV Provision for Standard Assets 551,138 85,978V Provision for Country Risk (1,339) (4,501)VI Provision for Unhedged Foregin Currency Exposure 20,938 (726)VII Provision for Diminution in value of Investments (2,668) (51,596)VIII Provision for Sundry Assets (Net of Write back) (800) (7,733)IX Other Loan losses/write-offs – –X Provision for Large Exposure 38,107 (19,711)XI Provision for Stressed Assets 428 (6,782) Total 692,657 958,689
` (000’s) For the Year For the Year Ended March Ended March 31, 2020 31, 2019
SCHEDULE 13INTEREST EARNEDI Interest/Discount on Advances/Bills 1,183,045 1,680,800II Income on Investments 1,806,065 1,279,992III Interest on balance with Reserve Bank of India and other inter-bank funds 65,414 23,771IV Others 101,491 86,753 Total 3,156,015 3,071,316
SCHEDULE 14OTHER INCOMEI Commission, Exchange and Brokerage 195,927 387,041II Profi t/(Loss) on sale of Investments (net) 221,036 44,643III Profi t/(Loss) on sale of assets (net) (26,865) (1,280)IV Profi t/(Loss) on Foreign Exchange Transactions (net) (3,214,463) 291,066V Income earned by way of dividends, etc. from subsidiaries, companies, joint venture abroad/in India – –VI Profi t/(Loss) on Derivative Transactions (net) 3,595,619 279,960VII Miscellaneous Income (refer note 18.24.xv) 24,036 63,616
Total 795,290 1,065,046
SCHEDULE 15INTEREST EXPENDEDI Interest on Deposits 1,097,625 1,388,431II Interest on Reserve Bank of India/Inter-bank borrowings 61,504 212,196III Others 242,883 244,575
Total 1,402,012 1,845,202
Schedule 17- SIGNIFICANT ACCOUNTING POLICIES
SCHEDULES FORMING PART OF FINANCIAL STATEMENTS FOR THE YEAR ENDED MARCH 31, 2020
I Principal Accounting Policies 1. Background
The accompanying fi nancial statements for the year ended 31st March 2020 comprise the accounts of the Indian branches of Société Générale (‘The Bank’), which is incorporated in France as a Public Limited Company. The Indian operations are in Mumbai and New Delhi with Mumbai being the headquarters.The Apex Committee is supreme governing body of the Bank. The members of the Apex Committee comprise:
Chief Executive Offi cer Head – HR Chief Operating Offi cer Head – Legal Chief Financial Offi cer Head – Compliance Chief Risk Offi cer Head – Communications Head – Corporate Banking Head – Credit Head – Treasury (Fixed Income and Sales) Head – Operations Head – Trade Finance (TRA and PCM) Head – Operational Risk Head – Internal Audit Head – IT
ECO
NOM
IC &
PO
LITI
CAL
WEE
KLY

SOCIETE GENERALE(Incorporated in France as a Public Limited Company)
CORPORATE & INDIAN BRANCHESINVESTMENT BANKING
Published on Saturday, JUNE 27, 2020 vol lV nos 26 & 27 EPW Economic & Political Weekly222
2. Basis of Preparation The fi nancial statements have been prepared and presented under the historical cost convention and accrual basis of accounting, unless otherwise stated and are in accordance with Generally Accepted Accounting Principles in India (‘GAAP’), statutory requirements prescribed under the Banking Regulation Act, 1949, circulars and guidelines issued by the Reserve Bank of India (‘RBI’) from time to time, Accounting Standards (‘AS’) specifi ed under Section 133 of the Companies Act, 2013, in so far as they apply to banks and current practices prevailing within the banking industry in India.
3. Use of estimatesThe preparation of the fi nancial statements requires Management to make estimates and assumptions that affect the reported amounts of assets, liabilities (including contingent liabilities) as at the date of the fi nancial statements, revenues and expenses during the period. Management believes that the estimates used in preparation of fi nancial statements are prudent and reasonable and although these estimates are based upon management’s best knowledge of current events and actions, actual results could differ from those estimates. Any revision to the accounting estimates is recognized prospectively in current and future periods.
4. Signifi cant Accounting Policies 4a. Transactions involving foreign exchange (a) Foreign currency monetary assets, liabilities are translated at the Balance Sheet date at exchange rates notifi ed by the FEDAI. The
resulting gains or losses are accounted in the Profi t and Loss Account. (b) Forward foreign exchange contracts are revalued FEDAI rates for specifi ed maturity discounted to present value based on the future
cash fl ows. The resulting gains or losses are recognized in the Profi t and Loss Account. (c) Income and expenditure in foreign currency is translated at the exchange rates prevailing on the date of the transaction. (d) Monetary assets and liabilities, contingent liabilities on accounts of guarantees, endorsements and other obligations denominated in
foreign currencies are stated at the exchange rates notifi ed by FEDAI at the Balance Sheet date.
4b. Investments Classifi cation & income recognition
As per the guidelines for investments laid down by the Reserve Bank of India (‘RBI’), the investment portfolio of the Bank is classifi ed as on the date of purchase under “Held to Maturity”, “Available for Sale” and “Held for Trading” categories. The Bank follows settlement date accounting for its investments. Costs including brokerage and commission pertaining to investments, paid at the time of acquisition, are charged to the Profi t and Loss Account. Cost of investments is computed based on the First-In-First-Out (FIFO) method.Profi t/loss on sale of investments in the ‘Held to Maturity’ category is recognised in the Profi t and Loss Account and Profi t is thereafter appropriated (net of applicable taxes and statutory reserve requirements) to Capital Reserve.Profi t/loss on sale of investments in ‘Available for Sale’ and ‘Held for Trading’ categories is recognised in the Profi t and Loss Account.Broken period interest (the amount of interest from the previous interest payment date till the date of purchase/sale of instruments) on debt instruments is treated as a revenue item. Provision for non-performing investments and investment subjected to prudential norms is made based on a periodic review of investments as per Bank’s policy and after having considered the provisioning guidelines issued by the RBI as amended from time to time.
Basis of classifi cationInvestments that are held principally for resale within 90 days from the date of purchase are classifi ed under HFT category. Investments which the Bank intends to hold till maturity are classifi ed as HTM securities. Investments in the equity of subsidiaries / joint ventures are categorised as HTM/AFS in accordance with the RBI guidelines. Investments which are not classifi ed in the above categories are classifi ed under AFS category.
Short SaleThe Bank undertakes short sale transactions in Central Government dated securities in accordance with RBI guidelines. The short position is refl ected as the amount received on sale and is classifi ed under ‘Other Liabilities’. The short position is marked to market and loss, if any, is charged to the Profi t and Loss Account while gain, if any, is ignored. Profi t / Loss on settlement of the short position is recognised in the Profi t and Loss Account.Valuation & provisioninga) Treasury Bills, Commercial Paper and Certifi cates of Deposit being discounted instruments, are valued at carrying cost.b) Held to Maturity: Investments under this category are carried at cost of acquisition, adjusted for the premium, which is amortized
over the residual maturity of the security. Any diminution, other than temporary, in the value of such securities is provided for.c) Available for Sale & Held for Trading: Investments in both categories are valued at lower of cost of acquisition or market value
as declared by Financial Benchmark India Private Limited (‘FBIL’). Securities under each category are valued scrip-wise and depreciation / appreciation is aggregated for each classifi cation. Net depreciation, if any, in aggregate for each classifi cation is recognized in the Profi t and Loss Account and net appreciation, if any, is ignored. Except in cases where provision for diminution other than temporary is created, the book value of the individual securities is not changed as a result of periodic valuations.
d) Quoted investments are valued based on prices declared by Primary Dealers Association of India jointly with FBIL periodically and the price list of RBI. Quoted equity shares are valued at their closing price on a recognized stock exchange. Unquoted equity shares are valued at the break-up value if the latest balance sheet is available, else, at Rs. 1 per company, as per relevant RBI guidelines.
ECO
NOM
IC &
PO
LITI
CAL
WEE
KLY

SOCIETE GENERALE(Incorporated in France as a Public Limited Company)
CORPORATE & INDIAN BRANCHESINVESTMENT BANKING
Economic & Political Weekly EPW Published on Saturday, JUNE 27, 2020 vol lV nos 26 & 27 223
e) The market/ fair value of unquoted government securities included in the AFS and HFT category is determined as per the prices published by FBIL. Further, in the case of unquoted bonds, debentures, pass through certifi cates (other than priority sector) and preference shares, valuation is carried out by applying an appropriate mark-up (refl ecting associated credit risk) over the Yield to Maturity (‘YTM’) rates of government securities. Such mark up and YTM rates applied are as per the relevant rates published by FIMMDA/FBIL.
Transfer between categories: Reclassifi cation of investments from one category to the other, if done, is in accordance with RBI guidelines and any such transfer is accounted for at the lower of acquisition cost/book value/ market value, as at the date of transfer. Depreciation, if any, on such transfer is fully provided for.
Accounting for Repo/Reverse Repo: Repo and Reverse Repo transactions in securities (including Borrowing/Lending under Liquidity Adjustment Facility) are accounted for as collateralized borrowing and lending transactions respectively. The borrowing cost on repo transactions is accounted as Interest Expense and revenue on reverse repo transactions is accounted as Interest Income. Repo and reverse repo transactions with the RBI under the Liquidity Adjustment Facility (LAF) are accounted for as secured borrowing and lending transactions.
4c. Advances Advances are classifi ed as performing and non-performing advances (‘NPAs’) based on the RBI guidelines as amended from time to time and are stated net of bills rediscounted, specifi c provisions, interest in suspense for non-performing advances, claims received from Export Credit Guarantee Corporation, provisions for funded interest term loan classifi ed as non-performing advances and provisions in lieu of diminution in the fair value of restructured assets. Also, NPAs are classifi ed into sub-standard, doubtful and loss assets. Unrealised Interest on NPAs is transferred to an interest suspense account and not recognised in the Profi t and Loss Account.Provisions for non-performing advances are made based on a periodic review of advances as per the Bank’s policy, which comply with the provisioning guidelines issued by the RBI as amended from time to time. Specifi c loan loss provision in respect of non-performing advances is charged to the Profi t and Loss Account. Any recoveries made by the Bank in case of NPAs written off are recognized in the Profi t and Loss Account.In addition to the above, the Bank on a prudential basis makes provisions on advances or exposures which are not NPAs, but has reasons to believe on the basis of the extant environment or specifi c information or basis regulatory guidance / instructions, of a possible slippage of a specifi c advance or a group of advances or exposures or potential exposures. These are classifi ed as contingent provisions and included under other liabilities. In accordance with RBI guidelines and prudential provisioning norms, the Bank has provided general provision on standard assets including credit exposures computed as per the current marked to market values of interest rate and foreign exchange derivative contracts at levels stipulated by RBI from time to time and disclosed in Schedule 5 “Other liabilities and provisions”.Further to the provisions required to be held according to the asset classifi cation status, provisions are held for individual country exposures (other than for home country exposure). Countries are categorised into risk categories as per Export Credit Guarantee Corporation of India Ltd. (‘ECGC’) guidelines and provisioning is done in respect of that country where the net funded exposure is one percent or more of the Bank’s total assets.For entities with Unhedged Foreign Currency Exposure (UFCE), provision is made in accordance with the guidelines issued by RBI, which requires to ascertain the amount of UFCE, estimate the extent of likely loss and estimate the riskiness of un-hedged position. This provision is classifi ed under Schedule 5 – Other Liabilities in the balance sheet.For Large exposure provision, Bank follow provisioning guidelines given in circular RBI/2016-17/50 DBR.BP.BC.No.8/21.01.003/2016-17 dated 25-Aug-2016.For Stressed sector provision, Bank follows provisioning guidelines given in circular DBR.No.BP.BC.64/21.04.048/2016-17 dated 18-Apr-2017. The Bank does not have a policy of creating fl oating provisions.
4d. Fixed Assets (a) Fixed assets are stated at historical cost less accumulated depreciation /amortisation and adjusted for impairment, if any. Cost includes cost
of purchase inclusive of freight, duties, incidental expenses and all expenditure like site preparation, installation costs and professional fees incurred on the asset before it is ready to put to use. Subsequent expenditure incurred on assets put to use is capitalised only when it increases the future benefi t / functioning capability from / of such assets.
(b) Depreciation is provided using the Straight-Line Method as per the useful lives of the assets estimated by the management, or at the useful life prescribed under part “C” of schedule II of the Companies Act, 2013 whichever is lower. Depreciation on tangible fi xed assets has been provided on the straight-line method as per the useful life prescribed in schedule II to the companies Act, 2013 except in respect of the premises, software and motor vehicle in which case the life of the assets has been assessed as under based on the nature of the assets, estimated usage of the asset.
Assets Useful Life Schedule II Premises 23 years 60 yearsImprovement to own premises 10 yearsFurniture and Fixtures 10 years 10 yearsOffi ce Equipments 5 years 5 yearsComputers 3 years 3 yearsSoftware 4 years 6 yearsMotor Vehicles 4 years 8 yearsLeasehold Improvements Over the life of the lease
ECO
NOM
IC &
PO
LITI
CAL
WEE
KLY

SOCIETE GENERALE(Incorporated in France as a Public Limited Company)
CORPORATE & INDIAN BRANCHESINVESTMENT BANKING
Published on Saturday, JUNE 27, 2020 vol lV nos 26 & 27 EPW Economic & Political Weekly224
(c) Depreciation on improvements to leased premises is based on the primary period of the lease of such premises.(d) All fi xed assets purchased in a block of 10 or less and individually costing less than Rs. 35,000/- are fully charged to the Profi t and
Loss Account in the year of purchase. (e) Profi t on sale of premises, if any, is transferred to Capital Reserve as per the RBI guidelines.(f) Fixed assets that have been retired from active use and are held for disposal are stated at the lower of their net book value and net
realisable value and are shown separately in the fi nancial statements. Any expected loss is recognised immediately in the profi t and loss statement.
4e. Staff Retirement Benefi ts (a) Provident Fund
The eligible employees of the Bank are entitled to receive benefi ts under the provident fund, a defi ned contribution plan, in which both employees and the Bank make monthly contributions at a specifi ed percentage of the covered employees’ salary (currently 12% of employees’ basic salary), which is recognised as an expense in the Profi t and Loss Account during the period. The contributions as specifi ed under the law are paid to the provident fund set up as irrevocable trust by the Bank. The Bank is generally liable for annual contributions and any shortfall in the fund assets based on the government specifi ed minimum rates of return and recognises such contributions and shortfall, if any, as an expense in the year incurred.
(b) GratuityThe Bank provides for its gratuity liability which is a defi ned benefi t scheme, based on actuarial valuation at the Balance Sheet date carried out by an independent actuary using the Projected Unit Credit Method. The actuarial gains or losses arising during the year are recognized in the Profi t and Loss Account and are not deferred. The Bank makes contribution to a Gratuity Fund administered by trustees and managed by a life insurance company.
(c) PensionThe Bank has a pension scheme, which is a defi ned contribution plan for employees participating in the scheme. The contributions are accounted for on an accrual basis and charged to the Profi t and Loss account.The Bank received an approval from the Offi ce of the Principal Commissioner of Income Tax (Governing Authority) for the following amendments to the pension scheme:
i. Eligibility criteria for all employees changed from 5 (fi ve) years to 1 (one) year; ii. To offer a one-time option to all existing employees to opt out of the SG India Pension Fund.
SG India Pension fund will pay the corpus for each of the employee who opted out from the pension fund. The current pension contribution is towards the employees who have not opted out from the pension fund.
(d) Short term compensated absences are provided for based on estimates, by charging to the Profi t and Loss Account. (e) Long Service Awards
The Bank provides lump sum benefi ts linked to fi nal eligible salary after completing each 5 years of service. The detailed actuarial valuation of the present value of the defi ned benefi t obligations may be made at the interval not exceeding three years. However, with a view that the amount recognized in the fi nancial statement do not differ materially from the amount that would be determined at the balance sheet date, the most recent valuation is reviewed at the balance sheet date and updated to refl ect any material transactions and other material changes in circumstances (including changes in interest rate) between the date of valuation and the balance sheet date. The fair value of any plan assets is determined at each balance sheet date.
4f. Net Profi t/ (Loss) The net profi t/ (loss) disclosed in the Profi t and Loss Account is after provisions, if any, for:
• taxes (including deferred tax) • non-performing advances • standard assets and derivatives • diminution in the value of investments • other necessary provisions
4g. DerivativesNotional amounts of derivative transactions comprising of forwards, swaps, futures and options are disclosed as off Balance Sheet exposures. The Bank recognises all derivative contracts (other than those designated as hedges) at fair value, on the date on which the derivative contracts are entered into and are re-measured at fair value as at the Balance Sheet or reporting dates. Changes in the fair value of derivatives other than those designated as hedges are recognised in the Profi t and Loss Account.All notional amounts of outstanding derivative transactions are recorded as Off-Balance Sheet items. The trading positions are Mark to market on a daily basis whereas hedge deals are recorded on accrual basis. MTM receivables and payables are disclosed in the Financial Statements on a gross basis in other assets & other liabilities respectively.Option contracts are marked to market using market values after considering the premium received or paid. The profi t or loss on revaluation is recorded in the Profi t and Loss Account and corresponding asset or liability is shown under Other assets or Other Liabilities. Premium received or Premium paid is recognized in the Profi t and Loss Account upon expiry or exercise of the option.
4h. Taxes on Income Tax expense comprises of current and deferred tax. Current income tax is determined in accordance with the Income-tax Act, 1961 and the rules framed there under. Deferred tax adjustments comprise of changes in the deferred tax assets and liabilities. Deferred tax refl ects the impact of the timing differences between taxable income and accounting income for the year
ECO
NOM
IC &
PO
LITI
CAL
WEE
KLY

SOCIETE GENERALE(Incorporated in France as a Public Limited Company)
CORPORATE & INDIAN BRANCHESINVESTMENT BANKING
Economic & Political Weekly EPW Published on Saturday, JUNE 27, 2020 vol lV nos 26 & 27 225
Deferred tax is measured based on the tax rates and the tax laws enacted or substantively enacted at the Balance Sheet date. Deferred tax assets are recognised only to the extent that there is reasonable certainty that suffi cient future taxable income will be available against which such deferred tax assets can be realised. In situations where the Bank has unabsorbed depreciation or carry forward tax losses, all deferred tax assets are recognised only if there is virtual certainty, supported by convincing evidence that they can be realised against future taxable profi ts. At each Balance Sheet date the Bank re-assesses unrecognised deferred tax assets. It recognizes previously unrecognised deferred tax assets to the extent that it has become reasonably certain or virtually certain, as the case may be that suffi cient future taxable income will be available against which such deferred tax assets can be realized.The carrying amount of deferred tax assets is reviewed at each Balance Sheet date and appropriately adjusted to refl ect the amount that is reasonably/virtually certain to be realised.
4i. Revenue Recognition(i) Interest income is recognized in the Profi t and Loss Account as it accrues, except in the case of interest on non-performing assets
and restructured accounts. Interest on non-performing assets and accounts restructured as per prevailing guidelines on date of restructuring is recognized as per the prudential norms of RBI and applicable guidelines.
(ii) Commission received on guarantees and letters of credit issued is amortised on a straight-line basis over the period of the contract.(iii) Loan processing fee is recognized as income when due.(iv) Income on discounted instruments is recognized over the tenure of the instrument on a straight-line basis.(v) Other fee and commission are recognized as and when they become due and a binding obligation to receive fees has arisen.
4j. Lease transactionsLease of assets under which all the risks and benefi ts of ownership are actively retained by the lessor are classifi ed as operating leases. Payments made under operating leases are charged to the Profi t and Loss Account on a straight line basis over the lease term.
4k. Provisions, contingent liabilities and contingent assetsThe Bank estimates the probability of any loss that might be incurred on outcome of contingencies on the basis of information available up to the date on which the fi nancial statements are prepared. A provision is recognised when an enterprise has a present obligation as a result of a past event and it is probable that an outfl ow of resources will be required to settle the obligation, in respect of which a reliable estimate can be made. Provisions are not discounted and are determined based on management estimates of amounts required to settle the obligation at the Balance Sheet date, supplemented by experience of similar transactions. These are reviewed at each Balance Sheet date and adjusted to refl ect the current management estimates. In cases where the available information indicates that the loss on the contingency is reasonably possible but the amount of loss cannot be reasonably estimated, a disclosure to this effect is made in the fi nancial statements. In case of remote possibility neither provision nor disclosure is made in the fi nancial statements. The Bank does not account for or disclose contingent assets, if any. Provisions for onerous contract are recognized when the expected benefi ts to be derived by the Bank from a contract are lower than the unavoidable cost of meeting the future obligation under the contract. The provision is measured at the present value of the lower of the expected cost of terminating the contract and the expected net cost of continuing with the contract. Before a provision is established, the Bank recognizes any impairment loss on the asset associated with that contract.
4l. Cash and cash equivalentsCash and cash equivalents include cash in hand, balances with RBI, balances with other banks and money at call and short notice (including the effect of changes in exchange rates on cash and cash equivalents in foreign currency).
4m. ImpairmentThe carrying amounts of assets are reviewed at each Balance Sheet date if there is any indication of impairment based on internal / external factors. Impairment loss, if any, is provided in the Profi t and Loss Account to the extent of carrying amount of assets exceeds their estimated recoverable amount.
4n. Segment InformationThe disclosure relating to segment information is in accordance with the guidelines issued by RBI.
4o. Société Générale has policy of allocating certain costs incurred centrally by Head Offi ce, subsidiaries and branches based on group cost allocation methodology. A brief description of the costs is as follows:IT & Other support services: These allocated costs include various IT & other support services provided by the Head Offi ce along-with its’ regional offi ces. These costs are recorded as intra-group costs in the Profi t and Loss Account.Corporate Support Function: These costs include certain corporate function such as administrative services (planning, co-ordination, budgetary control, fi nancial advises etc.), fi nancial services (supervision of solvency, capital increases, management of refi nancing) and assistance in the fi elds of recruiting, training, marketing and strategic planning, etc. These costs are booked as Head-Offi ce charges in the Profi t and Loss Account.Inter-unit recharges: Expense paid for Non-Financial services (e.g.: group reporting, vendor payments, IT support, HR support and Backoffi ce support etc.) off-shored to shared service unit is reported under Inter-unit recharge category and booked in Profi t and Loss Account.
ECO
NOM
IC &
PO
LITI
CAL
WEE
KLY

SOCIETE GENERALE(Incorporated in France as a Public Limited Company)
CORPORATE & INDIAN BRANCHESINVESTMENT BANKING
Published on Saturday, JUNE 27, 2020 vol lV nos 26 & 27 EPW Economic & Political Weekly226
Schedule18 -NOTES APPENDED TO AND FORMING PART OF THE FINANCIAL STATEMENTS FOR THE YEAR ENDED MARCH 31, 2020
All amounts in `‘000s, unless otherwise stated1. Internal Controls Over Financial Reporting The Apex Committee of the Bank certifi es that it has laid down the internal fi nancial controls to be followed by the Bank and that such controls
are adequate and were operating effectively.2. Capital: The Bank’s capital adequacy ratio computed under Basel III is given below: ` ‘000s
Sr. No.
Particulars March 31, 2020 March 31, 2019
i) Common Equity Tier I Capital (%) 11.60% 15.86%ii) Tier I Capital (%) 11.60% 15.86%iii) Tier II Capital (%) 0.98% 0.73%iv) Total CRAR % 12.58% 16.59%v) Percentage of the shareholding of the Government of India – –vi) Amount of Tier I capital 16,301,924 16,306,009vii) Amount of Additional Tier I capital – –viii) Amount of Tier II Capital of which
- Subordinated Debt from Head Offi ce – –- Others 1,375,126 751,167Amount of Tier II Capital 1,375,126 751,167
(ix) Total Capital 17,677,050 17,057,176(x) Total Risk weighted Assets 140,589,999 102,806,896
3. Investments in India Value of Investments: ` ‘000s
Particulars March 31, 2020 March 31, 2019Gross value of investments in India* 30,787,229 22,574,836Provision for depreciation in India* (172,129) (174,798)Net value of investments in India* 30,615,100 22,400,038
* The Bank has not made any investment outside India Movement in provision for depreciation/diminution on investments: ` ‘000s
Particulars 2019-20 2018-19
Opening Balance at beginning of the year 174,798 226,394Add: Provisions made during the year – –Less: Write-off/write-back of excess provisions during the year 2,669 51,596Closing Balance at end of the year* 172,129 174,798
*Includes provisions on Non-performing investments.4. Repo and Reverse Repo:- (i) Details of Repos and Reverse Repos including Liquidity Adjustment Facility (in face value terms): ` ‘000s
Particulars Minimum outstanding
during the year
Maximum outstanding
during the year
Daily average outstanding
during the year
March 31, 2020
Securities sold under repos– Government Securities – 1,999,968 11,530 –– Corporate Debt SecuritiesSecurities purchased under reverse repos– Government Securities – 10,900,000 292,263 –– Corporate Debt Securities
Particulars Minimum outstanding
during the year
Maximum outstanding
during the year
Daily average outstanding
during the year
March 31, 2019
Securities sold under repos– Government Securities – 8,398,700 985,075 –– Corporate Debt Securities – – – –Securities purchased under reverse repos– Government Securities – 5,626,100 407,927 3,873,360– Corporate Debt Securities – – – –
ECO
NOM
IC &
PO
LITI
CAL
WEE
KLY

SOCIETE GENERALE(Incorporated in France as a Public Limited Company)
CORPORATE & INDIAN BRANCHESINVESTMENT BANKING
Economic & Political Weekly EPW Published on Saturday, JUNE 27, 2020 vol lV nos 26 & 27 227
5. Non-SLR Investment Portfolio: i. Issuer Composition of Non SLR investments as at March 31, 2020 ` ‘000s
No Issuer Amount Extent of private
placement
Extent of ‘below investment grade’
Securities
Extent of ‘unrated’ Securities
Extent of ‘unlisted’ Securities
(1) (2) (3) (4) (5) (6) (7)1 PSUs – – – – –2 Fis – – – – –3 Banks – – – – –4 Private Corporates (*) 803,108 803,108 – 803,108 732,0925 Subsidiaries/Joint Ventures – – – – –6 Others – – – – –7 Provision held towards depreciation (172,129) (172,129) – (172,129) (101,113)
Total 630,979 630,979 – 630,979 630,979(*) Non SLR investment portfolio comprise of Equity shares and Optionally Convertible Debentures (OCDs) received by Bank from one borrower each under S4A & SDR scheme. These equity shares and OCD’s have been held under AFS category as per RBI circular RBI/2015-16/97 DBR No BP.BC.6 /21.04.141/2015-16 dated July 01, 2015. However, since the equity shares are vulnerable to market risk and to adhere to group norms the Bank has made 100% provision on these equity shares thus reducing the book value of shares to zero.
Issuer Composition of Non SLR investments as at March 31, 2019 ` ‘000sNo Issuer Amount Extent of
private placement
Extent of ‘below investment grade’
Securities
Extent of ‘unrated’ Securities
Extent of ‘unlisted’ Securities
(1) (2) (3) (4) (5) (6) (7)1 PSUs – – – – –2 Fis – – – – –3 Banks – – – – –4 Private Corporate (*) 832,645 832,645 – 832,645 761,6295 Subsidiaries/Joint Ventures – – – – –6 Others – – – – –7 Provision held towards depreciation (174,798) (174,798) – (174,798) (103,782)
Total 657,847 657,847 – 657,847 657,847(*) Non SLR investment portfolio comprise of Equity shares and Optionally Convertible Debentures (OCDs) received by Bank from one borrower each under S4A & SDR scheme. These equity shares and OCD’s have been held under AFS category as per RBI circular RBI/2015-16/97 DBR No BP.BC.6 /21.04.141/2015-16 dated July 01, 2015. However, since the equity shares are vulnerable to market risk and to adhere to group norms the Bank has made 100% provision on these equity shares thus reducing the book value of shares to zero.
ii. Non-performing Non-SLR Investments: ` ‘000sParticulars 2019-20 2018-19Opening Balance 297,245 –Additions during the year – 335,857Reductions during the year# (29,537) (38,612)Closing balance 267,708 297,245Total provisions held 103,808 131,842
# reduction is on account of repayment of some portion of OCD during the year ended March 31, 2020 and March 31, 2019.iii. During the year ended March 31, 2020 and March 31, 2019, the Bank has not sold any securities held under HTM portfolio.
iv. During the year ended March 31, 2020 and March 31, 2019, the Bank has not transferred securities from HTM to AFS/HFT portfolio. v. In Accordance with RBI circular RBI/2017-18/147 DBR No BP.BC.102/21.04.048/2017-18 dated April 02, 2018 Bank has made
Investment fl uctuation reserve on investment made in HFT and AFS portfolio. Investment fl uctuation reserve on investment HFT and AFS portfolio held as at March 31,2020 is `143,048 (P.Y `18,712).
vi. During the year ended March 31,2020 and March 31,2019 the Bank has not availed the option of spreading the mark to market losses on investment held in AFS and HFT.
6. Derivatives:- (i) Forward rate agreements / Interest Rate Swaps outstanding: ` ‘000s
Items March 31, 2020 March 31, 2019
The Notional principal of swap agreements 1,381,954,011 1,011,701,075Loss which would be incurred if counterparties failed to fulfi ll their obligations under the agreements
23,514,904 9,580,515
Collateral required by the Bank upon entering into swaps – –Concentration of credit risk arising from the swaps %– Banks and Financial Institutions 99.20% 99.98%– Others 0.80% 0.02%Fair value of the swap book (3,626,512) (151,077)
Bank exchanges collateral with the counterparties as per the Credit Support Annex (CSA) signed.
ECO
NOM
IC &
PO
LITI
CAL
WEE
KLY

SOCIETE GENERALE(Incorporated in France as a Public Limited Company)
CORPORATE & INDIAN BRANCHESINVESTMENT BANKING
Published on Saturday, JUNE 27, 2020 vol lV nos 26 & 27 EPW Economic & Political Weekly228
Nature and terms of interest rate swaps: Outstanding as at March 31, 2020: (`. ‘000s)
Nature No. NotionalPrincipal
Terms
Trading Swaps 500 197,217,308 Floating Receivable v/s Fixed Payable linked to INO-INR-1DTrading Swaps 415 172,353,354 Fixed Receivable v/s Floating Payable linked to INO-INR-1DTrading Swaps 124 119,429,636 Floating Receivable v/s Fixed Payable linked to LIB-USD-6MTrading Swaps 98 112,914,880 Fixed Receivable v/s Floating Payable linked to LIB-USD-6MTrading Swaps 1 1,655,400 Floating Receivable v/s Fixed Payable linked to EIB-EUR-6MTrading Swaps 4 2,152,020 Fixed Receivable v/s Floating Payable linked to EIB-EUR-6MTrading Swaps 253 147,600,000 Floating Receivable v/s Fixed Payable linked to MIF-INR-6MTrading Swaps 277 148,820,000 Fixed Receivable v/s Floating Payable linked to MIF-INR-6MTrading Swaps 7 4,640,310 Fixed Receivable v/s Floating Payable linked to OIS-JPY-1DTrading Swaps 3 2,648,640 Floating Receivable v/s Fixed Payable linked to EON-EUR-1DTrading Swaps 7 3,186,645 Fixed Receivable v/s Floating Payable linked to EON-EUR-1DTrading Swaps 225 161,204,283 Floating Receivable v/s Fixed Payable linked to LIB-USD-3MTrading Swaps 214 155,847,201 Fixed Receivable v/s Floating Payable linked to LIB-USD-3MTrading Swaps 2 522,122 Floating Receivable v/s Fixed Payable linked to EIB-EUR-3MTrading Swaps 2 522,122 Fixed Receivable v/s Floating Payable linked to EIB-EUR-3MTrading Swaps 23 10,615,800 Floating Receivable v/s Fixed Payable linked to OIS-USD-1DTrading Swaps 8 9,359,761 Fixed Receivable v/s Floating Payable linked to OIS-USD-1DTrading Swaps 4 7,883,792 Floating Receivable v/s Fixed Payable linked to LIB-JPY-6MTrading Swaps 8 12,798,732 Fixed Receivable v/s Floating Payable linked to LIB-JPY-6MBasis Swap 19 10,139,110 Single Currency Basis Swaps with Receiving leg linked to LIB-USD-3M & Paying leg linked to OIS-USD-1DBasis Swap 21 38,014,096 Single Currency Basis Swaps with Receiving leg linked to LIB-USD-3M & Paying leg linked to LIB-USD-6MBasis Swap 1 340,493 Single Currency Basis Swaps with Receiving leg linked to LIB-USD-6M & Paying leg linked to OIS-USD-1DBasis Swap 9 14,153,670 Single Currency Basis Swaps with Receiving leg linked to EON-EUR-1D & Paying leg linked to EIB-EUR-6MBasis Swap 12 16,948,960 Single Currency Basis Swaps with Receiving leg linked to LIB-USD-6M & Paying leg linked to LIB-USD-3MBasis Swap 1 1,566,731 Single Currency Basis Swaps with Receiving leg linked to LIB-JPY-3M & Paying leg linked to LIB-JPY-6MBasis Swap 1 1,392,650 Single Currency Basis Swaps with Receiving leg linked to OIS-JPY-1D & Paying leg linked to LIB-JPY-6MBasis Swap 2 2,269,950 Single Currency Basis Swaps with Receiving leg linked to LIB-USD-1M & Paying leg linked to LIB-USD-3MBasis Swap 2 2,269,950 Single Currency Basis Swaps with Receiving leg linked to LIB-USD-3M & Paying leg linked to LIB-USD-1MBasis Swap 5 7,263,840 Single Currency Basis Swaps with Receiving leg linked to OIS-USD-1D & Paying leg linked to LIB-USD-3MBasis Swap 7 6,704,370 Single Currency Basis Swaps with Receiving leg linked to EIB-EUR-6M & Paying leg linked to EIB-EUR-3MBasis Swap 2 2,648,275 Single Currency Basis Swaps with Receiving leg linked to OIS-USD-1D & Paying leg linked to LIB-USD-6MBasis Swap 3 6,869,910 Single Currency Basis Swaps with Receiving leg linked to EIB-EUR-6M & Paying leg linked to EON-EUR-1D
2,260 1,381,954,011
Outstanding as at March 31, 2019: (`. ‘000s)Nature No. Notional
PrincipalTerms
Trading Swaps 431 168,325,708 Floating Receivable v/s Fixed Payable linked to INO-INR-1DTrading Swaps 370 161,578,332 Fixed Receivable v/s Floating Payable linked to INO-INR-1DTrading Swaps 97 106,184,045 Floating Receivable v/s Fixed Payable linked to LIB-USD-6MTrading Swaps 73 100,872,941 Fixed Receivable v/s Floating Payable linked to LIB-USD-6MTrading Swaps 1 233,018 Floating Receivable v/s Fixed Payable linked to EIB-EUR-6MTrading Swaps 4 1,553,450 Fixed Receivable v/s Floating Payable linked to EIB-EUR-6MTrading Swaps 160 90,550,000 Floating Receivable v/s Fixed Payable linked to MIF-INR-6MTrading Swaps 191 105,870,000 Fixed Receivable v/s Floating Payable linked to MIF-INR-6MTrading Swaps 6 3,472,910 Fixed Receivable v/s Floating Payable linked to OIS-JPY-1DTrading Swaps 2 1,708,795 Floating Receivable v/s Fixed Payable linked to EON-EUR-1DTrading Swaps 7 2,990,391 Fixed Receivable v/s Floating Payable linked to EON-EUR-1DTrading Swaps 132 98,912,397 Floating Receivable v/s Fixed Payable linked to LIB-USD-3MTrading Swaps 93 60,856,400 Fixed Receivable v/s Floating Payable linked to LIB-USD-3MTrading Swaps 2 612,457 Floating Receivable v/s Fixed Payable linked to EIB-EUR-3MTrading Swaps 2 612,457 Fixed Receivable v/s Floating Payable linked to EIB-EUR-3MTrading Swaps 23 9,356,672 Floating Receivable v/s Fixed Payable linked to OIS-USD-1DTrading Swaps 7 6,555,894 Fixed Receivable v/s Floating Payable linked to OIS-USD-1DTrading Swaps 4 7,066,909 Floating Receivable v/s Fixed Payable linked to LIB-JPY-6MTrading Swaps 6 9,238,040 Fixed Receivable v/s Floating Payable linked to LIB-JPY-6MBasis Swap 16 6,846,345 Single Currency Basis Swaps with Receiving leg linked to LIB-USD-3M & Paying leg linked to OIS-USD-1DBasis Swap 14 28,657,832 Single Currency Basis Swaps with Receiving leg linked to LIB-USD-3M & Paying leg linked to LIB-USD-6MBasis Swap 1 311,198 Single Currency Basis Swaps with Receiving leg linked to LIB-USD-6M & Paying leg linked to OIS-USD-1D
ECO
NOM
IC &
PO
LITI
CAL
WEE
KLY

SOCIETE GENERALE(Incorporated in France as a Public Limited Company)
CORPORATE & INDIAN BRANCHESINVESTMENT BANKING
Economic & Political Weekly EPW Published on Saturday, JUNE 27, 2020 vol lV nos 26 & 27 229
Nature No. NotionalPrincipal
Terms
Basis Swap 5 7,844,923 Single Currency Basis Swaps with Receiving leg linked to EON-EUR-1D & Paying leg linked to EIB-EUR-6MBasis Swap 8 11,203,110 Single Currency Basis Swaps with Receiving leg linked to LIB-USD-6M & Paying leg linked to LIB-USD-3MBasis Swap 1 1,248,350 Single Currency Basis Swaps with Receiving leg linked to OIS-JPY-1D & Paying leg linked to LIB-JPY-6MBasis Swap 2 2,074,650 Single Currency Basis Swaps with Receiving leg linked to LIB-USD-1M & Paying leg linked to LIB-USD-3MBasis Swap 2 2,074,650 Single Currency Basis Swaps with Receiving leg linked to LIB-USD-3M & Paying leg linked to LIB-USD-1MBasis Swap 3 4,771,695 Single Currency Basis Swaps with Receiving leg linked to OIS-USD-1D & Paying leg linked to LIB-USD-3MBasis Swap 1 1,941,813 Single Currency Basis Swaps with Receiving leg linked to EIB-EUR-6M & Paying leg linked to EIB-EUR-3MBasis Swap 1 1,728,875 Single Currency Basis Swaps with Receiving leg linked to OIS-USD-1D & Paying leg linked to LIB-USD-6MBasis Swap 3 6,446,818 Single Currency Basis Swaps with Receiving leg linked to EIB-EUR-6M & Paying leg linked to EON-EUR-1D 1,668 1,011,701,075
There were no forward rate agreement outstanding as at 31.03.2020: Nil (P.Y. – Nil) (ii) Risk Exposure in Derivatives: Qualitative Disclosures
The Bank undertakes transactions in Derivatives, namely, Foreign exchange forward contracts, Interest rate swaps, Currency interest rate swaps and FX Options within the limits approved.There is a clear segregation of duties between the front and back offi ces independently.The global risk management systems of the Société Générale group are adopted by the Indian branches for both Market and Credit risk. The calculation of the various market risk parameters is undertaken by the Regional Offi ce in Hong Kong. The report along with exceptions, if any is circulated to the local management, front offi ce and Chief Risk Offi cer. The local Chief Risk Offi cer monitors the limits based on the reports received and those generated locally.Accounting policy: All outstanding derivative transactions are recorded as Off-Balance Sheet items. The trading positions are Mark to market on a daily basis whereas hedge deals are recorded on accrual basis.Quantitative Disclosure as at March 31, 2020: ` ‘000s
Sr. No. Particulars Currency Derivatives #
Interest Rate Derivatives
1 Derivatives (Notional Principal amount) a) For hedging – – b) For trading 1,021,756,935 1,381,954,0112 Marked to Market Positions a) Assets (+) 14,772,586 23,514,904 b) Liability (-) (16,380,850) (27,141,416)3 Credit Exposure 69,204,243 39,102,4464 Likely impact of one percentage change in interest rate (100*PV01) a) on hedging derivatives – – b) on trading derivatives 1,103,609 1,223,1375 Maximum of 100*PV01 observed during the year
a) on hedging – –b) on Trading 1,114,076 1,358,125
6 Minimum of 100*PV01 observed during the year a) on hedging – –b) on Trading 759,796 749,845
Quantitative Disclosure as at March 31, 2019: ` ‘000sSr. No. Particulars Currency
Derivatives #Interest Rate
Derivatives1 Derivatives (Notional Principal amount) a) For hedging – – b) For trading 700,644,661 1,011,701,0752 Marked to Market Positions a) Assets (+) 9,121,487 9,580,515 b) Liability (-) (9,252,472) (9,731,592)3 Credit Exposure 51,171,315 22,195,1204 Likely impact of one percentage change in interest rate (100*PV01) a) on hedging derivatives – – b) on trading derivatives 937,759 961,6015 Maximum of 100*PV01 observed during the year
a) on hedging – –b) on Trading 1,398,115 1,519,472
6 Minimum of 100*PV01 observed during the year a) on hedging – –b) on Trading 847,803 722,365
# Currency derivatives include forward foreign exchange contracts.
ECO
NOM
IC &
PO
LITI
CAL
WEE
KLY

SOCIETE GENERALE(Incorporated in France as a Public Limited Company)
CORPORATE & INDIAN BRANCHESINVESTMENT BANKING
Published on Saturday, JUNE 27, 2020 vol lV nos 26 & 27 EPW Economic & Political Weekly230
(iii) Unhedged/uncovered foreign currency exposure The Bank’s foreign currency exposures as at March 31, 2020 that are not hedged /covered by either derivative instruments or otherwise
are within the Net Overnight Open Position limit (NOOP) and the Aggregate Gap limit, as approved by the RBI. NOOP as at March 31, 2020 is `174,805/- (P.Y. `344,155/-).
(iv) Exchange Traded Interest Rate Derivatives:
Sr. No. Particulars 2019-20 2018-19
1 Notional principal amount of exchange traded interest rate derivatives undertaken during the year.
– –
2 Notional principal amount of exchange traded interest rate derivatives outstanding at the end of the year.
– –
3 Notional principal amount of exchange traded interest rate derivatives outstanding and not “highly effective”.
– –
4 Mark to market value of exchange traded interest rate derivatives outstanding and not “highly effective”.
– –
(v) Credit default swaps: The Bank has not entered into any Credit Default Swap transactions.
7. Asset Quality (i) Non-Performing Assets ` ‘000s
Particulars 2019-20 2018-19
Net NPAs to Net Advances (%) 0.00% 3.04%Gross Non-Performing AdvancesOpening Balance at beginning of the year 1,489,178 700,000Additions during the year – 789,178Less: Amounts recovered (700,000) –Less: Amounts written off –Closing Balance at end of the year 789,178 1,489,178Provisions for Non-Performing Advances (excluding provision for standard assets)Opening Balance at beginning of the year 1034,172 175,000Add: Provisions made during the year 454,466 859,712Less: write-back of excess provisions during the year (700,000) –Closing Balance at end of the year 789,178 1,034,712Net Non-Performing AdvancesOpening Balance at beginning of the year 454,466 525,000Additions/(Reduction) during the year (454,466) (70,534)Less: Amounts recovered – –Less: Amounts written off – –Closing Balance at end of the year – 454,466
(ii) Details of fi nancial assets sold to Securitization/Reconstruction Company for Asset Reconstruction – No fi nancial assets have been sold to Securitization/Reconstruction Company for Asset Reconstruction during the year Nil (P.Y. – Nil) (iii) Details of non-performing fi nancial assets purchased/sold No non-performing fi nancial assets have been purchased/sold from/to other banks during the year Nil (P.Y. - Nil) (iv) Provision on Standard Assets ` ‘000s
Particulars March 31, 2020 March 31, 2019
Standard Advances* 757,001 350,964Credit Exposure on Derivatives 433,227 288,126TOTAL 1,190,228 639,090
* this also includes provision for Diminution in Fair value of `104,211 (PY 134,246) & stressed standard assets of `591,085 (PY `160,109)
(v) Major component of provisions under other liabilities as mentioned in Schedule 5 ` ‘000s
Particulars March 31, 2020 March 31, 2019
Provision for Un-Hedged Foreign Currency Exposure 21,188 250Provision for Country Risk Exposure 255 1,594Provision for Stressed Sector 575 147Provision for Large Exposure 38,107 –TOTAL 60,125 1,991
ECO
NOM
IC &
PO
LITI
CAL
WEE
KLY

SOCIETE GENERALE(Incorporated in France as a Public Limited Company)
CORPORATE & INDIAN BRANCHESINVESTMENT BANKING
Economic & Political Weekly EPW Published on Saturday, JUNE 27, 2020 vol lV nos 26 & 27 231
(vi) Particulars of Accounts Restructured - The following tables set forth, for the periods indicated, details of loan assets subjected to restructuring. March 31, 2020 ` ‘000s
Sr. No.
Type of Restructuring OthersAsset Classification Standard Sub-
standardDoubtful Loss Total
Details 1 Restructured Accounts as on April 1
of the FY (opening figures) *No. of borrowers – – – – –Amount outstanding – – – – –Provision thereon – – – – –
1A Movement in Opening Balances (Recoveries)
No. of borrowers – – – – –Amount outstanding – – – – –Provision thereon – – – – –
2 Fresh Restructuring during the year No. of borrowers – – – – –Amount outstanding – – – – –Provision thereon – – – – –
3 Upgradations to restructured standard category during the FY
No. of borrowers – – – – –Amount outstanding – – – – –Provision thereon – – – – –
4 Restructured Standard Advances which cease to attract higher provisioning and/ or additional risk weight at the end of the FY and hence need not be shown as restructured standard advances at the beginning of the next FY
No. of borrowers – – – – –Amount outstanding – – – – –Provision thereon – – – – –
5 Down gradations of restructured accounts during the FY
No. of borrowers – – – – –Amount outstanding – – – – –Provision thereon – – – – –
6 Write-offs of restructured accounts during the FY
No. of borrowers – – – – –Amount outstanding – – – – –Provision thereon – – – – –
7 Restructured Accounts as on March 31 of the FY (closing figures*)
No. of borrowers – – – – –Amount outstanding – – – – –Provision thereon – – – – –
March 31, 2019 ` ‘000sSr. No.
Type of Restructuring OthersAsset Classification Standard Sub-
standardDoubtful Loss Total
Details 1 Restructured Accounts as on April 1
of the FY (opening figures) *No. of borrowers – – – – –Amount outstanding – – – – –Provision thereon – – – – –
1A Movement in Opening Balances (Recoveries)
No. of borrowers – – – – –Amount outstanding – – – – –Provision thereon – – – – –
2 Fresh Restructuring during the year No. of borrowers – – – – –Amount outstanding – – – – –Provision thereon – – – – –
3 Upgradations to restructured standard category during the FY
No. of borrowers – – – – –Amount outstanding – – – – –Provision thereon – – – – –
4 Restructured Standard Advances which cease to attract higher provisioning and/ or additional risk weight at the end of the FY and hence need not be shown as restructured standard advances at the beginning of the next FY
No. of borrowers – – – – –Amount outstanding – – – – –Provision thereon – – – – –
5 Down gradations of restructured accounts during the FY
No. of borrowers – – – – –Amount outstanding – – – – –Provision thereon – – – – –
6 Write-offs of restructured accounts during the FY
No. of borrowers – – – – –Amount outstanding – – – – –Provision thereon – – – – –
7 Restructured Accounts as on March 31 of the FY (closing figures*)
No. of borrowers – – – – –Amount outstanding – – – – –Provision thereon – – – – –
* Excluding the figures of Standard Restructured Advances which do not attract higher provisioning or risk weight (if applicable) and loans restructured under Strategic Debt Restructuring (SDR) and Scheme for Sustainable Structuring of Stressed Assets (S4A).
There are no cases restructured on account of CDR mechanism or SME debt restructuring in the current or previous year.
ECO
NOM
IC &
PO
LITI
CAL
WEE
KLY

SOCIETE GENERALE(Incorporated in France as a Public Limited Company)
CORPORATE & INDIAN BRANCHESINVESTMENT BANKING
Published on Saturday, JUNE 27, 2020 vol lV nos 26 & 27 EPW Economic & Political Weekly232
vii) Disclosure on Strategic Debt Restructuring Scheme March 31, 2020 ` ‘000s
No. of Accounts where SDR has been invoked
Amount outstanding as on the reporting date
Amount outstanding as on the reporting date with respect to accounts where conversion of debt to equity is pending
Amount outstanding as on the reporting date with respect to accounts where conversion of debt to equity has taken place
Classified as Standard
Classified as NPA
Classified as Standard
Classified as NPA
Classified as Standard
Classified as NPA
01 535,400 – – – 535,400 – Provision held against the OCD received from the carved-out debt is `172,533 (Diminution in Fair value of `104,211 and MTM Loss of
`68,322). March 31, 2019 ` ‘000s
No. of Accounts where SDR has been invoked
Amount outstanding as on the reporting date
Amount outstanding as on the reporting date with respect to accounts where conversion of debt to equity is pending
Amount outstanding as on the reporting date with respect to accounts where conversion of debt to equity has taken place
Classified as Standard
Classified as NPA
Classified as Standard
Classified as NPA
Classified as Standard
Classified as NPA
01 535,400 – – – 535,400 – Provision held against the OCD received from the carved-out debt is `177,202 (Diminution in Fair value of `134,246 and MTM Loss of
`42,956).
viii) Disclosure on the Scheme for Sustainable Structuring of Stressed Assets (S4A) The disclosure on S4A as on 31 March 2020 is as under ` ‘000s
No. of Accounts where S4A has been applied
Aggregate Amount outstanding
Amount outstandingProvision Held
In Part A In Part BClassified as standard 346,657 346,657 – 260,756Classified as NPA/NPI 267,708 – 267,708 103,808
Bank has outstanding OCDs of `196,692 Equity Shares of `71,016 and working capital demand loan of `346,657 on which provision held is `32,792, `71,016 and `260,756 respectively.
The disclosure on S4A as on 31 March 2019: ` ‘000s
No. of Accounts where S4A has been applied
Aggregate Amount outstanding
Amount outstanding Provision HeldIn Part A In Part BClassified as standard 343,192 343,192 – 160,109Classified as NPA/NPI 297,245 – 297,245 131,842
Bank has outstanding OCDs of `226,229 Equity Shares of `71,016 and working capital demand loan of `343,192 on which provision held is `60,826, `71,016 and `160,109 respectively.
ix) There was no account under the stand-still period where there was change in ownership outside Strategic Debt Restructuring Scheme as on March 31,2020 (P.Y. Nil).
x) Bank does not have any account under flexible debt restructuring as on March 31, 2020 (P.Y. Nil). xi) RBI vide its circular DBR.No.BP.BC.101/21.01.18/2017-18 dated February 12, 2018 issued a revised framework for resolution of
Stressed Assets which supersedes the existing guidelines of SDR, Corporate Debt Restructuring Scheme, Flexible Structuring of existing long-term project loans, Change in Ownership Outside SDR and S4A with immediate effect. Under the revised framework, there were no accounts where any of these Schemes had been invoked but not yet fully implemented.
xii) There are no Micro, Small and Medium Enterprises (MSME) cases which have been restructured during the year ended March 31, 2020 in term of the circular DBR.No.BP.BC.18/21.04.048/2018-19 dated January 01, 2019 on MSME sector – Restructuring of Advances.
xiii) With reference to RBI circular No. RBI/2018-19/203 DBR.No.BP.BC.45/21.04.048/2018-19 dated June 7, 2019. Bank has no borrower where the process of implementing a resolution plan (RP) was initiated.
8. COVID-19 Impact Assessment and Regulatory DisclosureThe outbreak of COVID-19 pandemic across the globe and in India has contributed to a signifi cant decline and volatility in the global and Indian fi nancial markets and slowdown in the economic activities. The Government of India ordered a nationwide Lockdown as a preventive measure against the COVID-19 pandemic in India. The Ministry of Home Affairs have declared Banking service as part of essential service and thus the Bank was full operational during the lockdown period.The Bank has used the principles of prudence in applying judgments, estimates and assumptions to assess overall impact of the pandemic on the business and Financial Statements for the year ended 31 March 2020. However, due to the uncertainties associated with the pandemic, the actual impact may not be in line with current estimates. The Bank will continue to closely monitor any further development relating to COVID-19, which may have impact on business and fi nancial position. Further the impact assessment does not indicate any signifi cant impact on its business and fi nancial results in long term.The impact of COVID-19 pandemic to the Bank is done by the management regularly in consultation with Crisis Management Team (CMT). All necessary measures are taken by the management to ensure smooth functioning of the business during lock down. The clients are communicated of any important regulatory updates due to COVID-19 situation. The employees are communicated on all updates important w.r.t COVID-19. In accordance with the RBI guidelines relating to COVID-19 Regulatory Package dated 27th March, 2020 and 17th April, 2020, and clarifi cation issued by RBI through Indian Bankers Association, dated 6th May 2020 the Bank is granting moratorium on the payment of installments and / or
ECO
NOM
IC &
PO
LITI
CAL
WEE
KLY

SOCIETE GENERALE(Incorporated in France as a Public Limited Company)
CORPORATE & INDIAN BRANCHESINVESTMENT BANKING
Economic & Political Weekly EPW Published on Saturday, JUNE 27, 2020 vol lV nos 26 & 27 233
interest, as applicable, falling due between 1st March, 2020 and 31st May, 2020 (‘moratorium period’) to eligible borrowers classifi ed as Standard, even if overdue, as on 29th February, 2020. In accordance with RBI guidelines, the moratorium period, wherever granted, is excluded by the Bank from the number of days past-due for the purpose of asset classifi cation under RBI’s Income Recognition and Asset Classifi cation norms. The Bank has made no provisions as at 31st March 2020 against the potential impact of COVID-19 based on the information available up to a point in time.
9. Business Ratios
Particulars 2019-20 2018-19Interest Income as a percentage to Working Funds (Note 1) 4.00% 5.07%Non-Interest Income as a percentage to Working Funds (Note 1) 1.01% 1.76%Operating profit (Note 2) as a percentage to Working Funds (Note 1) 1.42% 1.67%Return on assets (Note 3) 0.54% 0.09%Business per employee (`. 000s) (Note 4 and 5) 494,536 380,545Profit per employee (`. 000s) (Note 4) 5,003 551
Note 1: Working Funds represents the average of total assets as reported to RBI by the Bank in Form X under Section 27 of the Banking Regulation Act, 1949 during the 12months of financial year.
Note 2: Operating Profi t = Interest Income + Other Income – Interest Expenses – Operating ExpensesNote 3: Net profi t as a percentage to working fundsNote 4: Productivity ratios are based on average employee number.Note 5: Business means total of advances and deposits as at year end, excluding interbank depositsPrevious year’s fi gures are not reclassifi ed to conform to current year’s presentation.
10. Exposures (i) Exposure to Real Estate Sector* ` ‘000s
Category March 31, 2020 March 31, 2019a) Direct exposure: (i) Residential mortgages – – (ii) Commercial real estate – – (iii) Investments in mortgage backed securities (MBS) and
other securitized exposures: a) Residential b) Commercial Real Estate – –b) Indirect exposure: Fund based and non-fund based exposures on National Housing Bank (NHB)
and housing fi nance companies (HFCs) 800,000 –Total Real Estate Exposure 800,000 –
*On the basis of limits or outstanding, whichever is higher. (ii) Exposure to Capital Market* ` ‘000s
No Particulars March 31, 2020 March 31, 2019
1 Direct investments made in equity shares, convertible bonds, convertible debentures and units of equity-oriented mutual funds the corpus of which is not exclusively invested in corporate debt
– –
2 Advances against shares, bonds, debentures or other securities or on clean basis to individuals for investment in equity shares (including IPO’s/ESOPS), convertible bonds or convertible debentures, units of equity oriented mutual funds
– –
3 Advances for any other purposes where shares or convertible bonds or convertible debentures or units of equity oriented mutual funds are taken as primary security
– –
4 Advances for any other purposes to the extent secured by collateral security of shares or convertible bonds or convertible debentures or units of equity oriented mutual funds i.e. where the primary security other than shares/convertible bonds/convertible debentures/units of equity oriented mutual funds does not fully cover the advances
– –
5 Secured and unsecured advances to stockbrokers and guarantees issued on behalf of stockbrokers and market makers 100,000 100,000
6 Loans sanctioned to Corporates against the security of shares/bonds/debentures or other securities or on clean basis for meeting promoter’s contribution to the equity of new companies in anticipation of raising resources
– –
7 Bridge loans to companies against expected equity fl ows/issues – –8 Underwriting commitments taken up in respect of primary issue of shares
or convertible bonds or convertible debentures or units of equity oriented mutual funds
– –
9 Financing to stockbrokers for margin trading – –10 All exposures to venture capital funds (both registered and unregistered)
deemed to be on par with equity and hence reckoned for capital market exposure.
– –
Total Exposure to Capital Market 100,000 100,000* On the basis of limits or outstanding, whichever is higher.
ECO
NOM
IC &
PO
LITI
CAL
WEE
KLY

SOCIETE GENERALE(Incorporated in France as a Public Limited Company)
CORPORATE & INDIAN BRANCHESINVESTMENT BANKING
Published on Saturday, JUNE 27, 2020 vol lV nos 26 & 27 EPW Economic & Political Weekly234
(iii) Country Risk Exposure ` ‘000s
Risk Category Exposure (Net) as at March 31, 2020 (*)
Provision held as at March 31, 2020
Exposure (Net) as at March 31, 2019 (*)
Provision held as at March 31, 2019
Insignifi cant 373,542 255 2,626,507 1,594Low – – 700,613 –Moderate 20,574 – 56,121 –High 28,626 – 294,931 –Very Hig – – – –Restricted – – – –Off-Credit – – – –Total 422,742 255 3,678,172 1,594
(* Net funded outstanding as at reporting date has been reported)The Bank has compiled the data for the purpose of this disclosure (from its internal MIS system and has been furnished by the management) which has been relied upon by the auditor.
(iv) Disclosure on Single/Group Borrower LimitsDuring the year 2019-20 and 2018-19, the Bank’s credit exposures to single borrowers and group borrowers were within the limits prescribed by Reserve Bank of India.
(v) Unsecured Advances There are no advances for which intangible security such as charge over the rights, licenses, authority, etc. are accepted as collateral by
the Bank.11. Disclosures for the dealings with the Group entities March 31, 2020 ` ‘000s
Sr.No.
Type of Entity
Name of Entity Total Intra Group Exposure
Total Exposure as per cent of Paid-
up Capital and Reserves
1
Subsidiary – Parent
KOMERCNI BANK AS 481,455 2.802 SOCIETE GENERALE CHINA LIMITED – –3 SOCIETE GENERALE, ALGERIE – –4 SOCIETE GENERALE GLOBAL SOLUTION CENTRE PVT LTD 239,864 1.395 SOCIETE GENERALE SECURITIES INDIA PRIVATE LIMITED 100,000 0.586 BRD GROUPE SOCIETE GENERALE SA – –7 CREDIT DU NORD – –8 SKB BANKA DD 35,002 0.209 ROSBANK,MOSCOW 28,913 0.1710 SOCIETE GENERALE SPOLKA AKCYJNA ODDZIAL W POLSCE 19,632 0.1111 SOCIETE GENERALE BANKA SRBIJA A.D. BEOGRAD – –
Total Intra Group Exposure 904,866 5.26Total Exposure of the Bank 164,870,198
% of Intra-group exposure to total exposure of the bank 0.005%Note: The exposures to ALD Automotive Private Limited are excluded from the above computation of Intra Group Exposures for F.Y. 2019-20 based on the exemption as per Master Circular on Intra Group Transactions and Exposures DBOD.No.BP.BC.96/21.06.102/2013-14 dated February 11, 2014 reference no. 3.4.C. The Letter of Comfort is issued by Société Générale Paris (Head Office of Société Générale India) for the facility sanctioned by Société Générale India to M/s. ALD Automotive Private Limited.There was no breach of limits on intra group exposure during the financial year 2019-20(P.Y. Nil).
March 31, 2019 ` ‘000sSr. No.
Type of Entity
Name of Entity Total Intra Group Exposure [(E)=
(A)+(B)+(C) - (D)]
Total Exposure as per cent of
Paid-up Capital and Reserves
1
Subsidiary – Parent
KOMERCNI BANK AS 659,772 3.832 SOCIETE GENERALE CHINA LIMITED – –3 SOCIETE GENERALE, ALGERIE 31,0057 1.804 SOCIETE GENERALE GLOBAL SOLUTION CENTRE PVT LTD 134,683 0.785 SOCIETE GENERALE SECURITIES INDIA PRIVATE LIMITED 100,000 0.586 BRD GROUPE SOCIETE GENERALE SA – –7 CREDIT DU NORD 12,596 0.078 SKB BANKA DD 33,175 0.199 ROSBANK, MOSCOW 44,461 0.2610 SOCIETE GENERALE SPOLKA AKCYJNA ODDZIAL W POLSCE 17,943 0.1011 SOCIETE GENERALE BANKA SRBIJA A.D. BEOGRAD 3,824 0.02
Total Intra Group Exposure 1,316,511 7.65Total Exposure of the Bank 136,228,490
% of Intra-group exposure to total exposure of the bank 0.97%Note: The exposures to ALD Automotive Private Limited are excluded from the above computation of Intra Group Exposures for F.Y. 2018-19 based on the exemption as per Master Circular on Intra Group Transactions and Exposures DBOD.No.BP.BC.96/21.06.102/2013-14 dated February 11, 2014 reference no. 3.4.C. The Letter of Comfort is issued by Société Générale Paris (Head Office of Société Générale India) for the facility sanctioned by Société Générale India to M/s. ALD Automotive Private Limited.
ECO
NOM
IC &
PO
LITI
CAL
WEE
KLY

SOCIETE GENERALE(Incorporated in France as a Public Limited Company)
CORPORATE & INDIAN BRANCHESINVESTMENT BANKING
Economic & Political Weekly EPW Published on Saturday, JUNE 27, 2020 vol lV nos 26 & 27 235
12. Asset Liability Management Maturity Pattern of certain items of assets and liabilities as at March 31, 2020 ` ‘000s
Particulars Day – 1 2-7 Days 8-14 Days 15-30 Days 31 days and upto 2 months
over 2 months and upto 3 months
Over 3 Months and upto 6 months
Over 6 Months and upto
1 year
Over 1 Year
and upto 3 years
Over 3 Years
and upto 5 years
Over 5 years
Total
Loans and Advances 1,363,633 44,775 15,149 376,050 12,348 4,061 1,702 2,493 13,923,150 951 – 15,744,312
Investment 24,362,590 – – 1,925,898 646,717 1,381,690 1,155,771 414,300 66,166 18,053 643,915 30,615,100
Deposits 42,304 3,379,385 4,400,126 3,857,459 3,019,084 4,414,891 4,563,548 2,485,264 869,612 257,958 161,701 27,451,332
Borrowing – 3,037,737 – – – – – – – – – 3,037,737
FCY Assets 23,636,861 42,104 12,030 68,925 11,664 816,111 – – – – 1,024 24,588,719
FCY Liabilities 22,930,541 163,878 129,455 295,897 79,495 63,753 654,487 126,192 75,364 2,849 65,985 24,587,896
Maturity Pattern of certain items of assets and liabilities as at March 31, 2019 `. ‘000sPaticulars Day – 1 2-7 Days 8-14 Days 15-30 Days 31 days
and upto 2 months
over 2 months and upto 3 months
Over 3 Months and upto 6 months
Over 6 Months and upto
1 year
Over 1 Year and
upto 3 years
Over 3 Years
and upto 5 years
Over 5 years
Total
Loans and Advances 1,143,267 75,093 90,860 248,925 356,063 34,970 328,843 248,215 11,952,612 471,010 – 14,949,857
Investment 16,963,256 – – 63,590 805,245 1,113,815 1,700,879 182,857 350,407 – 1,219,989 22,400,038
Deposits 16,746 1,344,364 1,897,984 1,128,664 6,049,632 8,165,919 2,050,355 1,910,175 369,401 102,533 85,623 23,121,395
Borrowing – 6,295,314 – – – – – – – – – 6,295,314
FCY Assets 6,150,762 615,553 105,173 281,643 367,635 522,347 346,415 18,770 793,058 496 25 9,201,877
FCY Liabilities 3,161,409 37,660 43,936 100,449 26,980 21,637 271,116 64,162 25,578 967 47,451 3,801,345
Classification of assets and liabilities under the different maturity buckets is based on the same estimates and assumptions as used by the Bank for compiling the return submitted to the RBI which has been relied upon by the auditors. Maturity profile of foreign currency assets and liabilities is excluding off Balance Sheet transactions.
13. Concentration of Deposits, Advances, Exposures and NPAs a) Concentration of Deposits ` ‘000s
Particulars March 31, 2020 March 31, 2019
Total deposits of twenty largest depositors 26,975,748 22,439,587% of deposits of twenty largest depositors to total deposits 98.27% 97.05%
b) Concentration of Advances* ` ‘000s
Particulars March 31, 2020 March 31, 2019
Total advances to twenty largest borrowers 111,916,079 85,114,317% of advances of twenty largest borrowers to total advances 67.95% 62.51%
*Advances computed based on definition of Credit Exposure including derivatives as per Master Circular on Exposure NormsDBR.No.Dir.BC.12 /13.03.00/2015-16 dated July 1, 2015.The Bank has compiled the data for the purpose of this disclosure (from its internal MIS system and has been furnished by the Management) which has been relied upon by the auditor.
c) Concentration of Exposures** ` ‘000s
Particulars March 31, 2020 March 31, 2019
Total exposure to twenty largest borrowers/customers 111,992,163 85,379,106% of exposures to twenty largest borrowers/customers to total advances 67.93% 61.82%
**Exposures represent credit, derivatives and investment exposure as prescribed in Master Circular on Exposure Norms DBR.No.Dir.BC.12 /13.03.00/2015-16 dated July 1, 2015.The Bank has compiled the data for the purpose of this disclosure (from its internal MIS system and has been furnished by the Management) which has been relied upon by the auditor.
d) Concentration of NPAs/NPIs*** ` ‘000s
Particulars March 31, 2020 March 31, 2019
Total exposure to top four NPAs/NPIs accounts 1,237,700 1,967,245
***Represents NPAs/NPIs portion of gross exposure i.e. credit, derivatives and investment exposure as prescribed in Master Circular on Exposure Norms DBR.No.Dir.BC.12 /13.03.00/2015-16 dated July 1, 2015.
ECO
NOM
IC &
PO
LITI
CAL
WEE
KLY

SOCIETE GENERALE(Incorporated in France as a Public Limited Company)
CORPORATE & INDIAN BRANCHESINVESTMENT BANKING
Published on Saturday, JUNE 27, 2020 vol lV nos 26 & 27 EPW Economic & Political Weekly236
14. Sector Wise Advances ` ‘000sParticulars 2019-20 2018-19
Sr. No.
Sector* Gross Advances
Gross NPAs
Percentage of Gross NPAs to Total Advances in that sector
Gross Advances
Gross NPAs
Percentage of Gross NPAs to Total Advances in that sector
A Priority Sector 1 Agriculture and allied activities – – – – – –2 Advances to industries sector
eligible as priority sector lending – – – 2,754,365 – –3 Services 138,131 – – 1,141,403 – –4 Personal loans – – – – – –
Sub-total (A)* 138,131 – 3,895,768 – –B Non-Priority Sector 1 Agriculture and allied activities – – – – – –2 Industry 5,246,181 90,000 1.72 % 5,293,466 90,000 1.70%3 Services 11,149,178 699,178 6.27% 6,795,336 1,399,178 20.59%4 Personal loans – – – – – –
Sub-total (B) 16,395,359 789,178 – 12,088,802 1,489,178 –Total (A+B) 16,533,490 789,178 4.77% 15,984,570 1,489,178 9.32%
The Bank has compiled the data for the purpose of this disclosure (from its internal MIS system and has been furnished by the Management) which has been relied upon by the auditors* Bank has outstanding PSLC of `9,280,000/- as of March 2020. (P. Y. `7,725,000).
15. Movement of NPAs ` ‘000sParticulars 2019-20 2018-19Gross NPAs as on 1st April of particular year (opening balance) 1,489,178 700,000Additions (Fresh NPAs) during the year – 789,178Sub-total (A) 1,489,178 1,489,178Less: (i) Up gradations – –(ii) Recoveries (excluding recoveries made from upgraded accounts) (700,000) –(iii) Technical / Prudential Write-offs – –(iv) Write-offs other than those under (iii) above – –Sub-total (B) (700,000) –Gross NPAs as on 31st March (closing balance) (A-B) 789,178 1,489,178
Movement of Technical Write-offs and Recoveries: ` ‘000sParticulars 2019-2020 2018-2019Opening balance of Technical / Prudential written-off accounts as at 1st April – –Add: Technical / Prudential write-offs during the year – –Sub-Total (A) – –Less: Recoveries / Reductions made from previously Technical / Prudential written-off accounts during the year (B)
– –
Closing Balance as at 31st March (A-B) – –
16. The Provision Coverage Ratio (PCR) of the Bank after considering technical write-off, if any is 100% as at March 31, 2020 (P.Y: 69.48%).17. Divergence in Asset Classification and Provisioning for NPAs/NPIs
The RBI vide circular no. DBR.BP.BC.No.63/21.04.018/2016-17 & DBR.BP.BC.No.32/21.04.018/2018-19, titled ‘Disclosure in the Notes to Accounts to the fi nancial statements -Divergence in the asset classifi cation and provisioning’ dated April 18, 2017 & April 01, 2019 respectively has advised banks to include a disclosure with respect to the additional requirement or the additional gross NPA assessed by RBI for the fi nancial year.There has been no NPA divergence observations/comments for the FY2018-19. Accordingly, disclosure as required by above circular is not applicable for FY2019-20.As part of the onsite inspection for supervisory evaluation for FY 2017-18 undertaken, the RBI had pointed out certain retrospective divergence in the Bank’s asset classifi cation and provisioning as on 31st March 2018 in respect of Part B (Investment)portion of Advance restructured under S4A scheme. In conformity with the RBI circulars DBR.BP.BC.NO.63/21.04.018/2016-17 issued on April 18, 2017, the below table outlines divergences in asset classifi cation in respect of Part B (Investment) portion and provisioning:- ` in ‘000s
Sr. Particulars Amount1 Gross NPAs/NPIs as on March 31, 2018* as reported by the bank 700,0002 Gross NPAs/NPIs as on March 31, 2018 as assessed by RBI 1,035,8573 Divergence in Gross NPAs/NPIs (2-1) 335,8574 Net NPAs/NPIs as on March 31, 2018 as reported by the bank 525,0005 Net NPAs/NPIs as on March 31, 2018 as assessed by RBI 860,8576 Divergence in Net NPAs/NPIs (5-4) 335,8577 Provisions for NPAs/NPIs as on March 31, 2018 as reported by the bank 175,0008 Provisions for NPAs/NPIs as on March 31, 2018 as assessed by RBI 175,0009 Divergence in provisioning (8-7) –10 Reported Net Profi t after Tax (PAT) for the year ended March 31, 2018 173,84111 Adjusted (notional) Net Profi t after Tax (PAT) for the year ended March 31, 2018 after taking into
account the divergence in provisioning173,841
* March 31, 2018 is the close of the reference period in respect of which divergences were assessed
ECO
NOM
IC &
PO
LITI
CAL
WEE
KLY

SOCIETE GENERALE(Incorporated in France as a Public Limited Company)
CORPORATE & INDIAN BRANCHESINVESTMENT BANKING
Economic & Political Weekly EPW Published on Saturday, JUNE 27, 2020 vol lV nos 26 & 27 237
18. Overseas Assets, NPAs and Revenue ` ‘000sParticulars March 31, 2020 March 31, 2019Total Assets – –Total NPAs – –Total Revenues – –
19. Off Balance Sheet SPVs sponsored (which are required to be consolidated as per accounting norms)- Domestic and Overseas: NIL (P.Y. – Nil)20. The Bank has not undertaken any factoring business during the Financial Year 2019-20 (P.Y. Nil).21. Indian Accounting Standards (IND-AS)
The Institute of Chartered Accountants of India has issued IND-AS (a revised set of accounting standards) which largely converges the Indian accounting standards with International Financial Reporting Standards (IFRS). The Ministry of Corporate Affairs (MCA) had notifi ed these accounting standards (Ind-AS) for adoption. The RBI has issued a circular applicable to all commercial banks (RBI/2015-16/315 DBR.BP.BC. No. 76/21.07.001/2015-16 dated 11th Feb 2016) on Implementation of Indian Accounting Standards (IND AS). In FY 2018-19 RBI has deferred the IND AS Implementation again as per RBI circular No. RBI/2018-19/146 DBR.BP.BC.No. 29/21.07.001/2018-19 dated 22nd Mar 2019 until further notice. The Reserve Bank of India (RBI) through its press release dated March 22, 2019 has deferred the implementation of Indian Accounting Standards (Ind-AS) till further notice for scheduled commercial banks. In preparedness towards achieving the same, the Bank had prepared proforma fi nancial statements as required by Reserve Bank of India (RBI) vide its circular ref. DBR.BP.BC.No.106/21.07.001/2015-16 dated June 23, 2016, ref. DO.DBR.BP.No.2535/21.07.001/2017-18 dated September 13, 2017 and mail dated July 20, 2018 for every quarter, starting from quarter ended June 30, 2018 up to March 31, 2020 and submitted the same to the RBI. The Bank will continue its preparation towards migration to adopting Ind-AS as per regulatory requirement.
22. Miscellaneous (i) Amount of provisions made for Income-Tax during the year ` ‘000s
Particulars 2019-20 2018-19 – Current tax expense 506,000 475,000 – Tax Provision (Prior Years) (15,236) 7,753Total Tax Expense – A 490,764 482,753 – Deferred tax expense/(benefit) – B (158,377) (378,705)Total (A+B) 332,387 104,048
(ii) Disclosure of Penalties imposed by RBI During the Financial Year 2019-20 and 2018-19, no penalties were imposed on the Bank.
(iii) Bancassurance Business `. ‘000sNature of Income 2019-20 2018-19Selling life insurance policies – –Selling non-life insurance policies – –Selling mutual fund products – –Others (to be specified) – –
(iv) Operating Expenses The major components of other expenditure are as follows: `. ‘000s
Particulars 2019-20 2018-19Subscription charges 32,382 31,410Professional Fees 10,547 10,223Travel Expenses 13,937 16,460
(v) Disclosure on frauds: ` ‘000sParticulars 2019-20 2018-19No. of frauds reported during the period – –Amount involved – –Provision made – –Unamortized provision debited from “Other Reserves” – –
23. Disclosures as per Accounting Standards (AS) (i) Employee Benefi ts- AS 15
Provident Fund: The contribution to the employee’s provident fund amounted to `19,457 for the year ended March 31, 2020 (P.Y. `19,679)In February 2019, the honorable Supreme Court of India in its judgement clarifi ed that certain special allowances should be considered to measure obligations under Employees Provident Funds and Miscellaneous Provisions Act,1952 (the PF act). The Bank has been formally advised that there are interpretative challenges on the application of judgement retrospectively and as such does not consider there is any probable obligations for past periods. With reference to said order the bank does not foresee any such liability.Pension Fund: The contribution to the employee’s pension fund amounted to `NIL for the year ended March 31, 2020 (P.Y. `5,596)Gratuity: The Bank’s gratuity scheme is managed by Life Insurance Corporation of India Ltd. Based on an actuarial valuation the insurance company claims the difference between the present value of the gratuity obligation and the fund value.
ECO
NOM
IC &
PO
LITI
CAL
WEE
KLY

SOCIETE GENERALE(Incorporated in France as a Public Limited Company)
CORPORATE & INDIAN BRANCHESINVESTMENT BANKING
Published on Saturday, JUNE 27, 2020 vol lV nos 26 & 27 EPW Economic & Political Weekly238
The details of the Bank’s postretirement benefi t plans for gratuity for its employees in accordance with AS 15(R) are given below which are certifi ed by the actuary and relied upon by the auditors. ` ‘000s
Reconciliation of Defined Benefit Obligations 2019-20 2018-19Present Value of the Obligation at the beginning of the year 45,950 43,826Interest cost 2,693 3,011Current service cost 6,307 5,986Settlement cost (2,284) –Benefits paid (17,613) (9,425)Actuarial gain/(loss) on obligations 3,709 2,552Present Value of the Obligation at the end of the year 38,764 45,950
Reconciliation of Fair Value of Plan Assets 2019-20 2018-19Fair Value Plan Assets at the beginning of the year 34,677 34,855Expected return on Plan Assets 2,328 2,551Employer's contribution 11,274 5,971Benefits paid (17,613) (9,425)Actuarial gain /(loss) on obligations (689) 725Assets distributed on settlements – –Fair Value Plan Assets at the end of the year 29,978 34,677
Amount to be recognized in Balance Sheet 2019-20 2018-19Present Value of funded obligations 38,764 45,951Fair value of Plan Assets (29,978) (34,677)Present Value of unfunded obligations – –Unrecognized past service cost – –Amount not recognized as an asset – –Net (Asset)/Liability in Balance Sheet under “Other Assets/Other Liabilities and Provisions” 8,786 11,274
Amount to be recognized in Profit and Loss Account 2019-20 2018-19Current service cost 6,307 5,986Interest on defined benefit obligation 2,693 3,011Expected Return on Plan Assets (2,328) (2,550)Settlement Cost (2,284) –Net Actuarial losses/(gains) recognized during the year 4,398 1,826Past service cost – –Total expense recognized in the Profit & Loss Account under “Payments to and Provision for Employees” 8,786 8,274Actual Return on Plan Assets 1,639 3,276
Experience Adjustment # 2019-20 2018-19 2017-18 2016-17 2015-16Defined Benefit Obligation 38,764 45,950 43,826 40,365 41,595Plan Assets 29,978 34,677 34,855 30,939 30,761Surplus/(Deficit) (8,786) (11,274) (8,971) (9,426) (10,834)Gains/(Losses) due to change in assumptions (1,261) (2,721) (1,730) 1,971 990Exp. Adj. on plan Liabilities (2,449) 168 (409) (6,281) (4,037)Exp. Adj. on plan assets (689) 726 (47) 223 (63)
Summary of principal actuarial assumptions 2019-20 2018-19
Discount rate (p.a.) 6.80% 7.60%Expected rate of return (p.a.) 7.50% 7.50%Salary escalation rate (p.a.) 7.00% 7.50%Employees attrition rate Upto 30 years: 10%
31-40 years: 5% 41-50 years: 3%
Above 50 years: 2%
Upto 30 years: 10%31-40 years: 5% 41-50 years: 3%
Above 50 years: 2%Mortality rate Indian Assured
Lives Mortality (2006-2008)
Indian Assured Lives Mortality
(2006-2008) As the Gratuity Fund is managed by a Life Insurance Company, details of Investment are not available with the Bank.
Leave Encashment: The Bank charged an amount of `6,335 (‘000s) as liability for leave encashment for the year ended March 31, 2020 (P.Y. – `5,017 (000s).Long Service Awards: The actuarial liability for Long Service Awards in accordance with AS-15 (R) was `2,136 for the year ended March 31, 2020 (P.Y. `2,504).
ECO
NOM
IC &
PO
LITI
CAL
WEE
KLY

SOCIETE GENERALE(Incorporated in France as a Public Limited Company)
CORPORATE & INDIAN BRANCHESINVESTMENT BANKING
Economic & Political Weekly EPW Published on Saturday, JUNE 27, 2020 vol lV nos 26 & 27 239
Unamortized Pension and Gratuity LiabilitiesAmortization of pension and gratuity liabilities expenditure in terms of circular no. DBOD. No.BP.BC.80/21.04.018/2010-11 dated February 09,2011 is NIL for the year under review (P.Y : Nil)Termination Benefi tsAs part of business restructuring/reorganization the Bank has during the year closed two of its branches situated at Sanand & Chengalpattu and has paid `30,661 (in ‘000) towards termination benefi ts.Employee Stock OptionsSociété Générale (Parent) provides its employees worldwide the opportunity to become shareholders of the company on preferential terms as part of the annual capital increase reserved for the employees. All eligible employees can participate in the “International Group Savings Plan” and subscribe to Société Générale shares within their individual entitlement during the limited period of subscription.The preferential terms include a discount to the reference price and an “Employers Matching Contribution” up to the specifi ed limit per employee. Payments to and provision towards GESOP for employees for FY 19-20 is `720 (in‘000) (P.Y: `Nil) towards this scheme. There is no future liability in respect of this scheme.(ii) Segment Reporting- AS 17 (a) The Bank in India operates as a single unit and there are no identifi able geographical segments. (b) The Bank has classifi ed its business into the following segments, namely:
• Treasury – primarily comprising of trading in forex, bonds, government securities and derivatives. • Corporate/Wholesale Banking - comprising of commercial client relationship and trade fi nance. • Other Banking Operations – comprising of all operations including retail and other than treasury and corporate/wholesale banking.
(c) Segment revenues stated below are aggregate of Schedule 13 – Interest income and Schedule 14 – Other income after considering the net inter-segment fund transfer pricing.
(d) Segment result is net of expenses both directly attributable as well as allocated costs of support functions. (e) Segment assets and liabilities include the respective amounts directly attributable to each of the segments. (f) The Bank does not have retail operations in India.
FY 2019-20 ` ‘000s
Business Segments Particulars
Treasury Corporate / Wholesale Banking
Other Banking Operations
Total
Revenue 2,377,373 1,600,798 – 3,978,171Unallocated Revenue – – – (26,865)Result 2,091,108 (1,306,611) – 784,497Unallocated Results – – – (26,865)Unallocated Expenses – – – –Operating profi t – – – 757,634Income Taxes – – – 332,387Extraordinary Profi t/Loss – – – –Net Profi t – – – 425,247Other Information: – – – –Segment Assets 84,344,116 15,982,673 – 100,326,789 Unallocated assets – – – 1,642,990Total Assets – – – 101,969,779Segment Liabilities 56,462,738 44,921,337 – 101,384,075Unallocated Liabilities – – – 585,704Total Liabilities – – – 101,969,779
Segmental Information is provided as per the MIS available for internal reporting purposes, which includes certain estimates and assumptions. The methodology adopted in compiling and reporting the above information has been relied upon by the auditor.
FY 2018-19 ` ‘000s
Business Segments Particulars
Treasury Corporate / Wholesale Banking
Other Banking Operations
Total
Revenue 2,025,358 2,112,286 – 4,137,644Unallocated Revenue – – – (1,280)Result 1,192,222 (1,031,820) – 160,402Unallocated Results – – – (1,280)Unallocated Expenses – – – –Operating profit – – – 159,122Income Taxes – – – 104,048Extraordinary Profit/Loss – – – –Net Profit – – – 55,074Other Information: – – – –Segment Assets 54,051,947 15,453,500 – 69,505,447Unallocated assets – – – 1,421,668Total Assets – – – 70,927,115Segment Liabilities 31,001,677 39,553,453 – 70,555,130Unallocated Liabilities – – – 371,986Total Liabilities – – – 70,927,115
Segmental Information is provided as per the MIS available for internal reporting purposes, which includes certain estimates and assumptions. The methodology adopted in compiling and reporting the above information has been relied upon by the auditor.
ECO
NOM
IC &
PO
LITI
CAL
WEE
KLY

SOCIETE GENERALE(Incorporated in France as a Public Limited Company)
CORPORATE & INDIAN BRANCHESINVESTMENT BANKING
Published on Saturday, JUNE 27, 2020 vol lV nos 26 & 27 EPW Economic & Political Weekly240
(iii) Related Party Disclosures - AS 18 In the terms of the Accounting Standard 18 on “Related Party Disclosures” and the related guideline issued by the RBI, the details
pertaining to Related Parties are as under:
ParentSociété Générale, France - Head Offi ce and its branches:The Bank has considered transactions with its Parent and other branches of the Parent as ‘one entity’ and accordingly as per the guidance on compliance with the Accounting Standard by Banks issued by the Reserve Bank of India, has not disclosed details pertaining to them.The Bank has disclosed those Subsidiaries/Joint Ventures of the Parent as related parties with whom it has entered into transactions during the current and previous fi nancial year
1. ALD Automotive Private Limited2. BRD Groupe SG Bucharest3. Credit Du Nord4. Komercini Banka5. Newedge Broker India Private Limited.6. Rosbank Moscow7. Société Générale Hambros Bank (Channel ISL)8. Société Générale Hambros Bank Trust, GuernseyW9. Société Générale Securities Asia International Holdings Limited (Hong-Kong)10. Société Générale Spolka Akcyjna W Polsce11. Société Générale Wealth Management Solution Private Limited12. Société Générale Global Solution Centre Private Limited13. SKB Banka DD14. Société Générale Marocaine De Banques, Casablanca15. Société Générale Cyprus16. Société Générale (China) Limited.17. Société Générale Algérie18. Société Générale De Banques Au Senegal19. Société Générale Ghana20. Société Générale Securities India Private Limited (Formerly known as SG Asia Holdings (India) Private Limited)21. Société Générale De Banques Au Benin22. Société Générale de Banques en Cote d’Ivoire23. Union De banques Arabes24. Société Générale Splitska Banka
The above list has been compiled by the management and relied upon by the auditor.
Key Management Personnel:Antoine Castel - Chief Executive & Chief Country Offi cerNote:- In line with the RBI circular DBOD No. BP.BC.23/21.04.018/2015-16 dated July 01, 2015, the Bank has not disclosed details pertaining to related party where under a category there is only one entity/person. Similarly, there has been only one person under Key Management personnel at any given point of time, and therefore, those details are not disclosed.
Disclosure in respect of material transactions with subsidiaries of Head Office: `. ‘000s
Particulars As at March 31, 2020
Maximum Outstanding
during the yearAs at March 31,
2019Maximum
Outstanding during the year
Deposits 7,518,954 2,287,747,258 7,491,950 8,433,862Advances 500,000 870,000 14,713 1,220,000Non-Funded Commitments 239,864 1,455,896 870,547 2,033,362Receivables 3054 3054 – –Payables 59,694 59,694 75,531 75,531
The information is as certified by the management and relied upon by the auditor.
ECO
NOM
IC &
PO
LITI
CAL
WEE
KLY

SOCIETE GENERALE(Incorporated in France as a Public Limited Company)
CORPORATE & INDIAN BRANCHESINVESTMENT BANKING
Economic & Political Weekly EPW Published on Saturday, JUNE 27, 2020 vol lV nos 26 & 27 241
` ‘000s
Particulars 2019-20 2018-19
Interest Expense 360,341 354,984Interest Income 13,365 31,393Rendering of Services* 22,273 28,268Receipt of Services 91,499 111,213
* includes fee income on Non-Funded Commitments and Foreign Exchange transactions
Material related party transactions are given below:The following were the material transactions between the Bank and its related parties for the year ended March 31, 2020. A specifi c related party transaction is disclosed as a material related party transaction wherever it exceeds 10% of all related party transactions in that category.
Interest ExpenseInterest on deposits paid to Société Générale Securities India Private Limited `148,369 (P.Y. `211,439), Société Générale Global Centre Private Limited `191,931 (P.Y. `124,370).
Interest IncomeInterest on loans from ALD Automotive Private Limited `13,284 (P.Y. `31,179).
Rendering of ServicesFee and Commission Income / Other Income / Income on Foreign Exchange transactions received from Société Générale Global Solution Centre Private Limited 12,298 (P.Y. 19,195), Société Générale securities private limited 7,070 (P.Y. NIL), Komercini Bank `1,964 (P.Y. `2,295) and ALD Automotive Private Limited `341 (P.Y. `335).
Receipt of ServicesPayment to ALD Automotive Private Limited NIL (P.Y. `5,653) towards car leasing services and Société Générale Global Solution Centre Private Limited `91,499 (P.Y. Rs 105,561) towards back offi ce support and software services.
(iv) Lease Accounting- AS 19
(a) Nature of Lease – Operating Lease for motor cars, offi ce premises and residential premises for staff.(b) Minimum Lease Payments over the non-cancelable period of the lease: NIL (P.Y. `1,260). ` ‘000s
Particulars 2019-20 2018-19
Up to 1 year – 1,2601-5 years – –Above 5 years – –TOTAL – 1,260
(c) Lease payments recognized in the Profi t and Loss Account during the year: `23,819 (P.Y. `20,678).(d) The lease agreements do not have any undue restrictive or onerous clauses other than those normally prevalent in similar agreements
regarding use of assets, lease escalation clauses, renewals and a restriction on sub-leases.
(v) Taxes on Income-AS 22In accordance with Accounting Standard 22 on “Accounting for taxes on income” issued, the Bank has recognized Deferred Tax Asset (DTA) on timing differences to the extent there is reasonable certainty based on contracts and arrangements in place which will enable the Deferred Tax Asset to reverse:
`. ‘000s
Particulars March 31, 2020 March 31, 2019
Deferred Tax Asset– Provision for standard assets and other provisions 831,912 689,441– Amortization of premium on HTM securities – –– Provision for employee benefi ts 23,836 15,423– Provision on Non-SLR Investments 31,020 31,020– Provision for Sundry Assets – 349– Expenses accrued but disallowed – 5,827Deferred Tax Liability– Difference in Accounting and Tax Depreciation (128,383) (142,052)Net Deferred Tax Asset/(Liability) 758,385 600,008
ECO
NOM
IC &
PO
LITI
CAL
WEE
KLY

SOCIETE GENERALE(Incorporated in France as a Public Limited Company)
CORPORATE & INDIAN BRANCHESINVESTMENT BANKING
Published on Saturday, JUNE 27, 2020 vol lV nos 26 & 27 EPW Economic & Political Weekly242
(vi) Particulars of intangible assets `. ‘000sApplication Software March 31, 2020 March 31, 2019Gross BlockAt cost as at 31st March of the preceding year 486,727 545,798Additions during the year 5525 889Deductions during the year (676) (59,959)TOTAL: 491,576 486,727Depreciation / AmortizationAs at 31st March of the preceding year (474,733) (498,388)Charge for the year (12,660) (36,296)Deductions during the year 676 59,951Depreciation to date (486,717) (474,733)Net block 4,859 11,994
(vii) Capital Commitments ` ‘000sCapital Commitments March 31, 2020 March 31, 2019Estimated amount of contracts remaining to be executed on capital account and not provided for. 15,200 -
24. Additional Disclosures (i) Provisions and Contingencies
Description of Contingent LiabilitiesClaims against the Bank not acknowledged as debt.The Bank has responded to the notice received from Directorate of Enforcement on an existing matter related to FEMA. The Bank does not expect the outcome of these proceedings, if any, to have a material adverse effect on the Bank’s fi nancial conditions, results of operations or cash fl ows.Other items for which the Bank is contingently liableThis also includes contingent liability corresponding to amount transferred do Depositor Education and Awareness Fund (DEAF), the capital commitments given to vendors, constituent subsidiary general ledger balance, Municipal demand under protest and undrawn commitment funded credit lines.Tax contingent liability - The Bank expects the outcome of the appeals to be favorable based on decisions on similar issues in the previous years by the appellate authorities, based on the facts of the case and taxation laws.Liability on account of forward exchange and derivative contractsThe Bank enters into foreign exchange contracts, currency options, forward rate agreements, currency swaps, interest rate swaps and interest rate options on its own account and for customer. The notional amounts that are recorded as contingent liabilities form the basis for the calculation of the interest component on the contracts where applicable.Guarantees given on behalf of constituents, Acceptances, Endorsements and other obligationsAs a part of its normal banking activities, the Bank issues documentary credit and guarantees on behalf of its customer.Provisions and Contingencies recognized in the Profi t and Loss Account include: `‘000
Provision and Contingencies 2019-20 2018-19I. Taxation Charge – Current tax expense 506,000 475,000 – Tax Provision (Prior Years) (15,236) 7,753 – Deferred tax expense/ (benefi t) (158,377) (378,705)II. Provision / (Write back) for loan losses (245,534) 859,712III. Provision for Standard Assets 551,138 85,978IV. Provision for Diminution in value of Investment (2,668) (51,596)V. Provision for Country Risk (1,339) (4,501)VI. Provision for Un-Hedged Foreign Currency Exposure 20,938 (726)VII. Provision for Sundry Assets (Net of Write back) (800) (7,733)VIII. Other losses/write-offs – –IX. Provision for Large Exposure 38,107 (19,711)X. Provision for Stressed Assets 428 (6,782)
TOTAL 692,657 958,689(ii) Floating Provisions: Nil (P.Y. Nil)(iii) Draw down from Reserves: The Bank did not have drawdowns from reserves during the year ended March 31, 2020 (P.Y. Nil).(iv) Disclosure of Complaints:
Sr. No. Customer Complaints 2019-20 2018-19a) No. of complaints pending at the beginning of the year – –b) No. of complaints received during the year 3 3c) No. of complaints redressed received during the year 3 3d) No. of complaints pending at the end of the year – –
The above information does not include complaints redressed within 1 working day and is as certified by the Management and relied upon by the auditor.
ECO
NOM
IC &
PO
LITI
CAL
WEE
KLY

SOCIETE GENERALE(Incorporated in France as a Public Limited Company)
CORPORATE & INDIAN BRANCHESINVESTMENT BANKING
Economic & Political Weekly EPW Published on Saturday, JUNE 27, 2020 vol lV nos 26 & 27 243
(v) Disclosure of Awards passed by the Banking Ombudsman
Sr. No. Awards passed by the Banking Ombudsman 2019-20 2018-19a) No. of unimplemented awards at the beginning of the year – –b) No. of awards passed by the Banking Ombudsmen during the year – –c) No. of awards implemented during the year – –d) No. of unimplemented awards at the end of the year – –
The above information is as certifi ed by the Management and relied upon by the auditor. (vi) Disclosure of Letters of Comfort
The Bank has not issued any Letter of Comfort during the year. The assessed cumulative financial obligation under the Letters of Comfort issued and outstanding is `Nil. (P.Y. NIL)
(vii) Provision for Long Term contractsThe Bank has a process whereby periodically all long-term contracts (including derivative contracts) are assessed for material foreseeable losses. At the year end, the Bank has reviewed and recorded adequate provision as required under any law/accounting standards for material foreseeable losses on such long-term contracts (including derivative contracts) in the books of accounts and disclosed the same under the relevant notes in the financial statements.
(viii) PSLCs sold and purchased during the year ended March 31, 2020 `‘000
Particulars 2019-20 2018-19
Purchased Sold Purchased Sold
PSLC – Agriculture – – – –PSLC – SF/MF – – – –PSLC – Micro Enterprises 6,280,000 – 2,225,000 –PSLC – General 3,000,000 – 5,500,000 –
(ix) Disclosures on RemunerationIn accordance with the requirement of the RBI Circular No. DBOD.NO.BC.72/29.67/001/2011-12 dated 13 January 2012, the Bank has submitted to the RBI a letter from the Head Office which states that the compensation policies in India including that for the Chief Executive Officer are in line with the Financial Stability Board (FSB) requirements.
(x) Disclosure on Corporate Social Responsibility (CSR) Expenditure (a) As per the provisions of section 135 of the companies Act, 2013, amount to be contributed by the Bank is `4,487 (‘000) (based on
2% of average net profi ts before tax of three immediate preceding fi nancial years) (b) As per RBI circular DBOD. No. DIR.BC. 50/13.01.01/2005-06 dated December 21, 2005, amount to be contributed by the Bank
is `3,182 (‘000s) (based on 2% of published profi ts for the previous year) (c) Amount spent during the year ` ‘000s
Particulars Paid (i) Construction/ acquisition of any asset –(ii) On purpose other than (i) above 4,418
(xi) Disclosure on transfer to Depositor Education and Awareness Fund (DEAF) ` ‘000s
Particulars 2019-20 2018-19Opening balance of amounts transferred to DEAF 2,925 2,313Add: Amounts transferred to DEAF during year 732 612Less: Amounts reimbursed by DEAF towards claims – –Closing balance of amounts transferred to DEAF 3,657 2925
(xii) Based on the available information, there are no outstanding dues towards principal amount or interest thereon remaining unpaid to any supplier covered under, Micro, Small and Medium Enterprises Development Act, 2006 as at the end of the accounting year. Further, no interest was due or payable by the Bank to any supplier during the year under the provisions of the said Act. This information has been provided by the management and relied upon by the auditor.
(xiii) Unhedged Foreign Currency ExposuresThe Bank has provided for unhedged foreign currency exposure as per RBI master circular DBOD.No.BP.BC.2/21.04.048/2015-16 dated 01 July 2015 on prudential norms on income recognition, asset classifi cation and provisioning pertaining to advances. The Bank considers all customers who have borrowed from the Bank and covers gross sum of all items on the customer’s balance sheet that has an impact on the profi t and loss account due to movement in foreign exchange rates. While providing for unhedged foreign currency exposure, the Bank has considered both fi nancial hedges and natural hedges. The Bank has internally devised the mechanism of identifying the un-hedged foreign currency exposure to individual clients based on the latest certifi cates.Provision towards unhedged foreign currency exposure as on March 31, 2020 is `21,188 (in ‘000s) (P.Y. `249) and the capital held by the Bank towards this risk is `148,148 (P.Y. NIL).
ECO
NOM
IC &
PO
LITI
CAL
WEE
KLY

SOCIETE GENERALE(Incorporated in France as a Public Limited Company)
CORPORATE & INDIAN BRANCHESINVESTMENT BANKING
Published on Saturday, JUNE 27, 2020 vol lV nos 26 & 27 EPW Economic & Political Weekly244
(xiv) Liquidity Coverage Ratio (LCR) `‘000sSr.No.
Particulars Quarter Ended31-Mar-2020
Quarter Ended31-Dec-2019
Quarter Ended30-Sep-2019
Quarter Ended30-June-2019
Quarter Ended31-Mar-2019
Total Un-Weighted
Value (average)
Total Weighted
Value (average)
Total Un-Weighted
Value (average)
Total Weighted
Value (average)
Total Un-Weighted
Value (average)
Total Weighted
Value (average)
Total Un-Weighted
Value (average)
Total Weighted
Value (average)
Total Un-Weighted
Value (average)
Total Weighted
Value (average)
High Quality Liquid Assets 1 Total High-Quality Liquid Assets (HQLA) 268,770 268,770 240,485 240,485 188,353 188,353 172,390 172,390 138,880 138,880 Cash Outfl ows 2 Retail deposits and deposits from small
business customers, of which: – – – – – – 4 0 8 1
(i) Stable deposits – – – – – – – – 8 1(ii) Less stable deposits – – – – – – 4 – – –3 Unsecured wholesale funding, of which: 253,849 138,788 245,726 134,944 228,603 117,711 229,092 102,868 235,062 108,101 (i) Operational deposits (all counterparties) – – – – – – – – – – (ii) Non-operational deposits (all
counterparties) 191,768 76,707 184,637 73,855 184,820 73,928 210,373 84,149 211,602 84,641
(iii) Unsecured debt 62,081 62,081 61,089 61,089 43,783 43,783 18,719 18,719 23,461 23,461 4 Secured wholesale funding – – – – – – – – – 5 Additional requirements, of which 14,371 5,057 10,930 3,845 18,388 5,531 14,043 6,670 24,387 6,771 (i) Outfl ows related to derivative exposures
and other collateral requirements 817 817 798 798 1,143 1,143 3,510 3,510 14,025 3,663
(ii) Outfl ow related to loss of funding on debt products
– – – – – – – – – –
(iii) Credit and liquidity facilities 13,555 4,240 10,131 3,046 17,245 4,387 10,534 3,160 10,362 3,109 6 Other contractual funding obligations 280,418 280,418 230,646 230,646 248,914 248,914 169,677 169,677 137,037 137,037 7 Other contingent funding obligations 350,846 12,844 336,724 11,919 327,252 11,805 277,477 9,231 273,647 8,209 8 Total Cash Outfl ows 899,483 437,107 824,026 381,354 823,157 383,961 690,293 288,446 670,141 260,119 Cash Infl ows 9 Secured lending – – – – – – – – – – 10 Infl ows from fully performing exposures 94,231 68,314 97,359 67,754 112,229 75,588 104,299 57,293 117,914 60,568 11 Other cash infl ows 308,153 308,153 263,243 263,243 276,584 276,584 216,072 216,072 159,933 159,933 12 Total Cash Infl ows 402,385 376,468 360,602 330,997 388,814 352,172 320,372 273,366 277,847 220,501 13 Total HQLA* 268,770 240,485 188,353 172,390 138,88014 Total Net Cash Outfl ows* 109,277 95,338 95,990 72,244 65,03015 Liquidity Coverage Ratio (%)* 248.44% 251.44% 195.63% 243.00% 205.65%
* The average weighted, unweighted amounts, TOTAL HQLA, Total Net Cash Outflow, LCR are calculated taking simple average of month end numbers for each quarter.Qualitative Disclosure1) In accordance with Basel III norms, the LCR requirement has been introduced by RBI for banks in India effective January 1, 2015
with a minimum 60% for the calendar year 2015, rising in equal steps each calendar year to reach the minimum 100% requirement by January 1, 2019. The minimum requirement for calendar year 2017 is 80%, for 2018 is 90% and for 2019 is 100%.
2) LCR standard aims to ensure suffi cient liquidity within the bank through High Quality Liquidity Assets (HQLA) to survive acute stress scenario lasting for 30 days, as it is expected that the bank will take appropriate corrective action within 30 days.
3) Banks HQLA primarily consists of GSEC investments above the SLR limit and Government securities within the mandatory SLR requirement, to the extent allowed by RBI under MSF and FALLCR.
4) The Bank’s ALCO is responsible for liquidity risk management on an overall basis, providing guidance to respective stakeholders within the Bank.
5) The aforementioned table provides the quarterly LCR computation for the four quarters of the Financial Year 2019-20. The LCR is being monitored on daily basis effective January 1, 2017. Accordingly, fi gures are reported as simple average of daily observation for 90 days for all quarters of the FY 2019-20.
6) In computing the above information, certain estimates/assumptions have been made by the Bank’s management which have been relied upon by the auditor.
(xv) Miscellaneous income includes recovery from network, processing fees, rental income etc.(xvi) In terms of RBI Master Circular on Foreign Investments in India dated July 1, 2015, the bank does not have any subsidiary companies
and as such no certifi cate was required from the statutory auditors on an annual basis as regards status of compliance with the instruction on downstream investments in compliance with the FEMA provisions.
(xvii) The Bank has received no complaints for its disposal under the provisions of The Sexual Harassment of Women at Workplace (Prevention, prohibition and Redressal) Act, 2013.
(xviii) Previous year’s fi gures have been regrouped or rearranged, wherever necessary, to conform to current year’s presentation.
For Société Générale – Indian BranchesAntoine Castel Ashok KrishnamoorthyChief Executive and Chief Country Officer - India Chief Financial Officer/Chief Operating Officer - IndiaPlace: MumbaiDate: June 23, 2020
ECO
NOM
IC &
PO
LITI
CAL
WEE
KLY

SOCIETE GENERALE(Incorporated in France as a Public Limited Company)
CORPORATE & INDIAN BRANCHESINVESTMENT BANKING
Economic & Political Weekly EPW Published on Saturday, JUNE 27, 2020 vol lV nos 26 & 27 245
Basel III disclosures of the Indian Branches for the year ended 31 March 2020All amounts in ` ‘000s, unless otherwise stated
DF 1. Scope of application 1. Qualitative and Quantitative Disclosures: The Bank is subject to the capital adequacy guidelines stipulated by RBI, which are based on the framework of the Basel Committee on
Banking Supervision. As per Basel III guidelines, the Bank is required to maintain a minimum Capital to Risk Weighted Assets Ratio (CRAR) of 9% {12.5% including Capital Conservation Buffer (CCB) and additional CET 1 requirement under Global Systemically Important Bank}, with minimum Common Equity Tier I (CET1) of 5.5% (8% including CCB) as on 31st March 2020. These guidelines on Basel III has been implemented on 1st April 2013 in a phased manner. The minimum capital required to be maintained by the Bank for the year ended 31st March 2020 is 9% with minimum Common Equity Tier 1 (CET1) of 5.5%. The risk management framework of Indian operations is integrated with the Bank’s strategy and business planning processes at global level. The Bank has comprehensive risk management framework to monitor, evaluate and manage the principal risks assumed in conducting its activities. The risk management function in India is as per directives and framework set out at Head Offi ce level. As at March 31, 2020, the Bank does not have any investment in subsidiaries/Joint Ventures and Associates, signifi cant minority equity investment in insurance, fi nancial and commercial entities.
2. Capital structure Qualitative Disclosures
Bank regulatory capital consists of two components – Tier 1 capital and Tier 2 capital. Both components of capital provide support for banking operations and protect depositor. As per Reserve Bank of India (RBI) guidelines, the composition of capital instruments for foreign banks in India would include the following elements:Tier 1 Capital:● Interest-free funds received from Head Offi ce● Statutory reserves kept in Indian books● Remittable surplus retained in Indian books which is not repatriable so long as the bank functions in India● Capital Reserves● Interest-free funds remitted from Head Offi ce for acquisition of propertyTier 2 Capital:● General provisions and loss reserves: General provisions and loss reserves can be reckoned up to a maximum of 1.25 per cent of the total Credit risk-weighted assets.
Such provisions and reserves include provisions on Standard Assets, Country Risk Exposures, Unhedged Foreign Currency Exposures and Investment Reserve Account’.
Head Offi ce borrowings in foreign currency raised by foreign banks operating in India classifi ed as subordinated debt subject to a maximum ceiling of 50% of the Tier 1 capital maintained in India.
Quantitative Disclosurea) Tier 1 Capital (` ‘000s)
Amount Received from Head Offi ce 14,148,680Statutory Reserves 1,247,896Remittable Surplus Retained in India for CRAR 1,018,465Capital Reserves 305,058Interest-free funds remitted from Head Offi ce for acquisition of property 345,068Less: Intangible Assets and Deferred Tax Assets (763,243)Total Tier 1 Capital 16,301,924
b) Tier 2 Capital (` ‘000s)General Provisions and loss Reserves reckoned up to a maximum of 1.25 per cent of the total Credit risk-weighted assets 1,375.126Amount eligible to be reckoned as capital funds 1,375,126
c) Debt Capital Instruments Eligible for inclusion in Upper Tier 2 Capital (` ‘000s)Total Amount Outstanding – of which amount raised during the current year –Amount eligible to be reckoned as capital funds –
d) Subordinated Debt Eligible for inclusion in Lower Tier 2 Capital (` ‘000s)Total amount outstanding – of which amount raised during the current year –Amount eligible to be reckoned as capital funds –
Total Tier 2 Capital (b) + (c) + (d) 1,375,126
e) Other deduction from capital. There are no other deductions from capital.
f) Total Eligible Capital The total eligible capital is `17,677,050 (‘000s).
ECO
NOM
IC &
PO
LITI
CAL
WEE
KLY

SOCIETE GENERALE(Incorporated in France as a Public Limited Company)
CORPORATE & INDIAN BRANCHESINVESTMENT BANKING
Published on Saturday, JUNE 27, 2020 vol lV nos 26 & 27 EPW Economic & Political Weekly246
DF 2. Capital AdequacyQualitative DisclosuresThe Bank has assessed its capital requirement taking into account the 3 main risks as defi ned by Pillar 1 of the Basel III norms viz: Credit Risk, Market Risk and Operational Risk. The Credit Risk is computed using the Standardized Approach, the Market Risk is calculated using the Standardized Duration Approach and the Operational Risk is calculated using the Basic Indicator Approach. The risk computation under each of these 3 categories is adequately covered by the Capital of the Bank.The Bank has assessed its future capital requirement and the same has been documented in the ICAAP (Internal Capital Adequacy Assessment Process) based on the position as of March 31’2020. The capital requirement will be re-assessed taking into consideration the position of the Bank for the fi nancial year ended March 31’2020.The existing level of Capital is adequate to meet the Bank’s current and future business requirements and the CRAR ratio of the Bank is signifi cantly higher than that prescribed by the regulator. A summary of the Bank’s capital requirement for credit, market and operational risk and the capital adequacy ratio as on 31st March 2020 is presented below:Quantitative Disclosures (` ‘000s)
(a) Capital Requirements for Credit Risk:Portfolios subject to Standardized Approach 9,900,906Securitization Exposures –
(b) Capital Requirements for Market Risk: Standardized Duration Approach:Interest Rate Risk 1,869,475Foreign Exchange risk (including Gold) 270,000Equity Risk –
(c) Capital Requirement for Operational Risk: Basic Indicator Approach 345,285
Total Eligible Capital 17,677,050Total Risk Weighted Assets 1,40,589,999Total Capital Ratio 12.58%Tier 1 Capital Ratio 11.60%
DF 3. Credit risk: general disclosuresQualitative DisclosuresCredit Risk has been defi ned as the risk of fi nancial loss if counterparty defaults on an obligation under a contract. It arises mainly from direct lending, off-balance sheet exposures such as guarantees & derivatives and from the Bank’s investments in debt securities.Strategy and processes (including credit risk management policy of the Bank)The credit risk management framework is based upon Société Générale group policies and revolves around certain key principles All transactions and facilities must be authorized in advance. All requests for authorizations relating to a specifi c client or client group are handled by a single operating division. All authorizations are given by an independent risk department, and approval rests on a framework based on internal counterparty risk
ratings, Loss given default and a risk-adjusted return on capital analysis There are internal caps on the total sub-investment grade exposure (defi ned as internal rating of 6 (six) or below), exposure to sensitive
sectors and on the extent of unsecured exposure. There are also specifi c controls on exposures to banks and fi nancial institutions, designed to ensure against excessive risk concentration.Structure and Organization:The risk ratings are proposed by the operating divisions and are validated by the respective Risk Divisions at the Regional/Head Offi ce (HO) Hubs. The Risk department is independent of the operating divisions. Risk ratings are included in all credit proposals and are factored into all credit decisions.There is a specialized and centralized department for fi nancial institutions which is located at Regional/HO hubs.Scope and nature of risk reporting and measurement:The internal rating models measure counterparty risk (expressed as a probability of default by the borrower in one year) and transaction risk (expressed as the amount that will be lost should a borrower default). An in-house database stores all credit limits.The risk on counterparty exposure on market transactions is measured by modeling the future mark to market value of transactions, after taking into account netting and correlation effects.Non-performing advances:Non-performing advances are identifi ed by regular appraisals of the portfolio by management or in accordance with RBI guidelines, whichever is earlier. Specifi c provision is made on a case by case basis, subject to minimum provisioning levels prescribed by RBI. Special attention is paid to early identifi cation of problem exposures. The Bank’s approach towards problem exposures is: Quick identifi cation and isolation of potential weak /non-performing credits for concentrated attention through inclusion in the watch
list. Watch list discussions are attended by Senior Management, Head of Risk and the Relationship Manager. Continued and rigorous follow up of these credits with the intention to monitor a possible turnaround or an early exit. A structured and sustained pro-active approach complemented by a rigorous follow up procedures.For recognition of past due and impaired loans and advances, the Bank follows guidelines prescribed by Reserve Bank of India as contained in the Master Circular on Prudential norms on Income Recognition, Asset Classifi cation and Provisioning, as amended from time to time and other relevant circulars/notifi cations issued by RBI during the course of the year in this regard.
ECO
NOM
IC &
PO
LITI
CAL
WEE
KLY

SOCIETE GENERALE(Incorporated in France as a Public Limited Company)
CORPORATE & INDIAN BRANCHESINVESTMENT BANKING
Economic & Political Weekly EPW Published on Saturday, JUNE 27, 2020 vol lV nos 26 & 27 247
Quantitative Disclosuresa) Total gross credit risk exposure (` ‘000s)
Fund Based Non-Fund Based TotalAs at 31 March 2020 63,396,678 14,358,936 77,755,614
b) Geographic distribution of exposures (` ‘000s) As at 31.03.2020
Fund Based Non-Fund Based TotalOverseas – – –Domestic 63,396,678 14,358,936 77,755,614Total 63,396,678 14,358,936 77,755,614
c) Industry type distribution of exposures (` ‘000s)
Industry Funded Non-Funded Grand Total
Cement and Cement Products – 156,013 156,013Chemical and chemicals products 500,000 – 500,000Food Processing 1,658,040 2,416,805 4,074,845Infrastructure 2,276,400 2,262,087 4,539,487Mining & Quarrying-Others – 109,077 109,077All Engineering – Others 1,474,849 2,385,161 3,860,010Banking & Finance 412,765 3,472,095 3,893,860NBFC 76,00,000 800,000 84,00,000Financial Institution 703,355 – 703,355Vehicles, Vehicle Parts and Transport Equipments – 250 250
Other Industries 48,762,269 2,756,729 51,518,998Total 63,396,678 14,358,936 77,755,614
• Fund-based exposure represents funded loans & advances including overdrafts, cash credits and bill discounting.• Non-fund-based exposures are guarantees given on behalf of constituents, Letters of Credit, Undrawn binding commitments,
acceptances and endorsements.• The exposure amount is the net outstanding (i.e. net of provisions and credit risk mitigants, if any)• The increase in exposures by 25% due to unhedged foreign currency exposure is not considered in the above fi gures.
d) Residual contractual maturity breakdown of assets (` ‘000s) As at 31.03.20201 day 76,230,2252-7 days 2,053,7458-14 days 15,14915-30 days 2,598,08631 days and up to 2 months 750,989over 2 months and up to 3 months 2,479,451Over 3 Months and up to 6 months 1,413,837Over 6 Months and up to 1 year 754,385Over 1 Year and up to 3 years 14,266,029Over 3 Years and up to 5 years 121,865Over 5 years 1,286,060Total 101,969,779
e) Amount of NPAs (Gross) – `789,178 (P.Y. `1,489,178) in ‘000’ f) Net NPAs- Nil (P.Y. `454,466) in ‘000’ g) NPA Ratios
• Gross NPAs to gross advances 4.77 % (P.Y.9.32%)• Net NPAs to net advances- Nil (P.Y. 3.04%)
h) Movement of NPAs (` ‘000s)Gross NPAs Provision Net NPA
Opening balance 1,489,178 1,034,712 454,466Additions – – –Reduction (including write backs / write offs) 700,000 245,534 454,466Closing balance 789,178 789,178 –
i) Non-performing investments – `267,708 (P.Y. `297,245) in ‘000’ j) Provisions held for non-performing investments – `103,808 (P.Y. `131,842) in ‘000’
ECO
NOM
IC &
PO
LITI
CAL
WEE
KLY

SOCIETE GENERALE(Incorporated in France as a Public Limited Company)
CORPORATE & INDIAN BRANCHESINVESTMENT BANKING
Published on Saturday, JUNE 27, 2020 vol lV nos 26 & 27 EPW Economic & Political Weekly248
k) Movement of provisions for depreciation on investments (` ‘000s)
2019-20Opening Balance at beginning of the year 174,798Add: Provisions made during the year –Less: Write-off/write-back of excess provisions during the year (2.668)Closing Balance at end of the year 172,130
DF 4. Credit risk: disclosures for portfolios subject to the standardized approachQualitative DisclosuresThe Bank relies on the ratings given by the following External Credit Rating Agencies (ECRAs) approved by the RBI to calculate its capital requirement under the standardized approach for credit riskDomestic Credit Rating Agencies for external ratings of Indian Corporates:1) Credit Analysis and Research Ltd. (CARE)2) CRISIL.3) India Ratings & Research Private Limited (earlier known as FITCH India)4) ICRA Ltd, Brickwork Ratings India Pvt. Ltd., SMERA Ratings LimitedThe Bank has used issue-specifi c solicited ratings available in the public domain (for both Long Term and Short-Term facilities) from the above domestic rating agencies to allocate appropriate risk weighting for both funded as well as non-funded exposures on corporate customer.The mapping of external credit ratings and risk weights for corporate exposures is provided in the tables below:
Risk weight mapping of long-term corporate ratings
Long term ratings Risk weights
AAA 20%AA 30%A 50%BBB 100%BB & Below 150%Unrated 100%
Risk weight mapping of short term corporate ratings
CARE CRISIL FITCH ICRA Risk weightsPR1+ P1+ F1+ A1+ 20%PR1 P1 F1 A1 30%PR2 P2 F2 A2 50%PR3 P3 F3 A3 100%PR4 & PR5 P4 & P5 F4/F5 A4 & D 150%Unrated Unrated Unrated Unrated 100%
The claims on banks incorporated in India and foreign banks branches in India, excluding investment in equity shares and other instruments eligible for capital status are risk weighted as under:
Level ofCommon Equity Tier 1 capital (CET1) including applicable capital conservation buffer (CCB) (%)
All Scheduled Banks All Non-Scheduled Banks
Applicable Minimum CET1 + Applicable CCB and above 20 100 Applicable Minimum CET1 + CCB = 75% and <100% of applicable CCB33 50 150 Applicable Minimum CET1 + CCB = 50% and <75% of applicable CCB 100 250 Applicable Minimum CET1 + CCB = 0% and <50% of applicable CCB 150 350 Minimum CET1 less than applicable minimum 625 625
International ECRAs for external ratings of Foreign Banks, Foreign Sovereigns, Foreign Public-Sector Entities and Non-Resident Corporates:a) Fitchb) Moody’sc) Standard & Poor’sThe mapping of external credit ratings and risk weights for the above entities are provided in the tables below to the extent applicable.
Risk weights of Claims on foreign banks:
S &P / Fitch ratings AAA to AA A BBB BB to B Below B UnratedMoody’s ratings Aaa to Aa A Baa Ba to B Below B UnratedRisk weight (%) 20 50 50 100 150 50
ECO
NOM
IC &
PO
LITI
CAL
WEE
KLY

SOCIETE GENERALE(Incorporated in France as a Public Limited Company)
CORPORATE & INDIAN BRANCHESINVESTMENT BANKING
Economic & Political Weekly EPW Published on Saturday, JUNE 27, 2020 vol lV nos 26 & 27 249
Amount outstanding under various risk buckets: (` ‘000s)
As at 31.03.2020
Below 100 % risk weight 181,509,448100 % risk weight 10,233,171More than 100 % risk weight 15,435,462Deducted –Total** 207,178,081
**The increase in exposures by 25% due to unhedged foreign currency exposure (` 5,217,295) is not considered in the above fi gures.
DF 5. Credit risk mitigation: disclosures for standardized approaches:Qualitative DisclosuresPolicy for collateral valuation and ManagementAll corporate and institutional facilities are reviewed (and hence revalued) at least on an annual basis. All deeds of ownership/ titles related to collateral are held in physical custody under the control of executive’s independent of the business. Unsecured exposures cannot exceed the overall ceiling fi xed for such facilities.The main categories of recognized collateral taken by the Bank conform to the list of eligible fi nancial collateral advised in RBI’s Prudential guidelines on Capital Adequacy and Market discipline and include cash on deposits, marketable equities, and recognized debt securitiesThe Bank also extends credit facilities against guarantees from international corporates and banks. For a corporate guarantee to be recognized as a credit risk mitigant, the guarantor must have a rating of A or above from Standard & Poor’s, Fitch and / or Moody’s.The Bank is not active in securitization of standard assets in India.Quantitative Disclosures:As on March 31, 2020, the total exposure covered by eligible fi nancial collateral after application of haircuts was 7,579,716 (P.Y. 3,958,751) in 000s.
DF 6. Securitization: disclosure for standardized approachThe Bank has not undertaken any securitization operation during the year.
DF 7. Market risk in trading bookQualitative DisclosuresMarket risk arises out of the fl uctuation in the interest rates, foreign exchange rates and the consequent change in the prices of various fi nancial instruments held by the Bank. The fi nancial instruments are revalued daily as per the guidelines issued by the regulatory authorities. The change in the valuation of the fi nancial instruments may result in profi t or loss for the Bank.The primary objective of Bank’s market risk management is the continuous and independent mo(20nitoring of positions, market and counterparty risks incurred by the Bank’s trading activities, and the comparison of these positions and risks with established limits.Strategy and Process:All open Market Risk is subject to approved limits. The limits are set based on the projected business plan of the Risk Taking Unit, market environment and the risk perception. The internal HO Market Risk limits are defi ned as per the HO Market Risk policy under which the requests for limits are made by the relevant business line accompanied by supporting rationale (viz. projected business plan and historical utilizations). Market Risk team at the Regional/HO level then reviews and validates the limits in discussion with the business lines. All approved limits are then recorded in the reference systems for Market Limits (Colibris). The approved Market Risk limits are also presented to the Bank’s ALCO, which reviews and revalidates the limits. The limits are reviewed on an annual basis or if particular circumstances arise.In addition to the HO Market Risk limits, SG India also has local Stress Test, portfolio-wise VaR and PV01 limits. The local limits setting process involves, initiation of the request for limits by Treasury Front Offi ce (TFO) to Chief Risk Offi cer (CRO), which then reviews and validates the limits based on the rationale provided by the TFO. While reviewing the proposed limits, the CRO considers the business plan forecasts, past utilizations, market environment and risk perception. Subsequently, the limits are then presented to ALCO for its approval. The ALCO takes into consideration TFO’s capacity and capability to perform within the proposed limits evidenced by the experience of the Traders, controls and risk management, audit ratings and trading revenues. Post approval by the ALCO, the limits are documented in the limits package of SG India and updated in all the relevant risk monitoring reports. SG India also has Stop Loss limits applicable to the trading desk that is approved by the ALCO and the respective business head at the SG’s Regional Offi ce.Structure and organization of market risk managementThe local CRO is overall responsible for the management of Market Risk under support and guidance from the Market Risk Department (Risq/RMA) at the HO Level. The local CRO, functions within the broad framework defi ned by Risq/RMA, HO and ensures compliance with the local regulatory requirements. It works independently of Front Offi ce, who have no hierarchical authority over CRO and no pressure may be brought to bear by traders in relation to allocated limits or calculated risk amounts used by CRO. The TFO is the Risk Taking Unit within the bank. The primary responsibility for risk management of market transactions is held by TFO s as part of the ongoing management of their activities and the continuous monitoring of their positions.Scope and nature of risk measurement, risk reporting and risk monitoring system:Market risk is monitored and controlled using parameters, such as, Value at Risk (VaR), Sensitivity limits (parallel shift in interest rates), net open position limit (Foreign exchange positions) and stress test. The bank has set limits on each of these parameters and the utilizations are reported on a daily basis to the senior management.
ECO
NOM
IC &
PO
LITI
CAL
WEE
KLY

SOCIETE GENERALE(Incorporated in France as a Public Limited Company)
CORPORATE & INDIAN BRANCHESINVESTMENT BANKING
Published on Saturday, JUNE 27, 2020 vol lV nos 26 & 27 EPW Economic & Political Weekly250
All trading transactions are booked in the front offi ce deal booking system called X-ONE. This system is capable of calculating the position and sensitivity on treasury transactions that are used by TFO to view the risk on their portfolio. Additionally, TFO refers to another system called ‘Mercury’ to view the sensitivities on their positions. The Market Risk parameters like VaR, stress tests, Interest Rate sensitivity (10bps) and Forex Spot Position are computed by the Market Risk Department at HO (RISQ/RMA) using systems called RISK-ONE and AGRisk. The local CRO compiles the sensitivities and VaR report for the Bank’s portfolio using reports received from the Regional Offi ce as well as those that are generated locally using RISK-ONE system. The SG’s VaR model uses historical simulation methodology based on a 1-day time horizon at the 99% confi dence interval using a 1-year sliding window.The bank has adopted stress testing as an integral part of its risk management framework and as such it is used to evaluate potential vulnerability to some unlikely but plausible events or movements in fi nancial variable. While there is a well-defi ned global framework designed at the SG’s HO level on stress test, that covers all the geographical locations and markets including the Indian branches of SG, the bank has adopted a localized stress test framework to incorporate the local risk factors having an impact on the Bank’s portfolio. The Bank performs Market Risk Stress Test on a quarterly basis for both the Trading and accrual portfolios. The methodology, assumptions, scenarios and results of the Stress Test are presented to ALCO and APEX Committee for discussion and review.Capital requirements for market risk: (` ‘000s)
Standardized duration approach 31.03.2020Interest rate risk 1,869,475Foreign exchange risk 270,000Equity risk –Capital requirements for market risk 21,394,475
DF 8. Operational Risk:Qualitative disclosuresThe operational risk is defi ned as the risk of loss resulting from inadequate or failed internal processes, people and systems or from external events. This defi nition includes legal risk but excludes strategic and reputation risks.Strategy and ProcessThe Bank has an Incident Management policy in place which classifi es Operational Risk events into 8 major heads and 58 sub heads to map with the Basel II Loss Event Type Classifi cations, Event Description, Corrective & Preventive Action plan and loss amounts & recoveries. The risk is managed through a system of prevention, control and coverage that comprises detailed procedures, permanent supervision, and insurance policies, further supported by reviews of the Regional/Head-offi ce teams.Structure and OrganizationImplementation of the Operational Risk framework of the bank is done by the Head-Operational Risk Management under guidance from the regional Regulatory, Oversight & Cyber Security (ROCS) team responsible for Operational Risk topics. The framework rests on the following pillars: - Operational Loss Collection. Risk & Controls Self-Assessment Permanent Supervision Key Risk Indicators New Product Approval process Outsourcing of Essential Services process Business Continuity & Crisis Management Information & Cyber SecurityThe Operational Risk aspects are discussed in the APEX Committee meetings, Operational Risk Management Committee and Outsourcing Committee meetings chaired by the India CEO/COO and participants from the respective Business/Support Functions.Scope and nature of Risk reporting / measurement systemThe Bank has clearly defi ned the nature, scope of risk reporting by putting in place systems and thresholds for loss data collection, measurement and reporting by category and sub category of events. The Bank’s internal classifi cation has been mapped to the Basel II Loss Event Type Classifi cations. Based on this classifi cation Risk Drivers (KRIs) that convey any control weakness that could cause an Operational Risk Event are identifi ed and assessed through multiple evaluation questions.The Bank also has a RCSA (Risk Control & Self-Assessment) process in place which helps to evaluate the inherent risk in the business and the controls in place to mitigate it. The process covers all business units of the bank.Hedging / Mitigating techniquesPermanent Supervision controls framework is in place to ensure risk mitigants or controls are identifi ed and monitored periodically to prevent or reduce operational losses and impacts. The gaps / residual risks identifi ed during the RSCA exercises are addressed by implementing additional controls to ensure a robust ORM structure.The Bank has adopted the Basic Indicator approach to compute the capital requirement for operational risk as prescribed by RBI
DF 9. Interest rate risk in the banking book (IRRBB)In order to manage the risk optimally, the Interest Rate Risk in the Banking Book (IRRBB) is centralized within the ALM desk in Finance department. The Head Offi ce has assigned sensitivity limits on the IRRBB which also covers the capital and investments held in the HTM category. The risks arising out of various commercial banking activities are transferred to the ALM desk using the internal funds transfer pricing mechanism.The ALM desk manages and hedges, if required, the IRRBB with Treasury under the guidance of the ALCO.
ECO
NOM
IC &
PO
LITI
CAL
WEE
KLY

SOCIETE GENERALE(Incorporated in France as a Public Limited Company)
CORPORATE & INDIAN BRANCHESINVESTMENT BANKING
Economic & Political Weekly EPW Published on Saturday, JUNE 27, 2020 vol lV nos 26 & 27 251
Quantitative DisclosuresMarket Risk Limits
1- Value at Risk: VAR 99% (` ‘000s)
VAR Limit UsageFX VaR 450,000 113,643,21 25%Interest Rate Trading VaR 450,000 164,615.13 37%Consolidated Trading VaR (FX and IR) 350,000 179,683.14 51%
2- Interest Rate Sensitivity Limits
Parallel Limit UsageTotal Investments PVBP01 (HFT + AFS + HTM) 18,500 8534.29 46%IRD Trading PVBP01 7,000 1,098.78 16%
3- Stress Tests
Limit UsageStress Test 3,500,000 1,844,000 53%
As required under Pillar III norms, the increase / decline in earnings and economic value for an upward / downward rate shock of 200 basis points as on March 31, 2020, broken down by currency is as follows: Earnings Perspective (` ‘000s)
Currency Interest Rate Shock
2% Increase 2% DecreaseRupees and other major currencies (39,031) 39,031US Dollar 185,952 (185,952)
Economic Value Perspective (` ‘000s)
Currency Interest rate shock
2% increase 2% Decrease
Rupees and other major currencies 1,889,266 (1,889,266)US Dollar (107,432) 107,432
DF 10: General Disclosure for Exposures Related to Counterparty Credit Risk-Qualitative Disclosures:Counterparty Credit Risk (CCR) is the risk that the counterparty to a transaction could default before the fi nal settlement of the transaction’s cash fl ows. An economic loss would occur if the transactions or portfolio of transactions with the counterparty has a positive economic value at the time of default. Unlike a fi rm’s exposure to credit risk through a loan, where the exposure to credit risk is unilateral and only the lending bank faces the risk of loss, CCR creates a bilateral risk of loss: the market value of the transaction can be positive or negative to either counterparty to the transaction. The market value is uncertain and can vary over time with the movement of underlying market factors. SG India Bank computes the exposure amount for counterparty credit risk using the Current Exposure Method (CEM). The credit equivalent amount of a market related off-balance sheet transaction is calculated by taking the sum of current credit exposure and potential future credit exposure.The Bank has entered into CSAs with some Bank counterparties which requires maintenance of collateral due to valuation changes on transactions under the CSA framework. Exposures to central counterparties arising from OTC derivatives transactions, exchange traded derivatives transactions and securities fi nancing transactions (SFTs) are arrived at basis the counterparty credit risk treatment as stipulated in the regulatory guidelines. The Bank has exposure to only one QCCP, CCIL. The Bank does not take into account netting while computing exposures with counterparties except for the exposures with CCIL. Quantitative Disclosure: The derivative exposure is calculated using Current Exposure method, as seen in the table below
Type (` ‘000s) Notional Amount Exposure as per Current Exposure Method
I. Interest rate Swap 1,271,372,006 34,638,658II. Currency Swap 356,961,946 44,169,872III. Forex Forwards 180,060,700 9,497,843IV. Swap 110,582,005 2,100,2800V. Options 9,586,455 270,587Total Current Exposure 1,928,563,111 90,677,239
ECO
NOM
IC &
PO
LITI
CAL
WEE
KLY

SOCIETE GENERALE(Incorporated in France as a Public Limited Company)
CORPORATE & INDIAN BRANCHESINVESTMENT BANKING
Published on Saturday, JUNE 27, 2020 vol lV nos 26 & 27 EPW Economic & Political Weekly252
DF 11. Composition of capital: (` ‘000s)
Particulars Amount Amounts Subject to
Pre-Basel III Treatment
Ref No.
Common Equity Tier 1 capital: instruments and reserves 1 Directly issued qualifying common share capital plus related stock surplus (share
premium) (Funds from Head Offi ce)14,493,750 – Schedule 1
2 Retained earnings 1,018,465 – Schedule 23 Accumulated other comprehensive income (and other reserves) 1,552,952 – Schedule 24 Directly issued capital subject to phase out from CET1 (only applicable to non-joint
stock companies)– –
Public sector capital injections grandfathered until January 1, 2018 – – 5 Common share capital issued by subsidiaries and held by third parties (amount allowed
in group CET1)– –
6 Common Equity Tier 1 capital before regulatory adjustments 17,065,167 – Common Equity Tier 1 capital: regulatory adjustments 7 Prudential valuation adjustments – – 8 Goodwill (net of related tax liability) – – 9 Intangibles other than mortgage-servicing rights (net of related tax liability) 4,858 – Schedule 18
Note 22 (vi)10 Deferred tax assets 758,385 – Schedule 1111 Cash-fl ow hedge reserve – – 12 Shortfall of provisions to expected losses – – 13 Securitization gain on sale – – 14 Gains and losses due to changes in own credit risk on fair valued liabilities – – 15 Defi ned-benefi t pension fund net assets – – 16 Investments in own shares (if not already netted off paid-up capital on reported balance
sheet)– –
17 Reciprocal cross-holdings in common equity – – 18 Investments in the capital of banking, fi nancial and insurance entities that are outside
the scope of regulatory consolidation, net of eligible short positions, where the bank does not own more than 10% of the issued share capital (amount above 10% threshold)
– –
19 Signifi cant investments in the common stock of banking, fi nancial and insurance entities that are outside the scope of regulatory consolidation, net of eligible short positions (amount above 10% threshold)
– –
20 Mortgage servicing rights (amount above 10% threshold) – – 21 Deferred tax assets arising from temporary differences (amount above 10% threshold,
net of related tax liability)– –
22 Amount exceeding the 15% threshold – – 23 of which: signifi cant investments in the common stock of fi nancial entities – – 24 of which: mortgage servicing rights – – 25 of which: deferred tax assets arising from temporary differences – – 26 National specifi c regulatory adjustments (26a+26b+26c+26d) – – 26b of which: Investments in the equity capital of unconsolidated non-fi nancial subsidiaries – – 26c of which: Shortfall in the equity capital of majority owned fi nancial entities which have
not been consolidated with the bank– –
26d of which: Unamortized pension funds expenditures – – Regulatory Adjustments Applied to Common Equity Tier 1 in respect of Amounts Subject to Pre-Basel III Treatment
– –
of which: HO Debit Balance – – 27 Regulatory adjustments applied to Common Equity Tier 1 due to insuffi cient Additional
Tier 1 and Tier 2 to cover deductions– –
28 Total regulatory adjustments to Common Equity Tier 1 763,243 – Schedule 18Note 22 (vi) & Schedule 11
29 Common Equity Tier 1 capital (CET1) 16,301,924 – Additional Tier 1 capital: instruments 30 Directly issued qualifying Additional Tier 1 instruments plus related stock surplus (share
premium) (31+32)– –
31 of which: classifi ed as equity under applicable accounting standards (Perpetual Non-Cumulative Preference Shares)
– –
32 of which: classifi ed as liabilities under applicable accounting standards (Perpetual debt Instruments)
– –
33 Directly issued capital instruments subject to phase out from Additional Tier 1 – –
ECO
NOM
IC &
PO
LITI
CAL
WEE
KLY

SOCIETE GENERALE(Incorporated in France as a Public Limited Company)
CORPORATE & INDIAN BRANCHESINVESTMENT BANKING
Economic & Political Weekly EPW Published on Saturday, JUNE 27, 2020 vol lV nos 26 & 27 253
34 Additional Tier 1 instruments (and CET1 instruments not included in row 5) issued by subsidiaries and held by third parties (amount allowed in group AT1)
– –
35 of which: instruments issued by subsidiaries subject to phase out – – 36 Additional Tier 1 capital before regulatory adjustments – – Additional Tier 1 capital: regulatory adjustments 37 Investments in own Additional Tier 1 instruments – – 38 Reciprocal cross-holdings in Additional Tier 1 instruments – – 39 Investments in the capital of banking, fi nancial and insurance entities that are outside the
scope of regulatory consolidation, net of eligible short positions, where the bank does not own more than 10% of the issued common share capital of the entity (amount above 10% threshold)
– –
40 Signifi cant investments in the capital of banking, fi nancial and insurance entities that are outside the scope of regulatory consolidation (net of eligible short positions)
– –
41 National specifi c regulatory adjustments (41a+41b) – – 41a Investments in the Additional Tier 1 capital of unconsolidated insurance subsidiaries – – 41b Shortfall in the Additional Tier 1 capital of majority owned fi nancial entities which have
not been consolidated with the bank– –
Regulatory Adjustments Applied to Additional Tier 1 in respect of Amounts Subject to Pre-Basel III Treatment
– –
of which: – – 42 Regulatory adjustments applied to Additional Tier 1 due to insuffi cient Tier 2 to cover
deductions– –
43 Total regulatory adjustments to Additional Tier 1 capital – – 44 Additional Tier 1 capital (AT1) – – 44a Additional Tier 1 capital reckoned for capital adequacy – – 45 Tier 1 capital (T1 = CET1 + Admissible AT1) (29 + 44a) 16,301,924 – Tier 2 capital: instruments and provisions 46 Directly issued qualifying Tier 2 instruments plus related stock surplus – – 47 Directly issued capital instruments subject to phase out from Tier 2* – –48 Tier 2 instruments (and CET1 and AT1 instruments not included in rows 5 or 34) issued
by subsidiaries and held by third parties (amount allowed in group Tier 2)– –
49 of which: instruments issued by subsidiaries subject to phase out – – 50 Provisions (Please refer to Note to Template Point 50) 1,375,126 –51 Tier 2 capital before regulatory adjustments 1,375,126 – Tier 2 capital: regulatory adjustments 52 Investments in own Tier 2 instruments – – 53 Reciprocal cross-holdings in Tier 2 instruments – – 54 Investments in the capital of banking, fi nancial and insurance entities that are outside the
scope of regulatory consolidation, net of eligible short positions, where the bank does not own more than 10% of the issued common share capital of the entity (amount above the 10% threshold)
– –
55 Signifi cant investments13in the capital banking, fi nancial and insurance entities that are outside the scope of regulatory consolidation (net of eligible short positions)
– –
56 National specifi c regulatory adjustments (56a+56b) – – 56a of which: Investments in the Tier 2 capital of unconsolidated insurance subsidiaries – – 56b of which: Shortfall in the Tier 2 capital of majority owned fi nancial entities which have
not been consolidated with the bank– –
Regulatory Adjustments Applied to Tier 2 in respect of Amounts Subject to Pre-Basel III Treatment
– –
of which: Investment in Subsidiaries – – 57 Total regulatory adjustments to Tier 2 capital – – 58 Tier 2 capital (T2) 1,375,126 – 58a Tier 2 capital reckoned for capital adequacy 1,375,126 – 58b Excess Additional Tier 1 capital reckoned as Tier 2 capital – – 58c Total Tier 2 capital admissible for capital adequacy (58a + 58b) 1,375,126 – 59 Total capital (TC = T1 + Admissible T2) (45 + 58c) 17,677,050 – Risk Weighted Assets in respect of Amounts Subject to Pre-Basel III Treatment – –
of which: … – – 60 Total risk weighted assets (60a + 60b + 60c) 1,40,589,999 – 60a of which: total credit risk weighted assets 1,10,010,061 – 60b of which: total market risk weighted assets 26,743,442 – 60c of which: total operational risk weighted assets 3,836,496 – Capital ratios 61 Common Equity Tier 1 (as a percentage of risk weighted assets) 11.60% – 62 Tier 1 (as a percentage of risk weighted assets) 11.60% –
ECO
NOM
IC &
PO
LITI
CAL
WEE
KLY

SOCIETE GENERALE(Incorporated in France as a Public Limited Company)
CORPORATE & INDIAN BRANCHESINVESTMENT BANKING
Published on Saturday, JUNE 27, 2020 vol lV nos 26 & 27 EPW Economic & Political Weekly254
63 Total capital (as a percentage of risk weighted assets) 12.58% – 64 Institution specifi c buffer requirement (minimum CET1 requirement plus capital
conservation and countercyclical buffer requirements, expressed as a percentage of risk weighted assets)
– –
65 of which: capital conservation buffer requirement – – 66 of which: bank specifi c countercyclical buffer requirement – – 67 of which: G-SIB buffer requirement – – 68 Common Equity Tier 1 available to meet buffers (as a percentage of risk weighted assets) – – National minima (if different from Basel III) 69 National Common Equity Tier 1 minimum ratio (if different from Basel III minimum) 5.50% – 70 National Tier 1 minimum ratio (if different from Basel III minimum) 7.00% – 71 National total capital minimum ratio (if different from Basel III minimum) 9.00% – Amounts below the thresholds for deduction (before risk weighting) 72 Non-signifi cant investments in the capital of other fi nancial entities – – 73 Signifi cant investments in the common stock of fi nancial entities – – 74 Mortgage servicing rights (net of related tax liability) – – 75 Deferred tax assets arising from temporary differences (net of related tax liability) – – Applicable caps on the inclusion of provisions in Tier 2 76 Provisions eligible for inclusion in Tier 2 in respect of exposures subject to standardized
approach (prior to application of cap)1,375,126 –
77 Cap on inclusion of provisions in Tier 2 under standardized approach 1,375,126 –78 Provisions eligible for inclusion in Tier 2 in respect of exposures subject to internal
ratings-based approach (prior to application of cap)N.A. –
79 Cap for inclusion of provisions in Tier 2 under internal ratings-based approach N.A. – Capital instruments subject to phase-out arrangements (only applicable between March 31, 2018 and March 31, 2022)80 Current cap on CET1 instruments subject to phase out arrangements N.A. – 81 Amount excluded from CET1 due to cap (excess over cap after redemptions and
maturities)N.A. –
82 Current cap on AT1 instruments subject to phase out arrangements N.A. – 83 Amount excluded from AT1 due to cap (excess over cap after redemptions and maturities) N.A. – 84 Current cap on T2 instruments subject to phase out arrangements N.A. – 85 Amount excluded from T2 due to cap (excess over cap after redemptions and maturities) N.A. –
Note to the templateRow No. of the template
Particular (` ‘000s)
10 Deferred tax assets associated with accumulated losses –Deferred tax assets (excluding those associated with accumulated losses) net of Deferred tax liability 758,385Total as indicated in row 10 758,385
19 If investments in insurance subsidiaries are not deducted fully from capital and instead considered under 10% threshold for deduction, the resultant increase in the capital of bank
–
of which: Increase in Common Equity Tier 1 capitalof which: Increase in Additional Tier 1 capital –of which: Increase in Tier 2 capital –
26b If investments in the equity capital of unconsolidated non-fi nancial subsidiaries are not deducted and hence, risk weighted then:
–
(i) Increase in Common Equity Tier 1 capital – (ii) Increase in risk weighted assets –44a Excess Additional Tier 1 capital not reckoned for capital adequacy (difference between Additional Tier
1 capital as reported in row 44 and admissible Additional Tier 1 capital as reported in 44a)–
of which: Excess Additional Tier 1 capital which is considered as Tier 2 capital under row 58b –50 Eligible Provisions included in Tier 2 capital 1,375,126
Eligible Revaluation Reserves included in Tier 2 capital –Total of row 50 1,375,126
58a Excess Tier 2 capital not reckoned for capital adequacy (difference between Tier 2 capital as reported in row 58 and T2 as reported in 58a)
–
ECO
NOM
IC &
PO
LITI
CAL
WEE
KLY

SOCIETE GENERALE(Incorporated in France as a Public Limited Company)
CORPORATE & INDIAN BRANCHESINVESTMENT BANKING
Economic & Political Weekly EPW Published on Saturday, JUNE 27, 2020 vol lV nos 26 & 27 255
Table DF-12: Composition of Capital- Reconciliation requirementsStep 1 (` ‘000s)Particulars Balance sheet as in
published financial statements
Under regulatory scope of
consolidationAs at 31.03.2020 As at 31.03.2019
A Capital & Liabilities i. Paid-up Capital (funds from HO) 14,493,748 14,493,748
Reserves & Surplus 3,007,032 2,718,960Minority Interest – –Total Capital 17,500,778 17,212,708
ii. Deposits 27,451,332 23,121,395of which: Deposits from banks 1,160,068 16,709of which: Customer deposits 26,291,264 23,104,686of which: Other deposits (pl. specify) – –
iii. Borrowings 3,037,737 6,295,314of which: From RBI – –of which: From banks 37,833 –of which: From other institutions & agencies 2,999,904 6,295,314of which: Others (pl. specify) (Borrowings outside India) 37,833 –of which: Capital instruments – –
iv. Other liabilities & provisions 53,979,930 24,297,698Total 101,969,779 70,927,115
B Assetsi. Cash and balances with Reserve Bank of India 2,987,804 1,705,698
Balance with banks and money at call and short notice 2,183,255 4,302,683ii. Investments: 30,615,100 22,400,038
of which: Government securities 29,984,121 21,742,191of which: Other approved securities – –of which: Shares – –of which: Debentures & Bonds 630,979 657,847of which: Subsidiaries / Joint Ventures / Associates – –of which: Others (Commercial Papers, Mutual Funds etc.) – –
iii. Loans and advances 15,744,312 14,949,858of which: Loans and advances to banks 138,131 1,141,403of which: Loans and advances to customers 15,606,181 13,808,455
iv. Fixed assets 506,566 552,328v. Other assets 49,932,742 27,016,510
of which: Goodwill and intangible assets – –of which: Deferred tax assets 758,385 600,008
vi. Goodwill on consolidation – –vii. Debit balance in Profit & Loss account – –
Total Assets 101,969,779 70,927,115
Step 2Particulars Balance sheet as in
published financial statements
Under regulatory scope of consolidation
As at 31.03.2020 As at 31.03.2019A Capital & Liabilities
i. Paid-up Capital (funds from HO)of which: Amount eligible for CET1 17,065,168 16,918,010of which: Amount eligible for AT1 – –Reserves & Surplus 435,613 294,698Minority Interest – –Total Capital 17,500,781 17,212,708
ii. Deposits 27,451,332 23,121,395of which: Deposits from banks 1,160,068 16,709of which: Customer deposits 26,291,264 23,104,686of which: Other deposits (pl. specify) – –
ECO
NOM
IC &
PO
LITI
CAL
WEE
KLY

SOCIETE GENERALE(Incorporated in France as a Public Limited Company)
CORPORATE & INDIAN BRANCHESINVESTMENT BANKING
Published on Saturday, JUNE 27, 2020 vol lV nos 26 & 27 EPW Economic & Political Weekly256
iii. Borrowings 3,037,737 6,295,314of which: From RBI – –of which: From banks 37,833 –of which: From other institutions & agencies 2,999,904 6,295,314of which: Others (pl. specify) (Borrowings outside India) 37,833 –of which: Capital instruments – –
iv. Other liabilities & provisions 53,979,930 24,297,698of which: DTLs related to goodwill – –of which: DTLs related to intangible assets – –Total 101,969,779 70,927,115
AssetsB i. Cash and balances with Reserve Bank of India 2,987,804 1,705,698
Balance with banks and money at call and short notice 2,183,255 4,302,683ii. Investments: 30,615,100 22,400,038
of which: Government securities 29,984,121 21,742,191of which: Other approved securities – –of which: Shares – –of which: Debentures & Bonds 630,979 657,847of which: Subsidiaries / Joint Ventures / Associates – –of which: Others (Commercial Papers, Mutual Funds etc.) – –
iii.Loans and advances 15,744,312 14,949,858of which: Loans and advances to banks 138,131 1,141,403of which: Loans and advances to customers 15,606,181 13,808,455
iv. Fixed assets 506,566 552,328v. Other assets 49,932,742 27,016,510
of which: Goodwill and intangible assets – –of which: Goodwill – –of which: Intangible assets – –Deferred tax assets 758,385 600,008
vi. Goodwill on consolidation – –vii. Debit balance in Profit & Loss account – –
Total Assets 101,969,779 70,927,115
Step 3: Common Equity Tier 1 capital: instruments and reserves
Component of regulatory capital reported by bank
Source based on reference numbers/letters of the
balance sheet under the regulatory scope of
consolidation from step 2
1 Directly issued qualifying common share (and equivalent for non- joint stock companies) capital plus related stock surplus
14,493,750 14,493,750
2 Retained earnings 1,018,465 1,018,4653 Accumulated other comprehensive income 1,552,952 1,405,7954 (and other reserves) – –
5 Directly issued capital subject to phase out from CET1 (only applicable to non-joint stock companies)
– –
6 Common share capital issued by subsidiaries and held by third parties (amount allowed in group CET1)
17,065,167 16,918,010
7 Common Equity Tier 1 capital before regulatory adjustments – –8 Prudential valuation adjustments – –9 Goodwill (net of related tax liability) 4,858 11,993
10 Other intangibles other than mortgage-servicing rights (net of related tax liability)
758,385 600,008
11 Deferred tax assets that rely on future profitability excluding those arising from temporary differences (net of related tax liability)
– –
Common Equity Tier 1 capital (CET1) 16,301,924 16,306,009
DF-13: Main Features of Regulatory Capital Instruments The bank has not issued any regulatory capital instruments during the period.
ECO
NOM
IC &
PO
LITI
CAL
WEE
KLY

SOCIETE GENERALE(Incorporated in France as a Public Limited Company)
CORPORATE & INDIAN BRANCHESINVESTMENT BANKING
Economic & Political Weekly EPW Published on Saturday, JUNE 27, 2020 vol lV nos 26 & 27 257
DF 14: Full Terms and Conditions of Regulatory Capital InstrumentsThe bank has not issued any regulatory capital instruments during the period.DF 15: Disclosure Requirements for Remuneration:The Bank’s compensation policies are in conformity with the Financial Stability Board principles and standards. In accordance with the require-ments of the RBI Circular No. DBOD No.BC.72/29.67/001/2011-12 dated 13 January 2012, the Head Offi ce of the Bank in Paris, France has submitted a declaration to RBI confi rming the aforesaid matter. Accordingly, no disclosure is required to be made in this regard.DF 16: Equities – Disclosure for Banking Book Positions:Qualitative DisclosuresInvestment in Equities amounting to `71,016 (in 000s) as at 31st March 2020 are the shares obtained from restructuring of debt of client and are publicly traded. These have been full provided and therefore the Net Investment in Equities is nil.Quantitative DisclosuresThe Book value and Market value of quoted and unquoted securities are as follows: `in 000
Securities Book Value Market ValueInvestment in Equities: Quoted 71,016 13,568Investment in Equities: Unquoted – –
DF 17: Summary comparison of accounting assets vs. leverage ratio exposure measure:
Item (` in Millions) 1 Total consolidated assets as per published fi nancial statements 101,9702 Adjustment for investments in banking, fi nancial, insurance or commercial entities that are consolidated for
accounting purposes but outside the scope of regulatory consolidation –
3 Adjustment for fi duciary assets recognized on the balance sheet pursuant to the operative accounting framework but excluded from the leverage ratio exposure measure
–
4 Adjustments for derivative fi nancial instruments 100,7905 Adjustment for securities fi nancing transactions (i.e. repos and similar secured lending) – 6 Adjustment for off-balance sheet items (i.e. conversion to credit equivalent amounts of off- balance sheet
exposures)14,835
7 Other adjustments (38,502)8 Leverage ratio exposure 179,093
DF 18: Leverage ratio common disclosure template: Item (` in Millions) On-balance sheet exposures1 On-balance sheet items (excluding derivatives and SFTs, but including collateral) 64,1602 (Asset amounts deducted in determining Basel III Tier 1 capital) (763)3 Total on-balance sheet exposures (excluding derivatives and SFTs) (sum of lines 1 and 2) 63,397 Derivative exposures4 Replacement cost associated with all derivatives transactions (i.e. net of eligible cash variation margin) 36,2015 Add-on amounts for PFE associated with all derivatives transactions 64,5896 Gross-up for derivatives collateral provided where deducted from the balance sheet assets pursuant to the
operative accounting framework –
7 (Deductions of receivables assets for cash variation margin provided in derivatives transactions) –8 (Exempted CCP leg of client-cleared trade exposures) –9 Adjusted effective notional amount of written credit derivatives –10 (Adjusted effective notional offsets and add-on deductions for written credit derivatives) –11 Total derivative exposures (sum of lines 4 to 10) 100,790 Securities fi nancing transaction exposures12 Gross SFT assets (with no recognition of netting), after adjusting for sale accounting transactions 7113 (Netted amounts of cash payables and cash receivables of gross SFT assets) –14 CCR exposure for SFT assets –15 Agent transaction exposures –16 Total securities financing transaction exposures (sum of lines 12 to 15) 71 Other off-balance sheet exposures17 Off-balance sheet exposure at gross notional amount 37,20118 (Adjustments for conversion to credit equivalent amounts) (22,366)19 Off-balance sheet items (sum of lines 17 and 18) 14,835 Capital and total exposures20 Tier 1 capital 16,30221 Total exposures (sum of lines 3, 11, 16 and 19) 179,093 Leverage ratio22 Basel III leverage ratio 9.1
ECO
NOM
IC &
PO
LITI
CAL
WEE
KLY

Deutsche BankIndia Annual Results 2019-2020Deutsche Bank AG, India Branches(Incorporated in Germany with limited liability)
Published on Saturday, JUNE 27, 2020 vol lV nos 26 & 27 EPW Economic & Political Weekly258
INDEPENDENT AUDITOR’S REPORT To the Chief Executive Offi cer Deutsche Bank AG – India Branches
Report on the Audit of the Financial Statements
Opinion We have audited the fi nancial statements of Deutsche Bank AG – India Branches (“the Bank”), which comprise the Balance Sheet as at March 31, 2020, the Profi t and Loss Account, the Cash Flow Statement for the year then ended, and notes to the fi nancial statements, including a summary of signifi cant accounting policies and other explanatory information.
In our opinion and to the best of our information and according to the explanations given to us, the aforesaid fi nancial statements give the information required by the Banking Regulation Act, 1949 as well as the Companies Act, 2013 (“the Act”) in the manner so required for Banking Companies and give a true and fair view in conformity with the accounting principles generally accepted in India, of the state of affairs of the Bank as at March 31, 2020, its profi t and its cash fl ows for the year ended on that date.
Basis for Opinion We conducted our audit in accordance with the Standards on Auditing (SAs) specifi ed under Section 143(10) of the Act. Our responsibilities under those Standards are further described in the Auditor’s Responsibilities for the Audit of the Financial Statements section of our report. We are independent of the Bank in accordance with the Code of Ethics issued by the Institute of Chartered Accountants of India (“the ICAI”) together with the ethical requirements that are relevant to our audit of the fi nancial statements under the provisions of the Act and the Rules thereunder, and we have fulfi lled our other ethical responsibilities in accordance with these requirements and the Code of Ethics. We believe that the audit evidence we have obtained is suffi cient and appropriate to provide a basis for our opinion.
Emphasis of MatterWe draw attention to Note 4(h)(x) of Schedule 18 to the fi nancial statements which describes that the extent to which the COVID-19 Pandemic will impact the Bank’s fi nancial statements will depend on future developments, which are highly uncertain.
Our opinion is not modifi ed in respect of this matter.
Information Other than the Financial Statements and Auditor’s Report ThereonThe Branch Management Board of the Bank is responsible for the other information. The other information comprises the Basel III - Pillar 3 Disclosure but does not include the fi nancial statements and our auditor’s report thereon.
Our opinion on the fi nancial statements does not cover the other information and we do not express any form of assurance conclusion thereon.
In connection with our audit of the fi nancial statements, our responsibility is to read the other information and, in doing so, consider whether the other information is materially inconsistent with the fi nancial statements or our knowledge obtained in the audit or otherwise appears to be materially misstated. If, based on the work we have performed, we conclude that there is a material misstatement of this other information, we are required to report that fact. We have nothing to report in this regard.
Responsibilities of Branch Management Board for Financial Statements
The Branch Management Board of the Bank is responsible for the matters stated in Section 134(5) of the Act with respect to the preparation of these fi nancial statements that give a true and fair view of the fi nancial position, fi nancial performance and cash fl ows of the Bank in accordance with the accounting principles generally accepted in India, including the accounting standards specifi ed under Section 133 of the Act and provisions of Section 29 of the Banking Regulation Act, 1949 and circulars, guidelines and directions issued by the Reserve Bank of India (the “RBI”) from time to time as applicable to the Bank. This responsibility also includes maintenance of adequate accounting records in accordance with the provisions of the Act for safeguarding of the assets of the Bank and for preventing and detecting frauds and other irregularities; selection and application of appropriate accounting policies; making judgments and estimates that are reasonable and prudent; and design, implementation and maintenance of adequate internal fi nancial controls, that were operating effectively for ensuring the accuracy and completeness of the accounting records, relevant to the preparation and presentation of the fi nancial statements that give a true and fair view and are free from material misstatement, whether due to fraud or error.
In preparing the fi nancial statements, the Management is responsible for assessing the Bank’s ability to continue as a going concern, disclosing, as applicable, matters related to going concern and using the going concern basis of accounting unless the Management either intends to liquidate the Bank or to cease operations, or has no realistic alternative but to do so.
The Management is also responsible for overseeing the Bank’s fi nancial reporting process.
Auditor’s Responsibilities for the Audit of the Financial Statements
Our objectives are to obtain reasonable assurance about whether the fi nancial statements as a whole are free from material misstatement, whether due to fraud or error, and to issue an Auditor’s report that includes our opinion. Reasonable assurance is a high level of assurance but is not a guarantee that an audit conducted in accordance with SAs will always detect a material misstatement when it exists. Misstatements can arise from fraud or error and are considered material if, individually or in the aggregate, they could reasonably be expected to infl uence the economic decisions of users taken on the basis of these fi nancial statements.
As part of an audit in accordance with SAs, we exercise professional judgment and maintain professional skepticism throughout the audit. We also:
• Identify and assess the risks of material misstatement of the fi nancial statements, whether due to fraud or error, design and perform audit procedures responsive to those risks, and obtain audit evidence that is suffi cient and appropriate to provide a basis for our opinion. The risk of not detecting a material misstatement resulting from fraud is higher than for one resulting from error, as fraud may involve collusion, forgery, intentional omissions, misrepresentations, or the override of internal control.
• Obtain an understanding of internal control relevant to the audit in order to design audit procedures that are appropriate in the circumstances. Under Section 143(3)(i) of the Act, we are also responsible for expressing our opinion on whether the Bank has internal fi nancial controls with reference to fi nancial statements in place and the operating effectiveness of such controls.
ECO
NOM
IC &
PO
LITI
CAL
WEE
KLY

Deutsche BankIndia Annual Results 2019-2020Deutsche Bank AG, India Branches(Incorporated in Germany with limited liability)
Economic & Political Weekly EPW Published on Saturday, JUNE 27, 2020 vol lV nos 26 & 27 259
• Evaluate the appropriateness of accounting policies used and the reasonableness of accounting estimates and related disclosures made by the Management.
• Conclude on the appropriateness of the Management’s use of the going concern basis of accounting and, based on the audit evidence obtained, whether a material uncertainty exists related to events or conditions that may cast signifi cant doubt on the Bank’s ability to continue as a going concern. If we conclude that a material uncertainty exists, we are required to draw attention in our Auditor’s Report to the related disclosures in the fi nancial statements or, if such disclosures are inadequate, to modify our opinion. Our conclusions are based on the audit evidence obtained up to the date of our Auditor’s Report. However, future events or conditions may cause the Bank to cease to continue as a going concern.
• Evaluate the overall presentation, structure and content of the fi nancial statements, including the disclosures, and whether the fi nancial statements represent the underlying transactions and events in a manner that achieves fair presentation.
We communicate with those charged with governance regarding, among other matters, the planned scope and timing of the audit and signifi cant audit fi ndings, including any signifi cant defi ciencies in internal control that we identify during our audit.
We also provide those charged with governance with a statement that we have complied with relevant ethical requirements regarding independence, and to communicate with them all relationships and other matters that may reasonably be thought to bear on our independence, and where applicable, related safeguards.
Other Matter The fi nancial statements of the Bank for the year ended March 31, 2019, were audited by another auditor whose report dated June 19, 2019 expressed an unmodifi ed opinion on those fi nancial statements.
Our opinion is not modifi ed in respect of this matter.
Report on Other Legal and Regulatory Requirements 1. The Balance Sheet and the Profi t and Loss Account have been drawn up in accordance with the provisions of Section 29 of the Banking Regulation Act,
1949 read with Section 133 of the Companies Act, 2013 read with Rule 7 of the Companies (Accounts) Rules, 2014.
2. As required by sub section 3 of Section 30 of the Banking Regulation Act, 1949 we report that: a. We have sought and obtained all the information and explanations which, to the best of our knowledge and belief, were necessary for the purposes
of our audit and have found them to be satisfactory;b. The transactions of the Bank, which have come to our notice during the course of our audit, have been within the powers of the Bank; andc. Since the key operations of the Bank are automated with the key applications integrated to the core banking system, the audit is carried out centrally
in Mumbai as all the necessary records and data required for the purpose of our audit are available therein.
3. As required by Section 143(3) of the Act, we report that:a. We have sought and obtained all the information and explanations which to the best of our knowledge and belief were necessary for the purposes
of our audit;b. In our opinion, proper books of account as required by law have been kept by the Bank so far as it appears from our examination of those books;c. The Balance Sheet, the Profi t and Loss Account and the Cash Flow Statement dealt with by this Report are in agreement with the books of account;d. In our opinion, the aforesaid fi nancial statements comply with the Accounting Standards specifi ed under Section 133 of the Act, read with Rule 7 of
the Companies (Accounts) Rules, 2014 to the extent they are not inconsistent with the accounting policies prescribed by the RBI;e. The requirements of Section 164(2) of the Act is not applicable to the Bank considering it is a branch of Deutsche Bank AG, which is incorporated
with limited liability in Germany;f. With respect to the adequacy of the internal fi nancial controls with reference to fi nancial statements of the Bank and the operating effectiveness of
such controls, refer to our separate Report in “Annexure A”;g. With respect to the other matters to be included in the Auditor’s Report in accordance with the requirements of section 197(16) of the Act, as
amended.The Bank is a Banking Company as defi ned under Banking Regulation Act, 1949. Accordingly, the requirements prescribed under section 197 of the Companies Act, 2013 do not apply; and
h. With respect to the other matters to be included in the Auditor’s Report in accordance with Rule 11 of the Companies (Audit and Auditors) Rules, 2014, in our opinion and to the best of our knowledge and belief and according to the information and explanations given to us:
i. The Bank has disclosed the impact of pending litigations as at March 31, 2020 on its fi nancial position in its fi nancial statements – Refer Schedule 12 and Note 4(n)(i) and 4(v) of Schedule 18 to the fi nancial statements;
ii. The Bank has made provision as at March 31, 2020, as required under the applicable law or accounting standards, for material foreseeable losses, if any, on long-term contracts including derivative contracts – Refer Schedule 5 and Note 4(g), 4(h)(i) and Note 4(n)(i) of Schedule 18 to the fi nancial statements; and
iii. There were no amounts which were required to be transferred to the Investor Education and Protection Fund by the Bank during the year ended March 31, 2020.
For MSKC & Associates (Formerly known as R.K. Kumar & Co.) Chartered Accountants ICAI Firm Registration Number: 001595S
sd/- Tushar Kurani PartnerMumbai Membership Number: 118580June 22, 2020 UDIN: 20118580AAAACD3673
ECO
NOM
IC &
PO
LITI
CAL
WEE
KLY

Deutsche BankIndia Annual Results 2019-2020Deutsche Bank AG, India Branches(Incorporated in Germany with limited liability)
Published on Saturday, JUNE 27, 2020 vol lV nos 26 & 27 EPW Economic & Political Weekly260
ANNEXURE A TO THE INDEPENDENT AUDITOR’S REPORT OF EVEN DATE ON THE FINANCIAL STATEMENTS OF DEUTSCHE BANK AG – INDIA BRANCHES[Referred to in paragraph 3(f) under ‘Report on Other Legal and Regulatory Requirements’ in the Independent Auditor’s Report of even date to the Chief Executive Offi cer of Deutsche Bank AG – India Branches on the Financial Statements for the year ended March 31, 2020]
Report on the Internal Financial Controls under Clause (i) of Sub-section 3 of Section 143 of the Companies Act, 2013 (“the Act”)
We have audited the internal fi nancial controls with reference to fi nancial statements of Deutsche Bank AG - India Branches (“the Bank”) as of March 31, 2020 in conjunction with our audit of the fi nancial statements of the Bank for the year ended on that date.
Management’s Responsibility for Internal Financial Controls
The Bank’s Management is responsible for establishing and maintaining internal fi nancial controls based on the internal control with reference to fi nancial statements criteria established by the Bank considering the essential components of internal control stated in the Guidance Note on Audit of Internal Financial Controls Over Financial Reporting issued by the Institute of Chartered Accountants of India (“the ICAI”) (the “Guidance Note”). These responsibilities include the design, implementation and maintenance of internal fi nancial controls that were operating effectively for ensuring the orderly and effi cient conduct of its business, including adherence to Bank’s policies, the safeguarding of its assets, the prevention and detection of frauds and errors, the accuracy and completeness of the accounting records, and the timely preparation of reliable fi nancial information, as required under the Act.
Auditor’s Responsibility
Our responsibility is to express an opinion on the Bank’s internal fi nancial controls with reference to fi nancial statements based on our audit. We conducted our audit in accordance with the Guidance Note and the Standards on Auditing, issued by the ICAI and deemed to be prescribed under section 143(10) of the Act, to the extent applicable to an audit of internal fi nancial controls. Those Standards and the Guidance Note require that we comply with ethical requirements and plan and perform the audit to obtain reasonable assurance about whether internal fi nancial controls with reference to fi nancial statements was established and maintained and if such controls operated effectively in all material respects.
Our audit involves performing procedures to obtain audit evidence about the adequacy of the internal fi nancial controls with reference to fi nancial statements and their operating effectiveness. Our audit of internal fi nancial controls with reference to fi nancial statements included obtaining an understanding of internal fi nancial controls with reference to fi nancial statements, assessing the risk that a material weakness exists, and testing and evaluating the design and operating effectiveness of internal control based on the assessed risk. The procedures selected depend on the auditor’s judgement, including the assessment of the risks of material misstatement of the fi nancial statements, whether due to fraud or error.
We believe that the audit evidence we have obtained is suffi cient and appropriate to provide a basis for our audit opinion on the Bank’s internal fi nancial controls with reference to fi nancial statements.
Meaning of Internal Financial Controls With reference to Financial Statements
A Bank’s internal fi nancial control with reference to fi nancial statements is a process designed to provide reasonable assurance regarding the reliability of fi nancial reporting and the preparation of fi nancial statements for external purposes in accordance with generally accepted accounting principles. A Bank’s internal fi nancial control with reference to fi nancial statements includes those policies and procedures that (1) pertain to the maintenance of records that, in reasonable detail, accurately and fairly refl ect the transactions and dispositions of the assets of the Bank; (2) provide reasonable assurance that transactions are recorded as necessary to permit preparation of fi nancial statements in accordance with generally accepted accounting principles, and that receipts and expenditures of the Bank are being made only in accordance with authorizations of management and directors of the Bank; and (3) provide reasonable assurance regarding prevention or timely detection of unauthorized acquisition, use, or disposition of the Bank’s assets that could have a material effect on the fi nancial statements.
Inherent Limitations of Internal Financial Controls With reference to fi nancial statements
Because of the inherent limitations of internal fi nancial controls with reference to fi nancial statements, including the possibility of collusion or improper management override of controls, material misstatements due to error or fraud may occur and not be detected. Also, projections of any evaluation of the internal fi nancial controls with reference to fi nancial statements to future periods are subject to the risk that the internal fi nancial control with reference to fi nancial statements may become inadequate because of changes in conditions, or that the degree of compliance with the policies or procedures may deteriorate.
Opinion
In our opinion, the Bank has, in all material respects, adequate internal fi nancial controls with reference to fi nancial statements and such internal fi nancial controls with reference to fi nancial statements were operating effectively as at March 31, 2020, based on the internal control with reference to fi nancial statements criteria established by the Bank considering the essential components of internal control stated in the Guidance Note.
For MSKC & Associates (Formerly known as R.K. Kumar & Co.) Chartered Accountants ICAI Firm Registration Number: 001595S
sd/- Tushar Kurani PartnerMumbai Membership Number: 118580June 22, 2020 UDIN: 20118580AAAACD3673
ECO
NOM
IC &
PO
LITI
CAL
WEE
KLY

Deutsche BankIndia Annual Results 2019-2020Deutsche Bank AG, India Branches(Incorporated in Germany with limited liability)
Economic & Political Weekly EPW Published on Saturday, JUNE 27, 2020 vol lV nos 26 & 27 261
Balance Sheet as on 31 March 2020In thousands of Indian Rupees
Particulars Schedule 31 March 31 March 2020 2019
Capital and Liabilities
Capital 1 75,881,087 75,881,087
Reserves and Surplus 2 94,014,941 83,705,521
Deposits 3 599,095,565 555,408,831
Borrowings 4 139,736,932 167,252,499
Other Liabilities and Provisions 5 303,711,894 180,638,101
Total 1,212,440,419 1,062,886,039
Assets
Cash and Balances
with Reserve Bank of India 6 31,946,422 29,368,589
Balances with Banks and Money at Call and Short Notice 7 66,851,653 133,139,715
Investments 8 331,799,673 257,856,672
Advances 9 510,677,596 482,695,715
Fixed assets 10 1,138,329 1,238,112
Other assets 11 270,026,746 158,587,236
Total 1,212,440,419 1,062,886,039
Contingent liabilities 12 14,090,570,798 11,414,292,324
Bills for collection 373,538,918 644,660,349
Signifi cant accounting policies and Notes to the fi nancial statements 18
The accompanying notes form an integral part of this Balance Sheet
This is the Balance Sheet referred to in our report of even date. This is the Profi t and Loss Account referred to in our report of even date.
For MSKC & Associates (Formerly known as R.K. Kumar & Co.) For Deutsche Bank AG - India BranchesChartered Accountants Firm Registration No: 001595S
Sd/- Sd/- Sd/-Tushar Kurani Kaushik Shaparia Avinash PrabhuPartner Chief Executive Offi cer – India Chief Financial Offi cer – IndiaMembership No: 118580 Place : Mumbai Place : MumbaiDate : 22 June, 2020 Date : 22 June, 2020
Profi t and Loss Account for the year ended 31 March 2020In thousands of Indian Rupees
Particulars Schedule Year ended Year ended 31 March 2020 31 March 2019
Income
Interest Earned 13 66,541,712 56,762,129Other Income 14 7,318,779 12,147,854
Total 73,860,491 68,909,983
Expenditure
Interest Expended 15 28,760,907 25,421,677Operating Expenses 16 19,959,024 18,620,632Provisions and Contingencies 17 14,831,140 12,876,074
Total 63,551,071 56,918,383
Profi t / (Loss)
Net profi t for the year 10,309,420 11,991,600Profi t brought forward 9,238,069 7,922,281
Total 19,547,489 19,913,881
Appropriations
Transfer to statutory reserve 2,577,355 2,997,900Transfer to/(from) investment fl uctuation reserve 2,400,000 804,519Transfer to/(from) investment reserve (145,699) (47,526)Transfer to remittable surplus retained for CRAR requirements – 6,920,919Remittances to Head Offi ce made during the year – – Balance carried over to Balance Sheet 14,715,833 9,238,069
Total 19,547,489 19,913,881
Signifi cant accounting policies and notes to the fi nancial statements 18
The accompanying notes form an integral part of this Profi t and Loss Account.
ECO
NOM
IC &
PO
LITI
CAL
WEE
KLY

Deutsche BankIndia Annual Results 2019-2020Deutsche Bank AG, India Branches(Incorporated in Germany with limited liability)
Published on Saturday, JUNE 27, 2020 vol lV nos 26 & 27 EPW Economic & Political Weekly262
Particular 31 March 2020 31 March 2019
Cash Flow from operating activitiesNet profi t before Taxes 19,816,226 22,652,704
Adjustment for: Depreciation and amortisation for the year 375,487 342,365 Provision for depreciation on investments 2,696,443 112,514 Provision for loan loss (net) 1,121,733 113,867 Provision for contingent credit exposures (42,906) 47,811 Bad-debts written off 1,049,334 1,688,550 Provision for country risk 21,772 (5,035)Provision for standard assets 47,936 1,214,149 Other Provisions 392,522 (956,886)(Profi t)/Loss on sale of fi xed assets (net) 116,870 9,463 25,595,417 25,219,502
Adjustment for:Increase / (Decrease) in deposits 43,686,734 88,011,071 Increase / (Decrease) in other liabilities and provisions 122,654,469 90,134,410 (Increase) / Decrease in investments (76,639,444) (67,757,658)(Increase) / Decrease in advances (30,152,948) (92,023,569)(Increase) / Decrease in other assets (110,590,785) (83,044,185) (25,446,557) (39,460,429)Income tax paid (10,355,531) (10,133,001)
Net cash fl ow from / (used in) operating activities (A) (35,802,088) (49,593,430)
Cash fl ows from investing activitiesPurchase of fi xed assets (249,041) (549,003)Capital Work-in-progress (146,900) 51,078 Proceeds from sale of fi xed assets 3,367 951 Net cash fl ow from/(used in) investing activities (B) (392,574) (496,974)
Cash fl ows from fi nancing activitiesIncrease in Capital – 28,540,000 Remittance of profi t to Head Offi ce – – Increase / (Decrease) in borrowings (net) (27,515,567) 59,668,901
Net cash fl ow from/(used in) fi nancing activities (C) (27,515,567) 88,208,901
Net Increase / (Decrease) in cash and cash equivalents (A+B+C) (63,710,229) 38,118,497
Cash and cash equivalents at beginning of the year 162,508,304 124,389,807 Cash and cash equivalents at end of the year 98,798,075 162,508,304
Net Increase / (Decrease) in cash and cash equivalents (63,710,229) 38,118,497
Notes on cash fl ow statement 1. Cash and balances with Reserve Bank of India 31,946,422 29,368,589
Balances with banks and money at call and short notice 66,851,653 133,139,715
Cash and cash equivalents at end of the year 98,798,075 162,508,304
2. The above cash fl ow statement has been prepared under the indirect method set out in Accounting Standard 3 specifi ed under Section 133 of the Companies Act, 2013, read with Rule 7 of the Companies (Accounts) Rules, 2014.
This is the Cash Flow Statement referred to in our report of even date.
Cash Flow Statement for the year ended 31 March 2020In thousands of Indian Rupees
For MSKC & Associates (Formerly known as R.K. Kumar & Co.) For Deutsche Bank AG - India BranchesChartered Accountants Firm Registration No: 001595S
Sd/- Sd/- Sd/-Tushar Kurani Kaushik Shaparia Avinash PrabhuPartner Chief Executive Offi cer – India Chief Financial Offi cer – IndiaMembership No: 118580 Place : Mumbai Place : MumbaiDate : 22 June, 2020 Date : 22 June, 2020
1,698,925
ECO
NOM
IC &
PO
LITI
CAL
WEE
KLY

Deutsche BankIndia Annual Results 2019-2020Deutsche Bank AG, India Branches(Incorporated in Germany with limited liability)
Economic & Political Weekly EPW Published on Saturday, JUNE 27, 2020 vol lV nos 26 & 27 263
Schedule 1 - CapitalAmount of deposit with Reserve Bank of India (at face value) under Section 11 (2) (b) of the Banking Regulation Act, 1949 30,750,000 28,150,000
Head Offi ce AccountOpening Balance 75,881,087 47,341,087(including start-up capital of Rs 2 million and remittances from Head offi ce)Additions during the year – 28,540,000
Total 75,881,087 75,881,087
Schedule 2 - Reserves and Surplus1 Statutory reserve Opening Balance 29,688,575 26,690,675 Additions during the year: Additions : Transfer from Profi t and Loss Account 2,577,355 2,997,900 32,265,930 29,688,5752 Capital reserve Opening Balance 360,607 360,607 Additions during the year – – 360,607 360,6073 Investment fl uctuation reserve Opening Balance 804,519 – Additions/(Deductions) : Transfer from/(to) Profi t and Loss Account 2,400,000 804,519 (Refer Schedule 18 Note-4 n iii b) 3,204,519 804,519
4 Investment reserve Opening Balance 145,699 193,225 Additions/(Deductions) : Transfer from/(to) Profi t and Loss Account (145,699) (47,526) (Refer Schedule 18 Note-4 n iii a) - 145,699
5 Balance in Profi t and Loss Account 14,715,833 9,238,069
6 Remittable Surplus retained for CRAR requirements Opening Balance 43,468,052 36,547,133 Additions : Transfer from Profi t and Loss Account – 6,920,919 43,468,052 43,468,052
Total 94,014,941 83,705,521Schedule 3 - Deposits1 (a) Demand deposits i. From banks 14,199,869 15,180,169 ii. From others 300,888,085 227,673,570 315,087,954 242,853,739 (b) Savings bank deposits 24,728,970 20,970,403 (c) Term deposits i. From banks - - ii. From others 259,278,641 291,584,689 259,278,641 291,584,689
Total 599,095,565 555,408,8312 (i) Deposits of branches in India 599,095,565 555,408,831 (ii) Deposits of branches outside India - - Total 599,095,565 555,408,831
Schedules forming part of the Balance Sheet as on 31 March 2020In thousands of Indian Rupees
Particulars 31 March 31 March 2020 2019
Schedule 4 - Borrowings
1 Borrowings in India (a) Reserve Bank of India 1,120,000 7,500,000 (b) Other Banks 7,628 - (c) Other institutions and agencies 124,661,805 111,343,999
125,789,433 118,843,999
2 Borrowings outside India Other Banks 13,947,499 48,408,500
13,947,499 48,408,500
Total 139,736,932 167,252,499
Secured borrowings included in 1 and 2 above 110,781,806 118,843,999
Schedule 5 - Other Liabilities and Provisions
1 Bills payable 2,429,930 4,776,0472 Inter-offi ce adjustments - branches in India (net) 1,263 -3 Interest accrued 9,227,865 8,808,1214 Provision for taxation (net of tax paid in advance / tax deducted at source) - -5 Others (including provisions) (Refer Schedule 18 Note-4 h vi) 292,052,836 167,053,933
Total 303,711,894 180,638,101
Schedule 6 - Cash and Balances with Reserve Bank of India1 Cash in hand (including foreign currency notes) 174,570 130,800
2 Balances with Reserve Bank of India (a) in current account 31,771,852 29,237,789 (b) in other accounts - -
Total 31,946,422 29,368,589
Schedule 7 - Balances with Banks and Money at Call and Short Notice1 In India (a) Balances with banks i. in current accounts 68,980 35,661 ii. in other deposit accounts 552,500 2,052,500
(b) Money at call and short notice i. with banks 31,820,000 71,390,000 ii. with other institutions 8,636,435 14,280,876
2 Outside India (a) in current accounts 12,154,038 17,718,678 (b) in deposit accounts – – (c) Money at call and short notice 13,619,700 27,662,000
Total 66,851,653 133,139,715
Particulars 31 March 31 March 2020 2019
ECO
NOM
IC &
PO
LITI
CAL
WEE
KLY
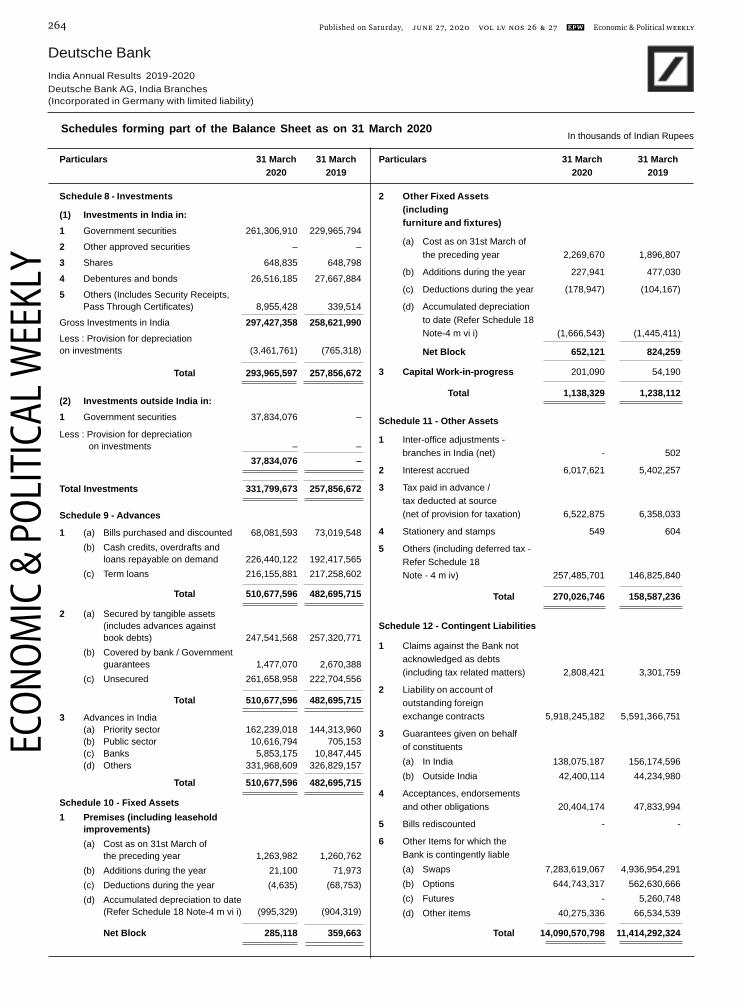
Deutsche BankIndia Annual Results 2019-2020Deutsche Bank AG, India Branches(Incorporated in Germany with limited liability)
Published on Saturday, JUNE 27, 2020 vol lV nos 26 & 27 EPW Economic & Political Weekly264
2 Other Fixed Assets (including furniture and fi xtures)
(a) Cost as on 31st March of the preceding year 2,269,670 1,896,807
(b) Additions during the year 227,941 477,030
(c) Deductions during the year (178,947) (104,167)
(d) Accumulated depreciation to date (Refer Schedule 18 Note-4 m vi i) (1,666,543) (1,445,411)
Net Block 652,121 824,259
3 Capital Work-in-progress 201,090 54,190
Total 1,138,329 1,238,112
Schedule 11 - Other Assets
1 Inter-offi ce adjustments - branches in India (net) - 502
2 Interest accrued 6,017,621 5,402,257
3 Tax paid in advance / tax deducted at source (net of provision for taxation) 6,522,875 6,358,033
4 Stationery and stamps 549 604
5 Others (including deferred tax - Refer Schedule 18 Note - 4 m iv) 257,485,701 146,825,840
Total 270,026,746 158,587,236
Schedule 12 - Contingent Liabilities
1 Claims against the Bank not acknowledged as debts (including tax related matters) 2,808,421 3,301,759
2 Liability on account of outstanding foreign exchange contracts 5,918,245,182 5,591,366,751
3 Guarantees given on behalf of constituents (a) In India 138,075,187 156,174,596 (b) Outside India 42,400,114 44,234,980
4 Acceptances, endorsements and other obligations 20,404,174 47,833,994
5 Bills rediscounted - -
6 Other Items for which the Bank is contingently liable (a) Swaps 7,283,619,067 4,936,954,291 (b) Options 644,743,317 562,630,666 (c) Futures - 5,260,748 (d) Other items 40,275,336 66,534,539
Total 14,090,570,798 11,414,292,324
Schedules forming part of the Balance Sheet as on 31 March 2020In thousands of Indian Rupees
Schedule 8 - Investments
(1) Investments in India in:1 Government securities 261,306,910 229,965,794
2 Other approved securities – –
3 Shares 648,835 648,798
4 Debentures and bonds 26,516,185 27,667,884
5 Others (Includes Security Receipts, Pass Through Certifi cates) 8,955,428 339,514
Gross Investments in India 297,427,358 258,621,990Less : Provision for depreciation on investments (3,461,761) (765,318)
Total 293,965,597 257,856,672
(2) Investments outside India in:1 Government securities 37,834,076 –
Less : Provision for depreciation on investments – – 37,834,076 –
Total Investments 331,799,673 257,856,672
Schedule 9 - Advances
1 (a) Bills purchased and discounted 68,081,593 73,019,548 (b) Cash credits, overdrafts and loans repayable on demand 226,440,122 192,417,565 (c) Term loans 216,155,881 217,258,602
Total 510,677,596 482,695,715
2 (a) Secured by tangible assets (includes advances against book debts) 247,541,568 257,320,771 (b) Covered by bank / Government guarantees 1,477,070 2,670,388 (c) Unsecured 261,658,958 222,704,556
Total 510,677,596 482,695,715
3 Advances in India (a) Priority sector 162,239,018 144,313,960 (b) Public sector 10,616,794 705,153 (c) Banks 5,853,175 10,847,445 (d) Others 331,968,609 326,829,157
Total 510,677,596 482,695,715
Schedule 10 - Fixed Assets1 Premises (including leasehold improvements) (a) Cost as on 31st March of the preceding year 1,263,982 1,260,762 (b) Additions during the year 21,100 71,973 (c) Deductions during the year (4,635) (68,753) (d) Accumulated depreciation to date (Refer Schedule 18 Note-4 m vi i) (995,329) (904,319)
Net Block 285,118 359,663
Particulars 31 March 31 March 2020 2019
Particulars 31 March 31 March 2020 2019
ECO
NOM
IC &
PO
LITI
CAL
WEE
KLY

Deutsche BankIndia Annual Results 2019-2020Deutsche Bank AG, India Branches(Incorporated in Germany with limited liability)
Economic & Political Weekly EPW Published on Saturday, JUNE 27, 2020 vol lV nos 26 & 27 265
Schedule 13 - Interest Earned
1 Interest/discounts on advances/bills 42,112,651 37,233,587
2 Income on investments 19,581,579 15,138,664
3 Interest on balances with Reserve Bank of India and other interbank funds 4,808,132 4,342,562
4 Others 39,350 47,316
Total 66,541,712 56,762,129
Schedule 14 - Other Income
1 Commission, exchange and brokerage (net) (including custodial and depository income) 5,259,347 4,672,670
2 Profi t / (Loss) on sale of investments (net) 1,150,286 804,519
3 Profi t / (Loss) on sale of fi xed assets (net) (116,870) (9,463)
4 Profi t / (Loss) on exchange transactions (net) 22,991 5,862,800
5 Miscellaneous Income / (Loss) 1,003,025 817,328
Total 7,318,779 12,147,854
Schedule 15 - Interest Expended
1 Interest on deposits 21,873,459 19,461,525
2 Interest on Reserve Bank of India and other interbank borrowings (including from other money market participants) 6,845,998 5,857,797
3 Others 41,450 102,355
Total 28,760,907 25,421,677
Schedule 16 - Operating Expenses1 Payments to and provisions for employees (Refer Schedule 18 Note-4 m i) (net of cost recoveries) 5,651,992 5,845,1972 Rent, taxes and lighting (net of cost recoveries) (Refer Schedule 18 Note-4 m v) 908,817 921,7273 Printing and stationery 35,681 37,3764 Advertisement and publicity 80,584 50,0715 Depreciation on Bank’s property 375,487 342,3656 Auditors’ fees and expenses 5,460 3,9007 Law charges 59,946 78,6618 Postage, telegrams, telephones, etc. 362,246 323,0359 Repairs and maintenance 372,431 426,59510 Insurance 648,005 516,13711 Head offi ce charges 2,034,573 2,319,70512 Other expenditure (net of cost recoveries) (Refer Schedule 18 Note-4 m vi iii) 9,423,802 7,755,863
Total 19,959,024 18,620,632
Schedule 17 - Provision and Contingencies1 Provision for loan loss (net) 1,121,733 113,8672 Provision / (write back) for contingent credit exposures (42,906) 47,8113 Provision made on sale of NPA 37,500 -4 Provision / (write back) for standard assets 47,936 1,214,1495 Provision / (write back) for country risk 21,772 (5,035)6 Bad debts written off 1,049,334 1,688,5507 Provision / (write back) for depreciation on investments 2,696,443 112,5148 Other Provisions (net) 392,522 (956,886)9 Provision for taxation: (a) Current tax 10,190,689 11,169,254 (b) Deferred tax (Refer Schedule 18 Note-4 m iv) (683,883) (508,150)
Total 14,831,140 12,876,074
Schedules forming part of the Profi t and Loss Account for the year ended 31 March 2020In thousands of Indian Rupees
Particulars Year ended Year ended 31 March 31 March 2020 2019
Particulars Year ended Year ended 31 March 31 March 2020 2019
1. Background The accompanying fi nancial statements for the year ended 31 March 2020 comprise accounts of the India Branches of Deutsche Bank AG (the ‘Bank’) which is incorporated in Germany with limited liability.
2. Basis of preparation and use of estimates The fi nancial statements have been prepared and presented under the historical cost convention and on accrual basis of accounting, unless otherwise stated, and are in accordance with the generally accepted accounting principles and statutory provisions prescribed under the Banking Regulation Act, 1949, circulars and guidelines issued by the Reserve Bank of India (‘RBI’) and Accounting Standards (‘AS’) specifi ed under section 133 of the Companies Act 2013, read with Rule 7 of the Companies (Account) Rules, 2014 and the Companies (Accounting Standards) Amendment Rules 2016 to the extent applicable and conform to the statutory requirements prescribed by the RBI from time to time and current practices prevailing within the banking industry in India.The preparation of the fi nancial statements in conformity with the generally accepted accounting principles requires Management to make estimates and assumptions that affect the reported amounts of assets, liabilities (including contingent liabilities), revenues and expenses as at the date of the fi nancial statements. Actual results could differ from those estimates. Any revision to the accounting estimates is recognised prospectively in the current and future periods.
Schedule 18: Notes forming part of the fi nancial statements of the India BranchesFor the year ended 31 March 2020EC
ONO
MIC
& P
OLI
TICA
L W
EEKL
Y

Deutsche BankIndia Annual Results 2019-2020Deutsche Bank AG, India Branches(Incorporated in Germany with limited liability)
Published on Saturday, JUNE 27, 2020 vol lV nos 26 & 27 EPW Economic & Political Weekly266
3. Signifi cant accounting policiesa. Foreign currency translation
Monetary foreign currency assets, liabilities and contingent liabilities on account of guarantees, endorsements and other outstandings are translated at the Balance Sheet date at rates notifi ed by the Foreign Exchange Dealers Association of India (‘FEDAI’). Revenue and expenses in foreign currency are translated at the rates prevailing on the date of the transaction. Profi ts/losses resulting from year-end revaluations are included in the Profi t and Loss Account.
b. Investments i. Investments are categorised as Held to Maturity (‘HTM’), Available for Sale (‘AFS’) and Held for Trading (‘HFT’) in accordance with the RBI
guidelines based on intent at the time of acquisition. However, for disclosure in the Balance Sheet, these Investments are classifi ed as Investments in India & Outside India. These are further classifi ed as Government securities, Other approved securities, Shares, Debentures and bonds, Investment in subsidiaries / joint ventures and other investments. These are valued in accordance with extant RBI guidelines.
Investments, which the Bank intends to hold till maturity are classifi ed as HTM investments. Investments that are held principally for resale within a short period are classifi ed as HFT investments. All other investments are classifi ed as AFS investments.
ii. Investments under HTM are carried at acquisition cost or amortised cost if acquired at a premium. The premium, if any, is amortised over the remaining life of the security on a straight line basis, while discount, if any, is ignored. Profi t on sale of HTM securities is appropriated to Capital Reserve net of income tax and statutory reserve while loss, if any, is charged to the Profi t and Loss Account. A provision is made for other than temporary diminution, if any, in the value of HTM investments.
iii. Investments under AFS and HFT categories are revalued periodically as per RBI guidelines. Securities under each category are valued scrip-wise and depreciation / appreciation is aggregated for each classifi cation. Net depreciation, if any, is provided for and net appreciation, if any, is ignored. Net depreciation required to be provided for in any one classifi cation is not reduced on account of net appreciation in any other classifi cation.
iv. Treasury bills including US Treasury bills, commercial paper and certifi cate of deposits, being discounted instruments, are valued at carrying cost. v. The market/ fair value applied for the purpose of periodical valuation of quoted investments included in the AFS and HFT categories is the market
price of the scrip as available from the trades/ quotes on the stock exchanges, or the prices periodically declared by Fixed Income Money Market and Derivatives Association (‘FIMMDA’)/ Financial Benchmark India Private Limited (‘FBIL’).
vi. The market/ fair value of unquoted government securities included in the AFS and HFT category is determined as per the RBI guidelines. Further, in the case of unquoted fi xed income securities (other than government securities), valuation is carried out by applying an appropriate mark-up (refl ecting associated credit risk) over the Yield to Maturity (‘YTM’) rates of government securities of similar tenor. Such mark up and YTM rates applied are as per the relevant rates published by FIMMDA/FBIL.
vii. Investments in security receipts issued by asset reconstruction companies are valued at the latest Net Asset Values (“NAV”) obtained from the asset reconstruction companies.
viii. Investments in pass through certifi cates (PTC’s) are valued by adopting base yield curve and corporate bond spread relative to weighted average maturity of the security.
ix. Quoted equity shares are valued at their closing price on a recognised stock exchange. Unquoted equity shares are valued at the book value if the latest balance sheet is available, else, at Re. 1 per company, as per relevant RBI guidelines.
x. Cost of investments is based on the weighted average cost method. xi. Broken period interest paid at the time of acquisition of the security has been charged to the Profi t and Loss Account. xii. Brokerage, commission, etc. paid at the time of purchase / sale is charged to the Profi t and Loss Account. xiii. Repurchase (repo) and reverse repurchase (reverse repo) transactions are accounted for as secured borrowing and lending contracts, respectively,
in accordance with the extant RBI guidelines. The transactions with RBI under Liquidity Adjustment Facility (“LAF”) are also accounted for as secured borrowing and lending transactions. These transactions are refl ected under Schedule 4.1 and Schedule 7.1 accordingly.
xiv. The Bank undertakes short sale transactions in Central Government dated securities. In accordance with the RBI guidelines, such short positions are categorised as HFT and are classifi ed under Schedule 5.5. These positions are marked-to-market along with the other securities under HFT portfolio and the resultant mark-to-market gains/losses are accounted for as per the relevant RBI guidelines for valuation of investments.
xv. The difference between the consideration amount of fi rst leg and second leg of the repo/ reverse repo is recognised as interest expense/ income in the Profi t and Loss Account.
xvi. The Bank follows settlement date accounting for recording purchase and sale of investments. xvii. Non-performing investments are identifi ed and provision is made thereon based on the RBI guidelines. The provision on such non-performing
investments is not set off against the appreciation in respect of other performing investments. xviii. Transfer of investments between categories is accounted in accordance with the extant RBI guidelines. a) Transfer from AFS/HFT to HTM is made at the lower of book value or market value at the time of transfer. b) Transfer from HTM to AFS/HFT is made at acquisition price/book value if originally placed in HTM at a discount, and at amortised cost if
originally placed in HTM at a premium. c) Transfer from AFS to HFT category or vice-versa is made at book value and the provision for the accumulated depreciation, if any, held is
transferred to the provision for depreciation against the HFT securities and vice-versa.
c. Derivatives transactions i. The Bank enters into derivative contracts such as interest rate swaps, interest rate futures, currency swaps, currency futures, foreign currency-
rupee options, cross currency options and foreign exchange contracts for hedging or trading purposes. ii. All derivative transactions are reported on a mark to market basis in the fi nancial statements, except in the case of derivatives undertaken
as hedges for risk arising from on-Balance Sheet / off-Balance Sheet exposures. The mark to market is performed based on the valuation procedures described in para 4 (g) of the Notes to the Accounts. The unrealised gains/losses are recognised in the Profi t and Loss Account and the corresponding amounts are refl ected as other assets/liabilities respectively in the Balance Sheet.
Schedule 18: Notes forming part of the fi nancial statements of the India Branches (Continued)For the year ended 31 March 2020
ECO
NOM
IC &
PO
LITI
CAL
WEE
KLY

Deutsche BankIndia Annual Results 2019-2020Deutsche Bank AG, India Branches(Incorporated in Germany with limited liability)
Economic & Political Weekly EPW Published on Saturday, JUNE 27, 2020 vol lV nos 26 & 27 267
iii. The accounting for derivatives transactions undertaken as hedges is as follows:Derivative contracts that hedge interest bearing assets or liabilities are valued for in the same manner as the underlying asset or liability. The bank identifi es the hedged item (asset or liability) at the inception of the transaction itself.Gains or losses on the termination of derivative transaction would be recognised when the offsetting gain or loss is recognised on the underlying asset or liability. This implies that any gain or loss on the terminated derivative would be deferred and recognised over the shorter of the remaining contractual life of the derivative or the remaining life of the asset/liability.
iv. Overdue receivables under derivative contracts are classifi ed as non-performing when unpaid for a period of 90 days and recognised through the Profi t and Loss Account in accordance with applicable RBI guidelines.
v. Foreign exchange contracts outstanding at the Balance Sheet date are marked to market as per methodology and at rates notifi ed by FEDAI for specifi ed maturities, suitably interpolated for in-between maturity contracts as specifi ed by FEDAI. Contracts of maturities over twelve months (Long Term Forex Contracts) are marked to market at rates derived from the Reuters curve for that respective currency. The resulting profi ts or losses are recognised in the Profi t and Loss Account.
vi. In case of currency option trades, the premium received / paid is refl ected on the Balance Sheet and recognised in the Profi t and Loss Account only on maturity of trade.
d. Advances and provision for advances i. Advances are stated after deduction of borrowings on inter-bank participation certifi cate with risk, interest in suspense, bills rediscounting and
provisions on non-performing advances. ii. Non-performing advances are identifi ed by periodic appraisals of the portfolio by the Management and appropriate provisions are made which meet the
prudential accounting norms prescribed by the RBI for asset classifi cation, income recognition, and provisioning after considering subsequent recoveries.Further to the provisions required to be held according to the asset classifi cation status, country risk provisions are held for individual country exposures (other than for home country exposure) in accordance with RBI guidelines.
iii. For standard assets, general provision has been made as prescribed by the RBI. In addition, the Bank also maintains a fl oating provision to cover potential credit losses which are inherent in any loan portfolio but not yet identifi ed, which is included under Schedule 5.5.
iv. Purchase / sale of non-performing assets are refl ected in accordance with the RBI regulations. Provisioning for non-performing assets purchased is made appropriate to the asset classifi cation status determined in accordance with the said guidelines. In case of sale of non-performing assets at a price below the net book value, the loss is debited to the Profi t and Loss Account whereas in case of a sale at higher than the net book value, the excess provision is not reversed but retained to meet the shortfall / loss on account of sale of other non-performing fi nancial assets, except in case of sale of non-performing assets to Securitisation Company (SC) / Reconstruction Company (RC) where any excess provision is reversed to Profi t and Loss Account in accordance with applicable RBI guidelines on sale of fi nancial assets to SC / RC. Recovery in respect of a non-performing asset purchased is fi rst adjusted against its acquisition cost. In case of sale of non-performing assets to SC/RC, recovery in excess of the acquisition cost is recognised as gain in the Profi t and Loss Account.
v. Provisions for restructured assets are made in accordance with applicable RBI guidelines on restructuring of advances by banks.vi. In addition to above, the Bank on a prudential basis makes provisions on specifi c advances or exposures which are not NPAs, but has reasons
to believe on the basis of the extant environment or specifi c information, the possible slippage of a specifi c advance or a group of advances or exposures or potential exposures. These provisions are included under Schedule 5.5.
e. Fixed assets and depreciation i. Fixed assets are stated at historical cost less accumulated depreciation and impairment, if any. Cost includes freight, duties, taxes and incidental
expenses related to the acquisition and installation of the asset. Subsequent expenditure incurred on assets put to use is capitalised only when it increases the future benefi t / functioning capability from / of such assets.
ii. Fixed assets individually costing less than Rs 30 thousand are expensed off in the Profi t and Loss Account.iii. Depreciation is provided on a straight line basis over the estimated useful life of the asset. The useful life estimates prescribed in Part C of
Schedule II to the Companies Act, 2013 are generally adhered to, except in respect of few asset classes where, based on management evaluation and past experience, a different estimate of useful life is considered suitable and is consistent with its global policy / RBI guidelines as prescribed. The rates for this purpose are as follows:
Asset Type Estimated useful lifeCost of buildings 40 yearsOther fi xed assets■ Furniture, fi xtures and offi ce equipment 10 years■ Vehicles 5 years■ Electronic Data Processing (EDP) hardware 3 years ■ Communication equipment 5 years
iv. Depreciation for the entire month is charged in the month in which the asset is purchased.v. Depreciation for the entire month is charged in the month of sale if the asset is sold after 15th day of the month. Depreciation is not provided for
the month of sale if the asset is sold on or before 15th of the month.vi. Leasehold improvements are depreciated over the residual period of the lease or over a period of 10 years whichever is shorter.vii. Software is amortised on a straight-line basis over its estimated useful life upto 10 years.viii. If at the Balance Sheet date there is an indication that an impairment of fi xed assets exists, the recoverable amount is reassessed and the asset
is refl ected at the recoverable amount. The reduction is treated as an impairment loss and is recognised in the Profi t and Loss Account. If at the Balance Sheet date there is an indication that a previously assessed impairment loss no longer exists, the recoverable amount is reassessed and the asset is refl ected at the recoverable amount subject to a maximum of its depreciable historical cost.
Items of fi xed asset that have been retired from active use and are held for sale are stated at the lower of their net book value and net realisable value and are shown separately in the fi nancial statements.
ix. Leasehold land and building thereon is amortised over the period of lease. The lease period of land, acquired by the Bank from Brihanmumbai Municipal Corporation (‘BMC’) on which the Bank has a building has expired in year 2004. The Bank’s solicitor has advised that, based on the current policy on lease renewals of the Government of Maharashtra, the lease/sublease for the bank’s premises is expected to be renewed for a period of 30 years on usual term and conditions. Accordingly, the Bank has amortised the leasehold land and building for 30 years.
Schedule 18: Notes forming part of the fi nancial statements of the India Branches (Continued)For the year ended 31 March 2020
3. Signifi cant accounting policies (Continued)c. Derivatives transactions (continued)
ECO
NOM
IC &
PO
LITI
CAL
WEE
KLY

Deutsche BankIndia Annual Results 2019-2020Deutsche Bank AG, India Branches(Incorporated in Germany with limited liability)
Published on Saturday, JUNE 27, 2020 vol lV nos 26 & 27 EPW Economic & Political Weekly268
f. Lease transactions: Lease of assets under which all the risks and benefi ts of ownership are effectively retained by the lessor are classifi ed as operating leases. Payments made under operating leases are charged to the Profi t and Loss Account on a straight line basis over the lease term.
g. Income recognition i Revenue is recognised in accordance with the requirements of AS-9 ‘Revenue Recognition’. Interest income is recognised in the Profi t and
Loss Account on an accrual basis, except in the case of interest on non-performing assets which is recognised on receipt basis as per income recognition and asset classifi cation norms of RBI and in accordance with AS 9.
ii. Fee and commission income is recognised on an accrual basis. Commission income on guarantees and acceptances are recognised over the life of the contract.
iii. Income on discounted instruments is recognized over the tenure of the instrument.iv. The Bank, in accordance with extant RBI guidelines, enters into transactions for sale or purchase of Priority Sector Lending Certifi cates (PSLC).
The fee received for sale of PSLCs is recorded under Schedule 14.5 and fee paid for purchase of the PSLCs is recorded under Schedule 16.12.h. Staff benefi ts
i. The Bank pays gratuity to employees who retire or resign after a minimum prescribed period of continuous service. For employees who have joined the Bank on or before 31 December 2015, the Bank’s Gratuity Scheme provides benefi ts to employees which are generally higher than those under the Payment of Gratuity Act, 1972. For employees joining on or after 1 January 2016, gratuity payment is as per the provisions of the Payment of Gratuity Act, 1972. The Bank makes contributions to a separate gratuity fund on a monthly basis subject to adjustments based on actuarial valuation. This fund is recognised by the Income-tax authorities and administered by a trust. The Gratuity Scheme is treated as a defi ned benefi t plan and provision for gratuity expenses are made based on an independent actuarial valuation conducted by a qualifi ed actuary at year-end as per method prescribed in AS 15, Employee benefi ts (revised).
ii. The Bank contributes 12% of basic salary as employer’s contribution towards Provident Fund which is administered by a trust. This Provident Fund is classifi ed as a defi ned benefi t plan under AS 15, Employee benefi ts (revised) as the same is created with a guaranteed return linked with that under Employees Provident Fund (‘EPF’) Scheme, 1952. The trust has the option of retaining an appropriate amount out of the amount earned, in a separate account (Surplus account) to fi nance future shortfalls, if any, after paying out an amount equal to or greater than the guaranteed rate of return. During the year the actuary has estimated the present value obligation (PVO) of the future guaranteed rate(s) of interest as per the guidance from the Institute of Actuaries of India in this regard. The shortfall if any of the PVO and the fair value of surplus account is refl ected in the Profi t and Loss Account for the year.
iii. Accumulated compensated absences, which are expected to be availed or encashed within 12 months from the end of the fi nancial year are treated as short term benefi ts. The Bank measures the expected cost of such absences as the additional amount that it expects to pay as a result of the unused entitlement that has accumulated at the reporting date.
iv. Eligible employees of the Bank have been granted stock awards under various plans of equity shares of Deutsche Bank AG. As per the various plans, these stock awards vest in installments (tranches) over multi year periods. During the year, the Bank has charged an amount pertaining to these under the head “Payments to and provisions for employees” as compensation cost.
v. Actuarial gains/losses are immediately taken to the Profi t and Loss Account.i. Taxation
i. Income tax expense comprises the current tax (i.e. amount of tax for the year, determined in accordance with the Income Tax Act, 1961 and the rules framed there under) and the deferred tax charge or credit comprises the tax effects of timing differences between accounting income and taxable income for the year.
ii. The deferred tax charge or credit and the corresponding deferred tax liabilities or assets are recognised using the tax rates that have been enacted or substantially enacted at the Balance Sheet date. Deferred tax assets are recognised only to the extent there is reasonable certainty that the assets can be realised in future. However, where there is unabsorbed depreciation or carried forward loss under taxation laws, deferred tax assets are recognised only if there is virtual certainty of realisation of such assets.
iii. Current tax assets and Current tax liabilities are off-set as the Bank has a legal right to set off the amounts representing taxes on income levied by the same governing taxation laws and the Bank intends to settle the amounts on a net basis. Deferred tax assets and deferred tax liabilities are off-set as the Bank has a legal right to set off the assets and liabilities and the amounts are related to the taxes on income levied by the same governing taxation laws.
iv. Deferred tax assets are reviewed at each Balance Sheet date and appropriately adjusted to refl ect the amount that is reasonably/virtually certain to be realised.
j. Provisions, contingent liabilities and contingent assets i. The Bank creates a provision when there is present obligation as a result of a past event that probably requires an outfl ow of resources and a
reliable estimate can be made of the amount of the obligation. A disclosure for contingent liability is made when there is a possible obligation or a present obligation that may but probably will not require an outfl ow of resources. When there is a possible obligation or a present obligation in respect of which the likelihood of outfl ow of resources is remote, no provision or disclosure is made.
ii. Provisions are reviewed at each Balance-Sheet date and adjusted to refl ect the current best estimate. If it is no longer probable that an outfl ow of resources would be required to settle the obligation, the provision is reversed.
iii. Contingent assets are not recognised or disclosed in the fi nancial statements.k. Debit Card Reward Points
The Bank estimates the probable redemption of debit card reward points based on an independent actuarial valuation conducted by a qualifi ed actuary at year-end. Provision for the said reward points is then made based on the actuarial valuation report as furnished by the actuary.
Schedule 18: Notes forming part of the fi nancial statements of the India Branches (Continued)For the year ended 31 March 20203. Signifi cant accounting policies (Continued)
ECO
NOM
IC &
PO
LITI
CAL
WEE
KLY

Deutsche BankIndia Annual Results 2019-2020Deutsche Bank AG, India Branches(Incorporated in Germany with limited liability)
Economic & Political Weekly EPW Published on Saturday, JUNE 27, 2020 vol lV nos 26 & 27 269
4. Notes to fi nancial statementsa. Capital adequacy ratio
The Bank is subject to the Basel III capital adequacy guidelines stipulated by RBI with effect from April 1, 2013. The guidelines provide a transition schedule for Basel III implementation till September 30, 2020. The capital adequacy ratio computed under Basel III is given below:
31 March 2020 31 March 2019i) Common Equity Tier 1 capital ratio 14.11% 15.37%ii) Tier 1 capital ratio 14.11% 15.37%iii) Tier 2 capital ratio 0.82% 0.66%iv) Total Capital ratio (CRAR) 14.93% 16.03%v) Percentage of the shareholding of the Government of India in public sector banks NA NAvi) Amount of equity capital raised – –vii) Amount of Additional Tier 1 capital raised; of which
PNCPS: – –PDI: – –
viii) Amount of Tier 2 capital raised; of which Debt capital instrument: – –Preference Share Capital Instruments: [Perpetual Cumulative Preference Shares (PCPS) / Redeemable Non-Cumulative Preference Shares (RNCPS) / Redeemable Cumulative Preference Shares (RCPS)]
– –
Capital and risk weighted assets: (In Rs.‘000)
31 March 2020 31 March 2019
Common Equity Tier 1 (CET1) capital 151,390,595 148,893,536
Tier 1 capital 151,390,595 148,893,536
Tier 2 capital 8,801,955 6,440,446
Total capital 160,192,550 155,333,982
Total risk weighted assets 1,073,134,308 968,816,930
b. Investments (In Rs.‘000)
31 March 2020 31 March 2019(1) Value of Investments
(i) Gross Value of Investments(a) In India 297,427,358 258,621,990(b) Outside India 37,834,076 -
(ii) Provisions for Depreciation (a) In India (3,461,761) (765,318)(b) Outside India - -
(iii) Net Value of Investments (a) In India 293,965,597 257,856,672 (b) Outside India 37,834,076 - (2) Movement of provisions held towards depreciation on investments. (i) Opening balance (as on 1 April) 765,318 652,804 (ii) Add: Provisions made during the year 2,696,443 112,514 (iii) Less: Write-off/ (write-back) of excess provisions during the year - - (iv) Closing balance (as on 31 March) 3,461,761 765,318
Investments – Government securities (Schedule 8.1) include:1) Government securities amounting to Rs. 34,900,000 thousand representing face value (Previous year: Rs. 53,330,000 thousand) are collateral
holdings parked with Clearing Corporation of India Limited (‘CCIL’) for Securities segment and Triparty Repo (‘TREPS’) segment.2) Government securities amounting to Rs. 1,093,360 thousand representing face value (Previous year Rs. 7,185,560 thousand) are reported under
Liquidity Adjustment Facility (‘LAF’) with RBI.3) Government securities amounting to Rs. 13,350,000 thousand representing face value (Previous year: Rs. 13,350,000 thousand) are deposited
with RBI in Intra Day Liquidity (‘IDL’) for availing Real Time Gross Settlement (‘RTGS’).4) Government securities amounting to Rs. 30,750,000 thousand representing face value (Previous year Rs. 28,150,000 thousand) are held with RBI
under Section 11(2)(b) of the Banking Regulation Act, 1949.5) Government securities amounting to Rs. 55,351,300 thousand representing face value (Previous year Rs. 33,294,600) are given under repurchase
transactions.
Schedule 18: Notes forming part of the fi nancial statements of the India Branches (Continued)For the year ended 31 March 2020
ECO
NOM
IC &
PO
LITI
CAL
WEE
KLY

Deutsche BankIndia Annual Results 2019-2020Deutsche Bank AG, India Branches(Incorporated in Germany with limited liability)
Published on Saturday, JUNE 27, 2020 vol lV nos 26 & 27 EPW Economic & Political Weekly270
c. Details of repo / reverse repo deals done during the year (in face value terms): (In Rs. ‘000)
31 March 2020 Minimum outstanding
during the year
Maximum outstanding
during the year
Daily average outstanding
during the year
As on 31 March 2020
Securities sold under repos (i) Government securities – 55,153,706 8,931,353 55,153,706 (ii) Corporate debt Securities – – – –Securities purchased under reverse repo (i) Government securities 3,893,484 140,686,923 44,840,091 8,636,435 (ii) Corporate debt Securities – – – –
The above fi gures exclude Repo & Reverse Repo transactions under LAF and Marginal Standing Facility (MSF) done with RBI.(In Rs. ‘000)
31 March 2019 Minimum outstanding
during the year
Maximum outstanding
during the year
Daily average outstanding
during the year
As on 31 March 2019
Securities sold under repos (i) Government securities – 74,590,100 13,534,837 47,794,600 (ii) Corporate debt Securities – – – –Securities purchased under reverse repo (i) Government securities 1,200,000 111,134,100 28,271,263 15,100,000 (ii) Corporate debt Securities – – – –
The above fi gures exclude Repo & Reverse Repo transactions under LAF and Marginal Standing Facility (MSF) done with RBI.d. Issuer composition of non statutory liquidity ratio investments
(In Rs.‘000)
Issuer31 March 2020
Amount Extent of private placement
Extent of ‘below investment
grade’ securities
Extent of ‘unrated’
securities*
Extent of ‘unlisted’
securitiesPublic sector undertakings 504,679 – – – –Financial Institutions (FIs) 3,299,341 – – – – Banks 2,389,238 – – – –Private Corporate 20,971,761 16,230,963 – – 1,909,250Subsidiaries / Joint Ventures – – – – –Others (including SC/RC, PTC’s & US T-Bills)
46,789,505 8,955,428 – 336,213 336,213
Provision held towards depreciation (3,461,761) (3,461,761) – (336,213) (339,213)Total 70,492,763 21,724,630 – – 1,906,250
Amounts reported under the above columns are not mutually exclusive.*Excludes investment in equity shares
(In Rs.‘000)
Issuer31 March 2019
Amount Extent of private placement
Extent of ‘below investment
grade’ securities
Extent of ‘unrated’
securities*
Extent of ‘unlisted’
securitiesPublic sector undertakings – – – – –Financial Institutions (FIs) – – – – – Banks – – – – –Private Corporate 28,316,682 22,315,165 – 1,440,994Subsidiaries / Joint Ventures – – – – –Others (including SC/RC) 339,514 339,514 – 339,514 339,514Provision held towards depreciation (765,318) (765,318) – (339,514) (342,514)
Total 27,890,878 21,889,361 – – 1,437,994
Amounts reported under the above columns are not mutually exclusive.*Excludes investment in equity shares
e. Movement in non-performing non-SLR investments (In Rs.‘000)
31 March 2020 31 March 2019Opening Balance 425,804 66,000Addition during the year 3,370,037 359,804Reductions during the year – –Closing Balance 3,795,841 425,804Total Provisions held 3,125,548 425,804
Schedule 18: Notes forming part of the fi nancial statements of the India Branches (Continued)For the year ended 31 March 20204. Notes to fi nancial statements (Continued)
ECO
NOM
IC &
PO
LITI
CAL
WEE
KLY

Deutsche BankIndia Annual Results 2019-2020Deutsche Bank AG, India Branches(Incorporated in Germany with limited liability)
Economic & Political Weekly EPW Published on Saturday, JUNE 27, 2020 vol lV nos 26 & 27 271
Schedule 18: Notes forming part of the fi nancial statements of the India Branches (Continued)For the year ended 31 March 2020
f. Sale and Transfers to/from HTM category During the year, the Bank has not sold /transferred securities to/from HTM category (Previous year Rs Nil).
g. Derivatives i Details of outstanding interest rate swap agreements
(In Rs.’000)
31 March 2020 31 March 2019
1. The Notional principal of swap agreements 6,868,087,138 4,662,853,8832. Losses which would be incurred if counterparties failed to fulfi ll their obligations
under the agreements114,734,642 41,590,856
3. Collateral required by the bank upon entering into swaps Nil Nil4. Concentration of credit risk arising from the Swaps %
– Banks (Including CCIL) 96.51% 97.18%– Others 3.49% 2.82%
Total 100.00% 100.00%5. The fair value of the swap book (2,714,000) 39,372
■ Nature and terms of interest rate swaps (In Rs.‘000)
31 March 2020 31 March 2019
Trading – MIBOR1 Pay Fixed - Receive Floating 2,415,393,368 1,645,662,127Trading – MIBOR1 Pay Floating - Receive Fixed 2,378,132,533 1,840,683,404Trading – MIFOR2 Pay Fixed - Receive Floating 520,170,000 309,470,000Trading – MIFOR2 Pay Floating - Receive Fixed 307,000,000 209,590,000Trading – INBMK3 Pay Fixed - Receive Floating 8,250,000 8,250,000Trading – INBMK3 Pay Floating - Receive Fixed 5,500,000 9,500,000Trading – Others (Incl LIBOR4) Pay Fixed - Receive Floating 468,545,926 264,259,873Trading – Others (Incl LIBOR4) Pay Floating - Receive Fixed 536,972,087 270,096,102Trading – LIBOR4 Pay Floating - Receive Floating 225,217,997 102,616,072Trading – EUBOR5 Pay Floating - Receive Floating 2,905,227 2,726,305
Total 6,868,087,138 4,662,853,883
1 Mumbai Interbank Offer Rate ; 2 Mumbai Interbank Forward Offer Rate ; 3 India Benchmark ; 4 London Interbank Offered Rate ; 5 Euro Interbank Offered Rate
■ There were no rupee forward rate agreements (FRA’s) outstanding as at 31 March 2020 and 31 March 2019.
ii Exchange Traded Interest Rate Derivatives (In Rs.’000)
31 March 2020 31 March 2019
(i) Notional principal amount of exchange traded interest rate derivatives under-taken during the year (instrument-wise)*
a) 10 year Government Security Notional Bond(ii) Notional principal amount of exchange traded interest rate derivatives out-
standing b) 10 year Government Security Notional Bond(iii) Notional principal amount of exchange traded interest rate derivatives out-
standing and not “highly effective”(iv) Mark-to-market value of exchange traded interest rate derivatives outstanding
and not “highly effective”
––
–
–
––
–
–
* Includes both purchase and sale.
iii Disclosures on risk exposure in Derivatives
Qualitative Disclosures The Bank undertakes transactions in derivative products in accordance with the extant guidelines issued by the RBI. The broad risk Management framework covering the Bank’s derivative business is covered in the below paragraphs. The Bank undertakes transactions in derivative products either in the role of a user or as market maker. The risk governance framework at the Bank including for derivatives is designed according to a three lines of defence (3LoD) operating model in order to ensure clear accountabilities for and a comprehensive, but non-duplicative, coverage of all risk management activities across the Bank. The Bank requires strict independence between its 3LoD in order to avoid confl icts of interest by an appropriate separation of functions and responsibilities. The Bank requires all lines of defence to establish an effective and effi cient internal governance structure with well-defi ned roles and responsibilities. Risk Management Council (RMC) has been established to oversee credit risk, market risk and operational risk related matters for DB India, to provide a platform for integrated risk management in line with local regulatory requirements and Bank’s 3LoD.
4. Notes to fi nancial statements (Continued)
ECO
NOM
IC &
PO
LITI
CAL
WEE
KLY

Deutsche BankIndia Annual Results 2019-2020Deutsche Bank AG, India Branches(Incorporated in Germany with limited liability)
Published on Saturday, JUNE 27, 2020 vol lV nos 26 & 27 EPW Economic & Political Weekly272
Limits are allocated to specifi c business lines, trading portfolio groups and geographical regions. Amongst the most important quantitative tools and metrics currently used to measure, manage and report market risk are Value-at-Risk (VaR) and Stress Testing. The Group acknowledges the limitations in the VaR methodology by supplementing the VaR limits with other position and sensitivity limit structures, as well as with stress testing, on a consolidated basis. To reduce derivatives related credit risk, the Bank regularly seeks the execution of master agreements (such as the International Swap Dealers Association contract) with clients. The Bank uses Comprehensive Approach for collateral valuation. For credit exposure measurement purposes, as the replacement values of the portfolios fl uctuate with movements in market rates and with changes in the transactions in the portfolios, the Bank also estimates the potential future replacement costs of the portfolios over their lifetimes. Hedging The Bank manages its risk from derivatives activity on a portfolio basis. Specifi c hedges undertaken, if any, are ring fenced from the transactions undertaken for trading/market making purposes and held in a separate designated portfolio for easy identifi cation and control.Accounting, Valuation & Provisioning Accounting & ProvisioningRefer para 3(c) of Notes to fi nancial statements.ValuationAll instruments in derivatives portfolio are valued on the basis of a common methodology, consistent with generally accepted practices. The valuation takes into consideration all relevant market factors (e.g. prices, interest rates, currency exchange rates, volatility, liquidity etc.). The accuracy and integrity of the market prices are verifi ed independently of trading personnel.All linear Over The Counter (OTC) instruments are valued on a discounted cash fl ow basis, i.e. all future cash fl ows (receipts and payments) are discounted to their present value using mid market data. Market prices are obtained from established and reliable information services.OTC option instruments are valued using proprietary option models. In case of foreign currency-rupee options, the volatility used for valuation is as given by FEDAI.Exchange traded derivative contracts are marked to market using closing price of relevant contract as published by the recognized exchange. Resultant mark to market profi t / loss is settled with the exchange on a daily basis.In case market prices do not accurately represent the fair value that would actually be realized for a position or portfolio, valuation adjustments such as market risk close-out costs, large position liquidity adjustments are made to arrive at the appropriate fair value. These adjustments may be calculated on a portfolio basis and are reported together with, or as a part of the carrying value of the positions being valued, thus reducing trading assets or increasing trading liabilities.
Quantitative Disclosures (In Rs. ‘000)
Sr. No 31 March 2020 31 March 2019
Currency Derivatives*
Interest Rate Derivatives
Currency Derivatives*
Interest Rate Derivatives
1. Derivatives (Notional Principal Amounts) a) For hedging - - - -b) For Trading 6,978,520,428 6,868,087,138 6,433,358,573 4,662,853,883
2. Marked to Market Positions (net) a) Asset (+) 118,416,994 114,734,642 79,789,525 41,590,856b) Liability (-) (130,692,908) (117,448,642) (93,938,105) (41,551,484)
3. Credit Exposure # 319,092,732 176,016,205 242,119,020 82,285,152
4. Likely impact of one percentage change in interest rates (100 * PV01)
a) On hedging - - - -b) On Trading 2,666,235 2,251,094 1,631,538 181,268
5. Maximum of 100*PV01 observed during the year @ a) On hedging - - - -b) On Trading 3,932,466 4,521,459 2,451,431 2,412,677
6. Minimum of 100*PV01 observed during the year @ a) On hedging - - - -b) On Trading 1,386,018 183,710 1,060,749 4,548
# Based on Current Exposure Method prescribed vide RBI master circular on Exposure norms.@ Maximum & Minimum of PV01 as disclosed above is based on daily risk data *Includes foreign exchange contracts
Schedule 18: Notes forming part of the fi nancial statements of the India Branches (Continued)For the year ended 31 March 2020
4. Notes to fi nancial statements (Continued)g. Derivatives (Continued) iii Disclosures on risk exposure in Derivatives (Continued)
ECO
NOM
IC &
PO
LITI
CAL
WEE
KLY

Deutsche BankIndia Annual Results 2019-2020Deutsche Bank AG, India Branches(Incorporated in Germany with limited liability)
Economic & Political Weekly EPW Published on Saturday, JUNE 27, 2020 vol lV nos 26 & 27 273
Schedule 18: Notes forming part of the fi nancial statements of the India Branches (Continued)For the year ended 31 March 2020
h. Asset Quality i Non-Performing Assets (NPAs):
(In Rs.’000)
Movement in NPAs 31 March 2020 31 March 2019
(i) Net NPAs to Net Advances (%) 1.31% 1.44%
(ii) Movement of Gross NPAs a) Opening balance 14,244,373 10,233,160b) Additions during the year 8,156,514 8,216,081c) Reductions during the year (7,298,134) (4,204,868)d) Closing Balance 15,102,753 14,244,373
(iii) Movement of Net NPAsa) Opening balance 6,946,507 3,049,161 b) Additions during the year 5,141,861 6,097,367 c) Reductions during the year (5,405,213) (2,200,021)d) Closing Balance 6,683,155 6,946,507
(iv) Movement of Provisions for NPAsa) Opening balance 7,297,866 7,183,999 b) Provisions made during the year 3,014,653 2,118,714 c) Write off/ write back of excess provisions during the year (1,892,921) (2,004,847)d) Closing Balance 8,419,598 7,297,866
ii Particulars of Accounts Restructured (fi nancial year ended 31 March 2020) (In Rs.’000)Sl No
Type of Restructuring →
Under CDR Mechanism Under SME Debt Restructuring Mechanism
Others Total
Asset Classifi cation → Stan-dard
Sub-Stan-dard
Doubt-ful
Loss Total Stan-dard
Sub-Stan-dard
Doubt-ful
Loss Total Stan-dard
Sub-Stan-dard
Doubt-ful
Loss Total Stan-dard
Sub-Stan-dard
Doubt-ful
Loss Total
Details ↓
1 Restructured Accounts as on April 1 of the FY (opening fi gures)
No. of borrowers
– – 1 – 1 – – – – – 1 2 – – 3 1 2 1 – 4
Amount outstanding
– – 210,000 – 210,000 – – – – – 898 141,602 – – 142,500 898 141,602 210,000 – 352,500
Provision thereon
– – 210,000 – 210,000 – – – – – – 23,439 – – 23,439 – 23,439 210,000 – 233,439
2 Fresh restruc-turing during the year
No. of borrowers
– – – – – – – – – – – 1 – – 1 – 1 – – 1
Amount outstanding
– – – – – – – – – – – 3,157 – – 3,157 – 3,157 – – 3,157
Provision thereon
– – – – – – – – – – – 789 – – 789 – 789 – – 789
3 Upgradations to restructured standard category during the FY
No. of borrowers
– – – – – – – – – – – – – – – – – – – –
Amount outstanding
– – – – – – – – – – – – – – – – – – – –
Provision thereon
– – – – – – – – – – – – – – – – – – – –
4 Restructured standard advances which cease to attract higher provisioning and / or additional risk weight at the end of the FY and hence need not be shown as restructured standard advances at the beginning of the next FY
No. of borrowers
– – – – – – – – – – 1 – – – 1 1 – – – 1
Amount outstanding
– – – – – – – – – – 898 – – – 898 898 – – – 898
Provision thereon
– – – – – – – – – – – – – – – – – – – –
5
Downgradations of restructured accounts during the FY
No. of borrowers
– – – – – – – – – – – (2) 2 – – – (2) 2 – –
Amount outstanding
– – – – – – – – – – – (141,602) 141,602 – – – (141,602) 141,602 – –
Provision thereon
– – – – – – – – – – – (23,439) 42,040 – 18,601 – (23,439) 42,040 – 18,601
4. Notes to fi nancial statements (Continued)
ECO
NOM
IC &
PO
LITI
CAL
WEE
KLY

Deutsche BankIndia Annual Results 2019-2020Deutsche Bank AG, India Branches(Incorporated in Germany with limited liability)
Published on Saturday, JUNE 27, 2020 vol lV nos 26 & 27 EPW Economic & Political Weekly274
Sl No
Type of Restructuring →
Under CDR Mechanism Under SME Debt Restructuring Mechanism
Others Total
Asset Classifi cation → Stan-dard
Sub-Stan-dard
Doubt-ful
Loss Total Stan-dard
Sub-Stan-dard
Doubt-ful
Loss Total Stan-dard
Sub-Stan-dard
Doubt-ful
Loss Total Stan-dard
Sub-Stan-dard
Doubt-ful
Loss Total
6 Write-offs (net of recovery/reversal) of restructured accounts during the FY
No. of borrowers
– – 1 – 1 – – – – – – – – – – – – 1 – 1
Amount outstanding
– – 210,000 – 210,000 – – – – – – – 3,874 – 3,874 – – 213,874 – 213,874
Provision thereon
– – 210,000 – 210,000 – – – – – – – – – – – – 210,000 – 210,000
7 Restructured Accounts as on March 31 of the FY (closing fi gures)
No. of borrowers
– – – – – – – – – – – 1 2 – 3 – 1 2 – 3
Amount outstanding
– – – – – – – – – – – 3,157 137,728 – 140,885 – 3,157 137,728 – 140,885
Provision thereon
– – – – – – – – – – – 789 42,040 – 42,829 – 789 42,040 – 42,829
Figures under Sr no. 6 (Under CDR Mechanism , Doubtful - Amount outstanding) includes amount recovered from restructured accounts amounting to Rs. 98,891 thousand. Figures under Sl no. 6 (Others, Doubtful - Amount outstanding) includes amount recovered from restructured accounts amounting to Rs. 3,874 thousand
ii Particulars of Accounts Restructured (fi nancial year ended 31 March 2019) (In Rs.’000)
Sl No
Type of Restructuring →
Under CDR Mechanism Under SME Debt Restructuring Mechanism
Others Total
Asset Classifi cation → Stan-dard
Sub-Stan-dard
Doubt-ful
Loss Total Stan-dard
Sub-Stan-dard
Doubt-ful
Loss Total Stan-dard
Sub-Stan-dard
Doubt-ful
Loss Total Stan-dard
Sub-Stan-dard
Doubt-ful
Loss Total
Details ↓
1 Restructured Accounts as on April 1 of the FY (opening fi gures)
No. of borrowers
– – 1 – 1 – – – – – 1 – – – 1 1 – 1 – 2
Amount outstanding
– – 210,000 – 210,000 – – – – – 1,862 – – – 1,862 1,862 – 210,000 – 211,862
Provision thereon
– – 210,000 – 210,000 – – – – – – – – – – – – 210,000 – 210,000
2 Fresh restructuring during the year
No. of borrowers
– – – – – – – – – – – 2 – – 2 – 2 – – 2
Amount outstanding
– – – – – – – – – – – 141,602 – – 141,602 – 141,602 – – 141,602
Provision thereon
– – – – – – – – – – – 23,439 – – 23,439 – 23,439 – – 23,439
3 Upgradations to restructured standard category during the FY
No. of borrowers
– – – – – – – – – – – – – – – – – – – –
Amount outstanding
– – – – – – – – – – – – – – – – – – – –
Provision thereon
– – – – – – – – – – – – – – – – – – – –
4 Restructured standard advances which cease to attract higher provisioning and / or additional risk weight at the end of the FY and hence need not be shown as restructured standard advances at the beginning of the next FY
No. of borrowers
– – – – – – – – – – – – – – – – – – – –
Amount outstanding
– – – – – – – – – – – – – – – – – – – –
Provision thereon
– – – – – – – – – – – – – – – – – – – –
5
Downgradations of restructured accounts during the FY
No. of borrowers
– – – – – – – – – – – – – – – – – – – –
Amount outstanding
– – – – – – – – – – – – – – – – – – – –
Provision thereon
– – – – – – – – – – – – – – – – – – – –
Schedule 18: Notes forming part of the fi nancial statements of the India Branches (Continued)For the year ended 31 March 20204. Notes to fi nancial statements (Continued)h. Asset Quality (Continued) ii Particulars of Accounts Restructured (fi nancial year ended 31 March 2020) (Continued) (In Rs. ‘000)
ECO
NOM
IC &
PO
LITI
CAL
WEE
KLY

Deutsche BankIndia Annual Results 2019-2020Deutsche Bank AG, India Branches(Incorporated in Germany with limited liability)
Economic & Political Weekly EPW Published on Saturday, JUNE 27, 2020 vol lV nos 26 & 27 275
Sl No
Type of Restructuring →
Under CDR Mechanism Under SME Debt Restructuring Mechanism
Others Total
Asset Classifi cation → Stan-dard
Sub-Stan-dard
Doubt-ful
Loss Total Stan-dard
Sub-Stan-dard
Doubt-ful
Loss Total Stan-dard
Sub-Stan-dard
Doubt-ful
Loss Total Stan-dard
Sub-Stan-dard
Doubt-ful
Loss Total
Details ↓
6 Write-offs (net of recovery/reversal) of restructured accounts during the FY
No. of borrowers
– – – – – – – – – – – – – – – – – – – –
Amount outstanding
– – – – – – – – – – 964 – – – 964 964 – – – 964
Provision thereon
– – – – – – – – – – – – – – – – – – – –
7 Restructured Accounts as on March 31 of the FY (closing fi gures)
No. of borrowers
– – 1 – 1 – – – – – 1 2 – – 3 1 2 1 – 4
Amount outstanding
– – 210,000 – 210,000 – – – – – 898 141,602 – – 142,500 898 141,602 210,000 – 352,500
Provision thereon
– – 210,000 – 210,000 – – – – – – 23,439 – – 23,439 – 23,439 210,000 – 233,439
Figures under Sr no. 6 (Doubtful - Amount outstanding) includes amount recovered from restructured accounts amounting to Rs. 964 thousand
iii Divergence in Asset Classifi cation and Provisioning for NPAs
Based on the requirement for disclosure of divergence in asset classifi cation and provisioning prescribed by the RBI vide circular no. DBR.BP.BC.No.32/21.04.018/2018-19 dated April 1, 2019, the Bank does not have any such reportable divergences in asset classifi cation and provisioning for the fi nancial year ended March 31, 2020 meeting the criteria specifi ed in the said circular.
iv Details of fi nancial assets sold to Securitisation Companies (SC) / Reconstruction companies (RC) for Asset Reconstruction: The Bank has not sold any fi nancial assets to SC/RC for Asset Reconstruction during the year ended March 31, 2020 and March 31, 2019.
v Book value and ageing of investments held in security receipts. (In Rs. ‘000)
31 March 2020 31 March 2019
Backed by NPAs sold by the bank as underlying - -Backed by NPAs sold by other banks/fi nancial institution/non-banking fi nancial companies as underlying
336,213 339,514
Total 336,213 339,514
Provision held on above investments is Rs. 336,213 thousand (Previous year Rs. 339,514 thousand).(In Rs. ‘000)
31 March 2020 SRs issued within past 5 years
SRs issued more than 5 years ago but within
past 8 years
SRs issued more than 8 years ago
(i) Book value of SRs backed by NPAs sold by the bank as underlying
– – –
Provision held against (i) – – –(ii) Book value of SRs backed by NPAs sold by
other banks / fi nancial institutions / non-banking fi nancial companies as underlying
– – 336,213
Provision held against (ii) – – 336,213 Total (i) + (ii) – – 336,213
(In Rs. ‘000)
31 March 2019 SRs issued within past 5 years
SRs issued more than 5 years ago but within
past 8 years
SRs issued more than 8 years ago
(i) Book value of SRs backed by NPAs sold by the bank as underlying
– – –
Provision held against (i) – – –(ii) Book value of SRs backed by NPAs sold by
other banks / fi nancial institutions / non-banking fi nancial companies as underlying
– – 339,514
Provision held against (ii) – – 339,514 Total (i) + (ii) – – 339,514
Schedule 18: Notes forming part of the fi nancial statements of the India Branches (Continued)For the year ended 31 March 2020
4. Notes to fi nancial statements (Continued)h. Asset Quality (Continued) ii Particulars of Accounts Restructured (fi nancial year ended 31 March 2019) (Continued) (In Rs. ‘000)
ECO
NOM
IC &
PO
LITI
CAL
WEE
KLY

Deutsche BankIndia Annual Results 2019-2020Deutsche Bank AG, India Branches(Incorporated in Germany with limited liability)
Published on Saturday, JUNE 27, 2020 vol lV nos 26 & 27 EPW Economic & Political Weekly276
vi Provision for standard assets Other liabilities and provisions – Others (Schedule 5.5) includes (In Rs. ‘000)
31 March 2020 31 March 2019Provision on Standard Assets 4,183,256 4,135,320
vii Details of non-performing fi nancial assets purchased / sold: (In Rs.’000)
31 March 2020 31 March 2019
No of accounts sold 6,545* –Aggregate outstanding – –Aggregate consideration received 37,500 –
* pertains to written off accounts
viii Details of Resolution plan (RP) implemented as prescribed by RBI vide circular no RBI/2018-19/203/DBR.No.BP.BC.45/21.04.048/2018-19 dated June 7, 2019: (In Rs.’000)
No of Accounts Amount Involved
(including non-funded exposure)
31 March 2020 2 1,576,671*
* Includes Rs 37 thousand of loan where conversion of debt to equity has taken place.
ix Details of Micro, Small and Medium Enterprises (MSME) accounts restructured as prescribed by RBI vide circular no RBI/2018-19/100 DBR.No.BP.BC.18/21.04.048/2018-19 January 1, 2019:
(In Rs.’000)
31 March 2020 31 March 2019No. of accounts restructured – –Amounts – –
x The Novel Coronavirus (COVID-19)COVID-19 pandemic continues to spread rapidly across the globe including India. The global and Indian fi nancial markets have experienced and may continue to experience signifi cant volatility resulting from the spread of COVID-19. Developments around the COVID 19 disease in 2020 so far suggest that that global and domestic economic growth is expected to be negatively impacted by the spread of the disease and the resulting disruption of economic activity, which could impact the Bank’s performance. The extent to which the COVID-19 pandemic will impact the Bank’s performance depends on future developments, which are highly uncertain, including, among other things, any new information concerning the severity of the COVID-19 pandemic and governmental response to mitigate its impact. Management believes that it has taken into account material impact of known events arising from COVID-19 pandemic in the preparation of the fi nancial statements as at 31st March 2020. The impact assessment of COVID-19 is a continuing process given the uncertainties associated with its nature and duration and the Bank will continue to monitor any material changes to future economic conditions. In accordance with the RBI guidelines relating to COVID-19 Regulatory Package dated March 27, 2020 and April 17, 2020, the Bank has granted moratorium to eligible borrowers on the payment of installments and / or interest, as applicable. For such accounts where the moratorium is granted, the asset classifi cation shall remain stand still during the moratorium period (i.e. the number of day’s past-due shall exclude the moratorium period for the purposes of asset classifi cation under the Income Recognition, Asset Classifi cation and Provisioning norms). The Bank holds provisions in this regard as per the said RBI guidelines and the required disclosures are as follows:
(In Rs.’000)
31 March 2020
(i) Respective amounts in SMA/overdue categories, where the moratorium/deferment was extended 13,420,601(ii) Respective amount where asset classifi cation benefi ts is extended. 789,533(iii) Provisions made during the year 265,569(iv) Provisions adjusted during the respective accounting periods against slippages and the residual provisions –
i. Business Ratios
Year ended 31 March 2020 31 March 2019Interest income as a percentage of working funds$ 6.12% 6.02%Non-interest income as a percentage of working funds$ 0.67% 1.29%Operating profi t as a percentage of working funds $ 2.32% 2.64%Return on assets # 0.95% 1.27%Business per employee (in Rs. 000’s) *@ 645,214 616,234Profi t per employee (in Rs. 000’s) * 6,072 7,181
$ Working funds to be reckoned as average of total assets (excluding accumulated losses, if any) as reported to RBI in Form X under Section 27 of the Banking Regulation Act, 1949, during the 12 months of the fi nancial year.# Return on Assets would be with reference to average working funds (i.e. total of assets excluding accumulated losses, if any).@ For the purpose of computation of business per employee (deposits plus advances) interbank deposits are excluded.* Productivity ratios are based on year end employee numbers.
Schedule 18: Notes forming part of the fi nancial statements of the India Branches (Continued)For the year ended 31 March 2020
4. Notes to fi nancial statements (Continued)h. Asset Quality (Continued)
ECO
NOM
IC &
PO
LITI
CAL
WEE
KLY

Deutsche BankIndia Annual Results 2019-2020Deutsche Bank AG, India Branches(Incorporated in Germany with limited liability)
Economic & Political Weekly EPW Published on Saturday, JUNE 27, 2020 vol lV nos 26 & 27 277
j. Asset Liability Management Maturity pattern of certain items of assets and liabilities (fi nancial year ended 31 March 2020) (In Rs.’000)
Maturity Bucket* Deposits Advances Investments Borrowings Foreign Currency
Assets
Foreign Currency Liabilities
Day – 1# - - - - - -2-7 Days 127,360,179 45,564,301 218,636,100 65,325,583 71,446,062 16,553,7288-14 Days 12,555,005 37,756,339 4,227,714 8,026,150 3,978,192 3,783,25015-30 Days 33,193,252 69,641,386 3,818,360 - 15,400,437 -31 Days and upto 2 months 22,727,571 21,945,014 3,674,655 250,900 2,259,685 -Over 2 months and upto 3 months 19,676,892 27,511,466 2,766,781 1,650,900 2,598,298 -Over 3 Months and upto 6 months 30,838,480 25,808,925 3,969,261 26,252,700 1,957,328 -Over 6 Months and upto 1 year 41,998,360 41,747,971 7,558,374 12,325,400 6,204,919 -Over 1 Year and upto 3 years 276,749,060 109,417,850 42,894,698 25,905,299 - 36,209,084Over 3 Year and upto 5 years 33,996,766 31,132,456 10,344,828 - 1,548 -Over 5 years - 100,151,888 33,908,902 - 2,524,268 5,752,658Total 599,095,565 510,677,596 331,799,673 139,736,932 106,370,737 62,298,720
* Maturity bucket has been revised based on RBI guideline dated March 23, 2016# Day 1 being a banking holiday amounts are being shown in 2-7 Days bucket.
Maturity pattern of certain items of assets and liabilities (fi nancial year ended 31 March 2019) (In Rs.’000)
Maturity Bucket* Deposits Advances Investments Borrowings Foreign Currency
Assets
Foreign Currency Liabilities
Day – 1# – – – – – – 2-7 Days 73,517,845 34,569,900 141,017,721 48,875,399 50,662,889 4,034,1198-14 Days 13,536,081 48,707,244 2,430,523 17,873,250 13,896,119 10,373,25015-30 Days 34,793,006 37,812,202 3,338,565 5,186,625 13,624,924 5,186,62531 Days and upto 2 months 37,525,110 7,790,819 4,933,680 14,144,000 3,010,330 13,831,000Over 2 months and upto 3 months 44,612,839 22,684,612 5,674,787 19,017,625 3,472,762 19,017,625Over 3 Months and upto 6 months 51,175,770 47,014,212 10,560,172 34,669,500 3,831,061 –Over 6 Months and upto 1 year 38,597,196 18,160,067 7,146,494 5,389,000 279,131 –Over 1 Year and upto 3 years 230,197,018 124,794,011 48,825,450 22,097,100 – 21,835,101Over 3 Year and upto 5 years 31,453,294 26,368,684 6,848,135 – – –Over 5 years 672 114,793,964 27,081,145 – 2,392,259 3,470,093Total 555,408,831 482,695,715 257,856,672 167,252,499 91,169,475 77,747,813
* Maturity bucket has been revised based on RBI guideline dated March 23, 2016 # Day 1 being a banking holiday amounts are being shown in 2-7 Days bucket. Classifi cation of assets and liabilities under different maturity buckets are compiled by Management based on guidelines issued by the RBI and are
based on the same estimates and assumptions as used by the Bank for compiling returns to be submitted to the RBI.
k. Exposures i Exposure to Real Estate Sector (In Rs.’000)
Category 31 March 2020 31 March 2019
a) Direct exposure (i) Residential Mortgages – (a) Lending fully secured by mortgages on residential property that
is or will be occupied by the borrower or that is rented [includes an amount of Rs 133,344 thousand (Previous year Rs 168,839 thousand) pertaining to individual housing loans eligible for priority sector advances]
7,171,964 9,386,915
(b) Other lendings secured by mortgage on residential property 100,324,121 95,611,388 (ii) Commercial Real Estate (CRE)* – 39,792,310 48,280,660
Lending secured by mortgages on commercial real estates (offi ce buildings, retail space, multi-purpose commercial premises, multi-family residential buildings, multi-tenanted commercial premises, industrial or warehouse space, hotels, land acquisition, development and construction, etc.). Exposure would also include non-fund based (NFB) limits
0 0
(iii) Other exposure (lendings secured by commercial property not falling under CRE defi nition)
37,966,735 34,272,048
(iv) Investments in Mortgage Backed Securities (MBS) and other securitized exposures –
- -
a. Residential 0b. Commercial Real Estate 0
b) Indirect Exposure 0Fund based and non-fund based exposures on National Housing Bank (NHB) and Housing Finance Companies (HFCs).
11,176,180 14,987,491
Total 196,431,310 202,538,502
* Commercial Real Estate exposure has been computed and reported in accordance with RBI circular ‘Guidelines on Classifi cation of Exposures as Commercial Real Estate (CRE) Exposures’ reference DBOD.BP.BC.No. 42 / 08.12.015/ 2009-10 dated September 9, 2009.
Schedule 18: Notes forming part of the fi nancial statements of the India Branches (Continued)For the year ended 31 March 20204. Notes to fi nancial statements (Continued)
ECO
NOM
IC &
PO
LITI
CAL
WEE
KLY

Deutsche BankIndia Annual Results 2019-2020Deutsche Bank AG, India Branches(Incorporated in Germany with limited liability)
Published on Saturday, JUNE 27, 2020 vol lV nos 26 & 27 EPW Economic & Political Weekly278
ii Exposure to Capital Market (In Rs.’000)
Items 31 March 2020 31 March 2019
(i) direct investment in equity shares, convertible bonds, convertible deben-tures and units of equity-oriented mutual funds the corpus of which is not exclusively invested in corporate debt 529,841 529,805
(ii) advances against shares/bonds/debentures or other securities or on clean ba-sis to individuals for investment in shares (including IPOs/ESOPs), convertible bonds, convertible debentures, and units of equity-oriented mutual funds – –
(iii) advances for any other purposes where shares or convertible bonds or convertible debentures or units of equity oriented mutual funds are taken as primary security 577,461 352,807
(iv) advances for any other purposes to the extent secured by the collateral security of shares or convertible bonds or convertible debentures or units of equity oriented mutual funds i.e. where the primary security other than shares/convertible bonds/convertible debentures/units of equity oriented mutual funds `does not fully cover the advances – –
(v) secured and unsecured advances to stockbrokers and guarantees issued on behalf of stockbrokers and market makers 1,490,000 7,000,000
(vi) loans sanctioned to corporates against the security of shares / bonds/de-bentures or other securities or on clean basis for meeting promoter’s contri-bution to the equity of new companies in anticipation of raising resources – –
(vii) bridge loans to companies against expected equity fl ows/issues – –(viii) underwriting commitments taken up by the banks in respect of primary
issue of shares or convertible bonds or convertible debentures or units of equity oriented mutual funds – –
(ix) fi nancing to stockbrokers for margin trading – –(x) all exposures to Venture Capital Funds (both registered and unregistered) – –(xi) irrevocable Payment Commitments issued by custodian banks in favour
of stock exchanges 1,101,612 3,292,306
Total 3,698,914 11,174,918
iii Risk Category wise Country Exposure (In Rs.’000)
31 March 2020 31 March 2019Risk Category Exposure (net) Provision held Exposure (net) Provision held Insignifi cant 108,384,553 86,920 108,083,671 65,148Low 4,865,310 – 2,359,831 –Moderately Low Risk – – 373,379 –Moderate – – 15,460 –Moderately High Risk 46,275 – – –High – – – –Very High – – – –Restricted – – – –Off-credit – – – –
Total 113,296,138 86,920 110,832,341 65,148
iv Single and Group Borrower Exposures The exposure ceiling for single borrower limit (SBL) and group borrower limit (GBL) is 15% and 40% of capital funds (i.e. Tier I & Tier II Capital) respectively, with an additional allowance of 5% and 10% of capital funds for infrastructure sector exposure. SBL is 25% of capital funds in respect of Oil companies who have been issued Oil Bonds (which do not have SLR status) by the Government of India.Based on the above prescribed limits, during the year the Bank has exceeded the credit exposure in respect of the below mentioned entities.• Wipro Limited*
• Flipkart India Private Limited*
• Star India Private Limited*
• Government of the United States of America@ * Exposure is within the Large Exposure limits as prescribed under RBI circular DBR.No.BP.BC.43/21.01.003/2018-19 dated June 03, 2019@ Exposure is in excess of Large Exposure limits as prescribed under RBI circular DBR.No.BP.BC.43/21.01.003/2018-19 dated June 03, 2019 which is subsequently ratifi ed and informed to RBI
v. Unsecured Advances The bank does not have any advances secured by an intangible asset (Previous year Rs. Nil).l. Disclosure of Penalties Imposed by RBI
During the year no penalties have been imposed on the Bank (Previous year: Rs. 40,100 thousand) by the RBI under section 47A(1)(c) read with section 46(4)(i) of the Banking Regulation Act, 1949. (In Rs.‘000)
31 March 2020 31 March 2019Non-compliance with the directions issued by RBI on Income Recognition and Asset Classifi cation (IRAC) norms, Know Your Customer / Anti-money Laundering (KYC/AML) norms, and on disclosure of monetary penalties imposed by the regulator.
– 30,100
Non-compliance with various directions issued by RBI on time-bound implementation and strengthening of SWIFT-related operational controls
– 10,000
Schedule 18: Notes forming part of the fi nancial statements of the India Branches (Continued)For the year ended 31 March 20204. Notes to fi nancial statements (Continued)k. Exposures (Continued)
ECO
NOM
IC &
PO
LITI
CAL
WEE
KLY

Deutsche BankIndia Annual Results 2019-2020Deutsche Bank AG, India Branches(Incorporated in Germany with limited liability)
Economic & Political Weekly EPW Published on Saturday, JUNE 27, 2020 vol lV nos 26 & 27 279
m. Disclosure requirements as per Accounting Standards i AS 15 – Employee Benefi ts Gratuity
Reconciliation of opening and closing balance of the present value of the defi ned benefi t obligation for gratuity is given below. (In Rs.’000)
31 March 2020 31 March 2019
Defi ned benefi t obligation 1,282,693 1,124,028Fair value of plan assets 1,141,985 1,049,771Defi cit/(Surplus) 140,708 74,257Changes in present value of defi ned benefi ts obligationsOpening Balance 1,124,028 1,148,560Current service cost 116,989 123,758Interest cost 81,536 78,499Benefi ts paid (102,370) (231,355)Actuarial (gain)/loss recognised during the year 62,510 4,566Closing Balance 1,282,693 1,124,028Changes in fair value of plan assetsOpening Balance 1,049,771 1,091,416Expected return on plan assets 82,306 82,084Contributions by the Bank 60,484 100,611Benefi ts paid (102,370) (231,355)Actuarial gain/(loss) recognised during the year 51,794 7,015Closing Balance 1,141,985 1,049,771Total expense recognised in the Profi t and Loss Account in schedule 16.1Current service cost 116,989 123,758Interest cost 81,536 78,499Expected return on plan assets (82,306) (82,084)Net actuarial (gain)/loss recognised during the year 10,716 (2,449)Expense recognised in the Profi t and Loss Account 126,935 117,724Actual return on plan assets 134,100 89,099Key AssumptionsSalary Escalation 10.00% 10.00%Discount rate 6.70% 7.60%Expected rate of return on plan assets 8.00% 8.00%Attrition rate - 0 to 5 years of service 20.00% 20.00%Attrition rate - 6 to 10 years of service 15.00% 15.00%Attrition rate - above 10 years of service 5.00% 5.00%
Gratuity Investment Pattern is as follows:
31 March 2020 31 March 2019Government of India Securities (Central and State) 29.62% 25.76%Corporate Bonds (Including Public Sector Bonds) 59.37% 66.07%Equity shares of listed companies - -Cash & Cash equivalents (including other current assets) 10.86% 7.96%Others (including fi xed deposit & special deposits) (including assets under scheme of Insurance)
0.15% 0.21%
Total 100.00% 100.00%
Experience adjustments are as follows: (In Rs.‘000)
For the fi nancial year ended
31 March 2020 31 March 2019 31 March 2018 31 March 2017 31 March 2016
Defi ned Benefi t Obligation 1,282,693 1,124,028 1,148,560 1,124,791 984,119Funded Assets 1,141,985 1,049,771 1,091,416 1,033,727 942,077Defi cit/ (Surplus) 140,708 74,257 57,144 91,064 42,042Experience Gain/(Loss) adjustments on plan liabilities
42,578 (4,566) 15,207 (9,914) (37,370)
Experience Gain/(Loss) adjustments on plan assets
51,794 7,015 (18,806) 40,935 (2,381)
Actuarial Gain/(Loss) due to change of assumptions
(105,088) - 58,304 (68,875) (8,738)
Schedule 18: Notes forming part of the fi nancial statements of the India Branches (Continued)For the year ended 31 March 20204. Notes to fi nancial statements (Continued)
ECO
NOM
IC &
PO
LITI
CAL
WEE
KLY

Deutsche BankIndia Annual Results 2019-2020Deutsche Bank AG, India Branches(Incorporated in Germany with limited liability)
Published on Saturday, JUNE 27, 2020 vol lV nos 26 & 27 EPW Economic & Political Weekly280
Schedule 18: Notes forming part of the fi nancial statements of the India Branches (Continued)For the year ended 31 March 2020
Provident fund The guidance note on AS-15, Employee Benefi ts, states that employer established provident funds, where interest is guaranteed are to be
considered as defi ned benefi t plans and the liability has to be valued. The Bank has charged Rs. 163,419 thousand (Previous year: Rs 208,047 thousand) to the Profi t and Loss Account towards provident fund expenses.
Key Assumptions 31 March 2020 31 March 2019Discount rate 6.70% 7.60%Expected return 8.50% 8.50%
Long-Term Award The Bank has discontinued Long Service Award benefi t with effect from October 1, 2019. Accordingly the Bank has reversed Rs. 30,289 thousand
(Previous year charged : Rs 6,022 thousand) to the Profi t and Loss Account.
ii AS 17- Segment reporting: ‘Segment Reporting’ prescribed by the AS 17 and in accordance with the guidelines issued by the RBI are given below: (In Rs.’000)
Business Segments Global Markets
Commercial Banking
Retail Banking
Others Total
For the year ended 31 March 2020Revenue 3,443,655 39,138,045 22,365,124 8,913,667 73,860,491Less: Inter-segment revenue (11,782,746) 3,451,772 (276,204) (8,607,178) –Income from operations 15,226,401 35,686,273 22,641,328 306,489 73,860,491Results 424,326 10,764,454 2,526,939 6,100,507 19,816,226Unallocated Expenses –Operating Profi t before tax 19,816,226Income Tax and Deferred Tax (9,506,806)Extraordinary profi t/Loss (pre-tax) – Net Profi t after tax 10,309,420Other InformationSegment Assets 467,092,018 660,533,357 61,384,475 11,615,179 1,200,625,029Unallocated Assets 11,815,390Total Assets 1,212,440,419Segment Liabilities 310,487,899 519,942,667 192,619,892 189,389,961 1,212,440,419Unallocated Liabilities – Total Liabilities 1,212,440,419Capital expenditure 70,831 2,461 119,635 56,115 249,042Depreciation 77,730 182,176 115,581 – 375,487
(In Rs.’000)
Business Segments
Global Markets
Commercial Banking
Retail Banking Others Total
For the year ended 31 March 2019
Revenue 8,455,944 33,826,373 18,106,999 8,520,667 68,909,983Less: Inter-segment revenue (8,561,928) 1,738,511 (1,091,668) 7,915,085 –Income from operations 17,017,872 32,087,862 19,198,667 605,582 68,909,983Results 2,694,262 11,997,543 1,257,370 6,703,529 22,652,704Unallocated Expenses –Operating Profi t before tax 22,652,704Income Tax and Deferred Tax (10,661,104)Extraordinary profi t/Loss (pre-tax) – Net Profi t after tax 11,991,600Other InformationSegment Assets 309,715,079 517,082,933 220,815,371 4,305,991 1,051,919,374Unallocated Assets 10,966,665Total Assets 1,062,886,039Segment Liabilities 148,666,423 569,347,700 178,248,313 166,623,603 1,062,886,039Unallocated Liabilities – Total Liabilities 1,062,886,039Capital expenditure 144,971 2,196 157,797 244,039 549,003Depreciation 85,299 160,836 96,230 – 342,365
4. Notes to fi nancial statements (Continued)m. Disclosure requirements as per Accounting Standards (Continued) i AS 15 – Employee Benefi ts (Continued)
ECO
NOM
IC &
PO
LITI
CAL
WEE
KLY

Deutsche BankIndia Annual Results 2019-2020Deutsche Bank AG, India Branches(Incorporated in Germany with limited liability)
Economic & Political Weekly EPW Published on Saturday, JUNE 27, 2020 vol lV nos 26 & 27 281
The Bank has classifi ed its business groups into following segments:• Global Markets• Commercial banking • Retail banking• Others The Bank’s operations predominantly comprise of its business encompassing Global Markets, Commercial banking services and Retail banking. Global Markets activities encompass trading in forex, derivatives, corporate bonds, government securities, placement of corporate debt in the market and also offering such products to the Bank’s corporate and institutional customers. Commercial banking encompasses transaction banking services, catering to working capital requirement of corporate customers and custodial and wealth management services. Principal products offered include loans, deposits, custodial services, trade services, cash management services and wealth management services. Retail banking activities encompasses raising of deposits from retail customers and catering to loan requirements of such customers. Principal products offered include personal loan, housing loan and business loan, deposits and advisory services.Others in segment revenue mainly includes parabanking income and revenue earned on account of the notional capital charge and notional cost of fi xed asset usage charged to other segments based on internal funds transfer pricing policy of the Bank. Others also include revenue from new Capital Release Unit (CRU) which is established along with other objectives to oversee a reduction in the size of lower yielding longer-dated fi xed income assets and hence free up resources that can be allocated to the Banks core strengths. Liquidity Pool Management activities are centrally managed by Treasury and are included in Others and subsequently allocated to business segments. Segment result is net of expenses both directly attributed as well as allocated costs from internal service providers supporting the respective business groups.Assets employed by a segment or assets that are directly attributable to that segment are included in segment assets. Others in segment assets mainly includes fi xed assets, security deposits and pre-paid expenses, the related charge of which are included in the respective segments either as directly attributable or allocated on a reasonable basis. Liabilities that result from operations of a segment are included in segment liabilities.Others in segment liabilities mainly include capital & reserves and surplus, the related notional charges of which are included under the respective segment. The Bank renders its services within one geographical segment and has no offi ces or operations outside India.
iii AS 18 - Related party disclosures Related party disclosures as required by AS 18 - ‘Related Party Disclosures’ and in accordance with the guidelines issued by the RBI are given below:- Relationships during the year i. Head offi ce Deutsche Bank AG and its branches ii. Associate Comfund Consulting Limited iii. Other related parties of Deutsche Bank Group where common control exists at group level
DBOI Global Services Private Limited, Deutsche Investor Services Private Limited, Deutsche Equities India Private Limited, Deutsche Securities (India) Private Limited, Deutsche CIB Centre Private Limited, Deutsche Asset Management (India) Private Limited, Deutsche India Holdings Private Limited, Deutsche Investments India Private Limited, RREEF India Advisors Private Limited, Deutsche Trustee Services (India) Private Limited, Deutsche Bank Trust Company Americas, OOO “Deutsche Bank”, Deutsche Bank Società per Azioni, Deutsche Nederland N.V., DB International (Asia) Limited, Deutsche Securities Mauritius Limited, DWS Investment S.A., DBOI Global Services (UK) Limited, Joint Stock Company Deutsche Bank DBU, DB Global Technology, Inc., OOO “Deutsche Bank TechCentre”, Deutsche Bank (Malaysia) Berhad, Deutsche Bank, Sociedad Anónima Española, Deutsche Bank Securities Inc., Deutsche Knowledge Services Pte. Ltd., Manila Branch, DB USA Core Corporation, Deutsche Bank National Trust Company, DB UK Bank Limited, Deutsche Bank Polska Spólka Akcyjna, DB Global Technology SRL, Deutsche Securities Inc., Deutsche Group Services Pty Limited, DEUTSCHE BANK A.S., DWS Group Services UK Limited, DB Privat- und Firmenkundenbank AG, Deutsche Bank (Suisse) SA, DWS Asset Management (Korea) Company Limited, Deutsche International Corporate Services (Ireland) Limited, Deutsche Bank Luxembourg S.A., DB Service Centre Limited, DWS Investment Management Americas, Inc., DWS Beteiligungs GmbH, Deutsche Bank Americas Holding Corp., Deutsche Securities (Proprietary) Limited, Deutsche Bank Trust Company, National Association, Deutsche Securities Korea Co., Deutsche Trust Company Limited Japan, German American Capital Corporation, DB Energy Trading LLC, DWS Distributors, Inc., Deutsche Alternative Asset Management (UK) Limited, DB Services Americas, Inc., DWS Investments Japan Limited, DWS Investments UK Limited, DWS International GmbH, MortgageIT, Inc., DB Investment Services GmbH, Sal. Oppenheim jr. & Cie. AG & Co. Kommanditgesellschaft auf Aktien, DB Operaciones y Servicios Interactivos Agrupación de Interés Económico, Deutsche Bank (Cayman) Limited, Deutsche Bank Trust Corporation, Deutsche Global Markets Limited, Deutsche Bank Trust Company Delaware, DB Investment Managers, Inc., Deutsche Securities Saudi Arabia (a closed joint stock company), Deutsche Asset & Wealth Management Investment GmbH, DBÖ Vermögensverwertung GmbH in Liqu., DWS Group GmbH & Co. KGaA, DB Group Services (EURO), Deutsche Bank S.A. - Banco Alemão, Deutsche Asia Pacifi c Holdings Pte Ltd, Deutsche Bank Europe GmbH, Filiale Belgien, Deutsche Bank Nederland N.V., Deutsche Bank (China) Co.- Ltd., Deutsche (Mauritius) Limited, Deutsche Trustees Malaysia Berhad, DWS Alternatives Global Limited, Deutsche Bank Europe GmbH, Filiale Portugal, norisbank GmbH, DWS Service Company, RREEF Management L.L.C., DWS Investments Hong Kong Limited, Deutsche Securities Asia Limited, Singapore Branch, Deutsche Bank México, S.A., Institución de Banca Múltiple, DB Alex. Brown LLC, DB Investment Partners, Inc., Deutsche Bank International Limited, Deutsche Bank (Portugal), S.A., Deutsche Bank Securities Limited, Deutsche Bank Zártkörüen Müködö Részvénytársaság, Deutsche Bank S.A, DB Consorzio S. Cons. a r. l., DB Servicios México, Sociedad Anónima de Capital Variable, DB HR Solutions GmbH, DB Capital Markets (Deutschland) GmbH, Hanoi Building Commercial Joint Stock Bank (merged per 28.08.2012), Scottish Widows Investment Solutions Funds ICVC - Fundamental Index Emerging Markets Equity Fund, Elmo Leasing Zwanzigste GmbH, EVAF B-Frost Finland Properties Oy, Hua Xia Bank Company Limited, Polski Kredyt Bank S.A. (sold per 26.11.2001), United Bank for Africa PLC, Gemini Technology Services Inc., PT Deutsche Sekuritas Indonesia, Deutsche Securities Asia Limited, Taipei Branch.
Schedule 18: Notes forming part of the fi nancial statements of the India Branches (Continued)For the year ended 31 March 20204. Notes to fi nancial statements (Continued)m. Disclosure requirements as per Accounting Standards (Continued) ii AS 17 – Segment Reporting (Continued)
ECO
NOM
IC &
PO
LITI
CAL
WEE
KLY

Deutsche BankIndia Annual Results 2019-2020Deutsche Bank AG, India Branches(Incorporated in Germany with limited liability)
Published on Saturday, JUNE 27, 2020 vol lV nos 26 & 27 EPW Economic & Political Weekly282
4. Notes to fi nancial statements (Continued)m. Disclosure requirements as per Accounting Standards (Continued) iii AS 18 - Related party disclosures (Continued)
iv. Key management personnelIn accordance with the RBI circular DBR.BP.BC No.23/21.04.018/2015-16 dated 1 July 2015, only the Chief Executive Offi cer (CEO) of the Bank, falls under the category of key management personnel, hence no disclosures pertaining to the CEO are provided.CEO of the Bank: Mr. Ravneet Singh Gill – up to 28 February 2019Mr. Khurshed Dordi – from 1 March 2019 to 27 May 2019Mr. Kaushik Shaparia – from 28 May 2019
v. Transactions with the related parties in the ordinary course of business (Current year fi gures are shown in bold. Previous year’s fi gures are shown in italics): (In Rs.‘000)
Items / Related Party Head Offi ce (as per
ownership or control)
Subsidiaries / Associates / Joint Venture
Other related parties in Deutsche
Bank Group
Key Management
Personnel
Relatives of Key
Management Personnel
Total
Sale of fi xed assets – – – – – –– – 3,404 – – 3,404
Purchase of fi xed assets – – 2,910 – – 2,910 – – 3,725 – – 3,725
Interest paid – – 622,030 – – 622,030 – – 474,883 – – 474,883
Interest received – – 286,962 – – 286,962 – – 331,507 – – 331,507
Rendering of services - receipt – – 126,514 – – 126,514 – – 213,777 – – 213,777
Receiving of services - payment – – 1,010,919 – – 1,010,919 – – 1,140,223 – – 1,140,223
Management contracts – – 123,696 – – 123,696 – – (227,776) – – (227,776)
Purchase of securities – – 183,750,377 – – 183,750,377 – – 85,908,566 – – 85,908,566
Sale of securities – – 168,304,736 – – 168,304,736 – – 107,038,620 – – 107,038,620
Purchase/sale of foreign exchange contracts
– –
– –
757,219,2831,149,705,433
– –
– –
757,219,2831,149,705,433
Note: As per the guidance on compliance with the accounting standards by banks issued by the RBI on 1 July 2015, the Bank has not disclosed the details pertaining to the related party where there is only one entity / person in any category of related parties.
vi. Balances with related parties are as follows (Current year fi gures are shown in bold. Previous year’s fi gures are shown in italics):(In Rs.‘000)
Items / Related Party Head Offi ce (as per
ownership or control)
Subsidiaries / Associates / Joint Venture
Other related parties in Deutsche
Bank Group
Key Management
Personnel
Relatives of Key
Management Personnel
Total
Borrowings – – – – – –– – – – – –
Deposits – – 18,891,643 – – 18,891,643– – 17,066,222 – – 17,066,222
Advances – – 827,700 – – 827,700– – – – – –
Balances with Banks – – 6,438,111 – – 6,438,111– – 2,443,659 – – 2,443,659
Non-funded commitments – – 485.359,896 – – 485.359,896– – 41,216,651 – – 41,216,651
Other Assets – – 1,191,201 – – 1,191,201– – 2,165,284 – – 2,165,284
Other Liabilities – – 9,662,503 – – 9,662,503– – 1,114,900 – – 1,114,900
Note: As per the guidance on compliance with the accounting standards by banks issued by the RBI on 1 July 2015, the Bank has not disclosed the details pertaining to the related party where there is only one entity / person in any category of related parties.
Schedule 18: Notes forming part of the fi nancial statements of the India Branches (Continued)For the year ended 31 March 2020
ECO
NOM
IC &
PO
LITI
CAL
WEE
KLY

Deutsche BankIndia Annual Results 2019-2020Deutsche Bank AG, India Branches(Incorporated in Germany with limited liability)
Economic & Political Weekly EPW Published on Saturday, JUNE 27, 2020 vol lV nos 26 & 27 283
vii. Details of maximum balances outstanding with related parties during fi nancial year ended 31 March 2020. (Current year fi gures are shown in bold. Previous year’s fi gures are shown in italics):
(In Rs.‘000)
Items / Related Party Head Offi ce (as per
ownership or control)
Subsidiaries / Associates / Joint Venture
Other related parties in Deutsche
Bank Group
Key Management
Personnel
Relatives of Key
Management Personnel
Total
Borrowings – – 13,538,631 – – 13,538,631
– – 32,657,311 – – 32,657,311
Deposits – – 42,054,635 – – 42,054,635 – – 33,540,471 – – 33,540,471
Advances – – 2,168,391 – – 2,168,391 – – 755,164 – – 755,164
Balances with Banks – – 40,329,047 – – 40,329,047 – – 21,969,544 – – 21,969,544
Non-funded commitments – – 551,790,316 – – 551,790,316 – – 88,688,744 – – 88,688,744
Other Assets – – 2,470,514 – – 2,470,514 – – 2,277,712 – – 2,277,712
Other Liabilities – – 9,662,503 – – 9,662,503 – – 1,997,305 – – 1,997,305
Maximum amounts outstanding for the current year have been computed based on daily balances outstanding.Note: As per the guidance on compliance with the accounting standards by banks issued by the RBI on 1 July 2015, the Bank has not disclosed the details pertaining to the related party where there is only one entity / person in any category of related parties.
viii. The following are the material transactions between the Bank and its related parties for the year ended 31 March 2020. A specifi c related party transaction is disclosed as material wherever it exceeds 10% of all related party transactions in the current year in that category and if it does not confl ict with the Bank’s duties of customer confi dentiality.
Rendering of services – receiptIncome from DB International (Asia) Limited Rs. 26,671 thousand (Previous year: 45,217 thousand), Deutsche Bank Trust Company Americas Rs. 63,415 thousand (Previous year: Rs. 139,535 thousand), Deutsche Investments India Private Limited Rs. 16,985 thousand (Previous year: Rs. 13,279 thousand), DBOI Global Services Private Limited Rs. 15,121 thousand (Previous year: Rs. 6,563 thousand).
Receiving of services – paymentExpenses for receiving services from Deutsche Bank Trust Company Americas Rs. 87,817 thousand (Previous year: Rs 106,645 thousand), DBOI Global Services Private Limited Rs. 717,478 thousand (Previous year: Rs. 807,325 thousand), Deutsche Investor Services Private Limited Rs. 109,899 thousand (Previous year: Rs. 158,244 thousand).
Management contractsReceipt from Deutsche Equities India Private Limited Rs 74,393 thousand (Previous Year: Rs. 62,568 thousand), DBOI Global Services Private Limited Rs. 258,275 thousand (Previous year: Rs. 196,506 thousand), Deutsche Investments India Private Limited Rs. 81,357 thousand (Previous year: Rs. 61,898 thousand), Deutsche CIB Centre Private Limited Rs. 83,178 thousand (Previous year: Rs. 19,540 thousand) Deutsche Bank Trust Company Americas Rs. 74,536 thousand (Previous year receipt of: Rs. 39,183 thousand).Payment to DB USA Core Corporation Rs. 3,935 thousand (Previous year: Rs. 231,674 thousand), DB Group Services (EURO) Rs. 229,633 thousand (Previous year: Rs. 167,291 thousand), DB Global Technology, Inc. Rs. 25,835 thousand (Previous year: Rs. 50,925 thousand), Deutsche Group Services Pty Limited Rs. 52,271 thousand (Previous year: Rs. 1,564 thousand), DBOI Global Services (UK) Limited Rs. 31,481 thousand (Previous year: Rs. 4,919 thousand), OOO “Deutsche Bank TechCentre” Rs. 42,826 thousand (Previous year: Rs. 2,332 thousand), Deutsche Bank Securities Inc. Rs. 28,504 thousand (Previous year: Rs. 35,760 thousand), Deutsche Knowledge Services Pte. Ltd., Manila Branch Rs. 14,195 thousand (Previous year: Rs. 10,406 thousand), Deutsche Securities Inc. Rs. 16,679 thousand (Previous year: Rs. 1,944 thousand).
Balance with BankBalance with Deutsche Bank Trust Company Americas Rs. 6,430,389 thousand (Previous year: Rs. 2,443,499 thousand).
Other AssetsDeutsche Equities India Private Limited Rs. 78,850 thousand (Previous year: Rs. 227,001 thousand), Deutsche Bank Trust Company Americas Rs. 374,144 thousand (Previous year: Rs. 220,847 thousand), DB International (Asia) Limited Rs 500,415 thousand (Previous year: Rs. 1,522,669 thousand).
Other LiabilitiesDBOI Global Services Private Limited Rs. 455,233 thousand (Previous year: Rs. 351,762 thousand), DB Group Services (EURO) Rs. 394,334 thousand (Previous year: Rs. 387,427 thousand), DB International (Asia) Limited Rs 7,986,328 thousand (Previous year: Rs.8 thousand).
Schedule 18: Notes forming part of the fi nancial statements of the India Branches (Continued)For the year ended 31 March 2020
4. Notes to fi nancial statements (Continued)m. Disclosure requirements as per Accounting Standards (Continued) iii AS 18 - Related party disclosures (Continued)
ECO
NOM
IC &
PO
LITI
CAL
WEE
KLY

Deutsche BankIndia Annual Results 2019-2020Deutsche Bank AG, India Branches(Incorporated in Germany with limited liability)
Published on Saturday, JUNE 27, 2020 vol lV nos 26 & 27 EPW Economic & Political Weekly284
iv AS 22 - Accounting for taxes on income Amount of provision made for income-tax during the year
(In Rs.‘000)
Provision for 31 March 2020 31 March 2019
Current tax* 10,190,689 11,169,254
Deferred tax (683,883) (508,150)
* Includes tax provision for earlier years of Rs. 71,995 thousand (Previous year Rs. 245,595 thousand).Deferred tax is accounted for on the basis of AS 22 - ‘Accounting for Taxes on Income’. Component of deferred tax assets and deferred tax liabilities are as under:
(In Rs.‘000)
Deferred tax asset / (Deferred tax liabilities) 31 March 2020 31 March 2019Provision for bad and doubtful debts 4,424,450 3,839,118Depreciation on fi xed assets 160,501 30,046Provision for staff compensation and benefi ts 175,481 237,770Others 532,083 501,698Net Deferred tax asset / (Deferred tax Liabilities) 5,292,515 4,608,632
v AS 19 – Leases - Operating leases Disclosures as required by AS 19 - ‘Leases’ pertaining to leasing arrangement entered into by the Bank are given below:-
i. Cancellable leasing arrangement for premises: Total lease rental of Rs. 250,546 thousand (Previous year: Rs. 370,928 thousand) has been included under Schedule 16.2.
ii. Non-cancellable leasing arrangement for premises: Total lease rental of Rs. 424,614 thousand (Previous year: Rs. 281,618 thousand) has been included under Schedule 16.2.
iii. Non-cancellable leasing arrangement for vehicles: Total lease rental of Rs. 26,275 thousand (Previous year: Rs 26,332 thousand) has been included under Schedule 16.12.
The future minimum lease payments under non-cancellable operating lease are as follows: (In Rs.‘000)
31 March 2020 31 March 2019Not later than one year 495,026 470,260Later than one year and not later than fi ve years 368,897 724,950Later than fi ve years – –
vi Other accounting standardsi) AS 10 – Property, Plant and Equipment - Movement in carrying amount:
(In Rs’000)
31 March 2020 31 March 2019
PremisesGross Carrying at Beginning of the year 1,263,982 1,260,762Accumulated Depreciation at Beginning of the year 904,319 878,472
Opening Carrying Amount 359,663 382,290Additions during the year 21,100 71,973 Deductions (net) during the year (14) (617)Depreciation for the period (95,631) (93,983)Closing Carrying amount 285,118 359,663
Gross Carrying at end of the year 1,280,447 1,263,982Accumulated Depreciation at end of the year 995,329 904,319
Other Fixed AssetsGross Carrying at Beginning of the year 2,269,670 1,896,807 Accumulated Depreciation at Beginning of the year 1,445,411 1,291,399
Opening Carrying Amount 824,259 605,408Additions during the year 227,941 477,030 Deductions (net) during the year (120,223) (9,797)Depreciation for the period (279,856) (248,382)Closing Carrying amount 652,121 824,259
Gross Carrying at end of the year 2,318,664 2,269,670 Accumulated Depreciation at end of the year 1,666,543 1,445,411
Schedule 18: Notes forming part of the fi nancial statements of the India Branches (Continued)For the year ended 31 March 2020
4. Notes to fi nancial statements (Continued)m. Disclosure requirements as per Accounting Standards (Continued)
ECO
NOM
IC &
PO
LITI
CAL
WEE
KLY

Deutsche BankIndia Annual Results 2019-2020Deutsche Bank AG, India Branches(Incorporated in Germany with limited liability)
Economic & Political Weekly EPW Published on Saturday, JUNE 27, 2020 vol lV nos 26 & 27 285
ii) AS 26 – Intangible assets included under Other fi xed assets (including furniture and fi xtures). It includes amount capitalized as software. (In Rs’000)
31 March 2020 31 March 2019Cost as at 31 March of the preceding year 845,081 544,736Addition during the year 310,327 306,035Deduction during the year (158,733) (5,690)Accumulated depreciation to date (461,594) (340,296)Net Value as at 31 March of the current year 535,081 504,785
iii) AS 28 – Impairment of Assets – During the year provision of Rs. Nil (Previous year Rs. Nil) with respect to impairment of Fixed Assets which has been included in Schedule 16.12.
iv) No disclosures are required under AS 24 on Discontinuing Operations. v) Consolidated fi nancial statements
The Bank has 30% of ownership interest in Comfund Consulting Limited (the Company). The Company’s main objects include carrying on business as consultants and / or advisors to industries, companies and other business establishments. However, the Company surrendered the license to act as a non-banking fi nance company to Reserve Bank of India on March 26, 2004. The Company has no operations, and the fi nancial statements of the Company are prepared based on liquidation basis of accounting.Investments in the Company are not held so as to lead to any economic benefi ts to the Bank. Accordingly no consolidation is required under Accounting Standard 21, “Consolidated Financial Statements” (AS – 21). Further the Company is under long-term restrictions that signifi cantly impair its ability to transfer funds to the Bank. Accordingly no consolidation is required under Accounting Standard 23, “Accounting for Investments in Associates in consolidated fi nancial statements” (AS-23). Hence the Bank does not consolidate the Company and has accounted for the investment in the Company in accordance with Accounting Standard 13, ‘Accounting for Investments’. Such non-consolidation does not have material impact on the fi nancial results of the Bank.
n. Additional disclosures i Provisions and Contingencies shown under the head Expenditure in Profi t and Loss Account: (In Rs.’000)
31 March 2020 31 March 2019Provision for loan loss (net) 1,121,733 113,867Provision / (write back) for contingent credit exposures (42,906) 47,811Provision made on sale of NPA 37,500 -Provision / (write back) for standard assets 47,936 1,214,149Provision / (write back) for country risk 21,772 (5,035)Bad debts written off 1,049,334 1,688,550Provision / (write back) for depreciation on investments 2,696,443 112,514Other Provisions (net) 392,522 (956,886)Provision for taxation: 0 0
(a) Current tax 10,190,689 11,169,254(b) Deferred tax (683,883) (508,150)
Total 14,831,140 12,876,074
Other Provisions (net) represent provisions made on prudential basis on specifi c advances or exposures which are not NPAs and general provision created for accounts where moratorium is granted in accordance with RBI guidelines relating to COVID-19 Regulatory Package. The Bank has reviewed all its pending litigations and long term contracts, including derivative contracts, to assess material foreseeable losses. At the year-end adequate provision for material foreseeable losses on such long term contracts, including derivative contracts has been made in the books of accounts in accordance with its accounting policy on provisions and contingencies.
ii Floating provision (In Rs’000)
31 March 2020 31 March 2019Opening balance 712,260 712,260Add: Floating provisions made during the year – –Less: Draw down made during the year – –Closing balance 712,260 712,260
iii (a) Drawdown on reserves The Bank has drawn down investment reserve of Rs. 145,699 thousand during the year ended 31 March 2020 (Previous year: Rs. 47,526 thousand) as required by RBI circular DBR No BP.BC.6/21.04.141/2015-16 dated 1 July 2015.
iii (b) Investment Fluctuation ReserveThe Bank has created Investment Fluctuation Reserve of Rs 2,400,000 thousand during the year ended 31 March 2020 (Previous year: Rs. 804,519 thousand) as required by RBI circular DBR.No.BP.BC.102/21.04.048/2017-18 dated 2 April 2018.
iv Customer complaints
31 March 2020 31 March 2019A Customer complaints
(a) No. of complaints pending at the beginning of the year 15 184 (b) No. of complaints received during the year 2,306 2,348 (c) No. of complaints redressed during the year 2,295 2,517 (d) No. of complaints pending at the end of the year 26 15
B Awards passed by the Banking Ombudsman(a) No. of unimplemented awards at the beginning of the year – –(b) No. of Awards passed by the Banking Ombudsman during the year – –(c) No. of Awards implemented during the year – –(d) No. of unimplemented Awards at the end of the Year – –
Schedule 18: Notes forming part of the fi nancial statements of the India Branches (Continued)For the year ended 31 March 2020
4. Notes to fi nancial statements (Continued)m. Disclosure requirements as per Accounting Standards (Continued) vi Other accounting standards (Continued)
ECO
NOM
IC &
PO
LITI
CAL
WEE
KLY

Deutsche BankIndia Annual Results 2019-2020Deutsche Bank AG, India Branches(Incorporated in Germany with limited liability)
Published on Saturday, JUNE 27, 2020 vol lV nos 26 & 27 EPW Economic & Political Weekly286
v Letter of comfort The Bank has not issued any letter of comfort during the year ended March 31, 2020 and March 31, 2019. vi Provisioning Coverage Ratio as at 31 March 2020 is 55.75% (Previous year 51.23%) vii Bancassurance business Fees / remuneration received in respect of bancassurance business during the year is as follows:
(In Rs. ‘000)
31 March 2020 31 March 2019For selling life insurance products 62,826 62,416For selling non life insurance products 26,202 24,541For selling Mutual fund products 335,468 439,994For selling PMS products 100,655 89,334Others – –Total 525,151 616,285
viii Concentration of Deposits, Advances, Exposures and NPAs i Concentration of Deposits (In Rs. ‘000)
31 March 2020 31 March 2019Total Deposits of twenty largest depositors 141,029,483 151,375,746Percentage of Deposits of twenty largest depositors to Total Deposits of the bank 23.54% 26.95%
ii Concentration of Advances* (In Rs. ‘000)
31 March 2020 31 March 2019Total Advances to twenty largest borrowers 640,005,973 540,923,534Percentage of Advances to twenty largest borrowers to Total Advances of the bank 41.05% 37.99%
*Advances are computed as per defi nition of Credit Exposure including derivatives furnished in RBI’s Master Circular on Exposure Norms. iii Concentration of Exposures** (In Rs. ‘000)
31 March 2020 31 March 2019
Total Exposure to twenty largest borrowers/customers 670,116,705 542,456,563Percentage of Exposures to twenty largest borrowers/customers to Total Exposure of the bank on borrowers/customers
41.05% 37.35%
**Exposures are computed based on credit and investment exposure as prescribed in RBI’s Master Circular on Exposure Norms. iv Concentration of NPAs
(In Rs. ‘000)
31 March 2020 31 March 2019
Total Exposure to top four NPA accounts 8,977,246 8,207,246
ix Sector-wise Advances and NPAs (In Rs. ‘000)
31 March 2020 31 March 2019Sector / Sub-Sector * Outstanding
Total Advances
Gross NPAs
% of Gross NPAs
to Total Advances in
that sector
Outstanding Total
Advances
Gross NPAs
% of Gross NPAs
to Total Advances in
that sector
A PRIORITY SECTOR1 Agriculture and allied activities – – – – – – 2 Advances to industries sector eligible
as priority sector lending, of which :101,453,968 1,484,667 1.46% 95,367,705 863,712 0.91%
Chemicals and Chemical Products 23,075,849 9,769 0.04% 16,670,381 17,353 0.10% Basic Metal and Metal Products – – – 11,185,313 69,617 0.62% All Engineering 20,649,541 620,987 3.01% 20,422,606 321,439 1.57%
Gems and Jewellery – – – 12,246,679 – –3 Services, of which : 61,386,120 812,913 1.32% 49,197,146 558,949 1.14% Computer Software 21,890,102 44,108 0.20% 19,914,744 17,155 0.09% Other Services 13,552,087 330,966 2.44% 9,981,196 193,781 1.94% Banking and fi nance other
than NBFC and MFs7,843,107 – – 10,348,930 – 0.00%
Non-Banking Financial Companies 8,100,000 – –4 Personal loans, of which : 131,560 3,290 2.50% 165,473 2,729 1.65% Housing Loans 131,560 3,290 2.50% 165,473 2,729 1.65%
Total PRIORITY SECTOR (A) 162,971,648 2,300,870 1.41% 144,730,324 1,425,390 0.98%
Schedule 18: Notes forming part of the fi nancial statements of the India Branches (Continued)For the year ended 31 March 20204. Notes to fi nancial statements (Continued)n. Additional disclosures (Continued)
ECO
NOM
IC &
PO
LITI
CAL
WEE
KLY
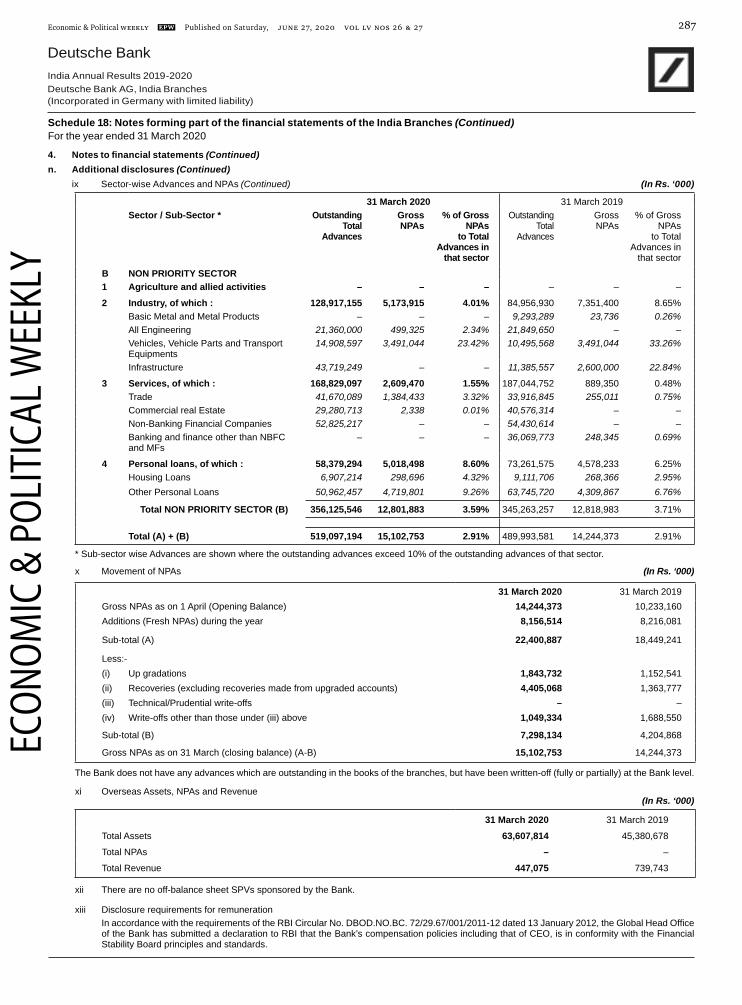
Deutsche BankIndia Annual Results 2019-2020Deutsche Bank AG, India Branches(Incorporated in Germany with limited liability)
Economic & Political Weekly EPW Published on Saturday, JUNE 27, 2020 vol lV nos 26 & 27 287
31 March 2020 31 March 2019Sector / Sub-Sector * Outstanding
Total Advances
Gross NPAs
% of Gross NPAs
to Total Advances in
that sector
Outstanding Total
Advances
Gross NPAs
% of Gross NPAs
to Total Advances in
that sector
B NON PRIORITY SECTOR 1 Agriculture and allied activities – – – – – –
2 Industry, of which : 128,917,155 5,173,915 4.01% 84,956,930 7,351,400 8.65%Basic Metal and Metal Products – – – 9,293,289 23,736 0.26%
All Engineering 21,360,000 499,325 2.34% 21,849,650 – – Vehicles, Vehicle Parts and Transport
Equipments 14,908,597 3,491,044 23.42% 10,495,568 3,491,044 33.26%
Infrastructure 43,719,249 – – 11,385,557 2,600,000 22.84%
3 Services, of which : 168,829,097 2,609,470 1.55% 187,044,752 889,350 0.48%Trade 41,670,089 1,384,433 3.32% 33,916,845 255,011 0.75%Commercial real Estate 29,280,713 2,338 0.01% 40,576,314 – – Non-Banking Financial Companies 52,825,217 – – 54,430,614 – –
Banking and fi nance other than NBFC and MFs
– – – 36,069,773 248,345 0.69%
4 Personal loans, of which : 58,379,294 5,018,498 8.60% 73,261,575 4,578,233 6.25% Housing Loans 6,907,214 298,696 4.32% 9,111,706 268,366 2.95% Other Personal Loans 50,962,457 4,719,801 9.26% 63,745,720 4,309,867 6.76%
Total NON PRIORITY SECTOR (B) 356,125,546 12,801,883 3.59% 345,263,257 12,818,983 3.71%
Total (A) + (B) 519,097,194 15,102,753 2.91% 489,993,581 14,244,373 2.91%
* Sub-sector wise Advances are shown where the outstanding advances exceed 10% of the outstanding advances of that sector.
x Movement of NPAs (In Rs. ‘000)
31 March 2020 31 March 2019Gross NPAs as on 1 April (Opening Balance) 14,244,373 10,233,160Additions (Fresh NPAs) during the year 8,156,514 8,216,081
Sub-total (A) 22,400,887 18,449,241
Less:-(i) Up gradations 1,843,732 1,152,541(ii) Recoveries (excluding recoveries made from upgraded accounts) 4,405,068 1,363,777(iii) Technical/Prudential write-offs – –(iv) Write-offs other than those under (iii) above 1,049,334 1,688,550
Sub-total (B) 7,298,134 4,204,868
Gross NPAs as on 31 March (closing balance) (A-B) 15,102,753 14,244,373
The Bank does not have any advances which are outstanding in the books of the branches, but have been written-off (fully or partially) at the Bank level.
xi Overseas Assets, NPAs and Revenue (In Rs. ‘000)
31 March 2020 31 March 2019
Total Assets 63,607,814 45,380,678
Total NPAs – –
Total Revenue 447,075 739,743
xii There are no off-balance sheet SPVs sponsored by the Bank.
xiii Disclosure requirements for remuneration In accordance with the requirements of the RBI Circular No. DBOD.NO.BC. 72/29.67/001/2011-12 dated 13 January 2012, the Global Head Offi ce of the Bank has submitted a declaration to RBI that the Bank’s compensation policies including that of CEO, is in conformity with the Financial Stability Board principles and standards.
Schedule 18: Notes forming part of the fi nancial statements of the India Branches (Continued)For the year ended 31 March 2020
4. Notes to fi nancial statements (Continued)n. Additional disclosures (Continued) ix Sector-wise Advances and NPAs (Continued) (In Rs. ‘000)
ECO
NOM
IC &
PO
LITI
CAL
WEE
KLY

Deutsche BankIndia Annual Results 2019-2020Deutsche Bank AG, India Branches(Incorporated in Germany with limited liability)
Published on Saturday, JUNE 27, 2020 vol lV nos 26 & 27 EPW Economic & Political Weekly288
xiv Disclosures relating to Securitisation
During the year, the Bank has not entered into any securitisation transactions (Previous year Rs Nil).
xv Credit Default Swaps
During the year, the Bank has not entered into credit default swaps (Previous year Rs Nil).
xvi Intra-Group Exposures
The details of Intra-Group transaction are as follows: (In Rs. ‘000)
31 March 2020 31 March 2019
Total amount of Intra-group exposures 16,065,737 18,801,424
Total amount of top 20 intra group exposures 16,065,737 18,801,424
% of intra-group exposure to total exposure of the bank on borrowers / customers 0.98% 1.29%
Breach of limits on intra group exposures No No
xvii Transfers to Depositor Education and Awareness Fund (DEAF) (In Rs. ‘000)
31 March 2020 31 March 2019
Opening balance of amounts transferred to DEAF 394,960 285,407
Add : Amounts transferred to DEAF during the year 63,038 111,120
Less : Amounts reimbursed by DEAF towards claims (2,340) (1,567)
Closing balance of amounts transferred to DEAF 455,658 394,960
xviii Unhedged Foreign Currency Exposure
The Bank has in place a policy on managing credit risk arising out of Unhedged Foreign Currency Exposures of its borrowers. In order to minimize risk arising out of exposure to corporates, all foreign currency loans granted by the Bank in excess of USD 10 million are subject to it being mandatorily hedged for foreign currency risk by the corporate, except in the following cases:
■ Foreign currency loans extended to fi nance exports provided customers have uncovered receivables to cover the loan amount.
■ Foreign currency loans extended for meeting foreign currency expenditure.
In addition to the above, foreign exchange (FX) risk on unhedged exposures is a crucial part of the risk assessment of the Bank as under:
■ FX risk on account of unhedged exposures is factored in during the initial and annual rating exercise based on its impact on the credit profi le of the counterparty. The counterparty rating is a critical determinant of all credit reviews and credit decisions.
■ FX Hedging policy of clients is discussed in detail during periodic client meetings and information is obtained about existing hedged and unhedged positions of the client and policy on hedging.
■ The FX risk of unhedged positions is also qualitatively assessed based on natural hedge available to the counterparty, under business economics/type of exposure to be hedged.
■ Rapid portfolio reviews are also conducted during periods of relative currency volatility and appropriate action is taken at a counterparty level to manage credit risks.
The Bank has maintained incremental standard asset provision of Rs. 942,748 thousand (Previous year Rs. 1,572,286 thousand) and incremental capital of Rs. 4,775,703 thousand (Previous year Rs. 8,198,531 thousand) on account of Unhedged Foreign Currency Exposure of its borrowers.
xix The Bank has outstanding factoring exposure of Rs. 38,516,980 thousand (Previous year: Rs. 26,427,474 thousand). The same has been included under the head ‘Bills purchased and discounted’ in Schedule 9.1.
Schedule 18: Notes forming part of the fi nancial statements of the India Branches (Continued)For the year ended 31 March 20204. Notes to fi nancial statements (Continued)n. Additional disclosures (Continued)
ECO
NOM
IC &
PO
LITI
CAL
WEE
KLY

Deutsche BankIndia Annual Results 2019-2020Deutsche Bank AG, India Branches(Incorporated in Germany with limited liability)
Economic & Political Weekly EPW Published on Saturday, JUNE 27, 2020 vol lV nos 26 & 27 289
o. Liquidity Coverage Ratio (In Rs. ‘000)Daily average for Quarter ended
30 June, 2019Daily average for Quarter ended
30 September, 2019Daily average for Quarter ended
31 December, 2019Daily average for Quarter ended
31 March, 2020TOTAL
UNWEIGHTED VALUE
(average)
TOTAL WEIGHTED
VALUE(average)
TOTAL UNWEIGHTED
VALUE(average)
TOTAL WEIGHTED
VALUE(average)
TOTAL UNWEIGHTED
VALUE(average)
TOTAL WEIGHTED
VALUE(average)
TOTAL UNWEIGHTED
VALUE(average)
TOTAL WEIGHTED
VALUE(average)
High Quality Liquid Assets1 Total high-quality liquid assets (HQLA) 241,070,159 261,860,933 274,053,012 276,011,729Cash Outfl ows 2 Retail deposits and deposits from small
business customers, of which:80,709,254 7,965,307 83,560,739 8,252,500 84,596,010 8,355,803 84,792,572 8,375,041
(i) Stable deposits 2,112,378 105,619 2,071,493 103,575 2,075,964 103,798 2,084,324 104,216(ii) Less stable deposits 78,596,876 7,859,688 81,489,246 8,148,925 82,520,046 8,252,005 82,708,248 8,270,8253 Unsecured wholesale funding, of which: 347,924,575 136,880,960 368,069,675 145,708,164 373,912,995 145,878,325 390,749,408 158,795,752(i) Operational deposits (all counterparties)
and deposits in networks of cooperative banks
183,323,428 45,797,856 184,610,515 46,119,788 208,245,627 52,028,337 211,272,375 52,783,663
(ii) Non-operational deposits (all counterparties) 164,601,147 91,083,104 183,459,160 99,588,376 165,667,368 93,849,988 179,477,033 106,012,089(iii) Unsecured debt - - - - - - - -4 Secured wholesale funding - - -5 Additional requirements, of which: 323,476,291 29,310,242 314,712,874 26,407,352 328,893,642 22,187,941 324,226,128 23,993,857(i) Outfl ows related to derivative exposures
and other collateral requirements- 10,273,946 - 8,378,129 - 4,143,220 - 6,361,266
(ii) Outfl ows related to loss of funding on debt products
(iii) Credit and liquidity facilities 32,34,76,291 1,90,36,296 31,47,12,874 1,80,29,223 32,88,93,642 1,80,44,721 32,42,26,128 1,76,32,5916 Other contractual funding obligations 10,35,570 10,35,570 11,87,113 11,87,113 10,10,722 10,10,722 9,38,387 9,38,3877 Other contingent funding obligations 20,55,21,652 61,65,650 20,99,79,669 62,99,390 21,07,07,953 63,21,239 19,91,75,620 59,75,2698 Total Cash Outfl ows 181,357,729 187,854,519 183,754,030 198,078,306Cash infl ows9 Secured lending (eg reverse repos) 51,431,440 - 57,653,569 - 90,970,290 - 85,653,794 -10 Infl ows from fully performing exposures 193,367,099 125,913,764 193,935,876 128,094,564 201,139,715 144,796,364 193,792,080 133,064,71311 Other cash infl ows 6,342,430 5,321,687 3,940,347 3,793,539 2,921,121 2,729,605 7,269,479 6,802,73312 Total Cash Infl ows 251,140,969 131,235,451 255,529,792 131,888,103 295,031,126 147,525,969 286,715,353 139,867,446
TOTAL ADJUSTED
VALUE
TOTAL ADJUSTED
VALUE
TOTAL ADJUSTED
VALUE
TOTAL ADJUSTED
VALUE13 Total HQLA 241,070,159 261,860,933 274,053,012 276,011,72914 Total Net Cash Outfl ows* 50,122,278 55,966,416 45,938,507 58,210,86015 Liquidity Coverage Ratio (%) 480.96% 467.89% 596.56% 474.16%
* Total Net Cash Outfl ows is capped to 25% of Cash outfl ows
(In Rs. ‘000)Daily average for Quarter
ended 30 June, 2018Daily average for Quarter ended 30 September, 2018
Daily average for Quarter ended 31 December, 2018
Daily average for Quarter ended 31 March, 2019
TOTAL UNWEIGHTED
VALUE(average)
TOTAL WEIGHTED
VALUE(average)
TOTAL UNWEIGHTED
VALUE(average)
TOTAL WEIGHTED
VALUE(average)
TOTAL UNWEIGHTED
VALUE(average)
TOTAL WEIGHTED
VALUE(average)
TOTAL UNWEIGHTED
VALUE(average)
TOTAL WEIGHTED
VALUE(average)
High Quality Liquid Assets1 Total high-quality liquid assets (HQLA) 164,554,496 196,298,567 177,670,710 178,457,300Cash Outfl ows 2 Retail deposits and deposits from small
business customers, of which: 57,871,348 5,682,253 62,092,651 6,106,903 68,808,242 6,778,229 73,859,793 7,285,028
(i) Stable deposits 2,097,625 104,881 2,047,253 102,363 2,051,905 102,595 2,019,032 100,952(ii) Less stable deposits 55,773,723 5,577,372 60,045,398 6,004,540 66,756,337 6,675,634 71,840,761 7,184,0763 Unsecured wholesale funding, of which: 286,267,323 112,633,814 319,303,180 132,356,954 324,387,782 127,596,717 322,375,038 132,705,527
(i) Operational deposits (all counterparties) and deposits in networks of cooperative banks 168,689,191 42,139,201 178,536,831 44,599,702 176,229,730 44,023,849 170,785,620 42,663,029
(ii) Non-operational deposits (all counterparties) 117,578,132 70,494,613 140,766,349 87,757,252 148,158,052 83,572,868 151,589,418 90,042,498(iii) Unsecured debt – – – – – – – –4 Secured wholesale funding – – –5 Additional requirements, of which: 404,476,849 26,118,143 385,370,088 26,159,257 343,640,541 23,758,355 325,539,762 22,426,374
(i) Outfl ows related to derivative exposures and other collateral requirements – 2,086,609 – 3,055,100 – 3,390,386 – 3,179,704
(ii) Outfl ows related to loss of funding on debt products – – – – – – – –
(iii) Credit and liquidity facilities 404,476,849 24,031,534 385,370,088 23,104,157 343,640,541 20,367,969 325,539,762 19,246,6706 Other contractual funding obligations 709,522 709,522 786,667 786,667 882,731 882,731 927,772 927,7727 Other contingent funding obligations 176,331,123 5,289,934 183,936,805 5,518,104 204,554,496 6,136,635 196,849,935 5,905,4988 Total Cash Outfl ows 150,433,666 170,927,885 165,152,667 169,250,199Cash infl ows9 Secured lending (eg reverse repos) 38,651,503 – 72,624,745 – 28,769,290 – 33,265,830 –10 Infl ows from fully performing exposures 171,392,969 110,961,425 198,017,417 130,661,378 209,263,179 136,775,354 198,024,849 132,176,31211 Other cash infl ows 8,069,397 5,467,521 4,353,665 4,091,814 9,358,536 6,914,376 16,984,017 11,545,32212 Total Cash Infl ows 218,113,869 116,428,946 274,995,827 134,753,192 247,391,005 143,689,730 248,274,696 143,721,634
TOTAL ADJUSTED
VALUE
TOTAL ADJUSTED
VALUE
TOTAL ADJUSTED
VALUE
TOTAL ADJUSTED
VALUE13 Total HQLA 164,554,496 196,298,567 177,670,710 178,457,30014 Total Net Cash Outfl ows* 37,608,417 42,731,971 41,288,166 42,312,55015 Liquidity Coverage Ratio (%) 437.55% 459.37% 430.32% 421.76%
* Total Net Cash Outfl ows is capped to 25% of Cash outfl ows
Schedule 18: Notes forming part of the fi nancial statements of the India Branches (Continued)For the year ended 31 March 2020
4. Notes to fi nancial statements (Continued)
ECO
NOM
IC &
PO
LITI
CAL
WEE
KLY

Deutsche BankIndia Annual Results 2019-2020Deutsche Bank AG, India Branches(Incorporated in Germany with limited liability)
Published on Saturday, JUNE 27, 2020 vol lV nos 26 & 27 EPW Economic & Political Weekly290
Qualitative Disclosure around LCR The Bank measures and monitors the Liquidity Coverage Ratio (LCR) in line with the extant RBI guidelines. The LCR is intended to promote the short-term resilience of a bank’s liquidity risk profi le over a 30 day stress scenario. The ratio is defi ned as the amount of High Quality Liquid Assets (“HQLA”) that could be used to raise liquidity, measured against the total volume of net cash outfl ows, arising from both actual and contingent exposures, in a stressed scenario. The minimum LCR requirement from 1st January 2019 till 27th March 2020 was 100%, it reduced to 80% from 28 March 2020 till 30 September 2020. As per the RBI circular minimum LCR should be 90% from 1 October 2020 till 31 March 2021, from April 1 2021 onwards minimum LCR will be 100%.The Bank’s average LCR for the quarter ended March 2020 stood at 474.16% as against 421.76% for the quarter ended March 2019. In accordance with RBI guidelines dated 31st March 2015, the LCR ratio for the quarter ended March 2020 is computed on daily LCR observations.The banks maintain HQLA primarily in the form of cash including excess CRR with the RBI, unencumbered SLR holdings over and above the mandatory SLR requirement and the portion of mandatory SLR holdings that are allowed by the RBI to be counted towards HQLA through the Marginal Standing Facility (MSF) and the Facility to Avail Liquidity for Liquidity Coverage Ratio (FALLCR).The Bank has maintained an average HQLA of Rs. 276,011,729 thousand for quarter ended March 2020 as against Rs. 178,457,300 thousand for quarter ended March 2019.The Bank’s average net cash outfl ows stood at Rs. 58,210,860 thousand for quarter ended March 2020 as against Rs. 42,312,550 thousand for quarter ended March 2019. The main drivers for cash outfl ows are operational and non-operational deposits from corporate and retail customers, short-term borrowings and contingent outfl ows from credit and liquidity facilities, letter of credit, guarantees and trade fi nance facilities granted to corporate customers. The main LCR infl ow driver is infl ows from fully performing exposures, representing infl ows from loans extended to retail and corporate customers.The Bank’s Asset Liability Committee (ALCO) manages and defi nes its funding strategy to maintain a stress-compliant and diversifi ed funding profi le based on LCR requirements, the Bank’s liquidity risk appetite and the Bank’s internal liquidity risk management framework. The ALCO manages the liquidity requirements of all of the Bank’s Indian branches and business centrally and holistically, meetings are chaired by the Bank’s Treasurer and attended by the CEO, CFO, COO, the Bank’s business heads and infrastructure function heads.
p. Corporate Social Responsibility (‘CSR’) The Bank continues to have a strong focus on CSR and has put in place a very strong governance process around project adoption and funds disbursal. The Bank’s CSR Policy document sets out the following primary objectives:i. Education - Enabling underprivileged children and youth overcome poverty through education and to reach their full potential, by boosting their
aspirations, improving their skill set and by making vocational training and job placements available to them. The Bank will work across the education continuum – primary, secondary and tertiary levels leading up to employability.
ii. Healthcare - Providing end-to-end access to affordable and quality healthcare to children, youth and adults from socially and economically backward background. This includes preventive & early screening of diseases, curative & operative healthcare for fatal diseases as well as capacity building for hospitals & institutions.
iii. Social & Environment Sustainability - Developing sustainable ideas that drive social and environmental change for increasing the country’s forest and water reserves and usage of renewable energy.
iv. Disaster Relief - Enabling funds directly or through implementing partners to support natural disaster relief efforts as may be required in the country from time to time.
v. CSR activities falling within the scope of Schedule VII of Section 135 of the Companies Act, 2013. Based on the above, the Bank has identifi ed and executed on CSR activities. a. Gross amount required to be spent by the Bank is Rs. 390,711 thousand (Previous year Rs. 387,926 thousand) b. Amount spent during the year is Rs. 394,192 thousand (Previous year Rs. 389,851 thousand), in accordance with the Companies Act, 2013,
expenditure towards corporate social responsibility is recognized in the Profi t and Loss account. The details of amount spent during the respective year towards CSR are as under (In Rs. ‘000)
31 March 2020 31 March 2019Amountspent
AmountUnpaid/
provision
Total Amountspent
AmountUnpaid/
provision
Total
1 Construction / acquisition of any asset – – – – – –2 On purpose other than (i) above 394,192 – 394,192 389,851 – 389,851
q. Disclosure on provisioning pertaining to fraud accounts (In Rs. ‘000)
31 March 2020 31 March 2019Number of frauds reported during the year 46 52Amounts involved 152,492 1,931Provisions made during the year 134,219 121Unamortised provision debited from ‘other reserves’ as at the end of the year – –
r. Priority Sector Lending Certifi cates (PSLCs) purchased / sold (In Rs. ‘000)
31 March 2020 31 March 2019Type of PSLCs Purchased Sold Purchased SoldPSLC - Agriculture – – – –PSLC - SF / MF – – – –PSLC - Micro Enterprises – – – –PSLC - General 49,000,000 – 15,927,500 –Total 49,000,000 – 15,927,500 –
s. Disclosure under Micro, Small and Medium Enterprises Development Act, 2006 Under the Micro, Small and Medium Enterprises Development Act, 2006, (MSMED), certain disclosures are required to be made relating to Micro, Small and Medium enterprises. On the basis of the information and records available with the Management and confi rmation sought from suppliers by the Bank on registration with specifi ed authority under MSMED, principal amount unpaid to such enterprises as at end of the year is Rs. 1,288 thousand
Schedule 18: Notes forming part of the fi nancial statements of the India Branches (Continued)For the year ended 31 March 2020
4. Notes to fi nancial statements (Continued)o. Liquidity Coverage Ratio (Continued)
ECO
NOM
IC &
PO
LITI
CAL
WEE
KLY

Deutsche BankIndia Annual Results 2019-2020Deutsche Bank AG, India Branches(Incorporated in Germany with limited liability)
Economic & Political Weekly EPW Published on Saturday, JUNE 27, 2020 vol lV nos 26 & 27 291
(Previous year Rs. 502 thousand) and interest thereon is Rs Nil (Previous year Rs. Nil), principal amount paid after the due date to such enterprises is Rs. 881 thousand (Previous year Rs. 140 thousand) and the interest payable as at 31 March 2020 to such enterprises is Rs. 1 thousand (Previous year Rs. 2 thousand).
t. Implementation of Indian Accounting Standards (Ind AS) The Ministry of Corporate Affairs (MCA), on 18 January 2016 issued a press release setting out the dates of Indian Accounting Standards (Ind AS) applicability for banks from the accounting period beginning 1 April 2019. The RBI had also advised that the Banks in India are required to implement Ind AS from 1 April 2019. Subsequently implementation of Ind AS was deferred by one year by RBI as the necessary legislative amendments to make the formats of fi nancial statements compatible with Ind AS were under consideration of the Government. Further, RBI vide its notifi cation dated 22 March 2019 has deferred the implementation of Ind AS till further notice.Based on RBI directions, the Bank continues to submit proforma Ind AS fi nancials to RBI on a quarterly basis. The Ind AS guidelines converge substantially with International Financial Reporting Standards (IFRS) and the Bank already prepares its fi nancial statements for Head Offi ce Reporting based on IFRS. Hence, the Bank has approached Ind AS implementation primarily as a review and analysis of existing IFRS reporting practices vis-à-vis Ind AS.
u. Movement in provision for debit card reward points (In Rs. ‘000)
31 March 2020 31 March 2019Opening provision 7,484 8,031Provision made during the year 5,919 4,573Utilization of provision during the year (5,950) (5,120)Closing provision 7,453 7,484
v. Provisions, Contingent liabilities and contingent asset
Sr. No
Contingent Liabilities Brief
1) Claims against the Bank not acknowledged as debts
The Bank is a party to various legal proceedings in the normal course of business. The Bank’s pending claims and litigations comprise of claims & litigations against the Bank by clients and proceedings pending with Income tax authorities, which are disputed by the bank and possible to be held against the bank.
2) Liability on account of foreign exchange and derivative contracts
The Bank enters into foreign exchange contracts, currency options, forward rate agreements, currency swaps, exchange traded derivatives and interest rate swaps with interbank participants/customers. Forward exchange contracts are commitments to buy or sell foreign currency at a future date at the contracted rate. Currency swaps are commitments to exchange cash fl ows by way of interest/principal in one currency against another, based on predetermined rates. Exchange traded derivatives are standardized future dated derivative contracts traded in a recognized stock exchange. Interest rate swaps are commitments to exchange fi xed and fl oating interest rate cash fl ows. The notional amounts that are recorded as contingent liabilities are typically amounts used as benchmark for the calculation of the interest component of the contracts.
3) Guarantees given on behalf of constituents, acceptances, endorsements and other obligations
As part of its commercial banking activities the Bank issues documentary credit and guarantees on behalf of its customers. Documentary credits such as letters of credit enhance the credit standing of the customers of the Bank. Guarantees generally represent irrevocable assurances that the Bank will make payments in the event of the customer failing to fulfi ll its fi nancial or performance obligations.
4) Other items for which the Bank is contingently liable- Others
These include undrawn commitments, capital commitments, amount transferred to the RBI under the Depositor Education and Awareness Fund (DEAF), forward asset purchases and value of investments traded on or before the Balance Sheet date with a settlement post the Balance Sheet date.
Provident fund liabilityOn 28 February 2019, the Hon’ble Supreme Court of India in its judgment clarifi ed that certain special allowances would be part of the wages for the purpose of considering the contribution under the Employees’ Provident Funds and Miscellaneous Provisions Act, 1952 (the PF Act). The Bank has accordingly implemented the judgement with effect from March 1, 2019 for the impacted categories of employees (a) Employees with Basic Salary lower than Rs. 15,000 per month, for whom the PF computation is now based on Basic salary plus allowances, and (b) International workers for whom PF would be on their Basic salary plus allowances, except certain foreign nationals who would be considered Indian nationals for the purpose of PF computation.
w. Comparative fi gures Certain comparative fi gures have been reclassifi ed to conform to the current year’s presentation.Signatures to Schedule 1 to 18 form part of the Financial Statements and to the above notes.The schedules referred to above and the attached notes form an integral part of the Financial Statements. As per our Report of even date.
Schedule 18: Notes forming part of the fi nancial statements of the India Branches (Continued)For the year ended 31 March 20204. Notes to fi nancial statements (Continued)
For MSKC & Associates (Formerly known as R.K. Kumar & Co.) For Deutsche Bank AG - India BranchesChartered AccountantsFirm Registration No: 001595S
Sd/- Sd/- Sd/-Tushar Kurani Kaushik Shaparia Avinash PrabhuPartner Chief Executive Offi cer – India Chief Financial Offi cer – IndiaMembership No: 118580
Place : Mumbai Place : MumbaiDate : 22 June, 2020 Date : 22 June, 2020
ECO
NOM
IC &
PO
LITI
CAL
WEE
KLY

Deutsche BankIndia Annual Results 2019-2020Deutsche Bank AG, India Branches(Incorporated in Germany with limited liability)
Published on Saturday, JUNE 27, 2020 vol lV nos 26 & 27 EPW Economic & Political Weekly292
1. Scope of applicationThe BASEL III - Pillar 3 disclosures contained herein relate to Deutsche Bank AG - India Branches (herein also referred to as the ‘Bank’) for the period ended March 31, 2020. These are compiled in accordance with the Reserve Bank of India (the ‘RBI’) Master Circular – Basel III Capital Regulation DBR.No.BP.BC.1/21.06.201/2015-16 dated July 1, 2015 and the amendments thereto issued from time to time.
As at March 31, 2020, the Bank is required to maintain minimum Common Equity Tier1 (CET1) capital ratio of 5.50%, Capital conservation buffer (CCB) of 1.875%, Global Systemically Important Banks buffer (GSIB) of 2%, minimum Tier-1 capital ratio of 7% and minimum total capital ratio including CCB and GSIB is 12.875%.
The following table lists Bank’s associates and their treatment in consolidated capital adequacy computations.
Name of the entity Included under accounting scope of
consolidation
Method of accounting
consolidation
Included under regulatory scope of
consolidation
Method of regulatory
consolidation
Reasons for difference in
the method of consolidation
Reasons for consolidation under one of the scope of
consolidation
Comfund Consulting Limited
No Refer Schedule 18 Note 4 m vi v of fi nancial statement of Bank as at
31 March 2020
Not Applicable No Not Applicable Not Applicable Not Applicable - Risk weighted for capital adequacy
purposes
List of Group entities operating in India and considered for regulatory scope of consolidation is as under. The Bank does not hold any investment in these group entities.
(In Rs. ‘000)
Sr. No.
Name of entity Principal activity of the entity Total balance sheet equity *
Total balance sheet assets *
1 Deutsche India Holdings Private Limited (DIHPL)
NBFC & Holding company 6,935,950 7,076,710
2 Deutsche Investments India Private Limited (DIIPL)
NBFC Business / Non-discretionary Portfolio management Services
9,007,290 19,253,300
* Figures as per audited accounts of March 31, 2019
List of Group entities operating in India and not considered for consolidation both under accounting and regulatory scope of consolidation is as under. The Bank does not hold any investment in these group entities.
(In Rs. ‘000)
Sr. No.
Name of entity Principal activity of the entity Total balance sheet equity*
Total balance sheet assets*
1 Deutsche Asset Management (India) Private Limited
Not Applicable$ 889,330 974,970
2 Deutsche Securities (India) Private Limited Not Applicable# 854,999 857,817
3 Deutsche Equities India Private Limited Stock broker / Merchant banking and advisory services
3,730,730 47,081,270
4 Deutsche Investor Services Private Limited Fund accounting 365,190 572,360
5 RREEF India Advisors Private Limited Not Applicable# 237,060 238,143
6 Deutsche Trustee Services (India) Private Limited
Not Applicable# 68,163 69,021
7 Deutsche CIB Centre Private Limited Global processing centre for Back offi ce processing / support services for business lines.
3,423,640 5,392,240
8 DBOI Global Services Private Limited Global processing centre for back offi ce / IT enabled services
11,696,780 16,406,840
* Figures as per audited accounts of March 31, 2019# The members have passed a resolution for voluntary winding up$ The company does not carry on any operations
2. Capital Structure a. Summary information on the terms and conditions of the main features of all capital instruments
CET1 and Tier I Capital primarily comprises of interest free capital received from the Head Offi ce, balance in statutory reserves, capital reserves and remittable surplus retained for CRAR requirement.Tier II Capital primarily comprises of Provision on Standard Assets, Floating Provision and excess provision on sale of Non Performing Assets (NPA) which are created in accordance with the extant RBI guidelines.
Management disclosures under Pillar 3 – Year ended March 31, 2020
ECO
NOM
IC &
PO
LITI
CAL
WEE
KLY

Deutsche BankIndia Annual Results 2019-2020Deutsche Bank AG, India Branches(Incorporated in Germany with limited liability)
Economic & Political Weekly EPW Published on Saturday, JUNE 27, 2020 vol lV nos 26 & 27 293
b. Details of Capital Funds of the Bank(In Rs.‘000)
Particulars 31 Mar 2020 31 Mar 2019
Capital - Head Offi ce Account 75,881,087 75,881,087Statutory Reserve 32,265,930 29,688,575Capital Reserve 360,607 360,607Remittable Surplus Retained for CRAR requirement 43,468,052 43,468,052Less: Earmark for Electronic Trading Platform (ETP) (50,000) -Less: Intangible assets (535,081) (504,785)CET1 Capital / Tier I Capital 151,390,595 148,893,536Investment Reserve - 145,699Investment fl uctuation reserve 3,204,519 804,519Provision on Standard Assets 4,183,256 4,135,320Provision on Country Risk 86,920 65,148Floating Provision 712,260 712,260Provision made on Sale of NPA 465,000 427,500Countercyclical provisioning buffer 150,000 150,000Tier II Capital 8,801,955 6,440,446Total Capital 160,192,550 155,333,982
3. Capital adequacya. Approach to assessing capital adequacy for current and future activities
The Bank is committed to maintaining sound capitalisation. Therefore, overall capital demand and supply are constantly monitored and adjusted as necessary in line with the strategic, business and capital plans drawn up annually by the Bank. It should be noted that Deutsche Bank operates as an integrated Group through its business divisions and infrastructure functions. The local Asset and Liability Committee (ALCO) for the Bank is the primary platform for providing strategic direction and follow through action relating to the management of the entity’s fi nancial resources. Specifi cally, the ALCO ensures adequate capitalisation to meet current and future business and regulatory requirements and sets limits for capital usage by business.Stress testing and sensitivity analysis are used to assess the Bank’s ability to sustain operations during periods of stress. They provide an insight into the potential impact of signifi cant adverse events on the Bank’s earnings, risk profi le and capital position.
b. Capital requirements for credit risk, market risk, operational risk, and Capital ratios per New Capital Adequacy frameworkThe Bank is subject to the Basel III capital adequacy guidelines stipulated by RBI with effect from April 1, 2013. The guidelines provide a transition schedule for Basel III implementation till September 30, 2020.
Standalone capital ratio as per Basel III is 14.93% (In Rs.’000)
Particulars 31 March 2020 31 March 2019
Capital requirement for credit risk# -(Standardised Approach) – Portfolios subject to Standardised Approach 112,554,468 99,432,951 – Portfolios subject to securitisation exposuresThe Bank invests in Pass Through Certifi cates (PTCs)
221,945 -
Capital requirement for market risk#
(Standardised Duration Approach) 0 0 – Interest rate risk 12,381,735 12,756,023 – Foreign exchange risk (including gold) 3,374,859 3,374,859 – Equity risk 206,562 202,310 Capital requirement for operational risk#
(Basic Indicator approach)9,426,474 8,969,037
Total 138,166,043 124,735,180Deutsche Bank AG, India BranchesCET1 Capital / Tier I Capital adequacy ratio 14.11% 15.37%Total Capital adequacy ratio 14.93% 16.03%Consolidated Bank*CET1 Capital / Tier I Capital adequacy ratio 14.80% 16.04%Total Capital adequacy ratio 15.61% 16.70%
# Capital requirement is arrived at after multiplying the risk weighted assets by 12.875% * Based on unaudited accounts of DIHPL and DIIPL.
4. Risk Exposure & Assessment Risk Governance Three Lines of Defence (3LoD)
The Bank follows DB Group’s three lines of defence (LoD) organisation structure in order to protect the Bank, its customers and shareholders against risk losses and resulting reputational damages. This structure ensures that all risks are taken on, and managed, in the best and long term interest of the Bank.As per the three LoD structure, risks are fully owned by those creating or taking on the risks (1st LoD), while the setting of risk appetite, monitoring of Bank-wide risk levels against the Bank’s risk appetite and provision of challenge to risk management decisions is performed by independent control functions (2nd LoD). Independent assurance over the design and operation of controls, in turn, is provided by the 3rd LoD. This set-up ensures that all risks are identifi ed and managed, and that risk management accountabilities are clearly assigned. A role’s designation to a line of defence depends on its mandate and activities, not its organisational affi liation, e.g. an infrastructure function such as Risk or Finance may be seen as primarily a 2nd LoD control function, however will also carry responsibility for managing its own risk portfolio, thereby also having 1st LoD accountability.
Management disclosures under Pillar 3 – Year ended March 31, 2020
ECO
NOM
IC &
PO
LITI
CAL
WEE
KLY

Deutsche BankIndia Annual Results 2019-2020Deutsche Bank AG, India Branches(Incorporated in Germany with limited liability)
Published on Saturday, JUNE 27, 2020 vol lV nos 26 & 27 EPW Economic & Political Weekly294
Risk accountability – 1st LoDThe 1st LoD refers to roles in the Bank whose activities generate risks, whether fi nancial or non-fi nancial. The 1st LoD, or risk owners are accountable for:1. All fi nancial and non-fi nancial risks that are generated in their respective organisations2. Managing these risks within the defi ned risk appetite at the appropriate granularity. This includes the timely identifi cation and escalation of risk
appetite breaches3. Ensuring that the appropriate organisation, governance and structures are in place in order to identify, monitor, assess and accept or mitigate the
risks they generate or are exposed toThe 1st LoD cannot delegate its accountability for the management of its own risks, and must adhere to the standards laid out in this policy as well as additional standards set by the 2nd LoD, and any applicable regulatory requirements. A Business / Infrastructure Function Head may delegate the execution of risk management activities into his / her organisation; however, he / she retains the accountability for the execution of the risk owner mandate. Performing activities outside the risk owner’s own organisation requires a formal documented agreement between the Heads of the affected units.Independent risk control and challenge – 2nd LoDThe 2nd LoD refers to Risk type controller (RTC) roles in the Bank who, as experts for a particular risk type, defi ne the risk appetite and risk management and control standards for that risk type, and facilitate the implementation of these standards in the 1st LoD. RTCs independently oversee and challenge the risk taking and management activities of the 1st LoD. RTCs’ mandate includes: As the 2nd LOD, as experts for their risk type –1. Defi ne and regularly update the risk management framework for their risk type. This includes the setting of minimum risk management and control
standards, as well as facilitating, and independently reviewing and assessing the implementation of these standards. The framework must be compliant with all applicable rules and regulations.
2. Act as an advisor to the 1st LoD on how to identify, assess and manage risks.3. Regularly update and report their risk type’s profi le at Group and other aggregation levels. This includes the identifi cation of emerging risks.As the 2nd LoD control function for their risk type-1. Defi ne their risk type’s risk appetite, both qualitatively and quantitatively.2. Monitor the adherence to the defi ned risk appetite levels, veto decisions that would exceed the Bank’s risk appetite, escalate confi rmed breaches
of risk appetite2, and enable the application of adequate consequences where risk appetite is breached.3. Independently assess and challenge the 1st LoD risk profi les and risk management activities to ensure the Bank adheres to the risk management
standards set by the 2nd LoD.Independent assurance – 3rd LoDAs the 3rd LoD, Group Audit provides independent and objective assurance on the effectiveness of 1st and 2nd LoD interaction, risk management, internal controls and governance processes. Further information on Group.The Supervisory Board exercises strategic control and supervision of DB Group. It monitors DB’s risk and capital profi le regularly via its designated subcommittee, the Risk Committee. The chair of the Risk Committee reports on items discussed during the Risk Committee’s meetings to the Supervisory Board.The Management Board (MB) provides overall risk & capital management supervision for the Group and is responsible for day to day management of the company with the objective of creating sustainable value in the interest of its shareholders, employees, regulators and other stakeholders. The MB is responsible for defi ning and implementing comprehensive and aligned business and risk strategies, as well as ensuring well-defi ned risk management functions and operating processes are in place to ensure that DB’s overall performance is aligned to its business and risk strategy. The MB is collectively accountable for DB’s risk exposure.The Group Risk Committee (GRC) established by the MB is the central forum for review and decision on all material risk topics. Sub-committees are established to cover the different risk types. The GRC is chaired by the Chief Risk Offi cer (CRO) and covers the following tasks and duties:o Review inventory of risks and decide on materiality classifi cationo Review and recommend DB Group Risk Management Principles to the MB for approvalo Support the MB during group-wide Risk & Capital Planning process and recommend risk appetite parameters to the MB, review risk appetite per
material risk type, set risk appetite targets and establish a sanctioning system for excesseso Review Group-wide Stress Testing results and discuss/recommend actions as requiredo Advise the MB on recovery measures in times of crisis and oversee their execution as decided by the MB and decide upon mitigating actions to
be taken during periods of anticipated or actual stress. Recommend the Group Risk Appetite Statement to the MBo Recommend the Group Recovery Plan and the Contingency Funding Plan to the MB for approval and support the authorities in executing the
Group resolution plan and coordinate internallyo Review high-level risk portfolios & risk exposure developments as well as overall risk level vs. recovery triggerso Monitor the development of Risk Culture across DB Group
Country Chief Risk Offi cer The roles and responsibilities of DB India, CRO are as follows:-
o Overall responsibility of the risk functions (responsibilities for review and control of all credit, market and operational risks)o CRO is responsible for supporting the India Branch Management Board (BMB) in its engagement with and oversight of the development of the
Bank’s risk appetite and for translating the risk appetite into a risk limits structure, extending risk principles into wider business strategyo Monitoring performance relating to risk taking / risk limits adherence in RMCo Monitoring and identifying emerging risks and alerting the Board on key risks /regularly engaging with the Board on key risk issueso Highlight to senior management and the board risk management concerns, such as risk concentrations and violations of risk appetite limits.o Identifying relationship between risks in separate business units, linkages across business and thus to manage them more effectively-integrated
risk approach.o CRO’s responsibilities also include managing and participating in key decision making processes (e.g. strategic planning, capital & liquidity
planning, etc.)o Responsibility for compliance at a strategic level along with appropriate risk functions.o CRO oversees the development and execution of local objectives, plans and policies, etc.o CRO is a key personnel in the Bank and will represent risk in the various management committees such as BMB, ALCO, Risk Management
Council (RMC), India Credit Risk Council (ICRC), etc.o CRO is also the CRM head, will be the vice chair of the RMC and ICRC to avoid any confl ict of interest (RBI approval in place)The Bank has aligned its management structure in line with the global management structure of Deutsche Bank AG. The Management of the overall affairs of the Bank is vested with the BMB. The Bank has various committees to monitor its functioning and provide necessary direction in view of external / internal developments, including changes in the regulatory environment. An overlap in membership between these committees facilitates a constant and comprehensive information fl ow.The ICRC is established by the BMB (“Delegating Person”) in 2018. Its mandate is to approve signifi cant credit risk and underwriting proposals for booking in DB India, Corporate & Investment Bank (CIB) in line with local regulatory requirements. The Chief Country Offi cer (the Chairperson) is empowered by the Delegating Person to set up the structure of the Council, including membership, taking into account its aim and its tasks.
Management disclosures under Pillar 3 – Year ended March 31, 2020
ECO
NOM
IC &
PO
LITI
CAL
WEE
KLY

Deutsche BankIndia Annual Results 2019-2020Deutsche Bank AG, India Branches(Incorporated in Germany with limited liability)
Economic & Political Weekly EPW Published on Saturday, JUNE 27, 2020 vol lV nos 26 & 27 295
Specifi c Banking Risks:Credit riskCredit risk arises from all transactions where actual, contingent or potential claims against any counterparty, borrower, obligor or issuer (which we refer to collectively as “counterparties”) exist, including those claims that we plan to distribute. It captures the risk of loss because of a deterioration of a counterparty’s creditworthiness or the failure of a counterparty to meet the terms of any contract with the Bank or otherwise perform as agreed. Credit risk contains fi ve material categories (Level 2) in DB Group’s risk taxonomy:• Default / migration risk is the risk that a counterparty defaults on its payment obligations or experiences material credit quality deterioration
increasing the likelihood of a default.• Country risk is the risk that otherwise solvent and willing counterparties are unable to meet their obligations due to direct sovereign intervention or policies.• Transactional/settlement risk (exposure risk) is the risk that arises from any existing, contingent or potential future positive exposure• Mitigation risk is the risk of higher losses due to risk mitigation measures not performing as anticipated.• Concentration risk is the risk of an adverse development in a specifi c single counterparty, country, industry or product leading to a disproportionate
deterioration in the risk profi le of DB’s credit exposures to that counterparty, country, industry or product.Market riskMarket risk arises from the uncertainty concerning changes in market prices and rates (including interest rates, equity prices, foreign exchange rates and commodity prices), the correlations among them and their levels of volatility.Operational riskOperational Risk is the risk of loss resulting from inadequate or failed internal processes, people and systems or from external events, and includes legal risk. Operational Risk excludes business and reputational risk.Liquidity riskLiquidity risk is the risk arising from the potential inability to meet all payment obligations when they come due or only being able to meet these obligations at excessive costs.Other risksOther risks such as Reputational Risk, Business Risk including Strategic Risk are also considered at Local/Group Level.Risk Management ToolsThe Bank uses a comprehensive range of quantitative and qualitative methodologies for assessing and managing risks. As a matter of policy, the Group continually assesses the appropriateness and the reliability of its quantitative tools and metrics in light of the Group’s changing risk environment. Some of these tools may be common to a number of risk categories, while others are tailored to the particular features of specifi c risk categories.
4.1 Credit riska. Credit Risk Management Organisation and structure
The Bank has established a RMC by the BMB. The Risk Management Council is mandated to oversee credit risk, market risk and operational risk related matters. The committee comprise of Chief Operating Offi cer, Head- Credit Risk Management (CRM) Corporate & Investment Bank (CIB), Head- Market Risk Management (MRM), Head-CRM Wealth Management (WM), Head-CRM Private and Commercial Bank (PCB), , Head-Compliance, Chief Financial Offi cer (CFO), India Internal Capital Adequacy Assessment Process (ICAAP) coordinator, Treasurer, Head-Legal and Head-Non Financial Risk (NFR) .
b. CRM CIB(i) Credit Risk policies and procedures
All business requests that involve credit risk need to be presented to CRM for its approval. Loan policy is updated annually and is also approved by the Risk Management Council. CRM uses its global ratings model for all risks and every counterpart is internally rated. CRM CIB has a policy of annual reviews of all risk limits. This policy is strictly followed and any overdue reviews are regularly monitored and explained. The annual review is a comprehensive exercise which covers the Industry scenario, key business drivers, key risk factors, business and fi nancial risk (including forex risk), management quality and transparency and a peer analysis along with downside scenarios in projections.CRM CIB in India has signifi cant delegation of approval authority, to enable timely credit decisions, based on an understanding of local market conditions. In line with the global policy, CRM takes decisions in India on the 4 eyes principle.In the event the credit authority of the local CRM team is not equipped to take a decision on complex / structured products, large ticket transactions, etc, the local CRM team forwards its recommendation on the request to senior CRM offi cers in Asia Pacifi c (APAC) or globally, for the fi nal decision, depending on the defi ned delegated authority.Bank has established an ICRC to approve signifi cant credit risk and underwriting proposal in line with the regulatory requirements. ICRC has a Terms of Reference (ToR) approved by the BMB highlighting roles and responsibilities, membership, etc.CRM globally operates on the “Batch Strategy’ concept, where each Industry / sector is reviewed globally in detail for risk drivers, along with an analysis of DB’s exposures in that sector globally – exposure amounts, counterparty ratings, products, risk profi le, etc. This system enables DB to quantitatively focus on its global exposures in different Industries / sectors, as well as the credit ratings / facility ratings of the exposures within those sectors.The Bank globally subjects all risk types covered under its Economic Capital (EC) concept and liquidity risk to regular stress tests. The Bank’s stress tests consider macroeconomic, business related and quantitative aspects to derive implications for its risk profi le.Risk limits and exposures on lower rated counterparties are intensively monitored. There is a quarterly CRM exercise to discuss all watch-list names. Deutsche Bank in India follows all the exposure norms and provisioning requirements as laid down by the RBI in its master circulars.Within the CRM CIB portfolio, concentration risk monitoring and mitigation plays an important role. CRM has guidelines in terms of maximum exposures on counterparties at different rating levels, with different levels of market access and in different categories of country risk.The credit risk assessment of exposures that are off-balance sheet are subject to the same vigorous scrutiny and approval process, as is followed for the balance sheet exposures. There is no differentiation between balance sheet and off-balance sheet exposures in the Bank’s risk assessment and monitoring standards.CRM is globally organized and carries out risk identifi cation, assessments, management, monitoring and reporting of credit risks. The CRM department is independent from the business. Accordingly, the credit policies of DB Group are adopted and the Head of CRM is responsible for establishing local policies and procedures to ensure compliance with DB Group principles.All new credit risks incurred within the DB Group (including DB India) have to be approved by individuals with appropriate credit authority (suffi cient to cover the entire DB Group exposure according to a “one obligor” principle). All credit risk decisions relevant to DB India are subject to the approval of Deutsche Bank’s CRM.Credit Risk is managed for DB Group on the basis of a “one obligor principle”; new credit exposures as well as reviews of credit exposures require approval by the appropriate authority holder covering the entire DB Group exposure. All credit risk decisions relevant to DB India are subject to the approval of DB Group’s CRM.
The management of credit risk follows a clearly defi ned credit process. Key processes are:– deriving a credit rating for the counterparties– approving credit limits with the required Credit Authority– setting credit limits for a certain counterparty or portfolio– deciding on the requirement for credit risk mitigants and risk transfers– monitoring of the credit exposures on a counterparty as well as on a portfolio level. This includes stress testing.– managing higher risk counterparties via watchlist process and transfer to workout unit.– proactively managing concentration risks and identifying quality trends.Adequate documentation and storage for future reference are ensured along the complete credit process.
Management disclosures under Pillar 3 – Year ended March 31, 2020
ECO
NOM
IC &
PO
LITI
CAL
WEE
KLY

Deutsche BankIndia Annual Results 2019-2020Deutsche Bank AG, India Branches(Incorporated in Germany with limited liability)
Published on Saturday, JUNE 27, 2020 vol lV nos 26 & 27 EPW Economic & Political Weekly296
(ii) Credit risk on trading instrumentsCRM CIB has global systems in place to monitor the Mark to Market risk on all foreign currency and rates derivative transactions undertaken by the clients. DB uses the Potential Future Exposure at 95% confi dence levels as the basis to determine the limit requirements for such products.Internally, the Bank manages credit risk on all trading instruments by reference to three measures:o Current Credit Exposure (“CCE”), which is the current value of any contract, at current market rates, as shown in the Bank’s records. CCE
will be reported net of enforceable collateral, and may be aggregated to refl ect enforceable netting arrangementso Potential Future Exposure (“PFE”), which is an estimate of the Current Credit Exposure that trading instruments could potentially assume
in the futureo Stress Testing, which refl ects the short term sensitivity of the portfolio CCE to market parameters.To reduce derivatives-related credit risk, the Bank regularly seeks the execution of master agreements (such as the “International Swap and Derivatives Association” - ISDA contract) with clients. A master agreement allows the offsetting of the obligations arising under all of the derivatives contracts that the agreement covers upon the counterparty’s default, resulting in one single net claim against the counterparty (called “close-out netting”).The Bank also enters into credit support annexes (CSA) to master agreements in order to further reduce the derivatives related credit risk. These annexes generally provide risk mitigation through periodic, usually daily, margining of the covered exposure. The CSAs also provide for the right to terminate the related derivative transactions upon the counterparty’s failure to honour a margin call. As with netting, when the Bank believes the annex is enforceable, it refl ects this in the exposure measurement.Certain CSAs to master agreements provide for rating dependent triggers, where additional collateral must be pledged if a party’s rating is downgraded. We also enter into master agreements that provide for an additional termination event upon a party’s rating downgrade. These downgrading provisions in CSAs and master agreements usually apply to both parties but may also apply to us only. The Bank analyses and monitors it’s potential contingent payment obligations resulting from a rating downgrade in it’s stress testing approach for liquidity risk on an ongoing basis.For credit exposure measurement purposes, as the replacement values of the portfolios fl uctuate with movements in market rates and with changes in the transactions in the portfolios, the Bank also estimates the potential future replacement costs of the portfolios over their lifetimes. This is based on the Current Exposure method as per RBI master circular on Exposure norms.
(iii) Credit rating policyDB Group’s risk assessment procedures consider both the creditworthiness of the counterparty and the risks related to the specifi c type of credit facility or exposure. This risk assessment not only affects the structuring of the transaction and the outcome of the credit decision, but also infl uences the level of decision-making authority required to extend or materially change the credit and the monitoring procedures DB Group applies to the ongoing exposure.DB Group has its own in-house assessment methodologies, scorecards and rating scale for evaluating the creditworthiness of its counterparties. Its granular 21-grade rating scale, which is in compliance with the Internal Ratings Based approach in Basel III and is calibrated on a probability of default measure based upon a statistical analysis of historical defaults in its portfolio, enables the comparison of its internal ratings with common market practice and ensures comparability between different sub-portfolios of its institution. Several default ratings therein enable the incorporation of the potential recovery rate of defaulted exposure. DB Group generally rates all its credit exposures individually. When DB Group assigns its internal risk ratings, DB Group compares them with external risk ratings assigned to counterparties by the major international rating agencies, where possible.The credit ratings are the core element of the Bank’s risk management framework and determine the –o Level of authority required for approvalo The SEC classifi cation (performing / non performing) and FED classifi cation (Special Mention, Sub standard, Doubtful, Loss)The accuracy and consistency of ratings are ensured through Front End Management, Portfolio Reviews including independent Asset Quality Reviews and validation by Risk Analytics and Instruments.Each and every facility in the banking book is rated based on the internal rating model of DB. For each counterparty, the Credit Risk management assigns a Counterparty Probability of Default (‘CPD’) and for each facility, a Facility Probability of Default (‘FPD’) is assigned, along with the Loss Given Default (‘LGD’) and Country of Risk.The Bank’s ratings scale closely mirrors the scales used by key global rating agencies such as S & P and Moody’s.
(iv) Defi nition and classifi cation of past due and impairedLoans and Advances are classifi ed into performing and non-performing loans in accordance with the extant RBI guidelines.Past due advances understood to mean Non Performing Advances are identifi ed by periodic appraisals of the portfolio by the management and appropriate provisions are made which meets the prudential accounting norms prescribed by the RBI for asset classifi cation, income recognition and provisioning after considering subsequent recoveries.
c. CRM PCB - Credit risk policies and proceduresCRM PCB India manages the credit risk of Retail Banking portfolio in India. All lending product launched within PCB are approved by CRM PCB before the launch. Credit Risk policies are clearly documented through Product Program for each product.
The scope of India Credit Policy covers the credit process for the PCB unit in India and details the following.o Credit principleso Generic credit processo Credit authority guidelineso Loan Loss Allowance / Write off guidelinesThe precise nature of the credit assessment, decision and monitoring process depends primarily on the type of product, exposure and the existence and quality of collateral.
The credit decision on a loan request involves rule based risk assessment which takes into account the following:o Customer information given in the application form (general customer data / fi nancial information)o Information on the borrower’s behavior (external data/account movements, where available)o Specifi c information of the application itself (credit volume / collateral)When deciding on a loan request, all required information and documents are considered. The credit offi cer assesses the profi le of the applicant and ability to repay the loan based on various reports available, viz. verifi cation, bureau and policy results etc. as part of the loan fi le. The portfolio is reviewed at periodic intervals and analysis is made to understand the behaviour of the portfolio in terms of repayment, delinquency, transactions etc.
d. CRM WMCredit in WM is governed by the Business – aligned Risk Management (BRM) WM – Credit Policy and Process Guide. Other related policies governing the credit linked business in WM are the Principles for Managing Credit Risk–DB Group, the India Credit policy and local regulations.The above credit policy framework details the following:o Credit principleso Credit Risk Management process (including initial due diligence, credit reports, rating models used, annual rating review process, credit
approval process, credit review process)o Credit Rating and Credit Limit guidelines (including the relevant rating model to be applied, one-obligor principle)o Credit Authority guidelines (including delegation of credit authority, approvals under ‘4-eye’)o Credit Risk Mitigation and Monitoring of risk positions (including collateral monitoring and credit limit excess monitoring)o Management of distressed exposures (covering watch-list and workout accounts)o Risk Tools (including credit systems, stress testing)
Management disclosures under Pillar 3 – Year ended March 31, 2020
ECO
NOM
IC &
PO
LITI
CAL
WEE
KLY

Deutsche BankIndia Annual Results 2019-2020Deutsche Bank AG, India Branches(Incorporated in Germany with limited liability)
Economic & Political Weekly EPW Published on Saturday, JUNE 27, 2020 vol lV nos 26 & 27 297
e. Total Gross Credit exposures (In Rs. ‘000)
Category 31 March 2020 31 March 2019Bills purchased and discounted 68,098,425 73,043,286Cash credits, overdrafts and loans repayable on demand 232,937,416 198,164,760Term loans 215,059,341 218,737,552Inter Bank 29,397,232 48,516,818Others 601,831 691,249Total Fund-based Exposures 546,094,245 539,153,665
Guarantees given on behalf of customers 180,475,301 200,409,576Acceptances, endorsements and other obligations 20,404,174 47,833,994Derivative exposures 495,108,937 324,404,173Undrawn Commitment 25,850,883 49,231,563Total Non-fund based Exposures 721,839,295 621,879,306
Exposure for the purposes of tables in this section refl ect actual notional, except for derivative exposures which is based on the current exposure method prescribed by RBI vide its master circular on Exposure norms.
Note: Investment in Non-SLR instruments not included here, covered under market risk. The Bank renders its services within one geographical segment and has no offi ces outside India.
f. Industry Type distribution of exposures (period ended 31 March 2020) (In Rs.’000)
Sector ID
Sector Name Funded Non Funded Total Percentage of Total
1 Mining & Quarrying 250,587 818,738 1,069,325 0.08%2 Food Processing 6,705,242 668,761 7,374,003 0.58%3 Beverages 7,343,604 1,447,766 8,791,370 0.69%4 Textile 12,622,256 289,228 12,911,484 1.02%5 Leather & Leather Products 904,047 1,146 905,193 0.07%6 Wood and Wood products 1,231,037 102,196 1,333,233 0.11%7 Paper and paper Products 3,131,242 26,643 3,157,885 0.25%8 Petroleum, Coal Products and Nuclear Fuels 1,315,849 10,246,427 11,562,276 0.91%9 Chemical and chemical products 33,595,155 10,467,826 44,062,981 3.48%10 Rubber Plastic and their products 5,945,610 613,175 6,558,785 0.52%11 Glass & Glassware 901,220 311,116 1,212,336 0.10%12 Cement and Cement Products 302,438 0 302,438 0.02%13 Basic Metal and Metal Products 23,270,368 8,889,331 32,159,699 2.54%14 All Engineering 42,008,206 51,069,479 93,077,685 7.34%15 Vehicles, Vehicle Parts and Transport Equipments 20,560,626 12,459,649 33,020,275 2.60%16 Gems and Jewellery 7,018,107 45,000 7,063,107 0.56%17 Construction 1,222,954 302,759 1,525,713 0.12%18 Infrastructure 51,822,993 30,736,771 82,559,764 6.51%19 Other Industries 36,615,519 6,914,737 43,530,256 3.43%20 Residuary Other 289,327,185 586,428,547 875,755,732 69.07%
Total 546,094,245 721,839,295 1,267,933,541 100.00%
Industry Type distribution of exposures (year ended 31 March 2019) (In Rs.’000)
Sector ID
Sector Name Funded Non Funded Total Percentage of Total
1 Mining & Quarrying 82,962 1,039,350 1,122,312 0.10%2 Food Processing 4,830,889 5,790,801 10,621,690 0.91%3 Beverages 5,518,113 912,897 6,431,010 0.55%4 Textile 9,254,121 1,546,750 10,800,871 0.93%5 Leather & Leather Products 862,978 555,633 1,418,611 0.12%6 Wood and Wood products 1,114,683 25,796 1,140,479 0.10%7 Paper and paper Products 2,481,943 18,416 2,500,359 0.22%8 Petroleum, Coal Products and Nuclear Fuels 229,349 6,951,124 7,180,473 0.62%9 Chemical and chemical products 25,069,741 12,283,150 37,352,891 3.22%10 Rubber Plastic and their products 5,709,785 673,699 6,383,484 0.55%11 Glass & Glassware 771,112 285,348 1,056,460 0.09%12 Cement and Cement Products 996,376 0 996,376 0.09%13 Basic Metal and Metal Products 20,478,602 14,477,503 34,956,105 3.01%14 All Engineering 42,272,256 53,707,116 95,979,372 8.27%15 Vehicles, Vehicle Parts and Transport Equipments 19,678,513 15,365,006 35,043,519 3.02%16 Gems and Jewellery 12,259,671 45,000 12,304,671 1.06%17 Construction 1,013,795 561,651 1,575,446 0.14%18 Infrastructure 17,294,250 40,684,672 57,978,922 4.99%19 Other Industries 58,922,313 8,178,783 67,101,096 5.78%20 Residuary Other Advances 310,312,213 458,776,611 769,088,824 66.23%
Total 539,153,665 621,879,306 1,161,032,971 100.00%
Management disclosures under Pillar 3 – Year ended March 31, 2020
ECO
NOM
IC &
PO
LITI
CAL
WEE
KLY

Deutsche BankIndia Annual Results 2019-2020Deutsche Bank AG, India Branches(Incorporated in Germany with limited liability)
Published on Saturday, JUNE 27, 2020 vol lV nos 26 & 27 EPW Economic & Political Weekly298
g. Residual contractual maturity break down of Total Assets (In Rs. ‘000)
Maturity buckets 31 March 2020
Day - 1 –2-7 Days 328,588,569 8-14 Days 57,771,982 15-30 Days 74,920,539 31 Days to 2 months 26,825,465 Over 2 Months to 3 months 31,254,009 Over 3 Months to 6 months 30,953,024 Over 6 Months to 12 months 52,267,313 Over 1 Year to 3 years 161,692,225 Over 3 Years to 5 years 43,773,309 Over 5 years 404,393,984 Total 1,212,440,419
(In Rs. ‘000)
Maturity buckets 31 March 19
Day - 1 –2-7 Days 310,926,1648-14 Days 57,071,05115-30 Days 41,973,28431 Days to 2 months 13,883,795Over 2 Months to 3 months 29,714,621Over 3 Months to 6 months 59,909,371Over 6 Months to 12 months 28,656,670Over 1 Year to 3 years 182,542,792Over 3 Years to 5 years 35,663,018Over 5 years 302,545,273
Total 1,062,886,039
h. Amount of NPA (In Rs. ‘000)
NPA Classifi cation (31 March 2020) Gross NPAs Net NPAs
Substandard 5,900,018 4,104,018
Doubtful 0 0 – Doubtful 1 2,697,862 1,808,545 – Doubtful 2 2,661,270 770,592 – Doubtful 3 3,843,603 –Loss – –Total 15,102,753 6,683,155NPA Ratio 2.91% 1.31%
(In Rs. ‘000)
NPA Classifi cation (31March 2019) Gross NPAs Net NPAs
Substandard 6,551,575 5,509,481
Doubtful 0 0
– Doubtful 1 1,623,669 1,035,873
– Doubtful 2 5,468,039 401,153
– Doubtful 3 259,601 –
Loss 341,489 –
Total 14,244,373 6,946,507
NPA Ratio 2.91% 1.44%
Management disclosures under Pillar 3 – Year ended March 31, 2020
ECO
NOM
IC &
PO
LITI
CAL
WEE
KLY
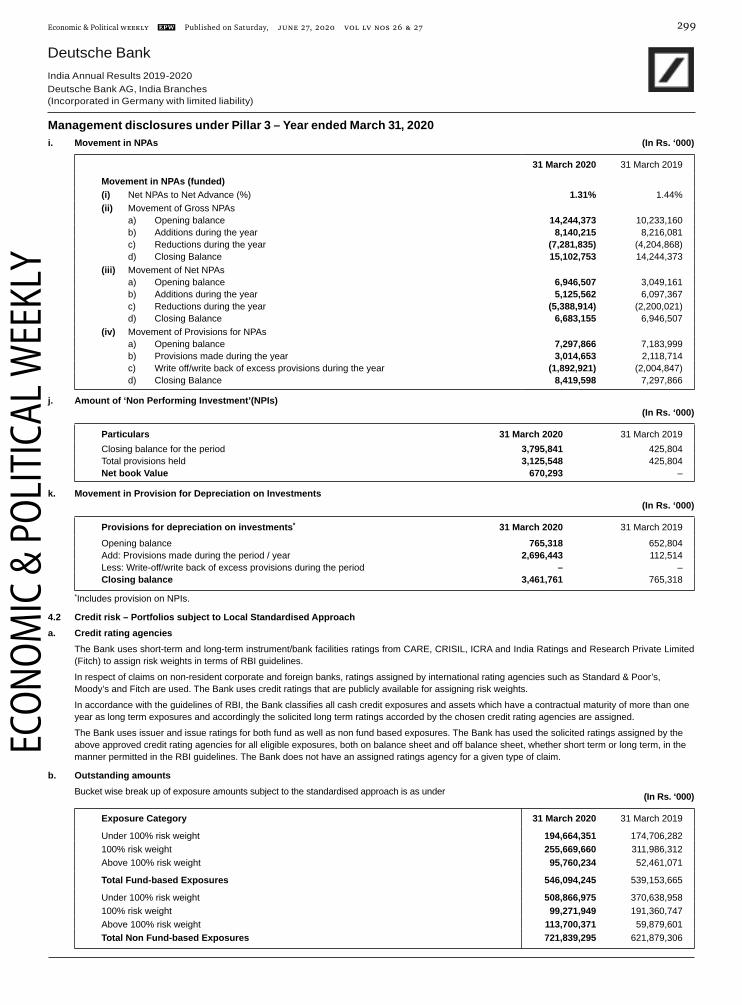
Deutsche BankIndia Annual Results 2019-2020Deutsche Bank AG, India Branches(Incorporated in Germany with limited liability)
Economic & Political Weekly EPW Published on Saturday, JUNE 27, 2020 vol lV nos 26 & 27 299
i. Movement in NPAs (In Rs. ‘000)
31 March 2020 31 March 2019
Movement in NPAs (funded)(i) Net NPAs to Net Advance (%) 1.31% 1.44%(ii) Movement of Gross NPAs
a) Opening balance 14,244,373 10,233,160 b) Additions during the year 8,140,215 8,216,081 c) Reductions during the year (7,281,835) (4,204,868)d) Closing Balance 15,102,753 14,244,373
(iii) Movement of Net NPAsa) Opening balance 6,946,507 3,049,161 b) Additions during the year 5,125,562 6,097,367 c) Reductions during the year (5,388,914) (2,200,021)d) Closing Balance 6,683,155 6,946,507
(iv) Movement of Provisions for NPAsa) Opening balance 7,297,866 7,183,999 b) Provisions made during the year 3,014,653 2,118,714 c) Write off/write back of excess provisions during the year (1,892,921) (2,004,847)d) Closing Balance 8,419,598 7,297,866
j. Amount of ‘Non Performing Investment’(NPIs) (In Rs. ‘000)
Particulars 31 March 2020 31 March 2019Closing balance for the period 3,795,841 425,804Total provisions held 3,125,548 425,804Net book Value 670,293 –
k. Movement in Provision for Depreciation on Investments(In Rs. ‘000)
Provisions for depreciation on investments* 31 March 2020 31 March 2019
Opening balance 765,318 652,804Add: Provisions made during the period / year 2,696,443 112,514Less: Write-off/write back of excess provisions during the period – –Closing balance 3,461,761 765,318
*Includes provision on NPIs.
4.2 Credit risk – Portfolios subject to Local Standardised Approacha. Credit rating agencies
The Bank uses short-term and long-term instrument/bank facilities ratings from CARE, CRISIL, ICRA and India Ratings and Research Private Limited (Fitch) to assign risk weights in terms of RBI guidelines.
In respect of claims on non-resident corporate and foreign banks, ratings assigned by international rating agencies such as Standard & Poor’s, Moody’s and Fitch are used. The Bank uses credit ratings that are publicly available for assigning risk weights.
In accordance with the guidelines of RBI, the Bank classifi es all cash credit exposures and assets which have a contractual maturity of more than one year as long term exposures and accordingly the solicited long term ratings accorded by the chosen credit rating agencies are assigned.
The Bank uses issuer and issue ratings for both fund as well as non fund based exposures. The Bank has used the solicited ratings assigned by the above approved credit rating agencies for all eligible exposures, both on balance sheet and off balance sheet, whether short term or long term, in the manner permitted in the RBI guidelines. The Bank does not have an assigned ratings agency for a given type of claim.
b. Outstanding amounts Bucket wise break up of exposure amounts subject to the standardised approach is as under (In Rs. ‘000)
Exposure Category 31 March 2020 31 March 2019
Under 100% risk weight 194,664,351 174,706,282100% risk weight 255,669,660 311,986,312Above 100% risk weight 95,760,234 52,461,071
Total Fund-based Exposures 546,094,245 539,153,665
Under 100% risk weight 508,866,975 370,638,958100% risk weight 99,271,949 191,360,747Above 100% risk weight 113,700,371 59,879,601Total Non Fund-based Exposures 721,839,295 621,879,306
Management disclosures under Pillar 3 – Year ended March 31, 2020
ECO
NOM
IC &
PO
LITI
CAL
WEE
KLY

Deutsche BankIndia Annual Results 2019-2020Deutsche Bank AG, India Branches(Incorporated in Germany with limited liability)
Published on Saturday, JUNE 27, 2020 vol lV nos 26 & 27 EPW Economic & Political Weekly300
4.3 Credit risk mitigation policy Credit risk is generally mitigated at DB Group level. The Bank employs the different techniques available for the management of credit risk in line with the strategy established at DB Group level. The Bank takes into account the local laws / local market practice for the use of credit risk mitigants. The Bank may also apply guarantees or other instruments to transfer credit risk to DB AG or other legal entities within DB Group.
Mitigation of credit risk on counterparty levelIn addition to determining counterparty credit quality and the risk appetite, the Bank actively uses various credit risk mitigation techniques to optimize the Bank`s credit exposure and reduce potential credit losses. While those techniques might ensure or can be an alternative source of repayment, they do not substitute for high quality underwriting standards and thorough due diligence. Key credit risk mitigation techniques comprise:• Comprehensive and enforceable credit documentation with adequate terms and conditions (including covenants where deemed adequate)• Collateral in its various forms. Key principles for collateral management include assigning realistic collateral valuations, risk and regulatory capital
reduction effectiveness and cost effi ciency.• Risk transfers shifting the probability of default risk of an obligor to a third party including hedging executed by the Credit Portfolio Strategies Group
(CPSG). Other de-risking tools such as securitizations etc. may also be employed.• Netting and collateral arrangements which reduce the credit exposure from derivatives as well as repo- and repo-style transactions.
CollateralThe Bank regularly agrees on collateral to be received from or to be provided to customers in contracts that are subject to credit risk. Collateral is security in the form of an asset or third-party obligation that serves to mitigate the inherent risk of credit loss in an exposure, by either substituting the borrower default risk or improving recoveries in the event of a default. While collateral can be an alternative source of repayment, it generally does not replace the necessity of high quality underwriting standards and a thorough assessment of the debt service ability of the counterparty.The Bank segregates collateral received into the following two types:• Financial and other collateral, which enables us to recover all or part of the outstanding exposure by liquidating the collateral asset provided, in
cases where the borrower is unable or unwilling to fulfi l its primary obligations. Cash collateral, securities (equity, bonds), collateral assignments of other claims or inventory, equipment (i.e., plant, machinery and aircraft) and real estate typically fall into this category.
• Guarantee collateral, which complements the borrower’s ability to fulfi l its obligation under the legal contract and as such is provided by third parties. Letters of credit, insurance contracts, export credit insurance, guarantees, credit derivatives and risk participations typically fall into this category.
The Bank’s processes seek to ensure that the collateral we accept for risk mitigation purposes is of high quality. This includes seeking to have in place legally effective and enforceable documentation for realizable and measureable collateral assets which are evaluated regularly by dedicated teams. The assessment of the suitability of collateral for a specifi c transaction is part of the credit decision and must be undertaken in a conservative way, including collateral haircuts that are applied. We have collateral type specifi c haircuts in place which are regularly reviewed and approved. In this regard, we strive to avoid “wrong-way” risk characteristics where the borrower’s counterparty risk is positively correlated with the risk of deterioration in the collateral value. For guarantee collateral, the process for the analysis of the guarantor’s creditworthiness is aligned to the credit assessment process for counterparties.
Netting and collateral arrangements for derivatives and securities fi nancing transactions (SFT)Netting is applicable to both exchange traded derivatives and over the counter (OTC) derivatives. Netting is also applied to SFT as far as documentation, structure and nature of the risk mitigation allow netting with the underlying Credit Risk.All exchange traded derivatives are cleared through central counterparties (CCP), which interpose themselves between the trading entities by becoming the counterparty to each of the entities. The rules and regulations of CCPs usually provide for the bilateral set off of all amounts payable on the same day and in the same currency (“payment netting”) and thereby reducing the settlement risk. Depending on the business model applied by the CCP, this payment netting applies either to all of Bank’s derivatives cleared by the CCP or at least to those that form part of the same class of derivatives. Many CCP rules and regulations also provide for the termination, close-out and netting of all cleared transactions upon the CCP’s default (“close-out netting”), which reduced the bank’s Credit Risk. In it’s risk measurement and risk assessment processes the Bank applies close-out netting only to the extent that the Bank has satisfi ed itself of the legal validity and enforceability of the relevant CCP’s close-out netting provisions.In order to reduce the Credit Risk resulting from OTC derivative transactions, where CCP clearing is not available, the Bank regularly seeks the execution of standard master agreements (such as master agreements for derivatives published by the International Swaps and Derivatives Association, Inc. (ISDA) or the German Master Agreement for Financial Derivative Transactions) with it’s counterparts. A master agreement allows for the close-out netting of rights and obligations arising under derivative transactions that have been entered into under such a master agreement upon the counterparty’s default, resulting in a single net claim owed by or to the counterparty. For parts of the derivatives business (i.e., foreign exchange transactions) the Bank also enters into master agreements under which payment netting applies in respect to transactions covered by such master agreements, reducing the settlement risk. In it’s risk measurement and risk assessment processes the Bank applies close-out netting only to the extent it has satisfi ed itself of the legal validity and enforceability of the master agreement in all relevant jurisdictions.Also, the Bank enters into CSA to master agreements in order to further reduce it’s derivatives related Credit Risk. These annexes generally provide risk mitigation through periodic, usually daily margining of the covered exposure. The CSAs also provide for the right to terminate the related derivative transactions upon the counterparty’s failure to honour a margin call. As with netting, when the Bank believes the annex is enforceable, It gets refl ected in it’s exposure measurement.Certain CSAs to master agreements provide for rating dependent triggers, where additional collateral must be pledged if a party’s rating is downgraded. The Bank also enters into master agreements that provide for an additional termination event upon a party’s rating downgrade. These downgrading provisions in CSAs and master agreements usually apply to both parties but may also apply to us only. The Bank analyses and monitors the potential contingent payment obligations resulting from a rating downgrade in it’s stress testing approach for liquidity risk on an ongoing basis.
Concentrations within credit risk (CR) mitigationConcentrations within Credit Risk mitigations taken may occur if a number of guarantors and credit derivative providers with similar economic characteristics are engaged in comparable activities with changes in economic or industry conditions affecting their ability to meet contractual obligations. The Bank uses a range of quantitative tools and metrics to monitor it’s Credit Risk mitigating activities. These also include monitoring of potential concentrations within collateral types supported by dedicated stress tests.
a. Collateral valuation and managementAs stipulated by the RBI guidelines, the Bank uses the Comprehensive Approach for collateral valuation. Under this approach, the Bank reduces its credit exposure to counterparty when calculating its capital requirements to the extent of risk mitigation provided by the eligible fi nancial collateral.
Management disclosures under Pillar 3 – Year ended March 31, 2020
ECO
NOM
IC &
PO
LITI
CAL
WEE
KLY

Deutsche BankIndia Annual Results 2019-2020Deutsche Bank AG, India Branches(Incorporated in Germany with limited liability)
Economic & Political Weekly EPW Published on Saturday, JUNE 27, 2020 vol lV nos 26 & 27 301
b. Types of collaterals taken by the Bank and main types of guarantor counterparties and Credit risk concentration within mitigationCollateral Risk Management is undertaken through the mechanism of the Facility Probability of Default (FPD) assignment.If there is no liquid collateral and no guarantor mitigating the credit risk, then the FPD will be the same as the Counterparty Probability of Default (CPD).If the facility risk can be shifted to the guarantor, the guarantor CPD becomes the FPD. In cases of received guarantees from un-correlated third parties, covering a Separate primary DB exposure, where for the Bank to incur a loss there needs to be a default by both the primary obligor as well as the guarantor, the Joint Default Probability (‘JDP’) applies. The Bank has in place a matrix indicating this JDP for the entire scale of primary obligor and guarantor CPDs.The Bank accepts security in the form of charge on receivables / inventories for working capital facilities, charge on fi xed assets in certain cases, besides guarantees for various obligations by the primary obligor and property collateral for mortgage loans to retail banking clients. The guarantees could be received from the local holding company of the obligor, or a stronger company within the same group or from the MNC parent of the local subsidiary. In certain cases, facilities to obligors may be supported by partial / full insurance protection purchased. Hence, since there are varied sources of credit protection acquired through different guarantors, there is no concentration of guarantor risk.The Bank records the Joint Obligor Risk Limit on the various guarantors, which ensures that the amounts of guarantees received from various sources are monitored for risk management purposes, e.g. the amount of insurance protection acquired from different insurance companies. The facility ratings for Joint Obligor Risk Limits are determined in accordance with the matrix in the Credit Ratings Policy of the Bank. This matrix captures the counterparty Probability of Default of the obligor as well as that of the guarantor, in determining the JPD.
c. Exposure covered by eligible fi nancial collateral: (In Rs. ‘000)
Exposures covered by fi nancial collateral 31 March 2020 31 March 2019
Exposures before Credit Risk Mitigation Technique 119,977,811 131,133,019Exposures after Credit Risk Mitigation Technique (after application of haircut on collateral) 6,674,558 11,734,606
d. Securitisation ExposurePrimary recourse for securitization exposures lies with the underlying assets. The related risk is mitigated by credit enhancement typically in the form of overcollateralization, subordination, excess interest, cash collateral in form of fi rst loss and second loss credit enhancement. The initial due diligence usually includes any or all of the following, depending on the specifi cs of the transaction: (a) the review of the relevant documents including term sheets, servicer reports or other historical performance data, third-party assessment reports such as rating agency analysis (if externally rated), etc., (b) modeling of base and downside scenarios through asset-class specifi c cash-fl ow models, (c) servicer reviews to assess the robustness of the servicer’s processes and fi nancial strength. The result of this due diligence is summarized in a credit and rating review which requires approval by an appropriate level of credit authority, depending on the size of exposure and internal rating assigned. Compliance with the regulatory requirements for risk retention, due diligence and monitoring according to the applicable regulatory requirements is part of our credit review process and the relevant data is gathered for reporting purposes. Ongoing regular performance reviews include checks of the periodic servicer reports as well as the overall performance trend in the context of economic, geographic, sector and servicer developments. For lending-related commitments an internal rating review is required at least annually. Signifi cant negative or positive changes in asset performance can trigger an earlier review date. Full credit reviews are also required annually, or, for highly rated exposures, every other year. Furthermore, there is a separate, usually quarterly, watch list process for exposures identifi ed to be at a higher risk of loss, which requires a separate assessment of asset and servicer performance. It includes a review of the exposure strategy and identifi es next steps to be taken to mitigate loss potential. Evaluation of structural integrity is another important component of risk management for securitization, focusing on the structural protection of a securitization as defi ned in the legal documentation (i.e., perfection of security interest, segregation of payment fl ows, and rights to audit). These securitization positions are managed by a dedicated team that uses a combination of market standard systems and to monitor performance and manage market and credit risks. Market Risk Management aims to accurately measure all types of market risks by a comprehensive set of risk metrics refl ecting economic and regulatory requirements.The Bank invests in Pass Through Certifi cates (PTCs). We have exposure to third-party securitizations which are reported as investments.The investments of the Bank in PTCs have been marked to market on the basis of the Base Yield Curve and the applicable spreads as per the spread matrix relative to the Weighted Average Maturity of the paper as notifi ed by Fixed Income Money Market and Derivative Association of India (FIMMDA).The Bank has made investments in Pass Through Certifi cates (PTCs) of Rs. 8,619,215 thousand as at 31 March 2020. These attract a risk weight of 20% since they are AAA rated instruments.
4.4 Market risk in trading booka. Market risk management framework
The Bank uses a combination of risk sensitivities, Value-at-Risk and stress testing metrics to manage market risks and establish limits. Value-at-Risk is a common metric used in the management of trading market risks.The MB and Group Risk Committee, supported by Group Market Risk Management, which is part of the independent risk management function, set a Group-wide Value-at-Risk limit for the market risks in the trading book. Group Market Risk Management sub-allocates this overall limit to the Group Divisions. Below that, limits are allocated to specifi c business lines and trading portfolio groups and geographical regions. In addition to the Bank’s main market risk Value-at-Risk limits, also stress testing and sensitivity limits are also operated.The Bank’s Value-at-Risk for the trading businesses is based on internal model. In October 1998, the German Banking Supervisory Authority (now the BaFin) approved the internal Value-at-Risk model for calculating market risk capital for the Group for both general and specifi c market risks. Since then the model has been periodically refi ned and approval has been maintained.
b. Types of market riskSubstantially all of the Bank’s businesses are subject to the risk that market prices and rates will move and result in profi ts or losses. The Bank distinguishes among four types of market risk:o Interest rate risk including credit spreado Equity price risk (where applicable)o Foreign exchange risko Commodity price risk (where applicable)The interest rate and equity price risks consist of two components each. The general risk describes value changes due to general market movements, while the specifi c risk has issuer-related causes.
c. Risk Management ToolsThe following are the most important quantitative tools and metrics currently used to measure, manage and report market risk:o Value-at-Risk. The Bank uses the Value-at-Risk approach to derive quantitative measures for trading book market risks under normal market
conditions. The Value-at-Risk fi gures play a role in both internal and external (regulatory) reporting. For a given portfolio, Value-at-Risk measures the potential future loss (in terms of market value) that, under normal market conditions, will not be exceeded with a defi ned confi dence level in a defi ned period. The Value-at-Risk for a total portfolio represents a measure of diversifi ed market risk (aggregated using pre-determined correlations) in that portfolio.
Management disclosures under Pillar 3 – Year ended March 31, 2020
ECO
NOM
IC &
PO
LITI
CAL
WEE
KLY
Deutsche BankIndia Annual Results 2019-2020Deutsche Bank AG, India Branches(Incorporated in Germany with limited liability)
Published on Saturday, JUNE 27, 2020 vol lV nos 26 & 27 EPW Economic & Political Weekly302
o Stress Testing. While Value-at-Risk, calculated on a daily basis, supplies forecasts for potential large losses under normal market conditions, it is not adequate to measure the tail risks of the portfolios. The Bank therefore also performs regular stress tests in which it values the trading portfolios under severe market scenarios not covered by the confi dence interval of the Value-at-Risk model.
d. Value-at-Risk AnalysisThe Value-at-Risk approach derives a quantitative measure for the trading book market risks under normal market conditions, estimating the potential future loss (in terms of market value) that will not be exceeded in a defi ned period of time and with a defi ned confi dence level. The Value-at-Risk measure enables to apply a constant and uniform measure across all of the trading businesses and products. It also facilitates comparisons of market risk estimates both over time and against the daily trading results.The Bank calculates Value-at-Risk using a 99% confi dence level and a holding period of one day.The Bank’s Value-at-Risk model is designed to take into account the following risk factors- interest rates, equity prices, foreign exchange rates and commodity prices, as well as their implied volatilities. The model incorporates both linear and, especially for derivatives, nonlinear effects of the risk factors on the portfolio value. The statistical parameters required for the Value-at-Risk calculation are based on a 261 trading day history (corresponding to at least one calendar year of trading days) with equal weighting being given to each observation. The Bank calculates Value-at-Risk using the Monte Carlo simulation technique and assuming that changes in risk factors follow a normal or logarithmic normal distribution.To determine the aggregated Value-at-Risk, the Bank uses historically observed correlations between different general market risk classes. However, when aggregating general and specifi c market risks, it is assumed that there is zero correlation between them.The Value-at-Risk analysis should also be viewed in the context of the limitations of the methodology the Bank uses and are therefore not maximum amounts that can be lost on the market risk positions. The limitations of the Value-at-Risk methodology include the following:o The use of historical data as a proxy for estimating future events may not capture all potential events, particularly those that are extreme in nature.o The assumption that changes in risk factors follow a normal or logarithmic normal distribution. This may not be the case in reality and may lead to
an underestimation of the probability of extreme market movements.o The correlation assumptions used may not hold true, particularly during market events that are extreme in nature.o The use of a holding period of one day assumes that all positions can be liquidated or hedged in that period of time. This assumption does not
fully capture the market risk arising during periods of illiquidity, when liquidation or hedging in that period of time may not be possible.o The use of a 99 % confi dence level does not take account of, nor makes any statement about, any losses that might occur beyond this level of
confi dence.o The Bank calculates Value-at-Risk at the close of business on each trading day. The Bank does not subject intraday exposures to intraday Value-
at-Risk calculations.o Value-at-Risk does not capture all of the complex effects of the risk factors on the value of positions and portfolios and could, therefore,
underestimate potential losses.
The Group acknowledges the limitations in the Value-at-Risk methodology by supplementing the Value-at-Risk limits with other position and sensitivity limit structures, as well as with stress testing, both on individual portfolios and on a consolidated basis.
The calculated Value-at-Risk numbers for India are used for internal control purposes only, the calculation of regulatory capital being based on the Standardised Approach specifi ed by the RBI. At the Group level, however, Value-at-Risk numbers are used for both internal control and Regulatory Capital calculation for market risk.
e. Back-TestingThe Bank uses back-testing in the trading units to verify the predictive power of the Value-at-Risk calculations. In back-testing, the hypothetical daily profi ts and losses are compared under the buy-and-hold assumption with the estimates from the Value-at-Risk model. The Bank analyzes performance fl uctuations and assesses the predictive power of the Value-at-Risk model, which in turn allows improvement of the risk estimation process.
f. HedgingThe Bank manages its risk from derivatives activity on a portfolio basis. Specifi c hedges undertaken, if any are ring fenced from the transactions undertaken for trading/market making purposes and held in separate designated portfolio for easy identifi cation and control.
g. Capital requirements for market risk (In Rs. ‘000)
Particulars 31 March 2020 31 March 2019
Capital requirement for market risk# – Interest rate risk 12,381,735 12,756,023 – Foreign exchange risk (including gold) 3,374,859 3,374,859 – Equity risk 206,562 202,310
Total 15,963,156 16,333,192
# Capital requirement is arrived at after multiplying the risk weighted assets by 12.875%
4.5 Operational riska. Defi nition of Operational Risk
Operational Risk is the risk of loss resulting from inadequate or failed internal processes, people and systems or from external events, and includes legal risk. Operational Risk (OR) excludes Business and Reputational Risk.
b. Operational Risk Management Framework:The Bank has established the Operational Risk Management Framework (ORMF) to identify and manage its operational risks. Building on the ORMF, Risk Type Controllers (RTCs) establish risk type specifi c frameworks for the OR type they control. The ORMF is designed to support three key objectives:ᅳ Proactive identifi cation and mitigation of operational risks where they originateᅳ Acceptance and understanding of risk ownership by the 1st LoD and strong challenge, engagement and facilitation by the 2nd LoD control
functions
Management disclosures under Pillar 3 – Year ended March 31, 2020
ECO
NOM
IC &
PO
LITI
CAL
WEE
KLY

Deutsche BankIndia Annual Results 2019-2020Deutsche Bank AG, India Branches(Incorporated in Germany with limited liability)
Economic & Political Weekly EPW Published on Saturday, JUNE 27, 2020 vol lV nos 26 & 27 303
ᅳ Standardisation and aggregation to allow reporting of the OR profi le on bank / unit / risk type levels and the quantifi cation of OR (OR capital calculation).
It comprises of several interconnected components, following the cycle of risk identifi cation, assessment, mitigation, and monitoring.
Organisational and Governance structure for India:The roles and responsibilities of the NFRM function with respect to Country Coverage are defi ned as part of the Operational Risk Country Coverage Key Operating Document (KOD).
o The Country Head of NFRM is responsible for overseeing the adequate implementation of the local NFRM governance process in India.o The Country Head of NFRM is a permanent member of the Operating Committee (OpCo) and RMC of DB AG India the Bank and updates the
Committee/Councils about the Operational Risk profi le of the country through the Country Flash Card (CFC) that includes, but is not limited to:– The aggregated operational OR loss reporting and the outline of material events– Specifi c insights on divisional relevant risks– Operational Risk capital developments– Overview of the management of issues and fi ndings– Relevant Key Risk Indicators
c. Operational Risk identifi cation:The Bank identifi es, captures and analyses its materialized and emerging operational risks that originate in its own organizations (internal events), in order to enable proactive risk management decisions as well as create transparency on its OR profi le.
The Bank’s OR Profi le is a refl ection of OR events that have already occurred, both internally and externally, and identifi ed gaps in – and defi ciencies of – the control environment. It is also shaped by emerging risks which have the potential to materialize.
The Bank uses an industry-wide OR event defi nition which comprises both, events with an impact on the Bank’s P&L (e.g. losses), and those with no P&L impact (e.g. near misses). For DB AG India, the OR events are captured according to defi ned thresholds as mentioned below:– Private and Commercial Clients Business and Operations: All losses (i.e. zero threshold)– Wealth Management Business & Operations: €1,000– CIB Business & Operations: €10,000– Global Markets Business: €10,000– Global Markets Operations: €2,500
For emerging risks that have not yet materialized, the Bank reviews a selection of external events and external / internal scenarios. All material identifi ed emerging risks are refl ected in the set of internal and external scenarios.
To facilitate more detailed analysis of material events, additional data is captured. Lessons Learnt and Read Across processes identify the root causes of incidents above a defi ned threshold and document mitigation decisions.
d. Operational Risk assessment:The Bank performs OR assessments, including standardised assessments of its OR, the adequacy of the control environment and the resulting residual risks. These assessments are informed, challenged and utilised by its independent risk control functions, to gain a holistic view across operational risk types.
The Bank’s central risk assessment process is the Risk Control Assessment (RCA). The RCA allows to capture its inherent risks, assesses its control environment and, ultimately, determine the residual risks. It allows the Bank’s risk control functions to obtain insight into the risk assessment across units and OR types, to facilitate the oversight and an independent challenge of the risk assessments.
The Control Assessment Framework ensures that the Bank’s key controls are captured in a Control Inventory and provides support for the ORMF by highlighting key control themes, reassurance to management on the fi rm’s control environment and enhances the execution of the RCA by supporting the generation of risk profi les for internal risk management and Regulatory Capital calculation purposes.
To manage the Operational Risks associated with material change initiatives incl. Core Change Initiatives (CCIs), the Group performs Transformation Risk Assessments (TRA).
Cross-risk processes capture and aggregate the assessments of various risk control functions, e.g. of new transactions, new products or vendors.
Further risk assessments are performed by risk control functions, e.g. Legal, Compliance and AFC.
e. Operational Risk mitigation:The Bank mitigates the assessed risks to a level where the residual risk fi ts into the defi ned risk appetite. Issues are identifi ed, mitigating actions clearly tracked and are suffi cient to reduce the residual risk to within risk appetite. Where within appetite, further mitigation can be temporarily delayed following a defi ned risk acceptance process including the review and challenge by the risk control functions who have a veto authority.
Identifi ed and assessed operational risks can be further reduced by performing mitigation activities, e.g. by improving the control environment, by transferring risks (i.e. insurance), or by ultimately reducing / ceasing the business activity. The transferring of risks using insurance activities is managed and governed by Corporate Insurance Deukona (CID).
Mitigation activities which are not already monitored by another resolution monitoring process, such as fi ndings management are captured, recorded and governed within the issue management process. These self-identifi ed issues address control gaps and defi ciencies which have not already been addressed elsewhere (e.g. audit and regulatory fi ndings or actions) and could result in an OR event.
The Group proactively identifi es and addresses control defi ciencies and gaps through the issue management process. For critical issues (and signifi cant optionally), the risk control functions mandatorily review and challenge the mitigation plan and may exercise a veto where the planned mitigation is insuffi cient to bring the residual risk back within risk appetite.
If the residual risk (including after the completion of mitigation activities) is within risk appetite – qualitatively and quantitatively - a related issue can be risk accepted for a certain time frame and not mitigated further during this time. If residual risks remain Signifi cant but is considered applicable for
Management disclosures under Pillar 3 – Year ended March 31, 2020
ECO
NOM
IC &
PO
LITI
CAL
WEE
KLY

Deutsche BankIndia Annual Results 2019-2020Deutsche Bank AG, India Branches(Incorporated in Germany with limited liability)
Published on Saturday, JUNE 27, 2020 vol lV nos 26 & 27 EPW Economic & Political Weekly304
OR acceptance, the risk acceptance process as defi ned in the ORMF is followed. Findings with “Critical” residual risk ratings are not eligible for Risk Acceptance. Risk acceptances will undergo independent challenge and risk control functions have a veto authority.
f. Operational Risk monitoringTo enable a pro-active management of OR, the Bank constantly monitors its business and control environment, and the risk level for each OR type against the defi ned OR appetite. Early warning signals ensure that trends in the development of the risk profi les are identifi ed before they materialize, including the major known but also emerging risks.
In line with DB Group NFR Appetite Framework, the Bank identifi es risk sensitive Key Risk Indicators (KRIs) to constantly monitor risk levels and the utilisation of risk appetite. These metrics act as a warning signal, indicating a potential shift in the business environment. When breaches of appetite occur, the Bank manages the breaches in-line with the Group Risk Appetite Policy and Non-Financial Risk Appetite minimum standards. This ensures that risks are identifi ed and addressed early, before they lead to losses from OR.
The Bank’s report regularly (risk reporting) and ad-hoc (escalations) on its OR profi le, top risks, utilisation of risk appetite and events, following DB global reporting standards.
For more detailed and comprehensive description of ORM framework please refer to ‘Operational Risk Management Policy – Deutsche Bank Group’ and respective related references.
4.6 Liquidity RiskTreasury is mandated to manage the overall liquidity and funding position of the Group, with Liquidity Risk Management (LRM) acting as an independent control function, responsible for the oversight of liquidity and funding risk management strategy and the validation of Liquidity Risk models which are developed by Treasury, to measure and manage the Group’s liquidity risk profi le.
Treasury manages liquidity and funding, in accordance with the Group MB approved risk across a range of relevant metrics, and implements a number of tools to monitor these and ensure compliance. In addition, Treasury works closely with LRM and the business, to analyze and understand the underlying liquidity characteristics of the business portfolios. They are engaged in regular and frequent dialogue to understand changes in the Group’s position arising from business activities and market circumstances. At the global level, dedicated business targets are allocated, to ensure the Group meets its overall liquidity and funding risk appetite.
At the country level, local Treasury is responsible for the overall liquidity management of the Bank. This includes proposing changes to liquidity risk limits and thresholds where necessary – in line with the risk appetite applied by LRM – for approval by the APAC Liquidity Risk Council (“LRC”) and notifying the local Asset ALCO. Day-to-day funding and cash management of the branch are undertaken by Treasury Pool (“Pool”) acting within the parameters set by ALCO.
Ongoing liquidity management is discussed as a regular item at the local ALCO meeting, which takes place as stated in the ALCO Terms of Reference (“ToR”). At each ALCO meeting, the liquidity position, the limit utilization, changes in exposure and liquidity policy compliance are presented to the committee. Other topics of discussion include changes to the asset/liability profi le if warranted by stress testing results, review and estimation of additional funding capabilities and other possible sources of liquidity.
5. Interest rate risk in the banking bookThe vast majority of the interest rate risk and foreign exchange risk arising from the non-trading assets and liability positions in the Banking book are transferred through internal hedges to the trading desks in Global Markets (w.e.f. May 2016 the position has been transferred is to Treasury) and is managed on the basis of Value-at-Risk as refl ected in the trading Value-at-Risk numbers. The treatment of interest rate risk in the Group’s trading portfolios and the application of the Value-at-Risk model is discussed above. The Bank considers this risk to be a part of the overall market risk framework.
6. Counterparty Credit Risk Credit Limits and Collaterals
Counterparty credit risk (CCR) is the risk that a Bank’s counterparty defaults in a FX, interest rate, commodity or credit derivative contract prior to or at the maturity date of the contract and that the Bank at the time has a claim on the counterparty.
The credit risk arising from all fi nancial derivatives is managed as part of the overall credit limits to both fi nancial institutions and other clients and customers. Exposure values for regulatory capital purposes on over the counter traded products are calculated according to the Current Exposure Method as defi ned by RBI. This is calculated as the sum of the current replacement cost and the PFE. The current replacement cost is the amount owed by the counterparty to the Bank for various fi nancial derivative transactions. The PFE is an add-on based on a percentage of the notional principal of each transaction. These percentages are prescribed by the RBI in the guidelines and vary according to the underlying asset class and tenor of each trade.
The Bank seeks to negotiate Credit Support Annexes (CSA) to International Swaps and Derivatives Association master agreements with counterparties on a case-by-case basis, where collateral is deemed a necessary or desirable mitigant to the exposure. The credit terms of the CSA are specifi c to each legal document and determined by the credit risk approval unit responsible for the counterparty. The nature of the collateral will be specifi ed in the legal document and will typically be cash or highly liquid securities. A daily operational process takes place to calculate the MTM on all trades captured under the CSA. Additional collateral will be called from the counterparty if total uncollateralised MTM exposure exceeds the threshold and minimum transfer amount specifi ed in the CSA. Additional collateral may be required from the counterparty to provide an extra buffer to the daily variation margin process.
The Bank further reduces its credit exposures to counterparties by entering into contractual netting agreements which result in a single amount owed by or to the counterparty through netting the sum of the positive (amounts owed by the counterparty) and negative (amounts owed by the Bank) MTM values of these transactions.
In India, the Bank follows the Standardised Approach (SA) for credit risk and hence no credit reserve is set aside. However, provisioning for the exposures on derivative contracts is made as per extant RBI guidelines.
Wrong Way RiskWrong way risk occurs when an exposure increase is coupled with a decrease in the credit quality of the obligor. The Group/Bank employs various policies and procedures to ensure that risk exposures are monitored. For example, as the MTM on a derivative contract increases in favour of the Bank, the counterparty may increasingly be unable to meet its payment, margin call or collateral posting requirements.
Management disclosures under Pillar 3 – Year ended March 31, 2020
ECO
NOM
IC &
PO
LITI
CAL
WEE
KLY

Deutsche BankIndia Annual Results 2019-2020Deutsche Bank AG, India Branches(Incorporated in Germany with limited liability)
Economic & Political Weekly EPW Published on Saturday, JUNE 27, 2020 vol lV nos 26 & 27 305
Impact of Credit Rating Downgrade
Credit ratings are formally reviewed at least annually and additionally reviewed whenever there is any major credit event / releases of regular earning statements of companies. CRM monitors credit ratings of all counterparties on an on-going basis and initiates rating actions throughout the year based on changes in business conditions / specifi c credit events /changes in sector outlooks / views of external rating agencies.
In case of a rating downgrade, CRM reviews the credit strategy and gets it approved by the respective authority holder. CRM follows the Global Credit Approval Authority Scheme which defi nes the authority delegation level per type of counterpart (corporate / bank / fi nancial institution etc), size of facility, credit rating of counterpart and type of approval- limit approval / temporary excess approval.
Also in line with market convention, the Bank negotiates CSA terms for certain counterparties where the thresholds related to each party are dependent on their External Credit Assessment Institution (ECAI) long term rating. Such clauses are typically mutual in nature. It is therefore recognised that a downgrade in the Group’s rating could result in counterparties seeking additional collateral calls to cover negative MTM portfolios where thresholds are lowered.
Quantitative Disclosures (in Rs ‘000)
Particulars* 31 March 2020 31 March 2019
Gross positive fair value of contracts 233,151,636 121,342,164
Netting benefi ts – –
Netted current credit exposure 233,151,636 121,342,164
Collateral held (including type, e.g. cash, government securities, etc.) – –
Net derivatives credit exposure 233,151,636 121,342,164
Potential future exposure 261,957,302 203,062,009
Measures for exposure at default or exposure amount under CEM 495,108,938 324,404,173
The notional value of credit derivative hedges – –
Distribution of current credit exposure by types of credit exposure: – –
– Interest Rates 176,016,206 82,285,152
– Fx 319,092,732 242,119,021
* Based on current exposure method
7. Leverage RatioThe leverage ratio act as a credible supplementary measure to the risk based capital requirement.W.e.f October 1, 2019 The Bank is required to maintain a minimum Leverage Ratio at 4% for Domestic Systemically Important Banks (DSIBs) and 3.5% for other banks as per notifi cation dated June 28, 2019.
The Bank’s leverage ratio, calculated in accordance with the RBI guidelines under consolidated framework is as follows:
Comparison of accounting assets and leverage ratio exposure(in Rs ‘000)
S. No. Leverage ratio framework Solo Regulatory scope of
consolidation*
1 Total consolidated assets 1,212,440,419 1,236,879,149
2 Adjustment for investments in banking, fi nancial, insurance or commercial entities that are consolidated for accounting purposes but outside the scope of regulatory consolidation
– –
3 Adjustment for fi duciary assets recognised on the balance sheet pursuant to the operative accounting framework but excluded from the leverage ratio exposure measure
– –
4 Adjustments for derivative fi nancial instruments 261,058,196 261,058,196
5 Adjustment for securities fi nancing transactions (i.e. repos and similar secured lending) 589,332 589,332
6 Adjustment for off-balance sheet items (i.e. conversion to credit equivalent amounts of off- balance sheet exposures)
199,741,100 201,737,738
7 Other adjustments (535,081) (5,774,618)
8 Leverage ratio exposure 1,673,293,966 1,694,489,797
* Based on un-audited accounts for banks & unaudited accounts for subsidiary
Management disclosures under Pillar 3 – Year ended March 31, 2020
ECO
NOM
IC &
PO
LITI
CAL
WEE
KLY

Deutsche BankIndia Annual Results 2019-2020Deutsche Bank AG, India Branches(Incorporated in Germany with limited liability)
Published on Saturday, JUNE 27, 2020 vol lV nos 26 & 27 EPW Economic & Political Weekly306
Leverage ratio common disclosure
(In Rs ‘000)
S. No. Leverage ratio framework Solo Regulatory scope of
consolidation*
On-balance sheet exposures
1 On-balance sheet items (excluding derivatives and SFTs, but including collateral) 937,933,243 962,371,973
2 (Asset amounts deducted in determining Basel III Tier 1 capital) (535,081) (5,774,618)
3 Total on-balance sheet exposures (excluding derivatives and SFTs) (sum of lines 1 and 2)
937,398,162 956,597,355
Derivative exposures
4 Replacement cost associated with all derivatives transactions (i.e. net of eligible cash variation margin)
233,151,636 233,151,636
5 Add-on amounts for PFE associated with all derivatives transactions 261,957,301 261,957,301
6 Gross-up for derivatives collateral provided where deducted from the balance sheet assets pursuant to the operative accounting framework
– –
7 (Deductions of receivables assets for cash variation margin provided in derivatives transactions) – –
8 (Exempted CCP leg of client-cleared trade exposures) – –
9 Adjusted effective notional amount of written credit derivatives – –
10 (Adjusted effective notional offsets and add-on deductions for written credit derivatives) – –
11 Total derivative exposures (sum of lines 4 to 10) 495,108,937 495,108,937
Securities fi nancing transaction exposures
12 Gross SFT assets (with no recognition of netting), after adjusting for sale accounting transactions
40,456,435 40,456,435
13 (Netted amounts of cash payables and cash receivables of gross SFT ASSETS) – –
14 CCR exposure for SFT assets 589,332 589,332
15 Agent transaction exposures – –
16 Total securities fi nancing transaction exposures (sum of lines 12 to 15) 41,045,767 41,045,767
Other off-balance sheet exposures
17 Off-balance sheet exposure at gross notional amount 510,676,271 530,642,646
18 (Adjustments for conversion to credit equivalent amounts) (310,935,171) (328,904,908)
19 Off-balance sheet items (sum of lines 17 and 18) 199,741,100 201,737,738
Capital and total exposures
20 Tier 1 capital 151,390,595 160,919,770
21 Total exposures (sum of lines 3, 11, 16 and 19) 1,673,293,966 1,694,489,797
Leverage ratio
22 Basel III leverage ratio 9.05% 9.50%
* Based on un-audited accounts for banks & unaudited accounts for subsidiary
Reconciliation of total published balance sheet size and on balance sheet exposure under common disclosure (In Rs ‘000)
S. No. Leverage ratio framework Solo Regulatory scope of consolidation*
1 Total consolidated assets 1,212,440,419 1,236,879,149
2 Replacement cost associated with all derivatives transactions, i.e. net of eligible cash variation margin
(234,050,741) (234,050,741)
3 Adjustment for securities fi nancing transactions (i.e. repos and similar secured lending) (40,456,435) (40,456,435)
4 Adjustment for entitles outside the scope of regulatory consolidation 0 0
5 On-balance sheet exposure under leverage ratio (excluding derivatives and SFTs) 937,933,243 962,371,973
* Based on un-audited accounts for banks & unaudited accounts for subsidiary
Management disclosures under Pillar 3 – Year ended March 31, 2020
ECO
NOM
IC &
PO
LITI
CAL
WEE
KLY

Deutsche BankIndia Annual Results 2019-2020Deutsche Bank AG, India Branches(Incorporated in Germany with limited liability)
Economic & Political Weekly EPW Published on Saturday, JUNE 27, 2020 vol lV nos 26 & 27 307
8. Composition of Capital Disclosure Template
(In Rs.’000)
Sr. No. Basel III common disclosure template to be used during the transition of regulatory adjustments
Solo Regulatory scope of
consolidation*
Ref No.
Common Equity Tier 1 capital: instruments and reserves 1 Directly issued qualifying common share capital plus related stock surplus
(share premium) 75,881,087 76,909,937 A
2 Retained earnings 76,094,589 89,834,451 B+C+D+E+F+G3 Accumulated other comprehensive income (and other reserves) –4 Directly issued capital subject to phase out from CET1 (only applicable to
non joint stock companies)–
5 Common share capital issued by subsidiaries and held by third parties (amount allowed in group CET1)
–
6 Common Equity Tier 1 capital before regulatory adjustments 151,975,676 166,744,388 Common Equity Tier 1 capital : regulatory adjustments 7 Prudential valuation adjustments8 Goodwill (net of related tax liability)9 Intangibles other than mortgage-servicing rights(net of related tax liability) 535,081 535,081 H10 Deferred tax assets 5,292,515 5,385,635 I11 Cash-fl ow hedge reserve12 Shortfall of provisions to expected losses13 Securitisation gain on sale14 Gains and losses due to changes in own credit risk on fair valued liabilities15 Defi ned-benefi t pension fund net assets16 Investments in own shares (if not already netted off paid-up capital on reported
balance sheet)17 Reciprocal cross-holdings in common equity18 Investments in the capital of banking, fi nancial and insurance entities that are
outside the scope of regulatory consolidation, net of eligible short positions, where the bank does not own more than 10% of the issued share capital (amount above 10% threshold)
19 Signifi cant investments in the common stock of banking, fi nancial and insurance entities that are outside the scope of regulatory consolidation, net of eligible short positions (amount above 10% threshold)
20 Mortgage servicing rights4(amount above 10% threshold)21 Deferred tax assets arising from temporary differences5
(amount above 10% threshold, net of related tax liability)22 Amount exceeding the 15% threshold23 of which : signifi cant investments in the common stock of fi nancial entities24 of which : mortgage servicing rights25 of which : deferred tax assets arising from temporary differences26 National specifi c regulatory adjustments7(26a+26b+26c+26d)26a of which : Investments in the equity capital of unconsolidated insurance subsidiaries
26b Of which: Investments in the equity capital of consolidated non- fi nancial subsidiaries
26c of which : Shortfall in the equity capital of majority owned fi nancial entities which have not been consolidated with the bank
26d of which : Unamortised pension funds expenditures27 Regulatory adjustments applied to Common Equity Tier 1 due to insuffi cient
Additional Tier 1 and Tier 2 to cover deductions28 Total regulatory adjustments to Common equity Tier 1 5,827,596 5,920,716
Add : Deferred Tax Asset which relate to timing difference, up to 10% of CET 1 Capital 5,292,515 5,292,515 Less : Investment in group entities in excess of 10% of owned fund – 5,146,417 Less : Other Deduction : Earmark for Electronic Trading Platform (ETP) 50,000 50,000 J.1
29 Common Equity Tier 1 capital (CET1) 151,390,595 160,919,770
Management disclosures under Pillar 3 – Year ended March 31, 2020
ECO
NOM
IC &
PO
LITI
CAL
WEE
KLY

Deutsche BankIndia Annual Results 2019-2020Deutsche Bank AG, India Branches(Incorporated in Germany with limited liability)
Published on Saturday, JUNE 27, 2020 vol lV nos 26 & 27 EPW Economic & Political Weekly308
(In Rs.’000)
Sr. No. Basel III common disclosure template to be used during the transition of regulatory adjustments
Solo Regulatory scope of
consolidation*
Ref No.
Additional Tier 1 capital : instruments30 Directly issued qualifying Additional Tier 1 instruments plus related stock surplus
(share premium) (31+32)31 of which : classifi ed as equity under applicable accounting standards (Perpetual
Non-Cumulative Preference Shares)32 of which : classifi ed as liabilities under applicable accounting standards
(Perpetual debt Instruments)33 Directly issued capital instruments subject to phase out from Additional Tier 134 Additional Tier 1 instruments (and CET1 instruments not included in row 5)
issued by subsidiaries and held by third parties (amount allowed in group AT1)35 of which : instruments issued by subsidiaries subject to phase out36 Additional Tier 1 capital before regulatory adjustments – Additional Tier 1 capital : regulatory adjustments37 Investments in own Additional Tier 1 instruments38 Reciprocal cross-holdings in Additional Tier 1 instruments39 Investments in the capital of banking, fi nancial and insurance entities that are
outside the scope of regulatory consolidation, net of eligible short positions, where the bank does not own more than 10% of the issued common share capital of the entity (amount above 10% threshold)
40 Signifi cant investments in the capital of banking, fi nancial and insurance entities that are outside the scope of regulatory consolidation (net of eligible short positions)
41 National specifi c regulatory adjustments (41a+41b)41a of which : Investments in the Additional Tier 1 capital of unconsolidated
insurance subsidiaries41b of which : Shortfall in the Additional Tier 1 capital of majority owned fi nancial
entities which have not been consolidated with the bank42 Regulatory adjustments applied to Additional Tier 1 due to insuffi cient Tier 2 to
cover deductions43 Total regulatory adjustments to Additional Tier 1 capital – –44 Additional Tier 1 capital (AT1) – –44a Additional Tier 1 capital reckoned for capital adequacy11 – –45 Tier 1 capital (T1 = CET1 + Admissible AT1) (29 + 44a) 151,390,595 160,919,770 Tier 2 capital: instruments and provisions46 Directly issued qualifying Tier 2 instruments plus related stock surplus47 Directly issued capital instruments subject to phase out from Tier 248 Tier 2 instruments (and CET1 and AT1 instruments not included in rows 5 or 34)
issued by subsidiaries and held by third parties (amount allowed in group Tier 2)49 of which : instruments issued by subsidiaries subject to phase out50 Provisions 8,801,955 8,802,530 J+K+L+M+N51 Tier 2 capital before regulatory adjustments 8,801,955 8,802,530Tier 2 capital: regulatory adjustments52 Investments in own Tier 2 instruments53 Reciprocal cross-holdings in Tier 2 instruments54 Investments in the capital of banking, fi nancial and insurance entities that are
outside the scope of regulatory consolidation, net of eligible short positions, where the bank does not own more than 10% of the issued common share capital of the entity (amount above the 10% threshold)
55 Signifi cant investments in the capital banking, fi nancial and insurance entities that are outside the scope of regulatory consolidation (net of eligible short positions)
56 National specifi c regulatory adjustments (56a+56b)56a of which : Investments in the Tier 2 capital of unconsolidated insurance
subsidiaries56b of which : Shortfall in the Tier 2 capital of majority owned fi nancial entities which
have not been consolidated with the bank57 Total regulatory adjustments to Tier 2 capital –
Management disclosures under Pillar 3 – Year ended March 31, 2020
ECO
NOM
IC &
PO
LITI
CAL
WEE
KLY

Deutsche BankIndia Annual Results 2019-2020Deutsche Bank AG, India Branches(Incorporated in Germany with limited liability)
Economic & Political Weekly EPW Published on Saturday, JUNE 27, 2020 vol lV nos 26 & 27 309
(In Rs.’000)
Sr. No. Basel III common disclosure template to be used during the transition of regulatory adjustments
Solo Regulatory scope of
consolidation*
Ref No.
58 Tier 2 capital (T2) 8,801,955 8,802,530
58a Tier 2 capital reckoned for capital adequacy 8,801,955 8,802,530
58b Excess Additional Tier 1 capital reckoned as Tier 2 capital –
58c Total Tier 2 capital admissible for capital adequacy (58a + 58b) 8,801,955 8,802,530
59 Total capital (TC = T1 + Admissible T2) (45 + 58c) 160,192,550 169,722,300
60 Total risk weighted assets (60a + 60b + 60c) 1,073,134,308 1,087,451,518
60a of which : total credit risk weighted assets 875,933,302 890,250,512
60b of which : total market risk weighted assets 123,985,675 123,985,675
60c of which : total operational risk weighted assets 73,215,331 73,215,331
Capital ratios61 Common Equity Tier 1 (as a percentage of risk weighted assets) 14.11% 14.80%
62 Tier 1 (as a percentage of risk weighted assets) 14.11% 14.80%
63 Total capital (as a percentage of risk weighted assets) 14.93% 15.61%
64 Institution specifi c buffer requirement (minimum CET1 requirement plus capital conservation plus countercyclical buffer requirements plus G-SIB buffer requirement, expressed as a percentage of risk weighted assets)
9.375% 9.375%
65 of which : capital conservation buffer requirement 1.875% 1.875%
66 of which : bank specifi c countercyclical buffer requirement – –
67 of which : G-SIB buffer requirement 2.000% 2.000%
68 Common Equity Tier 1 available to meet buffers (as a percentage of risk weighted assets)
8.61% 9.30%
National minima (if different from Basel III)69 National Common Equity Tier 1 minimum ratio (if different from Basel III
minimum)5.50% 5.50%
70 National Tier 1 minimum ratio (if different from Basel III minimum) 7.00% 7.00%
71 National total capital minimum ratio (if different from Basel III minimum) 9.00% 9.00%
Amounts below the thresholds for deduction (before risk weighting)72 Non-signifi cant investments in the capital of other fi nancial entities –
73 Signifi cant investments in the common stock of fi nancial entities –
74 Mortgage servicing rights (net of related tax liability) –
75 Deferred tax assets arising from temporary differences (net of related tax liability) –
Applicable caps on the inclusion of provisions in Tier 276 Provisions eligible for inclusion in Tier 2 in respect of exposures subject to
standardised approach (prior to application of cap) 8,801,955 8,802,530
77 Cap on inclusion of provisions in Tier 2 under standardised approach (Excluding Investment Fluctuation Reserve as per RBI circular dated 17th March 2020)
10,949,166 11,128,131
78 Provisions eligible for inclusion in Tier 2 in respect of exposures subject to internal ratings-based approach (prior to application of cap)
–
79 Cap for inclusion of provisions in Tier 2 under internal ratings-based approach –
Capital instruments subject to phase-out arrangements80 Current cap on CET1 instruments subject to phase out arrangements –
81 Amount excluded from CET1 due to cap (excess over cap after redemptions and maturities)
–
82 Current cap on AT1 instruments subject to phase out arrangements –
83 Amount excluded from AT1 due to cap (excess over cap after redemptions and maturities)
–
84 Current cap on T2 instruments subject to phase out arrangements
85 Amount excluded from T2 due to cap (excess over cap after redemptions and maturities)
* Based on unaudited accounts of DIHPL and audited accounts of DIIPL.
Management disclosures under Pillar 3 – Year ended March 31, 2020
ECO
NOM
IC &
PO
LITI
CAL
WEE
KLY

Deutsche BankIndia Annual Results 2019-2020Deutsche Bank AG, India Branches(Incorporated in Germany with limited liability)
Published on Saturday, JUNE 27, 2020 vol lV nos 26 & 27 EPW Economic & Political Weekly310
Step 1: (Rs. in 000)
Particulars
Balance sheet as in fi nancial statements
Balance sheet under regulatory scope of
consolidation*
As on reporting date As on reporting dateA Capital & Liabilities i. Paid-up Capital 75,881,087 76,909,937 Reserves & Surplus 94,014,941 109,463,085 Minority Interest – – Total Capital 169,896,028 186,373,022 ii. Deposits 599,095,565 599,095,565 of which : Deposits from banks 14,199,869 14,199,869 of which : Customer deposits 584,895,696 584,895,696 of which : Other deposits (pl. specify) – – iii. Borrowings 139,736,932 146,629,678 of which : From RBI 1,120,000 1,120,000 of which : From banks 13,955,127 13,955,127 of which : From other institutions & agencies 124,661,805 124,661,805
of which : Others (Including Commercial Papers) – 7,334,667 of which : Capital instruments – – iv. Other liabilities & provisions 303,711,894 304,338,963 Total 1,212,440,419 1,236,879,149 B Assets i. Cash and balances with Reserve Bank of India 31,946,422 31,946,422 ii. Balance with banks and money at call and short notice 66,851,653 70,485,157 iii. Investments (Net) 331,799,673 337,895,130 of which : Government securities in India 261,306,910 262,291,462
of which : Government securities outside India 37,834,076 37,834,076 of which : Other approved securities – – of which : Shares 222,994 3,989,899 of which : Debentures & Bonds 32,435,693 33,779,693 of which : Subsidiaries / Joint Ventures / Associates – – of which: Others (Commercial Papers, Mutual Funds etc.) – – iv. Loans and advances (Net) 510,677,596 523,570,453 of which : Loans and advances to banks 3,002,014 3,002,014 of which : Loans and advances to customers 507,675,582 520,568,439 v. Fixed assets 1,138,329 1,138,989 vi. Other assets 270,026,746 271,842,998 of which : Goodwill and intangible assets – – of which : Deferred tax assets 5,292,515 5,385,635 vii. Goodwill on consolidation – – viii. Debit balance in Profi t & Loss account – Total Assets 1,212,440,419 1,236,879,149
* Based on unaudited accounts of DIHPL and audited accounts of DIIPL.
Step 2: (Rs. in 000)
Particulars
Balance sheet as in fi nancial
statements
Balance sheet As in fi nancial statements
sheet under regulatory scope of
consolidation*
Ref
As on reporting date As on reporting dateA Capital & Liabilities i. Paid-up Capital 75,881,087 76,909,937 of which : Amount eligible for CET1 75,881,087 76,909,937 A of which : Amount eligible for AT1 – – Reserves & Surplus 94,014,941 109,463,085 Of which: Capital Reserve 360,607 360,607 B Of which: Statutory Reserve / Reserves under Sec 45-IC of RBI Act 1934 32,265,930 36,394,758 C Of which: Remittable Surplus retained for CRAR requirements 43,468,052 43,468,052 D
Of which: Securities Premium – 8,936,170 EOf which: General reserve & Other reserve - eligibile for CET1 – 272,871 Fof which: Balance in Profi t and Loss Account - eligible for CET1 – 401,993 G
of which: Investment Fluctuation Reserve 3,204,519 3,204,519 JOf which: Earmark for Electronic Trading Platform (ETP) 50,000 – J.1
Minority Interest – – Total Capital 169,896,028 186,373,022
Management disclosures under Pillar 3 – Year ended March 31, 2020
ECO
NOM
IC &
PO
LITI
CAL
WEE
KLY

Deutsche BankIndia Annual Results 2019-2020Deutsche Bank AG, India Branches(Incorporated in Germany with limited liability)
Economic & Political Weekly EPW Published on Saturday, JUNE 27, 2020 vol lV nos 26 & 27 311
Particulars
Balance sheet as in fi nancial
statements
Balance sheet As in fi nancial statements
sheet under regulatory scope of
consolidation*
Ref
As on reporting date As on reporting date ii. Deposits 599,095,565 599,095,565 of which : Deposits from banks 14,199,869 14,199,869 of which : Customer deposits 584,895,696 584,895,696 of which : Other deposits (pl. specify) – – iii. Borrowings 139,736,932 146,629,678 of which : From RBI 1,120,000 1,120,000 of which : From banks 13,955,127 13,955,127 of which : From other institutions & agencies 124,661,805 124,661,805 of which : Others (Including Commercial Papers) – 7,334,667 of which : Capital instruments – – iv. Other liabilities & provisions 303,711,894 304,338,963 of which : DTLs related to goodwill – of which : DTLs related to intangible assets –
of which : Investments Reserve – of which: Provision for accounts where moratorium is granted 265,569 265,569
of which: Provision on Standard Assets & Country Risk 4,270,176 4,270,751 K of which: General Loan Loss Provision 712,260 712,260 L
of which: NPA Provision reversal on sale of NPA 465,000 465,000 M of which: Countercyclical provisioning buffer 150,000 150,000 N Total 1,212,440,419 1,236,879,149 B Assets i. Cash and balances with Reserve Bank of India 31,946,422 31,946,422 ii. Balance with banks and money at call and short notice 66,851,653 70,485,157 iii. Investments (Net) 331,799,673 337,895,130 of which : Government securities in India 261,306,910 262,291,462
of which : Government securities outside India 37,834,076 37,834,076 of which : Other approved securities – – of which : Shares 222,994 3,989,899 of which : Debentures & Bonds 32,435,693 33,779,693 of which : Subsidiaries / Joint Ventures / Associates (net) – – of which: Others (Commercial Papers, Mutual Funds etc.) – – iv. Loans and advances (Net) 510,677,596 523,570,453 of which : Loans and advances to banks 3,002,014 3,002,014 of which : Loans and advances to customers 507,675,582 520,568,439 v. Fixed assets 1,138,329 1,138,989 of which : intangible assets 535,081 535,081 H vi. Other assets 270,026,746 271,842,998 of which : Goodwill and intangible assets – – of which : Deferred tax assets 5,292,515 5,385,635 I vii. Goodwill on consolidation – – viii. Debit balance in Profi t & Loss account – – Total Assets 1,212,440,419 1,236,879,149
* Based on unaudited accounts of DIHPL and audited accounts of DIIPL.
9. Regulatory Capital InstrumentsThe Bank has not issued any Regulatory Capital Instruments during the period. Regulatory capital increases for the Bank generally take place via capital infusion from the Head Offi ce, increase in statutory/ regulatory reserves and/or retention of Remittable Surplus for CRAR requirements.
10. Disclosure Requirements for RemunerationIn accordance with the requirements of the RBI Circular No. DBOD.NO.BC. 72/29.67/001/2011-12 dated 13 January 2012, the Global Head Offi ce of the Bank has submitted a declaration to RBI that the Bank’s compensation policies including that of CEO’s, is in conformity with the Financial Stability Board principles and standards.
11. Comparative fi gures Certain comparative fi gures have been reclassifi ed to conform to the current period’s preparation.
Management disclosures under Pillar 3 – Year ended March 31, 2020
For Deutsche Bank AG - India Branches
Sd/- Sd/-Kaushik Shaparia Avinash PrabhuChief Executive Offi cer – India Chief Financial Offi cer – India
Place : MumbaiDate : 22 June, 2020
ECO
NOM
IC &
PO
LITI
CAL
WEE
KLY

AMERICAN EXPRESS BANKING CORP.INDIA BRANCH
(INCORPORATED IN THE UNITED STATES OF AMERICA)
Published on Saturday, JUNE 27, 2020 vol lV nos 26 & 27 EPW Economic & Political Weekly312
Independent Auditor’s Report
ToThe Chief Executive Offi cer American Express Banking Corp.- India Branch
Report on the Audit of the Financial Statements
Opinion 1. We have audited the accompanying fi nancial statements of American Express Banking Corp.- India Branch (‘the Bank’), which
comprise the Balance Sheet as at March 31, 2020 and the Profi t and Loss Account and the Cash Flow statement for the year then ended, and a summary of signifi cant accounting policies and other explanatory information.
In our opinion and to the best of our information and according to the explanations given to us, the aforesaid fi nancial statements together with notes thereon give full information required by the Banking Regulation Act, 1949 as well as the Companies Act, 2013 (‘the Act’), in the manner so required for banking companies and give true and fair view in conformity with the accounting principles generally accepted in India:
a. in the case of the Balance Sheet, of the state of affairs of the Bank as at March 31, 2020; b. in case of the Profi t and Loss Account, of the profi t of the Bank for the year ended on that date; c. in the case of the Cash Flow Statement, of the cash fl ows of the Bank for the year ended on that date.
Basis for Opinion 2. We conducted our audit in accordance with the Standards on Auditing (‘SAs’) specifi ed under section 143(10) of the Act. Our
responsibilities under those Standards are further described in the Auditor’s Responsibilities for the Audit of the Financial Statements section of our report. We are independent of the Bank in accordance with the Code of Ethics issued by the Institute of Chartered Accountants of India (‘ICAI’) together with the ethical requirements that are relevant to our audit of the fi nancial statements under the provisions of the Act and the Rules thereunder; and we have fulfi lled our other ethical responsibilities in accordance with these requirements and the Code of Ethics. We believe that the audit evidence we have obtained is suffi cient and appropriate to provide a basis for our opinion.
Emphasis of Matter3. We draw attention to note no. 20 of the fi nancial statements, which fully describes that the Bank has recognised provision on credit
card receivables to refl ect the adverse business impact and uncertainties arising from the COVID-19 pandemic. Such estimates are based on current facts and circumstances and may not necessarily refl ect the future uncertainties and events arising from the full impact of the COVID-19 pandemic.
Our opinion is not modifi ed in respect of this matter.
Information Other than the Financial Statements and Auditor’s Report Thereon4. The Bank’s management is responsible for the other information. The other information comprises the information included in the
Bank’s Basel III – Pillar 3 disclosures and annual report, but does not include the fi nancial statements and our auditors’ report thereon. The other information is expected to be made available to us after the date of this auditor’s report. Our opinion on the fi nancial statements does not cover the other information and we do not express any form of assurance conclusion thereon. In connection with our audit of the fi nancial statements, our responsibility is to read the other information when it becomes available and, in doing so, consider whether the other information is materially inconsistent with the fi nancial statements or our knowledge obtained during the course of our audit or otherwise appears to be materially misstated.When we read the other Information and if we conclude that there is a material misstatement therein, we are required to communicate the matter to those charges with governance as required under SA 720 ‘The Auditor’s responsibilities Relating to other Information’.
Responsibility of Management for Financial Statements 5. The Bank’s management is responsible for the matters stated in section 134(5) of the Act with respect to the preparation of these
fi nancial statements that give a true and fair view of the fi nancial position, fi nancial performance and cash fl ows of the Bank in accordance with the accounting principles generally accepted in India, including the Accounting Standards specifi ed under prescribed Section 133 of the Act, provision of Section 29 of the Banking Regulation Act, 1949 and the circulars and guidelines issued by Reserve Bank of India (‘RBI’) from time to time. This responsibility also includes maintenance of adequate accounting records in accordance with the provisions of the Act for safeguarding of the assets of the Bank and for preventing and detecting frauds and other irregularities; selection and application of appropriate accounting policies; making judgments and estimates that are reasonable and prudent; design, implementation and maintenance of adequate internal fi nancial controls, that were operating effectively for ensuring the accuracy and completeness of the accounting records, relevant to the preparation and presentation of the fi nancial statements that
ECO
NOM
IC &
PO
LITI
CAL
WEE
KLY

AMERICAN EXPRESS BANKING CORP.INDIA BRANCH
(INCORPORATED IN THE UNITED STATES OF AMERICA)
Economic & Political Weekly EPW Published on Saturday, JUNE 27, 2020 vol lV nos 26 & 27 313
give a true and fair view and are free from material misstatement, whether due to fraud or error. In preparing the fi nancial statements, management is responsible for assessing the Bank’s ability to continue as a going concern, disclosing, as applicable, matters related to going concern and using the going concern basis of accounting unless management either intends to liquidate the Bank or to cease operations, or has no realistic alternative but to do so.
The Bank’s management is also responsible for overseeing the Bank’s fi nancial reporting process.
Auditor’s Responsibilities for the Audit of the Financial Statements 6. Our objectives are to obtain reasonable assurance about whether the fi nancial statements, as a whole are free from material
misstatement, whether due to fraud or error, and to issue an auditor’s report that includes our opinion. Reasonable assurance is a high level of assurance, but is not a guarantee that an audit conducted in accordance with SAs will always detect a material misstatement when it exists. Misstatements can arise from fraud or error and are considered material if, individually or in the aggregate, they could reasonably be expected to infl uence the economic decisions of users taken on the basis of these fi nancial statements. As part of our audit in accordance with SAs we exercise professional judgment and maintain professional scepticism throughout the audit. We also: • Identify and assess the risks of material misstatement of the fi nancial statements, whether due to fraud or error, to design and
perform audit procedures responsive to those risks, and obtain audit evidence that is suffi cient and appropriate to provide a basis for our opinion. The risk of not detecting a material misstatement resulting from fraud is higher than for one resulting from error, as fraud may involve collusion, forgery, intentional omissions, misrepresentations, or the override of internal control.
• Obtain an understanding of internal control relevant to the audit in order to design audit procedures that are appropriate in the circumstances. Under section 143(3)(i) of the Act, we are also responsible for expressing our opinion on whether the Bank has adequate internal fi nancial controls system in place and the operating effectiveness of such controls.
• Evaluate the appropriateness of accounting policies used and the reasonableness of accounting estimates and related disclosures made by management.
• Conclude on the appropriateness of management’s use of the going concern basis of accounting and, based on the audit evidence obtained, whether a material uncertainty exists related to events or conditions that may cast signifi cant doubt on the Bank’s ability to continue as a going concern. If we conclude that a material uncertainty exists, we are required to draw attention in our auditor’s report to the related disclosures in the fi nancial statements or, if such disclosures are inadequate, to modify our opinion. Our conclusions are based on the audit evidence obtained up to the date of our auditor’s report. However, future events or conditions may cause the Bank to cease to continue as a going concern.
• Evaluate the overall presentation, structure and content of the fi nancial statements, including the disclosures, and whether the fi nancial statements represent the underlying transactions and events in a manner that achieves fair presentation.
• Communicate with those charged with governance regarding, among other matters, the planned scope and timing of the audit and signifi cant audit fi ndings, including any signifi cant defi ciencies in internal control that we identify during our audit. We also provide those charged with governance with a statement that we have complied with relevant ethical requirements regarding independence, and to communicate with them all relationships and other matters that may reasonably be thought to bear on our independence, and where applicable, related safeguards.
Report on Other Legal and Regulatory Requirements 7. The Balance Sheet and Profi t and Loss Account and the Cash Flow Statement have been drawn up in accordance with the provisions
of Section 29 of the Banking Regulation Act, 1949 read with Section 133 of the Act read with Rule 7 of the Companies (Accounts) Rules, 2014.
8. As required by Section 30(3) of the Banking Regulation Act, 1949, we report that:a. We have sought and obtained all the information and explanations which to the best of our knowledge and belief were necessary
for the purposes of our audit and have found them to be satisfactory;b. the transactions of the Bank, which have come to our notice have been within the powers of the Bank; andc. Since the bank is having only one branch, the question on reporting the number of branches audited by us and the manner of
audit thereon does not arise.
9. As required by Section 143 (3) of the Act, we report that:a. we have sought and obtained all the information and explanations which to the best of our knowledge and belief were necessary
for the purposes of our audit;b. in our opinion proper books of account as required by law have been kept by the Bank so far as it appears from our examination
of those books; except that the backup of the books of accounts and other books and papers maintained in electronic mode has not been maintained on servers physically located in India, Refer note I of Schedule 18 of the fi nancial statements wherein it has been stated that the backup of the books of accounts and other paper maintained in electronic mode has been maintained on servers physically located outside India;
ECO
NOM
IC &
PO
LITI
CAL
WEE
KLY

AMERICAN EXPRESS BANKING CORP.INDIA BRANCH
(INCORPORATED IN THE UNITED STATES OF AMERICA)
Published on Saturday, JUNE 27, 2020 vol lV nos 26 & 27 EPW Economic & Political Weekly314
c. the Balance Sheet, the Profi t and Loss Account and the Cash Flow Statement dealt with by this Report are in agreement with the books of account;
d. in our opinion, the aforesaid fi nancial statements comply with the Accounting Standards specifi ed under Section 133 of the Act, read with Rule 7 of the Companies (Accounts) Rules, 2014 in so far as they apply to the Bank;
e. there are no material observations or comments on the fi nancial transactions or matters which have any adverse effect on the functioning of the Bank;
f. reporting requirement pursuant to provision of Section 164 (2) of the Act is not applicable considering the Bank is a branch of American Express Banking Corp which is incorporated in United States of America with limited liability;
g. With respect to the adequacy of the internal fi nancial controls with reference to fi nancial statements of the Bank and the operating effectiveness of such controls, refer to our separate Report in Annexure 1 to this report;
h. Reporting requirement pursuant to section 197 of the Act related to managerial remuneration is not applicable considering the Bank is a branch of American Express Banking Corp which is incorporated in United States of America with limited liability;
i. With respect to the other matters to be included in the Auditor’s Report in accordance with Rule 11 of the Companies (Audit and Auditors) Rules, 2014, in our opinion and to the best of our information and according to the explanations given to us, we report as under:
i the Bank has disclosed the impact, if any, of pending litigations on its fi nancial positions in its fi nancial statements as at March 31, 2020; Refer Schedule 12 and Note IV. 11 of Schedule 18 to the fi nancial statements;
ii the Bank has made adequate provision, as required under the applicable law or accounting standards, for material foreseeable losses, if any, on long-term contracts including derivative contracts- Refer note IV. 1 (g) of schedule 18 to the fi nancial statements;
iii the Bank is currently not liable to transfer any amount to the Investor Education and Protection Fund;
For Khimji Kunverji & Co LLP Chartered AccountantsFRN: 105146W/ W100621
Gautam V ShahPartner (F-117348)UDIN: 20117348AAAAAK6268
Mumbai June 26, 2020
Annexure 1 to the Independent Auditors’ Report [referred to in paragraph 8(f) under ‘Report on Other Legal and Regulatory Requirements’ in the Independent Auditor’s Report] Report on the Internal Financial Controls under Clause (i) of Sub-section 3 of Section 143 of the Act
We have audited the internal fi nancial controls over fi nancial reporting of American Express Banking Corp- India Branch (“the Bank”) as at March 31, 2020 in conjunction with our audit of the fi nancial statements of the Bank for the year ended on that date.
Management’s Responsibility for Internal Financial Controls
The Bank’s management is responsible for establishing and maintaining internal fi nancial controls based on the internal control over fi nancial reporting criteria established by the Bank considering the essential components of internal control stated in the Guidance Note on Audit of Internal Financial Controls over Financial Reporting issued by the Institute of Chartered Accountants of India (“ICAI”). These responsibilities include the design, implementation and maintenance of adequate internal fi nancial controls that were operating effectively for ensuring the orderly and effi cient conduct of its business, including adherence to the Bank’s policies, the safeguarding of its assets, the prevention and detection of frauds and errors, the accuracy and completeness of the accounting records, and the timely preparation of reliable fi nancial information, as required under the Act.
Auditors’ Responsibility
Our responsibility is to express an opinion on the Bank’s internal fi nancial controls with reference to fi nancial statements based on our audit. We conducted our audit in accordance with the Guidance Note on Audit of Internal Financial Controls Over Financial Reporting (the “Guidance Note”) and the Standards on Auditing, issued by ICAI and deemed to be prescribed under section 143(10) of the Act, to the extent applicable to an audit of internal fi nancial controls, both issued by the ICAI. Those Standards and the Guidance Note require
ECO
NOM
IC &
PO
LITI
CAL
WEE
KLY

AMERICAN EXPRESS BANKING CORP.INDIA BRANCH
(INCORPORATED IN THE UNITED STATES OF AMERICA)
Economic & Political Weekly EPW Published on Saturday, JUNE 27, 2020 vol lV nos 26 & 27 315
that we comply with ethical requirements and plan and perform the audit to obtain reasonable assurance about whether adequate internal fi nancial controls over fi nancial reporting was established and maintained and if such controls operated effectively in all material respects.
Our audit involves performing procedures to obtain audit evidence about the adequacy of the internal fi nancial controls system over fi nancial reporting and their operating effectiveness. Our audit of internal fi nancial controls over fi nancial reporting included obtaining an understanding of internal fi nancial controls over fi nancial reporting, assessing the risk that a material weakness exists, and testing and evaluating the design and operating effectiveness of internal control based on the assessed risk. The procedures selected depend on the auditor’s judgment, including the assessment of the risks of material misstatement of the fi nancial statements, whether due to fraud or error.
We believe that the audit evidence we have obtained is suffi cient and appropriate to provide a basis for our audit opinion on the Bank’s internal fi nancial controls system over fi nancial reporting.
Meaning of Internal Financial Controls Over Financial Reporting
A Bank’s internal fi nancial control over fi nancial reporting is a process designed to provide reasonable assurance regarding the reliability of fi nancial reporting and the preparation of fi nancial statements for external purposes in accordance with generally accepted accounting principles. A Bank’s internal fi nancial control over fi nancial reporting includes those policies and procedures that: (a) pertain to the maintenance of records that, in reasonable detail, accurately and fairly refl ect the transactions and dispositions of
the assets of the Bank; (b) provide reasonable assurance that transactions are recorded as necessary to permit preparation of fi nancial statements in
accordance with generally accepted accounting principles, and that receipts and expenditures of the Bank are being made only in accordance with authorisations of management and directors of the Bank; and
(c) provide reasonable assurance regarding prevention or timely detection of unauthorised acquisition, use, or disposition of the Bank’s assets that could have a material effect on the fi nancial statements.
Inherent Limitations of Internal Financial Controls Over Financial Reporting
Because of the inherent limitations of internal fi nancial controls over fi nancial reporting, including the possibility of collusion or improper management override of controls, material misstatements due to error or fraud may occur and not be detected. Also, projections of any evaluation of the internal fi nancial controls over fi nancial reporting to future periods are subject to the risk that the internal fi nancial control over fi nancial reporting may become inadequate because of changes in conditions, or that the degree of compliance with the policies or procedures may deteriorate.
Opinion
In our opinion, the Bank has, in all material respects, an adequate internal fi nancial controls system with reference to fi nancial statements and such internal fi nancial controls with reference to fi nancial statements were operating effectively as at March 31, 2020, based on the internal control over fi nancial reporting criteria established by the Bank considering the essential components of internal control stated in the Guidance Note on Audit of Internal Financial Controls Over Financial Reporting issued by the ICAI except that the backup of the books of accounts and other books and papers maintained in electronic mode has not been maintained on servers physically located in India, Refer note I of Schedule 18 of the fi nancial statements wherein it has been stated that the backup of the books of accounts and other paper maintained in electronic mode has been maintained on servers physically located outside India.
For Khimji Kunverji & Co LLP Chartered AccountantsFRN: 105146W/ W100621
Gautam V ShahPartner (F-117348)UDIN: 20117348AAAAAK6268
Mumbai June 26, 2020
ECO
NOM
IC &
PO
LITI
CAL
WEE
KLY

AMERICAN EXPRESS BANKING CORP.INDIA BRANCH
(INCORPORATED IN THE UNITED STATES OF AMERICA)
Published on Saturday, JUNE 27, 2020 vol lV nos 26 & 27 EPW Economic & Political Weekly316
BALANCE SHEET AS AT MARCH 31, 2020 PROFIT AND LOSS ACCOUNT FOR THE YEAR ENDED MARCH 31, 2020
Year ended Year ended Schedule March 31, March 31, 2020 2019
INCOME Interest Earned 13 6,872,936 5,187,308 Other Income 14 14,636,807 14,216,713
Total 21,509,743 19,404,021
EXPENDITURE Interest Expended 15 1,501,487 1,461,081 Operating Expenses 16 17,917,836 15,125,894 Provisions and Contingencies 17 2,034,118 2,534,761
Total 21,453,441 19,121,736
PROFIT / (LOSS)Net Profi t /(Loss) for the Year 56,302 282,285Profi t / (Loss) brought forward (2,752,497) (2,964,037)Transfer from Investment Fluctuation Reserve (2,696,195) (2,681,752)
APPROPRIATIONS Transfer to Statutory Reserve 14,076 70,571 Transfer to Other Reserves 300 174 Transfer to Government / proposed dividend – – Balance carried over to Balance Sheet (2,710,571) (2,752,497)
(2,696,195) (2,681,752)Signifi cant Accounting Policies and Notes to Financial Statements 18
The schedules referred above form an integral part of the Profi t and Loss Account.
This is the Profi t and Loss Account referred to in our Report of even date.
As at As at Schedule March 31, March 31, 2020 2019
CAPITAL AND LIABILITIESCapital 1 17,603,299 17,603,299 Reserves and Surplus 2 487,531 473,155 Deposits 3 21,289,851 21,355,294 Borrowings 4 20,596,093 12,534,290 Other Liabilities and Provisions 5 22,501,999 33,530,707
Total 82,478,773 85,496,745
ASSETS Cash and Balances with Reserve Bank of India 6 1,855,697 1,895,697 Balances with Banks and Money at Call and Short Notice 7 1,654,231 1,485,030 Investments 8 33,409,924 23,411,094 Advances 9 39,873,855 53,398,404 Fixed Assets 10 307,012 316,448 Other Assets 11 5,378,054 4,990,072
Total 82,478,773 85,496,745
Contingent Liabilities 12 1,719,272 1,219,506 Bills for Collection – – Signifi cant Accounting Policies and Notes to Financial Statements 18
The schedules referred above form an integral part of the Balance Sheet.
This is the Balance Sheet referred to in our Report of even date.
(Amount in INR ‘000) (Amount in INR. ‘000)
For Khimji Kunverji & Co. LLP For and on behalf of(formerly Khimji Kunverji & Co – FRN: 105146W/ W100621) American Express Banking Corp.- India Branch Chartered Accountants Gautam V. Shah Manoj Adlakha Partner Chief Executive Offi cer Membership No. F-117348UDIN: 20117348AAAAAK6268 Vivek Sehgal Financial Controller Place: Mumbai Place: Gurugram Date: June 26, 2020 Date: June 26, 2020
ECO
NOM
IC &
PO
LITI
CAL
WEE
KLY

AMERICAN EXPRESS BANKING CORP.INDIA BRANCH
(INCORPORATED IN THE UNITED STATES OF AMERICA)
Economic & Political Weekly EPW Published on Saturday, JUNE 27, 2020 vol lV nos 26 & 27 317
CASH FLOW STATEMENT FOR THE YEAR ENDED MARCH 31, 2020 (Amount in INR. ‘000)
Year ended Year ended March 31, 2020 March 31, 2019
Cash Flow from Operating activities Net profi t/(loss) before taxes 77,409 282,285 Adjustments for : Net (write back)/depreciation on value of securities – – Provision for standard advances 465,534 42,411 Provision for non-performing advances (481,375) 450,790 Depreciation on assets 117,283 111,661 Net (profi t)/loss on sale of land, building and other assets 4,149 (1,125) Operating profi t before working capital changes 183,000 886,022 (Increase)/decrease in investments (9,998,830) (4,772,943) (Increase)/decrease in advances 14,005,924 (2,868,149) Increase/(decrease) in deposits (65,443) 5,249,656 (Increase)/decrease in other assets (248,138) (682,313) Increase/(decrease) in other liabilities and provisions (11,494,242) 4,022,461 (Taxes paid)/(Taxes deducted at source)/Refund received [net] (202,877) (55,294)A Net Cash Flow (used in)/from operating activities (7,820,606) 1,779,440 Cash Flow from Investing activities Fixed assets purchased (119,415) (154,853) Proceeds from sale of fi xed assets 7,419 7,971 B Net Cash Flow (used in)/from Investing activities (111,996) (146,882) Cash Flow from Financing activities Infusion of capital – 3,364,375 Proceeds/(Repayment) from/of Borrowings (2,269,497) (9,455,511) Proceeds from Subordinate Debt 10,331,300 4,950,000 Long term borrowing – –
C Net Cash Flow from/(used in)Financing activities 8,061,803 (1,141,136)
Net Increase/(Decrease) in cash and cash equivalents (A+B+C) 129,201 491,422 Cash and cash equivalents at beginning of year 3,380,727 2,889,305 Cash and cash equivalents at end of year 3,509,928 3,380,727 Increase/(decrease) in cash and cash equivalents 129,201 491,422 Notes to the Cash Flow Statement 1. Cash and cash equivalents represents cash and balances with banks, balance with RBI as disclosed in Schedules 6 and 7 2. The above Cash Flow Statement has been prepared under the "Indirect method" as set out in the Accounting Standard (AS-3) on Cash Flow Statements issued by the Institute of Chartered Accountants of India. This is the Cash Flow Statement referred to in our Report of even date.
For Khimji Kunverji & Co. LLP For and on behalf of(formerly Khimji Kunverji & Co – FRN: 105146W/ W100621) American Express Banking Corp.- India Branch Chartered Accountants Gautam V. Shah Manoj Adlakha Partner Chief Executive Offi cer Membership No. F-117348UDIN: 20117348AAAAAK6268 Vivek Sehgal Financial Controller Place: Mumbai Place: Gurugram Date: June 26, 2020 Date: June 26, 2020
ECO
NOM
IC &
PO
LITI
CAL
WEE
KLY

AMERICAN EXPRESS BANKING CORP.INDIA BRANCH
(INCORPORATED IN THE UNITED STATES OF AMERICA)
Published on Saturday, JUNE 27, 2020 vol lV nos 26 & 27 EPW Economic & Political Weekly318
As at As at March 31, March 31, 2020 2019
SCHEDULE 4 - BORROWINGSI. BORROWINGS IN INDIA Reserve Bank of India – – Other banks 764,793 3,034,290
II. BORROWINGS OUTSIDE INDIA Tier 2 Debt Capital raised in the form of Head Offi ce Borrowings in Foreign Currency [Refer Note IV. 1. b of Schedule 18] 19,831,300 9,500,000 20,596,093 12,534,290 Secured borrowings included in I and II above – –
SCHEDULE 5 - OTHER LIABILITIES AND PROVISIONSI. Bills payable – –II. Inter-offi ce adjustments (net) – –III. Interest accrued 238,230 272,152IV. Others (including provisions) * 22,263,769 33,258,555
22,501,999 33,530,707 * Refer Note IV. 6 of Schedule 18
SCHEDULE 6 - CASH AND BALANCES WITH RESERVE BANK OF INDIAI. Cash in hand (including foreign currency notes) – –II. Balances with Reserve Bank of India i) In Current Account 1,855,697 1,895,697 ii) In Other Accounts – – 1,855,697 1,895,697
SCHEDULE 7 - BALANCES WITH BANKS AND MONEY AT CALL AND SHORT NOTICEI. In India Balances with banks i) In Current Accounts 1,654,231 1,485,030 ii) In Other Deposit Accounts – – Money at call and short notice i) With banks – – ii) With other institutions – – 1,654,231 1,485,030II. Outside India i) In Current Accounts – – ii) In Other Deposit Accounts – – iii) Money at call and short notice – – – –
1,654,231 1,485,030
(Amount in INR. ‘000) (Amount in INR. ‘000)
As at As at March 31, March 31, 2020 2019
SCHEDULE 1 - CAPITAL Amount of deposit kept with RBI under section 11 (2) of the Banking Regulation Act, 1949 as per contra. 474,981 404,410 474,981 404,410
HEAD OFFICE ACCOUNT Opening balance 17,603,299 14,238,924 Additions during the year – 3,364,375
Closing balance 17,603,299 17,603,299SCHEDULE 2 - RESERVES AND SURPLUSI. STATUTORY RESERVES Opening balance 472,981 402,410 Additions during the year 14,076 70,571 Closing balance 487,057 472,981
II. CAPITAL RESERVES Opening balance – – Additions during the year – – Closing balance – –
III. SHARE PREMIUM Opening balance – – Additions during the year – – Closing balance – –
IV. REVENUE AND OTHER RESERVES Opening balance 174 – Additions during the year 300 174 Closing balance 474 174
V. Balance of Profi t and Loss Account – – 487,531 473,155
SCHEDULE 3 - DEPOSITSA. In IndiaI. DEMAND DEPOSITS From banks – – From others – –II. SAVINGS BANK DEPOSITS – –
III. TERM DEPOSITS From banks – – From others (Institutional) 21,289,851 21,355,294
21,289,851 21,355,294B. (i) Deposits of branches in India 21,289,851 21,355,294 (ii) Deposits of branches outside India – – 21,289,851 21,355,294
SCHEDULES FORMING PART OF FINANCIAL STATEMENTS
ECO
NOM
IC &
PO
LITI
CAL
WEE
KLY

AMERICAN EXPRESS BANKING CORP.INDIA BRANCH
(INCORPORATED IN THE UNITED STATES OF AMERICA)
Economic & Political Weekly EPW Published on Saturday, JUNE 27, 2020 vol lV nos 26 & 27 319
(Amount in INR. ‘000) (Amount in INR. ‘000)
SCHEDULES FORMING PART OF FINANCIAL STATEMENTS
As at As at March 31, March 31, 2020 2019
SCHEDULE 10 - FIXED ASSETSI. PREMISES At cost as on 31 March of the preceding year – – Additions during the year – – Deductions during the year – – – – Depreciation to date – – Total Net Book Value I – –II OTHER FIXED ASSETS (Including Furniture and Fixtures)* At cost as on March 31 of the preceding year 1,622,773 1,564,875 Additions during the year 119,415 154,853 Deductions during the year (262,257) (96,955) 1,479,931 1,622,773 Depreciation to date (1,172,919) (1,306,325) Total Net Book Value II 307,012 316,448
Net Book Value I and II 307,012 316,448 * Refer Note III. 7 of Schedule 18SCHEDULE 11 - OTHER ASSETSI. Inter-offi ce adjustments (net) – –II. Interest accrued 268,540 204,052III. Tax paid in advance / tax deducted at source 361,938 180,168IV. Stationery and Stamps – –V. Non-banking assets acquired in satisfaction of claims – –VI. Deferred tax asset – –VII. Others (Including Debit Balance in Profi t and Loss Account 4,747,576 4,605,852 Rs. 2,710,571 (000); Previous Year Rs. 2,752,497 (000)) 5,378,054 4,990,072SCHEDULE 12 - CONTINGENT LIABILITIESI. Claims against the bank not acknowledged as debts – –II. Liability for partly paid investments – –III. Liability on account of outstanding forward exchange contracts – –IV. Guarantees given on behalf of constituents a) In India – – b) Outside India – –V. Acceptances, endorsements and other obligations – –VI. Other items for which the bank is contingently liable 1,719,272 1,219,506 1,719,272 1,219,506
As at As at March 31, March 31, 2020 2019
SCHEDULE 8 - INVESTMENTSI. Investment in India in i) Government Securities (Treasury Bills) 33,409,924 23,411,094 ii) Other approved securities – – iii) Shares – – iv) Debentures and Bonds – – v) Subsidiaries and/or joint ventures – – vi) Others – –
33,409,924 23,411,094II. Investment outside India in i) Government Securities (including local authorities) – – ii) Subsidiaries and/or joint ventures abroad – – iii) Others – – – –
33,409,924 23,411,094SCHEDULE 9 - ADVANCESA. i) Bills purchased and discounted – – ii) Cash credits, overdraft and loan repayable on demand # 39,873,796 53,398,331 iii) Term loans - Staff 59 73 39,873,855 53,398,404B. i) Secured by tangible assets (Secured primarily by Fixed Deposits) 549,869 1,101,165 ii) Covered by bank/ governments guarantees 623,569 982,216 iii) Unsecured 38,700,417 51,315,023 39,873,855 53,398,404C. I. Advances in India i) Priority sector * – – ii) Public sector – – iii) Banks 49,603 – iv) Others 39,824,252 53,398,404 39,873,855 53,398,404 II. Advances Outside India i) Due from banks – – ii) Due from others (a) Bills purchased and discounted – – (b) Syndicated loans – – (c) Others – – – –
39,873,855 53,398,404
* Not applicable to the Bank vide RBI letter no. RPCD.CO.Plan.11642/04.09.09/2008-09 dated 11/05/2009
ECO
NOM
IC &
PO
LITI
CAL
WEE
KLY

AMERICAN EXPRESS BANKING CORP.INDIA BRANCH
(INCORPORATED IN THE UNITED STATES OF AMERICA)
Published on Saturday, JUNE 27, 2020 vol lV nos 26 & 27 EPW Economic & Political Weekly320
Year ended Year ended March 31, March 31, 2020 2019
SCHEDULE 13 - INTEREST EARNEDInterest/discount on advances/bills 5,246,710 3,767,583Income on investments 1,626,226 1,419,725Interest on balances with the Reserve Bank of India and – – other inter-bank funds – –Others – – 6,872,936 5,187,308SCHEDULE 14 - OTHER INCOMECommission, exchange and brokerage (net)[Refer Note IV. 2 of Schedule 18] 13,650,245 13,380,503Net Profi t/(Loss) on sale of investments 300 174Net Profi t /(Loss) on revaluation of investments – –Profi t on sale of land, building and other assets 1,140 1,750Less: Loss on sale of land, building and other assets (5,289) (625)Net profi t on exchange transactions – –Income earned by way of dividends etc. from subsidiaries, companies and/ or joint ventures abroad/in India – –Miscellaneous Income 990,411 834,911 14,636,807 14,216,713SCHEDULE 15 - INTEREST EXPENDEDInterest on deposits 1,267,215 1,100,620Interest on Reserve Bank of India/ interbank borrowings 234,272 360,461Others – – 1,501,487 1,461,081
Year ended Year ended March 31, March 31, 2020 2019
SCHEDULE 16 - OPERATING EXPENSESPayments to and provisions for employees 1,841,299 1,591,008Rent, taxes and lighting 238,446 196,305Printing and stationery 189,978 136,725Advertisement and publicity 8,687,473 7,414,446Depreciation on Bank’s property 117,283 111,661Director’s fee, allowances and expenses – –Auditors’ fees and expenses[Refer Note IV. 17 of Schedule 18] 6,195 5,229Law charges 8,651 2,999Postage, telegram, telephones etc. 238,761 209,683Repairs and maintenance 47,394 59,185Insurance 22,780 18,793Business Support Cost (net) 5,088,310 3,936,809Other expenditure 1,431,266 1,443,051 17,917,836 15,125,894
SCHEDULE 17 - PROVISIONS AND CONTINGENCIES *Depreciation in the value of securities – –Provision for advances and receivables 2,013,011 2,534,761Provision for income tax and wealth tax : Income tax 21,107 – Fringe Benefi t Tax – – Deferred Income Tax – – 2,034,118 2,534,761*Refer Note IV.1.g) of Schedule 18 for details
(Amount in INR. ‘000) (Amount in INR. ‘000)
SCHEDULES FORMING PART OF FINANCIAL STATEMENTS
Schedules forming part of the Financial Statements for the year ended March 31, 2020 SCHEDULE 18 - SIGNIFICANT ACCOUNTING POLICIES AND NOTES TO FINANCIAL STATEMENTSI. The fi nancial statements for the year ended March 31, 2020 comprises the Balance Sheet, Profi t and Loss Account, Cash Flow
Statement and Schedules of the India Branch of American Express Banking Corp. (the “Bank”), which is incorporated in the New York State Banking Law, United States of America. The Bank’s ultimate holding company is American Express Company, which is incorporated in the United States of America. The Bank has maintained the books of accounts and other books and papers in the electronic mode, periodic backup of which have been maintained on servers physically located outside of India.
II. Background: American Express Banking Corp. - India Branch has been granted license by Reserve Bank of India (‘RBI’) to carry on banking business in India. The license authorises the Bank to conduct credit card business, distribute traveller cheques and accept institutional deposits. In line with the market practice and the RBI Guidelines, the bank issues credit cards and provides payment solutions to corporates and other entities for their purchases like inventory, fi xed assets, payroll cost and other expenses like offi ce supplies, utilities, advertising, couriers, etc.
III. Signifi cant Accounting Policies1. Basis of preparation: The fi nancial statements have been prepared and presented under the historical cost convention on the
accrual basis of accounting, unless otherwise stated and are in accordance with the generally accepted accounting principles in India, statutory provisions prescribed under the Banking Regulation Act, 1949, circulars and guidelines issued by the Reserve Bank of India (RBI) from time to time and Accounting Standards (AS) prescribed under Section 133 of the Companies Act, 2013
ECO
NOM
IC &
PO
LITI
CAL
WEE
KLY

AMERICAN EXPRESS BANKING CORP.INDIA BRANCH
(INCORPORATED IN THE UNITED STATES OF AMERICA)
Economic & Political Weekly EPW Published on Saturday, JUNE 27, 2020 vol lV nos 26 & 27 321
SCHEDULES FORMING PART OF THE FINANCIAL STATEMENTS FOR THE YEAR ENDED MARCH 31, 2020
Schedule 18 – Signifi cant Accounting Policies and Notes to Financial Statements (Contd.)
read with Rule 7 of the Companies (Accounts) Rules, 2014 and Companies (Accounting Standards) Amendment Rules, 2016 to the extent applicable and conform to the statutory requirements prescribed by the RBI from time to time and current practices prevailing within the banking industry in India.
The fi nancial statements are presented in Indian Rupees rounded off to the nearest thousand unless otherwise stated.2. Use of Estimates: The preparation of fi nancial statements, in conformity with the generally accepted accounting principles,
requires the Management to make estimates and assumptions considered in the reported amounts of assets and liabilities (including contingent liabilities) as of the date of the fi nancial statements and reported income and expenses for the reporting period. Management believes that the estimates used in the preparation of the fi nancial statements are prudent and reasonable. Actual results could differ from these estimates and these differences are recognized prospectively in the current and future periods.
3. Revenue Recognition (i) Fees and commissions received, net of rebates/commissions paid, are recognized upon the occurrence of the transactions.
Annual card fees, net of direct card acquisition costs are amortized over the period of one year. Joining fees on cards are recognised in the year of billing.
(ii) Interest income and other charges on card balances are recognized as it accrues, except in the case of non-performing assets, where it is recognised on realisation, as per the prudential norms prescribed by RBI.
(iii) Recovery from bad debts written off is recognized as income on the basis of actual realization from customers. (iv) Interest income on discounted instruments is recognised over the tenure of the instruments.4. Foreign Currency transactions and balances Transactions denominated in foreign currencies are recorded on the date of transactions at the standard exchange rate determined by
the Bank. Exchange differences arising on the foreign currency transactions settled during the year are recognized in the Profi t and Loss Account of the same year.
Monetary Assets and Liabilities denominated in foreign currencies as at the Balance Sheet date are restated at the closing rates notifi ed by Foreign Exchange Dealers’ Association of India (FEDAI) and the resultant exchange differences are recognised in the Profi t and Loss Account. Transactions wherein there is no foreign exchange risk, the amounts are carried at the settlement rates.
5. Investments (i) Classifi cation In accordance with Reserve Bank of India (‘RBI’) guidelines, all investments are categorised as ‘Held to Maturity’, or ‘Held
for Trading’ or ‘Available for Sale’. Investments that the Bank intends to hold to maturity are classifi ed as ‘Held to Maturity’. Investments that are held principally
for resale within ninety days from the date of purchase are classifi ed as ‘Held for Trading’. All other investments are classifi ed as ‘Available for Sale’. An Investment is classifi ed as ‘Held to Maturity’, ‘Available for Sale’ or ‘Held for Trading’ at the time of its purchase. Any subsequent change in classifi cation is done as per RBI norms. As on date, all the investments are classifi ed as ‘Available for Sale’.
(ii) Valuation Treasury Bills, being discounted instruments are valued at carrying cost as per RBI guidelines. (iii) Acquisition Cost Brokerage, commission, etc., paid at the time of acquisition of securities are charged to Profi t and Loss Account. (iv) Disposal of Investments Profi t or loss on sale of investments is recognised in the profi t and loss account on trade/settlement date.6. Advances
Loans and Advances comprise card outstanding and loans to staff. Loans and Advances are stated net of specifi c provision made towards Non-Performing Assets (NPAs). Advances under card receivables are maintained at the card member level.Provision for NPAs on card balances outstanding is made at card member level as per Bank’s credit loss provisioning policy in accordance with the prudential norms on Income Recognition, Asset Classifi cation and Provisioning pertaining to Advances issued by the Reserve Bank of India and are monitored and tracked at a portfolio level. In the case of sub-standard assets, in addition to minimum provision requirement prescribed by RBI, the bank makes additional provision based on best estimate of probable losses. The interest and other income on non-performing assets is not recognised as income until realised.Provision for Standard Assets and Unhedged Foreign Currency Exposure is made in compliance with the prudential norms on Income Recognition, Asset Classifi cation and Provisioning pertaining to Advances issued by the Reserve Bank of India and disclosed under Other Liabilities and Provisions. Provision for Standard Assets are monitored for suffi ciency using the write off rates basis historical trend at a portfolio level.The Bank identifi es all card accounts with delinquencies and generally writes off in the books of account, the outstanding card receivables which are 210 days past billing from bill generation date. Accounts classifi ed as doubtful/loss are provided at 100%
ECO
NOM
IC &
PO
LITI
CAL
WEE
KLY

AMERICAN EXPRESS BANKING CORP.INDIA BRANCH
(INCORPORATED IN THE UNITED STATES OF AMERICA)
Published on Saturday, JUNE 27, 2020 vol lV nos 26 & 27 EPW Economic & Political Weekly322
SCHEDULES FORMING PART OF THE FINANCIAL STATEMENTS FOR THE YEAR ENDED MARCH 31, 2020
Schedule 18 – Signifi cant Accounting Policies and Notes to Financial Statements (Contd.)
till written off. Accelerated write off is effected for card receivables which are due for less than 210 days from bill generation date, where it is evident that the outstanding amount is unlikely to be recovered.Restructured assets are classifi ed and provided for in accordance with the guidelines issued by RBI from time to time.Net Receivables from/payables to overseas group entities on account of merchant payments made for spends made by overseas/Indian card members in India/overseas, have been classifi ed under Other Assets/Other Liabilities in the Financial Statements.
7. Fixed assets and depreciation (i) Fixed assets are stated at cost less accumulated depreciation. The Bank capitalises all costs relating to acquisition and
installation of fi xed assets. (ii) Carrying amounts of cash generating assets are reviewed at each Balance Sheet date to determine whether there is any
impairment. Impairment loss, if any, is recognised in the Profi t and Loss Account whenever the carrying amount exceeds the recoverable amount.
(iii) Depreciation on fi xed assets is provided on pro-rata basis over the period of the estimated useful life of the asset on Straight Line Method over the estimated useful life prescribed in Schedule II to the Companies Act, 2013.
(iv) Fixed assets are depreciated over the estimated useful life given in the table below:
Asset Estimated Useful LifeLeasehold Improvements Over the lease periodData Processing Equipment
Server and Networks 6 yearsEnd User Devices such as laptop, desktop, etc. 3 years
Transport Equipment 8 yearsFurniture and Fixtures 10 yearsMachinery and Equipment
Offi ce Equipment 5 yearsHeadsets and Mobile Phones 3 years
8. Accounting for LeasesLeases in which a signifi cant portion of the risks and rewards of ownership are retained by the lessors are classifi ed as operating lease. Lease payments for assets taken on operating leases are recognized as an expense in the Profi t and Loss Account over the lease term on a straight line basis.
9. Employee Benefi ts a) Provident Fund
The Bank contributes to mandatory government administered provident funds which are defi ned contribution schemes as the Bank does not carry any further obligation, apart from the contributions made on a monthly basis. The contributions are accounted for on an accrual basis and recognized in the Profi t and Loss Account.
b) Pension (i) The Bank has a pension scheme which is a defi ned contribution plan. Employees of the Bank are entitled to receive retirement
benefi ts under the Bank’s Superannuation scheme under a defi ned contribution plan to the pension fund. Contributions under these schemes are recognised in the Profi t and Loss Account in the period in which they accrue.
(ii) In addition to the above arrangement, there are deferred (exited) employees who had opted for the defi ned benefi t scheme. The Bank has set up a Pension Trust viz. American Express Banking Corp. India Staff Superannuation Fund to manage the
contributions to the pension fund. The Bank provides for its pension liability based on actuarial valuation of the pension liability, based on Projected Unit Credit Method, as at the Balance Sheet date carried out by an independent actuary and contributes to the pension fund. The contributions made to the Trust are recognized as plan assets. The defi ned benefi t obligation as reduced by fair value of plan assets is recognized in the Balance Sheet. Actuarial gains or losses are recognized in the Profi t and Loss Account in the year in which they arise.
c) Gratuity The Bank has set up a Gratuity Trust viz. American Express Banking Corp. India Employees Gratuity Fund to manage the
contributions to the gratuity fund. The Bank provides for its gratuity liability based on actuarial valuation of the gratuity liability as at the Balance Sheet date, based on Projected Unit Credit Method, carried out by an independent actuary and contributes to the gratuity fund. The contributions made to the Trust are recognized as plan assets. The defi ned benefi t obligation as reduced by fair value of plan assets is recognized in the Balance Sheet. Actuarial gains or losses are recognized in the Profi t and Loss Account in the year in which they arise.
ECO
NOM
IC &
PO
LITI
CAL
WEE
KLY

AMERICAN EXPRESS BANKING CORP.INDIA BRANCH
(INCORPORATED IN THE UNITED STATES OF AMERICA)
Economic & Political Weekly EPW Published on Saturday, JUNE 27, 2020 vol lV nos 26 & 27 323
SCHEDULES FORMING PART OF THE FINANCIAL STATEMENTS FOR THE YEAR ENDED MARCH 31, 2020
Schedule 18 – Signifi cant Accounting Policies and Notes to Financial Statements (Contd.)
d) Leave encashment/ Compensated Absences The Bank provides for leave encashment/compensated absences liability, which is payable on separation or termination of
service. The liability for leave encashment, which is a defi ned benefi t scheme, is provided based on actuarial valuation as at the Balance Sheet date, based on Projected Unit Credit Method, carried out by an independent actuary.
10. Income TaxesIncome tax expense comprises of the current tax, the net change in the deferred tax asset and the deferred tax liability during the year. Current tax is determined as the amount of tax payable in respect of taxable income for the year on the basis of the provisions of the Income Tax Act, 1961.Deferred tax is recognized, subject to the consideration of prudence in respect of deferred tax asset, on timing differences, being the difference between taxable income and accounting income that originate in one period and are capable of reversal in one or more subsequent periods.In case there are carry forward tax losses, the Deferred Tax Asset is recognized only when there is virtual certainty supported by convincing evidence that suffi cient future taxable income will be available against which such deferred tax assets can be realised.
11. Membership Reward PointsThe Membership Reward programme is a card-based rewards programme through which eligible card members can earn points for purchases charged on the Bank’s card products. Membership Rewards points can be redeemed for a broad variety of rewards. The Bank establishes balance sheet provisions that represent the estimated cost of points earned to date that are ultimately expected to be redeemed based on the management’s judgement and shown as a part of Other Liabilities and Provisions. The cost of Membership Reward Points is included as part of Advertisement and Publicity Expense.
12. Accounting for Provision, Contingent Liabilities and Contingent AssetsThe Bank creates a provision when there is a present obligation as a result of a past event that probably requires an outfl ow of resources and a reliable estimate of the amount of the obligation can be made.A disclosure for Contingent Liability is made when there is a possible obligation or a present obligation that may, but probably will not, require an outfl ow of resources. When there is a possible obligation or a present obligation in respect of which the likelihood of outfl ow of resources is remote, no provision or disclosure is made.The provisions are reviewed at each Balance Sheet date and adjusted to refl ect the current best estimate.Contingent assets are not recognized in the fi nancial statements.
13. Segment ReportingThe Bank has recognised Banking Operations and Treasury operations, as the primary reporting Business Segments, in accordance with the RBI guidelines on compliance with Accounting Standard – 17 issued by Institute of Chartered Accountants of India as specifi ed under Section 133 of Companies Act, 2013 read with Rule 7 of the Companies (Accounting) Rules, 2014.Banking Operations include card operations, travellers’ cheque distribution and institutional deposits. Interest income and expense (other than those identifi ed with the Treasury Operations), other identifi ed income and operating expenses are reckoned in the operating results of this segment.Treasury activities include the Investments and balance in bank account to meet the Statutory Liquidity Ratio (SLR), Liquidity Coverage Ratio (LCR) and maintenance of Cash Balances to meet the Cash Reserve Ratio (CRR) requirement and the corresponding funding to meet these requirements. The interest income and interest expenses related to these activities comprise the revenue and expense of this segment.
14. Cash and Cash EquivalentsCash and cash equivalents includes cash in hand, balance with RBI, demand deposits with banks and other fi xed deposits with bank with original maturities of three months or less.
15. Impairment of AssetsThe carrying amounts of assets are reviewed at each balance sheet date to ascertain if there is any indication of impairment based on internal/external factors in accordance with Accounting Standard – 28, Impairment of Assets issued by Institute of Chartered Accountants of India as specifi ed under Section 133 of Companies Act, 2013 read with Rule 7 of the Companies (Accounting) Rules, 2014. The carrying amount is reduced to the recoverable amount and reduction is recognised as an impairment loss in the Profi t and Loss Account.
ECO
NOM
IC &
PO
LITI
CAL
WEE
KLY

AMERICAN EXPRESS BANKING CORP.INDIA BRANCH
(INCORPORATED IN THE UNITED STATES OF AMERICA)
Published on Saturday, JUNE 27, 2020 vol lV nos 26 & 27 EPW Economic & Political Weekly324
SCHEDULES FORMING PART OF THE FINANCIAL STATEMENTS FOR THE YEAR ENDED MARCH 31, 2020
Schedule 18 – Signifi cant Accounting Policies and Notes to Financial Statements (Contd.)
IV. NOTES TO FINANCIAL STATEMENTS1. Statutory Disclosures as per RBI norms: a) Capital Adequacy Ratio
In terms of the extant RBI guidelines on Basel III Capital Regulations, as of March 31, 2020, the Bank is required to maintain a minimum Capital to Risk-weighted Asset Ratio (CRAR) (including capital conservation buffer of 1.875%) of 10.875%. Further, within this overall capital requirement, the Bank is also required to maintain a Minimum Common Equity Tier 1 (including capital conservation buffer of 1.875%) of 7.375% and Minimum Tier 1 Capital of 7%. The Bank’s Capital Adequacy Ratio, calculated as per the Basel III Capital Regulations is provided here under.
Particulars 2019-20 2018-19Common Equity Tier 1 capital ratio (%)Tier I Capital Ratio (%)Tier II Capital Ratio (%)Total Capital ratio (CRAR) (%)Percentage of the shareholding of the Government of India in public sector banksAmount of equity capital raised – Head Offi ce Funds (Amount Rs. in ‘000) Amount of additional Tier 1 capital raised Amount of additional Tier 2 capital raised of which - – Debt Capital instrument: (Amount in Rs. ’000) – Preference Share Capital Instruments
17.56%17.56%22.88%40.44%
NA
––
10,331,300–
14.92%14.92%9.44%
24.36%NA
3,364,375–
4,950,000–
b) Subordinated Debt - Tier 2 Debt Capital Raised in the form of Head Offi ce Borrowings in Foreign Currency:Schedule 4 – Borrowings includes an amount of Rs.1,250,000 thousands, Rs.3,300,000 thousands ,Rs.4,950,000 thousands and 10,331,300 thousands pertaining to Tier 2 debt capital raised in the form of Head Offi ce borrowings in foreign currency during 2013-14 , 2015-16 , 2018-19 and 2019-20 respectively from Head Offi ce. Details of the Head Offi ce borrowings are as under–
(Amount Rs. in ‘000)
Particulars Tranche 1 Tranche 2 Tranche 3 Tranche 4 Tranche 5Date of Borrowing 1-Nov-2013 27-Nov-2015 04-May-2018 11-Mar-2020 17-Mar-2020Rate of Interest Interest Free Interest Free Interest Free Interest Free Interest FreeAmount (Rs. ’000) 1,250,000 3,300,000 4,950,000 5,150,600 5,180,700Date of Repayment 1-Nov-2023 27-Nov-2025 04-May-2028 11-Mar-2026 17-Mar-2027Call Option with the Bank
After completion of 5 years from the Issuance date (1-Nov-2018), with a prior notice of 120 days to the Lender. The bank has decided not to exercise the prepayment option.
After completion of 5 years from the Issuance date (27-Nov-2020), with a prior notice of 120 days to the Lender. The bank has decided not to exercise the prepayment option.
After completion of 5 years from the Issuance date (04-May-2023), with a prior notice of 90 days to the Lender. The bank has decided to exercise the prepayment option only after 01-May-2025.
After completion of 5 years from the Issuance date (11-Mar-2025), with a prior notice of 90 days to the Lender.
After completion of 5 years from the Issuance date (17-Mar-2025), with a prior notice of 90 days to the Lender.
c) Business / Information Ratios:Particulars 2019-20 2018-19
a. Interest income as a percentage to working funds (%) 7.97 6.53b. Non-interest income as a percentage to working funds (%) 16.97 17.88c. Operating profi t as a percentage to working funds (%) 2.43 3.54d. Return on assets (%) 0.07 0.36e. Business (deposits plus advances) per employee (Amount in Rs. ’000) 101,508 104,166f. Profi t/(loss) per employee (Amount in Rs. ’000) 78 420
Defi nitions: a) Working funds is the average of total assets as reported in return Form X under Section 27 of Banking Regulation Act,
1949 (excluding accumulated losses) during the year b) Operating profi t = (Interest income + other income – interest expenses – operating expenses – amortization of premium
on investments – profi t / (loss) on sale of fi xed assets).
ECO
NOM
IC &
PO
LITI
CAL
WEE
KLY

AMERICAN EXPRESS BANKING CORP.INDIA BRANCH
(INCORPORATED IN THE UNITED STATES OF AMERICA)
Economic & Political Weekly EPW Published on Saturday, JUNE 27, 2020 vol lV nos 26 & 27 325
SCHEDULES FORMING PART OF THE FINANCIAL STATEMENTS FOR THE YEAR ENDED MARCH 31, 2020
Schedule 18 – Signifi cant Accounting Policies and Notes to Financial Statements (Contd.)
c) “Business” is the average of the total of advances and deposits (net of inter-bank deposits). d) Productivity ratios are based on number of employees at year end. d) Asset Liability Management - Maturity Pattern of Certain Assets and Liabilities
Classifi cation of assets and liabilities under the different maturity buckets are based on the estimates and assumptions used by the Bank. These estimates and assumptions are based on the guidelines on Asset Liability Management issued by Reserve Bank of India.
(Amount Rs. in ‘000)
Particulars Day - 1 2-7 Days 8-14 Days 15-30 Days
31 Days & upto
2 months
Over 2 Months
and upto 3 months
Over 3 Months
and upto 6 months
Over 6 Months
and upto 1 year
Over 1 Year and
upto 3 years
Over 3 Year and
upto 5 years
Over 5 years
Total
Deposits -Current Year 10,000 1,191,410 952,112 2,463,635 2,810,304 2,397,723 4,581,600 1,878,067 5,005,000 – – 21,289,851
Previous Year – 1,403,214 3,085,662 2,782,906 1,686,113 2,374,751 5,630,934 4,391,714 – – – 21,355,294
Advances -Current Year 828,006 4,968,037 5,796,043 13,248,098 2,451,853 1,221,518 3,036,805 2,257,291 5,539,629 368,642 157,933 39,873,855
Previous Year 1,205,086 7,230,516 8,435,601 19,281,375 4,540,296 1,361,937 2,983,318 2,168,235 4,970,685 10,821,46 139,209 53,398,404
Investments - Current Year 26,737,370 389,318 382,740 659,644 411,853 411,830 681,151 1,060,685 489,021 180,762 2,005,550 33,409,924
Previous Year 16,242,806 882,156 437,292 990,368 466,574 525,293 889,199 1,206,121 238,416 198,472 1,334,397 23,411,094
Borrowings -Current Year 264,793 – – – 500,000 – – – – 1,250,000 18,581,300 20,596,093
Previous Year – – – – – 1,000,000 – 2,023,786 10,504 1,250,000 8,250,000 12,534,290
Foreign CurrencyAssets –Current Year – – – 8,822 – 360 – – – – – 9,182
Previous Year – – – 37 – – – – – – – 37
Foreign CurrencyLiabilities –Current Year 17,608 1,379,026 1,692,617 4,243,049 2,872,751 – – 800,497 – 1,250,000 18,581,300 30,836,848
Previous Year 266,456 584,491 1,766,279 4,090,191 7,780,583 2,324,836 – 622,784 – 1,250,000 8,250,000 26,935,620
e) Exposure to real estate(Amount Rs. in ‘000)
Particulars 2019-20 2018-19
a) Direct exposure 94,354 82,727 (i) Residential Mortgages – – –
Lending fully secured by mortgages on residential property that is or will be occupied by the borrower or that is rented
– –
(ii) Commercial Real Estate – 94,354 82,727Lending secured by mortgages on commercial real estate – –Others 94,354 82,727
(iii) Investments in Mortgage Backed Securities (MBS) and other securitized exposures–
– –
a. Residential – – b. Commercial Real Estate – –b) Indirect Exposure – –
Fund based and non-fund based exposures on National Housing Bank (NHB) and Housing Finance Companies (HFCs)
– –
Total Exposure to Real Estate Sector 94,354 82,727
ECO
NOM
IC &
PO
LITI
CAL
WEE
KLY

AMERICAN EXPRESS BANKING CORP.INDIA BRANCH
(INCORPORATED IN THE UNITED STATES OF AMERICA)
Published on Saturday, JUNE 27, 2020 vol lV nos 26 & 27 EPW Economic & Political Weekly326
SCHEDULES FORMING PART OF THE FINANCIAL STATEMENTS FOR THE YEAR ENDED MARCH 31, 2020
Schedule 18 – Signifi cant Accounting Policies and Notes to Financial Statements (Contd.)
f) Exposure to Capital Market(Amount Rs. in ‘000)
Particulars 2019-20 2018-19(i) direct investment in equity shares, convertible bonds, convertible debentures
and units of equity oriented mutual funds the corpus of which is not exclusively invested in corporate debt;
- -
(ii) advances against shares / bonds / debentures or other securities or on clean basis to individuals for investment in shares (including IPOs / ESOPs), convertible bonds, convertible debentures, and units of equity oriented mutual funds;
- -
(iii) advances for any other purposes where shares or convertible bonds or convertible debentures or units of equity oriented mutual funds are taken as primary security;
- -
(iv) advances for any other purposes to the extent secured by the collateral security of shares or convertible bonds or convertible debentures or units of equity oriented mutual funds i.e. where the primary security other than shares / con-vertible bonds / convertible debentures / units of equity oriented mutual funds ` does not fully cover the advances;
- -
(v) secured and unsecured advances to stockbrokers and guarantees issued on behalf of stockbrokers and market makers; 41,646 227,857
(vi) loans sanctioned to corporates against the security of shares / bonds / debentures or other securities or on clean basis for meeting promoter’s contribution to the equity of new companies in anticipation of raising resources;
- -
(vii) bridge loans to companies against expected equity fl ows / issues; - -(viii) underwriting commitments taken up by the banks in respect of primary issue of
shares or convertible bonds or convertible debentures or units of equity oriented mutual funds;
- -
(ix) fi nancing to stockbrokers for margin trading; - -(x) all exposures to Venture Capital Funds (both registered and unregistered) - -Total Exposure to Capital Market 41,646 227,857
g) Provisions and Contingencies: (Amount Rs. in ‘000)
Particulars 2019-20 2018-19Provision for depreciation on Investment - -Provision towards Non Performing Assets (481,375) 450,790Provision towards Standard Assets 465,533 42,412Write-offs 1,999,764 1,943,654Others 29,088 97,905Provision made towards Income tax & Wealth Tax 21,107 -TOTAL 2,034,118 2,534,761
h) Investments (Amount Rs. in ‘000)
Particulars 2019-20 2018-19Gross value of Investments In India 33,409,924 23,411,094 Outside India – –Provision for depreciation In India – – Outside India – –Net value of investments In India 33,409,924 23,411,094 Outside India – –
ECO
NOM
IC &
PO
LITI
CAL
WEE
KLY

AMERICAN EXPRESS BANKING CORP.INDIA BRANCH
(INCORPORATED IN THE UNITED STATES OF AMERICA)
Economic & Political Weekly EPW Published on Saturday, JUNE 27, 2020 vol lV nos 26 & 27 327
SCHEDULES FORMING PART OF THE FINANCIAL STATEMENTS FOR THE YEAR ENDED MARCH 31, 2020
Schedule 18 – Signifi cant Accounting Policies and Notes to Financial Statements (Contd.)
i) Asset Quality - Non-performing assets (‘NPAs’)(Amount Rs. in ‘000)
Particulars 2019-20 2018-19
(i) Net NPAs to Net Advances (%) 0.92% 2.03%
(ii) Movement of NPAs (Gross) (a) Opening balance 1,995,881 848,490 (b) Additions during the year 12,524,459 7,073,750 (c) Reductions during the year 13,719,171 5,926,359 (d) Closing balance 801,169 1,995,881
(iii) Movement of provisions for NPAs(excluding provisions on standard assets) (a) Opening balance 913,808 463,018 (b) Provisions made during the year 7,415,214 3,992,048 (c) Write off / write back of excess provision 7,896,589 3,541,258 (d) Closing balance 432,433 913,808
(iv) Movement of Net NPAs (a) Opening balance 1,082,073 385,472 (b) Additions during the year 5,109,245 3,081,702 (c) Reductions during the year 5,822,582 2,385,101 (d) Closing balance 368,736 1,082,073
j) Category-wise NPAs (funded) (Amount Rs. in ‘000)
Non-performing asset category 2019-20 2018-19
Gross NPAs Provisions Gross NPAs Provisions
Sub standard 729,012 360,276 1,752,587 670,514Doubtful 71,666 71,666 243,223 243,223Loss 491 491 71 71Total 801,169 432,433 1,995,881 913,808
k) Single Borrower Limit (SBL) and Group Borrower Limits (GBL) : During the year, the Bank’s credit exposure to single borrowers and group borrowers were within the limits prescribed by
Reserve Bank of India.
l) Disclosure of complaints: Customer Complaints
Particulars 2019-20 2018-19
1 No. of complaints pending at the beginning of the year 397 4152 No. of complaints received during the year 23,005 22,8363 No. of complaints redressed during the year 23,034 22,8544 No. of complaints pending at the end of the year 368 397
m) Concentration of Deposits, Advances, Exposures and NPAs : Concentration of Deposits
(Amount Rs. in ‘000)S. No. Particulars 2019-20 2018-19
1 Total Deposits of twenty largest depositors 20,851,605 20,924,3462 Percentage of Deposits of twenty largest depositors to Total Deposits of the Bank 97.94% 97.98%
ECO
NOM
IC &
PO
LITI
CAL
WEE
KLY

AMERICAN EXPRESS BANKING CORP.INDIA BRANCH
(INCORPORATED IN THE UNITED STATES OF AMERICA)
Published on Saturday, JUNE 27, 2020 vol lV nos 26 & 27 EPW Economic & Political Weekly328
SCHEDULES FORMING PART OF THE FINANCIAL STATEMENTS FOR THE YEAR ENDED MARCH 31, 2020
Schedule 18 – Signifi cant Accounting Policies and Notes to Financial Statements (Contd.)
Concentration of Advances (Amount Rs. in ‘000)
S. No. Particulars 2019-20 2018-191 Total Advances to twenty largest borrowers 4,472,996 7,939,9762 Percentage of Advances of twenty largest borrowers to Total Advances of the Bank 11.10% 14.62%
Concentration of Exposures (Amount Rs. in ‘000)
S. No. Particulars 2019-20 2018-191 Total Exposure to twenty largest borrowers / customers 8,296,735 13,484,8162 Percentage of Exposures to twenty largest borrowers/ customers to Total
Exposure of the bank on borrowers/ customers3.26% 5.90%
Concentration of NPAs(Amount Rs. in ‘000)
S. No. Particulars 2019-20 2018-191 Total Exposure to top four NPA accounts 33,530 844,482
n) Sector-wise Advances (Amount Rs. in ‘000)S. No. Sector 2019-20 2018-19
Outstand-ing Total Advances
Gross NPAs
Percentage of Gross NPA to Total
Advances
Outstand-ing Total Advances
Gross NPAs
Percentage of Gross NPA to Total
AdvancesA Priority Sector*1 Agriculture and allied activities – – – – – –2 Industry (Micro & small, Medium
and Large)– – – – – –
3 Services – – – – – –4 Personal Loans – – – – – –
Sub Total (A) – – – – – –
B Non Priority Sector1 Agriculture and allied activities – – – – – –2 Industry (Micro & small, Medium
and Large)2,769,184 46,804 1.69% 7,025,265 908,784 12.94%
– Food Processing 478,088 6,838 1.43% 994,524 81,975 8.24%– Chemicals and Chemical Products
(Dyes, Paints, etc.)603,621 5,254 0.87% 994,555 10,052 1.01%
– All Engineering (Electronics & Others) 655,211 11,598 1.77% 1,998,087 65,074 3.26%– Infrastructure 10,404 – 0.00% 773,130 737,599 95.40%– Others 1,021,859 23,114 2.26% 2,264,970 14,084 0.62%
3 Services 8,131,758 51,542 0.63% 16,480,250 187,177 1.14%– Computer Software 1,349,789 17,421 1.29% 3,688,863 34,629 0.94%– Tourism, Hotel and Restaurants 1,453,210 7,306 0.50% 3,972,972 64,071 1.61%– Professional Services 1,249,382 11,132 0.89% 2,590,066 31,153 1.20%– Retail Trade 2,380,491 4,008 0.17% 2,714,683 35,438 1.31%– Others 1,698,887 11,675 0.69% 3,513,666 21,886 0.62%
4 Personal Loans 29,405,497 702,822 2.39% 30,806,697 899,920 2.92%Sub Total (B) 40,306,439 801,169 1.99% 54,312,212 1,995,881 3.67%Totals (A+B) 40,306,439 801,169 1.99% 54,312,212 1,995,881 3.67%
* Not applicable to the Bank vide RBI letter no. RPCD.CO.Plan.11642/04.09.09/2008-09 dated 11/05/2009
ECO
NOM
IC &
PO
LITI
CAL
WEE
KLY

AMERICAN EXPRESS BANKING CORP.INDIA BRANCH
(INCORPORATED IN THE UNITED STATES OF AMERICA)
Economic & Political Weekly EPW Published on Saturday, JUNE 27, 2020 vol lV nos 26 & 27 329
SCHEDULES FORMING PART OF THE FINANCIAL STATEMENTS FOR THE YEAR ENDED MARCH 31, 2020
Schedule 18 – Signifi cant Accounting Policies and Notes to Financial Statements (Contd.)
o) Movement of NPAs (Amount Rs. in ‘000)
Particulars 2019-20 2018-19
Gross NPAs – Opening Balance 1,995,881 848,490
Additions – Fresh NPAs during the year* 12,524,459 7,073,751
Sub-Total [ A ] ( 1 + 2 ) 14,520,340 7,922,240
Less : (i) Upgradations – –(ii) Recoveries 11,544,789 4,261,694(iii) Write-offs 1,802,033 1,664,665(iv) Change in classifi cation due to process enhancement 372,349 –
Sub-Total [ B ] 13,719,171 5,926,359
Gross NPAs – Closing Balance 801,169 1,995,881
*Net of Advances amounting INR 372,349 (‘000) tagged as Standard on account of process enhancement during the year p) Provisioning Coverage Ratio (PCR)
In terms of the RBI guidelines, the Bank’s Provisioning Coverage Ratio as of September 30, 2010 was 82.88%. The provisioning coverage ratio of the Bank with regard to the NPAs as on March 31, 2020 computed as per the RBI guidelines is 65.02% [2018-19: 50.22%].
q) Intra-Group ExposureAs a prudential measure aimed at better risk management and avoiding concentration and contagion of credit and liquidity risk that may arise from Intra Group Exposures, the Reserve Bank of India (RBI) has issued Guidelines on Management of Intra Group Transactions and Exposures (ITEs) vide its Circular No. RBI/2013-14/487 DBOD.No.BP.BC.96/21.06.102/2013-14 dated February 11, 2014. Quantitative disclosures under the above guidelines are provided here.
(Amount Rs. in ‘000)
S. No. Particulars March 31, 2020 March 31, 2019
1 Total amount of intra-group exposures 309,786 598,8142 Total amount of top-20 intra-group exposures 309,786 598,8143 Percentage of intra-group exposures to total exposure of the bank on
borrowers / customers0.12% 0.26%
4 Details of breach of limits on intra-group exposures and regulatory action thereon, if any
None None
r) Transfers to Depositor Education and Awareness Fund (DEAF)As per guidelines issued by RBI in relation to Depositor Education and Awareness Fund Scheme, 2014, banks are required to transfer to a designated fund, the amounts becoming due in each calendar month i.e. proceeds of the inoperative accounts and balances remaining unclaimed for ten years or more as specifi ed in the Scheme and the interest accrued thereon on the last working day of the subsequent month.Below are the details of amount transferred to Depositor Education and Awareness Fund as of March 2020.
(Amount Rs. in ‘000)
Particulars 2019-20 2018-19
Opening balance of amounts transferred to DEAF 19,576 15,161Add : Amounts transferred to DEAF during the year 35,454 7,682Less : Amounts reimbursed by DEAF towards claims 1 3,267Closing balance of amounts transferred to DEAF 55,029 19,576
ECO
NOM
IC &
PO
LITI
CAL
WEE
KLY

AMERICAN EXPRESS BANKING CORP.INDIA BRANCH
(INCORPORATED IN THE UNITED STATES OF AMERICA)
Published on Saturday, JUNE 27, 2020 vol lV nos 26 & 27 EPW Economic & Political Weekly330
SCHEDULES FORMING PART OF THE FINANCIAL STATEMENTS FOR THE YEAR ENDED MARCH 31, 2020
Schedule 18 – Signifi cant Accounting Policies and Notes to Financial Statements (Contd.)
s) Liquidity Coverage RatioAs per ‘Basel III Framework on Liquidity Standards – Liquidity Coverage Ratio (LCR), Liquidity Risk Monitoring Tools and LCR Disclosure Standards’ dated June 9, 2014 (Circular Ref No. RBI/2012-13/635/DBOD.BP.BC.No.120/21.04.098 /2013-14) and subsequent amendments, banks are required to monitor their resilience to potential liquidity disruptions under stress scenarios by ensuring that they have suffi cient high quality liquid assets to survive an acute stress scenario lasting for 30 days and fund their activities with more stable sources of funding on an ongoing basis.Banks are required to maintain High Quality Liquid Assets of a minimum of 100% of its Net Cash Outfl ows by January 1, 2019. However, with a view to provide transition time, the guidelines mandate a minimum requirement of 60% w.e.f. January 1, 2015 and a step up of 10% every year to reach the minimum requirement of 100% by January 1, 2019.
Qualitative DisclosuresLiquidity Risk is defi ned as the inability of the Bank to meet its ongoing fi nancial and business obligations as they become due, at a reasonable cost. The Bank manages its liquidity risk by maintaining access to a diverse set of readily marketable securities, and contingent sources of liquidity to ensure that it can continuously meet its business requirements and fi nancial obligations. The India Country ALCO chaired by the CEO oversees the Bank’s liquidity and funding risk program including adherence to internal funding/liquidity limits as well as regulatory limits and ratios such as CRR, SLR and LCR.General principles and the overall framework for managing liquidity and funding risk are defi ned in the Liquidity and Funding Policy of the Bank duly approved by the Country Executive Committee (CEC).The Bank incurs and accepts liquidity risk through its established business model and through the normal course of offering its products and services. The liquidity risk the Bank is willing to accept is controlled through a liquidity risk tolerance limit which provides for the maintenance of a cushion of high quality, unencumbered liquid assets to be held against identifi ed funding requirements under stress for defi ned liquidity risk survival horizon. In addition, the Bank maintains a contingency funding plan which provides a framework for analyzing and responding to liquidity events that are both market-driven as well as institution-specifi c. Further, the CFP describes the governance and protocol to be put into effect upon the occurrence of a liquidity event and details the roles and responsibilities of Senior Management.The Bank also seeks to diversify its funding sources across capital, institutional deposits, subordinated debt from head offi ce and lines of credit from local banks. Funding from signifi cant counterparties and instruments is monitored regularly as part of its ongoing liquidity management.The Bank has institutionalized a process of measuring, monitoring and reporting of the LCR in line with the Reserve Bank of India’s guidelines on LCR.The Bank has been in compliance with the minimum standard of 70% from 1st January 2016 to 31st December 2016, 80% from 1st January 2017, 90% from 1st January 2018 and 100% from 1st January 2019 onwards.The LCR is calculated by dividing the amount of high-quality liquid unencumbered assets (HQLA) by the estimated net cash outfl ows over a stressed 30 calendar day period.Detailed compositions of elements of the LCR are listed below –
High Quality liquid assets (HQLA)Assets are HQLA if they can be converted into cash at little or no loss of value. The Bank holds stock of Level 1 HQLA in the form of excess CRR balances with RBI and excess Government securities over and above the SLR requirements. Additionally, the Bank also reckons government securities within the mandatory SLR requirement, to the extent allowed by the Reserve Bank under Marginal Standing Facility and Facility to avail Liquidity for LCR as Level 1 HQLA.
Net Cash Outfl owsThe total net cash outfl ows are defi ned as the total expected cash outfl ows minus total expected cash infl ows for the subsequent 30 calendar days. Total expected cash outfl ows, are calculated by multiplying the outstanding balances of various categories or types of liabilities by the rates at which they are expected to run off or be drawn down and total expected cash infl ows are calculated by multiplying the outstanding balances of various categories of receivables by the rates at which they are expected to fl ow in, up to an aggregate cap of 75% of total expected cash outfl ows, in line with RBI guidelines.The major components of cash outfl ow for the Bank are unsecured wholesale funding (lines of credit from Banks and Institutional Deposits), uncommitted, revocable credit facilities extended to customers and other contractual payouts such as merchant payables, membership rewards etc. The key constituents of cash infl ow for the Bank are remittances from card members, balances with banks etc.The daily average LCR for the Bank for the quarter ending March 31, 2020 stood at 128.32 %
ECO
NOM
IC &
PO
LITI
CAL
WEE
KLY

AMERICAN EXPRESS BANKING CORP.INDIA BRANCH
(INCORPORATED IN THE UNITED STATES OF AMERICA)
Economic & Political Weekly EPW Published on Saturday, JUNE 27, 2020 vol lV nos 26 & 27 331
SCHEDULES FORMING PART OF THE FINANCIAL STATEMENTS FOR THE YEAR ENDED MARCH 31, 2020
Schedule 18 – Signifi cant Accounting Policies and Notes to Financial Statements (Contd.)
Quantitative Disclosures (Amount Rs. in ‘000)
Qtr ended 31st March 2020
Qtr ended 31st December 2019
Qtr ended 30th September 2019
Qtr ended 30th June 2019
Quarter ended 31st March 2019
Total Unweighted
Value (average)
Total Weighted
Value (average)
Total Unweighted
Value (average)
Total Weighted
Value (average)
Total Unweighted
Value (average)
Total Weighted
Value (average)
Total Unweighted
Value (average)
Total Weighted
Value (average)
Total Unweighted
Value (average)
Total Weighted
Value (average)
High Quality Liquid Assets 1 Total High Quality Liquid Assets
(HQLA) 27,486,344 26,760,089 25,756,506 24,157,148 21,074,942
Cash Outfl ows 2 Retail deposits and deposits from
small business customers, of which: – – – – – – – – – –
(i) Stable deposits – – – – – – – – – –(ii) Less stable deposits – – – – – – – – – –3 Unsecured wholesale funding, of
which: 6,686,073 3,345,376 8,204,761 4,066,369 7,643,937 3,499,159 9,093,912 4,384,803 6,659,196 3,038,739
(i) Operational deposits (all counterpar-ties)
– – – – – – – – – –
(ii) Non-operational deposits (all coun-terparties)
5,567,828 2,227,131 6,896,613 2,761,238 6,754,141 2,656,222 7,848,516 3,139,406 6,034,095 2,413,638
(iii) Unsecured debt 1,118,245 1,118,245 1,308,148 1,305,131 889,796 842,937 1,245,397 1,245,397 625,101 625,1014 Secured wholesale funding – – – – –5 Additional requirements, of which 789,763 789,763 769,946 770,254 815,400 821,718 839,891 839,891 920,972 920,972(i) Outfl ows related to derivative expo-
sures and other collateral requirements 789,763 789,763 769,946 770,254 815,400 821,718 839,891 839,891 920,972 920,972
(ii) Outfl ows related to loss of funding on debt products
– – – – – – – – – –
(iii) Credit and liquidity facilities – – – – – – – – – –6 Other contractual funding obligations 18,304,221 18,304,221 20,713,961 20,676,719 20,306,998 20,428,811 20,086,562 20,086,565 18,396,489 18,396,4897 Other contingent funding obligations 205,008,211 10,250,410 195,716,671 9,781,528 186,743,567 9,301,052 177,729,501 8,886,475 167,779,992 8,389,0008 Total Cash Outfl ows 32,689,770 35,294,870 34,050,740 34,197,733 30,745,200Cash Infl ows – – – 9 Secured lending (e.g. reverse repos) – – – – – – – – – –10 Infl ows from fully performing
exposures 19,392,169 9,696,085 21,932,643 10,968,451 22,122,181 11,114,437 24,058,459 12,029,229 23,471,932 11,735,966
11 Other cash infl ows 15,033,045 1,573,889 14,599,162 1,963,506 14,664,735 1,499,586 14,974,605 1,656,026 13,325,328 1,427,47912 Total Cash Infl ows 34,425,215 11,269,973 36,531,805 12,931,958 36,786,916 12,614,024 39,033,064 13,685,255 36,797,260 13,163,444 Total Ad-
justed Value Total Ad-
justed Value Total Ad-
justed Value Total Ad-
justed Value Total Ad-
justed Value21 TOTAL HQLA 27,486,344 26,760,089 25,756,506 24,157,148 21,074,94222 Total Net Cash Outfl ows 21,419,797 22,362,912 21,436,716 20,512,478 17,581,75523 Liquidity Coverage Ratio (%) 128.32% 119.66% 120.15% 117.77% 119.87%
* Higher of [25% of Total Cash Outfl ows] or [Total Cash Outfl ows less Total Cash Infl ows] t) Risk Category wise Country Exposure Provision for country risk exposure in terms of RBI Circular DBOD.BP.BC.71/21.04.103/2002-03 dated June 17, 2004 is as follows:
(Amount Rs. in ‘000)Risk Category Exposure (Net) as at
March 31, 2020Provision as at March
31, 2020Exposure (Net) as at
March 31, 2019Provision as at March
31, 2019Insignifi cant 9,174 - 37 -Low - - - -Moderate 12 - - -High - - - -Very High - - - -Restricted - - - -Off-credit - - - -Total 9,186 - 37 -
ECO
NOM
IC &
PO
LITI
CAL
WEE
KLY

AMERICAN EXPRESS BANKING CORP.INDIA BRANCH
(INCORPORATED IN THE UNITED STATES OF AMERICA)
Published on Saturday, JUNE 27, 2020 vol lV nos 26 & 27 EPW Economic & Political Weekly332
SCHEDULES FORMING PART OF THE FINANCIAL STATEMENTS FOR THE YEAR ENDED MARCH 31, 2020
Schedule 18 – Signifi cant Accounting Policies and Notes to Financial Statements (Contd.)
u) Disclosure on Frauds (Amount Rs. in ‘000)Particulars 2019-20 2018-19Number of frauds reported (in numbers) 3,928 7,534Amount Involved 123,102 164,403Amount Written-Off 83,621 115,824Amount Recovered 39,481 48,579Quantum of unamortized provision debited from other reserves – –
v) Unhedged Foreign Currency Exposure:Provision towards unhedged foreign currency exposures as on 31 March 2020 is Rs. 72,466 (‘000) [2018-19: Rs. 147,467 (‘000)] and the capital held by the Bank towards this risk is Rs. 229,758 (‘000) [2018-19: Rs. 469,182 (‘000)] as per RBI master circular DBR.No.BP.BC.2/21.04.048/2015-16 dated 01 July 2015 on prudential norms on income recognition, asset classifi cation and provisioning pertaining to advances.
w) Divergence in the asset classifi cation and provisioningRBI vide its circular RBI/2016-17/283 DBR.BP.BC.No.63/21.04.018/2016-17 dated April 18, 2017 and subsequently vide its circular RBI/2018-19/157 DBR.BP.BC.No.32/21.04.018/2018-19 dated April 01, 2019, has directed that banks shall make suitable disclosures, wherever either (a) the additional provisioning for NPAs assessed by RBI exceeds 10 percent of the reported profi t before provisions and contingencies for the reference period or (b) the additional Gross NPAs identifi ed by RBI exceed 15 percent of the published incremental Gross NPAs for the reference period, or both. For fi nancial year 2017-18, RBI has not assessed any additional provisioning requirement or Gross NPAs for the Bank.
x) Particulars of Accounts Restructured Under CDR Mechanism: NIL Under SME Debt Restructuring Mechanism: NIL Others: (Amount Rs. in ‘000)
2019-20 2018-19Particulars Stan-
dardSub
StandardDoubtful Loss Total Stan-
dardSub
StandardDoubtful Loss Total
Restructured Accounts – Opening Balance
No. of Borrowers – 1 – – 1 – – – – –Amount Outstanding – 737,599 – – 737,599 – – – – –Provision Thereon – 184,400 – – 184,400 – – – – –Fresh restructuring during the year No. of Borrowers – 17 – – 17 – 1 – – 1Amount Outstanding – 42,825 – – 42,825 – 737,599 – – 737,599Provision Thereon – 25,379 – – 25,379 – 184,400 – – 184,400Upgrade to Restructured Standard Category
No. of Borrowers – – – – – – – – – –Amount Outstanding – – – – – – – – – –Provision Thereon – – – – – – – – – –Restructured Standard Advances cease to attract higher provision / risk weight and need to be shown as restructured standard advance
No. of Borrowers – – – – – – – – – –Amount Outstanding – – – – – – – – – –Provision Thereon – – – – – – – – – –Downgrade of restructured accounts No. of Borrowers – – – – – – – – – –Amount Outstanding – – – – – – – – – –Provision Thereon – – – – – – – – – –Write offs/recoveries of restruc-tured accounts
No. of Borrowers – 2 – – 2 – – – – –Amount Outstanding- Write offs – 16,795 – – 16,795 – – – – –Amount Outstanding- Recoveries 760,599 760,599 Provision Thereon – 208,146 – – 208,146 – – – – –Restructured Accounts–Closing Balance No. of Borrowers – 16 – – 16 – 1 – – 1Amount Outstanding – 3,030 – – 3,030 – 737,599 – – 737,599Provision Thereon – 1,633 – – 1,633 – 184,400 – – 184,400
ECO
NOM
IC &
PO
LITI
CAL
WEE
KLY

AMERICAN EXPRESS BANKING CORP.INDIA BRANCH
(INCORPORATED IN THE UNITED STATES OF AMERICA)
Economic & Political Weekly EPW Published on Saturday, JUNE 27, 2020 vol lV nos 26 & 27 333
SCHEDULES FORMING PART OF THE FINANCIAL STATEMENTS FOR THE YEAR ENDED MARCH 31, 2020
Schedule 18 – Signifi cant Accounting Policies and Notes to Financial Statements (Contd.)
y) The Bank has no disclosure to make in respect of the following items as the relevant items are Nil(i) Investments : Repo Transactions
Non-SLR Investment PortfolioNon performing Non-SLR InvestmentsMovement of provisions held towards depreciation in InvestmentsSale and transfers to/from HTM category
(ii) Asset Quality : Details of fi nancial assets sold to Securitisation/Reconstruction Company for Asset ReconstructionDetails of non-performing fi nancial assets purchased/soldUnsecured Advances: Assets for which intangible securities have been taken as collateralInvestment in Securities Receipts
(iii) Awards passed by the Banking Ombudsman(iv) Disclosure relating to securitisation(v) Draw down from Reserves(vi) Penalties imposed by Reserve Bank of India(vii) Discontinuing Operations(viii) Unamortised Pension and Gratuity Liabilities(ix) Resolution of Stressed Assets – Extension of Resolution Timelines
z) The Bank has no disclosure to make in respect of the following items as the relevant items are Not Applicable
(i) Investments : Investments in Associates(ii) Derivatives : Forward Rate Agreements/ Interest Rate Swaps
Exchange Traded Interest Rate DerivativesDisclosure on risk exposure in derivativesCredit Default Swaps
(iii) Letter of Comforts issued by the Bank(iv) Earnings per share(v) Consolidated Financial Statements(vi) Interim Financial Reporting(vii) Overseas Assets, NPAs and Revenue(viii) Off-Balance Sheet SPVs sponsored
2. Commission, exchange and brokerage (net)Commission, exchange and brokerage is netted off with the amount shared with affi liates on overseas Card Member spend on the Bank’s merchant and volume rebates amounting to Rs. 3,193,279 (‘000) [2018-19: Rs. 3,204,800 (‘000)].
3. Deferred TaxesIn accordance with AS-22 on ‘Accounting for Taxes on Income’ issued by Institute of Chartered Accountants of India (ICAI), the Bank recognizes Deferred Tax Assets on timing differences to the extent that there is a virtual certainty supported by convincing evidence that suffi cient future taxable income will be available against which such deferred tax assets can be realized. As of March 31, 2020, in view of lack of virtual certainty supported by convincing evidence that suffi cient taxable income would accrue in the immediate future, as a matter of prudence, the Bank has decided not to recognise Net Deferred Tax Assets as on March 31, 2020.The major composition of Deferred Tax Assets (DTA) and Deferred Tax Liabilities (DTL) is as under:
(Amount in Rs. ‘000)Particulars As at
March 31, 2020As at
March 31, 2019Deferred tax assets:Provision for Bad & Doubtful Debts 665,398 645,612Provision for Employee Benefi ts 190,284 153,860Accumulated Taxable Losses - 53,428Depreciation on fi xed assets 68,774 62,019Deferred Rent & Other reserves 16,314 17,731Deferred tax liabilities NIL NIL
ECO
NOM
IC &
PO
LITI
CAL
WEE
KLY

AMERICAN EXPRESS BANKING CORP.INDIA BRANCH
(INCORPORATED IN THE UNITED STATES OF AMERICA)
Published on Saturday, JUNE 27, 2020 vol lV nos 26 & 27 EPW Economic & Political Weekly334
SCHEDULES FORMING PART OF THE FINANCIAL STATEMENTS FOR THE YEAR ENDED MARCH 31, 2020
Schedule 18 – Signifi cant Accounting Policies and Notes to Financial Statements (Contd.)
4. Segment Reporting The summary of the segmental information of the Bank for the Year ended 31st March, 2020 are given below-
(Amount in Rs. ‘000)Segmentation Banking operations Treasury Total Particulars 2019-20 2018-19 2019-20 2018-19 2019-20 2018-19Segment revenue 19,883,517 17,984,296 1,626,226 1,419,725 21,509,743 19,404,021Unallocated Expenses - -Segment result (257,841) (15,003) 335,250 297,288 77,409 282,285Operating Profi ts /(Loss) 77,409 282,285Income taxes 21,107 -Extraordinary profi t / (loss) - -Net profi t (loss) 56,302 282,285Other information :Segment assets 44,035,923 56,560,266 35,370,341 26,003,814 79,406,264 82,564,080Unallocated assets (Taxes and accumulated losses) 3,072,509 2,932,665Total assets 44,035,923 56,560,266 35,370,341 26,003,814 82,478,773 85,496,745Segment liabilities 29,017,602 41,416,477 35,370,341 26,003,814 64,387,943 67,420,291Unallocated liabilities (Taxes, Capital and Reserve and Surplus) 18,090,830 18,076,454Total liability 29,017,602 41,416,477 35,370,341 26,003,814 82,478,773 85,496,745Cost to acquire fi xed assets 119,415 154,853 119,415 154,853Depreciation 117,283 111,661 117,283 111,661
The Bank does not have any overseas operations and hence there is no geographical segment reporting.5. Related Party Disclosures
In the terms of the Accounting Standard 18 on ‘Related Party Disclosures’ issued by Institute of Chartered Accountants of India as specifi ed under Section 133 of Companies Act, 2013 read with Rule 7 of the Companies (Accounting) Rules, 2014 and the related guideline issued by the RBI, the details pertaining to related parties are as under:
Related Party Relationship:
Sr. No. Relationship Party Name1. Parent - Head Offi ce American Express Banking Corp., New York.2. Ultimate Holding Company American Express Company3. Subsidiaries of Ultimate Holding Company American Express (Malaysia) Sdn. Bhd.
American Express (Thai) Co., Ltd.American Express Australia LtdAmerican Express Business Solutions (India) Private LimitedAmerican Express Company (Mexico) Sa De CVAmerican Express Europe LimitedAmerican Express Global Business TravelAmerican Express India Pvt Ltd.American Express International (NZ), Inc.American Express International (Taiwan), Inc.American Express International, Inc.American Express LimitedAmerican Express Services Europe LimitedAmerican Express Services India Pvt LtdAmerican Express Travel Related Services Company, Inc.Amex Canada Inc.Loyalty Solutions and Research Pvt Ltd
4. Subsidiaries/ Associates/ Joint Ventures -5. Key Management Personnel ** Manoj Adlakha as Chief Executive Offi cer
ECO
NOM
IC &
PO
LITI
CAL
WEE
KLY
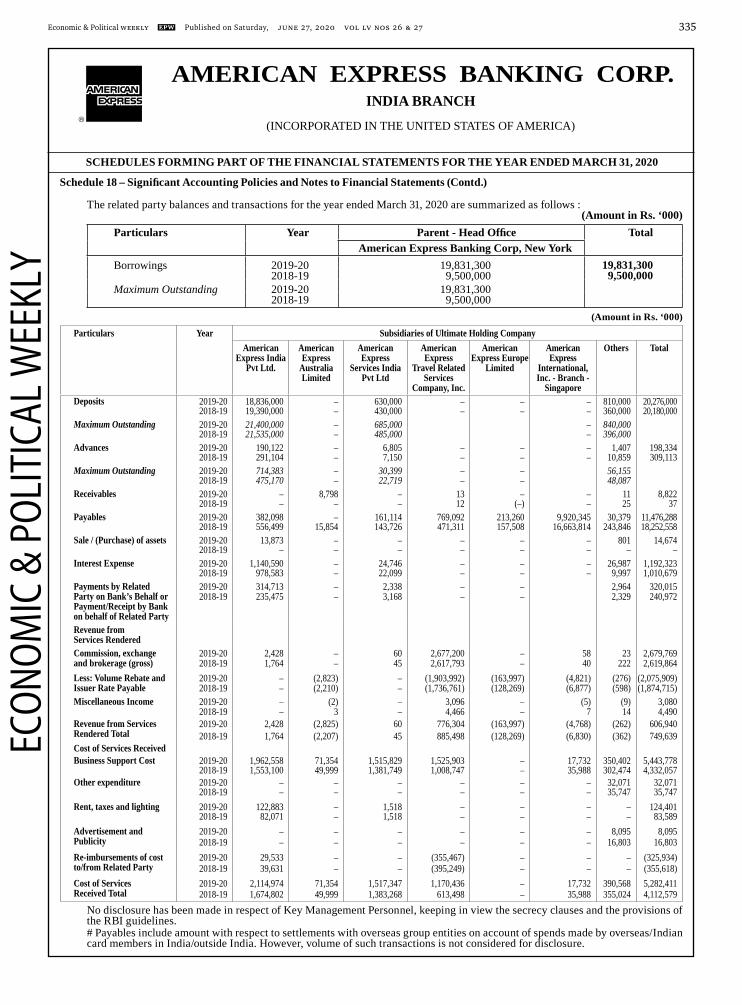
AMERICAN EXPRESS BANKING CORP.INDIA BRANCH
(INCORPORATED IN THE UNITED STATES OF AMERICA)
Economic & Political Weekly EPW Published on Saturday, JUNE 27, 2020 vol lV nos 26 & 27 335
SCHEDULES FORMING PART OF THE FINANCIAL STATEMENTS FOR THE YEAR ENDED MARCH 31, 2020
Schedule 18 – Signifi cant Accounting Policies and Notes to Financial Statements (Contd.)
The related party balances and transactions for the year ended March 31, 2020 are summarized as follows :(Amount in Rs. ‘000)
Particulars Year Parent - Head Offi ce TotalAmerican Express Banking Corp, New York
Borrowings 2019-20 19,831,300 19,831,300 2018-19 9,500,000 9,500,000Maximum Outstanding 2019-20 19,831,300 2018-19 9,500,000
(Amount in Rs. ‘000)Particulars Year Subsidiaries of Ultimate Holding Company
American Express India
Pvt Ltd.
American Express
Australia Limited
American Express
Services India Pvt Ltd
American Express
Travel Related Services
Company, Inc.
American Express Europe
Limited
American Express
International, Inc. - Branch -
Singapore
Others Total
Deposits 2019-20 18,836,000 – 630,000 – – – 810,000 20,276,000 2018-19 19,390,000 – 430,000 – – – 360,000 20,180,000 Maximum Outstanding 2019-20 21,400,000 – 685,000 – 840,000 2018-19 21,535,000 – 485,000 – 396,000 Advances 2019-20 190,122 – 6,805 – – – 1,407 198,334 2018-19 291,104 – 7,150 – – – 10,859 309,113 Maximum Outstanding 2019-20 714,383 – 30,399 – – 56,155 2018-19 475,170 – 22,719 – – 48,087 Receivables 2019-20 – 8,798 – 13 – – 11 8,822 2018-19 – – – 12 (–) – 25 37 Payables 2019-20 382,098 – 161,114 769,092 213,260 9,920,345 30,379 11,476,288 2018-19 556,499 15,854 143,726 471,311 157,508 16,663,814 243,846 18,252,558 Sale / (Purchase) of assets 2019-20 13,873 – – – – – 801 14,674 2018-19 – – – – – – – – Interest Expense 2019-20 1,140,590 – 24,746 – – – 26,987 1,192,323 2018-19 978,583 – 22,099 – – – 9,997 1,010,679 Payments by Related Party on Bank’s Behalf or Payment/Receipt by Bank on behalf of Related Party
2019-202018-19
314,713 235,475
– –
2,338 3,168
– –
– –
2,964 2,329
320,015 240,972
Revenue from Services Rendered
Commission, exchange and brokerage (gross)
2019-202018-19
2,428 1,764
– –
60 45
2,677,200 2,617,793
– –
58 40
23 222
2,679,769 2,619,864
Less: Volume Rebate and Issuer Rate Payable
2019-202018-19
––
(2,823)(2,210)
––
(1,903,992)(1,736,761)
(163,997)(128,269)
(4,821)(6,877)
(276)(598)
(2,075,909)(1,874,715)
Miscellaneous Income
2019-202018-19
– –
(2) 3
– –
3,096 4,466
– –
(5) 7
(9) 14
3,080 4,490
Revenue from Services Rendered Total
2019-20 2,428 (2,825) 60 776,304 (163,997) (4,768) (262) 606,940 2018-19 1,764 (2,207) 45 885,498 (128,269) (6,830) (362) 749,639
Cost of Services Received Business Support Cost 2019-20 1,962,558 71,354 1,515,829 1,525,903 – 17,732 350,402 5,443,778
2018-19 1,553,100 49,999 1,381,749 1,008,747 – 35,988 302,474 4,332,057 Other expenditure 2019-20 – – – – – – 32,071 32,071
2018-19 – – – – – – 35,747 35,747 Rent, taxes and lighting 2019-20 122,883 – 1,518 – – – – 124,401
2018-19 82,071 – 1,518 – – – – 83,589 Advertisement and Publicity
2019-20 – – – – – – 8,095 8,095 2018-19 – – – – – – 16,803 16,803
Re-imbursements of cost to/from Related Party
2019-20 29,533 – – (355,467) – – – (325,934)2018-19 39,631 – – (395,249) – – – (355,618)
Cost of Services Received Total
2019-20 2,114,974 71,354 1,517,347 1,170,436 – 17,732 390,568 5,282,411 2018-19 1,674,802 49,999 1,383,268 613,498 – 35,988 355,024 4,112,579
No disclosure has been made in respect of Key Management Personnel, keeping in view the secrecy clauses and the provisions of the RBI guidelines.# Payables include amount with respect to settlements with overseas group entities on account of spends made by overseas/Indian card members in India/outside India. However, volume of such transactions is not considered for disclosure.
ECO
NOM
IC &
PO
LITI
CAL
WEE
KLY

AMERICAN EXPRESS BANKING CORP.INDIA BRANCH
(INCORPORATED IN THE UNITED STATES OF AMERICA)
Published on Saturday, JUNE 27, 2020 vol lV nos 26 & 27 EPW Economic & Political Weekly336
SCHEDULES FORMING PART OF THE FINANCIAL STATEMENTS FOR THE YEAR ENDED MARCH 31, 2020
Schedule 18 – Signifi cant Accounting Policies and Notes to Financial Statements (Contd.)
6. Other Liabilities include:(Amount in Rs. ‘000)
Particulars 2019-20 2018-19Provisions towards Standard Assets# 826,112 360,578Counter Cyclical Provisioning Buffer 88,500 88,500
#Includes Unhedged Foreign Currency Provision of Rs. 72,466 (‘000) [2018-19: Rs. 147,467 (‘000)]7. Floating Provisions: The Bank has no policy of making fl oating provision.8. Leases
The Bank’s signifi cant leasing arrangements are in respect of operating leases for commercial and residential premises. Lease expenditure for operating leases is recognized on a straight-line basis over the primary period of lease.
(Amount in Rs. ‘000)Particulars 2019-20 2018-19Future minimum lease payments under non-cancellable Operating leasesNot later than 1 year 213,890 175,893Later than 1 year and not later than 5 years 355,176 394,963Later than 5 years 15,298 -Lease payments recognized in the Profi t and Loss Account in respect of operating leases 189,664 147,090
9. Provision, Contingent Liabilities and Contingent Assets Movement in provision for membership reward points:
(Amount in Rs. ‘000)Particulars 2019-20 2018-19Opening 2,719,284 2,113,141Additions 5,050,375 3,975,080Utilisations/Write backs 4,305,935 3,368,937Closing Balance 3,463,724 2,719,284
The bank estimates provision for card reward points by applying historic redemption rates on points eligible for redemption by a card member.
10. Taxes The income tax expenses comprise the following: (Amount in Rs. ‘000)
Particulars 2019-20 2018-19Wealth Tax – –Deferred Income tax (benefi t)/expense – –Total – –
11. Description of contingent liabilities
Contingent Liabilities Brief DescriptionOther items for which the bank is contingently liable*
The Bank is a party to various legal proceedings and direct/indirect tax assessments in the normal course of business. The Bank does not expect the outcome of any of legal proceedings to have a material adverse effect on the Bank’s fi nancial condition, result of operations and cash fl ows. Income tax matters for which appeal is pending having tax impact of Rs. 1,661,464 ('000) [2018-19: Rs. 1,197,150 (‘000)] has been disputed by bank and hence disclosed as contingent liability.The Bank as part of certain service contracts has provided guarantees which amount to Rs. 2,780 (‘000) [2018-19: Rs. 2,780 (‘000)].The amount deposited in Depositor Education and Awareness Fund amounting to Rs. 55,029 (‘000) [2018-19: Rs. 19,576 (‘000)].
* Also refer Schedule 12 – Contingent Liabilities
ECO
NOM
IC &
PO
LITI
CAL
WEE
KLY

AMERICAN EXPRESS BANKING CORP.INDIA BRANCH
(INCORPORATED IN THE UNITED STATES OF AMERICA)
Economic & Political Weekly EPW Published on Saturday, JUNE 27, 2020 vol lV nos 26 & 27 337
SCHEDULES FORMING PART OF THE FINANCIAL STATEMENTS FOR THE YEAR ENDED MARCH 31, 2020
Schedule 18 – Signifi cant Accounting Policies and Notes to Financial Statements (Contd.)
12. Employee Benefi tsThe disclosures required as per the revised AS 15 are as under:Brief description of the PlansThe Bank has various schemes for long-term benefi ts such as provident fund, pension, and gratuity and leave encashment. The Bank’s defi ned contribution plans are provident fund and employees’ pension scheme (under the provisions of the Employees’ Provident Funds and Miscellaneous Provisions Act, 1952), and the Bank has no further obligation beyond making the contributions. The Bank’s defi ned benefi t plans includes pension for deferred/vested pensioner (left employees), gratuity and leave encashment.
(Amount in Rs. ‘000)A Charge to the Profi t and Loss Account based on contributions:
2019-20 2018-19
Provident fund 57,485 49,748Superannuation 845 867TOTAL 58,330 50,615
The Hon’ble Supreme Court of India (“SC”) by their order dated February 28, 2019, in the case of Surya Roshani Limited & others v/s EPFO, set out the principles based on which allowances paid to the employees should be identifi ed for inclusion in basic wages for the purposes of computation of Provident Fund contribution. In light of the same, with effect from 1st March 2019, the PF contribution by the Bank has been changed to a fl at amount of Rs. 1800/- per month for all colleagues whose monthly basic wage is less than Rs. 15,000/-.Subsequently, a review petition against this decision has been fi led and is pending before the SC for disposal. Pending decision on the subject review petition and directions from the EPFO, further impact, if any, is not ascertainable and consequently no effect have been given in the accounts.
(Amount in Rs. ‘000)B Contribution towards Pension for deferred / vested pensioners (left employees) :
The above employee benefi t is covered under Pension Trust and as detailed under Paragraph III 9 (b) of Schedule 18 above.Pension: The components of net benefi t expenses recognized in the Profi t and Loss Account and Balance Sheet and the funded status for the pension benefi t plan are summarised below :
As at March 31, 2020 As at March 31, 2019I Assumptions
Mortality Rate (in deferment) LIC (1996-98) Ultimate LIC (1996-98) UltimateMortality Rate (Post retirement) LIC (1996-98) Ultimate LIC (1996-98) Ultimate
Discount Rate 6.50% 7.30% Rate of increase in compensation Not Applicable Not Applicable
Rate of return(expected) on plan assets 7.50% 7.50%As at March 31, 2020 As at March 31, 2019
II Changes in present value of obligationsDefi ned Benefi t Obligation at beginning of the Year 37,957 37,026Interest Cost 2,593 2,699Current Service Cost - -Actuarial Losses/(Gains) 3,731 320Benefi t Payments (4,884) (2,088)
Defi ned Benefi t Obligation at end of the Year 39,397 37,957III Changes in fair value of plan assets
Fair Value of Plan Assets at beginning of the Year 62,798 63,027Expected return on plan assets 4,544 4,650Actuarial Gain / (Loss) (2,295) (2,838)
Benefi t Payments (4,415) (2,041)Fair Value of Plan Assets at end of the Year 60,632 62,798
IV Amounts to be recognised in the Balance Sheet Defi ned Benefi t Obligation at the end of the Year 39,397 37,957 Fair Value of Plan Assets at the end of the Year 60,632 62,798 Amount not recognised as an Asset - - Surplus Assets 21,235 24,841V Expense Recognised - -
The Pension Fund assets are invested in government securities, corporate bonds and other eligible investments.
ECO
NOM
IC &
PO
LITI
CAL
WEE
KLY

AMERICAN EXPRESS BANKING CORP.INDIA BRANCH
(INCORPORATED IN THE UNITED STATES OF AMERICA)
Published on Saturday, JUNE 27, 2020 vol lV nos 26 & 27 EPW Economic & Political Weekly338
SCHEDULES FORMING PART OF THE FINANCIAL STATEMENTS FOR THE YEAR ENDED MARCH 31, 2020
Schedule 18 – Signifi cant Accounting Policies and Notes to Financial Statements (Contd.)
As at March 31, 2020 As at March 31, 2019
Percentage
Government of India securities (Central and State) 51.13 49.46High quality corporate Bonds (Including Public Sector Bonds) – –Equity shares – –Cash (Including Special Deposits) 47.92 49.88Others 0.95 0.66Total 100 100
(Amount in Rs. ‘000)
Experience AdjustmentsAs at March
31, 2020As at March
31, 2019As at March
31, 2018As at March
31, 2017As at March
31, 2016Defi ned Benefi t Obligation at end of the period (39,397) (37,957) (37,026) (41,096) (35,522)Plan Asset as at the end of the period 60,632 62,798 63,027 68,346 72,666Funded Status 21,235 24,841 26,001 27,250 37,144Experience Gain/(Loss) adjustments on plan liabilities (71) (104) (2,854) (7,433) (584)Experience Gain/(Loss) adjustments on plan assets (2,295) (2,838) (1,407) (2,053) (2,150)Actuarial Gain/(Loss) due to change on assumptions (3,660) (216) 748 (3,098) –
(Amount in Rs. ‘000)
C Contribution towards Gratuity:The above employee benefi t is covered under a Gratuity Trust and as detailed under Paragraph III 9 (c) of Schedule 18 above.
Gratuity : The components of net benefi t expenses recognized in the Profi t and Loss Account and Balance Sheet and the funded status for gratuity benefi t plan are summarised below:
As at March 31, 2020 As at March 31, 2019I Assumptions
Mortality Indian Assured Lives Mortality (2006-08)
(modifi ed) Ult.
Indian Assured Lives Mortality (2006-08)
(modifi ed) Ult. Discount Rate 6.50% 7.30% Rate of increase in compensation 9.00% 9.00% Rate of return (expected) on plan assets 7.50% 7.50% Withdrawal rates Up to age 30 - 27%
age 31-40 - 18% age 41-50 - 7%
age 51 and above - 8%
Up to age 30 - 27%age 31-40 - 18% age 41-50 - 7%
age 51 and above - 8%
II Changes in present value of obligations DBO at beginning of the Year 174,029 146,177 Interest Cost 12,170 10,612 Current Service Cost 18,531 16,138
Benefi ts Paid (14,623) (15,421) Actuarial Losses/(Gains) on obligation 14,379 10,472
Liabilities extinguished on settlements - - Liability released due to employee transfer
Plan Amendment CostAcquisitions CostDBO at end of the Year
-1,7542,521
208,761
--
6,051174,029
ECO
NOM
IC &
PO
LITI
CAL
WEE
KLY

AMERICAN EXPRESS BANKING CORP.INDIA BRANCH
(INCORPORATED IN THE UNITED STATES OF AMERICA)
Economic & Political Weekly EPW Published on Saturday, JUNE 27, 2020 vol lV nos 26 & 27 339
SCHEDULES FORMING PART OF THE FINANCIAL STATEMENTS FOR THE YEAR ENDED MARCH 31, 2020
Schedule 18 – Signifi cant Accounting Policies and Notes to Financial Statements (Contd.)
III Changes in fair value of plan assets Fair Value of Plan Assets at beginning of the Year 23,263 37,711 Expected Return of Plan Assets 1,196 2,250 Contributions - - Benefi ts paid (14,623) (15,421)
Assets distributed in settlements - - Actuarial gain / (loss) on plan assets (618) (1,277) Fair Value of Plan Assets at end of the Year 9,218 23,263IV Amounts to be recognised in the Balance Sheet Present Value of DBO at the end of the Year 208,761 174,029 Fair Value of Plan Assets at end of the Year 9,218 23,263 Funded/(Unfunded) Status (199,543) (150,766) Unrecognised Past Service Costs - - Net Asset /(Liability) recognised in the Balance Sheet (199,543) (150,766)V Expense Recognised Current Service Cost 18,531 16,138 Interest Cost 12,170 10,612 Expected Return on Plan Assets (1,196) (2,250) Net Actuarial (Gain) /Loss recognised for the Year 14,997 11,749
Past Service Cost 1,754 - Expense recognised in the P&L A/c 46,256 36,249
The estimate of future salary increases, considered in actuarial valuation take account of infl ation, seniority, promotion and other relevant factors such as supply and demand in employee market.The Gratuity Fund assets are invested in government securities, corporate bonds and other eligible investments.Major categories of Plan assets as a percentage of total plan assets.
As at March 31, 2020 As at March 31, 2019 PercentageGovernment of India securities (Central and State) – – High quality corporate Bonds (Including Public Sector Bonds) – – Equity shares – – Cash (Including Special Deposits) 100.00 100.00 Others – –Total 100.00 100.00
(Amount in Rs. ‘000)Experience Adjustments As at March
31, 2020As at March
31, 2019As at March
31, 2018As at March
31, 2017As at March
31, 2016
Defi ned Benefi t Obligation at end of the period
(208,761) (174,029) (146,177) (148,301) (125,572)
Plan Asset as at the end of the period 9,218 23,263 37,711 46,870 53,878Funded Status (199,543) (150,766) (108,466) (101,431) (71,694)Experience Gain/(Loss) adjustments on plan liabilities
(1,719) (7,998) (844) 267 (2,601)
Experience Gain/(Loss) adjustments on plan assets
(618) (1,277) (1,097) (1,673) (464)
Actuarial Gain/(Loss) due to change on assumptions
(12,660) (2,474) 18,429 (7,891) –
D Leave Encashment/Compensated AbsencesThe amount charged/(released) to Profi t and Loss Account during the year towards Leave Encashment and compensated absences Rs.45,708 (‘000) (Previous year Rs. (4,504) (‘000))The liability for leave encashment and compensated absences as on March 31, 2020 is Rs. 135,221 (‘000) (Previous Year Rs. 104,122 (‘000)).
ECO
NOM
IC &
PO
LITI
CAL
WEE
KLY

AMERICAN EXPRESS BANKING CORP.INDIA BRANCH
(INCORPORATED IN THE UNITED STATES OF AMERICA)
Published on Saturday, JUNE 27, 2020 vol lV nos 26 & 27 EPW Economic & Political Weekly340
SCHEDULES FORMING PART OF THE FINANCIAL STATEMENTS FOR THE YEAR ENDED MARCH 31, 2020
Schedule 18 – Signifi cant Accounting Policies and Notes to Financial Statements (Contd.)
13. Disclosure under Micro, Small and Medium Enterprises Development Act, 2006:To the extent of the information received by the Bank from its vendors, the below are the transactions with suppliers as defi ned under the Micro, Small and Medium Enterprises Development Act, 2006 during the fi nancial year.
(Amount in Rs. ‘000)
Particulars 2019-20 2018-191 Principal amount due remaining unpaid – –2 Interest amount due thereon and remaining unpaid – –3 Amount of interest paid in terms of Section 18 of the MSMED Act 2006 405 4214 Interest due and payable (under the MSMED Act 2006) which have not
been paid (covering all payments) 811 405
5 The amount of interest accrued and remaining unpaid at the end of the accounting year (i.e. including amount brought forward from previous year) 811 405
6 Details on payments made in respect of outstanding as at Sl. No. 1 above. – –14. Details of fees / remuneration received in respect of Bancassurance business: (Amount in Rs. ‘000)
Particulars 2019-20 2018-19Others - Income from Insurance Corporate Agency Business – For selling life insurance products 14,727 1,941– For selling non-life insurance products 122,122 103,346
15. Disclosures on Remuneration :Qualitative DisclosuresBeing a Branch of a Foreign Bank, the Bank does not have any Remuneration Committee for approval of the Managerial Remuneration. The Bank’s compensation structure is in conformity with the principles and practices set out by the Financial Stability Board (FSB). Further, the Bank’s has obtained the RBI’s approval for the Chief Executive Offi cer’s (CEO) remuneration.Quantitative DisclosuresThe quantitative disclosures cover the Bank’s CEO and Key Risk Takers. The Bank’s Key Risk Takers include the CEO, Head of Business Units and select roles in Treasury and Risk. (Amount in Rs. ‘000)
No. Particulars 2019-20 2018-191 (i) Number of employees having received a variable remuneration award
during the fi nancial year. 5 4(ii) Total amount of outstanding deferred remuneration, split into cash,
shares and share-linked instruments and other forms. – –(iii) Total amount of deferred remuneration paid out in the fi nancial year – –
2 Breakdown of amount of remuneration awards for the fi nancial year to show fi xed and variable, deferred and non-deferred.Fixed 50,282 49,589Variable 41,555 39,815Deferred – –Non-deferred 41,555 39,815
3 (i) Total amount of outstanding deferred remuneration and retained remuneration exposed to ex post explicit and / or implicit adjustments. – –
(ii) Total amount of reductions during the fi nancial year due to ex- post explicit adjustments. – –
(iii) Total amount of reductions during the fi nancial year due to ex- post implicit adjustments. – –
4 Retirals (PF, Gratuity, SA) 3,356 3,282Variable pay included above is on cash basis i.e. the year in which the same is paid out.Compensation for CEO is as approved by the RBI and paid by the Bank to the CEO. Compensation for other risk takers is as approved by the Bank.Charges for ESOPs, issued by the ultimate parent company to the key risk takers, has not been considered for the disclosure purpose as there is no charge to Profi t and Loss Account of the Bank.
ECO
NOM
IC &
PO
LITI
CAL
WEE
KLY

AMERICAN EXPRESS BANKING CORP.INDIA BRANCH
(INCORPORATED IN THE UNITED STATES OF AMERICA)
Economic & Political Weekly EPW Published on Saturday, JUNE 27, 2020 vol lV nos 26 & 27 341
SCHEDULES FORMING PART OF THE FINANCIAL STATEMENTS FOR THE YEAR ENDED MARCH 31, 2020
Schedule 18 – Signifi cant Accounting Policies and Notes to Financial Statements (Contd.)
16. Disclosure on Corporate Social Responsibility (CSR)The Bank believes that serving our communities is not only integral to running a business successfully; it is part of our individual responsibilities as corporate citizen.
The CSR committee was formed in accordance with the Bank’s CSR policy to comply with the provisions of the Section 135 of the Companies Act, 2013. During the year, the Bank has contributed an amount of Rs. 18,633 (‘000).
(Amount in Rs. ‘000)
S.no. Particulars 2019-20 2018-19
A. Gross amount required to be spent by the Bank during the year
18,633 13,105
B. Amount spent during the year: In Cash Yet to Paid in Cash
Total In Cash Yet to Paid in Cash
Total
(i) Construction/acquisition of any asset - - - - - -(ii) On purposes other than (i) above 18,633 - 18,633 13,105 - 13,105
17. Auditors’ Remuneration [excluding goods & service tax] (Amount in Rs. ‘000)
Particulars 2019-20 2018-19As Auditors:– Statutory Audit 3,850 3,500– Tax Audit 425 390– Certifi cates 925 400– Out of Pocket Expenses 995 939Total 6,195 5,229
18. Transfer PricingThe Bank has a comprehensive system of maintenance of information and documents required by transfer pricing legislation under section 92-92F of the Income Tax Act, 1961. The management is of the opinion that international transactions are at arm’s length so that the above legislation will not have material impact on the fi nancial statements, particularly on the amount of tax expense and that of provision of taxes.
19. Implementation of Indian Accounting Standards (IND AS)In January 2016, the Ministry of Corporate Affairs issued the roadmap for implementation of new Indian Accounting Standards (IND AS) for scheduled commercial banks, insurance companies and non-banking fi nancial companies (NBFCs). The RBI has also issued a circular DBR.BP.BC.No.76/21.07.001/2015-16 dated February 11th, 2016 advising that the Banks in India are required to implement IND AS from April 1, 2018. Subsequently, RBI in its press release issued on 5th April 2018 and vide notifi cation RBI/2018-2019/146 DBR.BP.BC.No.29/21.07.001/2018-19 dated March 22, 2019 has deferred the applicability of IND AS for Scheduled Commercial Banks.
Based on RBI directions, the Bank has formed a Steering Committee to oversee IND AS implementation. The bank submitted proforma IND AS fi nancial statements to the RBI for the half-year ended September 30, 2016 and quarter ended June 30, 2017. Further, as per email notifi cation dated July 20th, 2018, the Bank is also submitting proforma IND AS fi nancials to RBI on quarterly basis effective quarter ended June 2018.
20. Impact of novel Coronavirus (COVID-19) PandemicThe novel coronavirus (COVID-19) pandemic continues to spread rapidly across the globe including India. On March 11, 2020, the COVID-19 outbreak was declared a global pandemic by the World Health Organization. COVID-19 has taken its toll on not
ECO
NOM
IC &
PO
LITI
CAL
WEE
KLY

AMERICAN EXPRESS BANKING CORP.INDIA BRANCH
(INCORPORATED IN THE UNITED STATES OF AMERICA)
Published on Saturday, JUNE 27, 2020 vol lV nos 26 & 27 EPW Economic & Political Weekly342
just human life, but business and fi nancial markets too, the extent of which is currently unascertainable. Various governments, civil society and many organisations, including the Bank, have introduced a variety of measures to contain the spread of the virus to protect lives and livelihood. The extent to which COVID-19 pandemic will impact the Bank’s operations and fi nancial results is dependent on the future developments, which are highly uncertain, including among many the other things, any new information concerning the severity of the pandemic and any action to contain its spread or mitigate its impact whether government mandated or elected by the Bank. The Bank holds provisions amounting INR 583,036 (‘000) as at March 31, 2020 against the potential impact of COVID-19 based on the information available at this point in time. The provisions held by the bank are in excess of the RBI prescribed norms.
In reference to RBI circular RBI/2019-20/186 DOR.No.BP.BC.47/21.04.048/2019-20 dated March 27, 2020 and RBI/2019-20/220 DOR.No.BP.BC.63/21.04.048/2019-20 dated April 17, 2020 on ‘COVID-19 Regulatory Package’, the Bank has granted moratorium for credit card dues falling due between March 01, 2020 and May 31, 2020. Below are the details of accounts which were granted moratorium till May 31, 2020 and were in overdue status as on February 29, 2020:
(Amount in Rs. ’000)
Days Past Overdue Amount Outstanding as at March 31, 2020
Provision as at March 31, 2020
Provision Adjusted against Slippages
01 - 30 Days 53,181 2,659 -
31 - 60 Days 22,365 1,118 -
61 - 90 Days - - -
21. Comparative fi guresPrevious year fi gures have been reclassifi ed and regrouped wherever considered necessary to conform to current year’s presentation.
Signature to Schedules 1 to 18
For Khimji Kunverji & Co. LLP For and on behalf of(formerly Khimji Kunverji & Co – FRN: 105146W/ W100621) American Express Banking Corp.- India Branch Chartered Accountants Gautam V. Shah Manoj Adlakha Partner Chief Executive Offi cer Membership No. F-117348UDIN: 20117348AAAAAK6268 Vivek Sehgal Financial Controller Place: Mumbai Place: Gurugram Date: June 26, 2020 Date: June 26, 2020
SCHEDULES FORMING PART OF THE FINANCIAL STATEMENTS FOR THE YEAR ENDED MARCH 31, 2020
Schedule 18 – Signifi cant Accounting Policies and Notes to Financial Statements (Contd.)
ECO
NOM
IC &
PO
LITI
CAL
WEE
KLY

AMERICAN EXPRESS BANKING CORP.INDIA BRANCH
(INCORPORATED IN THE UNITED STATES OF AMERICA)
Basel – Pillar III disclosures March 2020
Economic & Political Weekly EPW Published on Saturday, JUNE 27, 2020 vol lV nos 26 & 27 343
1. Scope of Application The Basel Pillar III disclosures contained herein relate to American Express Banking Corp. – India Branch, herein after referred to as “the Bank” for the period ended March 31, 2020. American Express Banking Corp. (AEBC) is organized under the New York State Banking Law and incorporated in the United States of America. AEBC is a wholly owned subsidiary of American Express Company and conducts business through a branch office in India. In India, AEBC holds a banking license issued by the Reserve Bank of India (RBI) and is subject to the provisions of the Banking Regulation Act. The Bank’s operations are confined to three business areas viz. card operations, distribution of travellers’ cheques and acceptance of institutional deposits.The disclosures have been compiled in accordance with Reserve Bank of India’s Master Circular DBR.No.BP.BC. 1/21.06.201/2015-16 dated July 1, 2015 on Basel III Capital Regulations and the amendments thereto issued from time to time. The Bank does not have any subsidiaries, nor does it hold any significant stake in any companies. Further, the Bank is not required to prepare consolidated financial statements. No quantitative disclosures are required to be made, as the Bank has no subsidiaries. The Bank also does not have any interest in insurance entities.2. Capital AdequacyThe primary objective of capital management at the Bank is to maintain a consistently strong and flexible capital position and to ensure that the Bank’s capital is of sufficient quality and quantity to meet at a minimum, all regulatory requirements and maintain adequate capital over and above regulatory minimums to act as a safety net for the variety of risks the Bank is exposed to, in its ordinary course of business. The Bank has established a comprehensive internal capital adequacy assessment process (“ICAAP”) which enables the Bank to set internal capital targets and strategies for achieving those internal targets that are consistent with its business plans, risk profile, and operating environment. This framework facilitates the assessment of the overall capital adequacy of the Bank in relation to its risk profile which includes all material risks faced by the Bank which are not captured by the regulatory minimums prescribed by the regulator. The framework is aimed at ensuring that the Bank’s capital is adequate to address current and future risk and achieve strategic objectives. Key components of the Bank’s ICAAP include: Board and senior management oversight; sound capital assessment and planning; comprehensive assessment of risks, sensitivity and scenario analysis, monitoring and reporting The Board of Directors is responsible for ultimate oversight of capital management and as such, oversees the annual review and approval of the Bank’s ICAAP, Internal Capital Targets, Capital Plan and ICAAP and Capital Management Policy.The Bank has implemented a Board approved Stress Testing Framework which forms an integral part of the Bank’s ICAAP. Stress Testing involves the use of various techniques (such as macroeconomic stress testing and event driven scenario / single factor stress tests) to assess the Bank’s potential vulnerability (profitability and capital impacts) to extreme conditions. Stress tests are conducted on a periodic basis and the stress test results are reported to the India Country Asset Liability Management Committee (ALCO), India Risk Management Committee, Board and other governance committees of the Bank. The Bank periodically assesses and refines its stress tests in an effort to ensure that the stress scenarios capture material risks as well as reflect possible changes in the macro economic conditions. The stress tests are used in conjunction with the Banks business plans for the purpose of capital planning in the ICAAP.Quantitative Disclosure:
(Amount Rs.’000)Particulars As at March 31, 2020
RWA* Min. Cap. Req.**
Credit Risk– Portfolio subject to Standardised Approach 56,647,108 6,160,373Market Risk– Interest Rate Risk 1,472,677 160,154– Foreign Exchange Risk 1,687,500 183,516Operational Risk – Basic Indicator Approach 27,772,736 3,020,285Total 87,580,022 9,524,327
* RWA = Risk Weighted Assets. ** Min. Cap. Req. = Minimum Capital Requirement (including capital conservation buffer) at 10.875% of RWA.
Capital Adequacy Ratio As at March 31, 2020
Common Equity Tier I Ratio 17.56%Tier I Ratio 17.56%Total Capital Ratio 40.44%
3. Credit Risk - General DisclosuresCredit Risk is defined as the risk of loss to the Bank due to non-payment of amounts that are contractually owed to the Bank. The Bank’s Management and the Board of Directors continuously monitor credit risk to ensure that prudent lending criteria are established and complied with to minimize the Bank’s exposure to credit risk. The AEBC Credit Policy Committee (CPC) is responsible for assisting the Bank in carrying out its credit risk management functions and reports to the Board. It has oversight responsibilities for the Bank’s credit risk and for ensuring compliance with all pertinent policies and regulatory requirements. The Bank’s lending is only in relation to card issuance business and loans to staff.
ECO
NOM
IC &
PO
LITI
CAL
WEE
KLY

AMERICAN EXPRESS BANKING CORP.INDIA BRANCH
(INCORPORATED IN THE UNITED STATES OF AMERICA)
Basel – Pillar III disclosures March 2020
Published on Saturday, JUNE 27, 2020 vol lV nos 26 & 27 EPW Economic & Political Weekly344
It is the policy of the Bank to:• Extend Credit only on a safe, sound and collectible basis.• Extend Credit in an economically sound fashion. • Extend Credit only in compliance with applicable law and regulations and the policies of the Bank and in full consideration of applicable
regulatory guidance.• Document credit decisions.• Adopt and use best-in-class risk management tools and practices. • Require its vendors, including its affiliates, to act in accordance with the policies of the Bank when conducting business on the Bank’s behalf.
The Bank has established policies and procedures to control and manage the credit risk. These policies and procedures, in particular:• Establish the governance structure through which credit risk will be identified, assessed, controlled, monitored and reported.• Details the credit products and services that the Bank may offer.• Specifies certain key metrics to be used in managing credit risk.• Establishes the conditions under which exceptions to credit policy may occur.
Management can never eliminate the Bank’s credit risk. However, consistent application of the above practices will result in the credit risk being controlled to an acceptable level. Therefore, Management and the Board of Directors continuously monitor credit risk to ensure that prudent lending criterion are established and complied with so as to minimize the Bank’s exposure to credit risk.The Bank follows the RBI guidelines for asset classification. Accordingly, card receivables are treated as non-performing, if any amount is overdue for a period of more than 90 days.The Bank also identifies all card accounts with delinquencies and writes off in the books of accounts, the outstanding card receivables which are 210 days past billing. In addition, accelerated write off is effected where it is evident that the outstanding is unlikely to be recovered.Provision for Non-Performing Assets, Standard Assets and Unhedged Foreign Currency Exposure are made in compliance with the prudential norms prescribed by Reserve Bank of India. In the case of sub-standard assets, in addition to minimum provision requirement prescribed by RBI, the bank makes additional provision based on best estimate of probable losses. Accounts classified as doubtful/loss are provided at 100% till written off. Restructured assets are classified and provided for in accordance with the guidelines issued by RBI from time to time. The Bank holds provisions as at 31st March 2020 against the potential impact of COVID-19 based on the information available at this point in time. The provisions held by the Bank are in excess of the RBI prescribed norms.Quantitative Disclosure:(a) Total credit exposure by industry and geographic distribution of exposure (Amount Rs.’000)
As at March 31, 2020Fund Based Non-fund Based Total
Domestic Investments - - -Advances: - - -Mining and Quarrying 256,085 - 256,085Coal 17,417 - 17,417Others 238,668 - 238,668Food Processing 648,912 - 648,912Sugar 4,696 - 4,696Edible Oils and Vanaspati 17,043 - 17,043Tea 12,458 - 12,458Coffee 20,000 - 20,000Others 594,715 - 594,715Beverages (excluding Tea & Coffee) and Tobacco 172,108 - 172,108Tobacco and tobacco products 16,890 - 16,890Others 155,218 - 155,218Textiles 638,788 - 638,788Cotton 187,043 - 187,043Jute 7,418 - 7,418Man-made 3,300 - 3,300Others 441,027 - 441,027Leather and Leather products 124,239 - 124,239Leather and Leather products 124,239 - 124,239Wood and Wood Products 39,709 - 39,709Wood and Wood Products 39,709 - 39,709Paper and Paper Products 69,520 - 69,520Paper and Paper Products 69,520 - 69,520Petroleum (non-infra), Coal Products (non-mining) and Nuclear Fuels 49,764 - 49,764Petroleum (non-infra), Coal Products (non-mining) and Nuclear Fuels 49,764 - 49,764
ECO
NOM
IC &
PO
LITI
CAL
WEE
KLY
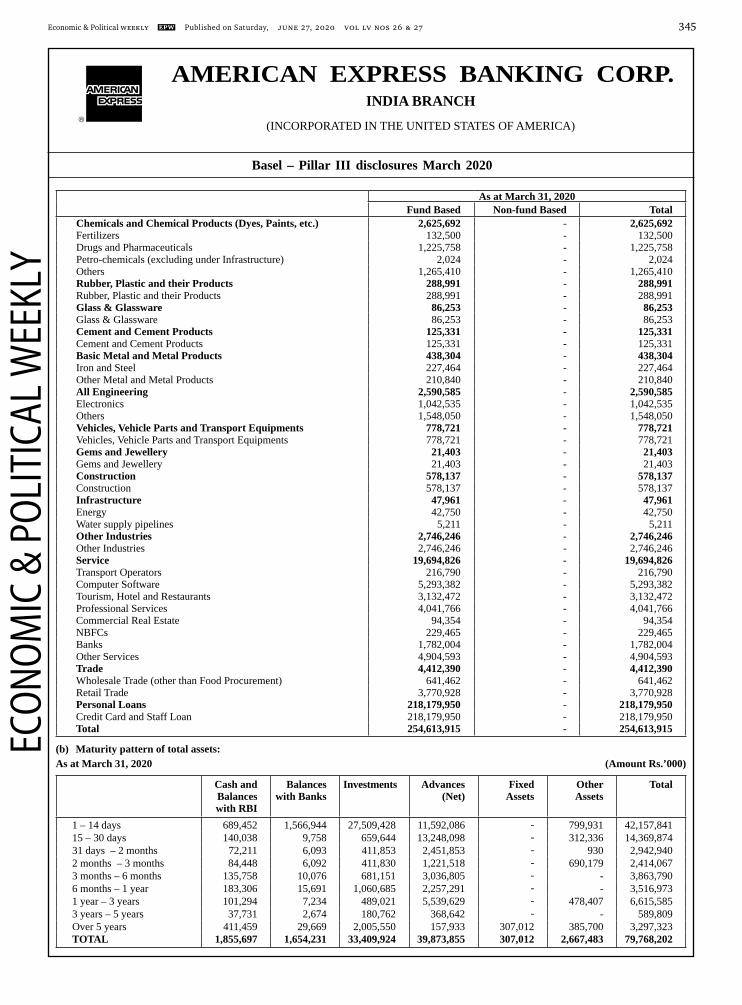
AMERICAN EXPRESS BANKING CORP.INDIA BRANCH
(INCORPORATED IN THE UNITED STATES OF AMERICA)
Basel – Pillar III disclosures March 2020
Economic & Political Weekly EPW Published on Saturday, JUNE 27, 2020 vol lV nos 26 & 27 345
As at March 31, 2020Fund Based Non-fund Based Total
Chemicals and Chemical Products (Dyes, Paints, etc.) 2,625,692 - 2,625,692Fertilizers 132,500 - 132,500Drugs and Pharmaceuticals 1,225,758 - 1,225,758Petro-chemicals (excluding under Infrastructure) 2,024 - 2,024Others 1,265,410 - 1,265,410Rubber, Plastic and their Products 288,991 - 288,991Rubber, Plastic and their Products 288,991 - 288,991Glass & Glassware 86,253 - 86,253Glass & Glassware 86,253 - 86,253Cement and Cement Products 125,331 - 125,331Cement and Cement Products 125,331 - 125,331Basic Metal and Metal Products 438,304 - 438,304Iron and Steel 227,464 - 227,464Other Metal and Metal Products 210,840 - 210,840All Engineering 2,590,585 - 2,590,585Electronics 1,042,535 - 1,042,535Others 1,548,050 - 1,548,050Vehicles, Vehicle Parts and Transport Equipments 778,721 - 778,721Vehicles, Vehicle Parts and Transport Equipments 778,721 - 778,721Gems and Jewellery 21,403 - 21,403Gems and Jewellery 21,403 - 21,403Construction 578,137 - 578,137Construction 578,137 - 578,137Infrastructure 47,961 - 47,961Energy 42,750 - 42,750Water supply pipelines 5,211 - 5,211Other Industries 2,746,246 - 2,746,246Other Industries 2,746,246 - 2,746,246Service 19,694,826 - 19,694,826Transport Operators 216,790 - 216,790Computer Software 5,293,382 - 5,293,382Tourism, Hotel and Restaurants 3,132,472 - 3,132,472Professional Services 4,041,766 - 4,041,766Commercial Real Estate 94,354 - 94,354NBFCs 229,465 - 229,465Banks 1,782,004 - 1,782,004Other Services 4,904,593 - 4,904,593Trade 4,412,390 - 4,412,390Wholesale Trade (other than Food Procurement) 641,462 - 641,462Retail Trade 3,770,928 - 3,770,928Personal Loans 218,179,950 - 218,179,950Credit Card and Staff Loan 218,179,950 - 218,179,950Total 254,613,915 - 254,613,915
(b) Maturity pattern of total assets:As at March 31, 2020 (Amount Rs.’000)
Cash and Balances with RBI
Balances with Banks
Investments Advances (Net)
Fixed Assets
Other Assets
Total
1 – 14 days 689,452 1,566,944 27,509,428 11,592,086 - 799,931 42,157,84115 – 30 days 140,038 9,758 659,644 13,248,098 - 312,336 14,369,87431 days – 2 months 72,211 6,093 411,853 2,451,853 - 930 2,942,9402 months – 3 months 84,448 6,092 411,830 1,221,518 - 690,179 2,414,0673 months – 6 months 135,758 10,076 681,151 3,036,805 - - 3,863,7906 months – 1 year 183,306 15,691 1,060,685 2,257,291 - - 3,516,9731 year – 3 years 101,294 7,234 489,021 5,539,629 - 478,407 6,615,5853 years – 5 years 37,731 2,674 180,762 368,642 - - 589,809Over 5 years 411,459 29,669 2,005,550 157,933 307,012 385,700 3,297,323TOTAL 1,855,697 1,654,231 33,409,924 39,873,855 307,012 2,667,483 79,768,202
ECO
NOM
IC &
PO
LITI
CAL
WEE
KLY

AMERICAN EXPRESS BANKING CORP.INDIA BRANCH
(INCORPORATED IN THE UNITED STATES OF AMERICA)
Basel – Pillar III disclosures March 2020
Published on Saturday, JUNE 27, 2020 vol lV nos 26 & 27 EPW Economic & Political Weekly346
(c) Amount of NPAs (Gross) - Total (Amount in Rs. ‘000)Non-performing asset category As at
March 31, 2020Sub standard 729,012Doubtful 71,666Loss 491
Total 801,169
(d) Net NPAs (Amount in Rs. ‘000)Net Non-performing asset category As at
March 31, 2020Sub-Standard 368,736Doubtful -Loss -
Total 368,736
(e) NPA Ratios (Amount in Rs. ‘000)Particulars As at
March 31, 2020Gross NPA as a ratio to gross advances 1.99%Net NPAs to net advances 0.92%
(f) Movement of NPAs Gross (Amount Rs. ‘000)
Particulars For the year ended
March 31, 2020Opening Balance (As at April 1, 2019) 1,995,881Additions during the period 12,524,459Reductions during the period 13,719,171Closing Balance (As at March 31, 2020) 801,169
(g) Movement of Provisions for NPAs (Amount Rs. ‘000)
Particulars For the year ended
March 31, 2020Opening balance (As at April 1, 2019) 913,808Provisions made during the period 7,415,214Reductions made during the period due to write-off, upgradation and recoveries 7,896,589Any other Adjustments, including transfer between provisions -Write-back of excess provisions -Closing balance (As at March 31, 2020) 432,433
(h) Details of write offs and recoveries booked directly to the Income Statement (Amount Rs. ‘000)
Particulars For the year ended
March 31, 2020 Write offs 1,999,764 Recoveries 877,704
(i) Movement of Provisions for Standard Assets* (Amount Rs. ‘000)
Particulars For the year ended
March 31, 2020 Opening balance (As at April 1, 2019) 360,578 Provisions made during the period 465,534 Write-back of excess provisions - Closing balance (As at March 31, 2020) 826,112
* includes provision created for Unhedged Foreign Currency Exposure and Willful Defaulters
ECO
NOM
IC &
PO
LITI
CAL
WEE
KLY

AMERICAN EXPRESS BANKING CORP.INDIA BRANCH
(INCORPORATED IN THE UNITED STATES OF AMERICA)
Basel – Pillar III disclosures March 2020
Economic & Political Weekly EPW Published on Saturday, JUNE 27, 2020 vol lV nos 26 & 27 347
(j) Amount of Non-Performing Investments: NIL(k) Amount of Provision held for Non-Performing Investments: NIL(l) Movement of Provision held for depreciation on Investments: NIL(m) Geographic and industry wise distribution of Gross NPA, Provision for NPA, NPA Write-offs and Provision for Standard Assets As at March 31, 2020 (Amount Rs. ‘000)
Particulars Gross NPA Provision towards NPA
NPA Write offs Provision forStandard Assets*
Mining and Quarrying 82 42 25 1,490Coal - - - 209Others 82 42 25 1,280Food Processing 6,837 3,473 82,577 5,710Sugar - - - 4Edible Oils and Vanaspati - - - 15Tea 6,825 3,467 - 82Coffee - - - 1Others 12 6 82,577 5,608Beverages (excluding Tea & Coffee) and Tobacco 163 83 237 957Tobacco and tobacco products - - - -Others 163 83 237 957Textiles 534 271 3,439 1,427Cotton 35 18 - 391Jute 335 170 - 37Man-made - - - -Others 164 83 3,439 1,000Leather and Leather products 21 11 1,500 280Leather and Leather products 21 11 1,500 280Wood and Wood Products - - 18 132Wood and Wood Products - - 18 132Paper and Paper Products 7 7 2,246 142Paper and Paper Products 7 7 2,246 142Petroleum (non-infra), Coal Products (non-mining) and Nuclear Fuels
5 3 - 57
Petroleum (non-infra), Coal Products (non-mining) and Nuclear Fuels
5 3 - 57
Chemicals and Chemical Products (Dyes, Paints, etc.)
5,254 2,890 6,248 7,100
Fertilizers - - - 382Drugs and Pharmaceuticals 5,025 2,772 3,476 2,404Petro-chemicals (excluding under Infrastructure) - - - 11Others 229 118 2,772 4,303Rubber, Plastic and their Products 490 249 7 475Rubber, Plastic and their Products 490 249 7 475Glass & Glassware 7,944 7,812 15,400 293Glass & Glassware 7,944 7,812 15,400 293Cement and Cement Products 2 1 - 9Cement and Cement Products 2 1 - 9BasicMetal and Metal Products - - 9,117 1,155Iron and Steel - - 9,086 575Other Metal and Metal Products - - 31 579All Engineering 11,599 6,443 317,927 14,387Electronics 5,550 3,114 10,610 9,976Others 6,049 3,329 307,317 4,411Vehicles, Vehicle Parts and Transport Equipments
828 429 162 1,793
Vehicles, Vehicle Parts and Transport Equipments 828 429 162 1,793Gems and Jewellery - - - 32Gems and Jewellery - - - 32Construction 12,407 6,302 692 2,590Construction 12,407 6,302 692 2,590Infrastructure - - 18,450 125Energy - - 18,450 90Water supply pipelines - - - 35Other Industries 632 319 157 1,967Other Industries 632 319 157 1,967
ECO
NOM
IC &
PO
LITI
CAL
WEE
KLY

AMERICAN EXPRESS BANKING CORP.INDIA BRANCH
(INCORPORATED IN THE UNITED STATES OF AMERICA)
Basel – Pillar III disclosures March 2020
Published on Saturday, JUNE 27, 2020 vol lV nos 26 & 27 EPW Economic & Political Weekly348
Particulars Gross NPA Provision towards NPA
NPA Write offs Provision forStandard Assets*
Services 46,450 25,311 173,150 68,786Transport Operators 142 72 482 864Computer Software 17,421 9,557 18,383 16,158Tourism, Hotel and Restaurants 7,305 4,006 115,921 17,367Professional Services 11,132 6,065 12,886 14,965Commercial Real Estate - - 1 1,199NBFCs - - 4 1,327Banks 2,012 1,022 - 587Other Services 8,438 4,589 25,473 16,319Trade 5,092 2,587 61,691 16,749Wholesale Trade(other than Food procurement) 1,084 551 58,332 2,633Retail Trade 4,008 2,036 3,359 14,117Personal Loans 702,822 376,200 1,108,990 117,418Personal Loans 702,822 376,200 1,108,990 117,418Total 801,169 432,433 1,802,033 243,076
* includes provision created for Unhedged Foreign Currency Exposure and Willful Defaulters4. Credit Risk: Disclosures for Portfolios Subject to Standardised Approach. The Bank lending business is confined to card lending through its card issuance business and loans to staff. In view of this limited lending activity, the Bank does not use any rating assigned by the eligible external credit rating agencies for measuring credit risk. The card receivables under consumer portfolio are covered under the Specified Category attracting risk weight of 125%, card receivables under corporate portfolio are covered under the Claims on Corporates, AFCs and NBFC-IFCs Category attracting risk weight of 150% and loans to staff attract risk weight of 20% as per the RBI guidelines. All interbank balances with scheduled banks have been reckoned at 20% as per the RBI guidelines, as the counterparty banks have capital adequacy ratio of 9% and above.Quantitative Disclosure:Amount of bank’s outstanding, by risk weight are as follows:
(Amount in Rs. ‘000)
Risk Weight Applied* As at March 31, 2020
Below 100 % risk weight 37,316,820100 % risk weight 2,946,170More than 100 % risk weight 38,955,343Deducted (in computation of Net Owned Funds) -
* Net of provisions and collaterals5. Credit Risk Mitigation: Disclosures for Standardised ApproachThe Bank’s advances arise from its card operations and there are normally no collaterals for these lending. However, in few cases, to mitigate credit risk, the Bank uses Bank Guarantees and Institutional deposits from customers as collaterals.Quantitative Disclosure:
(Amount in Rs. ‘000)
Particulars As at March 31, 2020
Exposure covered by Bank Guarantees 944,641Exposure covered primarily by Institutional Deposits 2,252,690
6. Securitization : Disclosure for Standardized ApproachThe Bank does not have any securitization exposure.
7. Market Risk in Trading Book Market Risk is defined as the risk to earnings or risk to the value of assets or liabilities resulting from changes in market risk factors such as interest and foreign exchange rates.The Bank does not engage in any trading but maintains a portfolio of high quality liquid assets in the form of investments which are limited to GOI Treasury Bills to meet the Statutory Liquidity Ratio (SLR) and Liquidity Coverage Ratio (LCR) requirements. These investments are held under the Available for Sale (AFS) category and do not carry any credit risk. Foreign exchange risk in the banking book is limited and is generated on account of foreign currency denominated exposures in the balance sheet.The general market risk capital charge towards interest rate risk and foreign exchange risk is provided as per the extant RBI guidelines, using the Standardized Duration Approach. The market risk management architecture is similar to interest rate risk and has been outlined in subsequent sections.
ECO
NOM
IC &
PO
LITI
CAL
WEE
KLY
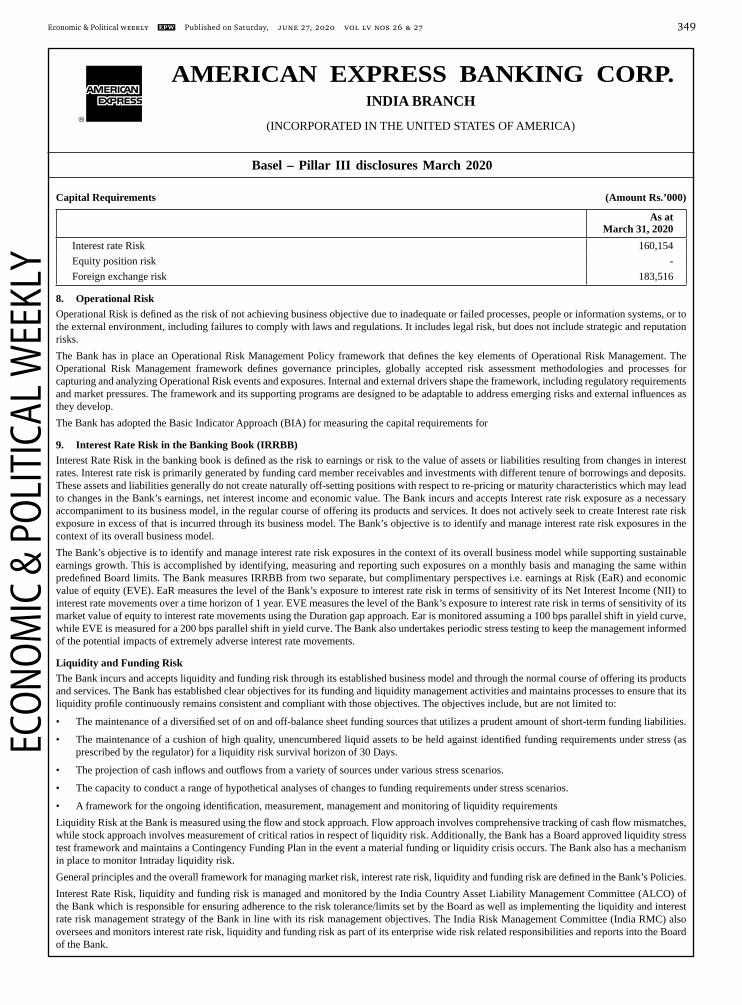
AMERICAN EXPRESS BANKING CORP.INDIA BRANCH
(INCORPORATED IN THE UNITED STATES OF AMERICA)
Basel – Pillar III disclosures March 2020
Economic & Political Weekly EPW Published on Saturday, JUNE 27, 2020 vol lV nos 26 & 27 349
Capital Requirements (Amount Rs.’000)
As at March 31, 2020
Interest rate Risk 160,154Equity position risk -Foreign exchange risk 183,516
8. Operational Risk Operational Risk is defined as the risk of not achieving business objective due to inadequate or failed processes, people or information systems, or to the external environment, including failures to comply with laws and regulations. It includes legal risk, but does not include strategic and reputation risks.The Bank has in place an Operational Risk Management Policy framework that defines the key elements of Operational Risk Management. The Operational Risk Management framework defines governance principles, globally accepted risk assessment methodologies and processes for capturing and analyzing Operational Risk events and exposures. Internal and external drivers shape the framework, including regulatory requirements and market pressures. The framework and its supporting programs are designed to be adaptable to address emerging risks and external influences as they develop.The Bank has adopted the Basic Indicator Approach (BIA) for measuring the capital requirements for
9. Interest Rate Risk in the Banking Book (IRRBB)Interest Rate Risk in the banking book is defined as the risk to earnings or risk to the value of assets or liabilities resulting from changes in interest rates. Interest rate risk is primarily generated by funding card member receivables and investments with different tenure of borrowings and deposits. These assets and liabilities generally do not create naturally off-setting positions with respect to re-pricing or maturity characteristics which may lead to changes in the Bank’s earnings, net interest income and economic value. The Bank incurs and accepts Interest rate risk exposure as a necessary accompaniment to its business model, in the regular course of offering its products and services. It does not actively seek to create Interest rate risk exposure in excess of that is incurred through its business model. The Bank’s objective is to identify and manage interest rate risk exposures in the context of its overall business model.The Bank’s objective is to identify and manage interest rate risk exposures in the context of its overall business model while supporting sustainable earnings growth. This is accomplished by identifying, measuring and reporting such exposures on a monthly basis and managing the same within predefined Board limits. The Bank measures IRRBB from two separate, but complimentary perspectives i.e. earnings at Risk (EaR) and economic value of equity (EVE). EaR measures the level of the Bank’s exposure to interest rate risk in terms of sensitivity of its Net Interest Income (NII) to interest rate movements over a time horizon of 1 year. EVE measures the level of the Bank’s exposure to interest rate risk in terms of sensitivity of its market value of equity to interest rate movements using the Duration gap approach. Ear is monitored assuming a 100 bps parallel shift in yield curve, while EVE is measured for a 200 bps parallel shift in yield curve. The Bank also undertakes periodic stress testing to keep the management informed of the potential impacts of extremely adverse interest rate movements.
Liquidity and Funding RiskThe Bank incurs and accepts liquidity and funding risk through its established business model and through the normal course of offering its products and services. The Bank has established clear objectives for its funding and liquidity management activities and maintains processes to ensure that its liquidity profile continuously remains consistent and compliant with those objectives. The objectives include, but are not limited to:
• The maintenance of a diversified set of on and off-balance sheet funding sources that utilizes a prudent amount of short-term funding liabilities.
• The maintenance of a cushion of high quality, unencumbered liquid assets to be held against identified funding requirements under stress (as prescribed by the regulator) for a liquidity risk survival horizon of 30 Days.
• The projection of cash inflows and outflows from a variety of sources under various stress scenarios.
• The capacity to conduct a range of hypothetical analyses of changes to funding requirements under stress scenarios.
• A framework for the ongoing identification, measurement, management and monitoring of liquidity requirementsLiquidity Risk at the Bank is measured using the flow and stock approach. Flow approach involves comprehensive tracking of cash flow mismatches, while stock approach involves measurement of critical ratios in respect of liquidity risk. Additionally, the Bank has a Board approved liquidity stress test framework and maintains a Contingency Funding Plan in the event a material funding or liquidity crisis occurs. The Bank also has a mechanism in place to monitor Intraday liquidity risk.General principles and the overall framework for managing market risk, interest rate risk, liquidity and funding risk are defined in the Bank’s Policies. Interest Rate Risk, liquidity and funding risk is managed and monitored by the India Country Asset Liability Management Committee (ALCO) of the Bank which is responsible for ensuring adherence to the risk tolerance/limits set by the Board as well as implementing the liquidity and interest rate risk management strategy of the Bank in line with its risk management objectives. The India Risk Management Committee (India RMC) also oversees and monitors interest rate risk, liquidity and funding risk as part of its enterprise wide risk related responsibilities and reports into the Board of the Bank.
ECO
NOM
IC &
PO
LITI
CAL
WEE
KLY

AMERICAN EXPRESS BANKING CORP.INDIA BRANCH
(INCORPORATED IN THE UNITED STATES OF AMERICA)
Basel – Pillar III disclosures March 2020
Published on Saturday, JUNE 27, 2020 vol lV nos 26 & 27 EPW Economic & Political Weekly350
Quantitative Disclosure Impact on earnings and economic value of capital:As at March 31, 2020 (Amount Rs.’000)
Impact of increase in interestrates by 100 bps
Impact of decrease in interest rates by 100 bps
Earnings perspective 79,951 (79,951)
Impact of increase in interest rates by 200 bps
Impact of decrease in interest rates by 200 bps
Economic value perspective (486,746) 486,746
10. General Disclosure for Exposures Related to Counterparty Credit Risk: Not Applicable
11. Composition of Capital (Amount Rs.’000)
Composition of Capital As atMarch 31, 2020
Ref No.
Common Equity Tier 1 capital: instruments and reserves 1 Directly issued qualifying common share capital plus related stock surplus (share premium)/
Head office funds17,603,299 a
2 Retained earnings / Reserves & Surplus 487,057 b3 Accumulated other comprehensive income (and other reserves) (2,710,571) e4 Directly issued capital subject to phase out from CET1 (only applicable to non-joint stock
companies)–
Public sector capital injections grandfathered until January 1, 2018 5 Common share capital issued by subsidiaries and held by third parties (amount allowed in group
CET1)–
6 Common Equity Tier 1 capital before regulatory adjustments 15,379,785Common Equity Tier 1 capital: regulatory adjustments 7 Prudential valuation adjustments – 8 Goodwill (net of related tax liability) – 9 Intangibles other than mortgage-servicing rights (net of related tax liability) – 10 Deferred tax assets – 11 Cash-flow hedge reserve – 12 Shortfall of provisions to expected losses – 13 Securitisation gain on sale – 14 Gains and losses due to changes in own credit risk on fair valued liabilities –15 Defined-benefit pension fund net assets – 16 Investments in own shares (if not already netted off paid-in capital on reported balance sheet) – 17 Reciprocal cross-holdings in common equity – 18 Investments in the capital of banking, financial and insurance entities that are outside the scope of
regulatory consolidation, net of eligible short positions, where the bank does not own more than 10% of the issued share capital (amount above 10% threshold)
–
19 Significant investments in the common stock of banking, financial and insurance entities that are outside the scope of regulatory consolidation, net of eligible short positions (amount above 10% threshold)
–
20 Mortgage servicing rights (amount above 10% threshold) – 21 Deferred tax assets arising from temporary differences (amount above 10% threshold,
net of related tax liability)–
22 Amount exceeding the 15% threshold – 23 of which: significant investments in the common stock of financial entities – 24 of which: mortgage servicing rights – 25 of which: deferred tax assets arising from temporary differences –
ECO
NOM
IC &
PO
LITI
CAL
WEE
KLY

AMERICAN EXPRESS BANKING CORP.INDIA BRANCH
(INCORPORATED IN THE UNITED STATES OF AMERICA)
Basel – Pillar III disclosures March 2020
Economic & Political Weekly EPW Published on Saturday, JUNE 27, 2020 vol lV nos 26 & 27 351
Composition of Capital As atMarch 31, 2020
Ref No.
26 National specific regulatory adjustments (26a+26b+26c+26d) – 26a of which: Investments in the equity capital of the unconsolidated insurance subsidiaries – 26b of which: Investments in the equity capital of unconsolidated non-financial subsidiaries – 26c of which: Shortfall in the equity capital of majority owned financial entities which have not been
consolidated with the bank–
26d of which: Unamortized pension funds expenditures – Regulatory Adjustments Applied to Common Equity Tier 1 in respect of Amounts Subject to
Pre-Basel III Treatment–
of which: [INSERT TYPE OF ADJUSTMENT] – For example: filtering out of unrealized losses on AFS debt securities
(not relevant in Indian context)–
27 Regulatory adjustments applied to Common Equity Tier 1 due to insufficient Additional Tier 1 and Tier 2 to cover deductions
–
28 Total regulatory adjustments to Common equity Tier1 – 29 Common Equity Tier 1 capital (CET1) 15,379,785Additional Tier 1 Capital: Instruments 30 Directly issued qualifying Additional Tier 1 instruments plus related stock surplus (31+32) – 31 of which: classified as equity under applicable accounting standards (Perpetual Non-Cumulative
Preference Shares)–
32 of which: classified as liabilities under applicable accounting standards (Perpetual debt Instruments)
–
33 Directly issued capital instruments subject to phase out from Additional Tier 1 – 34 Additional Tier 1 instruments (and CET1 instruments not included in row 5) issued by
subsidiaries and held by third parties (amount allowed in group AT1)–
35 of which: instruments – 36 Additional Tier 1 capital before regulatory adjustments – Additional Tier 1 capital: regulatory adjustments 37 Investments in own Additional Tier 1 instruments – 38 Reciprocal cross-holdings in Additional Tier 1 instruments – 39 Investments in the capital of banking, financial and insurance entities that are outside the scope
of regulatory consolidation, net of eligible short positions, where the bank does not own more than 10% of the issued common share capital of the entity (amount above 10% threshold)
–
40 Significant investments in the capital of banking, financial and insurance entities that are outside the scope of regulatory consolidation (net of eligible short positions)
–
41 National specific regulatory adjustments (41a+41b) – 41a Investments in the Additional Tier 1 capital of unconsolidated insurance subsidiaries – 41b Shortfall in the Additional Tier 1 capital of majority owned financial entities which have not
been consolidated with the bank–
42 Regulatory adjustments applied to Additional Tier 1 due to insufficient Tier 2 to cover deductions – 43 Total regulatory adjustments to Additional Tier 1 capital – 44 Additional Tier 1 capital (AT1) – 44a Additional Tier 1 capital reckoned for capital adequacy – 45 Tier 1 capital (T1 = CET1 + AT1) (29 + 44a) 15,379,785Tier 2 capital: instruments and provisions 46 Directly issued qualifying Tier 2 instruments plus related stock surplus – Sub-ordinated debt 19,331,300 c47 Directly issued capital instruments subject to phase out from Tier 2 – 48 Tier 2 instruments (and CET1 and AT1 instruments not included in rows 5 or 34) issued by
subsidiaries and held by third parties (amount allowed in group Tier 2)–
49 of which: instruments issued by subsidiaries subject to phase out – 50 Provisions: 708,563
ECO
NOM
IC &
PO
LITI
CAL
WEE
KLY

AMERICAN EXPRESS BANKING CORP.INDIA BRANCH
(INCORPORATED IN THE UNITED STATES OF AMERICA)
Basel – Pillar III disclosures March 2020
Published on Saturday, JUNE 27, 2020 vol lV nos 26 & 27 EPW Economic & Political Weekly352
Composition of Capital As atMarch 31, 2020
Ref No.
General Provisions 708,089 dInvestment Fluctuation Reserve 474 b
51 Tier 2 capital before regulatory adjustments 20,039,863 Tier 2 capital: regulatory adjustments 52 Investments in own Tier 2 instruments – 53 Reciprocal cross-holdings in Tier 2 instruments – 54 Investments in the capital of banking, financial and insurance entities that are outside the scope
of regulatory consolidation, net of eligible short positions, where the bank does not own more than 10% of the issued common share capital of the entity (amount above the 10% threshold)
–
55 Significant investments in the capital banking, financial and insurance entities that are outside the scope of regulatory consolidation (net of eligible short positions)
–
56 National specific regulatory adjustments (56a+56b) – 56a of which: Investments in the Tier 2 capital of unconsolidated subsidiaries – 56b of which: Shortfall in the Tier 2 capital of majority owned financial entities which have not been
consolidated with the bank–
Regulatory Adjustments Applied To Tier 2 in respect of Amounts Subject to Pre-Basel III Treatment
–
57 Total regulatory adjustments to Tier 2 capital – 58 Tier 2 capital (T2) 20,039,863 59 Total capital (TC = T1 + T2) (45 + 58c) 35,419,648 Risk Weighted Assets in respect of Amounts Subject to Pre-Basel III Treatment 60 Total risk weighted assets (60a + 60b + 60c) 87,580,021 60a of which: total credit risk weighted assets 56,647,108 60b of which: total market risk weighted assets 3,160,177 60c of which: total operational risk weighted assets 27,772,736 Capital ratios61 Common Equity Tier 1 (as a percentage of risk weighted assets) 17.56% 62 Tier 1 (as a percentage of risk weighted assets) 17.56% 63 Total capital (as a percentage of risk weighted assets) 40.44% 64 Institution specific buffer requirement (minimum CET1 requirement plus capital conservation
and countercyclical buffer requirements, expressed as a percentage of risk weighted assets)7.38%
65 of which: capital conservation buffer requirement 1.88% 66 of which: bank specific countercyclical buffer requirement – 67 of which: G-SIB buffer requirement – 68 Common Equity Tier 1 available to meet buffers (as a percentage of risk weighted assets) 12.06% National minima (if different from Basel III) 69 National Common Equity Tier 1 minimum ratio (if different from Basel III minimum) 5.50% 70 National Tier 1 minimum ratio (if different from Basel III minimum) 7.00% 71 National total capital minimum ratio (if different from Basel III minimum) 9.00% Amounts below the thresholds for deduction (before risk weighting) 72 Non-significant investments in the capital of other financial entities – 73 Significant investments in the common stock of financial entities – 74 Mortgage servicing rights (net of related tax liability) – 75 Deferred tax assets arising from temporary differences (net of related tax liability) – Applicable caps on the inclusion of provisions in Tier 276 Provisions eligible for inclusion in Tier 2 in respect of exposures subject to standardized
approach (prior to application of cap)914,612
77 Cap on inclusion of provisions in Tier 2 under standardized approach 708,089
ECO
NOM
IC &
PO
LITI
CAL
WEE
KLY

AMERICAN EXPRESS BANKING CORP.INDIA BRANCH
(INCORPORATED IN THE UNITED STATES OF AMERICA)
Basel – Pillar III disclosures March 2020
Economic & Political Weekly EPW Published on Saturday, JUNE 27, 2020 vol lV nos 26 & 27 353
Composition of Capital As atMarch 31, 2020
Ref No.
78 Provisions eligible for inclusion in Tier 2 in respect of exposures subject to internal ratings-based approach (prior to application of cap)
–
79 Cap for inclusion of provisions in Tier 2 under internal ratings-based approach – Capital instruments subject to phase-out arrangements (only applicable between March 31, 2018 and March 31, 2022)
80 Current cap on CET1 instruments subject to phase out arrangements – 81 Amount excluded from CET1 due to cap (excess over cap after redemptions and maturities) – 82 Current cap on AT1 instruments subject to phase out arrangements – 83 Amount excluded from AT1 due to cap (excess over cap after redemptions and maturities) – 84 Current cap on T2 instruments subject to phase out arrangements – 85 Amount excluded from T2 due to cap (excess over cap after redemptions and maturities) –
Notes to Template(Amount Rs.’000)
Row No. of the template Particular As at March 31, 2020
10 Deferred tax assets associated with accumulated losses –Deferred tax assets (excluding those associated with accumulated losses) net of Deferred tax liability –Total as indicated in row 10 –
19 If investments in insurance subsidiaries are not deducted fully from capital and instead considered under 10% threshold for deduction, the resultant increase in the capital of bank –of which: Increase in Common Equity Tier 1 capital –of which: Increase in Additional Tier 1 capital –of which: Increase in Tier 2 capital –If investments in the equity capital of unconsolidated non-financial subsidiaries are not deducted and hence, risk weighted then:
26b (i) Increase in Common Equity Tier 1 capital(ii) Increase in risk weighted assets
44aExcess Additional Tier 1 capital not reckoned for capital adequacy (difference between Additional Tier 1 capital as reported in row 44 and admissible Additional Tier 1 capital as reported in 44a) –of which: Excess Additional Tier 1 capital which is considered as Tier 2 capital under row 58b –
50 Eligible Provisions included in Tier 2 capital 708,089Eligible Investment Fluctuation Reserves included in Tier 2 capital 474Eligible Revaluation Reserves included in Tier 2 capital –Total of row 50 708,563
12. Composition of Capital – Reconciliation requirements:Step - I (Amount in ‘000)
Balance sheet as in financial statements
Balance sheet under regulatory scope of
consolidation
As on March 31, 2020
As on March 31, 2020
A Capital & LiabilitiesI Paid-up Capital 17,603,299 17,603,299
Reserves & Surplus 487,531 487,531Minority Interest – –Total Capital & Reserves 18,090,830 18,090,830
ECO
NOM
IC &
PO
LITI
CAL
WEE
KLY

AMERICAN EXPRESS BANKING CORP.INDIA BRANCH
(INCORPORATED IN THE UNITED STATES OF AMERICA)
Basel – Pillar III disclosures March 2020
Published on Saturday, JUNE 27, 2020 vol lV nos 26 & 27 EPW Economic & Political Weekly354
Balance sheet as in financial statements
Balance sheet under regulatory scope of
consolidation
As on March 31, 2020
As on March 31, 2020
II Deposits 21,289,851 21,289,851of which: Deposits from banks – –of which: Customer deposits 21,289,851 21,289,851of which: Other deposits (pl. specify) – –
III Borrowings 20,596,093 20,596,093of which: From RBI – –of which: From banks 764,793 764,793of which: From other institutions & agencies – –of which: Others (pl. specify) – –of which: Capital instruments 19,831,300 19,831,300
IV Other liabilities & provisions 22,501,999 22,501,999 Total 82,478,773 82,478,773B AssetsI Cash and balances with Reserve Bank of India 1,855,697 1,855,697
Balance with banks and money at call and short notice 1,654,231 1,654,231II Investments: 33,409,924 33,409,924
of which: Government securities 33,409,924 33,409,924of which: Other approved securities – –of which: Shares – –of which: Debentures & Bonds – –of which: Subsidiaries / Joint Ventures / Associates – –of which: Others (Commercial Papers, Mutual Funds etc.) – –
III Loans and advances 39,873,855 39,873,855of which: Loans and advances to banks 49,603 49,603of which: Loans and advances to customers 39,824,252 39,824,252
IV Fixed assets 307,012 307,012V Other assets 2,667,483 2,667,483
of which: Goodwill and intangible assets – –of which: Deferred tax assets – –
VI Goodwill on consolidation – –VII Debit balance in Profit & Loss account 2,710,571 2,710,571 Total Assets 82,478,773 82,478,773
Step - II (Amount in ‘000)
Balance sheet as in financial statements
Balance sheet under regulatory scope of
consolidation
Ref
As on March 31, 2020
As on March 31, 2020
A Capital & Liabilities I Paid-up Capital 17,603,299 17,603,299 a
of which: Amount eligible for CET1 17,603,299 17,603,299of which: Amount eligible for AT1 – –Reserves & Surplus 487,531 487,531 bof which: Statutory Reserve 487,057 487,057of which: Investment Fluctuation Reserve 474 474Minority Interest – –Total Capital 18,090,830 18,090,830
(Amount in Rs. ‘000)
ECO
NOM
IC &
PO
LITI
CAL
WEE
KLY

AMERICAN EXPRESS BANKING CORP.INDIA BRANCH
(INCORPORATED IN THE UNITED STATES OF AMERICA)
Basel – Pillar III disclosures March 2020
Economic & Political Weekly EPW Published on Saturday, JUNE 27, 2020 vol lV nos 26 & 27 355
Balance sheet as in financial statements
Balance sheet under regulatory scope of
consolidation
Ref
As on March 31, 2020
As on March 31, 2020
II Deposits 21,289,851 21,289,851
of which: Deposits from banks – –
of which: Customer deposits 21,289,851 21,289,851
of which: Other deposits (pl. specify) – –
III Borrowings 20,596,093 20,596,093
of which: From RBI – –
of which: From banks 764,793 764,793
of which: From other institutions & agencies – –
of which: Others (pl. specify) – –
of which: Capital instruments 19,831,300 19,831,300
of which: admissible as Tier 2 capital 19,331,300 19,331,300 cIV Other liabilities & provisions 22,501,999 22,501,999
of which: general provisions included in Tier 2 Capital 708,089 708,089 dof which: other liabilities 21,793,910 21,793,910
Total 82,478,773 82,478,773
B Assets
I Cash and balances with Reserve Bank of India 1,855,697 1,855,697
Balance with banks and money at call and short notice 1,654,231 1,654,231
II Investments 33,409,924 33,409,924
of which: Government securities 33,409,924 33,409,924
of which: Other approved securities – –
of which: Shares – –
of which: Debentures & Bonds – –
of which: Subsidiaries / Joint Ventures / Associates – –
of which: Others (Commercial Papers, Mutual Funds etc.) – –
III Loans and advances 39,873,855 39,873,855
of which: Loans and advances to banks 49,603 49,603
of which: Loans and advances to customers 39,824,252 39,824,252
IV Fixed assets 307,012 307,012
V Other assets 2,667,483 2,667,483
of which: Goodwill and intangible assets out of which: – –
Goodwill – –
Other intangibles (excluding MSRs) – –
Deferred tax assets – –
VI Goodwill on consolidation – –
VII Debit balance in Profit & Loss account 2,710,571 2,710,571 eof which: Accumulated Losses 2,752,497 2,752,497
of which: (Profit)/Loss during the year (41,926) (41,926)
Total Assets 82,478,773 82,478,773
(Amount in Rs. ‘000)
ECO
NOM
IC &
PO
LITI
CAL
WEE
KLY

AMERICAN EXPRESS BANKING CORP.INDIA BRANCH
(INCORPORATED IN THE UNITED STATES OF AMERICA)
Basel – Pillar III disclosures March 2020
Published on Saturday, JUNE 27, 2020 vol lV nos 26 & 27 EPW Economic & Political Weekly356
Step – III Amount in ‘000
Extract of Basel III common disclosure template (with added column) – Table DF-11 (Part I / Part II whichever, applicable)Tier 1 & Tier 2 Capital Component of
regulatory capital reported by bank
Source based on reference numbers/letters of the balance
sheet under the regulatory scope of consolidation from step 2
Ref
1 Directly issued qualifying common share (and equivalent for non-joint stock companies) capital plus related stock surplus
17,603,299 17,603,299a
2 Statutory Reserves 487,057 487,057 b3 Accumulated Losses (2,710,571) (2,710,571) e
Tier 1 capital (1+2+3) 15,379,785 15,379,7854 Investment fluctuation 474 474 b5 Provisions 708,089 708,089 d6 Subordinate Debt 19,831,300 19,831,3006a Of which: admissible as Tier 2 Capital 19,331,300 19,331,300 c
Tier 2 capital (4+5+6a) 20,039,863 20,039,863
13. Disclosures on Main Features of Regulatory Capital Instruments and Full Terms and ConditionsThe capital of the bank comprises of interest free funds from Head Office, reserves & surplus, subordinated debt and general provisions on standard assets (including provision for unhedged foreign currency exposure). Further, the bank has issued below capital instruments forming part of Tier 2 Debt Capital raised in the form of Head Office Borrowings in Foreign Currency:
As at March 31, 2020S.No. Items I II III IV V1 Issuer American Express
Banking Corp. - India Branch
American Express Banking Corp. - India Branch
American Express Banking Corp. - India Branch
American Express Banking Corp. - India Branch
American Express Banking Corp. - India Branch
2 Unique identifier (e.g. CUSIP, ISIN or Bloomberg identifier for private placement)
Not Applicable Not Applicable Not Applicable Not Applicable Not Applicable
3 Governing law(s) of the instrument
Applicable Indian statutes and regulatory requirements
Applicable Indian statutes and regulatory requirements
Applicable Indian statutes and regulatory requirements
Applicable Indian statutes and regulatory requirements
Applicable Indian statutes and regulatory requirements
Regulatory treatment 4 Transitional Basel III rules Tier 2 Tier 2 Tier 2 Tier 2 Tier 25 Post-transitional Basel
III rules Tier 2 Tier 2 Tier 2 Tier 2 Tier 2
6 Eligible at solo/group/ group & solo
Solo Solo Solo Solo Solo
7 Instrument type Tier 2 Debt instrument - Head Office Borrowings
Tier 2 Debt instrument - Head Office Borrowings
Tier 2 Debt instrument - Head Office Borrowings
Tier 2 Debt instrument - Head Office Borrowings
Tier 2 Debt instrument - Head Office Borrowings
8 Amount recognized in regulatory capital (Rs. in million, as of most recent reporting date)
INR 750 million. INR 3300 million. INR 4950 million. INR 5150.60 million.
INR 5180.70 million.
9 Par value of instrument INR 1250 million. INR 3300 million. INR 4950 million. INR 5150.60 million.
INR 5180.70 million.
10 Accounting classification
Liability - Borrowings Outside India - Tier 2 Debt Capital raised in the form of Head Office Borrowings in Foreign Currency
Liability - Borrowings Outside India - Tier 2 Debt Capital raised in the form of Head Office Borrowings in Foreign Currency
Liability - Borrowings Outside India - Tier 2 Debt Capital raised in the form of Head Office Borrowings in Foreign Currency
Liability - Borrowings Outside India - Tier 2 Debt Capital raised in the form of Head Office Borrowings in Foreign Currency
Liability - Borrowings Outside India - Tier 2 Debt Capital raised in the form of Head Office Borrowings in Foreign Currency
ECO
NOM
IC &
PO
LITI
CAL
WEE
KLY

AMERICAN EXPRESS BANKING CORP.INDIA BRANCH
(INCORPORATED IN THE UNITED STATES OF AMERICA)
Basel – Pillar III disclosures March 2020
Economic & Political Weekly EPW Published on Saturday, JUNE 27, 2020 vol lV nos 26 & 27 357
As at March 31, 2020S.No. Items I II III IV V11 Original date of issuance 1-Nov-13 27-Nov-15 4-May-18 11-Mar-20 17-Mar-2012 Perpetual or dated Dated Dated Dated Dated Dated13 Original maturity date 1-Nov-23 27-Nov-25 4-May-28 11-Mar-26 17-Mar-2714 Issuer call subject
to prior supervisory approval
Yes (as per current guidelines RBI approval is required)
Yes (as per current guidelines RBI approval is required)
Yes (as per current guidelines RBI approval is required)
Yes (as per current guidelines RBI approval is required)
Yes (as per current guidelines RBI approval is required)
15 Optional call date, contingent call dates and redemption amount
After completion of 5 years from the Issuance date (i.e 1-Nov-2018), with a prior notice of 120 days to the Lender. The Bank has decided not to exercise the prepayment option.
After completion of 5 years from the Issuance date (i.e. 27-Nov-2020), with a prior notice of 120 days to the Lender. The Bank has decided not to exercise the prepayment option.
After completion of 5 years from the Issuance date (i.e. 04-May-2023), with a prior notice of 90 days to the Lender. The Bank has decided to exercise the prepayment option only after 01-May-2025.
After completion of 5 years from the Issuance date (11-Mar-2025), with a prior notice of 90 days to the Lender.
After completion of 5 years from the Issuance date (17-Mar-2025), with a prior notice of 90 days to the Lender.
Tax/Regulatory call event - Not applicable
Tax/Regulatory call event - Not applicable
Tax/Regulatory call event - Not applicable
Tax/Regulatory call event - Not applicable
Tax/Regulatory call event - Not applicable
Redemption Price : At par
Redemption Price : At par
Redemption Price : At par
Redemption Price : At par
Redemption Price : At par
16 Subsequent call dates, if applicable
Not Applicable Not Applicable Not Applicable Not Applicable Not Applicable
Coupons / dividends 17 Fixed or floating
dividend/couponInterest Free Interest Free Interest Free Interest Free Interest Free
18 Coupon rate and any related index
Not Applicable Not Applicable Not Applicable Not Applicable Not Applicable
19 Existence of a dividend stopper
Not Applicable Not Applicable Not Applicable Not Applicable Not Applicable
20 Fully discretionary, partially discretionary or mandatory
Not Applicable Not Applicable Not Applicable Not Applicable Not Applicable
21 Existence of step up or other incentive to redeem
Not Applicable Not Applicable Not Applicable Not Applicable Not Applicable
22 Noncumulative or cumulative
Not Applicable Not Applicable Not Applicable Not Applicable Not Applicable
23 Convertible or non-convertible
Not Applicable Not Applicable Not Applicable Not Applicable Not Applicable
24 If convertible, conversion trigger(s)
Not Applicable Not Applicable Not Applicable Not Applicable Not Applicable
25 If convertible, fully or partially
Not Applicable Not Applicable Not Applicable Not Applicable Not Applicable
26 If convertible, conversion rate
Not Applicable Not Applicable Not Applicable Not Applicable Not Applicable
27 If convertible, mandatory or optional conversion
Not Applicable Not Applicable Not Applicable Not Applicable Not Applicable
28 If convertible, specify instrument type convertible into
Not Applicable Not Applicable Not Applicable Not Applicable Not Applicable
29 If convertible, specify issuer of instrument it converts into
Not Applicable Not Applicable Not Applicable Not Applicable Not Applicable
ECO
NOM
IC &
PO
LITI
CAL
WEE
KLY

AMERICAN EXPRESS BANKING CORP.INDIA BRANCH
(INCORPORATED IN THE UNITED STATES OF AMERICA)
Basel – Pillar III disclosures March 2020
Published on Saturday, JUNE 27, 2020 vol lV nos 26 & 27 EPW Economic & Political Weekly358
As at March 31, 2020S.No. Items I II III IV V30 Write-down feature Not Applicable Not Applicable Not Applicable Not Applicable Not Applicable31 If write-down, write-
down trigger(s) Not Applicable Not Applicable Not Applicable Not Applicable Not Applicable
32 If write-down, full or partial
Not Applicable Not Applicable Not Applicable Not Applicable Not Applicable
33 If write-down, permanent or temporary
Not Applicable Not Applicable Not Applicable Not Applicable Not Applicable
34 If temporary write-down, description of write-up mechanism
Not Applicable Not Applicable Not ApplicableNot Applicable
Not Applicable
35 Position in subordination hierarchy in liquidation (specify instrument type immediately senior to instrument)
Subordinate to the claims of all depositors and general creditors.
Subordinate to the claims of all depositors and general creditors.
Subordinate to the claims of all depositors and general creditors.
Subordinate to the claims of all depositors and general creditors.
Subordinate to the claims of all depositors and general creditors.
36 Non-compliant transitioned features
No No No No No
37 If yes, specify non-compliant features
Not Applicable Not Applicable Not Applicable Not Applicable Not Applicable
14. Full Terms and Conditions of Regulatory Capital instruments: The capital of the bank comprises of interest free funds from Head Office, reserves & surplus, subordinated debt and general provisions on standard assets (including provision for unhedged foreign currency exposure and willful defaulters). The details of issued Tier 2 capital is as above.15. Comparison of accounting assets vs. leverage ratio exposure measureAs at March 31, 2020
Summary comparison of accounting assets vs. leverage ratio exposure measureS No. Particulars Amount in Rs. ‘0001 Total consolidated assets as per published financial statements 82,478,7732 Adjustment for investments in banking, financial, insurance or commercial entities that are consolidated
for accounting purposes but outside the scope of regulatory consolidation3 Adjustment for fiduciary assets recognised on the balance sheet pursuant to the operative accounting
framework but excluded from the leverage ratio exposure measure4 Adjustments for derivative financial instruments5 Adjustment for securities financing transactions (i.e. repos and similar secured lending)6 Adjustment for off-balance sheet items (i.e. conversion to credit equivalent amounts of off- balance
sheet exposures)
21,487,0887 Other adjustments (Debit balance in Profit & Loss Account) (2,710,571)8 Leverage ratio exposure 101,255,290
Leverage Ratio as at March 31, 2020 (Amount Rs.’000)
S No. Particulars Leverage ratio framework
On-balance sheet exposures1 On-balance sheet items (excluding derivatives and SFTs, but including collateral) 82,478,7732 Asset amounts deducted in determining Basel III Tier 1 capital (2,710,571)3 Total on-balance sheet exposures (excluding derivatives and SFTs) (sum of lines 1, 2 and 2A) 79,768,202Derivative exposures4 Replacement cost associated with all derivatives transactions
(i.e. net of eligible cash variation margin)-
5 Add-on amounts for PFE associated with all derivatives transactions -6 Gross-up for derivatives collateral provided where deducted from the balance sheet assets pursuant to
the operative accounting framework -
ECO
NOM
IC &
PO
LITI
CAL
WEE
KLY

AMERICAN EXPRESS BANKING CORP.INDIA BRANCH
(INCORPORATED IN THE UNITED STATES OF AMERICA)
Basel – Pillar III disclosures March 2020
Economic & Political Weekly EPW Published on Saturday, JUNE 27, 2020 vol lV nos 26 & 27 359
S No. Particulars Leverage ratio framework
7 (Deductions of receivables assets for cash variation margin provided in derivatives transactions) -8 (Exempted CCP leg of client-cleared trade exposures) -9 Adjusted effective notional amount of written credit derivatives -10 (Adjusted effective notional offsets and add-on deductions for written credit derivatives) -11 Total derivative exposures (sum of lines 4 to 10) -Securities financing transaction exposures12 Gross SFT assets (with no recognition of netting), after adjusting for sale accounting transactions -13 (Netted amounts of cash payables and cash receivables of gross SFT assets) -14 CCR exposure for SFT assets -15 Agent transaction exposures -16 Total securities financing transaction exposures (sum of lines 12 to 15) -Other off-balance sheet exposures17 Off-balance sheet exposure at gross notional amount 214,870,87518 (Adjustments for conversion to credit equivalent amounts) -193,383,78819 Off-balance sheet items (sum of lines 17 and 18) 21,487,088Capital and total exposures20 Tier 1 capital 15,379,78521 Total exposures (sum of lines 3, 11, 16 and 19) 101,255,290Leverage ratio 22 Basel III leverage ratio 15.19%
18. Disclosures on RemunerationQualitative Disclosures Being a Branch of a Foreign Bank, the Bank does not have any Remuneration Committee for approval of the Managerial Remuneration. The Bank’s compensation structure is in conformity with the principles and practices set out by the Financial Stability Board (FSB). Further, the Bank has obtained the RBI’s approval for the Chief Executive Offi cer’s (CEO) remuneration. Quantitative Disclosures The quantitative disclosures cover the Bank’s CEO and Key Risk Takers. The Bank’s Key Risk Takers include the CEO, Head of Business Units and select roles in Treasury and Risk.
(Amount Rs.’000)S No. Particulars 2019-201 (i) Number of employees having received a variable remuneration award during the financial year. 5
(ii) Total amount of outstanding deferred remuneration, split into cash, shares and share-linked instruments and other forms.
–
(iii) Total amount of deferred remuneration paid out in the financial year –2 Breakdown of amount of remuneration awards for the financial year to show fixed and variable, deferred
and non-deferred.Fixed 50,282Variable 41,555Deferred –Non-deferred 41,555
3 (i) Total amount of outstanding deferred remuneration and retained remuneration exposed to ex post explicitand / or implicit adjustments.
–
(ii) Total amount of reductions during the financial year due to ex- post explicit adjustments. –(iii) Total amount of reductions during the financial year due to ex- post implicit adjustments. –
4 Retrials’ (PF, Gratuity, SA) 3,356
Variable pay included above is on cash basis i.e. the year in which the same is paid out.Compensation for CEO is as approved by the RBI and paid by the Bank to the CEO. Compensation for other risk takers is as approved by the Bank. Charges for ESOPs, issued by the ultimate parent company to the key risk takers, has not been considered for the disclosure purpose as there is no charge to Profit and Loss Account of the Bank.
ECO
NOM
IC &
PO
LITI
CAL
WEE
KLY

Standard CharteredStandard Chartered Bank – India Branches(Incorporated in the United Kingdom with limited liability)
Published on Saturday, june 27, 2020 vol lV nos 26 & 27 EPW Economic & Political Weekly360
INDEPENDENT AUDITOR’S REPORT To the Country Management Team (“Management”) of Standard Chartered Bank – India Branches Report on the Audit of the Financial StatementsOpinion We have audited the fi nancial statements of Standard Chartered Bank – India Branches (“the Bank”), which comprise the Balance Sheet as at March 31, 2020, the Profi t and Loss Account, Cash Flow Statement for the year then ended, and notes to the fi nancial statements, including a summary of signifi cant accounting policies and other explanatory information. In our opinion and to the best of our information and according to the explanations given to us, the aforesaid fi nancial statements give the information required by the Banking Regulation Act, 1949 as well as the Companies Act, 2013 (“the Act”) in the manner so required for Banking Companies and give a true and fair view in conformity with the accounting principles generally accepted in India, of the state of affairs of the Bank as at March 31, 2020, its profi t and its cash fl ows for the year ended on that date.Basis for Opinion We conducted our audit in accordance with the Standards on Auditing (SAs) specifi ed under Section 143(10) of the Act. Our responsibilities under those Standards are further described in the Auditor’s Responsibilities for the Audit of the Financial Statements section of our report. We are independent of the Bank in accordance with the Code of Ethics issued by the Institute of Chartered Accountants of India (“the ICAI”) together with the ethical requirements that are relevant to our audit of the fi nancial statements under the provisions of the Act and the Rules thereunder, and we have fulfi lled our other ethical responsibilities in accordance with these requirements and the Code of Ethics. We believe that the audit evidence we have obtained is suffi cient and appropriate to provide a basis for our opinion.Emphasis of MatterWe draw attention to Note 18(E)(1)(xii)(b) to the fi nancial statements, which describes that the extent to which the COVID-19 Pandemic will impact the Bank’s fi nancial statements will depend on future developments, which are highly uncertain. Our opinion is not modifi ed in respect of this matter. Information Other than the Financial Statements and Auditor’s Report ThereonThe Management of Bank is responsible for the other information. The other information comprises the Basel III - Pillar 3 Disclosure but does not include the fi nancial statements and our auditor’s report thereon. The Basel III – Pillar 3 Disclosure is expected to be made available to us after the date of this auditor's reportOur opinion on the fi nancial statements does not cover the other information and we do not express any form of assurance conclusion thereon.In connection with our audit of the fi nancial statements, our responsibility is to read the other information and, in doing so, consider whether the other information is materially inconsistent with the fi nancial statements or our knowledge obtained in the audit or otherwise appears to be materially misstated. When we read the Basel III – Pillar 3 Disclosure, if we conclude that there is a material misstatement therein, we are required to communicate the matter to those charged with governance under SA 720 ‘The Auditor’s responsibilities Relating to Other Information’.Responsibilities of Management and Those charged with Governance for Financial Statements The Bank’s Management is responsible for the matters stated in Section 134(5) of the Act with respect to the preparation of these fi nancial statements that give a true and fair view of the fi nancial position, fi nancial performance and cash fl ows of the Bank in accordance with the accounting principles generally accepted in India, including the Accounting Standards specifi ed under Section 133 of the Act and provisions of Section 29 of the Banking Regulation Act, 1949 and circulars, guidelines and directions issued by the Reserve Bank of India from time to time as applicable to Bank. This responsibility also includes maintenance of adequate accounting records in accordance with the provisions of the Act for safeguarding of the assets of the Bank and for preventing and detecting frauds and other irregularities; selection and application of appropriate accounting policies; making judgments and estimates that are reasonable and prudent; and design, implementation and maintenance of adequate internal fi nancial controls, that were operating effectively for ensuring the accuracy and completeness of the accounting records, relevant to the preparation and presentation of the fi nancial statements that give a true and fair view and are free from material misstatement, whether due to fraud or error. In preparing the fi nancial statements, the Management is responsible for assessing the Bank’s ability to continue as a going concern, disclosing, as applicable, matters related to going concern and using the going concern basis of accounting unless the Management either intends to liquidate the Bank or to cease operations, or has no realistic alternative but to do so. The Management is also responsible for overseeing the Bank’s fi nancial reporting process. Auditor’s Responsibilities for the Audit of the Financial Statements Our objectives are to obtain reasonable assurance about whether the fi nancial statements as a whole are free from material misstatement, whether due to fraud or error, and to issue an Auditor’s report that includes our opinion. Reasonable assurance is a high level of assurance but is not a guarantee that an audit conducted in accordance with SAs will always detect a material misstatement when it exists. Misstatements can arise from fraud or error and are considered material if, individually or in the aggregate, they could reasonably be expected to infl uence the economic decisions of users taken on the basis of these fi nancial statements. As part of an audit in accordance with SAs, we exercise professional judgment and maintain professional skepticism throughout the audit. We also:• Identify and assess the risks of material misstatement of the fi nancial statements, whether due to fraud or error, design and perform audit
procedures responsive to those risks, and obtain audit evidence that is suffi cient and appropriate to provide a basis for our opinion. The risk of not detecting a material misstatement resulting from fraud is higher than for one resulting from error, as fraud may involve collusion, forgery, intentional omissions, misrepresentations, or the override of internal control.
• Obtain an understanding of internal control relevant to the audit in order to design audit procedures that are appropriate in the circumstances. Under Section 143(3)(i) of the Act, we are also responsible for expressing our opinion on whether the Bank has internal fi nancial controls with reference to fi nancial statements in place and the operating effectiveness of such controls.
• Evaluate the appropriateness of accounting policies used and the reasonableness of accounting estimates and related disclosures made by Management.
ECO
NOM
IC &
PO
LITI
CAL
WEE
KLY

Standard CharteredStandard Chartered Bank – India Branches(Incorporated in the United Kingdom with limited liability)
Economic & Political Weekly EPW Published on Saturday, june 27, 2020 vol lV nos 26 & 27 361
• Conclude on the appropriateness of Management’s use of the going concern basis of accounting and, based on the audit evidence obtained, whether a material uncertainty exists related to events or conditions that may cast signifi cant doubt on the Bank’s ability to continue as a going concern. If we conclude that a material uncertainty exists, we are required to draw attention in our Auditor’s report to the related disclosures in the fi nancial statements or, if such disclosures are inadequate, to modify our opinion. Our conclusions are based on the audit evidence obtained up to the date of our auditor’s report. However, future events or conditions may cause the Bank to cease to continue as a going concern.
• Evaluate the overall presentation, structure and content of the fi nancial statements, including the disclosures, and whether the fi nancial statements represent the underlying transactions and events in a manner that achieves fair presentation.
We communicate with those charged with governance regarding, among other matters, the planned scope and timing of the audit and signifi cant audit fi ndings, including any signifi cant defi ciencies in internal control that we identify during our audit.We also provide those charged with governance with a statement that we have complied with relevant ethical requirements regarding independence, and to communicate with them all relationships and other matters that may reasonably be thought to bear on our independence, and where applicable, related safeguards.Other Matter The fi nancial statements of the Bank for the year ended March 31, 2019, were audited by another auditor whose report dated June 19, 2019 expressed an unmodifi ed opinion on those fi nancial statements.Our opinion is not modifi ed in respect of this matter. Report on Other Legal and Regulatory Requirements 1. The Balance Sheet and the Profi t and Loss Account have been drawn up in accordance with the provisions of Section 29 of the Banking
Regulation Act, 1949 read with Section 133 of the Companies Act, 2013 read with Rule 7 of the Companies (Accounts) Rules, 2014. 2. As required by sub-section 3 of Section 30 of the Banking Regulation Act, 1949, we report that: a) We have sought and obtained all the information and explanations which to the best of our knowledge and belief were necessary for the
purposes of our audit and have found them to be satisfactory; b) The transactions of the Bank, which have come to our notice during the course of our audit, have been within the powers of the Bank; c) Since the key operations of the Bank are automated with the key applications integrated to the core banking system, the audit is carried
out centrally as all the necessary records and data required for the purposes of our audit are available therein. However, during the course of our audit we have visited 1 branch.
3. As required by Section 143(3) of the Act, we report that: a) We have sought and obtained all the information and explanations which to the best of our knowledge and belief were necessary for the
purposes of our audit; b) In our opinion, proper books of account as required by law have been kept by the Bank so far as it appears from our examination of those books; c) The Balance Sheet, the Profi t and Loss Account and the Cash Flow Statement dealt with by this Report are in agreement with the books
of account; d) In our opinion, the aforesaid fi nancial statements comply with the Accounting Standards specifi ed under Section 133 of the Act, read
with Rule 7 of the Companies (Accounts) Rules, 2014 to the extent they are not inconsistent with the accounting policies prescribed by the Reserve Bank of India;
e) The requirement of Section 164 (2) of the Companies Act, 2013 is not applicable to the Bank considering it is a branch of Standard Chartered Bank, UK, which is incorporated with limited liability in United Kingdom;
f) With respect to the adequacy of the internal fi nancial controls with reference to fi nancial statements of the Bank and the operating effectiveness of such controls, refer to our separate Report in “Annexure A”;
g) With respect to the other matters to be included in the Auditor’s Report in accordance with the requirements of section 197(16) of the Act, as amended;
The Bank is a Banking Company as defi ned under Banking Regulation Act, 1949. Accordingly, the requirements prescribed under section 197 of the Companies Act, 2013 do not apply; and
h) With respect to the other matters to be included in the Auditor’s Report in accordance with Rule 11 of the Companies (Audit and Auditors) Rules, 2014, in our opinion and to the best of our knowledge and belief and according to the information and explanations given to us:
i. The Bank has disclosed the impact of pending litigations as at March 31, 2020 on its fi nancial position in its fi nancial statements – Refer Schedule 12 and 18(E)(1)(xxxv)(b) to the fi nancial statements;
ii. The Bank has made provision as at March 31, 2020, as required under the applicable law or accounting standard, for material foreseeable losses, if any, on long term contracts including derivative contracts - Refer Schedule 18(E)(1)(xxxi) & (xxxii) and 18(E)(1)(xxxv)(a) & (d) to the fi nancial statements;
iii. There were no amounts which were required to be transferred to the Investor Education and Protection Fund by the Bank.For MSKC & Associates (Formerly known as R. K. Kumar & Co)Chartered AccountantsICAI Firm Registration Number: 001595SSd/-Tushar KuraniPartnerMembership No. 118580UDIN: 20118580AAAACB8458MumbaiJune 18, 2020
ECO
NOM
IC &
PO
LITI
CAL
WEE
KLY

Standard CharteredStandard Chartered Bank – India Branches(Incorporated in the United Kingdom with limited liability)
Published on Saturday, june 27, 2020 vol lV nos 26 & 27 EPW Economic & Political Weekly362
ANNEXURE A TO THE INDEPENDENT AUDITOR’S REPORT OF EVEN DATE ON THE FINANCIAL STATEMENTS OF STANDARD CHARTERED BANK – INDIA BRANCHES
[Referred to in paragraph 3(f) under ‘Report on Other Legal and Regulatory Requirements’ in the Independent Auditor’s Report of even date to the Members of Standard Chartered Bank – India Branches on the Financial Statements for the year ended March 31, 2020]
Report on the Internal Financial Controls under Clause (i) of Sub-section 3 of Section 143 of the Companies Act, 2013 (“the Act”)We have audited the internal fi nancial controls with reference to fi nancial statements of Standard Chartered Bank – India Branches (“the Bank”) as of March 31, 2020 in conjunction with our audit of the fi nancial statements of the Bank for the year ended on that date.Management’s Responsibility for Internal Financial ControlsThe Bank’s Management is responsible for establishing and maintaining internal fi nancial controls based on the internal control with reference to fi nancial statements criteria established by the Bank considering the essential components of internal control stated in the Guidance Note on Audit of Internal Financial Controls Over Financial Reporting issued by the Institute of Chartered Accountants of India (ICAI) (the “Guidance Note”). These responsibilities include the design, implementation and maintenance of internal fi nancial controls that were operating effectively for ensuring the orderly and effi cient conduct of its business, including adherence to Bank’s policies, the safeguarding of its assets, the prevention and detection of frauds and errors, the accuracy and completeness of the accounting records, and the timely preparation of reliable fi nancial information, as required under the Act.Auditor’s ResponsibilityOur responsibility is to express an opinion on the Bank's internal fi nancial controls with reference to fi nancial statements based on our audit. We conducted our audit in accordance with the Guidance Note and the Standards on Auditing, issued by ICAI and deemed to be prescribed under section 143(10) of the Act, to the extent applicable to an audit of internal fi nancial controls. Those Standards and the Guidance Note require that we comply with ethical requirements and plan and perform the audit to obtain reasonable assurance about whether internal fi nancial controls with reference to fi nancial statements was established and maintained and if such controls operated effectively in all material respects.Our audit involves performing procedures to obtain audit evidence about the adequacy of the internal fi nancial controls with reference to fi nancial statements and their operating effectiveness. Our audit of internal fi nancial controls with reference to fi nancial statements included obtaining an understanding of internal fi nancial controls with reference to fi nancial statements, assessing the risk that a material weakness exists, and testing and evaluating the design and operating effectiveness of internal control based on the assessed risk. The procedures selected depend on the auditor’s judgement, including the assessment of the risks of material misstatement of the fi nancial statements, whether due to fraud or error.We believe that the audit evidence we have obtained is suffi cient and appropriate to provide a basis for our audit opinion on the Bank’s internal fi nancial controls with reference to fi nancial statements.Meaning of Internal Financial Controls With reference to Financial StatementsA Bank’s internal fi nancial control with reference to fi nancial statements is a process designed to provide reasonable assurance regarding the reliability of fi nancial reporting and the preparation of fi nancial statements for external purposes in accordance with generally accepted accounting principles. A Bank's internal fi nancial control with reference to fi nancial statements includes those policies and procedures that (1) pertain to the maintenance of records that, in reasonable detail, accurately and fairly refl ect the transactions and dispositions of the assets of the Bank; (2) provide reasonable assurance that transactions are recorded as necessary to permit preparation of fi nancial statements in accordance with generally accepted accounting principles, and that receipts and expenditures of the Bank are being made only in accordance with authorizations of management of the Bank; and (3) provide reasonable assurance regarding prevention or timely detection of unauthorized acquisition, use, or disposition of the Bank's assets that could have a material effect on the fi nancial statements.Inherent Limitations of Internal Financial Controls With reference to fi nancial statementsBecause of the inherent limitations of internal fi nancial controls with reference to fi nancial statements, including the possibility of collusion or improper management override of controls, material misstatements due to error or fraud may occur and not be detected. Also, projections of any evaluation of the internal fi nancial controls with reference to fi nancial statements to future periods are subject to the risk that the internal fi nancial control with reference to fi nancial statements may become inadequate because of changes in conditions, or that the degree of compliance with the policies or procedures may deteriorate.OpinionIn our opinion, the Bank has, in all material respects, adequate internal fi nancial controls with reference to fi nancial statements and such internal fi nancial controls with reference to fi nancial statements were operating effectively as at March 31, 2020, based on the internal control with reference to fi nancial statements criteria established by the Bank considering the essential components of internal control stated in the Guidance Note.
For MSKC & Associates (Formerly known as R. K. Kumar & Co)Chartered AccountantsICAI Firm Registration Number: 001595S
Sd/-Tushar KuraniPartnerMembership No. 118580UDIN: 20118580AAAACB8458
MumbaiJune 18, 2020
ECO
NOM
IC &
PO
LITI
CAL
WEE
KLY

Standard CharteredStandard Chartered Bank – India Branches(Incorporated in the United Kingdom with limited liability)
Economic & Political Weekly EPW Published on Saturday, june 27, 2020 vol lV nos 26 & 27 363
Profi t and Loss Account for the year ended 31 March 2020Balance Sheet as at 31 March 2020
As at As at 31 March 31 March 2020 2019 Schedule (` in 000s) (` in 000s)
For the For the year ended year ended 31 March 2020 31 March 2019 Schedule (` in 000s) (` in 000s)
Capital and Liabilities
Capital 1 74,400,742 74,400,742 Reserves and Surplus 2 214,125,403 197,783,434 Deposits 3 1,003,945,824 1,050,875,049 Borrowings 4 167,255,791 115,279,669 Other Liabilities and Provisions 5 385,267,475 274,154,523
Total Capital and Liabilities 1,844,995,235 1,712,493,417
Assets
Cash and Balances with Reserve Bank of India 6 40,321,832 41,355,203 Balances with Banks and Money at Call and Short Notice 7 122,579,328 132,866,096 Investments 8 485,033,387 539,182,018 Advances 9 762,137,280 668,380,711 Fixed Assets 10 13,796,537 13,074,626 Other Assets 11 421,126,871 317,634,763 Total Assets 1,844,995,235 1,712,493,417 Contingent Liabilities 12 19,349,936,522 22,777,444,166 Bills for Collection 451,032,982 505,380,855
Signifi cant accounting policies and notes to fi nancial statements 18 The accompanying schedules form an integral part of the Balance Sheet
IncomeInterest Earned 13 114,056,323 105,000,503 Other Income 14 30,561,193 18,414,506 Total Income 144,617,516 123,415,009
ExpenditureInterest Expended 15 50,409,833 49,188,590 Operating Expenses 16 35,037,585 34,928,586 Provisions and Contingencies 17 30,823,324 17,612,328 Total Expenditure 116,270,742 101,729,504
Net Profi t 28,346,774 21,685,505 Balance in Profi t and Loss Account brought forward 12,669,582 14,333,758 Total 41,016,356 36,019,263
AppropriationsTransfer to Statutory Reserves 2 7,086,694 5,421,376 Transfer to Capital Reserve– Surplus on sale of immovable properties 2 8,460 – Transfer to Investment Fluctuation Reserves 2 2,872,565 3,594,547 Transfer to/(from) Investment Reserve 2 1,178,902 (139,846)Remitted to Head Offi ce 2 12,669,582 14,333,758 Remittable Surplus retained in India for CRAR 2 – 139,846 Balance carried over to Balance Sheet 2 17,200,153 12,669,582 Total 41,016,356 36,019,263
Signifi cant accounting policies and notes to fi nancial statements 18
The accompanying schedules form an integral part of the Profi t & Loss Account
As per our report of even date
For MSKC & Associates For Standard Chartered Bank – India Branches(Formerly knows as R.K. Kumar & Co.)Chartered AccountantsFirm's Registration No: 001595S
Sd/- Sd/-Tushar Kurani Zarin DaruwalaPartner Chief Executive Offi cer – IndiaMembership No: 118580 Sd/-Mumbai Subhradeep Mohanty18 June 2020 Chief Financial Offi cer – India
ECO
NOM
IC &
PO
LITI
CAL
WEE
KLY

Standard CharteredStandard Chartered Bank – India Branches(Incorporated in the United Kingdom with limited liability)
Published on Saturday, june 27, 2020 vol lV nos 26 & 27 EPW Economic & Political Weekly364
Particulars For the year ended For the year ended 31 March 2020 31 March 2019 (` in 000s) (` in 000s)
Cash fl ow from operating activities Profi t Before Tax 43,214,603 34,467,034 Adjustments for: Depreciation on Bank’s property (including amortisation) 585,704 711,840 Surplus on Revaluation of Premises (630,770) – Specifi c provisions against advances (net) 10,707,114 2,140,451 General provision against standard assets 8,622,374 196,476 (Appreciation)/depreciation on investments (3,433,710) 1,686,437 Other Provisions (2,731,245) 2,548,769 Net (profi t)/loss on sale of premises and other assets (35,190) (21,583)Write off of fi xed assets – 110
56,298,880 41,729,534
Adjustments for: (Increase)/decrease in investments 57,582,340 (148,325,432)(Increase)/decrease in advances (104,463,683) (28,863,196)(Increase)/decrease in other assets (103,313,727) (131,128,532)Increase/(decrease) in deposits (46,929,225) 214,800,839 Increase/(decrease) in other liabilities and provisions 105,221,823 121,776,865
(35,603,592) 69,990,078 Direct taxes paid (14,405,578) (14,346,154)
Net Cash fl ow from operating activities (A) (50,009,170) 55,643,924 Cash fl ow from investing activities Purchase of fi xed assets (including capital work in progress) (773,443) (600,566)Proceeds from the sale of fi xed assets 155,934 73,132 Net Cash fl ow from/(used in) investing activities (B) (617,509) (527,434) Cash fl ow from fi nancing activities Remittance to Head Offi ce (12,669,582) (14,333,758)Increase/(decrease) in borrowings (net) 51,976,122 (26,825,546) Net Cash fl ow from/(used in) fi nancing activities (C) 39,306,540 (41,159,304) Net increase/(decrease) in cash and cash equivalents (A+B+C) (11,320,139) 13,957,186 Cash and cash equivalents at the beginning of the year 174,221,299 160,264,113 Cash and cash equivalents at the end of the year 162,901,160 174,221,299 Net increase/(decrease) in cash and cash equivalents (11,320,139) 13,957,186 Note : Cash and Cash Equivalents represent Schedule As at 31 March 2020 As at 31 March 2019
Cash and Balances with Reserve Bank of India 6 40,321,832 41,355,203 Balances with Banks and Money at call and short notice 7 122,579,328 132,866,096
Total 162,901,160 174,221,299 As per our report of even date
For MSKC & Associates For Standard Chartered Bank – India Branches(Formerly knows as R.K. Kumar & Co.)Chartered AccountantsFirm's Registration No: 001595S
Sd/- Sd/-Tushar Kurani Zarin DaruwalaPartner Chief Executive Offi cer – IndiaMembership No: 118580 Sd/-Mumbai Subhradeep Mohanty18 June 2020 Chief Financial Offi cer – India
Cash Flow Statement for the year ended 31 March 2020
ECO
NOM
IC &
PO
LITI
CAL
WEE
KLY

Standard CharteredStandard Chartered Bank – India Branches(Incorporated in the United Kingdom with limited liability)
Economic & Political Weekly EPW Published on Saturday, june 27, 2020 vol lV nos 26 & 27 365
Schedules to the fi nancial statements
1. Capital Deposit kept with Reserve Bank of India under Section 11(2)(b) of the Banking Regulation Act, 1949 (face value) 79,200,000 74,350,000
a. Head offi ce reserves Balance, beginning of the year 21,960 21,960 Balance, end of the year 21,960 21,960
b. Head Offi ce Capital Balance, beginning of the year 74,378,782 74,378,782 Additions during the year – – Balance, end of the year 74,378,782 74,378,782
Total Capital 74,400,742 74,400,742
2. Reserves and Surplus a. Statutory Reserves Balance, beginning of the year 84,103,072 78,681,696 Transfer from Profi t and Loss Account 7,086,694 5,421,376 Balance, end of the year 91,189,766 84,103,072
b. Property Revaluation Reserve Balance, beginning of the year 5,092,783 5,092,783 Additions during the year 664,777 – Reduction during the year – – Balance, end of the year 5,757,560 5,092,783
c. Capital Reserves–Surplus on sale of Immovable Properties Balance, beginning of the year 10,451,371 10,451,371 Additions during the year 8,460 – Balance, end of the year 10,459,831 10,451,371
d. Capital Reserves–Surplus on sale of Held To Maturity investments Balance, beginning of the year 984,772 984,772 Balance, end of the year 984,772 984,772
e. Capital Reserve Balance, beginning of the year 302,387 302,387 Balance, end of the year 302,387 302,387
f. Remittable Surplus retained in India for Capital to Risk-weighted Assets Ratio (CRAR) Balance, beginning of the year 80,376,768 80,236,922 Transfer from Profi t and Loss Account – 139,846 Balance, end of the year 80,376,768 80,376,768
g. Balance in Profi t and Loss Account 17,200,153 12,669,582 h. Exchange Reserve Balance, beginning of the year 1,229 1,229 Balance, end of the year 1,229 1,229i. Property Investment Reserve Balance, beginning of the year 206,923 206,923 Balance, end of the year 206,923 206,923
As at 31 As at 31 As at 31 As at 31 March 2020 March 2019 March 2020 March 2019 (` in 000s) (` in 000s) (` in 000s) (` in 000s)
j. Investment Reserve Balance, beginning of the year – 139,846 Transfer to/(from) Profi t and Loss Account 1,178,902 (139,846) Balance, end of the year 1,178,902 –k. Investment Fluctuation Reserve Balance, beginning of the year 3,594,547 – Addition during the year 2,872,565 3,594,547 Balance, end of the year 6,467,112 3,594,547 Total Reserves and Surplus 214,125,403 197,783,434 3. Deposits A I Demand Deposits from banks 19,546,612 15,543,939 from others 282,583,981 212,345,048 Total Demand Deposits 302,130,593 227,888,987 II Savings Bank Deposits 179,633,103 150,014,088 Total Savings Bank Deposits 179,633,103 150,014,088 III Term Deposits from banks 7,702,988 6,751,695 from others 514,479,140 666,220,279 Total Term Deposits 522,182,128 672,971,974 Total Deposits 1,003,945,824 1,050,875,049 B I Deposits of branches in India 1,003,945,824 1,050,875,049 II Deposits of branches outside India – – Total Deposits 1,003,945,824 1,050,875,049 4. Borrowings I Borrowings in India from (i) Reserve Bank of India – 26,309,999 (ii) Other banks – – (iii) Other institutions and agencies 94,896,700 61,300,000 II Borrowings outside India 72,359,091 27,669,670 Total Borrowings 167,255,791 115,279,669 Secured Borrowings included in I and II above – 26,309,999 5. Other Liabilities and Provisions Bills payable 4,933,696 9,842,333 Inter Offi ce Adjustments (net) – – Interest accrued 7,460,108 5,494,783 Mark-to-market adjustments on Foreign Exchange and Derivative contracts 304,681,925 214,743,643 Provision against Standard Assets 18,746,085 10,123,711 Others (including provisions) 49,445,661 33,950,053 Total other liabilities and provisions 385,267,475 274,154,523 6. Cash and Balances with the Reserve Bank of India (i) Cash in hand (including foreign currency notes) 3,439,151 1,526,014 (ii) Balance with Reserve Bank of India (a) In Current Accounts 36,882,681 39,829,189 (b) In Other Accounts – – Total Cash and Balances with the Reserve Bank of India 40,321,832 41,355,203
ECO
NOM
IC &
PO
LITI
CAL
WEE
KLY

Standard CharteredStandard Chartered Bank – India Branches(Incorporated in the United Kingdom with limited liability)
Published on Saturday, june 27, 2020 vol lV nos 26 & 27 EPW Economic & Political Weekly366
c (ii). Advances Outside India Due from Banks – – Due from Others – – (a) Bills purchased and discounted – – (b) Syndicated loans – – (c) Others – –
Total – –
Total advances 762,137,280 668,380,711
10. Fixed Assets Premises Balance, beginning of the year 13,829,299 13,650,511 Additions during the year – 204,163 Additions on account of revaluation during the year 630,770 – Deduction on account of revaluation during the year – – Deductions during the year (108,973) (25,375) 14,351,096 13,829,299 Less : Depreciation to date (1,796,601) (1,619,995)
Net book value of Premises 12,554,495 12,209,304
Other fi xed assets (including furniture and fi xtures) Balance, beginning of the year 6,387,772 6,184,607 Additions during the year 550,696 425,169 Additions on account of revaluation during the year – – Deduction on account of revaluation during the year – – Deductions during the year (at cost) (236,701) (222,004) 6,701,767 6,387,772 Less : Depreciation to date (5,740,124) (5,556,179) Net book value of other fi xed assets 961,643 831,593
Intangible (Capitalised Software) Balance, beginning of year 197,871 197,871 Additions during the year 13,900 – Deductions during the year at cost – – 211,771 197,871 Less: Amortisation to date (198,096) (197,871)
Net book value of Intangible (capitalised software) 13,675 –
Intangible assets/Goodwill Balance, beginning of the year – 31,821 Additions during the year 55,255 – Deductions during the year at cost – – 55,255 31,821
Less: Amortisation to date (15,554) (31,821)
Net book value of intangible assets/Goodwill 39,701 –
Capital Work in Progress 227,023 33,729
Total net book value of fi xed assets 13,796,537 13,074,626
7. Balances with Banks and Money at Call and Short notice In India (i) Balances with banks (a) In current accounts 1,225,563 1,585,231 (b) In other deposit accounts 552,500 300,000 (ii) Money at call and short notice (a) with banks – 19,000,000 (b) with other institutions 96,810,356 63,346,525 Total (i and ii) 98,588,419 84,231,756 Outside India (i) In current accounts 3,183,034 3,683,590 (ii) In other deposit accounts 20,807,875 44,950,750 (iii) Money at call and short notice – – Total (i, ii and iii) 23,990,909 48,634,340 Total Balances with Banks and Money at Call and Short Notice 122,579,328 132,866,096 8. Investments In India Government securities 406,684,314 425,534,664 Other approved securities – – Shares 148,039 199,288 Debentures and bonds 46,952,504 55,739,688 Subsidiaries and/or Joint Ventures – – Others (including Certifi cates of Deposits, Commercial Papers and Pass Through Certifi cates) 31,248,530 57,708,378 Total Investments 485,033,387 539,182,018 Outside India Government securities (including local authorities) – – Subsidiaries and/or joint ventures abroad – – Other Investments – – Total Investments 485,033,387 539,182,018 9. Advances a. Bills purchased and discounted 69,923,929 52,727,009 Cash credits, overdrafts and loans repayable on demand 296,930,466 240,563,154 Term loans 395,282,885 375,090,548 Total 762,137,280 668,380,711 b. Secured by tangible assets 440,788,022 397,598,335 (includes advances secured against book debts) Covered by bank/ government guarantees 2,170,545 1,610,422 Unsecured 319,178,713 269,171,954 Total 762,137,280 668,380,711 c (i). Advances in India Priority sectors 253,929,505 226,933,362 Public sector 24 236,884 Banks 18,686,680 – Others 489,521,071 441,210,465 Total 762,137,280 668,380,711
Schedules to the fi nancial statements As at 31 As at 31 As at 31 As at 31 March 2020 March 2019 March 2020 March 2019 (` in 000s) (` in 000s) (` in 000s) (` in 000s)
ECO
NOM
IC &
PO
LITI
CAL
WEE
KLY

Standard CharteredStandard Chartered Bank – India Branches(Incorporated in the United Kingdom with limited liability)
Economic & Political Weekly EPW Published on Saturday, june 27, 2020 vol lV nos 26 & 27 367
Schedules to the fi nancial statements As at 31 As at 31 For the For the March 2020 March 2019 year ended year ended (` in 000s) (` in 000s) March 2020 March 2019 (` in 000s) (` in 000s)
14. Other Income Commission, exchange and brokerage 15,954,100 14,212,642 Net profi t/(loss) on sale of investments 1,656,400 (1,805,173) Net profi t/(loss) on revaluation of investments 2,790,962 (1,741,334) Net profi t/(loss) on sale of premises and other assets 35,499 21,583 Net profi t/(loss) on exchange transactions (incl. derivatives and long term Fx contracts) 6,927,041 7,265,473 Income by way of dividends, etc from subsidiary companies – – Miscellaneous income 3,197,191 461,315 Total Other Income 30,561,193 18,414,506 15. Interest Expended Interest on deposits 38,140,770 43,559,822 Interest on Reserve Bank of India and inter-bank borrowings 1,734,571 676,798 Others 10,534,492 4,951,970 Total Interest Expended 50,409,833 49,188,590 16. Operating Expenses Payments to and provisions for employees 15,571,886 15,708,682 Rent, taxes and lighting (net) 1,052,721 796,766 Printing and stationery 234,793 242,475 Advertisement and publicity 379,091 393,799 Depreciation on Bank's property 620,302 706,651 Auditors' fees and expense 12,765 10,603 Legal and professional charges 515,908 781,728 Postage, telegrams, telephones, etc. 401,747 544,913 Repairs and maintenance 856,645 782,905 Insurance 1,047,304 974,478 Travelling 425,829 474,679 Business support cost 6,095,608 6,804,289 Other expenditure [Refer Note 18 E (4)] 7,822,986 6,706,618 Total Operating Expenses 35,037,585 34,928,586 17. Provisions and Contingencies Specifi c provisions against advances (net) 10,707,114 2,140,451 General provision against standard assets 8,622,374 196,476 Provision for country risk exposure – – Specifi c provisions against investments (net) (642,748) (54,897) Provision on account of tax – Current tax expense [Refer note 18 E (9)] (3,981,152) 6,658,330 – Deferred tax charge [Refer note 18 E (8)] 18,848,981 5,714,601 – MAT Credit Entitlement – 408,598 Other Provisions (2,731,245) 2,548,769 Total Provisions and Contingencies 30,823,324 17,612,328
For the For the year ended year ended 31 March 2020 31 March 2019 (` in 000s) (` in 000s)
13. Interest Earned Interest/discount on advances/bills 70,501,064 66,524,466 Income on investments 38,512,782 32,884,246 Interest on balances with Reserve Bank of India and other inter-bank funds 3,277,876 4,131,852 Others 1,764,601 1,459,939 Total Interest Earned 114,056,323 105,000,503
11. Other Assets
Inter-offi ce adjustment (net) – – Interest accrued 13,106,050 15,912,951 Tax paid in advance/TDS (net of provision for tax) 41,571,743 23,536,470 Deferred Tax asset [Refer Note 18 E (8)] 7,552,301 26,401,282 Stationery and stamps 10,653 5,790 Mark-to-market adjustments on Foreign exchange and Derivative contracts 281,061,914 190,695,422 Others* 77,824,210 61,082,848
Total Other Assets 421,126,871 317,634,763
* Pursuant to RBI circular DBR.BP.BC.No.31/21.04.018/2015-16 dated 16 July 2015, the Bank has included deposits placed with NABARD/NHB/SIDBI/MUDRA of ` 30,212,510 (in 000s) (2018-19 37,648,881 (in 000s)).
12. Contingent Liabilities
Claims against the Bank not acknowledged as debts 32,771,664 19,805,400 Liability for partly paid investments – – Liability on account of outstanding foreign exchange contracts 7,874,610,798 7,252,130,946 Liability on account of derivative contracts 10,836,348,408 14,991,228,163 Guarantees given on behalf of constituents – – – in India 295,057,470 273,053,573 – outside India 116,357,298 88,783,543 Acceptances, endorsements and other obligations 125,288,590 120,746,718 Other items for which the Bank is contingently liable 69,502,294 31,695,823
Total Contingent Liabilities 19,349,936,522 22,777,444,166 ECO
NOM
IC &
PO
LITI
CAL
WEE
KLY
Standard CharteredStandard Chartered Bank – India Branches(Incorporated in the United Kingdom with limited liability)
Published on Saturday, june 27, 2020 vol lV nos 26 & 27 EPW Economic & Political Weekly368
Schedules to the fi nancial statements for the year ended 31 March 202018. Signifi cant accounting policies and notes to fi nancial statementsA) Background The accompanying fi nancial statements for the year ended 31 March 2020 comprise the accounts of India branches of Standard Chartered
Bank (‘SCBʼ or ‘the Bankʼ), which is incorporated with limited liability in the United Kingdom. The Bank s ultimate holding company is Standard Chartered PLC (‘SCPLCʼ), which is incorporated in the United Kingdom.
B) Basis of preparation The fi nancial statements are prepared and presented under the historical cost convention on the accrual basis of accounting, unless otherwise
stated, and in accordance with Generally Accepted Accounting Principles (‘GAAPʼ) in India, statutory requirements of the Banking Regulation Act, 1949, circulars and guidelines issued by the Reserve Bank of India (‘RBIʼ) from time to time, the Accounting Standards (‘ASʼ) specifi ed under section 133 of the Companies Act, 2013 read with Rule 7 of Companies (Accounts) Rules 2014 and Companies (Accounting Standards) Rules, 2006 (as amended) to the extent applicable and current practices prevailing within the banking industry in India.
The fi nancial statements are presented in Indian Rupees rounded off to the nearest thousand, unless otherwise stated.C) Use of estimates The preparation of the fi nancial statements in conformity with GAAP requires the management to make estimates and assumptions that
affect the reported amounts of assets, liabilities, income and expenses and disclosures relating to the contingent liabilities as at the date of fi nancial statements. Management believes that the estimates used in the preparation of the fi nancial statements are prudent and reasonable. Actual result could differ from those estimates. Any revision to accounting estimates is recognized prospectively in current and future periods.
D) Signifi cant Accounting Policies (1) Investments Classifi cation and valuation of the Bank s investments is carried out in accordance with the RBI guidelines. Classifi cation Investments are classifi ed as ‘Held to Maturityʼ (‘HTMʼ) or ‘Held for Tradingʼ (‘HFTʼ) or ‘Available for Saleʼ (‘AFSʼ) at the time of
their purchase. Investments acquired by the Bank with the intention of holding up to maturity are classifi ed as HTM. Investments acquired with the intention to trade by taking advantage of short-term price/interest rate movements and are to be sold within 90 days are classifi ed as HFT. All other investments are classifi ed as AFS.
The Bank follows settlement date accounting for its investments. In the fi nancial statements, investments in India are disclosed under six categories in Schedule 8 – Investments as per the requirements
of the RBI guidelines. Valuation Cost of investments is determined using the weighted average cost method. Investments classifi ed as HTM are carried at acquisition cost. Any premium on acquisition is amortized over the remaining period till
maturity on the basis of a constant yield to maturity. In terms of RBI guidelines, discount on securities held under HTM category is not accrued and such securities are held at the acquisition cost till maturity. Where in the opinion of management and in accordance with RBI guidelines, there is any diminution in the value of any HTM security, which is other than temporary, appropriate provisions are made.
Investments classifi ed as AFS or HFT are marked to market as per frequency prescribed by RBI. Net depreciation for each classifi cation in respect of any category mentioned in Schedule 8 – Investments, is recognized in the Profi t and Loss Account. Net appreciation, if any, is ignored.
The mark to market value of investments in debt securities classifi ed as HFT and AFS is determined using prices or on the basis of the base yield curve and the applicable spreads as notifi ed by Fixed Income Money Market and Derivatives Association (‘FIMMDA ) jointly with Primary Dealers Association of India (‘PDAIʼ) and Financial Benchmarks India Private Limited (‘FBIL ).
In line with the RBI guidance, Treasury Bills are marked to market using the Yield to Maturity (YTM) rate as published by FIMMDA/FBIL. Certifi cate of Deposits and Commercial Paper are valued at carrying cost including the pro rata discount accreted for the holding
period. Brokerage and commission on debt instruments paid at the time of acquisition are charged to the Profi t and Loss Account. Valuations
are adjusted for illiquidity; the illiquidity adjustments are based on management estimates. Non-performing investments are identifi ed and valued based on the RBI guidelines. Transfer between categories Transfer of investments between categories is accounted in accordance with provisions of the RBI guidelines: a) Securities transferred from AFS/HFT category to HTM category are transferred at the lower of book value or market value. b) Securities placed under the HTM category at a discount, are transferred to AFS/HFT category at the acquisition price/book value. c) Securities placed under the HTM category at a premium, are transferred to the AFS/HFT category at the amortized cost. d) Securities transferred from AFS to HFT category or vice-versa, are transferred at book value and provisions held for
accumulated depreciation, if any, is transferred to provisions for depreciation against the HFT securities and vice-versa. Accounting for repurchase/reverse repurchase In accordance with the RBI Circular FMRD.DIRD.10/14.03.002/2015-16 dated 19 May 2016, repurchase (repos) and reverse
repurchase (reverse repos) are accounted as collateralized borrowing and lending. The Bank also follows the aforesaid principle to account repo and reverse repo transactions undertaken under Liquidity Adjustment Facility (‘LAFʼ).
ECO
NOM
IC &
PO
LITI
CAL
WEE
KLY

Standard CharteredStandard Chartered Bank – India Branches(Incorporated in the United Kingdom with limited liability)
Economic & Political Weekly EPW Published on Saturday, june 27, 2020 vol lV nos 26 & 27 369
(1) Investments (Continued) Short sales In accordance with the RBI guidelines, the bank undertakes short sale transactions in Central Government dated securities. Such short
positions are categorized under HFT category. These positions are marked to market along with the other securities under HFT portfolio and the resultant marked to market losses/gains are accounted for as per the relevant RBI guidelines for valuation of investments.
Investment fl uctuation reserve (IFR) With a view to building up of adequate reserves to protect against increase in yields, RBI through circular number RBI/2017-18/147
DBR.No.BP. BC.102/21.04.048/2017-18 dated April 2, 2018, advised all banks to create an IFR with effect from the FY 2018-19. The amount transferred to IFR will be lower of the following (i) net profi t on sale of investments during the year or (ii) net profi t for the
year less mandatory appropriations, until the amount of IFR is at least 2 percent of the HFT and AFS portfolio, on a continuing basis. (2) Advances Classifi cation and provisioning of advances of the Bank are carried out in accordance with the RBI guidelines on Prudential Norms on
Income Recognition, Asset Classifi cation and Provisioning pertaining to advances. Classifi cation Advances are classifi ed into performing and non-performing advances (‘NPA ) based on management s periodic internal assessment
and RBI s prudential norms on classifi cation. Further, NPAs are classifi ed into substandard, doubtful and loss assets based on the criteria stipulated by RBI.
The Bank transfers advances through inter-bank participation with and without risk. In accordance with the RBI guidelines, in the case of participation with risk, the aggregate amount of the participation issued by the Bank is reduced from advances and where the Bank is participating, the aggregate amount of the participation is classifi ed under advances. In the case of participation without risk, the aggregate amount of participation issued by the Bank is classifi ed under borrowings and where the Bank is participating, the aggregate amount of participation is shown as due from banks under advances.
Provisioning Advances are stated net of specifi c provisions and interest in suspense. Specifi c provisions are made based on management s
assessment of the degree of impairment of the advances and in accordance with the Bank s internal policy on specifi c provisioning for NPAs, subject to minimum provisioning norms laid down by the RBI.
For restructured advances, provision is made in accordance with the RBI guidelines, which requires the diminution in the fair value of the advances to be provided at the time of restructuring.
The Bank maintains provision on standard advances as per the norms prescribed by RBI and based on management s periodic assessment, considering the extant environment or information relating to specifi c borrowers, subject to minimum prescribed in the guidelines and discloses the same in Schedule 5 - Other Liabilities and Provisions.
(3) Securitization (including assignment) The Bank securitizes advances to Special Purpose Vehicles (‘SPVʼ). Securitized assets are derecognized if they are transferred to the
SPV in compliance with all the conditions of true sale as prescribed in ‘Guidelines on Securitization transactionsʼ issued by RBI. Securitization transactions which do not meet the criteria for derecognition are accounted for as secured borrowings.
In accordance with the guidelines, gain arising on securitization is amortized over the life of the securities issued/to be issued by the SPV. Loss, if any, is recognized immediately in the Profi t and Loss Account.
The Bank also follows the aforesaid principles to ascertain de-recognition of standard loans and advances through direct assignment and the gain arising upon such direct assignment is amortized over the life of the loans and advances sold. Loss, if any, is recognized immediately in the Profi t and Loss Account.
In respect of credit enhancements provided or recourse obligations accepted by the Bank at the time of securitization or direct assignment, appropriate provisions/disclosures are made in accordance with AS 29 – Provisions, Contingent Liabilities and Contingent Assets.
(4) Derivative transactions Derivative transactions comprise forward exchange contracts, interest rate swaps, currency futures, cross currency swaps and options
and are undertaken for either trading or hedging purposes. Trading derivatives are marked to market and the resultant unrealized gain or loss is recognized in the Profi t and Loss Account under
Schedule 14 - Other Income. Options are marked to market and unrealized gain or loss on revaluation is recorded in the Profi t and Loss Account. The premium received or paid is recognized in the Profi t and Loss Account upon expiry or exercise of the options. Valuations are adjusted for illiquidity, Credit Valuations Adjustments based on management estimates.
Hedging transactions are undertaken by the Bank to protect the change in the fair value or the cash fl ow of the underlying assets or liabilities. The hedging instrument is accounted for on accrual basis except for an instrument designated with an asset or liability that is carried at market value or lower of cost or market value in the fi nancial statements. In that case the hedging instrument is marked to market with the resulting gain or loss recorded as an adjustment to the market value of the designated asset.
(5) Income recognition Revenue is recognised to the extent that it is possible, that the economic benefi ts will fl ow to the Bank and the revenue can be reliably
measured, is so far as it is consistent with the statutory provisions and the guidelines issued by the RBI. Interest income on advances is recognized on accrual basis, except in case of interest on NPAs, which is recognized as income on
receipt, in accordance with RBI guidelines. Interest income on discounted instruments is recognized over the tenor of the instrument on a constant effective yield basis.
Commission on guarantees and letters of credit are recognized over the facility tenor. Fees on loans and credit cards are recognized at the inception of the transactions. Fee from management advisory services, structuring and such other services is recognized based on applicable service contracts and any substantial fee is amortised over the effective life of the facility.
Schedules to the fi nancial statements for the year ended 31 March 2020 (Continued)D) Signifi cant Accounting Policies (Continued)
ECO
NOM
IC &
PO
LITI
CAL
WEE
KLY

Standard CharteredStandard Chartered Bank – India Branches(Incorporated in the United Kingdom with limited liability)
Published on Saturday, june 27, 2020 vol lV nos 26 & 27 EPW Economic & Political Weekly370
Schedules to the fi nancial statements for the year ended 31 March 2020 (Continued)
Realized gains on investments under the HTM category are recognized in the Profi t and Loss Account and subsequently appropriated to Capital Reserve net of tax expense and transfer to Statutory Reserves. Losses are recognized in the Profi t and Loss Account in accordance with RBI guidelines.
Recoveries from Bad Debt written off are recognized in the Profi t & Loss Account. Dividend on Equity shares are recognized as income when the right to receive dividend is established. (6) Fixed assets (including goodwill/intangibles) Fixed assets are accounted for as per AS 10 – Accounting for Property, Plant and Equipment. Fixed assets are stated at acquisition cost less accumulated depreciation, with the exception of premises which are revalued
periodically and are stated at revalued cost less accumulated depreciation. Borrowing costs that are attributable to the acquisition of qualifying assets are capitalized as part of the cost of such assets in accordance
with AS 16 – Borrowing Costs. A qualifying asset is one that necessarily takes a substantial period of time to get ready for intended use. Depreciation is provided on a straight line basis over the useful life of the asset as per the management s internal assessment, subject
to useful life prescribed under the Companies Act, 2013. In the case of premises, depreciation is provided on revalued cost. On disposal of revalued premises, the amount standing to the credit of revaluation reserve is transferred to Capital Reserve in accordance with the RBI guidelines.
Profi t on disposal of premises is recognized in the Profi t and Loss Account and subsequently appropriated to Capital Reserve net of tax expense and transfer to statutory reserve. Losses are recognized in the Profi t and Loss Account.
Fixed assets individually costing less than `250 (in 000s) are expensed in the year of purchase, except where individual assets are purchased and installed as part of the owned and leasehold improvement projects, in which case they are capitalized as improvements to property. DCR (Desktop Computer Renewal) assets, User assets (Note books, Desktops, Workstations) are capitalized with 3 yearsʼ useful life and other hardware (more than or equal to `250 (in 000s)) is capitalized with 5 yearsʼ useful life. Computer software less than 25,000 (in 000s) is expensed in the year of purchase.
Software costing more than equal to 25,000 (in 000s) but less than 50,000 (in 000s) are capitalized with useful life of 3 years and anything costing more than or equal 50,000 (in 000s) is considered as signifi cant software asset and it is capitalized with useful life of 5 years.
Goodwill and other intangibles are recognized on business acquisition and represents the difference between the price paid and the assets and liabilities acquired, which would include any identifi able intangible assets (such as customer or core deposit relationships). These are amortized on a straight-line basis over the best estimate of their useful life as determined by the management.
The depreciation rates applied on other fi xed assets are as follows: Category Depreciation rate per annum (%) Computers 20/33.33 Plant 20 Furniture and Fixtures 20 Motor Vehicles 33 Electrical Installations 14 Improvements to property (1) 20 Computer Software (2) 20/33.33 Goodwill/Intangibles 20 (1) Improvements to owned and leasehold property are depreciated over the remaining useful life/lease period subject to a
maximum period of fi ve years. (2) Acquisition costs and development costs are amortized over the expected useful lives, subject to a maximum period of three to
fi ve years. Fixed assets are reviewed for impairment whenever events or changes in circumstances indicate that the carrying amount of an asset
may not be recoverable. Recoverability of assets to be held and used is measured by a comparison of the carrying amount of an asset to future net discounted cash fl ows expected to be generated by the asset or net realizable value, whichever is higher. If such assets are considered to be impaired, the impairment is recognized by charging the Profi t and Loss Account and is measured by the amount by which the carrying amount of the assets exceeds the fair value of the assets.
(7) Accounting for leases Assets given/taken on lease are accounted for in accordance with provisions of AS 19 – Leases. Lease payments under operating
leases are recognized as an expense on a straight line basis over the lease term. (8) Foreign currency transactions and balances Transactions in foreign currency are recorded at exchange rates prevailing on the date of the transaction. Exchange differences arising
on foreign exchange transactions settled during the year are recognized in the Profi t and Loss Account. Monetary assets and liabilities denominated in foreign currencies are translated at the Balance Sheet date at rates of exchange notifi ed
by the Foreign Exchange Dealersʼ Association of India (‘FEDAIʼ) and the resultant exchange differences are recognized in the Profi t and Loss Account.
Foreign currency contracts and forward rate agreements are revalued at the exchange rates notifi ed by FEDAI and where exchange rates are not notifi ed by FEDAI, are revalued at foreign exchange rates implied by swap curves. The profi t or loss on revaluation is recognized in the Profi t and Loss Account.
Contingent liabilities on account of foreign exchange contracts, guarantees, acceptances, endorsements and other obligations denominated in foreign currencies are disclosed at the closing rates of exchange notifi ed by FEDAI.
D) Signifi cant Accounting Policies (Continued) (5) Income recognition (Continued)
ECO
NOM
IC &
PO
LITI
CAL
WEE
KLY

Standard CharteredStandard Chartered Bank – India Branches(Incorporated in the United Kingdom with limited liability)
Economic & Political Weekly EPW Published on Saturday, june 27, 2020 vol lV nos 26 & 27 371
(9) Retirement and other employee benefi ts Retirement and other employees benefi ts are accounted for as per AS 15 (Revised 2005) – Employee Benefi ts as set out below: a) Provident fund The Bank contributes to a recognized provident fund, which is a defi ned contribution scheme, for all its eligible employees.
The contributions are accounted for on an accrual basis and recognized in the Profi t and Loss Account. b) Gratuity The Bank has a gratuity scheme, which is a defi ned benefi t plan. The Bank s net obligation in respect of the gratuity benefi t
is calculated by estimating the amount of future benefi t that the employees have earned in return for their service in the current and prior periods. This benefi t is discounted to determine the present value of the obligation under the benefi t plan.
The present value of the obligation under such benefi t plan is determined based on actuarial valuation carried out by an independent actuary as at the year end, using the Projected Unit Credit Method which recognizes each period of service that give rise to additional unit of employee benefi t entitlement and measures each unit separately to build up the fi nal obligation.
The obligation is measured at present value of estimated future cash fl ows. The discount rates used for determining the present value are based on the market yields on Government Securities as at the balance sheet date.
Actuarial gains and losses are recognized immediately in the Profi t and Loss Account. c) Superannuation The Bank contributes to an approved superannuation fund, which is a defi ned contribution scheme, for all its eligible employees
who have opted for the scheme. The contributions are accounted for on an accrual basis and recognized in the Profi t and Loss Account. d) Pension The Bank has a pension scheme for its award staff, which is a defi ned benefi t plan. The Bank s net obligation in respect of the
pension benefi t is calculated by estimating the amount of future benefi t that the award staff have earned in return for their service in the current and prior periods. This benefi t is discounted to determine the present value of the obligation under the benefi t plan.
The present value of the obligation under such benefi t plan is determined based on actuarial valuation carried out by an independent actuary as at the year end, using the Projected Unit Credit Method which recognizes each period of service that give rise to additional unit of employee benefi t entitlement and measures each unit separately to build up the fi nal obligation.
The obligation is measured at present value of estimated future cash fl ows. The discount rates used for determining the present value are based on the market yields on Government Securities as at the balance sheet date.
Actuarial gains and losses are recognized immediately in the Profi t and Loss Account. e) Compensated absences The Bank has a leave encashment scheme for its award staff, which is a defi ned benefi t plan. The Bank s net obligation in
respect of the leave benefi t is calculated by estimating the amount of future benefi t that the award staff have earned in return for their service in the current and prior periods.
This benefi t is discounted to determine the present value of the obligation under the benefi t plan. The present value of the obligation under such benefi t plan is determined based on actuarial valuation carried out by an
independent actuary as at the year end, using the Projected Unit Credit Method which recognizes each period of service that give rise to additional unit of employee benefi t entitlement and measures each unit separately to build up the fi nal obligation.
The obligation is measured at present value of estimated future cash fl ows. The discount rates used for determining the present value are based on the market yields on Government Securities as at the balance sheet date.
Actuarial gains and losses are recognized immediately in the Profi t and Loss Account. (10) Taxation Income tax comprises current tax (i.e. amount of tax for the period, determined in accordance with the Income Tax Act, 1961 and the
rules framed thereunder) and deferred tax charge or credit (refl ecting the tax effects of timing differences between accounting income and taxable income for the year).
Current tax expense is recognized on an annual basis under the taxes payable method based on the estimated liability computed after taking credit for allowances and exemptions in accordance with the provisions of Income Tax Act, 1961.
The Bank accounts for deferred taxes in accordance with the provisions of AS 22 – Accounting for Taxes on Income. The deferred tax charge or credit and the corresponding deferred tax liabilities or assets are recognized using the tax rates that have been enacted or substantively enacted at the Balance Sheet date.
Deferred tax assets are recognized only to the extent there is reasonable certainty that the assets can be realized in future. In case there is unabsorbed depreciation or carried forward loss under taxation laws, deferred tax assets are recognized only if there is virtual certainty of realization of such assets.
Deferred tax assets are reviewed at each Balance Sheet date and appropriately adjusted to refl ect the amount that is reasonably/virtually certain to be realized.
Minimum Alternative Tax (‘MATʼ) under the provisions of the Income-tax Act, 1961 is recognized as current tax in the Profi t and Loss Account. The credit available under the Act in respect of MAT paid is recognized as an asset only when and to the extent there is convincing evidence that the Bank will pay normal income tax during the period for which the MAT credit can be carried forward for set-off against the normal tax liability. MAT credit recognized as an asset is reviewed at each Balance Sheet date and written down to the extent the aforesaid convincing evidence no longer exists.
Schedules to the fi nancial statements for the year ended 31 March 2020 (Continued)D) Signifi cant Accounting Policies (Continued)
ECO
NOM
IC &
PO
LITI
CAL
WEE
KLY

Standard CharteredStandard Chartered Bank – India Branches(Incorporated in the United Kingdom with limited liability)
Published on Saturday, june 27, 2020 vol lV nos 26 & 27 EPW Economic & Political Weekly372
The Bank creates a provision when there is a present obligation as a result of past events that probably requires an outfl ow of resources embodying economic benefi ts and a reliable estimate can be made of the amount of such obligation. A disclosure for a contingent liability is made when there is a possible obligation or a present obligation that may, but probably will not, require an outfl ow of resources. When there is a possible obligation or a present obligation in respect of which the likelihood of outfl ow of resources is remote, no provision or disclosure is made.
Provisions are reviewed at each Balance Sheet date and adjusted to refl ect the current best estimate. If it is no longer probable that an outfl ow of resources would be required to settle the obligation, the provision is reversed.
Contingent assets are neither recognized nor disclosed in the fi nancial statements. However, if it is virtually certain that an economic benefi t will arise, the asset and related income are recognized in the period in which the change occurs.
(12) Provision for reward points awarded to customers The Bank has a policy of awarding reward points to customers for credit/debit card spends and remote banking. Provision for such
reward points is made on the basis of behavioral analysis of utilisation trends.E) Notes to accounts (1) Statutory Disclosures (i) Capital Adequacy Ratio (` in 000s) As at 31-Mar-20 As at 31-Mar-19 Capital Ratios Common Equity Tier I 13.91% 14.67% Tier I Capital 13.91% 14.67% Tier II Capital 0.98% 0.79% Total Capital Ratio (CRAR) 14.89% 15.46% Amount of equity capital raised – – Amount of additional Tier I capital raised – – Amount of Tier II capital raised – – Total Capital 274,258,561 259,440,499 Total Risk weighted assets and contingents 1,842,283,309 1,678,238,212 Capital adequacy has been calculated based on RBI guidelines. (ii) Business Ratios Sr. For the year ended For the year ended No. 31-Mar-20 31-Mar-19 i. Interest income as a % to working funds 1 7.15% 6.70% ii. Non-interest income as a % to working funds 1 1.92% 1.17% iii. Operating profi t as a % to working funds 1 3.71% 2.51% iv. Return on assets 1 1.78% 1.38% v. Business (deposits + advances) per employee (` in 000s)2 & 3 271,311 259,633 vi. Profi t per employee (` in 000s)3 4,423 3,318 1 Computed based on average of total assets as per Form X submitted to RBI 2 Computed based on deposits plus advances (excluding inter-bank deposits) outstanding as at the year end 3 Computed based on number of employees as at the year end (iii) Maturity Pattern of Assets and Liabilities As at 31 March 2020 (` in 000s) Maturity Bucket Loans and Investments Deposits * Borrowings * Foreign Foreign Advances * Currency Currency
Assets Liabilities Day 1 10,199,367 219,066,599 20,758,279 6,152,214 34,759,394 17,905,632 2 – 7 days 32,422,376 20,796,223 177,365,153 3,500,000 142,854 13,162,101 8 – 14 days 54,752,776 22,532,050 160,355,234 419,700 893,009 18,007,792 15 – 30 days 31,216,474 9,107,146 45,939,717 394,800 6,934,836 1,233,009 31 days and upto 2 months 31,901,663 16,074,840 60,817,558 55,063,750 10,472,244 44,359,558 2 months and upto 3 months 68,161,844 21,233,510 72,830,159 39,514,050 11,298,542 29,803,285 Over 3 months – 6 months 60,917,322 37,449,972 55,123,392 2,693,400 14,968,817 7,986,115 Over 6 months – 1 year 72,853,431 19,016,400 32,782,460 37,556,600 14,655,910 12,772,177 Over 1 year – 3 years 197,645,789 89,318,651 377,886,478 21,961,277 30,339,661 42,756,467 Over 3 years – 5 years 70,384,834 20,207,278 87,394 – 19,785,641 14,354,620 Over 5 years 131,681,404 1,213,957 – – 6,637,626 3,377,988 Total 762,137,280 476,016,626 1,003,945,824 167,255,791 150,888,534 205,718,744 * Including foreign currency balances Note: Classifi cation of assets and liabilities under the maturity buckets is based on the same estimates and assumptions as used by the
Bank for compiling the return submitted to RBI. Accordingly, investments are reported after applying haircut as per RBI guidelines, as per the Bank s internally approved policies.
Schedules to the fi nancial statements for the year ended 31 March 2020D) Signifi cant Accounting Policies (Continued) (11) Provisions, contingent liabilities and contingent assets
ECO
NOM
IC &
PO
LITI
CAL
WEE
KLY

Standard CharteredStandard Chartered Bank – India Branches(Incorporated in the United Kingdom with limited liability)
Economic & Political Weekly EPW Published on Saturday, june 27, 2020 vol lV nos 26 & 27 373
RBI vide its circular dated March 27, 2020 on ‘COVID-19 Regulatory Package , the Bank has offered moratorium and accordingly impacted cash fl ow is presented in the respective maturity buckets.
As at 31 March 2019 (` in 000s) Maturity Bucket Loans and Investments Deposits * Borrowings * Foreign Foreign Advances * Currency Currency
Assets Liabilities Day 1 11,497,300 189,138,623 13,930,815 699,220 56,742,198 5,330,968 2 – 7 days 38,936,164 23,158,846 110,187,242 2,074,650 977,136 13,652,513 8 – 14 days 43,626,425 46,845,016 106,390,167 26,309,999 1,843,736 14,041,998 15 – 30 days 28,106,277 10,611,487 47,193,552 195,000 6,354,067 766,191 31 days and upto 2 months 28,262,880 34,934,011 132,742,932 12,828,100 11,469,802 2,704,563 2 months and upto 3 months 30,712,627 43,035,035 140,532,531 17,147,825 8,528,414 9,421,707 Over 3 months – 6 months 50,562,895 42,496,170 102,978,273 10,958,250 10,945,365 20,199,288 Over 6 months – 1 year 45,413,549 38,699,111 76,924,232 6,870,000 6,361,167 24,054,463 Over 1 year – 3 years 176,011,800 62,451,929 319,844,401 38,196,625 11,294,352 31,856,384 Over 3 years – 5 years 59,573,496 38,823,242 150,904 – 5,897,277 6,144,068 Over 5 years 155,677,298 1,206,044 – – 2,644,362 2,784,510 Total 668,380,711 531,399,514 1,050,875,049 115,279,669 123,057,876 130,956,653 * Including foreign currency balances Note: Classifi cation of assets and liabilities under the maturity buckets is based on the same estimates and assumptions as used by the
Bank for compiling the return submitted to RBI. Accordingly, investments is reported after applying haircut as per RBI guidelines, as per the Bank s internally approved policies.
(iv) Investments(` in 000s)
As at 31-Mar-20 As at 31-Mar-19 Value of Investments (i) Gross Value of Investments 492,800,071 550,382,311 (a) In India 492,800,071 550,382,311 (b) Outside India – – (ii) Provisions for Depreciation 7,766,684 11,200,293 (a) In India 7,766,684 11,200,293 (b) Outside India – – (iii) Net Value of Investments 485,033,387 539,182,018 (a) In India 485,033,387 539,182,018 (b) Outside India – – The Bank has no sale and transfers to/from HTM category during the year (2018-19: Nil). (v) Movement of Provision held towards Depreciation on Investments
(` in 000s) For the year ended For the year ended 31-Mar-20 31-Mar-19 Balance, beginning of the year 11,200,293 9,786,863 Add: Provisions made during the year – 2,243,411 Less: Write-off/write back of excess provisions during the year (3,433,609) (829,981) Balance, end of the year 7,766,684 11,200,293 (vi) Repurchase and Reverse repurchase transactions including Liquidity Adjustment Facility (LAF) (face value) For the year ended 31 March 2020 (` in 000s) Minimum Maximum Daily average Outstanding outstanding outstanding outstanding as at during the year* during the year during the year* 31-Mar-20 Securities sold under repos (Government Securities) 50,000 182,656,348 45,920,397 – Securities purchased under reverse repos: i. Government Securities 2,350,000 122,246,910 38,886,284 90,211,870 ii. Corporate Debt securities 918,000 6,232,000 480,780 – * Minimum outstanding during the year excludes the days with nil outstanding and daily average is considered all days
Schedules to the fi nancial statements for the year ended 31 March 2020 (Continued)E) Notes to accounts (Continued) (1) Statutory Disclosures (Continued) (iii) Maturity Pattern of Assets and Liabilities (Continued)
ECO
NOM
IC &
PO
LITI
CAL
WEE
KLY

Standard CharteredStandard Chartered Bank – India Branches(Incorporated in the United Kingdom with limited liability)
Published on Saturday, june 27, 2020 vol lV nos 26 & 27 EPW Economic & Political Weekly374
For the year ended 31 March 2019 (` in 000s)
Minimum Maximum Daily average Outstanding outstanding outstanding outstanding as at during the year* during the year during the year* 31-Mar-19 Securities sold under repos (Government Securities) 50,000 68,967,800 11,716,088 25,825,390 Securities purchased under reverse repos (Government Securities) 10,480,000 119,173,820 47,466,268 61,785,210 * Minimum outstanding during the year excludes the days with nil outstanding and daily average is considering all days.
(vii) Issuer composition of non-SLR investments As at 31 March 2020
(` in 000s) Issuer Total Amount Extent of Extent of ‘Below Extent of Extent of Private Investment Unrated Unlisted Placement Gradeʼ Securities Securities Securities* (a) (b) (c) (d) PSU 9,700 9,700 – 9,700 9,700 Financial institutions 17,812,929 14,980,000 – – 5,980,000 Banks 127 127 – 127 127 Private corporate 37,876,445 37,876,445 5,563,049 6,085,421 13,233,865 Subsidiaries/Joint Venture – – – – – Others 29,061,790 29,061,790 315,399 315,399 29,061,790 Provisions held towards depreciation (6,411,918) (6,403,985) (5,875,263) (6,262,481) (3,296,740) Total 78,349,073 75,524,077 3,185 148,166 44,988,742 * Excludes investments which are in process of listing As at 31 March 2019
(` in 000s) Issuer Total Amount Extent of Extent of ‘Below Extent of Extent of Private Investment Unrated Unlisted Placement Gradeʼ Securities Securities Securities* (a) (b) (c) (d) PSU 9,700 9,700 – 9,700 9,700 Financial institutions 25,446,079 18,161,810 – – 3,411,810 Banks 127 127 – 127 127 Private corporate 58,175,685 58,175,685 6,594,417 6,779,418 21,729,800 Subsidiaries/Joint Venture – – – – – Others 37,903,323 37,903,323 315,399 315,399 37,903,323 Provisions held towards depreciation (7,887,560) (7,880,310) (6,855,382) (6,905,228) (3,287,573) Total 113,647,354 106,370,335 54,434 199,416 59,767,187 * Excludes shares which have been suspended for trading in the exchange Note: Total investments include investments in Pass Through Certifi cates (PTCs) of 28,746 million (gross) (2018-19: 37,588 million) Amounts reported under column (a), (b), (c) and (d) above are not mutually exclusive.
(viii) Movement in non-performing non-SLR investments (` in 000s)
For the year ended For the year ended 31-Mar-20 31-Mar-19 Balance, beginning of the year 6,909,816 6,990,714 Additions during the year – 772,511 Reductions during the year (1,031,368) (853,409) Balance, end of the year 5,878,448 6,909,816 Total Provisions held at the end of the year 5,875,263 6,855,382
Schedules to the fi nancial statements for the year ended 31 March 2020 (Continued)E) Notes to accounts (Continued) (1) Statutory Disclosures (Continued) (vi) Repurchase and Reverse repurchase transactions including LAF (face value) (Continued)
ECO
NOM
IC &
PO
LITI
CAL
WEE
KLY

Standard CharteredStandard Chartered Bank – India Branches(Incorporated in the United Kingdom with limited liability)
Economic & Political Weekly EPW Published on Saturday, june 27, 2020 vol lV nos 26 & 27 375
(ix) Disclosures relating to NPAs and related provisions The percentage of net NPAs to net advances is 0.80% as at 31 March 2020 (previous year: 0.39%). The Provision Coverage Ratio (PCR) is 92.73% as at 31 March 2020 (previous year: 96.78%).
(` in 000s) Movement of Gross NPAs For the year ended For the year ended 31-Mar-20 31-Mar-19 Balance, beginning of the year 66,907,776 84,411,009 Additions during the year 24,852,072 14,196,060 Reductions during the year (40,247,486) (31,699,293) Balance, end of the year 51,512,362 66,907,776
(` in 000s) Movement of Net NPAs For the year ended For the year ended 31-Mar-20 31-Mar-19 Balance, beginning of the year 2,598,361 3,738,457 Additions during the year 7,191,260 735,096 Reductions during the year (3,700,490) (1,875,192) Balance, end of the year 6,089,131 2,598,361
(` in 000s) Movement in Provision for NPAs For the year ended For the year ended 31-Mar-20 31-Mar-19 Balance, beginning of the year 64,309,415 80,672,552 Additions during the year 17,660,812 13,460,964 Reductions during the year (36,546,996) (29,824,101) Balance, end of the year 45,423,231 64,309,415
(` in 000s) Concentration of NPAs As at 31-Mar-20 As at 31-Mar-19 Total exposure to top four NPA accounts 17,272,405 27,077,117 There was no divergence in asset classifi cation and provisioning during the current year and previous year, requiring detailed
disclosures pursuant to RBI/2018-19/157 circular no. DBR.BP.BC.No.32/21.04.018/2018-19 dated April 1, 2019 and RBI/2016-17/283 circular no. DBR.BP.BC.No.63/21.04.018/2016-17 dated 18 April 2017.
Disclosure is in accordance with RBI guidelines: Percentages of gross NPA to total advances (` in 000s) As at 31-Mar-20 As at 31-Mar-19 Sector Outstanding Gross % of Gross Outstanding Gross % of Gross
total NPAʼs NPA to total total NPAʼs NPA to total advances advances in advances advances in
that sector that sector (A) Priority Sector Agriculture & allied activities 61,592,082 383,680 0.62% 29,821,025 98,691 0.33% Advances to industries sector eligible as priority sector lending 57,680,589 3,063,920 5.31% 51,623,316 1,428,727 2.77% – Basic Metal and Metal Products 6,455,851 211,579 3.28% 6,551,096 131,429 2.01% – Infrastructure 5,898,711 312,845 5.30% 4,372,373 - 0.00% – Construction 3,891,206 6,665 0.17% 2,753,544 9,717 0.35% Services 132,036,914 4,361,651 3.30% 121,401,903 2,270,305 1.87% – Trade 80,744,077 2,882,922 3.57% 86,678,819 1,867,816 2.15% – Commercial Real Estate 14,523,032 452,107 3.11% 7,704,768 - 0.00% Personal Loans 9,060,523 512,935 5.66% 27,870,141 576,669 2.07% Sub total (A) 260,370,108 8,322,185 3.20% 230,716,385 4,374,392 1.90% (B) Non-priority sector Agriculture & allied activities 440,706 401,033 91.00% 1,106,910 4,550 0.41% Industry 209,620,351 23,525,575 11.22% 171,296,351 42,224,823 24.65% – Basic Metal and Metal Products 22,802,170 244,836 1.07% 20,476,311 376,326 1.84% – Infrastructure 66,340,091 6,647,928 10.02% 54,362,702 17,997,914 33.11% – Construction 25,532,668 628,151 2.46% 5,747,560 135,422 2.36% Services 233,237,575 15,280,189 6.55% 188,747,402 16,151,871 8.56% – Trade 25,371,497 3,828,985 15.09% 26,591,068 6,894,768 25.93% – Commercial Real Estate 125,423,177 9,743,540 7.77% 111,996,475 5,683,152 5.07% Personal Loans 103,891,771 3,983,380 3.83% 140,823,079 4,152,140 2.95% Sub total (B) 547,190,403 43,190,176 7.89% 501,973,742 62,533,384 12.46% Total (A+B) 807,560,511 51,512,362 6.38% 732,690,127 66,907,776 9.13%
Schedules to the fi nancial statements for the year ended 31 March 2020 (Continued)E) Notes to accounts (Continued) (1) Statutory Disclosures (Continued)
ECO
NOM
IC &
PO
LITI
CAL
WEE
KLY

Standard CharteredStandard Chartered Bank – India Branches(Incorporated in the United Kingdom with limited liability)
Published on Saturday, june 27, 2020 vol lV nos 26 & 27 EPW Economic & Political Weekly376
(` in 000s) Movement in Gross NPA For the year ended For the year ended 31-Mar-20 31-Mar-19 Gross NPAs as on 01 April 66,907,776 84,411,009 Additions (fresh NPAs) during the year 24,852,072 14,196,060 Sub-total (A) 91,759,848 98,607,069 Less:- (i) Upgradations (2,922,662) (2,051,091) (ii) Recoveries (excluding recoveries made from upgraded accounts) (6,214,990) (6,561,224) (iii) Technical/Prudential Write-offs (18,717,425) (13,667,678) (iv) Write-offs other than those under (iii) above (12,392,409) (9,419,300) Sub-total (B) (40,247,486) (31,699,293) Gross NPAs as on 31 March (A - B) 51,512,362 66,907,776 (` in 000s) Movement in Technical/Prudential write-offs For the year ended For the year ended 31-Mar-20 31-Mar-19 Opening balance of Technical/Prudential written-off accounts as on 01 April 13,667,678 – Add: Technical/Prudential Write-offs during the year 18,717,425 13,667,678 Sub-total (A) 32,385,103 13,667,678 Less: Recoveries made from previously technical/prudential written-off accounts during the year (B) (140,751) – Closing balance as on 31 March (A-B) 32,244,352 13,667,678 (x) Concentration of Advances* (` in 000s) As at 31-Mar-20 As at 31-Mar-19 Total advances to twenty largest borrowers 570,375,641 505,684,275 Percentage of advances to twenty largest borrowers to total advances of the Bank 17.22% 16.12% * Advances are computed as per defi nition of credit exposure (including derivatives) as per the RBI guidelines on exposure norms. (xi) Concentration of Exposures* (` in 000s) As at 31-Mar-20 As at 31-Mar-19 Total exposure to twenty largest borrowers/customers 578,260,421 510,234,275 Percentage of exposures to twenty largest borrowers/customers to total exposure of the Bank on borrowers/customers 15.96% 15.01% * Exposures are computed as per defi nition of credit and investment exposure as per the RBI guidelines on exposure norms. (xii) Provision towards Standard Assets, Country Risk Exposure and Novel Coronavirus (COVID-19) a) Provision towards Standard Assets and Country Risk Exposure
(` in 000s) As at 31-Mar-20 As at 31-Mar-19 Provisions towards Standard Assets * 18,746,085 10,123,711 Provisions towards Country Risk Exposure 63,558 63,558 Total 18,809,643 10,187,269 * includes provision towards unhedged foreign currency exposure of 1,051 million (2018-19: 849 million). b) Novel Coronavirus (COVID-19) The novel coronavirus (COVID-19) pandemic continues to spread across the globe including India. COVID-19 outbreak has
been declared a global pandemic by the World Health Organization and it has taken its toll on not just human life, but business and fi nancial markets too, the extent of which is currently unascertainable. The extent to which COVID-19 pandemic will impact the Bank s operations and fi nancial results is dependent on the future developments, which are highly uncertain, including among many the other things, any new information concerning the severity of the pandemic and any action to contain its spread or mitigate its impact whether government mandated or elected by the Bank.
Schedules to the fi nancial statements for the year ended 31 March 2020 (Continued)E) Notes to accounts (Continued) (1) Statutory Disclosures (Continued) (ix) Disclosures relating to NPAs and related provisions (Continued)
ECO
NOM
IC &
PO
LITI
CAL
WEE
KLY

Standard CharteredStandard Chartered Bank – India Branches(Incorporated in the United Kingdom with limited liability)
Economic & Political Weekly EPW Published on Saturday, june 27, 2020 vol lV nos 26 & 27 377
In accordance with the RBI guidelines relating to COVID-19 Regulatory Package dated 27 March, 2020 and 17 April, 2020, the Bank is granting moratorium on the payment of instalments and/or interest, as applicable, to eligible borrowers. In accordance with RBI guidelines, the moratorium period, wherever granted, is excluded by the Bank from the number of days past-due for the purpose of asset classifi cation under RBI's Income Recognition and Asset Classifi cation norms. The bank has made general provision of 5% in respect of accounts under moratorium requiring provisioning as per aforesaid RBI guidelines based on the information available up to a point in time. Following are the details of such accounts and provisions made by the Bank:
(` in 000s) As at 31-Mar-20 (i) Respective amounts in SMA/overdue categories, where the moratorium/ deferment was extended 10,960,682 (ii) Respective amount where asset classifi cation benefi ts is extended. 1,380,337 (iii) Provisions made during the Q4 FY2020 548,034 (iv) Provisions adjusted during the periods against slippages – (v) Residual provisions 548,034 (xiii) Details of non-performing fi nancial assets purchased The amount of non-performing fi nancial assets purchased during the year is Nil. (2018–19: Nil). (xiv) Details of non-performing fi nancial assets sold (other than sold to Securitization Company/Reconstruction Company)
(` in 000s) For the year ended For the year ended 31-Mar-20 31-Mar-19 (a) Number of accounts sold during the year – – (b) Aggregate outstanding * – – (c) Aggregate consideration received – – * Net book value on date of sale
(xv) Details of sale of fi nancial assets to Securitization Company (SC)/Reconstruction Company (RC) for asset reconstruction(` in 000s)
For the year ended For the year ended 31-Mar-20 31-Mar-19 (i) No of accounts 42 3 (ii) Aggregate value (net of provisions) of accounts sold to SC /RC * – 76,103 (iii) Aggregate consideration 714,200 1,200,500 (iv) Additional consideration realised in respect of accounts transferred in earlier years – – (v) Aggregate gain over net book value 714,200 1,124,397 * Net book value on date of sale
(xvi) Spread Over of shortfall on Sale of NPAs to SC/RC
There is no spread over of Shortfall on Sale of NPAs to SC/RC (2018-19: Nil).
(xvii) Implementation of Resolution Plan
In terms of RBI Circular, June 7, 2019, the Bank has implemented Resolution Plan in one account during FY 2019-20. For four accounts Resolution Plan was not implemented and for which Bank has undertaken 20% additional Provision.
(xviii) Disclosures on change in ownership of projects under implementation (accounts which are currently under the stand-still period)
There were no project loan accounts during the year where bank has decided to effect the change in ownership. (2018-19: Nil).
Schedules to the fi nancial statements for the year ended 31 March 2020 (Continued)E) Notes to accounts (Continued) (1) Statutory Disclosures (Continued) (xii) Provision towards Standard Assets, Country Risk Exposure and Novel Coronavirus (COVID-19) (Continued) b) Novel Coronavirus (COVID-19) (Continued)
ECO
NOM
IC &
PO
LITI
CAL
WEE
KLY
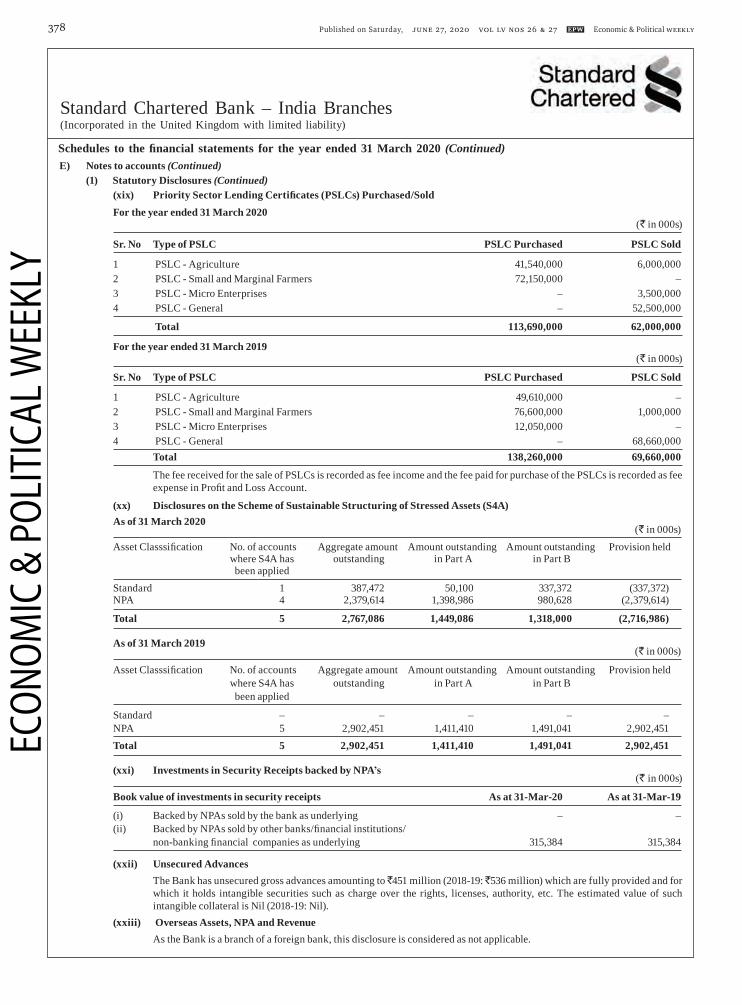
Standard CharteredStandard Chartered Bank – India Branches(Incorporated in the United Kingdom with limited liability)
Published on Saturday, june 27, 2020 vol lV nos 26 & 27 EPW Economic & Political Weekly378
(xix) Priority Sector Lending Certifi cates (PSLCs) Purchased/Sold For the year ended 31 March 2020 (` in 000s) Sr. No Type of PSLC PSLC Purchased PSLC Sold 1 PSLC - Agriculture 41,540,000 6,000,000 2 PSLC - Small and Marginal Farmers 72,150,000 – 3 PSLC - Micro Enterprises – 3,500,000 4 PSLC - General – 52,500,000 Total 113,690,000 62,000,000 For the year ended 31 March 2019 (` in 000s) Sr. No Type of PSLC PSLC Purchased PSLC Sold 1 PSLC - Agriculture 49,610,000 – 2 PSLC - Small and Marginal Farmers 76,600,000 1,000,000 3 PSLC - Micro Enterprises 12,050,000 – 4 PSLC - General – 68,660,000 Total 138,260,000 69,660,000 The fee received for the sale of PSLCs is recorded as fee income and the fee paid for purchase of the PSLCs is recorded as fee
expense in Profi t and Loss Account.
(xx) Disclosures on the Scheme of Sustainable Structuring of Stressed Assets (S4A) As of 31 March 2020 (` in 000s) Asset Classsifi cation No. of accounts Aggregate amount Amount outstanding Amount outstanding Provision held where S4A has outstanding in Part A in Part B been applied Standard 1 387,472 50,100 337,372 (337,372) NPA 4 2,379,614 1,398,986 980,628 (2,379,614) Total 5 2,767,086 1,449,086 1,318,000 (2,716,986)
As of 31 March 2019 (` in 000s) Asset Classsifi cation No. of accounts Aggregate amount Amount outstanding Amount outstanding Provision held where S4A has outstanding in Part A in Part B been applied Standard – – – – – NPA 5 2,902,451 1,411,410 1,491,041 2,902,451 Total 5 2,902,451 1,411,410 1,491,041 2,902,451
(xxi) Investments in Security Receipts backed by NPAʼs(` in 000s)
Book value of investments in security receipts As at 31-Mar-20 As at 31-Mar-19 (i) Backed by NPAs sold by the bank as underlying – – (ii) Backed by NPAs sold by other banks/fi nancial institutions/ non-banking fi nancial companies as underlying 315,384 315,384 (xxii) Unsecured Advances The Bank has unsecured gross advances amounting to 451 million (2018-19: 536 million) which are fully provided and for
which it holds intangible securities such as charge over the rights, licenses, authority, etc. The estimated value of such intangible collateral is Nil (2018-19: Nil).
(xxiii) Overseas Assets, NPA and Revenue As the Bank is a branch of a foreign bank, this disclosure is considered as not applicable.
Schedules to the fi nancial statements for the year ended 31 March 2020 (Continued)E) Notes to accounts (Continued) (1) Statutory Disclosures (Continued)
ECO
NOM
IC &
PO
LITI
CAL
WEE
KLY

Standard CharteredStandard Chartered Bank – India Branches(Incorporated in the United Kingdom with limited liability)
Economic & Political Weekly EPW Published on Saturday, june 27, 2020 vol lV nos 26 & 27 379
Sche
dule
s to
the
fi n
anci
al s
tate
men
ts f
or t
he y
ear
ende
d 31
Mar
ch 2
020
(Con
tinue
d)E
) N
otes
to a
ccou
nts (
Con
tinue
d)
(1)
Stat
utor
y D
iscl
osur
es (C
ontin
ued)
(xxi
v)
Acc
ount
s Res
truc
ture
d
Th
e dis
clos
ure o
f res
truc
ture
d ad
vanc
es v
ide R
BI g
uide
lines
is a
s und
er:
For t
he y
ear e
nded
31
Mar
ch 2
020
(` in
000
s)
Sr
. Ty
pe o
f Res
truc
turi
ng
Und
er C
DR
Mec
hani
sm
Oth
ers
Tota
l
No.
Ass
et C
lass
ifi ca
tion
Det
ails
St
and-
Su
b-
Dou
bt-
Loss
To
tal
Stan
d-
Sub-
D
oubt
- Lo
ss
Tota
l St
and-
Su
b-
Dou
bt-
Loss
To
tal
ard
Stan
d-
ful
ard
Stan
d-
ful
ard
Stan
d-
ful
ar
d
ar
d
ar
d
1
Re
struc
ture
d
No.
of b
orro
wer
s –
–
7
–
7
–
2
1
5
2
19
–
2
2
2
2
26
Acc
ount
s as o
n A
mou
nt
A
pril
1 of
the F
Y ou
tstan
ding
–
–
8
19,3
42
–
819
,342
–
6
,130
3
,465
,674
2
,457
3
,474
,261
–
6
,130
4
,285
,016
2
,457
4
,293
,604
(ope
ning
fi gu
res)
* P
rovi
sion
ther
eon
–
–
819
,342
–
8
19,3
42
–
3,6
67
3,4
65,6
74
2,4
57
3,4
71,7
98
–
3,6
67
4,2
85,0
16
2,4
57
4,2
91,1
40
2
Fr
esh
N
o. o
f bor
row
ers
–
–
–
–
–
–
4
–
–
4
–
4
–
–
4
re
struc
turin
g A
mou
nt
durin
g th
e yea
r ou
tstan
ding
–
–
1
78,4
71
–
178
,471
–
1
3,65
4
30,
470
–
4
4,12
4
–
13,
654
2
08,9
41
–
222
,595
Pr
ovisi
on th
ereo
n –
–
1
78,4
71
–
178
,471
–
8
,192
3
0,47
0
–
38,
662
–
8
,192
2
08,9
41
–
217
,133
3
U
pgra
datio
ns
No.
of
borro
wer
s –
–
–
–
–
1
–
(1
) –
–
1
–
(1
) –
–
to
restr
uctu
red
A
mou
nt
sta
ndar
d ca
tego
ry
outst
andi
ng
–
–
–
–
–
50,
100
–
–
–
5
0,10
0
50,
100
–
–
–
5
0,10
0
durin
g th
e FY
Prov
ision
ther
eon
–
–
–
–
–
–
–
–
–
–
–
–
–
–
–
4
Re
struc
ture
d
No.
of b
orro
wer
s –
–
–
–
–
–
–
–
–
–
–
–
–
–
–
sta
ndar
d ad
vanc
es
whi
ch ce
ase t
o at
tract
A
mou
nt
hi
gher
pro
visio
ning
ou
tstan
ding
–
–
–
–
–
–
–
–
–
–
–
–
–
–
–
an
d/or
addi
tiona
l
risk
wei
ght a
t the
end
Prov
ision
ther
eon
–
–
–
–
–
–
–
–
–
–
–
–
–
–
–
of th
e FY
and
henc
e
ne
ed n
ot b
e sho
wn
as
restr
uctu
red
stand
ard
adva
nces
at th
e
be
ginn
ing o
f the
ne
xt F
Y
5
D
owng
rada
tions
N
o. o
f bo
rrow
ers
–
–
(1)
1
–
–
(1
) –
1
–
–
(1
) (1
) 2
–
of re
struc
ture
d
Am
ount
ac
coun
ts du
ring
outst
andi
ng
–
–
(4
1,23
9)
41,
239
–
–
(2
,091
) (3
90,7
70)
392
,861
–
–
(2
,091
) (4
32,0
09)
434
,100
–
the F
Y Pr
ovisi
on th
ereo
n –
–
(4
1,23
9)
41,
239
–
–
(1
,255
) (3
90,7
70)
392
,861
8
36
–
(1,2
55)
(432
,009
) 4
34,1
00
836
6
W
rite-
offs
of
No.
of
restr
uctu
red
bo
rrow
ers
–
–
1
–
1
–
1
3
1
5
–
1
4
1
6
acco
unts
durin
g
Am
ount
the F
Y o
utsta
ndin
g –
–
2
42,6
48
3
242
,651
–
4
,040
8
66,1
91
392
,861
1
,263
,092
–
4
,040
1
,108
,839
3
92,8
64
1,5
05,7
43
7
Re
struc
ture
d
No.
of b
orro
wer
s –
–
5
1
6
1
4
11
2
1
8
1
4
16
3
2
4
Acc
ount
s as
on
Am
ount
Mar
ch 3
1 of
the F
Y ou
tstan
ding
–
–
713
,926
4
1,23
6
755
,162
5
0,10
0
13,
653
2
,239
,183
2
,457
2
,305
,393
5
0,10
0
13,
653
2
,953
,109
4
3,69
3
3,0
60,5
56
(clo
sing
fi gur
es)*
Pr
ovisi
on th
ereo
n –
–
71
3,926
41
,236
755,1
62
–
8,19
3 2,
239,1
83
2,45
7 2,
249,8
33
–
8,19
3 2,
953,1
09
43,69
3 3,
004,
995
* Ex
clud
ing
the fi
gur
es o
f Sta
ndar
d Re
struc
ture
d Adv
ance
s whi
ch d
o no
t attr
act h
ighe
r pro
visio
ning
or r
isk w
eigh
t (if
appl
icab
le).
Sr. N
o. 2-
Am
ount
outst
andi
ng in
clude
s add
ition
to ex
istin
g res
tructu
red a
ccou
nts a
mou
ntin
g to
2,08
,940
(in 0
00s)
(num
ber o
f acc
ount
s 2) a
nd pr
ovisi
on th
eron
inclu
des a
dditi
onal
prov
ision
amou
ntin
g to
2,08
,940
(in 0
00s)
(num
ber o
f acc
ount
s 2)
Sr
. No.
6 - A
mou
nt o
utsta
ndin
g in
clud
es am
ount
reco
vere
d fro
m re
struc
ture
d ac
coun
ts am
ount
ing
to
11,7
7,08
6 (in
000
s) (n
umbe
r of a
ccou
nts 9
)
Sr
. No.
7- P
rovi
sion
ther
eon
is af
ter a
djus
ting
the p
rovi
sion
of
15,
04,1
15 (
in 0
00s)
tow
ards
amou
nt re
cove
red
/ writ
ten
off
Ther
e are
no
acco
unts
restr
cutu
red
unde
r SM
E de
bt re
struc
turin
g m
eche
nism
ECO
NOM
IC &
PO
LITI
CAL
WEE
KLY

Standard CharteredStandard Chartered Bank – India Branches(Incorporated in the United Kingdom with limited liability)
Published on Saturday, june 27, 2020 vol lV nos 26 & 27 EPW Economic & Political Weekly380
Sche
dule
s to
the
fi n
anci
al s
tate
men
ts f
or t
he y
ear
ende
d 31
Mar
ch 2
020
(Con
tinue
d)E
) N
otes
to a
ccou
nts (
Con
tinue
d)
(1)
Stat
utor
y D
iscl
osur
es (C
ontin
ued)
(xxi
v)
Acc
ount
s Res
truc
ture
d
Th
e dis
clos
ure o
f res
truc
ture
d ad
vanc
es v
ide R
BI g
uide
lines
is a
s und
er:
For t
he y
ear e
nded
31
Mar
ch 2
019
(` in
000
s)
Sr
. Ty
pe o
f Res
truc
turi
ng
Und
er C
DR
Mec
hani
sm
Oth
ers
Tota
l
No.
Ass
et C
lass
ifi ca
tion
Det
ails
St
and-
Su
b-
Dou
bt-
Loss
To
tal
Stan
d-
Sub-
D
oubt
- Lo
ss
Tota
l St
and-
Su
b-
Dou
bt-
Loss
To
tal
ard
Stan
d-
ful
ard
Stan
d-
ful
ard
Stan
d-
ful
ar
d
ar
d
ar
d
1
Re
struc
ture
d
No.
of b
orro
wer
s –
–
7
-
7
1
1
11
2
1
5
1
1
18
2
2
2
A
ccou
nts a
s on
Am
ount
Apr
il 1
of th
e FY
outst
andi
ng
–
–
2,4
96,1
07
-
2,4
96,1
07
496
,680
3
34
3,5
74,6
30
2,4
57
4,0
74,1
01
496,
680
3
34
6,0
70,7
37
2,4
57
6,5
70,2
08
(ope
ning
fi gu
res)
* P
rovi
sion
ther
eon
–
–
2,4
96,1
07
-
2,4
96,1
07
219
,562
2
99
3,5
74,6
30
2,4
57
3,7
96,9
48
219
,562
2
99
6,0
70,7
37
2,4
57
6,2
93,0
55
2
Fr
esh
N
o. o
f bor
row
ers
–
–
–
–
–
–
2
5
–
7
–
2
5
–
7
re
struc
turin
g A
mou
nt
durin
g th
e yea
r ou
tstan
ding
–
–
–
–
–
–
6
,130
4
15,8
37
–
42
1,96
7
–
6,1
30
415
,837
–
421
,967
Pr
ovisi
on th
ereo
n –
–
–
–
–
–
3
,667
4
15,8
37
–
41
9,50
3
–
3,6
67
415
,837
–
4
19,5
03
3
U
pgra
datio
ns
No.
of
borro
wer
s –
–
–
–
–
–
–
–
–
–
–
–
–
–
–
to re
struc
ture
d
Am
ount
stand
ard
cate
gory
ou
tstan
ding
–
–
–
–
–
–
–
–
–
–
–
–
–
–
–
du
ring
the F
Y Pr
ovisi
on th
ereo
n –
–
–
–
–
–
–
–
–
–
–
–
–
–
–
4
Re
struc
ture
d
No.
of b
orro
wer
s –
–
–
–
–
–
–
–
–
–
–
–
–
–
–
sta
ndar
d ad
vanc
es
whi
ch ce
ase t
o at
tract
A
mou
nt
hi
gher
pro
visio
ning
ou
tstan
ding
–
–
–
–
–
–
–
–
–
–
–
–
–
–
–
an
d/or
addi
tiona
l
risk
wei
ght a
t the
end
Prov
ision
ther
eon
–
–
–
–
–
–
–
–
–
–
–
–
–
–
–
of th
e FY
and
henc
e
ne
ed n
ot b
e sho
wn
as
restr
uctu
red
stand
ard
adva
nces
at th
e
be
ginn
ing o
f the
ne
xt F
Y
5
D
owng
rada
tions
N
o. o
f bo
rrow
ers
–
–
–
–
–
(1)
–
1
–
–
(1
) –
1
–
–
of re
struc
ture
d
Am
ount
ac
coun
ts du
ring
outst
andi
ng
–
–
–
–
–
(49
6,68
0)
–
6
22,1
71
–
12
5,49
1 (
496,
680)
–
6
22,1
71
–
125
,491
th
e FY
Prov
ision
ther
eon
–
–
–
–
– (
219,
562)
–
6
22,1
71
–
402
,609
(2
19,5
62)
–
622
,171
–
4
02,6
09
6
W
rite-
offs
of
No.
of
restr
uctu
red
bo
rrow
ers
–
–
–
–
–
–
1
2
–
3
–
1
2
–
3
acco
unts
durin
g
Am
ount
the F
Y o
utsta
ndin
g –
–
1
,676
,765
–
1
,676
,765
–
334
1
,146
,964
–
1,
147,
298
–
3
34
2,8
23,7
29
–
2
,824
,063
7
Re
struc
ture
d
No.
of b
orro
wer
s –
–
7
–
7
–
2
1
5
2
19
–
2
2
2
2
26
A
ccou
nts a
s on
A
mou
nt
M
arch
31
of th
e FY
outst
andi
ng
–
–
8
19,3
42
–
819
,342
–
6
,130
3
,465
,674
2
,457
3
,474
,261
–
6
,130
4
,285
,016
2
,457
4
,293
,604
(c
losin
g fi g
ures
)*
Prov
ision
ther
eon
–
–
819,3
42
–
819,3
42
–
3,66
7 3,
465,6
74
2,45
7 3,
471,7
98
–
3,66
7 4,
285,0
16
2,45
7 4,
291,
140
* Ex
clud
ing
the fi
gur
es o
f Sta
ndar
d Re
struc
ture
d Adv
ance
s whi
ch d
o no
t attr
act h
ighe
r pro
visio
ning
or r
isk w
eigh
t (if
appl
icab
le).
.
Sr. N
o. 2
- Am
ount
out
stand
ing
incl
udes
addi
tion
to ex
istin
g re
struc
ture
d ac
coun
ts am
ount
ing
to
41,
726
(in 0
00s)
(num
ber o
f acc
ount
s 1) a
nd p
rovi
sion
ther
on in
clud
es ad
ditio
nal p
rovi
sion
amou
ntin
g to
4
1,72
6 (in
000
s) (n
umbe
r of a
ccou
nts 1
) Sr
. No.
6 - A
mou
nt o
utsta
ndin
g in
clud
es am
ount
reco
vere
d fro
m re
struc
ture
d ac
coun
ts am
ount
ing
to
2,8
24,0
62 (i
n 00
0s) (
num
ber o
f acc
ount
s 13
)
Sr. N
o. 7
- Pro
visio
n th
ereo
n is
afte
r adj
ustin
g th
e pro
visio
n of
2
,824
,027
(in
000
s) to
war
ds am
ount
reco
vere
d / w
ritte
n of
f
Ther
e are
no
acco
unts
restr
cutu
red
unde
r SM
E de
bt re
struc
turin
g m
echa
nism
ECO
NOM
IC &
PO
LITI
CAL
WEE
KLY

Standard CharteredStandard Chartered Bank – India Branches(Incorporated in the United Kingdom with limited liability)
Economic & Political Weekly EPW Published on Saturday, june 27, 2020 vol lV nos 26 & 27 381
(xxv) Lending to Sensitive Sectors(` in 000s)
Category As at 31-Mar-20 As at 31-Mar-19 Exposure to Real Estate Sector Direct exposure (i) Residential Mortgages Lending fully secured by mortgages on residential property that is or will be occupied by the borrower or that is rented: 143,569,902 151,640,442 Of which individual housing loans eligible for inclusion in priority sector advances 7,953,135 10,174,937 (ii) Commercial Real Estate Lending secured by mortgages on commercial real estates 189,240,979 206,558,006 (iii) Other Direct Exposure (Loans backed by Commercial Property not falling under defi nition of Commercial Real Estate Exposure as per RBI circular No. DBOD.BP.BC.No. 42/08.12.015/2009-10 dated 09 September, 2009) 50,745,298 46,128,542 (iv) Investments in Mortgage Backed Securities (MBS) and other securitised exposures (includes Bonds & Debentures) a. Residential 1,656,942 1,656,942 b. Commercial Real Estate 26,018,069 17,115,384 Indirect Exposure Fund based and non-fund based exposures on National Housing Bank (NHB) and Housing Finance Companies (HFCs) 14,259,425 18,740,051 Total Exposure to Real Estate Sector 425,490,615 441,839,367 Exposure to Capital Market (i) Direct investment in equity shares, convertible bonds, convertible debentures and units of equity-oriented mutual funds the corpus of which is not exclusively invested in corporate debt 93,909 93,930 (ii) Advances against shares /bonds /debentures or other securities or on clean basis to individuals for investment in shares (including IPOs /ESOPs), convertible bonds, convertible debentures, and units of equity-oriented mutual funds 2,859 151,988 (iii) Advances for any other purposes where shares or convertible bonds or convertible debentures or units of equity oriented mutual funds are taken as primary security 19,897,508 1,012,036 (iv) Advances for any other purposes to the extent secured by the collateral security of shares or convertible bonds or convertible debentures or units of equity oriented mutual funds i.e. where the primary security other than shares /convertible bonds /convertible debentures /units of equity oriented mutual funds does not fully cover the advances 4,354,902 6,788,835 (v) Secured and unsecured advances to stockbrokers and guarantees issued on behalf of stockbrokers and market makers 10,826,435 8,316,235 (vi) Loans sanctioned to corporates against the security of shares /bonds / debentures or other securities or on clean basis for meeting promoter s contribution to the equity of new companies in anticipation of raising resources* 4,067,115 14,048,750 (vii) Bridge loans to companies against expected equity fl ows /issues 2,510,000 (viii) Underwriting commitments taken up by the banks in respect of primary issue of shares or convertible bonds or convertible debentures or units of equity oriented mutual funds – (ix) Financing to stockbrokers for margin trading – (x) All exposures to Venture Capital Funds (both registered and unregistered) – (xi) Others (Irrevocable Payment Commitments) 6,733,061 6,897,035 Total Exposure to Capital Market 45,975,789 39,818,809 * Includes investment in Bonds. Current Year - Nil (2018-19: 13,950 million).
Schedules to the fi nancial statements for the year ended 31 March 2020 (Continued)E) Notes to accounts (Continued) (1) Statutory Disclosures (Continued)
ECO
NOM
IC &
PO
LITI
CAL
WEE
KLY

Standard CharteredStandard Chartered Bank – India Branches(Incorporated in the United Kingdom with limited liability)
Published on Saturday, june 27, 2020 vol lV nos 26 & 27 EPW Economic & Political Weekly382
(xxvi) Assets Securitization (including assignment)
(a) Securitization
The Bank has not entered into any securitization transactions during the year (2018-19: Nil).
(b) Assignment
In accordance with RBI guidelines, there are no assignments during the year (2018-19 : Nil)
(c) Form and quantum of outstanding value of services provided by way of:(` in 000s)
As at As at 31-Mar-20 31-Mar-19 Credit Enhancement given in the form of Cash Collateral 328,434 328,434 Credit Enhancement given in the form of Guarantees 1,328,508 1,328,508 Liquidity Support – – Post securitisation asset servicing – – (xxvii) Intra-group Exposures Disclosure is in accordance with the RBI guidelines:
(` in 000s) As at As at 31-Mar-20 31-Mar-19 (a) Total amount of intra group exposures 28,007,754 12,866,349 (b) Total amount of top-20 intra-group exposures 27,996,534 12,851,060 (c) Percentage of intra-group exposures to total exposure of the bank on borrowers/customers 0.77% 0.38% (d) Details of breach of limits on intra-group exposures and regulatory action thereon, if any. Nil Nil
(xxviii) Amounts transferred to Depositors Education and Awareness Fund (DEAF) Disclosure in accordance with the RBI guidelines
(` in 000s) Category For the For the year ended year ended 31-Mar-20 31-Mar-19 Opening balance of amounts transferred to DEAF 2,598,999 2,163,185 Add : Amounts transferred to DEAF during the year 439,844 495,122 Less : Amounts reimbursed by DEAF towards claims (80,213) (59,308) Closing balance of amounts transferred to DEAF 2,958,630 2,598,999
(xxix) Unhedged Foreign Currency Exposures The Bank has provided for unhedged foreign currency exposures as per the RBI guidelines on prudential norms on income
recognition, asset classifi cation and provisioning pertaining to advances. The Bank considers all customers who have borrowed from the Bank and covers gross sum of all items on the customer s Balance sheet that has an impact on the Profi t and Loss account due to movement in foreign exchange rates. While providing for unhedged foreign currency exposures, the Bank has considered both fi nancial hedges and natural hedges. The Bank has robust processes to manage credit risk assessment including currency induced credit risk and review in stressed scenarios whereby the Bank initiates corrective actions where required.
Provision towards unhedged foreign currency exposures as on 31 March 2020 is `1,051 million (2018-19: `849 million) and the capital (including buffer) held by the Bank towards this risk is 7,005 million (2018-19: 4,691 million).
Schedules to the fi nancial statements for the year ended 31 March 2020 (Continued)E) Notes to accounts (Continued) (1) Statutory Disclosures (Continued)
ECO
NOM
IC &
PO
LITI
CAL
WEE
KLY

Standard CharteredStandard Chartered Bank – India Branches(Incorporated in the United Kingdom with limited liability)
Economic & Political Weekly EPW Published on Saturday, june 27, 2020 vol lV nos 26 & 27 383
(xxx) Liquidity Coverage Ratio (LCR) (a) Quantitative Disclosures Disclosure in accordance with RBI guidelines is as under: (` in 000s) Q1 FY 2019-20 Q2 FY 2019-20 Q3 FY 2019-20 Q4 FY 2019-20 Total Un- Total Total Un- Total Total Un- Total Total Un- Total weighted Weighted weighted Weighted weighted Weighted weighted Weighted Value Value Value Value Value Value Value Value Liquidity Coverage Ratio (average) (average) (average) (average) (average) (average) (average) (average)
High Quality Liquid Assets 1 Total High Quality Liquid Assets (HQLA) 345,029,680 324,600,141 330,051,231 374,398,479 Cash Outfl ows 2 Retail deposits and deposits from small business customers, of which: 334,960,311 31,795,159 356,170,545 33,921,536 347,391,426 33,039,615 334,759,675 31,539,209 (i) Stable deposits 34,017,441 1,700,872 33,910,376 1,695,519 33,990,547 1,699,527 38,735,173 1,936,759 (ii) Less stable deposits 300,942,870 30,094,287 322,260,169 32,226,017 313,400,879 31,340,088 296,024,502 29,602,450 3 Unsecured wholesale funding, of which : 634,703,562 296,718,987 534,470,626 256,093,362 510,958,544 251,391,288 559,982,517 269,979,967 (i) Operational deposits (all counterparties) 122,937,832 30,710,244 125,867,156 31,442,542 132,271,806 33,043,078 141,131,628 35,238,213 (ii) Non-operational deposits (all counterparties) 511,765,730 266,008,743 408,603,470 224,650,820 378,686,738 218,348,210 418,850,889 234,741,754 (iii) Unsecured debt – – – – – – – – 4 Secured wholesale funding – – – – 5 Additional requirements, of which: 123,139,295 57,316,110 124,028,155 52,962,443 138,826,631 51,297,322 147,270,311 53,908,851 (i) Outfl ows related to derivative exposures and other collateral requirements 44,330,256 44,330,256 39,063,236 39,063,236 34,500,846 34,500,846 36,953,760 36,953,760 (ii) Outfl ows related to loss of funding on debt products – – – – – – – – (iii) Credit and liquidity facilities 78,809,039 12,985,854 84,964,919 13,899,207 104,325,785 16,796,476 110,316,551 16,955,091 6 Other contractual funding obligations 32,926,694 32,926,694 31,591,762 31,591,762 28,987,357 28,987,357 28,323,414 28,323,414 7 Other contingent funding obligations 991,984,245 39,933,480 1,010,071,006 40,802,910 1,043,631,195 42,057,846 1,059,073,116 42,783,863 8 Total Cash Outfl ows 458,690,429 415,372,011 406,590,312 426,535,304 Cash Infl ows 9 Secured lending (e.g. reverse repos) – – – – – – – – 10 Infl ows from fully performing exposures 190,198,410 156,960,048 150,158,585 138,885,700 164,072,648 124,664,339 161,583,747 122,298,618 11 Other cash infl ows 1,661,013 830,506 1,326,517 796,001 1,556,441 778,221 1,397,365 698,683 12 Total Cash Infl ows 191,859,423 157,790,554 151,485,102 139,681,701 165,629,089 125,442,560 162,981,112 122,997,301 Total Adjusted Total Adjusted Total Adjusted Total Adjusted Value Value Value Value 21 TOTAL HQLA 345,029,680 324,600,141 330,051,231 374,398,479 22 Total Net Cash Outfl ows 300,899,875 275,690,310 281,330,868 303,538,003 23 Liquidity Coverage Ratio (%) 115% 118% 117% 123%
Q1 FY 2018-19 Q2 FY 2018-19 Q3 FY 2018-19 Q4 FY 2018-19 Total Un- Total Total Un- Total Total Un- Total Total Un- Total weighted Weighted weighted Weighted weighted Weighted weighted Weighted Value Value Value Value Value Value Value Value Liquidity Coverage Ratio (average) (average) (average) (average) (average) (average) (average) (average) High Quality Liquid Assets 1 Total High Quality Liquid Assets (HQLA) 287,412,732 318,427,125 352,553,888 379,778,547 Cash Outfl ows 2 Retail deposits and deposits from small business customers, of which: 302,398,586 28,666,442 298,185,583 28,195,615 324,100,461 30,668,230 330,829,705 31,370,604 (i) Stable deposits 31,468,331 1,573,417 32,458,867 1,622,943 34,836,313 1,741,816 34,247,332 1,712,367 (ii) Less stable deposits 270,930,255 27,093,025 265,726,716 26,572,672 289,264,148 28,926,414 296,582,373 29,658,237 3 Unsecured wholesale funding, of which : 525,740,855 243,151,970 589,864,692 272,850,566 628,490,814 283,940,895 669,759,151 294,771,868 (i) Operational deposits (all counterparties) 102,499,112 25,601,955 108,209,640 27,029,176 112,649,488 28,139,036 110,076,292 27,495,640 (ii) Non-operational deposits (all counterparties) 423,241,743 217,550,015 481,655,052 245,821,390 515,841,326 255,801,859 559,682,859 267,276,228 (iii) Unsecured debt – – – – – – – – 4 Secured wholesale funding – – – – 5 Additional requirements, of which: 138,262,955 52,027,016 122,445,950 53,591,605 125,237,459 60,279,821 221,827,207 153,536,379 (i) Outfl ows related to derivative exposures and other collateral requirements 36,915,868 36,915,868 40,325,044 40,325,044 48,300,355 48,300,355 139,255,844 139,255,844 (ii) Outfl ows related to loss of funding on debt products – – – – – – – – (iii) Credit and liquidity facilities 101,347,087 15,111,148 82,120,906 13,266,561 76,937,104 11,979,466 82,571,363 14,280,535 6 Other contractual funding obligations 16,724,611 16,724,611 18,891,519 18,891,519 28,146,999 28,146,999 25,380,947 25,380,947 7 Other contingent funding obligations 901,698,831 37,071,185 908,063,458 37,173,974 950,313,150 38,589,396 974,924,796 39,466,746 8 Total Cash Outfl ows 377,641,225 410,703,279 441,625,341 544,526,544 Cash Infl ows 9 Secured lending (e.g. reverse repos) – – – – – – – – 10 Infl ows from fully performing exposures 143,170,361 112,856,345 150,158,585 119,727,925 144,120,266 111,245,500 240,112,790 206,624,612 11 Other cash infl ows 1,324,313 662,156 1,326,517 663,258 1,455,150 727,575 1,468,001 734,000 12 Total Cash Infl ows 144,494,674 113,518,501 151,485,102 120,391,183 145,575,416 111,973,075 241,580,791 207,358,612 Total Adjusted Total Adjusted Total Adjusted Total Adjusted Value Value Value Value 21 TOTAL HQLA 287,412,732 318,427,125 352,553,888 379,778,547 22 Total Net Cash Outfl ows 264,122,723 290,312,096 329,652,266 337,167,932 23 Liquidity Coverage Ratio (%) 109% 110% 107% 113%
Schedules to the fi nancial statements for the year ended 31 March 2020 (Continued)E) Notes to accounts (Continued) (1) Statutory Disclosures (Continued)
ECO
NOM
IC &
PO
LITI
CAL
WEE
KLY
Standard CharteredStandard Chartered Bank – India Branches(Incorporated in the United Kingdom with limited liability)
Published on Saturday, june 27, 2020 vol lV nos 26 & 27 EPW Economic & Political Weekly384
(xxx) Liquidity Coverage Ratio (LCR) (Continued) (b) Qualitative Disclosures The LCR standard aims to ensure that a bank maintains an adequate level of unencumbered HQLA that can be converted into cash to
meet its liquidity needs for a 30 calendar day time horizon under a signifi cantly severe liquidity stress scenario specifi ed by supervisors. At a minimum, the stock of liquid assets should enable the bank to survive until day 30 of the stress scenario, by which time it is assumed that appropriate corrective actions can be taken.
i. The main drivers of LCR results and the evolution of the contribution of inputs to the LCR s calculation over time; The key components/drivers of the LCR are (i) stock of HQLA and (ii) net cash outfl ows over the next 30 calendar days.
HQLA comprises high quality assets that can be readily sold or used as collateral to obtain funds in a range of stress scenarios. they should be unencumbered and easily convertible into cash at little or no loss of value. Net cash outfl ows are the total expected cash outfl ows minus expected cash infl ows for the subsequent 30 calendar days. Cash outfl ows and infl ows are calculated by multiplying outstanding balances of various types of liabilities and off-balance sheet commitment and various categories of contractual receivables by the prescribed outfl ows/infl ows rates. Total infl ows are capped at 75% of total outfl ows for LCR computation.
ii. Intra-period changes as well as changes over time; The LCR requirement has been introduced by RBI for banks in India effective 1 January 2015 with a minimum 60% for the
calendar year 2015, rising in equal steps each calendar year to reach the minimum 100% requirement by 1 January 2019. iii. The composition of HQLA; There are two categories of assets which can be included in the stock of HQLA s, viz. Level 1 and Level 2 assets, subject to
prescribed operational requirements and other criteria: • Level 1 assets comprise of the following and can be included without any limit as also without applying any haircut: a) Cash, including cash reserves in excess of required CRR; b) Government securities in excess of the minimum SLR requirement; c) Within the mandatory SLR requirement, Government securities to the extent allowed by RBI (currently 17.5%
of NDTL), under Marginal Standing Facility and Facility to Avail Liquidity for Liquidity Coverage Ratio; d) Marketable securities issued or guaranteed by foreign sovereigns, subject to certain conditions. • Level 2 assets (comprising Level 2A assets and Level 2B assets) can be included, subject to the requirement that they
comprise no more than 40% of the overall stock of HQLAs after haircuts have been applied. HQLA for the Bank currently comprises of Level 1 assets only. iv. Concentration of funding sources; The Bank seeks to diversify its funding sources across retail, private, commercial, corporate and institutional client, as well
as across products, tenors and currency. Funding from signifi cant counterparties, products/instruments and currency is monitored regularly as part of its ongoing liquidity management. The Bank endeavours to fund its customersʼ loans from deposits and capital, thereby ensuring minimal/no reliance on interbank borrowings.
v. Derivative exposures and potential collateral calls; Derivative exposures with outfl ows and infl ows in the next 30 calendar days are included in the LCR calculations. Further,
management assesses the potential need for higher liquidity on account of valuation, collateral or specifi c scenarios. vi. Currency mismatch in the LCR; and LCR computation is aggregated across currencies, with the predominant currency being INR. The Bank s foreign currency
liabilities support its foreign currency exposures, however all HQLA is maintained in INR only. vii. Description of the degree of centralisation of liquidity management and interaction between the group s units; The Bank s ALCO is responsible for liquidity management on an overall basis, with ALM managing the day-to-day
requirements within the Bank s liquidity risk framework, by interacting with all the business and product lines on an ongoing basis via the Liquidity Management Forum. Treasury Risk and Finance monitor adherence to various internal structural and short term liquidity limits, as well as regulatory limits and ratios such as CRR, SLR, LCR, call borrowings/lending, etc.
viii. RBI has issued guidelines regarding EMI moratorium under the COVID 19 Regulatory package vide circular reference RBI/2019-20/186, DOR.No.BP.BC.47/21.04.048/2019-20 dated March 27, 2020.
In respect of all term loans (including agricultural term loans, retail and crop loans), all commercial banks and NBFC s are permitted to grant a moratorium of three months on payment of all instalments falling due between March 1, 2020 and May 31, 2020.
The repayment schedule for such loans as also the residual tenor, will be shifted across the board by three months after the moratorium period.
Interest shall continue to accrue on the outstanding portion of the term loans during the moratorium period. Banks are required to create a board approved policy to implement the same. Retail: Payment moratorium has been extended to all term loan products as a default option. Although there is an option
given to the customer to opt out of the option, given large number of accounts & diffi culty in tracking this at an account level – Bank has taken a conservative stance and not considered any infl ows from Retail term loans and Credit Cards for LCR computation as of 31 March 2020.
Schedules to the fi nancial statements for the year ended 31 March 2020 (Continued)E) Notes to accounts (Continued) (1) Statutory Disclosures (Continued)
ECO
NOM
IC &
PO
LITI
CAL
WEE
KLY

Standard CharteredStandard Chartered Bank – India Branches(Incorporated in the United Kingdom with limited liability)
Economic & Political Weekly EPW Published on Saturday, june 27, 2020 vol lV nos 26 & 27 385
CCIB: An option has been given to the customers to opt for payment moratorium (except SCF) and hence an adjustment needs to be done only for those customers who have opted in for the moratorium.
Infl ows for LCR have been reduced in respect of clients who have opted in for the moratorium. Since no infl ows are considered for OD and SCF, no separate adjustment has been done for these products.
(xxxi) Risk Exposure in Derivatives (a) Exchange traded interest rate derivatives (` in 000s) As at 31-Mar-20 As at 31-Mar-19 Notional principal amount of derivatives undertaken during the year - -
Notional principal amount of derivatives outstanding as at 31 March – – Notional principal amount of derivatives outstanding and not ‘highly effectiveʼ NA NA Mark to market value of derivatives outstanding and not ‘highly effectiveʼ NA NA (b) Qualitative Disclosures Structure and organisation of management of risk in derivatives trading The derivatives business is managed by the front offi ce with independent back offi ce for confi rmation and settlement of trades. A
separate middle offi ce team validates all the derivative transactions and the processing and settlement is done by the back offi ce team. The market risk team is responsible for monitoring market risk limits for derivative instruments. VAR (Value at Risk) is the primary risk measure and supplemented by other limits like PV01 as required and appropriate. There is clear segregation of duties and different reporting lines to ensure independent monitoring and reporting.
Risk monitoring team The Bank is exposed to market risk, liquidity risk, operational risk and credit risk on the derivatives portfolio. The Bank s risk
management group, compliance group and internal audit group assist in identifying, assessing and monitoring of these principal risks in accordance with policies and procedures.
Provisioning, collateral and credit risk mitigation Counterparties are reviewed by credit offi cers who set their credit limits. The Bank does a credit analysis which includes a review of
facility detail, credit grade determination and fi nancial spreading/ratio analysis. The Bank uses a numerical grading system, for quantifying the risk associated with counterparty.
The Bank applies the Current Exposure methodology to manage credit risk associated with derivative transactions. This is calculated by taking the cost of replacing the contract, where its mark-to-market value, is positive together with an estimate of the potential future change in the market value of the contract, refl ecting the volatilities that affect it. The credit risk on contracts with a negative mark-to-market value is restricted to the potential future change in their market value.
Provisioning on the exposure taken on derivative contracts is made as prescribed by RBI guidelines. (c) Quantitative Disclosures (` in 000s) Sr. Particulars Currency Interest rate Currency Interest rate No. Derivatives as at Derivatives as at Derivative as at Derivatives as at 31-03-2020 31-03-2020 31-03-2019 31-03-2019 1 Derivatives (Notional Principal Amount) a) For hedging 5,674,875 97,450,000 5,186,625 130,800,000 b) For trading 9,145,768,683 9,462,065,648 8,356,851,634 13,750,520,851 2 Marked to Market Positions a) Asset (+) 165,462,582 115,599,332 122,207,900 68,487,522 b) Liability (-) (186,712,358) (117,969,567) (143,423,416) (71,320,226) 3 Credit Exposure1 301,204,059 128,200,635 238,836,063 135,490,359 4 Likely impact of one percentage change in interest rate (100*PV01)2 a) on hedging derivatives 187,297 1,625,054 138,024 2,963,821 b) on trading derivatives 2,116,980 4,625,943 2,159,713 1,976,728 5 Maximum of 100*PV01 observed during the year2 a) on hedging 587,484 2,960,963 138,459 3,000,689 b) on trading 2,853,831 5,829,320 2,542,540 4,304,678 6 Minimum of 100*PV01 observed during the year2 a) on hedging 130,939 1,625,054 138,024 1,022,435 b) on trading 1,560,717 1,274,886 1,385,439 1,119,360 1 Computed as per the current exposure method as per RBI guidelines. 2 Only for currency Currency derivatives include Currency options, Currency swaps and Currency futures. Interest rate derivatives includes Forward rate
agreement, Interest rate options and Interest rate swaps.
Schedules to the fi nancial statements for the year ended 31 March 2020 (Continued)E) Notes to accounts (Continued) (1) Statutory Disclosures (Continued) (xxx) Risk Exposure in Derivatives (Continued) (b) Qualitative Disclosures (Continued)
ECO
NOM
IC &
PO
LITI
CAL
WEE
KLY

Standard CharteredStandard Chartered Bank – India Branches(Incorporated in the United Kingdom with limited liability)
Published on Saturday, june 27, 2020 vol lV nos 26 & 27 EPW Economic & Political Weekly386
(xxxii) Interest Rate Swaps, Interest Rate Options and Forward Rate Agreements The notional principal amount of Interest Rate Swaps (‘IRSʼ), Interest Rate Options (‘IROʼ), Interest Rate Futures (‘IRFʼ)
and Forward Rate Agreements (‘FRA ) are:(` in 000s)
As at 31-Mar-20 As at 31-Mar-19 IRS 9,413,133,713 13,787,435,573 IRO 91,583,688 93,885,278 IRF – – FRA 54,798,247 – Total 9,559,515,648 13,881,320,851 The credit risk is the pre-settlement risk which is estimated in accordance with the Current Exposure Method. All IRS, IRO, IRF and
FRA are monitored for price risks under the Value at Risk approach. The Bank as at 31 March 2020 has taken `1,959 million as collateral from counterparties in respect of derivative contracts (2018-19:
`647 million). The gross positive mark to market on the IRS, IRO, IRF and FRA, which is the potential loss that the Bank would incur in case the
counter parties fail to fulfi ll their obligations are:(` in 000s)
As at 31-Mar-20 As at 31-Mar-19 IRS 115,013,183 68,190,618 IRO 392,873 296,904 IRF – – FRA 193,276 – Total 115,599,332 68,487,522 As at 31 March 2020, the exposure on IRS, IRO, IRF and FRA is spread over various industries. Based on the notional principal
amount, the maximum single industry exposure lies with Financial Institutions at 51% (2018-19: Financial Institutions 65%). Fair value (net MTM value) which the Bank would receive or (pay) to terminate the IRS, IRO, IRF and FRA is given below:
(` in 000s) As at 31-Mar-20 As at 31-Mar-19 IRS (2,304,600) (2,832,704) IRO – – IRF – – FRA (65,635) – Total (2,370,235) (2,832,704) The nature and terms of the IRS and IRO as on 31 March 2020 are set out below: (` in 000s) Nature Number of Contracts Notional Principal Benchmark Term Trading 14 16,638,000 INBMK Fixed Payable v/s Floating Receivable Trading 3 2,500,000 INBMK Fixed Receivable v/s Floating Payable Trading 2 1,290,307 LIBOR Fixed Payable v/s Fixed Receivable Trading 304 776,187,891 LIBOR Fixed Payable v/s Floating Receivable Trading 19 42,454,425 LIBOR Floating Payable v/s Fixed Receivable Trading 5 15,845,885 LIBOR Floating Payable v/s Floating Receivable Trading 20 37,278,309 LIBOR Fixed Receivable v/s Fixed Payable Trading 283 715,444,029 LIBOR Fixed Receivable v/s Floating Payable Trading 17 35,568,910 LIBOR Floating Receivable v/s Fixed Payable Trading 12 17,534,161 LIBOR Floating Receivable v/s Floating Payable Trading 1,129 799,374,800 MIFOR Fixed Payable v/s Floating Receivable Trading 1,391 763,220,740 MIFOR Fixed Receivable v/s Floating Payable Trading 4,234 3,113,680,288 OIS Fixed Payable v/s Floating Receivable Trading 5,114 3,042,696,322 OIS Fixed Receivable v/s Floating Payable Trading 4 842,599 OTHER Fixed Payable v/s Fixed Receivable Trading 9 6,071,121 OTHER Fixed Payable v/s Floating Receivable Trading 6 6,780,176 OTHER Floating Payable v/s Fixed Receivable Trading 5 1,008,139 OTHER Fixed Receivable v/s Fixed Payable Trading 9 6,071,121 OTHER Fixed Receivable v/s Floating Payable Trading 6 6,780,176 OTHER Floating Receivable v/s Fixed Payable Hedging 208 97,450,000 OIS Fixed Payable v/s Floating Receivable 12,794 9,504,717,399
Schedules to the fi nancial statements for the year ended 31 March 2020 (Continued)E) Notes to accounts (Continued) (1) Statutory Disclosures (Continued)
ECO
NOM
IC &
PO
LITI
CAL
WEE
KLY

Standard CharteredStandard Chartered Bank – India Branches(Incorporated in the United Kingdom with limited liability)
Economic & Political Weekly EPW Published on Saturday, june 27, 2020 vol lV nos 26 & 27 387
The nature and terms of the IRS and IRO as on 31 March 2019 are set out below: (` in 000s)
Nature Number of Contracts Notional Principal Benchmark Term Trading 18 19,210,000 INBMK Fixed Payable v/s Floating Receivable Trading 3 2,500,000 INBMK Fixed Receivable v/s Floating Payable Trading 2 1,485,569 LIBOR Fixed Payable v/s Fixed Receivable Trading 311 600,621,552 LIBOR Fixed Payable v/s Floating Receivable Trading 17 44,669,702 LIBOR Floating Payable v/s Fixed Receivable Trading 5 6,954,480 LIBOR Floating Payable v/s Floating Receivable Trading 19 34,419,115 LIBOR Fixed Receivable v/s Fixed Payable Trading 315 511,569,967 LIBOR Fixed Receivable v/s Floating Payable Trading 17 44,669,702 LIBOR Floating Receivable v/s Fixed Payable Trading 9 14,135,842 LIBOR Floating Receivable v/s Floating Payable Trading 1,025 716,897,700 MIFOR Fixed Payable v/s Floating Receivable Trading 1,448 698,010,450 MIFOR Fixed Receivable v/s Floating Payable Trading 6,415 5,558,584,654 OIS Fixed Payable v/s Floating Receivable Trading 6,337 5,463,822,901 OIS Fixed Receivable v/s Floating Payable Trading 6 691,363 OTHER Fixed Payable v/s Fixed Receivable Trading 11 13,520,309 OTHER Fixed Payable v/s Floating Receivable Trading 7 2,272,937 OTHER Floating Payable v/s Fixed Receivable Trading 6 691,363 OTHER Fixed Receivable v/s Fixed Payable Trading 11 13,520,309 OTHER Fixed Receivable v/s Floating Payable Trading 7 2,272,936 OTHER Floating Receivable v/s Fixed Payable Hedging 282 130,800,000 OIS Fixed Payable v/s Floating Receivable 16,271 13,881,320,851 The nature and terms of the FRA as on 31 March 2020 are set out below (2018-19: Nil):
(` in 000s) Nature Number of Contracts Notional Principal Benchmark Term Trading 3 30,266,000 LIBOR Fixed Payable v/s Floating Receivable Trading 121 24,532,247 OTHER Fixed Payable v/s Floating Receivable 124 54,798,247 The nature and terms of the IRF - Bank does not have holdings as on 31 March 2020 and 31 March 2019. (xxxiii) Country Risk Exposure
` in 000s) Risk Category Funded Exposure Provision held Funded Exposure Provision held (net) as at 31-Mar-20 as at 31-Mar-20 (net) as at 31-Mar-19 as at 31-Mar-19 Insignifi cant 54,277,788 36,912 86,607,198 36,912 Low 23,910,464 26,646 13,483,536 26,646 Moderately Low 114,167 – 14,240 – Moderate 905,190 – 364,234 – Moderately High 66,040 – 149,360 – High 76 – 277 – Very High 151 – 69 – Total 79,273,876 63,558 100,618,914 63,558 Disclosure for country risk exposure is in accordance with RBI guidelines. The above provision has been included in Schedule 5 - Other Liabilities and Provisions. (xxxiv) Prudential Credit Exposure Limits – Single and Group Borrower Exposure The Bank s exposure to single and group borrowers has been within limits specifi ed by RBI.
Schedules to the fi nancial statements for the year ended 31 March 2020 (Continued)E) Notes to accounts (Continued) (1) Statutory Disclosures (Continued) (xxxii) Interest Rate Swaps, Interest Rate Options and Forward Rate Agreements (Continued)
ECO
NOM
IC &
PO
LITI
CAL
WEE
KLY

Standard CharteredStandard Chartered Bank – India Branches(Incorporated in the United Kingdom with limited liability)
Published on Saturday, june 27, 2020 vol lV nos 26 & 27 EPW Economic & Political Weekly388
(xxxv) Provisions and Contingencies (a) As per AS 29 – Provisions, Contingent Liabilities and Contingent Assets, movement in provision for reward points awarded
to customers and movement in other provisions are given below: (` in 000s) For the year ended 31-Mar-20 For the year ended 31-Mar-19 Reward Other Reward Other Points 1 Provisions2 Points 1 Provisions2 Opening provision 704,655 2,959,918 628,208 430,229 Provision made during the year 135,388 277,319 534,275 2,744,682 Utilisation/write back of provision during the year (105,346) (2,993,972) (457,828) (214,993) Closing provision 734,697 243,265 704,655 2,959,918 1 Basis of calculation of provision for reward points is explained in Note 18 (D) (12). The provision is utilised when actual claims
for redemption are made by customers. 2 Includes provision for legal, contingent and operational losses. (b) Description of Contingent Liabilities (i) Claims against the Bank not acknowledged as debts These represent claims fi led against the Bank relating to certain legal and tax proceedings that are currently in progress. (ii) Liability on account of outstanding foreign exchange contracts The Bank enters into foreign exchange contracts on its own account and for customers. Forward exchange contracts
are commitments to buy or sell foreign currency at a future date at the contracted rate. The Bank also undertakes currency futures transactions.
(iii) Liability on account of derivative contracts These include notional principal on outstanding cross currency swaps, currency options, forward rate agreements,
interest rate swaps, interest rate futures and interest rate options. (iv) Guarantees given on behalf of constituents, acceptances, endorsements and other obligations As a part of its commercial banking activities, the Bank issues documentary credit and guarantees on behalf of its
customers. Documentary credit such as letters of credit enhances the credit standing of the customers of the Bank. Guarantees generally represent irrevocable assurances that the Bank will make payments in the event of the customer failing to fulfi ll its fi nancial or performance obligations. Irrevocable Payment Commitments are included under guarantees given on behalf of constituents in India.
(v) Other items for which the Bank is contingently liable These include capital commitments, amounts deposited in the Depositor Education and Awareness Fund, underwriting
commitments, recourse obligations representing credit enhancements in the form of cash collaterals in respect of securitised loans, bills re-discounted and amount payable on securities purchased.
(c) Inquiry Proceedings The Bank has received certain show cause notices from the Enforcement Directorate alleging violation of certain provisions
of Foreign Exchange Management Act. The Bank has responded to the same and hearing has been completed. No order has been issued by the Enforcement Directorate as on date. The Bank, based on legal advice, believes that it has an arguable case and the chances of success are more likely than not. Hence, no provision has been made in these fi nancial statements.
(d) Breakup of Schedule 17 – Provisions and Contingencies(` in 000s)
Particulars For the year ended For the year ended 31-Mar-20 31-Mar-19 Specifi c provisions against advances (net) 10,707,114 2,140,451 General provision against standard assets 8,622,374 196,476 Provision for Country Risk Exposure – – Specifi c provisions against investments (net) (642,748) (54,897) Provision on account of tax – – – Current tax expense (3,981,152) 6,658,330 – Deferred tax charge/credit 18,848,981 5,714,601 – MAT Credit Entitlement – 408,598 Other provisions (2,731,245) 2,548,769 Total provisions and contingencies 30,823,324 17,612,328 Provision for income tax for the year ended 31 March 2020 includes the reversal of tax provision of 19,267,252 (in 000s) and Deferred
tax charge of 20,307,890 (in 000s) for prior years.
Schedules to the fi nancial statements for the year ended 31 March 2020 (Continued)E) Notes to accounts (Continued) (1) Statutory Disclosures (Continued)
ECO
NOM
IC &
PO
LITI
CAL
WEE
KLY

Standard CharteredStandard Chartered Bank – India Branches(Incorporated in the United Kingdom with limited liability)
Economic & Political Weekly EPW Published on Saturday, june 27, 2020 vol lV nos 26 & 27 389
The Bank has assessed its obligations arising in the normal course of business, including pending litigations, proceedings pending with tax authorities and other contracts including derivative and long term contracts. In accordance with the provisions of AS - 29, the Bank recognizes a provision for material foreseeable losses and it is probable that an outfl ow of resources will be required to settle the obligation, in respect of which a reliable estimate can be made. In cases where there is a possible obligation or a present obligation that may, but probably will not, require an outfl ow of resources, a disclosure to this effect is made as contingent liabilities. The Bank does not expect the outcome of these proceedings to have a materially adverse effect on its fi nancial results.
(e) Floating Provisions The Bank does not have any fl oating provision as at 31 March 2020 (2018-19: Nil). (xxxvi) Draw down from Reserves During the year ended 31 March 2020, there was no draw down from reserves (2018-19: 140 million from Investment reserves). (xxxvii) Retirement Benefi ts (a) Defi ned Benefi t Plans Reconciliation of opening and closing balance of the present value of the defi ned benefi t obligations for retirement benefi ts which
includes total of pension, gratuity and compensated absences is given below:(` in 000s)
For the year ended For the year ended 31-Mar-20 31-Mar-19 Changes in present value of defi ned benefi t obligations Opening balance as at 01 April 3,189,838 3,152,293 Current service cost 114,493 119,488 Interest cost 216,666 219,908 Past service cost 12,042 35,437 Acquisition adjustment (489) (3,743) Actuarial losses/(gains) 169,905 125,541 Benefi ts paid (299,767) (459,086) Closing balance as at 31 March (A) 3,402,688 3,189,838 Changes in fair value of plan assets Opening balance as at 01 April 1,870,404 1,637,678 Expected return on plan assets 140,751 120,511 Contributions paid by the Bank 377,964 582,283 Acquisition adjustment 1,247 (3,743) Benefi ts paid (299,767) (459,086) Actuarial gains/(losses) (42,379) (7,239) Closing balance as at 31 March (B) 2,048,220 1,870,404 Net liability (B - A) (1,354,468) (1,319,434) (` in 000s) As at 31-Mar-20 As at 31-Mar-19
Present value of defi ned benefi t obligations as at 31 March 3,402,688 3,189,838 Fair value of plan assets as at 31 March 2,048,220 1,870,404 Funded status – Defi cit (1,354,468) (1,319,434) Unrecognised assets as per paragraph 59(b) of AS 15 (8,921) (4,258) Net liability recognised in Balance Sheet (1,363,389) (1,323,692) (` in 000s) For the year ended For the year ended 31-Mar-20 31-Mar-19 Components of employerʼs expense Current service cost 114,493 119,488 Interest cost 216,666 219,908 Expected return on assets (140,751) (120,511) Past Service Cost 12,042 35,437 Net actuarial losses/(gains) 212,283 132,780 Effect of the limit in paragraph 59(b) of AS 15 4,662 4,139 Net cost recognised in the Profi t and Loss Account 419,395 391,241
Schedules to the fi nancial statements for the year ended 31 March 2020 (Continued)E) Notes to accounts (Continued) (1) Statutory Disclosures (Continued) (d) Breakup of Schedule 17 – Provisions and Contingencies (Continued)
ECO
NOM
IC &
PO
LITI
CAL
WEE
KLY

Standard CharteredStandard Chartered Bank – India Branches(Incorporated in the United Kingdom with limited liability)
Published on Saturday, june 27, 2020 vol lV nos 26 & 27 EPW Economic & Political Weekly390
Key Assumptions 31-Mar-20 31-Mar-19 Discount rate 6.60% 7.40% Expected return on plan assets 7.00% 7.50% Salary escalation rate • Management Staff 7.00% 7.00% • Non Management Staff 7.00% 7.00%
Details of plan assets, defi ned benefi t obligations and experience adjustments(` in 000s)
31-Mar-20 31-Mar-19 31-Mar-18 31-Mar-17 31-Mar-16 Plan assets 2,048,220 1,870,404 1,637,678 827,434 863,856 Defi ned benefi t obligations 3,402,689 3,189,838 3,152,293 2,971,136 2,611,049 Amount not recognised as an asset (limit in para 59(b) of AS 15) 8,921 4,258 119 – – Defi cit (1,363,390) (1,323,692) (1,514,734) (2,143,702) (1,747,193) Experience adjustment on plan assets (42,379) (7,239) 79,692 639 13,477 Experience adjustment on plan liabilities (71,675) 63,379 59,335 88,162 14,488 The estimates of future salary increases in the actuarial valuation takes into consideration infl ation, seniority, promotion and other
relevant factors. The major categories of plan assets as a percentage of total plan assets are as follows: Category of Assets As at 31-Mar-20 As at 31-Mar-19 Insurer managed funds 91% 88% Government of India securities 4% 4% Others (includes corporate bonds, special deposit scheme) 5% 8% Total 100% 100% (b) Defi ned Contribution Plans The amount recognized as an expense for the Defi ned Contribution Plans is as under:
(` in 000s) For the year ended For the year ended Particulars 31-Mar-20 31-Mar-19 Provident Fund 492,791 506,827 Superannuation Fund 30,907 33,105
(xxxviii) Primary dealership
In line with the RBI guidelines, the details pertaining to net borrowing in call money markets are as under:
For the year ended 31 March 2020 (` in 000s) Particulars Average net call Maximum net call
borrowing borrowing Net Call Borrowing – – For the year ended 31 March 2019 (` in 000s) Particulars Average net call Maximum net call
borrowing borrowing Net Call Borrowing – –
Schedules to the fi nancial statements for the year ended 31 March 2020 (Continued)E) Notes to accounts (Continued) (1) Statutory Disclosures (Continued) (xxxvii) Retirement Benefi ts (Continued) (a) Defi ned Benefi t Plans (Continued)
ECO
NOM
IC &
PO
LITI
CAL
WEE
KLY

Standard CharteredStandard Chartered Bank – India Branches(Incorporated in the United Kingdom with limited liability)
Economic & Political Weekly EPW Published on Saturday, june 27, 2020 vol lV nos 26 & 27 391
(xxxix) Customer complaints and awards of Banking Ombudsman In accordance with RBI guidelines, details with respect to customer complaints and awards passed by the Banking Ombudsman are
given below: (` in 000s) For the year ended For the year ended Particulars 31-Mar-20 31-Mar-19 (a) No. of complaints pending at the beginning of the year 354 323 (b) No. of complaints received during the year 21,229 25,999 (c) No. of complaints redressed during the year 21,415 25,968 (d) No. of complaints pending at the end of the year 168 354 Complaints received and resolved within 1 day are excluded in the numbers reported above. Above include 10,698 complaints (2018-19: 16,368 complaints) pertaining to cases of failed ATM transactions at other Bank s ATM s.
(` in 000s) For the year ended For the year ended Particulars 31-Mar-20 31-Mar-19 (a) No. of unimplemented awards at the beginning of the year – – (b) No. of awards passed by the Banking Ombudsman during the year – – (c) No. of awards implemented during the year – – (d) No. of unimplemented awards at the end of the year – – (xl) Letters of Comfort (LoC) issued The Bank has not issued any LoC during the year (2018-19: Nil). (xli) Fees earned in respect of bancassurance business
(` in 000s) For the year ended For the year ended Nature of income 31-Mar-20 31-Mar-19 For selling life insurance policies (including ULIPs) 714,042 709,007 For selling non life insurance policies 86,700 92,274 Total 800,742 801,281 (xlii) Concentration of Deposits
(` in 000s) As at 31-Mar-20 As at 31-Mar-19 Total deposits of twenty largest depositors 174,180,031 250,071,429 Percentage of deposits of twenty largest depositors to total deposits of the Bank 17.35% 23.80% (xliii) Off-Balance Sheet Special Purpose Vehicles sponsored The Bank has not sponsored any Special Purpose Vehicle during the year (2018-19: Nil). (xliv) Factoring Services The bank has receivables acquired under factoring amounting to `27,924 million as on 31 March 2020 (2018-19: 26,250 million). (xlv) Fraud Disclosure is in accordance with RBI circular DBR.No.BP.BC.92/21.04.048/2015-16 dated 18 April 2016
(` in 000s) For the year ended For the year ended 31-Mar-20 31-Mar-19 Number of Frauds reported during the year 881 679 Amount involved in such frauds during the year (net of recoveries) 8,915,002 4,372,843 Quantum of provision made during the year (including w/off)¹ 8,928,822 4,328,400 Quantum of unamortised provision debited from ‘other reservesʼ as at the end of the year – – 1 Represents write off/provision made during FY 2019-20. Included in this fi gure is the provision Bank holds against specifi c non
performing clients amounting to 6,254,040 (in 000s) (2018-19: 3,516,524 (in 000s)).
Schedules to the fi nancial statements for the year ended 31 March 2020 (Continued)E) Notes to accounts (Continued) (1) Statutory Disclosures (Continued)
ECO
NOM
IC &
PO
LITI
CAL
WEE
KLY

Standard CharteredStandard Chartered Bank – India Branches(Incorporated in the United Kingdom with limited liability)
Published on Saturday, june 27, 2020 vol lV nos 26 & 27 EPW Economic & Political Weekly392
(i) Segment Description The Bank has disclosed its operations under the following segments: Segment Defi nition Activities Treasury Treasury activities include foreign exchange, fi xed income, money market and derivative
transactions. Wholesale Banking Local corporate fi nancing, corporate advisory and all advances to trusts, partnership fi rms,
companies and statutory bodies, which are not included under the “Retail Banking” segment, are reported under Wholesale Banking.
Retail Banking Retail banking serves retail customers through the branch network and other delivery channels. This segment raises deposits from customers and makes loans and provides other services to such customers. This segment also includes activities relating to credit cards, debit cards, mortgage loans, third party product distribution and their associated costs. Exposures are classifi ed under retail banking taking into account the orientation, product, granularity and individual exposure criteria.
Others Others include Property and other items not allocable in the aforementioned segments. The classifi cation of exposures to the respective segments conform to the guidelines issued by RBI based on the information available
for classifi cation. (ii) Segment Accounting Policy Segment results are determined after considering the following inter-unit notional charges/recoveries: a. Fund Transfer Pricing: Treasury gives notional interest benefi t to other divisions for the funds mobilized by the latter through deposits, and
similarly charge notional interest to other divisions for the funds utilized by them for lending and investment purposes. Based on tenor of assets/liabilities and market scenarios, Treasury calculates notional interest rates used for this purpose.
b. Premises Rental Chargeback: Individual business segments are charged rent based on notional market values and the same is credited to ‘Othersʼ
(Property) in respect of the premises occupied by them. c. Support costs (costs pertaining to Finance, HR, Property, Legal & Compliance, etc.) are allocated to Treasury, Wholesale &
Retail banking segments based on managementsʼ estimates of the benefi ts accruing to these segments for the costs incurred. This is similar to the basis used for the internal management reporting.
d. Capital & Reserves and attributable earnings thereon are allocated to individual business segments based on period end Risk Weighted Assets.
(iii) Geographic Segments As the Bank does not have any earnings or assets originating outside India, the Bank is considered to operate only in the domestic
segment. (iv) Segment Reporting
For the year ended 31 March 2020 (` in 000s) Treasury Wholesale Retail Banking Others Total Banking A. Gross Segment Revenue 53,347,255 52,476,812 35,659,662 3,133,787 144,617,516 B. Net Segment Revenue 36,299,651 36,378,651 24,172,643 (2,643,262) 94,207,683 C. Net Segment Results 35,970,973 7,718,754 4,037,049 (4,512,172) 43,214,604 D. Operating Profi t – – – – 43,214,604 E. Income Taxes – – – (14,867,830) (14,867,830) F. Net Profi t – – – – 28,346,774 G. Segment Assets 943,731,155 529,931,697 263,735,172 107,597,210 1,844,995,234 H. Segment Liabilities 557,244,681 840,466,131 421,626,589 25,657,833 1,844,995,234 I. Capital Expenditure to acquire Fixed Assets – – – 619,850 619,850 J. Depreciation – – – 620,302 620,302
Schedules to the fi nancial statements for the year ended 31 March 2020 (Continued)E) Notes to accounts (Continued) (2) Segment reporting
ECO
NOM
IC &
PO
LITI
CAL
WEE
KLY
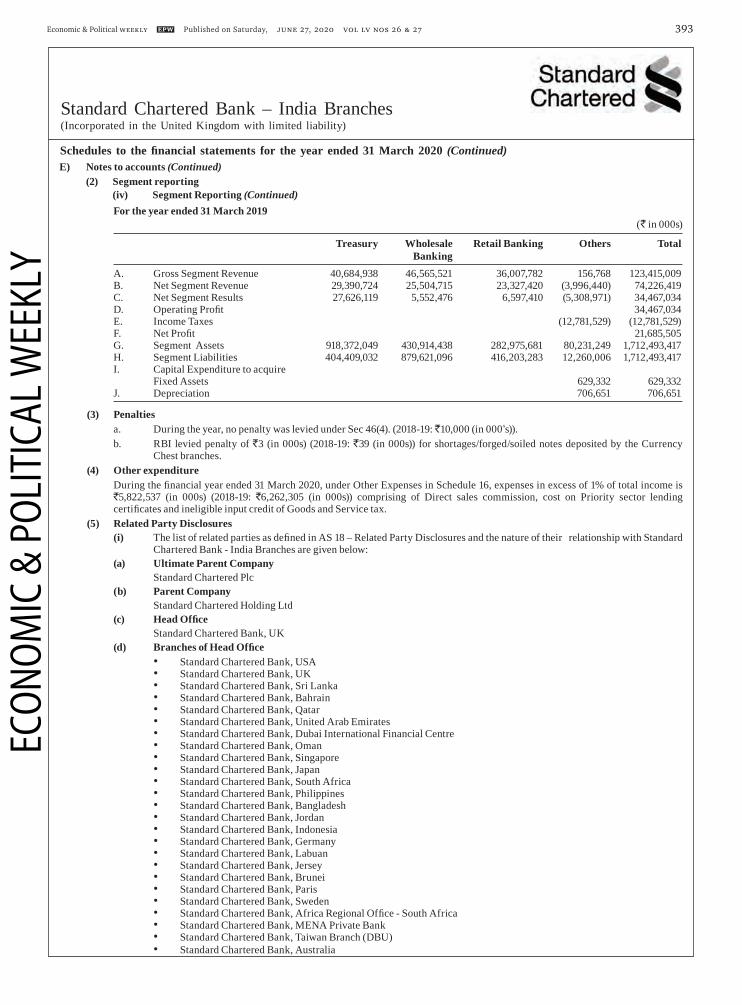
Standard CharteredStandard Chartered Bank – India Branches(Incorporated in the United Kingdom with limited liability)
Economic & Political Weekly EPW Published on Saturday, june 27, 2020 vol lV nos 26 & 27 393
For the year ended 31 March 2019 (` in 000s) Treasury Wholesale Retail Banking Others Total Banking A. Gross Segment Revenue 40,684,938 46,565,521 36,007,782 156,768 123,415,009 B. Net Segment Revenue 29,390,724 25,504,715 23,327,420 (3,996,440) 74,226,419 C. Net Segment Results 27,626,119 5,552,476 6,597,410 (5,308,971) 34,467,034 D. Operating Profi t 34,467,034 E. Income Taxes (12,781,529) (12,781,529) F. Net Profi t 21,685,505 G. Segment Assets 918,372,049 430,914,438 282,975,681 80,231,249 1,712,493,417 H. Segment Liabilities 404,409,032 879,621,096 416,203,283 12,260,006 1,712,493,417 I. Capital Expenditure to acquire Fixed Assets 629,332 629,332 J. Depreciation 706,651 706,651 (3) Penalties a. During the year, no penalty was levied under Sec 46(4). (2018-19: 10,000 (in 000 s)). b. RBI levied penalty of `3 (in 000s) (2018-19: `39 (in 000s)) for shortages/forged/soiled notes deposited by the Currency
Chest branches. (4) Other expenditure During the fi nancial year ended 31 March 2020, under Other Expenses in Schedule 16, expenses in excess of 1% of total income is
`5,822,537 (in 000s) (2018-19: `6,262,305 (in 000s)) comprising of Direct sales commission, cost on Priority sector lending certifi cates and ineligible input credit of Goods and Service tax.
(5) Related Party Disclosures (i) The list of related parties as defi ned in AS 18 – Related Party Disclosures and the nature of their relationship with Standard
Chartered Bank - India Branches are given below: (a) Ultimate Parent Company Standard Chartered Plc (b) Parent Company Standard Chartered Holding Ltd (c) Head Offi ce Standard Chartered Bank, UK (d) Branches of Head Offi ce • Standard Chartered Bank, USA • Standard Chartered Bank, UK • Standard Chartered Bank, Sri Lanka • Standard Chartered Bank, Bahrain • Standard Chartered Bank, Qatar • Standard Chartered Bank, United Arab Emirates • Standard Chartered Bank, Dubai International Financial Centre • Standard Chartered Bank, Oman • Standard Chartered Bank, Singapore • Standard Chartered Bank, Japan • Standard Chartered Bank, South Africa • Standard Chartered Bank, Philippines • Standard Chartered Bank, Bangladesh • Standard Chartered Bank, Jordan • Standard Chartered Bank, Indonesia • Standard Chartered Bank, Germany • Standard Chartered Bank, Labuan • Standard Chartered Bank, Jersey • Standard Chartered Bank, Brunei • Standard Chartered Bank, Paris • Standard Chartered Bank, Sweden • Standard Chartered Bank, Africa Regional Offi ce - South Africa • Standard Chartered Bank, MENA Private Bank • Standard Chartered Bank, Taiwan Branch (DBU) • Standard Chartered Bank, Australia
Schedules to the fi nancial statements for the year ended 31 March 2020 (Continued)E) Notes to accounts (Continued) (2) Segment reporting (iv) Segment Reporting (Continued)
ECO
NOM
IC &
PO
LITI
CAL
WEE
KLY
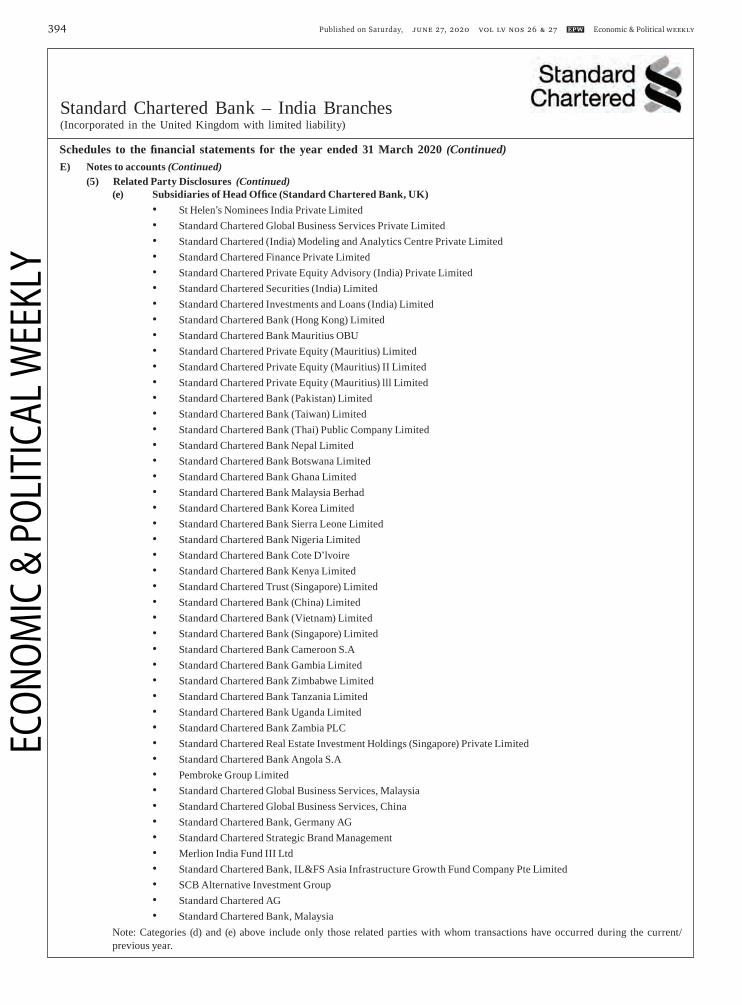
Standard CharteredStandard Chartered Bank – India Branches(Incorporated in the United Kingdom with limited liability)
Published on Saturday, june 27, 2020 vol lV nos 26 & 27 EPW Economic & Political Weekly394
(e) Subsidiaries of Head Offi ce (Standard Chartered Bank, UK) • St Helen s Nominees India Private Limited • Standard Chartered Global Business Services Private Limited • Standard Chartered (India) Modeling and Analytics Centre Private Limited • Standard Chartered Finance Private Limited • Standard Chartered Private Equity Advisory (India) Private Limited • Standard Chartered Securities (India) Limited • Standard Chartered Investments and Loans (India) Limited • Standard Chartered Bank (Hong Kong) Limited • Standard Chartered Bank Mauritius OBU • Standard Chartered Private Equity (Mauritius) Limited • Standard Chartered Private Equity (Mauritius) II Limited • Standard Chartered Private Equity (Mauritius) lll Limited • Standard Chartered Bank (Pakistan) Limited • Standard Chartered Bank (Taiwan) Limited • Standard Chartered Bank (Thai) Public Company Limited • Standard Chartered Bank Nepal Limited • Standard Chartered Bank Botswana Limited • Standard Chartered Bank Ghana Limited • Standard Chartered Bank Malaysia Berhad • Standard Chartered Bank Korea Limited • Standard Chartered Bank Sierra Leone Limited • Standard Chartered Bank Nigeria Limited • Standard Chartered Bank Cote Dʼlvoire • Standard Chartered Bank Kenya Limited • Standard Chartered Trust (Singapore) Limited • Standard Chartered Bank (China) Limited • Standard Chartered Bank (Vietnam) Limited • Standard Chartered Bank (Singapore) Limited • Standard Chartered Bank Cameroon S.A • Standard Chartered Bank Gambia Limited • Standard Chartered Bank Zimbabwe Limited • Standard Chartered Bank Tanzania Limited • Standard Chartered Bank Uganda Limited • Standard Chartered Bank Zambia PLC • Standard Chartered Real Estate Investment Holdings (Singapore) Private Limited • Standard Chartered Bank Angola S.A • Pembroke Group Limited • Standard Chartered Global Business Services, Malaysia • Standard Chartered Global Business Services, China • Standard Chartered Bank, Germany AG • Standard Chartered Strategic Brand Management • Merlion India Fund III Ltd • Standard Chartered Bank, IL&FS Asia Infrastructure Growth Fund Company Pte Limited • SCB Alternative Investment Group • Standard Chartered AG • Standard Chartered Bank, Malaysia Note: Categories (d) and (e) above include only those related parties with whom transactions have occurred during the current/
previous year.
Schedules to the fi nancial statements for the year ended 31 March 2020 (Continued)E) Notes to accounts (Continued) (5) Related Party Disclosures (Continued)
ECO
NOM
IC &
PO
LITI
CAL
WEE
KLY

Standard CharteredStandard Chartered Bank – India Branches(Incorporated in the United Kingdom with limited liability)
Economic & Political Weekly EPW Published on Saturday, june 27, 2020 vol lV nos 26 & 27 395
(f) Key Management Personnel In accordance with the RBI circular DBR.BP.BC No.23/21.04.018/2015-16 dated 01 July 2015, only Ms. Zarin Daruwala, the Chief
Executive Offi cer of the Bank falls under the category of key management personnel for the year 2019-20, hence, no disclosures are provided.
(ii) Transactions and balances In line with the RBI circular DBR.BP.BC No.23/21.04.018/2015-16 dated 01 July 2015, related party disclosures exclude transactions
in a category where there is only one related party (i.e. key management personnel) and where the Bank has an obligation under law to maintain confi dentiality in respect of their customer transactions.
(` in 000s)
Parent Company Head Offi ce & Branches Subsidiaries & Fellow Subsidiaries
For the For the For the For the For the For the year ended year ended year ended year ended year ended year ended
31-Mar-20 31-Mar-19 31-Mar-20 31-Mar-19 31-Mar-20 31-Mar-19 Leasing arrangements availed – – – – 19,659 19,675 Leasing arrangements provided – – – – 54,984 87,307 Purchase of Fixed assets – – – – – – Sale of Fixed Assets – – – – – – Employee Share Options – – 176,786 267,122 – – Rendering of services – – 670,820 1,794,187 600,855 816,774 Receiving of services – – 87,952 108,042 3,713,516 4,169,559 Interest Paid – – 1,511,809 338,817 200,233 247,754 Interest Received – – 330,016 588,669 8,570 1,347 Sale of foreign exchange – – 6,916,074,530 10,005,700,697 251,276,954 240,805,122 Purchase of foreign exchange – – 7,002,842,998 10,845,337,995 147,872,102 242,554,176 Fee and commission/other income (net) – – 1,240,559 1,554,856 64,178 (427,224) Service Fees received on Guarantees/LCs – – 383,860 169,051 514,360 384,726 Purchase of DP business – – – – 97,500 – Purchase of investments – – 108,331,368 46,570,323 768,325 3,149,182 Sale of investments – – 92,558,605 52,868,306 – – (` in 000s)
Parent Company Head Offi ce & Branches Subsidiaries & Fellow Subsidiaries
Maximum Maximum Maximum Outstanding Outstanding Outstanding As at during the As at during the As at during the 31-Mar-20 year 31-Mar-20 year 31-Mar-20 year Lease Rentals Payable* – – – – – 2,197 Lease Rentals Receivable* – – – – 20,744 38,898 Employee Share Options* – – (266,708) (1,042,106) – – Borrowings – – (72,352,764) (158,431,043) – – Subordinated Debts – – – – – – Deposit/Vostros* – – (2,373,458) (6,828,621) (5,374,801) (6,369,900) Investments – – – – – – Placements – – – 64,751,850 – – Advances – – – – – – Nostro/Bank Balances – – 2,478,002 90,122,122 44,587 180,877 Derivative Notional & Trade Contingents* – – 2,211,178,967 2,212,200,803 23,415,049 102,035,544 Sundry Balances (Net)* – – (2,974,332) (2,974,332) (1,239,369) (1,239,380) Positive MTM* – – 23,669,459 23,669,459 27,883 2,209,726 Negative MTM* – – (27,087,019) (27,087,019) (641,935) (1,445,786)
Schedules to the fi nancial statements for the year ended 31 March 2020 (Continued)E) Notes to accounts (Continued) (5) Related Party Disclosures (Continued)
ECO
NOM
IC &
PO
LITI
CAL
WEE
KLY

Standard CharteredStandard Chartered Bank – India Branches(Incorporated in the United Kingdom with limited liability)
Published on Saturday, june 27, 2020 vol lV nos 26 & 27 EPW Economic & Political Weekly396
(` in 000s) Parent Company Head Offi ce & Branches Subsidiaries & Fellow
Subsidiaries Maximum Maximum Maximum Outstanding Outstanding Outstanding As at during the As at during the As at during the 31-Mar-19 year 31-Mar-19 year 31-Mar-19 year Lease Rentals Payable* – – – – – 5,148 Lease Rentals Receivable* – – – – – 126,172 Employee Share Options* – – (825,198) (834,093) – – Borrowings – – (26,970,450) (89,769,259) – – Deposit/Vostros* – – (2,155,230) (2,765,530) (2,095,961) (12,672,075) Placements – – 8,644,375 75,567,131 – – Advances – – – – – – Nostro/Bank Balances – – 9,863,784 20,029,165 (11,123) 543,521 Derivative Notional & Trade Contingents* – – 1,663,681,697 1,885,245,704 58,320,763 52,020,628 Sundry Balances (Net)* – – 1,341,848 2,122,317 (881,777) (416,893) Positive MTM* – – 15,304,849 22,716,387 1,049,058 1,049,058 Negative MTM* – – (13,475,199) (35,562,350) (68,789) (194,815)
Figures in bracket denotes payable * Figures indicate maximum balance outstanding during the year based on comparison of the total outstanding balances at each
month-end. (iii) Material related party transactions are given below: The following were the material transactions between the Bank and its related parties for the year ended 31st March 2020. A specifi c
related party transaction is disclosed as a material related party transaction wherever it exceeds 10% of all related party transactions in that category.
Leasing Arrangements For availing leasing service - payment of rent to Standard Chartered Global Business Services Private Limited `20 million (2018-19:
`20 million). For providing leasing services - receipt of rent from Standard Chartered Finance Private Limited `18 million (2018-19: `34 million),
Standard Chartered Securities (India) Limited `24 million (2018-19: `33 million) and Standard Chartered Investments and Loans (India) Limited 8 million (2018-19: 8 million).
Rendering of Services During the year the Bank provided secondment, amenities and other services to related parties. The material transactions were with
Standard Chartered Private Equity Advisory (India) Private Limited, `103 million (2018-19: `487 million), Standard Chartered Bank, Singapore `429 million (2018-19: `924 Million), SCB US `167 million (2018-19: `385 million), SCB Mauritius `149 million (2018-19: 35 million) and Pembroke Group Limited 133 million (2018-19 : Nil).
Receiving of Services During the year the Bank availed of back offi ce support, brokerage, marketing and other services from related parties. The material
transactions were back offi ce support services from Standard Chartered Global Business Services Private Limited `3,408 million (2018-19: 3,871 million).
Interest Paid Interest on money market borrowings to Head Offi ce 1.4 billion (2018-19: (1) million), Standard Chartered Bank, Japan 41 million
(2018-19: 297 million), Standard Chartered Bank, Nepal 75 million (2018-19: 171 million) and Standard Chartered Bank, Vietnam `76 million (2018-19: 37 million).
Interest Received Interest on money market lending to Head Offi ce 264 million (2018-19: 507 million) and Interest on Nostro balances and lending to
Standard Chartered Bank, USA 40 million (2018-19: 52 million). Foreign Exchange Transactions Sale of foreign currencies to Head Offi ce `5,093,139 million (2018-19: `5,857,513 million) and Standard Chartered Bank, Singapore
`796,830 million (2018-19: 3,343,397 million). Purchase of foreign currencies from Head Offi ce `5,239,472 million (2018-19: `6,831,477 million), Standard Chartered Bank, Singapore
`768,105 million (2018-19: 3,002,653 million) and Standard Chartered Bank, Japan 709,997 million (2018-19: 208,331 million). Fee and Commission Income/Other Income Receipt of fees from Head Offi ce `1,340 million (2018-19: `1,350 million) and Standard Chartered Bank, Singapore `310 million
(2018-19: 496 million)
Schedules to the fi nancial statements for the year ended 31 March 2020 (Continued)E) Notes to accounts (Continued) (5) Related Party Disclosures (Continued) (ii) Transactions and balances (Continued)
ECO
NOM
IC &
PO
LITI
CAL
WEE
KLY

Standard CharteredStandard Chartered Bank – India Branches(Incorporated in the United Kingdom with limited liability)
Economic & Political Weekly EPW Published on Saturday, june 27, 2020 vol lV nos 26 & 27 397
Service Fees on Guarantees & Letters of Credit Receipt of trade fees from Standard Chartered Bank, Dubai `80 million (2018-19: `7 million), Standard Chartered Bank, Singapore `148
million (2018-19: 5.5 million), SCB Bangladesh 102 million (2018-19: 17 million) and SCB Nepal 260 million (2018-19: 86 million). Purchase and Sale of Investments Purchase of investments from Standard Chartered Bank (Mauritius) Limited `768 million (2018-19: `3,149 million) and Standard
Chartered Bank, Singapore 108,331 million (2018 - 19: 46,570 million). Sale of investments to Standard Chartered Bank, Singapore 92,559 million (2018-19: 52,868 million). (6) Leases Commercial and residential premises are taken on operating leases, which are cancellable in nature. Information provided herein
pertains to premises taken/given on operating leases:(` in 000s)
For the year ended For the year ended 31-Mar-20 31-Mar-19 Lease payments recognised in the Profi t and Loss Account in respect of operating leases 914,835 882,551
(` in 000s) For the year ended For the year ended 31-Mar-20 31-Mar-19 Assets given on lease – Premises Gross carrying amount 806,299 1,132,165 Accumulated depreciation 49,244 67,766 Depreciation charge for the year 5,397 8,462 • There are no provisions relating to contingent rent • The terms of renewal/purchase options and escalation clauses are those normally prevalent in similar agreements • There are no undue restrictions or onerous clauses in the agreements • Initial direct costs for leases given are recognized as an expense in Profi t and Loss Account (7) Disclosure under Micro, Small & Medium Enterprises Development Act, 2006 The following disclosure is made as per the requirement under the Micro, Small and Medium Enterprises Development Act, 2006
(‘MSMEDʼ) on the basis of confi rmation sought from suppliers on registration with specifi ed authority under MSMED:(` in 000s)
As at 31-Mar-20 As at 31-Mar-19 Principal amount remaining unpaid to any supplier as at the year end 26,022 3,398 Interest due thereon – – Amount of interest paid and payments made to the supplier beyond the appointed day during each accounting year – – Amount of interest due and payable for period of delay in making payment (which have been paid but beyond the appointed day during the year) but without adding the interest specifi ed under this Act – – Amount of interest accrued and remaining unpaid at the year end – – (8) Deferred Tax The deferred tax charge of `18,849 million for the year ended 31 March 2020 (2018-19: `5,715 million) is included in provision on
account of tax under Schedule 17- Provisions and Contingencies. The primary components that gave rise to deferred tax assets and liabilities included in the balance sheet are as follows:
(` in 000s) As at 31-Mar-20 As at 31-Mar-19 Deferred tax assets Provision for Advances 8,679,733 25,978,675 Depreciation 419,479 521,714 Disallowances under section 43B of Income Tax Act 1961 733,826 714,704 Others – – Deferred tax assets 9,833,038 27,215,093 Deferred tax liabilities (2,280,737) (813,811) Net deferred tax assets 7,552,301 26,401,282 Charge for the year 18,848,981 5,714,601
Schedules to the fi nancial statements for the year ended 31 March 2020 (Continued)E) Notes to accounts (Continued) (5) Related Party Disclosures (Continued) (iii) Material related party transactions are given below: (Continued)
ECO
NOM
IC &
PO
LITI
CAL
WEE
KLY

Standard CharteredStandard Chartered Bank – India Branches(Incorporated in the United Kingdom with limited liability)
Published on Saturday, june 27, 2020 vol lV nos 26 & 27 EPW Economic & Political Weekly398
(9) Amount of Provisions made for Income Tax during the year(` in 000s)
For the year ended For the year ended 31-Mar-20 31-Mar-19 Provision for Income Tax (3,981,152) 6,658,330 (10) Portfolio Purchase During the year, the Bank has purchased loans (retail loans) amounting to `8,491 million (2018-19: `13,070 million) from various
NBFCs, banks and other institutions. (11) Disclosure on remuneration The Bank s compensation policies including that of CEO s, is in conformity with the Financial Stability Board principles and
standards. In accordance with the requirements of the RBI Circular No. DBOD No.BC.72/29.67.001/2011-12 dated 13 January 2012, the Bank has submitted a declaration to RBI confi rming the aforesaid matter.
(12) Employee Share Based Payment The eligible employees of the Bank have been granted stock awards as equity shares of the ultimate holding company, SCPLC, under
various share schemes such as Restricted Share Award (RSA), Deferred Restricted Share Award (DRSA), Performance Share Award (PSA), Sharesave Plan, etc.
During the year, the Bank has recognized an amount of `176,788 (in 000s) (2018-19: `267,120 (in 000s)) under the head ‘Payments to and Provisions for Employees , as cost on account of share-based payments under Schedule 16 – Operating Expenses and the same is payable to Standard Chartered Bank, UK (Head offi ce).
(13) Corporate Social Responsibility The Bank has a local Corporate Social Responsibility (CSR) committee responsible for the preparation and implementation of the
CSR policy, review and approval of budgets, developing a monitoring framework for implementation. The Bank has a local policy on CSR that support programs related to health (preventive blindness), water and sanitation, education, employability and entrepreneurship and any other duly authorized initiative by the Management Committee of the Bank. Details of CSR expenditure are set out below:
(` in 000s) Gross amount required to be spent during the year 707,898 (2018-19: 525,373) Amount spent during the year ending on 31 March 2020: Incash Yet to be Total paid in cash 1. Construction/acquisition of any assets – – – 2. For purposes other than 1 above 634,743 – 634,743 Amount spent during the year ending on 31 March 2019: Incash Yet to be Total paid in cash 1. Construction/acquisition of any assets – – – 2. For purposes other than 1 above 357,558 – 357,558 (14) Prior Period Comparatives Previous year fi gures have been reclassifi ed or regrouped wherever necessary to conform to the current year s presentation.
For MSKC & Associates For Standard Chartered Bank – India Branches(Formerly knows as R.K. Kumar & Co.)Chartered AccountantsFirm s Registration No: 001595S
Sd/- Sd/-Tushar Kurani Zarin DaruwalaPartner Chief Executive Offi cer – IndiaMembership No: 118580 Sd/- Subhradeep Mohanty Chief Financial Offi cer – IndiaMumbai18 June 2020
Schedules to the fi nancial statements for the year ended 31 March 2020 (Continued)E) Notes to accounts (Continued)
ECO
NOM
IC &
PO
LITI
CAL
WEE
KLY

Standard CharteredStandard Chartered Bank – India Branches(Incorporated in the United Kingdom with limited liability)
Economic & Political Weekly EPW Published on Saturday, june 27, 2020 vol lV nos 26 & 27 399
1. Background The Standard Chartered Group (SCB Group or the Group) is an international banking and fi nancial services group particularly focused on
the markets of Asia, Africa and the Middle East. Standard Chartered Bank is regulated by the Financial Conduct Authority and Prudential Regulation Authority in the United Kingdom (UK).
SCB India (SCBI or the Bank) is a branch of Standard Chartered Bank UK, which is part of the SCB Group. The ultimate parent company of the Bank is Standard Chartered PLC, which is listed on the London Stock Exchange and the Stock Exchanges of Hong Kong and India. Indian branch operations are conducted in accordance with the banking license granted by the Reserve Bank of India (RBI) under the Banking Regulation Act 1949.
2. Overview The Basel Committee on Banking Supervision published a framework for International Convergence of Capital Measurement and Capital
Standards (commonly referred to as Basel II), which replaced the original 1988 Basel I Accord. The RBI adopted the same in Mar 2008. Subsequently, post introduction of Basel III, RBI adopted implementation of the same from 1 April 2013 and is phased in through to 31 Mar 2020. Accordingly, for 31 Mar 2019 reporting purposes, the Bank has calculated its Pillar 1 capital requirement based on Basel III norms.
Basel III is structured around three “pillars” which are outlined below: ▪ Pillar 1 sets out minimum regulatory capital requirements – the minimum amount of regulatory capital banks must hold against the
risks they assume; ▪ Pillar 2 sets out the key principles for supervisory review of a bank’s risk management framework and its capital adequacy. It sets
out specifi c oversight responsibilities for the Board and senior management, thus reinforcing principles of internal control and other corporate governance practices; and
▪ Pillar 3 aims to bolster market discipline through enhanced disclosure by banks. Basel III provides three approaches of increasing sophistication to the calculation of credit risk capital; the Standardised Approach (SA),
the Foundation Internal Ratings Based Approach and the Advanced Internal Ratings Based Approach (IRB). Basel II also introduced capital requirements for operational risk (OR) for the fi rst time.
3. DF 1 - Scope of Application Name of the head of the banking group to which the framework applies: Standard Chartered Bank, India Branches DF 1 - Qualitative Disclosures3.1. Pillar 1 The SCB Group and local management of the Indian operations recognise that Basel III is a driver for continuous improvement of risk
management practices and believe that adoption of leading risk management practices are essential for achieving its strategic intent. Accordingly, the Group has adopted the IRB model for the measurement of credit risk covering substantial majority of the portfolio. The Group applies Internal Models Approach for market risk capital and the Standardised Approach for determining its OR capital requirements.
SCBI has adopted RBI’s prevailing Basel III regulations related to SA for credit and market risk and Basic Indicator Approach (BIA) for OR for computing local regulatory Pillar 1 capital.
3.2. Pillar 2 Pillar 2 requires banks to undertake a comprehensive assessment of their risks and to determine the appropriate amounts of capital to be
held against these risks where other suitable mitigants are not available. This risk and capital assessment is commonly referred to as an Internal Capital Adequacy Assessment Process (ICAAP). The range of risks that need to be covered by the ICAAP is much broader than Pillar 1, which covers only credit risk, market risk and OR.
The Group has developed an ICAAP framework which closely integrates the risk management and capital assessment processes and ensures that adequate levels of capital are maintained to support the current and projected demand for capital under expected and stressed conditions. The ICAAP framework has been designed to be applied consistently across the organisation to meet the Pillar 2 requirements of local regulators. As a branch of a foreign bank in India, the India ICAAP is largely based on the Group ICAAP framework, so as to maintain consistency in reporting of the risk and capital management aspects. However, wherever necessary, local customisation has been incorporated to align with the RBI requirements.
3.3. Pillar 3 Pillar 3 aims to provide a consistent and comprehensive disclosure framework that enhances comparability between banks and further promotes
improvements in risk management practices. The Bank has implemented the requirements laid down by RBI for Pillar 3 disclosure, covering both the qualitative and quantitative items. These are also published in the Bank’s annual report and hosted on the Bank’s website.
The risk related disclosures and analysis provided herein below, are primarily in the context of the disclosures required under the RBI’s Pillar 3 – Market Discipline of the Basel III Capital Regulations and are in respect of SCBI, except where required and specifi cally elaborated, to include other Group entities operating in India. The information provided has been reviewed by senior management and is in accordance with the guidelines prescribed by the RBI.
3.4. Accounting and Prudential Treatment/Consolidation Framework The consolidation norms for accounting are determined by the prevailing Indian Generally Accepted Accounting Principles (GAAP). The
regulatory requirements are governed by RBI guidelines. The differences between consolidation for accounting purposes and regulatory purposes are mainly on account of following reasons:
1) Control over other entities to govern the fi nancial and operating policies of the subsidiaries or joint ventures As per Indian GAAP, existence of control/joint control to govern the fi nancial and operating policies of the subsidiary or joint venture
is necessary for accounting consolidation. However, certain entities such as Non Banking Finance Companies (NBFC) have to be consolidated for regulatory capital adequacy purposes even where the above requirement is not fulfi lled. Such cases are where the ability to control fi nancial and operating policies of the entities legally vests with the Parent or Group entities and not with the India branch operations.
Risk review and disclosures under Basel III Framework for the period ended 31 Mar 2020
ECO
NOM
IC &
PO
LITI
CAL
WEE
KLY

Standard CharteredStandard Chartered Bank – India Branches(Incorporated in the United Kingdom with limited liability)
Published on Saturday, june 27, 2020 vol lV nos 26 & 27 EPW Economic & Political Weekly400
2) Nature of business of the entities to be consolidated As per Indian GAAP, subsidiaries are not excluded from consolidation because of dissimilar nature of business activities between
subsidiary and other entities within the Group. However, RBI regulations do not require consolidation of entities engaged in insurance business and businesses not pertaining to fi nancial services.
3) Method of consolidation The accounting consolidation methodology requires ‘line by line’ consolidation and elimination of all inter-group balances.
However, for the purpose of regulatory consolidation under the capital adequacy framework, the risk weighted assets (RWA) and capital requirements for each entity can be computed separately by applying the Basel III norms as applicable for a bank and simply added together with that of the lead bank in the consolidated group. The Bank has adopted the latter approach for consolidation of entities for limited purpose of capital adequacy framework, as the accounting consolidation method is not appropriate considering the legal ownership pattern of the consolidated entities.
List of group entities considered for consolidation for regulatory purposes is summarised below: Name of the Entity / Whether the Explain the Whether the Explain the Explain the Explain the Country of Entity Is Method of Entity Is Method of Reasons for Reasons if Incorporation Included Under Consolidation Included Under Consolidation Difference in Consolidated Accounting Regulatory the Method of under Only Scope of Scope of Consolidation One of the Consolidation Consolidation Scopes of (Yes/No) (Yes/No) Consolidation Standard Chartered Yes Full Yes For the purpose of regulatory consolidation under
Bank, India Branches the capital adequacy framework, the RWA and capital requirements for each entity can be computed Standard Chartered No Not Yes separately by applying the Basel III norms as Investments and Loans Applicable applicable for a bank and simply added together with (India) Limited that of the lead bank in the consolidated group. The Bank has adopted the latter approach for consolidation of entities for limited purpose of capital adequacy framework, as the accounting consolidation method is not appropriate considering the legal ownership pattern of the consolidated entities.
List of group entities in India not considered for consolidation both under the accounting and regulatory scope of consolidation: (` in 000s)
Name of the Principle activity of the entity Total balance % of bank’s Regulatory Total balance Entity/Country sheet equity holding in treatment sheet assets of Incorporation (as stated in of the total bank’s (as stated in the accounting equity investments the accounting balance sheet in the capital balance sheet of the legal instruments of the legal entity) of the entity entity) Standard Chartered Category I merchant banker, rendering 2,818,557 0% Not Applicable 2,815,553 Securities (India) brokering services to retail clients and Limited ** depository services St. Helen’s Nominee business - holding shares/ 100 0% Not Applicable 35,174 Nominees India debentures in limited companies on Private Limited* behalf of SCBI and its clients. Security trusteeship business for SCBI. Standard Chartered The company renders the following 83,116 100% Not Applicable 22,133,400 Global Business services to related parties: a) Software Services Private development, maintenance & support Limited* b) Back offi ce transaction processing and data processing of various banking transactions c) IT support d) Voice call centre services Standard Chartered Marketing services of fi nancial products 71,907 0% Not Applicable 881,179 Finance Private of Standard Chartered Bank and its Limited** Home Assist division provides search and other property related services. Standard Chartered The company is a captive knowledge 500,000 100% Not Applicable 779,135 (India) Modeling process outsourcing company which and Analytics Centre provides robust and contemporary Private Limited* analytical solutions to the Bank’s businesses across the globe for the purpose of risk management and capital management. Standard Chartered The company is a research unit for 24,000 0% Not Applicable 199,781 Private Equity Merlion India Fund carrying on activities Advisory (India) of industry research and advice by Private Limited** furnishing industry and market feedback. Note: * Basis audited results as at 31 Mar 2020 ** Basis unaudited results as at 31 Mar 2020
Risk review and disclosures under Basel III Framework for the period ended 31 Mar 2020 (Continued)
ECO
NOM
IC &
PO
LITI
CAL
WEE
KLY

Standard CharteredStandard Chartered Bank – India Branches(Incorporated in the United Kingdom with limited liability)
Economic & Political Weekly EPW Published on Saturday, june 27, 2020 vol lV nos 26 & 27 401
DF1 - Quantitative Disclosures List of group entities considered for regulatory consolidation: (` in 000s) Name of the Entity/ Principle activity of the entity Total balance sheet Total balance sheet Country of Incorporation equity (as stated in the assets (as stated in the accounting balance accounting balance sheet of the legal entity) sheet of the legal entity) Standard Chartered Bank, Banking and Financial services 74,400,742 1,844,995,234 India Branches Standard Chartered Financial services acceptable for NBFC, 4,543,900 25,056,528 Investments and Loans (India) other than accepting public deposits eg. Limited lending, investments, etc. Note: The above data is as per audited results as at 31 Mar 2020. The aggregate amount of capital defi ciencies in all subsidiaries not included in the consolidatio, i.e., that are deducted and the name(s) of such subsidiaries. NIL The aggregate amounts (e.g., current book value) of the bank’s total interests in insurance entities, which
are risk-weighted, as well as, their name, their country of incorporation or residence, the proportion of ownership interest and, if different, the proportion of voting power in these entities. In addition,
indicate the quantitative impact on regulatory capital of using this method versus using the deduction. NIL Any restrictions or impediments on transfer of funds or regulatory capital within the banking group As per extant RBI guidelines 4. DF 2 - Capital Adequacy DF 2 - Qualitative Disclosures4.1. Objectives The Bank’s capital management approach is driven by its desire to maintain a strong capital base to support the development of its business
and to meet regulatory capital requirements at all times.4.2. Approach Strategic, business and capital plans are drawn up annually covering a one to fi ve year horizon. The plans ensure that adequate levels of
capital and an optimum mix are maintained by the Bank to support its strategy. This is integrated with the Bank’s annual planning process which takes into consideration business growth assumptions across products and the related impact on capital resources.
The capital plan takes the following into account: ▪ Regulatory capital requirements and assessment of future standards; ▪ Demand for capital due to business growth, market stresses and potential risks; and ▪ Available supply of capital and capital raising options. The Group uses internal models and other quantitative techniques in its internal risk and capital assessment at an overall Group level. The
Bank also considers additional risk types other than those considered under Pillar 1 as part of its ICAAP. Each material risk is assessed, relevant mitigants considered, and appropriate levels of capital determined.
Stress testing and scenario/sensitivity analysis are used to assess the Bank’s ability to sustain operations during periods of extreme but plausible events. They provide an insight into the potential impact of signifi cant adverse events on the Bank’s earnings, risk profi le and capital position and how these could be mitigated.
The capital that the Bank is required to hold by the RBI is mainly determined by its balance sheet, off-balance sheet and market risk positions, after applying collateral and other risk mitigants.
4.3. Governance The Group operates processes and controls to monitor and manage capital adequacy across the organisation. At a country level, capital is
maintained on the basis of the local regulator’s requirements. It is overseen by the country Asset and Liability Committee (ALCO), which is responsible for managing the country balance sheet, capital and liquidity, with the active support and guidance from Group ALCO (GALCO), Operational Balance Sheet Committee (OBSC) and Group Treasury (GT). The responsibility of capital management has been assigned to a dedicated sub-group of ALCO, the Capital Management Forum (CMF). The capital management process is governed by the Capital Planning Framework.
Suitable processes and controls are in place to monitor and manage capital adequacy and ensure compliance with local regulatory ratios in all legal entities. These processes are designed to ensure that each entity and the consolidated Bank have suffi cient capital available to meet local regulatory capital requirements at all times.
4.4. Mobility of Capital Resources The Bank operates as a branch in India, hence under current RBI regulations it cannot raise capital externally. The Group’s policy in
respect of profi t repatriation requires that each local entity should remit its profi ts that are considered surplus to local regulatory minimum requirements. The amount to be remitted/injected and the mix/mode of capital (CET 1 v/s Tier 2) is determined in conjunction with GT, after taking into account local capital adequacy regulations (inclusive of any regulatory buffers), anticipated changes to those regulations, forecast organic growth and Head Offi ce (HO) return expectations.
Risk review and disclosures under Basel III Framework for the period ended 31 Mar 2020 (Continued)
ECO
NOM
IC &
PO
LITI
CAL
WEE
KLY

Standard CharteredStandard Chartered Bank – India Branches(Incorporated in the United Kingdom with limited liability)
Published on Saturday, june 27, 2020 vol lV nos 26 & 27 EPW Economic & Political Weekly402
4.5. Capital Structure CET 1/Tier 1 capital mainly comprises of: i) Capital funds injected by HO. ii) Net profi ts of each year retained as per statutory norms (currently 25%). iii) Remittable net profi ts retained in India for meeting regulatory capital requirements. iv) Capital reserves created out of profi ts on account of sale of immovable properties and held to maturity investments, as per RBI regulations. The above are not repatriable/distributable to HO as long as the Bank operates in India. Tier 2 capital mainly comprises of: i) 45% of reserve created on revaluation of immovable properties in accordance with the Indian GAAP. ii) General provisions on standard (performing) assets created as per RBI regulations. iii) Reserve created out of unrealised gain on revaluation of investments as per RBI regulations. iv) Investment fl uctuation reserve created as per RBI regulations. DF 2 - Quantitative Disclosures Capital and RWA As at 31 Mar 2020 (` in 000s) Solo bank* Consolidated bank* Tier 1 Capital : 256,283,122 265,320,691 Common Equity Tier I 256,283,122 265,320,691 Head Offi ce Capital 74,400,742 74,400,742 Paid up capital – 4,543,900 Eligible reserves 183,521,677 188,090,048 Benefi t of DTA – – Illiquid securities reserves (860,289) (860,289) Intangible assets (excluding DTA) (53,376) (128,078) Other regulatory adjustments (725,631) (725,631) DTA deduction (Net of Benefi t) – – DTA Benefi t – – Total Tier 1 Capital 256,283,122 265,320,691 Additional Tier I – – Tier 2 Capital : 17,975,439 18,063,460 Eligible revaluation reserves 2,590,903 2,590,903 General provision and other eligible reserves/provisions 15,384,536 15,472,557 Debt capital instruments eligible to be reckoned as capital funds and included in Lower Tier 2 (of which amount raised during the year Rs. Nil) – Less: Amortisation of qualifying subordinated debts – – Other regulatory adjustments – – Total capital base 274,258,561 283,384,151 Minimum regulatory capital requirements Credit risk 134,421,393 136,718,625 Standardised approach portfolios 112,826,964 115,105,364 Securitisation exposures 1,827,604 1,827,604 Counterparty/settlement risks 18,067,557 18,067,557 Benefi t of DTA 1,699,268 1,718,100 Market risk - Standardised duration approach 18,493,593 18,493,593 Interest rate risk 17,447,368 17,447,368 Foreign exchange risk (including gold) 1,012,500 1,012,500 Equity risk 33,725 33,725 Counterparty/settlement risks – – Operational risk - Basic indicator approach 12,890,512 13,095,506 Total minimum regulatory capital requirements 165,805,498 168,307,724 Risk weighted assets and contingents Credit risk 1,493,571,031 1,519,095,838 Market risk (including counterparty/settlement risks) 205,484,367 205,484,367 Operational risk - Basic indicator approach 143,227,911 145,505,626 Total Risk weighted assets and contingents 1,842,283,309 1,870,085,831 Capital ratios Common Equity Tier 1 capital 13.91% 14.19% Tier 1 capital 13.91% 14.19% Tier 2 capital 0.98% 0.97% Total capital 14.89% 15.15%
Risk review and disclosures under Basel III Framework for the period ended 31 Mar 2020 (Continued)
ECO
NOM
IC &
PO
LITI
CAL
WEE
KLY

Standard CharteredStandard Chartered Bank – India Branches(Incorporated in the United Kingdom with limited liability)
Economic & Political Weekly EPW Published on Saturday, june 27, 2020 vol lV nos 26 & 27 403
As at 31 Mar 2019 (` in 000s) Solo bank* Consolidated bank* Tier 1 Capital : 246,216,480 254,628,124 Common Equity Tier I 246,216,480 254,628,124 Head Offi ce Capital 74,400,742 74,400,742 Paid up capital – 4,543,900 Eligible reserves 176,426,524 179,603,623 Benefi t of Deferred Tax Assets (DTA) – – Illiquid securities reserves (690,414) (690,414) Intangible assets (excluding DTA) – (36,779) Other regulatory adjustments (2,601,816) (2,601,816) DTA deduction (Net of Benefi t) (1,318,555) (591,133) DTA Benefi t – – Total Tier 1 Capital 246,216,480 254,628,124 Additional Tier I – – Tier 2 Capital : 13,224,019 13,302,319 Eligible revaluation reserves 2,291,754 2,291,754 General provision and other eligible reserves/provisions 10,932,265 11,010,565 Debt capital instruments eligible to be reckoned as capital funds and included in Lower Tier 2 (of which amount raised during the year Rs. Nil) – – Less: Amortisation of qualifying subordinated debts – – Other regulatory adjustments – – Total capital base 259,440,499 267,930,443 Minimum regulatory capital requirements Credit risk 122,432,138 124,702,943 Standardised approach portfolios 100,999,673 103,097,583 Securitisation exposures 1,835,342 1,835,342 Counterparty/settlement risks 13,953,510 13,953,510 Benefi t of DTA 5,643,613 5,816,508 Market risk - Standardised duration approach 15,545,816 15,545,816 Interest rate risk 14,892,916 14,892,916 Foreign exchange risk (including gold) 607,500 607,500 Equity risk 45,400 45,400 Counterparty/settlement risks – – Operational risk - Basic indicator approach 13,063,485 13,228,765 Total minimum regulatory capital requirements 151,041,439 153,477,524 Risk weighted assets and contingents Credit risk 1,360,357,089 1,385,588,257 Market risk (including counterparty/settlement risks) 172,731,287 172,731,292 Operational risk - Basic indicator approach 145,149,836 146,986,280 Total Risk weighted assets and contingents 1,678,238,212 1,705,305,829 Capital ratios Common Equity Tier 1 capital 14.67% 14.93% Tier 1 capital 14.67% 14.93% Tier 2 capital 0.79% 0.78% Total capital 15.46% 15.71% * Solo Bank represents the main licensed bank of the Group in India and consolidated bank includes Group controlled entities operating
in India and consolidated for the limited purpose of capital adequacy framework.5. Risk Management The Bank has a strong governance culture and framework for risk management. The Bank’s risk management principles align with those
established at a Group level and are customized to meet the local regulatory requirements. One of the main risks incurred arises from extending credit to clients through trading and lending operations. Beyond credit risk, the Bank is also exposed to a range of other risk types such as market, operational, liquidity, pension, country cross border, reputational, strategic and other risks that are inherent to its strategy, product range and geographical coverage.
5.1. Risk Management Framework The Bank adds value to clients and generates returns for shareholders by taking and managing risk in line with strategy and risk appetite.
Risk management is the set of end-to-end activities through which the Bank makes risk-taking decisions and controls and optimises its risk-return profi le. It is a Bank-wide activity and starts right at the front-line.
The management of risk lies at the heart of the Bank’s business, as a central role of the Bank is to “warehouse” risk by extending credit to selected clients and to provide products which enable clients to lay off their price and liquidity risks to the Bank. Effective risk management is a central part of the fi nancial and operational management of the Bank and fundamental to its ability to generate profi ts consistently and maximise the interest of its shareholders and other stakeholders.
Risk review and disclosures under Basel III Framework for the period ended 31 Mar 2020 (Continued)
ECO
NOM
IC &
PO
LITI
CAL
WEE
KLY

Standard CharteredStandard Chartered Bank – India Branches(Incorporated in the United Kingdom with limited liability)
Published on Saturday, june 27, 2020 vol lV nos 26 & 27 EPW Economic & Political Weekly404
The foundation of all risk assessment is aligned to the Group’s Enterprise Risk Management Framework (“ERMF”) and governance structure which has been adopted locally. The Group’s ERMF establishes common principles and standards for the management of and control of all risks, and to inform behaviour across the organisation. The core components of the ERMF include risk culture, principle risk types, source of authorities, enterprise risk identifi cation, assessment, mitigation & monitoring.
Under this framework, there are three lines of defence. ▪ The First Line of Defence is business and functions engaged in or supporting revenue generating activities that own and manage the
risks. ▪ The Second Line of Defence comprises the Risk Framework Owners (“RFOs”) supported by their respective control functions. The
control functions independent of the First Line that provide oversight and challenge of risk management to provide confi dence to the GCRO, the Senior Management and the Board.
▪ The Third Line of Defence is the Internal Audit function that provides independent assurance of the effectiveness of controls that support First Line’s risk management of business activities, and the processes maintained by the Second Line.
5.2. Risk Governance The Group’s committee governance structure ensures that risk-taking authority and risk management policies are cascaded down from the
GALCO and Group Chief Risk Offi cer to the appropriate functional and divisional committees. Information regarding material risk issues and compliance with policies and standards is communicated through the business and functional committees up to the Group-level committees, as appropriate.
The Country Management Team (CMT) drives and executes the business and governance agenda bringing alignment across the business and the functions so as to maximise and protect the value of the Group’s operations in India. It is responsible for the overall strategic direction of the Bank. It is chaired by Country Chief Executive Offi cer (CEO) and comprises senior executive members of the Bank.
The following committees are the primary committees with oversight of risk and capital for the Bank: 1. ALCO – responsible for the management of capital and liquidity and the establishment of and compliance with policies relating to
balance sheet management, including management of the Bank’s liquidity and capital adequacy. It includes the CEO, Chief Financial Offi cer (CFO), Country Chief Risk Offi cer (CCRO) and members from the businesses and economist.
2. Country Risk Committee (CRC) – responsible for the effective management of risks in support of business strategy within the boundaries set by the CMT and business level risk committees. It is responsible for implementing the ERMF, including assignment of the roles and responsibilities of RFOs locally. It is also responsible for ensuring that the risk exposures for all types of risks, including liquidity risk, remain within the overall risk appetite and within any specifi c boundaries advised by CMT and business risk committees. It includes the CEO, CCRO, CFO and members from the businesses and compliance.
Key sub-committees/forums include: A. The Liquidity Management Forum (LMF) is a sub-group of the ALCO which manages liquidity. It includes members from Finance,
Asset Liability Management (ALM) (also referred to as Treasury Markets) and the businesses. B. The CMF is a sub-group of the ALCO which manages capital. It includes members from Finance, Risk and the businesses. C. The Stress Test Forum (STF) is a sub-committee of the CRC which is responsible for reviewing the results of ongoing stress testing
including for ICAAP. It includes members from the Finance and Risk functions and the Country Economist. D. The Country Non-Financial Risk Committee (CNFRC) is a sub-committee of the CRC which exercises oversight of the Bank’s OR
exposures to ensure that it is aligned with the Bank’s ERMF. The CNFRC reviews the Bank’s signifi cant risk exposures and ensures appropriateness and adequacy of mitigating action plans.
E. The Credit Issues Committee (CIC) is a sub-committee of the CRC which is responsible for identifying and monitoring corporate clients which show potential signs of weakness and/or may be exposed to higher risks. The CIC reviews the existing Early Alert, Retail and Group Special Assets Management (GSAM) portfolio and new accounts presented to the committee.
5.3. The Risk function The CCRO manages the Risk function which is independent of the businesses. The role of the Risk function is: ▪ To maintain the ERMF, ensuring it remains appropriate to the Bank’s activities and is effectively communicated and implemented
across the Bank and for administering related governance and reporting processes. ▪ To uphold the integrity of the Bank’s risk/return decisions, and in particular for ensuring that risks are properly assessed, that risk/
return decisions are made transparently on the basis of this proper assessment, and are controlled in accordance with its standards and risk appetite.
▪ To exercise direct risk control ownership for credit, market, country cross-border, liquidity and operational risk types. The Risk function is independent of the origination, trading and sales functions to ensure that the necessary balance in risk/return
decisions is not compromised by short-term pressures to generate revenues. This is particularly important given that most revenues are recognised immediately while losses arising from risk positions only manifest themselves over time.
In addition, the Risk function is a centre of excellence that provides specialist capabilities of relevance to risk management processes in the wider organisation.
5.4. Risk Appetite/Tolerance The Group/Bank manages its risks to build a sustainable franchise in the interests of all stakeholders. The Group Risk Tolerance Statement
is the Standard Chartered PLC’s Board of Directors’ articulation of the amount of risk that the Group is willing to take in the pursuit of its strategic goals. The Risk Tolerance benchmarks provide a lens to identify risks and concentrations that may cause the Group to exceed its risk appetite. Within the Bank, these risks and concentrations are addressed and governed by various policies and frameworks (eg. ERMF, Local Lending Policy, Liquidity Risk Framework, etc) which contain specifi c limits and parameters (i.e., risk thresholds) to manage them. A consolidation of the key thresholds is monitored on an on-going basis through SCB India ERMF.
Risk review and disclosures under Basel III Framework for the period ended 31 Mar 2020 (Continued)
ECO
NOM
IC &
PO
LITI
CAL
WEE
KLY

Standard CharteredStandard Chartered Bank – India Branches(Incorporated in the United Kingdom with limited liability)
Economic & Political Weekly EPW Published on Saturday, june 27, 2020 vol lV nos 26 & 27 405
5.5. Stress Testing Stress testing and scenario analysis are used to assess the Bank’s ability to maintain operations during periods of severe but plausible stress
conditions and to simulate the set of feasible management mitigating actions and their impact on the Bank’s earnings, risk profi le and capital position, should such conditions materialise. These conditions may arise from economic, liquidity, legal, political or physical events, or from materialisation of risks that are unique to the Bank.
The stress testing framework is designed to: ▪ Contribute to the setting and monitoring of the Bank’s ability to take risk; ▪ Identify the key risks to strategy, fi nancial position and reputation; ▪ Support the development of mitigating actions and contingency plans; ▪ Ensure effective governance, processes and systems are in place to co-ordinate and integrate stress testing; ▪ Inform senior management; and ▪ Ensure adherence to regulatory requirements. A Group level equivalent of STF, led by the Risk function with participation from the businesses, Group Finance, Global Research and GT,
aims to ensure that the earnings and capital implications of specifi c stress scenarios are fully understood allowing informed mitigation actions and construction of contingency plans. This group forum generates and considers pertinent and plausible scenarios that have the potential to adversely affect the Group/Bank’s business.
The India STF leverages on work done by Group and, in addition, reviews scenarios specifi c to the local context, including for ICAAP. Stress tests/impact analysis done in India during 2018-19 included impact of trade wars, currency depreciation, oil price surge on the SCB India portfolio as well as RBI mandated bottom-up stress test, derivatives portfolio stress test, liquidity and price risk stress tests, etc.
6. DF 3 - Credit Risk: General disclosures DF 3 - Qualitative Disclosures Credit risk is the potential for loss due to the failure of counterparty to meet its agreed obligations to pay the group. Credit exposures may
arise from both, the banking and trading books. Credit risk is managed through a framework that sets out policies and procedures covering the measurement and management of credit
risk. There is a clear segregation of duties between transaction originators who are in the business units and approvers in the risk function. All credit exposure limits are approved within a defi ned credit approval authority framework.
6.1. Credit Policies Group-wide credit policies and standards are considered and approved by the Group Risk Committee (GRC), which also defi nes the overall
risk management framework. Policies and procedures specifi c to each business are established and provide the outline for how credit risk should be monitored and managed in the Bank. These Group policies/procedures are customised locally to incorporate any local regulatory and governance needs.
6.2. Credit Assessment Process For Commercial, Corporate and Institutional (C&I) Clients A pre-sanction appraisal is carried out by the relationship manager team through a Business Credit Application (BCA). BCAs are reviewed
and duly approved by the credit offi cer based on the authority delegation given to him. Every account is graded using an alphanumeric grading system for quantifying the risks associated with the counterparty. The grading is based on a Probability of Default (PD) measure, with clients analysed against a range of quantitative and qualitative measures. The numeric grades run from 1 to 14 and some of the grades are further sub-classifi ed A, B or C. Lower credit grades are indicative of a lower likelihood of default. Credit grades 1A to 12C are assigned to performing clients or accounts, while credit grades 13 and 14 are assigned to non-performing or defaulted clients. The Bank’s credit grades are not intended to replicate external credit grades, and ratings assigned by external ratings agencies are not used in determining the Bank’s internal credit grades. Nonetheless, as the factors used to grade a borrower may be similar, a borrower’s poor external rating is kept in mind while assessing his internal credit grade.
Nominal Limits, Loss Given Default (LGD), Expected Loss, Exposure At Default (EAD) and RWA (as per AIRB) are used in the assessment of individual exposures and portfolio analysis. LGD is the credit loss incurred if an obligor defaults. Nominal Limits are used in the delegation of credit approval authority and must be calculated for every transaction to determine the appropriate level of approval. In accordance with the credit authority delegation, signifi cant exposures are reviewed and approved centrally under dual approval framework or by Group Chief Risk offi cer or delegate. All the credit facilities are subject to an annual credit review process.
The Bank’s Credit Policy, including local/governance/regulatory needs, requires strict adherence to laid down credit procedures and deviations, if any, are approved and captured through the credit appraisal process. Deviation from pre defi ned policy and procedures/local regulations are fl agged off and approved by the relevant authority, if allowed, to ensure that deviations are justifi ed and appropriately approved to avoid any undue loss/risk to the Bank.
For Retail Clients Standard application forms are used, which are processed in central units using largely automated processes. Where appropriate to the
client, product or market, a manual approval process by SCB offi cers is in place. Origination and approval roles are segregated. Distribution of credit products through the new business channel is governed by the New Business Management and Risk Policy and
Procedures, which among other requirements, lays down policies governing recruitment, verifi cation, training and monitoring of sales staff. Credit decisions are independent of the sales/marketing functions and there are clear and specifi c delegated authorities. Regular assurance reviews through Control Self Testing/Key Control Indicators and audits ensure compliance to policy and delegated authorities.
Credit scores, where used, are based on PD calculated using IRB score models. These models are based on application and behavioural scorecards which make use of external credit bureau information as well as the Bank’s own data. In case of portfolios where such IRB models/credit grades have not yet been developed, the PD is calculated using portfolio delinquency fl ow rates and expert judgment, where applicable. An alphanumeric grading system identical to that for C&I clients is used as an index of portfolio quality.
Risk review and disclosures under Basel III Framework for the period ended 31 Mar 2020 (Continued)
ECO
NOM
IC &
PO
LITI
CAL
WEE
KLY

Standard CharteredStandard Chartered Bank – India Branches(Incorporated in the United Kingdom with limited liability)
Published on Saturday, june 27, 2020 vol lV nos 26 & 27 EPW Economic & Political Weekly406
6.3. Credit Approval All credit approval authorities are delegated to individuals based on their judgment and experience the delegation is guided by the matrix
set out in the Credit Policy for CIB & CB based on a risk-adjusted scale which takes account of the estimated maximum potential loss from a given client or portfolio. Credit origination and approval roles are segregated in all exposures.
6.4. Credit Monitoring The Bank monitors its credit exposures and assesses the impact of trends in the macroeconomic environment which may impact its
portfolio performance. For Commercial and C&I clients, clients or portfolios are placed on ‘Early Alert’ when they display signs of actual or potential weakness.
For example, where there is a decline in the client’s position within the industry, market perception, management, fi nancial leverage or behavioural patterns. Such accounts are subjected to a dedicated process overseen by the CIC. Client account plans, documentation for existing facilities, and credit grades are re-evaluated. In addition, remedial actions are agreed and monitored. Remedial actions include, but are not limited to, exposure reduction, security enhancement, exiting the account or immediate movement of the account into the control of GSAM, the specialist recovery unit, which is independent of the main businesses.
For Retail clients, portfolio delinquency trends are monitored and reviewed at pre determined frequency. Individual client behaviour is also tracked and is considered for lending decisions. Accounts which are past due are subject to a collections process, managed independently within the Risk function. Charged-off accounts are managed by a specialist recovery team. The micro and small-sized enterprise business is managed in small businesses segment. The credit processes are refi ned based on exposure at risk and are managed through Programmed Lending, in line with procedures for Retail clients. For BWC, some of the practices for portfolio monitoring are adapted from the CB segment portfolio management processes including accounts being managed by Relationship Managers and periodic Special Alert Reviews (SAR)
The CRC is responsible for the effective management of credit risk, among other risks. 6.5. Concentration Risk Credit concentration risk is the risk of material losses arising from sub-optimally diversifi ed exposures. This may be due to the portfolio's
sizeable single name exposure or high correlation across geographies and sectors. The risk arises that, due to a change in circumstances, having a concentration may give rise to potential losses.
Credit concentration risk is governed by the risk appetite framework and Local Lending Policy (LLP)/Credit Approval Document (CAD); adherence to these policies is monitored by CMT. Credit concentration risk is managed via Country Risk Appetite Mandates and within concentration caps set for counterparties or groups of connected counterparties, and for industry sectors, credit grade bands, business segments and collateralisation for Commercial and C&I clients and by products for Retail clients.
Credit concentration risk is principally managed based on three components: single-name borrower exposure, industry concentrations and product concentration. For managing single-name concentrations, the Bank monitors compliance to the single and group borrower regulatory guidelines. The LLP
For Retail clients, product concentration risk is managed through portfolio management approach in order to limit concentration, reduce volatility and improve profi tability. As part of this approach, the Bank monitors product concentration on a bi-monthly basis.
6.6. Risk Reporting and Measurement Risk measurement plays a central role, along with judgment and experience, in informing risk-taking and portfolio management decisions.
It is a primary area for sustained investment and senior management attention. Various risk measurement systems are available to risk offi cers to enable them to assess and manage the credit portfolio. As the Group has
adopted IRB for credit risk under Basel III, these include systems to calculate nominal exposure, PD, LGD and EAD on a transaction, counterparty and portfolio basis. The Group has implemented a single risk reporting system to aggregate risk data. This is used to generate management information to assist business and Risk users with risk monitoring and management.
A number of internal risk management reports are produced on a regular basis, providing information on; individual counterparty, counterparty group, portfolio exposure, credit grade migration, the status of accounts or portfolios showing signs of weakness or fi nancial deterioration, models performance and updates on credit markets. IRB portfolio metrics are widely used in these reports. Regular portfolio risk reports are made available at-risk committee meetings.
6.7. Problem Credit Management and Provisioning Credit monitoring is a continuous process. The frequency for each type of monitoring processes is defi ned. For example, excesses and past
dues are reviewed on daily basis by business and credit offi cers. Covenants and risk triggers are normally linked to an event e.g. quarter on quarter drop in sales, exchange rate, crude prices, etc. For corporate accounts identifi ed in risk-based manner, a Quarterly Performance Review (QPR) is also carried out, if necessary. Account conduct is also tracked on a monthly basis in terms of unauthorized excesses, documentation, compliance with covenants and progress on exit accounts through the Account Subject to Additional Review Process (ASTAR) reporting process. Potential problem credits are identifi ed through the credit monitoring process and reported to the CIC for additional review. In addition, portfolio level review for Commercial, C&I and Retail clients is undertaken to track portfolio performance against local underwriting standards/Group policy. Outcomes of such reviews are placed before the CRC/CMT.
Commercial and C&I Exposures Loans are classifi ed as impaired and considered non-performing where analysis and review indicates that full payment of either interest or
principal becomes questionable, or as soon as payment of interest or principal is 90 days or more overdue. Impaired accounts are managed by GSAM.
Specifi c provisions are made in accordance with the Bank’s internal policy, subject to minimum provisions required under the RBI guidelines. When all sources of recovery have been exhausted and no further source of recovery is apparent, then the debt is written off by applying the impairment provision held.
Risk review and disclosures under Basel III Framework for the period ended 31 Mar 2020 (Continued)
ECO
NOM
IC &
PO
LITI
CAL
WEE
KLY

Standard CharteredStandard Chartered Bank – India Branches(Incorporated in the United Kingdom with limited liability)
Economic & Political Weekly EPW Published on Saturday, june 27, 2020 vol lV nos 26 & 27 407
Retail Exposures An account is considered to be delinquent when payment is not received on the due date. For credit cards, an account is required to be
considered delinquent on the payment due date upon non-receipt of payment till the payment due date (for NPA calculation) plus 3 grace days (for bureau reporting). For delinquency reporting purposes, the Bank follows industry standards measuring delinquency as of 1, 30, 60 and 90 days past due. Accounts that are overdue are closely monitored. Loans are classifi ed as impaired and considered non-performing where analysis and review indicates that full payment of either interest or principal becomes questionable, or as soon as payment of interest or principal is 90 days or more overdue.
Process used for raising provisions adheres to minimum provisions required under the RBI guidelines. In case of unsecured products, outstanding balances are written off at 150 days past due. In case of secured products like Mortgages, provision is raised after considering the realisable value of the collateral. Charge off for secured products happens at 720 days past due. For all products there are certain accounts such as cases involving fraud and death, where the loss recognition process is accelerated.
The Bank also maintains general provision as a percentage of performing standard advances and on unhedged foreign currency exposures, as prescribed by the RBI, to cover the inherent risk of losses.
The credit portfolio is monitored and reported to appropriate authorities in accordance with extant Group Policies/Procedures including Credit Policy for CIB & CB and Risk Mitigation Policy, as well as extant local regulations/guidelines prescribed from time to time by RBI.
DF 3 - Quantitative Disclosures a) Analysis of total gross credit risk exposures; fund based and non-fund based separately (` in 000s) Nature & category of exposures Credit risk exposures 31.03.2020 31.03.2019 Inter bank exposures 25,768,972 69,519,571 Investments (HTM) – – Advances 807,560,512 732,690,126 Total gross fund based exposures 833,329,484 802,209,697 Specifi c provisions/Provisions for depreciation in the value of investment1 (45,423,232) (64,309,415) Total net fund based exposures 787,906,252 737,900,282 Fx and derivative contracts 604,043,826 496,845,473 Guarantees, acceptances, endorsements and other obligations 402,414,611 368,099,336 Other commitments and credit lines2 52,378,320 35,829,830 Total gross non-fund based exposures3 1,058,836,757 900,774,639 Specifi c provisions – (2,735,155) Total net non fund based exposures 1,058,836,757 898,039,484 1 Excluding provision on standard assets 2 Excluding credit lines which are unconditionally cancellable at the Bank’s sole discretion or, effectively provide for automatic
cancellation of credit lines due to deterioration of borrower’s creditworthiness. 3 For non-fund-based exposures, credit risk exposures or, equivalents are computed as under: ▪ In case of exposures other than FX and derivative contracts, credit equivalent is arrived at by multiplying the underlying contract
or notional principal amounts with the credit conversion factors prescribed by the RBI under the Basel III capital framework. ▪ In case of FX and derivative contracts, credit equivalents are computed using the current exposure method which includes, two
steps as under: – Computation of current credit exposure, which is sum of the positive Mark to Market (MTM) value of the outstanding contracts. – Potential future credit exposure (PFE), which is determined by multiplying the notional principal amounts by the relevant
‘add-on’ factor based on tenor and type of underlying contracts. b) Analysis of geographic distribution of exposures; fund based and non-fund based separately As all the exposures under Para (a) above are domestic, the analysis of geographic distribution of exposures into fund and non-fund
based has not been disclosed separately. c) Analysis of industry wise distribution of exposures; fund based and non-fund based separately (` in 000s) S No Nature and category of industry 31.03.2020 31.03.2019 Credit Risk Exposures Credit Risk Exposures Fund based Non-fund based Total Fund based Non-fund based Total 1. Mining and Quarrying 900,976 1,092,371 1,993,347 529,368 451,974 981,342 Of which: – Coal 136,994 89,436 226,430 12,945 74,908 87,853 – Others 763,982 1,002,935 1,766,917 516,423 377,066 893,489 2. Food Processing 3,890,393 4,949,301 8,839,694 14,975,032 4,149,689 19,124,721 Of which: – Sugar 25,994 (1) 25,993 367,551 15,186 382,737 – Edible Oils and Vanaspati 1,590,203 4,420,916 6,011,119 4,472,962 3,937,627 8,410,589 – Tea – – – – – – – Coffee – – – – – – Others 2,274,196 528,385 2,802,581 10,134,519 196,876 10,331,395
Risk review and disclosures under Basel III Framework for the period ended 31 Mar 2020 (Continued)
ECO
NOM
IC &
PO
LITI
CAL
WEE
KLY
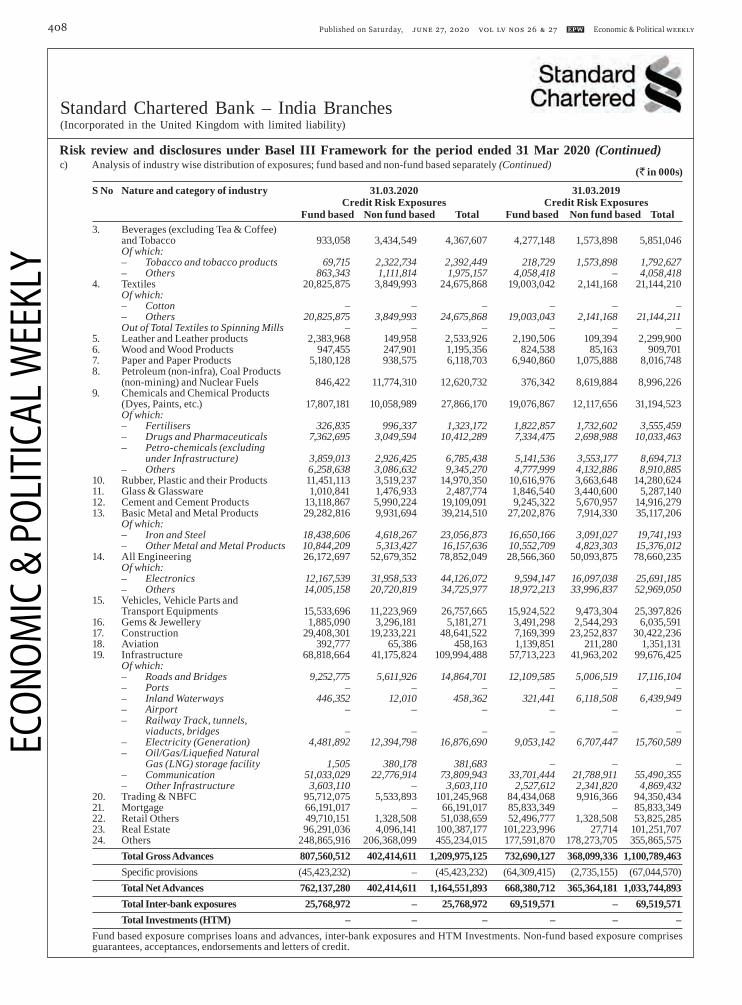
Standard CharteredStandard Chartered Bank – India Branches(Incorporated in the United Kingdom with limited liability)
Published on Saturday, june 27, 2020 vol lV nos 26 & 27 EPW Economic & Political Weekly408
(` in 000s) S No Nature and category of industry 31.03.2020 31.03.2019 Credit Risk Exposures Credit Risk Exposures Fund based Non fund based Total Fund based Non fund based Total 3. Beverages (excluding Tea & Coffee) and Tobacco 933,058 3,434,549 4,367,607 4,277,148 1,573,898 5,851,046 Of which: – Tobacco and tobacco products 69,715 2,322,734 2,392,449 218,729 1,573,898 1,792,627 – Others 863,343 1,111,814 1,975,157 4,058,418 – 4,058,418 4. Textiles 20,825,875 3,849,993 24,675,868 19,003,042 2,141,168 21,144,210 Of which: – Cotton – – – – – – – Others 20,825,875 3,849,993 24,675,868 19,003,043 2,141,168 21,144,211 Out of Total Textiles to Spinning Mills – – – – – – 5. Leather and Leather products 2,383,968 149,958 2,533,926 2,190,506 109,394 2,299,900 6. Wood and Wood Products 947,455 247,901 1,195,356 824,538 85,163 909,701 7. Paper and Paper Products 5,180,128 938,575 6,118,703 6,940,860 1,075,888 8,016,748 8. Petroleum (non-infra), Coal Products (non-mining) and Nuclear Fuels 846,422 11,774,310 12,620,732 376,342 8,619,884 8,996,226 9. Chemicals and Chemical Products (Dyes, Paints, etc.) 17,807,181 10,058,989 27,866,170 19,076,867 12,117,656 31,194,523 Of which: – Fertilisers 326,835 996,337 1,323,172 1,822,857 1,732,602 3,555,459 – Drugs and Pharmaceuticals 7,362,695 3,049,594 10,412,289 7,334,475 2,698,988 10,033,463 – Petro-chemicals (excluding under Infrastructure) 3,859,013 2,926,425 6,785,438 5,141,536 3,553,177 8,694,713 – Others 6,258,638 3,086,632 9,345,270 4,777,999 4,132,886 8,910,885 10. Rubber, Plastic and their Products 11,451,113 3,519,237 14,970,350 10,616,976 3,663,648 14,280,624 11. Glass & Glassware 1,010,841 1,476,933 2,487,774 1,846,540 3,440,600 5,287,140 12. Cement and Cement Products 13,118,867 5,990,224 19,109,091 9,245,322 5,670,957 14,916,279 13. Basic Metal and Metal Products 29,282,816 9,931,694 39,214,510 27,202,876 7,914,330 35,117,206 Of which: – Iron and Steel 18,438,606 4,618,267 23,056,873 16,650,166 3,091,027 19,741,193 – Other Metal and Metal Products 10,844,209 5,313,427 16,157,636 10,552,709 4,823,303 15,376,012 14. All Engineering 26,172,697 52,679,352 78,852,049 28,566,360 50,093,875 78,660,235 Of which: – Electronics 12,167,539 31,958,533 44,126,072 9,594,147 16,097,038 25,691,185 – Others 14,005,158 20,720,819 34,725,977 18,972,213 33,996,837 52,969,050 15. Vehicles, Vehicle Parts and Transport Equipments 15,533,696 11,223,969 26,757,665 15,924,522 9,473,304 25,397,826 16. Gems & Jewellery 1,885,090 3,296,181 5,181,271 3,491,298 2,544,293 6,035,591 17. Construction 29,408,301 19,233,221 48,641,522 7,169,399 23,252,837 30,422,236 18. Aviation 392,777 65,386 458,163 1,139,851 211,280 1,351,131 19. Infrastructure 68,818,664 41,175,824 109,994,488 57,713,223 41,963,202 99,676,425 Of which: – Roads and Bridges 9,252,775 5,611,926 14,864,701 12,109,585 5,006,519 17,116,104 – Ports – – – – – – – Inland Waterways 446,352 12,010 458,362 321,441 6,118,508 6,439,949 – Airport – – – – – – – Railway Track, tunnels, viaducts, bridges – – – – – – – Electricity (Generation) 4,481,892 12,394,798 16,876,690 9,053,142 6,707,447 15,760,589 – Oil/Gas/Liquefi ed Natural Gas (LNG) storage facility 1,505 380,178 381,683 – – – – Communication 51,033,029 22,776,914 73,809,943 33,701,444 21,788,911 55,490,355 – Other Infrastructure 3,603,110 – 3,603,110 2,527,612 2,341,820 4,869,432 20. Trading & NBFC 95,712,075 5,533,893 101,245,968 84,434,068 9,916,366 94,350,434 21. Mortgage 66,191,017 – 66,191,017 85,833,349 – 85,833,349 22. Retail Others 49,710,151 1,328,508 51,038,659 52,496,777 1,328,508 53,825,285 23. Real Estate 96,291,036 4,096,141 100,387,177 101,223,996 27,714 101,251,707 24. Others 248,865,916 206,368,099 455,234,015 177,591,870 178,273,705 355,865,575 Total Gross Advances 807,560,512 402,414,611 1,209,975,125 732,690,127 368,099,336 1,100,789,463 Specifi c provisions (45,423,232) – (45,423,232) (64,309,415) (2,735,155) (67,044,570) Total Net Advances 762,137,280 402,414,611 1,164,551,893 668,380,712 365,364,181 1,033,744,893 Total Inter-bank exposures 25,768,972 – 25,768,972 69,519,571 – 69,519,571 Total Investments (HTM) – – – – – – Fund based exposure comprises loans and advances, inter-bank exposures and HTM Investments. Non-fund based exposure comprises
guarantees, acceptances, endorsements and letters of credit.
Risk review and disclosures under Basel III Framework for the period ended 31 Mar 2020 (Continued)c) Analysis of industry wise distribution of exposures; fund based and non-fund based separately (Continued)
ECO
NOM
IC &
PO
LITI
CAL
WEE
KLY

Standard CharteredStandard Chartered Bank – India Branches(Incorporated in the United Kingdom with limited liability)
Economic & Political Weekly EPW Published on Saturday, june 27, 2020 vol lV nos 26 & 27 409
d) Analysis of residual contractual maturity of assets As at 31 Mar 2020 (` in 000s) Maturity Bucket Cash and Balances Investments Advances Fixed Other Bank with Banks Assets Assets balances and money with RBI at call and short notice 1day (d) 10,956,607 106,891,341 219,066,599 10,218,416 – 59,377,193 2 – 7 days 3,412,393 – 20,796,223 32,453,281 – 10,121,008 8 – 14 days 3,703,899 52,500 22,532,050 54,758,656 – 1,478,519 15 – 30 days 1,497,065 15,633,000 9,107,146 31,268,664 – 36,758,566 31 days – 2 months 2,642,439 – 16,074,840 31,919,263 – 32,428,167 2 months – 3 months 2,387,144 – 21,233,510 68,160,907 – 39,765,284 Over 3 months – 6 months 2,841,738 – 37,449,972 60,831,726 – 28,289,350 Over 6 month – 1 year 1,118,334 – 19,016,400 72,853,431 – 43,028,770 Over 1 year – 3 years 11,572,077 2,487 89,318,651 197,636,962 – 99,565,090 Over 3 year – 5 years 2,608 – 20,207,278 70,369,047 – 57,982,402 Over 5 years 187,528 – 1,213,957 131,666,927 13,796,538 12,332,520 Total 40,321,832 122,579,328 476,016,626 762,137,280 13,796,538 421,126,869
As at 31 Mar 2019 (` in 000s) Maturity Bucket Cash and Balances Investments Advances Fixed Other Bank with Banks Assets Assets balances and money with RBI at call and short notice 1day (d) 2,021,139 74,646,795 189,138,623 11,497,300 – 52,123,993 2 – 7 days 4,483,167 57,994,601 23,158,846 38,936,164 – 6,553,971 8 – 14 days 4,082,361 – 46,845,016 43,626,425 – 4,789,633 15 – 30 days 2,057,539 40,000 10,611,487 28,106,277 – 18,256,443 31 days – 2 months 4,274,499 115,000 34,934,011 28,262,884 – 16,859,092 2 months – 3 months 4,488,738 65,000 43,035,035 30,712,627 – 22,605,629 Over 3 months – 6 months 5,311,472 – 42,496,170 50,562,895 – 43,181,830 Over 6 month – 1 year 3,111,317 – 38,699,111 45,413,549 – 34,636,756 Over 1 year – 3 years 11,297,667 4,700 62,451,929 176,011,800 – 52,169,883 Over 3 year – 5 years 17,577 – 38,823,242 59,573,492 – 35,699,063 Over 5 years 209,727 – 1,206,044 155,677,298 13,074,626 30,758,470 Total 41,355,203 132,866,096 531,399,514 668,380,711 13,074,626 317,634,763 The above has been prepared on similar guidelines as used for the statement of structural liquidity. e) Details of Non-Performing Advances (NPAs) - Gross and Net (` in 000s) Particulars 31.03.2020 31.03.2019 Sub Standard 15,658,826 7,560,207 Doubtful 28,144,723 54,019,695 – Doubtful 1 4,364,468 20,781,549 – Doubtful 2 10,680,711 20,822,899 – Doubtful 3 13,099,544 12,415,247 Loss 7,708,813 5,327,874 Gross NPAs 51,512,362 66,907,776 Provisions (45,423,232) (64,309,415) Net NPAs 6,089,131 2,598,361 Cover ratio 92.73% 96.78% f) NPA Ratios Particulars 31.03.2020 31.03.2019 Gross NPAs to gross advances 6.38% 9.13% Net NPAs to net advances 0.80% 0.39%
Risk review and disclosures under Basel III Framework for the period ended 31 Mar 2020 (Continued)
ECO
NOM
IC &
PO
LITI
CAL
WEE
KLY

Standard CharteredStandard Chartered Bank – India Branches(Incorporated in the United Kingdom with limited liability)
Published on Saturday, june 27, 2020 vol lV nos 26 & 27 EPW Economic & Political Weekly410
g) Movement of NPAs (` in 000s) Particulars 31.03.2020 31.03.2019 Gross Net Gross Net Balance, 1st April 66,907,776 2,598,361 84,411,009 3,738,457 Additions during the period 24,852,072 7,191,260 14,196,060 735,096 Reductions during the period (40,247,486) (3,700,490) (31,699,293) (1,875,192) Balance, end of the period 51,512,362 6,089,131 66,907,776 2,598,361 h) Movement of Provisions for NPAs Specifi c Provisions (` in 000s) Particulars 31.03.2020 31.03.2019 Balance, 1st April 64,309,415 80,672,553 Provisions made during the period 17,660,813 13,460,964 Write-off (30,131,636) (23,086,978) Write-back of excess provisions (6,415,360) (6,737,123) Any other adjustments, including transfer between provisions – – Balance, end of the period 45,423,232 64,309,415 General Provisions (` in 000s) Particulars 31.03.2020 31.03.2019 Balance, 1st April 10,123,710 11,283,108 Provisions made during the period 9,527,341 2,618,716 Write-off (904,967) – Write-back of excess provisions – (3,778,113) Any other adjustments, including transfer between provisions – – Balance, end of the period 18,746,084 10,123,711 (` in 000s) Particulars 31.03.2020 31.03.2019 Write-off that have been booked directly to the income statement 1,376,081 5,173 Recoveries that have been booked directly to the income statement (1,049,781) (665,973) i) Movement of Non-Performing Investments and amount of Provisions held for Non-Performing Investments (` in 000s) Particulars 31.03.2020 31.03.2019 Balance, 1st April 6,909,816 6,990,714 Additions during the period - 772,511 Reductions during the period (1,031,368) (853,409) Balance, end of the period 5,878,448 6,909,816 Total provisions held at the end of the period 5,875,262 6,855,382 j) Movement of Provision for Depreciation on Investments (` in 000s) Particulars 31.03.2020 31.03.2019 Balance, 1st April 11,200,293 9,786,863 Provisions made during the period - 2,243,411 Write-off - (273,005) Write-back of excess provisions (2,790,862) - Any other adjustments, including transfer between provisions (642,747) (556,976) Balance, end of the period 7,766,684 11,200,293 k) NPA by Major Industries (Top 5 Industries) (` in 000s) As on Gross NPA Specifi c General Specifi c provision Write-off during Provisions Provisions during the the current period current period 31-Mar-20 21,695,891 20,722,822 0 (16,240,048) 21,558,352 31-Mar-19 39,628,830 39,353,559 0 (3,505,022) 8,170,781
Risk review and disclosures under Basel III Framework for the period ended 31 Mar 2020 (Continued)
ECO
NOM
IC &
PO
LITI
CAL
WEE
KLY

Standard CharteredStandard Chartered Bank – India Branches(Incorporated in the United Kingdom with limited liability)
Economic & Political Weekly EPW Published on Saturday, june 27, 2020 vol lV nos 26 & 27 411
7. DF 4 - Credit Risk: Disclosures for portfolios subject to the standardised approach DF 4 - Qualitative Disclosures As per the provisions of the Basel framework in India, SCBI has adopted the SA for measurement of credit risk. The risk weights applied
under the SA are prescribed by the RBI and are based on the asset class to which the exposure is assigned. This approach permits use of external ratings for credit exposures to counterparties in the category of sovereigns, international banks, corporate and securitisation exposures. The specifi ed credit rating agencies used for these types of exposures are as under:
Domestic Credit Rating Agencies International Credit Rating Agencies Credit Rating Information Services of India Limited Standard and Poor’s ICRA Limited Moody’s India Ratings and Research Private Limited (India Ratings) Credit Analysis and Research Limited Acuite Ratings and Research Limited Brickworks Ratings India Pvt. Limited Infomerics Valuation and Rating Pvt. Limited Rated facilities have generally been considered as those facilities where the Bank’s exposure has been explicitly considered; else, the
exposure has been treated by the Bank as unrated. The process used to transfer public issue ratings onto comparable assets in the banking book is in accordance with the requirements laid down by RBI.
DF 4 - Quantitative Disclosures Analysis of outstanding credit exposures (after considering credit risk mitigation) and credit risk by regulatory risk weight As at 31 Mar 2020
(` in 000s) Nature & category Total gross Credit risk Net Credit risk weight buckets summary of exposures credit mitigation exposure < 100% 100% >100% Deduction exposure (before from provision) capital Inter bank exposures 25,768,972 – 25,768,972 25,725,841 25,751 17,380 – Investments (HTM) – – – – – – – Advances 807,560,512 (12,509,179) 795,051,333 227,722,932 420,382,361 146,946,040 – Total fund based exposures 833,329,484 (12,509,179) 820,820,305 253,448,773 420,408,112 146,963,420 – Fx and derivative contracts 604,043,826 – 604,043,826 561,780,976 27,964,312 14,298,538 – Guarantees, Acceptances, endorsements and other obligations 402,414,611 (104,993) 402,309,618 205,343,351 44,647,455 152,318,812 – Undrawn Commitments and others 52,378,320 – 52,378,320 – 45,829,588 6,548,732 – Total non fund based exposures 1,058,836,757 (104,993) 1,058,731,764 767,124,327 118,441,355 173,166,082 – As at 31 Mar 2019
(` in 000s) Nature & category Total gross Credit risk Net Credit risk weight buckets summary of exposures credit mitigation exposure < 100% 100% >100% Deduction exposure (before from provision) capital Inter bank exposures 69,519,571 – 69,519,571 69,483,122 8,170 28,279 – Investments (HTM) – – – – – – – Advances 732,690,125 (14,332,296) 718,357,830 192,186,899 358,584,929 167,540,058 – Total fund based exposures 802,209,697 (14,332,296) 787,877,401 261,670,021 358,593,099 167,568,337 – Fx and derivative contracts 496,845,473 – 496,845,473 454,433,278 42,061,256 350,939 – Guarantees, Acceptances, endorsements and other obligations 368,099,336 (39,695) 368,059,641 129,034,370 154,334,758 84,690,510 – Undrawn Commitments and others 35,829,830 – 35,829,830 – 32,454,055 3,375,775 – Total non fund based exposures 900,774,639 (39,695) 900,734,944 583,467,648 228,850,069 88,417,224 –
Risk review and disclosures under Basel III Framework for the period ended 31 Mar 2020 (Continued)
ECO
NOM
IC &
PO
LITI
CAL
WEE
KLY

Standard CharteredStandard Chartered Bank – India Branches(Incorporated in the United Kingdom with limited liability)
Published on Saturday, june 27, 2020 vol lV nos 26 & 27 EPW Economic & Political Weekly412
8. DF 5 - Credit risk mitigation: Disclosures for standardised approaches DF 5 - Qualitative Disclosures Potential credit losses from any given account, client or portfolio are mitigated using a range of tools such as collateral, netting agreements,
guarantees and restructuring. The reliance that can be placed on these mitigants is carefully assessed in light of issues such as legal certainty and enforceability, market valuation correlation and counterparty risk of the guarantor.
Risk mitigation policies determine the eligibility of collateral types. Collateral types for credit risk mitigation include cash; residential, commercial and industrial property; fi xed assets such as motor vehicles, aircraft, plant and machinery; marketable securities; commodities; bank guarantees and letters of credit.
The above collateral types are applicable to all client segments, including, corporates and fi nancial institutions, though exposures to banks are generally non-collateralised. There are well laid down policies and processes for valuation/revaluation of collaterals, covering source of valuation, independent professional valuations, hair-cuts/margins on collateral market values, re-margining requirements and re-assessment of credit limits. However, from a local regulatory perspective, the main “eligible” collaterals under the SA are restricted to cash (including fi xed deposits) and units of mutual funds.
Collateral is valued in accordance with the Bank’s lending policies, which prescribe the frequency of valuation for different collateral types. The valuation frequency is driven by the level of price volatility of each type of collateral and the nature of the underlying product or risk exposure. Collateral held against impaired loans is recorded at fair value, which is revalued at least annually as prescribed in risk mitigation policy and procedures. In case of stock and book debts, monthly statements are obtained from the clients. In case of marketable securities listed on recognised exchanges, the valuation frequency is daily.
Guarantees taken can be categorised as follows: ▪ Guarantee from a bank (including central banks), or surety bond which is repayable on demand. ▪ Guarantee from a related corporate (including government owned commercial enterprises). ▪ Guarantee from an unconnected corporate. ▪ Guarantee from a government department, or an entity classifi ed as government risk (excluding those classifi ed as banks or
commercial enterprises). ▪ Guarantee or indemnity from a SCB Group entity (subsidiary/associate or branch). ▪ Guarantee from one or more individuals. DF 5 - Quantitative Disclosures (` in 000s) Nature and category of exposures 31.03.2020 31.03.2019 Exposure covered by eligible fi nancial collateral after application of haircuts 848,846 2,095,996 Exposure covered by guarantees 117,338 444,706 9. DF 6 – Securitisation exposures: Disclosure for standardised approach DF 6 - Qualitative Disclosures Securitisation transactions are generally undertaken with the objective of credit risk transfer, liquidity management, meeting regulatory
requirements such as priority sector lending and asset portfolio management. The Bank participates in securitisations in the role of originator, as well as, investor. In general, it provides credit enhancement services (as originator or as a third party), liquidity facilities, interest rate derivative products and acts as a collection and service agent.
The key risks inherent in securitisation transactions include: ▪ Credit risk: risk arising on account of payment delinquencies from underlying obligors/borrowers in the assigned pool. ▪ Liquidity risk: risk arising on account of lack of secondary market to provide ready exit options to the investors/participants. ▪ Interest rate/currency risk: mark to market risks arising on account of interest rate/currency fl uctuations. ▪ Prepayment risk: prepayments in the securitised pool results in early amortisation and loss of future interest to the investor on the
prepaid amount. ▪ Co-mingling risk: risk arising on account of co-mingling of funds belonging to investor(s) with that of the originator and/or
collection and service agent, when there exists a time lag between collecting amounts due from the obligors and payment made to the investors.
Monitoring credit risk The risk assessment of the pools is done continuously by the rating agencies based on amortisation level, collection effi ciency, credit
enhancement utilisation levels and credit cover available for balance deal tenor. If bank is acting as an investor, appropriate risk triggers are agreed at the time of investment and the same is monitored at regular intervals.
Where the bank is acting as an originator and is required to have retained risks as per RBI guidelines, the Bank has not used any credit risk mitigants to mitigate such retained risks.
The Bank may provide credit enhancement in the form of cash deposits or guarantees in its securitisation transactions and also provides credit enhancement as a third party on behalf of our clients. The Bank makes appropriate provisions for any delinquency losses assessed at the time of sale as well as over the life of the securitisation transactions in accordance with the RBI guidelines.
Regulatory capital approach As per the provisions of the Basel III framework, all banks have to mandatorily adopt SA for capital treatment of securitisation transactions.
This approach requires use of external rating agencies for risk weighting securitisation exposures. The credit rating agencies used by the Bank for these types of exposures are those recognised by the RBI (refer section 7 – DF- 4 above).
Risk review and disclosures under Basel III Framework for the period ended 31 Mar 2020 (Continued)
ECO
NOM
IC &
PO
LITI
CAL
WEE
KLY

Standard CharteredStandard Chartered Bank – India Branches(Incorporated in the United Kingdom with limited liability)
Economic & Political Weekly EPW Published on Saturday, june 27, 2020 vol lV nos 26 & 27 413
DF 6 - Quantitative Disclosures 1. Banking Book a) The outstanding exposures securitised by the Bank (in 000’s) as on 31 Mar 2020: 706,268 (Previous Year: 1,602,027). b) Securitisation losses recognised by the Bank during period ending 31 Mar 2020: NIL (Previous Year: NIL) c) Assets intended to be securitised within a year – NIL (Previous Year: NIL). The securitisation transactions are undertaken on a need basis to meet the objectives as disclosed above. d) The total amount of exposures securitised with unrecognised gain/(loss)
(` in 000s) 31-Mar-20 31-Mar-19 Exposure Type Outstanding Unrecognised Outstanding Unrecognised
gain /(loss) gain /(loss) Housing Loans 706,268 – 803,195 – Corporate Loans – – 798,832 – e) Securitisation exposures retained or purchased (` in 000s) 31-Mar-20 31-Mar-19 Exposure Type On Balance Sheet Off Balance Sheet On Balance Sheet Off Balance Sheet) Housing Loans 328,434 1,328,508 328,434 1,328,508 f) Aggregate amount of securitisation exposures retained or purchased and the associated capital charge As at 31 Mar 2020 (` in 000s) Exposure Type <100% risk weight 100% risk weight >100% risk weight Total Housing Loans – – 1,624,536 1,624,536 Capital Charge – – 1,827,604 1,827,604 As at 31 Mar 2019 (` in 000s) Exposure Type <100% risk weight 100% risk weight >100% risk weight Total Housing Loans – – 1,656,942 1,656,942 Capital Charge – – 1,864,060 1,864,060 g) Securitisation exposures deducted from capital : NIL (Previous Year: NIL)2. Trading Book a) There are no outstanding exposures securitised for which the Bank has retained any exposure which is subject to Market Risk. b) Securitisation exposures retained or purchased – On Balance Sheet and Off Balance Sheet. As at 31 Mar 2020 (` in 000s) Exposure Type On Balance Sheet Off Balance Sheet Vehicle Loans – – SME Loans 25,294,865 – Direct & Indirect Agriculture Lending 3,451,527 – Total 28,746,392 – As at 31 Mar 2019 (` in 000s) Exposure Type On Balance Sheet Off Balance Sheet Vehicle Loans – – SME Loans 32,630,396 Direct & Indirect Agriculture Lending 4,957,529 – Total 37,587,925 – c) Securitisation exposures retained or purchased (` in 000s) Risk Weight Bands 31-Mar-20 31-Mar-19 Exposures subject to Comprehensive Risk Measure for specifi c risk 28,746,392 37,587,925 Exposures subject to the securitisation framework for specifi c risk <100% risk weight 28,746,392 37,587,925 100% risk weight – – >100% risk weight – – Total 28,746,392 37,587,925
Risk review and disclosures under Basel III Framework for the period ended 31 Mar 2020 (Continued)
ECO
NOM
IC &
PO
LITI
CAL
WEE
KLY

Standard CharteredStandard Chartered Bank – India Branches(Incorporated in the United Kingdom with limited liability)
Published on Saturday, june 27, 2020 vol lV nos 26 & 27 EPW Economic & Political Weekly414
d) Aggregate amount of the capital requirements for the securitisation exposures (` in 000s) Risk Weight Bands 31-Mar-20 31-Mar-19 <100% risk weight 517,435 676,583 100% risk weight – – >100% risk weight – – Total 517,435 676,583 e) Securitisation exposures deducted from capital: NIL (Previous Year: NIL)10. DF 7 - Market Risk in Trading Book DF 7 - Qualitative Disclosures The Bank recognises market risk as the potential for loss of earnings or economic value due to adverse changes in fi nancial market rates or
prices. The Bank is exposed to market risk arising principally from client-driven transactions. The objective of the Bank’s market risk policies and processes is to obtain a balance of risk and return while meeting clients’ requirements.
The primary categories of market risk for the Bank are interest rate risk and currency exchange rate risk.10.1. Market Risk Governance The Board Risk Committee (BRC) approves the Group’s market risk appetite taking account of market volatility, the range of products and
asset classes, business volumes and transaction sizes. The Traded Risk Management (TRM) operating under the current approved Traded Risk Framework in force, is responsible for setting the Value at Risk (VaR) and Stress Loss Trigger as the primary market risk measure within the Group’s risk appetite.
The TRM is also responsible for policies and other standards for the control of market risk and overseeing their effective implementation. These policies cover both trading and non-trading books. At a country level, there is an independent market risk function to implement Group market risk policies/limits and to monitor the market risk exposures in accordance with Group and local governance/regulatory norms.
Traded Risk Management approves the limits within delegated authorities and monitors exposures against these limits. Additional limits are placed on specifi c instruments and position concentrations, where appropriate. Sensitivity measures are used in addition to VaR as risk management tools. For example, interest rate sensitivity is measured in terms of exposure to a one basis point increase in yields, whereas, foreign exchange, commodity and equity sensitivities are measured in terms of the underlying values or amounts involved. Option risks are controlled through revaluation limits on underlying price and volatility shifts and limits on volatility risk and other variables that determine the options’ value.
The CRC, in conjunction with TRM, provides market risk oversight, reporting and management of the market risk profi le. Value at Risk The Bank measures the risk of losses arising from future potential adverse movements in market rates, prices and volatilities using a VaR
methodology. VaR, in general, is a quantitative measure of market risk that applies recent historical market conditions to estimate the potential future loss in market value that will not be exceeded in a set time period at a set statistical confi dence level. VaR provides a consistent measure that can be applied across trading businesses and products over time and can be set against actual daily trading profi t and loss outcome. VaR is calculated for expected movements over a minimum of one business day and to a confi dence level of 97.5 per cent. This confi dence level suggests that potential daily losses, in excess of the VaR measure, are likely to be experienced six times per year.
Back Testing To assess their predictive power, Trading VaR models are back tested against actual results and presented to the local risk committee. Stress Testing Losses beyond the confi dence interval are not captured by a VaR calculation, which therefore gives no indication of the size of unexpected
losses in these situations. TRM complements the VaR measurement by regularly stress testing market risk exposures to highlight potential risk that may arise from extreme market events that are rare but plausible.
Stress testing is an integral part of the market risk management framework and considers both, historical market events and forward looking scenarios. A consistent stress testing methodology is applied to trading and non-trading books. The stress testing methodology assumes that scope for management action would be limited during a stress event, refl ecting the decrease in market liquidity that often occurs. Stress scenarios are regularly updated to refl ect changes in risk profi le and economic events.
Regular stress test scenarios are applied to interest rates, credit spreads, exchange rates and equity prices thereby covering asset classes in the Financial Markets (FM) non-trading and trading books. Ad hoc scenarios are also prepared, refl ecting specifi c market conditions and for particular concentrations of risk that arise within the businesses.
10.2. Foreign Exchange Exposure The foreign exchange exposures comprise trading and non-trading foreign currency translation exposures. Foreign exchange trading
exposures are principally derived from client driven transactions. 10.3. Interest Rate Exposure The interest rate exposures arise from trading and non-trading activities. Structural interest rate risk arises from the differing re-pricing
characteristics of commercial banking assets and liabilities. 10.4. Derivatives Structure and organisation of management of risk in derivatives trading The derivatives business is managed by the front offi ce with independent back offi ce for confi rmation and settlement of trades. A separate
middle offi ce team validates all the derivative transactions and the processing and settlement is done by the back offi ce team. The TRM team is responsible for monitoring market risk limits for derivative instruments. VaR is the primary risk measure and supplemented by other limits like PV01 as required and appropriate. There is clear segregation of duties and different reporting lines to ensure independent monitoring and reporting.
Risk review and disclosures under Basel III Framework for the period ended 31 Mar 2020 (Continued)
ECO
NOM
IC &
PO
LITI
CAL
WEE
KLY
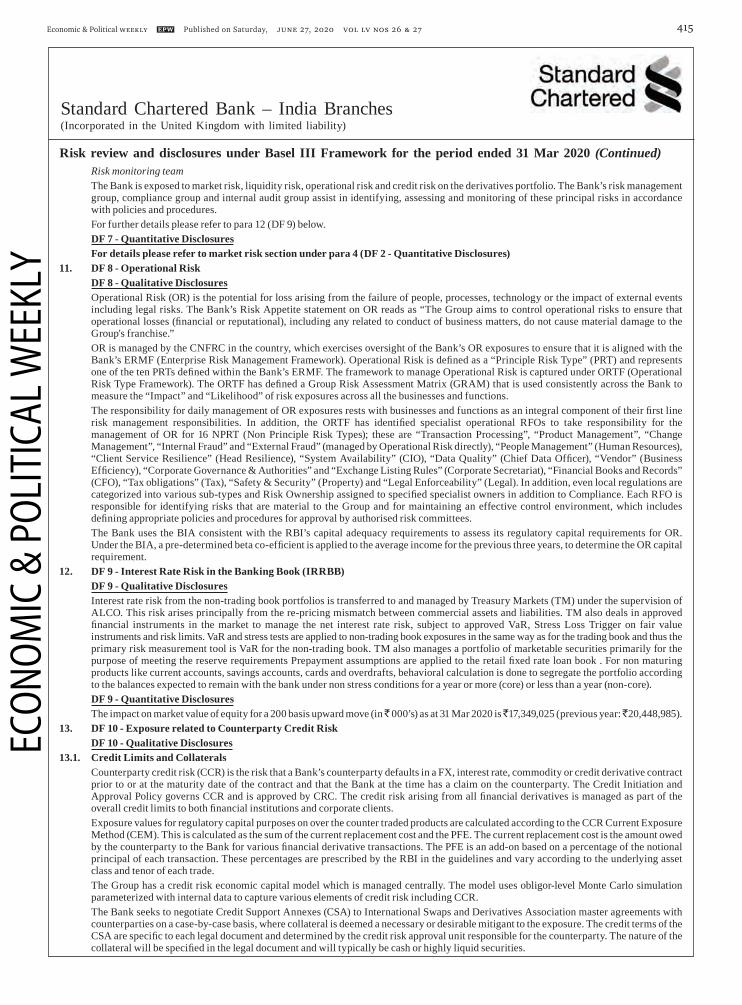
Standard CharteredStandard Chartered Bank – India Branches(Incorporated in the United Kingdom with limited liability)
Economic & Political Weekly EPW Published on Saturday, june 27, 2020 vol lV nos 26 & 27 415
Risk monitoring team The Bank is exposed to market risk, liquidity risk, operational risk and credit risk on the derivatives portfolio. The Bank’s risk management
group, compliance group and internal audit group assist in identifying, assessing and monitoring of these principal risks in accordance with policies and procedures.
For further details please refer to para 12 (DF 9) below. DF 7 - Quantitative Disclosures For details please refer to market risk section under para 4 (DF 2 - Quantitative Disclosures)11. DF 8 - Operational Risk DF 8 - Qualitative Disclosures Operational Risk (OR) is the potential for loss arising from the failure of people, processes, technology or the impact of external events
including legal risks. The Bank’s Risk Appetite statement on OR reads as “The Group aims to control operational risks to ensure that operational losses (fi nancial or reputational), including any related to conduct of business matters, do not cause material damage to the Group's franchise.”
OR is managed by the CNFRC in the country, which exercises oversight of the Bank’s OR exposures to ensure that it is aligned with the Bank’s ERMF (Enterprise Risk Management Framework). Operational Risk is defi ned as a “Principle Risk Type” (PRT) and represents one of the ten PRTs defi ned within the Bank’s ERMF. The framework to manage Operational Risk is captured under ORTF (Operational Risk Type Framework). The ORTF has defi ned a Group Risk Assessment Matrix (GRAM) that is used consistently across the Bank to measure the “Impact” and “Likelihood” of risk exposures across all the businesses and functions.
The responsibility for daily management of OR exposures rests with businesses and functions as an integral component of their fi rst line risk management responsibilities. In addition, the ORTF has identifi ed specialist operational RFOs to take responsibility for the management of OR for 16 NPRT (Non Principle Risk Types); these are “Transaction Processing”, “Product Management”, “Change Management”, “Internal Fraud” and “External Fraud” (managed by Operational Risk directly), “People Management” (Human Resources), “Client Service Resilience” (Head Resilience), “System Availability” (CIO), “Data Quality” (Chief Data Offi cer), “Vendor” (Business Effi ciency), “Corporate Governance & Authorities” and “Exchange Listing Rules” (Corporate Secretariat), “Financial Books and Records” (CFO), “Tax obligations” (Tax), “Safety & Security” (Property) and “Legal Enforceability” (Legal). In addition, even local regulations are categorized into various sub-types and Risk Ownership assigned to specifi ed specialist owners in addition to Compliance. Each RFO is responsible for identifying risks that are material to the Group and for maintaining an effective control environment, which includes defi ning appropriate policies and procedures for approval by authorised risk committees.
The Bank uses the BIA consistent with the RBI’s capital adequacy requirements to assess its regulatory capital requirements for OR. Under the BIA, a pre-determined beta co-effi cient is applied to the average income for the previous three years, to determine the OR capital requirement.
12. DF 9 - Interest Rate Risk in the Banking Book (IRRBB) DF 9 - Qualitative Disclosures Interest rate risk from the non-trading book portfolios is transferred to and managed by Treasury Markets (TM) under the supervision of
ALCO. This risk arises principally from the re-pricing mismatch between commercial assets and liabilities. TM also deals in approved fi nancial instruments in the market to manage the net interest rate risk, subject to approved VaR, Stress Loss Trigger on fair value instruments and risk limits. VaR and stress tests are applied to non-trading book exposures in the same way as for the trading book and thus the primary risk measurement tool is VaR for the non-trading book. TM also manages a portfolio of marketable securities primarily for the purpose of meeting the reserve requirements Prepayment assumptions are applied to the retail fi xed rate loan book . For non maturing products like current accounts, savings accounts, cards and overdrafts, behavioral calculation is done to segregate the portfolio according to the balances expected to remain with the bank under non stress conditions for a year or more (core) or less than a year (non-core).
DF 9 - Quantitative Disclosures The impact on market value of equity for a 200 basis upward move (in 000’s) as at 31 Mar 2020 is 17,349,025 (previous year: 20,448,985).13. DF 10 - Exposure related to Counterparty Credit Risk DF 10 - Qualitative Disclosures13.1. Credit Limits and Collaterals Counterparty credit risk (CCR) is the risk that a Bank’s counterparty defaults in a FX, interest rate, commodity or credit derivative contract
prior to or at the maturity date of the contract and that the Bank at the time has a claim on the counterparty. The Credit Initiation and Approval Policy governs CCR and is approved by CRC. The credit risk arising from all fi nancial derivatives is managed as part of the overall credit limits to both fi nancial institutions and corporate clients.
Exposure values for regulatory capital purposes on over the counter traded products are calculated according to the CCR Current Exposure Method (CEM). This is calculated as the sum of the current replacement cost and the PFE. The current replacement cost is the amount owed by the counterparty to the Bank for various fi nancial derivative transactions. The PFE is an add-on based on a percentage of the notional principal of each transaction. These percentages are prescribed by the RBI in the guidelines and vary according to the underlying asset class and tenor of each trade.
The Group has a credit risk economic capital model which is managed centrally. The model uses obligor-level Monte Carlo simulation parameterized with internal data to capture various elements of credit risk including CCR.
The Bank seeks to negotiate Credit Support Annexes (CSA) to International Swaps and Derivatives Association master agreements with counterparties on a case-by-case basis, where collateral is deemed a necessary or desirable mitigant to the exposure. The credit terms of the CSA are specifi c to each legal document and determined by the credit risk approval unit responsible for the counterparty. The nature of the collateral will be specifi ed in the legal document and will typically be cash or highly liquid securities.
Risk review and disclosures under Basel III Framework for the period ended 31 Mar 2020 (Continued)
ECO
NOM
IC &
PO
LITI
CAL
WEE
KLY

Standard CharteredStandard Chartered Bank – India Branches(Incorporated in the United Kingdom with limited liability)
Published on Saturday, june 27, 2020 vol lV nos 26 & 27 EPW Economic & Political Weekly416
A daily operational process takes place to calculate the MTM on all trades captured under the CSA. Additional collateral will be called from the counterparty at agreed frequency if total uncollateralised MTM exposure exceeds the threshold and minimum transfer amount specifi ed in the CSA. Additional collateral may be required from the counterparty to provide an extra buffer to the daily variation margin process.
The Bank further reduces its credit exposures to counterparties by entering into contractual netting agreements which result in a single amount owed by or to the counterparty through netting the sum of the positive (amounts owed by the counterparty) and negative (amounts owed by the Bank) MTM values of these transactions.
In India, the Bank follows SA for credit risk and hence no credit reserve is set aside. However, provisioning for the exposures on derivative contracts is made as prescribed by RBI Circular No.DBR.No.BP.BC.2/21.04.048/2015-16 dated 01 July 2015.
13.2. Wrong Way Risk Wrong-way risk (“WWR”) occurs when exposure to counterparty is positively correlated to deterioration in its creditworthiness. WWR
falls into two categories: Specifi c Wrong Way Risk, which occurs when future exposure to a specifi c counterparty is adversely correlated with the counterparty's probability of default due to the nature of the transactions with the counterparty. General Wrong Way Risk, which occurs when the likelihood of default of counterparty is adversely correlated with general market risk factors. The Counterparty Credit Risk (CCR) Standards manages WWR through ‘CCR Guidance-Stress Testing and WWR Management’.
13.3. Impact of Credit Rating Downgrade In line with market convention, the Bank negotiates CSA terms for certain counterparties where the thresholds related to each party are
dependent on their External Credit Assessment Institution (ECAI) long term rating. Such clauses are typically mutual in nature. In the event of downgrade of counterparty’s credit rating, margin call may be initiated to ask for additional collateral to cover negative MTM portfolios where thresholds are lowered. It is recognised that a downgrade in the Group’s rating could result in counterparties seeking additional collateral calls to cover negative MTM portfolios where thresholds are lowered.
DF 10 - Quantitative Disclosures (` in 000s) Particulars 31.03.2020 31.03.2019 Gross positive fair value of contracts 280,347,261 190,165,114 Less: Netting benefi ts – – Netted current credit exposure 280,347,261 190,165,114 Less: Collateral held (including type, e.g. cash, government securities, etc.) – – Net derivatives credit exposure 280,347,261 190,165,114 Potential future exposure 323,696,565 306,680,359 Measures for exposure at default or exposure amount under CEM 604,043,826 496,845,473 Notional value of credit derivative hedges – – Distribution of current credit exposure by types of credit exposure – Interest Rates 195,296,490 174,523,561 – Fx 408,747,336 322,321,912 Credit Derivative Transactions that create exposures to CCR (Notional Value) NIL NIL For capital requirement details, refer “Minimum Regulatory Capital Requirements” under para 4 (DF 2 – quantitative disclosure) of this
disclosure.14. Other Key Risks14.1. Liquidity Risk Liquidity risk is the potential that the Bank either does not have suffi cient stable or diverse sources of funding or fi nancial resources to
meet our obligations as they fall due. The Liquidity Risk Framework governs liquidity risk and is managed by ALCO. In accordance with that framework, the Bank maintains a
liquid portfolio of marketable securities as reserve assets. The level of the Bank’s aggregate liquid reserves is in accordance with local regulatory minimum liquidity requirements, including the Liquidity Coverage Ratio norms.
14.2. Reputational Risk Reputational risk is the potential for damage to the Group’s franchise, resulting in loss of earnings or adverse impact on market
capitalisation as a result of stakeholders taking a negative view of the organisation or its actions. Reputational risk is managed by the CMT/CRC, which is responsible for protecting the Group’s reputation locally and has the responsibility
to ensure that the Bank does not undertake any activities that may cause material damage to the Group’s franchise. Reputational risk is registered, recorded and reviewed by the CEO through the CRC. Whilst the CRC covers all forms of reputational risk in
country, any signifi cant business-related reputational risks identifi ed is escalated to Business Responsibility and Reputational Risk Committee. 15. Monitoring Monitoring of risk management is achieved through independent reviews by RFOs, GIA, Compliance, concurrent audits and spot checks
by external specialists as required under regulations. To ensure the effectiveness of risk management processes in maintaining the risk profi le of the Bank within risk appetite, the Bank
maintains a three ‘lines of defence’ framework - refer para 5.1 above for further details.
Risk review and disclosures under Basel III Framework for the period ended 31 Mar 2020 (Continued)
ECO
NOM
IC &
PO
LITI
CAL
WEE
KLY

Standard CharteredStandard Chartered Bank – India Branches(Incorporated in the United Kingdom with limited liability)
Economic & Political Weekly EPW Published on Saturday, june 27, 2020 vol lV nos 26 & 27 417
16. DF 11 – Composition of Capital as at 31 Mar 2020 Basel III common disclosure template Solo Consolidated Common Equity Tier 1 capital: instruments Basel III Amounts Basel III Amounts Ref No. and reserves Amounts Subject to Amounts Subject to (Section 17/
Pre-Basel III Pre-Basel III DF 12) Treatment Treatment 1 Directly issued qualifying common share capital plus related stock surplus (share premium) 74,401 – 74,401 – A1 2 Retained earnings 80,377 – 80,377 – B6 3 Accumulated other comprehensive income B1+B3+B4+ (and other reserves) 103,145 – 107,713 – B5+B7+B8+ C1+C3 4 Directly issued capital subject to phase out from CET1 (only applicable to non-joint stock companies) – – – – 5 Common share capital (plus share premium) issued by other regulated entities and held by third parties (amount allowed in group CET1) – – 4,544 – A2 6 Common Equity Tier 1 capital before regulatory adjustments 257,922 – 267,035 – Common Equity Tier 1 capital: regulatory adjustments 7 Prudential valuation adjustments – – – – 8 Goodwill (net of related tax liability) (0) – (0) – E1 9 Intangibles other than mortgage-servicing rights (net of related tax liability) 53 – 128 – E2 10 Deferred tax assets – – 84 – 11 Cash-fl ow hedge reserve – – – – 12 Shortfall of provisions to expected losses – – – – 13 Securitisation gain on sale – – – – 14 Gains and losses due to changes in own credit risk on fair valued liabilities – – – – 15 Defi ned-benefi t pension fund net assets – – – – 16 Investments in own shares (if not already netted off paid-in capital on reported balance sheet) – – – – 17 Reciprocal cross-holdings in common equity – – – – 18 Investments in the capital of banking, fi nancial and insurance entities that are outside the scope of regulatory consolidation, net of eligible short positions, where the bank does not own more than 10% of the issued share capital (amount above 10% threshold) – – – – 19 Signifi cant investments in the common stock of banking, fi nancial and insurance entities that are outside the scope of regulatory consolidation, net of eligible short positions (amount above 10% threshold) – – – – 20 Mortgage servicing rights (amount above 10% threshold) – – – – 21 Deferred tax assets arising from temporary differences (amount above 10% threshold, net of related tax liability) – – – – 22 Amount exceeding the 15% threshold – – – – 23 of which: signifi cant investments in the common stock of fi nancial entities – – – – 24 of which: mortgage servicing rights – – – – 25 of which: deferred tax assets arising from temporary differences – – – – 26 National specifi c regulatory adjustments (26a+26b+26c+26d) – – – – 26a of which: Investments in the equity capital of the unconsolidated insurance subsidiaries – – – – 26b of which: Investments in the equity capital of unconsolidated non-fi nancial subsidiaries – – – – 26c of which: Shortfall in the equity capital of majority owned fi nancial entities which have not been consolidated with the bank – – – –
Risk review and disclosures under Basel III Framework for the period ended 31 Mar 2020 (Continued)
ECO
NOM
IC &
PO
LITI
CAL
WEE
KLY

Standard CharteredStandard Chartered Bank – India Branches(Incorporated in the United Kingdom with limited liability)
Published on Saturday, june 27, 2020 vol lV nos 26 & 27 EPW Economic & Political Weekly418
26d of which: Unamortised pension funds expenditures – – – – Regulatory Adjustments Applied to Common Equity Tier 1 in respect of Amounts Subject to Pre-Basel III Treatment 1,586 – 1,586 – of which: HO Debit Balance (20%) 726 – 726 – F of which: Valuation adjustments 860 – 860 – 27 Regulatory adjustments applied to Common Equity Tier 1 due to insuffi cient Additional Tier 1 and Tier 2 to cover deductions – – – – 28 Total regulatory adjustments to Common equity Tier 1 1,639 – 1,798 – 29 Common Equity Tier 1 capital (CET1) 256,283 – 265,237 – Additional Tier 1 capital: instruments 30 Directly issued qualifying Additional Tier 1 instruments plus related stock surplus (31+32) – – – – 31 of which: classifi ed as equity under applicable accounting standards (Perpetual Non-Cumulative Preference Shares) – – – – 32 of which: classifi ed as liabilities under applicable accounting standards (Perpetual debt Instruments) – – – – 33 Directly issued capital instruments subject to phase out from Additional Tier 1 – – – – 34 Additional Tier 1 instruments (and CET1 instruments not included in row 5) issued by subsidiaries and held by third parties (amount allowed in group AT1) – – – – 35 of which: instruments issued by subsidiaries subject to phase out – – – – 36 Additional Tier 1 capital before regulatory adjustments – – – – Additional Tier 1 capital: regulatory adjustments 37 Investments in own Additional Tier 1 instruments – – – – 38 Reciprocal cross-holdings in Additional Tier 1 instruments – – – – 39 Investments in the capital of banking, fi nancial and insurance entities that are outside the scope of regulatory consolidation, net of eligible short positions, where the bank does not own more than 10% of the issued common share capital of the entity (amount above 10% threshold) – – – – 40 Signifi cant investments in the capital of banking, fi nancial and insurance entities that are outside the scope of regulatory consolidation (net of eligible short positions)10 – – – – 41 National specifi c regulatory adjustments (41a+41b) – – – – 41a Investments in the Additional Tier 1 capital of unconsolidated insurance subsidiaries – – – – 41b Shortfall in the Additional Tier 1 capital of majority owned fi nancial entities which have not been consolidated with the bank – – – – 42 Regulatory adjustments applied to Additional Tier 1 due to insuffi cient Tier 2 to cover deductions – – – – 43 Total regulatory adjustments to Additional Tier 1 capital – – – – 44 Additional Tier 1 capital (AT1) – – – –
Risk review and disclosures under Basel III Framework for the period ended 31 Mar 2020 (Continued) Basel III common disclosure template Solo Consolidated Common Equity Tier 1 capital: instruments Basel III Amounts Basel III Amounts Ref No. and reserves Amounts Subject to Amounts Subject to (Section 17/
Pre-Basel III Pre-Basel III DF 12) Treatment Treatment
ECO
NOM
IC &
PO
LITI
CAL
WEE
KLY

Standard CharteredStandard Chartered Bank – India Branches(Incorporated in the United Kingdom with limited liability)
Economic & Political Weekly EPW Published on Saturday, june 27, 2020 vol lV nos 26 & 27 419
44a Additional Tier 1 capital reckoned for capital adequacy – – – – 45 Tier 1 capital (T1 = CET1 + AT1) (29 + 44a) 256,283 – 265,237 – Tier 2 capital: instruments and provisions 46 Directly issued qualifying Tier 2 instruments plus related stock surplus – – – – 47 Directly issued capital instruments subject to phase D out from Tier 2 – – – – (Discounted Value) 48 Tier 2 instruments (and CET1 and AT1 instruments not included in rows 5 or 34) issued by subsidiaries and held by third parties (amount allowed in group Tier 2) – – – – 49 of which: instruments issued by subsidiaries subject to phase out – – – – 50 Provisions 17,975 – 18,063 – B2*45%+ C2+D1+D2+ D3+D4 51 Tier 2 capital before regulatory adjustments 17,975 – 18,063 – Tier 2 capital: regulatory adjustments 52 Investments in own Tier 2 instruments – – – – 53 Reciprocal cross-holdings in Tier 2 instruments – – – – 54 Investments in the capital of banking, fi nancial and insurance entities that are outside the scope of regulatory consolidation, net of eligible short positions, where the bank does not own more than 10% of the issued common share capital of the entity (amount above the 10% threshold) – – – – 55 Signifi cant investments in the capital banking, fi nancial and insurance entities that are outside the scope of regulatory consolidation (net of eligible short positions) – – – – 56 National specifi c regulatory adjustments (56a+56b) – – – – 56a of which: Investments in the Tier 2 capital of unconsolidated subsidiaries – – – – 56b of which: Shortfall in the Tier 2 capital of majority owned fi nancial entities which have not been consolidated with the bank – – – – 57 Total regulatory adjustments to Tier 2 capital – – – – 58 Tier 2 capital (T2) 17,975 – 18,063 – 58a Tier 2 capital reckoned for capital adequacy 17,975 – 18,063 – 58b Excess Additional Tier 1 capital reckoned as Tier 2 capital – – – – 58c Total Tier 2 capital admissible for capital adequacy (58a + 58b) 17,975 – 18,063 – 59 Total capital (TC = T1 + T2) (45 + 58c) 274,259 – 283,300 – Risk Weighted Assets in respect of Amounts Subject to Pre-Basel III Treatment of which: 60 Total risk weighted assets (60a + 60b + 60c) 1,842,283 – 1,870,086 – 60a of which: total credit risk weighted assets 1,493,571 – 1,519,096 – 60b of which: total market risk weighted assets 205,484 – 205,484 – 60c of which: total operational risk weighted assets 143,228 – 145,506 –
Risk review and disclosures under Basel III Framework for the period ended 31 Mar 2020 (Continued) Basel III common disclosure template Solo Consolidated Common Equity Tier 1 capital: instruments Basel III Amounts Basel III Amounts Ref No. and reserves Amounts Subject to Amounts Subject to (Section 17/
Pre-Basel III Pre-Basel III DF 12) Treatment Treatment
ECO
NOM
IC &
PO
LITI
CAL
WEE
KLY

Standard CharteredStandard Chartered Bank – India Branches(Incorporated in the United Kingdom with limited liability)
Published on Saturday, june 27, 2020 vol lV nos 26 & 27 EPW Economic & Political Weekly420
Capital Ratios 61 Common Equity Tier 1 (as a percentage of risk weighted assets) 13.91% 14.18% 62 Tier 1 (as a percentage of risk weighted assets) 13.01% 14.18% 63 Total capital (as a percentage of risk weighted assets) 14.89% 15.15% 64 Institution specifi c buffer requirement (minimum CET1 requirement plus capital conservation and countercyclical buffer requirements, expressed as a percentage of risk weighted assets) 8.13% – 8.13% – 65 of which: capital conservation buffer requirement 1.88% – 1.88% – 66 of which: bank specifi c countercyclical buffer requirement – – – – 67 of which: G-SIB buffer requirement 0.75% – 0.75% – 68 Common Equity Tier 1 available to meet buffers (as a percentage of risk weighted assets) 13.91% – 14.18% – National minima (if different from Basel III) 69 National Common Equity Tier 1 minimum ratio (if different from Basel III minimum) – – – – 70 National Tier 1 minimum ratio (if different from Basel III minimum) – – – – 71 National total capital minimum ratio (if different from Basel III minimum) – – – – Amounts below the thresholds for deduction (before risk weighting) 72 Non-signifi cant investments in the capital of other fi nancial entities – – – – 73 Signifi cant investments in the common stock of fi nancial entities – – – – 74 Mortgage servicing rights (net of related tax liability) – – – – 75 Deferred tax assets arising from temporary differences (net of related tax liability) – – – – Applicable caps on the inclusion of provisions in Tier 2 76 Provisions eligible for inclusion in Tier 2 in respect of exposures subject to standardised approach (prior to application of cap) – – – – 77 Cap on inclusion of provisions in Tier 2 under standardised approach – – – – 78 Provisions eligible for inclusion in Tier 2 in respect of exposures subject to internal ratings-based approach (prior to application of cap) – – – – 79 Cap for inclusion of provisions in Tier 2 under internal ratings-based approach – – – – Capital instruments subject to phase-out arrangements 80 Current cap on CET1 instruments subject to phase out arrangements – – – – 81 Amount excluded from CET1 due to cap (excess over cap after redemptions and maturities) – – – – 82 Current cap on AT1 instruments subject to phase out arrangements – – – – 83 Amount excluded from AT1 due to cap (excess over cap after redemptions and maturities) – – – – 84 Current cap on T2 instruments subject to phase out arrangements – – – – 85 Amount excluded from T2 due to cap (excess over cap after redemptions and maturities) – – – –
Risk review and disclosures under Basel III Framework for the period ended 31 Mar 2020 (Continued) Basel III common disclosure template Solo Consolidated Common Equity Tier 1 capital: instruments Basel III Amounts Basel III Amounts Ref No. and reserves Amounts Subject to Amounts Subject to (Section 17/
Pre-Basel III Pre-Basel III DF 12) Treatment Treatment
ECO
NOM
IC &
PO
LITI
CAL
WEE
KLY

Standard CharteredStandard Chartered Bank – India Branches(Incorporated in the United Kingdom with limited liability)
Economic & Political Weekly EPW Published on Saturday, june 27, 2020 vol lV nos 26 & 27 421
Notes to the Template (` in M) Row Particular Solo Consolidate 10 Deferred tax assets associated with accumulated losses – – Deferred tax assets (excluding those associated with accumulated losses) net of Deferred tax liability – 84 Total as indicated in row 10 – 84 19 If investments in insurance subsidiaries are not deducted fully from capital and instead considered under 10% threshold for deduction, the resultant increase in the capital of bank – – of which: Increase in Common Equity Tier 1 capital – – of which: Increase in Additional Tier 1 capital – – of which: Increase in Tier 2 capital – – 26b If investments in the equity capital of unconsolidated non- fi nancial subsidiaries are not deducted and hence, risk weighted then: (i) Increase in Common Equity Tier 1 capital – – (ii) Increase in risk weighted assets – – 44a Excess Additional Tier 1 capital not reckoned for capital adequacy (difference between Additional Tier 1 capital as reported in row 44 and admissible Additional Tier 1 capital as reported in 44a) – – of which: Excess Additional Tier 1 capital which is considered as Tier 2 capital under row 58b – – 50 Eligible Provisions included in Tier 2 capital 15,385 15,473 Eligible Revaluation Reserves included in Tier 2 capital 2,591 2,591 Total of row 50 17,975 18,063 17. DF 12 - Composition of Capital Reconciliation
(` in M) Balance sheet as in Balance sheet under Ref. No. fi nancial statements regulatory scope of (Section 16/ consolidation DF 11) As on 31 Mar 20 As on 31 Mar 20 Capital & Liabilities i Paid-up Capital 74,401 78,945 H.O. assigned Capital 74,401 74,401 A1 Common share capital (plus share premium) issued by other regulated entities and held by third parties (amount allowed in group CET1) – 4,544 A2 of which: Amount eligible for CET1 74,401 78,945 of which: Amount eligible for AT1 – – ii Reserves & Surplus 214,125 218,694 a Statutory Reserves 91,190 92,409 B1 b Property Revaluation Reserve 5,758 5,758 B2 c Capital Reserves-Surplus on sale of immovable properties 10,460 10,460 B3 d Capital Reserves-Surplus on sale of Held To Maturity investments 985 985 B4 e Capital Reserve 302 302 B5 f Remittable Surplus retained in India for CRAR 80,377 80,377 B6 g Profi t and Loss Account 17,200 20,549 a) Considered for Regulatory Consolidation – – B7 b) Not Considered for Regulatory Consolidation 17,200 20,549 h Exchange Reserve 1 1 B8 i Property Investment Reserve 207 207 C1 j Investment Reserve 7,646 7,646 C2 k General Reserve – – C3 Total Capital 288,526 297,638
Risk review and disclosures under Basel III Framework for the period ended 31 Mar 2020 (Continued)
ECO
NOM
IC &
PO
LITI
CAL
WEE
KLY

Standard CharteredStandard Chartered Bank – India Branches(Incorporated in the United Kingdom with limited liability)
Published on Saturday, june 27, 2020 vol lV nos 26 & 27 EPW Economic & Political Weekly422
iii Deposits 1,003,946 1,004,436 of which: Deposits from banks 27,250 27,250 of which: Customer deposits 976,696 976,696 of which: Other deposits (pl.specify) – 490 iv Borrowings 167,256 170,350 of which: From RBI – – of which: From banks – 3,076 of which: From other institutions 94,897 94,897 of which: subordinated debt – D of which: outside India 72,359 72,377 v Other liabilities & provisions 385,267 397,628 of which: Provision for Countercyclical Buffer 2 2 D1 of which: Provision Held for Sold NPA's 733 733 D2 of which: Provision for Country Risk 64 64 D3 of which: Provision for Standard assets 18,746 18,747 D4 Total Capital & Liabilities 1,844,995 1,870,052 Assets vi Cash and balances with Reserve Bank of India 40,322 40,322 vii Balance with banks and money at call and short notice 122,579 124,445 viii Investments 485,033 486,180 of which: Government securities 406,684 406,684 of which: Other approved securities – – of which: Shares 148 148 of which: Debentures & Bonds 46,953 48,099 of which: Subsidiaries/Joint Ventures/Associates – – of which: Others (Pass-through certifi cates, Commercial Paper & Certifi cate of Deposits etc.) 31,249 31,249 ix Loans and advances 762,137 782,713 of which: Loans and advances to banks – – of which: Loans and advances to customers 762,137 782,713 x Fixed assets 13,797 13,877 of which: Goodwill (0) (0) E1 of which: Intangible 53 53 E2 xi Other assets 421,127 422,515 of which: Deferred tax assets – 84 of which: Ho Debit Balance 726 726 F Total Assets 1,844,995 1,870,052 18. DF 13 - Main Features of Regulatory Capital Instruments
There were no regulatory capital instruments issued by SCBI as of 31 Mar 2020.
19. DF 14 - Full Terms and Conditions of Regulatory Capital Instruments
There were no regulatory capital instruments issued by SCBI as of 31 Mar 2020.
20. DF 15 - Disclosure Requirements for Remuneration
The Bank’s compensation policies including that of CEO’s, is in conformity with the Financial Stability Board principles and standards. In accordance with the requirements of the RBI Circular No. DBOD No.BC.72/29.67/001/2011-12 dated 13 January 2012, the Regional Offi ce of the Bank has submitted a declaration to RBI confi rming the aforesaid matter. Accordingly no disclosure is required to be made in this regard.
Risk review and disclosures under Basel III Framework for the period ended 31 Mar 2020 (Continued)(` in M)
Balance sheet as in Balance sheet under Ref. No. fi nancial statements regulatory scope of (Section 16/ consolidation DF 11) As on 31 Mar 20 As on 31 Mar 20
ECO
NOM
IC &
PO
LITI
CAL
WEE
KLY

Standard CharteredStandard Chartered Bank – India Branches(Incorporated in the United Kingdom with limited liability)
Economic & Political Weekly EPW Published on Saturday, june 27, 2020 vol lV nos 26 & 27 423
21. DF 16 - Equities – Disclosure for Banking Book Positions Gross value of Investments in equities (in ` 000’s) as at 31 Mar 2020 amounts to ` 4,212,814 and mainly include shares obtained from
restructuring of debt in case of certain clients. As per the banks accounting policy they are classifi ed as ‘Available for Sale’ (AFS). Unquoted equity shares are valued at the break-up value, if the latest balance sheet is available, or at Re. 1, as per RBI guidelines. The break-up of equities into quoted and unquoted is as under:
(` in 000s) Particulars 31.03.2020 31.03.2019 Quoted 3,087,618 3,758,260 Unquoted 1,125,196 1,125,196 Total 4,212,814 4,883,456 22. Leverage Ratio The bank is required to maintain a minimum leverage ratio of 4%. The bank’s leverage ratio, calculated in accordance with the RBI
guidelines under consolidated framework is 8.49% as of 31 Mar 2020 (Previous Year: 8.83%). DF 17 - Quantitative disclosures Summary comparison of accounting assets vs. leverage ratio exposure measure
(` in M) 31 Mar 2020 31 Mar 2019 Sr. No. Item Solo Consol Solo Consol 1 Total consolidated assets as per published fi nancial statements 1,844,995 1,865,798 1,712,493 1,738,150 2 Adjustment for investments in banking, fi nancial, insurance or commercial entities that are consolidated for accounting purposes but outside the scope of regulatory consolidation – – – – 3 Adjustment for fi duciary assets recognised on the balance sheet pursuant to the operative accounting framework but excluded from the leverage ratio exposure measure – – – – 4 Adjustments for derivative fi nancial instruments 140,568 140,568 169,979 169,979 5 Adjustment for securities fi nancing transactions (i.e. repos and similar secured lending) 96,810 96,810 37,403 (25,943) 6 Adjustment for off-balance sheet items (i.e. conversion to credit equivalent amounts of off-balance sheet exposures) 540,279 540,667 468,165 468,190 7 Other adjustments (98,450) (98,524) (67,957) (67,994) 8 Leverage ratio exposure 2,524,204 2,545,319 2,320,084 2,345,728 DF 18 Quantitative disclosures Leverage ratio common disclosure (` in M) Sr. 31 Mar 2020 31 Mar 2019 No. Item Solo Consol Solo Consol On-balance sheet exposures 1 On-balance sheet items (excluding derivatives and SFTs, but including collateral) 1,467,123 1,487,925 1,458,451 1,484,108 2 (Asset amounts deducted in determining Basel III Tier 1 capital) (1,639) (1,714) (4,611) (4,648) 3 Total on-balance sheet exposures (excluding derivatives and SFTs) (sum of lines 1 and 2) 1,465,484 1,486,211 1,453,841 1,479,460 On-balance sheet exposures 4 Replacement cost associated with all derivatives transactions (i.e. net of eligible cash variation margin) 281,062 281,062 190,695 190,695 5 Add-on amounts for PFE associated with all derivatives transactions 323,697 323,697 306,680 306,680 6 Gross-up for derivatives collateral provided where deducted from the balance sheet assets pursuant to the operative accounting framework – – – – 7 (Deductions of receivables assets for cash variation margin provided in derivatives transactions) – – – – 8 (Exempted CCP leg of client-cleared trade exposures) (183,128) (183,128) (136,702) (136,702) 9 Adjusted effective notional amount of written credit derivatives – – – – 10 (Adjusted effective notional offsets and add-on deductions for written credit derivatives) – – – – 11 Total derivative exposures (sum of lines 4 to 10) 421,630 421,630 360,674 360,674
Risk review and disclosures under Basel III Framework for the period ended 31 Mar 2020 (Continued)
ECO
NOM
IC &
PO
LITI
CAL
WEE
KLY

Standard CharteredStandard Chartered Bank – India Branches(Incorporated in the United Kingdom with limited liability)
Published on Saturday, june 27, 2020 vol lV nos 26 & 27 EPW Economic & Political Weekly424
Securities fi nancing transaction exposures 12 Gross SFT assets (with no recognition of netting), after adjusting for sale accounting transactions 96,810 96,810 63,347 63,347 13 (Netted amounts of cash payables and cash receivables of gross SFT assets) – – (26,310) (26,310) 14 CCR exposure for SFT assets – – 367 367 15 Agent transaction exposures – – – – 16 Total securities fi nancing transaction exposures (sum of lines 12 to 15) 96,810 96,810 37,403 37,403 Other off-balance sheet exposures 17 Off-balance sheet exposure at gross notional amount 1,677,471 1,677,858 1,408,893 1,408,918 18 (Adjustments for conversion to credit equivalent amounts) (1,137,191) (1,137,191) (940,727) (940,727) 19 Off-balance sheet items (sum of lines 17 and 18) 540,279 540,667 468,165 468,190 Capital and total exposures 20 Tier 1 capital 207,854 216,191 200,149 207,074 21 Total exposures (sum of lines 3, 11, 16 and 19) 2,524,204 2,545,319 2,320,084 2,345,728 Leverage ratio 22 Basel III leverage ratio 8.23% 8.49% 8.63% 8.83%
Reconciliation of total published balance sheet size and on balance sheet exposure (` in M)
31 Mar 2020 31 Mar 2019 Sr. No. Item Solo Consol Solo Consol 1 Total consolidated assets as per published fi nancial statements 1,844,995 1,865,798 1,712,493 1,738,150 2 Replacement cost associated with all derivatives transactions i.e. net of eligible cash variation margin (281,062) (281,062) (190,695) (190,695) 3 Adjustment for securities fi nancing transactions (i.e. repos and similar secured lending) (96,810) (96,810) (63,347) (63,347) 4 Adjustments for entities outside the scope of regulatory consolidation – – – – On-balance sheet exposures under leverage ratio (excluding derivatives and SFTs) 1,467,123 1,487,925 1,458,451 1,484,108
Risk review and disclosures under Basel III Framework for the period ended 31 Mar 2020 (Continued)(` in M)
Sr. 31 Mar 2020 31 Mar 2019 No. Item Solo Consol Solo Consol
ECO
NOM
IC &
PO
LITI
CAL
WEE
KLY

Economic & Political Weekly EPW Published on Saturday, june 27, 2020 vol lV nos 26 & 27 425
An online database on Indian economy structured in 20 different modules
ECO
NOM
IC &
PO
LITI
CAL
WEE
KLY

june 29, 2013 vol xlvIII Nos 26 & 27 EPW Economic & Political Weekly426
Published on Saturday, june 27, 2022 vol lV nos 26 & 27 EPW Economic & Political Weekly426
Axis Bank Limited page 44
Credit Agricole Corporate & Investment Bank page 116
Paytm Payments Bank Limited page 164
Kookmin Bank page 184
Index of Banks(EPW, June 27, 2020, Supplement)
Societe Generale page 214
Deutsche Bank AG page 258
American Express Banking Corp. page 312
Standard Chartered Bank page 360
PREPARING FOR THE CIVIL SERVICES EXAMINATION THIS YEAR?
Economic and Political Weekly (EPW) is a must-read for those who aspire to join the civil services. Every week EPW provides informed commentaries on the current affairs not covered by the mainstream media. In addition, it gives detailed analysis of contemporary trends in India and the world. Reading EPW will give you that edge in all stages of your preparation. As part of the EPW Translation Project, EPW editorials are translated into seven regional languages and these translated editorials are available on the EPW website.
SUBSCRIBE NOW to avail special concessionfor aspirants
₹1,800for 1 Year
₹3,068for 1 Year
Print Edition Print + Digital Archives
Along with the payment send in a photocopy/scan of your ICard, complete postal address and email address.
Pay by either sending a demand draft/cheque in favour of Economic and Political Weekly or by making online payment with a credit card/net banking on our secure site at www.epw.in.
How to Subscribe ₹
320–322, A to Z Industrial Estate, Ganpatrao Kadam Marg, Lower Parel, Mumbai, India 400 013Phone: +91-22-40638282 | www.epw.in | [email protected] EPW’s Digital Initiative
eEPW
engag
ECO
NOM
IC &
PO
LITI
CAL
WEE
KLY

Economic & Political Weekly EPW Published on Saturday, JUNE 27, 2020 vol lIV nos 26 & 27 427
ECO
NOM
IC &
PO
LITI
CAL
WEE
KLY

428 Published on Saturday, JUNE 27, 2020 vol lV nos 26 & 27 EPW Economic & Political Weekly
Regd No MCW-238/2018-20 WPP Licence No MR/Tech/WPP-197/West/2018-20. Licensed to post without prepayment. Posted at Patrika Channel
Sorting Offi ce, Mumbai-1 on every Tuesday-Wednesday. Regd. with the RNI – No 14089/66
ECO
NOM
IC &
PO
LITI
CAL
WEE
KLY
Related Documents


