STARTER Review homework on Research, draw and annotate your choice of data and complete two of today’s techniques on the same data. In pairs can you think of 3 of the more sophisticated graphing techniques?

Review homework on Research, draw and annotate your choice of data and complete two of today’s techniques on the same data. In pairs can you think of 3.
Dec 13, 2015
Welcome message from author
This document is posted to help you gain knowledge. Please leave a comment to let me know what you think about it! Share it to your friends and learn new things together.
Transcript

STARTER
Review homework on Research, draw and annotate your
choice of data and complete two of today’s techniques on the same data.
In pairs can you think of 3 of the more sophisticated graphing techniques?

Sophisticated Graph Presentation techniques
To be able to understand data shown on sophisticated graphs.
LEARNING OBJECTIVE

1) To know how to read data from sophisticated graphs including compound bar / line graphs, scatter graphs and flow lines.
2) To be able to describe data from these sophisticated graphs. (with annotation)
3) To apply data in order to complete/construct these sophisticated graphs.
LEARNING OUTCOMES
To know how to read data from sophisticated graphs including compound bar / line graphs, scatter graphs and flow line graphs.
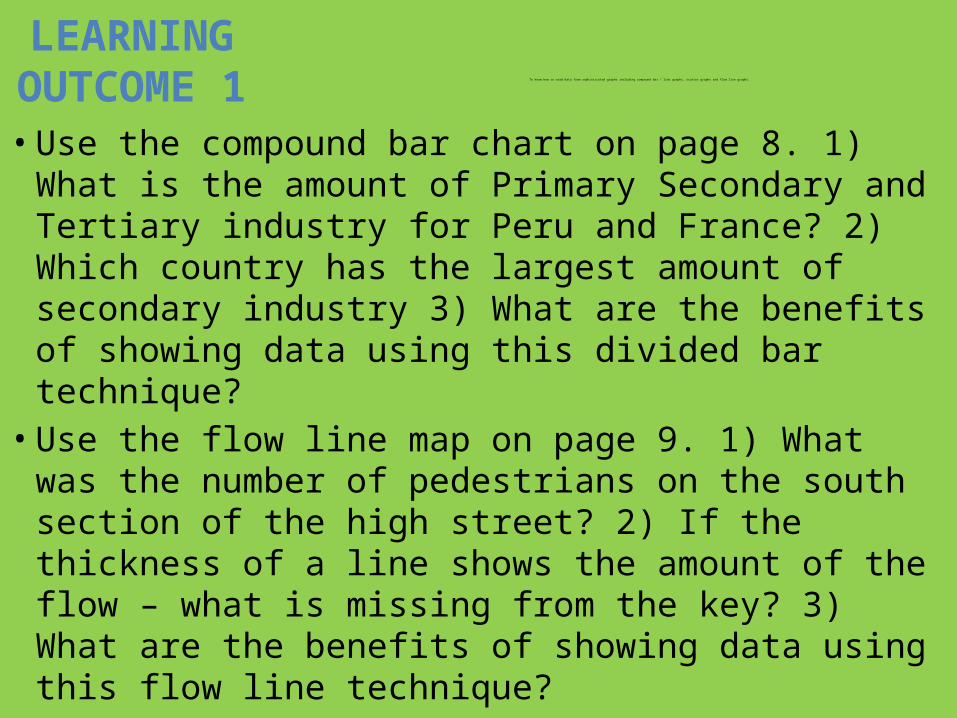
• Use the compound bar chart on page 8. 1) What is the amount of Primary Secondary and Tertiary industry for Peru and France? 2) Which country has the largest amount of secondary industry 3) What are the benefits of showing data using this divided bar technique?
• Use the flow line map on page 9. 1) What was the number of pedestrians on the south section of the high street? 2) If the thickness of a line shows the amount of the flow – what is missing from the key? 3) What are the benefits of showing data using this flow line technique?
LEARNINGOUTCOME 1

To be able to describe data from these basic graphs. (with annotation)
• Task: using your HOLT technique and making sure you refer to data (and complex data like doing a bit of maths to show change, please annotate the following graphs.
• There are four graphs.• You have one minute to annotate one thing
then pass it on.• The next person annotates one thing.• Make sure it is easily identifiable what it is that
you are annotating.
LEARNING
OUTCOME 2

LEARNING
OUTCOME 3 To apply data in order to complete/construct these sophisticated graphs.
Complete the following exam questions….

Complete the graph for 2015 – Latin America =2Asia Pacific = 11Europe = 7Africa = 5North America = 34 marks

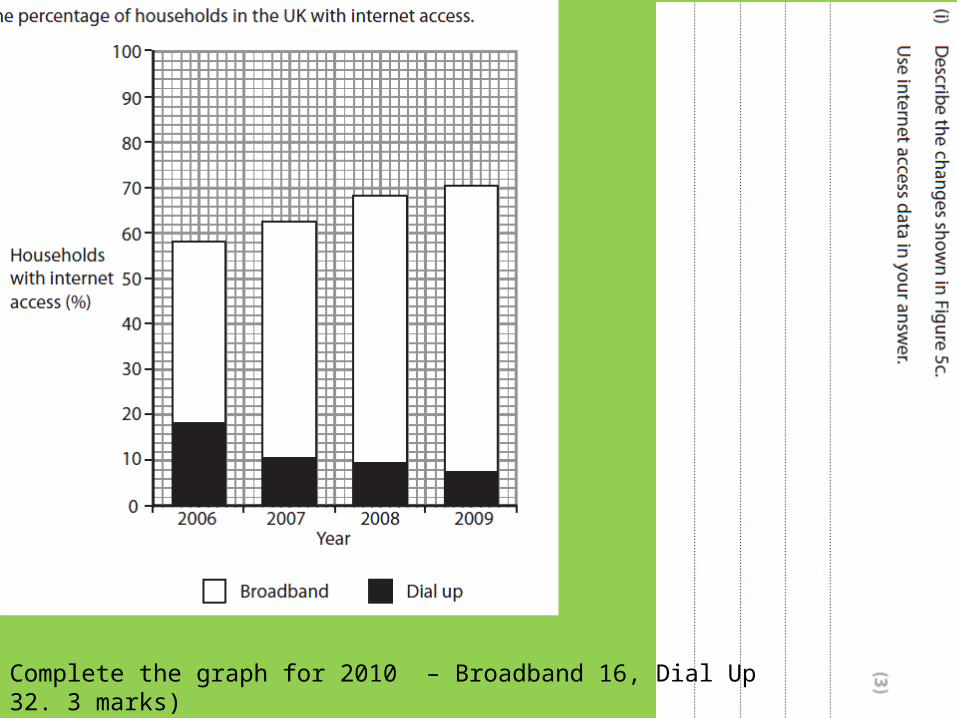
Complete the graph for 2010 – Broadband 16, Dial Up 32. 3 marks)

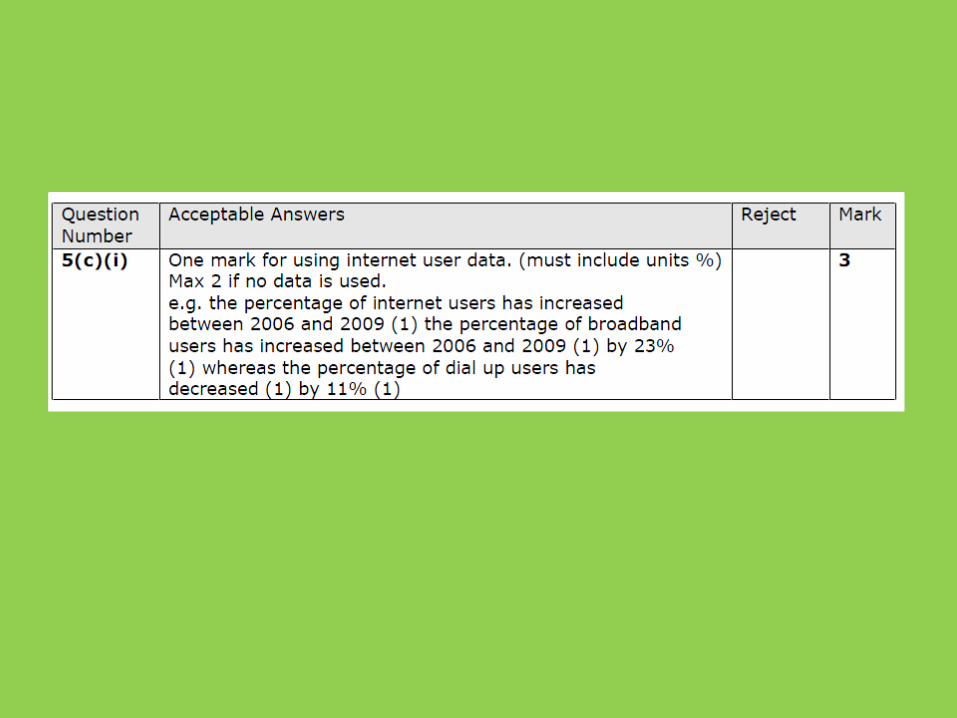
PLENARY Use the following mark schemes to peer assess the progression you have made today.


HOME
WORK
• Research, draw and annotate a flow line map. It is the only one yet to appear on
an exam.
Related Documents