Hindawi Publishing Corporation Advances in Condensed Matter Physics Volume 2012, Article ID 323165, 12 pages doi:10.1155/2012/323165 Review Article Broadband/Wideband Magnetoelectric Response Chee-Sung Park and Shashank Priya Center for Energy Harvesting Materials and Systems (CEHMS), Department of Materials Science and Engineering, Virginia Polytechnic Institute and State University, Blacksburg, VA 24061, USA Correspondence should be addressed to Shashank Priya, [email protected] Received 19 September 2011; Accepted 26 December 2011 Academic Editor: Amar Bhalla Copyright © 2012 C.-S. Park and S. Priya. This is an open access article distributed under the Creative Commons Attribution License, which permits unrestricted use, distribution, and reproduction in any medium, provided the original work is properly cited. A broadband/wideband magnetoelectric (ME) composite offers new opportunities for sensing wide ranges of both DC and AC magnetic fields. The broadband/wideband behavior is characterized by flat ME response over a given AC frequency range and DC magnetic bias. The structure proposed in this study operates in the longitudinal-transversal (L-T) mode. In this paper, we provide information on (i) how to design broadband/wideband ME sensors and (ii) how to control the magnitude of ME response over a desired frequency and DC bias regime. A systematic study was conducted to identify the factors affecting the broadband/wideband behavior by developing experimental models and validating them against the predictions made through finite element modeling. A working prototype of the sensor with flat bands for both DC and AC magnetic field conditions was successfully obtained. These results are quite promising for practical applications such as current probe, low-frequency magnetic field sensing, and ME energy harvester. 1. Introduction Magnetoelectric (ME) materials have been investigated to find applications in sensors, transducers, actuators, energy harvesters, and servomechanism. Direct ME effect implies induction of electric polarization by applying an external magnetic field. It has been widely investigated in composite structures consisting of magnetostrictive and piezoelectric materials. In these composites, ME coefficient is dependent upon the elastic coupling occurring at the interface between piezoelectric and magnetostrictive phases [1–4]. Functional composites are defined by connectivity of materials such as 2-2 composite which is 2 dimensionally laminated, 3-0 com- posite which has dispersed particles in 3-dimensional matrix, and 3-1 composite which has 1-dmensional rods embed- ded in 3-dimensional matrix structures. Magnetostrictive- piezoelectric laminate composites with 2-2 connectivity have shown much higher ME coefficients than that of single-phase materials or particulate composites [4–8]. Experimental and analytical results on ME laminates have shown relatively large ME output voltage, but the peak in ME coefficient occurring at the optimum DC bias is generally sharp. This limits their ability to be utilized for AC magnetic field sensing when the optimized DC condition becomes slightly moved off by external noises. Moreover, high ME coefficient generally occurs near the electromechan- ical resonance (EMR) frequency. This narrow bandwidth also poses problem for stable sensing in a limited frequency range. The common modes utilized for ME laminates are longitudinal transversal (LT) and longitudinal longitudinal (LL). In these two modes, the ME composites exhibit maxima at a specific DC bias magnitude dependent upon the material properties. This maxima position is in the vicinity of ∼5 Oe magnetic DC bias for 2-1 composites consisting of Metglas sheets and piezoelectric fibers which is probably the lowest reported value [9]. For sintered composites consisting of PZT and ferrite phases, the maximum occurs at the applied DC bias of ∼400 Oe [10]. In order to overcome the problems of limited DC and AC magnetic field ranges associated with laminates, we attempted to design structures with flat ME responses for sensing wide ranges of both DC magnetic field and AC mag- netic frequency as illustrated in Figure 1 [11, 12]. Metglas and lead zirconate titanate-lead zinc niobate (PZNT)-based composites were utilized for all the experimentation.

Welcome message from author
This document is posted to help you gain knowledge. Please leave a comment to let me know what you think about it! Share it to your friends and learn new things together.
Transcript

Hindawi Publishing CorporationAdvances in Condensed Matter PhysicsVolume 2012, Article ID 323165, 12 pagesdoi:10.1155/2012/323165
Review Article
Broadband/Wideband Magnetoelectric Response
Chee-Sung Park and Shashank Priya
Center for Energy Harvesting Materials and Systems (CEHMS), Department of Materials Science and Engineering,Virginia Polytechnic Institute and State University, Blacksburg, VA 24061, USA
Correspondence should be addressed to Shashank Priya, [email protected]
Received 19 September 2011; Accepted 26 December 2011
Academic Editor: Amar Bhalla
Copyright © 2012 C.-S. Park and S. Priya. This is an open access article distributed under the Creative Commons AttributionLicense, which permits unrestricted use, distribution, and reproduction in any medium, provided the original work is properlycited.
A broadband/wideband magnetoelectric (ME) composite offers new opportunities for sensing wide ranges of both DC and ACmagnetic fields. The broadband/wideband behavior is characterized by flat ME response over a given AC frequency range and DCmagnetic bias. The structure proposed in this study operates in the longitudinal-transversal (L-T) mode. In this paper, we provideinformation on (i) how to design broadband/wideband ME sensors and (ii) how to control the magnitude of ME response over adesired frequency and DC bias regime. A systematic study was conducted to identify the factors affecting the broadband/widebandbehavior by developing experimental models and validating them against the predictions made through finite element modeling.A working prototype of the sensor with flat bands for both DC and AC magnetic field conditions was successfully obtained. Theseresults are quite promising for practical applications such as current probe, low-frequency magnetic field sensing, and ME energyharvester.
1. Introduction
Magnetoelectric (ME) materials have been investigated tofind applications in sensors, transducers, actuators, energyharvesters, and servomechanism. Direct ME effect impliesinduction of electric polarization by applying an externalmagnetic field. It has been widely investigated in compositestructures consisting of magnetostrictive and piezoelectricmaterials. In these composites, ME coefficient is dependentupon the elastic coupling occurring at the interface betweenpiezoelectric and magnetostrictive phases [1–4]. Functionalcomposites are defined by connectivity of materials such as2-2 composite which is 2 dimensionally laminated, 3-0 com-posite which has dispersed particles in 3-dimensional matrix,and 3-1 composite which has 1-dmensional rods embed-ded in 3-dimensional matrix structures. Magnetostrictive-piezoelectric laminate composites with 2-2 connectivity haveshown much higher ME coefficients than that of single-phasematerials or particulate composites [4–8].
Experimental and analytical results on ME laminateshave shown relatively large ME output voltage, but the peakin ME coefficient occurring at the optimum DC bias isgenerally sharp. This limits their ability to be utilized for
AC magnetic field sensing when the optimized DC conditionbecomes slightly moved off by external noises. Moreover,high ME coefficient generally occurs near the electromechan-ical resonance (EMR) frequency. This narrow bandwidthalso poses problem for stable sensing in a limited frequencyrange. The common modes utilized for ME laminates arelongitudinal transversal (LT) and longitudinal longitudinal(LL). In these two modes, the ME composites exhibitmaxima at a specific DC bias magnitude dependent upon thematerial properties. This maxima position is in the vicinityof ∼5 Oe magnetic DC bias for 2-1 composites consisting ofMetglas sheets and piezoelectric fibers which is probably thelowest reported value [9]. For sintered composites consistingof PZT and ferrite phases, the maximum occurs at theapplied DC bias of ∼400 Oe [10].
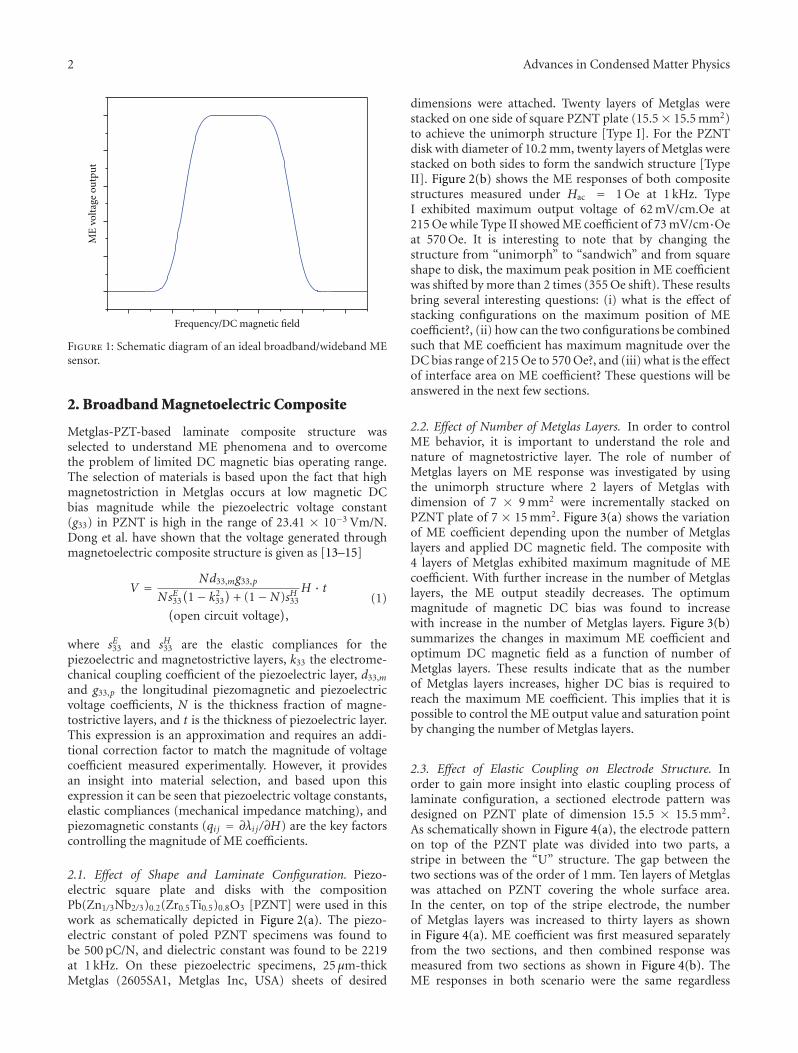
In order to overcome the problems of limited DC andAC magnetic field ranges associated with laminates, weattempted to design structures with flat ME responses forsensing wide ranges of both DC magnetic field and AC mag-netic frequency as illustrated in Figure 1 [11, 12]. Metglasand lead zirconate titanate-lead zinc niobate (PZNT)-basedcomposites were utilized for all the experimentation.
2 Advances in Condensed Matter Physics
Frequency/DC magnetic field
ME
vol
tage
ou
tpu
t
Figure 1: Schematic diagram of an ideal broadband/wideband MEsensor.
2. Broadband Magnetoelectric Composite
Metglas-PZT-based laminate composite structure wasselected to understand ME phenomena and to overcomethe problem of limited DC magnetic bias operating range.The selection of materials is based upon the fact that highmagnetostriction in Metglas occurs at low magnetic DCbias magnitude while the piezoelectric voltage constant(g33) in PZNT is high in the range of 23.41 × 10⁻³ Vm/N.Dong et al. have shown that the voltage generated throughmagnetoelectric composite structure is given as [13–15]
V = Nd33,mg33,p
NsE33
(1− k2
33
)+ (1−N)sH33
H · t(open circuit voltage
),
(1)
where sE33 and sH33 are the elastic compliances for thepiezoelectric and magnetostrictive layers, k33 the electrome-chanical coupling coefficient of the piezoelectric layer, d33,m
and g33,p the longitudinal piezomagnetic and piezoelectricvoltage coefficients, N is the thickness fraction of magne-tostrictive layers, and t is the thickness of piezoelectric layer.This expression is an approximation and requires an addi-tional correction factor to match the magnitude of voltagecoefficient measured experimentally. However, it providesan insight into material selection, and based upon thisexpression it can be seen that piezoelectric voltage constants,elastic compliances (mechanical impedance matching), andpiezomagnetic constants (qi j = ∂λi j /∂H) are the key factorscontrolling the magnitude of ME coefficients.
2.1. Effect of Shape and Laminate Configuration. Piezo-electric square plate and disks with the compositionPb(Zn1/3Nb2/3)0.2(Zr0.5Ti0.5)0.8O3 [PZNT] were used in thiswork as schematically depicted in Figure 2(a). The piezo-electric constant of poled PZNT specimens was found tobe 500 pC/N, and dielectric constant was found to be 2219at 1 kHz. On these piezoelectric specimens, 25 μm-thickMetglas (2605SA1, Metglas Inc, USA) sheets of desired
dimensions were attached. Twenty layers of Metglas werestacked on one side of square PZNT plate (15.5 × 15.5 mm2)to achieve the unimorph structure [Type I]. For the PZNTdisk with diameter of 10.2 mm, twenty layers of Metglas werestacked on both sides to form the sandwich structure [TypeII]. Figure 2(b) shows the ME responses of both compositestructures measured under Hac = 1 Oe at 1 kHz. TypeI exhibited maximum output voltage of 62 mV/cm.Oe at215 Oe while Type II showed ME coefficient of 73 mV/cm·Oeat 570 Oe. It is interesting to note that by changing thestructure from “unimorph” to “sandwich” and from squareshape to disk, the maximum peak position in ME coefficientwas shifted by more than 2 times (355 Oe shift). These resultsbring several interesting questions: (i) what is the effect ofstacking configurations on the maximum position of MEcoefficient?, (ii) how can the two configurations be combinedsuch that ME coefficient has maximum magnitude over theDC bias range of 215 Oe to 570 Oe?, and (iii) what is the effectof interface area on ME coefficient? These questions will beanswered in the next few sections.
2.2. Effect of Number of Metglas Layers. In order to controlME behavior, it is important to understand the role andnature of magnetostrictive layer. The role of number ofMetglas layers on ME response was investigated by usingthe unimorph structure where 2 layers of Metglas withdimension of 7 × 9 mm2 were incrementally stacked onPZNT plate of 7 × 15 mm2. Figure 3(a) shows the variationof ME coefficient depending upon the number of Metglaslayers and applied DC magnetic field. The composite with4 layers of Metglas exhibited maximum magnitude of MEcoefficient. With further increase in the number of Metglaslayers, the ME output steadily decreases. The optimummagnitude of magnetic DC bias was found to increasewith increase in the number of Metglas layers. Figure 3(b)summarizes the changes in maximum ME coefficient andoptimum DC magnetic field as a function of number ofMetglas layers. These results indicate that as the numberof Metglas layers increases, higher DC bias is required toreach the maximum ME coefficient. This implies that it ispossible to control the ME output value and saturation pointby changing the number of Metglas layers.
2.3. Effect of Elastic Coupling on Electrode Structure. Inorder to gain more insight into elastic coupling process oflaminate configuration, a sectioned electrode pattern wasdesigned on PZNT plate of dimension 15.5 × 15.5 mm2.As schematically shown in Figure 4(a), the electrode patternon top of the PZNT plate was divided into two parts, astripe in between the “U” structure. The gap between thetwo sections was of the order of 1 mm. Ten layers of Metglaswas attached on PZNT covering the whole surface area.In the center, on top of the stripe electrode, the numberof Metglas layers was increased to thirty layers as shownin Figure 4(a). ME coefficient was first measured separatelyfrom the two sections, and then combined response wasmeasured from two sections as shown in Figure 4(b). TheME responses in both scenario were the same regardless

Advances in Condensed Matter Physics 3
Piezoelectric
Type I Type II
Magnetostrictive(number of Metglas)
(a)
0
50
100
−50
−100
−900 −600 −300 0 300 600 900
Type II
Type I
dE/dH
(mV
/cm·O
e)
Hac = 1Oe at 1 kHz
DC magnetic field (Oe)
(b)
Figure 2: (a) Schematic diagram of fabricated samples: type I—15.5 × 15.5 mm2 PZNT plate with Metglas attached on one side only,and Type II—10.2 mm diameter PZNT disk with Metglas attached on both sides. (b) Magnetoelectric output voltage as a function of DCmagnetic field [11].
0
5
10
15
20
25
30
35
40
0 100 200 300 400 500 600 700 800
DC magnetic field (Oe)
Number of Metglas layers
2 layers4 layers6 layers
8 layers10 layers
Magnetic field
dE/dH
(mV
/Oe·c
m)
Number of Metglaslayers
(a)
100
150
200
250
300
350
15
20
25
30
35
40
Opt
imu
m D
C m
agn
etic
fiel
d (O
e)Number of Metglas layers
108642
Max
imu
m o
fdE/dH
(mV
/Oe·c
m)
(b)
Figure 3: (a) ME coefficient as a function of the number of Metglas layers and DC magnetic field. (b) Maximum ME coefficient and optimumDC magnetic field as a function of the number of Metglas layers on PZNT. All measurements were conducted under the constant conditionof Hac = 1 Oe at f = 1 kHz [11].
of electrical connections. This phenomenon gives us animportant insight. Although locally different ME outputbehavior was expected from each section because of thedifference in number of Metglas layers, the magnitudes ofME coefficient and optimum DC magnetic field were foundto be identical from both sections. This indicates that averagestrain distribution is homogeneous even though locallydifferent strains are generated. Therefore, a larger physical
separation will be required to achieve differences between thepeak positions of ME coefficient from two separated sections.
2.4. Effect of Composite Dimensions on ME Behaviors. PZNTplates with different planar dimensions (15.5 × 15.5, 12.5× 12.5, and 8 × 8 mm2), but the same thickness of 1 mmwas used in this experiment. Twenty-layers of Metglas wereattached on each plate as shown in Figure 5 (unimorph

4 Advances in Condensed Matter Physics
StackedMetglas
Patterned electrodeon PZNT
Magnetic field
(a)
−150
−100
−50
0
50
100
150
dE/dH
(mV
/cm·O
e)
DC magnetic field (Oe)
Electrical connection
CenterEdgeSum
−600 −400 −200 0 200 400 600
Hac = 1Oe at 1 kHz
(b)
Figure 4: (a) Schematic representation of sample preparation with pyramid-shaped Metglas structure on separately electroded PZNT plate.(b) Magnetoelectric coefficients depending on electrical connections [11].
0
10
20
30
40
50
60
70
Small Medium Large
Large
Medium
Small
dE/dH
(mV
/cm·O
e)
DC magnetic field (Oe)Composite size
0 200 400 600 800
Figure 5: ME coefficient variation as a function of DC magnetic field for various dimensions. 20 layers of Metglas were attached on all PZNTplates. All ME measurements were conducted under Hac = 1 Oe at 1 kHz [11].
configuration). Higher number of Metglas layers was usedto avoid variation as a function of number of Metglaslayers (saturated response in Figure 3(b)). Thus, the MEcoefficient is dependent only upon the planar dimensionsof the composite. Figure 5 shows the ME behavior as afunction of DC magnetic field for three different samples.
As the planar area of composite decreases, the ME voltagecoefficient decreases, while optimum DC magnetic fieldincreases. As a result, the ME coefficient and optimumDC magnetic field exhibit inverse behaviors with increasingplanar area. In other words, when the planar geometry islarger, the ME coefficient is larger with smaller optimum

Advances in Condensed Matter Physics 5
DC magnetic field
ME
ou
tpu
t
DC magnetic field
ME
ou
tpu
t
(a) (b)
Figure 6: Schematic diagram of modified sensor structure. Based on the results of ME dependency on the size (a), dimensionally gradientstructure was designed as shown in (b).
Metglas
ElectrodedPZNT
(a)
0 200 400 600 800
0
10
20
30
40
50
60
dE/dH
(mV
/cm·O
e)
DC magnetic field (Oe)
Hac = 1Oe at 1 kHz
(b)
Figure 7: (a) Schematic structure of the dimensionally gradient laminate composite. 20 layers of Metglas were attached on each rectangularsection, (b) ME coefficient of the dimensionally gradient sample under Hac = 1 Oe at 1 kHz [11].
magnetic DC bias. The results of Figure 5 can be explainedon the basis of edge effect called “shear lagging” [16]. Asdimensions of ME composites become smaller, the relativesurface and edge areas increase leading to shear lagging.This results in the change of magnetization behavior andpiezomagnetic coefficient (qi j = ∂λi j /∂H); subsequently,both optimum magnetic bias and ME coefficient are changedwith a trade-off relationship between them.
This result is important to realize different peak positionsof ME coefficient from different sections. In combinationwith the result of Figure 3, it is quite interesting to notethat optimum number of layers of Metglas on piezoelectricphase with large planar dimensions can provide higher
ME coefficient at smaller magnetic DC bias. These results(Figures 3 and 5) lead us to the design rule that maximumpeak of the ME coefficient can be shifted by altering thegeometry of laminate composites and by designing structurewith gradient dimensions as illustrated in Figure 6.
2.5. Effect of Dimensionally Gradient Laminate Composite.In order to achieve the individual response from separatedsections of composite, a new geometrical structure wasconceived as schematically shown in Figure 6. The compositedesign was guided by the results of previous sections thatindicated (i) different dimensions resulted in different peakpositions with respect to magnetic DC bias, and (ii) physical

6 Advances in Condensed Matter Physics
30
4
(a)
0 100 200 300 400 5000
20
40
60
80
100
4
30
dE/dH
(mV
/Oe·c
m)
DC magnetic field (Oe)
Hac = 1Oe at 1 kHz
(b)
Figure 8: (a) Schematic diagram of the asymmetric H-shaped composite structure. (b) Broadband ME behavior of the asymmetric H-shapedlaminate [11].
separation between the Metglas layers was necessary tocreate difference in the peak positions of ME coefficient. Weincorporated these two factors by designing a dimensionallygradient composite with the separation of Metglas sections,as shown in Figure 7(a). The dimensions of the PZNTplate in each section were as following: 15.5 × 5, 10.6 ×5.5, and 6.2 × 5 mm2 (width of about 5 mm was reducedper 5 mm length). The thickness of the plate was 1 mm.On this structure, 20 layers of Metglas with proportionalsurface area were attached where each Metglas section wasseparated from each other by 1.5 mm. The stack of twenty-layers of Metglas was intentionally selected so that theobserved effect is solely from the variation of the dimensionacross the composite. Figure 5(b) shows the measured MEresponse of this composite structure. Interestingly, totalME response of the structure was in combination of thethree individual effects as shown by the peak fitting; three-typical components were found in the same specimen. Asthe planar dimension of composite decreases, the saturationmagnetic field increases in providing three separate peaksfrom three different sections. The larger composite sectionexhibits higher ME coefficient at smaller magnetic DC biasin agreement with our result in Figure 5 and expectation inFigure 6.
The results of Figures 3–7 lead us to an importantconclusion that high magnitude and saturation point of MEcoefficient can be controlled by composite structure havingseparated sections, dimensions of composite, and number ofMetglas layers on the piezoelectric planar area.
2.6. Observation of Broadband Behavior. In order to enhancethe physical separation, an asymmetric H-shaped PZNTplate was fabricated with the dimensions shown inFigure 8(a) (15.2 × 5.3 and 8.5 × 5 mm2 areas wereconnected with the bridge of 4 × 5 mm2). In this design,
the bridge connecting two different dimensions of laminatecomposites will lead to two separate responses. On this PZNTplate, 4 layers of Metglas were attached on the smaller area,and 30 layers of Metglas were attached on the larger area.It should be noted here that a smaller dimensions lead tosmaller ME coefficient, but smaller number of Metglas layerslead to larger ME coefficient. Thus, a compromise betweenthe two opposing effects was calculated to be in the rangeequivalent to that of the large composite with 30 layers ofMetglas. Figure 8(b) shows the measured ME response fromthis composite structure. The first peak of ME coefficientwas found at 94 Oe which was associated with that of 4-layered Metglas structure on smaller piezoelectric surfacearea. The second peak in ME coefficient was found at 220 Oeresulting from the 30-layered Metglas structure on the largerpiezoelectric area. There is a slight drop in the magnitudeof ME coefficient between the two peaks, which reflects amismatch in tailoring the dimensions of two sections. Byfurther adjusting the dimensions, it is possible to bringthe two peaks closer to each other and achieve almost asquare wave response. However, the results of this figureclearly demonstrate the idea in designing the broadbandmagnetoelectric sensor.
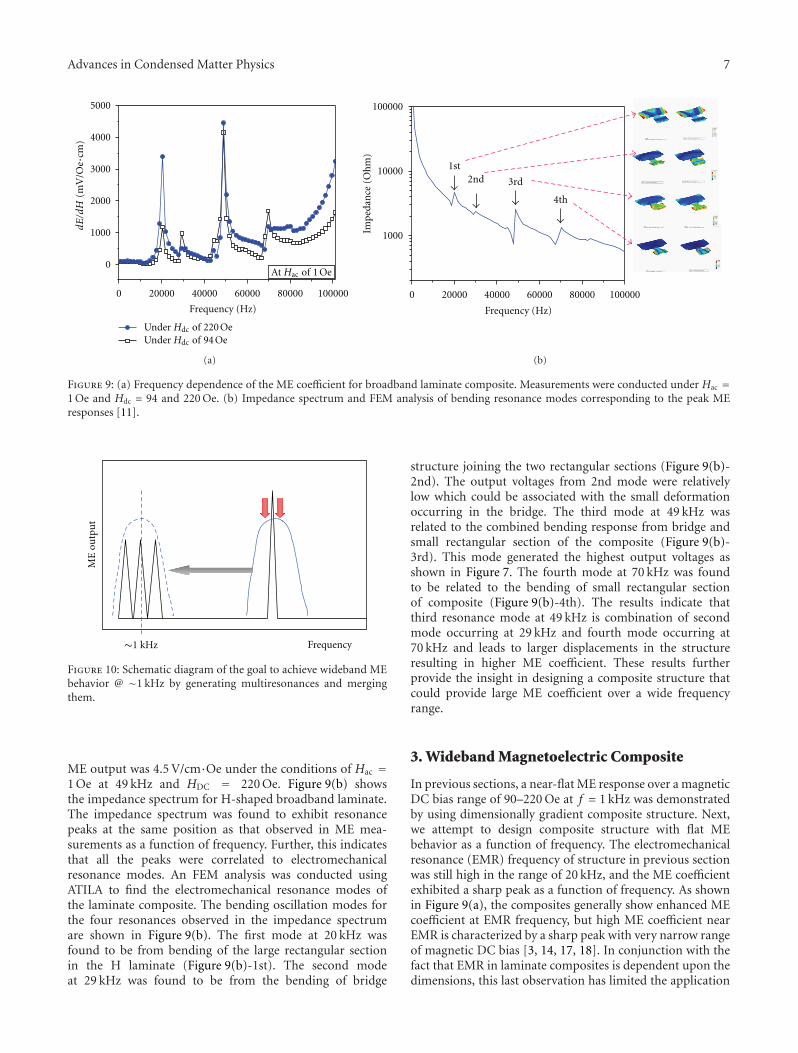
2.7. Frequency Dependence of Broadband ME Sensor. Thefrequency dependence of the ME coefficient for broadbandcomposite in the range of 40 to 105 Hz is shown inFigure 9(a). The measurement was conducted under theAC magnetic field of Hac = 1 Oe and under applied DCmagnetic fields of 94 and 220 Oe. The peaks in this figurecorrespond to electromechanical resonances occurring at 20,29, 49, and 70 kHz. It is interesting to note that regardlessof the applied DC magnetic field in the range of 94–220 Oe, the broadband ME sensor shows similar range ofME output voltage, ∼4 V/cm·Oe, at 49 kHz. The maximum
Advances in Condensed Matter Physics 7
0 20000 40000 60000 80000 100000
0
1000
2000
3000
4000
5000
dE/dH
(mV
/Oe·c
m)
Frequency (Hz)
At Hac of 1 Oe
Under Hdc of 220 OeUnder Hdc of 94 Oe
(a)Im
peda
nce
(O
hm
)
0 20000 40000 60000 80000 100000
1000
10000
100000
4th
3rd2nd1st
Frequency (Hz)
(b)
Figure 9: (a) Frequency dependence of the ME coefficient for broadband laminate composite. Measurements were conducted under Hac =1 Oe and Hdc = 94 and 220 Oe. (b) Impedance spectrum and FEM analysis of bending resonance modes corresponding to the peak MEresponses [11].
Frequency
ME
ou
tpu
t
∼1 kHz
Figure 10: Schematic diagram of the goal to achieve wideband MEbehavior @ ∼1 kHz by generating multiresonances and mergingthem.
ME output was 4.5 V/cm·Oe under the conditions of Hac =1 Oe at 49 kHz and HDC = 220 Oe. Figure 9(b) showsthe impedance spectrum for H-shaped broadband laminate.The impedance spectrum was found to exhibit resonancepeaks at the same position as that observed in ME mea-surements as a function of frequency. Further, this indicatesthat all the peaks were correlated to electromechanicalresonance modes. An FEM analysis was conducted usingATILA to find the electromechanical resonance modes ofthe laminate composite. The bending oscillation modes forthe four resonances observed in the impedance spectrumare shown in Figure 9(b). The first mode at 20 kHz wasfound to be from bending of the large rectangular sectionin the H laminate (Figure 9(b)-1st). The second modeat 29 kHz was found to be from the bending of bridge
structure joining the two rectangular sections (Figure 9(b)-2nd). The output voltages from 2nd mode were relativelylow which could be associated with the small deformationoccurring in the bridge. The third mode at 49 kHz wasrelated to the combined bending response from bridge andsmall rectangular section of the composite (Figure 9(b)-3rd). This mode generated the highest output voltages asshown in Figure 7. The fourth mode at 70 kHz was foundto be related to the bending of small rectangular sectionof composite (Figure 9(b)-4th). The results indicate thatthird resonance mode at 49 kHz is combination of secondmode occurring at 29 kHz and fourth mode occurring at70 kHz and leads to larger displacements in the structureresulting in higher ME coefficient. These results furtherprovide the insight in designing a composite structure thatcould provide large ME coefficient over a wide frequencyrange.
3. Wideband Magnetoelectric Composite
In previous sections, a near-flat ME response over a magneticDC bias range of 90–220 Oe at f = 1 kHz was demonstratedby using dimensionally gradient composite structure. Next,we attempt to design composite structure with flat MEbehavior as a function of frequency. The electromechanicalresonance (EMR) frequency of structure in previous sectionwas still high in the range of 20 kHz, and the ME coefficientexhibited a sharp peak as a function of frequency. As shownin Figure 9(a), the composites generally show enhanced MEcoefficient at EMR frequency, but high ME coefficient nearEMR is characterized by a sharp peak with very narrow rangeof magnetic DC bias [3, 14, 17, 18]. In conjunction with thefact that EMR in laminate composites is dependent upon thedimensions, this last observation has limited the application

8 Advances in Condensed Matter Physics
0 20000 40000 60000 80000 1000000
5000
10000
Impe
dan
ce (
Oh
m)
Frequency (Hz)
(a)
0 20000 40000 60000 80000 100000
1000
10000
100000
Impe
dan
ce (
Oh
m)
−100
−80
−60
−40
−20
0
Ph
ase
(deg
)
Frequency (Hz)
(b)
Figure 11: Resonance analysis: (a) unimorph and (b) bimorph piezoelectric asymmetric H-shaped structure [12].
of ME composites in magnetic field sensing; that is, largedimensions are required to achieve low EMR frequency.
A study for wideband ME response by combining severalTerfenol-D/epoxy-Pb(Zr,Ti)O3 bilayers through parallel andseries electrical connections was conducted by Yu et al. [19].However, this approach has obvious problems as follows:(i) several laminate composites are required with varyingEMR frequency which increases the overall dimensions, (ii)the overall magnitude of ME coefficient at EMR frequencydecreases significantly because of mismatch in electricaloutput, (iii) the magnitude of ME coefficient fluctuatesdepending upon the gradient in external magnetic field, and(iv) operational frequency is still quite high.
It is well known that, by combining the piezoelectricelement having capacitance, Cp, in parallel with shunt havingcapacitance Cs, the total capacitance of the system changes toC = Cp + Cs, which affects the natural resonance frequency(ω) given as [20]
ω =√
Keff + C−1d2
meff, (2)
where Keff is equivalent stiffness of the cantilever beam, meff
is the effective mass, and d is the electromechanical coupling.Charnegie has shown that, for a three-layer structure con-sisting of two piezoelectric beams bonded on to a substratewhich is nonpiezoelectric (three layer laminate), the EMRfrequency of one piezoelectric layer with capacitance Cp canbe shifted by changing the capacitance of other piezoelectriclayer Cs through the expression [21]
ω =
√√√√√3(s11 − d2
31A/t(Cp + Cs
))−1I
L3meff, (3)
where A is area, t is the thickness, L is the length, s11
is the mechanical compliance of piezoelectric material, d31
is the electromechanical coupling coefficient, and I is the
moment of inertia. Equation (3) also predicts that bycombining several laminates in series and parallel connectionthe EMR frequency can be modified. This technique hasbeen recently utilized for energy harvesters to modify theoperating frequency range [22].
In order to achieve the wideband behavior for themagnetic frequency regime, multiple resonance modes inclose vicinity to each other should be the key factor, asschematically illustrated in Figure 10. With reduction in theresonance frequency closer to ∼1 kHz, wideband behaviorsboth in terms of magnetic DC bias and frequency will bedescribed in the next few sections.
3.1. Bimorph-typed Dimensionally Gradient Laminate Com-posite. Figure 11 shows the difference in resonant frequen-cies between the asymmetric H-shaped piezoelectric uni-morph and bimorph configurations. The resonance spec-trum of the asymmetric H-shaped single plate was analyzedusing the FEM method (ATILA), as shown in Figure 11(a).The FEM results demonstrate electromechanical resonancesoccurring at 40, 70, and 94 kHz as shown in Figure 11(a). Thefirst mode at 40 kHz was associated with bending of the largerrectangular section. The second mode at 70 kHz was found tobe from bending of two rectangular sections. The third modeat 94 kHz was related to combined lateral response from largerectangular section.
On the other hand, the asymmetric H-shaped piezo-electric bimorph structure was found to generate additionalresonant modes and reduce the resonant frequency. Twopiezoelectric plates with the thickness of 500 μm weremachined to have the asymmetric H shapes (15.5 × 5and 9.5 × 5 mm2 areas were connected with the bridge of4 × 5 mm2). Next, two piezoelectric plates with oppositepoling directions were bonded together as shown in theinset of Figure 11(b). The asymmetric H-shaped bimorphexhibited multiple resonances below 100 kHz as shown inFigure 11(b). The impedance and phase spectrums showed

Advances in Condensed Matter Physics 9
0 200 4000
20
40
60
80
100
120
140
dE/dH
(mV
/cm·O
e)
DC magnetic field (Oe)
30
4
Hac = 1Oe at 1 kHz
(a)
Frequency (Hz)
0
0
20000 40000 60000 80000 100000
1000
10000
100000
Impe
dan
ce (
Oh
m)
−80
−60
−40
−20
Ph
ase
(deg
)
(b)
Frequency (Hz)
0 20000 40000 60000 80000 1000000
200
400
600
800
1000
dE/dH
(mV
/cm·O
e)
60 Oe215 Oe
Hac = 1Oe
Hdc
(c)
Frequency (Hz)
0 5000 10000 15000 20000 25000 30000
0
200
400
600
800
1000
Band
dE/dH
(mV
/cm·O
e)
60 Oe215 Oe
Hac = 1Oe
Hdc
(d)
Figure 12: (a) ME coefficient as a function of magnetic DC bias at frequency of 1 kHz and applied AC magnetic field of Hac = 1 Oe. Inset:schematic diagram of Metglas attached to the bimorph. Four layers of Metglas of area 15 × 7 mm2 were attached on smaller rectangularsection while thirty layers of Metglas of area 20× 7 mm2 were attached on the larger rectangular section, (b) impedance and phase spectrumsas a function of frequency, (c) ME coefficient as a function of frequency until 100 kHz, and (d) wideband ME behavior as a function offrequency until 30 kHz [12].
the resonance peaks at 10.09, 13.08, 23.32, 33.31, 43.05,58.54, and 82.26 kHz. These peaks are resultant of bimorphconfiguration which indicates coupling between the twopiezoelectric plates. The main peak for bimorph wasobserved at 13.08 kHz. The presence of these additionalresonant peaks allows us to merge them in the desiredoperating range resulting in wide band response.
3.2. Observation of Wideband Behavior. On the asymmetricH-shaped piezoelectric bimorph, four layers of Metglas witharea of 15 × 7 mm2 were attached at the smaller section,and thirty layers of Metglas with area of 20 × 7 mm2 wereattached at the larger section to have configuration similarto that of previous approach (Figure 8(a)). There are twovariables here which can be adjusted to achieve averagingof the ME response from two sections of the asymmetric Hlaminate. First, if the area of two sections is same, then one
with smaller number of Metglas layers will show higher MEcoefficient. Second, if a number of Metglas layers are same,then one with smaller area will show smaller ME coefficient[11, 12]. Thus, by adjusting the ratio of Metglas layers toarea of the piezoelectric rectangular sections, an averageresponse can be obtained from the asymmetric H-shapedstructure. Figure 12(a) shows the measured ME responsefrom bimorph composite structure as a function of magneticDC bias at frequency of 1 kHz with Hac = 1 Oe. The peakat 60 Oe was associated with four-layered Metglas section onthe smaller piezoelectric surface area. The second peak ofME coefficient at 215 Oe was associated with thirty-layeredMetglas section with the larger piezoelectric area.
Figure 12(b) shows the impedance and phase anglespectrum of this laminate. After Metglas was attached onthe PZNT plate, the intensity of resonances became smallerwhich can be explained by dampening effect and the position

10 Advances in Condensed Matter Physics
0 200 4000
20
40
60
80
100
120
140dE
/dH
(mV
/cm
·Oe)
DC magnetic field (Oe)
Hac = 1 Oe at 1 kHz
(a)
0
0 20000 40000 60000 80000 100000
1000
10000
100000
Frequency (Hz)
−80
−60
−40
−20
Ph
ase
(deg
)
Impe
dan
ce (
Oh
m)
(b)
0
500
1000
1500
2000
2500
0 20000 40000 60000 80000 100000
Frequency (Hz)
dE
/dH
(mV
/cm
·Oe)
60 Oe215 Oe
Hdc
Hac = 1 Oe
(c)
0 200 4000
20
40
60
80
100
120
140
dE
/dH
(mV
/cm
·Oe)
DC magnetic field (Oe)
Hac = 1 Oe at 1 kHz
(d)0
0 20000 40000 60000 80000 100000
1000
10000
100000
Frequency (Hz)
−80
−60
−40
−20
Ph
ase
(deg
)
Impe
dan
ce (
Oh
m)
(e)
0
500
1000
1500
dE
/dH
(mV
/cm
·Oe)
0 20000 40000 60000 80000 100000
Frequency (Hz)
60 Oe215 Oe
Hac = 1 Oe
Hdc
(f)Figure 13: (a) ME coefficient of the laminate composite with tip mass on the smaller rectangular area as a function of magnetic DC bias at1 kHz, (b) impedance and phase spectrums with tip mass on the smaller section as a function of frequency, (c) ME sensitivity with tip masson the smaller section as a function of frequency, (d) ME coefficient of the laminate with tip mass on both smaller and larger rectangularsections, (e) impedance and phase spectrums with tip mass on both sections, and (f) ME sensitivity as a function of frequency with tip masson both sections [12].
Advances in Condensed Matter Physics 11
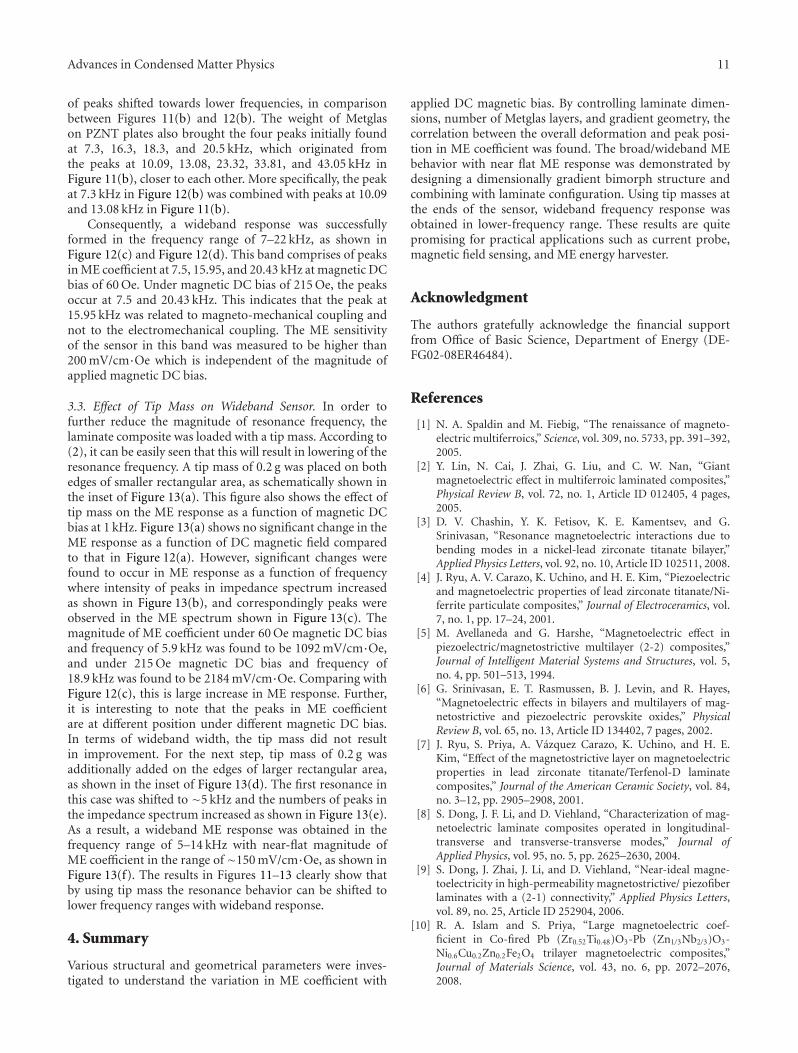
of peaks shifted towards lower frequencies, in comparisonbetween Figures 11(b) and 12(b). The weight of Metglason PZNT plates also brought the four peaks initially foundat 7.3, 16.3, 18.3, and 20.5 kHz, which originated fromthe peaks at 10.09, 13.08, 23.32, 33.81, and 43.05 kHz inFigure 11(b), closer to each other. More specifically, the peakat 7.3 kHz in Figure 12(b) was combined with peaks at 10.09and 13.08 kHz in Figure 11(b).
Consequently, a wideband response was successfullyformed in the frequency range of 7–22 kHz, as shown inFigure 12(c) and Figure 12(d). This band comprises of peaksin ME coefficient at 7.5, 15.95, and 20.43 kHz at magnetic DCbias of 60 Oe. Under magnetic DC bias of 215 Oe, the peaksoccur at 7.5 and 20.43 kHz. This indicates that the peak at15.95 kHz was related to magneto-mechanical coupling andnot to the electromechanical coupling. The ME sensitivityof the sensor in this band was measured to be higher than200 mV/cm·Oe which is independent of the magnitude ofapplied magnetic DC bias.
3.3. Effect of Tip Mass on Wideband Sensor. In order tofurther reduce the magnitude of resonance frequency, thelaminate composite was loaded with a tip mass. According to(2), it can be easily seen that this will result in lowering of theresonance frequency. A tip mass of 0.2 g was placed on bothedges of smaller rectangular area, as schematically shown inthe inset of Figure 13(a). This figure also shows the effect oftip mass on the ME response as a function of magnetic DCbias at 1 kHz. Figure 13(a) shows no significant change in theME response as a function of DC magnetic field comparedto that in Figure 12(a). However, significant changes werefound to occur in ME response as a function of frequencywhere intensity of peaks in impedance spectrum increasedas shown in Figure 13(b), and correspondingly peaks wereobserved in the ME spectrum shown in Figure 13(c). Themagnitude of ME coefficient under 60 Oe magnetic DC biasand frequency of 5.9 kHz was found to be 1092 mV/cm·Oe,and under 215 Oe magnetic DC bias and frequency of18.9 kHz was found to be 2184 mV/cm·Oe. Comparing withFigure 12(c), this is large increase in ME response. Further,it is interesting to note that the peaks in ME coefficientare at different position under different magnetic DC bias.In terms of wideband width, the tip mass did not resultin improvement. For the next step, tip mass of 0.2 g wasadditionally added on the edges of larger rectangular area,as shown in the inset of Figure 13(d). The first resonance inthis case was shifted to ∼5 kHz and the numbers of peaks inthe impedance spectrum increased as shown in Figure 13(e).As a result, a wideband ME response was obtained in thefrequency range of 5–14 kHz with near-flat magnitude ofME coefficient in the range of ∼150 mV/cm·Oe, as shown inFigure 13(f). The results in Figures 11–13 clearly show thatby using tip mass the resonance behavior can be shifted tolower frequency ranges with wideband response.
4. Summary
Various structural and geometrical parameters were inves-tigated to understand the variation in ME coefficient with
applied DC magnetic bias. By controlling laminate dimen-sions, number of Metglas layers, and gradient geometry, thecorrelation between the overall deformation and peak posi-tion in ME coefficient was found. The broad/wideband MEbehavior with near flat ME response was demonstrated bydesigning a dimensionally gradient bimorph structure andcombining with laminate configuration. Using tip masses atthe ends of the sensor, wideband frequency response wasobtained in lower-frequency range. These results are quitepromising for practical applications such as current probe,magnetic field sensing, and ME energy harvester.
Acknowledgment
The authors gratefully acknowledge the financial supportfrom Office of Basic Science, Department of Energy (DE-FG02-08ER46484).
References
[1] N. A. Spaldin and M. Fiebig, “The renaissance of magneto-electric multiferroics,” Science, vol. 309, no. 5733, pp. 391–392,2005.
[2] Y. Lin, N. Cai, J. Zhai, G. Liu, and C. W. Nan, “Giantmagnetoelectric effect in multiferroic laminated composites,”Physical Review B, vol. 72, no. 1, Article ID 012405, 4 pages,2005.
[3] D. V. Chashin, Y. K. Fetisov, K. E. Kamentsev, and G.Srinivasan, “Resonance magnetoelectric interactions due tobending modes in a nickel-lead zirconate titanate bilayer,”Applied Physics Letters, vol. 92, no. 10, Article ID 102511, 2008.
[4] J. Ryu, A. V. Carazo, K. Uchino, and H. E. Kim, “Piezoelectricand magnetoelectric properties of lead zirconate titanate/Ni-ferrite particulate composites,” Journal of Electroceramics, vol.7, no. 1, pp. 17–24, 2001.
[5] M. Avellaneda and G. Harshe, “Magnetoelectric effect inpiezoelectric/magnetostrictive multilayer (2-2) composites,”Journal of Intelligent Material Systems and Structures, vol. 5,no. 4, pp. 501–513, 1994.
[6] G. Srinivasan, E. T. Rasmussen, B. J. Levin, and R. Hayes,“Magnetoelectric effects in bilayers and multilayers of mag-netostrictive and piezoelectric perovskite oxides,” PhysicalReview B, vol. 65, no. 13, Article ID 134402, 7 pages, 2002.
[7] J. Ryu, S. Priya, A. Vazquez Carazo, K. Uchino, and H. E.Kim, “Effect of the magnetostrictive layer on magnetoelectricproperties in lead zirconate titanate/Terfenol-D laminatecomposites,” Journal of the American Ceramic Society, vol. 84,no. 3–12, pp. 2905–2908, 2001.
[8] S. Dong, J. F. Li, and D. Viehland, “Characterization of mag-netoelectric laminate composites operated in longitudinal-transverse and transverse-transverse modes,” Journal ofApplied Physics, vol. 95, no. 5, pp. 2625–2630, 2004.
[9] S. Dong, J. Zhai, J. Li, and D. Viehland, “Near-ideal magne-toelectricity in high-permeability magnetostrictive/ piezofiberlaminates with a (2-1) connectivity,” Applied Physics Letters,vol. 89, no. 25, Article ID 252904, 2006.
[10] R. A. Islam and S. Priya, “Large magnetoelectric coef-ficient in Co-fired Pb (Zr0.52Ti0.48)O3-Pb (Zn1/3Nb2/3)O3-Ni0.6Cu0.2Zn0.2Fe2O4 trilayer magnetoelectric composites,”Journal of Materials Science, vol. 43, no. 6, pp. 2072–2076,2008.

12 Advances in Condensed Matter Physics
[11] C. S. Park, C. W. Ahn, J. Ryu et al., “Design and characteriza-tion of broadband magnetoelectric sensor,” Journal of AppliedPhysics, vol. 105, no. 9, Article ID 094111, 2009.
[12] C. S. Park, C. W. Ahn, S. C. Yang, and S. Priya, “Dimensionallygradient magnetoelectric bimorph structure exhibiting widefrequency and magnetic dc bias operating range,” Journal ofApplied Physics, vol. 106, no. 11, Article ID 114101, 2009.
[13] S. Dong, J. F. Li, and D. Viehland, “Longitudinal and trans-verse magnetoelectric voltage coefficients of magnetostric-tive/piezoelectric laminate composite: theory,” IEEE Transac-tions on Ultrasonics, Ferroelectrics, and Frequency Control, vol.50, no. 10, pp. 1253–1261, 2003.
[14] S. Dong, J. Cheng, J. F. Li, and D. Viehland, “Enhancedmagnetoelectric effects in laminate composites of Terfenol-D/Pb(Zr,Ti)O3 under resonant drive,” Applied Physics Letters,vol. 83, no. 23, pp. 4812–4814, 2003.
[15] S. Dong, J. F. Li, and D. Viehland, “Magnetoelectric cou-pling, efficiency, and voltage gain effect in piezoelectric-piezomagnetic laminate composites,” Journal of MaterialsScience, vol. 41, no. 1, pp. 97–106, 2006.
[16] C. M. Chang and G. P. Carman, “Modeling shear lag anddemagnetization effects in magneto-electric laminate com-posites,” Physical Review B, vol. 76, no. 13, Article ID 134116,2007.
[17] M. I. Bichurin, D. A. Filippov, V. M. Petrov, V. M. Laletsin, N.Paddubnaya, and G. Srinivasan, “Resonance magnetoelectriceffects in layered magnetostrictive-piezoelectric composites,”Physical Review B, vol. 68, no. 13, Article ID 132408, 4 pages,2003.
[18] Y. X. Liu, J. G. Wan, J. M. Liu, and C. W. Nan, “Numericalmodeling of magnetoelectric effect in a composite structure,”Journal of Applied Physics, vol. 94, no. 8, pp. 5111–5117, 2003.
[19] H. Yu, M. Zeng, Y. Wang, J. G. Wan, and J. M. Liu, “Mag-netoelectric resonance-bandwidth broadening of Terfenol-D/epoxy- Pb (Zr,Ti)O3 bilayers in parallel and series connec-tions,” Applied Physics Letters, vol. 86, no. 3, Article ID 032508,3 pages, 2005.
[20] M.G. Muriuki, An investigation into the design and control oftunable piezoelectric resonators, Ph.D. dissertation, Universityof Pittsburgh, 2004.
[21] D. Charnegie, Frequency tuning concepts for piezoelectriccantilever beams and plates for energy harvesting, M.S. thesis,University of Pittsburgh, 2005.
[22] H. Xue, Y. Hu, and Q. M. Wang, “Broadband piezoelectricenergy harvesting devices using multiple bimorphs withdifferent operating frequencies,” IEEE Transactions on Ultra-sonics, Ferroelectrics, and Frequency Control, vol. 55, no. 9, pp.2104–2108, 2008.
Related Documents