REVIEW ARTICLE bioresources.com Hubbe et al. (2014). “Petrochemicals biosorption,” BioResources 9(4), 7782-7925. 7782 Cellulosic Substrates for Removal of Pollutants from Aqueous Systems: A Review. Part 4. Dissolved Petrochemical Compounds Martin A. Hubbe,* Junyeong Park, and Sunkyu Park Dissolved petroleum-based compounds, e.g. solvents, pesticides, and chemical reagents such as phenolic compounds, can pose significant hazards to the health of humans and ecosystems when they are released to the environment. This review article considers research progress related to the biosorption and removal of such contaminants from water using cellulose-derived materials. The fact that cellulosic materials show promise in removing such sparingly soluble materials from water lends support to a hypothesis that lignocellulosic materials can be broad- spectrum adsorbents. Also, the hydrophobic character and sorption capabilities can be increased through thermal treatment and the preparation of activated carbons. As shown in many studies, the efficiency of uptake of various petrochemical products from water also can be increased by chemical treatments of the adsorbent. It appears that more widespread adoption of biosorption as a means of removing petroleum- based products from water has been limited by concerns about the used, loaded biosorbent. Disposal or regeneration options that need to be considered more in future research include enzymatic and biological treatments, taking advantage of the fact that the biosorbent material is able to collect, immobilize, and concentrate various contaminants in forms that are suited for a number of packed bed or batch-type degradative treatment systems. Keywords: Cellulose; Biomass; Biosorption; Remediation; Pollutants; Adsorption; Petroleum; Organic chemicals; Solvents; Pesticides; Wastewater treatment Contact information: Department of Forest Biomaterials, College of Natural Resources, North Carolina State University, Campus Box 8005, Raleigh, NC 27695-8005; *Corresponding author: [email protected] CONTENTS Introduction . . . . . . . . . . . . . . . . . . . . . . . . . 7783 Experimental Findings . . . . . . . . . . . . . . . . . 7784 Source materials . . . . . . . . . . . . . . . 7784 Modification of the sorbent . . . . . . . 7787 Attributes of the sorbent . . . . . . . . . . 7792 Attributes of the sorbate . . . . . . . . . 7799 Aqueous conditions . . . . . . . . . . . . . 7801 Theoretical Aspects . . . . . . . . . . . . . . . . . . . 7806 Life Cycle Issues . . . . . . . . . . . . . . . . . . . . . 7829 Concluding Remarks. . . . . . . . . . . . . . . . . . . 7835 Literature Citations . . . . . . . . . . . . . . . . . . . . 7837 Table A (Appendix) . . . . . . . . . . . . . . . . . . . . 7881

Welcome message from author
This document is posted to help you gain knowledge. Please leave a comment to let me know what you think about it! Share it to your friends and learn new things together.
Transcript
REVIEW ARTICLE bioresources.com
Hubbe et al. (2014). “Petrochemicals biosorption,” BioResources 9(4), 7782-7925. 7782
Cellulosic Substrates for Removal of Pollutants from Aqueous Systems: A Review. Part 4. Dissolved Petrochemical Compounds
Martin A. Hubbe,* Junyeong Park, and Sunkyu Park
Dissolved petroleum-based compounds, e.g. solvents, pesticides, and chemical reagents such as phenolic compounds, can pose significant hazards to the health of humans and ecosystems when they are released to the environment. This review article considers research progress related to the biosorption and removal of such contaminants from water using cellulose-derived materials. The fact that cellulosic materials show promise in removing such sparingly soluble materials from water lends support to a hypothesis that lignocellulosic materials can be broad-spectrum adsorbents. Also, the hydrophobic character and sorption capabilities can be increased through thermal treatment and the preparation of activated carbons. As shown in many studies, the efficiency of uptake of various petrochemical products from water also can be increased by chemical treatments of the adsorbent. It appears that more widespread adoption of biosorption as a means of removing petroleum-based products from water has been limited by concerns about the used, loaded biosorbent. Disposal or regeneration options that need to be considered more in future research include enzymatic and biological treatments, taking advantage of the fact that the biosorbent material is able to collect, immobilize, and concentrate various contaminants in forms that are suited for a number of packed bed or batch-type degradative treatment systems.
Keywords: Cellulose; Biomass; Biosorption; Remediation; Pollutants; Adsorption; Petroleum;
Organic chemicals; Solvents; Pesticides; Wastewater treatment
Contact information: Department of Forest Biomaterials, College of Natural Resources, North Carolina
State University, Campus Box 8005, Raleigh, NC 27695-8005; *Corresponding author: [email protected]
CONTENTS
Introduction . . . . . . . . . . . . . . . . . . . . . . . . . 7783 Experimental Findings . . . . . . . . . . . . . . . . . 7784 Source materials . . . . . . . . . . . . . . . 7784 Modification of the sorbent . . . . . . . 7787 Attributes of the sorbent . . . . . . . . . . 7792 Attributes of the sorbate . . . . . . . . . 7799 Aqueous conditions . . . . . . . . . . . . . 7801 Theoretical Aspects . . . . . . . . . . . . . . . . . . . 7806
Life Cycle Issues . . . . . . . . . . . . . . . . . . . . . 7829 Concluding Remarks. . . . . . . . . . . . . . . . . . . 7835 Literature Citations . . . . . . . . . . . . . . . . . . . . 7837 Table A (Appendix) . . . . . . . . . . . . . . . . . . . . 7881
REVIEW ARTICLE bioresources.com
Hubbe et al. (2014). “Petrochemicals biosorption,” BioResources 9(4), 7782-7925. 7783
INTRODUCTION
The water-soluble components of various petrochemical products, such as
pesticides, solvents, plasticizers, and pharmaceuticals, pose hazards to people and to nature
(Keith and Telliard 1979). The toxic nature of many petroleum-derived organic
compounds has been well documented (Augulyte et al. 2008). Substances capable of
disrupting the endocrine systems of people and animals are of particular concern
(Sethunathan et al. 2004; Yu et al. 2008; Kumar et al. 2009a; Rossner et al. 2009; Chang
et al. 2012; Jung et al. 2013; Ye et al. 2013; Soni and Padmaja 2014). Phenolic compounds,
despite their limited aqueous solubility, are serious water pollutants, especially in the case
of chlorinated phenolics (Igbinosa et al. 2013; Tsai 2013).
Alternative measures for removal of organic pollutants from water solution have
been reviewed (Franklin 1991; Dvorak et al. 1993; Droste 1997; Özbelge et al. 2002;
Demirev 2008; Thuy et al. 2008; Musteret et al. 2010; Pratarn et al. 2011; Margot et al.
2013). In particular, conventional wastewater treatment, using either activated sludge or
various types of bioreactors, can induce biodegradation of many petrochemical products,
at least in part (Juhasz and Naidu 2000a; Farhadian et al. 2008; Marin et al. 2010; Kwon
et al. 2011; Al-Khalid and El-Naas 2012; Krastanov et al. 2013; Niti et al. 2013).
Adsorption onto suspended particles has been proposed for many years as a
promising route to remove petrochemical pollutants from dilute aqueous solutions (Morris
and Weber 1962; Weber and Morris 1963). The general topic of biosorption also has been
reviewed (Mattson and Mark 1971; Dobbs and Cohen 1980; Perrich 1981; Pollard et al.
1992; Vrana et al. 1998; Moreno-Castilla 2004; Aksu 2005; Dąbrowski et al. 2005;
Mathialagan and Viraraghavan 2008; Gadd 2009; Lin and Juang 2009; Bhatnagar et al.
2010; Capasso and De Martino 2010; Zolgharnein et al. 2011; Delgado et al. 2012;
Julinová and Slavík 2012; Pintor et al. 2012; Gupta and Saleh 2013; Liu et al. 2013;
Michalak et al. 2013; Fomina and Gadd 2014). In the present discussion the term
“biosorption” will be taken to include adsorption of pollutants on any sorbent material
derived from plant matter. Activated carbons will be included, with emphasis placed on
such products prepared from cellulosic raw materials. A recent article by Chowdhury et
al. (2013) provides a thorough review and discussion of carbonization and carbon
activation procedures, making it unnecessary to cover those aspects in as great detail in the
present article. This article focuses on progress that has been made in the use of
lignocellulosic materials, as well as its derivative products, for the removal of solubilized
petrochemical products from water.
A subtheme of this article will be the extent to which cellulose-derived products
can act as broad-spectrum absorbents. The earlier review articles in this series also showed
that cellulose-based materials can be effective for the removal of heavy metals, dyes, and
liquid or emulsified oils from water (Hubbe et al. 2011, 2012, 2013). It is notable that
cellulosic products can be effective for the remediation of aqueous spills of oil-like
substances, a capability that is not obvious based on the hydrophilic nature of the sugar
units that make up cellulose. The scope of the third of the listed review articles was
intentionally incomplete, since it did not deal with uptake of the dissolved portions of those
oils. Thus, the present article completes the analysis for petroleum-derived products as a
whole. Also it should be noted that, strictly speaking, the dyes reviewed in Part 2 of the
REVIEW ARTICLE bioresources.com
Hubbe et al. (2014). “Petrochemicals biosorption,” BioResources 9(4), 7782-7925. 7784
series can be considered as petrochemical products. So there will naturally be frequent
references to aspects already covered in Part 2 (Hubbe et al. 2012).
The motivation to seek broad-spectrum absorbency stems from the nature of
pollution. Only seldom does it happen that the material one wishes to remove from water
is highly pure and highly characterized. It is far more common for polluted water to contain
many substances that have not been identified. For instance, it is reasonable to expect that
petrochemical-based compounds in samples of contaminated water may span the ranges
between aliphatic and aromatic, hydrophilic to very sparingly soluble, and nonionic to
highly charged, with huge ranges of molecular mass and volatility. In light of this diversity
of potential sorbates, this review article will begin with consideration of diverse types of
cellulosic materials – as well as transformed products such as torrefied wood and activated
carbons – relative to the uptake of petroleum-based sorbates from water. As will be shown,
while cellulosic biomass in general has a rather broad affinity for a wide range of
petroleum-based substances, the affinity can be increased by various treatments. Also, one
should not rule out the possible use of mixed sorbents, such as combinations of raw and
torrefied biomass or sawdust together with fungal biomass, etc. Subsequent sections of the
article will deal with attributes of common petroleum-derived contaminants that may be
present in water samples, aspects of aqueous composition found to affect sorption,
theoretical aspects, and life cycle issues.
EXPERIMENTAL FINDINGS
Overview Research studies devoted to the removal of petrochemical-based substances from
water by use of cellulose-derived sorbents have been both numerous and diverse, especially
during the most recent decade. Key findings from articles considered in the present review
are listed in Table A, which due to its length is placed in the Appendix. The table lists the
information according to the categories of pollutant, adsorbent (including drying
conditions and treatments), adsorption isotherms that best fit the data, adsorption
capacities, the rate laws that best fit to data, and the main thermodynamic information –
whether adsorption is exothermic or endothermic. Additional information of note appears
in a column headed by “Key Findings”. The headings of the table correspond, in a rough
sense, to the progression of topics in sections that follow. Sorbent Source Materials Though just about every imaginable plant-based material has been studied relative
to its potential use in adsorbing synthetic organic compounds, inspection of the second
column in Table A reveals a preponderance of interest in the use of activated carbon
sorbents. Results of such work will be summarized later in this section. The reason why
activated carbon products receive so much attention can be attributed to a favorable
combination of a hydrophobic nature, a high surface area, and a potentially favorable pore
size distribution that can be changed depending on the conditions of preparation. But, as
will be described, the conditions used in the preparation of activated carbons make such
sorbents inherently more expensive than many other cellulosic materials due to the
significant weight loss, energy usage, and chemical usage, especially in cases where the
REVIEW ARTICLE bioresources.com
Hubbe et al. (2014). “Petrochemicals biosorption,” BioResources 9(4), 7782-7925. 7785
raw material can be obtained as an underutilized byproduct. So, one of the important
questions to consider is whether and when it may make sense to favor the use of different
kinds of sorbent materials.
Wood
Adsorption tests of monoaromatic hydrocarbons onto unmodified softwood chips
have been reported by Mackay and Gschwend (2000). Adsorption kinetics were found to
be favorably affected by lignin content in the wood. But one of the key findings was that
the rate of uptake into the wood was very slow, at least when it is utilized in the form of
chips rather than fibers.
Huang et al. (2006) found that the adsorption characteristics of aspen wood fibers
could be altered by bleaching and hydrolysis. An oxidative bleaching treatment removed
the lignin, rendering the fibers more hydrophilic and more porous. Hydrolysis, with use of
strong acid, mainly removed hemicellulose, thus yielding fibers having a higher aromatic
character and lower polarity. In general, the bleaching treatment decreased the sorption
capacity for phenanthrene and pyrene, whereas the hydrolysis treatment increased
adsorption of both of the sparingly soluble compounds from aqueous solution.
The lignin component of wood is sometimes viewed as a potential sorbent for
sparingly soluble organic pollutants due to its generally hydrophobic character. Lignin’s
capability for biosorption of phenolic substances was evaluated by Allen et al. (2005).
Cuhha et al. (2010) showed that humins, which can be considered to be a product of the
natural decomposition of lignin, can be used to adsorb trihalomethanes. Rodriguez-Cruz
et al. (2007) compared the adsorption capacities for pesticides onto nine types of woods
having a wide range of lignin content. There was a strong correlation between increasing
lignin content and increasing sorption capacity. These results are consistent with the
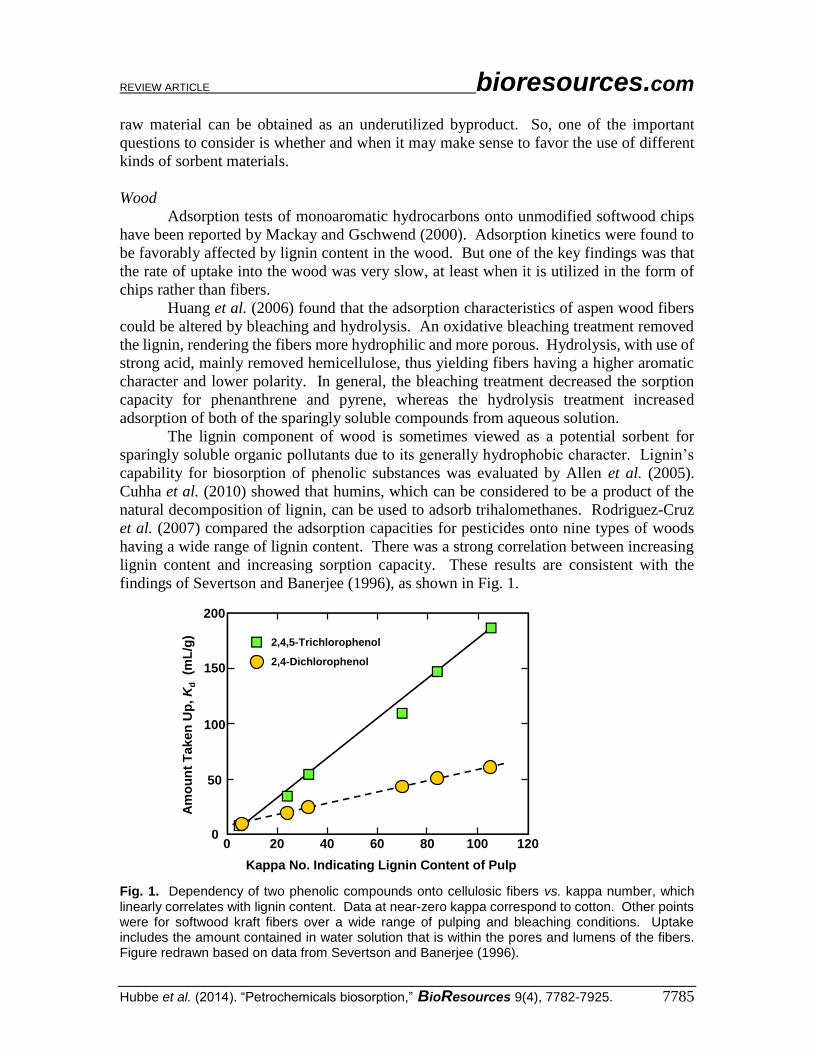
findings of Severtson and Banerjee (1996), as shown in Fig. 1.
Fig. 1. Dependency of two phenolic compounds onto cellulosic fibers vs. kappa number, which linearly correlates with lignin content. Data at near-zero kappa correspond to cotton. Other points were for softwood kraft fibers over a wide range of pulping and bleaching conditions. Uptake includes the amount contained in water solution that is within the pores and lumens of the fibers. Figure redrawn based on data from Severtson and Banerjee (1996).
Am
ou
nt
Tak
en
Up
, K
d(m
L/g
)
200
150
100
50
0
Kappa No. Indicating Lignin Content of Pulp
0 20 40 60 80 100 120
2,4,5-Trichlorophenol
2,4-Dichlorophenol

REVIEW ARTICLE bioresources.com
Hubbe et al. (2014). “Petrochemicals biosorption,” BioResources 9(4), 7782-7925. 7786
Severtson and Banerjee (1996) studied sorption of chlorophenols onto pulped
softwood kraft fibers having different extents of delignification. As indicated in Fig. 1,
very little of the pollutants were adsorbed onto cotton cellulose (data points near to zero
kappa number), whereas there was a very strong correlation between chlorophenol
adsorption and the kappa number of the kraft pulps, the value of which is reflective of the
relative amount of lignin remaining in the fiber.
Bark is another tree-derived material that has been considered as a potential
biosorbent. Kumar and Min (2011a) and Kumar et al. (2012) showed that Acacia
leucocephala bark could be used to remove chlorophenols. Related work with pine bark
was reported by Kumar et al. (2014). Rotala et al. (2003) showed that pine bark can be
used to remove the pesticides lindane and heptachlor from solution. A study by Li et al.
(2010a) showed that pine bark contains substantial amounts of waxy substances, in addition
to polysaccharides and lignin.
Fungal sorbent material
Relative to wood, fungal products have some key attributes that make them
promising candidates for biosorption (Aksu 2005): The material tends to be less dense,
making it reasonable to expect easier accessibility of various molecules into the fine pore
structure. Also, much of the available fungal material is produced as a byproduct of other
processes, such as fermentation, which are carried out at centralized locations. As shown
by Kumar and Min (2011b), fungal biomass may contain significant amounts of nitrogen
in the form of amines and amides; this is attributable to the presence of protein. Various
researchers have evaluated fungal material relative to the uptake of phenols and other
synthetic organic compounds from solution (Young and Banks 1998; Rao and
Viraraghavan 2002; Denizli et al. 2005; Wu and Yu 2006b; Kumar et al. 2009b; Pernyeszi
et al. 2009; Huang et al. 2010; Kumar and Min 2011b; Zhang et al. 2011c; Farkas et al.
2013). Rao and Viraraghavan (2002) found the highest uptake following pretreatment of
Aspergillus niger with sulfuric acid.
Bacterial sorbent material
Ju et al. (1997) compared the adsorption of lindane onto Gram-positive and Gram-
negative bacteria. Seo et al. (1997) explored the use of seeding micro-organisms into a
membrane filtration system, in combination with activated carbon. The inoculated systems
were found to be four times as effective in removing various hard-to-decompose organic
substances from water. Though such studies involving bacteria have been relatively scarce,
they can help contribute to an understanding of activated sludge systems for water
treatment (Bell and Tsezos 1988; Aksu and Yener 1998, 2001; Vrana et al. 1998;
Stringfellow and Alvarez-Cohen 1999; Aksu and Gönen 2004; Arslan and Dursun 2008;
Augulyte et al. 2008; Pan et al. 2010; Yu and Hu 2011; Hai et al. 2012; Julinová and Slavík
2012; Khalaf et al. 2013). Thus, it is likely that biosorption can explain at least part of the
ability of activated sludge-based wastewater treatment systems to remove various sparingly
soluble pollutants from water (Tsezos and Bell 1988, 1989, 1991; Tsezos and Wang 1991).
REVIEW ARTICLE bioresources.com
Hubbe et al. (2014). “Petrochemicals biosorption,” BioResources 9(4), 7782-7925. 7787
Living or dead microbial matter
One key difference between a conventional activated sludge wastewater treatment
system and most studies that have considered use of microbial matter as a biosorbent
concerns whether the cells are alive or dead. Several studies have confronted this issue
directly, using various means to optionally kill the microbes and find out any effects of
such treatment on biosorption (Tsezos and Bell 1989). In some cases the extent of removal
of pollutants from water was about the same, when comparing live vs. dead cells (Yan and
Allen 1994; Johasz et al. 2002; Lei et al 2002; Chen et al. 2010; Ding et al. 2013). There
was evidence in some of the studies that adsorption onto microbial material may tend to
protect the target compounds from enzyme-induced decomposition (Chen et al. 2010). On
the other hand, increased adsorption of petrochemicals after autoclaving of microbial
biomass to kill the cells has been observed in some cases (Wang and Grady 1994; Lang et
al. 2009).
Modification of Sorbent Materials Biomaterials have been modified physically, chemically, and by pyrolysis with an
aim to determine the most suitable processing conditions to enhance adsorption capacities
or other attributes of sorbents.
Drying
As was noted in earlier review articles concerned with biosorption of heavy metal
ions and dyes (Hubbe et al. 2011, 2012), a majority of researchers have begun their
analyses either with pre-dried cellulosic materials or by imposing a controlled drying step,
using an oven (see Table A). Such procedures possibly can be justified in terms of better
storage stability of the dried material. Also, the heat treatment can help to define the
starting condition for testing. But the question of whether or not such drying may affect
adsorption outcomes has been studied less frequently. Choi and Huber (2009) observed
that the sorption of 1-methylcyclopropene from the atmosphere to fruit and vegetable
materials was markedly reduced by drying. In that case, much of the adsorptive capability
was restored when the material was rehydrated by a minute of wetting with distilled water.
But other researchers have documented irreversible losses in the water-absorbing ability of
cellulosic materials when they are dried (Stone and Scallan 1966; Weise 1998). The
phenomenon is often called hornification (Jayme and Büttel 1968). Thus, there is a critical
need for further research, especially in the case of phenolics and other potentially toxic
organic compounds in water adsorbing onto plant material that is either never-dried, dried
by exposure to different heating regimes, or rehydrated under different aqueous conditions
(e.g. temperature, pH, and duration) to determine reversibility of the drying effect.
Grinding of plant material
A great many studies of biosorption begin with the grinding of dried plant-derived
material into a fine powder (Table A). However, in the cited cases the authors generally
did not run control tests to find out whether such grinding will affect biosorption results.
Thus, again, there is a critical need for research in that area. The topic of “particle size”
will be considered later.
REVIEW ARTICLE bioresources.com
Hubbe et al. (2014). “Petrochemicals biosorption,” BioResources 9(4), 7782-7925. 7788
Chemical pretreatments or extraction
Certain studies have shown clear effects on biosorption after treating the plant-
derived sorbent with acids, bases, or various solvents. For instance, Juhasz and Naidu
(2006b) observed very significant increases in uptake of DDT and related pesticide
compounds onto fungal mycelia after treatment with concentrated HCl. Chen et al. (2005)
found that when plant cuticle material was solvent-fractionated into components having
different polarity, such components differed greatly in their ability to take up polar and
nonpolar organic compounds. Li et al. (2010a) showed that relatively severe extraction,
using a Soxhlet device, as well as treatments with strong acid or base, were able to partition
pine bark into components that differed greatly in their ability to adsorb polycyclic
aromatic compounds. El-Sheikh et al. (2013) found surprisingly that washing of olive
wood with various solvents made it more effective as an adsorbent for various phenolics.
Presumably such an effect can be understood as a removal of hydrophobic materials from
pore spaces, thereby making those spaces available for removal other hydrophobic
substances from water. However, the cited observation can be considered surprising
because one might expect that removal of hydrophobic components from lignocellulosic
material would render it more hydrophilic and less oleophilic.
Chemical derivatization and grafting
The adsorptive characteristics of plant-derived materials clearly can be changed by
reactions that place new functional groups on the solid surfaces. Maurin et al. (1999)
treated sawdust with fatty acids and demonstrated increased removal of fats from water.
Vismara et al. (2009) and Sokker et al. (2009) grafted glycidyl methacrylate (GMA) onto
cotton, which in its untreated state was ineffective for adsorption of phenol. The
derivatized cotton, depending on the detailed structure of the functional groups, was highly
effective as an adsorbent. Hsu and Pan (2007) and Hsu et al. (2009) showed that grafting
of methacrylic acid onto rice husk greatly enhanced its ability to take up paraquat.
For high-end applications, such as purification of petrochemical compounds
present in aqueous solution, it has been shown feasible to chemically “imprint” a polymeric
adsorbent, using the target molecule as a template (Shaikh et al. 2012). The cited authors
showed that such a system could be used to bind and enrich an endocrine disruptor
molecule, thus amplifying and simplifying subsequent chromatographic analysis. Such a
concept has potential to be incorporated into a system for biosorption of specific molecules,
using cellulosic materials as a support.
Torrefaction of cellulosic matter
The word torrefaction can be defined as the applications of mild thermal treatment
in the range of about 200 to 300 oC in the partial or complete absence of oxygen (van der
Stelt et al. 2011). Such treatment can significantly change the composition and behavior
of woody material. Torrefaction has been shown to cause chemical changes due to the loss
of volatile components and hemicelluloses. In addition, the changes in lignin structure
(e.g. the amount of non-protonated carbon characterized by solid-state NMR) has been
reported in this temperature range (Park et al. 2013). There has been a lot of attention
directed to the topic of torrefaction in the most recent decade as a promising means to
upgrade the energy-density and burning characteristics of pellets and briquettes (van der
Stelt et al. 2011; Giudicianni et al. 2013; Ibrahim et al. 2013). But some other changes
REVIEW ARTICLE bioresources.com
Hubbe et al. (2014). “Petrochemicals biosorption,” BioResources 9(4), 7782-7925. 7789
brought about by torrefaction of wood suggest potential applications in the adsorption of
oleophilic species from water. For example, various studies have shown that torrefaction
tends to make the treated material more hydrophobic (Ibrahim et al. 2013). Penmetsa and
Steele (2012) took this approach one step further by adding a binder, before torrefaction,
such that the final product was sufficiently hydrophobic to resist moisture when shipped in
open containers. In none of the cited studies was there any attempt to evaluate the uptake
of petrochemicals from water; thus research in this area is critically needed.
Biochars and carbonation
The term “biochars” can denote a broad range of cellulose-derived products that
have been pyrolyzed to various degrees sufficient to cause at least partial carbonation, i.e.
the conversion of polysaccharides and/or lignin to such carbon species as graphite (Reed
and Williams 2004; Anderson et al. 2013; Giudicianni et al. 2013). Rutherford et al. (2012)
found that aliphatic components tended to be lost, leaving behind material enriched in
aromatic content. Various studies have shown that biochars can be used as biosorbents to
remove petrochemicals from water (Edgehill and Lu 1998; Jonkers and Koelmans 2002;
James et al. 2005; Chen and Chen 2008, 2009; Zheng et al. 2010; Kong et al. 2011b; Ni et
al. 2011; Ahmad et al. 2012, 2013; Chen et al. 2012b; Denyes et al. 2012; Mubarik et al.
2012; Das et al. 2013; Hao et al. 2013; Zheng et al. 2013; Mohan et al. 2014). Ahmad et
al. (2012) attributed increased adsorption of trichloroethylene after pyrolysis to a
combination of increased hydrophobicity and surface area. Also, the aromatic character of
the surface tends to be increased (Hao et al. 2013). Karakoyun et al. (2011) showed that
effective biosorption of organic contaminants could be achieved with a composite prepared
from a hydrogel and biochar.
One of the potential advantages of biochars prepared under intermediate thermal
conditions is that there might be a high diversity of surface sites. James et al. (2005) found
that the heterogeneity of surface sites in biochar depends on both the starting material and
the temperature of pyrolysis. Mohan et al. (2014), who reviewed the topic of adsorption
of contaminants onto biochar, noted that such sorbents typically have much higher oxygen,
hydrogen, and ash content in comparison to typical activated carbons. The cited article
showed very wide ranges in the reported adsorption capacities of different biochars for a
range of metal ions; presumably much of the differences might be attributable to
differences in conditions of charring, e.g. temperature, time, and atmosphere. Biochars
also have to potential for lower cost than the available activated carbons, though as Mohan
et al. (2014) point out, such an advantage may slip away as soon as one attempts to upgrade
the material to improve its adsorption capacity or other performance issues.
Biochars have been often suggested as playing a key role in carbon sequestration,
since biochar added to soils can be expected to persist for many decades (Rutherford et al.
2012). But in addition, such biochar can be expected to play a role in binding sparingly
soluble organic contaminants that may be present in the soil (Lou et al. 2011; Deneys et al.
2012; Hao et al. 2013; Li et al. 2013a). One potentially problematic aspect of biochar
addition to soils is the fact that some polycyclic aromatic hydrocarbons (PACs), which can
be considered as pollutants, may come from the biochar itself (Fabbri et al. 2013; Quilliam
et al. 2013). A slow pyrolysis process was recommended by Fabbri et al. (2013) in order
to minimize the level of the PACs that originate from the biomass or from its conversion
into char.

REVIEW ARTICLE bioresources.com
Hubbe et al. (2014). “Petrochemicals biosorption,” BioResources 9(4), 7782-7925. 7790
Activation of carbon
The term “activated carbon” implies a material that has been pyrolyzed under
conditions leading to very high internal surface area. Though substantial quantities of
carbon products are prepared from fossil resources such as coal (Dumanli and Windle
2012), there is increasing interest in preparation of activated carbons from a variety of
biomass sources (Choudhury et al. 2013). In particular, coconut shell is a major source for
the production of activated carbons. Activated carbon products have a complex,
interconnecting pore nanostructure that can be influenced by the treatment conditions. The
subject of activated carbons, including strategies and theories related to their optimization,
has been described in greater detail elsewhere (Dias et al. 2007; Suhas et al. 2007;
Chowdhury et al. 2013). Briefly stated, the production of activated carbons typically
entails treatment at temperatures in the range of 600 to 1200 oC. But mere carbonizing of
the plant-derived material in an oxygen-poor environment generally would not succeed in
production of a high surface area material with a favorable balance between micropores
(less than 2 nm) and mesopores (2 to 50 nm) (Rouquerol et al. 1994). One approach to
achieving such objectives entails adding such reagents as KOH, NaOH, H3PO4, or H2SO4
before the final stage of pyrolysis (see Table A). Another approach is to treat the system
with steam during pyrolysis (see later).
Various studies have shown favorable effects of activation treatments on the uptake
of petrochemicals from aqueous systems. Such studies can be identified in Table A by the
letters “AC” (for “activated carbon”) in the third column. As is evident from many of the
values shown in the 6th column, activated carbons typically exhibit high adsorption
capacities in comparison to most other types of sorbents.
Because of the profoundness of the changes brought about by pyrolysis and
activation, it appears that details of the starting cellulosic material can become unimportant.
For example, Klasson et al. (2010) found no significant differences between activated
carbons prepared from different batches of nut shells. As long as the material was relatively
uniform it was possible to prepare activated carbon of high quality and effectiveness. More
prominent effects related to the source material were reported by Yeganeh et al. (2006),
who compared a much more diverse set of biomass types.
Activating compound
The performance of carbon-based absorbents can be greatly enhanced by treatment
of the carbon with certain chemicals, either initially or before a final activation stage.
Potassium hydroxide is one of the most widely studied activating agents (Wu et al. 2005;
Radhika and Palanivelu 2006; Tan et al. 2008; Kilic et al. 2011; Wu et al. 2011, 2012b;
Kong et al. 2012). Radhika and Palanivelu (2006) found that KOH-activated carbon
outperformed products that they prepared from five other activating systems relative to
sorption of chlorophenol. Wu and Tseng (2006) and Tan et al. (2008) described the action
of KOH as “etching”, a treatment that renders the carbon susceptible to the generation of
pores. The cited authors showed that a combination of KOH activation followed by
pyrolytic treatment with CO2 had a promising effect on phenol sorption. Chen et al.
(2012a) employed the unique approach; instead of adding KOH they selected a biomass
source inherently rich in potassium. After pyrolysis the material had a well-developed
mesoporous structure and exhibited a high ability to adsorb phenol from water.

REVIEW ARTICLE bioresources.com
Hubbe et al. (2014). “Petrochemicals biosorption,” BioResources 9(4), 7782-7925. 7791
Phosphoric acid is another of the most widely reported activating compounds for
preparation of activated carbons (Toles et al. 1997, 1998; Daifullah and Girgis 1998, 2003;
Kennedy et al. 2007; Aber et al. 2009; Anirudhan et al. 2009; Klasson et al. 2009; Bello-
Huitle et al. 2010; Timur et al. 2010; Moreno-Pirajan et al. 2011). Kennedy et al. (2007)
found that a two-stage process, with an initial carbonation stage followed by addition of
the activating agent (H3PO4) and further pyrolysis, yielded a favorable combination of
micropores and mesopores – offering both high sorption capacity and relatively quick
equilibration.
Other activating agents that have been considered to improve the adsorption of
petrochemicals from water include zinc chloride (Mohanty et al. 2005; Nath et al. 2008;
Subha and Namasivayam 2009, 2010; Timur et al. 2010; Aravindhan et al. 2011), carbon
dioxide (Ferro-Garcia et al. 1996; Toles et al. 1997; Teng and Hseih 1999; Wu and Tseng
2006; Hameed et al. 2009; Zhong et al. 2012), sodium hydroxide (Tseng et al. 2010, 2011;
Fierro et al. 2008), potassium carbonate (Mestre et al. 2007; Kilic et al 2011), and nitric
acid (Nabais et al. 2009; Mourão et al. 2011). Sulfuric acid, when used as an activating
agent, has been said to help dehydrate the raw material and to aid in formation of a porous
texture (Cuerda-Correa et al. 2006). Iniesta et al. (2001) reported that sulfuric acid also
can result in lower ash content. Because some of the ash may have a catalytic effect, the
removal of mineral content may affect char reactivity.
Steam activation
Several investigators have reported that steam activation of carbon can be effective
to increase the sorption capacity for hydrophobic organic compounds (Ng et al. 2000;
Juang et al. 2001; Galiatsatou et al. 2002; Vinod and Anirudhan 2002; Tseng et al. 2003;
Reed and Williams 2004; Kumar et al. 2006; Mestre et al. 2007; Klasson et al. 2009, 2010;
Anderson et al. 2013; Bai et al. 2013). Ahmedna et al. (2004) found that steam-activated
carbon outperformed acid-activated carbon for the sorption of chlorination byproducts
from drinking water. Bansode et al. (2003) likewise found that activation with either steam
or CO2 was more effective than other activation systems considered for enhancing the
uptake of volatile organic compounds.
Post-treatments of activated carbons
Various authors have described enhancement procedures for activated carbons that
might be called “post-treatments”. It appears that the general goal of such treatments has
been to modify the nature of surface sites on the material, while attempting to avoid too
much damage to the pore size distribution and surface area attributes achieved in previous
steps. Alvarez et al. (2005) treated activated carbons with ozone and showed evidence of
an increased level of acidic functional groups on the surface. Nevskaia and Guerrero-Ruiz
(2001) showed that post-treatment with nitric acid was another way to increase the content
of oxygen-containing groups at the surface of activated carbon. Qu et al. (2013) showed
that by post-treatment with nitrogen plasma it was possible to reduce the frequency of
oxygen-containing groups in activated carbon, together with a loss of surface area; by
contrast, treatment with an oxygen plasma increased both oxygen content and specific
surface area. Mahajan et al. (1980) had shown earlier that post-treatment with a nitrogen
atmosphere increased the adsorption capacity for phenol. Leng and Pinto (1997)
considered the effects of oxygenation, de-oxygenation, and HCl-washing. Mild oxidation
REVIEW ARTICLE bioresources.com
Hubbe et al. (2014). “Petrochemicals biosorption,” BioResources 9(4), 7782-7925. 7792
showed promise for extending the service life of regenerated activated carbon. Quinlivan
et al. (2005) showed that the surface chemistry of active carbon could be modified by acid
washing, oxidation, hydrogen treatment, or ammonia treatment, and such changes affected
the adsorption of methyl tetra-butyl ether and trichloroethene.
Post-treatment can be used as a way to change the surface composition and make
an activated carbon product more effective for specific applications. Thus, Radovic et al.
(1997) found that an increase in acidic groups on the sorbent surface increased the uptake
of analine, a basic material, whereas an increase in graphene content favored uptake of the
neutral, hydrophobic compound nitrobenzene. Stavropoulos et al. (2008) post-treated
active carbon to introduce acidic or basic properties using partial oxygen gasification, nitric
acid, or urea followed by pyrolysis. The urea treatment resulted in higher nitrogen content
of the sorbent and led to the greatest increase in uptake of phenol. Tessmer et al. (1997)
observed that adsorption of phenolic compounds was favored by carrying out the final
pyrolysis in the absence of oxygen, thus lowering the content of acidic groups at the surface
of the sorbent.
Attributes of Sorbent Materials The goal of this section is to discuss evidence, provided in the literature, to support
the hypothesis that the ability of cellulose-based materials to take up sparingly soluble
synthetic organic materials from water is somehow related to either the physical structure
or the chemical nature of the solid surfaces. Attributes related to physical structure will be
considered first.
Particle size of the cellulose-based sorbent
If one starts with a simple model in which sorbate molecules are envisioned as
adsorbing mainly onto outer surfaces of the sorbent material, then it would follow that
adsorption capacity, or at least the initial rate of uptake, ought to increase with decreasing
particle size. A number of publications that have provided information that permit some
testing of such idealized models will be considered here.
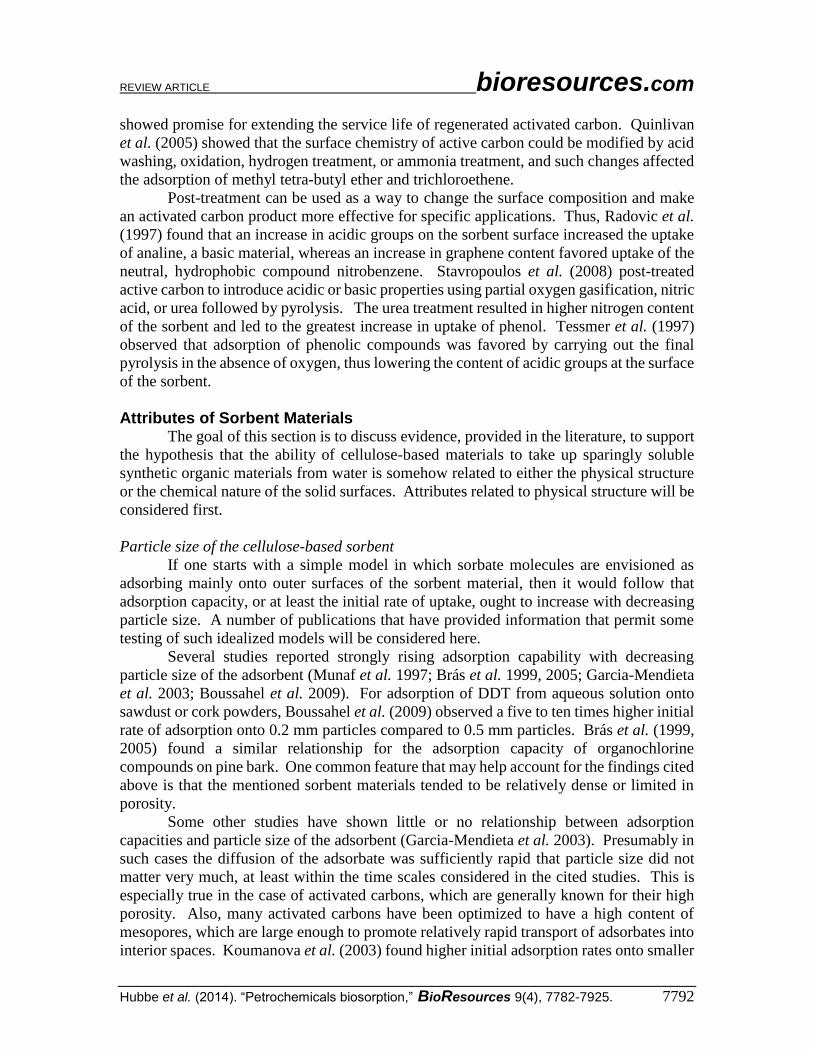
Several studies reported strongly rising adsorption capability with decreasing
particle size of the adsorbent (Munaf et al. 1997; Brás et al. 1999, 2005; Garcia-Mendieta
et al. 2003; Boussahel et al. 2009). For adsorption of DDT from aqueous solution onto
sawdust or cork powders, Boussahel et al. (2009) observed a five to ten times higher initial
rate of adsorption onto 0.2 mm particles compared to 0.5 mm particles. Brás et al. (1999,
2005) found a similar relationship for the adsorption capacity of organochlorine
compounds on pine bark. One common feature that may help account for the findings cited
above is that the mentioned sorbent materials tended to be relatively dense or limited in
porosity.
Some other studies have shown little or no relationship between adsorption
capacities and particle size of the adsorbent (Garcia-Mendieta et al. 2003). Presumably in
such cases the diffusion of the adsorbate was sufficiently rapid that particle size did not
matter very much, at least within the time scales considered in the cited studies. This is
especially true in the case of activated carbons, which are generally known for their high
porosity. Also, many activated carbons have been optimized to have a high content of
mesopores, which are large enough to promote relatively rapid transport of adsorbates into
interior spaces. Koumanova et al. (2003) found higher initial adsorption rates onto smaller
REVIEW ARTICLE bioresources.com
Hubbe et al. (2014). “Petrochemicals biosorption,” BioResources 9(4), 7782-7925. 7793
particles even in the case activated carbon, an effect that might be at least partly attributed
to relatively slow diffusion into the interior of particles. Zheng et al. (2010) found that less
time was required to reach equilibrium adsorption of triazine pesticides onto smaller
particles of biochar. Leyva-Ramos et al. (1999) reported increased adsorption capacity of
smaller activated carbon particles when adsorbing phenol from aqueous solution; no effect
of particle size was found when the adsorption was from cyclohexane solution. Kao et al.
(2000) surprisingly observed higher adsorption capacity for chlorophenols in the case of
larger fly ash particles than smaller particles. This unusual effect was attributed to a
different chemical composition of the bigger particles compared to the smaller ones. The
bigger particles were found to have a higher carbon content, which apparently contributed
to a higher sorption capacity.
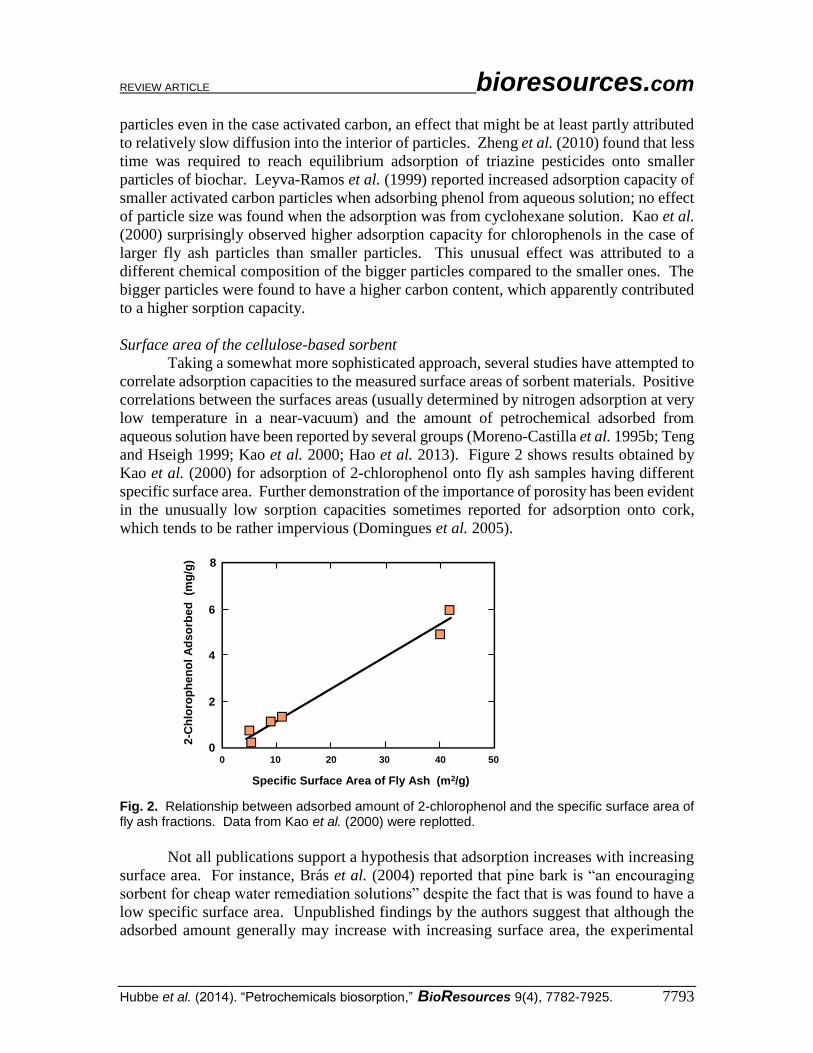
Surface area of the cellulose-based sorbent
Taking a somewhat more sophisticated approach, several studies have attempted to
correlate adsorption capacities to the measured surface areas of sorbent materials. Positive
correlations between the surfaces areas (usually determined by nitrogen adsorption at very
low temperature in a near-vacuum) and the amount of petrochemical adsorbed from
aqueous solution have been reported by several groups (Moreno-Castilla et al. 1995b; Teng
and Hseigh 1999; Kao et al. 2000; Hao et al. 2013). Figure 2 shows results obtained by
Kao et al. (2000) for adsorption of 2-chlorophenol onto fly ash samples having different
specific surface area. Further demonstration of the importance of porosity has been evident
in the unusually low sorption capacities sometimes reported for adsorption onto cork,
which tends to be rather impervious (Domingues et al. 2005).
Fig. 2. Relationship between adsorbed amount of 2-chlorophenol and the specific surface area of fly ash fractions. Data from Kao et al. (2000) were replotted.
Not all publications support a hypothesis that adsorption increases with increasing
surface area. For instance, Brás et al. (2004) reported that pine bark is “an encouraging
sorbent for cheap water remediation solutions” despite the fact that is was found to have a
low specific surface area. Unpublished findings by the authors suggest that although the
adsorbed amount generally may increase with increasing surface area, the experimental
Specific Surface Area of Fly Ash (m2/g)
0 10 20 30 40 50
8
6
4
2
0
2-C
hlo
rop
he
no
l A
ds
orb
ed
(m
g/g
)
REVIEW ARTICLE bioresources.com
Hubbe et al. (2014). “Petrochemicals biosorption,” BioResources 9(4), 7782-7925. 7794
results can be highly dependent on experimental conditions such as the manner of washing
and the flow rate.
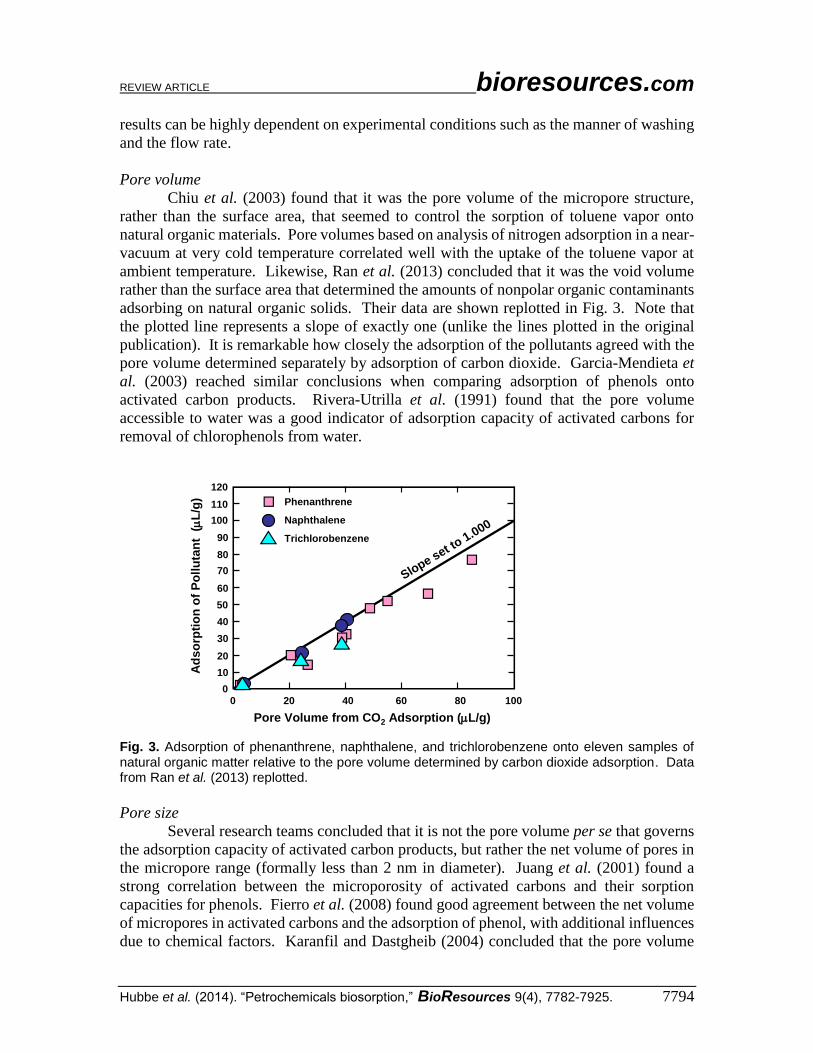
Pore volume
Chiu et al. (2003) found that it was the pore volume of the micropore structure,
rather than the surface area, that seemed to control the sorption of toluene vapor onto
natural organic materials. Pore volumes based on analysis of nitrogen adsorption in a near-
vacuum at very cold temperature correlated well with the uptake of the toluene vapor at
ambient temperature. Likewise, Ran et al. (2013) concluded that it was the void volume
rather than the surface area that determined the amounts of nonpolar organic contaminants
adsorbing on natural organic solids. Their data are shown replotted in Fig. 3. Note that
the plotted line represents a slope of exactly one (unlike the lines plotted in the original
publication). It is remarkable how closely the adsorption of the pollutants agreed with the
pore volume determined separately by adsorption of carbon dioxide. Garcia-Mendieta et
al. (2003) reached similar conclusions when comparing adsorption of phenols onto
activated carbon products. Rivera-Utrilla et al. (1991) found that the pore volume
accessible to water was a good indicator of adsorption capacity of activated carbons for
removal of chlorophenols from water.
Fig. 3. Adsorption of phenanthrene, naphthalene, and trichlorobenzene onto eleven samples of natural organic matter relative to the pore volume determined by carbon dioxide adsorption. Data from Ran et al. (2013) replotted.
Pore size
Several research teams concluded that it is not the pore volume per se that governs
the adsorption capacity of activated carbon products, but rather the net volume of pores in
the micropore range (formally less than 2 nm in diameter). Juang et al. (2001) found a
strong correlation between the microporosity of activated carbons and their sorption
capacities for phenols. Fierro et al. (2008) found good agreement between the net volume
of micropores in activated carbons and the adsorption of phenol, with additional influences
due to chemical factors. Karanfil and Dastgheib (2004) concluded that the pore volume
50
40
30
20
10
0
60
70
80
90
100
110
120
0 20 40 60 80 100
Pore Volume from CO2 Adsorption (L/g)
Ad
so
rpti
on
of
Po
llu
tan
t (
L/g
) Phenanthrene
Naphthalene
Trichlorobenzene
Slope set to 1.000
REVIEW ARTICLE bioresources.com
Hubbe et al. (2014). “Petrochemicals biosorption,” BioResources 9(4), 7782-7925. 7795
associated with micropores governed the capacity of granulated carbon for adsorption of
trichloroethylene from water. Kumagai et al. (2009) reached a similar conclusion for
adsorption of dibenzothiophenes from kerosene onto activated carbons; the mesopores
were regarded by those authors as mainly a way to conduct the sorbate to the smallest
category of pores. Presumably the adsorbate has a strong tendency to completely fill pores
if they are smaller than a critical dimension, whereas adsorbate merely coats the surface of
larger pores.
Pore size distribution
More complex relationships have been reported by investigators who considered
somewhat larger sorbate molecules (Li et al. 2002; Newcombe et al. 2002a; Karanfil et al.
2006; Yang et al. 2006a,b). In principle, for each size of sorbate molecule, there must be
an optimal size of pore that is large enough to accommodate that sorbate with high affinity.
Thus, Hsieh and Teng (2000) proposed that sorbents having a range of pore size will have
a consequent range of adsorption energies, such that smaller pores, still able to
accommodate the sorbate, exhibit higher energies of adsorption. If pores are too small,
then either the adsorption will be unfavored (due to restricted molecular motions) or
impossible (because the sorbate molecule simply does not fit). In consideration of such
factors, Quilivan et al. (2005) proposed an ideal pore size of 1.5 times the kinetic diameter
of the target adsorbate.
Micropores, i.e. those having diameter below 2 nm, often account for the largest
component of surface area in activated carbon products (Urano et al. 1991; Aber et al.
2009). The following studies reported cases in which the finest pores were too small to
accommodate one or more adsorbates (Li et al. 2002; Ali et al. 2012). Furthermore, very
narrow pores are more prone to clogging (Amstaetter et al. 2012). However, in other cases,
the adsorption of the target pollutant was increased by increased microporosity of activated
carbon (Bai et al. 2013). Galiatsatou et al. (2002) found a correlation between
mesoporosity and adsorption of phenols, whereas other sorbates appeared to be mainly
influenced by the extent of microporosity. Ji et al. (2010) found evidence that humic acid
molecules, which are relatively large, may fail to fill micropores in activated carbon; such
exclusion was proposed as a mechanism to account for the non-competition between the
humic acids and tetracycline on graphite and carbon nanotubes. Martín-Gullón and Font
(2001) attributed high removal of pesticide from water to the presence of “low size
mesopores”, i.e. a class of pores that provided a good balance between rapid diffusion and
fairly high surface area.
Caturla et al. (1988) proposed that if the pore size distribution of activated carbon
is sufficiently broad, thus presenting few barriers to adsorption, then the adsorption process
ought to become more influenced by factors such as chemical affinity. Indeed, Seredych
and Bandosz (2011) documented cases in which sulfur-to-sulfur affinity was strong enough
to promote significant adsorption within mesopores in addition to the micropores. Chen et
al. (2005, 2008) proposed that adsorption can be “porosity-selective” within a certain size
range of pores, whereas adsorption can be “polarity-selective” in some other cases. It is
worth noting that the broad pore-size distributions present in many well-designed activated
carbon products are in contrast to the extremely uniform microporosity inherent in zeolite
materials (Rossner et al 2009). Sakoda et al. (1987) argued that a combination of
REVIEW ARTICLE bioresources.com
Hubbe et al. (2014). “Petrochemicals biosorption,” BioResources 9(4), 7782-7925. 7796
microporosity (offering a high surface area) and mesoporosity (offering a shorter diffusion
path and more rapid equilibration) is likely to give the best overall performance.
Sorbent chemical composition
The sorbent’s chemical composition, and in particular the chemistry of the surface,
can be expected to play a major role in determining the ability to bind various species from
solution. For instance it makes sense to expect that cork, which has a chemical composition
quite different from most other plant materials (Olivella et al. 2013), might have a quite
different affinity for hydrocarbons. The suberin component, which is generally understood
to provide the impervious nature of cork, is not found in most other plant materials.
However, in the cited study, the content of aromatic groups in the cork had a bigger
contribution to adsorption of polycyclic aromatic hydrocarbons.
Oxygen content of the surface
Several studies have considered the extent to which the oxygen content of the
surface of cellulose-based sorbents – especially activated carbon products – has an
influence on the uptake of various petrochemical compounds from solution (Franz et al.
2000; Galiatsatou et al. 2002; Alvarez et al. 2005; László et al. 2006; Fierro et al. 2008).
In many such studies, the adsorbed amounts were found to decrease as the oxygen content
of the adsorbent surfaces became higher (Coughlin et al. 1968; Mahajan et al. 1980;
Tessmer et al. 1997; Franz et al. 2000; Nevskaia and Guerrero-Ruiz 2001; Li et al. 2002;
Salame and Bandosz 2003; Dąbrowski et al. 2005; Mestre et al. 2007; Okawa et al. 2007;
Stavropoulos et al. 2008; Blanco-Martínez et al. 2009; Leyva-Ramos et al. 2009b; Kong
et al. 2011a; Sun et al. 2012b; Das et al. 2013; Olivella et al. 2013).
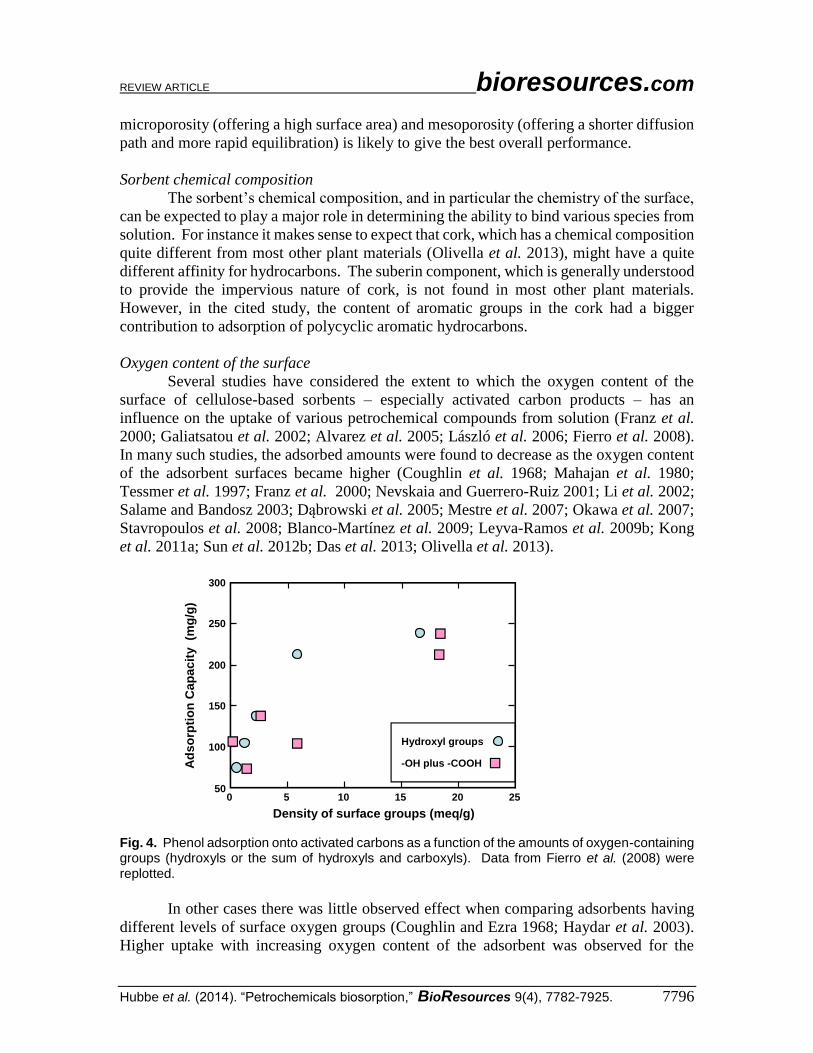
Fig. 4. Phenol adsorption onto activated carbons as a function of the amounts of oxygen-containing groups (hydroxyls or the sum of hydroxyls and carboxyls). Data from Fierro et al. (2008) were replotted.
In other cases there was little observed effect when comparing adsorbents having
different levels of surface oxygen groups (Coughlin and Ezra 1968; Haydar et al. 2003).
Higher uptake with increasing oxygen content of the adsorbent was observed for the
0 5 10 15 20 25
Density of surface groups (meq/g)
300
250
200
150
100
50
Ad
so
rpti
on
Ca
pa
cit
y
(mg
/g)
Hydroxyl groups
-OH plus -COOH
REVIEW ARTICLE bioresources.com
Hubbe et al. (2014). “Petrochemicals biosorption,” BioResources 9(4), 7782-7925. 7797
adsorption of ethanol (Bai et al. 2013), phenol (Leng and Pinto 1997; Podkościelny et al.
2003; Fierro et al. 2008), polyaromatic compounds (Gotovac et al. 2007b), trihalomethanes
(Lu et al. 2005), and fluorinated herbicides (Sun et al. 2011a). Figure 4 shows data from
Fierro et al. (2008), which suggests a positive influence of oxygen-containing groups on
the adsorption of phenol onto activated carbons that had been modified in different ways.
One aspect that needs to be borne in mind, when considering such findings, is that
treatments capable of changing the oxygen content of the surface of activated carbons can
be expected to also affect the surface area and distribution of pore sizes. Thus, Teng and
Hseih (1999) attributed the greater adsorption of phenol onto carbons with higher oxygen
content to the larger surface areas of such adsorbents. Dąbrowski et al. (2005) proposed,
based on their study of the literature, that phenols mainly are bound to oxygen-free sites at
the edges of graphene sheets in the carbonized material.
Nitrogen content of the surface
Stavropoulos et al. (2008) correlated the presence of nitrogen at activated carbon
surfaces with increased affinity for phenol. Likewise, Wu et al. (2012b) prepared activated
carbon with a high nitrogen content and found a high capacity for phenol adsorption. Sun
et al. (2012b) found a positive relationship between N content and adsorption of phthalic
esters; the effects was attributed to the hydrogen bonding capability of the nitrogen-
containing groups. Zhang et al. (2013) found a similar relationship in the case of
phenanthrene. Yaghmaeian et al. (2014) found that activation of carbon in the presence of
NH4Cl yielded more effective uptake of amoxicillin, presumably due to the interaction
between the carboxylate group of the antibiotic and the basic nitrogens ending up on the
activated carbon.
But increased nitrogen content may not be a suitable approach for sorption of more
hydrophobic species. As in the case of oxygen, the presence of nitrogen at the surface of
activated carbon contributes to a hydrophilic character; with this in mind, Li et al. (2002)
suggested that nitrogen content should be kept low when designing activated carbon
products for adsorption of organic contaminants.
Polar character of the absorbent surface
Several authors have postulated that the polar character of sites at the absorbent
surface contribute to adsorption, especially in the case of phenolic adsorbates (Aksu and
Yener 2001; Chen et al. 2005; Akhtar et al. 2006). Other researchers have found higher
adsorption of nonpolar sorbate species when the adsorbent surface was less polar (Huang
et al. 2006; Chen et al. 2008; Olivella et al. 2013; Zhang et al. 2013). Haghseresht et al.
(2002b) proposed that different mechanisms can be important for adsorption when one
compares effects of hydrophilic vs. hydrophobic types of activated carbons.
Though it might be argued the “hydrophobic” is merely another way of saying
“non-polar,” several authors have suggested the content of specific hydrophobic
compounds already present in adsorbents can account for the differing abilities of activated
carbon surfaces to take up various petrochemical compounds (Li et al. 2002; Karanfil and
Dastgheib 2004; Quinlivan et al. 2005; Li et al. 2010a; Hao et al. 2013). Thus, Barbour et
al. (2005) found that lipids, a hydrophobic component of plant tissues, were primarily
responsible for uptake of aromatic organic pollutants from water. Likewise, Boucher et al.
(2007) found that residual oils in press-cake from oilseed processing had a high affinity for
REVIEW ARTICLE bioresources.com
Hubbe et al. (2014). “Petrochemicals biosorption,” BioResources 9(4), 7782-7925. 7798
adsorption of the pesticides carbaryl, atrazine, and parathion. Chen and Li (2007) found
that removal of wax from plant cuticles made them less effective for the adsorption of
naphthol. Lin et al. (2007) found that the adsorption of hydrophobic organic compounds
onto tea leaf powders increased with the content of aliphatic carbons; Sun et al. (2012a)
reached similar conclusions in the case of herbicide adsorption by biochars. Likewise,
Salloum et al. (2002) found that the aliphatic carbons in organic matter were largely
responsible for adsorption of phenanthrene. Chen and Schnoor (2009) found that removal
of the hydrophobic suberin from root tissue rendered the adsorbent material less effective
for phenanthrene. Similarly, Ghosh et al. (2009) found that removal of lipids from
Rhizopus oryzae biomass decreased the ability of the adsorbent to take up lindane. Choi
and Huber (2009) attributed higher adsorption of 1-methylcyclopropene to certain plant
materials to the greater hydrophobicity of lignin. Li et al. (2012) correlated the adsorption
of chlorophenols onto fruit cuticles and potato periderm factions to the content of
hydrophobic components such as waxes and cutin.
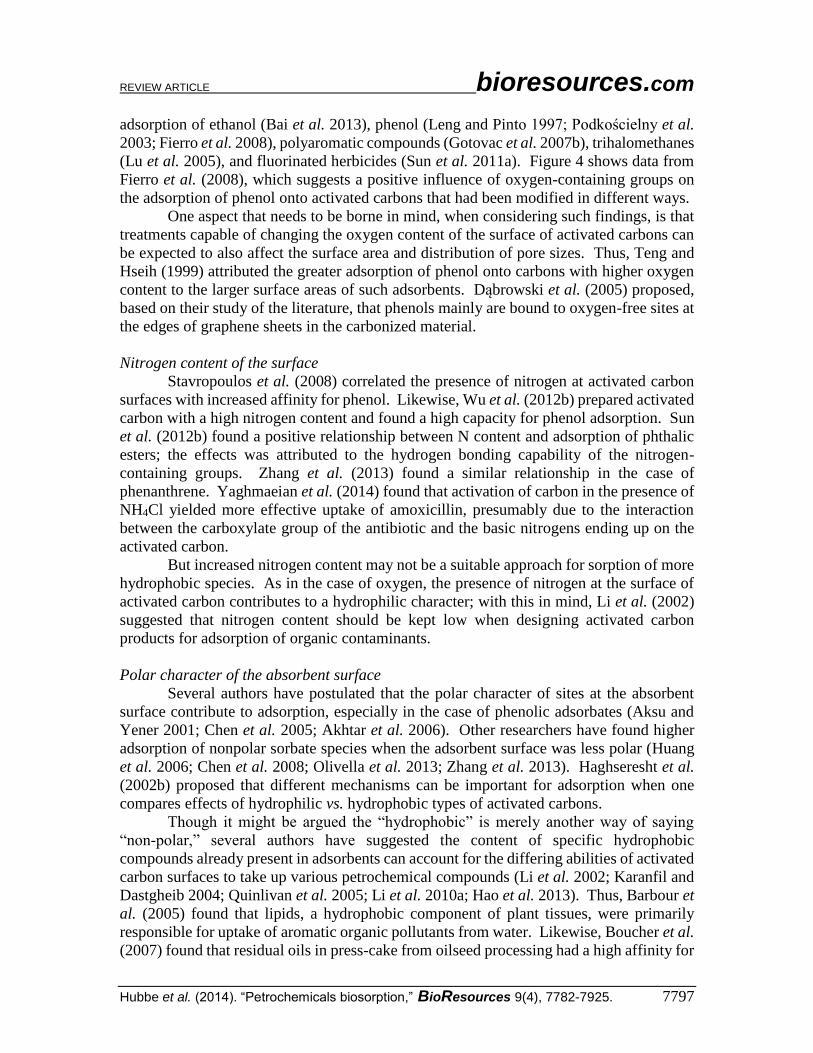
The influence of the polarity of the sorbate material in illustrated in Fig. 5, which
is based on data from Li et al. (2010b). Different fractions of material derived from pine
bark were used to adsorb pyrene and phenanthrene from aqueous solution. The uptake
showed a very high dependency on the ratio of the sum of the nitrogen and oxygen elements
to the amount of carbon element. As shown, each of the target chemicals was adsorbed at
much higher efficiency if the polarity was very low, i.e. as little as possible of nitrogen and
oxygen in the component obtained from pine bark.
Fig. 5. Dependency of adsorption capacity of different extracted components from pine bark on the [O + N]/C ratio (Figure replotted from the data of Li et al. 2010b).
Acid/base character of the absorbent surface
Some of the effects just described, involving relative contents of oxygen and
nitrogen at adsorbent surfaces, might be explained in terms of the acidic or basic character
of the surfaces. That is because oxygen at a carbon-rich surface is often in the form of
carboxylic acids, whereas nitrogen is often present as basic amine groups. The following
studies provided support for the idea that acidic or basic groups on an adsorbent surface
were favorable for adsorption of certain species from solution (Fierro et al. 2008;
Stavropoulos et al. 2008). Similarly, Mattson et al. (1969) used the term “charge-transfer”
Pyrene
Phenanthrene
Re
lati
ve
Va
lue
of
Ad
so
rpti
on
(K
d) 18
15
12
9
6
3
00.6 0.8 1.0 1.2 1.4
Polarity (Elemental Ratio, [O+N]/C)
REVIEW ARTICLE bioresources.com
Hubbe et al. (2014). “Petrochemicals biosorption,” BioResources 9(4), 7782-7925. 7799
to explain the preferential adsorption of adsorbate molecules based on the electron-density
of surface sites. However, given the importance of acidic or basic character in many
branches of technology, it is striking how few studies have emphasized such issues among
those surveyed in the present work.
Diversity of adsorption sites
In view of the fact that most contaminated waters contain a wide variety of
pollutants, there may be a preference for “broad-spectrum” adsorbents having the
capability of removing many contrasting compounds. Heterogeneity of adsorption sites
has been noted as an important attribute (Snoeyink et al. 1969; Podkościelny et al. 2003;
Pan and Xing 2008; Rossner et al. 2009; Sun et al. 2011b). One of the ways in which a
substrate can be heterogeneous can involve ionically charged groups (Müller et al. 1980).
Thus, László et al. (2003, 2006) and Dąbrowski et al. (2005) point out that the charge
heterogeneity of a sorbent, which might be called its amphoteric character, tends to be
greater at intermediate pH values where both amines and carboxylic acids can be present
in their charged forms. Sun et al. (2011b) suggested that hydrothermal biochars may be
superior to thermally-produced biochars in terms of the chemical diversity of the surface
sites. Another aspect of heterogeneity, as described by Hseigh and Teng (2000) and
Rossner et al. (2009), is due to the different sizes of pores, offering capability to take up a
spectrum of different adsorbates having different attributes (see next section).
Attributes of the Sorbate Petrochemical compounds present in water can vary over large ranges with respect
to many attributes, including molecular weight (i.e. molecular size), shape, solubility in
water (or polarity), aromatic character, and ionic charge. Specific functional groups might
also be important in some cases. This section considers published findings that help to
address the hypothesis that such differences in the sorbate can have an important influence
on their removal from aqueous solution by adsorption.
Molecular weight of the adsorbate
The importance of molecular size of the sorbate molecules already was mentioned
in the earlier discussion of findings related to the pore size distributions of adsorbents.
Thus, studies have identified cases in which the dissolved compounds were too large to be
efficiently adsorbed within micropores (Yang et al. 2006a,b; Ali et al. 2012). Correa
(2009) explained similar findings based on kinetics, noting that increasing numbers of
chlorine substituent atoms imply larger size of chlorophenol molecules; the larger
molecules can be expected to exhibit slower rates of diffusion into the fine pore structure
of a cellulose-based adsorbent. As was noted earlier, one can expect there to be an optimum
pore size, estimated to be 1.3 to 1.8 times larger than the kinetic diameter of the sorbate,
which will give the greatest uptake (Li et al. 2002). In principle the free energy of
adsorption will be maximized when there is a suitable balance between such factors as (a)
favorable surface interactions (enthalpy term), and (b) sufficient space for the molecules to
move around (entropy term) (Maginn et al. 1995; Jaroniec and Choma 1997; Adolphs
2007). In other cases the size of a sorbate molecule appears to play an underlying role
relative to its affinity to the adsorbent surface (Nouri et al. 2002a). Higher molecular mass
often implies a greater tendency to adsorb (Haghseresht et al. 2002a; Choi et al. 2003;
REVIEW ARTICLE bioresources.com
Hubbe et al. (2014). “Petrochemicals biosorption,” BioResources 9(4), 7782-7925. 7800
Boving and Zhang 2004; Gao and Wang 2007; Hansen et al. 2010; Julinová and Slavík
2012; Kusmierek et al. 2013). Larger molecules in general would be expected to have
higher free energy of adsorption, per unit molecule.
Molecular shape of the adsorbate molecule
The topic of molecular shape seems to have been considered in only a few cases.
Thus, Karanfil and Dastgheib (2004) found that trichloroethylene molecules were able to
access the interior regions of microporous activated carbons; this ability was attributed to
a flat molecular shape. There was no demonstration, however, of whether different results
would be obtained with a different molecular shape, all things being equal. Likewise,
Jonker and Koelmans (2002) observed preferential adsorption of planar molecules. The
work of Ozdemir et al. (2012) includes a suggestion that maybe some of the observed
differences in adsorption behavior of chlorophenoxy acid derivatives might be related to
the presence or absence of chirality. Such ideas might be the subject of future studies,
especially if the concepts can be backed up by molecular dynamics simulations or other
support. Dargaville et al. (1996) found that ortho-linked oligomers of phenol were
adsorbed more from an ethanol solution than the corresponding para-linked phenol
oligomers. The difference was explainable by the greater ethanol-solubility of the para-
linked compounds. Related findings are discussed in the next section.
Solubility of the sorbate molecules in water
Several studies have found correlations between adsorption capacity and
decreasing water-solubility of the sorbate (Daifullah and Girgis 1998, 2003; Nouri et al.
2002b; Dąbrowski et al. 2005; Wu and Yu 2006a; Aktar et al. 2007a; Hamdaoui and
Naffrechoux 2007a; Thuy et al. 2008; Navarro et al. 2009; Hansen 2010; Zhang et al.
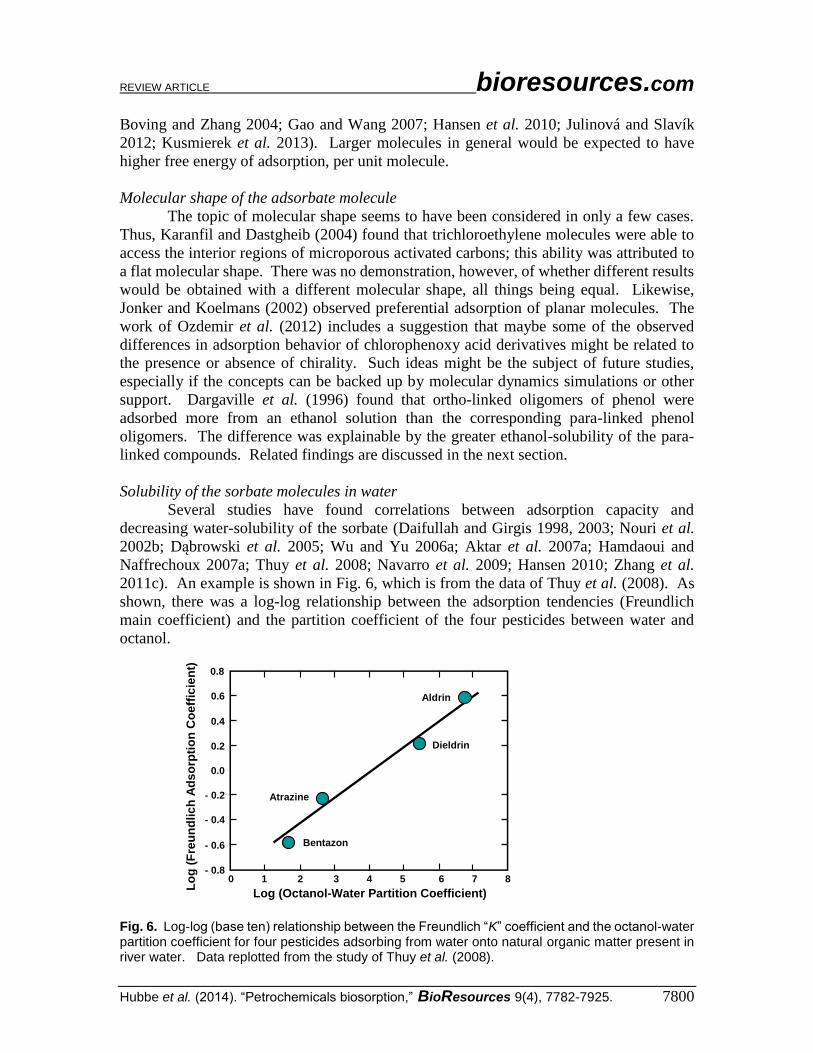
2011c). An example is shown in Fig. 6, which is from the data of Thuy et al. (2008). As
shown, there was a log-log relationship between the adsorption tendencies (Freundlich
main coefficient) and the partition coefficient of the four pesticides between water and
octanol.
Fig. 6. Log-log (base ten) relationship between the Freundlich “K” coefficient and the octanol-water partition coefficient for four pesticides adsorbing from water onto natural organic matter present in river water. Data replotted from the study of Thuy et al. (2008).
0 1 2 3 4 5 6 7 8
0.8
0.6
0.4
0.2
0.0
- 0.2
- 0.4
- 0.6
- 0.8
Log (Octanol-Water Partition Coefficient)
Lo
g (
Fre
un
dlic
hA
ds
orp
tio
n C
oe
ffic
ien
t)
Bentazon
Atrazine
Dieldrin
Aldrin
REVIEW ARTICLE bioresources.com
Hubbe et al. (2014). “Petrochemicals biosorption,” BioResources 9(4), 7782-7925. 7801
Similarly, Boving and Zhang (2004) showed that the rate at which aromatic
hydrocarbons desorbed from aspen wood fibers was proportional to their water-solubility.
Thus, the interaction between the sorbate molecules and water may often play a major role
in determining the degree of success of adsorption as a procedure to remove a contaminant
from water. Whightman and Fein (1999) identified the molecular characteristics governing
the water-solubilities of chlorinated phenols. Findings of increased adsorption with
decreasing water-solubility are sometimes explained in terms of a partitioning of the
sorbate between the solubilized phase and an adsorbed state (Xia and Ball 1999).
Water-solubility does not always predict adsorption of petrochemical compounds
in an expected way. For instance, a study by Yu et al. (2008) was notable with respect to
its contrary finding that adsorption increased with increasing water-solubility of the three
endocrine-disrupting compounds. Vismara et al. (2009) reported that a certain type of
activated carbon, modified by polymer grafting, had high affinity for nitrophenols, which
are somewhat hydrophilic compared to other phenols. The finding was attributed to the
polarity of the polymeric chains grafted onto the adsorbents.
Ionic charge of the adsorbate
The majority of studies represented in Table A were concerned with sorbate species
in their neutral state of charge. However, phenolic compounds are well known to acquire
a negative charge if the pH is raised sufficiently. Thus the pKa values (negative logarithms,
base 10, of the acid dissociation constants) are generally in the pH range from about 6 to
10 (Daifullah and Girgis 1998). In addition, various studies have focused on sorbate
species bearing strongly dissociated functional groups, such that an ionic charge was
expressed over the whole studied range of pH (Yu et al. 2009; Yu and Hu 2011). Yu et al.
(2009) proposed an ion exchange mechanism to account of the adsorption of
perfluorooctane sulfonate and perfluorooctanoate, both of which will be present in
dissociated form to give negatively charged surfactant species. Müller et al. (1980) noted
that the adsorption of weak electrolytes (those that are not fully dissociated) can be
predicted to a large degree by knowing the pH and the pKa values. Li et al. (2012) reported
cases in which increasing ionization of weak acid groups (the phenolic groups) resulted in
less adsorption of chlorophenols. Such results are consistent with the solubility
considerations discussed earlier.
Effects of Aqueous Conditions Having considered the influences of adsorbent properties and adsorbate properties,
it remains to consider the findings of studies that mainly have investigated the effects of
differences in aqueous conditions.
pH of the aqueous solution
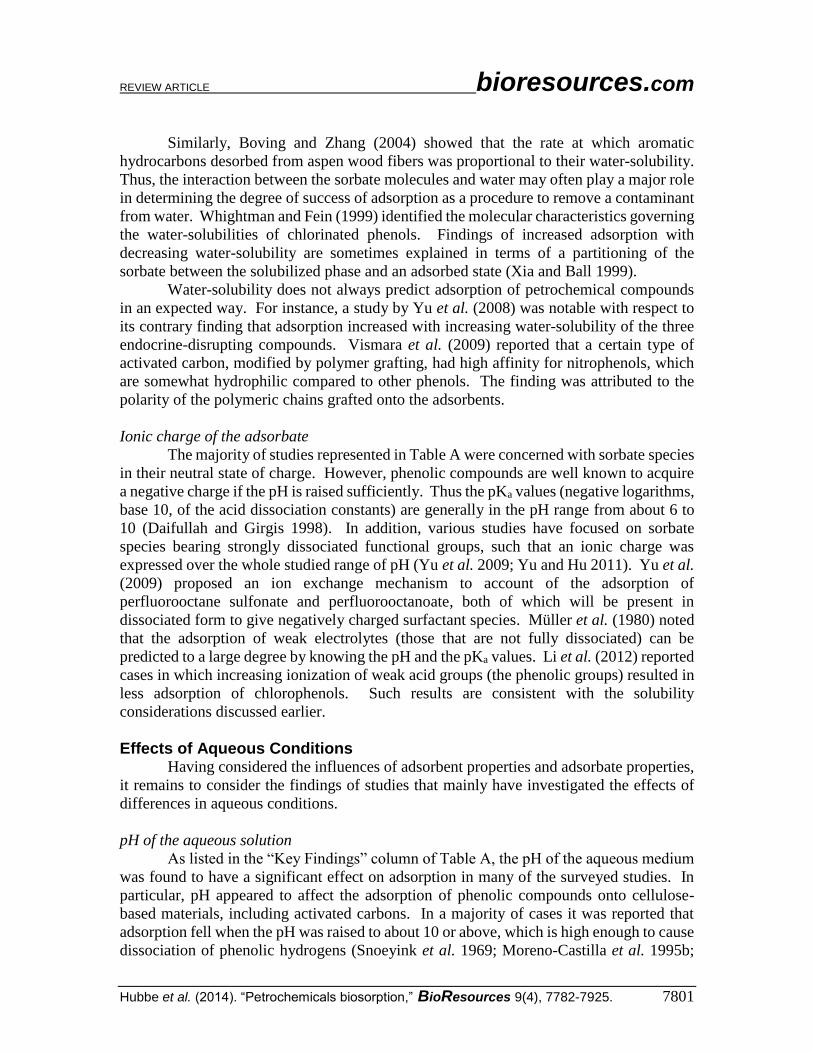
As listed in the “Key Findings” column of Table A, the pH of the aqueous medium
was found to have a significant effect on adsorption in many of the surveyed studies. In
particular, pH appeared to affect the adsorption of phenolic compounds onto cellulose-
based materials, including activated carbons. In a majority of cases it was reported that
adsorption fell when the pH was raised to about 10 or above, which is high enough to cause
dissociation of phenolic hydrogens (Snoeyink et al. 1969; Moreno-Castilla et al. 1995b;
REVIEW ARTICLE bioresources.com
Hubbe et al. (2014). “Petrochemicals biosorption,” BioResources 9(4), 7782-7925. 7802
Severtson and Banerjee 1996; Kao et al. 2000; László and Szucs 2001; Rengaraj et al.
2002a; Lu and Chang 2005; Nouri and Haghseresht 2005; Ayranci and Duman 2006; Diaz-
Flores et al. 2006; Srivastava et al. 2006; Wang 2007a; Blanco-Martínez et al. 2009;
Nabais et al. 2009; Ofomaja and Unuabonah 2011; Rodrigues et al. 2011, 2013; Abdallah
2013). Figure 7, based on data from Severtson and Banerjee (1996), shows typical
behavior. Some studies reported a maximum in adsorption at an intermediate pH (Rao and
Viraraghavan 2002; Ahmaruzzaman and Sharma 2005; Ayranci and Duman 2006; Ncibi
et al. 2006; Thawornchaisit and Pakulanon 2007; Memon et al. 2008; Bayramoglu et al.
2009; Li et al. 2009; Jamil et al. 2011; Rodrigues et al. 2011; Kumar et al. 2012; Ozdemir
et al. 2012; Abdallah 2013; Kumar et al. 2014), though in most of these cases as well, the
adsorption dropped off strongly with further increases in pH.
Fig. 7. Effect of pH on the adsorption of two chlorinated phenols onto softwood fibers having moderately high lignin content (Kappa number 69.8). Data replotted from Severtson and Banerjee (1996).
Other studies reported a general increase in adsorption of phenolic compounds with
decreasing pH (Müller et al. 1985a,b; Shimizu et al. 1992; Jacobsen et al. 1996; Brandt et
al. 1997; Namasivayam and Kavitha 2003; Nouri and Haghseresht 2004; Villacanas et al.
2006; Gao and Wang 2007; Kennedy et al. 2007; Nath et al. 2008; Correa 2009;
Mathialagan and Viraraghavan 2009; Navarro et al. 2009). In yet other cases the best
adsorption of phenolic compounds was observed at strongly acidic pH (Aksu and Yener
2001; Brás et al. 2005; Mohanty et al. 2005; Akhtar et al. 2006; Mestre et al. 2007; Ashour
et al. 2008; Pigatto et al. 2013).
All such results, mentioned so far in this subsection, are consistent with increasing
repulsion between the generally negative ionic charge of cellulose-based surfaces (due
mainly to carboxylic acid groups) and the increasingly negative character of phenols as
they are converted to their phenolate form at very high pH (Severtson and Banerjee 1996;
Dąbrowski et al. 2005; Nabais et al. 2009). Also, as explained by various researchers
(Westall et al. 1985; Wightman and Fein 1999; Moreno-Castilla 2004; Rodrigues et al.
2013), higher pH conditions that cause dissociation of phenolic groups cause such
140
120
100
80
60
40
20
00 2 4 6 8 10 12 14
pH
Ad
so
rpti
on
(K
d,
mL
/g)
2,4,5-trichlorophenol
2,4-dichlorophenol
REVIEW ARTICLE bioresources.com
Hubbe et al. (2014). “Petrochemicals biosorption,” BioResources 9(4), 7782-7925. 7803
compounds to become more soluble in water and therefore less prone to adsorb, regardless
of the nature of the adsorbent.
In rare cases, increasing adsorption of petrochemical compounds with increasing
pH has been reported (Mahvi et al. 2004). Nanseu-Njiki et al. (2010) found that the
adsorption of paraquat on sawdust was highest at high pH. Qu et al. (2008) observed
increasing adsorption of nitrobenzene onto bacterial surfaces with increasing pH. Navarro
et al. (2008) reported maximal adsorption of phenol onto seaweed at pH=10. Notably,
many of these reported findings involved non-rigid, swellable cellulose-based materials.
Thus increasing adsorption of various sparingly soluble materials with increasing pH might
be attributable to a tendency of the biomaterial to swell and become more accessible under
such conditions.
Diverse effects of pH also have been reported relative to biosorption of certain
pesticides. Ju et al. (1997) reported an optimum adsorption of lindane at lower pH onto
bacterial biomass. Sathishkumar et al. (2008) reported maximum adsorption of carbaryl
onto activated carbon at pH 11. Zheng et al. (2010) found that adsorption of two triazine
pesticides on biochar was highest at low pH. However, later work by Zheng et al. (2013)
reported increasing adsorption of the antibiotic sulfamethoxazole onto biochars with
increasing pH.
Ionic strength
The effects of ion concentrations in solution also have been studied. Some
researchers reported a slight increase in adsorption of sparingly soluble petrochemical
compounds onto activated carbons with increasing salt concentration in solution (Moreno-
Castilla 2004; Anirudhan et al. 2009). Other studies have shown a slight decrease in phenol
adsorption with increasing KCl or NaCl (Halhouli et al. 1997; Karahoyun et al. 2011).
Kilduff et al. (1998) reported similar trends in the case of trichloroethylene onto activated
carbon that had been pre-loaded with humic substances. Khan et al. (2010) found that even
large concentrations of salt did not interfere with adsorption of dicholoromethane onto
activated carbons. Likewise, Liu et al. (2009) found that removal of n-alkanes onto
Rhodococcus erythropolis biomass was tolerant of salt conditions corresponding to
seawater. Nanseu-Njiki et al. (2010) found somewhat lower adsorption of paraquat onto
sawdust in the presence of NaCl. Mathialagan and Viraraghavan (2009) found no effect
of salt concentration on the adsorption of pentachlorophenol from aqueous solution onto
fungal biomass. To summarize, as noted already by Jacobsen et al. (1996), the effects of
ionic strength tend to be minor when compared to those of pH, as described in the previous
subsection.
In the case of adsorption of lindane onto bacterial biomass, Ju et al. (1997) found a
strongly positive effect of increasing ionic strength. Newcombe and Drikas (1997)
reported a similar trend for adsorption of natural organic matter onto activated carbon.
Such findings are consistent with screening effects, allowing more charged material to
adsorb in adjacent sites on a sorbent surface (Newcombe and Drikas 1997). According to
a mechanism described by Westall et al. (1985), charged species such as phenolate ions
would be expected to become increasingly compatible with a non-aqueous phase with
increasing salt concentration; however, the mechanism has not be strongly supported by
more recent work.

REVIEW ARTICLE bioresources.com
Hubbe et al. (2014). “Petrochemicals biosorption,” BioResources 9(4), 7782-7925. 7804
Divalent ions appear to promote adsorption of phenolics onto activated carbon in
some cases (Coughlin et al. 1968). Surprisingly, Ni et al. (2011) reported that adsorption
of certain aromatic carboxylate species was insensitive to either Ca2+ or Mg2+.
Oxygen content of the aqueous solution
A number of researchers have found that the adsorption of phenolic compounds
onto cellulose-based sorbents, including activated carbons, can be affected by the
concentration of oxygen in the solution (Nakhla et al. 1992; Abuzaid and Nakhla 1994;
Uranowski et al. 1998). The explanation appears to be that the oxygen can favor an
oligomerization reaction at the sorbent surface (Abuzaid and Nakhla 1994). In related
work, Alvarez et al. (2009) showed that simultaneous ozonization and adsorption of gallic
acid was a promising combined approach to remove it from solution.
Temperature
Effects of system temperature are shown in Table A in the column labeled
“thermodynamics”. A great many studies have included an analysis of whether changes in
the temperature of equilibration would either increase or decrease the adsorption capacity
of cellulose-based materials for various petrochemical compounds. The label “En”, which
stands for endothermic, means that heat was taken up when the adsorbate became attached
to the surface of the adsorbent. The label “Ex”, for exothermic, means that heat was
released during the adsorption event. As can be seen from the tabulated findings, both
endothermic and exothermic behaviors have been widely reported. One complicating
factor is that increased temperature can be expected to increase rates of adsorption, even in
cases where there is minimal effect on the adsorption capacity (Chung et al. 2007). Thus,
there is some possible difficulty in interpretation in cases where it is not clear whether or
not equilibrium conditions of adsorption had been reached.
Agitation
Increased initial rates of uptake of petrochemical species onto adsorbents in the
presence of agitation have been reported in a few cases (Koumanova et al. 2003; Chung et
al. 2007; Jamil et al. 2011). Alam et al. (2007) found the best results for adsorption of 2,4-
dichlorophenol onto activated carbon at an intermediate level of agitation. The fact that so
few cases have shown significant effects due to agitation of adsorbent particles suspension
suggests that factors other than diffusion to the surface of the adsorbent usually play a more
prominent role in affecting adsorption.
Presence of surfactants
Gotovac et al. (2006) reported that the presence of surfactants affected the rate of
adsorption of phenanthrene from ethanol solution onto carbon nanotubes. The sorbent
material had been dispersed either with sodium dodecylsulfate or sodium
dodecylbenzenesulfonate. The fact that the adsorption isotherms for the two systems were
different from each other provides evidence for a strong interaction between the
phenanthrene and the surfactant.
REVIEW ARTICLE bioresources.com
Hubbe et al. (2014). “Petrochemicals biosorption,” BioResources 9(4), 7782-7925. 7805
Other solvent media
Though the focus of this review article is on aqueous media, it can be revealing to
consider results from a few studies involving adsorption of petrochemicals from other fluid
media. Seredych and Bandosz (2010, 2011) studied adsorption of dibenzothiophene and
4,6-dimethyldibenothohphene from simulated diesel fuel onto activated carbon. Results
were found to be consistent with the pore size distribution and the size of the sorbate
molecules. Zazharov et al. (2010) studied adsorption of phenol from mixtures of water
and either dimethylsulfoxide or acetonitrile. Leva-Ramos et al. (1999) compared
adsorption of phenol from aqueous and cyclohexane solutions. Greater adsorption was
found in the case of the aqueous system. In general, one can expect greater solubility of
various petrochemical compounds in non-aqueous media, and this difference may account
for reduced adsorption in most of the reported cases.
Competition for adsorption sites
The topic of competitive adsorption between different petrochemical species will
be considered at this point. In other words, one wants to know whether it makes a
difference whether the aqueous system contains one adsorbate compound or two. Various
articles have set out to answer that question. In many cases it has been reported that the
adsorption of one species tended to inhibit the adsorption of another species (Fritz and
Schluender 1994; Srivastava and Tyagi 1995a; Ha and Vinitnantharat 2000; Haghseresht
et al. 2003; Yang et al. 2006b; Ashour et al. 2008; Li et al. 2010a; Wei and Seo 2010;
Kong et al. 2011b; Yu and Hu 2011; Mubarik et al. 2012; Sulaymon et al. 2013). Li et al.
(2010b) found competitive effects between pyrene and phenol in the case of one type of
activated carbon, but not in the case of a second type of activated carbon. Likewise, Cao
et al. (2009) observed strong competition between atrazine and lead for adsorption onto
activated carbon, but little competition in the case of biochar. Sometimes the competitive
species are already present, due to the source of the adsorbent material (Cabrera et al.
2011). In particular, humic acids and other natural organic matter adsorbed onto biochar
or activated carbon has been shown to compete for adsorption sites with various
petrochemicals that may be present in soils or effluents (Kilduff et al. 1998; Newcombe et
al. 2002b; Quinlivan et al. 2005; Karanfil et al. 2006; Yu et al. 2008; Ji et al. 2010; Li et
al. 2010a; Yu and Hu 2011). In other cases minor or no competitive effects were observed
(Bell and Tsezos 1998; Barbour et al. 2005; Cao et al. 2009; Chen et al. 2010). Certain of
these “no significant competition” cases involved pairs of adsorbates having such different
character (e.g. a metal ion and a petrochemical) such that one can easily expect interaction
with different classes of surface site (Cao et al. 2009). However, in other cases very
different types of sorbate were found to compete with each other for adsorption sites (Kong
et al. 2011b). Chen et al. (2010) explained an instance of non-competition by proposing
that adsorption was governed by partitioning between an aqueous phase and an oleophilic
adsorbed phase having ample capacity.
Some investigators have noted that competition effects can be more pronounced
near the beginning of an isotherm, i.e. when the bulk concentration of the adsorbate is very
low (Yang et al. 2006b). Such behavior implies that a minority of sites may have higher
affinity for the sorbate (Kilduff et al. 1998). As a logical extension, one might expect that
competition would be more evident at relatively high levels of coverage if there is unequal
REVIEW ARTICLE bioresources.com
Hubbe et al. (2014). “Petrochemicals biosorption,” BioResources 9(4), 7782-7925. 7806
affinity for different adsorbates on the less-favorable sites (i.e. the last sites to be filled) on
the adsorbent surface.
Liu and Pinto (1997) noted that, in a sense, all systems involving adsorption from
solution should be considered in terms of competition, since the adsorbate species needs to
compete with the solvent molecules, i.e. the water molecules, for adsorption sites. The
importance of this effect was observed by Miyake (2003), who studied the adsorption of
tricholorethylene from moist air onto activated carbons.
THEORETICAL ASPECTS
The goal of this section is to review what has been published regarding how to
explain various observed adsorption effects in terms of underlying mechanisms and
models. Aspects to be considered can be grouped into the areas of molecular-level and
colloidal forces, equilibrium aspects of adsorption (including isotherms), kinetic aspects of
adsorption, and finally the modeling of semi-continuous “packed bed” systems for removal
of petrochemicals from aqueous solutions using cellulose-derived adsorbents. The present
discussion builds upon progress as described in previous review articles on the topic
(Cookson 1978; Michalak et al. 2013).
Van der Waals Interactions The adsorption of hydrocarbons and aromatic compounds is very profoundly
influenced by van der Waals forces. The London dispersion component of van der Waals
forces results in attraction between all objects in the universe – including both atoms and
larger objects (Liang et al. 2007). The range over which these forces are strong extends to
about a wavelength of light, and as a consequence, such forces can be very important with
respect to interactions between an adsorbate molecule and the adsorbent. Though the
London dispersion component of force does not involve fixed electronic charges or
polarity, it depends very strongly on the polarizability of electrons in the outer shells of the
molecules under consideration (Visser 1972). Thus, somewhat higher London dispersion
forces of attraction can be expected in the case of adsorbate molecules and adsorbents that
have less strongly held electrons, such as those in the iodine or bromine atom or those
associated with aromatic rings. The equations and constants governing such interactions
have been well discussed and tabulated elsewhere (Visser 1972; Bowen and Jener 1995).
Because most of the studies considered in the present work involve adsorbates
having moderate to strong hydrophobic character, and a majority of the studied compounds
were uncharged under the conditions of testing, it is unsurprising that van der Waals forces
have been very often proposed as being a key driving force for adsorption onto cellulose-
derived substrates (Ju et al. 1997; Radobic et al. 1997; Franz et al. 2000; Jung et al. 2001;
Haghseresht et al. 2002b; Juhasz et al. 2002; Nouri et al. 2002b; Villacanas et al. 2006).
In the cited studies it was generally not possible to attribute adsorption to other likely
classes of force, e.g. attraction between opposite charges or hydrogen bonding. One gets a
sense that researchers sometimes have relied on a process of elimination in attributing
adsorption to van der Waals attractions. Indeed, some of the strongest evidence
demonstrating the importance of the London dispersion forces involves systems in which
substantial adsorption was observed in spite of there being repulsion between negative

REVIEW ARTICLE bioresources.com
Hubbe et al. (2014). “Petrochemicals biosorption,” BioResources 9(4), 7782-7925. 7807
ionic charges on both the adsorbent and the adsorbate (Haghseresht et al. 2002b; Villacanas
et al. 2006). Another form of evidence supporting a prominent role of dispersion forces is
the influence of substituent groups on aromatic rings; by affecting the electron density and
polarizability of the aromatic structures, the substituent groups of different
electronegativity can be expected to change the strength of adsorption (Nouri et al. 2002b).
Hydrophobic interactions
The term “hydrophobic interactions” has been widely used to account for cases in
which the hydrophobic parts of molecules in aqueous solution either self-associate or come
out of solution to face towards a hydrophobic solid or air (Widom et al. 2003; Meyer et al.
2006). Thus the term has been used by some researchers to explain aspects of adsorption
of petrochemical compounds onto cellulose-derived adsorbents (Ju et al. 1997; Rubin et
al. 2006; Pan and Xing 2008; Yu et al. 2009; Pan et al. 2010; Hu et al. 2011; Plazinski and
Plazinska 2011; Zhang et al. 2011a,b,c; Kong et al. 2012; Cong et al. 2013; Olivella et al.
2013; Zheng 2013). An important point to bear in mind is that in addition to the London
dispersion forces acting between the hydrophobic entities, probably an even greater
contribution to observed hydrophobic effects is due to hydrogen bonding and other polar
interactions that occur within the aqueous phase. The free energy of the system as a whole
is maximized when the hydrophobic groups either self-associate or become involved in
adsorption, essentially getting out of the way of the groups capable of hydrogen bonding
with each other (Moreno-Castilla 2004). Another important point to bear in mind is that
cellulose itself can display substantial hydrophobic character, depending on circumstances,
due to the self-integration of most of the hydrogen bondable sites (Medronho et al. 2012).
Biochars and activated carbons, due to their greater aromatic nature and lower content of
oxygenated groups, can be substantially hydrophobic in character (Ahmad et al. 2012;
Ibrahim et al. 2013). As noted by Meyer et al. (2006) certain hydrophobic effects can be
amplified and made to appear longer in range if the system contains tiny bubbles of air.
Pi () Bonding
The terms -bonding and -stacking imply that organic compounds arrange
themselves with the aromatic groups in a preferred orientation relative to each other. At
present there does not appear to be a consensus regarding the origin of these forces, and
some researchers have even questioned their existence (Grimme 2008). Three likely
explanations for the appearance of strong affinity between aromatic structures include (a)
the strength of London dispersion forces that may arise due to the delocalization and
polarizability of electrons in aromatic rings, (b) polar interactions between electron-rich
and electron-poor parts of molecules, and (c) the hydrophobic effect, as discussed in the
previous subsection.
The action of -bonding has been used to account for strong adsorption of certain
aromatic species to activated carbons and other aromatic-rich plant-derived adsorbents
(Jung et al. 2001; Haghserest et al. 2002b; Terzyk 2003a,b; Alvarez et al. 2005; Dąbrowski
et al. 2005; Diaz-Flores et al. 2006; Wang et al. 2007a; Nabais et al. 2009; Rodrigues et
al. 2011; Zhang et al. 2011b; Fu et al. 2012a; Zheng et al. 2013; Soni and Padmaja 2014).
Other authors have noticed a similarly high affinity of aromatic compounds for aromatic-
containing adsorbents but have explained the effect differently, stating that the relatively
strong adsorption is due to the fact that flat hydrophobic faces of the “aromatic nuclei” are
REVIEW ARTICLE bioresources.com
Hubbe et al. (2014). “Petrochemicals biosorption,” BioResources 9(4), 7782-7925. 7808
able to interact strongly with adsorbate surfaces (Calace et al. 2002). Certain authors
noticed that electron-withdrawing groups tended to decrease adsorption (Salame and
Bandosz 2003; Moreno-Castilla 2004; Dąbrowski et al. 2005); this effect was attributed to
a decreased electron density in the system, thus decreasing the polarizability of the
electrons. Likewise, Diaz-Flores (2006) proposed that the presence of basic sites on the
adsorbent made - interactions stronger for the adsorption of pentachlorophenol onto
activated carbons. Qu et al. (2008) observed strong adsorption between 1,3-dinitrobenzene
and bacterial surfaces and proposed that an acid-base interaction is involved (see later)
between deprotonated oxygen of carboxyl groups with the electrons of 1,3-
dinitrobenzene.
The most serious objection that has been raised relative to the face-to-face -
stacking model for adsorption of aromatic compounds to activated carbons (Sinnokrot et
al. 2002) appears to be that of Haghseresht et al. (2002a). These authors proposed that the
model aromatic compounds that they studied tended to adsorb by their edges, i.e. in a “T”
arrangement. For electrostatic reasons the aromatic rings may stack themselves in an off-
set arrangement, so that the electron-rich regions in the interior of aromatic rings can be
adjacent to electron poor hydrogens on neighboring aromatic rings. Also, work has shown
that effects very similar – and sometimes stronger – than interaction between adjacent
aromatic compounds can be achieved by analogous molecular structures having very
similar architecture, but lacking aromaticity (Bloom and Wheeler 2011). In summary, one
needs to be quite skeptical of any claims that adsorption of aromatic compounds onto
activated carbon or other adsorbents is conclusively attributable to -bonding or -
stacking. More research is needed in order to resolve questions regarding use of the -
bonding concepts and their possible replacement with other approaches to interpret
adsorption phenomena.
Hydrogen Bonding It is well known that hydrogen bonds can form in systems where hydrogen is
covalently bonded to oxygen, or to a lesser extent to other relatively electronegative atoms
such as nitrogen (Jeffrey 1997; Maréchal 2007). Because of the unfair sharing of electrons
between the hydrogen and its electronegative partner, the hydrogen takes on part of the
character of a bare proton. This unusual circumstance gives rise to hydrogen bond
formation between such protons and the lone pairs of electrons on neighboring oxygens in
the system. Considering the bonds within cellulose as an example, a typical hydrogen bond
has an energy of about 19 kJ/mole (about 4 to 5% the energy of a covalent bond between
O and H), a distance that can be 2 to 2.5 times the length of a corresponding covalent bond
between O and H (Li et al. 2011), and an average lifetime of only about 250 picoseconds
under ordinary ambient conditions (Belashchenko et al. 2014).
As was briefly suggested in an earlier paragraph dealing with hydrophobic bonding,
the most important contributions of hydrogen bonding to the adsorption of substantially
oxygen-free compounds onto cellulose-derived substrates may be indirect. That is, the
extensive hydrogen bonding within the aqueous phase provides a thermodynamic driving
force encouraging the exclusion of molecules or molecular segments that lack hydrogen
bonding ability. The high cohesive energy within an aqueous phase (2.30 kJ/cm3) is
considerably larger than that of a typical organic solvent such as heptane (0.23 kJ/cm3) or
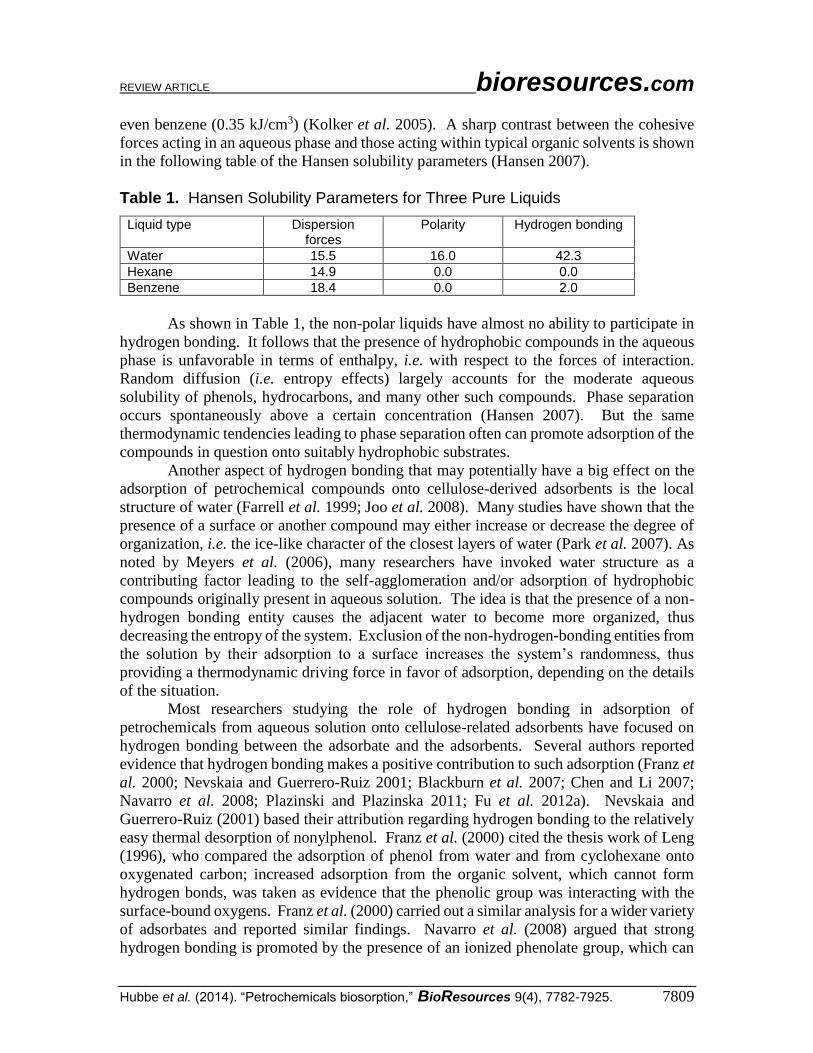
REVIEW ARTICLE bioresources.com
Hubbe et al. (2014). “Petrochemicals biosorption,” BioResources 9(4), 7782-7925. 7809
even benzene (0.35 kJ/cm3) (Kolker et al. 2005). A sharp contrast between the cohesive
forces acting in an aqueous phase and those acting within typical organic solvents is shown
in the following table of the Hansen solubility parameters (Hansen 2007).
Table 1. Hansen Solubility Parameters for Three Pure Liquids
Liquid type Dispersion forces
Polarity Hydrogen bonding
Water 15.5 16.0 42.3
Hexane 14.9 0.0 0.0
Benzene 18.4 0.0 2.0
As shown in Table 1, the non-polar liquids have almost no ability to participate in
hydrogen bonding. It follows that the presence of hydrophobic compounds in the aqueous
phase is unfavorable in terms of enthalpy, i.e. with respect to the forces of interaction.
Random diffusion (i.e. entropy effects) largely accounts for the moderate aqueous
solubility of phenols, hydrocarbons, and many other such compounds. Phase separation
occurs spontaneously above a certain concentration (Hansen 2007). But the same
thermodynamic tendencies leading to phase separation often can promote adsorption of the
compounds in question onto suitably hydrophobic substrates.
Another aspect of hydrogen bonding that may potentially have a big effect on the
adsorption of petrochemical compounds onto cellulose-derived adsorbents is the local
structure of water (Farrell et al. 1999; Joo et al. 2008). Many studies have shown that the
presence of a surface or another compound may either increase or decrease the degree of
organization, i.e. the ice-like character of the closest layers of water (Park et al. 2007). As
noted by Meyers et al. (2006), many researchers have invoked water structure as a
contributing factor leading to the self-agglomeration and/or adsorption of hydrophobic
compounds originally present in aqueous solution. The idea is that the presence of a non-
hydrogen bonding entity causes the adjacent water to become more organized, thus
decreasing the entropy of the system. Exclusion of the non-hydrogen-bonding entities from
the solution by their adsorption to a surface increases the system’s randomness, thus
providing a thermodynamic driving force in favor of adsorption, depending on the details
of the situation.
Most researchers studying the role of hydrogen bonding in adsorption of
petrochemicals from aqueous solution onto cellulose-related adsorbents have focused on
hydrogen bonding between the adsorbate and the adsorbents. Several authors reported
evidence that hydrogen bonding makes a positive contribution to such adsorption (Franz et
al. 2000; Nevskaia and Guerrero-Ruiz 2001; Blackburn et al. 2007; Chen and Li 2007;
Navarro et al. 2008; Plazinski and Plazinska 2011; Fu et al. 2012a). Nevskaia and
Guerrero-Ruiz (2001) based their attribution regarding hydrogen bonding to the relatively
easy thermal desorption of nonylphenol. Franz et al. (2000) cited the thesis work of Leng
(1996), who compared the adsorption of phenol from water and from cyclohexane onto
oxygenated carbon; increased adsorption from the organic solvent, which cannot form
hydrogen bonds, was taken as evidence that the phenolic group was interacting with the
surface-bound oxygens. Franz et al. (2000) carried out a similar analysis for a wider variety
of adsorbates and reported similar findings. Navarro et al. (2008) argued that strong
hydrogen bonding is promoted by the presence of an ionized phenolate group, which can
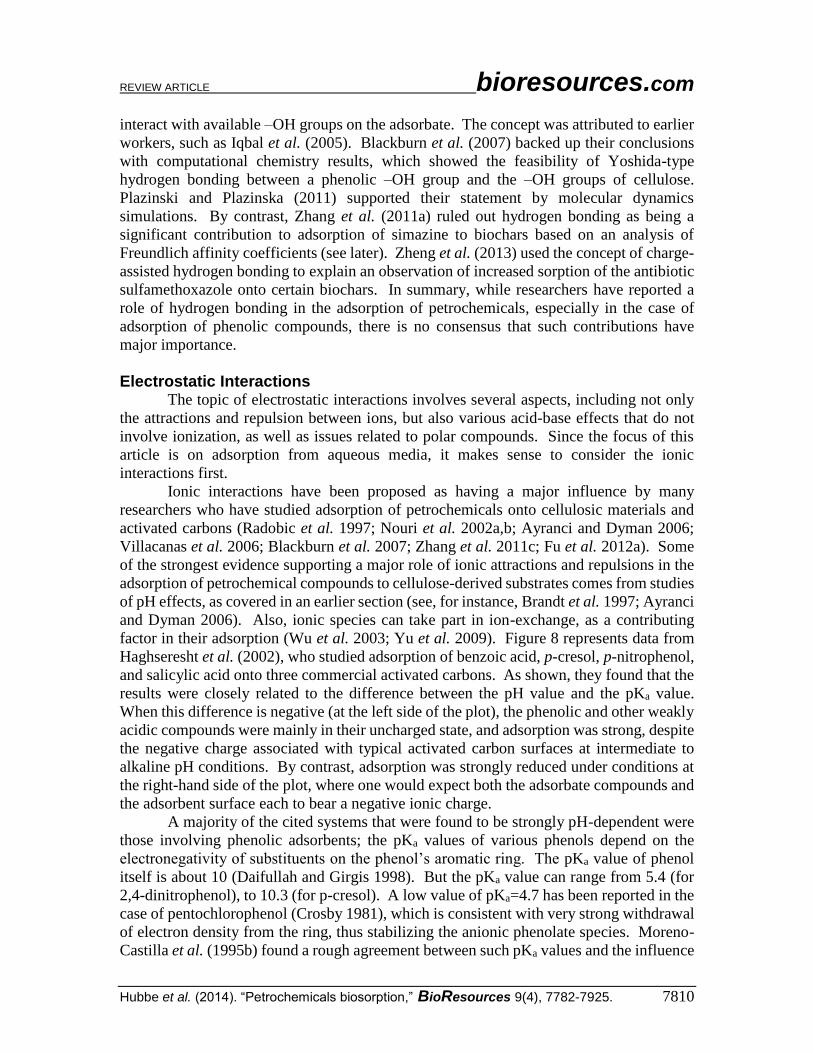
REVIEW ARTICLE bioresources.com
Hubbe et al. (2014). “Petrochemicals biosorption,” BioResources 9(4), 7782-7925. 7810
interact with available –OH groups on the adsorbate. The concept was attributed to earlier
workers, such as Iqbal et al. (2005). Blackburn et al. (2007) backed up their conclusions
with computational chemistry results, which showed the feasibility of Yoshida-type
hydrogen bonding between a phenolic –OH group and the –OH groups of cellulose.
Plazinski and Plazinska (2011) supported their statement by molecular dynamics
simulations. By contrast, Zhang et al. (2011a) ruled out hydrogen bonding as being a
significant contribution to adsorption of simazine to biochars based on an analysis of
Freundlich affinity coefficients (see later). Zheng et al. (2013) used the concept of charge-
assisted hydrogen bonding to explain an observation of increased sorption of the antibiotic
sulfamethoxazole onto certain biochars. In summary, while researchers have reported a
role of hydrogen bonding in the adsorption of petrochemicals, especially in the case of
adsorption of phenolic compounds, there is no consensus that such contributions have
major importance.
Electrostatic Interactions The topic of electrostatic interactions involves several aspects, including not only
the attractions and repulsion between ions, but also various acid-base effects that do not
involve ionization, as well as issues related to polar compounds. Since the focus of this
article is on adsorption from aqueous media, it makes sense to consider the ionic
interactions first.
Ionic interactions have been proposed as having a major influence by many
researchers who have studied adsorption of petrochemicals onto cellulosic materials and
activated carbons (Radobic et al. 1997; Nouri et al. 2002a,b; Ayranci and Dyman 2006;
Villacanas et al. 2006; Blackburn et al. 2007; Zhang et al. 2011c; Fu et al. 2012a). Some
of the strongest evidence supporting a major role of ionic attractions and repulsions in the
adsorption of petrochemical compounds to cellulose-derived substrates comes from studies
of pH effects, as covered in an earlier section (see, for instance, Brandt et al. 1997; Ayranci
and Dyman 2006). Also, ionic species can take part in ion-exchange, as a contributing
factor in their adsorption (Wu et al. 2003; Yu et al. 2009). Figure 8 represents data from
Haghseresht et al. (2002), who studied adsorption of benzoic acid, p-cresol, p-nitrophenol,
and salicylic acid onto three commercial activated carbons. As shown, they found that the
results were closely related to the difference between the pH value and the pKa value.
When this difference is negative (at the left side of the plot), the phenolic and other weakly
acidic compounds were mainly in their uncharged state, and adsorption was strong, despite
the negative charge associated with typical activated carbon surfaces at intermediate to
alkaline pH conditions. By contrast, adsorption was strongly reduced under conditions at
the right-hand side of the plot, where one would expect both the adsorbate compounds and
the adsorbent surface each to bear a negative ionic charge.
A majority of the cited systems that were found to be strongly pH-dependent were
those involving phenolic adsorbents; the pKa values of various phenols depend on the
electronegativity of substituents on the phenol’s aromatic ring. The pKa value of phenol
itself is about 10 (Daifullah and Girgis 1998). But the pKa value can range from 5.4 (for
2,4-dinitrophenol), to 10.3 (for p-cresol). A low value of pKa=4.7 has been reported in the
case of pentochlorophenol (Crosby 1981), which is consistent with very strong withdrawal
of electron density from the ring, thus stabilizing the anionic phenolate species. Moreno-
Castilla et al. (1995b) found a rough agreement between such pKa values and the influence
REVIEW ARTICLE bioresources.com
Hubbe et al. (2014). “Petrochemicals biosorption,” BioResources 9(4), 7782-7925. 7811
of pH on the adsorption of two phenols. However, there is a critical need for research that
compares a series of different phenols onto a specified adsorbent over a range of pH values.
In principle, adsorption would be expected to fall off under conditions in which the phenols
in question spend a high fraction of their time in a negatively charged ionic state, giving
rise to electrostatic repulsion with anionic carboxylate groups present on typical cellulose-
derived adsorbents, including activated carbon products.
Fig. 8. Dependency of adsorption capacity on the difference between pH and the pKa value of selected weakly acidic compounds having a single aromatic ring. The three symbols correspond to three different commercial activated carbons.
Acid-Base Interactions Even in cases where surfaces are not ionized, there still can be important
electrostatic contributions to molecular interaction due to Lewis acidity and basicity. The
subject of Lewis acids and bases, including explanations of how this type of interaction
differs from Brønsted acidity and basicity, has been well described elsewhere (House
2013). While ionic species, i.e. Brønsted acids and bases, are often dominant in aqueous
systems, Lewis acidity and basicity can express themselves in non-aqueous environments.
The petrochemicals considered in this review article include many quite hydrophobic
compounds, and typical activated carbon products are hydrophobic too. It is reasonable to
expect, in such cases, that the adsorbing hydrophobic species might force water molecules
away from the interface with the adsorbent, creating a local non-aqueous environment.
As noted in review papers by Shen (2009) and Gamelas (2013), lignocellulosic
materials typically contain both acidic and basic Lewis sites at their surfaces. Ahmad et
al. (2013) noted that the surfaces of activated carbons tend to be dominated by acidic
groups after preparation at relatively low temperatures, whereas basic Lewis sites often
predominate in carbons pyrolyzed at relatively high temperatures. Strong correlations have
been found between Lewis basicity and the content of –C=O groups, which are able to
contribute electron density (Shen et al. 1998). Furthermore, the Lewis acidic or basic
surface character of activated carbon can be affected by post-treatment (Dąbrowski et al.
2005).
Several groups of researchers have proposed that acidic or basic sites play a role in
the adsorption of various petrochemical compounds either on lignocellulosic materials or
pH – pKa Difference
Qm
ax
(m
ol/
m2)
-10 -8 -6 -4 -2 0 2 4 6 8 10
2.5
2.0
1.5
1.0
0.5
0.0
REVIEW ARTICLE bioresources.com
Hubbe et al. (2014). “Petrochemicals biosorption,” BioResources 9(4), 7782-7925. 7812
on their pyrolyzed forms (Tessmer et al. 1997; Daifullah and Girgis 2003; Terzyk 2003b;
Diaz-Flores et al. 2006; Hu et al. 2011; Fu et al. 2012a; Ahmad et al. 2013). According to
Dąbrowski et al. (2005), the greater the ratio of acid to basic groups, the lower will be the
adsorption of phenol. Franz et al. (2009) concluded that donor-acceptor interactions were
not significant in their study of adsorption of various aromatic compounds onto activated
carbon. If fact, in none of the studies just cited was there undisputable evidence that it was
the Lewis form of acidity or basicity, rather than consequent ionization of the surface, that
affected adsorption.
Solubility Concepts Relative to Adsorption Another way to attempt to account for different types of contribution to adsorption
phenomena is by considering the mutual solubility of the adsorbate in the adsorbent
material. Such an approach has become widely applied in order to predict whether a given
polymer will dissolve in a given solvent system (Hildebrand 1936; Hansen 2007;
Rosenholm 2010). The concept also has been used to predict wetting and adhesion
phenomena (Good 1992). To apply a solubility approach to predicting whether or not a
given adsorbent will have strong affinity for a given adsorbate surface, one compares
certain aspects of each of them, such as the Hildebrand parameter (defined as the square-
root of the cohesive energy density) and the tendency of both the adsorbate and adsorbent
to form hydrogen bonds. A mis-match regarding either of these factors implies less
compatibility. Browne and Cohen (1990) showed that the Hildebrand solubility parameter
could be used to compare the solubilities of different sorbates, therefore helping to explain
the relative tendencies of chloroform and trichloroethylene to adsorb onto activated carbon.
One situation in which a solubility approach appears to be especially appropriate is
when the substrate contains a portion of solvent-like compounds such as waxes or residual
oils (Lin et al. 2007; Li and Chen 2009). Also, solubility considerations such as the
partitioning of adsorbate between two phases have been applied when the adsorbate is a
soft, swellable material, such as fruit cuticles (Li and Chen 2009) or never-dried fungal
biomass (Chen et al. 2010, 2011). In some cases the adsorbate may actually become bound
to solubilized polymers that are released from a substrate (Choi et al. 2003). Alternatively,
it was found that derivatizing the surface of sawdust with fatty acid chains was beneficial
for the removal of oleic acid and olive oil from water (Maurin et al. 1999); the cited study
provides a clear example of how chemical similarity between the adsorbent’s surface and
the adsorbate can promote sorption.
Abe et al. (1985) carried out a unique analysis in which they considered the
contributions of individual types of atoms toward adsorption of pollutants onto activated
carbon. Carbon, bromine, and chlorine atoms on the adsorbent surfaces were found to have
a positive effect on adsorption, whereas oxygen atoms negatively affected adsorption, and
hydrogen atoms had little influence. As noted earlier, Seredych and Bandosz (2011) found
evidence that sulfur atoms on both the adsorbent and adsorbate can promote adsorption.
Free Energy Change on Adsorption In principle, by summing all of the interactive force contributions, it should be
possible to predict the free energy of adsorption. Polanyi proposed that such an energy
term could be used to predict adsorption outcomes (Manes and Hofer 1969). The cited
authors used this approach and concluded that findings from gas-phase adsorption can be
REVIEW ARTICLE bioresources.com
Hubbe et al. (2014). “Petrochemicals biosorption,” BioResources 9(4), 7782-7925. 7813
used to predict adsorption from various solvents. Various other researchers have employed
aspects of the Polanyi adsorption theory to understand adsorption of petrochemicals onto
cellulose-derived adsorbents (Greenbank and Manes 1981; Aytekin 1991). Xia and Ball
(1999) found close agreement between their data for adsorption of nine nonpolar
compounds onto loam soil; they concluded from such evidence that adsorption involved
filling of micropores, which was one of the theoretical predictions (see later). Yang et al.
(2006a) likewise found good agreement with the Polanyi theory when studying adsorption
of polycyclic aromatic hydrocarbons on various carbon-based adsorbents. Though not
much research of this type has been reported, the approach appears well suited for
confirmation by molecular dynamics simulation studies (Terzyk et al. 2010; Plazinski and
Plazinska 2011). Advances in computing power and simulation programs offer the
possibility in future studies of achieving greater quantification of interactive forces, while
also taking into account the many possible conformations of adsorbed molecules.
Adsorption Isotherms The term “adsorption isotherm” refers to the portrayal of adsorption data obtained
under quasi-equilibrium conditions. Either equations or their graphical representation are
used in an isotherm to describe the relationship between the amount adsorbed and the
concentration in an adjacent bulk solution. As the subject of adsorption isotherms was
covered earlier in great detail (Hubbe et al. 2011), the main focus here will be on just the
adsorption of petrochemicals onto cellulose-derived adsorbents. Readers who are
particularly interested in the mathematical forms of various isotherms may refer to the
earlier document. An attempt also will be made in this section to draw connections between
the fitting of data to certain types of isotherms vs. what is likely to be happening at the
molecular and nano-scale levels.
Langmuir isotherm
As can be seen from the fifth column of Table A (see Appendix), the Langmuir
isotherm (Langmuir 1918) has been successfully used by many research groups to
represent equilibrium amounts of various petrochemical compounds on various cellulose-
related substrates. As was noted earlier (Hubbe et al. 2011), the Langmuir equations can
be expressed in nonlinear and linearized forms as follows,
e
e
o
ebC
bCQq
1 (1)
Ce/ qe = 1/ Qob + Ce/ Qo (2)
where qe (mg/g) is the amount of adsorbed compound, and Ce (mg/L) is the corresponding
concentration in the solution at equilibrium. The quantity b (L/mg) is a measure of the
affinity of binding sites for the adsorbate, and Qo (mg/g) is the adsorption capacity, based
on a model in which each adsorbate molecule can fill one site and where there are no
interactions between molecules adsorbing at adjacent sites.
From several perspectives it can be argued that the Langmuir model provides a
superior approach for judging the suitability and performance of different adsorbents for
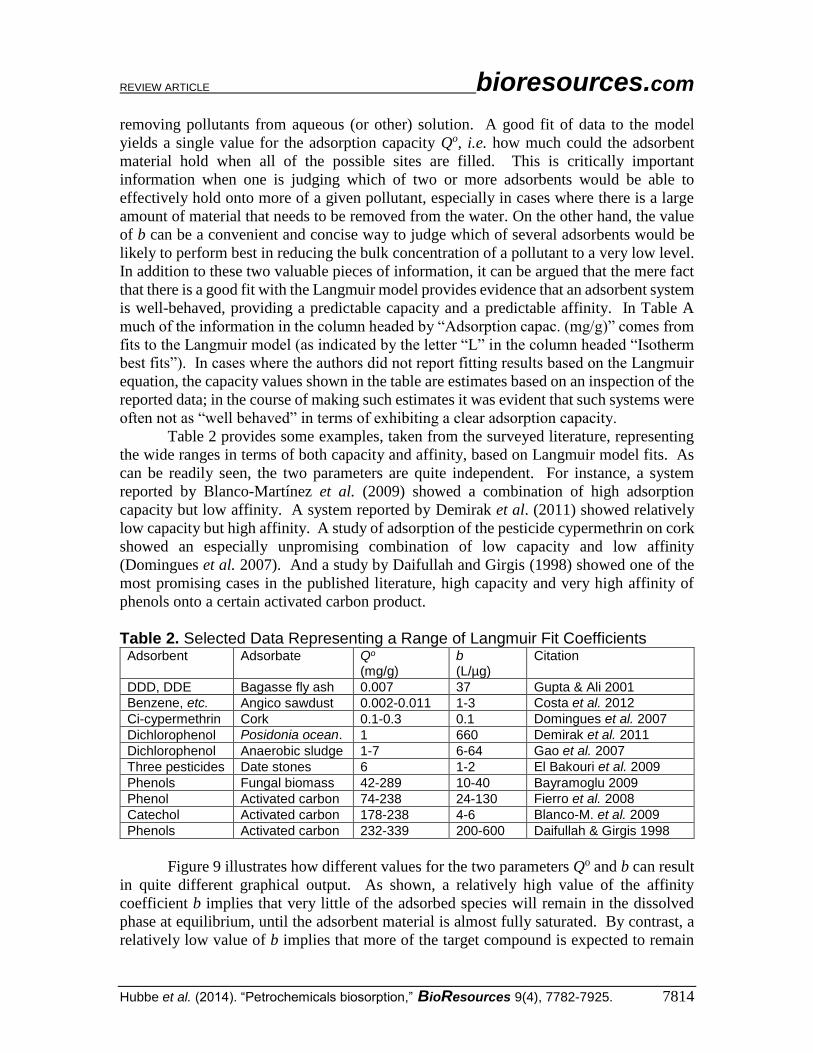
REVIEW ARTICLE bioresources.com
Hubbe et al. (2014). “Petrochemicals biosorption,” BioResources 9(4), 7782-7925. 7814
removing pollutants from aqueous (or other) solution. A good fit of data to the model
yields a single value for the adsorption capacity Qo, i.e. how much could the adsorbent
material hold when all of the possible sites are filled. This is critically important
information when one is judging which of two or more adsorbents would be able to
effectively hold onto more of a given pollutant, especially in cases where there is a large
amount of material that needs to be removed from the water. On the other hand, the value
of b can be a convenient and concise way to judge which of several adsorbents would be
likely to perform best in reducing the bulk concentration of a pollutant to a very low level.
In addition to these two valuable pieces of information, it can be argued that the mere fact
that there is a good fit with the Langmuir model provides evidence that an adsorbent system
is well-behaved, providing a predictable capacity and a predictable affinity. In Table A
much of the information in the column headed by “Adsorption capac. (mg/g)” comes from
fits to the Langmuir model (as indicated by the letter “L” in the column headed “Isotherm
best fits”). In cases where the authors did not report fitting results based on the Langmuir
equation, the capacity values shown in the table are estimates based on an inspection of the
reported data; in the course of making such estimates it was evident that such systems were
often not as “well behaved” in terms of exhibiting a clear adsorption capacity.
Table 2 provides some examples, taken from the surveyed literature, representing
the wide ranges in terms of both capacity and affinity, based on Langmuir model fits. As
can be readily seen, the two parameters are quite independent. For instance, a system
reported by Blanco-Martínez et al. (2009) showed a combination of high adsorption
capacity but low affinity. A system reported by Demirak et al. (2011) showed relatively
low capacity but high affinity. A study of adsorption of the pesticide cypermethrin on cork
showed an especially unpromising combination of low capacity and low affinity
(Domingues et al. 2007). And a study by Daifullah and Girgis (1998) showed one of the
most promising cases in the published literature, high capacity and very high affinity of
phenols onto a certain activated carbon product.
Table 2. Selected Data Representing a Range of Langmuir Fit Coefficients Adsorbent Adsorbate Qo
(mg/g) b (L/µg)
Citation
DDD, DDE Bagasse fly ash 0.007 37 Gupta & Ali 2001
Benzene, etc. Angico sawdust 0.002-0.011 1-3 Costa et al. 2012
Ci-cypermethrin Cork 0.1-0.3 0.1 Domingues et al. 2007
Dichlorophenol Posidonia ocean. 1 660 Demirak et al. 2011
Dichlorophenol Anaerobic sludge 1-7 6-64 Gao et al. 2007
Three pesticides Date stones 6 1-2 El Bakouri et al. 2009
Phenols Fungal biomass 42-289 10-40 Bayramoglu 2009
Phenol Activated carbon 74-238 24-130 Fierro et al. 2008
Catechol Activated carbon 178-238 4-6 Blanco-M. et al. 2009
Phenols Activated carbon 232-339 200-600 Daifullah & Girgis 1998
Figure 9 illustrates how different values for the two parameters Qo and b can result
in quite different graphical output. As shown, a relatively high value of the affinity
coefficient b implies that very little of the adsorbed species will remain in the dissolved
phase at equilibrium, until the adsorbent material is almost fully saturated. By contrast, a
relatively low value of b implies that more of the target compound is expected to remain
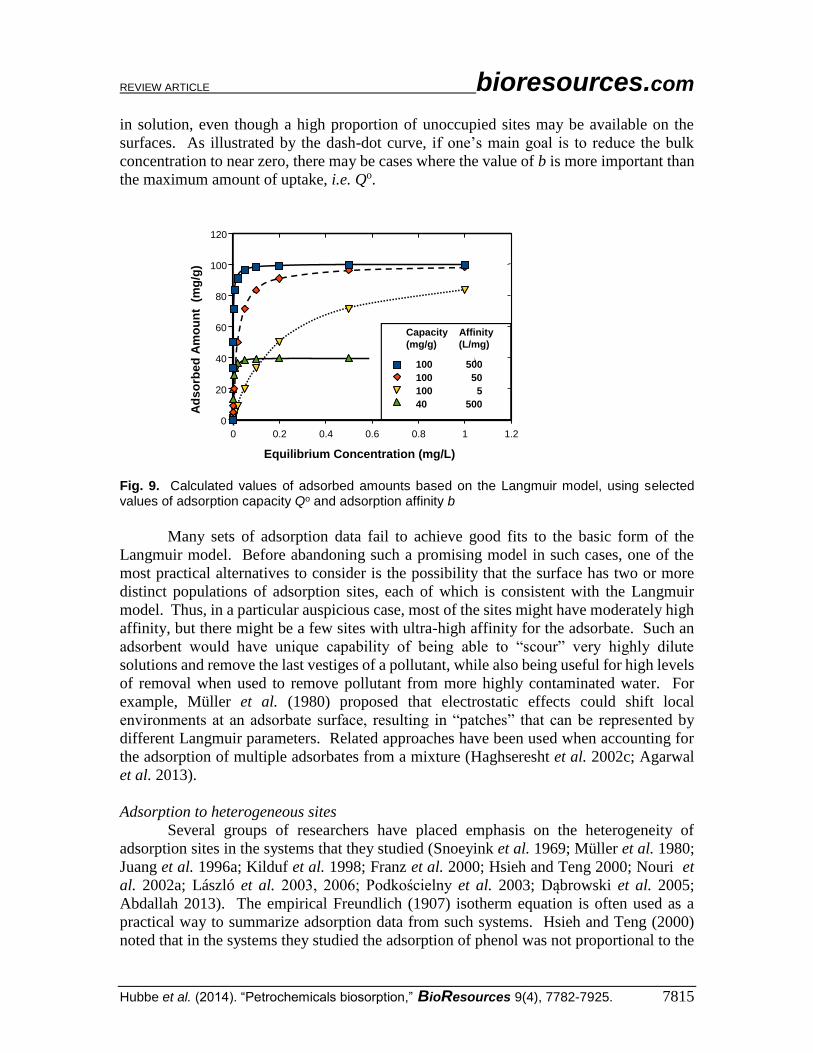
REVIEW ARTICLE bioresources.com
Hubbe et al. (2014). “Petrochemicals biosorption,” BioResources 9(4), 7782-7925. 7815
in solution, even though a high proportion of unoccupied sites may be available on the
surfaces. As illustrated by the dash-dot curve, if one’s main goal is to reduce the bulk
concentration to near zero, there may be cases where the value of b is more important than
the maximum amount of uptake, i.e. Qo.
Fig. 9. Calculated values of adsorbed amounts based on the Langmuir model, using selected values of adsorption capacity Qo and adsorption affinity b
Many sets of adsorption data fail to achieve good fits to the basic form of the
Langmuir model. Before abandoning such a promising model in such cases, one of the
most practical alternatives to consider is the possibility that the surface has two or more
distinct populations of adsorption sites, each of which is consistent with the Langmuir
model. Thus, in a particular auspicious case, most of the sites might have moderately high
affinity, but there might be a few sites with ultra-high affinity for the adsorbate. Such an
adsorbent would have unique capability of being able to “scour” very highly dilute
solutions and remove the last vestiges of a pollutant, while also being useful for high levels
of removal when used to remove pollutant from more highly contaminated water. For
example, Müller et al. (1980) proposed that electrostatic effects could shift local
environments at an adsorbate surface, resulting in “patches” that can be represented by
different Langmuir parameters. Related approaches have been used when accounting for
the adsorption of multiple adsorbates from a mixture (Haghseresht et al. 2002c; Agarwal
et al. 2013).
Adsorption to heterogeneous sites
Several groups of researchers have placed emphasis on the heterogeneity of
adsorption sites in the systems that they studied (Snoeyink et al. 1969; Müller et al. 1980;
Juang et al. 1996a; Kilduf et al. 1998; Franz et al. 2000; Hsieh and Teng 2000; Nouri et
al. 2002a; László et al. 2003, 2006; Podkościelny et al. 2003; Dąbrowski et al. 2005;
Abdallah 2013). The empirical Freundlich (1907) isotherm equation is often used as a
practical way to summarize adsorption data from such systems. Hsieh and Teng (2000)
noted that in the systems they studied the adsorption of phenol was not proportional to the
0 0.2 0.4 0.6 0.8 1 1.2
0
20
40
60
80
100
120
Ad
so
rbe
d A
mo
un
t (
mg
/g)
Equilibrium Concentration (mg/L)
Capacity Affinity
(mg/g) (L/mg)
100 500
100 50
100 5
40 500
REVIEW ARTICLE bioresources.com
Hubbe et al. (2014). “Petrochemicals biosorption,” BioResources 9(4), 7782-7925. 7816
determined surface areas of different activated carbons, and they therefore concluded from
this observation that the adsorption sites must be heterogeneous. Dąbrowski et al. (2005)
argued that both chemical and geometrical factors can account for differences in affinity
of an adsorbate for different locations on an adsorbent. Rossner et al. (2009) proposed that
some cases in which adsorbents exhibit heterogeneity in adsorption affinity are due to a
distribution of pore sizes, with higher affinity associated with the smaller pores. It seems
likely that locations within very fine pores can be favored because the tight concave
curvature of the solid allows more of the solid surface to be exposed to an individual
molecule of adsorbate (Farrell et al. 1999).
Figure 10 provides an example where fits to the Freundlich equation appear to show
an important shift in the nature of adsorption phenomena as the temperature of biochar
formation is increased (Zhang et al. 2011a). Note that increasing charring temperature
changed not only the overall levels of adsorption, but also the slopes of the best-fit lines
were changed. Such a shift is consistent with the enrichment of aromatic and hydrophobic
surface groups, which offer strong affinity to the simazine pesticide even at very low levels
of adsorbed amounts. By contrast, higher slopes were found for samples that had been
subjected to lower temperatures of treatment. Such results are consistent with a lower
affinity between the pesticide and the surface-bound groups at the lower level of charring.
Thus, in those cases there would be a greater importance of self-association of the pesticide
molecules with each other as a contributing factor leading to their adsorption.
Fig. 10. Freundlich plot of adsorbed amounts of simazine pesticide on biochars prepared from corn straw at various oxygen-limited temperatures. Data replotted from Zhang et al. (2011a)
Other isotherm models
A wide range of other equations, some empirical and some based on theoretical
models, have been used to account for data that do not fit well to the Langmuir model.
Some examples are cited in Table 3, which also lists some of the purported advantages or
implications of such models. The arrangement of the rows places models that are most
similar to the Langmuir model near to the top. Towards the bottom of the table one finds
models used to fit data in cases where adsorption did not seem to be related to a definable
population of surface sites.
10,000
1000
100
10
1
0.1
Ad
so
rbe
d m
as
s
(g
/g)
Equilibrium concentration (mg/L)
0.0001 0.001 0.01 0.1 1.0 10
c
600 oC
500 oC
400 oC
300 oC
200 oC
100 oC
Charring
temperature
REVIEW ARTICLE bioresources.com
Hubbe et al. (2014). “Petrochemicals biosorption,” BioResources 9(4), 7782-7925. 7817
Table 3. Selected Examples Where Isotherms Models Other than Langmuir Were Used to Account for Adsorption of Petrochemicals onto Cellulose-derived Adsorbents
Model and its Attributes
Citation
Redlich-Peterson. A heterogeneity factor is used together with an approach that is otherwise similar to the Langmuir model. The results converge to the Langmuir equation as the factor approaches unity. The equation is basically a combination of the Langmuir and the Freundlich equations.
Redlich & Peterson 1959; Aksu and Yener 2001; Ahmaruzzaman & Sharma 2005
Temkin isotherm. The heat of adsorption is assumed to decrease linearly with filling of adsorption sites. This implies that there is mutual repulsion between adsorbed molecules and similar dissolved molecules approaching adjacent adsorption sites.
Temkin 1941; Hamdaoui & Naffrechoux 2007a,b; Ahmad et al. 2013
Dubinin-Astakknov. The cited authors show that this equation has advantages over the ordinary Langmuir equation to account for adsorption of phenols on activated carbons.
Stoeckli et al. 2001
Fowler-Guggenheim. The heat of adsorption is assumed to be varying in a linear manner with increasing adsorption. The model is consistent with lateral interaction between adsorbate molecules, which can be either attractive or repulsive.
Fowler & Guggenheim 1939; Hamdaoui & Naffrechoux 2007a
Hill-de Boer. Adsorbate molecules are assumed to be able to move, and the adsorption sites are assumed to have a range of adsorption energies. Lateral interaction among the adsorbed molecules can be positive or negative.
Hill 1946; de Boer 1953; Hamdaoui & Naffrechoux 2007a
Kiselev. Adsorption is assumed to take place as localized monomolecular layers.
Kiselev 1958.
Dubinin-Radushkevich. The model assumes that adsorption is dominated by the filling of pores, with a strongly increasing energy of adsorption with decreasing width of slit-like pores.
Dubinin 1975, 1989; Cal et al. 1994; Ahmad et al. 2013
Elovich. The rate of filling unoccupied sites of adsorption is assumed to decrease according to an exponential relationship during the process of adsorption.
Aharoni & Tompkins 1970; Tseng & Juang 2003; Hamdaoui & Naffrechoux 2007a
Brunauer, Emmet, and Teller. This model is widely used for determination of surface areas of solids by adsorption of very cold nitrogen or argon gases, under the assumption of a detectable transition from monolayer to multi-layer adsorption.
Brunauer et al. 1938; Rao & Viraraghavan 2002
Low affinity adsorption
The scientific literature in general has been shown to reflect a bias in favor of the
reporting of successful results (Fanelli 2012). Thus, even when authors report especially
low adsorption capacities and feeble affinity, words such as “successfully adsorbed” often
appear in the concluding statements. Given this state of affairs, the discerning reader needs
to adopt a strategic approach, looking for clues that might reveal inherent problems with
certain combinations of adsorbate and adsorbent. Some such clues, which were noted
during the current search of the literature, are summarized in Table 4.
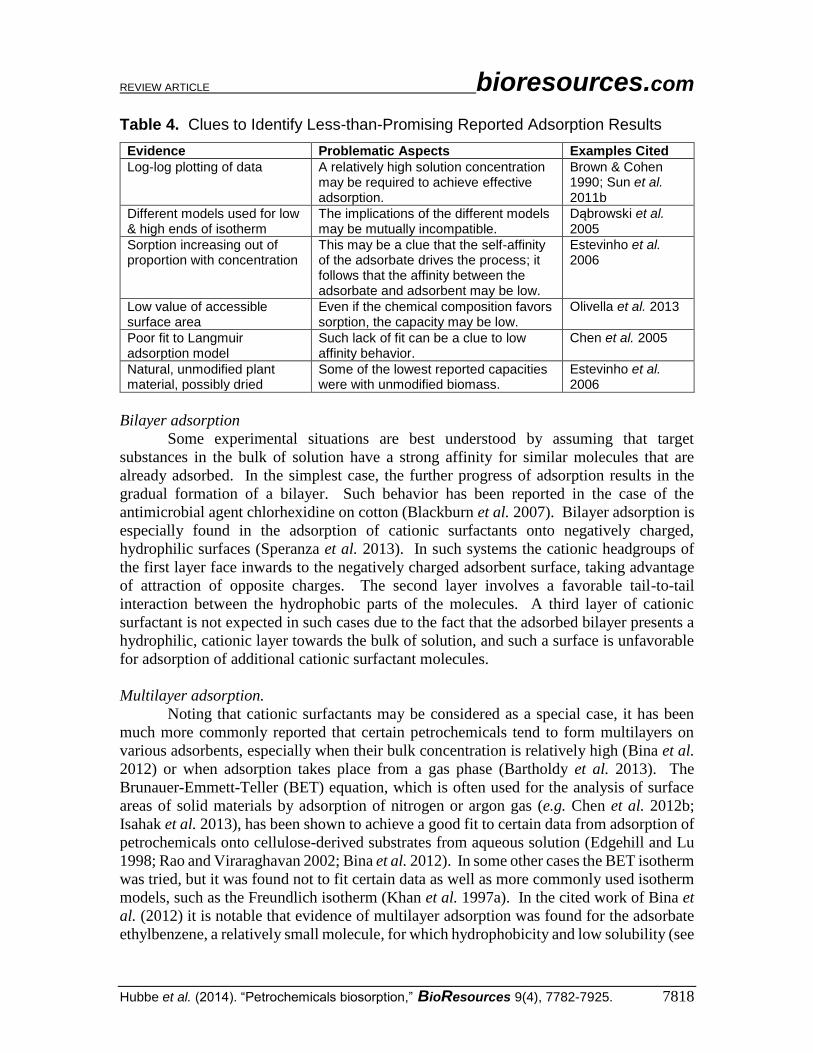
REVIEW ARTICLE bioresources.com
Hubbe et al. (2014). “Petrochemicals biosorption,” BioResources 9(4), 7782-7925. 7818
Table 4. Clues to Identify Less-than-Promising Reported Adsorption Results
Evidence Problematic Aspects Examples Cited
Log-log plotting of data A relatively high solution concentration may be required to achieve effective adsorption.
Brown & Cohen 1990; Sun et al. 2011b
Different models used for low & high ends of isotherm
The implications of the different models may be mutually incompatible.
Dąbrowski et al. 2005
Sorption increasing out of proportion with concentration
This may be a clue that the self-affinity of the adsorbate drives the process; it follows that the affinity between the adsorbate and adsorbent may be low.
Estevinho et al. 2006
Low value of accessible surface area
Even if the chemical composition favors sorption, the capacity may be low.
Olivella et al. 2013
Poor fit to Langmuir adsorption model
Such lack of fit can be a clue to low affinity behavior.
Chen et al. 2005
Natural, unmodified plant material, possibly dried
Some of the lowest reported capacities were with unmodified biomass.
Estevinho et al. 2006
Bilayer adsorption
Some experimental situations are best understood by assuming that target
substances in the bulk of solution have a strong affinity for similar molecules that are
already adsorbed. In the simplest case, the further progress of adsorption results in the
gradual formation of a bilayer. Such behavior has been reported in the case of the
antimicrobial agent chlorhexidine on cotton (Blackburn et al. 2007). Bilayer adsorption is
especially found in the adsorption of cationic surfactants onto negatively charged,
hydrophilic surfaces (Speranza et al. 2013). In such systems the cationic headgroups of
the first layer face inwards to the negatively charged adsorbent surface, taking advantage
of attraction of opposite charges. The second layer involves a favorable tail-to-tail
interaction between the hydrophobic parts of the molecules. A third layer of cationic
surfactant is not expected in such cases due to the fact that the adsorbed bilayer presents a
hydrophilic, cationic layer towards the bulk of solution, and such a surface is unfavorable
for adsorption of additional cationic surfactant molecules.
Multilayer adsorption.
Noting that cationic surfactants may be considered as a special case, it has been
much more commonly reported that certain petrochemicals tend to form multilayers on
various adsorbents, especially when their bulk concentration is relatively high (Bina et al.
2012) or when adsorption takes place from a gas phase (Bartholdy et al. 2013). The
Brunauer-Emmett-Teller (BET) equation, which is often used for the analysis of surface
areas of solid materials by adsorption of nitrogen or argon gas (e.g. Chen et al. 2012b;
Isahak et al. 2013), has been shown to achieve a good fit to certain data from adsorption of
petrochemicals onto cellulose-derived substrates from aqueous solution (Edgehill and Lu
1998; Rao and Viraraghavan 2002; Bina et al. 2012). In some other cases the BET isotherm
was tried, but it was found not to fit certain data as well as more commonly used isotherm
models, such as the Freundlich isotherm (Khan et al. 1997a). In the cited work of Bina et
al. (2012) it is notable that evidence of multilayer adsorption was found for the adsorbate
ethylbenzene, a relatively small molecule, for which hydrophobicity and low solubility (see

REVIEW ARTICLE bioresources.com
Hubbe et al. (2014). “Petrochemicals biosorption,” BioResources 9(4), 7782-7925. 7819
earlier) provide a driving force that favors self-association of the adsorbate in the adsorbed
state.
Pore filling models and hysteresis
It does not require too much extension beyond a concept of multilayer adsorption
before one passes into a somewhat different approach to predicting adsorption capacities –
models in which the adsorption capacity is mainly determined by the void volume within
a microporous or mesoporous adsorbent. Such a model has been proposed by many authors
to account for the adsorption of various petrochemical compounds onto and into activated
carbon products (Xia and Ball 1999; Ahmad et al. 2013; Hao et al. 2013; Ran et al. 2013).
Chiu et al. (2003) found that a pore-filling model could account for toluene adsorption
from the vapor phase onto peat, with the results not too far from the pore volume
determined by nitrogen adsorption isotherms. Xia et al. (1999) observed the same limiting
sorption capacity for a wide range of nonpolar organic chemicals, and they used this finding
as evidence that void volume, rather than surface interactions, mainly provides the upper
limit of sorption capacity in the studied systems.
It seems remarkable that few researchers dealing with adsorption of petrochemicals
from aqueous solution have considered use of the Kelvin equation to account for adsorption
phenomena (Hseih and Teng 2000). It is well known that the Kelvin equation predicts a
decreased vapor pressure of liquid contained within a finely porous solid, depending on the
contact angles (Adamson and Gast 1997; Beverley et al. 1999). As shown by the form of
the Kelvin equation given below, the vapor pressure of adsorbate in a gas phase in
equilibrium with a small pore can be strongly depressed, depending on the shape of the
meniscus within the pore. The Kelvin equation can be written in the following form (Chen
et al. 2006),
RT ln(p/ps) = V (p – ps + 2 cos /r ) (3)
where R is the gas constant (8314 J kmol-1K-1), T is the absolute temperature, p is the
equilibrium vapor pressure, ps is the same in the case of a flat interface, V is the volume of
a mole of the liquid, is the interfacial tension, is the contact angle with respect to the
liquid in the capillary, and r is the radius of a capillary (modeled as a cylinder). Assuming
perfect wetting of the internal liquid, the cos term approaches unity. While it is widely
used to account for the condensation of gases in finely porous solids, the Kelvin model has
been considered much less often for adsorption of dissolved compounds from aqueous
solution onto micro- and mesoporous solids (Gun’ko et al. 2003; Chen et al. 2006). There
does not appear to be any strong theoretical reason to doubt that the same principles hold
true when a liquid within a capillary is adjacent to an immiscible liquid phase. In either
case, the pressure difference due to the capillary forces will result in a difference in
chemical potential on the two sides of the interface. In principle, depending on the contact
angles at the adsorbate-aqueous-adsorbent interface at the entrance to an unfilled pore
structure, one can expect that there to be bias in favor of adsorption, compared to
adsorption onto outer surfaces of the adsorbent. This appears to be a neglected field in
terms of both theory and practical demonstrations.
One type of evidence that can support the pore-filling concept involves hysteresis.
In other words, the relationship between adsorbed amount and bulk concentration is
REVIEW ARTICLE bioresources.com
Hubbe et al. (2014). “Petrochemicals biosorption,” BioResources 9(4), 7782-7925. 7820
different, depending on whether the bulk concentration is being raised or lowered. Strong
hysteresis could be expected based on a pore-filling model if the affinity between an
adsorbate molecule and an adsorbent is strongly enhanced by the presence of condensed
adsorbate molecules already occupying some of the pores. The Kelvin equation, as just
introduced, predicts strong hysteresis in some cases, since a strongly curved meniscus can
contribute to a strong suppression of desorption, beyond what would be expected for
adsorption on a flat surface. Such a mechanism has been proposed by Farrell et al. (1999).
Evidence of irreversibility of adsorption has been reported in many relevant cases
(Snoeyink et al. 1969; Ferro-Garcia et al. 1996; Pignatello and Xing 1996; Farrell et al.
1999; Ning et al. 1999; Ha and Vinitnantharat 2000; Pan and Xiing 2008; Chen and Ding
2012; Cong et al. 2013; ElHaddad et al. 2013). However, irreversibility also can be
attributed to other effects, such as polymerization and covalent bonding to the surface of
the adsorbent (Terzyk 2003a,b), as will be discussed next.
Covalent Reactions of the Adsorbate As just mentioned, one way to account for unexpectedly depressed extents of
desorption, in cases where the bulk concentration of adsorbate is reduced, is to suppose
that a reaction has taken place to render the compound insoluble. Several research teams
have reached the conclusion that phenolic compounds may become covalently coupled to
suitable carbonaceous surfaces (Magne and Walker 1986; Grant and King 1990; Ferro-
Garcia et al. 1996; Vidic et al. 1997; Juhasz et al. 2002; Namasivayam and Kavitha 2003;
Salame and Bandosz 2003; Terzyk 2003a; Moreno-Castilla 2004; Alvarez et al. 2005).
Results reported by Mathialagan and Viraraghavan (2009) are also consistent with covalent
bonding as a possible mechanism. Grant and King (1990) quantified such bound phenolic-
based compounds by extracting the activated carbons with a variety of different solvents;
the portion that could not be removed was considered to have been covalently reacted.
Moreno-Castilla (2004) likewise found that a portion of adsorbed phenols could be
removed from activated carbon surfaces by heating, whereas another portion could not.
Terzyk (2003a) used thermogravimetric analysis and concluded that the covalently bound
phenol-derived material was of minor amount. Vidic et al. (1997) and Uranowski et al.
(1998) observed that the binding of phenolics to activated carbon was promoted by the
presence of molecular oxygen. Figure 11 illustrates a mechanism that was proposed by
Osei-Twum et al. (1996) to account for such coupling.
Though the reaction is shown in Fig. 11 as occurring between a pair of isolated
monoaromatic phenol molecules, one could readily apply such a model to other situations,
such as when a phenolic group is associated with the surface of an activated carbon product.
Indeed, oxidative coupling of phenols appears to be enabled by oxygen-containing groups
at the surface of suitably treated activated carbons (Alvarez et al. 2005). Salame and
Bandosz (2003) proposed an esterification between the phenolic group and carboxyl groups
at the carbon surface. Magne and Walker (1986) found that it was possible to avoid what
they called “chemisorption” of phenol to activated carbon by minimizing both the contact
time and temperature of exposure of the phenol to the absorbate. An analogous oxidative
coupling reaction also can take place in the presence of chlorine (Voudrias et al. 1985);
however, the cited work warned of the likely formation of chlorinated phenols when carbon
products are exposed to residual chlorine in water.
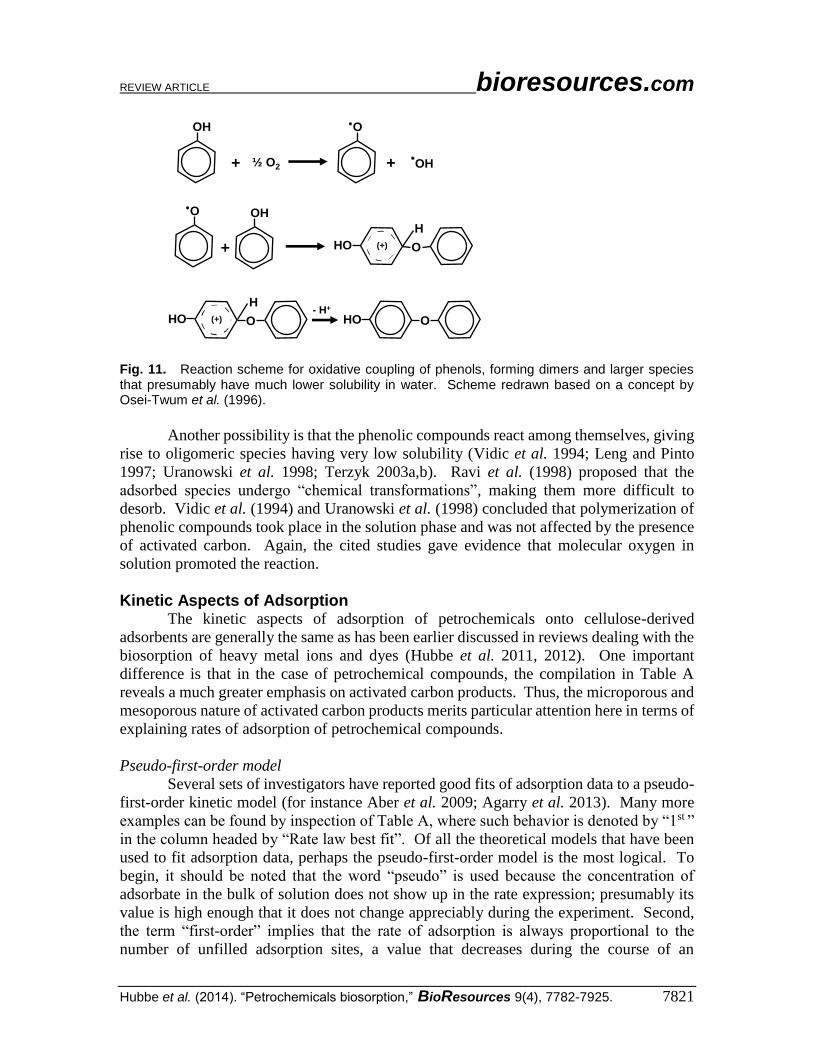
REVIEW ARTICLE bioresources.com
Hubbe et al. (2014). “Petrochemicals biosorption,” BioResources 9(4), 7782-7925. 7821
Fig. 11. Reaction scheme for oxidative coupling of phenols, forming dimers and larger species that presumably have much lower solubility in water. Scheme redrawn based on a concept by Osei-Twum et al. (1996).
Another possibility is that the phenolic compounds react among themselves, giving
rise to oligomeric species having very low solubility (Vidic et al. 1994; Leng and Pinto
1997; Uranowski et al. 1998; Terzyk 2003a,b). Ravi et al. (1998) proposed that the
adsorbed species undergo “chemical transformations”, making them more difficult to
desorb. Vidic et al. (1994) and Uranowski et al. (1998) concluded that polymerization of
phenolic compounds took place in the solution phase and was not affected by the presence
of activated carbon. Again, the cited studies gave evidence that molecular oxygen in
solution promoted the reaction.
Kinetic Aspects of Adsorption The kinetic aspects of adsorption of petrochemicals onto cellulose-derived
adsorbents are generally the same as has been earlier discussed in reviews dealing with the
biosorption of heavy metal ions and dyes (Hubbe et al. 2011, 2012). One important
difference is that in the case of petrochemical compounds, the compilation in Table A
reveals a much greater emphasis on activated carbon products. Thus, the microporous and
mesoporous nature of activated carbon products merits particular attention here in terms of
explaining rates of adsorption of petrochemical compounds.
Pseudo-first-order model
Several sets of investigators have reported good fits of adsorption data to a pseudo-
first-order kinetic model (for instance Aber et al. 2009; Agarry et al. 2013). Many more
examples can be found by inspection of Table A, where such behavior is denoted by “1st ”
in the column headed by “Rate law best fit”. Of all the theoretical models that have been
used to fit adsorption data, perhaps the pseudo-first-order model is the most logical. To
begin, it should be noted that the word “pseudo” is used because the concentration of
adsorbate in the bulk of solution does not show up in the rate expression; presumably its
value is high enough that it does not change appreciably during the experiment. Second,
the term “first-order” implies that the rate of adsorption is always proportional to the
number of unfilled adsorption sites, a value that decreases during the course of an
OH
+ ½ O2
O
+ OH
O
+
OH
O(+)
H
HO
O(+)
H
HO OHO- H+
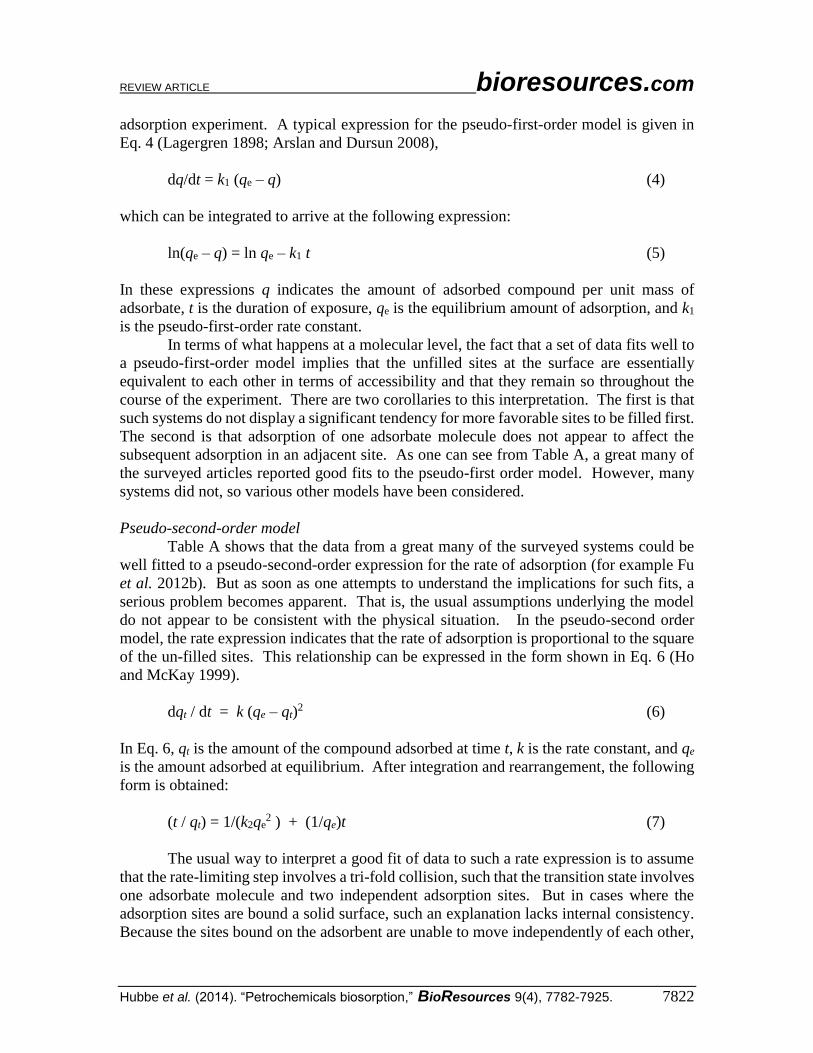
REVIEW ARTICLE bioresources.com
Hubbe et al. (2014). “Petrochemicals biosorption,” BioResources 9(4), 7782-7925. 7822
adsorption experiment. A typical expression for the pseudo-first-order model is given in
Eq. 4 (Lagergren 1898; Arslan and Dursun 2008),
dq/dt = k1 (qe – q) (4)
which can be integrated to arrive at the following expression:
ln(qe – q) = ln qe – k1 t (5)
In these expressions q indicates the amount of adsorbed compound per unit mass of
adsorbate, t is the duration of exposure, qe is the equilibrium amount of adsorption, and k1
is the pseudo-first-order rate constant.
In terms of what happens at a molecular level, the fact that a set of data fits well to
a pseudo-first-order model implies that the unfilled sites at the surface are essentially
equivalent to each other in terms of accessibility and that they remain so throughout the
course of the experiment. There are two corollaries to this interpretation. The first is that
such systems do not display a significant tendency for more favorable sites to be filled first.
The second is that adsorption of one adsorbate molecule does not appear to affect the
subsequent adsorption in an adjacent site. As one can see from Table A, a great many of
the surveyed articles reported good fits to the pseudo-first order model. However, many
systems did not, so various other models have been considered.
Pseudo-second-order model
Table A shows that the data from a great many of the surveyed systems could be
well fitted to a pseudo-second-order expression for the rate of adsorption (for example Fu
et al. 2012b). But as soon as one attempts to understand the implications for such fits, a
serious problem becomes apparent. That is, the usual assumptions underlying the model
do not appear to be consistent with the physical situation. In the pseudo-second order
model, the rate expression indicates that the rate of adsorption is proportional to the square
of the un-filled sites. This relationship can be expressed in the form shown in Eq. 6 (Ho
and McKay 1999).
dqt / dt = k (qe – qt)2 (6)
In Eq. 6, qt is the amount of the compound adsorbed at time t, k is the rate constant, and qe
is the amount adsorbed at equilibrium. After integration and rearrangement, the following
form is obtained:
(t / qt) = 1/(k2qe2 ) + (1/qe)t (7)
The usual way to interpret a good fit of data to such a rate expression is to assume
that the rate-limiting step involves a tri-fold collision, such that the transition state involves
one adsorbate molecule and two independent adsorption sites. But in cases where the
adsorption sites are bound a solid surface, such an explanation lacks internal consistency.
Because the sites bound on the adsorbent are unable to move independently of each other,
REVIEW ARTICLE bioresources.com
Hubbe et al. (2014). “Petrochemicals biosorption,” BioResources 9(4), 7782-7925. 7823
they cannot join in such a three-membered transition state. Thus, the usual way to account
for pseudo-second-order rate behavior needs to be abandoned.
Fortunately, there is an alternative way the account for good fits of adsorption data
to a pseudo-second-order rate expression. As first proposed in an earlier review article in
this series (Hubbe et al. 2012), one relaxes the assumption that all adsorption sites have
equal accessibility to adsorbate molecules. Instead, one assumes that the more easily
occupied sites tend to fill up first, and the later sites become increasingly slower to be filled.
Possible contributions to the slower filling of later-to-be-filled sites might be due to a wide
range of circumstances, including the chemical nature of the site, the location of a site
deeper within a narrow pore structure, or a degree of repulsion between already-adsorbed
molecules and yet-to-be adsorbed molecules. The form of Eq. 7 is such that the
deceleration in the rate of adsorption becomes increasingly severe as the surface
approaches 100% saturation. The fact that the pseudo-second-order expression gives good
fits to so many sets of data seems to be telling us that strong non-uniformity of accessibility
or affinity of adsorption sites is the norm, rather than the exception, especially with respect
to the last-to-be-filled sites.
To be consistent with the explanation just given, it is proposed that the pseudo-
second-order rate expression be regarded as an empirical expression, very much in the
same manner as the Freundlich adsorption isotherm has been regarded as being mainly a
means to summarize experimental data (Freundlich 1907; Cal et al. 1994; Furuya et al.
1997). It is recommended that careful research be undertaken, with a focus on pure systems
with well-defined pore structures, to shed more light on the underlying causes of pseudo-
second-order adsorption rate behavior.
Intraparticle diffusion
Another model that has been very widely employed to fit and to interpret data for
adsorption of petrochemicals onto cellulose-related adsorbents is the so-called intraparticle
diffusion model (Webber and Morris 1963). Figure 12 provides a schematic view of the
situation assumed in such cases. As shown, one envisions two possibilities for the rate-
limiting step in adsorption, including (a) diffusion across a boundary layer at the outer
surface of the particle of adsorbent material, and (b) diffusion within the particle.
Webber and Morris (1963) considered cases in which the rate-limiting step
appeared to be controlled by an activation energy. Presumably the activation energy is
needed to cause momentary release of an adsorbate molecule from a surface site so that it
is free to diffuse to an adjacent unoccupied site (either via surface diffusion or through the
aqueous phase within the pore). Thus the rate of adsorption follows an Arhenius
relationship of the form,
k = A e –E / RT (8)
where A is sometimes called the frequency factor, E is the activation energy for adsorption,
R is the gas constant, and T is absolute temperature.
Webber and Morris (1963) proposed that such a factor, in combination with a first-
order model (essentially that of the pseudo-first-order model discussed earlier), could
account for adsorption rates that were mainly controlled by rates of diffusion of adsorbate
molecules from the outsides of finely porous activated carbon particles into their interiors.
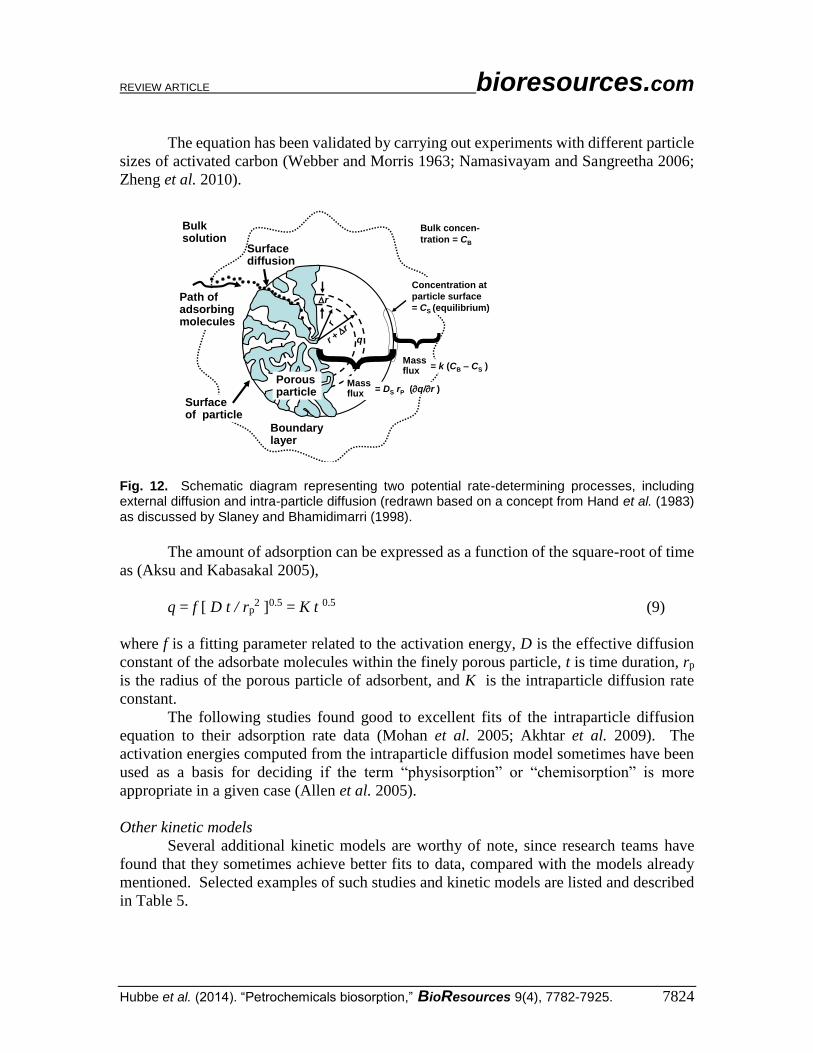
REVIEW ARTICLE bioresources.com
Hubbe et al. (2014). “Petrochemicals biosorption,” BioResources 9(4), 7782-7925. 7824
The equation has been validated by carrying out experiments with different particle
sizes of activated carbon (Webber and Morris 1963; Namasivayam and Sangreetha 2006;
Zheng et al. 2010).
Fig. 12. Schematic diagram representing two potential rate-determining processes, including external diffusion and intra-particle diffusion (redrawn based on a concept from Hand et al. (1983) as discussed by Slaney and Bhamidimarri (1998).
The amount of adsorption can be expressed as a function of the square-root of time
as (Aksu and Kabasakal 2005),
q = f [ D t / rp2 ]0.5 = K t 0.5 (9)
where f is a fitting parameter related to the activation energy, D is the effective diffusion
constant of the adsorbate molecules within the finely porous particle, t is time duration, rp
is the radius of the porous particle of adsorbent, and K is the intraparticle diffusion rate
constant.
The following studies found good to excellent fits of the intraparticle diffusion
equation to their adsorption rate data (Mohan et al. 2005; Akhtar et al. 2009). The
activation energies computed from the intraparticle diffusion model sometimes have been
used as a basis for deciding if the term “physisorption” or “chemisorption” is more
appropriate in a given case (Allen et al. 2005).
Other kinetic models
Several additional kinetic models are worthy of note, since research teams have
found that they sometimes achieve better fits to data, compared with the models already
mentioned. Selected examples of such studies and kinetic models are listed and described
in Table 5.
Bulk solution
Boundary layer
Porous particle
Path of adsorbing molecules
Surface diffusion
r
r
r
r +
r
Concentration at
particle surface
= CS (equilibrium)
Bulk concen-
tration = CB
Mass flux
= k (CB – CS )
{{Mass flux
= DS rP (q/r )
q
Surface of particle
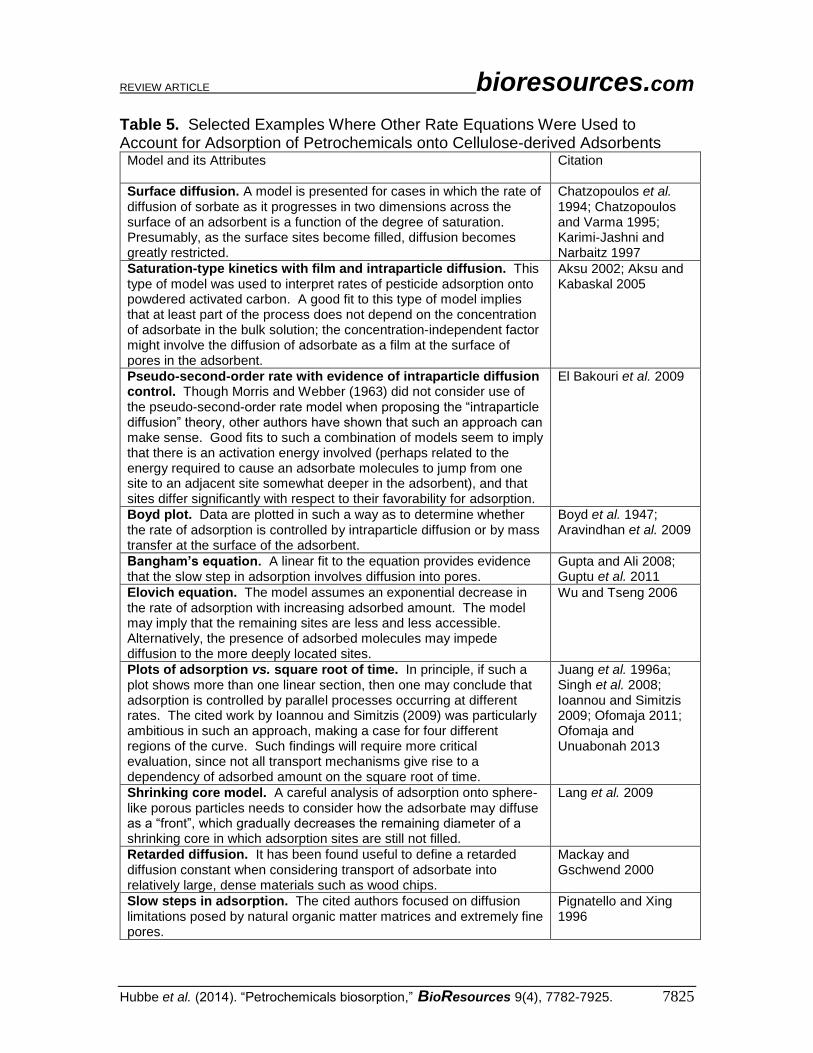
REVIEW ARTICLE bioresources.com
Hubbe et al. (2014). “Petrochemicals biosorption,” BioResources 9(4), 7782-7925. 7825
Table 5. Selected Examples Where Other Rate Equations Were Used to Account for Adsorption of Petrochemicals onto Cellulose-derived Adsorbents
Model and its Attributes
Citation
Surface diffusion. A model is presented for cases in which the rate of diffusion of sorbate as it progresses in two dimensions across the surface of an adsorbent is a function of the degree of saturation. Presumably, as the surface sites become filled, diffusion becomes greatly restricted.
Chatzopoulos et al. 1994; Chatzopoulos and Varma 1995; Karimi-Jashni and Narbaitz 1997
Saturation-type kinetics with film and intraparticle diffusion. This type of model was used to interpret rates of pesticide adsorption onto powdered activated carbon. A good fit to this type of model implies that at least part of the process does not depend on the concentration of adsorbate in the bulk solution; the concentration-independent factor might involve the diffusion of adsorbate as a film at the surface of pores in the adsorbent.
Aksu 2002; Aksu and Kabaskal 2005
Pseudo-second-order rate with evidence of intraparticle diffusion control. Though Morris and Webber (1963) did not consider use of the pseudo-second-order rate model when proposing the “intraparticle diffusion” theory, other authors have shown that such an approach can make sense. Good fits to such a combination of models seem to imply that there is an activation energy involved (perhaps related to the energy required to cause an adsorbate molecules to jump from one site to an adjacent site somewhat deeper in the adsorbent), and that sites differ significantly with respect to their favorability for adsorption.
El Bakouri et al. 2009
Boyd plot. Data are plotted in such a way as to determine whether the rate of adsorption is controlled by intraparticle diffusion or by mass transfer at the surface of the adsorbent.
Boyd et al. 1947; Aravindhan et al. 2009
Bangham’s equation. A linear fit to the equation provides evidence that the slow step in adsorption involves diffusion into pores.
Gupta and Ali 2008; Guptu et al. 2011
Elovich equation. The model assumes an exponential decrease in the rate of adsorption with increasing adsorbed amount. The model may imply that the remaining sites are less and less accessible. Alternatively, the presence of adsorbed molecules may impede diffusion to the more deeply located sites.
Wu and Tseng 2006
Plots of adsorption vs. square root of time. In principle, if such a plot shows more than one linear section, then one may conclude that adsorption is controlled by parallel processes occurring at different rates. The cited work by Ioannou and Simitzis (2009) was particularly ambitious in such an approach, making a case for four different regions of the curve. Such findings will require more critical evaluation, since not all transport mechanisms give rise to a dependency of adsorbed amount on the square root of time.
Juang et al. 1996a; Singh et al. 2008; Ioannou and Simitzis 2009; Ofomaja 2011; Ofomaja and Unuabonah 2013
Shrinking core model. A careful analysis of adsorption onto sphere-like porous particles needs to consider how the adsorbate may diffuse as a “front”, which gradually decreases the remaining diameter of a shrinking core in which adsorption sites are still not filled.
Lang et al. 2009
Retarded diffusion. It has been found useful to define a retarded diffusion constant when considering transport of adsorbate into relatively large, dense materials such as wood chips.
Mackay and Gschwend 2000
Slow steps in adsorption. The cited authors focused on diffusion limitations posed by natural organic matter matrices and extremely fine pores.
Pignatello and Xing 1996
REVIEW ARTICLE bioresources.com
Hubbe et al. (2014). “Petrochemicals biosorption,” BioResources 9(4), 7782-7925. 7826
Divergence between adsorption rate and capacity. The cited authors reported that the highest rate of adsorption did not coincide with the highest capacity. Such findings are generally consistent with the idea that micropores within activated carbon are the most difficult to access, and they also have the highest surface area for adsorption.
Roostaei and Tezel 2004
Half-life, half-capacity approach. This analysis, based on a Langmuir isotherm model and a pseudo-second-order rate of adsorption, revealed a case in which a lower capacity adsorbent was more effective for packed-bed applications, requiring fewer stages of treatment.
Tseng et al. 2011
Adsorbate’s diffusivity in the substrate’s partition phase. Fast and slow rates of adsorption can be accounted for by a model in which adsorption first takes place onto a “partition phase”, from which release into other parts of the adsorbent is relatively slow.
Chen et al. 2012b
Interpretation of Packed Bed Results Much of the emphasis, up to this point in the article, has been on studies focused
on quasi-equilibrium conditions. Indeed, most of the studies represented in Table A can
be described as batch-type adsorption experiments. But important research also has been
carried out with continuous flow-through systems, i.e. packed beds (Gupta et al. 2000;
Garcia-Mendeita et al. 2003; Gupta and Ali 2008; Rossner and Knappe 2008; Hank et al.
2010). Such studies provide an essential link to some of the most promising scale-up
opportunities for biosorption technologies.
A key goal of studies involving packed beds has been to accurately predict
breakthrough – often defined by the point in time at which the concentration of contaminant
at the outlet of the column reaches half of its value at the inlet (Slaney and Bhamidimarri
1998; Chern and Chien 2002, 2003; Chuang et al. 2003a,b; Akzu and Gönen 2004; Rossner
and Knappe 2008; Wu and Yu 2008; Sulaymon et al. 2012; Zeinali et al. 2012).
Researchers also have been concerned with the steepness of the breakthrough curves
(Brasquet et al. 1996; Brás et al. 1999), a factor that affects the degree to which the capacity
of the adsorbent can be utilized before the concentration of pollutant in the outlet stream
becomes unacceptably high. The concentration distribution in a column also can be used
as the basis for estimation of rates of adsorption, as well as diffusion rates (Wolborska
1989).
In principle, since continuous flow experiments do not provide time for
equilibration, one might expect such experiments to reveal lower adsorption capacities in
comparison to batch-type types. However, the opposite has been reported in a couple of
cases (Tyagi and Srivastava 1996; Gupta et al. 2000). Thus, there is reason to more closely
consider some theoretical aspects.
In terms of modeling, there appears to be general agreement that the breakthrough
curve can be estimated from an equation of the form,
𝜀𝜕𝐶
𝜕𝑡+ 𝑢𝑜𝜀
𝜕𝐶
𝜕𝑧+ 𝜌
𝜕𝑞
𝜕𝑡= 0 (10)
where is the void volume, C is the local concentration of pollutant in solution, t is the
elapsed time since the start of elution, uo is the interstitial flow velocity, z is the distance
from the inlet of the packed bed, 𝜌 is the density of solid (carbon) in the packed bed, and
REVIEW ARTICLE bioresources.com
Hubbe et al. (2014). “Petrochemicals biosorption,” BioResources 9(4), 7782-7925. 7827
q is the local concentration of pollutant in the stationary phase (Chern and Chien 2002).
The cited article gives a good description of the assumptions and boundary conditions that
are used when applying the equation. Through use of various simplifications, the elution
time can be expressed in the following form,
𝑡 = 𝑡1/2 +𝜌𝑞𝐹
𝜀𝐾𝐿𝑎𝐶𝐹∫
1
𝐶−𝑔(𝑞𝐹𝐶
𝐶𝐹)𝑑𝐶
𝐶
𝐶𝐹/2 (11)
where t1/2 is the time at which the dimensionless effluent concentration equals 0.5, the
subscript “F” stands for “feed”, a is the mass transfer area per unit volume of the bed, and
g is the mobile phase concentration at equilibrium.
In order to make predictions related to breakthrough curves it is necessary to input
information about adsorbed amounts as a function of local concentration. This is usually
done with use of the Langmuir model, or some other suitable model, to express the
adsorption isotherm. In the case of the Langmuir model, the following equation can be
used to relate elution time to other variables (Chern and Chien 2002),
𝑡 = 𝑡1/2 +𝜌𝑁
𝜀𝐾𝐿𝑎𝐶𝐹{ln 2𝑥 +
1
1+𝐾𝐶𝐹ln
1
2(1−𝑥)} (12)
where N and K are Langmuir parameters (mol/kg and m3/mole, respectively) and x is the
normalized effluent concentration, i.e. the local concentration divided by the feed
concentration (dimensionless).
Various aspects of the predictions of models have been confirmed in studies of
adsorption of petrochemicals onto cellulose-derived adsorbents (Wolborska 1989; Chuang
et al. 2003a; Gupta and Ali 2008; Rossner and Knappe 2008; Hank et al. 2010; Zeinali et
al. 2012). For example, it has been found that the efficiency of uptake tends to fall when
the flow rate is increased (Aksu and Gönen 2004; Wu and Yu 2008). Effects of the size of
porous particles have been quantified (Garcia-Mendieta et al. 2003). Chern and Chien
(2002, 2003) showed that the breakthrough performance could be envisioned based on
constant wave patterns of solute concentrations progressing through a bed. Sulaymonn et
al. (2012) predicted breakthrough curves using a model based on external and internal mass
transfer, with provision for axial dispersion. Slaney and Bhamidimarri (1998) were able
to account for breakthrough curves by assuming a surface diffusion model of the adsorbate
within the particles of activated carbon. Brasquet et al. (1996) observed a strong
selectivity, with ready adsorption of the small hydrophobic molecules phenol and atrazine,
but very inefficient adsorption of high-mass humic substances.
One of the odd consequences of data fitting is that the value obtained for maximum
adsorption, based on a fitting of data from packed bed experiments, is sometimes higher
than what has been obtained for the same systems when batch adsorption tests were carried
out (Tyagi and Srivastava 1996; Gupta 2000). Such findings are unexpected due to the fact
that batch experiments allow much more time for adsorption to approach equilibrium. A
possible explanation for the seemingly reversed results is that different ranges of input data
are often used in such pairs of analyses. The packed bed experiments seldom incorporate
data corresponding to nearly full saturation. As a consequence, the fitting of a value for
REVIEW ARTICLE bioresources.com
Hubbe et al. (2014). “Petrochemicals biosorption,” BioResources 9(4), 7782-7925. 7828
maximum adsorption inherently involves an extrapolation somewhat beyond the range of
the actual data, especially in the case of data from dynamic testing in a packed bed.
Biodegradation Aspects Another factor that can affect not only the rate but even the amount of
petrochemical compounds removed from water in the presence of cellulose-based materials
is biodegradation. Biodegradation is also considered in parts 2 and 3 of this series of
articles, which deal with the removal of dyes and liquid oils from water (Hubbe et al. 2012,
2013). As has been pointed out in some review articles, various petrochemical compounds
can be effectively degraded by the enzymatic action of bacteria and fungi (Juhasz and
Naidu 2000a; Bamforth and Singleton 2005; Julinová and Slavík 2012). However, as noted
by Julinová and Slavík (2012), the process of biodegradation under ambient conditions
often requires a long time.
Several teams of researchers have presented evidence that biodegradation can play
a significant role as a process that goes on in parallel to biosorption (Dec and Bollag 1994;
Ha and Vinitnantharat 2000; Lei et al. 2002; Raghukumar et al. 20006; Kliaugaite et al.
2008; Liu et al. 2009; Oh et al. 2011; Chen and Ding 2012; Hai et al. 2012; Ding et al.
2013; Senkaran et al. 2013; Ye et al. 2013). For instance, Dec and Bollag (1994) noted
that peroxidases were able to detoxify water that was contaminated with phenolic
compounds. Most notable are studies in which the decomposition products from
biodegradation of petrochemical compounds were either detected or quantified (Tsezos and
Wang 1991; Benoit et al. 1998; Sethunathan et al. 2004; Chan et al. 2006; Gao et al. 2011).
Liu et al. (2009) were able to distinguish between biodegraded alkanes and those
that remained within biofloccules, a location that appeared to protect part of the alkanes
from biodegradation. Such entrapment, meaning biosorption rather than just
biodegradation, was observed after about 50 to 60 hours of bacterial culturing. Chen et al.
(2010) found evidence that biosorption tended to inhibit biodegradation by white-rot fungi.
Similar findings were reported by Pignatello and Xing (1996) for various organic
compounds, and Wang and Grady (1995) found the same in the case of di-n-butylphthalate.
Stringfellow and Alvarez-Cohen (1999) concluded that although adsorption of polynuclear
aromatic hydrocarbons onto bacterial biomass tended to suppress their biodegradation in
the short run, the pollutants may be ultimately degraded in the longer term, and in any case
the biosorbed hydrocarbons become removed from the water phase.
Seo et al. (1997) found that the ability of activated carbon to take up peptone and
various other pollutants was increased by a factor of four after inoculation of the system
with microorganisms. Hank et al. (2010) found that the ability of activated carbon to
remove phenol from solution was greatly enhanced by the presence of a biofilm, and the
effect was attributed partly to biodegradation. Likewise, Hu et al. (2013) and Li et al.
(2013) demonstrated the effectiveness of activated carbon that had been “bioaugmented”
with bacterial films for the removal of methyltert-butyl ether (MTBE) from soil samples.
The growth of degrading organisms as a biofilm on the carbon particles provided the
capability of long-term removal of MTBE, making it unnecessary to replace or otherwise
reactivate the adsorbent.
Various researchers have used microbes to decompose adsorbed petrochemicals,
thereby restoring the adsorptive capacity to activated carbon (Vinitnantharat et al. 2001).
Ivancev-Tumbas et al. (1998) used aerobic microbial treatment to achieve regeneration of
REVIEW ARTICLE bioresources.com
Hubbe et al. (2014). “Petrochemicals biosorption,” BioResources 9(4), 7782-7925. 7829
activated carbon that had been used for the adsorption of phenol. Oh et al. (2013) used
biodegradation to regenerate activated carbon that had become loaded with 4-chlorophenol.
Toh et al. (2013) found that granular activated carbon could be regenerated after having
been loaded with phenol and o-cresol, by exposure to microbial cultures. Sodha et al.
(2013) achieved only about 58% of regeneration of the adsorption capacity of activated
carbon for phenol after bacterial culturing to degrade the phenol. Oh et al. (2011) found
that biofilm-coated activated carbon particles were effective in degrading chlorophenols
only when the concentration of the pollutant was at or below the level to which the
microorganisms had become acclimatized. Romeh (2010) found that inoculation of water
with certain bacteria resulted in a drastic decrease in the pesticide imidacloprid within 48 h,
whereas a much lesser change was observed in parallel experiments with the same biomass in
suspension, but without innoculation. Samanta et al. (2002) noted that although naturally
occurring bacteria can break down many polycyclic aromatic compounds, their
performance may be improved by metabolic engineering.
In some other cases the authors concluded that most of the removal of the
petrochemical compounds was attributable to biosorption rather than biodegradation
(Augulyte et al. 2009; Namane et al. 2012). To add some perspective, it should be recalled
from an earlier part of this article that many researchers found little or no advantage of
utilizing live micro-organisms, rather than heat-killed microbial biomass of the same type
as a means of removing the petrochemicals from solution (Yan and Allen 1994; Lei et al
2002; Chen et al. 2010; Ding et al. 2013), and in a few cases the dead biomass was found
to be more effective (Wang and Grady 1994; Lang et al. 2009).
Another factor that can help put matters into perspective is to compare the times
required to get rid of a target pollutant; for example, while most of the studies represented
in Table A indicate that most of the biosorption took place within the first hour, a study by
Chen and Ding (2012) found that three days was required to decrease the phenanthrene
content of soil by 20 to 40%, and 90 days was needed to reduce the amount by 60 to 95%
in the presence of various bacterial or fungal cultures. Similar results were reported by
Gao et al. (2011) for nonylphenol and biosorption and/or biodegradation by Chlorella
species. Also Lei et al. (2002) found that pyrene was first adsorbed onto live microbial
cells and then more gradually biodegraded, with the rates differing for different micro-
organisms and conditions. Sethunathan et al. (2004) found that algae were effective for
relatively quick biosorption of an endocrine disrupting insecticide from water, allowing
most of it to be biodegraded within 10 to 50 days, depending on the details.
LIFE CYCLE ISSUES
Up to this point in this article the relative success of biosorption has been mainly
considered in terms of adsorption capacities and rates. But full success of a biosorption
process also requires that an approach is cost-effective, that each step fits well with the
next in an integrated program, and that potential adverse environmental impacts are
avoided or minimized. Some aspects of environmental impacts will be considered here,
with attention to the possible fate of cellulose-based absorbent material after it has been
used to collect various petrochemical compounds from water. For instance, it has been
pointed out that the production of the adsorbent material itself will ideally be carried out in
REVIEW ARTICLE bioresources.com
Hubbe et al. (2014). “Petrochemicals biosorption,” BioResources 9(4), 7782-7925. 7830
an environmentally friendly way, with preference given to bio-based, photosynthetically
renewable materials (Ali et al. 2012). Because some of these same issues already were
covered in an earlier review article (Hubbe et al. 2013), the discussion that follows is
somewhat abbreviated.
Practical Handling of Particulate Matter As has been mentioned in an earlier review article (Hubbe et al. 2011), relatively
large particle or fibers of adsorbent material are likely to be advantageous in term of
practical handling. In batch operations relatively large particles are more easily collected,
and in packed bed systems they may provide less resistance to flow. But again when
considering adsorption of petrochemical compounds, little research could be found dealing
with such practical issues. As an exception, Han et al. (2013) showed that activated carbon
could be rendered ferromagnetic by incorporation of -Fe2O3 nanoparticles. Khoshmood
and Azizian (2012) likewise prepared activated carbons having magnetic properties. Such
materials could be easily removed from solution by use of a magnet. It is worth noting that
such issues were hardly mentioned in the great majority of articles considered in this
review. Once again, the paucity of research concerning various highly practical issues
implies that there remain critical needs for academic and industrial research by engineers
and scientists in the coming years.
Regeneration The philosophy behind regeneration is that the biosorbent ought to be used multiple
times, thus minimizing any environmental costs associated with its preparation. Once the
biosorbent material has become loaded with the target pollutant or pollutants, there ought
to be a benign way to remove the target compounds and to restore the adsorbent near to its
initial state and capacity. As proposed by Pollard et al. (1992), it would be most desirable
for such regeneration to be carried out in situ, thus allowing a packed bed of the adsorbent
to be used multiple times. Several approaches to accomplish this are considered in the
subsections that follow.
Regeneration by rinsing with an organic solvent
In principle it would be possible to restore many adsorbents by a kind of dry-
cleaning, essentially rinsing them off with an organic solvent (Srivastava and Tyagi 1995b;
Ferro-Garcia et al. 1996; Leng and Pinto 1997; Gupta et al. 2000; Juhasz and Naidu 2000b;
Denizli et al. 2004, 2005; Akhtar et al. 2007b; Sathishkumar et al. 2008; Stasinakis et al.
2008; Lang et al. 2009; Tan et al. 2009a,b). However, there is reason to doubt that such
approaches make sense in terms of environmental impact. While the adsorbent may
become cleaned, the solvent becomes contaminated. A possible exception to this rule is
that sometimes it is possible to use adsorption as a means to pre-concentrate organic liquids
as a step towards obtaining them in their pure form (Aktar et al. 2007a). In general,
however, it makes sense to seek alternatives to the use of organic solvents in the
regeneration of adsorbents.
Release back into an alkaline aqueous phase as a concentrate
When dealing with phenolic compounds many researchers have observed that it is
possible to transfer much of the adsorbed material back into aqueous solution by raising
REVIEW ARTICLE bioresources.com
Hubbe et al. (2014). “Petrochemicals biosorption,” BioResources 9(4), 7782-7925. 7831
the pH to approximately 10 or 11 or higher (Leng and Pinto 1997; Tyagi et al. 1997; Akhtar
et al. 2009; Anirudhan et al. 2009; Gupta et al. 2000; Kujawski et al. 2004; Özkaya 2006;
Tang et al. 2007; Kumar 2009b; Kumar and Min 2011b; Abdallah 2013). Brandt et al.
(1997) found that raising the pH to 7 was sufficient to regenerate bacterial biomass that
had been loaded with pentachlorophenol; such results are consistent with the much stronger
acidity of that compound in comparison to most other phenols. Chularueangaksorn et al.
(2013) employed a mixture of NaOH and NaCl in a methanol-water (70:30) solution to
remove perfluorooctane sulfonate from an anionic exchange resin. Presumably the
regeneration by base should be performed with a minimum of aqueous phase, such that the
resulting aqueous solution is many times more concentrated than the original polluted
water. Leng and Pinto (1997) found that oxygen-free conditions were much more effective
than oxygenated conditions when using a methanol-NaOH combination to remove phenol
from activated carbons. Treatment with alkaline solution also has been found to be
effective for regeneration of activated carbons that had been loaded with certain other
contaminants, such as pesticides (Hamadi et al. 2004). In work that calls into question the
need to always raise the pH of the desorbing solution, Wu and Yu (2007, 2008) found that
simple equilibration with deionized water was able to remove over 80% of adsorbed 2,4-
dichlorophenol from fungal beds; however such easy desorption may raise concerns
regarding insufficient affinity in those cases between the target adsorbate and a candidate
adsorbent to achieve effective removal in the first place.
Figure 13 describes a possible scheme that might be employed to treat the
concentrated rinsate from an alkaline regeneration operation. After pH adjustment, it is
proposed that the mixture be subjected to biological treatment with activated sludge in
conventional wastewater treatment systems or bioreactors (Farhadian et al. 2008; Kwon et
al. 2011; Al-Khalid and El-Naas 2012; Niti et al. 2013).
Fig. 13. Schematic diagram of a scheme for desorptive regeneration of a packed bed, followed by biodegradation of the rinsate, and then recapture of any remaining contaminant onto the packed bed, allowing release of purified water
Back-flush solution(high pH, etc.)
Activated Sludge
Treatment
Wastewater clarification
Inlet
Back-flushing of bed
Packed bed in operation
Discharge of cleaned water
pH adjustment
REVIEW ARTICLE bioresources.com
Hubbe et al. (2014). “Petrochemicals biosorption,” BioResources 9(4), 7782-7925. 7832
Note that according to the diagram the biologically clarified water is then sent once
again through the packed bed system. Incorporation of such a repetition of biosorption is
justified by the presumed low rates of biodegradation of many petrochemical products. On
the other hand, it can be expected that an activated sludge system can become increasingly
effective in biodegradation during repeated cycles due to the enrichment of microbes in the
activated sludge that are capable of breaking down various recalcitrant compounds.
Oxidative degradation
Another promising approach to the regeneration of a contaminated adsorbent
material can involve oxidation or bleaching, with the aim of breaking down the adsorbed
compounds into non-harmful byproducts. Such an approach depends both on the nature of
the adsorbed compounds and the type of oxidant. Compared to the biological processes
just described, oxidative processes can be quite rapid, offering the possibility of in-situ
regeneration of packed beds.
Advanced oxidation processes (AOP) are of particular interest relative to their
possible use in the regeneration of packed beds contaminated with hard-to-oxidize
compounds (Pera-Titus et al. 2004; Pignatello et al. 2006). For instance, such processes
can employ a combination of UV light and an oxidant such as H2O2 to generate OH-
radicals. Another approach is to use Fenton’s reaction, wherein Fe(II) is used with H2O2
to generate such radicals. Much less is known regarding possible scale-up of such
processes for in-situ treatment of packed beds. Doocey and Sharratt (2004) showed that a
Fenton catalysis system could be used to regenerate zeolite that had been contaminated
with chlorophenols. Chan et al. (2007) employed photocatalytic oxidation for the treatment
of seaweed that had been used to adsorb di(2-ethylhexyl)phthalate. Titanium dioxide
particles were employed as a catalyst along with hydrogen peroxide as the oxidant and
ultraviolet light to initiate the reaction. Complete regeneration was achieved within 45 min
under optimum conditions. Okawa et al. (2007) achieved similar results using wet
peroxide oxidation to remove trichloroethylene from activated carbon. Apparently the
activated carbon itself was able to play the role of catalyst, causing H2O2 to decompose,
yielding the desired OH- radical. Some loss of adsorption capacity was observed, and this
was attributed to partial oxidation of the adsorbent. Omri and Benzina (2014) generated
very small anatase TiO2 particles onto the surface of activated carbon particles; such
systems made it possible to first adsorb phenol, then subject it to photocatalytic oxidation.
Figure 14 provides a schematic diagram suggesting how an advanced oxidation
treatment could be integrated into a packed bed system for the removal of oxidizable
petrochemical compounds from water. As shown, once the packed bed has reached its
capacity, the concept is to backflush the system is such a way that the derived oxidative
radical species are in their active form and able to interact with the adsorbed contaminants.
Because the packed bed material presumably will be opaque to ultraviolet light, there are
various research questions that need to be answered. For instance, the limited lifetimes of
radical species may make it difficult to optimize the oxidation of compounds held within
the adsorbent material.
REVIEW ARTICLE bioresources.com
Hubbe et al. (2014). “Petrochemicals biosorption,” BioResources 9(4), 7782-7925. 7833
Fig. 14. Schematic diagram of a concept for in-situ oxidative regeneration of a packed bed that has been used for the adsorption of petrochemical compounds
Thermal regeneration
The idea behind thermal regeneration is to employ conditions similar to, but
generally milder than those used in the initial preparation of activated carbons. Basically,
one heats the material in the absence of oxygen such as to cause desorption of the collected
organic molecules and restoration of the pristine conditions within the mesopores and
micropores of the carbon (Moreno-Castilla et al. 1995a; San Miguel et al. 2001; Denizli et
al. 2004; Sabio et al. 2004; Namasivayam and Sangreetha 2006; Maldonado-Hódar et al.
2007; Stasinakis et al. 2008; Román et al. 2013). Román et al. (2013) attributed the
observed desorption to thermal removal of functional groups from the carbon surface, as
well as cracking of the chemisorbed compounds. Álvarez et al. (2004, 2009) found that an
additional 15% of mass loss from the carbon was incurred during heating at 1123 oK with
carbon dioxide gas to restore activated carbon that had been used to adsorb phenol. It was
found that similar results could be obtained with ozone gas treatment at room temperature
(Álvarez et al. 2005, 2009). Sabio et al. (2004) found that gasification with carbon dioxide
was much more effective than simple pyrolysis in the regeneration of active carbon loaded
with p-nitrophenol. Ania et al. (2005) found that microwave heating made it possible to
achieve more rapid regeneration of activated carbon with less harmful effect on the pore
size distribution than conventional heating. San Miguel et al. (2001) found that steam
gasification was very effective for regeneration of activated carbon, but that excessively
severe conditions deteriorated the microporosity of the adsorbent.
Biological regeneration or treatment
Adsorbent material also can be regenerated by exposing it to conditions that allow
biological decomposition (Ivancev-Tubas et al. 1998; Vinitnantharat et al. 2001; Oh et al.
2013; Sodha et al. 2013; Toh et al. 2013). For instance Ivancev-Tubas et al. (1998)
employed aerobic conditions that allowed micro-organisms to break down adsorbed phenol
on activated carbon. A study by Oh et al. (2013) revealed no effect of the amount of
adsorbed chlorophenol on the bioregeneration of activated carbon. Sekaran et al. (2013)
Inlet
Back-flushing of bed
Packed bed in operation
Discharge of cleaned water
Rinsate
(oxidized)Adjust pH,
redox potential,
clarify, etc.
UV light
H2O2 +TiO2,orFentonsystem
Return to packed bed

REVIEW ARTICLE bioresources.com
Hubbe et al. (2014). “Petrochemicals biosorption,” BioResources 9(4), 7782-7925. 7834
immobilized bacteria on activated carbon to decontaminate sulphonated phenolic
compounds. On the other hand, Toh et al. (2013) found that it made no difference whether
microbial biomass was immobilized or free-floating during the bioregeneration of activated
carbon loaded with phenol and o-cresol.
One of the key concerns about the kind of approach just mentioned is that
biodegradation may be too slow for practical use in many packed bed systems. A possible
way to get around this dilemma is to allow biodegradation to take place continuously within
the bed. Examples employing of such an approach were mentioned earlier (Hu et al. 2013;
Li et al. 2013c). A challenging aspect of such an approach is the need to maintain
conditions is a suitable range for biological growth, possibly including control of pH,
temperature, and micronutrients. While the cited studies claimed success for semi-
continuous biosorption and biodegradation of some selected contaminants, more such
research is needed to determine if the concept can be scaled up and used for diverse and
variable streams of contaminated water.
In addition to considering use of biodegradation as a way to recondition adsorbent
material, one needs to appreciate that biodegradation constitutes a key step in conventional
wastewater treatment programs. For instance, Al-Khalid and El-Nass (2012) have
reviewed studies dealing with the aerobic biodegradation of phenols. Such treatment can
be understood as involving adsorption of the pollutants onto bacterial sludge, in addition
to the possibility of enzymatic breakdown while the target compounds are in the soluble
phase. Several studies have documented the adsorption of phenolic compounds and other
petrochemicals onto bacterial sludge of the type generated during wastewater treatment
(Bell and Tsezos 1988, 1989; Tsezos and Wang 1991a,b; Kennedy et al. 1992; Yan and
Allen 1994; Aksu and Yener 1998, 2001; Stringfellow and Avlarez-Cohen 1999; Karim
and Gupta 2002; Aksu and Gönen 2004; Gao and Wang 2007; Thawornchaisit and
Pakulanon 2007; Arslan and Dursun 2008; Augulyte et al. 2008; Ochoa-Herrera and Sierra-
Alverez 2008; Yu and Hu 2011; Julinová and Slavík 2012; Li et al. 2013b; Sulaymon et
al. 2013). Pan et al. (2010) also documented the adsorption of phenanthrene to water-
soluble polymeric substances released by bacterial sludge. These studies can serve as a
reminder not to draw a sharp dividing line between biosorption and biodegradation
processes. In fact, the two processes appear to be working in tandem during conventional
wastewater treatment with the application of activated sludge.
Life-Cycle Comments for the Series of Review Articles Table 6 provides a summary of options for the handling of spent cellulose-based
adsorbent materials corresponding to the contaminant classes considered in the four review
articles in this series (Hubbe et al. 2011, 2012, 2013, and the present article). In this table
the word “Yes” is used to indicate that the effectiveness of the proposed approach is at least
partly supported by published articles. The question mark is used in cases where there is a
serious need for more research. And the word “No” is used when the existing literature
has revealed scant support for the given option. As can be seen, there are many question
marks in the table. That’s good news for people who want to embark on a career to try to
solve some of those problems. The table also exposes the seriousness of the challenge
regarding commercial-scale implementation of concepts that already have shown promise
in the laboratory.
REVIEW ARTICLE bioresources.com
Hubbe et al. (2014). “Petrochemicals biosorption,” BioResources 9(4), 7782-7925. 7835
Table 6. Tentative Rating of Possible Regeneration Schemes for Use with the Four Classes of Pollutants Considered in this Series of Articles Metals Dyes Oil Petro-
chem.
REGENERATE THE ADSORBENT Concentrate the rinsate. Biodegrade rinsate & recirculate. Chemically degrade in situ.
Yes No No
No Yes Yes
No -?- No
No -?- -?-
INCINERATE FILLED ADSORBENT Recover energy from biomass. Recover concentrated adsorbate.
Yes -?-
Yes No
Yes No
-?- No
LANDFILL (leaching concerns) -?- Yes No No
BIODEGRADATION OF ADSOBENT Anaerobic (then recirculate) Activated sludge water treatment Composting (self-contained)
No No No
Yes Yes -?-
-?- No -?-
-?- -?- -?-
CONCLUDING REMARKS Based on the many scientific works that have been considered in this review, it is
clear that there is a great deal of interest in using adsorbents based on cellulosic materials
as a means to remove various petrochemical pollutants from water. However, full-scale
implementation of this type of technology does not appear to have kept pace. According
to Gadd (2009) as well as Fomina and Gadd (2014), there has been little or no industrial
exploitation of plant-based adsorbent materials other than activated carbon products. To
put a positive spin on this statement, however, there has been substantial progress in
understanding the wide range of cellulose-based sources that can be used in the preparation
of activated carbons, and progress has been made in understanding how to achieve
favorable pore structures – achieving a good balance between high surface area and ready
accessibility of internal sites for adsorption.
Activated carbon products generally can be described as being highly efficient
adsorbents that can be fully combusted after their use, as one promising option. In addition,
activated carbons loaded with various pollutants can be regenerated by such means as mild
pyrolysis, microbial treatment, and by back-washing. Although back-washing with high-
pH aqueous solution appears to be a good approach for removing non-covalently bound
phenolic compounds from cellulose-based adsorbents, such an approach presupposes that
a wastewater treatment facility is available and that it has adequate means of dealing with
the highly polluted rinsate that results from such operations. One promising approach
would be to subject such rinsate to biodegradation under controlled conditions, possibly
using biosorption once again in a follow-up step to polish water before it passes from a
wastewater treatment system to a natural waterway.
Though it is clear from the surveyed literature that a lot of progress has been made
concerning the regeneration of spent adsorbent, it would appear that there should be a
priority to develop even better systems for in-situ regeneration, with emphasis on
REVIEW ARTICLE bioresources.com
Hubbe et al. (2014). “Petrochemicals biosorption,” BioResources 9(4), 7782-7925. 7836
approaches that break down the contaminant rather than just transferring it to another
phase. The published literature, as has been discussed in this article, already has shown
substantial progress in this area, e.g. the in-situ oxidative treatment of the adsorbent (Chan
et al. 2007; Okawa et al. 2007), or biodegradation of various compounds while they are
mainly being held in place by activated carbon or other cellulose-derived adsorbents
(Ivancev-Tubas et al. 1998; Vinitnantharat et al. 2001; Oh et al. 2013; Sodha et al. 2013;
Toh et al. 2013). Research in this area needs to address a reported tendency for biosorption
to suppress rates of degradation of the adsorbed species (Stringfellow and Alvarez-Cohen
1999; Liu et al. 2009). It would seem that a suitable balance of containment of the
contaminant on the adsorbent material, while also allowing sufficient diffusion to enable
the desired degradative processes to occur, could be achieved by varying such parameters
as pH, temperature, and strategic uses of surfactants, among other variables.
If one’s goal is to promote the usage of cellulose-based adsorbents, it would make
sense to aim for applications that are likely to play to the strength of this type of technology.
As noted by Moreno-Castilla (2004), the use of adsorbents is especially appropriate when
there is a need to remove low concentrations of highly objectionable compounds from
aqueous solution. Biosorption can be recommended as a polishing step after other
wastewater treatment operations, such as pre-filtration, coagulative settling (primary
clarification), and activated sludge (secondary wastewater treatment) have removed the
major portion of contaminants. Relative to membrane-based separations, biosorption
offers far fewer concerns about flow restrictions and fouling. Other options such as
evaporation and fully effective reverse osmosis as means to purify water involve much
higher cost per volume of water to be purified.
Finally, it would seem that the time is ripe for further exploitation of torrefied wood
in certain applications calling for biosorption. One of the promising attributes of torrefied
wood, compared to the source material, is its more hydrophobic character in comparison
to the original plant material, especially following more severe levels of treatment (Ibrahim
et al. 2013). As noted by Penmetsa and Steele (2012), there is potential to impart stronger
hydrophobic character to torrefied wood by treating it with certain low-cost hydrophobic
materials. Such treatment would likely increase the effectiveness of the material for
removing various synthetic organic compounds from water. Compared to activated
carbons, torrefied wood products offer potential advantages such as much higher yield
(relative to the raw material), a well-developed, interconnecting macro-pore structure
associated with fiber lumens, and a rich diversity of surface chemical groups, all
attributable to the much lower level of thermal degradation in comparison to conventional
activated carbons. A wide diversity of surface sites would tend to favor use of an adsorbent
material for a broad range of potential applications. Thus it is hoped that when a similar
review article is written ten years from now, some key developments in the field will
include large-scale, economical preparation of torrefied biomass products that have been
engineered for more effective use as adsorbents.
REVIEW ARTICLE bioresources.com
Hubbe et al. (2014). “Petrochemicals biosorption,” BioResources 9(4), 7782-7925. 7837
REFERENCES CITED
Abdallah, M. A. M. (2013). “The potential of different bio adsorbents for removing
phenol from its aqueous solution,” Environ. Monitoring Assess. 185(8), 6495-6503.
DOI: 10.1007/s10661-012-3041-y
Abe, I., Hayashi, K., Tatsumoto, H., Kitagawa, M., and Hirashima, T. (1985). “The
relation between activated carbon adsorption and water-quality indexes,” Water Res.
19(9), 1191-1193. DOI: 10.1016/0043-1354(85)90356-2
Aber, S., Khataee, A., and Sheydaei, M. (2009). “Optimization of activated carbon fiber
preparation from Kenaf using K2HPO4 as chemical activator for adsorption of
phenolic compounds,” Bioresour. Technol. 100(24), 6586-6591. DOI:
10.1016/j.biortech.2009.07.074
Abuzaid, N. S., and Nakhla, G. F. (1994). “Dissolved oxygen effects on equilibrium and
kinetics of phenolics adsorption by activated carbon,” Environ. Sci. Technol. 28(2),
216-221. DOI: 10.1021/es00051a006
Adachi, A., Ikeda, C., Takagi, S., Fukao, N., Yoshie, E., and Okano, T. (2001a).
“Efficiency of rice bran for removal of organochlorine compounds and benzene from
industrial wastewater,” J. Agric. Food Chem. 49, 1309-1314. DOI:
10.1021/jf001147c
Adachi, A., Komiyama, T., Tanaka, T., Nakatani, M., Muguruma, R., and Okano, T.
(2001b). “Removal efficiency of defatted seed for organochlorine compounds,” J.
Health Sci. 47(1), 54-59. DOI: 10.1248/jhs.47.54
Adamson, A. W., and Gast, A. P. (1997). Physical Chemistry of Surfaces, Wiley, New
York.
Adhikari, S., Chattopadhyay, P., and Ray, L. (2010). “Biosorption of Malathion by dry
cells of an isolated Bacillus sp. S-14,” Chem. Speciation Bioavail. 22(3), 207-213.
DOI: 10.3184/095422910X12843150483621
Adolphs, J. (2007). “Excess surface work - A modelless way of getting surface energies
and specific surface areas directly from sorption isotherms,” Applied Surf. Sci.
253(13), 5645-5649. DOI: 10.1016/j.apsusc.2006.12.089
Agarry, S. E., Ogunleye, O. O., and Aworanti, O. A. (2013). “Biosorption equilibrium,
kinetic and thermodynamic modelling of naphthalene removal from aqueous solution
onto modified spent tea leaves,” Environ. Technol. 34(7), 825-839. DOI:
10.1080/09593330.2012.720616
Agarwal, B., Thakur, P. K., and Balomajumder, C. (2013). “Use of iron-impregnated
granular activated carbon for co-adsorptive removal of phenol and cyanide: Insight
into equilibrium and kinetics,” Chemical Engineering Communications 200(9), 1278-
1292. DOI: 10.1080/00986445.2012.744749
Aharoni, C., and Tomkins, F. E. (1970). “Kinetics of adsorption and desorption and the
Elovich equation,” in: Advances in Catalysis and Related Subjects, Eley, D. D., Pines,
H., and Weisz, P. B. (eds.), Academic Press, New York, pp. 1-49.
Ahmad, M., Lee, S. S., Dou, X. M., Mohan, D., Sung, J.-K., Yang, J. E., and Ok, Y. S.
(2012). “Effects of pyrolysis temperature on soybean stover- and peanut shell-derived
biochar properties and TCE adsorption in water,” Bioresource Technology 118, 536-
544. DOI: 10.1016/j.biortech.2012.05.042
REVIEW ARTICLE bioresources.com
Hubbe et al. (2014). “Petrochemicals biosorption,” BioResources 9(4), 7782-7925. 7838
Ahmad, M., Lee, S. S., Rajapaksha, A. U., Vithanage, M., Zhang, M., Cho, J. S., Lee, S.-
E., and Ok, Y. S. (2013). “Trichloroethylene adsorption by pine needle biochars
produced at various pyrolysis temperatures,” Bioresource Technology 143, 615-622.
DOI: 10.1016/j.biortech.2013.06.033
Ahmaruzzaman, M., and Sharma, D. K. (2005). “Adsorption of phenols from
wastewater,” J. Colloid Interface Sci. 287(1), 14-24. DOI: 10.1016/j.jcis.2005.01.075
Ahmed, M. J., and Theydan, S. K. (2012). “Equilibrium isotherms, kinetics and
thermodynamics studies of phenolic compounds adsorption on palm-tree fruit
stones,” Ecotoxicology and Environmental Safety 84, 39-45. DOI:
10.1016/j.ecoenv.2012.06.019
Ahmedna, M., Marshall, W. E., Husseiny, A. A., Goktepe, I., and Rao, R. M. (2004).
“The use of nutshell carbons in drinking water filters for removal of chlorination by-
products,” J. Chem. Technol. Biotechnol. 79, 1092-1097. DOI: 10.1002/jctb.1087
Ahn, S., Werner, D., Karapanagioti, H. K., McGlothlin, D. R., Zare, R. N., and Luthy, R.
G. (2005). “Phenanthrene and pyrene sorption and intraparticle diffusion in
polyoxymethyene, coke and activated carbon,” Environ. Sci. Technol. 39(17), 6516-
6526. DOI: 10.1021/es050113o
Akhtar, M., Bhanger, M. E., Iqbal, S., and Hasany, S. M. (2005). “Efficiency of rice bran
for the removal of selected organics from water: Kinetic and thermodynamic
investigations,” J. Agric. Food Chem. 53, 8655-8662. DOI: 10.1021/jf058060h
Akhtar, M., Bhanger, M. I., Iqbal, S., and Hasany, S. M. (2006). “Sorption potential of
rice husk for the removal of 2,4-dichlorophenol from aqueous solutions: Kinetic and
thermodynamic investigations,” J. Hazard. Mater. 128, 44-52. DOI:
10.1016/j.jhazmat.2005.07.025
Akhtar, M., Hasany, S. M., Bhanger, M. I., and Iqbal, S. (2007a). “Sorption potential of
Moringa olifeira pods for the removal of organic pollutants from aqueous solutions,”
J. Hazard. Mater. 141, 546-556. DOI: 10.1016/j.jhazmat.2006.07.016
Akhtar, M., Hasany, S. M., Bhanger, M. I., and Iqbal, S. (2007b). “Low cost sorbents for
the removal of methyl parathion pesticide from aqueous solutions,” Chemosphere
66(10), 1829-1838. DOI: 10.1016/j.chemosphere.2006.09.006
Akhtar, M., Iqbal, S., Bhanger, M. I., Zia-Ul-Haq, M., and Moazzam, M. (2009).
“Sorption of organophosphorous pesticides onto chickpea husk from aqueous
solutions,” Colloids Surf. B – Biointerfaces 69(1), 63-70. DOI:
10.1016/j.colsurfb.2008.10.019
Aksu, Z. (2002). “Determination of the equilibrium, kinetic and thermodynamic
parameters of the batch biosorption of nickel(II) ions onto Chlorella vulgaris,”
Process Biochem. 38, 89-99. DOI: 10.1016/S0032-9592(02)00051-1
Aksu, Z. (2005). “Application of biosorption for the removal of organic pollutants: A
review,” Process Biochem. 40, 997-1026. DOI: 10.1016/j.procbio.2004.04.008
Aksu, Z., and Gönen, F. (2004). “Biosorption of phenol by immobilized activated sludge
in a continuous packed pad: Prediction of breakthrough curves,” Process Biochem.
39(5), 599-613. DOI: 10.1016/S0032-9592(03)00132-8
Aksu, Z., and Kabasakal, E. (2003). “Batch adsorption of 2,3-dichloropehnoxy-acetic
acid (2,4-D) from aqueous solution by granular activated carbon,” Separation and
Purification Technology 35, 223-240. DOI:10.1016/S1383-5866(03)00144-8
Aksu, Z., and Kabasakal, E. (2005). “Adsorption characteristics of 2,4-
REVIEW ARTICLE bioresources.com
Hubbe et al. (2014). “Petrochemicals biosorption,” BioResources 9(4), 7782-7925. 7839
dichlorophenoxyacetic acid (2,4-D) from aqueous solution on powdered activated
carbon,” J. Environ. Sci. Health. Pt. B – Pesticides Food Contam. Ag. Wastes 40(4),
545-570. DOI: 10.1081/PFC-200061533
Aksu, Z., and Yener, J. (1998). “Investigation of the biosorption of phenol and
monochlorinated phenols on the dried activated sludge,” Proc. Biochem. 33(6), 649-
655. DOI: 10.1016/S0032-9592(98)00029-6
Aksu, Z, and Yener, J. (2001). “A comparative adsorption/biosorption study of
monochlorinated phenols onto various sorbents,” Waste Manage. 21, 695-702. DOI:
10.1016/S0956-053X(01)00006-X
Alam, M. Z., Muyibi, S. A., and Toramae, J. (2007). “Statistical optimization of
adsorption processes for removal of 2,4-dichlorophenol by activated carbon derived
from oil palm empty fruit bunches,” J. Environ. Sci. – China 19(6), 674-677. DOI:
10.1016/S1001-0742(07)60113-2
Allen, S. J., Koumanova, B., Kircheva, Z., and Nenkova, S. (2005). “Adsorption of 2-
nitrophenol by technical hydrolysis lignin: Kinetics, mass transfer, and equilibrium
studies,” Indust. Eng. Chem. Res. 44(7), 2281-2287. DOI: 10.1021/ie049455d
Ali, I., Asim, M., and Khan, T. A. (2012). “Low cost adsorbents for the removal of
organic pollutants from wastewater,” Journal of Environmental Management 113,
170-183. DOI: 10.1016/j.jenvman.2012.08.028
Al-Khalid, T., and El-Naas, M. H. (2012). “Aerobic biodegradation of phenols: A
comprehensive review,” Crit. Revs. Environ. Sci. Technol. 42(16), 1631-1690. DOI:
10.1080/10643389.2011.569872
Álvarez, P. M., Beltrán, F. J., Gómez-Serrano, V., Jaramillo, J., and Rodríguez, E. M.
(2004). “Comparison between thermal and ozone regenerations of spent activated
carbon exhausted with phenol,” Water Res. 38, 2155-2165. DOI:
10.1016/j.watres.2004.01.030
Alvarez, P. M., Beltran, F. J., Masa, F. J., and Pocostales, J. P. (2009). “A comparison
between catalytic ozonation and activated carbon adsorption/ozone-regeneration
processes for wastewater treatment,” Appl. Catal. B – Environ. 92(3-4), 393-400.
DOI: 10.1016/j.apcatb.2009.08.019
Alvarez, P. M., García-Araya, J. F., Beltrán, F. J., Masa, F. J., and Medina, F. (2005).
“Ozonation of activated carbons: Effect on the adsorption of selected phenolic
compounds from aqueous solutions,” J. Colloid Interface Sci. 283(2), 503-512. DOI:
10.1016/j.jcis.2004.09.014
Amstaetter, K., Eek, E., and Cornelissen, G. (2012). “Sorption of PAHs and PCBs to
activated carbon: Coal versus biomass-based quality,” Chemosphere 87(5), 573-578.
DOI: 10.1016/j.chemosphere.2012.01.007
Anderson, N., Jones, J. G., Page-Dumroese, D., McCollum, D., Baker, S., Loeffler, D.,
and Chung, W. (2013). “A comparison of producer gas, biochar, and activated carbon
from two distributed scale thermochemical conversion systems used to process forest
biomass,” Energies 6(1), 164-183. DOI: 10.3390/en6010164
Ania, C. O., Parra, J. B., Menéndez, J. A., and Pis, J. J. (2005). “Effect of microwave and
conventional regeneration on the microporous and mesoporous network and on the
adsorptive capacity of activated carbons,” Micropor. Mesopor. Mater. 85, 7-15. DOI:
10.1016/j.micromeso.2005.06.013
Anirudhan, T. S., Sreekumari, S. S., and Bringle, C. D. (2009). “Removal of phenols
REVIEW ARTICLE bioresources.com
Hubbe et al. (2014). “Petrochemicals biosorption,” BioResources 9(4), 7782-7925. 7840
from water and petroleum industry refinery effluents by activated carbon obtained
from coconut coir pith,” Adsorp. J. Inernat. Adsorp. Soc. 15(5-6), 439-451. DOI:
10.1007/s10450-009-9193-6
Antizar-Ladislao, B., and Galil, N. I. (2004). “Biosorption of phenol and chlorophenols
by acclimated residential biomass under bioremediation conditions in a sandy
aquifer,” Water Res. 38, 267.276. doi:10.1016/j.watres.2003.09.032
Aravindhan, R., Rao, J. R., and Nair, B. U. (2009). “Application of a chemically
modified green macro alga as a biosorbent for phenol removal,” J. Environ. Manag.
90(5), 1877-1883. DOI: 10.1016/j.jenvman.2008.12.005
Aravindhan, R., Rao, J. R., and Nair, B. U. (2011). “Adsorption of phenol onto activated
carbon from seaweed: Determination of the optimal experimental parameters using
factorial design,” Journal of The Taiwan Institute of Chemical Engineers 42(6), 952-
956. DOI: 10.1016/j.jtice.2011.04.003
Arslan, C. S., and Dursun, A. Y. (2008). “Biosorption of phenol on dried activated
sludge: Effect of temperature,” Separ. Sci. Technol. 43(11-12), 3251-3268. DOI:
10.1080/01496390802063671
Ashour, I., Al-Rub, F. A., Sheikha, D., and Volesky, B. (2008). “Biosorption of
naphthalene from refinery simulated waste-water on blank alginate beads and
immobilized dead algal cells,” Separ. Sci. Technol. 43(8), 2208-2224. DOI:
10.1080/01496390801887351
Augulyte, L., Kliaugaite, D., Racys, V., Jankunaite, D., Zaliauskiene, A., Andersson, P.
L., and Bergqvist, P.-A. (2008). “Chemical and ecotoxicological assessment of
selected biologically activated sorbents for treating wastewater polluted with
petroleum products with special emphasis on polycyclic aromatic hydrocarbons,”
Water Air Soil Pollution 195, 243-256. DOI: 10.1007/s11270-008-9743-7
Augulyte, L., Kliaugaite, D., Racys, V., Jankunaite, D., Zaliauskiene, A., Bergqvist, P.
A., and Andersson, P. L. (2009). “Multivariate analysis of a biologically activated
carbon (BAC) system and its efficiency for removing PAHs and aliphatic
hydrocarbons from wastewater polluted with petroleum products,” J. Hazard. Mater.
170(1), 103-110. DOI: 10.1016/j.jhazmat.2009.04.129
Ayotamuno, M. J., Kogbara, R. B., Ogaji, S. O. T., and Probert, S. D. (2006). “Petroleum
contaminated ground-water: Remediation using activated carbon,” Applied Energy
83, 1258-1264. DOI: 10.1016/j.apenergy.2006.01.004
Ayranci, E., and Duman, O. (2006). “Adsorption of aromatic organic acids onto high area
activated carbon cloth in relation to wastewater purification,” J. Hazard. Mater. B
136, 542-552. DOI: 10.1016/j.jhazmat.2005.12.029
Aytekin, C. (1991). “Application of the Polanyi adsorption potential theory to adsorption
of phenolic compounds from water solution onto activated carbon,” Spectros. Lett.
24(5), 653-664. DOI: 10.1080/00387019108018146
Azad, F. S., Abedi, J., and Iranmanesh, S. (2013). “Removal of naphthenic acids using
adsorption process and the effect of the addition of salt,” Journal of Environmental
Science and Health Part A-Toxic/Hazardous Substances & Environmental
Engineering 48(13), 1649-1654. DOI: 10.1080/10934529.2013.815457
Bai, Y., Huang, Z.-H., Wang, M.-X., and Kang, F. Y. (2013). “Adsorption of benzene
and ethanol on activated carbon nanofibers prepared by electrospinning,” Adsorption
- Journal of the International Adsorption Society 19(5), 1035-1043. DOI:
REVIEW ARTICLE bioresources.com
Hubbe et al. (2014). “Petrochemicals biosorption,” BioResources 9(4), 7782-7925. 7841
10.1007/s10450-013-9524-5
Bamforth, S. M., and Singleton, I. (2005). “Bioremediation of polycyclic aromatic
hydrocarbons: Current knowledge and future directions,” J. Chem. Technol.
Biotechnol. 80, 723-736. DOI: 10.1002/jctb.1276
Bansode, R. R., Losso, J. N., Marshall, W. E., Rao, R. M., and Portier, R. J. (2003).
“Adsorption of volatile organic compounds by pecan shell and almost shell-based
granular activated carbons,” Bioresour. Technol. 90, 175-184. DOI: 10.1016/S0960-
8524(03)00117-2
Barbour, J. P., Smith, J. A., and Chiou, C. T. (2005). “Sorption of aromatic organic
pollutants to grasses from water,” Environ Sci. Technol. 39(21), 8369-8373. DOI:
10.1021/es0504946
Bartholdy, S., Bjorner, M. G., Solbraa, E., Shapiro, A., and Kontogeorgis, G. M. (2013).
“Capabilities and limitations of predictive engineering theories for multicomponent
adsorption,” Industrial & Engineering Chemistry Research 52(33), 11552-11563.
DOI: 10.1021/ie400593b
Bayramoglu, G., Gursel, I., Tunali, Y., and Arica, M. Y. (2009). “Biosorption of phenol
and 2-chlorophenol by Funalia trogii pellets,” Bioresour. Technol. 100(10), 2685-
2691. DOI: 10.1016/j.biortech.2008.12.042
Belashchenko, D. K., Rodnikova, M. N., Balabaev, N. K., and Solonina, I. A. (2014).
“Investigating hydrogen bonds in liquid ethylene glycol structure by means of
molecular dynamics,” Russian J. Phys. Chem. A. 88(1), 94-102. DOI:
10.1134/S0036024414010063
Bell, J. P., and Tsezos, M. (1987). “Removal of hazardous organic pollutants by biomass
adsorption,” J. Water Pollut. Control Fed. 59(4), 191-198.
Bell, J. P., and Tsezos, M. (1988). “The selectivity of biosorption of hazardous organics
by microbial biomass,” Water Res. 22(10), 1245-1251. DOI: 10.1016/0043-
1354(88)90111-X
Bello-Huitle, V., Atenco-Fernández, P., and Reyes-Mazzoco, R. (2010). “Adsorption
studies of methylene blue and phenol onto pecan and castile nutshells prepared by
chemical activation,” Revista Mexicana de Ingeniería Quimica 9(3), 313-322.
Benoit, P., Barriuso, E., and Calvet, R. (1998). “Biosorption characterization of
herbicides, 2,4-D and atrazine, and two chlorophenols on fungal mycelium,”
Chemosphere 37(7), 1271-1282. DOI: 10.1016/S0045-6535(98)00125-8
Berezkin, V. I., Viktorovskiĭ, I. V., Golubev, L. V., Petrova, V. N., and Khoroshko, L. O.
(2002). “A comparative study of the sorption capacity of activated charcoal, soot, and
fullerenes for organochlorine compounds,” Tech. Phys. Lett. 28(11), 885-888. DOI:
10.1134/1.1526872
Beverley, K. J., Cling, J. H., Fletcher, P. D. I, and Thubron, S. (1999). “Evaporation rates
of water containing within porous silica particles,” Phys. Chem. Chem. Phys. 1(5),
909-911. DOI: 10.1039/a809241i
Bhatnagar, A., Vilar, V. J. P., Botelho, C. M. S., and Boaventura, R. A. R. (2010).
“Coconut-based biosorbents for water treatment - A review of the recent literature,”
Advan. Colloid Interface Sci. 160, 1-15. DOI: 10.1016/j.cis.2010.06.011
Bhowmik, M., and Bajpai, S. K. (2012). “Sorptive removal of gatifloxacin from synthetic
wastewater using chitin: An equilibrium study,” Environ. Eng. Manag. J. 11(8),
1395-1406.
REVIEW ARTICLE bioresources.com
Hubbe et al. (2014). “Petrochemicals biosorption,” BioResources 9(4), 7782-7925. 7842
Bilgili, M. S., Varank, G., Sekman, E., Top, S., Özçimen, D., and Yazici, R. (2012).
“Modeling 4-chlorophenol removal from aqueous solutions by granular activated
carbon,” Environ. Model. Assess. 17(3), 289-300. DOI: 10.1007/s10666-011-9293-z
Bina, B., Pourzamani, H., Rashidi, A., and Amin, M. M. (2012). “Ethylbenzene removal
by carbon nanotubes from aqueous solution,” J. Environ. Public Health 2012, article
no. 817187.
Blackburn, R. S., Harvey, A., Kettle, L. L., Manian, A. P., Payne, J. D., and Russell, S. J.
(2007). “Sorption of chlorhexidine on cellulose: Mechanism of binding and molecular
recognition,” Journal of Physical Chemistry B 111, 8775-8784. DOI:
10.1021/jp070856r
Blanco-Martínez, D. A., Giraldo, L., and Moreno-Piraján, J. C. (2009). “Effect of the pH
in the adsorption and in the immersion enthalpy of mono-hydroxylated phenols from
aqueous solutions on activated carbons,” J. Hazard. Mater. 169, 291-296. DOI:
10.1016/j.jhazmat.2009.03.099
Bloom, J. W. G., and Wheeler, S. E. (2011). “Taking the aromaticity out of aromatic
hydrocarbons by insoluble dietary fiber,” Angew. Chem. 123(34), 7993-7995. DOI:
10.1002/ange.201102982
Boki, K., Kadota, S., Takahashi, M., and Kitakouji, M. (2007). “Uptake of polycyclic
aromatic hydrocarbons by insoluble dietary fiber,” J. Health Sci. 53(1), 99-106. DOI:
10.1248/jhs.53.99
Boucher, J., Steiner, L., and Marison, I. W. (2007). “Bio-sorption of atrazine in the press-
cake from oilseeds,” Water Res. 41, 3209-3216. DOI: 10.1016/j.watres.2007.05.038
Boussahel, R., Irinislimane, H., Harik, D., and Moussaoui, K. M. (2009). “Adsorption,
kinetics, and equilibrium studies on removal of 4,4-DDT from aqueous solutions
using low-cost adsorbents,” Chem. Eng. Commun. 196(12), 1547-1558. DOI:
10.1080/00986440903155733
Boving, T. G., and Zhang, W. (2004). “Removal of aqueous-phase polynuclear aromatic
hydrocarbons using aspen wood fibers,” Chemosphere 54(7), 831-839. DOI:
10.1016/j.chemosphere.2003.07.007
Bowen, W. R., and Jenner, F. (1995). “The calculation of dispersion forces for
engineering applications,” Advan. Colloid Interface Sci. 56, 201-243. DOI:
10.1016/0001-8686(94)00233-3
Boyd, G. E., Adamson, A. W., and Myers, L. S. (1947). “The exchange adsorption of
ions from aqueous solution by organic zeolites. II. Kinetics,” Journal of the American
Chemical Society 69, 2836-2848. DOI: 10.1021/ja01203a066
Brandt, S., and Zeng, A. P., and Deckwer, W. D. (1997). “Adsorption and desorption of
pentachlorophenol on cells of Mycobacterium chloropehnolicum PCP-1,” Biotechnol.
Bioeng. 55(3), 480-489. DOI: 10.1002/(SICI)1097-0290(19970805)55:3<480::AID-
BIT3>3.0.CO;2-8
Brás, I., Lemos, L. T., Alves, A., and Pereira, M. F. R. (2004). “Application of pine bark
as a sorbent for organic pollutants in effluents,” Manag. Environ. Qual. 15(5), 491-
501. DOI: 10.1108/14777830410553933
Brás, I., Lemos, L., Alves, A., and Pereira, M. F. R. (2005). “Sorption of
pentachlorophenol on pine bark,” Chemosphere 60, 1095-1102. DOI:
10.1016/j.chemosphere.2004.12.064
REVIEW ARTICLE bioresources.com
Hubbe et al. (2014). “Petrochemicals biosorption,” BioResources 9(4), 7782-7925. 7843
Brás, I., Santos, L., and Alves, A. (1999). “Organochlorine pesticides removal by Pinus
bark sorption,” Environ. Sci. Technol. 33, 631-634. DOI: 10.1021/es980402v
Brasquet, C., and Le Cloirec, P. (1999). “Effects of activated carbon cloth surface on
organic adsorption in aqueous solutions. Use of statistical methods to describe
mechanisms,” Langmuir 15(18), 5906-5912. DOI: 10.1021/la9811160
Brasquet, C., Roussy, J., Subrenat, E., and Le Cloirec, P. (1996). “Adsorption and
selectivity of activated carbon fibers application to organics,” Environ. Technol.
17(11), 1245-1252. DOI: 10.1080/09593331708616494
Browne, T. E., and Cohen, Y. (1990). “Aqueous-phase adsorption of trichloroethylene
and chloroform onto polymeric resins and activated carbon,” Ind Eng. Chem. Res.
29(7), 1338-1345. DOI: 10.1021/ie00103a038
Brunauer, S., Emmet, P. H., and Teller, E. (1938). “Adsorption of gases in
multimolecular layers,” Journal of the American Chemical Society 60, 309-319. DOI:
10.1021/ja01269a023
Cabrera, A., Cox, L., Spokas, K. A., Celis, R., Hermosín, M. C., Cornejo, J., and
Koskinen, W. C. (2011). “Comparative sorption and leaching study of the herbicides
fluometuron and 4-chloro-2-methylphenoxyacetic acid (MCPA) in a soil amended
with biochars and other sorbents,” Journal of Agricultural and Food Chemistry
59(23), 12550-12560. DOI: 10.1021/jf202713q
Cal, M. P., Larson, S. M., and Rood, M. J. (1994). “Experimental and modeled results
describing the adsorption of acetone and benzene onto activated carbon fibers,”
Environ. Prog. 13(1), 26-30. DOI: 10.1002/ep.670130114
Calace, N., Nardi, E., Petronio, B. M., and Pietroletti, M. (2002). “Adsorption of phenols
by papermill sludges,” Environ. Pollut. 118, 315-319. DOI: 10.1016/S0269-
7491(01)00303-7
Calleja, G., Serna, J., and Rodríguez, J. (1993). “Kinetics of adsorption of phenolic
compounds from wastewater onto activated carbon,” Carbon 31(5), 691-697. DOI:
10.1016/0008-6223(93)90005-U
Cao, X. D., Ma, L. N., Gao, B., and Harris, W. (2009). “Dairy-manure derived biochar
effectively sorbs lead and atrazine,” Environ. Sci. Technol. 43(9), 3285-3291. DOI:
10.1021/es803092k
Capasso, R., and De Martino, A. (2010). “Polymerin and lignimerin, as humic acid-like
sorbents from vegetable waste, for the potential remediation of waters contaminated
with heavy metals, herbicides, or polycyclic aromatic hydrocarbons,” J. Agr. Food
Chem. 58(19), 10283-10299. DOI: 10.1021/jf101574r
Caturla, F., Martín-Martínez, J. M., Molina-Sabio, M., Rodriguez-Reinoso, F., and
Torregrosa, R. (1988). “Adsorption of substituted phenols on activated carbon,” J.
Colloid Interface Sci. 124, 528-534. DOI: 10.1016/0021-9797(88)90189-0
Chan, H. W., Chan, C. M., Ang, P. O., and Wong, P. K. (2007). “Integrated biosorption
and photocatalytic oxidation treatment of di(2-ethylhexyl)phthalate,” J. Appl. Phycol.
19(6), 745-753. DOI: 10.1007/s10811-007-9218-z
Chan, S. M. N., Luan, T. G., Wong, M. H., and Tam, N. F Y. (2006). “Removal and
biodegradation of polycyclic aromatic hydrocarbons by Selenastrum capricornutum,”
Environ. Toxic. Chem. 25(7), 1772-1779. DOI: 10.1897/05-354R.1
Chang, K. L., Hsieh, J. F., Ou, B. M., Chang, M. H., Hseih, W. Y., Lin, J. H., Huang, P.
J., Wong, K. F., and Chen, S. T. (2012). “Adsorption studies on the removal of an

REVIEW ARTICLE bioresources.com
Hubbe et al. (2014). “Petrochemicals biosorption,” BioResources 9(4), 7782-7925. 7844
endocrine-disrupting compound (Bisphenol A) using activated carbon from rice straw
agricultural waste,” Separation Science and Technology 47(10), 1514-1521. DOI:
10.1080/01496395.2011.647212
Chatzopoulos, D., and Varma, A. (1995). “Aqueous-phase adsorption and desorption of
toluene in activated carbon fixed beds: Experiments and model,” Chem. Eng. Sci. 50,
127-141. DOI: 10.1016/0009-2509(94)00195-W
Chatzopoulos, D., Varma, A., Irvine, R. L. (1994). “Adsorption and desorption studies in
the aqueous-phase for the toluene/activated carbon system,” Environ. Prog. 13(1), 21-
25. DOI: 10.1002/ep.670130113
Chen, B., and Chen, Z. (2009). “Sorption of naphthalene and 1-naphthol by biochars or
orange peels with different pyrolytic temperatures,” Chemosphere 76(1), 127-133.
DOI: 10.1016/j.chemosphere.2009.02.004
Chen, B., and Schnoor, J. L. (2009). “Role of suberin, suberan, and hemicellulose in
phenanthrene sorption by root tissue fractions of switchgrass (Panicum virgatum),”
Environ. Sci. Technol. 43, 4130-4136. DOI: 10.1021/es803510u
Chen, B., Zhou, D., and Zhu, L. (2008). “Transitional adsorption and partition of
nonpolar and polar aromatic contaminants by biochar of pine needles with different
pyrolytic temperatures,” Environ. Sci. Technol. 42(14), 5137-5143. DOI:
10.1021/es8002684
Chen, B. L., and Ding, J. (2012). “Biosorption and biodegradation of phenanthrene and
pyrene in sterilized and unsterilized soil slurry systems stimulated by Phanerochaete
chrysosporium,” J. Hazard. Mater. 229, 159-169. DOI:
10.1016/j.jhazmat.2012.05.090
Chen, B. L., Johnson, E. J., Chefetz, B., Zhu, L. Z., and Xing, B. S. (2005). “Sorption of
polar and nonpolar aromatic organic contaminants by plant cuticular materials: Role
of polarity and accessibility,” Environ. Sci. Technol. 39, 6138-6146. DOI:
10.1021/es050622q
Chen, B.-L., and Li, Y.-G. (2007). “Sorption of 1-naphthol by plant cuticular fractions,”
J. Environ. Sci. – China 19(10), 1214-1220. DOI: 10.1016/S1001-0742(07)60198-3
Chen, B. L., Wang, Y. S., and Hu, D. F. (2010). “Biosorption and biodegradation of
polycyclic aromatic hydrocarbons in aqueous solutions by a consortium of white-rot
fungi,” J. Hazard. Mater. 179, 845-851. DOI: 10.1016/j.jhazmat.2010.03.082
Chen, B. L., Yuan, M. X., and Liu, H. (2011). “Removal of polycyclic aromatic
hydrocarbons from aqueous solution using plant residue materials as a biosorbent,” J.
Hazard. Mater. 188, 436-442. DOI: 10.1016/j.jhazmat.2011.01.114
Chen, Y., Wetzel, T., Aranovich, G. L., and Donohue, M. D. (2006). “Generalization of
Kelvin's equation for compressible liquids in nanoconfinement,” J. Colloid Interface
Sci. 300(1), 45-51. DOI: 10.1016/j.jcis.2006.03.025
Chen, Y.-D., Huang, M.-J., Huang, B., and Chen, X.-R. (2012a). “Mesoporous activated
carbon from inherently potassium-rich pokeweed by in situ self-activation and its use
for phenol removal,” Journal of Analytical and Applied Pyrolysis 98, 159-165. DOI:
10.1016/j.jaap.2012.09.011
Chen, Z. M., Chen, B. L., and Chiou, C. T. (2012b). “Fast and slow rates of naphthalene
sorption to biochars produced at different temperatures,” Environmental Science &
Technology 46(20), 11104-11111. DOI: 10.1021/es302345e
REVIEW ARTICLE bioresources.com
Hubbe et al. (2014). “Petrochemicals biosorption,” BioResources 9(4), 7782-7925. 7845
Cheng, X., Kan, A. T., and Tomson, M. B. (2005). “Uptake and sequestration of
naphthalene and 1,2-dichlorobenzene by C60,” J. Nanoparticle Res. 7, 555-567. DOI:
10.1007/s11051-005-5674-z
Cherifi, H., Hanini, S., and Bentahar, F. (2009). “Adsorption of phenol from wastewater
using vegetal cords as a new adsorbent,” Desalination 244, 177-187. DOI:
10.1016/j.desal.2008.05.022
Chern, J.-M., and Chien, Y.-W. (2002). “Adsorption of nitrophenol onto activated
carbon: Isotherms and breakthrough curves,” Water Res. 36, 647-655. DOI:
10.1016/S0043-1354(01)00258-5
Chern, J. M., Chien, Y. W. (2003). “Competitive adsorption of benzoic acid and p-
nitrophenol onto activated carbon: Isotherm and breakthrough curves,” Water Res.
37(10), 2347-2356. DOI: 10.1016/S0043-1354(03)00038-1
Chiu, C.-H., Lin, T.-F., and Young, C.-C. (2003). “Short-term sorption of toluene vapor
onto natural organic materials,” Water Air Soil Pollution 144, 223-241. DOI:
10.1023/A:1022977503362
Choi, S.-D., Hong, H.-B., and Chang, Y.-S. (2003). “Adsorption of halogenated aromatic
pollutants by a protein released from Bacillus pumilus,” Water Res. 37(16), 4004-
4010. DOI: 10.1016/S0043-1354(03)00308-7
Choi, S. T., and Huber, D. J. (2009). “Differential sorption of 1-methylcyclopropene to
fruit and vegetable tissues, storage and cell wall polysaccharides, oils, and lignins,”
Postharvest Biology Technol. 52, 62-70. DOI: 10.1016/j.postharvbio.2008.11.002
Chowdhury, Z. Z., Abd Hamid, S. B., Das, R., Hasan, M. R., Zain, S. M., Khalid, K., and
Uddin, M. N. (2013). "Preparation of carbonaceous adsorbents from lignocellulosic
biomass and their use in removal of contaminants from aqueous solution,"
BioResources 8(4), 6523-6555.
Chuang, C.-L., Chiang, P.-C., and Chang, E. E. (2003a). “Kinetics of benzene adsorption
onto activated carbon,” Environ. Sci. Pollut. Res. 10(1), 6-8. DOI:
10.1065/espr2001.10.098
Chuang, C. L., Chiang, P. C., and Chang, E. E. (2003b). “Column study of benzene
adsorption onto activated carbon,” Carbon 41(12), 2427-2430. DOI: 10.1016/S0008-
6223(03)00153-2
Chularueangaksorn, P., Tanaka, S., Fujii, S., and Kunacheva, C. (2013). “Regeneration
and reusability of anion exchange resin used in perfluorooctane sulfonate removal by
batch experiments,” Journal of Applied Polymer Science 130(2), 884-890. DOI:
10.1002/app.39169
Chung, M. K., Tsui, M. T. K., Cheung, K. C., Tam, N. F. Y., and Wong, M. H. (2007).
“Removal of aqueous phenanthrene by brown seaweed Sargassum hemiphyllum:
Sorption-kinetic and equilibrium studies,” Separ. Purif. Technol. 54(3), 355-362.
DOI: 10.1016/j.seppur.2006.10.008
Cong, Q., Yuan, X., and Qu, J. (2013). “A review on the removal of antibiotics by carbon
nanotubes,” Water Sci. Technol. 68(8), 1679-1687. DOI: 10.2166/wst.2013.420
Cookson, J. T. (1978). “Adsorption mechanisms: The chemistry of organic adsorption on
activated carbon,” In: Cheremisinoff, P. N., and Ellerbusch, F. (eds.), Carbon
Adsorption Handbook, Ann Arbor Science, Ann Arbor, MI, pp. 241-279.
Costa, A. S., Romao, L. P. C., Araújo, B. R., Lucas, S. C. O., Maciel, S. T. A.,
Wisniewski, M. A., and Alexandre, M. R. (2012). “Environmental strategies to
REVIEW ARTICLE bioresources.com
Hubbe et al. (2014). “Petrochemicals biosorption,” BioResources 9(4), 7782-7925. 7846
remove volatile aromatic fractions (BTEX) from petroleum industry wastewater using
biomass,” Bioresour. Technol. 105, 31-39. DOI:
http://dx.doi.org/10.1016/j.biortech.2011.11.096
Coughlin, R. W., and Ezra, F. S. (1968). “Role of surface acidity in the adsorption of
organic pollutants on the surface of carbon,” Environ. Sci. Technol. 2(4), 291-297.
DOI: 10.1021/es60016a002
Coughlin, R. W., Ezra, F. S., and Tan, R. N. (1968). “Influence of chemisorbed oxygen in
adsorption onto carbon from aqueous solution,” J. Colloid Interface Sci. 28(3-4), 386-
396. DOI: 10.1016/0021-9797(68)90069-6
Crisafully, R., Milhome, M. A. L., Cavalcante, R. M., Silveira, E. R., Keukeleire, D. D.,
and Nascimento, R. F. (2008). “Removal of some polycyclic aromatic hydrocarbons
from petrochemical wastewater using low-cost adsorbents of natural origin,”
Bioresour. Technol. 99, 4515-4519. DOI: 10.1016/j.biortech.2007.08.041
Crosby, D. G. (1981). “Environmental chemistry of pentachlorophenol,” Pure Appl.
Chem. 53, 1051-1080. DOI: 10.1351/pac198153051051
Cuerda-Correa, E. M., Díaz-Díez, M. A., Macías-García, A., and Gañán-Gómez, J.
(2006). “Preparation of activated carbons previously treated with sulfuric acid - A
study of their adsorption capacity in solution,” Appl. Surf. Sci. 252(17), 6042-6045.
DOI: 10.1016/j.apsusc.2005.11.013
Cunha, G. D., Romão, L. P. C., Santos, M. C., Araújo, B. R., Navickiene, S., and de
Pádua, V. L. (2010). “Adsorption of trihalomethanes by humin: Batch and fixed bed
column studies,” Bioresour. Technol. 101(10), 3345-3354. DOI:
10.1016/j.biortech.2009.11.096
Dąbrowski, A., Podkościelny, P., Hubicki M., and Barczak, M. (2005). “Adsorption of
phenolic compounds by activated carbon – A critical review,” Chemosphere 58,
1049-1070. DOI: 10.1016/j.chemosphere.2004.09.067
Daifullah, A. A. M., and Girgis, B. S. (1998). “Removal of some substituted phenols by
activated carbon obtained from agricultural waste,” Water Res. 32(4), 1169-1177.
DOI: 10.1016/S0043-1354(97)00310-2
Daifullah, A. A. M., and Girgis, B. S. (2003). “Impact of surface characterisitics of
activated carbon on adsorption of BTEX,” Colloids Surf. A – Physicochem. Eng.
Aspects 214, 181-193. DOI: 10.1016/S0927-7757(02)00392-8
Dalmacija, B., Tamaš, Z., Miškovic, D., Karlovic, E., and Petrovic, O. (1992). “The
biosorption of selected pesticides from water by biologically activated carbon,”
Water Sci. Technol. 26(9-11), 1991-1994.
Dargaville, T. R., Guerzoni, F. N., Looney, M. G., and Solomon, D. H. (1996). “The
adsorption of multinuclear phenolic compounds on activated carbon,” J. Colloid
Interface Sci. 182(1), 17-25. DOI: 10.1006/jcis.1996.0432
Das, L., Kolar, P., Classen, J. J., and Osborne, J. A. (2013). “Adsorbents from pine
wood via K2CO3-assisted low temperature carbonization for adsorption of p-cresol,”
Industrial Crops and Products 45, 215-222. DOI: 10.1016/j.indcrop.2012.12.010
Daughney, C. J., and Fein, J. B. (1998). “Sorption of 2,4,6-trichlorophenol by Bacillus
subtillis,” Environ. Sci. Technol. 32, 749-752. DOI: 10.1021/es970295p
de Araujo, B. S., Dec, J., Bollag, J. M., and Pletsch, M. (2006). “Uptake and
transformation of phenol and chlorophenols by hairy root cultures of Daucus carota,
Ipomoea batas, and Solanum aviculare,” Chemosphere 63, 642-651. DOI:
REVIEW ARTICLE bioresources.com
Hubbe et al. (2014). “Petrochemicals biosorption,” BioResources 9(4), 7782-7925. 7847
doi:10.1016/j.chemosphere.2005.08.005
de Boer, J. H. (1953). The Dynamical Character of Adsorption, Oxford University
Press, Oxford.
Dec, J., and Bollag, J.-M. (1994). “Use of plant material for decontamination of water
polluted with phenols,” Biotech. Bion. 44, 1132-1139. DOI: 10.1002/bit.260440915
Delgado, L. F., Charles, P., Glucina, K., and Morlay, C. (2012). “The removal of
endocrine disrupting compounds, pharmaceutically activated compounds and
cyanobacterial toxins during drinking water preparation using activated carbon – A
review,” Sci. Total Environ. 435-436, 509-525. DOI:
10.1016/j.scitotenv.2012.07.046
Demirak, A., Dalman, Ö., Tilkan, E., Yildiz, D., Yavuz, E., and Gökçe, C. (2011).
“Biosorption of 2,4 dichlorophenol (2,4-DCP) onto Posidonia oceanica (L.)
seagrass in a batch system: Equilibrium and kinetic modeling,” Microchemical
Journal 99(1), 97-102. DOI: 10.1016/j.microc.2011.04.002
Demirev, A. (2008). “Ozonation of phenols in water solutions intermediates and
mechanism of destruction. A review,” Oxidation Commun. 31(4), 812-818.
Denizli, A., Cihangir, N., Rad, A. Y., Taner, M., and Alsancak, G. (2004). “Removal of
chlorophenols from synthetic solutions using Phanerochaete chrysosporium,” Proc.
Biochem. 39(12), 2025-2030. DOI: 10.1016/j.procbio.2003.10.003
Denizli, A., Cihangir, N., Tüzmen, N., and Alsancak, G. (2005). “Removal of
chlorophenols from aquatic systems using the dried and dead fungus Pleurotus sajor
caju,” Bioresour. Technol. 96(1), 59-62. DOI: 10.1016/j.biortech.2003.11.029
Denyes, M. J., Langlois, V. S., Rutter, A., and Zeeb, B. A. (2012). “The use of biochar
to reduce soil PCB bioavailability to Cucurbita pepo and Eisenia fetida,” Science of
the Total Environment 437, 76-82. DOI: 10.1016/j.scitotenv.2012.07.081
Dias, J. M., Alvim-Ferraz, M. C. M., Almeida, M. F., Rivera-Utrilla, J., and Sanchez-
Polo, M. (2007). “Waste materials for activated carbon preparation and its use in
aqueous-phase treatment: A review,” J. Environ. Manag. 85(4), 833-846. DOI:
10.1016/j.jenvman.2007.07.031
Diaz-Flores, P. E., Leyva-Ramos, R., Guerrero-Coronado, R. M., and Mendoza-Barron,
J. (2006). “Adsorption of pentachlorophenol from aqueous solution onto activated
carbon fiber,” Ind. Eng. Chem. Res. 45(1), 330-336. DOI: 10.1021/ie050507o
Ding, J., Chen, B. L., and Zhu, L. Z. (2013). “Biosorption and biodegradation of
polycyclic aromatic hydrocarbons by Phanerochaete chrysosporium in aqueous
solution,” Chin. Sci. Bull. 58(6), 613-621. DOI: 10.1007/s11434-012-5411-9
Dobbs, R. A., and Cohen, J. M. (1980). “Carbon adsorption isotherm of toxic organics,”
EPA-600/8-80-023, V.S. Environmental Protection Agency.
Domingues, V., Alves, A., Cabral, M., and Delerue-Matos, C. (2005). “Sorption
behavior of bifenthrin on cork,” J. Chromatogr. A 1069, 127-132. DOI:
10.1016/j.chroma.2004.10.011
Domingues, V. E., Priolo, G., Alves, A. C., Cabral, M. E., and Delerue-Matos, C.
(2007). “Adsorption behavior of alpha-cypermethrin on cork and activated carbon,”
J. Environ. Sci. Health. Pt. B – Pesticides Food Contam. Ag. Wastes 42(6), 649-654.
DOI: 10.1080/03601230701465635
Domínguez-Vargas, J. R., Navarro-Rodríguez, J. A., de Heredia, J. B., and Cuerda-
Correa, E. M. (2009). “Removal of chlorophenols in aqueous solution by carbon
REVIEW ARTICLE bioresources.com
Hubbe et al. (2014). “Petrochemicals biosorption,” BioResources 9(4), 7782-7925. 7848
black low-cost adsorbents. Equilibrium study and influence of operation
conditions,” J. Hazard. Mater. 169, 302-308. DOI: 10.1016/j.jhazmat.2009.03.075
Doocey, D. J., and Sharratt, P. N. (2004). “Zeolite-mediated advanced oxidation of
model chlorinated phenolic aqueous waste. Part 1: Aqueous phase Fenton catalysis,”
Process Safety Environ. Prot. 82(B5), 352-358. DOI: 10.1205/psep.82.5.352.44198
Dotto, G. L., Gonçalves, J. O., Cadaval, T. R. S., and Pinto, L. A. A. (2013).
“Biosorption of phenol onto bionanoparticles from Spirulina sp. LEB 18,” J. Colloid
Interface Sci. 407, 450-456. DOI: 10.1016/j.jcis.2013.06.044
Droste, R. L. (1997). Theory and Practice of Water and Wastewater Treatment, Wiley,
New York.
Dubinin, M. M. (1975). “Physical adsorption of gases and vapors in micropores,” Prog.
Surf. Membrane Sci. 9, 1070.
Dubinin, M. M. (1989). “Fundamentals of the theory of adsorption in micropores of
carbon adsorbents: Characteristics of their adsorption properties and microporous
structures,” Carbon 27(3), 457-467. DOI: 10.1016/0008-6223(89)90078-X
Dumanli, A., and Windle, A. H. (2012). “Carbon fibres from cellulosic precursors: A
review,” J. Mater. Sci. 47(10), 4236-4250. DOI: 10.1007/s10853-011-6081-8
Dursun, G., Çiçek, H., and Dursun, A. Y. (2005). “Adsorption of phenol from aqueous
solution by using carbonized beet pulp,” J. Hazard. Mater. 125, 175-182. DOI:
10.1016/j.jhazmat.2005.05.023
Dvorak, B. I., Lawler, D. F., Speitel, G. E., Jones, D. L., and Badway, D. A. (1993).
“Selecting among physical/chemical processes for removing synthetic organics from
water,” Water Environ. Res. 65(7), 827-839. DOI: 10.2175/WER.65.7.4
Edgehill, R. U., and Lu, G. Q. (1998). “Adsorption characteristics of carbonized bark
for phenol and pentachlorophenol,” J. Chem. Technol. Biotechnol. 71(1), 27-34.
DOI: 10.1002/(SICI)1097-4660(199801)71:1<27::AID-JCTB796>3.0.CO;2-T
El Bakouri, H., Usero, J., Morillo, J., Rojas, R., and Ouassini, A. (2009). “Drin
pesticides removal from aqueous solutions using acid-treated date stones,”
Bioresour. Technol. 100, 2676-2584. DOI: 10.1016/j.biortech.2008.12.051
ElHaddad, E., Ensinger, W., and Schuth, C. (2013). “Sorption reversibility of organic
contaminants in activated carbon, charcoal and Zeolite Y-200,” Grundwasser 18(3),
197-202. DOI: 10.1007/s00767-013-0229-1
El-Sheikh, A. H., Alzawahreh, A. M., and Sweileh, J. A. (2011). “Preparation of an
efficient sorbent by washing then pyrolysis of olive wood for simultaneous solid
phase extraction of chloro-phenols and nitro-phenols from water,” Talanta 85(2),
1034-1042. DOI: 10.1016/j.talanta.2011.05.016
El-Sheikh, A. H., Newman, A. P., Said, A. J., Alzawahreh, A. M., and Abu-Helal, M.
(2013). “Improving the adsorption efficiency of phenolic compounds into olive
wood biosorbents by pre-washing with organic solvents: Equilibrium, kinetic and
thermodynamic aspects,” J. Environ. Manag. 118, 1-10. DOI:
10.1016/j.jenvman.2013.01.009
Estevinho, B. N., Ratola, N., Alves, A., and Santos, L. (2006). “Pentachlorophenol
removal from aqueous matrices by sorption with almond shell residues,” J. Hazard.
Mater. 137(2), 1175-1181. DOI: 10.1016/j.jhazmat.2006.04.001
REVIEW ARTICLE bioresources.com
Hubbe et al. (2014). “Petrochemicals biosorption,” BioResources 9(4), 7782-7925. 7849
Fabbri, D., Rombolà, A. G., Torri, C., and Spokas, K. A. (2013). “Determination of
polycyclic aromatic hydrocarbons in biochar and biochar amended soil,” Journal of
Analytical and Applied Pyrolysis 103, 60-67. DOI: 10.1016/j.jaap.2012.10.003
Fanelli, D. (2012). “Negative results are disappearing from most disciplines and
countries,” Scientometrics 90(3), 891-904. DOI: 10.1007/s11192-011-0494-7
Farhadian, M., Duchez, D., Vachelard, C., and Larroche, C. (2008). “Monoaromatics
removal from polluted water through bioreactors - A review,” Water Res. 42(6-7),
1325-1341. DOI: 10.1016/j.watres.2007.10.021
Farkas, V., Felinger, A., Hegedüsova, A., Dékány, I., and Pernyeszi, T. (2013).
“Comparative study of the kinetics and equilibrium of phenol biosorption on
immobilized white-rot fungus Phanerochaete chrysosporium from aqueous solution,”
Colloids Surf. B – Biointerfaces 103, 381-390. DOI: 10.1016/j.colsurfb.2012.09.029
Farrell, J., Hauck, B., and Jones, M. (1999). “Thermodynamic investigation of
trichloroethylene adsorption in water-saturated microporous adsorbents,” Environ.
Toxic. Chem. 18(8), 1637-1642. DOI: 10.1002/etc.5620180805
Ferro-Garcia, M. A., Rivera-Utrilla, J., Bautista-Toledo, I., and Moreno-Castilla, C.
(1996). “Chemical and thermal regeneration of an activated carbon saturated with
chlorophenols,” J. Chem. Technol. Biotechnol. 67, 183-189. DOI:
10.1002/(SICI)1097-4660(199610)67:2<183::AID-JCTB550>3.0.CO;2-K
Fierro, V., Torné-Fernández, V., Montané, D., and Celzard, A. (2008). “Adsorption of
phenol onto activated carbons having different textural and surface properties,”
Micropor. Mesopor. Mater. 111(1-3), 276-284. DOI:
10.1016/j.micromeso.2007.08.002
Fomina, M., and Gadd, G. M. (2014). “Biosorption: Current perspectives on concept,
definition and application,” Bioresour. Technol. 160, 3-14. DOI:
10.1016/j.biortech.2013.12.102
Fowler, R. H., and Guggenheim, E. A. (1939). Statistical Thermodynamics, Cambridge
University Press, London, pp. 431-450.
Franklin, L. B. (1991). Wastewater Engineering: Treatment, Disposal and Reuse,
McGraw-Hill, New York.
Franz, M., Arafat, H. A., and Pinto, N. G. (2000). “Effect of chemical surface
heterogeneity on the adsorption mechanism of dissolved aromatics on activated
carbon,” Carbon 38(13), 1807-1819. DOI: 10.1016/S0008-6223(00)00012-9
Freundlich, H. M. F. (1907). “Uber die adsorption in losungen,” Zeitschrift fur
Physikalische Chemie (Leipzig). A 57, 385-470.
Fritz, W., and Schluender, E. U. (1974). “Simultaneous adsorption equilibria of organic
solutes in dilute aqueous solutions on activated carbon,” Chem. Eng. Sci. 29, 1279-
1282. DOI: 10.1016/0009-2509(74)80128-4
Fu, D., Zhang, Y. H., Lv, F. Z., Chu, P. K., and Shang, J. W. (2012a). “Removal of
organic materials from TNT red water by bamboo charcoal adsorption,” Chem. Eng.
J. 193, 39-49.
Fu, D., Zhang, Y. H., Wang, H. L., and Lv, F. Z. (2012b). “Rice husk active carbon as a
potential low-cost adsorbent for TNT wastewater,” Prog. Environ. Sci. Eng., Adv.
Mater. Res. series, Li, H., Xy, Q. J., and Zhang, D. (eds.), Vol. 356-360, 1289-1292.
REVIEW ARTICLE bioresources.com
Hubbe et al. (2014). “Petrochemicals biosorption,” BioResources 9(4), 7782-7925. 7850
Furuya, E. G., Chang, H. T., Miyura, Y., and Noll, K. E. (1997). “A fundamental analysis
of the isotherm of the adsorption of phenolic compounds on activated carbon,” Sep.
Purif. Technol. 11, 69-78. DOI: 10.1016/S1383-5866(96)01001-5
Gadd, G. M. (2009). “Biosorption: Critical review of scientific rationale, environmental
importance and significance for pollution treatment,” J. Chem. Technol. Biotechnol.
84(1), 12-28. DOI: 10.1002/jctb.1999
Galiatsatou, P., Metaxas, M., Arapoglou, D., and Kasselouri-Rigopoulou, V. (2002).
“Treatment of olive mill waste water with activated carbons from agricultural by-
products,” Waste Management 22(7), 803-812. DOI: 10.1016/S0956-053X(02)00055-
7
Gamelas, J. A. F. (2013). “The surface properties of cellulose and lignocellulosic
materials assessed by inverse gas chromatography: A review,” Cellulose 20(6), 2675-
2693. DOI: 10.1007/s10570-013-0066-5
Gao, Q. T., Wong, Y. S., and Tam, N. F. Y. (2011). “Removal and biodegradation of
nonylphenol by different Chlorella species,” Marine Pollut. Bull. 63, 445-451. DOI:
10.1016/j.marpolbul.2011.03.030
Gao, R. Y., and Wang, J. L. (2007). “Effects of pH and temperature on isotherm
parameters of chlorophenols biosorption to anaerobic granular sludge,” J. Hazard.
Mater. 145(3), 398-403. DOI: 10.1016/j.jhazmat.2006.11.036
García-Araya, J. F., Beltrán, F. J., Álvarez, P., and Masa, F. J. (2003). “Activated carbon
adsorption of some phenolic compounds present in agroindustrial wastewater,”
Adsorption 9(2), 107-115. DOI: 10.1023/A:1024228708675
Garcia-Mendieta, A., Slache-Ríos, M., and Olguín, M. T. (2003). “Comparison of phenol
and 4-chlorophenol adsorption in activated carbon with different physical properties,”
Sep. Sci. Technol. 38, 2549-2564. DOI: 10.1081/SS-120022287
Ghosh, S., Das, S. K., Guha, A. K., and Sanyal, A. K. (2009). “Adsorption behavior of
lindane on Rhizopus oryzae biomass: Physico-chemical studies,” J. Hazard. Mater.
172(1), 485-490. DOI: 10.1016/j.jhazmat.2009.06.156
Giudicianni, P., Cardone, G., and Ragucci, R. (2013). “Cellulose, hemicellulose and
lignin slow steam pyrolysis: Thermal decomposition of biomass components
mixtures,” J. Anal. Appl. Pyrol. 100, 213-222. DOI: 10.1016/j.jaap.2012.12.026
Gotovac, S., Hattori, Y., Noguchi, E., Miyamoto, J., Kanamura, M., Utsumi, S., Kanoh,
H., and Kaneko, K. (2006). “Phenanthrene adsorption from solution on single wall
carbon nanotubes,” J. Phys. Chem. B 110(33), 16219-16224. DOI:
10.1021/jp0611830
Gotovac, S., Song, L., Kanoh, H., and Kaneko, K. (2007a). “Assembly structure control
of single wall carbon nanotubes with liquid phase naphthanlene adsorption,” Colloids
Surf. A – Physicochem Eng. Aspects 300(1-2), 117-121. DOI:
10.1016/j.colsurfa.2006.10.035
Gotovac, S., Yang, C. M., Hattori, Y., Takahashi, K., Kanoh, H., and Kaneko, K.
(2007b). “Adsorption of polyaromatic hydrocarbons on single wall carbon nanotubes
of different functionalities and diameters,” J. Colloid Interface Sci. 314(1), 18-24.
DOI: 10.1016/j.jcis.2007.04.080
Grant, T. M., and King, C. J. (1990). “Mechanism of irreversible adsorption of phenolic
compounds by activated carbons,” Ind. Eng. Chem. Res. 29(2), 264-271. DOI:
10.1021/ie00098a017
REVIEW ARTICLE bioresources.com
Hubbe et al. (2014). “Petrochemicals biosorption,” BioResources 9(4), 7782-7925. 7851
Greenbank, M., and Manes, M. (1981). “Application of the Polanyi adsorption potential
theory to adsorption from solution on activated carbon. 11. Adsorption of organic
liquid mixtures from water solution,” J. Phys Chem. 85, 3050-3059. DOI:
10.1021/j150621a009
Grimme, S. (2008). “Do special noncovalent pi-pi stacking interactions really exist?,”
Angew. Chemie Int. Ed. 47(18), 3430-3434. DOI: 10.1002/anie.200705157
Gun'ko, V. M., Voronin, E. F., Mironyuk, I. F., Leboda, R., Skubiszewska-Zieba, J.,
Pakhlov, E. M., Guzenko, N. V., and Chuiko, A. A. (2003). “The effect of heat,
adsorption and mechanochemical treatments on stuck structure and adsorption
properties of fumed silicas,” Colloids Surf. A. – Physicochem. Eng. Aspects 218, 125-
135. DOI: 10.1016/S0927-7757(02)00598-8
Gupta, V. K., and Ali, I. (2001). “Removal of DDD and DDE from wastewater using
bagasse fly ash, a sugar industry waste,” Water Res. 35, 33-40. DOI: 10.1016/S0043-
1354(00)00232-3
Gupta, V. K., and Ali, I. (2008). “Removal of endosulfan and methoxychlor from water
on carbon slurry,” Environ. Sci. Technology 42(3), 766-770. DOI:
10.1021/es7025032
Gupta, V. K., Gupta, B., Rastogi, A., Agarwal, S., and Nayak, A. (2011). “Pesticides
removal from wastewater by activated carbon prepared from waste rubber tire,”
Water Res. 45(13), 4047-4055. DOI: 10.1016/j.watres.2011.05.016
Gupta, V. K., and Saleh, T. A. (2013). “Sorption of pollutants by porous carbon, carbon
nanotubes and fullerene - An overview,” Environmental Science and Pollution
Research 20(5), 2828-2843. DOI: 10.1007/s11356-013-1524-1
Gupta, V. K., Sharma, S., Yadav, I. S., and Mohan, D. (1998). “Utilization of bagasse fly
ash generated in the sugar industry for the removal and recovery of phenol and p-
nitrophenol from wastewater,” J. Chem. Technol. Biotechnol. 71, 180-186. DOI:
10.1002/(SICI)1097-4660(199802)71:2<180::AID-JCTB798>3.0.CO;2-I
Gupta, V. K., Srivastava, S. K., and Tyagi, R. (2000). “Design parameters for the
treatment of phenolic waste by carbon columns (obtained from fertilizer waste
material),” Water Res. 34(5), 1543-1550. DOI: 10.1016/S0043-1354(99)00322-X
Ha, S. R., and Vinitnantharat, S. (2000). “Competitive removal of phenol and 2,4-
dichlorophenol in biological activated carbon system,” Environ. Technol. 21(4), 387-
396. DOI: 10.1080/09593332108618107
Haghseresht, F., Finnerty, J. J., Nouri, S., and Lu, G. Q. (2002a). “Adsorption of aromatic
compounds onto activated carbons: Effects of the orientation of the adsorbates,”
Langmuir 18(16), 6193-6200. DOI: 10.1021/la025541b
Haghseresht, F., Nouri, S., Finnerty, J. J., and Lu, G. Q. (2002b). “Effects of surface
chemistry on aromatic compound adsorption from dilute aqueous solutions by
activated carbon,” J. Phys. Chem. B 106, 10935-10943. DOI: 10.1021/jp025522a
Haghseresht, F., Nouri, S., and Lu, G. Q. (2002c). “Effects of the solute ionization on the
adsorption of aromatic compounds from dilute aqueous solutions by activated
carbon,” Langmuir 18(5), 1574-1579. 10.1021/la010903l
Haghseresht, F., Nouri, S., and Lu, G. Q. M. (2003). “Effects of carbon surface chemistry
and solution pH on the adsorption of binary aromatic solutes,” Carbon 41(5), 881-892.
DOI: 10.1016/S0008-6223(02)00437-2
Hai, F. I., Modin, O., Yamamoto, K., Fukushi, K., Nakajima, F., and Nghiem, L. D.

REVIEW ARTICLE bioresources.com
Hubbe et al. (2014). “Petrochemicals biosorption,” BioResources 9(4), 7782-7925. 7852
(2012). “Pesticide removal by a mixed culture of bacteria and white-rot fungi,” J.
Taiwan Inst. Chem. Eng. 43(3), 459-462. DOI: 10.1016/j.jtice.2011.11.002
Halhouli, K. A., Darwish, N. A., and Al-Dhoon, N. M. (1995). “Effects of pH and
inorganic salts on the adsorption of phenol from aqueous systems on activated
decoloring charcoal,” Sep. Sci. Technol. 30(17), 3313-3324. DOI:
10.1080/01496399508013147
Halhouli, K. A., Darwish, N. A., and Al-Jahmany, Y. Y. (1997). “Effects of temperature
and inorganic salts on the adsorption of phenol from multicomponent systems onto a
decolorizing carbon,” Separation Sci. Technol. 32(18), 3027-3036. DOI:
10.1080/01496399708000793
Hamadi, N. K., Swaminathan, S., and Chen, X. D. (2004). “Adsorption of paraquat
dichloride from aqueous solution by activated carbon derived from used tires,” J.
Hazard Mater. 112, 133-141. DOI: 10.1016/j.jhazmat.2004.04.011
Hamdaoui, O., and Naffrechoux, E. (2007a). “Modeling of adsorption isotherms of
phenol and chlorophenols onto granular activated carbon. Part I. Two-parameter
models and equations allowing determination of thermodynamic parameters,” J.
Hazard. Mater. 147, 381-394. DOI: 10.1016/j.jhazmat.2007.01.021
Hamdaoui, O., and Naffrechoux, E. (2007b). “Modeling of adsorption isotherms of
phenol and chlorophenols onto granular activated carbon - Part II. Models with more
than two parameters,” J. Hazard. Mater. 147(1-2), 401-411. DOI:
10.1016/j.jhazmat.2007.01.023
Hameed, B. H., Chin, L. H., and Rengaraj, S. (2008a). “Adsorption of 4-chlorophenol
onto activated carbon prepared from rattan sawdust,” Desalination 225, 185-198.
DOI: 10.1016/j.desal.2007.04.095
Hameed, B. H., and Rahman, A. A. (2008b). “Removal of phenol from aqueous solutions
by adsorption onto activated carbon prepared from biomass material,” J. Hazard
Mater. 160(2-3), 576-581. DOI: 10.1016/j.jhazmat.2008.03.028
Hameed, B. H., Tan, I. A. W., and Ahmad, A. L. (2009). “Preparation of oil palm empty
fruit bunch-based activated carbon for removal of 2,4,6-trichlorophenol: Optimization
using response surface methodology,” J. Hazard Mater. 164(2-3), 1316-1324. DOI:
10.1016/j.jhazmat.2008.09.042
Han, S., Zhao, F., Sun, J., Wang, B., Wei, R. Y., and Yan, S. Q. (2013). “Removal of p-
nitrophenol from aqueous solution by magnetically modified activated carbon,”
Journal of Magnetism and Magnetic Materials 341, 133-137. DOI:
10.1016/j.jmmm.2013.04.018
Hand, D. W., Crittenden, J.-C., and Thacker, W. E. (1983). “User-oriented batch reactor
solutions to the homogeneous surface diffusion model,” J. Env. Eng. Dev., ASCE 109,
82-101. DOI: 10.1061/(ASCE)0733-9372(1983)109:1(82)
Hank, D., Namane, A., and Hellal, A. (2010). “Biosorption of phenol by Pseudomonas
aeruginosa biofilm fixed on granular activated carbon,” Environ. Eng. Manag. J.
9(9), 1211-1216.
Hansen, C. M. (2007). Hansen Solubility Parameters. A User’s Handbook, 2nd Ed., CRC
Press, Taylor and Francis, Boca Raton. DOI: 10.1201/9781420006834
Hansen, M. C., Børresen, M. H., Schlabach, M., and Cornelissen, G. (2010). “Sorption of
perfluorinated compounds from contaminated water to activated carbon,” J. Soils
Sediments 10, 179-185. DOI: 10.1007/s11368-009-0172-z
REVIEW ARTICLE bioresources.com
Hubbe et al. (2014). “Petrochemicals biosorption,” BioResources 9(4), 7782-7925. 7853
Hao, F. H., Zhao, X. C., Ouyang, W., Lin, C. Y., Chen, S. Y., Shan, Y. S., and Lai, X. H.
(2013). “Molecular structure of corncob-derived biochars and the mechanism of
atrazine sorption,” Agronomy Journal 105(3), 773-782. DOI:
10.2134/agronj2012.0311
Haydar, S., Ferro-García, M. A., Rivera-Utrilla, J., and Joly, J. P. (2003). “Adsorption of
p-nitrophenol on an activated carbon with different oxidations,” Carbon 41, 387-395.
DOI: 10.1016/S0008-6223(02)00344-5
Hildebrand, J. H. (1936). Solubility of Non-electrolytes, Reinhold, New York.
Hill, T. L. (1946). “Localized and mobile adsorption and adsorption,” J. Chem. Phys. 14,
441-453. DOI: 10.1063/1.1724166
Ho, Y. S., and McKay, G. (1999). “Pseudo-second order model for sorption processes,”
Process Biochem. 34, 451-465. DOI: 10.1016/S0032-9592(98)00112-5
House, J. E. (2013). Inorganic Chemistry, 2nd Ed., Elsevier – Academic Press,
Amsterdam; see Ch. 9, p. 288.
Hsieh, C. T., and Teng, H. S. (2000). “Liquid-phase adsorption of phenol onto activated
carbons prepared with different activation levels,” J. Colloid Interface Sci. 230(1),
171-175. DOI: 10.1006/jcis.2000.7052
Hsu, S.-T., Chen, L.-C., Lee, C.-C., Pan, T.-C., You, B.-X., and Yan, Q.-F. (2009).
“Preparation of methacrylic acid-modified rice husk improved by an experimental
design and application for paraquat adsorption,” J. Hazard. Mater. 171, 465-470.
DOI: 10.1016/j.jhazmat.2009.06.144
Hsu, S., and Pan, T.-C. (2007). “Adsorption of paraquat using methacrylic acid-modified
rice husk,” Bioresour. Technol. 98, 3616-3621. DOI: 10.1016/j.biortech.2006.11.060
Hu, J., Li, B. J., Huang, L.-Y., Zuo, J., Zhang, W., Ying, W.-C., and Matsumoto, M. R.
(2013). “Biological-activated carbon process for removing MTBE from
groundwater,” Environmental Progress & Sustainable Energy 32(3), 512-523. DOI:
10.1002/ep.11651
Hu, J., Shao, D., Chen, C., Sheng, G., Ren, X., and Wang, X. (2011). “Removal of 1-
naphthylamine from aqueous solution by multiwall carbon nanotubes/iron
oxides/cyclodextrin composite,” J. Hazard. Mater. 185, 463-471. DOI:
10.1016/j.jhazmat.2010.09.055
Huang, L., Boving, T. B., and Xing, B. S. (2006). “Sorption of PAHs by aspen wood
fibers as affected by chemical alterations,” Environ. Sci. Technol. 40, 3279-3284.
DOI: 10.1021/es0524651
Huang, Y., Zhang, S. Y., Lv, M. J., and Xie, S. G. (2010). “Biosorption characteristics of
ectomycorrhizal fungal mycelium for anthracene,” Biomed. Environ. Sci. 23(5), 378-
383. DOI: 10.1016/S0895-3988(10)60079-7
Hubbe, M. A., Hasan, S. H., and Ducoste, J. J. (2011). “Cellulosic substrates for removal
of pollutants from aqueous systems: A review. 1. Metals,” BioResources 6(2), 2161-
2287.
Hubbe, M. A., Beck, K. R., O'Neal, W. G., and Sharma, Y. C. (2012). “Cellulosic
substrates for removal of pollutants from aqueous systems: A review. 2. Dyes,”
BioResources 7(2), 2592-2687.
Hubbe, M. A., Rojas, O. J., Fingas, M., and Gupta, B. S. (2013). “Cellulosic substrates
for removal of pollutants from aqueous systems: A Review. 3. Spilled oil and
emulsified organic liquids,” BioResources 8(2), 3038-3097.

REVIEW ARTICLE bioresources.com
Hubbe et al. (2014). “Petrochemicals biosorption,” BioResources 9(4), 7782-7925. 7854
Ibrahim, R. H. H., Darvell, L. I., Jones, J. M., and Williams, A. (2013). “Physicochemical
characterisation of torrefied biomass,” J. Anal. Appl. Pyrol. 103, 21-30. DOI:
10.1016/j.jaap.2012.10.004
Igbinosa, E. O., Odjadjare, E. E., Chigor, V. N., Igbinosa, I. H., Emoghene, A. O.,
Ekhaise, F. O., Igiehon, N. O., and Idemudia, O. G. (2013). “Toxicological profile of
chlorophenols and their derivatives in the environment: The public health
perspective,” Sci. World J., article number 460215. DOI 10.1155/2013/460215.
Iniesta, E., Sánchez, F., García, A. N., and Marcilla, A. (2001). “Yields and CO2
reactivity of chars from almond shells obtianed by a two heating step carbonisation
process. Effect of different chemical pre-treatments and ash content,” J. Analytical
Appl. Pyrol. 58-59, 983-994. DOI: 10.1016/S0165-2370(00)00212-6
Ioannou, Z., and Simitzis, J. (2009). “Adsorption kinetics of phenol and 3-nitrophenol from
aqueous solutions on conventional and novel carbons,” J. Hazard. Mater. 171(1-3), 954-
964. DOI: 10.1016/j.jhazmat.2009.06.098
Iqbal, Y., Khan, M., and Ihsanullah, N. (2005). “Effect of selected parameters on the
adsorption of phenol on activated charcoal,” Int. J. Environ. Stud. 62, 47-57. DOI:
10.1080/0020723042000253875
Isahak, W. N. R. W., Hisham, M. W. M., and Yarmo, M. A. (2013). “Highly porous carbon
materials from biomass by chemical and carbonization method: A comparison study,” J.
Chem., article number 620346, DOI: 10.1155/2013/620346.
Ivancev-Tumbas, I., Dalmacija, B., Tamas, Z., and Karlovic, E. (1998). “Reuse of biologically
regenerated activated carbon for phenol removal,” Water Res. 32(4), 1085-1094. DOI:
10.1016/S0043-1354(97)00337-0
Jacobsen, B. N., Arvin, E., and Reinders, M. (1996). “Factors affecting sorption of
pentachlorophenol to suspended microbial biomass,” Water Res. 30(1), 13-20. DOI:
10.1016/0043-1354(95)00108-W
Jain, A. K., Gupta, V. K., Jain, S., and Suhas (2004). “Removal of chlorophenols using
industrial wastes,” Environ. Sci. Technol. 38(4), 1195-1200. DOI: 10.1021/es034412u
James, G., Sabatini, D. A., Chiou, C. T., Rutherford, D., Scott, A. C., and Karapanagioti,
H. K. (2005). “Evaluating phenanthrene sorption on various wood chars,” Water Res.
39, 549-558. DOI: 10.1016/j.watres.2004.10.015
Jamil, N., Ahsan, N., Munawar, M. A., Anwar, J., and Shafique, U. (2011). “Removal of
toxic dichlorophenol from water by sorption with chemically activated carbon of
almond shells - A green approach,” J. Chem. Soc. Pakistan 33(5), 640-645.
Jaroniec, M., and Choma, J. (1997). “Characterization of geometrical and energetic
heterogeneities of active carbons by using sorption measurements,” in: Equilibria and
Dynamics of Gas Adsorption on Heterogeneous Solid Surfaces, Rudzinski, W.,
Steele, W. A., and Zgrablich, G., Book Series: Studies in Surface Science and
Catalysis, Vol. 104, CH. 14, pp. 715-744.
Jayme, G., and Büttel, H. (1968). “Über die Bestimmung und Bedeutung des Wasser-
rückhaltevermögens (des WRV-Wertes) verschiedener gebleichter und ungebleichter
Zellstoffe. II. Beziehung zwischen dem WRV-Wert und anderen
Zellstoffeigenschaften,” Wochenblatt für Papierfabrikation 96(6), 180-187.
Jeffrey, G. A. (1997). An Introduction to Hydrogen Bonding, Oxford Univ. Press, New
York.

REVIEW ARTICLE bioresources.com
Hubbe et al. (2014). “Petrochemicals biosorption,” BioResources 9(4), 7782-7925. 7855
Ji, L. L., Chen, W., Bi, J., Zheng, S. R., Xu, Z. Y., Zhu, D. Q., and Alvarez, P. J. (2010).
“Adsorption of tetracycline on single-walled and multi-walled carbon nanotubes as
affected by aqueous solution chemistry,” Environ. Toxicol. Chem. 29(12), 2713-2719.
DOI: 10.1002/etc.350
Jonker, M. T. O., and Koelmans, A. A. (2002). “Sorption of polycyclic aromatic hydrocarbons
and polychlorinated biphenyls to soot and soot-like materials in the aqueous environment:
Mechanistic considerations,” Environ. Sci. Technol. 36(17), 3725-3734. DOI:
10.1021/es020019x
Joo, J. C., Shackelford, C. D., and Reardon, K. F. (2008). “Sorption of nonpolar neutral
organic compounds to humic acid-coated sands: Contributions of organic and mineral
components,” Chemosphere 70(7), 1290-1297. DOI: 10.1016/j.chemosphere.2007.07.052
Ju, Y.-H., Chen, T.-C., and Liu, J. C. (1997). “A study on the biosorption of lindane,” Colloids
Surf. B. – Biointerfaces 9(3-4), 187-196. DOI: 10.1016/S0927-7765(97)00019-2
Juang, R.-S. , Tseng, R.-L., and Wu, F.-C. (2001). “Role of microporosity of activated carbons
on their adsorption abilities for phenols and dyes,” Adsorption 7, 65-72. DOI:
10.1023/A:1011225001324
Juang, R.-S., Tseng, R.-L., Wu, F.-C., and Lee, S.-H. (1996a). “Liquid-phase adsorption of
phenol and its derivatives on activated carbon fibers,” Separ. Sci. Technol. 31(14), 1915-
1931. DOI: 10.1080/01496399608001020
Juang, R.-S., Wu, F.-C., and Tseng, R.-L. (1996b). “Adsorption isotherms of phenolic
compounds from aqueous solutions onto activated carbon fibers,” J. Chem. Eng. Data 41,
487-492. DOI: 10.1021/je950238g
Juang, R.-S., Wu, F.-C., and Tseng, R.-L. (2000). “Mechanism of adsorption of dyes and
phenols from water using activated carbons prepared from plum kernels,” J. Colloid
Interface Sci. 227, 437-444. DOI: 10.1006/jcis.2000.6912
Juhasz, A., L., and Naidu, R. (2000a). “Bioremediation of high molecular polycyclic aromatic
hydrocarbons: A review of the microbial degradation, of benzo[a]pyrene,” Intl.
Biodeterior. Biodegrad. 45, 57-88. DOI: 10.1016/S0964-8305(00)00052-4
Juhasz, A. L., and Naidu, R. (2000b). “Extraction and recovery of organochlorine pesticides
from fungal mycelia,” J. Microbiolog. Methods 39(2), 149-158. DOI: 10.1016/S0167-
7012(99)00111-6
Juhasz, A. L., Smith, E., Smith, J., and Naidu, R. (2002). “Biosorption of organochlorine
pesticides using fungal biomass,” J. Indust. Microbiol. Biotechnol. 29(4), 163-169. DOI:
10.1038/sj.jim.7000280
Julinová, M., and Slavík, R. (2012). “Removal of phthalates from aqueous solution by
different adsorbents: A short review,” Journal of Environmental Management 94(1), 13-
24. DOI: 10.1016/j.jenvman.2011.09.006
Jung, C., Park, J., Lim, K. H., Park, S., Heo, J., Her, N.-G., Oh, J., and Yoon, Y. (2013).
“Adsorption of selected endocrine disrupting compounds and pharmaceuticals on
activated biochars,” J. Hazard Mater. 263(2), 702-710. DOI:
10.1016/j.jhazmat.2013.10.033
Jung, M.-W., Ahn, K.-H., Lee, Y., Kim, K.-P., Rhee, J.-S., Park, J. T., and Paeng, K.-J.
(2001). “Adsorption characteristics of phenol and chlorophenols on granular activated
carbons (GAC),” Microchem. J. 70, 123-131. DOI: 10.1016/S0026-265X(01)00109-6

REVIEW ARTICLE bioresources.com
Hubbe et al. (2014). “Petrochemicals biosorption,” BioResources 9(4), 7782-7925. 7856
Kao, P.-C., Tzeng, J.-H., and Huang, T.-L. (2000). “Removal of chlorophenols from aqueous
solution by fly ash,” J. Hazard. Mater. 76(2-3), 237-249. DOI: 10.1016/S0304-
3894(00)00201-6
Karakoyun, N., Kubilay, S., Aktas, N., Turhan, O., Kasimoglu, M., Yilmaz, S., and Sahiner,
N. (2011). “Hydrogel-biochar composites for effective organic contaminant removal from
aqueous media,” Desalination 280(1-3), 319-325. DOI: 10.1016/j.desal.2011.07.014
Karanfil, T., and Dastgheib, S. A. (2004). “Trichloroethylene adsorption by fibrous and
granular activated carbons: Aqueous phase, gas phase, and water vapor adsorption
studies,” Environ. Sci. Technol. 38, 5834-5841. DOI: 10.1021/es0497936
Karanfil, T., Dastgheib, S. A., and Mauldin, D. (2006). “Exploring molecular sieve
capabilities of activated carbon fibers to reduce the impact of NOM preloading on
trichloroethylene adsorption,” Environ. Sci. Technol. 40(4), 1321-1327. DOI:
10.1021/es051285o
Karim, K., and Gupta, S. K. (2002). “Biosorption of nitrophenols on anaerobic granular
sludge,” Environ. Technol. 23(12), 1379-1384. DOI: 10.1080/09593332508618443
Karimi-Jashni, A., and Narbaitz, R. M. (1997). “Impact of pH on the adsorption and
desorption kinetics of 2-nitrophenol on activated carbons,” Water Res. 31(12), 3039-
3044. DOI: 10.1016/S0043-1354(97)00176-0
Keith, L. H., and Telliard, W. A. (1979). “Priority pollutants. 1. A perspective view,” Environ.
Sci. Technol. 13(4), 416-423. DOI: 10.1021/es60152a601
Kennedy, K. J., Lu, J. H., and Mohn, W. W. (1992). “Biosorption of chlorophenols to
anaerobic granular sludge,” Water Res. 26(8), 1085-1092. DOI: 10.1016/0043-
1354(92)90144-S
Kennedy, L. J., Vijaya, J. J., Kayalvishi, K., and Sekaran, G. (2007). “Adsorption of phenol
from aqueous solutions using mesoporous carbon prepared by two-stage process,” Chem.
Eng. J. 132, 279-287. DOI: 10.1016/j.cej.2007.01.009
Khalaf, S., Al-Rimawi, F., Khamis, M., Nir, S., Bufo, S. A., Scrano, L., Mecca, G., and
Karaman, R. (2013). “Efficiency of membrane technology, activated charcoal, and a
micelle-clay complex for removal of the acidic pharmaceutical mefenamic acid,” Journal
of Environmental Science and Health Part A-Toxic/Hazardous Substances &
Environmental Engineering 48(13), 1655-1662. DOI: 10.1080/10934529.2013.815475
Khan, A. R., Al-Bahri, T. A., and Al-Haddad, A. (1997a). “Adsorption of phenol-based
organic pollutants on activated carbon from multi-component dilute aqueous solutions,”
Water Res. 31(8), 2102-2112. DOI: 10.1016/S0043-1354(97)00043-2
Khan, A. R., Ataullah, R., and Al-Haddad, A. (1997b). “Equilibrium adsorption studies of
some aromatic pollutants from dilute aqueous solutions on activated carbon at different
temperatures,” J. Colloid Interface Sci. 194, 154-165. DOI: 10.1006/jcis.1997.5041
Khan, E., Khaodhir, S., and Rotwiron, P. (2007). “Polycyclic aromatic hydrocarbon removal
from water by natural fiber sorption,” Water Environ. Res. 79(8), 901-911. DOI:
10.2175/106143007X176040
Khan, M. A., Kim, S.-W., Rao, R. A. K., Abou-Shanab, R. A. I., Bhatnagar, A., Song, H., and
Jeon, B.-H. (2010). “Adsorption studies of dichloromethane on some commercially
available GACs: Effect of kinetics, thermodynamics and competitive ions,” J. Hazard.
Mater. 178, 963-972. DOI: 10.1016/j.jhazmat.2010.02.032
Khan, S., Wang, N., Reid, B. J., Freddo, A., and Cai, C. (2013). “Reduced bioaccumulation of
PAHs by Lactuca sativa L. grown in contaminated soil amended with sewage sludge and
REVIEW ARTICLE bioresources.com
Hubbe et al. (2014). “Petrochemicals biosorption,” BioResources 9(4), 7782-7925. 7857
sewage sludge derived biochar,” Environmental Pollution 175, 64-68. DOI:
10.1016/j.envpol.2012.12.014
Khoshnood, M., and Azizian, S. (2012). “Adsorption of 2,4-dichlorophenoxyacetic acid
pesticide by graphitic carbon nanostructures prepared from biomasses,” Journal of
Industrial and Engineering Chemistry 18(5), 1796-1800. DOI: 10.1016/j.jiec.2012.04.007
Kilduff, J. E., Karanfil, T., and Weber, W. J., Jr. (1998). “TCE adsorption by GAC preloaded
with humic substances,” J. Amer Water Works Assoc. 90, 76-89.
Kilic, M., Apaydin-Varol, E., and Pütün, A. E. (2011). “Adsorptive removal of phenol from
aqueous solutions on activated carbon prepared from tobacco residues: Equilibrium,
kinetics and thermodynamics,” Journal of Hazardous Materials 189(1-2), 397-403. DOI:
10.1016/j.jhazmat.2011.02.051
Kim, T. Y., Cho, S. Y., and Kim, S. J. (2011). “Adsorption equilibrium and kinetics of copper
ions and phenol onto modified adsorbents,” Adsorp. – J. Intl. Adsorp. Soc. 17(1), 135-143.
DOI: 10.1007/s10450-010-9306-2
Kiselev, A. V. (1958). “Vapor adsorption in the formation of adsorbate molecule complexes
on the surface,” Kolloid. Zhur. 20, 338-348.
Klasson, K. T., Ledbetter, C. A., Wartelle, L. H., and Lingle, S. E. (2010). “Feasibility of
dibromochloropropane (DBCP) and trichloroethylene (TCE) adsorption onto
activated carbons made from nut shells of different almond varieties,” Indus. Crops
Prod. 31(2), 261-265. DOI: 10.1016/j.indcrop.2009.11.002
Klasson, K. T., Wartelle, L. H., Lima, I. M., Marshall, W. E., and Akin, D. E. (2009).
“Activated carbons from flax shive and cotton gin waste as environmental adsorbents
for the chlorinated hydrocarbon trichloroethylene,” Biores. Technol. 100(21), 5045-
5050. DOI: 10.1016/j.biortech.2009.02.068
Kliaugaite, D., Jankunaite, D., and Racys, V. (2008). “Factors influencing treatment of
petroleum polluted wastewater using biologically activated carbon,” 7th International
Conference Environmental Engineering, Cygas, D., and Froehner, K. D. (eds.), 569-
575.
Kolker, A. M., Korolev, V. P., and Batov, D. V. (2005). “Relationship between the
internal pressure and cohesive energy density of liquids,” J. Structural Chem. 46(5),
927-930. DOI: 10.1007/s10947-006-0221-z
Kong, H. L., He, J., Gao, Y. Z., Han, J., and Zhu, X. Z. (2011a). “Removal of polycyclic
aromatic hydrocarbons from aqueous solution on soybean stalk-based carbon,” J.
Environ. Qual. 40(6), 1737-1744. DOI: 10.2134/jeq2010.0343
Kong, H., He, J., Gao, Y., Wu, H., and Zhu, X. (2011b). “Cosorption of phenanthrene
and mercury(II) from aqueous solution by soybean stalk-based biochar,” J. Agric.
Food Chem. 59(22), 12116-12123. DOI: 10.1021/jf202924a
Kong, H. L., He, J., Wu, H. F., Wu, H., and Gao, Y. Z. (2012). “Phenanthrene removal
from aqueous solution on sesame stalk-based carbon,“ Clean – Soil Air Water 40(7),
752-759. DOI: 10.1002/clen.201100322
Košíková, B., Sláviková, E., and Lábaj, J. (2009). “Affinity of lignin preparations
towards genotoxic compounds,” BioResources 4(1), 72-79.
Koumanova, B., Peeva, P., and Allen, S. J. (2003). “Variation of intra-particle diffusion
parameter during adsorption of p-chlorophenol onto activated carbon made from
apricot stones,” J. Chem. Technol. Biotechnol. 78(5), 582-587. DOI:
10.1002/jctb.839

REVIEW ARTICLE bioresources.com
Hubbe et al. (2014). “Petrochemicals biosorption,” BioResources 9(4), 7782-7925. 7858
Krastanov, A., Alexieva, Z., and Yemendzhiev, H. (2013). “Microbial degradation of
phenol and phenolic derivatives, ” Eng. Life Sci. 13(1), 76-87. DOI:
10.1002/elsc.201100227
Kujawski, W., Warzawski, A., Ratajczak, W., Porębski, W., Capała, W., and Ostrowska,
I. (2004). “Application of pervaporation and adsorption to the phenol removal from
wastewater,” Sep. Purif. Technol. 40, 123-132. DOI: 10.1016/j.seppur.2004.01.013
Kumagai, S., Shimizu, Y., Toida, Y., and Enda, Y. (2009). “Removal of
dibenzothiophenes in kerosene by adsorption on rice husk activated carbon,” Fuel 88,
1975-1982. DOI: 10.1016/j.fuel.2009.03.016
Kumar, A., Kumar, S., Kumar, S., and Gupta, D. V. (2007). “Adsorption of phenol and 4-
nitrophenol on granular activated carbon in basal salt medium: Equilibrium and
kinetics,” J. Hazard. Mater. 147, 155-166. DOI: 10.1016/j.jhazmat.2006.12.062
Kumar, A. K., Mohan, S. V., and Sarma, P. N. (2009a). “Sorptive removal of endocrine-
disruptive compound (estriol, E3) from aqueous phase by batch and column studies:
Kinetic and mechanistic evaluation,” J. Hazard. Mater. 164, 820-828. DOI:
10.1016/j.jhazmat.2008.08.075
Kumar, A., Prasad, B., and Mishra, I. M. (2008). “Optimization of process parameters for
acrylonitrile removal by a low-cost adsorbent using Box–Behnken design,” J.
Hazard. Mater. 150, 174-182. 10.1016/j.jhazmat.2007.09.043
Kumar, B. G. P., Shivakamy, K., Miranda, L. R., and Velan, M. (2006). “Preparation of
steam activated carbon from rubberwood sawdust (Hevea brasiliensis) and its
adsorption kinetics,” J. Hazard. Mater. 136(3), 922-929. DOI:
10.1016/j.jhazmat.2006.01.037
Kumar, N. S., Boddu, V. M., and Krishnaiah, A. (2009b). “Biosorption of phenolic
compounds by Trametes versicolor polyporus fungus,” Adsorp. Sci. Technol. 27(1),
31-46. DOI: 10.1260/026361709788921597
Kumar, N. S., Che Man, H., and Woo, H.-S. (2014). “Biosorption of phenolic compounds
from aqueous solutions using pine (Pinus densiflora Sieb) bark powder,”
BioResources 9(3), 5155-5174.
Kumar, N. S., and Min, K. (2011a). “Removal of phenolic compounds from aqueous
solutions by biosorption onto Acacia leucocephala bark powder: Equilibrium and
kinetic studies,” J. Chilean Chem. Soc. 56(1), 539-545. DOI: 10.4067/S0717-
97072011000100004
Kumar, N. S., and Min, K. (2011b). “Phenolic compounds biosorption onto
Schizophyllum commune fungus: FTIR analysis, kinetics and adsorption isotherms
modeling,” Chem. Eng. J. 168(2), 562-571. DOI: 10.1016/j.cej.2011.01.023
Kumar, N. S., Woo, H. S., and Min, K. (2012). “Equilibrium and kinetic studies on
biosorption of 2,4,6-trichlorophenol from aqueous solutions by Acacia leucocephala
bark,” Colloids Surf. B – Biointerfaces 94, 125-132. DOI:
10.1016/j.colsurfb.2012.01.048
Kusmierek, K., Dabek, L., Kaminski, W., and Swiatkowski, A. (2013). “Evaluation of the
usefulness of peat for removal of chlorophenols from water solutions,” Ochrona
Srodowiska 35(2), 51-55.
Kwon, S., Sullivan, E. J., Katz, L. E., Bowman, R. S., and Kinney, K. A. (2011).
“Laboratory and field evaluation of a pretreatment system for removing organics
REVIEW ARTICLE bioresources.com
Hubbe et al. (2014). “Petrochemicals biosorption,” BioResources 9(4), 7782-7925. 7859
from produced water,” Water Environment Research 83(9), 843-854. DOI:
10.2175/106143011X12928814445212
Lagergren, S. (1898). “About the theory of so-called adsorption of soluble substances,”
K. Sven. Vetenskapsakad. Handl. 24, 1-39.
Lang, W., Dejma, C., Sirisansaneeyakul, S., and Sakairi, N. (2009). “Biosorption of
nonylphenol on dead biomass of Rhizopus arrhizus encapsulated in chitosan beads,”
Biores. Technol. 100(23), 5616-5623. DOI: 10.1016/j.biortech.2009.06.021
Langmuir, I. (1918). “The adsorption of gases on plane surface of glass, mica and
platinum,” J. Am. Chem. Soc. 40, 1361-1403. DOI: 10.1021/ja02242a004
László, K., Podkościelny, P., and Dąbrowski, A. (2003). “Heterogeneity of polymer-
based active carbons in adsorption of aqueous solutions of phenol and 2,3,4-
trichlorophenol,” Langmuir 19(13), 5287-5294. DOI: 10.1021/la026761s
László, K., Podkościelny, P., Dąbrowski, A. (2006). “Heterogeneity of activated carbons
with different surface chemistry in adsorption of phenol from aqueous solutions,”
Appl. Surf. Sci. 252(16), 5752-5762. DOI: 10.1016/j.apsusc.2005.07.027
László, K., and Szücs, A. (2001). “Surface characterization of polyethyleneterephthalate
PET based activated carbon and the effect of pH on its adsorption capacity from
aqueous phenol and 2,3,4-trichlorophenol solutions,” Carbon 39, 1945-1953. DOI:
10.1016/S0008-6223(00)00245-1
Lei, A. P., Wong, Y. S., and Tam, N. F. Y. (2002). “Removal of pyrene by different
microalgal species,” Water Sci. Technol. 46(11-12), 195-201.
Leng, C. C. (1996). “Mechanism of adsorption and desorption of oxygen and nitrogen
containing aromatics on activated carbon,” PhD dissertation, University of Cincinnati.
Leng, C.-C., and Pinto, N. G. (1997). “Effects of surface properties of activated carbons
on adsorption behavior of selected aromatics,” Carbon 35(9), 1375-1385. DOI:
10.1016/S0008-6223(97)00091-2
Leyva-Ramos, R., Bernal-Jacome, L. A., Mendoza-Barron, J., and Hernandez-Orta, M.
M. G. (2009a). “Kinetic modeling of pentachlorophenol adsorption onto granular
activated carbon,” J. Taiwan Inst. Chem. Eng. 40(6), 622-629. DOI:
10.1016/j.jtice.2009.05.006
Leyva-Ramos, R., Diaz-Flores, P. E., Leyva-Ramos, J., and Femat-Flores, R. A. (2007).
“Kinetic modeling of pentachlorophenol adsorption from aqueous solution on
activated carbon fibers,” Carbon 45(11), 2280-2289. DOI:
10.1016/j.carbon.2007.06.010
Leyva-Ramos, R., Rivera-Utrilla, J., Medellín-Castillo, N. A., and Sánchez-Polo, M.
(2009b). “Kinetic modelling of naphthalenesulphonic acid adsorption from aqueous
solution onto untreated and ozonated activated carbons,” Adsorp. Sci. Technol. 27(4),
395-411. DOI: 10.1260/026361709790252650
Leyva-Ramos, R., Zuniga, J. H. S., Barron, J. M., and Coronado, R. M. G. (1999).
“Adsorption of phenol from aqueous solution on to activated carbon. Effect of
solvent, temperature and particle size,” Adsorp. Sci. Technol. 17(7), 533-543.
Li, B.-J., Hu, J., Huang, L.-Y., Lv, Y., Zuo, J., Zhang, W., Ying, W.-C., and Matsumoto,
M. R. (2013c). “Removal of MTBE in biological activated carbon adsorbers,”
Environ. Prog. Sustain. Energy 32(2), 239-248. DOI: 10.1002/ep.11614
Li, H., Zhou, B., Lin, Y., Gu, L., Wang, W., Fernando, K. A. S., Kumar, S., Allard, L. F.,
and Sun, Y.-P. (2004). “Selective interactions of porphyrins with semi-conducting
REVIEW ARTICLE bioresources.com
Hubbe et al. (2014). “Petrochemicals biosorption,” BioResources 9(4), 7782-7925. 7860
single-walled carbon nanotubes,” J. Amer. Chem. Soc. 126, 1014-1015. DOI:
10.1021/ja037142o
Li, J. F., Li, Y. M., Wu, M. J., Zhang, Z. Y., and Lü, J. H. (2013a). “Effectiveness of low-
temperature biochar in controlling the release and leaching of herbicides in soil,”
Plant and Soil 370(1-2), 333-344. DOI: 10.1007/s11104-013-1639-7
Li, K., Ji, F., Liu, Y. L., Tong, Z. L., Zhan, X. M., and Hu, Z. H. (2013b). “Adsorption
removal of tetracycline from aqueous solution by anaerobic granular sludge:
Equilibrium and kinetic studies,” Water Sci. Technol. 67(7), 1490-1496. DOI:
10.2166/wst.2013.016
Li, K. Q., Zheng, Z., Feng, J. W., Zhang, J. B., Luo, X. Z., Zhao, G. H., and Huang, X. F.
(2009). “Adsorption of p-nitroaniline from aqueous solutions onto activated carbon
fiber prepared from cotton stalk,” J. Hazard. Mater. 166(2-3), 1180-1185. DOI:
10.1016/j.jhazmat.2008.12.035
Li, L., Quinlivan, P. A., and Knappe, D. R. U. (2002). “Effects of activated carbon
surface chemistry and pore structure on the adsorption of organic contaminants from
aqueous solution,” Carbon 40, 2085-2100. DOI: 10.1016/S0008-6223(02)00069-6
Li, Y., and Chen, B. (2009). “Phenanthrene sorption by fruit cuticles and potato periderm
with different compositional characteristics,” J. Agric. Food Chem. 57(2), 637-644.
DOI: 10.1021/jf802719h
Li, Y., Chen, B., and Zhu, L. (2010a). “Enhanced sorption of polycyclic aromatic
hydrocarbons from aqueous solution by modified pine bark,” Bioresour. Technol.
101, 7307-7313. DOI: 10.1016/j.biortech.2010.04.088
Li, Y., Lin, M., and Davenport, J. W. (2011). “Ab initio studies of cellulose I: Crystal
structure, intermolecular forces, and interactions with water,” J. Phys. Chem. 155,
11533-15539.
Li, Y. G., Chen, B. L., and Zhu, L. Z. (2010b). “Single-solute and bi-solute sorption of
phenanthrene and pyrene onto pine needle cuticular fractions,” Environ. Pollut.
158(7), 2478-2484. DOI: 10.1016/j.envpol.2010.03.021
Li, Y. G., Deng, Y. Q., and Chen, B. L. (2012). “Sorption of chlorophenols onto fruit
cuticles and potato periderm,” J. Environ. Sci. – China 24(4), 675-681. DOI:
10.1016/S1001-0742(11)60891-7
Liang, Y., Hilal, N., Langston, P., and Starov, V. (2007). “Interaction forces between
colloidal particles in liquid: Theory and experiment,” Advan. Colloid Interface Sci.
134-135, 151-166. DOI: 10.1016/j.cis.2007.04.003
Lin, D. H., Pan, B., Zhu, L. Z., and Xing, B. S. (2007). “Characterization and
phenanthrene sorption of tea leaf powders,” J. Agric. Food Chem. 55(14), 5718-5724.
DOI: 10.1021/jf0707031
Lin, S.-H., and Juang, R.-S. (2009). “Adsorption of phenol and its derivatives from water
using synthetic resins and low-cost natural adsorbents: A review,” J. Environ. Manag.
90(3), 1336-1349. DOI: 10.1016/j.jenvman.2008.09.003
Lin, Y., Munroe, P., Joseph, S., Henderson, R., Ziolkowski, A. (2012). “Water
extractable organic carbon in untreated and chemical treated biochars,” Chemosphere
87(2), 151-157. 10.1016/j.chemosphere.2011.12.007
Liu, C. W., Chang, W. N., and Liu, H. S. (2009). “Bioremediation of n-alkanes and the
formation of biofloccules by Rhodococcus erythropolis NTU-1 under various saline
REVIEW ARTICLE bioresources.com
Hubbe et al. (2014). “Petrochemicals biosorption,” BioResources 9(4), 7782-7925. 7861
conditions and sea water,” Biochem. Eng. J. 45(1), 69-75. DOI:
10.1016/j.bej.2009.02.009
Liu, X., and Pinto, N. G. (1997). “Ideal adsorbed phase model for adsorption of phenolic
compounds on activated carbon,” Carbon 35(9), 1387-1397. DOI: 10.1016/S0008-
6223(97)00092-4
Liu, X. B., Xie, X. X., Yan, H., Sun, X. J., and Sun, Y. (2013). “A review of the
adsorption of organic pollutants on mesoporous carbons and carbon/silica hybrids,”
New Carbon Materials 28(4), 241-253.
Lou, L. P., Wu, B. B., Wang, L. N., Luo, L., Xu, X. H., Hou, J. A., Xun, B., Hu, B. L.,
and Chen, Y. X. (2011). “Sorption and ecotoxicity of pentachlorophenol polluted
sediment amended with rice-straw derived biochar,” Bioresour. Technol. 102(5),
4036-4041. DOI: 10.1016/j.biortech.2010.12.010
Lu, C., Chung, Y.-L., and Chang, K.-F. (2005). “Adsorption of trihalomethanes from
water with carbon nanotubes,” Water Res. 39, 1183-1189. DOI:
10.1016/j.watres.2004.12.033
Lu, C. S., Chung, Y.-L., and Chang, K.-F. (2006). “Adsorption thermodynamic and
kinetic studies of trihalomethanes on multiwalled carbon nanotubes,” J. Hazard.
Mater. 138(2), 304-310. DOI: 10.1016/j.jhazmat.2006.05.076
Mackay, A. A., and Gschwend, P. M. (2000). “Sorption of monoaromatic hydrocarbons
to wood,” Environ. Sci. Technol. 34, 839-845. DOI: 10.1021/es9900858
Maginn, E. J., Bell, A. T., and Theodorou, D. N. (1995). “Sorption thermodynamics,
siting, and conformation of long n-alkanes in silicalite as predicted by
configurational-bias monte-carlo integration,” J. Phys. Chem. 99(7), 2057-2079. DOI:
10.1021/j100007a042
Magne, P., and Walker Jr., P. L. (1986). “Phenol adsorption on activated carbons:
Application to the regeneration of activated carbons polluted with phenol,” Carbon
24(2), 101-107. MOI: 10.1016/0008-6223(86)90102-8
Mahajan, O. P., Moreno-Castilla, C., and Walker, P. L. (1980). “Surface-treated activated
carbon for removal of phenol from water,” Sep. Sci. Technol. 15(10), 1733-1752.
DOI: 10.1080/01496398008055619
Mahvi, A. H., Maleki, A., and Eslami, A. (2004). “Potential of rice husk and rice husk
ash for phenol removal in aqueous systems,” Am. J. Appl. Sci. 1(4), 321-326. DOI:
10.3844/ajassp.2004.321.326
Maldonado-Hódar, F. J., Moreno-Castilla, C., Carrasco-Marín, F., and Pérez-Cadenas, A.
F. (2007). “Reversible toluene adsorption on monolithic carbon aerogels,” J. Hazard.
Mater. 148(3), 548-552. DOI: 10.1016/j.jhazmat.2007.03.007
Manes, M., and Hofer, (1969). “Application of the Polanyi adsorption potential theory
to adsorption from solution on activated carbon,” J. Phys. Chem. 73(3), 584-590.
DOI: 10.1021/j100723a018
Maréchal, Y. (2007). The Hydrogen Bond and the Water Molecule: The Physics and
Chemistry of Water, Aqueous and Bio Media, Elsevier, Amsterdam.
Margot, J., Kienle, C., Magnet, A., Weil, M., Rossi, L., de Alencastro, L. F., Abegglen,
C., Thonney, D., Chèvre, N., Schärer, M., and Barry, D. A. (2013). “Treatment of
micropollutants in municipal wastewater: Ozone or powdered activated carbon?”
Science of the Total Environment 461, 480-498. DOI:
10.1016/j.scitotenv.2013.05.034

REVIEW ARTICLE bioresources.com
Hubbe et al. (2014). “Petrochemicals biosorption,” BioResources 9(4), 7782-7925. 7862
Marin, J., Kennedy, K. J., and Eskicioglu, C. (2010). “Characterization of an anaerobic
baffled reactor treating dilute aircraft de-icing fluid and long term effects of
operation on granular biomass,” Biores. Technol. 101(7), 2217-2223. DOI:
10.1016/j.biortech.2009.11.055
Martín-Gullón, I., and Font, R. (2001). “Dynamic pesticide removal with activated
carbon fibers,” Water Res. 35(2), 516-520. DOI: 10.1016/S0043-1354(00)00262-1
Mathialagan, T., and Viraraghavan, T. (2008). “Biosorption of chlorophenols: A
review,” Intl. J. Environ. Pollut. 34, 164-194. DOI: 10.1504/IJEP.2008.020790
Mathialagan, T., and Viraraghavan, T. (2009). “Biosorption of pentachlorophenol from
aqueous solution by a fungal biomass,” Bioresour. Technol. 100(2), 549-558. DOI:
10.1016/j.biortech.2008.06.054
Mattson, J. A., and Mark H. B. (1971). Activated Carbon Surface Chemistry and
Adsorption from Aqueous Solution, Marcel Dekker, New York.
Mattson, J. A., Mark, H. B., Malbin, M. D., Weber, W. J., and Crittenden, J. C. (1969).
“Surface chemistry of active carbon: Specific adsorption of phenols,” J. Colloid
Interface Sci. 31, 116-130. DOI: 10.1016/0021-9797(69)90089-7
Maurin, E., Clement, A., Gerardin, P., and Loubinoux, B. (1999). “A feasibility study on
the use of chemically modified sawdusts bearing fatty alkyl chains for removal of
oleic acid and olive-oil from water,” Holz Roh Werkstoff 57(4), 265-266. DOI:
10.1007/s001070050055
Mbui, D. N., Shiundu, P. M., Ndonye, R. M., and Kamau, G. N. (2002). “Adsorption
and detection of some phenolic compounds by rice husk ash of Kenyan origin,” J.
Environ. Monit. 4, 978-984. DOI: 10.1039/b207257m
Medronho, B., Romano, A., Miguel, M. G., Stigsson, L., and Lindman, B. (2012).
“Rationalizing cellulose (in)solubility: Reviewing basic physicochemical aspects
and role of hydrophobic interactions,” Cellulose 19(3), 581-587. DOI:
10.1007/s10570-011-9644-6
Memon, G. Z., Bhanger, M. I., and Akhtar, M. (2007). “The removal efficiency of
chestnut shells for selected pesticides from aqueous solutions,” J. Colloid Interface
Sci. 315(1), 33-40. DOI: 10.1016/j.jcis.2007.06.037
Memon, G. Z., Bhanger, M. I., Akhtar, M., Talpur, F. N., and Memon, J. R. (2008).
“Adsorption of methyl parathion pesticide from water using watermelon peels as
low cost adsorbent,” Chem. Eng. J. 138, 616-621. DOI: 10.1016/j.cej.2007.09.027
Memon, G. Z., Bhanger, M. I., Memon, J. R., and Akhtar, M. (2009). “Adsorption of
methyl parathion from aqueous solutions using mango kernels: Equilibrium, kinetic
and thermodynamic studies,” Bioremediation J. 13(2), 102-106; 13(3), 154-157.
Mercier, A., Wille, G., Michel, C., Harris-Hellal, J., Amalric, L., Morlay, C., and
Battaglia-Brunet, F. (2013). “Biofilm formation vs. PCB adsorption on granular
activated carbon in PCB-contaminated aquatic sediment,” Journal of Soils and
Sediments 13(4), 793-800. DOI: 10.1007/s11368-012-0647-1
Mestre, A. S., Pires, J., Nogueira, J. M. F., and Carvalho, A. P. (2007). “Activated
carbons for the adsorption of ibuprofen,” Carbon 45(10), 1979-1988. DOI:
10.1016/j.carbon.2007.06.005
Meyer, E. E., Rosenberg, K. J., and Israelachvili, J. (2006). “Recent progress in
understanding hydrophobic interactions,” Proc. Natl. Acad. Sci. USA 103(43), 15739-
15746. DOI: 10.1073/pnas.0606422103
REVIEW ARTICLE bioresources.com
Hubbe et al. (2014). “Petrochemicals biosorption,” BioResources 9(4), 7782-7925. 7863
Michalak, I., Chojnacka, K., and Witek-Krowiak, A. (2013). “State of the art for the
biosorption process – A review,” Appl. Biochem. Biotechnol. 170(6), 1389-1416.
DOI: 10.1007/s12010-013-0269-0
Mikhalovska, L. I., Gun'ko, V. M., Rugal, A. A., Oranska, O. I., Gornikov, Y. I., Morvan,
C., Follain, N., Domas, C., Pakhlov, E. M., and Mikhalovsky, S. V. (2012).
“Cottonised flax fibres vs. cotton fibres: Structural, textural and adsorption
characteristics,” RSC Advan. 2(5), 2032-2042. DOI: 10.1039/c2ra00725h
Miyake, Y., Sakoda, A., Yamanashi, H., Kaneda, H., and Suzuki, M. (2003). “Activated
carbon adsorption of trichloroethylene (TCE) vapor stripped from TCE-
contaminated water,” Water Res. 37(8), 1852-1858. DOI: 10.1016/S0043-
1354(02)00564-X
Mohan, D., Sarswat, A., Ok, Y. S., and Pittman, C. U. (2014). “Organic and inorganic
contaminants removal from water with biochar, a renewable, low cost and sustainable
adsorbent - A critical review,” Bioresour. Technol. 160, 191-202. DOI:
10.1016/j.biortech.2014.01.120
Mohan, D., Singh, K. P., Sinha, S., and Gosh, D. (2004). “Removal of pyridine from
aqueous solution using low cost activated carbons derived from agricultural waste
materials,” Carbon 42(12-13), 2409-2421. DOI: 10.1016/j.carbon.2004.04.026
Mohan, D., Singh, K. P., Sinha, S., and Gosh, D. (2005). “Removal of pyridine
derivatives from aqueous solution by activated carbons developed from agricultural
waste materials,” Carbon 43(8), 1680-1693. DOI: 10.1016/j.carbon.2005.02.017
Mohanty, K., Das, D., and Biswas, M. N. (2005). “Adsorption of phenol from aqueous
solutions using activated carbons prepared form Tectona grandis sawdust by ZnCl2
activation,” Chem. Eng. J. 115, 121-131. DOI: 10.1016/j.cej.2005.09.016
Mollah, A. H., and Robinson, C. W. (1996a). “Pentachlorophenol adsorption and
desorption characteristics of granular activated carbon. 1. Isotherms,” Water Res.
30(12), 2901-2906. DOI: 10.1016/S0043-1354(96)00131-5
Mollah, A. H., and Robinson, C. W. (1996b). “Pentachlorophenol adsorption and
desorption characteristics of granular activated carbon. 2. Kinetics,” Water Res.
30(12), 2907-2913. DOI: 10.1016/S0043-1354(96)00132-7
Moreno-Castilla, C. (2004). “Adsorption of organic molecules from aqueous solutions on
carbon materials,” Carbon 42, 83-94. DOI: 10.1016/j.carbon.2003.09.022
Moreno-Castilla, C., Rivera-Utrilla, J., Joly, J. P., López-Ramón, M. V., Ferro-García, M.
A., and Carrasco-Marín, F. (1995a). “Thermal regeneration of an activated carbon
exhausted with different substituted phenols,” Carbon 33(10), 1417-1423. DOI:
10.1016/0008-6223(95)00090-Z
Moreno-Castilla, C., Rivera-Utrilla, J., López-Ramón, M. V., and Carrasco-Marín, F.
(1995b). “Adsorption of some substituted phenols on activated carbons from a
bituminous coal,” Carbon 33(6), 845-851. DOI: 10.1016/0008-6223(94)00182-Y
Moreno-Pirajan, J. C., Giraldo, L., and Gonzalez, J. F. (2011). “Adsorption of phenol in
aqueous solutions using activated carbon monoliths of Coco shell: Adsorption
isotherms and kinetics,” Afinidad 68(554), 290-295.
Morris, J. C., and Weber, W. J. (1962). “The use of adsorption for the removal of
biologically-resistant pollutants from wastewaters,” J. Water Pollut. Control Fed.
34(3), 235-236.
REVIEW ARTICLE bioresources.com
Hubbe et al. (2014). “Petrochemicals biosorption,” BioResources 9(4), 7782-7925. 7864
Mourão, P. A. M., Laginhas, C., Custódio, F., Nabais, J. M. V., Carrott, P. J. M., and
Ribeiro Carrott, M. M. L. (2011). “Influence of oxidation process on the adsorption
capacity of activated carbon from lignocellulosic precursors,” Fuel Process Technol.
92(2), 241-246. DOI: 10.1016/j.fuproc.2010.04.013
Mubarik, S., Saeed, A., Mehmood, Z., and Iqbal, M. (2012). “Phenol adsorption by
charred sawdust of sheesham (Indian rosewood; Dalbergia sissoo) from single,
binary and ternary contaminated solutions,” J. Taiwan Inst. Chem. Eng. 43(6), 926-
933. DOI: 10.1016/j.jtice.2012.07.003
Müller, G., Radke, C. J., and Prausnitz, J. M. (1980). “Adsorption of weak organic
electrolytes from aqueous solution on activated carbon. Effect of pH,” J. Phys. Chem.
84, 369-376. DOI: 10.1021/j100441a006
Müller, G., Radke, C. J., and Prausnitz, J. M. (1985a). “Adsorption of weak organic
electrolytes from dilute aqueous solution onto activated carbon. Part 1. Single-solute
systems,” J. Colloid Interf. Sci. 103(2), 466-483. DOI: 10.1016/0021-9797(85)90123-
7
Müller, G., Radke, C. J., and Prausnitz, J. M. (1985b). “Adsorption of weak organic
electrolytes from dilute aqueous-solution onto activated carbon. 2. Multisolute
systems,” J. Colloid Interface Sci. 103(2), 484-492. DOI: 10.1016/0021-
9797(85)90124-9
Munaf, E., Zein, R., and Kurniadi, I. (1997). “The use of rice husk for removal of phenol
from wastewater as studied using 4-aminoantipyrine spectrophotometric method,”
Environ. Technol. 18(3), 355-358. DOI: 10.1080/09593331808616548
Musteret, C.-P., Cailean, D., Barjoveanu, G., and Teodosiu, C. (2010). “An assessment of
operational parameters for the removal of chlorophenols from wastewater,” Environ.
Eng. Manag. J. 9(10), 1451-1457.
Nabais, J. M. V., Gomes, J. A., Suhas, Carrott, P. J. M., Laginhas, C., and Roman, S.
(2009). “Phenol removal onto novel activated carbons made from lignocellulosic
precursors: Influence of surface properties,” J. Hazard Mater. 167(1-3), 904-910.
DOI: 10.1016/j.jhazmat.2009.01.075
Nakhla, G. F., Abuzaid, N., Farooq, S., and Ala’ama, S. (1992). “Oxygen-induced
enhancement of the adsorptive capacity of activated charcoal,” Environ. Technol. 13,
181-188. DOI: 10.1080/09593339209385142
Namane, A., Ali, O., Cabana, H., and Hellal, A. (2012). “Evaluation of biological
treatments for the adsorption of phenol from polluted waters,” Adsorption Science &
Technology 30(6), 521-532. DOI: 10.1260/0263-6174.30.6.521
Namasivayam, C., and Kavitha, D. (2003). “Adsorptive removal of 2-chlorophenol by
low-cost coir pith carbon,” J. Hazard. Mater. B98, 257-274. DOI: 10.1016/S0304-
3894(03)00006-2
Namasivayam, C., and Sangreetha, D. (2006). “Recycling of agricultural solid waste, coir
pith: Removal of anions, heavy metals, organics and dyes from water by adsorption
onto ZnCl2 activated coir pith carbon,” J. Hazard. Mater. B135(1-3), 449-452. DOI:
10.1016/j.jhazmat.2005.11.066
Nanseu-Njiki, C. P., Dedzo, G. K., and Ngameni, E. (2010). “Study of the removal of
paraquat from aqueous solution by biosorption onto Ayous (Triplochiton
schleroxylon) sawdust,” J. Hazard. Mater. 179(1-3), 63-71. DOI:
10.1016/j.jhazmat.2010.02.058
REVIEW ARTICLE bioresources.com
Hubbe et al. (2014). “Petrochemicals biosorption,” BioResources 9(4), 7782-7925. 7865
Nath, K., Thummar, M., Vaghela, M., and Jani, P. (2008). “Sorption of phenol from
aqueous solution using activated carbon prepared from Manilkara zapota seed,”
Indian J. Chem. Technol. 15(6), 533-540.
Navarro, A. E., Cuizano, N. A., Lazo, J. C., Sun-Kou, M. R., and Llanos, B. P. (2009).
“Comparative study of the removal of phenolic compounds by biological and non-
biological adsorbents,” J. Hazard. Mater. 164, 1439-1446. DOI:
10.1016/j.jhazmat.2008.09.077
Navarro, A. E., Portales, R. F., Sun-Kou, M. R., and Llanos, B. P. (2008). “Effect of pH
on phenol biosorption by marine seaweeds,” J. Hazard. Mater. 156, 405-411. DOI:
10.1016/j.jhazmat.2007.12.039
Ncibi, M. C., Mahjoub, B., and Seffen, M. (2006). “Biosorption of phenol onto Posidonia
oceanica (L.) seagrass in batch system: Equilibrium and kinetic modeling,” Canad. J.
Chem. Eng. 84(4), 495-500. DOI: 10.1002/cjce.5450840411
Nelson, P. O., and Yang, M. (1995). “Equilibrium adsorption of chlorophenols on
granular activated carbon,” Water Environ. Res. 67(6), 892-898. DOI:
10.2175/106143095X133103
Nevskaia, D. M., and Guerrero-Ruiz, A. (2001). “Comparative study of the adsorption
from aqueous solutions and the desorption of phenol and nonylphenol substrates on
activated carbons,” J. Colloid Interface Sci. 234, 316-321. DOI:
10.1006/jcis.2000.7300
Nevskaia, D. M., Sepulveda-Escribano, A., and Guerrero-Ruiz, A. (2001). “Surface
properties of activated carbons in relation to their ability to adsorb nonylphenol
aqueous contaminant,” Phys. Chem. Chem. Physics 3(3), 463-468. DOI:
10.1039/b008883h
Newcombe, G., and Drikas, M. (1997). “Adsorption of NOM onto activated carbon:
Electrostatic and non-electrostatic effects,” Carbon 35(9), 1239-1250. DOI:
10.1016/S0008-6223(97)00078-X
Newcombe, G., Morrison, J., and Hepplewhite, C. (2002a). “Simultaneous adsorption of
MIB and NOM onto activated carbon. I. Characterisation of the system and NOM
adsorption,” Carbon 40(12), 2135-2146. DOI: 10.1016/S0008-6223(02)00097-0
Newcombe, G., Morrison, J., Hepplewhite, C., and Knappe, D. R. U. (2002b).
“Simultaneous adsorption of MIB and NOM onto activated carbon: II. Competitive
effects,” Carbon 40(12), 2147-2156. DOI: 10.1016/S0008-6223(02)00098-2
Ng, C., Losso, J. N., Marshall, W. E., and Rao, R. M. (2000). “Physical and chemical
properties of selected agricultural by products based activated carbons and their
ability to adsorb geosim,” Bioresour. Technol. 84, 177-185. DOI: 10.1016/S0960-
8524(02)00014-7
Ni, J. Z., Pignatello, J. J., and Xing, B. S. (2011). “Adsorption of aromatic carboxylate
ions to black carbon (biochar) is accompanied by proton exchange with water,”
Environ. Sci. Technol. 45(21), 9240-9248; 46(11), 5633.
Ning, Z., Fernandes, L., and Kennedy, K. J. (1999). “Chlorophenol sorption to anaerobic
granules under dynamic conditions,” Water Res. 33(1), 180-188. DOI:
10.1016/S0043-1354(98)00185-7
Niti, C., Sunita, S., Kamlesh, K., and Rakesh, K. (2013). “Bioremediation: An emerging
technology for remediation of pesticides,” Res. J. Chem. Environ. 17(4), 88-105.
REVIEW ARTICLE bioresources.com
Hubbe et al. (2014). “Petrochemicals biosorption,” BioResources 9(4), 7782-7925. 7866
Nouri, S., and Haghseresht, F. (2004). “Adsorption of p-nitrophenol in untreated and
treated activated carbon,” Adsorp. – J. Intl. Adsorp. Soc. 10(1), 79-86. DOI:
10.1023/B:ADSO.0000024037.31407.15
Nouri, S., and Haghseresht, F. (2005). “Estimation of adsorption capacity for dissociating
and non dissociating aromatic compounds on activated carbon with different models,”
Adsorption – J. Intern. Adsorp. Soc. 11(1), 77-86. DOI: 10.1007/s10450-005-1095-7
Nouri, S., Haghseresht, F., and Lu, M. (2002a). “Adsorption of aromatic compounds by
activated carbon: Effects of functional groups and molecular size,” Adsorpt. Sci.
Technol. 20, 1-15. DOI: 10.1260/026361702760120890
Nouri, S., Haghseresht, F., and Lu, G. Q. M. (2002b). “Comparison of adsorption
capacity of p-cresol and p-nitrophenol by activated carbon in single and double
solute,” Adsorption 8(3), 215-223. DOI: 10.1023/A:1021260501001
Ochoa-Herrera, V., and Sierra-Alverez, R. (2008). “Removal of perfluorinated surfactants
by sorption onto granular activated carbon, zeolite, and sludge,” Chemosphere 72,
1588-1593. DOI: 10.1016/j.chemosphere.2008.04.029
Ofomaja, A. E. (2011). “Kinetics and pseudo-isotherm studies of 4-nitrophenol adsorption
onto mansonia wood sawdust,” Indust. Crops Prod. 33(2), 418-428. DOI:
10.1016/j.indcrop.2010.10.036
Ofomaja, A. E., and Unuabonah, E. I. (2011). “Adsorption kinetics of 4-nitrophenol onto a
cellulosic material, mansonia wood sawdust and multistage batch adsorption process
optimization,” Carbohyd. Polym. 83(3), 1192-1200. DOI:
10.1016/j.carbpol.2010.09.023
Ofomaja, A. E., and Unuabonah, E. I. (2013). “Kinetics and time-dependent Langmuir
modeling of 4-nitrophenol adsorption onto Mansonia sawdust,” Journal of the Taiwan
Institute of Chemical Engineers 44(4), 566-576. DOI: 10.1016/j.jtice.2012.12.021
Oh, W.-D., Lim, P.-E., Seng, C.-E., Mohamed, N., Adnan, R., Leong, K.-Y., and Voon, S.-
Y. (2013). “Effect of initial biomass concentration on bioregeneration of 4-
chlorophenol-loaded granular activated carbon: Kinetic and efficiency studies,”
Journal of Chemical Technology and Biotechnology 88(6), 1157-1163. DOI:
10.1002/jctb.3960
Oh, W.-D., Lim, P.-E., Seng, C.-E., and Sujari, A. N. A. (2011). “Bioregeneration of
granular activated carbon in simultaneous adsorption and biodegradation of
chlorophenols,” Bioresource Technology 102(20), 9497-9502. DOI:
10.1016/j.biortech.2011.07.107
Okawa, K., Suzuki, K., Takeshita, T., and Nakano, K. (2007). “Regeneration of granular
activated carbon with adsorbed trichloroethylene using wet peroxide oxidation,” Water
Res. 41, 1045-1051. DOI: 10.1016/j.watres.2006.10.032
Olivella, M. À., Jové, P., Bianchi, A., Bazzicalupi, C., and Cano, L. (2013). “An integrated
approach to understanding the sorption mechanism of phenanthrene by cork,”
Chemosphere 90(6), 1939-1944. DOI: 10.1016/j.chemosphere.2012.10.035
Omri, A., and Benzina, M. (2014). “Almond shell activated carbon: Adsorbent and
catalytic support in the phenol degradation,” Environ. Monitor. Assess. 186(6), 3875-
3890. DOI: 10.1007/s10661-014-3664-2
Osei-Twum, E. Y., Abuzaid, N. S., and Nahkla, G. (1996). “Carbon-catalyzed oxidative
coupling of phenolic compounds,” Bull Environ. Contam. Toxicol. 56, 513-519. DOI:
10.1007/s001289900074

REVIEW ARTICLE bioresources.com
Hubbe et al. (2014). “Petrochemicals biosorption,” BioResources 9(4), 7782-7925. 7867
Özbelge, T. A., Özbelge, Ö. H., and Başkaya, S. Z. (2002). “Removal of phenolic
compounds from rubber-textile wastewaters by physicochemical methods,” Chem.
Eng. Process 41(8), 719-730. DOI: 10.1016/S0255-2701(01)00189-1
Ozdemir, S., Bekler, F. M., Okumus, V., Dundar, A., and Kilinc, E. (2012). “Biosorption
of 2,4-D, 2,4-DP, and 2,4-DB from aqueous solution by using thermophilic
Anoxybacillus flavithermus and analysis by high-performance thin layer
chromatography: Equilibrium and kinetic studies,” Environ. Prog. Sustain. Energy
31(4), 544-552. DOI: 10.1002/ep.10576
Özkaya, B. (2006). “Adsorption and desorption of phenol on activated carbon and a
comparison of isotherm models,” J. Hazard Mater. B 129, 128-163. DOI:
10.1016/j.jhazmat.2005.08.025
Pajooheshfar, S. P., and Saeedi, M. (2009). “Adsorptive removal of phenol from
contaminated water and wastewater by activated carbon, almond, and walnut shells
charcoal,” Water Environ. Res. 81(6), 641-648. DOI: 10.2175/106143008X390780
Pan, B., and Xing, B. (2008). “Adsorption mechanisms of organic chemicals on carbon
nanotubes,” Environ. Sci. Technol. 42(24), 9005-9013. DOI: 10.1021/es801777n
Pan, X. L., Liu, J., and Zhang, D. Y. (2010). “Binding of phenanthrene to extracellular
polymeric substances (EPS) from aerobic activated sludge: A fluorescence study,”
Colloids Surf. B – Biointerfaces 80(1), 103-106. DOI: 10.1016/j.colsurfb.2010.05.002
Park, J., Meng, J., Lim, K. H., Rojas, O. J., and Park, S. (2013). “Transformation of
lignocellulosic biomass during torrefaction,” J. Anal. Appl. Pyrol. 100(3), 199-206.
DOI: 10.1016/j.jaap.2012.12.024
Park, S., Venditti, R. A., Jameel, H., and Pawlak, J. J. (2007). “Studies of the heat of
vaporization of water associated with cellulose fibers characterized by thermal
analysis,” Cellulose 14(3), 195-402. DOI: 10.1007/s10570-007-9108-1
Pavoni, B., Drusian, D., Giacometti, A., and Zanette, M. (2006). “Assessment of organic
chlorinated compound removal from aqueous matrices by adsorption on activated
carbon,” Water Res. 40, 3571-3579. DOI: 10.1016/j.watres.2006.05.027
Peng, X., Li, Y., Luan, Z., Di, Z., Wang, H., Tian, B., and Jia, Z. (2003). “Adsorption of
1,2-dichlorobenzene from water to carbon nanotubes,” Chem. Phys. Lett. 376, 154-158.
DOI: 10.1016/S0009-2614(03)00960-6
Penmetsa, V. K., and Steele, P. H. (2012). “Preliminary findings for the production of
water repellent torrefied wood pellets with pyrolysis oil,” Environ. Prog. Sustain.
Energy 31(2), 235-239. DOI: 10.1002/ep.11624
Pera-Titus, M., Garcia-Molina, V., Banos, M. A., Gimenez, J., and Esplugas, S. (2004).
“Degradation of chlorophenols by means of advanced oxidation processes: A general
review,” Appl. Catal. B – Environ. 47(4), 219-256. DOI: 10.1016/j.apcatb.2003.09.010
Pernyeszi, T., Honfi, K., Boros, B., Talos, K., Kilar, F., and Majdik, C. (2009).
“Biosorption of phenol from aqueous solutions by fungal biomass of Phanerochaete
chrysosporium,” Studia Univ. Babes-Bolyai Chemia 54(3), 173-183.
Perrich, J. R. (1981). Activated Carbon Adsorption for Wastewater Treatment, CRC Press,
Boca Raton, FL.
Pigatto, G., Lodi, A., Finocchio, E., Palma, M. S. A., and Converti, A. (2013). “Chitin as
biosorbent for phenol removal from aqueous solution: Equilibrium, kinetic and
thermodynamic studies,” Chemical Engineering and Processing 70, 131-139. DOI:
10.1016/j.cep.2013.04.009
REVIEW ARTICLE bioresources.com
Hubbe et al. (2014). “Petrochemicals biosorption,” BioResources 9(4), 7782-7925. 7868
Pignatello, J. J., Oliveros, E., and MacKay, A. (2006). “Advanced oxidation processes for
organic contaminant destruction based on the Fenton reaction and related chemistry,”
Crit. Revs. Environ. Sci. Technol. 36(1), 1-84. DOI: 0.1080/10643380500326564
Pignatello, J. J., and Xing, B. (1996). “Mechanisms of slow sorption of organic chemicals
to natural particles,” Environ. Sci. Technol. 30(1), 1-11. DOI: 10.1021/es940683g
Pintor, A. M. A., Ferreira, C. I. A., Pereira, J. C., Correia, P., Silva, S. P., Vilar, V. J. P.,
Botelho, C. M. S., and Boaventura, R. A. R. (2012). “Use of cork powder and granules
for the adsorption of pollutants: A review,” Water Res. 46(10), 3152-3166. DOI:
10.1016/j.watres.2012.03.048
Plazinski, W., and Plazinska, A. (2011). “Molecular dynamics study of the interactions
between phenolic compounds and alginate/alginic acid chains,” New J. Chem. 35(8),
1607-1614. DOI: 10.1039/c1nj20273a
Podkościelny, P., Dąbrowski, A., and Marijuk, O. V. (2003). “Heterogeneity of active
carbons in adsorption of phenol aqueous solutions,” Appl. Surf. Sci. 205, 297-303.
DOI: 10.1016/S0169-4332(02)01154-6
Pollard, S. J. T., Fowler, G. D., Sollars, C. J., and Perry, R. (1992). “Low cost adsorbents
for waste and wastewater treatment: A review,” Sci. Total Environ. 116, 31-52. DOI:
10.1016/0048-9697(92)90363-W
Pratarn, W., Pornsiri, T., Thanit, S., Tawatchai, C., and Wiwut, T. (2011). “Adsorption
and ozonation kinetic model for phenolic wastewater treatment,” Chin. J. Chem. Eng.
19(1), 76-82. DOI: 10.1016/S1004-9541(09)60180-4
Qu, G.-Z., Li, J., Liang, D.-L., Huang, D.-L., Qu, D., and Huang, Y.-M. (2013). “Surface
modification of a granular activated carbon by dielectric barrier discharge plasma and
its effects on pentachlorophenol adsorption,” Journal of Electrostatics 71(4), 689-694.
DOI: 10.1016/j.elstat.2013.03.013
Qu, X. L., Xiao, L., and Zhu, D. Q. (2008). “Site-specific adsorption of 1,3-
dinitrobenzene to bacterial surfaces: A mechanism of n-pi electron-donor-acceptor
interactions,” J. Environ. Qual. 37(3), 824-829. DOI: 10.2134/jeq2007.0236
Quilliam, R. S., Rangecroft, S., Emmett, B. A., Deluca, T. H., and Jones, D. L. (2013).
“Is biochar a source or sink for polycyclic aromatic hydrocarbon (PAH) compounds
in agricultural soils?” Global Change Biology Bioenergy 5(2), 96-103. DOI:
10.1111/gcbb.12007
Quinlivan, P. A., Li, L., and Knappe, D. R. U. (2005). “Effects of activated carbon
characteristics on the simultaneous adsorption of aqueous organic micropollutants and
natural organic matter,” Water Res. 39, 1663-1673. DOI: 10.1016/j.watres.2005.01.029
Radhika, M., and Palanivelu, K. (2006). “Adsorptive removal of chlorophenol from
aqueous solution by low cost adsorbent – Kinetics and isotherm analysis,” J. Hazard
Mater B138, 116-124. DOI: 10.1016/j.jhazmat.2006.05.045
Radovic, L. R., Silva, I. F., Ume, J. I., Menéndez, J. A., León y León, C., and Scaroni, A.
W. (1997). “An experimental and theoretical study of the adsorption of aromatics
possessing electron-withdrawing and electron-donating functional groups by
chemically modified activated carbons,” Carbon 35(9), 1339-1348. DOI:
10.1016/S0008-6223(97)00072-9
Raghukumar, C., Shailaja, M. S., Parameswaran, M. S., and Singh, S. K. (2006). “Removal
of polycyclic aromatic hydrocarbons from aqueous media by the marine fungus
REVIEW ARTICLE bioresources.com
Hubbe et al. (2014). “Petrochemicals biosorption,” BioResources 9(4), 7782-7925. 7869
NIOCC #312: Involvement of lignin-degrading enzymes and exopolysaccharides,” Ind.
J. Mar. Sci. 35, 373-379.
Ran, Y., Yang, Y., Xing, B. S., Pignatello, J. J., Kwon, S., Su, W., and Zhou, L. (2013).
“Evidence of micropore filling for sorption of nonpolar organic contaminants by
condensed organic matter,” J. Environ. Qual. 42(3), 806-814. DOI:
10.2134/jeq2012.0286
Rao, J. R., and Viraraghavan, T. (2002). “Biosorption of phenol from an aqueous solution
by Aspergillus niger biomass,” Bioresour. Technol. 85(2), 165-171. DOI:
10.1016/S0960-8524(02)00079-2
Ratola, N., Botelho, C., and Alves, A. (2003). “The use of pine bark as a natural
adsorbent for persistent organic pollutants – Study of lindane and heptachlor
adsorption,” J. Chem. Technol. Biotechnol. 78, 347-351. DOI: 10.1002/jctb.784
Ravi, V. P., Jasra, R. V., and Bhat, T. S. G. (1998). “Adsorption of phenol, cresol isomers
and benzyl alcohol from aqueous solution on activated carbon,” J. Chem. Technol.
Biotechnol. 71, 173-179. DOI: 10.1002/(SICI)1097-4660(199802)71:2<173::AID-
JCTB818>3.0.CO;2-N
Redlich, O. J., and Peterson, D. L. (1959). “A useful adsorption isotherm,” J. Phys. Chem.
63, 1024-1024. DOI: 10.1021/j150576a611
Reed, A. R., and Williams, P. T. (2004). “Thermal processing of biomass natural fibre
wastes by pyrolysis,” Int. J. Energy Res. 28(2), 131-145. DOI: 10.1002/er.956
Rengaraj, S., Moon, S. H., Sivabalan, R., Arabindoo, B., and Murugesan, V. (2002a).
“Agricultural solids waste for the removal of organics: Adsorption of phenol from
water and wastewater by palm seed coat activated carbon,” Waste Manage. 22(5),
543-548. DOI: 10.1016/S0956-053X(01)00016-2
Rengaraj, S., Moon, S. H., Sivabalan, R., Arabindoo, B., and Murugesan, V. (2002b).
“Removal of phenol from aqueous solution and resin manufacturing industry
wastewater using an agricultural waste: Rubber seed coat,” J. Hazard Mater. 89(2-3),
185-196. DOI: 10.1016/S0304-3894(01)00308-9
Rivera-Utrilla, J., Utrera-Hidalgo, E., Ferro-García, M. A., and Moreno-Castilla, C.
(1991). “Comparison of activated carbons prepared from agricultural raw materials
and Spanish lignites when removing chlorophenols from aqueous solutions,” Carbon
29(4/5), 613-619. DOI: 10.1016/0008-6223(91)90128-6
Rodrigues, L. A., da Silva, M. L. C. P., Alvarez-Mendes, M. O., Coutinho, A. R., and
Thim, G. P. (2011). “Phenol removal from aqueous solution by activated carbon
produced from avocado kernel seeds,” Chem. Eng. J. 174(1), 49-57. DOI:
10.1016/j.cej.2011.08.027
Rodrigues, L. A., Ribeiro, L. A. D., Thim, G. P., Ferreira, R. R., Alvarez-Mendez, M. O.,
and Coutinho, A. D. (2013). “Activated carbon derived from macadamia nut shells:
An effective adsorbent for phenol removal,” Journal of Porous Materials 20(4), 619-
627. DOI: 10.1007/s10934-012-9635-5
Rodriguez-Cruz, S., Andrades, M. S., Sanchez-Camazano, M., and Sanchez-Martin, M. J.
(2007). “Relationship between the adsorption capacity of pesticides by wood residues
and the properties of woods and pesticides,” Environ. Sci. Technol. 41, 3613-3619.
DOI: 10.1021/es062616f
Román, S., Ledesma, B., González, J. F., Al-Kassir, A., Engo, G., and Álvarez-Murillo,
A. (2013). “Two stage thermal regeneration of exhausted activated carbons. Steam

REVIEW ARTICLE bioresources.com
Hubbe et al. (2014). “Petrochemicals biosorption,” BioResources 9(4), 7782-7925. 7870
gasification of effluents,” Journal of Analytical and Applied Pyrolysis 103(Special
Issue), 201-206. DOI: 10.1016/j.jaap.2012.08.017
Romeh, A. A. (2010). “Phytoremediation of water and soil contaminated with
imidacloprid pesticide by Plantago major, L.,” Intl. J. Phytoremed. 12(2), 188-199.
DOI: 10.1080/15226510903213936
Roostaei, N., and Tezel, F. H. (2004). “Removal of phenol from aqueous solutions by
adsorption,” J. Environ. Manag. 70, 157-164. DOI: 10.1016/j.jenvman.2003.11.004
Rosenholm, J. B. (2010). “Critical comparison of molecular mixing and interaction
models for liquids, solutions and mixtures,” Advan. Colloid Interface Sci. 156(1-2),
14-34. DOI: 10.1016/j.cis.2010.02.005
Rossner, A., and Knappe, D. R. U. (2008). “MTBE adsorption on alternative adsorbents
and packed bed adsorber performance,” Water Res. 42(8-9), 2287-2299. DOI:
10.1016/j.watres.2007.12.009
Rossner, A., Snyder, S. A., and Knappe, D. R. U. (2009). “Removal of emerging
contaminants of concern by alternative adsorbents,” Water Res. 43(15), 3787-3796.
DOI: 10.1016/j.watres.2009.06.009
Rouquerol, J., Avnir, E., Fairbridge, C. W., Everett, D. H., Haynes, J. M., Pernicone, N.,
Ramsay, J. D. F., Sing, K. S. W., and Unger, K. K. (1994). "Recommendations for the
characterization of porous solids (Technical Report)," Pure & Appl. Chem. 66(8),
1739-1758. DOI:10.1351/pac199466081739
Rubin, E., Rodriguez, P., Herrero, R., and de Vincente, M. E. S. (2006). “Biosorption of
phenolic compounds by the brown alga Sargassum muticum,” J. Chem. Technol.
Biotechnol. 81(7), 1093-1099. DOI: 10.1002/jctb.1430
Rutherford, D. W., Wershaw, R. L., Rostad, C. E., and Kelly, C. N. (2012). “Effect of
formation conditions on biochars: Compositional and structural properties of
cellulose, lignin, and pine biochars,” Biomass & Bioenergy 46, 693-701. DOI:
10.1016/j.biombioe.2012.06.026
Sabio, E., González, E., González, J. F., González-García, C. M., Ramiro, A., and Gañan,
J. (2004). “Thermal regeneration of activated carbon saturated with p-nitrophenol,”
Carbon 42, 2285-2293. DOI: 10.1016/j.carbon.2004.05.007
Sakoda, A., Kawazoe, K., and Suzuki, M. (1987). “Adsorption of tri- and tetra-
chloroethylene from aqueous solutions on activated carbon fibers,” Water Res. 21(6),
717-722. DOI: 10.1016/0043-1354(87)90084-4
Salame, I. I., and Bandosz, T. J. (2003). “Role of surface chemistry in adsorption of
phenol on activated carbons,” J. Colloid Interf. Sci. 264, 307-312. DOI:
10.1016/S0021-9797(03)00420-X
Salloum, M. J., Chefetz, B., and Hatcher, P. G. (2002). “Phenanthrene sorption by
aliphatic-rich natural organic matter,” Environ. Sci. Technol. 36, 1953-1558. DOI:
10.1021/es015796w
Samanta, S. K., Singh, O. V., and Jain, R. K. (2002). “Polycyclic aromatic hydrocarbons:
Environmental pollution and bioremediation,” Trend. Biotechnol. 20(6), 243-248.
DOI: 10.1016/S0167-7799(02)01943-1
San Miguel, G., Lambert, S. D., and Graham, N. J. D. (2001). “The regeneration of
field-spent granular activated carbon,” Water Res. 35(11), 2740-2748. DOI:
10.1016/S0043-1354(00)00549-2
REVIEW ARTICLE bioresources.com
Hubbe et al. (2014). “Petrochemicals biosorption,” BioResources 9(4), 7782-7925. 7871
Sathishkumar, M., Binupriya, A. R., Kavitha, D., Selvakumar, R., Jayabalan, R., Choi, J.
G., and Yun, S. E. (2009). “Adsorption potential of maize cob carbon for 2,4-
dichlorophenol removal from aqueous solutions: Equilibrium, kinetics and
thermodynamics modeling,” Chem. Eng. J. 147(2-3), 265-271. DOI:
10.1016/j.cej.2008.07.020
Sathishkumar, M., Choi, J. G., Ku, C. S., Vijayaraghavan, K., Binupriya, A. R., and Yun,
S. E. (2008). “Carbaryl sorption by porogen-treated banana pith carbon,” Adsorp. Sci.
Technol. 26(9), 679-686. DOI: 10.1260/026361708788251367
Sekaran, G., Karthikeyan, S., Gupta, V. K., Boopathy, R., and Maharaja, P. (2013).
“Immobilization of Bacillus sp in mesoporous activated carbon for degradation of
sulphonated phenolic compound in wastewater,” Mater. Sci. Eng. C – Materials Bio.
Appl. 33(2), 735-745. DOI: 10.1016/j.msec.2012.10.026
Şenel, S., Kara, A., Alsancak, G., and Denizli, A. (2006). “Removal of phenol and
chlorophenols from water with reusable dye-affinity hollow fibers,” J. Hazard.
Mater. 138(2), 317-324. DOI: 10.1016/j.jhazmat.2006.05.121
Seo, G. T., Ohgaki, S., and Suzuki, Y. (1997). “Sorption characteristics of biological
powdered activated carbon in BPAC-MF (biological powdered activated carbon-
microfiltration) system for refractory organic removal,” Water Sci. Technol. 35(7),
163-170. DOI: 10.1016/S0273-1223(97)00127-3
Seredych, M., and Bandosz, T. J. (2010). “Adsorption of dibenzothiophenes on
nanoporous carbons: identification of specific adsorption sites governing capacity and
selectivity,” Energy Fuels 24, 3352-3360. DOI: 10.1021/ef9015087
Seredych, M., and Bandosz, T. J. (2011). “Removal of dibenzothiophenes from model
diesel fuel on sulfur rich activated carbons.” Applied Catalysis B - Environmental
106(1-2), 133-141.
Sethunathan, N., Megharaj, M., Chen, Z. L., Williams, B. D., Lewis, G., and Naidu, R.
(2004). “Algal degradation of a known endocrine disrupting insecticide, alpha-
endosulfan, and its metabolite, endosulfan sulfate, in liquid medium and soil,” J.
Agric. Food Chem. 52(10), 3030-3035. DOI: 10.1021/jf035173x
Severtson, S. J., and Banerjee, S. (1996). “Sorption of chlorophenols to wood pulp,”
Environ. Sci. Technol. 30, 1961-1969. DOI: 10.1021/es950649h
Shaikh, H., Memon, N., Khan, H., Bhander, M. I., and Nizamani, S. M. (2012).
“Preparation and characterization of molecularly imprinted polymer for di(2-
ethylhexyl) phthalate: Application to sample clean-up prior to gas chromatographic
determination,” J. Chromatography A 1247, 125-133. DOI:
10.1016/j.chroma.2012.05.056
Shen, Q. (2009). “Surface properties of cellulose and cellulose derivatives: A review,” in:
Model Cellulosic Surfaces, Roman, M. (ed.), ACS Symposium Ser. 1019, 259-289.
DOI: 10.1021/bk-2009-1019.ch012
Shen, Q., Mikkola, P., and Rosenholm, J. B. (1998). “Quantitative characterization of the
subsurface acid-base properties of wood by XPS and Fowkes theory,” Colloids Surf.
A: Physicochem. Eng. Aspects 145, 235-241. DOI: 10.1016/S0927-7757(98)00655-4
Shen, W. Z., Guo, Q. J., Zhang, Y. S., Liu, Y., Zheng, J. T., Cheng, J., and Fan, J. (2006).
“The effect of activated carbon fiber structure and loaded copper, cobalt, silver on the
REVIEW ARTICLE bioresources.com
Hubbe et al. (2014). “Petrochemicals biosorption,” BioResources 9(4), 7782-7925. 7872
adsorption of dichloroethylene,” Colloids Surf. A. – Physicochem. Eng. Aspects 273(1-
3), 147-153. DOI: 10.1016/j.colsurfa.2005.08.010
Shimizu, Y., Yamazaki, S., and Terashima, Y. (1992). “Sorption of anionic
pentachlorophenol (PCP) in aqueous environments: The effect of pH,” Water Sci.
Technol. 25(11), 41-48.
Singh, B. K., and Rawat, N. S. (1994a). “Comparative sorption kinetic-studies of
phenolic-compounds on fly-ash and impregnated fly-ash,” J. Chem. Technol. Biotech.
61(1), 57-65. DOI: 10.1002/jctb.280610109
Singh, B. K., and Rawat, N. S. (1994b). “Comparative sorption equilibrium studies of
toxic phenols on fly ash and impregnated fly ash,” J. Chem. Technol. Biotechnol. 61,
307-315. DOI: 10.1002/jctb.280610405
Singh, K. P., Malik, A., Sinha, S., and Ojha, P. (2008). “Liquid-phase adsorption of
phenols using activated carbons derived from agricultural waste material,” J. Hazard.
Mater. 150, 626-641. DOI: 10.1016/j.jhazmat.2007.05.017
Sinnokrot, M. O., Valeev, E. F., and Sherrill, C. D. (2002). “Estimates of the ab initio
limit for pi-pi interactions: The benzene dimer,” J. Amer. Chem. Soc. 124(36),
10887-10893. DOI: 10.1021/ja025896h
Slaney, A. J., and Bhamidimarri, R. (1998). “Adsorption of pentachlorophenol (PCP) by
activated carbon in fixed beds: Application of homogeneous surface diffusion
model,” Water Sci. Technol. 38(7), 227-235. DOI: 10.1016/S0273-1223(98)00630-1
Snoeyink, V. L., Weber, W. J., and Mark, H. B. (1969). “Sorption of phenol and
nitrophenol by active carbon,” Environ. Sci. Technol. 31(10), 918-926. DOI:
10.1021/es60033a008
Sodha, K., Panchani, S. C., and Nath, K. (2013). “Feasibility study of microbial
regeneration of spent activated carbon sorbed with phenol using mixed bacterial
culture,” Indian Journal of Chemical Technology 20(1), 33-39.
Sokker, H. H., Badawy, S. M., Zayed, E. M., Eldien, F. A. N., and Farag, A. M.
(2009). “Radiation-induced grafting of glycidyl methacrylate onto cotton fabric
waste and its modification for anchoring hazardous wastes from their solutions,”
J. Hazardous Mater. 168(1), 137-144. DOI: 10.1016/j.jhazmat.2009.02.039
Soni, H., and Padmaja, P. (2014). “Palm shell based activated carbon for removal of
bisphenol A: An equilibrium, kinetic and thermodynamic study,” J. Porous
Mater. 21(3), 275-284. DOI: 10.1007/s10934-013-9772-5
Sothornvit, R., and Sampoompuang, C. (2012). “Rice straw paper incorporated with
activated carbon as an ethylene scavenger in a paper-making process,”
International Journal of Food Science and Technology 47(3), 511-517. DOI:
10.1111/j.1365-2621.2011.02871.x
Speranza, F., Pilkington, G. A., Dane, T. G., Cresswell, P. T., Li, P. X., Jacobs, R.
M. J., Arnold, T., Bouchenoire, L., Thomas, R. K., and Briscoe, W. H. (2013),
“Quiescent bilayers at the mica-water interface,” Soft Matter 9(29), 7028-7041.
DOI: 10.1039/c3sm50336d
Srivastava, S. K., and Tyagi, R. (1995a). “Competitive adsorption of substituted
phenols by activated carbon developed from the fertilizer waste slurry,” Water
Res. 29(2), 483-488. DOI: 10.1016/0043-1354(94)00182-7
Srivastava, S. K., and Tyagi, R. (1995b). “Organic desorption and chemical
regeneration of spent carbon developed from fertilizer waste slurry,” J. Environ.
REVIEW ARTICLE bioresources.com
Hubbe et al. (2014). “Petrochemicals biosorption,” BioResources 9(4), 7782-7925. 7873
Eng. – ASCE 121(2), 186-193. DOI: 10.1061/(ASCE)0733-
9372(1995)121:2(186)
Srivastava, S. K., Tyagi, R., Pal, N., and Mohan, D. (1997). “Process development for
removal of substituted phenols by carbonaceous adsorbent obtained from fertilizer
waste,” J. Environ. Eng. 123, 842-851. DOI: 10.1061/(ASCE)0733-
9372(1997)123:9(842)
Srivastava, V. C., Swamy, M. M., Mall, I. D., Prasad, B., and Mishra, I. M. (2006).
“Adsorptive removal of phenol by bagasse fly ash and activated carbon: Equilibrium,
kinetics and thermodynamics,” Colloids Surf. A: Physicochem. Aspects 272, 89-104.
DOI: 10.1016/j.colsurfa.2005.07.016
Stasinakis, A. S., Elia, I., Petalas, A. V., and Halvadakis, C. P. (2008). “Removal of total
phenols from olive-mill wastewater using an agricultural by-product olive pomace,”
J. Hazard. Mater. 160, 408-413, Doi: 10.1016/j.jhazmat.2008.03.012.
Stavropoulos, G. G., Samaras, P., and Sakellaropoulos, G. P. (2008). “Effect of activated
carbons modification on porosity, surface structure and phenol adsorption,” J. Hazard
Mater. 151, 414-421. DOI: 10.1016/j.jhazmat.2007.06.005
Steen, W. C., and Karickhoff, S. W. (1981). “Biosorption of hydrophobic organic
pollutants by mixed microbial-populations,” Chemosphere 10(1), 27-32. DOI:
10.1016/0045-6535(81)90156-9
Stoeckli, F., López-Ramón, M. V., and Moreno-Castilla, C. (2001). “Adsorption of
phenolic compounds from aqueous solutions by activated carbons, described by the
Dubinin-Astakhov equation,” Langmuir 17, 3301-3306. DOI: 10.1021/la0014407
Stone, J. E., and Scallan, A. M. (1996). “Influence of drying on the pore structures of the
cell wall,” in: Consolidation of the Paper Web, Transactions of the symposium held
at Cambridge, Sept. 1965, Bolam, F. (ed.), Tech. Sec. British Paper and Board
Makers’ Assoc., London, pp. 145-174.
Streat, M., Patrick, J. W., and Camporro Perrez, M. J. (1995). “Sorption of phenol and
parachlorophenol from water using conventional and novel activated carbons,” Water
Res. 29(2), 467-472. DOI: 10.1016/0043-1354(94)00187-C
Stringfellow, W. T., and Alvarez-Cohen, L. (1999). “Evaluating the relationship between
the sorption of PAHs to bacterial biomass and biodegradation,” Water Res. 33(11),
2535-2544. DOI: 10.1016/S0043-1354(98)00497-7
Subha, R., and Namasivayam, C. (2009). “Kinetics and isotherm studies for the
adsorption of phenol using low cost micro porous ZnCl2 activated coir pith carbon,”
Canad. J. Civil Eng. 36(1), 148-159. DOI: 10.1139/S08-039
Subha, R., and Namasivayam, C. (2010). “ZnCl2-modified activated carbon from
biomass coir pith for the removal of 2-chlorophenol by adsorption process,”
Bioremed. J. 14(1), 1-9. DOI: 10.1080/10889860903455360
Suhas, Carrott, P. J. M., and Carrott, M. M. L. R. (2007). “Lignin - from natural
adsorbent to activated carbon: A review,” Bioresour. Technol. 98(12), 2301-2312.
DOI: 10.1016/j.biortech.2006.08.008
Sulaymon, A. H., Abbood, D. W., Ali, A. H. (2012). “Removal of phenol and lead from
synthetic wastewater by adsorption onto granular activated carbon in fixed bed
adsorbers: Prediction of breakthrough curves,” Desalination Water Treat. 40, 244-
253. DOI: 10.1080/19443994.2012.671253
Sulaymon, A. H., Abbood, D. W., and Ali, A. H. (2013). “A comparative
REVIEW ARTICLE bioresources.com
Hubbe et al. (2014). “Petrochemicals biosorption,” BioResources 9(4), 7782-7925. 7874
adsorption/biosorption for the removal of phenol and lead onto granular activated
carbon and dried anaerobic sludge,” Desalination Water Treat. 51(10-12), 2055-
2067. DOI: 10.1080/19443994.2013.734497
Sun, K., Gao, B., Ro, K. S., Novak, J. M., Wang, Z. Y., Herbert, S., and Xing, B. S.
(2012a). “Assessment of herbicide sorption by biochars and organic matter associated
with soil and sediment,” Environmental Pollution 163, 167-173. DOI:
10.1016/j.envpol.2011.12.015
Sun, K., Jin, J., Keiluweit, M., Kleber, M., Wang, Z. Y., Pan, Z. Z., and Xing, B. S.
(2012b). “Polar and aliphatic domains regulate sorption of phthalic acid esters
(PAEs) to biochars,” Bioresour. Technol. 118, 120-127. DOI:
10.1016/j.biortech.2012.05.008
Sun, K., Keiluweit, M., Kleber, M., Pan, Z., and Xing, B. (2011a). “Sorption of
fluorinated herbicides to plant biomass-derived biochars as a function of molecular
structure,” Bioresour. Technol. 102(21), 9897-9903. DOI:
10.1016/j.biortech.2011.08.036
Sun, K., Ro, K., Guo, M., Novak, J., Mashayekhi, H., and Xing, B. (2011b). “Sorption
of bisphenol A, 17alpha-ethinyl estradiol and phenanthrene on thermally and
hydrothermally produced biochars,” Bioresour. Technol. 102(10), 5757-5763. DOI:
10.1016/j.biortech.2011.03.038
Tan, I. A. W., Ahmad, A. L., and Hameed, B. H. (2008). “Preparation of activated carbon
from coconut husk: Optimization study on removal of 2,4,6-trichlorophenol using
response surface methodology,” J. Hazard Mater. 153(1-2), 709-717. DOI:
10.1016/j.jhazmat.2007.09.014
Tan, I. A. W., Ahmad, A. L., and Hameed, B. H. (2009a). “Fixed-bed adsorption
performance of oil palm shell-based activated carbon for removal of 2,4,6-
trichlorophenol,” Bioresour. Technol. 100(3), 1494-1496. DOI:
10.1016/j.biortech.2008.08.017
Tan, I. A. W., Ahmad, A. L., and Hameed, B. H. (2009b). “Adsorption isotherms,
kinetics, thermodynamics and desorption studies of 2,4,6-trichlorophenol on oil palm
empty fruit bunch-based activated carbon,” J. Hazard. Mater. 164(2-3), 473-482.
DOI: 10.1016/j.jhazmat.2008.08.025
Tancredi, N., Medero, N., Möller, F., Piriz, J., Plada, X., and Cordero, T. (2004). “Phenol
adsorption onto powdered and granular activated carbon prepared from Eucalyptus
wood,” J. Colloid Interface Sci. 279, 357-363. DOI: 10.1016/j.jcis.2004.06.067
Tang, D., Zheng, Z., Lin, K., Luan, J., and Zhang, J. (2007). “Adsorption of p-
nitrophenol from aqueous solutions onto activated carbon fiber,” J. Hazard Mater.
143, 49-56. DOI: 10.1016/j.jhazmat.2006.08.066
Temkin, M. I. (1941). “Adsorption equilibrium and the kinetics of processes on
nonhomogeneous surfaces and in the interaction between adsorbed molecules,” Zh.
Fiz. Chim. 15, 296-332.
Teng, H., and Hseih, C.-T. (1999). “Liquid-phase adsorption of phenol by activated
carbons prepared from biotuminous coals with different oxygen contents,” J. Chem.
Technol. Biotechnol. 74, 123-130. DOI: 10.1002/(SICI)1097-
4660(199902)74:2<123::AID-JCTB991>3.0.CO;2-5
Terzyk, A. P. (2003a). “Adsorption of biologically active compounds from aqueous
solutions on to commercial unmodified activated carbons. Part V. The mechanism of
REVIEW ARTICLE bioresources.com
Hubbe et al. (2014). “Petrochemicals biosorption,” BioResources 9(4), 7782-7925. 7875
the physical and chemical adsorption of phenol,” Adsorp. Sci. Technol. 21(6), 539-
585. DOI: 10.1260/026361703771953596
Terzyk, A. P. (2003b). “Further insights into the role of carbon surface functionalities in
the mechanism of phenol adsorption,” J. Colloid Interf. Sci. 268, 301-329. DOI:
10.1016/S0021-9797(03)00690-8
Terzyk, A. P., Gauden, P. A., Furmaniak, S., Wesołowski, R. P., and Harris, P. J. F.
(2010). “Molecular dynamics simulation insight into the mechanism of phenol
adsorption at low coverages from aqueous solutions on microporous carbons,” Phys.
Chem. Chem. Phys. 12(4), 812-817. DOI: 10.1039/b919794j
Tessmer, C. H., Vidic, R. D., and Uranowski, L. J. (1997). “Impact of oxygen-containing
surface functional groups on activated carbon adsorption of phenols,” Environ. Sci.
Technol. 31(7), 1872-1878. DOI: 10.1021/es960474r
Thawornchaisit, U., and Pakulanon, K. (2007). “Application of dried sewage sludge as
phenol biosorbent,” Bioresour. Technol. 98, 140-144. DOI:
10.1016/j.biortech.2005.11.004
Thuy, P. T., Anh, N. V., and van der Bruggen, B. (2012). “Evaluation of two low-cost-
high-performance adsorbent materials in the waste-to-product approach for the
removal of pesticides from drinking water,” Clean-Soil Air Water 40(3), 246-253.
DOI: 10.1002/clen.201100209
Thuy, P. T., Moons, K., van Dijk, J. C., Anh, N. V., and Van der Bruggen, B. (2008). “To
what extent are pesticides removed from surface water during coagulation-
flocculation?” Water Environ. J. 22(3), 217-223. DOI: 10.1111/j.1747-
6593.2008.00128.x
Timur, S., Kantarli, I. C., Onenc, S., and Yanik, J. (2010). “Characterization and
application of activated carbon produced from oak cups pulp,” J. Anal. Appl. Pyrol.
89(1), 129-136. DOI: 10.1016/j.jaap.2010.07.002
Toh, R. H., Lim, P. E., Seng, C. E., and Adnan, R. (2013). “Immobilized acclimated
biomass-powdered activated carbon for the bioregeneration of granular activated
carbon loaded with phenol and o-cresol,” Bioresource Technology 143, 265-274.
DOI: 10.1016/j.biortech.2013.05.126
Toles, C. A., Marshall, W. E., and Johns, M. M. (1997). “Granular activated carbons
from nutshells for the uptake of metals and organic compounds,” Carbon 35(9),
1407-1414. DOI: 10.1016/S0008-6223(97)00073-0
Toles, C. A., Marshall, W. E., and Johns, M. M. (1998). “Phosphoric acid activation of
nutshells for metals and organic remediation: Process optimization,” J. Chem.
Technol. Biotechnol. 72, 255-263. DOI: 10.1002/(SICI)1097-
4660(199807)72:3<255::AID-JCTB890>3.0.CO;2-P
Tsai, W.-T. (2013). “A review on environmental distributions and risk management of
phenols pertaining to the endocrine disrupting chemicals in Taiwan,” Toxicological
And Environmental Chemistry 95(5), 723-736. DOI: 10.1080/02772248.2013.818150
Tseng, R. L., Wu, F. C., and Juang, R. S. (2003). “Liquid-phase adsorption of dyes and
phenols using pinewood-based activated carbons,” Carbon 41(3), 487-495. DOI:
10.1016/S0008-6223(02)00367-6
Tseng, R.-L., Wu, K.-T., Wu, F.-C., and Juang, R.-S. (2010). “Kinetic studies on the
adsorption of phenol, 4-chlorophenol, and 2,4-dichlorophenol from water using
REVIEW ARTICLE bioresources.com
Hubbe et al. (2014). “Petrochemicals biosorption,” BioResources 9(4), 7782-7925. 7876
activated carbons,” J. Environ. Manag. 91(11), 2208-2214. DOI:
10.1016/j.jenvman.2010.05.018
Tseng, R.-L., Wu, P.-H., Wu, F.-C., and Juang, R.-S. (2011). “Half-life and half-capacity
concentration approach for the adsorption of 2,4-dichlorophenol and methyl blue
from water on activated carbons,” J. Taiwan Inst. Chem. Eng. 42(2), 312-319. DOI:
10.1016/j.jtice.2010.07.002
Tsezos, M., and Bell, J. P. (1988). “Significance of biosorption for the hazardous
organics removal efficiency of a biological reactor,” Water Res. 22(3), 391-394. DOI:
10.1016/S0043-1354(88)90320-X
Tsezos, M., and Bell, J. P. (1989). “Comparison of the biosorption and desorption of
hazardous organic pollutants by live and dead biomass,” Water Res. 23(5), 561-568.
DOI: 10.1016/0043-1354(89)90022-5
Tsezos, M., and Bell, J. P. (1991). “A mechanistic study on the fate of malathion
following interaction with microbial biomass,” Water Res. 25(9), 1039-1046. DOI:
/10.1016/0043-1354(91)90197-X
Tsezos, M., and Wang, X. (1991a). “Biosorption and biodegradation interactions - A
study on lindane,” Biotech. Forum Eur. 8(3), 120-125.
Tsezos, M., and Wang, X. (1991b). “Study on the kinetics of hazardous pollutants
adsorption and desorption by biomass: Mechanistic considerations,” J. Chem.
Technol. Biotechnol. 50(4), 507-521. DOI: 10.1002/jctb.280500408
Tyagi, R., and Srivastava, S. K. (1996). “Chemical regeneration of spent carbon
developed from the fertilizer waste slurry by column method,” Fresenius Environ.
Bull 5(5-6), 314-318.
Urano, K., Yamamoto, E., Tonegawa, M., and Fujie, K. (1991). “Adsorption of
chlorinated organic compounds on activated carbon from water,” Water Res. 25(12),
1459-1464. DOI: 10.1016/0043-1354(91)90175-P
Uranowski, L. J., Tessmer, C. H., and Vidic, R. D. (1998). “The effect of surface metal
oxides on activated carbon adsorption of phenolics,” Water Res. 32(6), 1841-1851.
DOI: 10.1016/S0043-1354(97)00479-X
van der Stelt, M. J. C., Gerhauser, H., Kiel, J. H. A., and Ptasinski, K. J. (2011).
“Biomass upgrading by torrefaction for the production of biofuels: A review,”
Biomass Bioenergy 35(9), 3748-3762.
Vázquez, I., Rodríguez-Iglesias, J., Marañón, E., Castrillón, L, and Álvarez, M. (2007).
“Removal of residual phenols from coke wastewater by adsorption,” J. Hazard.
Mater. 147, 395-400. DOI: 10.1016/j.jhazmat.2007.01.019
Vidic, R. D., Suidan, M. T., Sorial, G. A., and Brenner, R. C. (1994). “Effect of
molecular oxygen on adsorptive capacity and extraction efficiency of granulated
activated carbon for three ortho-substituted phenols,” J. Hazard Mater. 38, 373-388.
DOI: 10.1016/0304-3894(93)E0129-P
Vidic, R. D., Tessmer, C. H., and Uranowski, L. J. (1997). “Impact of surface properties
of activated carbons on oxidative coupling of phenolic compounds,” Carbon 35(9),
1349-1359. DOI: 10.1016/S0008-6223(97)00071-7
Villacanas, F., Pereira, M. F. R., Órfäo, J. J. M., and Figueiredo, J. L. (2006).
“Adsorption of simple aromatic compounds on activated carbons,” J. Colloid
Interface Sci. 293(1), 128-136. DOI: 10.1016/j.jcis.2005.06.032
REVIEW ARTICLE bioresources.com
Hubbe et al. (2014). “Petrochemicals biosorption,” BioResources 9(4), 7782-7925. 7877
Vinitnantharat, S., Baral, A., Ishibashi, Y., and Ha, S. R. (2001). “Quantitative
bioregeneration of granular activated carbon loaded with phenol and 2,4-
dichlorophenol,” Environ. Technol. 22(3), 339-344. DOI:
10.1080/09593332208618288
Vinod, V. P., and Anirudhan, T. S. (2002). “Effect of experimental variables on phenol
adsorption on activated carbon prepared from coconut husk by single-step steam
pyrolysis: Mass transfer process and equilibrium studies,” J. Sci. Ind. Res. 61, 128-
138.
Viraraghavan, T., and Alfaro, F. D. (1998). “Adsorption of phenol from wastewater by
peat, fly ash and bentonite,” J. Hazard Mater. 57, 59-70. DOI: 10.1016/S0304-
3894(97)00062-9
Vismara, E., Melone, L., Gastaldi, G., Cosentino, C., and Torri, G. (2009). “Surface
functionalization of cotton cellulose with glycidyl methacrylate and its application for
the adsorption of aromatic pollutants from wastewaters,” J. Hazard. Mater. 170(2-3),
798-808. DOI: 10.1016/j.jhazmat.2009.05.042
Visser, J. (1972). “On Hamaker constants: A comparison between Hamaker constants and
Lifshitz - van der Waals constants,” Advan. Colloid Interface Sci. 3, 331-361. DOI:
10.1016/0001-8686(72)85001-2
Vrana, B., Balaz, S., Dercova, K., and Tandlich, R. (1998). “Biosorption of hydrophobic
organic pollutants,” Chemicke Listy 92(3), 186-196.
Voudrias, E. A., Larson, R. A., and Snoeyin, V. L. (1985). “Effects of activated carbon
on the reactions of free chlorine with phenols,” Environ. Sci. Technol. 19(5), 441-449.
DOI: 10.1021/es00135a010
Wang, J.-P., Chen, Y.-Z., Feng, H.-M., Zhang, S.-J., and Yu, H.-Q. (2007a). “Removal of
2,4-dichlorophenol from aqueous solution by static-air-activated carbon fibers,” J.
Colloid Interface Sci. 313(1), 80-85. DOI: 10.1016/j.jcis.2007.04.012
Wang, J.-P., Feng, H.-M., and Yu, H.-Q. (2007b). “Analysis of adsorption characteristics
of 2,4-dichlorophenol from aqueous solutions by activated carbon fiber,” J. Hazard
Mater. 144, 200-207. DOI: 10.1016/j.jhazmat.2006.10.003
Wang, X. L., and Grady, C. P. L. (1994). “Comparison of biosorption isotherms for di-n-
butyl phthalate by live and dead bacteria,” Water Res. 28(5), 1247-1251. DOI:
10.1016/0043-1354(94)90214-3
Wang, X. L., and Grady, C. P. L. (1995). “Effects of biosorption and dissolution on the
biodegradation of di-n-butyl phthalate,” Water Environ. Res. 67(5), 863-871. DOI:
10.2175/106143095X131808
Weber, W. J., and Morris, J. C. (1963). “Kinetics of adsorption on carbon from solution,” J.
Sanity Eng. Div. Am. Soc. Civil Eng. 89, 31-59. Wei, Z. S., and Seo, Y. (2010). “Trichloroethylene (TCE) adsorption using sustainable
organic mulch,” J. Hazard. Mater. 181(1-3), 147-153. DOI: 10.1016/j.jhazmat.2010.04.109
Weise, U. (1998). “Hornification – Mechanisms and terminology,” Paperi Puu 80(2), 110-
115.
Westall, J. C., Leuenberger, C., and Schwarzenbach, R. P. (1985). “Influence of pH and
ionic strength on the aqueous-nonaqueous distribution of chlorinated phenols,”
Environ. Sci. Technol. 19(2), 193-198. DOI: 10.1021/es00132a014
Widom, B., Bhimalapuram, P., and Koga, K. (2003). “The hydrophobic effect,” Phys.
REVIEW ARTICLE bioresources.com
Hubbe et al. (2014). “Petrochemicals biosorption,” BioResources 9(4), 7782-7925. 7878
Chem. Chem. Phys. 5(15), 3085-3093. DOI: 10.1039/b304038k
Wightman, P. G., and Fein, J. B. (1999). “Experimental study of 2,4,6-trichlorophenol and
pentachlorophenol solubilities in aqueous solutions: Derivation of a speciation-based
chlorophenol solubility model,” Appl. Geochem. 14, 319-331. DOI: 10.1016/S0883-
2927(98)00054-7
Wolborska, A. (1989). “Adsorption on activated carbon of p-nitrophenol from aqueous
solution,” Water Res. 23(1), 85-91. DOI: 10.1016/0043-1354(89)90066-3
Wu, F.-C., and Tseng, R.-L. (2006). “Preparation of highly porous carbon from fir wood by
KOH etching and CO2 gasification for adsorption of dyes and phenols from water,” J.
Colloid Interf. Sci. 294(1), 21-30. DOI: 10.1016/j.jcis.2005.06.084
Wu, F.-C., Tseng, R.-L., and Juang, R.-S. (1999). “Preparation of activated carbons from
bamboo and their adsorption abilities for dyes and phenol,” J. Enviorn. Sci. Health. Pt.
A – Toxic Hazard Subst. Environ. Eng. 34(9), 1753-1775. DOI:
10.1080/10934529909376927
Wu, F. C., Tseng, R. L., and Juang, R. S. (2005). “Preparation of highly microporous
carbons from fir wood by KOH activation for adsorption of dyes and phenols from
water,” Separ. Purif. Technol. 47(1-2), 10-19. DOI: 10.1016/j.seppur.2005.03.013
Wu, F.-C., Wu, P.-H., Tseng, R.-L., and Juang, R.-S. (2011). “Preparation of novel
activated carbons from H2SO4-pretreated corncob hulls with KOH activation for quick
adsorption of dye and 4-chlorophenol,” J. Environ. Manag. 92(3), 708-713. DOI:
10.1016/j.jenvman.2010.10.003
Wu, J., and Yu, H.-Q. (2006a). “Biosorption of phenol and chlorophenols from aqueous
solutions by fungal mycelia,” Proc. Biochem. 41(1), 44-49. DOI:
10.1016/j.procbio.2005.03.065
Wu, J., and Yu, H.-Q. (2006b). “Biosorption of 2,4-dichlorophenol from aqueous solution
by Phanerochaete chrysosporium biomass: Isotherms, kinetics and thermodynamics,”
J. Hazard. Mater. B137(1), 498-508. DOI: 10.1016/j.jhazmat.2006.02.026
Wu, J., and Yu, H.-Q. (2007). “Biosorption of 2,4-dichlorophenol by immobilized white-
rot fungus Phanerochaete chrysosporium from aqueous solutions,” Bioresour. Technol.
98(2), 253-259. DOI: 10.1016/j.biortech.2006.01.018
Wu, J., and Yu, H. Q. (2008). “Biosorption of 2,4-dichlorophenol from aqueous
solutions by immobilized Phanerochaete chrysospor2T ium biomass in a fixed-bed
column,” Chem. Eng. J. 138, 128-135. DOI: 10.1016/j.cej.2007.05.051
Wu, P., Yang, G.-P., and Zhao, X.-K. (2003). “Sorption behavior of 2,4-dichlorophenol
on marine sediment,” J. Colloid Interface Sci. 265, 251-256. DOI: 10.1016/S0021-
9797(03)00515-0
Wu, W., Jiang, W., Xia, W., Yang, K., and Xing, B. (2012a). “Influence of pH and
surface oxygen-containing groups on multiwalled carbon nanotubes on the
transformation and adsorption of 1-naphthol,” J. Colloid Interface Sci. 374(1), 226-
231. DOI: 10.1016/j.jcis.2012.01.045
Wu, Y., Jin, X. J., Zhang, M. Y., and Xu, D. (2012b). “Phenol adsorption on nitrogen-
enriched activated carbon from wood fiberboard waste,” Wood and Fiber Science
44(2), 220-226.
Xia, G., and Ball, W. P. (1999). “Adsorption-partitioning uptake of nine low-polarity
organic chemicals on a natural sorbent,” Environ. Sci. Technol. 33, 262-269. DOI:
10.1021/es980581g
REVIEW ARTICLE bioresources.com
Hubbe et al. (2014). “Petrochemicals biosorption,” BioResources 9(4), 7782-7925. 7879
Xu, J., Lv, X., Li, J., Li, Y., Shen, L., Zhou, H., and Xu, X. (2012). “Simultaneous
adsorption and dechlorination of 2-4-dichlorophenol by Pd/Fe nanoparticles with
multi-walled carbon nanotube support,” J. Hazard. Mater. 225-226, 36-45. DOI:
10.1016/j.jhazmat.2012.04.061
Yaghmaeian, K., Moussavi, G., and Alahabadi, A. (2014). “Removal of amoxicillin
from contaminated water using NH4Cl-activated carbon: Continuous flow fixed-bed
adsorption and catalytic ozonation regeneration,” Chem. Eng. J. 236, 538-544. DOI:
10.1016/j.cej.2013.08.118
Yan, G., and Allen, D. G. (1994). “Biosorption of high-molecular-weight
organochlorines in pulp-mill effluent,” Water Res. 28(9), 1933-1941. DOI:
10.1016/0043-1354(94)90168-6
Yang, K., Zhu, L., and Xing, B. (2006a). “Adsorption of polycyclic aromatic
hydrocarbons by carbon nanomaterials,” Environ. Sci. Technol. 40, 1855-1861. DOI:
10.1021/es052208w
Yang, K., Wang, X. L., Zhu, L. Z., Xing, B. S. (2006b). “Competitive sorption of
pyrene, phenanthrene, and naphthalene on multiwalled carbon nanotubes,” Environ.
Sci. Technol. 40(18), 5804-5810. DOI: 10.1021/es061081n
Ye, J. S., Yin, H., Peng, H., Bai, J. Q., Xie, D. P., and Wang, L. L. (2013). “Biosorption
and biodegradation of triphenyltin by Brevibacillus brevis,” Bioresour. Technol. 129,
236-241. DOI: 10.1016/j.biortech.2012.11.076
Yeganeh, M. N., Kaghazchi, T., and Soleimani, M. (2006). “Effect of raw materials on
properties of activated carbons,” Chem. Eng. Technol. 29(10), 1247-1251. DOI:
10.1002/ceat.200500298
Young, E., and Banks, C. J. (1998). “The removal of lindane from aqueous solution
using a fungal biosorbent: The influence of pH, temperature, biomass concentration,
and culture age,” Environ. Technol. 19(6), 619-625. DOI:
10.1080/09593331908616718
Yu, J.-J., and Chou, S.-Y. (2000). “Contaminated site remedial investigation and
feasibility of removal of chlorinated volatile organic compounds from groundwater
by activated carbon fiber adsorption,” Chemosphere 41, 371-378. DOI:
10.1016/S0045-6535(99)00437-3
Yu, J., and Hu, J. Y. (2011). “Adsorption of perfluorinated compounds onto activated
carbon and activated sludge,” J. Environ. Eng. – ASCE 137(10), 945-951. DOI:
10.1061/(ASCE)EE.1943-7870.0000402
Yu, J.-W., and Neretnieks, I. (1990). “Single-component and multicomponent adsorption
equilibrium on activated carbon of methylcyclohexane, toluene, and isobutyl methyl
ketone,” Ind. Eng. Chem. Res. 29, 220-231. DOI: 10.1021/ie00098a012
Yu, Q., Zhang, R., Deng, S., Huang, J., and Yu, G. (2009). “Sorption of perfluorooctane
sulfonate and perfluorooctanoate on activated carbons and resin: Kinetic and
isothermal study,” Water Res. 43, 1150-1158. DOI: 10.1016/j.watres.2008.12.001
Yu, Z. R., Peldszus, S., and Huck, P. M. (2008). “Adsorption characteristics of selected
pharmaceuticals and an endocrine disrupting compound – Napoxen, carbamazepine
and nonylphenol – on activated carbon,” Water Res. 42(12), 2873-2882. DOI:
10.1016/j.watres.2008.02.020
REVIEW ARTICLE bioresources.com
Hubbe et al. (2014). “Petrochemicals biosorption,” BioResources 9(4), 7782-7925. 7880
Zakharov, A. G., Voronova, M. I., Surov, O. V., and Batov, D. V. (2010). “Phenol
sorption on cellulose from binary aqueous-organic mixtures,” J. Molecular Liquids
151(1), 74-80. DOI: 10.1016/j.molliq.2009.10.017
Zeinali, F., Ghoreyshi, A. A., Najafpour, G. (2012). “Removal of toluene and
dichloromethane from aqueous phase by granular activated carbon (GAC),” Chem.
Eng. Commun. 199(2), 203-220. DOI: 10.1080/00986445.2011.584354
Zhang, D. N., Ran, C. Y., Yang, Y., and Ran, Y. (2013). “Biosorption of phenanthrene by
pure algae and field-collected planktons and their fractions,” Chemosphere 93(1), 61-
68. DOI: 10.1016/j.chemosphere.2013.04.068
Zhang, G., Zhang, Q., Sun, K., Liu, X., Zheng, W., and Zhao, Y. (2011a). “Sorption of
simazine to corn straw biochars prepared at different pyrolytic temperatures,”
Environ. Pollut. 159(10), 2594-2601. DOI: 10.1016/j.envpol.2011.06.012
Zhang, L., Xu, T., Liu, X., Zhang, Y., and Jin, H. (2011b). “Adsorption behavior of
multi-walled carbon nanotubes for the removal of olaquindox from aqueous
solutions,” J. Hazard. Mater. 197, 389-396. DOI: 10.1016/j.jhazmat.2011.09.100
Zhang, Y., Wei, D. B., Huang, R. D., Yang, M., Zhang, S. J., Dou, X. M., Wang, D. S.,
and Vimonses, V. (2011c). “Binding mechanisms and QSAR modeling of aromatic
pollutant biosorption on Penicillium oxalicum biomass,” Chem. Eng. J. 166(2), 624-
630. DOI: 10.1016/j.cej.2010.11.034
Zheng, H., Wang, Z. Y., Zhao, J., Herbert, S., and Xing, B. S. (2013). “Sorption of
antibiotic sulfamethoxazole varies with biochars produced at different temperatures,”
Environmental Pollution 181, 60-67. DOI: 10.1016/j.envpol.2013.05.056
Zheng, W., Guo, M., Chow, T., Bennett, D. N., and Rajagopalan, N. (2010). “Sorption
properties of greenwaste biochar for two triazine pesticides,” J. Hazard Mater. 181,
121-126. DOI: 10.1016/j.jhazmat.2010.04.103
Zhong, M., Wang, Y., Yu, J., Tian, Y. J., and Xu, G. W. (2012). “Porous carbon from
vinegar lees for phenol adsorption,” Particuology 10(1), 35-41. DOI:
10.1016/j.partic.2011.05.006
Zolgharnein, J., Shahmoradi, A., and Ghasemi, J. (2011). “Pesticides removal using
conventional and low-cost adsorbents: A review,” Clean – Soil Air Water 39(12),
1105-1119. DOI: 10.1002/clen.201000306
ERRATUM A correction was made to Table 3 on October 14, 2018. The entry for the item headed
“Elovich” was changed. The words “increase exponentially” were changed to “decrease
exponentially”, and the statement was modified to refer to the kinetics of adsorption
rather than an equilibrium state.
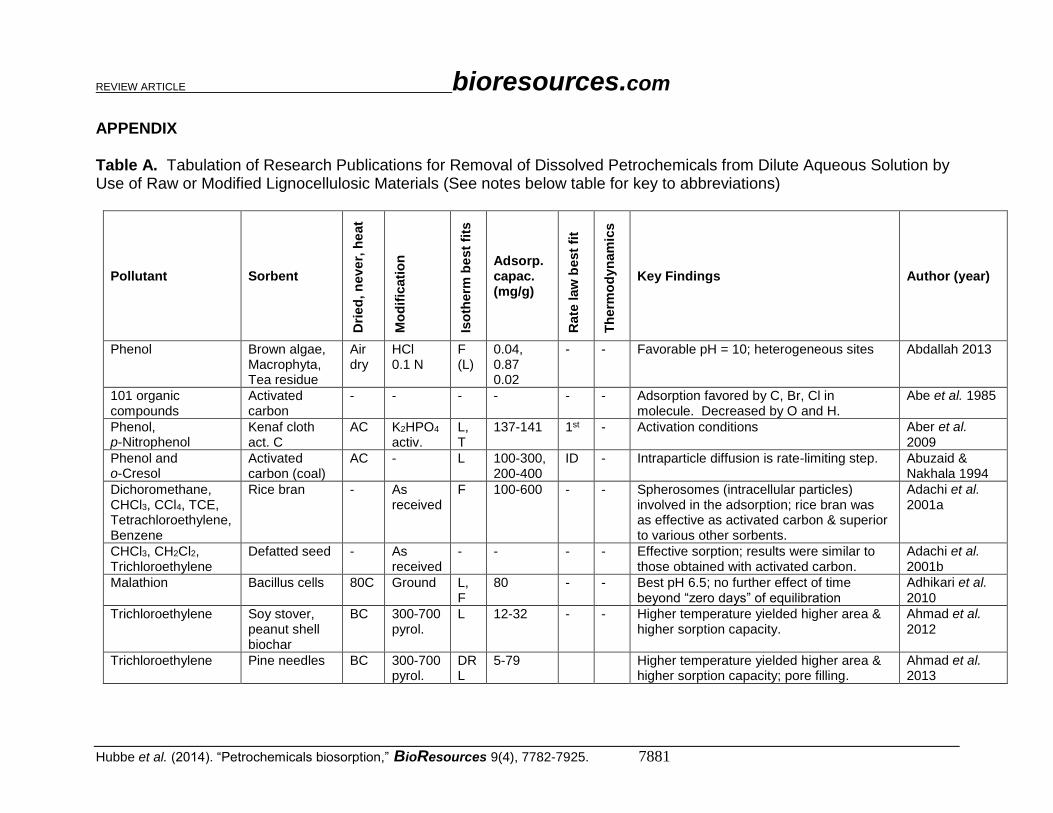
REVIEW ARTICLE bioresources.com
Hubbe et al. (2014). “Petrochemicals biosorption,” BioResources 9(4), 7782-7925. 7881
APPENDIX Table A. Tabulation of Research Publications for Removal of Dissolved Petrochemicals from Dilute Aqueous Solution by Use of Raw or Modified Lignocellulosic Materials (See notes below table for key to abbreviations)
Pollutant Sorbent
Dri
ed
, n
eve
r, h
eat
Mo
dif
icati
on
Iso
therm
be
st
fits
Adsorp. capac. (mg/g)
Rate
law
best
fit
Th
erm
od
yn
am
ics
Key Findings Author (year)
Phenol Brown algae, Macrophyta, Tea residue
Air dry
HCl 0.1 N
F (L)
0.04, 0.87 0.02
- - Favorable pH = 10; heterogeneous sites Abdallah 2013
101 organic compounds
Activated carbon
- - - - - - Adsorption favored by C, Br, Cl in molecule. Decreased by O and H.
Abe et al. 1985
Phenol, p-Nitrophenol
Kenaf cloth act. C
AC K2HPO4 activ.
L, T
137-141 1st - Activation conditions Aber et al. 2009
Phenol and o-Cresol
Activated carbon (coal)
AC - L 100-300, 200-400
ID - Intraparticle diffusion is rate-limiting step. Abuzaid & Nakhala 1994
Dichoromethane, CHCl3, CCl4, TCE, Tetrachloroethylene, Benzene
Rice bran - As received
F 100-600 - - Spherosomes (intracellular particles) involved in the adsorption; rice bran was as effective as activated carbon & superior to various other sorbents.
Adachi et al. 2001a
CHCl3, CH2Cl2, Trichloroethylene
Defatted seed - As received
- - - - Effective sorption; results were similar to those obtained with activated carbon.
Adachi et al. 2001b
Malathion Bacillus cells 80C Ground L, F
80 - - Best pH 6.5; no further effect of time beyond “zero days” of equilibration
Adhikari et al. 2010
Trichloroethylene Soy stover, peanut shell biochar
BC 300-700 pyrol.
L 12-32 - - Higher temperature yielded higher area & higher sorption capacity.
Ahmad et al. 2012
Trichloroethylene Pine needles BC 300-700 pyrol.
DR L
5-79 Higher temperature yielded higher area & higher sorption capacity; pore filling.
Ahmad et al. 2013
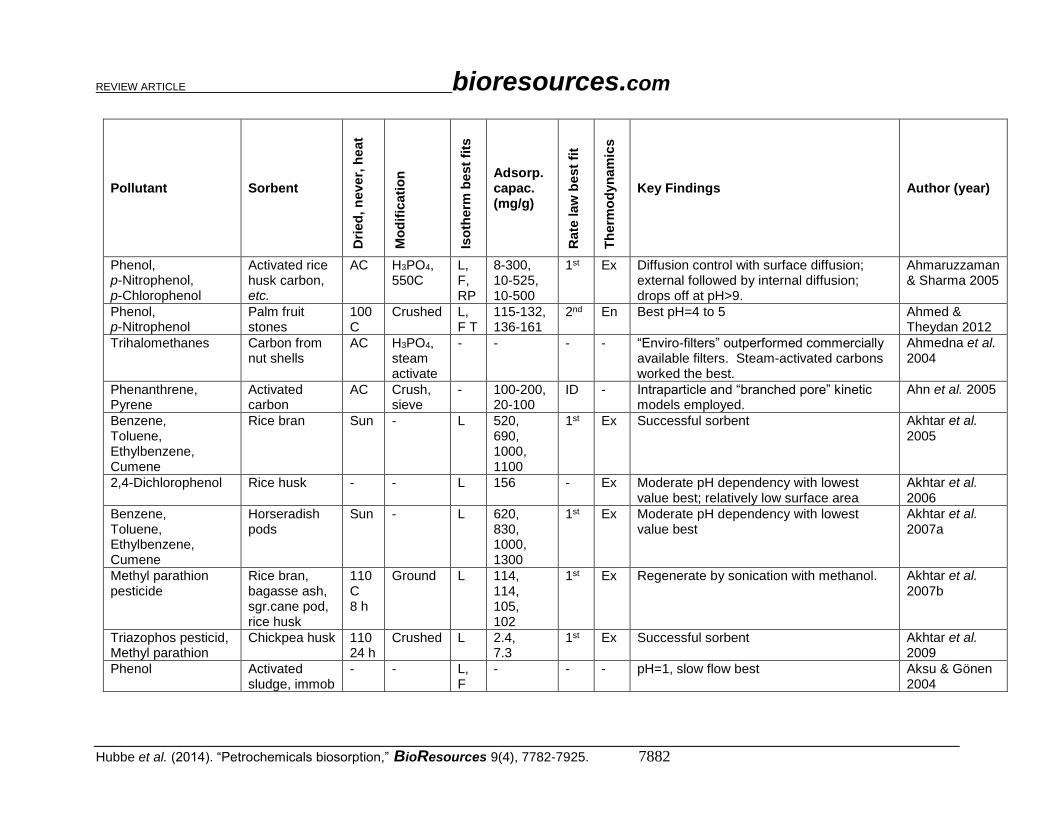
REVIEW ARTICLE bioresources.com
Hubbe et al. (2014). “Petrochemicals biosorption,” BioResources 9(4), 7782-7925. 7882
Pollutant Sorbent
Dri
ed
, n
eve
r, h
eat
Mo
dif
icati
on
Iso
therm
be
st
fits
Adsorp. capac. (mg/g)
Rate
law
best
fit
Th
erm
od
yn
am
ics
Key Findings Author (year)
Phenol, p-Nitrophenol, p-Chlorophenol
Activated rice husk carbon, etc.
AC H3PO4, 550C
L, F, RP
8-300, 10-525, 10-500
1st Ex Diffusion control with surface diffusion; external followed by internal diffusion; drops off at pH>9.
Ahmaruzzaman & Sharma 2005
Phenol, p-Nitrophenol
Palm fruit stones
100C
Crushed L, F T
115-132, 136-161
2nd En Best pH=4 to 5 Ahmed & Theydan 2012
Trihalomethanes Carbon from nut shells
AC H3PO4, steam activate
- - - - “Enviro-filters” outperformed commercially available filters. Steam-activated carbons worked the best.
Ahmedna et al. 2004
Phenanthrene, Pyrene
Activated carbon
AC Crush, sieve
- 100-200, 20-100
ID - Intraparticle and “branched pore” kinetic models employed.
Ahn et al. 2005
Benzene, Toluene, Ethylbenzene, Cumene
Rice bran Sun - L 520, 690, 1000, 1100
1st Ex Successful sorbent Akhtar et al. 2005
2,4-Dichlorophenol Rice husk - - L 156 - Ex Moderate pH dependency with lowest value best; relatively low surface area
Akhtar et al. 2006
Benzene, Toluene, Ethylbenzene, Cumene
Horseradish pods
Sun - L 620, 830, 1000, 1300
1st Ex Moderate pH dependency with lowest value best
Akhtar et al. 2007a
Methyl parathion pesticide
Rice bran, bagasse ash, sgr.cane pod, rice husk
110C 8 h
Ground L 114, 114, 105, 102
1st Ex Regenerate by sonication with methanol. Akhtar et al. 2007b
Triazophos pesticid, Methyl parathion
Chickpea husk 110 24 h
Crushed L 2.4, 7.3
1st Ex Successful sorbent Akhtar et al. 2009
Phenol Activated sludge, immob
- - L, F
- - - pH=1, slow flow best Aksu & Gönen 2004
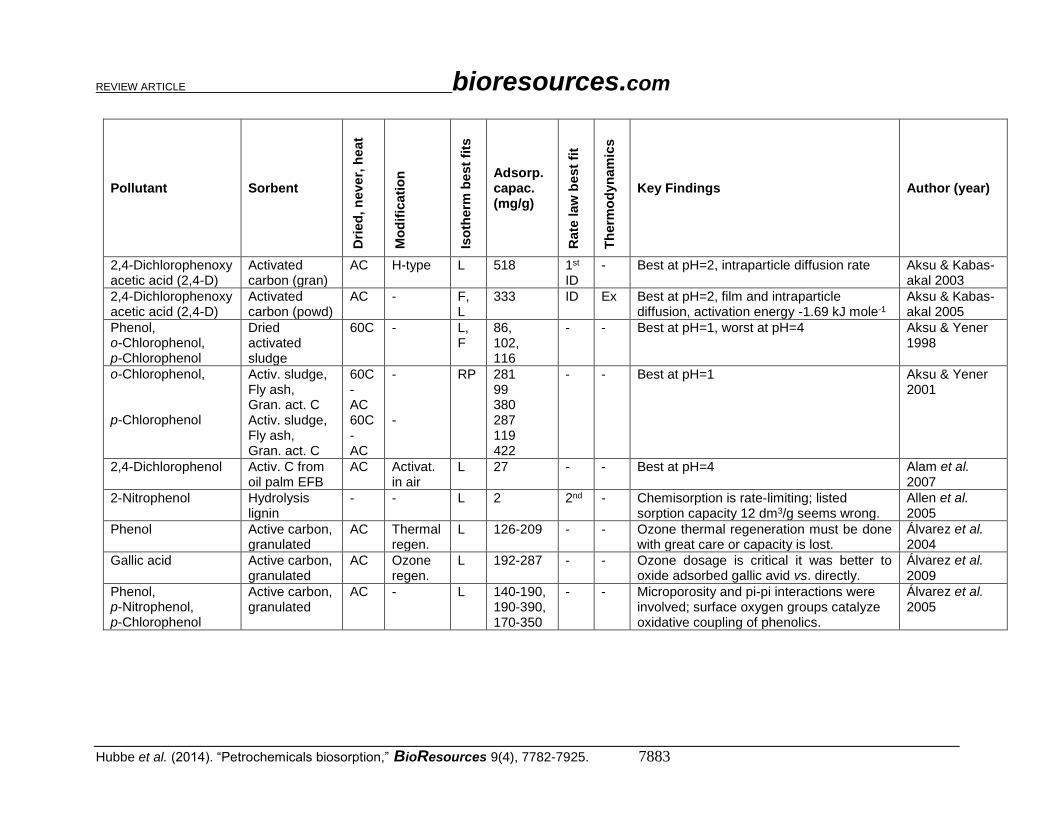
REVIEW ARTICLE bioresources.com
Hubbe et al. (2014). “Petrochemicals biosorption,” BioResources 9(4), 7782-7925. 7883
Pollutant Sorbent
Dri
ed
, n
eve
r, h
eat
Mo
dif
icati
on
Iso
therm
be
st
fits
Adsorp. capac. (mg/g)
Rate
law
best
fit
Th
erm
od
yn
am
ics
Key Findings Author (year)
2,4-Dichlorophenoxy acetic acid (2,4-D)
Activated carbon (gran)
AC H-type L 518 1st ID
- Best at pH=2, intraparticle diffusion rate Aksu & Kabas-akal 2003
2,4-Dichlorophenoxy acetic acid (2,4-D)
Activated carbon (powd)
AC - F, L
333 ID Ex Best at pH=2, film and intraparticle diffusion, activation energy -1.69 kJ mole-1
Aksu & Kabas-akal 2005
Phenol, o-Chlorophenol, p-Chlorophenol
Dried activated sludge
60C - L, F
86, 102, 116
- - Best at pH=1, worst at pH=4 Aksu & Yener 1998
o-Chlorophenol, p-Chlorophenol
Activ. sludge, Fly ash, Gran. act. C Activ. sludge, Fly ash, Gran. act. C
60C - AC 60C - AC
- -
RP 281 99 380 287 119 422
- - Best at pH=1 Aksu & Yener 2001
2,4-Dichlorophenol Activ. C from oil palm EFB
AC Activat. in air
L 27 - - Best at pH=4 Alam et al. 2007
2-Nitrophenol Hydrolysis lignin
- - L 2 2nd - Chemisorption is rate-limiting; listed sorption capacity 12 dm3/g seems wrong.
Allen et al. 2005
Phenol Active carbon, granulated
AC Thermal regen.
L 126-209 - - Ozone thermal regeneration must be done with great care or capacity is lost.
Álvarez et al. 2004
Gallic acid Active carbon, granulated
AC Ozone regen.
L 192-287 - - Ozone dosage is critical it was better to oxide adsorbed gallic avid vs. directly.
Álvarez et al. 2009
Phenol, p-Nitrophenol, p-Chlorophenol
Active carbon, granulated
AC - L 140-190, 190-390, 170-350
- - Microporosity and pi-pi interactions were involved; surface oxygen groups catalyze oxidative coupling of phenolics.
Álvarez et al. 2005

REVIEW ARTICLE bioresources.com
Hubbe et al. (2014). “Petrochemicals biosorption,” BioResources 9(4), 7782-7925. 7884
Pollutant Sorbent
Dri
ed
, n
eve
r, h
eat
Mo
dif
icati
on
Iso
therm
be
st
fits
Adsorp. capac. (mg/g)
Rate
law
best
fit
Th
erm
od
yn
am
ics
Key Findings Author (year)
Pyrene, PCB-101
Active C from: coconut shell, anthracite. coconut shell, anthracite.
AC AC AC AC
- - - -
F 9 11 12 13
- - The narrower pores of the bio-based carbon were more easily clogged.
Amstaetter et al. 2012
Phenol, p-chlorophenol, p-nitrophenol
Activ.carbon from coir pith
AC H3PO4 F, L
43, 63, 72
UT - Best pH=6; regeneration with 0.1 N NaOH Anirudhan et al. 2009
Phenol, Chlorophenol, Trichlorophenol, Pentachlorophenol
Sandy aquifer media (non-viable bacteria cells)
- - F 2-3, 1-2, 5-15, 0.2-0.4
- - Lower pH favorable; adsorption was at most weakly correlated to hydrophobicity.
Antizar-L. & Galil 2004
Phenol Green macro algae
Air Crushed H2SO4
L 20 2nd - Best pH = 6 Aravindhan et al. 2009
Phenol Active carbon from seaweed
AC ZnCl2 - - - - Best pH = 3 Aravindhan et al. 2011
Phenol Dried activat. sludge
60C 24 h
- F, L
43 2nd En Best pH = 8, weak function Arslan & Dursun 2008
Naphthalene Aganate bead, immob. cells
- - Ca2+
L, F, DR
18, 12
2nd - Best pH > 3; Adsorbent was adversely affected by heavy metals.
Ashour et al. 2008
Polycyclic aromatic hydrocarbons
Active carbons AC - - - - - Reduction in hydrocarbons was achieved; combined sorption & biodegradation.
Augulyte et al. 2008
Polycyclic aromatic hydrocarbons, etc.
Biologically active carbons
- - - - - - Semipermeable membrane was used for the separation; enzymatic action is key.
Augulyte et al. 2009
Petroleum components
Two active carbons
AC - F 400-2000 - - Two contacting basins in series are common.
Ayotamuno et al. 2006
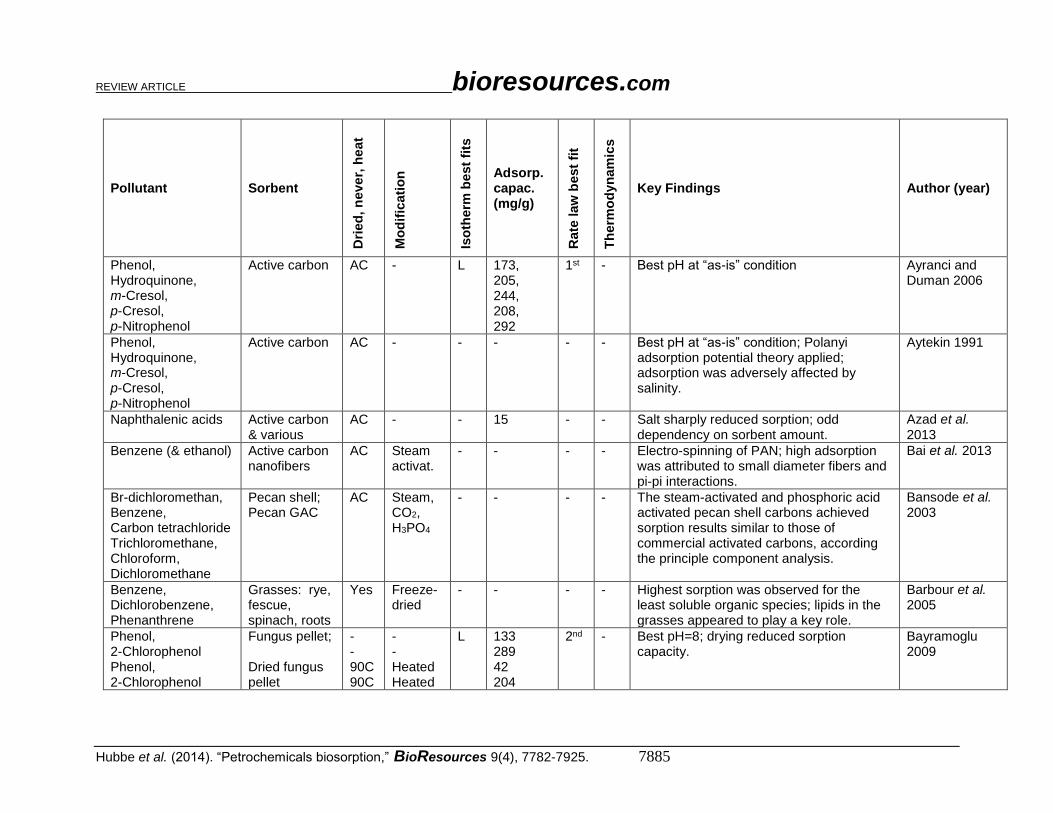
REVIEW ARTICLE bioresources.com
Hubbe et al. (2014). “Petrochemicals biosorption,” BioResources 9(4), 7782-7925. 7885
Pollutant Sorbent
Dri
ed
, n
eve
r, h
eat
Mo
dif
icati
on
Iso
therm
be
st
fits
Adsorp. capac. (mg/g)
Rate
law
best
fit
Th
erm
od
yn
am
ics
Key Findings Author (year)
Phenol, Hydroquinone, m-Cresol, p-Cresol, p-Nitrophenol
Active carbon AC - L 173, 205, 244, 208, 292
1st - Best pH at “as-is” condition Ayranci and Duman 2006
Phenol, Hydroquinone, m-Cresol, p-Cresol, p-Nitrophenol
Active carbon AC - - - - - Best pH at “as-is” condition; Polanyi adsorption potential theory applied; adsorption was adversely affected by salinity.
Aytekin 1991
Naphthalenic acids Active carbon & various
AC - - 15 - - Salt sharply reduced sorption; odd dependency on sorbent amount.
Azad et al. 2013
Benzene (& ethanol) Active carbon nanofibers
AC Steam activat.
- - - - Electro-spinning of PAN; high adsorption was attributed to small diameter fibers and pi-pi interactions.
Bai et al. 2013
Br-dichloromethan, Benzene, Carbon tetrachloride Trichloromethane, Chloroform, Dichloromethane
Pecan shell; Pecan GAC
AC Steam, CO2, H3PO4
- - - - The steam-activated and phosphoric acid activated pecan shell carbons achieved sorption results similar to those of commercial activated carbons, according the principle component analysis.
Bansode et al. 2003
Benzene, Dichlorobenzene, Phenanthrene
Grasses: rye, fescue, spinach, roots
Yes Freeze-dried
- - - - Highest sorption was observed for the least soluble organic species; lipids in the grasses appeared to play a key role.
Barbour et al. 2005
Phenol, 2-Chlorophenol Phenol, 2-Chlorophenol
Fungus pellet; Dried fungus pellet
- - 90C 90C
- - Heated Heated
L 133 289 42 204
2nd - Best pH=8; drying reduced sorption capacity.
Bayramoglu 2009
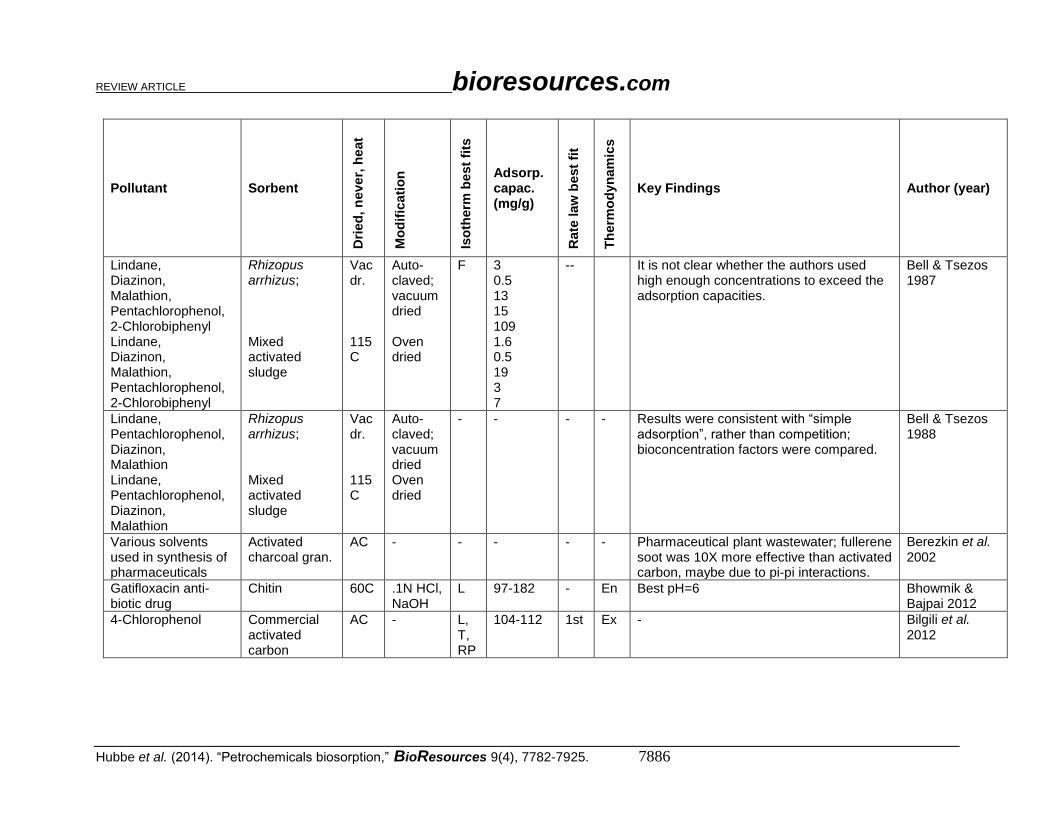
REVIEW ARTICLE bioresources.com
Hubbe et al. (2014). “Petrochemicals biosorption,” BioResources 9(4), 7782-7925. 7886
Pollutant Sorbent
Dri
ed
, n
eve
r, h
eat
Mo
dif
icati
on
Iso
therm
be
st
fits
Adsorp. capac. (mg/g)
Rate
law
best
fit
Th
erm
od
yn
am
ics
Key Findings Author (year)
Lindane, Diazinon, Malathion, Pentachlorophenol, 2-Chlorobiphenyl Lindane, Diazinon, Malathion, Pentachlorophenol, 2-Chlorobiphenyl
Rhizopus arrhizus; Mixed activated sludge
Vac dr. 115 C
Auto-claved; vacuum dried Oven dried
F 3 0.5 13 15 109 1.6 0.5 19 3 7
-- It is not clear whether the authors used high enough concentrations to exceed the adsorption capacities.
Bell & Tsezos 1987
Lindane, Pentachlorophenol, Diazinon, Malathion Lindane, Pentachlorophenol, Diazinon, Malathion
Rhizopus arrhizus; Mixed activated sludge
Vac dr. 115 C
Auto-claved; vacuum dried Oven dried
- - - - Results were consistent with “simple adsorption”, rather than competition; bioconcentration factors were compared.
Bell & Tsezos 1988
Various solvents used in synthesis of pharmaceuticals
Activated charcoal gran.
AC - - - - - Pharmaceutical plant wastewater; fullerene soot was 10X more effective than activated carbon, maybe due to pi-pi interactions.
Berezkin et al. 2002
Gatifloxacin anti-biotic drug
Chitin 60C .1N HCl, NaOH
L 97-182 - En Best pH=6 Bhowmik & Bajpai 2012
4-Chlorophenol Commercial activated carbon
AC - L, T, RP
104-112 1st Ex - Bilgili et al. 2012
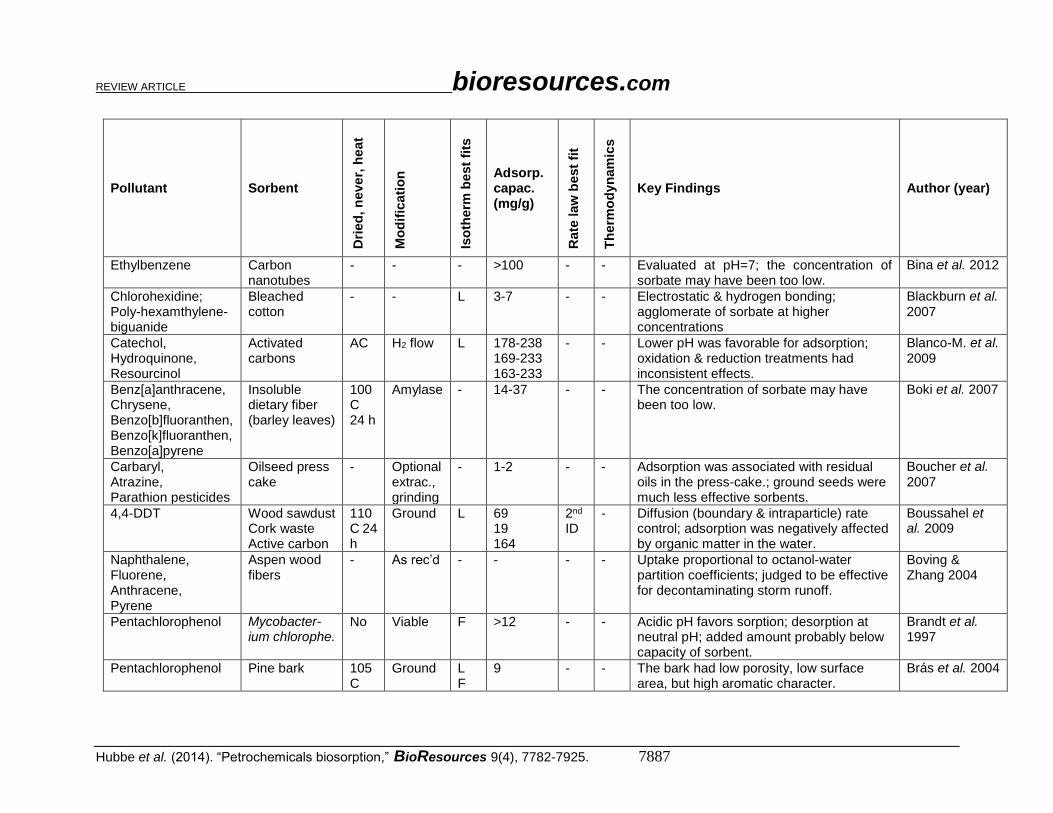
REVIEW ARTICLE bioresources.com
Hubbe et al. (2014). “Petrochemicals biosorption,” BioResources 9(4), 7782-7925. 7887
Pollutant Sorbent
Dri
ed
, n
eve
r, h
eat
Mo
dif
icati
on
Iso
therm
be
st
fits
Adsorp. capac. (mg/g)
Rate
law
best
fit
Th
erm
od
yn
am
ics
Key Findings Author (year)
Ethylbenzene Carbon nanotubes
- - - >100 - - Evaluated at pH=7; the concentration of sorbate may have been too low.
Bina et al. 2012
Chlorohexidine; Poly-hexamthylene-biguanide
Bleached cotton
- - L 3-7 - - Electrostatic & hydrogen bonding; agglomerate of sorbate at higher concentrations
Blackburn et al. 2007
Catechol, Hydroquinone, Resourcinol
Activated carbons
AC H2 flow L 178-238 169-233 163-233
- - Lower pH was favorable for adsorption; oxidation & reduction treatments had inconsistent effects.
Blanco-M. et al. 2009
Benz[a]anthracene, Chrysene, Benzo[b]fluoranthen, Benzo[k]fluoranthen, Benzo[a]pyrene
Insoluble dietary fiber (barley leaves)
100 C 24 h
Amylase - 14-37 - - The concentration of sorbate may have been too low.
Boki et al. 2007
Carbaryl, Atrazine, Parathion pesticides
Oilseed press cake
- Optional extrac., grinding
- 1-2 - - Adsorption was associated with residual oils in the press-cake.; ground seeds were much less effective sorbents.
Boucher et al. 2007
4,4-DDT Wood sawdust Cork waste Active carbon
110 C 24 h
Ground L 69 19 164
2nd ID
- Diffusion (boundary & intraparticle) rate control; adsorption was negatively affected by organic matter in the water.
Boussahel et al. 2009
Naphthalene, Fluorene, Anthracene, Pyrene
Aspen wood fibers
- As rec’d - - - - Uptake proportional to octanol-water partition coefficients; judged to be effective for decontaminating storm runoff.
Boving & Zhang 2004
Pentachlorophenol Mycobacter-ium chlorophe.
No Viable F >12 - - Acidic pH favors sorption; desorption at neutral pH; added amount probably below capacity of sorbent.
Brandt et al. 1997
Pentachlorophenol Pine bark 105 C
Ground L F
9 - - The bark had low porosity, low surface area, but high aromatic character.
Brás et al. 2004
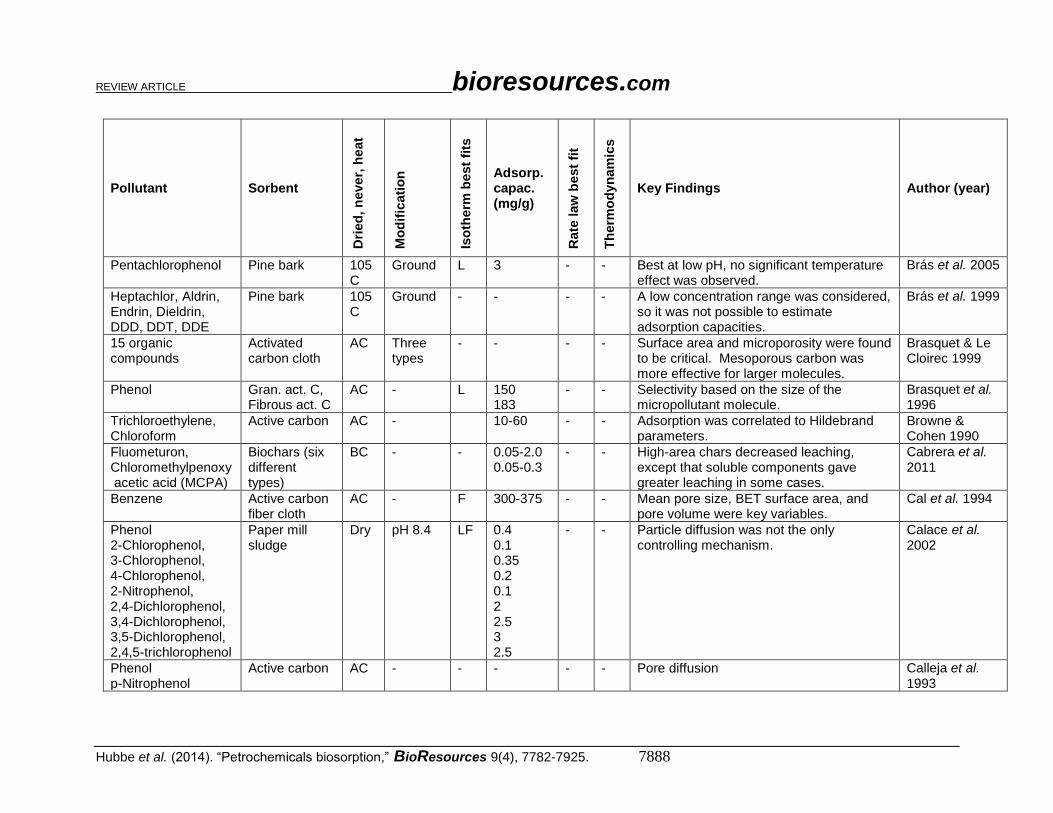
REVIEW ARTICLE bioresources.com
Hubbe et al. (2014). “Petrochemicals biosorption,” BioResources 9(4), 7782-7925. 7888
Pollutant Sorbent
Dri
ed
, n
eve
r, h
eat
Mo
dif
icati
on
Iso
therm
be
st
fits
Adsorp. capac. (mg/g)
Rate
law
best
fit
Th
erm
od
yn
am
ics
Key Findings Author (year)
Pentachlorophenol Pine bark 105 C
Ground L 3 - - Best at low pH, no significant temperature effect was observed.
Brás et al. 2005
Heptachlor, Aldrin, Endrin, Dieldrin, DDD, DDT, DDE
Pine bark 105 C
Ground - - - - A low concentration range was considered, so it was not possible to estimate adsorption capacities.
Brás et al. 1999
15 organic compounds
Activated carbon cloth
AC Three types
- - - - Surface area and microporosity were found to be critical. Mesoporous carbon was more effective for larger molecules.
Brasquet & Le Cloirec 1999
Phenol Gran. act. C, Fibrous act. C
AC - L 150 183
- - Selectivity based on the size of the micropollutant molecule.
Brasquet et al. 1996
Trichloroethylene, Chloroform
Active carbon AC - 10-60 - - Adsorption was correlated to Hildebrand parameters.
Browne & Cohen 1990
Fluometuron, Chloromethylpenoxy acetic acid (MCPA)
Biochars (six different types)
BC - - 0.05-2.0 0.05-0.3
- - High-area chars decreased leaching, except that soluble components gave greater leaching in some cases.
Cabrera et al. 2011
Benzene Active carbon fiber cloth
AC - F 300-375 - - Mean pore size, BET surface area, and pore volume were key variables.
Cal et al. 1994
Phenol 2-Chlorophenol, 3-Chlorophenol, 4-Chlorophenol, 2-Nitrophenol, 2,4-Dichlorophenol, 3,4-Dichlorophenol, 3,5-Dichlorophenol, 2,4,5-trichlorophenol
Paper mill sludge
Dry pH 8.4 LF 0.4 0.1 0.35 0.2 0.1 2 2.5 3 2.5
- - Particle diffusion was not the only controlling mechanism.
Calace et al. 2002
Phenol p-Nitrophenol
Active carbon AC - - - - - Pore diffusion Calleja et al. 1993
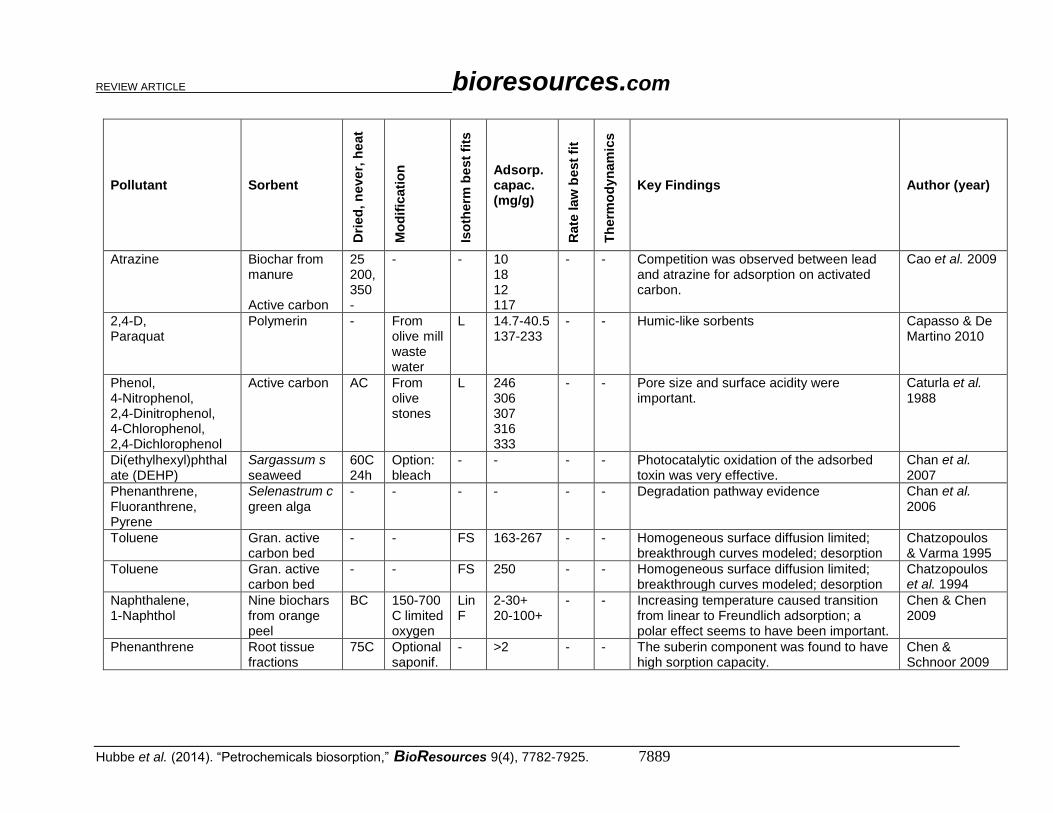
REVIEW ARTICLE bioresources.com
Hubbe et al. (2014). “Petrochemicals biosorption,” BioResources 9(4), 7782-7925. 7889
Pollutant Sorbent
Dri
ed
, n
eve
r, h
eat
Mo
dif
icati
on
Iso
therm
be
st
fits
Adsorp. capac. (mg/g)
Rate
law
best
fit
Th
erm
od
yn
am
ics
Key Findings Author (year)
Atrazine Biochar from manure Active carbon
25 200, 350 -
- - 10 18 12 117
- - Competition was observed between lead and atrazine for adsorption on activated carbon.
Cao et al. 2009
2,4-D, Paraquat
Polymerin - From olive mill waste water
L 14.7-40.5 137-233
- - Humic-like sorbents Capasso & De Martino 2010
Phenol, 4-Nitrophenol, 2,4-Dinitrophenol, 4-Chlorophenol, 2,4-Dichlorophenol
Active carbon AC From olive stones
L 246 306 307 316 333
- - Pore size and surface acidity were important.
Caturla et al. 1988
Di(ethylhexyl)phthalate (DEHP)
Sargassum s seaweed
60C 24h
Option: bleach
- - - - Photocatalytic oxidation of the adsorbed toxin was very effective.
Chan et al. 2007
Phenanthrene, Fluoranthrene, Pyrene
Selenastrum c green alga
- - - - - - Degradation pathway evidence Chan et al. 2006
Toluene Gran. active carbon bed
- - FS 163-267 - - Homogeneous surface diffusion limited; breakthrough curves modeled; desorption
Chatzopoulos & Varma 1995
Toluene Gran. active carbon bed
- - FS 250 - - Homogeneous surface diffusion limited; breakthrough curves modeled; desorption
Chatzopoulos et al. 1994
Naphthalene, 1-Naphthol
Nine biochars from orange peel
BC 150-700 C limited oxygen
Lin F
2-30+ 20-100+
- - Increasing temperature caused transition from linear to Freundlich adsorption; a polar effect seems to have been important.
Chen & Chen 2009
Phenanthrene Root tissue fractions
75C Optional saponif.
- >2 - - The suberin component was found to have high sorption capacity.
Chen & Schnoor 2009
REVIEW ARTICLE bioresources.com
Hubbe et al. (2014). “Petrochemicals biosorption,” BioResources 9(4), 7782-7925. 7890
Pollutant Sorbent
Dri
ed
, n
eve
r, h
eat
Mo
dif
icati
on
Iso
therm
be
st
fits
Adsorp. capac. (mg/g)
Rate
law
best
fit
Th
erm
od
yn
am
ics
Key Findings Author (year)
Naphthalene, Nitrobenzene, m-dinitrobenzene
Biochar from pine needles
100-700C
1M HCl - 100-450 - - Higher heating yielded higher sorption. Chen et al. 2008
Phenanthrene, Pyrene
Phanero-chaete c.
- Viable mycelia
F - - - Combined biosorption & biodegradation shown.
Chen & Ding 2012
Naphthanlene, Phenanthrene, Phenol, 1-Napthol
Plant cuticles (green pepper fractions)
FD Boil, freeze-dry, grind; Dewax
F 1-20, 1-10, 100-400, 10-200
- - Polarity of the solute and accessibility to surface sites were key factors; Low affinity behavior apparent.
Chen et al. 2005
1-Napthol Tomato cuticle sheet fractions
Dry Oxalic, dewax
F 40-160 - - Cutin makes a key contribution to sorption; hydrophobic and H-bonding interactions.
Chen & Li 2007
Naphthanlene, Acenaphthene, Fluorene, Phenanthrene, Pyrene
White rot fungi -, 60C 24h
Live, killed
F - - - Biosorption might restrict biodegradation; low affinity behavior.
Chen et al. 2010
Naphthalene, Acenaphthene, Fluorene Phenanathrene Pyrene
Wood chips, ryegrass roots, orange peels, bamboo leaves, pine needles
Air 25C
Ground F 0 -1.5 - - Low affinity; removal of polar components by acid hydrolysis increased uptake.
Chen et al. 2011
Phenol Mesoporous active carbon fr. pokeweed
AC 450, then 900C
L 172 - - Potassium in the pokeweed helps activate the carbon.
Chen et al. 2012a
REVIEW ARTICLE bioresources.com
Hubbe et al. (2014). “Petrochemicals biosorption,” BioResources 9(4), 7782-7925. 7891
Pollutant Sorbent
Dri
ed
, n
eve
r, h
eat
Mo
dif
icati
on
Iso
therm
be
st
fits
Adsorp. capac. (mg/g)
Rate
law
best
fit
Th
erm
od
yn
am
ics
Key Findings Author (year)
Naphthalene Biochar series BC 150-700 F 0.02-177 - - Diffusivity was the key factor; low affinity behavior evident; intermediate temp the micropores were hard to access; capacity increased with carbonation temperature.
Chen et al. 2012b
Naphthalene, 1,2-Dichlorobenzene
C-60 (Bucky-balls)
- - - 5-50 - En Low affinity behavior; best results when C60 was well dispersed in water.
Cheng et al. 2005
Phenol Loofa vegetal cords
105 NaOH, bleach
L 5 - En Bleaching with peroxide increased uptake greatly.
Cherifi et al. 2009
p-Nitrophenol Active carbon AC - F RP
4 - Ex Breakthrough curves Chern & Chien 2002
Toluene vapor Peats (2), Compost
65C 48h
- - 0.5-14 1-4
- - Pore filling mechanism Chiu et al. 2003
1,2,3,4-Tetrachlor. Dibenzofuran, PCDD/Fs, PCBs Chlorobenzenes, Chloronaphthalenes
Bacillus pumil. exudates
- Boiled to release chems.
- - - - Uptake amounts are expressed based on volume of sorbent, not mass; hard to compare; proteins sorbed much more than the carbohydrates or the insulin.
Choi et al. 2003
1-Methlcyclpropene Fruit & veg. tissues
No, Yes
- 50C
- - - - External tissues had greater sorption; drying reduced sorption; pectins & lignin were sinks for sorption; rates compared.
Choi & Huber. 2009
Benzene Active carbon bed
AC - - 650 - Ex Simulation based on kinetic model. Chuang et al. 2003a
Benzene vapor Active carbon bed
AC - L 200-450 - Ex Simulation based on kinetic model. Chuang et al. 2003a
Perfluorooctane sulfonate
Granulated active carbon
AC - F 455 - - Regeneration highly successful with methanol solutions of NaOH, NaCl.
Chularueang-aksorn 2013
REVIEW ARTICLE bioresources.com
Hubbe et al. (2014). “Petrochemicals biosorption,” BioResources 9(4), 7782-7925. 7892
Pollutant Sorbent
Dri
ed
, n
eve
r, h
eat
Mo
dif
icati
on
Iso
therm
be
st
fits
Adsorp. capac. (mg/g)
Rate
law
best
fit
Th
erm
od
yn
am
ics
Key Findings Author (year)
Phenanthrene Sargassum hemiphyllum
50C 16h
- - 0.4-0.5 2nd En Shaking sped up sorption. Chung et al. 2007
Benzene Toluene Ethylbenzene m,p-Xylenes o-Xylene
Angico sawdust & peat
Air 25C
None L 0.002 to 0.011 reported for whole set
- - Peat performed better than the sawdust. Costa et al. 2012
Phenol, Nitrobenzene
Carbon BC Acidity content
- 10-100 50-200
- - Oxygen content of carbon suppressed adsorption.
Coughlin & Ezra 1968
Phenol, Nitrobenzene, Na benzenesolufon.
Carbon BC - - 10-100 50-200 -
- - Dilute phenol adsorption was reduced by oxygenated sites.
Coughlin et al. 1968
Naphthalene, Acenaphthene, Anthrene Pyrene
Bagasse, Green cocon., Chitosan, Chitin
Dry - F 0.1-0.8 - - Lignin seemed to be mainly responsible for adsorption.
Crisafully et al. 2008
p-Nitrophenol Active carbon fr. cedar wood
AC H2SO4 & CO2
L 300-630 - - Surface sulfur appeared to inhibit uptake of p-nitrophenol; previous dehydration favored activation & adsorption.
CuerdaCorrea et al. 2006
Chloroform, DiClBrmethane, Bromoform
Humin from peat bog
Air 25C
Ground - 18-21 2nd - Humin was found to be effective. Cunha et al. 2010
Phenol, Cresols, Nitrophenols, Chlorophenols
Active carbon AC H3PO4 L 232-339 - - Uptake was inversely proportional to solubility and pKa; uptake also correlated to molecular size; they did not measure pH or temperature.
Daifullah & Girgis 1998
REVIEW ARTICLE bioresources.com
Hubbe et al. (2014). “Petrochemicals biosorption,” BioResources 9(4), 7782-7925. 7893
Pollutant Sorbent
Dri
ed
, n
eve
r, h
eat
Mo
dif
icati
on
Iso
therm
be
st
fits
Adsorp. capac. (mg/g)
Rate
law
best
fit
Th
erm
od
yn
am
ics
Key Findings Author (year)
BTEX: Benzene, Toluene, Ethylbenzene, Xylene
Active carbon fr. date pits, cotton stalk, peach stones, almond shell, olive stone
AC H3PO4 post-tr., 773K
- 1-9 4-9 5-9 5-10
- - B < T < E < X uptake consistent with decreasing solubility and increasing molecular weight; air oxidation gave higher uptake per unit area.
Daifullah & Girgis 2003
Quinalphos, Lindane pesticides
Bio-activated carbon
- Danube River flora
- - - - Adsorption & microbiological degradation happen simultaneously; the system worked better for the quinalphos; flow-through.
Dalmacija et al. 1992
Phenol and its successively coupled multimers
Active carbon AC - L 20-90 - - Adsorption capacity increased with the size of the molecule.
Dargaville et al. 1996
p-Cresol Biochar from pine
BC K2CO3
300-400 L 5-7 - Ex Adsorption inhibited by acidic groups. Das et al. 2013
2,4,6-Trichlorophenol
Bacellus subtillis
No Live culture
- - - - Best pH<5; stability constant fits Daughney Fein 1998
Phenol, 2-Chlorophenol, 2,6-Dichlorophenol
Daucus carota Ipomoea bat. Solanum avi.
No Cultured - - - - Roots were effective in removing phenols. De Araugjo et al. 2006
2,4-Dichlorophenol & other contaminants
Horseradish, Potato, White radish
No - - H2O2
- - - - Showed effective biodegradation with peroxidases; in the absence of H2O2 the removal was much less effective.
Dec & Bolag 1994
2,4-Dichlorophenol Posidonia oceanica L.
60C 48h
- L, F
5-13 2nd - Seagrass; best pH 3 to 7; Demirak et al. 2011
Phenol, o-Chlorophenol, p-Chlorophenol, 2,4,6-Trichlorophen.
Phanerochaet chrysosporium
30C 24h
Ground (L) 113 193 225 424
- - Methanol was used for regeneration of the fungus.
Denizli et al. 2004
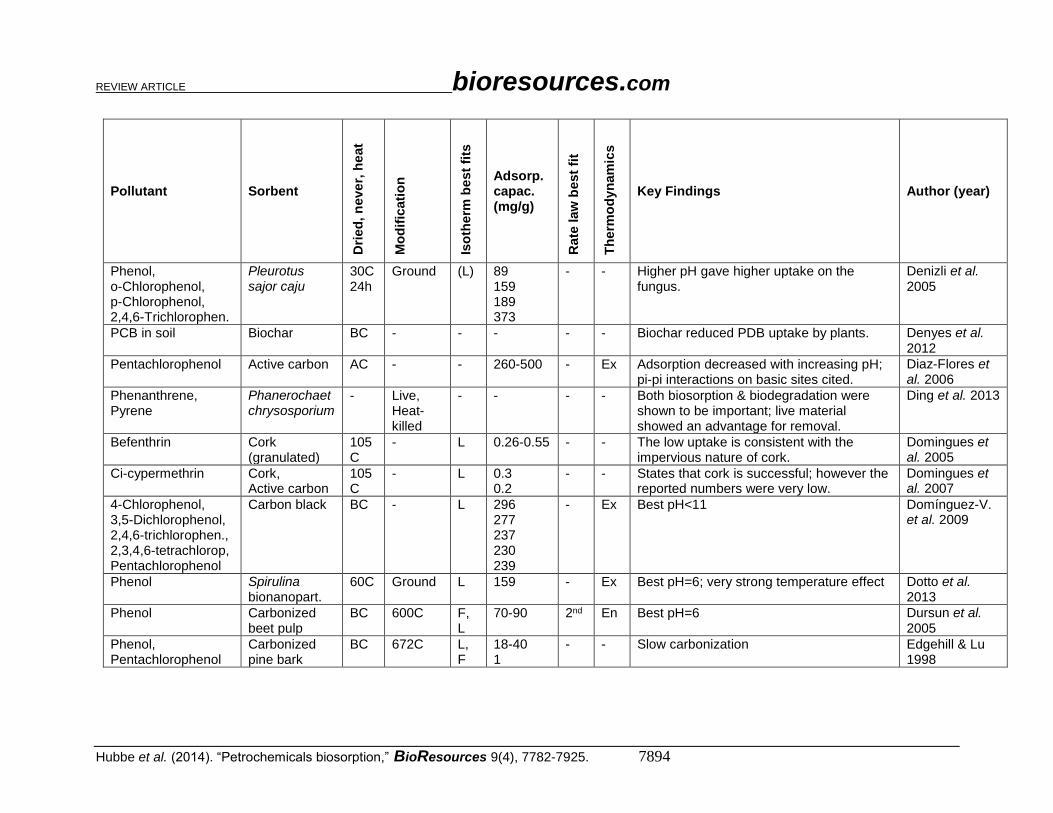
REVIEW ARTICLE bioresources.com
Hubbe et al. (2014). “Petrochemicals biosorption,” BioResources 9(4), 7782-7925. 7894
Pollutant Sorbent
Dri
ed
, n
eve
r, h
eat
Mo
dif
icati
on
Iso
therm
be
st
fits
Adsorp. capac. (mg/g)
Rate
law
best
fit
Th
erm
od
yn
am
ics
Key Findings Author (year)
Phenol, o-Chlorophenol, p-Chlorophenol, 2,4,6-Trichlorophen.
Pleurotus sajor caju
30C 24h
Ground (L) 89 159 189 373
- - Higher pH gave higher uptake on the fungus.
Denizli et al. 2005
PCB in soil Biochar BC - - - - - Biochar reduced PDB uptake by plants. Denyes et al. 2012
Pentachlorophenol Active carbon AC - - 260-500 - Ex Adsorption decreased with increasing pH; pi-pi interactions on basic sites cited.
Diaz-Flores et al. 2006
Phenanthrene, Pyrene
Phanerochaet chrysosporium
- Live, Heat-killed
- - - - Both biosorption & biodegradation were shown to be important; live material showed an advantage for removal.
Ding et al. 2013
Befenthrin Cork (granulated)
105C
- L 0.26-0.55
- - The low uptake is consistent with the impervious nature of cork.
Domingues et al. 2005
Ci-cypermethrin Cork, Active carbon
105C
- L 0.3 0.2
- - States that cork is successful; however the reported numbers were very low.
Domingues et al. 2007
4-Chlorophenol, 3,5-Dichlorophenol, 2,4,6-trichlorophen., 2,3,4,6-tetrachlorop, Pentachlorophenol
Carbon black BC - L 296 277 237 230 239
- Ex Best pH<11 Domínguez-V. et al. 2009
Phenol Spirulina bionanopart.
60C Ground L 159 - Ex Best pH=6; very strong temperature effect Dotto et al. 2013
Phenol Carbonized beet pulp
BC 600C F, L
70-90 2nd En Best pH=6 Dursun et al. 2005
Phenol, Pentachlorophenol
Carbonized pine bark
BC 672C L, F
18-40 1
- - Slow carbonization Edgehill & Lu 1998
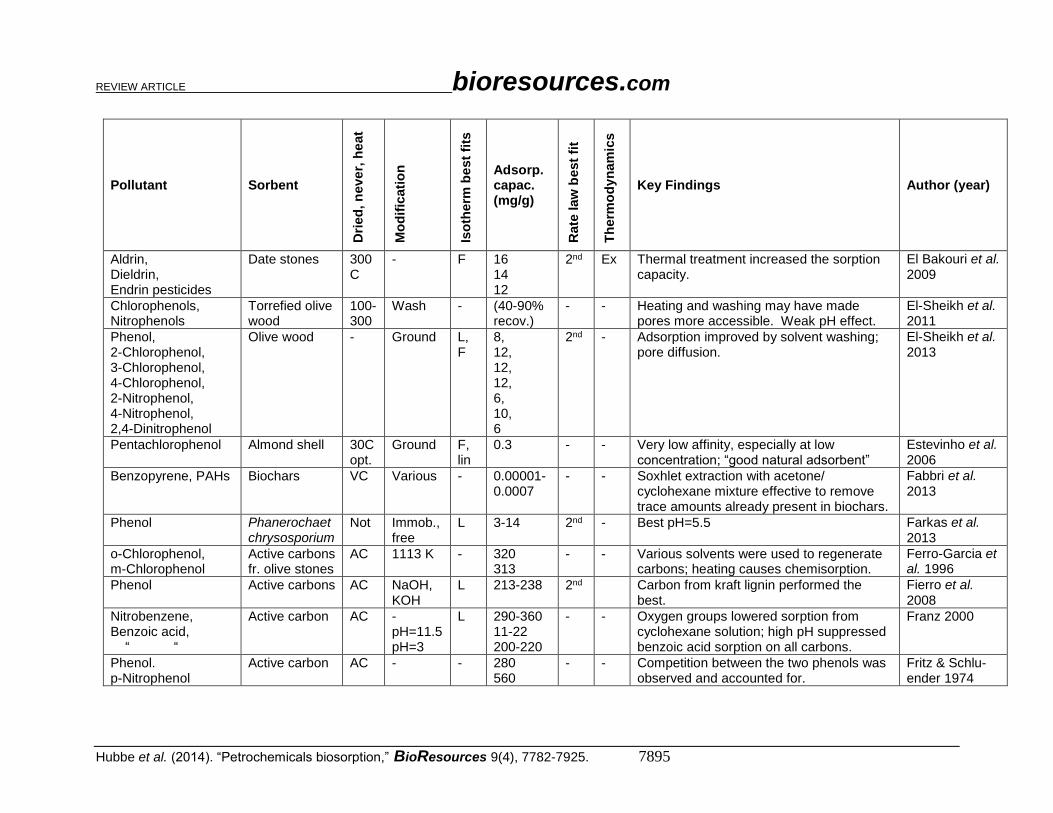
REVIEW ARTICLE bioresources.com
Hubbe et al. (2014). “Petrochemicals biosorption,” BioResources 9(4), 7782-7925. 7895
Pollutant Sorbent
Dri
ed
, n
eve
r, h
eat
Mo
dif
icati
on
Iso
therm
be
st
fits
Adsorp. capac. (mg/g)
Rate
law
best
fit
Th
erm
od
yn
am
ics
Key Findings Author (year)
Aldrin, Dieldrin, Endrin pesticides
Date stones 300C
- F 16 14 12
2nd Ex Thermal treatment increased the sorption capacity.
El Bakouri et al. 2009
Chlorophenols, Nitrophenols
Torrefied olive wood
100-300
Wash - (40-90% recov.)
- - Heating and washing may have made pores more accessible. Weak pH effect.
El-Sheikh et al. 2011
Phenol, 2-Chlorophenol, 3-Chlorophenol, 4-Chlorophenol, 2-Nitrophenol, 4-Nitrophenol, 2,4-Dinitrophenol
Olive wood - Ground L, F
8, 12, 12, 12, 6, 10, 6
2nd - Adsorption improved by solvent washing; pore diffusion.
El-Sheikh et al. 2013
Pentachlorophenol Almond shell 30C opt.
Ground F, lin
0.3 - - Very low affinity, especially at low concentration; “good natural adsorbent”
Estevinho et al. 2006
Benzopyrene, PAHs Biochars VC Various - 0.00001-0.0007
- - Soxhlet extraction with acetone/ cyclohexane mixture effective to remove trace amounts already present in biochars.
Fabbri et al. 2013
Phenol Phanerochaet chrysosporium
Not Immob., free
L 3-14 2nd - Best pH=5.5 Farkas et al. 2013
o-Chlorophenol, m-Chlorophenol
Active carbons fr. olive stones
AC 1113 K - 320 313
- - Various solvents were used to regenerate carbons; heating causes chemisorption.
Ferro-Garcia et al. 1996
Phenol Active carbons AC NaOH, KOH
L 213-238 2nd Carbon from kraft lignin performed the best.
Fierro et al. 2008
Nitrobenzene, Benzoic acid, “ “
Active carbon AC - pH=11.5 pH=3
L 290-360 11-22 200-220
- - Oxygen groups lowered sorption from cyclohexane solution; high pH suppressed benzoic acid sorption on all carbons.
Franz 2000
Phenol. p-Nitrophenol
Active carbon AC - - 280 560
- - Competition between the two phenols was observed and accounted for.
Fritz & Schlu-ender 1974
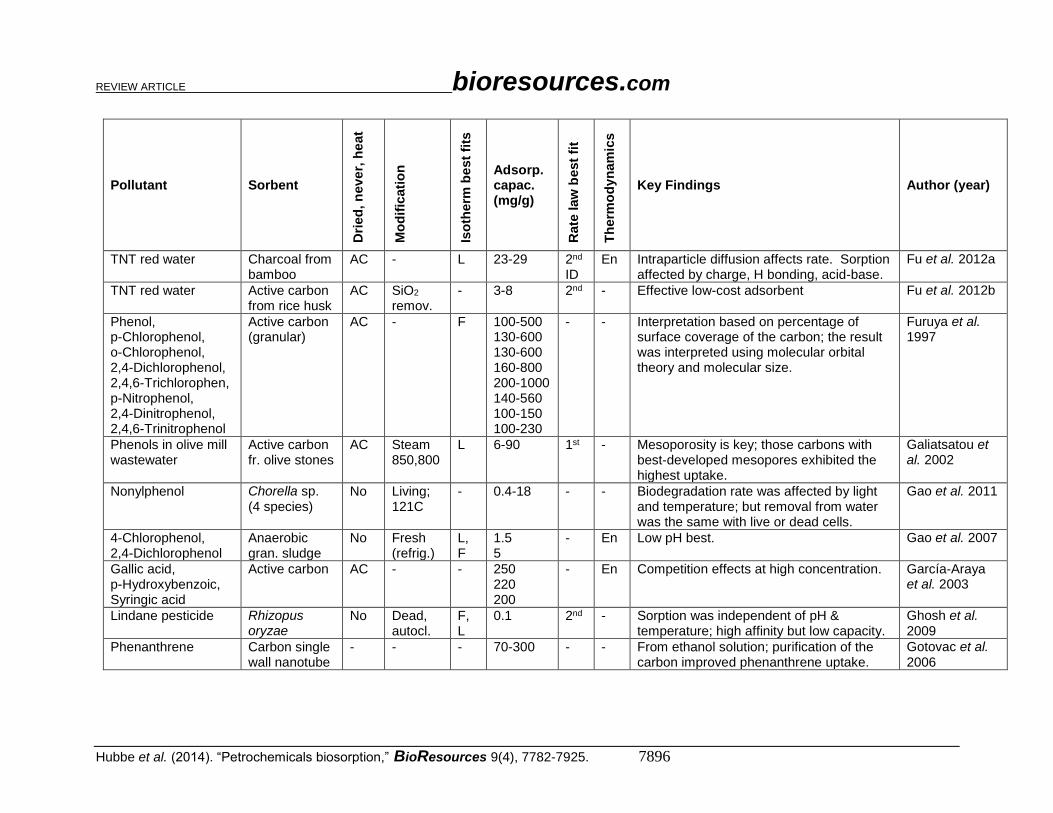
REVIEW ARTICLE bioresources.com
Hubbe et al. (2014). “Petrochemicals biosorption,” BioResources 9(4), 7782-7925. 7896
Pollutant Sorbent
Dri
ed
, n
eve
r, h
eat
Mo
dif
icati
on
Iso
therm
be
st
fits
Adsorp. capac. (mg/g)
Rate
law
best
fit
Th
erm
od
yn
am
ics
Key Findings Author (year)
TNT red water Charcoal from bamboo
AC - L 23-29 2nd ID
En Intraparticle diffusion affects rate. Sorption affected by charge, H bonding, acid-base.
Fu et al. 2012a
TNT red water Active carbon from rice husk
AC SiO2 remov.
- 3-8 2nd - Effective low-cost adsorbent Fu et al. 2012b
Phenol, p-Chlorophenol, o-Chlorophenol, 2,4-Dichlorophenol, 2,4,6-Trichlorophen, p-Nitrophenol, 2,4-Dinitrophenol, 2,4,6-Trinitrophenol
Active carbon (granular)
AC - F 100-500 130-600 130-600 160-800 200-1000 140-560 100-150 100-230
- - Interpretation based on percentage of surface coverage of the carbon; the result was interpreted using molecular orbital theory and molecular size.
Furuya et al. 1997
Phenols in olive mill wastewater
Active carbon fr. olive stones
AC Steam 850,800
L 6-90 1st - Mesoporosity is key; those carbons with best-developed mesopores exhibited the highest uptake.
Galiatsatou et al. 2002
Nonylphenol Chorella sp. (4 species)
No Living; 121C
- 0.4-18 - - Biodegradation rate was affected by light and temperature; but removal from water was the same with live or dead cells.
Gao et al. 2011
4-Chlorophenol, 2,4-Dichlorophenol
Anaerobic gran. sludge
No Fresh (refrig.)
L, F
1.5 5
- En Low pH best. Gao et al. 2007
Gallic acid, p-Hydroxybenzoic, Syringic acid
Active carbon AC - - 250 220 200
- En Competition effects at high concentration. García-Araya et al. 2003
Lindane pesticide Rhizopus oryzae
No Dead, autocl.
F, L
0.1 2nd - Sorption was independent of pH & temperature; high affinity but low capacity.
Ghosh et al. 2009
Phenanthrene Carbon single wall nanotube
- - - 70-300 - - From ethanol solution; purification of the carbon improved phenanthrene uptake.
Gotovac et al. 2006
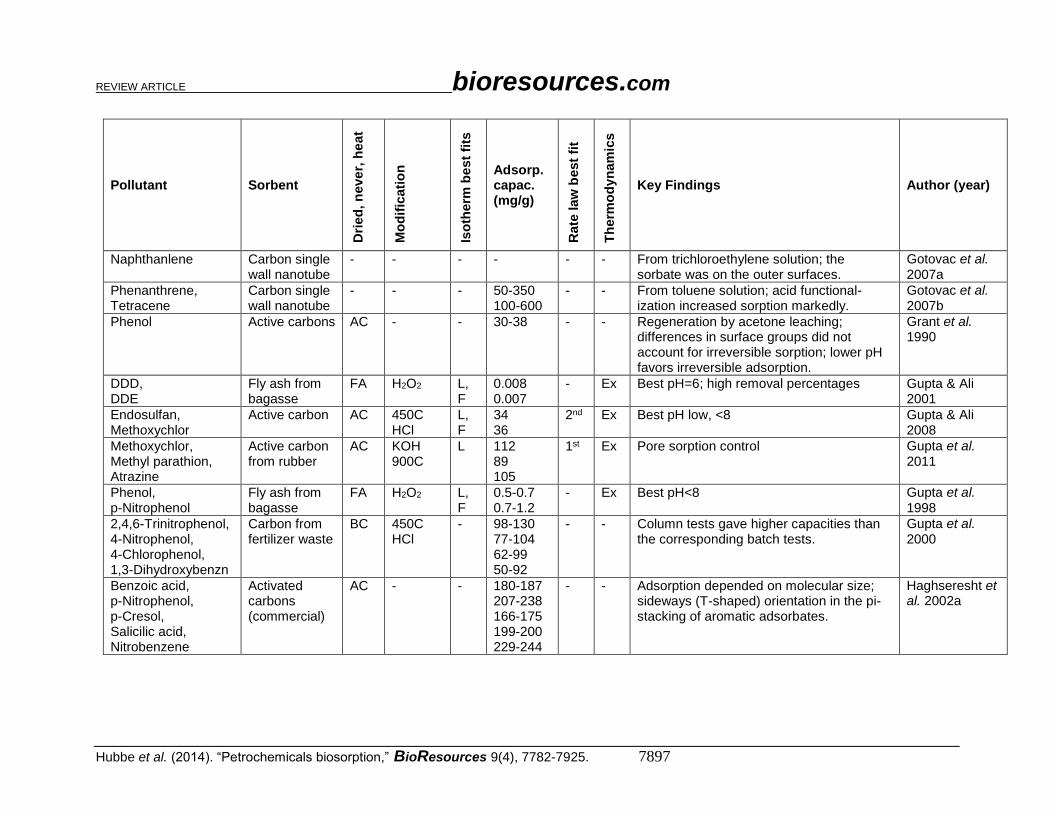
REVIEW ARTICLE bioresources.com
Hubbe et al. (2014). “Petrochemicals biosorption,” BioResources 9(4), 7782-7925. 7897
Pollutant Sorbent
Dri
ed
, n
eve
r, h
eat
Mo
dif
icati
on
Iso
therm
be
st
fits
Adsorp. capac. (mg/g)
Rate
law
best
fit
Th
erm
od
yn
am
ics
Key Findings Author (year)
Naphthanlene Carbon single wall nanotube
- - - - - - From trichloroethylene solution; the sorbate was on the outer surfaces.
Gotovac et al. 2007a
Phenanthrene, Tetracene
Carbon single wall nanotube
- - - 50-350 100-600
- - From toluene solution; acid functional-ization increased sorption markedly.
Gotovac et al. 2007b
Phenol Active carbons AC - - 30-38
- - Regeneration by acetone leaching; differences in surface groups did not account for irreversible sorption; lower pH favors irreversible adsorption.
Grant et al. 1990
DDD, DDE
Fly ash from bagasse
FA H2O2 L, F
0.008 0.007
- Ex Best pH=6; high removal percentages Gupta & Ali 2001
Endosulfan, Methoxychlor
Active carbon AC 450C HCl
L, F
34 36
2nd Ex Best pH low, <8 Gupta & Ali 2008
Methoxychlor, Methyl parathion, Atrazine
Active carbon from rubber
AC KOH 900C
L 112 89 105
1st Ex Pore sorption control Gupta et al. 2011
Phenol, p-Nitrophenol
Fly ash from bagasse
FA H2O2 L, F
0.5-0.7 0.7-1.2
- Ex Best pH<8 Gupta et al. 1998
2,4,6-Trinitrophenol, 4-Nitrophenol, 4-Chlorophenol, 1,3-Dihydroxybenzn
Carbon from fertilizer waste
BC 450C HCl
- 98-130 77-104 62-99 50-92
- - Column tests gave higher capacities than the corresponding batch tests.
Gupta et al. 2000
Benzoic acid, p-Nitrophenol, p-Cresol, Salicilic acid, Nitrobenzene
Activated carbons (commercial)
AC - - 180-187 207-238 166-175 199-200 229-244
- - Adsorption depended on molecular size; sideways (T-shaped) orientation in the pi-stacking of aromatic adsorbates.
Haghseresht et al. 2002a
REVIEW ARTICLE bioresources.com
Hubbe et al. (2014). “Petrochemicals biosorption,” BioResources 9(4), 7782-7925. 7898
Pollutant Sorbent
Dri
ed
, n
eve
r, h
eat
Mo
dif
icati
on
Iso
therm
be
st
fits
Adsorp. capac. (mg/g)
Rate
law
best
fit
Th
erm
od
yn
am
ics
Key Findings Author (year)
Benzoic acid, p-Nitrophenol, p-Cresol, Salicilic acid, Nitrobenzene
Activated carbons (commercial)
AC - - 180-234 207-239 166-221 199-293 229-266
Adsorption of dissociable aromatic compounds provides evidence of London dispersion contribution to adsorption.
Haghseresht et al. 2002b
Benzoic acid, p-Nitrophenol, p-Cresol, Salicilic acid, Nitrobenzene
Activated carbons (commercial)
AC - - 186 236 176 193 246
- - Adsorption falls above critical pH value: Benzoic & salicylic acids: pH ~6; p-Nitrophenol & cresol: pH ~10.
Haghseresht et al. 2002c
p-Nitrophenol, p-Cresol, Nitrobenzene
Activated carbons (commercial)
AC - - 153-208, 119-151, 154-209
- - Binary isotherms predicted; oxidation reduces capacity moderately (15-20%).
Haghseresht et al. 2003
Phenol Activated charcoal
AC - F, L, RP
48 - Ex Large drop in adsorption about pH 10; scant effect of salt
Halhouli et al. 1995
Paraquot dichloride Activated carbon
AC CO2 900C
L 28-34 2nd Ex Particle size did not make a clear difference; regenerate at high pH.
Hamadi et al. 2004
Phenol, 2-Chlorophenol, 4-Chlorophenol, 2,4-Dichlorophenol, 2,4,6-Trichlorophen.
Granular activated carbon
AC - FG HB T F
238-250, 284-303, 356-301, 303-370, 438-482
- - No association among the adsorbed molecules detected; capacity increased with molecular weight, hydrophobicity, decreased solubility; various forms of Langmuir model gave similar results.
Hamdaoui & N. 2007a
4-Chlorophenol Activ. carbon from rattan sawdust
AC - L 189 2nd - Intra-particle diffusion; gradual dropoff in capacity above pH=7
Hameed et al. 2008a
REVIEW ARTICLE bioresources.com
Hubbe et al. (2014). “Petrochemicals biosorption,” BioResources 9(4), 7782-7925. 7899
Pollutant Sorbent
Dri
ed
, n
eve
r, h
eat
Mo
dif
icati
on
Iso
therm
be
st
fits
Adsorp. capac. (mg/g)
Rate
law
best
fit
Th
erm
od
yn
am
ics
Key Findings Author (year)
Phenol Activ. carbon from rattan sawdust
AC KOH, 850C
L 149 2nd - Dropoff in capacity above pH=8 Hameed et al. 2008b
2,4,6-trichlorophenol Activated carbon
AC KOH, 814C
L 169 - - Activation conditions were optimized. Hameed et al. 2009
p-Nitrophenol Magnetic activated carbon
AC - L 128-133, 61-72
- - Coprecipitation was effective for magnetizing the carbon.
Han et al. 2013
Phenol Pseudomon. on active C
- - - - - - Adsorption happens first, then biodegradation; packed bed.
Hank et al. 2010
Perfluoroacetic acid & related compounds
Gran & powd. activated carbon
AC - L, F
0.05-50 - - Some of the surfactants exhibited tiny values of adsorption capacity; low bulk concentrations were employed.
Hansen et al. 2010
Atrazine Biochars from corncob
BC 350-650C
F 0.5-3 - - The capacity Increased with higher temperature of charring; low affinity.
Hao et al. 2013
p-Nitrophenol Activated carbons
AC HNO3 NaOH
- 300-500 - - Oxidation decreased the surface area but had little effect on adsorption.
Haydar et al. 2003
Phenol Activated carbons
AC CO2 900C
- 60-200 - - Different adsorption energies on different sizes of pores; pore-filling mechanism.
Hsieh & Teng 2000
Paraquot Rice husk 50C Methacrylic acid
L 292 - - The carboxylate form (NaOH) was effective for paraquot removal.
Hsu et al. 2009
Paraquot Rice husk 50C Methacrylic acid
L 318 - - - Hsu & Pan 2007
Methyltertbutyl ether MTBE
Biolog. active. carbon
- - - 1-20 - - Bioaugmentation was used to regenerate the carbon adsorbent in-situ, adsorption was mainly on the bacterial surfaces.
Hu et al. 2013
REVIEW ARTICLE bioresources.com
Hubbe et al. (2014). “Petrochemicals biosorption,” BioResources 9(4), 7782-7925. 7900
Pollutant Sorbent
Dri
ed
, n
eve
r, h
eat
Mo
dif
icati
on
Iso
therm
be
st
fits
Adsorp. capac. (mg/g)
Rate
law
best
fit
Th
erm
od
yn
am
ics
Key Findings Author (year)
1-Naphthylamine Multiwall carbon nanotubes
- - L 154-294 2nd En Best pH range 7-9; pi-pi interactions; magnetic particles were effective for remediation with separation.
Hu et al. 2011
Phenanthrene; Pyrene
Aspen wood fibers
- Bleach, Hydrol.
F 0.01-5.0 0.01-10
- - Bleaching decreased uptake; hydrolysis of carbohydrates increased uptake.
Huang et al. 2006
Anthracene Gomphidius viscidus
No Auto-claved
L 1500-1900
2nd - Fungal biomass most effective at pH>6; fungus could become acclimated.
Huang et al. 2010
Phenol, 3-Nitrophenol
Activated carbons
AC Up to 1000C
- 10-20, 10-20
2nd ID
- Intraparticle diffusion Ioannou & Simitzis 2009
Phenol Bio-active carbon
- Com-mercial
- - - - Substituted phenols inhibited the biofilm; packed bed system; >90% biodegradation in 20-30 days
Ivancev-T. et al. 1998
Pentachlorophenol Microbial biomass
No - - - - - Higher uptake onto activated sludge at lower pH
Jacobsen et al. 1996
Phenol, 2-Chlorophenol, 4-Chlorophenol, 2,,4-Dichlorophenol
Carbon slurry, etc.
BC 500C L 17, 50, 57, 132
1st - Pore diffusion Jain et al. 2004
Phenanthrene Biochars from wood
BC 300 to 820C
F 2-30 - - Low-affinity isotherms; heating at above 450 oC greatly increased uptake.
James et al. 2005
Tetracycline Carbon nanotubes
- - F - - Humic acids suppressed adsorption of tetracyclene; Cu(II) increased adsorption.
Ji et al. 2010

REVIEW ARTICLE bioresources.com
Hubbe et al. (2014). “Petrochemicals biosorption,” BioResources 9(4), 7782-7925. 7901
Pollutant Sorbent
Dri
ed
, n
eve
r, h
eat
Mo
dif
icati
on
Iso
therm
be
st
fits
Adsorp. capac. (mg/g)
Rate
law
best
fit
Th
erm
od
yn
am
ics
Key Findings Author (year)
Phenanthrene, Anthracene, Fluoranthrene, Benz[a]anthracene, Benzofluoranthene, Benzo[g,h,i]perylene
Diesel soot from car exhaust pipes, other soots
- - - - - - Adsorption of the aromatic compounds onto soot was very strong and largely irreversible, according to isotopic tests; preferential adsorption of planar molecules.
Jonker & Koelmans 2002
Lindane Gram – bacter Gram + bacter
Not, 100
Live or dired
F 0.1-1 - - Zeta potential was correlated with adsorption; Van der Waals interactions.
Ju et al. 1997
Phenol, 4-Chlorophenol
Active carbon 750-840
Steam active.
L 240-300; 250-400
- En Adsorption in micropores seems likely. Juang et al. 2001
Phenol, 4-Chlorophenol, 4-Nitrophenol
Active carbon fibers
AC - L 110-140, 240-260, 230-240
- - Jossens et al. 3-parameter heterogeneous thermodynamic isotherm fit best; rate data fit two-phase model.
Juang et al. 1996a
Phenol, Chlorophenols, Cresols
Active carbon fibers
800-1200
- - 150, 240-264, 199-209
- - Higher adsorption of chlorinated, compared to methylated phenols
Juang et al. 1996b
Phenols Active carbon, plum kernel
750-900
Steam activat.
L 106-258 2nd ID
- Intraparticle diffusion, hydrogen bonding Juang et al. 2000
DDT, DDD, DDE
Fungal mycelia
- - - - - - Dichloromethane was used to extract the chlorinated pesticides from the fungal mycelia.
Juhasz & Naidu 2000b
p,p’-DDT Cladosporium fungal mycel.
no - - 7-17 - - Killed biomass adsorbed somewhat more than living; little effect of pH.
Juhasz et al. 2002
Phenol, Chlorophenols
Granular act. carbons
AC - F 0.5-10 - - Starting bulk concentrations were too low; dispersion forces proposed important.
Jung et al. 2001
REVIEW ARTICLE bioresources.com
Hubbe et al. (2014). “Petrochemicals biosorption,” BioResources 9(4), 7782-7925. 7902
Pollutant Sorbent
Dri
ed
, n
eve
r, h
eat
Mo
dif
icati
on
Iso
therm
be
st
fits
Adsorp. capac. (mg/g)
Rate
law
best
fit
Th
erm
od
yn
am
ics
Key Findings Author (year)
2-Chlorophenol, 2,4-Dichlorophenol
Fly ash from power plant
FA - F 1.3 2
- Ex Carbon content and specific surface area were correlated with uptake; packed bed; lower adsorption above pH=7.
Kao et al. 2000
Phenol Hydrogel-biochar composites
BC - L 14-23 1st - Increasing salt increased uptake Karakoyun et al. 2011
Trichloroethylene Active carbons AC - F 1-100 - - Many different activated carbons were compared; 5 nm pore volume is key.
Karanfil & Dastgheib 2004
Trichloroethylene Active carbon fibers
AC - F 1-100 - - Natural organic matter can be excluded with a membrane.
Karanfil et al. 2006
2-Nitrophenol Active carbons AC - - 500-550 - - Most of the adsorbed phenol did not come off when bulk concentration was lowered.
Karimi-J. & N. 1997
Chlorophenols Anaerobic gran. sludge
No. Live sludge
F 0.1-2 - - Linear adsorption isotherms were weakly correlated to octanol-water partition coefficients.
Kennedy et al. 1992
Phenol Mesoporous carbon
700-900
- F, L
22 2nd Ex Highest adsorption at low pH. Kennedy et al. 2007
Nefenamic acid pharmaceutical
Active carbon AC - L 100 - - Activated carbon outperformed membrane ultrafiltration.
Khalaf et al. 2013
Phenol, o-Chlorophenol, m-Chlorophenol, p-Chlorophenol, m-Cresol
Active carbon AC - F, L
160-220 - - Larger molecules of lower solubility in water adsorb to a greater degree.
Khan et al. 1997a

REVIEW ARTICLE bioresources.com
Hubbe et al. (2014). “Petrochemicals biosorption,” BioResources 9(4), 7782-7925. 7903
Pollutant Sorbent
Dri
ed
, n
eve
r, h
eat
Mo
dif
icati
on
Iso
therm
be
st
fits
Adsorp. capac. (mg/g)
Rate
law
best
fit
Th
erm
od
yn
am
ics
Key Findings Author (year)
Toluene, Acetone, p-Cresol, p-Chlorophenol, Benzene, n-Pentanol, 4n-Propylphenol, p-Methylphenol
Active carbon AC - L 260, 50, 19, 260, 200, 43, 200, 95
- - Khan et al. 1997b
Naphthalene, Acenaphthylene, Acenaphthene, Fluorene, Phenanthrene, Anthracene, Fluoranthene
Cat-tail fibers; Kapok fibers
60C 24h
Cat-tail was ground
F 0.05-0.6 - - Cat-tail fibers were more effective than kapok fibers; low affinity isotherms.
Khan et al. 2007
Dichloromethane Commercial G active carbon
AC - F L
46 2nd 1st
Ex Best pH 6-8; different carbons showed different fits.
Khan et al. 2010
16 multi-ringed compounds
Biochar from sewag. sludge
BC 500C - - - - The biochar reduced bioaccumulation of polyaromatic hydrocarbons by lettuce.
Khan et al. 2013
2,4-Dichlorophen-oxyacetic acid
Magnetic & graphitic C
BC Fe3O4 µ-wave
L 33-77 2nd - The magnetic powders are easily separated.
Khoshnood & A. 2012
Trichloroethylene Granular active carbon
AC - F 1-80 - - Preloaded with humic substances; effects of calcium and salt; low affinity
Kilduff et al. 1998
Phenol Active carbon from tobacco residues
AC K2CO3, KOH 700C
L 18, 46 2nd - - Kilic et al. 2011
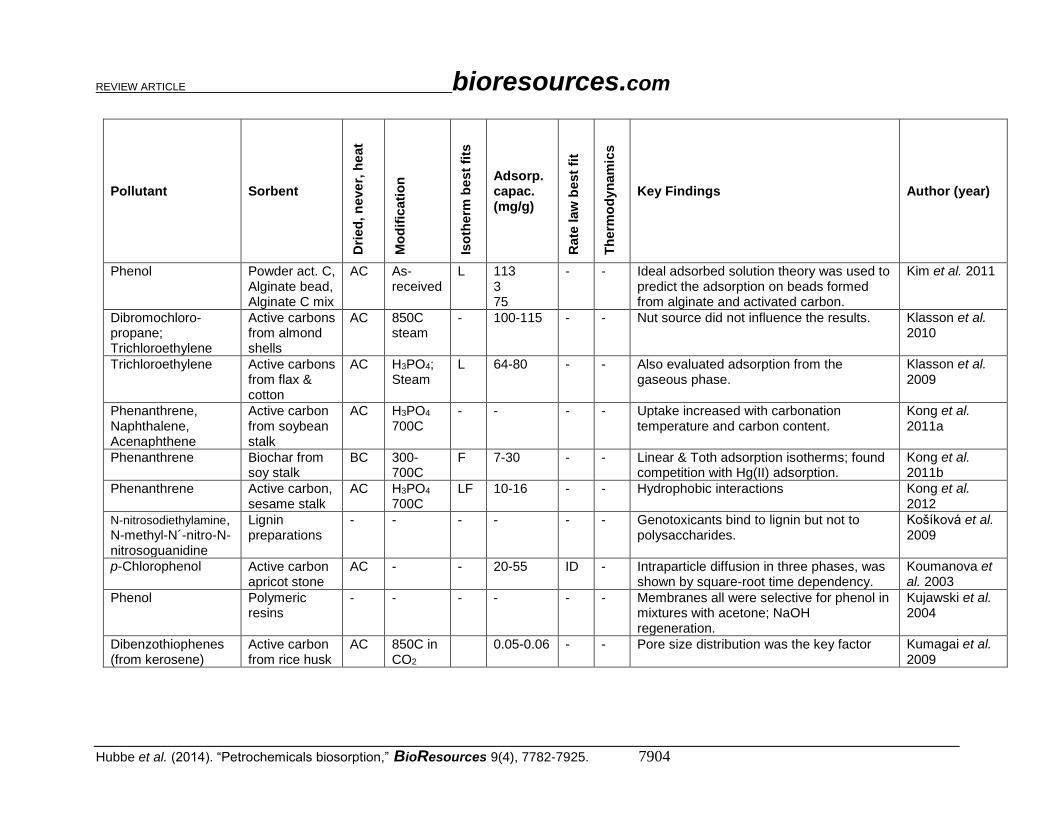
REVIEW ARTICLE bioresources.com
Hubbe et al. (2014). “Petrochemicals biosorption,” BioResources 9(4), 7782-7925. 7904
Pollutant Sorbent
Dri
ed
, n
eve
r, h
eat
Mo
dif
icati
on
Iso
therm
be
st
fits
Adsorp. capac. (mg/g)
Rate
law
best
fit
Th
erm
od
yn
am
ics
Key Findings Author (year)
Phenol Powder act. C, Alginate bead, Alginate C mix
AC As-received
L 113 3 75
- - Ideal adsorbed solution theory was used to predict the adsorption on beads formed from alginate and activated carbon.
Kim et al. 2011
Dibromochloro-propane; Trichloroethylene
Active carbons from almond shells
AC 850C steam
- 100-115 - - Nut source did not influence the results. Klasson et al. 2010
Trichloroethylene Active carbons from flax & cotton
AC H3PO4; Steam
L 64-80 - - Also evaluated adsorption from the gaseous phase.
Klasson et al. 2009
Phenanthrene, Naphthalene, Acenaphthene
Active carbon from soybean stalk
AC H3PO4 700C
- - - - Uptake increased with carbonation temperature and carbon content.
Kong et al.
2011a
Phenanthrene Biochar from soy stalk
BC 300-700C
F 7-30 - - Linear & Toth adsorption isotherms; found competition with Hg(II) adsorption.
Kong et al. 2011b
Phenanthrene Active carbon, sesame stalk
AC H3PO4 700C
LF 10-16 - - Hydrophobic interactions Kong et al. 2012
N-nitrosodiethylamine, N-methyl-N´-nitro-N-nitrosoguanidine
Lignin preparations
- - - - - - Genotoxicants bind to lignin but not to polysaccharides.
Košíková et al. 2009
p-Chlorophenol Active carbon apricot stone
AC - - 20-55 ID - Intraparticle diffusion in three phases, was shown by square-root time dependency.
Koumanova et al. 2003
Phenol Polymeric resins
- - - - - - Membranes all were selective for phenol in mixtures with acetone; NaOH regeneration.
Kujawski et al. 2004
Dibenzothiophenes (from kerosene)
Active carbon from rice husk
AC 850C in CO2
0.05-0.06 - - Pore size distribution was the key factor Kumagai et al. 2009
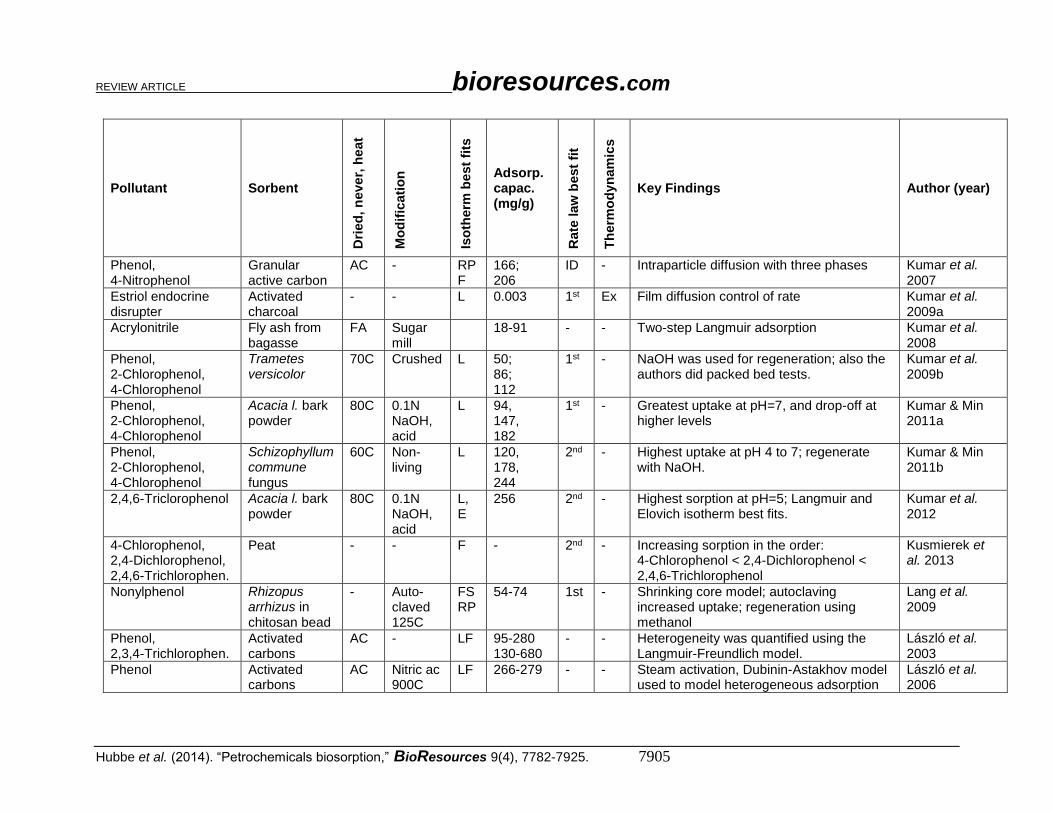
REVIEW ARTICLE bioresources.com
Hubbe et al. (2014). “Petrochemicals biosorption,” BioResources 9(4), 7782-7925. 7905
Pollutant Sorbent
Dri
ed
, n
eve
r, h
eat
Mo
dif
icati
on
Iso
therm
be
st
fits
Adsorp. capac. (mg/g)
Rate
law
best
fit
Th
erm
od
yn
am
ics
Key Findings Author (year)
Phenol, 4-Nitrophenol
Granular active carbon
AC - RP F
166; 206
ID - Intraparticle diffusion with three phases Kumar et al. 2007
Estriol endocrine disrupter
Activated charcoal
- - L 0.003 1st Ex Film diffusion control of rate Kumar et al. 2009a
Acrylonitrile Fly ash from bagasse
FA Sugar mill
18-91 - - Two-step Langmuir adsorption Kumar et al. 2008
Phenol, 2-Chlorophenol, 4-Chlorophenol
Trametes versicolor
70C Crushed L 50; 86; 112
1st - NaOH was used for regeneration; also the authors did packed bed tests.
Kumar et al. 2009b
Phenol, 2-Chlorophenol, 4-Chlorophenol
Acacia l. bark powder
80C 0.1N NaOH, acid
L 94, 147, 182
1st - Greatest uptake at pH=7, and drop-off at higher levels
Kumar & Min 2011a
Phenol, 2-Chlorophenol, 4-Chlorophenol
Schizophyllum commune fungus
60C Non-living
L 120, 178, 244
2nd - Highest uptake at pH 4 to 7; regenerate with NaOH.
Kumar & Min 2011b
2,4,6-Triclorophenol Acacia l. bark powder
80C 0.1N NaOH, acid
L, E
256 2nd - Highest sorption at pH=5; Langmuir and Elovich isotherm best fits.
Kumar et al. 2012
4-Chlorophenol, 2,4-Dichlorophenol, 2,4,6-Trichlorophen.
Peat - - F - 2nd - Increasing sorption in the order: 4-Chlorophenol < 2,4-Dichlorophenol < 2,4,6-Trichlorophenol
Kusmierek et al. 2013
Nonylphenol Rhizopus arrhizus in chitosan bead
- Auto-claved 125C
FS RP
54-74 1st - Shrinking core model; autoclaving increased uptake; regeneration using methanol
Lang et al. 2009
Phenol, 2,3,4-Trichlorophen.
Activated carbons
AC - LF 95-280 130-680
- - Heterogeneity was quantified using the Langmuir-Freundlich model.
László et al. 2003
Phenol Activated carbons
AC Nitric ac 900C
LF 266-279 - - Steam activation, Dubinin-Astakhov model used to model heterogeneous adsorption
László et al. 2006
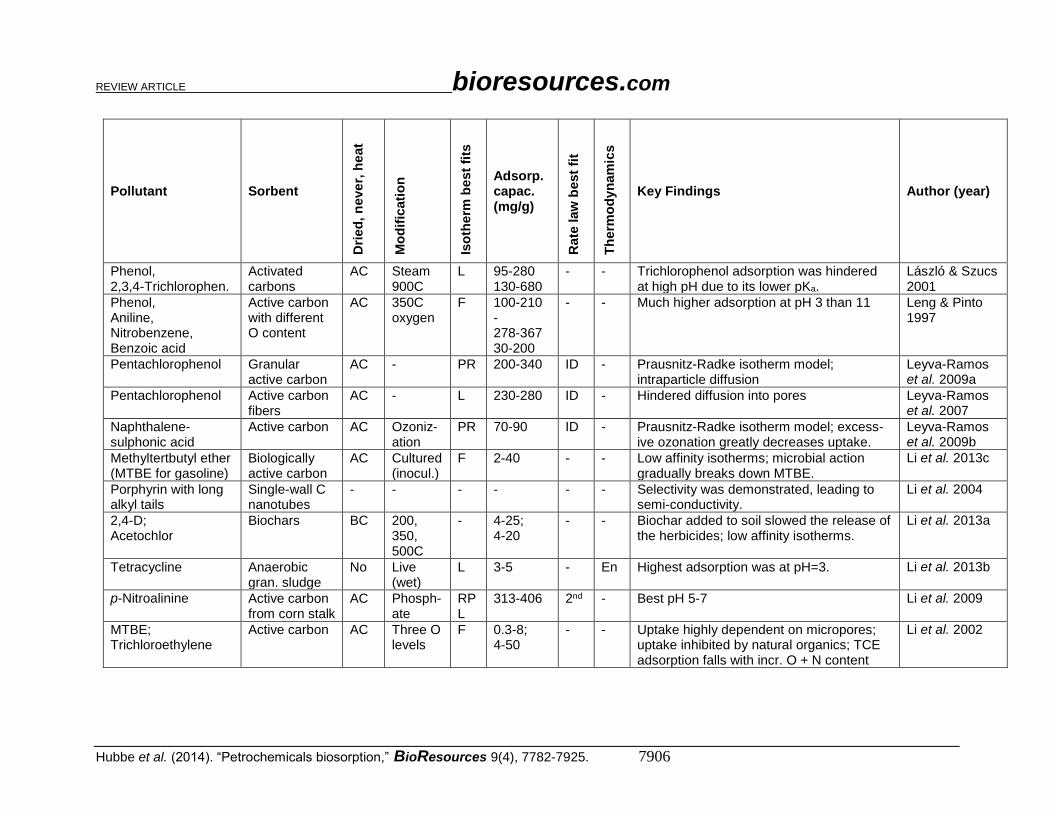
REVIEW ARTICLE bioresources.com
Hubbe et al. (2014). “Petrochemicals biosorption,” BioResources 9(4), 7782-7925. 7906
Pollutant Sorbent
Dri
ed
, n
eve
r, h
eat
Mo
dif
icati
on
Iso
therm
be
st
fits
Adsorp. capac. (mg/g)
Rate
law
best
fit
Th
erm
od
yn
am
ics
Key Findings Author (year)
Phenol, 2,3,4-Trichlorophen.
Activated carbons
AC Steam 900C
L 95-280 130-680
- - Trichlorophenol adsorption was hindered at high pH due to its lower pKa.
László & Szucs 2001
Phenol, Aniline, Nitrobenzene, Benzoic acid
Active carbon with different O content
AC 350C oxygen
F 100-210 - 278-367 30-200
- - Much higher adsorption at pH 3 than 11 Leng & Pinto 1997
Pentachlorophenol Granular active carbon
AC - PR 200-340 ID - Prausnitz-Radke isotherm model; intraparticle diffusion
Leyva-Ramos et al. 2009a
Pentachlorophenol Active carbon fibers
AC - L 230-280 ID - Hindered diffusion into pores Leyva-Ramos et al. 2007
Naphthalene-sulphonic acid
Active carbon AC Ozoniz-ation
PR 70-90 ID - Prausnitz-Radke isotherm model; excess-ive ozonation greatly decreases uptake.
Leyva-Ramos et al. 2009b
Methyltertbutyl ether (MTBE for gasoline)
Biologically active carbon
AC Cultured (inocul.)
F 2-40 - - Low affinity isotherms; microbial action gradually breaks down MTBE.
Li et al. 2013c
Porphyrin with long alkyl tails
Single-wall C nanotubes
- - - - - - Selectivity was demonstrated, leading to semi-conductivity.
Li et al. 2004
2,4-D; Acetochlor
Biochars BC 200, 350, 500C
- 4-25; 4-20
- - Biochar added to soil slowed the release of the herbicides; low affinity isotherms.
Li et al. 2013a
Tetracycline Anaerobic gran. sludge
No Live (wet)
L 3-5 - En Highest adsorption was at pH=3. Li et al. 2013b
p-Nitroalinine Active carbon from corn stalk
AC Phosph-ate
RP L
313-406 2nd - Best pH 5-7 Li et al. 2009
MTBE; Trichloroethylene
Active carbon AC Three O levels
F 0.3-8; 4-50
- - Uptake highly dependent on micropores; uptake inhibited by natural organics; TCE adsorption falls with incr. O + N content
Li et al. 2002

REVIEW ARTICLE bioresources.com
Hubbe et al. (2014). “Petrochemicals biosorption,” BioResources 9(4), 7782-7925. 7907
Pollutant Sorbent
Dri
ed
, n
eve
r, h
eat
Mo
dif
icati
on
Iso
therm
be
st
fits
Adsorp. capac. (mg/g)
Rate
law
best
fit
Th
erm
od
yn
am
ics
Key Findings Author (year)
Phenanthrene Fruit cuticles; Potato perid.
60C fractions F 1-7 - - Cutin and suberin components played big role in adsorption; low affinity
Li & Chen 2009
Phenanthrene; Pyrene
Pine bark 60C Extract, Saponif, Hydrol, etc.
- 0-6 - - Lignin had the largest contribution to adsorption; bulk concentrations too low; low affinity isotherms; acid hydrolysis had good effect by removing polysaccharides.
Li et al. 2010a
4-Chlorophenol, 2,4-Dichlorophenol, 2,4,6-Trichlorophen.
Fruit cuticles; Potato perid.
60C fractions F 0-100 - - Cutin and suberin components played big role in adsorption; low affinity.
Li et al. 2012
Phenanthrene Tea leaf powder
70C Brewed F 0-5 - - Low affinity; aliphatic carbons in tea leaves correlated with uptake.
Lin et al. 2007
Organic carbon Biochars BC - - 0.004-0.8 - - Hot water extraction of organics already present in various biochars
Lin et al. 2012
Phenol; Aniline
Active carbon AC - L 200-300, 200-300
- - Poor fits to Langmuir model actually; the ideal adsorbed phase model was used.
Liu & Pinto 1997
Pentachlorophenol Biochar from rice straw
BC Open burning
F 30-45 - - The biochar benefited germination and plant growth in-situ.
Lou et al. 2011
Trihalomethanes Carbon nanotubes
- - L 1-2.5 - - Capacity drops off above pH=7. Lu et al. 2005
Trihalomethanes M.-W. carbon nanotubes
- - L 0.3-3 1st Ex Proposed for drinking water treatment. Lu et al. 2006
Benzene; Toluene; o-Xylene
Wood chips: fir & pine
- Water-soaked
Lin 0-6 - - Fractional lignin content of wood correlated with the adsorption capacity.
Mackay & G. 2000
Phenol Active carbon AC Oxida-tion
L 16-20 - - Oxidation adversely affected phenol adsorption.
Mahajan et al. 1980
Phenol Rice husk; Rice husk ash
100 -
- 400C
F L
0.002 0.89
1st - Ashing greatly increased adsorption. Mahvi et al. 2004
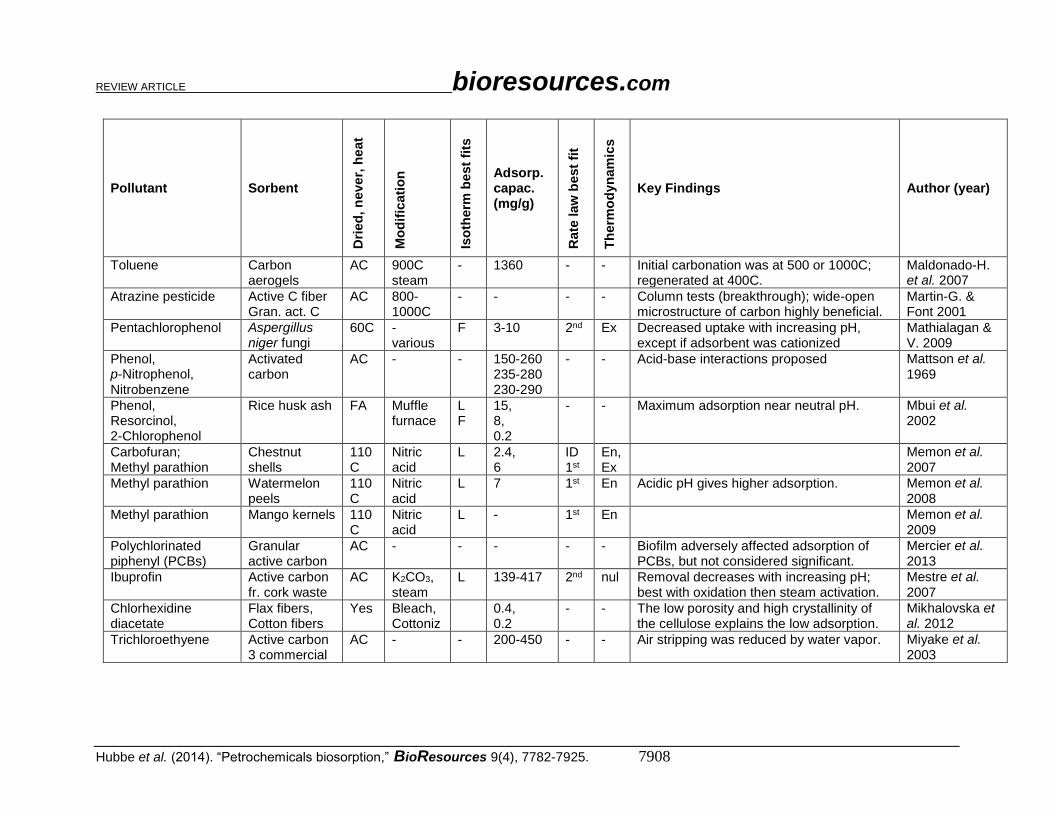
REVIEW ARTICLE bioresources.com
Hubbe et al. (2014). “Petrochemicals biosorption,” BioResources 9(4), 7782-7925. 7908
Pollutant Sorbent
Dri
ed
, n
eve
r, h
eat
Mo
dif
icati
on
Iso
therm
be
st
fits
Adsorp. capac. (mg/g)
Rate
law
best
fit
Th
erm
od
yn
am
ics
Key Findings Author (year)
Toluene Carbon aerogels
AC 900C steam
- 1360 - - Initial carbonation was at 500 or 1000C; regenerated at 400C.
Maldonado-H. et al. 2007
Atrazine pesticide Active C fiber Gran. act. C
AC 800-1000C
- - - - Column tests (breakthrough); wide-open microstructure of carbon highly beneficial.
Martin-G. & Font 2001
Pentachlorophenol Aspergillus niger fungi
60C - various
F 3-10 2nd Ex Decreased uptake with increasing pH, except if adsorbent was cationized
Mathialagan & V. 2009
Phenol, p-Nitrophenol, Nitrobenzene
Activated carbon
AC - - 150-260 235-280 230-290
- - Acid-base interactions proposed Mattson et al. 1969
Phenol, Resorcinol, 2-Chlorophenol
Rice husk ash FA Muffle furnace
L F
15, 8, 0.2
- - Maximum adsorption near neutral pH. Mbui et al. 2002
Carbofuran; Methyl parathion
Chestnut shells
110 C
Nitric acid
L 2.4, 6
ID 1st
En, Ex
Memon et al. 2007
Methyl parathion Watermelon peels
110 C
Nitric acid
L 7 1st En Acidic pH gives higher adsorption. Memon et al. 2008
Methyl parathion Mango kernels 110 C
Nitric acid
L - 1st En Memon et al. 2009
Polychlorinated piphenyl (PCBs)
Granular active carbon
AC - - - - - Biofilm adversely affected adsorption of PCBs, but not considered significant.
Mercier et al. 2013
Ibuprofin Active carbon fr. cork waste
AC K2CO3, steam
L 139-417 2nd nul Removal decreases with increasing pH; best with oxidation then steam activation.
Mestre et al. 2007
Chlorhexidine diacetate
Flax fibers, Cotton fibers
Yes Bleach, Cottoniz
0.4, 0.2
- - The low porosity and high crystallinity of the cellulose explains the low adsorption.
Mikhalovska et al. 2012
Trichloroethyene Active carbon 3 commercial
AC - - 200-450 - - Air stripping was reduced by water vapor. Miyake et al. 2003
REVIEW ARTICLE bioresources.com
Hubbe et al. (2014). “Petrochemicals biosorption,” BioResources 9(4), 7782-7925. 7909
Pollutant Sorbent
Dri
ed
, n
eve
r, h
eat
Mo
dif
icati
on
Iso
therm
be
st
fits
Adsorp. capac. (mg/g)
Rate
law
best
fit
Th
erm
od
yn
am
ics
Key Findings Author (year)
Pyridine Active carbons (coconut)
AC H2SO4 200-800
L 20-161 1st En Best uptake at pH>4; film diffusion Mohan et al. 2004
Alpha-picoline, Beta-picoline, Gamma-picline
Active carbons (coconut)
AC H2SO4 200-800
L 25-49; 42-149; 142-400
2nd Particle diffusion or film diffusion; adsorption capacities were inconsistent relative to temperature of equilibration.
Mohan et al. 2005
Phenol Active carbons (sawdust)
AC ZnCl2 300-600
L F
3 2nd - Highest uptake at pH=3.5 Mohanty et al. 2005
Pentachlorophenol Granular active carbon
AC - RP F
500 - Ex Radke-Prausnitz modified isotherm accounts for both pH and temperature; desorbable at high pH.
Mollah & Rob-inson 1996a
Pentachlorophenol Granular active carbon
AC - - - 1st - Batch and plug-flow kinetics modeled. Mollah & Rob-inson 1996b
Phenol, m-Aminophenol, p-Cresol, p-Nitrophenol
Active carbon fr. coal
AC Steam - 167, 178, 209, 196
- - Thermal regeneration was possible, but the adsorption capacities gradually decreased with increasing cycles; some was physi- and some chemi-sorbed.
Moreno-Castilla et al. 1995a
Phenol, m-Aminophenol, p-Cresol, p-Nitrophenol, m-Chlorophenol
Active carbon fr. coal
AC Steam L 97-152, 66-183, 99-243, 127-232, 66-206
- - Donor-acceptor interactions; adsorption fell at higher pH, depending on adsorbate details.
Moreno-Castilla et al. 1995b
Phenol, p--Nitrophenol
Active carbon AC Nitric a., CO2
L 73-238 - - The pH effects were consistent with charge interactions.
Mourão et al. 2011
Phenol Charred sawdust
BC 673C L 345 2nd - Oxygen-containing groups participated in the adsorption.
Mubarik et al. 2012
Analine, Benzoic acid, p-Nitrophenol
Activated carbon
AC - L 465-660, 866, 695-987
- - Accounting for pH effects by means of pKa values and double layer effects
Müller et al. 1985a
REVIEW ARTICLE bioresources.com
Hubbe et al. (2014). “Petrochemicals biosorption,” BioResources 9(4), 7782-7925. 7910
Pollutant Sorbent
Dri
ed
, n
eve
r, h
eat
Mo
dif
icati
on
Iso
therm
be
st
fits
Adsorp. capac. (mg/g)
Rate
law
best
fit
Th
erm
od
yn
am
ics
Key Findings Author (year)
Phenol Activated carbons
AC Nitric a., CO2
F 45-90 - - Reduced adsorption at high pH due to electrostatics; pi-pi interactions proposed.
Nabais et al. 2009
Phenol Pseudomonas aeruginosa
- Free or fixed
- - - - Fixing of the bacteria onto GAC or on alginate beads doubles the adsorption.
Namane et al. 2012
2-Chlorophenol Carbon from coir pith
AC 700C F 18 2nd Acidic pH favored adsorption; chemisorption played major role.
Namasivayam & Kavitha 2003
Phenol Carbon from coir pith
AC ZnCl2
700C LF - - - Rate of adsorption was faster for smaller
particles. Namasivayam & Sangr. 2006
Paraquat Sawdust from Triplochiton s
Sun dry
Ground L 9.5 2nd Ex Uptake increases with increasing pH; NaCl reduces adsorption capacity.
NanseuNjiki et al. 2010
2-Nitrophenol, 2-Chlorophenol
Seaweeds (algae)
60C Ground CaCl2
L F
19-97, 10-24
- - Hydrophobicity (octanol partitioning coef.) explained the main results.
Navarro et al. 2009
Phenol Seaweeds (algae)
60C Ground CaCl2
- - - - Higher uptake at pH=10; proposes hydrogen bonding concept.
Navarro et al. 2008
Phenol Posidonia oceanica
40C 1-2 mm selected
RP 5 2nd - Adsorption onto seagrass highest at pH=5. Ncibi et al. 2006
p-Chlorophenol, 3,4-Dichlorophenol, 2,4,6-Trichlorophen.
Granular active carbon
AC - LF 2, 3, 3
- Ex Particle size affected rate but not capacity; thermal regeneration was effective; uptake drops with increasing pH above 7.
Nelson & Yang 1995
Phenol, Nonylphenol
Active carbons AC HNO3 optional
- 150-225, 440-620
- - Oxidation caused 2-step adsorption; authors proposed hydrogen bonding.
Nevskaia & G.-R. 2001
Nonylphenol Active carbons AC - - 260-725 - - Two-step isotherms were attributed to micropores and “surface micelles”.
Nevskaia et al. 2001
2-Methylisoborneol, Nat. organic material
Active carbons (six types)
AC - - - - - Pre-adsorption of 2-methylisoborneol did not affect NOM subsequent adsorption.
Newcombe et al. 2002a
2-Methylisoborneol, Nat. organic material
Active carbons (six types)
AC - 0.2-10 - - Pore blockage by NOM Newcombe et al. 2002b

REVIEW ARTICLE bioresources.com
Hubbe et al. (2014). “Petrochemicals biosorption,” BioResources 9(4), 7782-7925. 7911
Pollutant Sorbent
Dri
ed
, n
eve
r, h
eat
Mo
dif
icati
on
Iso
therm
be
st
fits
Adsorp. capac. (mg/g)
Rate
law
best
fit
Th
erm
od
yn
am
ics
Key Findings Author (year)
Trans-1,10-dimethyl-trans-9-decalol
Active carbons fr. ag. residue
AC Steam F - - - Adsorption of “geosim” onto active carbons from bagasse & pecan shell
Ng et al. 2000
Cinnamic acid salt, Coumaric acid salt
Biochar (carbon black)
BC - L 10-23, 20
- - Release of ions upon adsorption implies an ion exchange mechanism.
Ni et al. 2011
3-Chlorophenol, 2,4-Dichlorophenol, 3,4-Dichlorophenol, 2,4,6-Trichlorophen., Pentachlorophenol
Anaerobic sludge granules from a CTMP paper mill
Live Acclim-ation
- - - - Packed bed experiments; linear adsorption behavior was observed; biosorption slowed the elution of the phenols through the column.
Ning et al. 1999
p-Nitrophenol Activated carbon
AC Untreat., H2, urea, H2SO4
L 63-210, 83-180, 63-180, 42-250
- - Higher uptake at low pH Nouri & Hagh- seresht 2004
Benzene, Toluene, p-Cresol, Benzoic acid
Activated carbon
AC - L 275-275, 274-278, 176-217, 29-248
- - Increased uptake with decreasing pH in cases of benzoic acid and cresol; results were consistent with pKa values.
Nouri & Hagh- seresht 2005
p-Cresol, p-Nitrophenol
Activated carbon
AC - L 122-174, 67-224
- - Adsorption depended on solubility, which depended on the pH and dissociation.
Nouri et al. 2002a
Perfluorinated surfactants
Active carbon, Zeolite, Sludge
AC - -
- L 60-250, 5-105, 2-120
- - Adsorption capacity increased with length of the fluorocarbon tail; activated carbon was most effective.
Ochoa-Herrera & S.-A. 2008
4-Nitrophenol Sawdust from Mansonia
100 Ground L 21 2nd - Three distinct stages of diffusion Ofomaja 2011
4-Nitrophenol Mansonia wood sawdust
100 Water wash
- 16 2nd 1st
- Multistage adsorption to reduce aqueous concentration to a low level; pH < 6 best
Ofomaja & U. 2011
4-Nitrophenol Mansonia wood sawdust
100 Ground L 150-425 2nd - Time-dependent Langmuir model shows three stages.
Ofomaja & U. 2013
REVIEW ARTICLE bioresources.com
Hubbe et al. (2014). “Petrochemicals biosorption,” BioResources 9(4), 7782-7925. 7912
Pollutant Sorbent
Dri
ed
, n
eve
r, h
eat
Mo
dif
icati
on
Iso
therm
be
st
fits
Adsorp. capac. (mg/g)
Rate
law
best
fit
Th
erm
od
yn
am
ics
Key Findings Author (year)
4-Chlorophenol Granular active carbon
AC Steam - 80-200 - - Bioregeneration was fitted to a Haldane kinetic model.
Oh et al. 2013
4-Chlorophenol, 2,4-Dichlorophenol
Granular active carbon
AC Steam - 150-280 100-280
- - The highest biodegradation was when the concentration was below acclimated level.
Oh et al. 2011
Trichloroethylene Granular active carbon
AC - F 1-20 - - Wet peroxide oxidation used to regenerate the adsorbent, low affinity adsorption.
Okawa et al. 2007
Phenanthrene Cork - Un-treated
- - - - Hydrophobic interactions attributed to pi-pi stacking; negatively charged groups inhibit adsorption.
Olivella et al. 2013
2,4-D, 2,4-DP 2,4-DB
Anoxybacillus flavithermus
80C Ground L F
24, 14, 14
1st - Optimum pH=4 Ozdemir et al. 2012
Phenol Active carbon AC - L 50 1st NaOH was used for regeneration. Özkaya 2006
Phenol Active carbon, Charcoal
AC BC
- 700C
F L
6-18, 41-74
- - The biochars adsorbed more phenol as the pH was lowered below 4.
Pajooheshfar & Saeed 2009
14 organic chloro compounds
Active carbon (5 common)
AC - F 0.03-43 - - The authors found no easy way to predict adsorbed amounts.
Pavoni et al. 2006
1,2-Dichlorobenzene Carbon nanotubes
- - - 28-31 - En Good adsorption in range 3<pH<10; falls off at pH=11.
Peng et al. 2003
Phenol Active carbons AC Nitric a, heat
DA 56-132 - - Dubinin-Astakhov isotherm was used to quantify heterogeneity of adsorption.
Podkościelny et al. 2003
Pentachlorophenol Granular active carbon
AC Plasma (N2, O2)
- 120-150 - - Oxygen plasma slightly increase uptake; N2 plasma caused a decline.
Qu et al. 2013
1,3-Dinitrobenzene,
Gram+ and Gram- bacteria
Dry Freeze-dried
L 17-84,
- - Increased uptake with increasing pH; proposed n-pi interactions.
Qu et al. 2008
Meth. tertbutyl ether, Trichloroethylene
Activated carbons
AC Natural organics
0.01-0.8, 0.3-18
- - Pores should be 1.5 times the size of the target molecules to avoid blockage.
Quinlivan et al. 2005

REVIEW ARTICLE bioresources.com
Hubbe et al. (2014). “Petrochemicals biosorption,” BioResources 9(4), 7782-7925. 7913
Pollutant Sorbent
Dri
ed
, n
eve
r, h
eat
Mo
dif
icati
on
Iso
therm
be
st
fits
Adsorp. capac. (mg/g)
Rate
law
best
fit
Th
erm
od
yn
am
ics
Key Findings Author (year)
p-Chlorophenol, 1,4,6-Trichlorophen.
Activated carbons
AC KOH, etc.
F 73-134, 112-122
2nd - Lower pH favored adsorption; only 10-50% desorption, even at pH=11.
Radhika & Pal-anivelu 2006
Analine, Nitrobenzene
Active carbons AC Oxidiz., Heated
- 46-186, 120-490
- - Both electrostatic & dispersive forces are important; analine uptake enhanced by oxidation; nitrobenzene by low O content.
Radovic et al. 1997
Phenanthrene, Naphthalene, 1,3,5-Trichlorobenz, 1,2-Dichlorobenzene
Peats and humic acids
- - F 3-360, 10-120, 10-30, 3-30
- - The substrate surfaces were highly heterogeneous.
Ran et al. 2013
Phenol Aspergillus niger
65-70C
H2SO4 best
L 0.3 - - Best pH=5, BET isotherm, irreversible uptake
Rao & Virara-ghavan 2002
Lindane, Heptachlor
Pine bark 105 C
ground F 0.1-200 - - Low affinity isotherms shown. Ratola et al. 2003
Phenol, o-Cresol, m-Cresol, p-Cresol, Benzyl alcohol
Active carbon AC - L 410-600, 420-460, 330-370, 380-480, 340-460
- nil Irreversibility of adsorption implies changes in adsorbates upon adsorption.
Ravi et al. 1998
Phenol Active carbon fr. palm seed
AC CO2 850-900
F 2-20 - - Decreased uptake below pH 3 and above pH=10, film diffusion rate control
Rengaraj et al. 2002a
Phenol Active carbon fr. rubber seed
AC CO2 850-900
F 10-15 1st ID
- Batch and column; intraparticle diffusion control
Rengaraj et al. 2002b
2-Chlorophenol, 3-Chlorophenol
Active carbons (various)
AC - 840
L 218-401, 218-394
- - Low pH favors adsorption; agricultural-derived active carbons were highly effective; uptake related to pore volume.
Rivera-Utrilla et al. 1991
Phenol Active carbon fr. avocado
AC CO2 900C
L 87 2nd nil Best pH 4 to 8.5, proposes pi-pi interaction, no easy regeneration found.
Rodrigues et al. 2011
REVIEW ARTICLE bioresources.com
Hubbe et al. (2014). “Petrochemicals biosorption,” BioResources 9(4), 7782-7925. 7914
Pollutant Sorbent
Dri
ed
, n
eve
r, h
eat
Mo
dif
icati
on
Iso
therm
be
st
fits
Adsorp. capac. (mg/g)
Rate
law
best
fit
Th
erm
od
yn
am
ics
Key Findings Author (year)
Penol Active carbon fr. macademia
AC CO2 850C
L 341 2nd Ex Decreased uptake with increasing pH. Rodrigues et al. 2013
Linuron, Alachlor, Metalaxyl, Chlorpyrifos, Dicamba, Paraquat
Nine types of wood with lignin 18 to 27% content
- Ground F >10, >1, >0.2, >3, >5 >30
- - Strong correlation between uptake and lignin content; the bulk concentrations were too low to provide reliable isotherms and adsorption capacities.
Rodriguez-C. et al. 2007
Imidacloprid pesticide
Plantago major L.
Dry As-is 0.002-0.037
- - Phytoremediation; gram-positive bacteria were able to induce biodegradation.
Romeh 2010
Phenol Active carbon, etc.
AC - L LF
205-310 1st Ex Activated carbon had higher capacity than silica gel, which had the highest rate; smaller particles gave faster adsorption.
Roostaei & Tezel 2004
Meth. tert-butyl ether (MTBE)
Granular active carbon (coconut), etc.
AC - F 0.1-30 - - Surface diffusion was faster for carbon, compared to other adsorbents; zeolite had higher capacity & costs less to regenerate.
Rossner & Knappe 2008
Endocrine disruptor, pharmaceuticals
Granular active carbon (coconut), etc.
AC - - - - - Heterogeneity of pore size is essential to achieve broad-spectrum adsorption; active carbon removed 24 of the 25 chemicals.
Rossner et al. 2009
Phenol, 2-Chlorophenol, 4-Chlorophenol
Sargassum muticum
60C CaCl2 pretreat
L 4.6, 79, 251
1st - Uptake correlated with octanol-water partition coefficients, which suggests the importance of hydrophobicity.
Rubin et al. 2006
p-Nitrophenol Active carbons AC - L 90-185 - - CO2 gasification was much more effective for regeneration than other media.
Sabio et al. 2004
Trichloroethylene, Tetrachloroethylene
Active carbon fibers
AC - L 52-150, 130-390
- - Key attributes were micropore content (for capacity) and length of diffusion path.
Sakoda et al. 1987

REVIEW ARTICLE bioresources.com
Hubbe et al. (2014). “Petrochemicals biosorption,” BioResources 9(4), 7782-7925. 7915
Pollutant Sorbent
Dri
ed
, n
eve
r, h
eat
Mo
dif
icati
on
Iso
therm
be
st
fits
Adsorp. capac. (mg/g)
Rate
law
best
fit
Th
erm
od
yn
am
ics
Key Findings Author (year)
Phenol Active carbons from wood
AC H3PO4 627C 1027C
F 50-300 - - Phenol uptake depends on both porosity and chemistry details; esterification with the surface; COOH reduces pi interaction.
Salame & Ban-dosz 2003
Phenanthrene Natural organic matter
- - F 10-20 - - Lowest phenanthrene uptake on cellulose; highest on paraffinic matter
Salloum et al. 2002
2,4-Dichlorophenol Active carbon from corn cob
AC 700C L 18 2nd - Acidic pH favored adsorption; incomplete desorption indicated chemisorption.
Sathishkumar et al. 2009
Carbaryl Carbon from banana pith
AC ZnCl2 110C
L F
46 1st 2nd
- Highest uptake at pH=11, desorption complete with acetone.
Sathishkumar et al. 2008
Phenol, o-Chlorophenol, p-Chlorophenol, 2,4,6-Trichlorophen.
Polyamide hollow fibers with reactive green dye
- - - 146, 203, 194, 179
2nd - Decreasing sorption with increasing pH above 6; chemisorption may be rate-determining step; regeneration achieved.
Şenel et al. 2006
Refractory organics in 2ndary wastewater
Bio-activated carbon
- Innoc. F 9-16 - - Biofilm increased sorption capacity by a factor of four.
Seo et al. 1997
Dibenzothiophenes Active carbons AC 800C F 1-15 - - Micropores appeared to be the main site of adsorption.
Seredych & Bandosz 2010
Dibenzothiophenes; 4,6-Dimethyldibenz.
Active carbons AC 650, 800C
- 20, 33
- - Sulfur on the adsorbent promoted uptake of the sulfur-containing compounds.
Seredych & Bandosz 2011
2,4-Dichlorophenol, 2,4,5-Trichlorophen.
SW kraft fiber, & kraft lignin
not,
= 5 - 120-185 - Ex Drastic drop in sorption above pH=6; Lignin is mainly responsible for the interaction with wood pulp.
Severtson & Banerjee 1996
Dichloroethylene Active carbon fiber
AC Steam 830C
- 4-10 - - Reduced metal on the carbon enhanced dichloroethylene uptake.
Shen et al. 2006
o-Cresol, p-Nitrophenol
Fly ash FA Al(NO3)3 & FeCl3
- 3-5, 7-10
1st ID
- Somewhat faster sorption onto smaller particles; intraparticle diffusion; trivalent metal ions became bound to phenolates.
Singh & Rawat 1994a
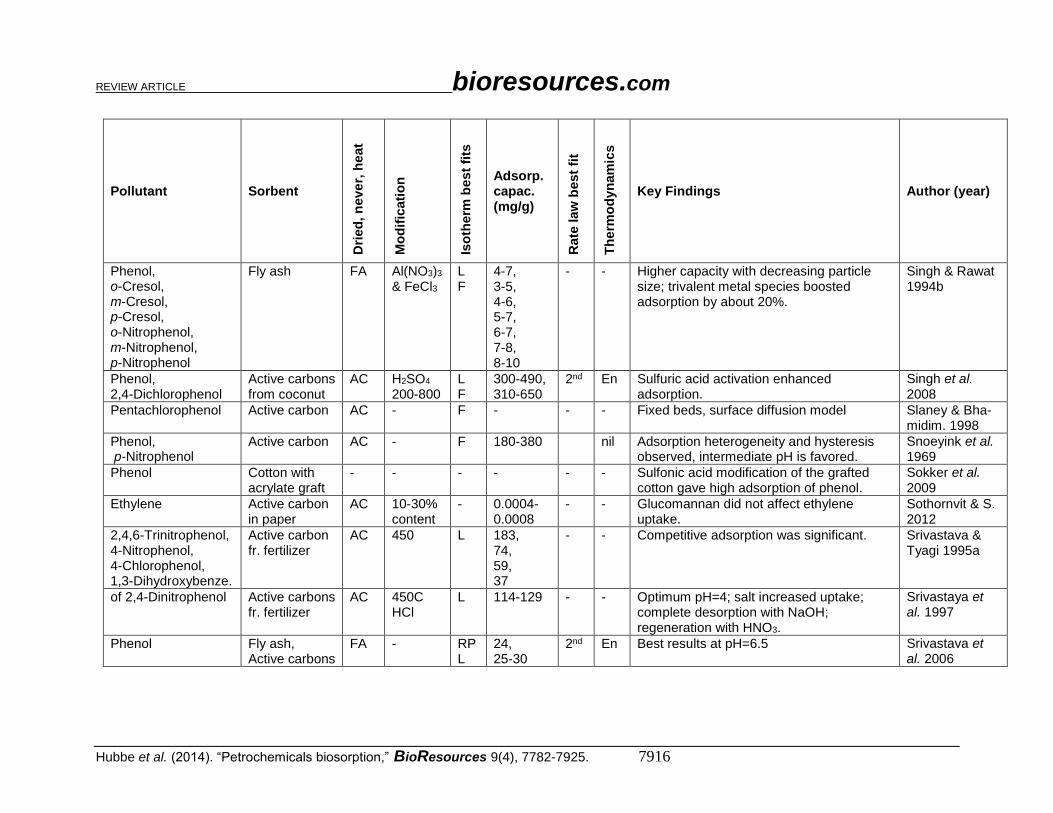
REVIEW ARTICLE bioresources.com
Hubbe et al. (2014). “Petrochemicals biosorption,” BioResources 9(4), 7782-7925. 7916
Pollutant Sorbent
Dri
ed
, n
eve
r, h
eat
Mo
dif
icati
on
Iso
therm
be
st
fits
Adsorp. capac. (mg/g)
Rate
law
best
fit
Th
erm
od
yn
am
ics
Key Findings Author (year)
Phenol, o-Cresol, m-Cresol, p-Cresol, o-Nitrophenol, m-Nitrophenol, p-Nitrophenol
Fly ash FA Al(NO3)3 & FeCl3
L F
4-7, 3-5, 4-6, 5-7, 6-7, 7-8, 8-10
- - Higher capacity with decreasing particle size; trivalent metal species boosted adsorption by about 20%.
Singh & Rawat 1994b
Phenol, 2,4-Dichlorophenol
Active carbons from coconut
AC H2SO4 200-800
L F
300-490, 310-650
2nd En Sulfuric acid activation enhanced adsorption.
Singh et al. 2008
Pentachlorophenol Active carbon AC - F - - - Fixed beds, surface diffusion model Slaney & Bha-midim. 1998
Phenol, p-Nitrophenol
Active carbon AC - F 180-380 nil Adsorption heterogeneity and hysteresis observed, intermediate pH is favored.
Snoeyink et al. 1969
Phenol Cotton with acrylate graft
- - - - - - Sulfonic acid modification of the grafted cotton gave high adsorption of phenol.
Sokker et al. 2009
Ethylene Active carbon in paper
AC 10-30% content
- 0.0004-0.0008
- - Glucomannan did not affect ethylene uptake.
Sothornvit & S. 2012
2,4,6-Trinitrophenol, 4-Nitrophenol, 4-Chlorophenol, 1,3-Dihydroxybenze.
Active carbon fr. fertilizer
AC 450 L 183, 74, 59, 37
- - Competitive adsorption was significant. Srivastava & Tyagi 1995a
of 2,4-Dinitrophenol Active carbons fr. fertilizer
AC 450C HCl
L 114-129 - - Optimum pH=4; salt increased uptake; complete desorption with NaOH; regeneration with HNO3.
Srivastaya et al. 1997
Phenol Fly ash, Active carbons
FA - RP L
24, 25-30
2nd En Best results at pH=6.5 Srivastava et al. 2006
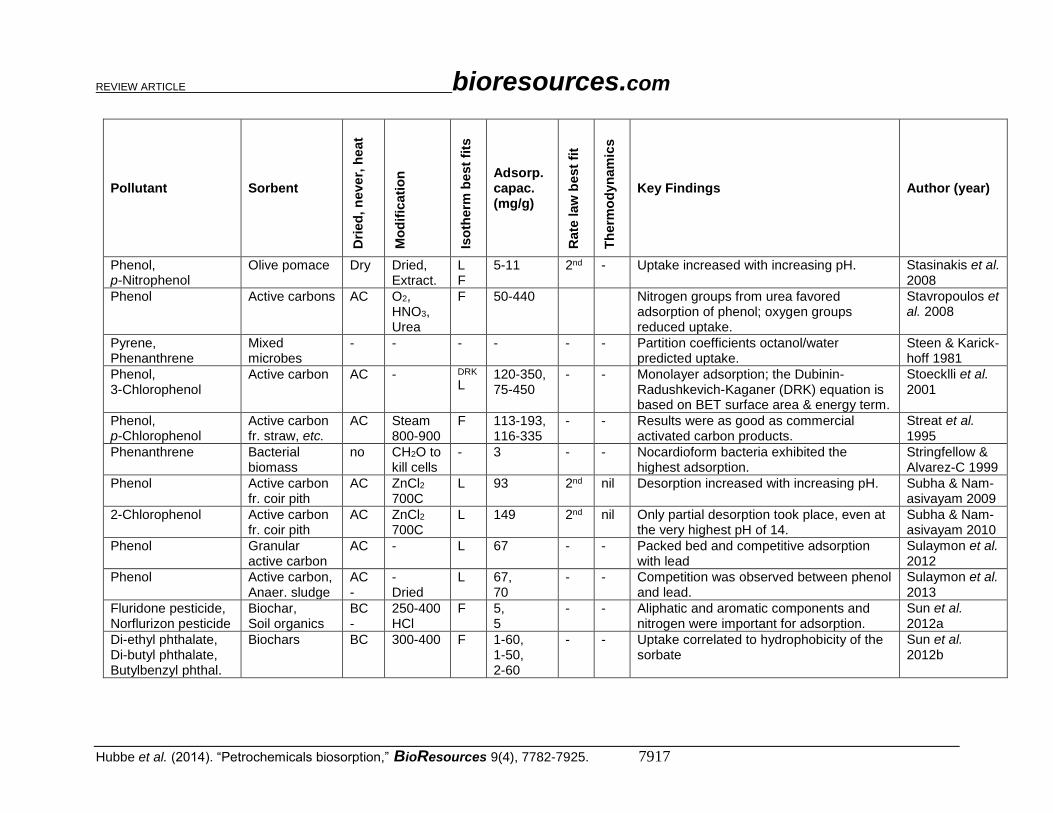
REVIEW ARTICLE bioresources.com
Hubbe et al. (2014). “Petrochemicals biosorption,” BioResources 9(4), 7782-7925. 7917
Pollutant Sorbent
Dri
ed
, n
eve
r, h
eat
Mo
dif
icati
on
Iso
therm
be
st
fits
Adsorp. capac. (mg/g)
Rate
law
best
fit
Th
erm
od
yn
am
ics
Key Findings Author (year)
Phenol, p-Nitrophenol
Olive pomace Dry Dried, Extract.
L F
5-11 2nd - Uptake increased with increasing pH. Stasinakis et al. 2008
Phenol Active carbons AC O2, HNO3, Urea
F 50-440 Nitrogen groups from urea favored adsorption of phenol; oxygen groups reduced uptake.
Stavropoulos et al. 2008
Pyrene, Phenanthrene
Mixed microbes
- - - - - - Partition coefficients octanol/water predicted uptake.
Steen & Karick-hoff 1981
Phenol, 3-Chlorophenol
Active carbon AC - DRK
L 120-350, 75-450
- - Monolayer adsorption; the Dubinin- Radushkevich-Kaganer (DRK) equation is based on BET surface area & energy term.
Stoecklli et al. 2001
Phenol, p-Chlorophenol
Active carbon fr. straw, etc.
AC Steam 800-900
F 113-193, 116-335
- - Results were as good as commercial activated carbon products.
Streat et al. 1995
Phenanthrene Bacterial biomass
no CH2O to kill cells
- 3 - - Nocardioform bacteria exhibited the highest adsorption.
Stringfellow & Alvarez-C 1999
Phenol Active carbon fr. coir pith
AC ZnCl2 700C
L 93 2nd nil Desorption increased with increasing pH. Subha & Nam-asivayam 2009
2-Chlorophenol Active carbon fr. coir pith
AC ZnCl2 700C
L 149 2nd nil Only partial desorption took place, even at the very highest pH of 14.
Subha & Nam-asivayam 2010
Phenol Granular active carbon
AC - L 67 - - Packed bed and competitive adsorption with lead
Sulaymon et al. 2012
Phenol Active carbon, Anaer. sludge
AC -
- Dried
L 67, 70
- - Competition was observed between phenol and lead.
Sulaymon et al. 2013
Fluridone pesticide, Norflurizon pesticide
Biochar, Soil organics
BC -
250-400 HCl
F 5, 5
- - Aliphatic and aromatic components and nitrogen were important for adsorption.
Sun et al. 2012a
Di-ethyl phthalate, Di-butyl phthalate, Butylbenzyl phthal.
Biochars BC 300-400 F 1-60, 1-50, 2-60
- - Uptake correlated to hydrophobicity of the sorbate
Sun et al. 2012b
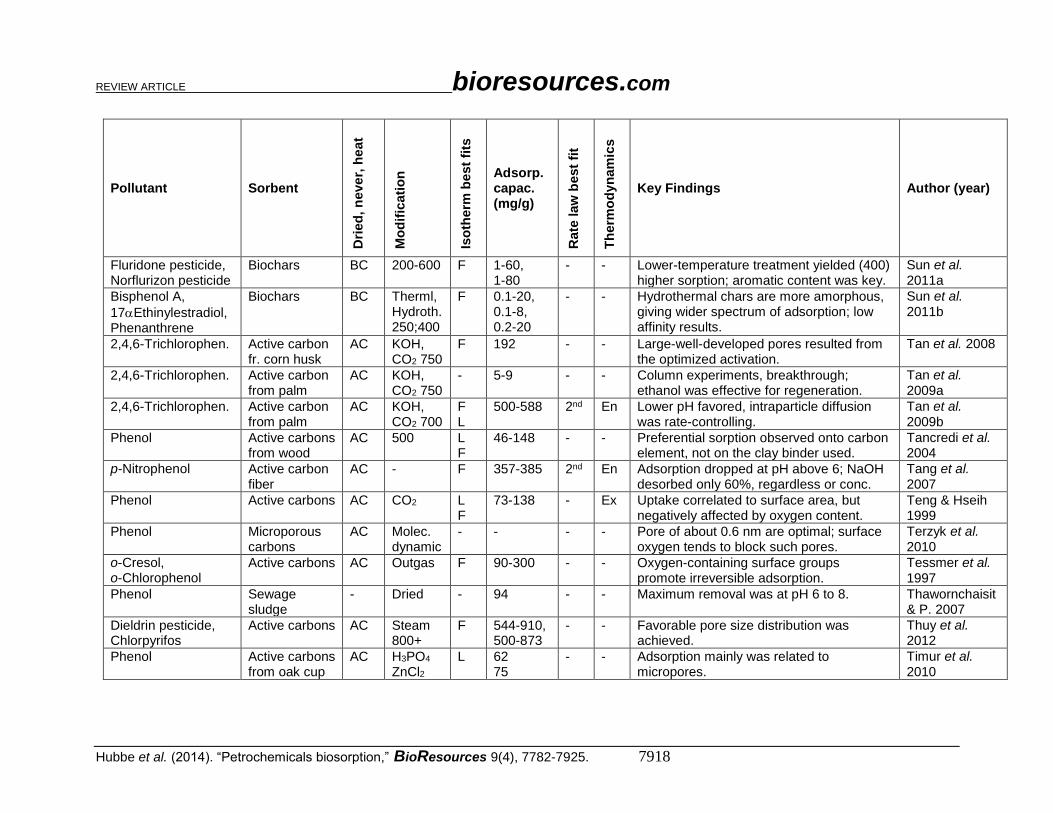
REVIEW ARTICLE bioresources.com
Hubbe et al. (2014). “Petrochemicals biosorption,” BioResources 9(4), 7782-7925. 7918
Pollutant Sorbent
Dri
ed
, n
eve
r, h
eat
Mo
dif
icati
on
Iso
therm
be
st
fits
Adsorp. capac. (mg/g)
Rate
law
best
fit
Th
erm
od
yn
am
ics
Key Findings Author (year)
Fluridone pesticide, Norflurizon pesticide
Biochars BC 200-600 F 1-60, 1-80
- - Lower-temperature treatment yielded (400) higher sorption; aromatic content was key.
Sun et al. 2011a
Bisphenol A,
17Ethinylestradiol, Phenanthrene
Biochars BC Therml, Hydroth. 250;400
F 0.1-20, 0.1-8, 0.2-20
- - Hydrothermal chars are more amorphous, giving wider spectrum of adsorption; low affinity results.
Sun et al. 2011b
2,4,6-Trichlorophen. Active carbon fr. corn husk
AC KOH, CO2 750
F 192 - - Large-well-developed pores resulted from the optimized activation.
Tan et al. 2008
2,4,6-Trichlorophen. Active carbon from palm
AC KOH, CO2 750
- 5-9 - - Column experiments, breakthrough; ethanol was effective for regeneration.
Tan et al. 2009a
2,4,6-Trichlorophen. Active carbon from palm
AC KOH, CO2 700
F L
500-588 2nd En Lower pH favored, intraparticle diffusion was rate-controlling.
Tan et al. 2009b
Phenol Active carbons from wood
AC 500 L F
46-148 - - Preferential sorption observed onto carbon element, not on the clay binder used.
Tancredi et al. 2004
p-Nitrophenol Active carbon fiber
AC - F 357-385 2nd En Adsorption dropped at pH above 6; NaOH desorbed only 60%, regardless or conc.
Tang et al. 2007
Phenol Active carbons AC CO2
L F
73-138 - Ex Uptake correlated to surface area, but negatively affected by oxygen content.
Teng & Hseih 1999
Phenol Microporous carbons
AC Molec. dynamic
- - - - Pore of about 0.6 nm are optimal; surface oxygen tends to block such pores.
Terzyk et al. 2010
o-Cresol, o-Chlorophenol
Active carbons AC Outgas F 90-300 - - Oxygen-containing surface groups promote irreversible adsorption.
Tessmer et al. 1997
Phenol Sewage sludge
- Dried - 94 - - Maximum removal was at pH 6 to 8. Thawornchaisit & P. 2007
Dieldrin pesticide, Chlorpyrifos
Active carbons AC Steam 800+
F 544-910, 500-873
- - Favorable pore size distribution was achieved.
Thuy et al. 2012
Phenol Active carbons from oak cup
AC H3PO4 ZnCl2
L 62 75
- - Adsorption mainly was related to micropores.
Timur et al. 2010
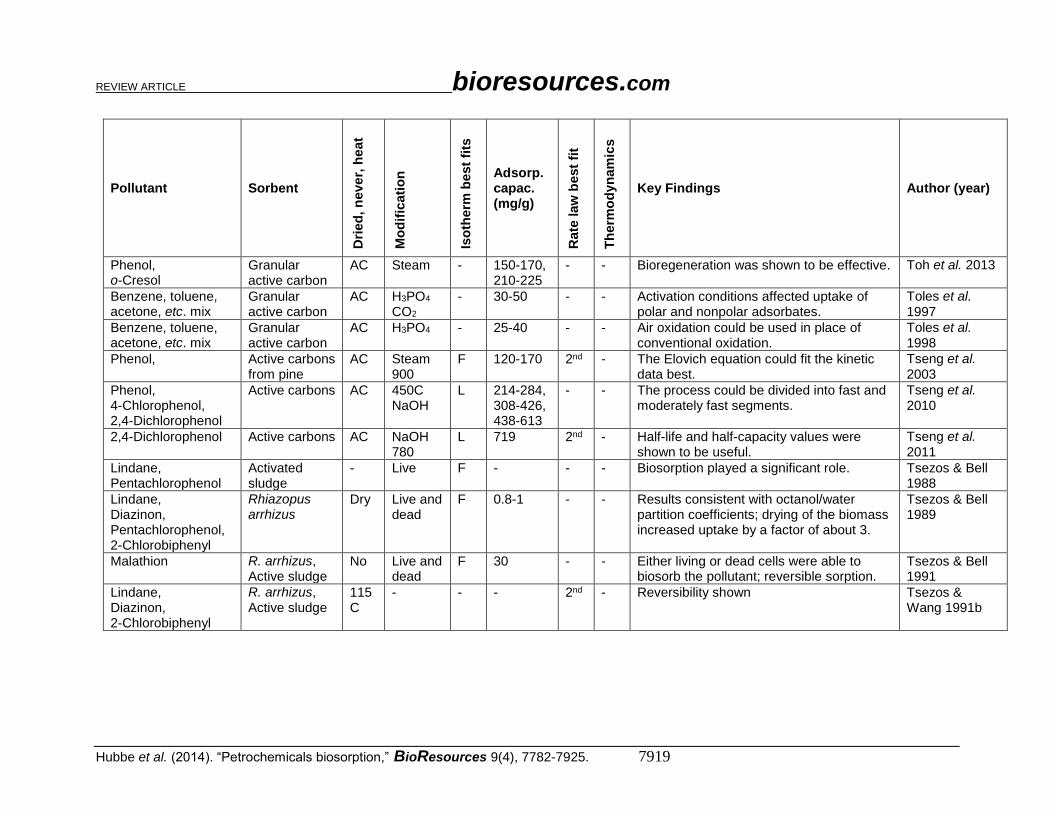
REVIEW ARTICLE bioresources.com
Hubbe et al. (2014). “Petrochemicals biosorption,” BioResources 9(4), 7782-7925. 7919
Pollutant Sorbent
Dri
ed
, n
eve
r, h
eat
Mo
dif
icati
on
Iso
therm
be
st
fits
Adsorp. capac. (mg/g)
Rate
law
best
fit
Th
erm
od
yn
am
ics
Key Findings Author (year)
Phenol, o-Cresol
Granular active carbon
AC Steam - 150-170, 210-225
- - Bioregeneration was shown to be effective. Toh et al. 2013
Benzene, toluene, acetone, etc. mix
Granular active carbon
AC H3PO4 CO2
- 30-50 - - Activation conditions affected uptake of polar and nonpolar adsorbates.
Toles et al. 1997
Benzene, toluene, acetone, etc. mix
Granular active carbon
AC H3PO4
- 25-40 - - Air oxidation could be used in place of conventional oxidation.
Toles et al. 1998
Phenol,
Active carbons from pine
AC Steam 900
F 120-170
2nd - The Elovich equation could fit the kinetic data best.
Tseng et al. 2003
Phenol, 4-Chlorophenol, 2,4-Dichlorophenol
Active carbons AC 450C NaOH
L 214-284, 308-426, 438-613
- - The process could be divided into fast and moderately fast segments.
Tseng et al. 2010
2,4-Dichlorophenol Active carbons AC NaOH 780
L 719 2nd - Half-life and half-capacity values were shown to be useful.
Tseng et al. 2011
Lindane, Pentachlorophenol
Activated sludge
- Live F - - - Biosorption played a significant role. Tsezos & Bell 1988
Lindane, Diazinon, Pentachlorophenol, 2-Chlorobiphenyl
Rhiazopus arrhizus
Dry Live and dead
F 0.8-1 - - Results consistent with octanol/water partition coefficients; drying of the biomass increased uptake by a factor of about 3.
Tsezos & Bell 1989
Malathion R. arrhizus, Active sludge
No Live and dead
F 30 - - Either living or dead cells were able to biosorb the pollutant; reversible sorption.
Tsezos & Bell 1991
Lindane, Diazinon, 2-Chlorobiphenyl
R. arrhizus, Active sludge
115C
- - - 2nd - Reversibility shown Tsezos & Wang 1991b

REVIEW ARTICLE bioresources.com
Hubbe et al. (2014). “Petrochemicals biosorption,” BioResources 9(4), 7782-7925. 7920
Pollutant Sorbent
Dri
ed
, n
eve
r, h
eat
Mo
dif
icati
on
Iso
therm
be
st
fits
Adsorp. capac. (mg/g)
Rate
law
best
fit
Th
erm
od
yn
am
ics
Key Findings Author (year)
Tetrachloroethylene, Trichloroethylene, 1,2-Dichloroethylen, 1,1-Dichloroethane, Carbontetrachloride, Trichloroethane, Chloroform
Granular active carbons
AC - F 1-100 - - Pores smaller than 2 nm had a dominant effect; humic substances decreased sorption by about 10-20%.
Urano et al 1991
2-Methylpehnol,
Active carbons AC Anoxic, Oxidiz.
- 79-142, 105-288
- - Irreversible adsorption (up to 288 mg/g) was proportional to surface area.
Uranowski et al. 1998
Phenols mixture Granular active carbon
AC - L F
1.5 1st - Column experiments Vázquez et al. 2007
2-Methylphenol, 2-Chlorophenol, 2-Ethylphenol
Granular active carbon
AC Anoxic, Oxidiz.
F 100-300, 250-400
- - Oxygenation increased the adsorption capacity.
Vidic et al. 1994
Phenol, Analine, Nitrobenzene
Active carbons AC HNO3 H2
L 103-179, 105-214, 197-406
- - The aminated carbon exhibited the highest sorption capacity.
Villacanas et al. 2006
Phenol Peat, Fly ash, Bentonite
103, - -
- F, L
0.2, 40
- - Optimum pH 3 to 5. Viraraghavan & Alfaro 1998
2,4,6-Trinitrophenol, 4-Nitrophenol, 2,4-Dinitrophenol,
Acrylate-graft cotton
- Glycicyl meth-acrylate
L F
56-116, 31-65, 56-108
2nd - Poor adsorption at pH 2.3 in most cases; most data are for pH 11; glycidic groups favored uptake of hydrophobic compound.
Vismara et al. 2009
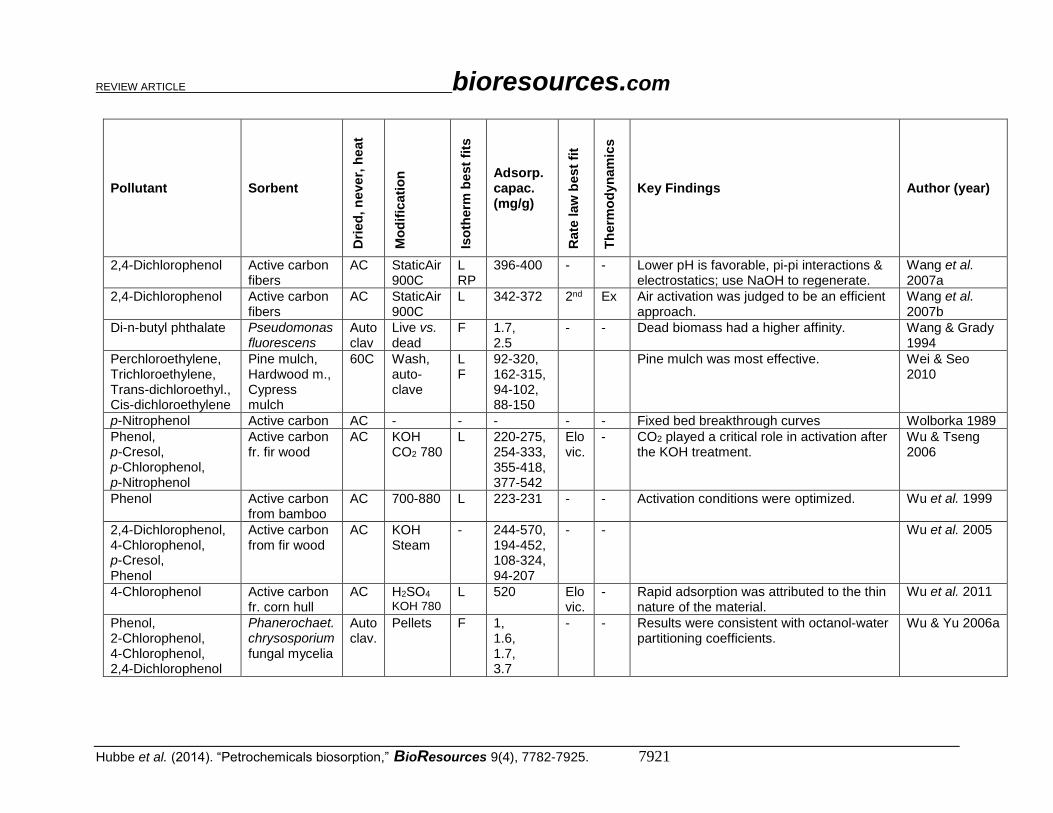
REVIEW ARTICLE bioresources.com
Hubbe et al. (2014). “Petrochemicals biosorption,” BioResources 9(4), 7782-7925. 7921
Pollutant Sorbent
Dri
ed
, n
eve
r, h
eat
Mo
dif
icati
on
Iso
therm
be
st
fits
Adsorp. capac. (mg/g)
Rate
law
best
fit
Th
erm
od
yn
am
ics
Key Findings Author (year)
2,4-Dichlorophenol Active carbon fibers
AC StaticAir 900C
L RP
396-400 - - Lower pH is favorable, pi-pi interactions & electrostatics; use NaOH to regenerate.
Wang et al. 2007a
2,4-Dichlorophenol Active carbon fibers
AC StaticAir 900C
L 342-372 2nd Ex Air activation was judged to be an efficient approach.
Wang et al. 2007b
Di-n-butyl phthalate Pseudomonas fluorescens
Auto clav
Live vs. dead
F 1.7, 2.5
- - Dead biomass had a higher affinity. Wang & Grady 1994
Perchloroethylene, Trichloroethylene, Trans-dichloroethyl., Cis-dichloroethylene
Pine mulch, Hardwood m., Cypress mulch
60C Wash, auto-clave
L F
92-320, 162-315, 94-102, 88-150
Pine mulch was most effective. Wei & Seo 2010
p-Nitrophenol Active carbon AC - - - - - Fixed bed breakthrough curves Wolborka 1989
Phenol, p-Cresol, p-Chlorophenol, p-Nitrophenol
Active carbon fr. fir wood
AC KOH CO2 780
L 220-275, 254-333, 355-418, 377-542
Elo vic.
- CO2 played a critical role in activation after the KOH treatment.
Wu & Tseng 2006
Phenol Active carbon from bamboo
AC 700-880 L 223-231 - - Activation conditions were optimized. Wu et al. 1999
2,4-Dichlorophenol, 4-Chlorophenol, p-Cresol, Phenol
Active carbon from fir wood
AC KOH Steam
- 244-570, 194-452, 108-324, 94-207
- - Wu et al. 2005
4-Chlorophenol Active carbon fr. corn hull
AC H2SO4 KOH 780
L 520 Elo vic.
- Rapid adsorption was attributed to the thin nature of the material.
Wu et al. 2011
Phenol, 2-Chlorophenol, 4-Chlorophenol, 2,4-Dichlorophenol
Phanerochaet. chrysosporium fungal mycelia
Auto clav.
Pellets F 1, 1.6, 1.7, 3.7
- - Results were consistent with octanol-water partitioning coefficients.
Wu & Yu 2006a

REVIEW ARTICLE bioresources.com
Hubbe et al. (2014). “Petrochemicals biosorption,” BioResources 9(4), 7782-7925. 7922
Pollutant Sorbent
Dri
ed
, n
eve
r, h
eat
Mo
dif
icati
on
Iso
therm
be
st
fits
Adsorp. capac. (mg/g)
Rate
law
best
fit
Th
erm
od
yn
am
ics
Key Findings Author (year)
2,4-Dichlorophenol Phanerochaet. chrysosporium fungal mycelia
Auto clav.
Pellets F L
4.1 2nd ID
Ex Best pH=5, intraparticle diffusion Wu & Yu 2006b
2,4-Dichlorophenol Phanerochaet. chrysosporium fungal mycelia
Auto clav.
Immob-ilized
L F
4-7 - - Reversible with distilled water Wu et al. 2007
2,4-Dichlorophenol Phanerochaet. chrysosporium fungal mycelia
Auto clav.
Immob-ilized
- 5-12 - - Fixed bed, breakthrough models, the bed could be reused five times with up to 68% desorption.
Wu & Yu 2008
1-Naphthol MW carbon nanotubes
- KMnO4, NaOH, H2SO4
- 20-1200 - - Oxidative polymerization of the adsorbate; surface oxygen groups covalently bond; adsorption increased up to pH=7, then fell.
Wu et al. 2012a
Phenol Active carbon (N-enriched)
AC KOH 850C
L 207 2nd - Nitrogen-enriched activated carbon was effective for adsorption of phenol.
Wu et al. 2012b
Phenol, 2-Chlorophenol, 4-Chlorophenol, 2-4-Dichlorophenol
MW caron nanotubes
- Zero-valent Fe
L 4, 14, 14, 20
- - Chlorine atoms on nanotubes increase adsorption capacity.
Xu et al. 2012
Organochlorines in pulp bleach effluent
Sewage sludge
Auto clav.
- L F
7.5 as Cl - - Adsorption was not dependent on cell viability.
Yan & Allen 1994
Naphthalene, Phenanthrene, Pyrene
Fullerenes, SW C nanotu., MW C nanot.
- - F 1-50, 10-40, 10-45
- - Polanyi model was used to fit the isotherms.
Yang et al. 2006
Triphenyltin Brevibacillus brevis
live Cultured - - - - Endocrine disruptor was biodegraded to certain byproducts; minor pH effects.
Ye et al. 2013
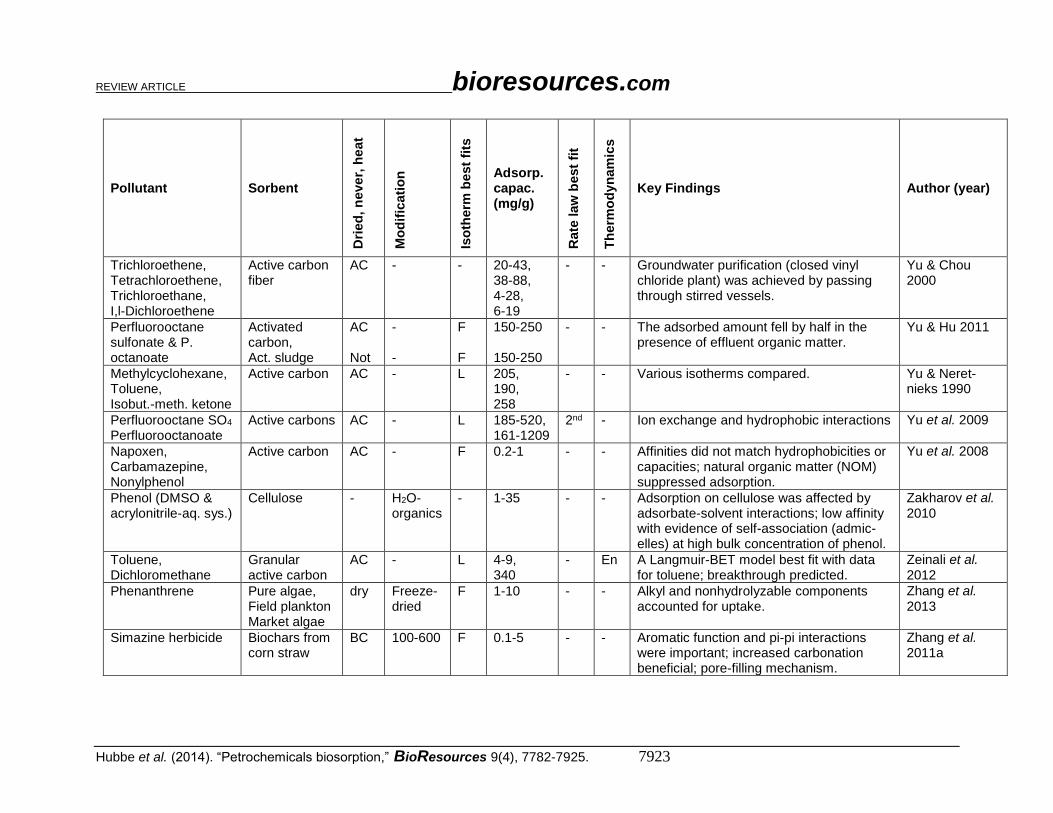
REVIEW ARTICLE bioresources.com
Hubbe et al. (2014). “Petrochemicals biosorption,” BioResources 9(4), 7782-7925. 7923
Pollutant Sorbent
Dri
ed
, n
eve
r, h
eat
Mo
dif
icati
on
Iso
therm
be
st
fits
Adsorp. capac. (mg/g)
Rate
law
best
fit
Th
erm
od
yn
am
ics
Key Findings Author (year)
Trichloroethene, Tetrachloroethene, Trichloroethane, I,l-Dichloroethene
Active carbon fiber
AC - - 20-43, 38-88, 4-28, 6-19
- - Groundwater purification (closed vinyl chloride plant) was achieved by passing through stirred vessels.
Yu & Chou 2000
Perfluorooctane sulfonate & P. octanoate
Activated carbon, Act. sludge
AC Not
- -
F F
150-250 150-250
- - The adsorbed amount fell by half in the presence of effluent organic matter.
Yu & Hu 2011
Methylcyclohexane, Toluene, Isobut.-meth. ketone
Active carbon AC - L 205, 190, 258
- - Various isotherms compared. Yu & Neret-nieks 1990
Perfluorooctane SO4 Perfluorooctanoate
Active carbons AC - L 185-520, 161-1209
2nd - Ion exchange and hydrophobic interactions Yu et al. 2009
Napoxen, Carbamazepine, Nonylphenol
Active carbon AC - F 0.2-1 - - Affinities did not match hydrophobicities or capacities; natural organic matter (NOM) suppressed adsorption.
Yu et al. 2008
Phenol (DMSO & acrylonitrile-aq. sys.)
Cellulose - H2O-organics
- 1-35 - - Adsorption on cellulose was affected by adsorbate-solvent interactions; low affinity with evidence of self-association (admic-elles) at high bulk concentration of phenol.
Zakharov et al. 2010
Toluene, Dichloromethane
Granular active carbon
AC - L 4-9, 340
- En A Langmuir-BET model best fit with data for toluene; breakthrough predicted.
Zeinali et al. 2012
Phenanthrene Pure algae, Field plankton Market algae
dry Freeze-dried
F 1-10 - - Alkyl and nonhydrolyzable components accounted for uptake.
Zhang et al. 2013
Simazine herbicide Biochars from corn straw
BC 100-600 F 0.1-5 - - Aromatic function and pi-pi interactions were important; increased carbonation beneficial; pore-filling mechanism.
Zhang et al. 2011a
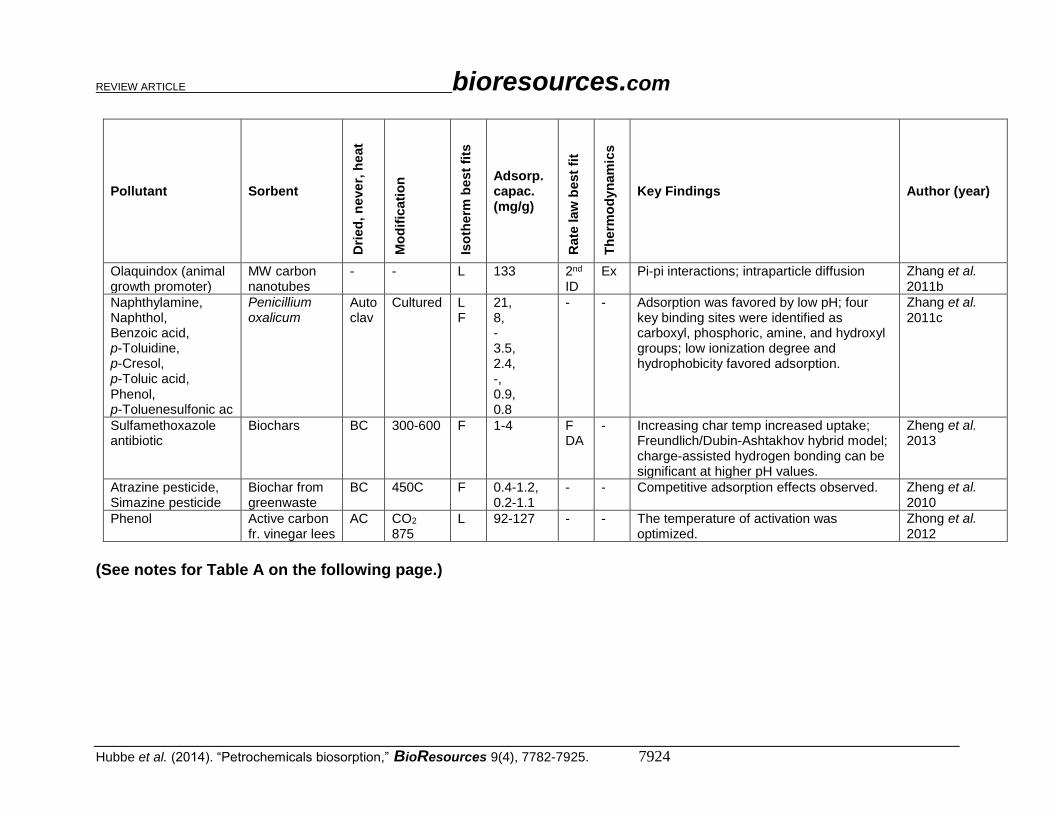
REVIEW ARTICLE bioresources.com
Hubbe et al. (2014). “Petrochemicals biosorption,” BioResources 9(4), 7782-7925. 7924
Pollutant Sorbent
Dri
ed
, n
eve
r, h
eat
Mo
dif
icati
on
Iso
therm
be
st
fits
Adsorp. capac. (mg/g)
Rate
law
best
fit
Th
erm
od
yn
am
ics
Key Findings Author (year)
Olaquindox (animal growth promoter)
MW carbon nanotubes
- - L 133 2nd ID
Ex Pi-pi interactions; intraparticle diffusion Zhang et al. 2011b
Naphthylamine, Naphthol, Benzoic acid, p-Toluidine, p-Cresol, p-Toluic acid, Phenol, p-Toluenesulfonic ac
Penicillium oxalicum
Auto clav
Cultured L F
21, 8, - 3.5, 2.4, -, 0.9, 0.8
- - Adsorption was favored by low pH; four key binding sites were identified as carboxyl, phosphoric, amine, and hydroxyl groups; low ionization degree and hydrophobicity favored adsorption.
Zhang et al. 2011c
Sulfamethoxazole antibiotic
Biochars BC 300-600 F 1-4 F DA
- Increasing char temp increased uptake; Freundlich/Dubin-Ashtakhov hybrid model; charge-assisted hydrogen bonding can be significant at higher pH values.
Zheng et al. 2013
Atrazine pesticide, Simazine pesticide
Biochar from greenwaste
BC 450C F 0.4-1.2, 0.2-1.1
- - Competitive adsorption effects observed. Zheng et al. 2010
Phenol Active carbon fr. vinegar lees
AC CO2 875
L 92-127 - - The temperature of activation was optimized.
Zhong et al. 2012
(See notes for Table A on the following page.)
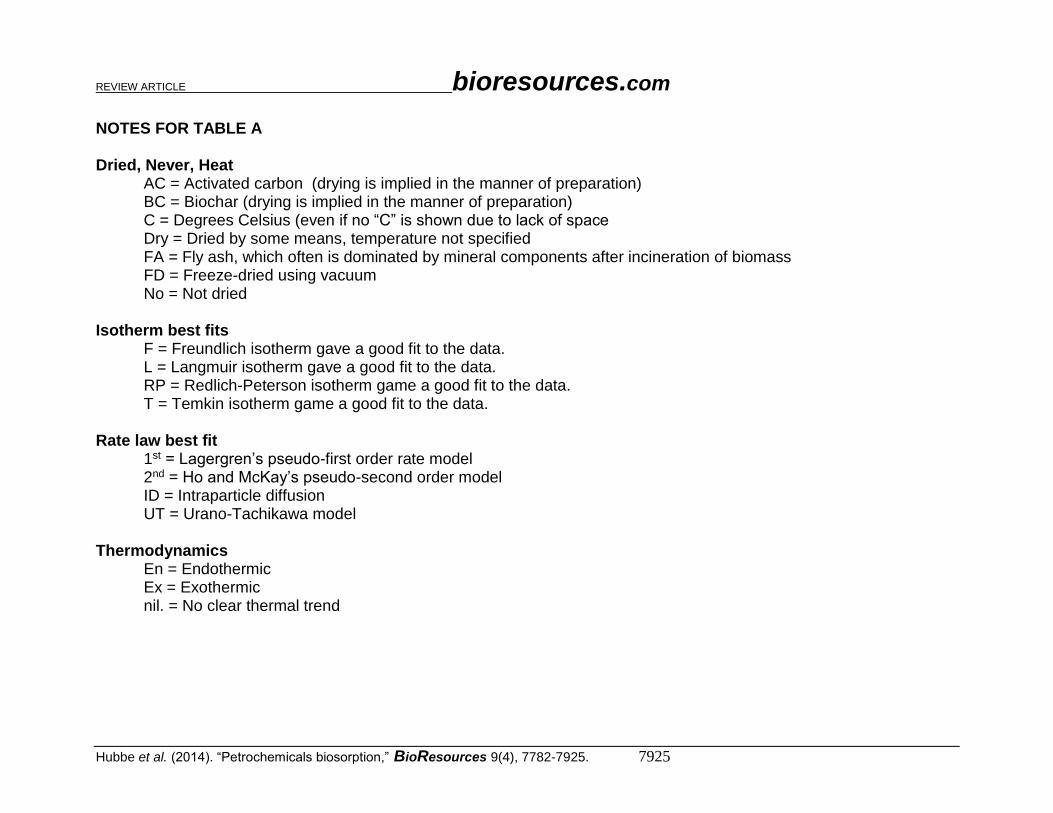
REVIEW ARTICLE bioresources.com
Hubbe et al. (2014). “Petrochemicals biosorption,” BioResources 9(4), 7782-7925. 7925
NOTES FOR TABLE A Dried, Never, Heat AC = Activated carbon (drying is implied in the manner of preparation) BC = Biochar (drying is implied in the manner of preparation) C = Degrees Celsius (even if no “C” is shown due to lack of space
Dry = Dried by some means, temperature not specified FA = Fly ash, which often is dominated by mineral components after incineration of biomass FD = Freeze-dried using vacuum No = Not dried
Isotherm best fits F = Freundlich isotherm gave a good fit to the data. L = Langmuir isotherm gave a good fit to the data.
RP = Redlich-Peterson isotherm game a good fit to the data. T = Temkin isotherm game a good fit to the data.
Rate law best fit 1st = Lagergren’s pseudo-first order rate model 2nd = Ho and McKay’s pseudo-second order model ID = Intraparticle diffusion UT = Urano-Tachikawa model Thermodynamics En = Endothermic Ex = Exothermic nil. = No clear thermal trend
Related Documents