REVERSING

Welcome message from author
This document is posted to help you gain knowledge. Please leave a comment to let me know what you think about it! Share it to your friends and learn new things together.
Transcript
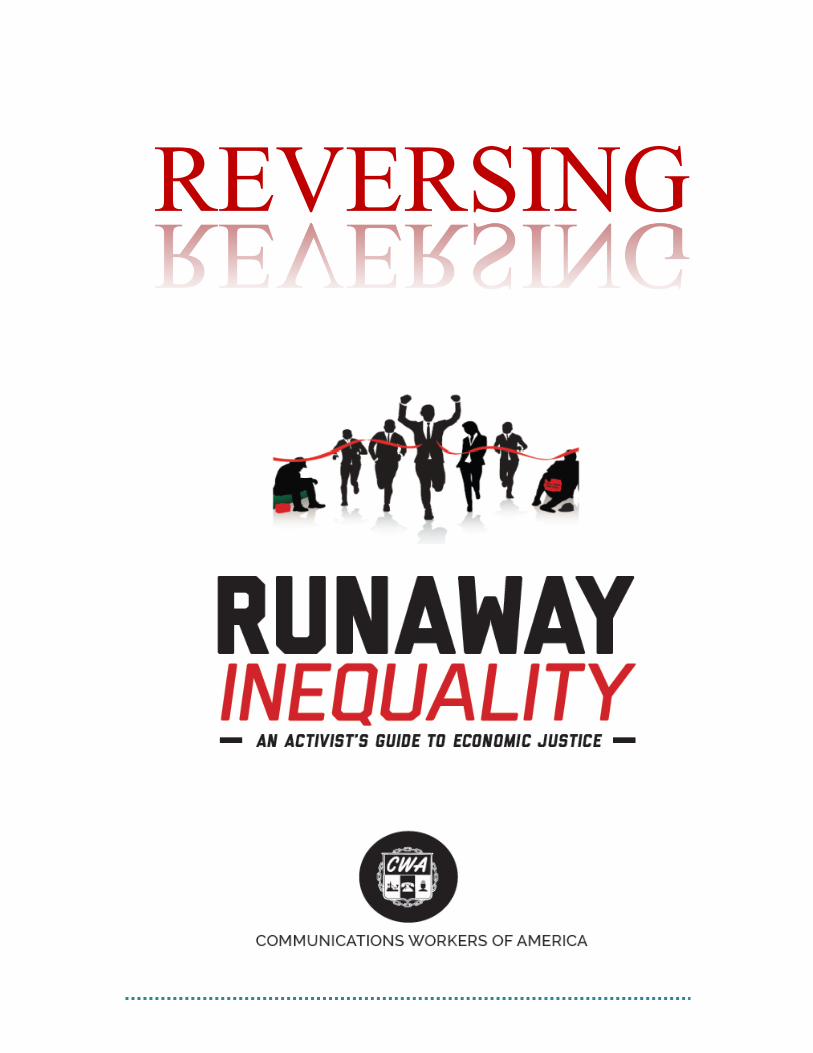
REVERSING
Les Leopold, Executive Director at Labor Institute Charlie Albanetti, Communications Director at Citizen Action of NY Margarita Hernandez, Deputy Director - Political/Legislative at CWA District 1 NY Kris Raab, Research Analyst at CWA revised 8/17/2016
i
TABLE OF CONTENTS INTRODUCTION 1
TASK ................................................................................................................................................. 1
ACTIVITY 1: SOCIAL MOVEMENTS, SOCIAL CHANGE 3 TASK 1: TIMELINE OF SOCIAL MOVEMENTS .................................................................................... 3
Timeline of (Some) Important American Social Movements ....................................................... 4 Unions in the Public and Private Sectors ...................................................................................... 5
TASK 2: WHAT A MOVEMENT LOOKS LIKE ...................................................................................... 6 New Deal Era Victories (1930’s) ................................................................................................... 7 Civil Rights and Great Society Era (1960’s) .................................................................................. 9
ACTIVITY 2: THE POWELL MEMO 13 TASK: LEARNING FROM THE POWELL MEMO ................................................................................ 13
The Powell Memo ...................................................................................................................... 14 Powell’s Strategy: Transform Ideas ........................................................................................... 15 Powell’s Strategy: Cultivate Political Power .............................................................................. 16
ACTIVITY 3: INTRODUCTION TO THE CEO-‐TO-‐WORKER WAGE GAP AND THE WEALTH GAP 19 TASK 1: MEASURE THE WAGE GAP ................................................................................................ 19 TASK 2: AMERICANS UNDERESTIMATE THE WAGE GAP. IS THIS AN ORGANIZING OPPORTUNITY? ....................................................................................................................................................... 20
Top 100 CEOs vs. Average Workers ........................................................................................... 21 The Wage Gap Has Skyrocketed ................................................................................................ 22 Wage Gap Is Much Bigger Than We Think ................................................................................ 23 What Americans Think the Pay Gap Should Be ......................................................................... 24
TASK 3A: INCOME VS. WEALTH ..................................................................................................... 25 TASK 3B: THE WEALTH GAP BY RACIAL AND ETHNIC GROUP ........................................................ 26
Differences in Home Ownership ................................................................................................ 27 Differences in Wealth by Group ................................................................................................. 28 Effects of Education on Wealth ................................................................................................. 29 Rising Wealth Gap by Group ...................................................................................................... 30 Differences in Poverty by Group ................................................................................................ 31
ACTIVITY 4: THE PRODUCTIVITY AND WAGE GAP 33 TASK 1: WHY DID WORKERS’ WAGES AND PRODUCTIVITY SPLIT APART? .................................... 33 TASK 2: UNDERSTANDING FINANCIALIZATION .............................................................................. 35 FINANCIAL STRIP-‐MINING VIDEO, SEGMENT #1 ............................................................................ 36 TASK 3: CEO STOCK INCENTIVES .................................................................................................... 43 FINANCIAL STRIP-‐MINING VIDEO SEGMENT #2 ............................................................................. 44
ii
ACTIVITY 5: HOW DOES FINANCIAL STRIP-‐MINING AFFECT US? 49 TASK 1: HOW DOES FINANCIAL STRIP-‐MINING AFFECT YOU PERSONALLY? ................................. 49 TASK 2: HOW DOES FINANCIAL STRIP-‐MINING AFFECT OUR WORKPLACES & COMMUNITIES? ... 50
U.S. CEO-‐to-‐Worker Wage Gap Dwarfs Rest of the World ........................................................ 51 Median Wealth in the U.S. Is Low .............................................................................................. 52 U.S. Has 2nd Highest Rate of Children Living in Poverty ............................................................. 53 Half of Americans Stay in the Same Economic Class as Their Parents ....................................... 54 Climate Change Hits Hardest for the Most Vulnerable .............................................................. 55 Highly Consolidated Assets Make Some Banks “Too Big to Fail” ............................................... 56 Student Loan Debt ..................................................................................................................... 57 Gender Wage Gap ..................................................................................................................... 58
TASK 3: FINANCIAL STRIP-‐MINING VIDEO SEGMENT #3 ................................................................ 59
ACTIVITY 6: INSTITUTIONAL RACISM HELPS THE 1% STAY IN POWER 63 TASK 1: WHAT IS RACE? ................................................................................................................. 63
The Creation of Race .................................................................................................................. 64 An Example of “Race Science” Run Wild .................................................................................... 65
TASK 2: INSTITUTIONAL RACISM IN U.S. HISTORY ......................................................................... 67 Slaves, Servants, Laborers Rebel in 1675 ................................................................................... 68 Woodrow Wilson Re-‐Segregates the Federal Government ........................................................ 69 Railroad Companies & Chinese Laborers ................................................................................... 70 Mexican Migrants Used as Disposable Labor by U.S Corporate Agriculture .............................. 71
TASK 3: LEGACIES OF INSTITUTIONAL RACISM .............................................................................. 72 TASK 4: INSTITUTIONAL RACISM IN THE 21ST CENTURY ................................................................. 73
Segregated Housing Reinforces Inequity ................................................................................... 74 Voter Suppression ...................................................................................................................... 75 6 Million People Disenfranchised ............................................................................................... 76 Disproportionate Drug Sentencing ............................................................................................ 77 Disparate Effects on Health ....................................................................................................... 78 Schools Are as Segregated Now as in 1968 ............................................................................... 79
ACTIVITY 7: TAKING ON WALL STREET TO REVERSE RUNAWAY INEQUALITY 81 TASK ............................................................................................................................................... 81
ACTIVITY 8: TIME FOR ACTION! 83
ACTIVITY 9: NEXT STEPS 85 TASK 1 ............................................................................................................................................ 85 TASK 2 ............................................................................................................................................ 85 TASK 3 ............................................................................................................................................ 86
APPENDIX: TIMELINE OF (SOME) IMPORTANT AMERICAN SOCIAL MOVEMENTS 89
Introduction
1
INTRODUCTION Task
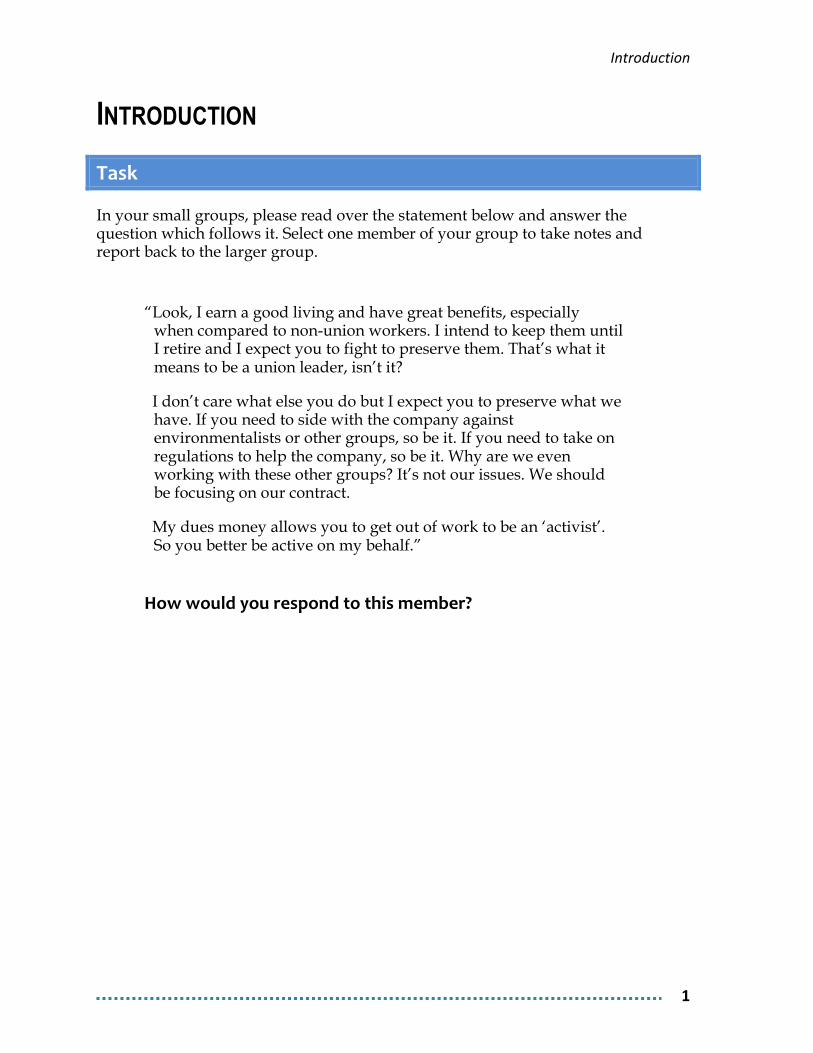
In your small groups, please read over the statement below and answer the question which follows it. Select one member of your group to take notes and report back to the larger group.
“Look, I earn a good living and have great benefits, especially when compared to non-union workers. I intend to keep them until I retire and I expect you to fight to preserve them. That’s what it means to be a union leader, isn’t it?
I don’t care what else you do but I expect you to preserve what we have. If you need to side with the company against environmentalists or other groups, so be it. If you need to take on regulations to help the company, so be it. Why are we even working with these other groups? It’s not our issues. We should be focusing on our contract.
My dues money allows you to get out of work to be an ‘activist’. So you better be active on my behalf.”
How would you respond to this member?

Activity 1
3
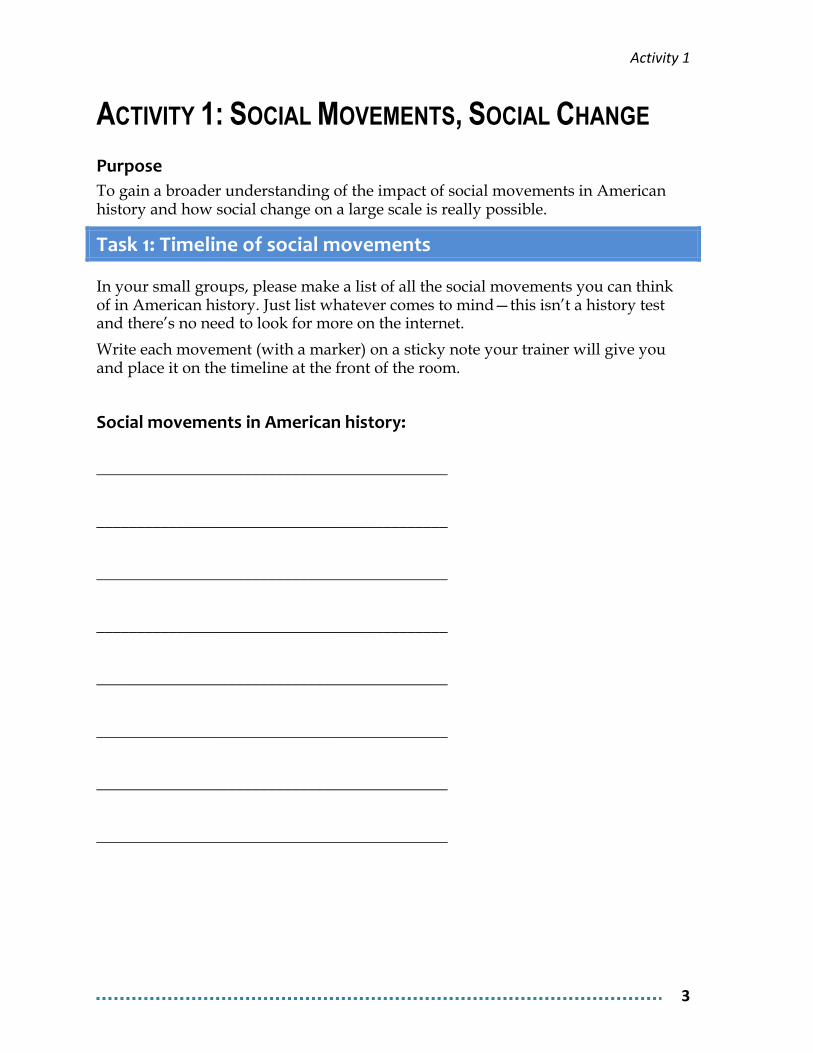
ACTIVITY 1: SOCIAL MOVEMENTS, SOCIAL CHANGE Purpose To gain a broader understanding of the impact of social movements in American history and how social change on a large scale is really possible.
Task 1: Timeline of social movements
In your small groups, please make a list of all the social movements you can think of in American history. Just list whatever comes to mind—this isn’t a history test and there’s no need to look for more on the internet.
Write each movement (with a marker) on a sticky note your trainer will give you and place it on the timeline at the front of the room.
Social movements in American history:
____________________________________________
____________________________________________
____________________________________________
____________________________________________
____________________________________________
____________________________________________
____________________________________________
____________________________________________
Activity 1
4
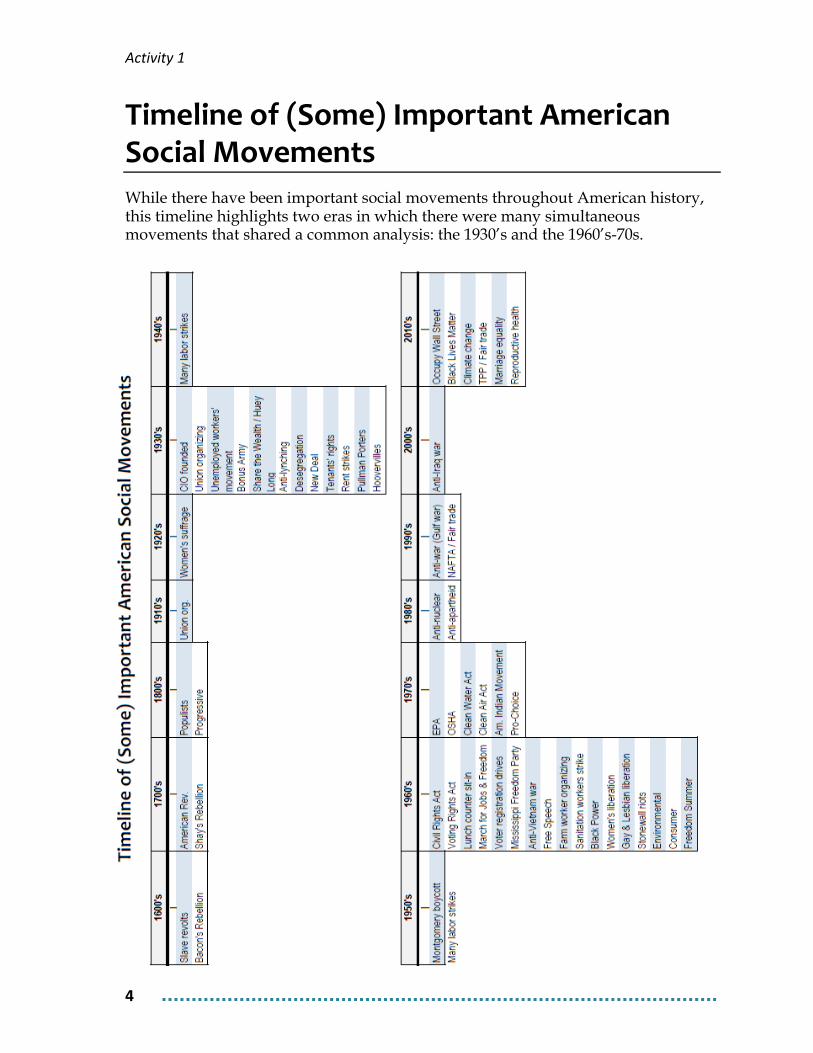
Timeline of (Some) Important American Social Movements While there have been important social movements throughout American history, this timeline highlights two eras in which there were many simultaneous movements that shared a common analysis: the 1930’s and the 1960’s-70s.
Activity 1
5
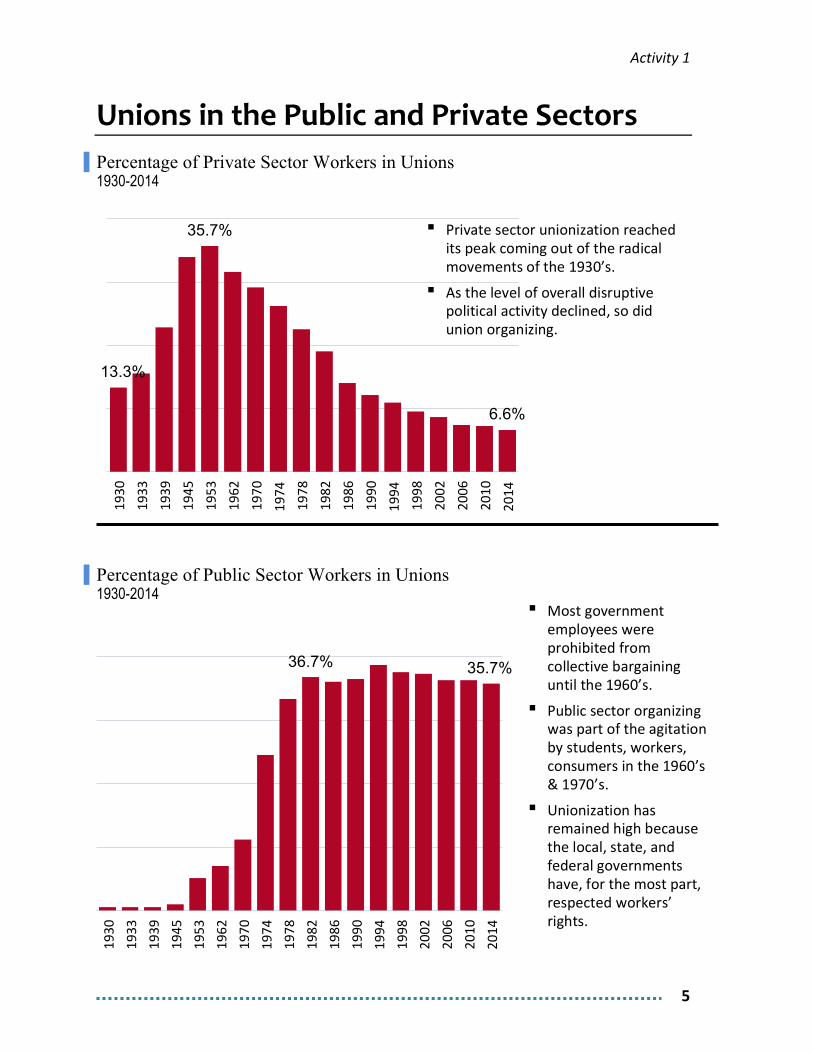
Unions in the Public and Private Sectors Percentage of Private Sector Workers in Unions 1930-2014
Percentage of Public Sector Workers in Unions 1930-2014
36.7% 35.7%
1930
1933
1939
1945
1953
1962
1970
1974
1978
1982
1986
1990
1994
1998
2002
2006
2010
2014
13.3%
35.7%
6.6%
1930
1933
1939
1945
1953
1962
1970
1974
1978
1982
1986
1990
1994
1998
2002
2006
2010
2014
▪ Private sector unionization reached its peak coming out of the radical movements of the 1930’s.
▪ As the level of overall disruptive political activity declined, so did union organizing.
▪ Most government employees were prohibited from collective bargaining until the 1960’s.
▪ Public sector organizing was part of the agitation by students, workers, consumers in the 1960’s & 1970’s.
▪ Unionization has remained high because the local, state, and federal governments have, for the most part, respected workers’ rights.
Activity 1
6
Task 2: What a movement looks like
Social justice movements in the 1930’s and 1960’s gave rise to some of our biggest progressive victories, like the 8-hour day and the Voting Rights Act. Mass uprisings and disruptive and confrontational tactics brought profound change.
Movements happen when individuals get outside their issue silos and when organizations look beyond their day-to-day work.
Movements happen when regular people “rise up in anger and hope, defy the rules that ordinarily govern their lives, and, by doing so, disrupt the workings of the institutions in which they are enmeshed.” (Francis Fox Piven, Poor People’s Movements)
In your small group, please review pages 7-10 and answer the question below.
What commonalities do you see between the tactics of the 1930’s and those of the 1960’s?
Movements happen when regular people rise up and defy the rules that ordinarily govern their lives.
Activity 1
7
New Deal Era Victories (1930’s)
Victories ▪ National Labor Relations Act (gave workers the right to organize our own
unions and act collectively)
▪ Social Security
▪ Unemployment insurance
▪ Child labor abolished
▪ 40-hour workweek
▪ Minimum wage
▪ Regulation of industries
▪ G.I. Bill
Campaigns
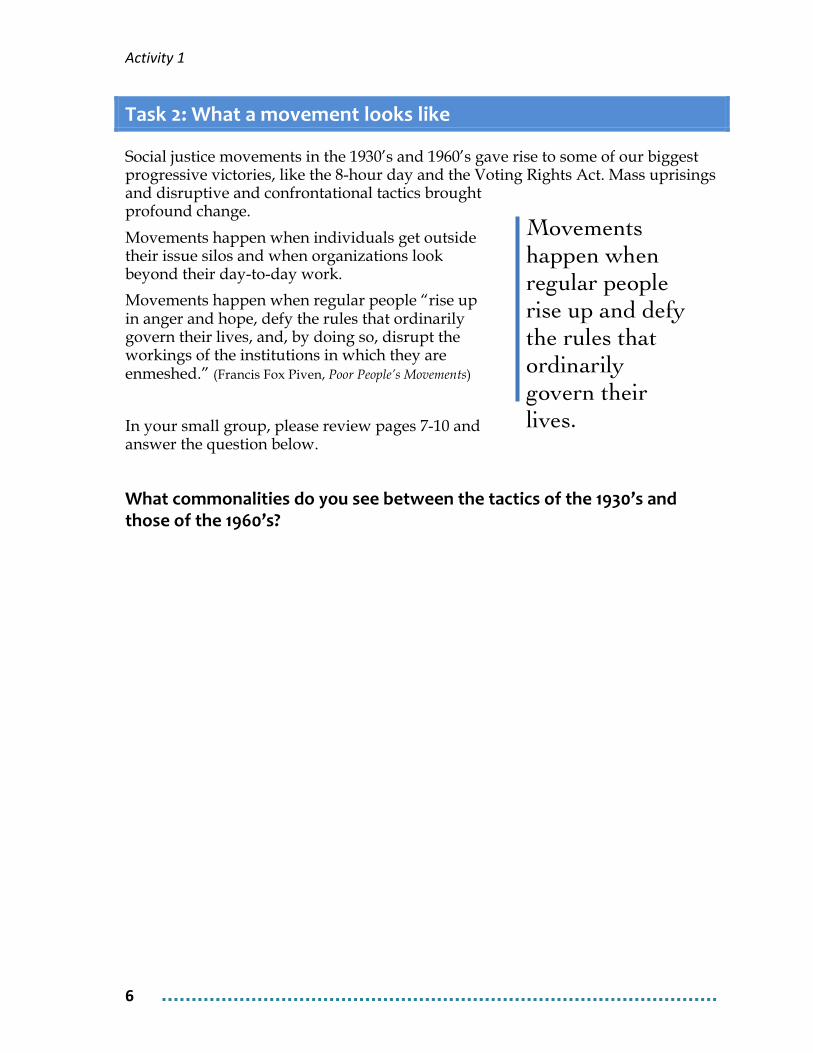
The Bonus Army (May-July 1932) More than 20,000 unemployed WWI veterans and their families occupied Washington, D.C., demanding bonuses they had been promised for their service. The bonus had been delayed until 1945 and when the Great Depression hit many
veterans were desperate for relief.
After the Senate rejected a bill to pay the bonus, the local police attempted but failed to evict the veterans. President Hoover then ordered the U.S. army in, led by General MacArthur. The army burned down the camps, killing and injuring veterans and their families.
Four years later, WWI veterans were paid their wartime bonuses. The G.I. Bill to assist future veterans passed in 1944.
Great Rent Strike of the Bronx (1932) The Great Depression hit all workers, including middle-class tenants in the Bronx. Many of these tenants, mostly Eastern European Jews, couldn’t pay their rents. Activists from the Unemployed Council, a communist-led group, organized massive strikes at the three largest apartment buildings in Bronx Park East. The majority of the tenants agreed to withhold their rent and began picketing their
The Bonus Army built encampments with streets, a library, barber shops, and a post office.
Activity 1
8
building to demand 15% rent reduction, repairs, an end to evictions, and recognition of the tenants committee as an official bargaining agent. With partial success, rent strikes spread across New York City.
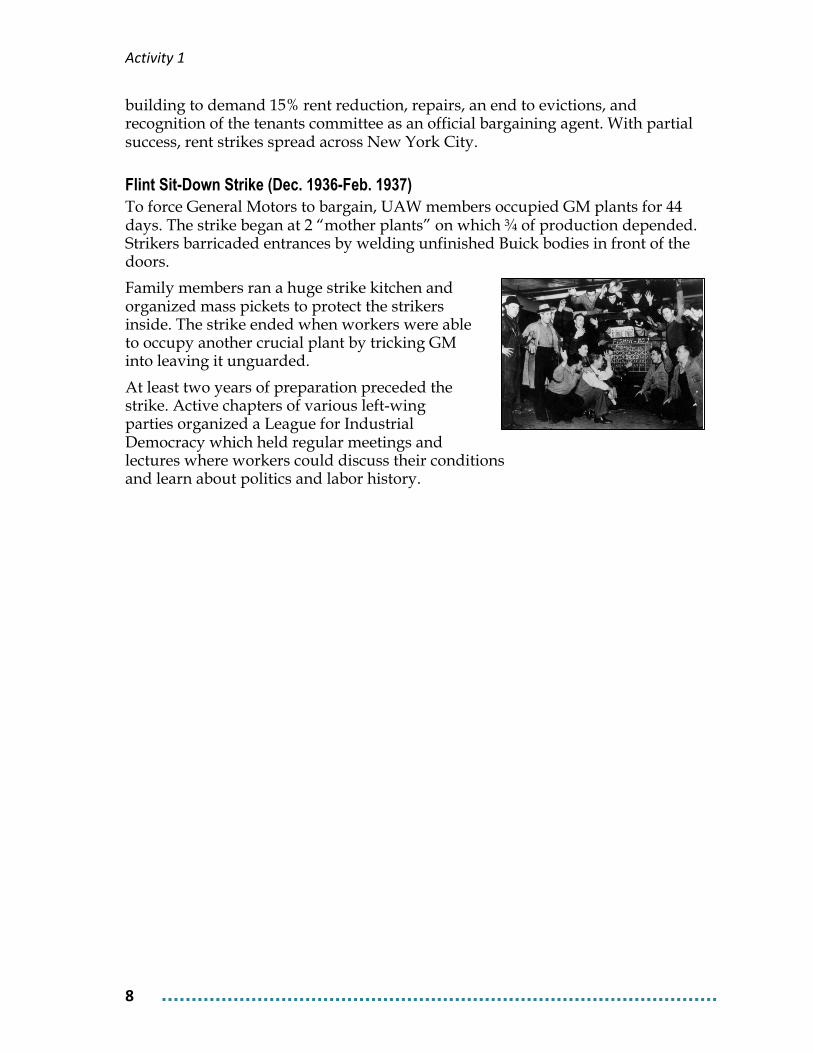
Flint Sit-Down Strike (Dec. 1936-Feb. 1937) To force General Motors to bargain, UAW members occupied GM plants for 44 days. The strike began at 2 “mother plants” on which ¾ of production depended. Strikers barricaded entrances by welding unfinished Buick bodies in front of the doors.
Family members ran a huge strike kitchen and organized mass pickets to protect the strikers inside. The strike ended when workers were able to occupy another crucial plant by tricking GM into leaving it unguarded.
At least two years of preparation preceded the strike. Active chapters of various left-wing parties organized a League for Industrial Democracy which held regular meetings and lectures where workers could discuss their conditions and learn about politics and labor history.
Activity 1
9
Civil Rights and Great Society Era (1960’s) Victories
▪ Civil Rights Act of 1964
▪ Voting Rights Act of 1965
▪ Medicare
▪ Medicaid
▪ Food Stamps
▪ Head Start
▪ Equal Pay Act
▪ Age Discrimination in Employment Act
Campaigns
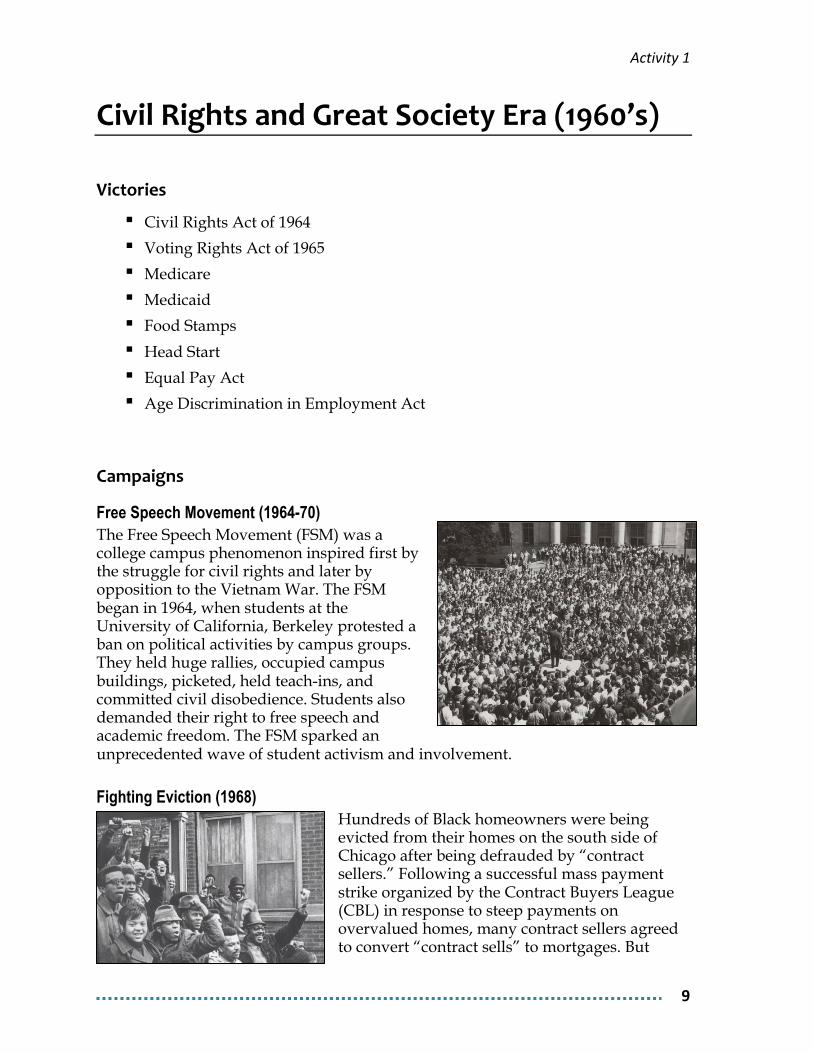
Free Speech Movement (1964-70) The Free Speech Movement (FSM) was a college campus phenomenon inspired first by the struggle for civil rights and later by opposition to the Vietnam War. The FSM began in 1964, when students at the University of California, Berkeley protested a ban on political activities by campus groups. They held huge rallies, occupied campus buildings, picketed, held teach-ins, and committed civil disobedience. Students also demanded their right to free speech and academic freedom. The FSM sparked an unprecedented wave of student activism and involvement.
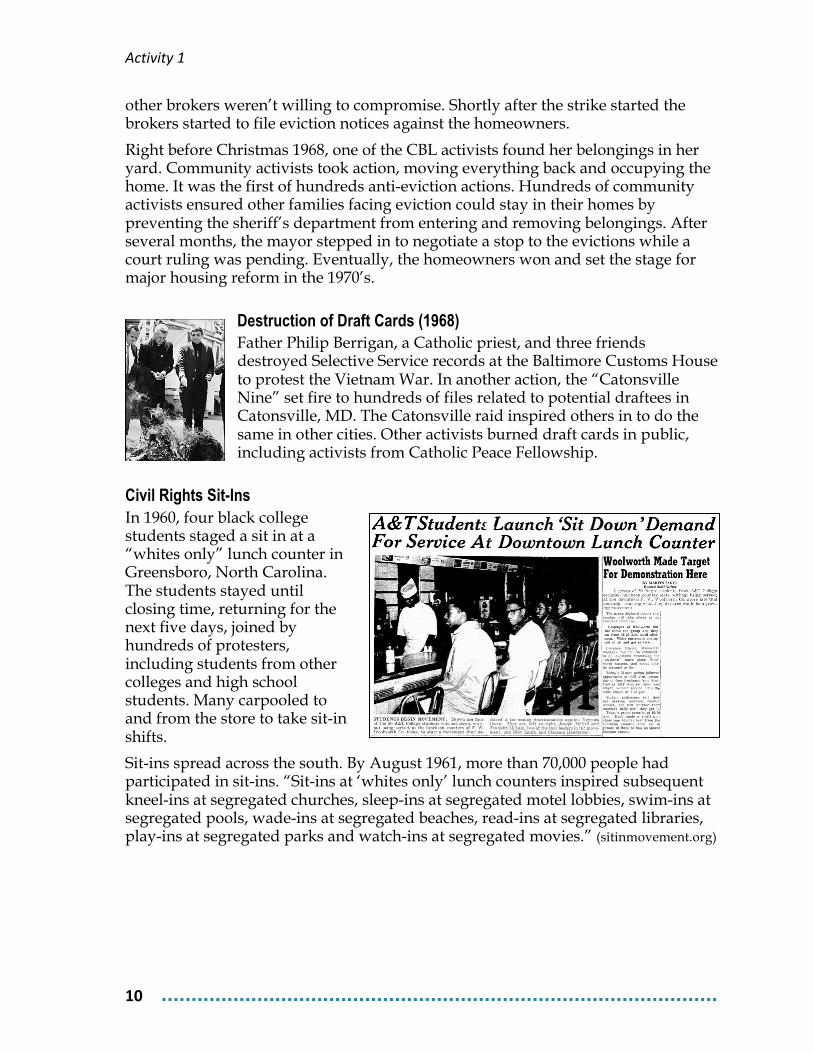
Fighting Eviction (1968) Hundreds of Black homeowners were being evicted from their homes on the south side of Chicago after being defrauded by “contract sellers.” Following a successful mass payment strike organized by the Contract Buyers League (CBL) in response to steep payments on overvalued homes, many contract sellers agreed to convert “contract sells” to mortgages. But
Activity 1
10
other brokers weren’t willing to compromise. Shortly after the strike started the brokers started to file eviction notices against the homeowners.
Right before Christmas 1968, one of the CBL activists found her belongings in her yard. Community activists took action, moving everything back and occupying the home. It was the first of hundreds anti-eviction actions. Hundreds of community activists ensured other families facing eviction could stay in their homes by preventing the sheriff’s department from entering and removing belongings. After several months, the mayor stepped in to negotiate a stop to the evictions while a court ruling was pending. Eventually, the homeowners won and set the stage for major housing reform in the 1970’s.
Destruction of Draft Cards (1968) Father Philip Berrigan, a Catholic priest, and three friends destroyed Selective Service records at the Baltimore Customs House to protest the Vietnam War. In another action, the “Catonsville Nine” set fire to hundreds of files related to potential draftees in Catonsville, MD. The Catonsville raid inspired others in to do the same in other cities. Other activists burned draft cards in public, including activists from Catholic Peace Fellowship.
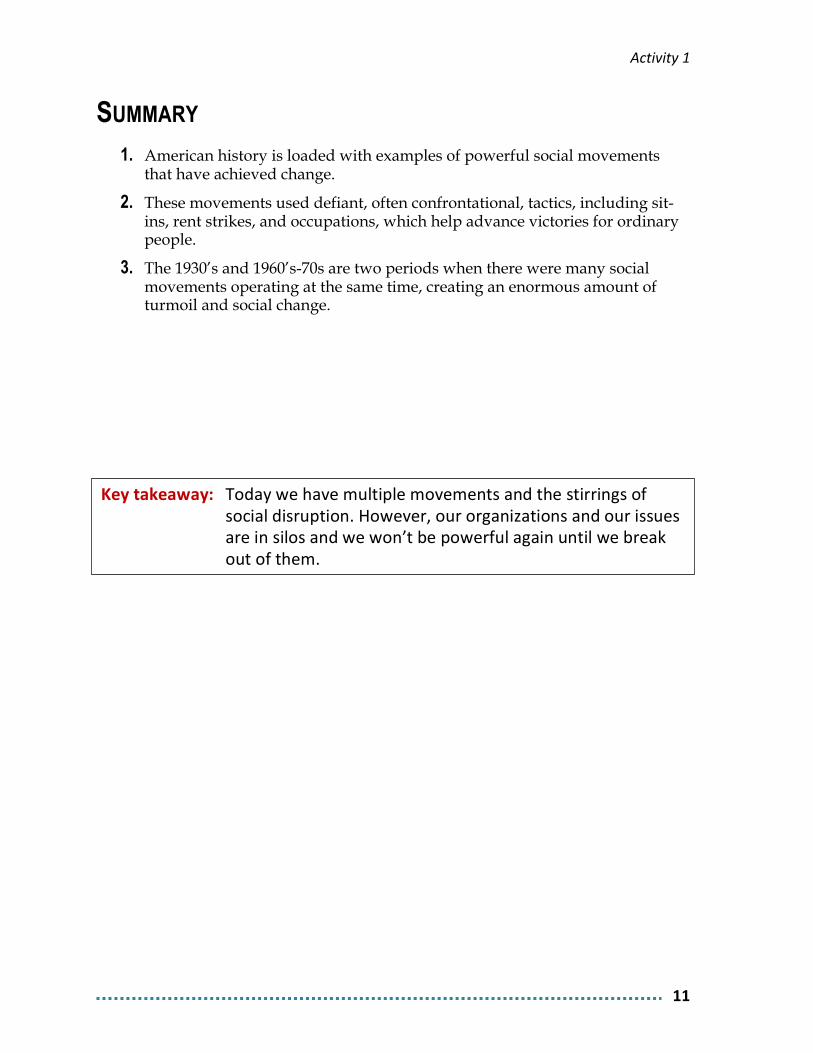
Civil Rights Sit-Ins In 1960, four black college students staged a sit in at a “whites only” lunch counter in Greensboro, North Carolina. The students stayed until closing time, returning for the next five days, joined by hundreds of protesters, including students from other colleges and high school students. Many carpooled to and from the store to take sit-in shifts.
Sit-ins spread across the south. By August 1961, more than 70,000 people had participated in sit-ins. “Sit-ins at ‘whites only’ lunch counters inspired subsequent kneel-ins at segregated churches, sleep-ins at segregated motel lobbies, swim-ins at segregated pools, wade-ins at segregated beaches, read-ins at segregated libraries, play-ins at segregated parks and watch-ins at segregated movies.” (sitinmovement.org)
Activity 1
11
SUMMARY 1. American history is loaded with examples of powerful social movements
that have achieved change.
2. These movements used defiant, often confrontational, tactics, including sit-ins, rent strikes, and occupations, which help advance victories for ordinary people.
3. The 1930’s and 1960’s-70s are two periods when there were many social movements operating at the same time, creating an enormous amount of turmoil and social change.
Key takeaway: Today we have multiple movements and the stirrings of social disruption. However, our organizations and our issues are in silos and we won’t be powerful again until we break out of them.

Activity 2
13
ACTIVITY 2: THE POWELL MEMO Purpose To understand what powerful movements with a common analysis look like from the other side.
Task: Learning from the Powell Memo
In Activity 1, we looked at periods in our history when multiple movements operated at the same time and were able to achieve significant progressive victories. They were successful in large part because they shared a common analysis of corporate power and government responsibility, and they raised hell!
In the late 1960’s and early 1970’s, the politically powerful and the corporate elite in the U.S. were under attack. The economic system seemed to be threatened from all sides—student protests, civil rights rebellions, millions of workers on strike, growing consumer advocacy, environmentalism, etc. The attacks all were aimed at fighting corporate power, not just making gains on single issues.
In your groups, please review pages 14-16 and answer the questions below. They are designed to give us a better understanding of what it takes to build a powerful mass movement.
Please choose a different member of your group to take notes and report back.
1. What problem did Lewis Powell see?
2. What solutions did Powell propose?
3. What are the lessons for us from the Powell memo?
Activity 2
14
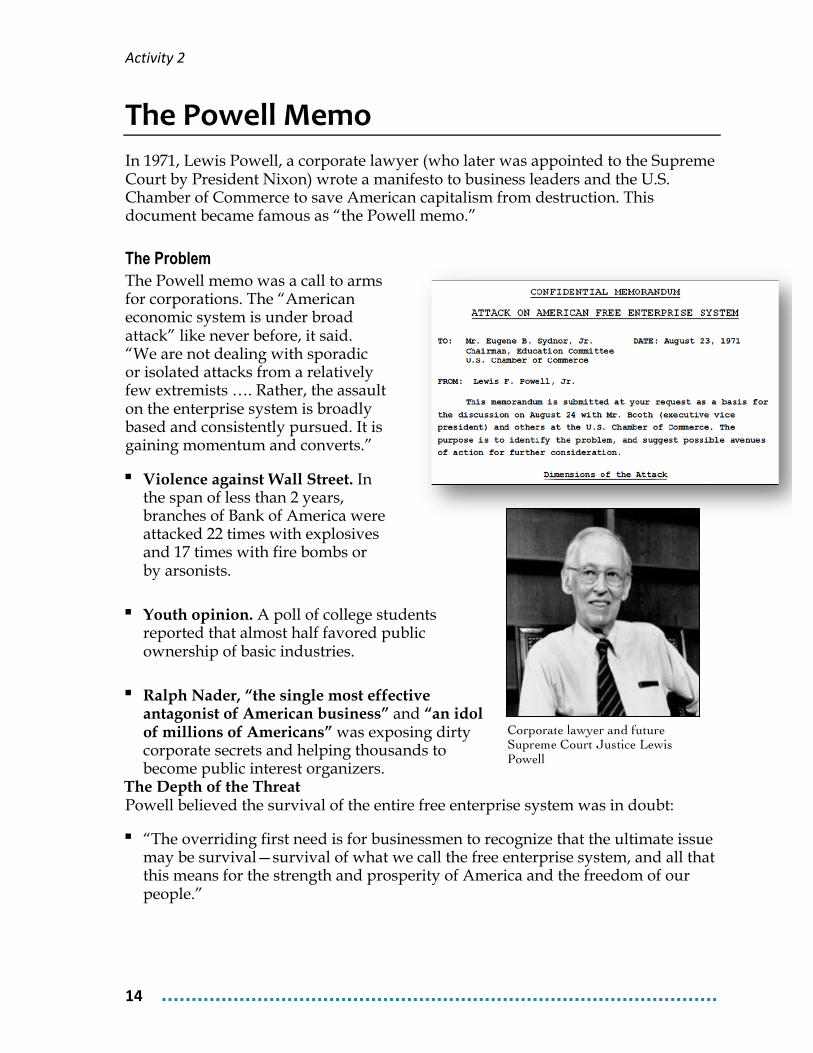
The Powell Memo In 1971, Lewis Powell, a corporate lawyer (who later was appointed to the Supreme Court by President Nixon) wrote a manifesto to business leaders and the U.S. Chamber of Commerce to save American capitalism from destruction. This document became famous as “the Powell memo.”
The Problem The Powell memo was a call to arms for corporations. The “American economic system is under broad attack” like never before, it said. “We are not dealing with sporadic or isolated attacks from a relatively few extremists …. Rather, the assault on the enterprise system is broadly based and consistently pursued. It is gaining momentum and converts.”
▪ Violence against Wall Street. In the span of less than 2 years, branches of Bank of America were attacked 22 times with explosives and 17 times with fire bombs or by arsonists.
▪ Youth opinion. A poll of college students reported that almost half favored public ownership of basic industries.
▪ Ralph Nader, “the single most effective antagonist of American business” and “an idol of millions of Americans” was exposing dirty corporate secrets and helping thousands to become public interest organizers.
The Depth of the Threat Powell believed the survival of the entire free enterprise system was in doubt:
▪ “The overriding first need is for businessmen to recognize that the ultimate issue may be survival—survival of what we call the free enterprise system, and all that this means for the strength and prosperity of America and the freedom of our people.”
Corporate lawyer and future Supreme Court Justice Lewis Powell
Activity 2
15
Powell’s Strategy: Transform Ideas Powell wasn’t interested in changing laws or regulations. The very ideas that the public had about business and the American economic system had to be reclaimed:
“Members of the intellectual community are waging ideological warfare against the enterprise system and the values of western society.”
The threat wasn’t confined to intellectuals:
“The most disquieting voices joining the chorus of criticism come from perfectly respectable elements of society: from the college campus, the pulpit, the media, the intellectual and literary journals, the arts and sciences, and from politicians.”
He offered a sophisticated, long-term strategy to use these same institutions to counter the assault that included:
▪ Create think tanks of “eminent scholars, writers and speakers, who will do the thinking, the analysis, the writing and the speaking.”
▪ Publish a steady flow of articles for popular magazines and professional journals.
▪ Evaluate economics, political science, and sociology textbooks for college and high school and keep them “under constant surveillance.”
▪ Do the same for TV, radio, and the press.
In many ways, Fox News, with its claim to a “fair and balanced” approach to counter the “liberal” media, is the ultimate fulfillment of Powell’s strategy.
Activity 2
16
Powell’s Strategy: Cultivate Political Power
Go on the Attack and Punish Politicians Powell believed that labor and other “self-interest” groups were wielding the kind of political power that business must also exert, “without embarrassment and without the reluctance which has been so characteristic of American business.”
Instead,
“There should be no hesitation to attack the Naders, the Marcuses [a radical scholar] and others who openly seek destruction of the system. There should not be the slightest hesitation to press vigorously in all political arenas for support of the enterprise system. Nor should there be reluctance to penalize politically those who oppose it.”
Corporations Should Be in the Ideology Business “The day is long past when the chief executive officer of a major corporation discharges his responsibility by maintaining a satisfactory growth of profits ….. If our system is to survive, top management must be equally concerned with protecting and preserving the system itself.”
Corporations should appoint a high-level executive whose responsibility is “to counter—on the broadest front—the attack on the enterprise system.”
Corporations Must Get Out of Their Silos Powell stressed that corporations would need to act together. It didn’t matter whether a company drilled for oil, manufactured steel, or sold soap.
“[I]ndependent and uncoordinated activity by individual corporations . . . will not be sufficient. . . . Political power [is] available only through united action and national organizations.”
Activity 2
17
SUMMARY 1. By the early 1970’s, anti-war protests, civil rights demonstrations, mass labor
strikes, Ralph Nader’s consumer actions, environmentalism, and other movements had created an anti-business climate.
2. Corporate lawyer Lewis Powell wanted business to defend the system by building a vast presence on college campuses and in the media and using political power aggressively.
3. He recognized this campaign could not be successful unless corporations broke out of their silos.
4. Today there are many movements but they are fractured from each other, often operating in separate silos. To build a powerful movement for economic and racial justice will require “silo busting.”
Key takeaway: We must not only break down the silos we’re in, but also build a new identity. We have to become more than just a labor person or a community activist. We need to wear the hat of a movement builder.

Activity 3
19
ACTIVITY 3: INTRODUCTION TO THE CEO-TO-WORKER WAGE GAP AND THE WEALTH GAP Purpose To understand how the wage gap between CEOs and the average worker has changed and how it might lead to important organizing opportunities. To understand the enormous wealth gap between Black, white, and Latino workers.
Task 1: Measure the wage gap
In your groups, please answer the following questions and report back on #3 and #6.
1. How much do you believe a CEO of a large company receives each year in total compensation?
___________
2. How much do you believe an average worker in a large
company receives? ___________
3. What ratio do you get when you divide the CEO estimate by the worker estimate?
___________
4. In your opinion, what should a CEO of a large company receive each year in total compensation?
___________
5. What do you think an average worker should receive per year? ___________
6. What ratio do you get when you divide the CEO estimate by the worker estimate?
___________
Activity 3
20
Task 2: Americans underestimate the wage gap. Is this an organizing opportunity?
In your groups, please review the fact sheets on pages 21-24, then answer the question below. Please choose a new spokesperson for your group who will take notes and report back to the larger group.
1. In your opinion, is the growing wage gap between CEOs and the rest of us an important issue? Why or why not?
2. Of the fact sheets on pages 21-‐24, which one do you think would be most important to share with your co-‐workers and community members?
Page _____
Title of fact sheet ___________________________________________
Why did you choose this fact sheet?
Read more about the wage gap in chapter 1 of Runaway Inequality, pp. 9-14.
Activity 3
21
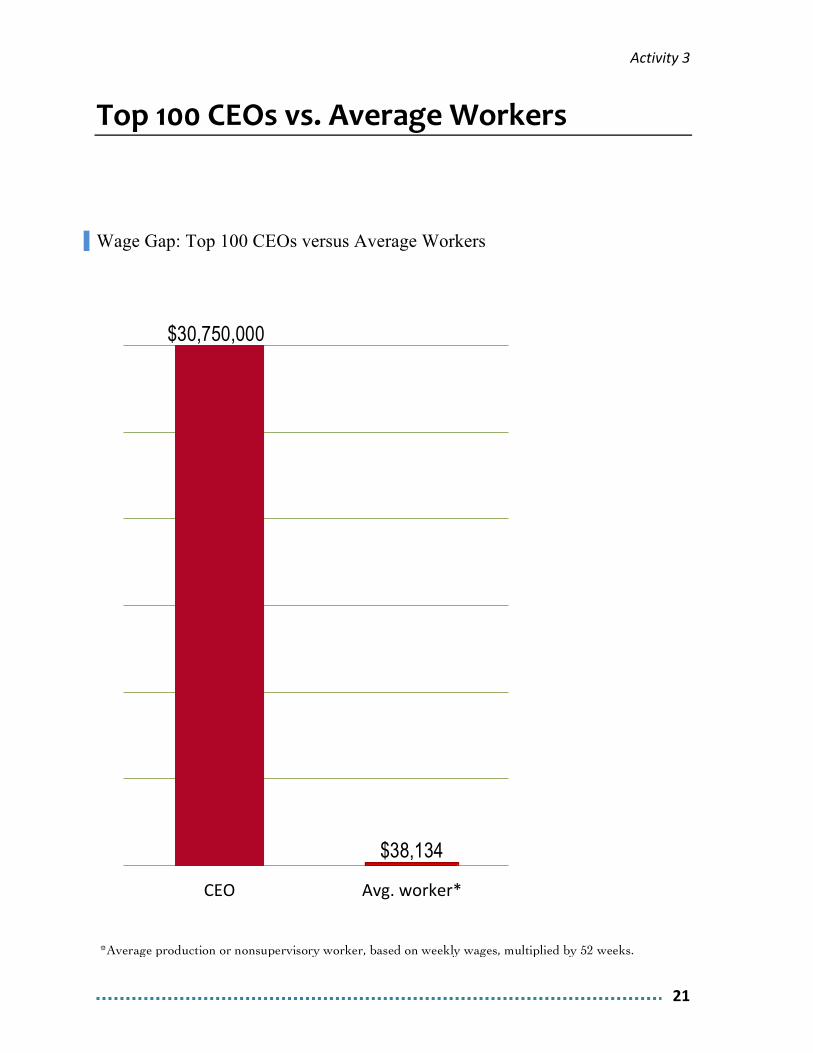
Top 100 CEOs vs. Average Workers
Wage Gap: Top 100 CEOs versus Average Workers
$30,750,000
*Average production or nonsupervisory worker, based on weekly wages, multiplied by 52 weeks.
CEO Avg. worker*
$38,134
Activity 3
22
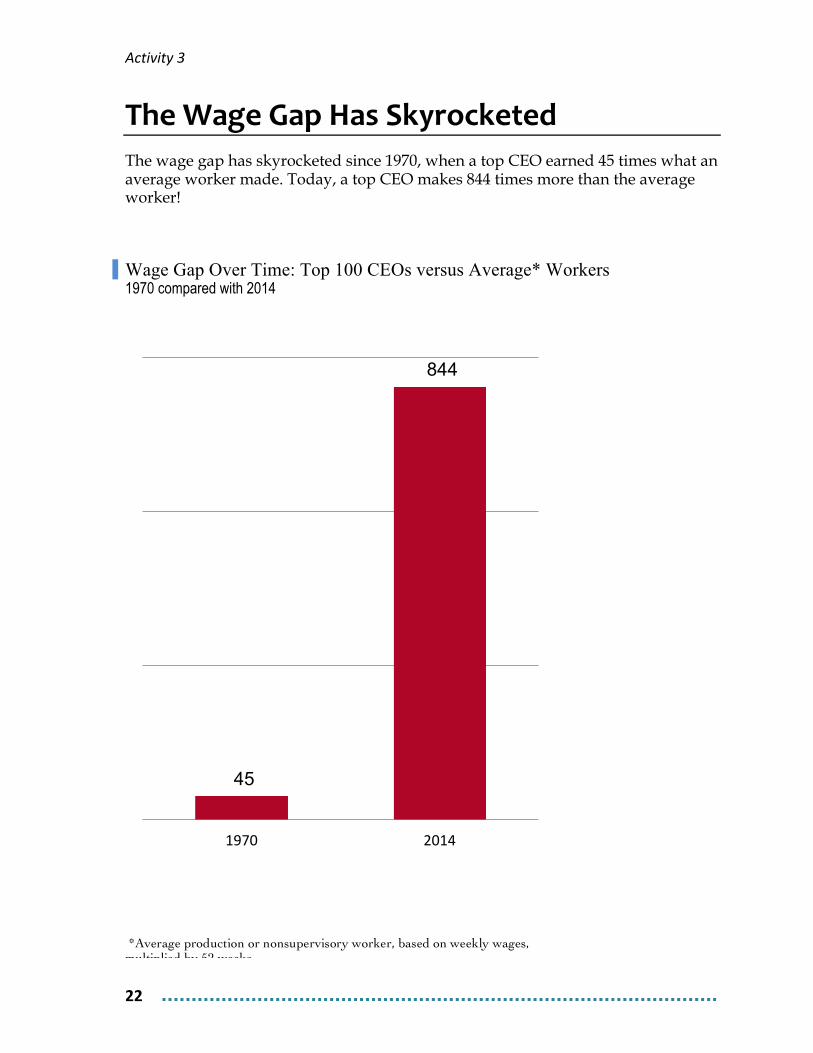
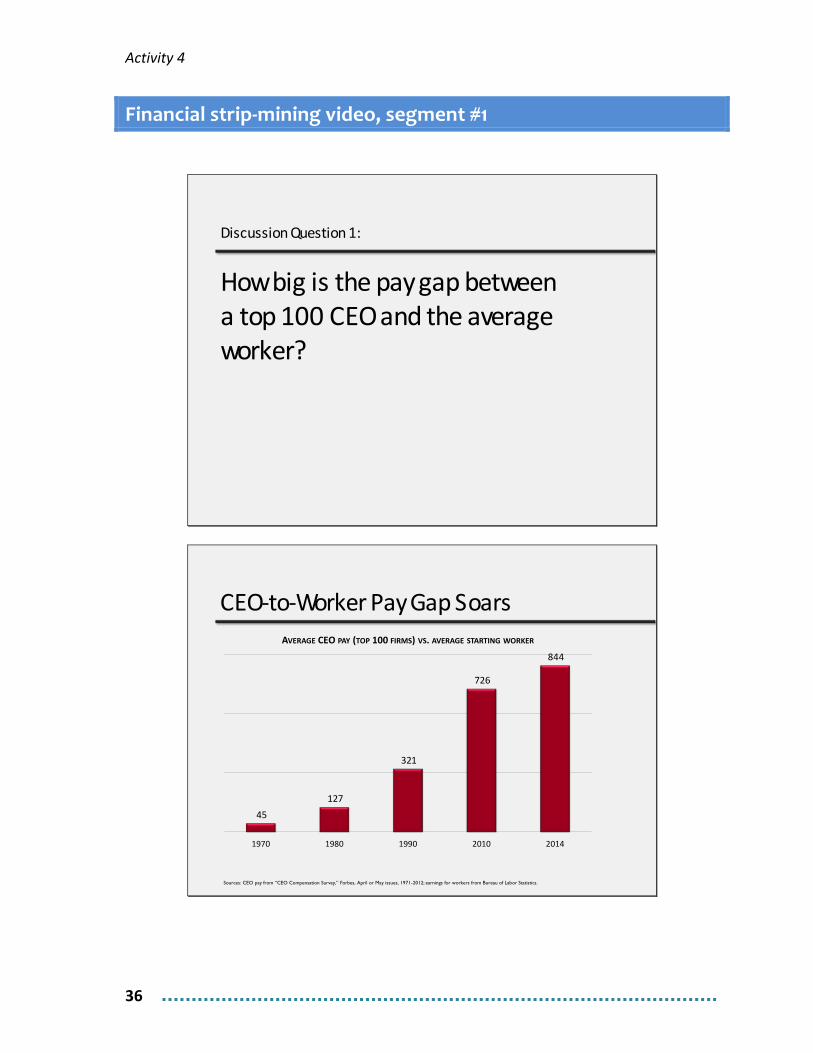
The Wage Gap Has Skyrocketed The wage gap has skyrocketed since 1970, when a top CEO earned 45 times what an average worker made. Today, a top CEO makes 844 times more than the average worker!
Wage Gap Over Time: Top 100 CEOs versus Average* Workers 1970 compared with 2014
45
844
1970 2014
*Average production or nonsupervisory worker, based on weekly wages, multiplied by 52 weeks.
Activity 3
23
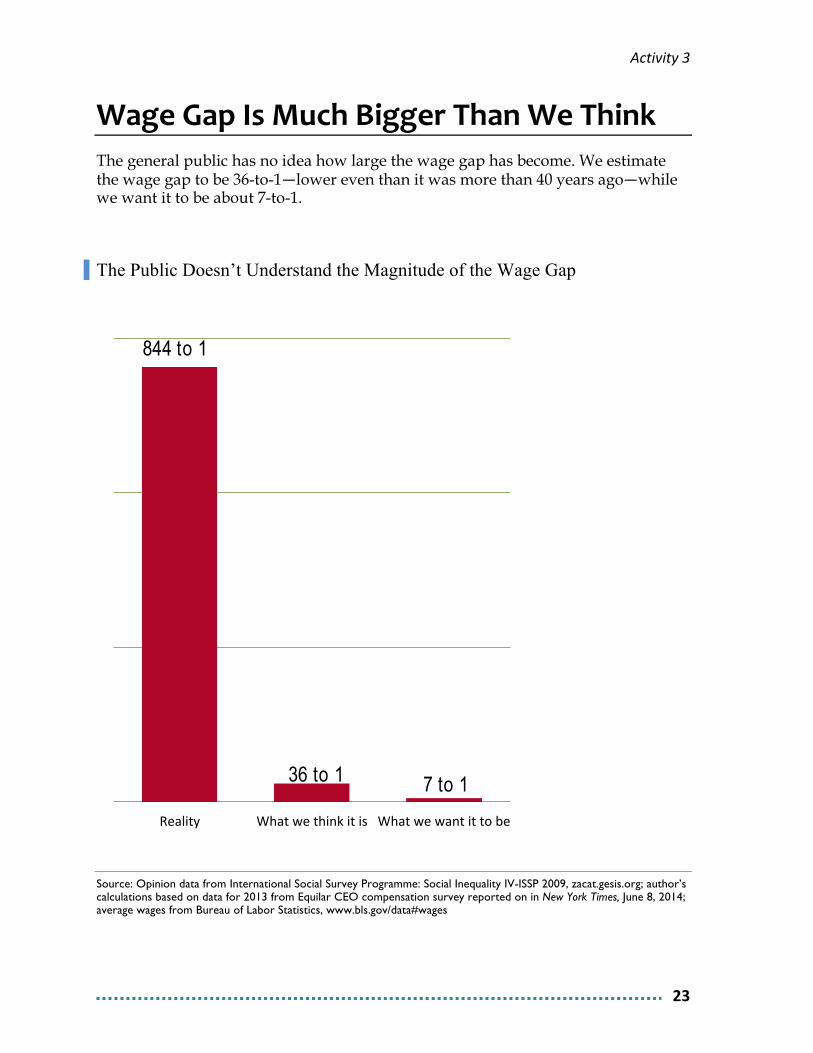
Wage Gap Is Much Bigger Than We Think The general public has no idea how large the wage gap has become. We estimate the wage gap to be 36-to-1—lower even than it was more than 40 years ago—while we want it to be about 7-to-1.
The Public Doesn’t Understand the Magnitude of the Wage Gap
Source: Opinion data from International Social Survey Programme: Social Inequality IV-ISSP 2009, zacat.gesis.org; author’s calculations based on data for 2013 from Equilar CEO compensation survey reported on in New York Times, June 8, 2014; average wages from Bureau of Labor Statistics, www.bls.gov/data#wages
Reality What we think it is What we want it to be
844 to 1
7 to 1
36 to 1
Activity 3
24
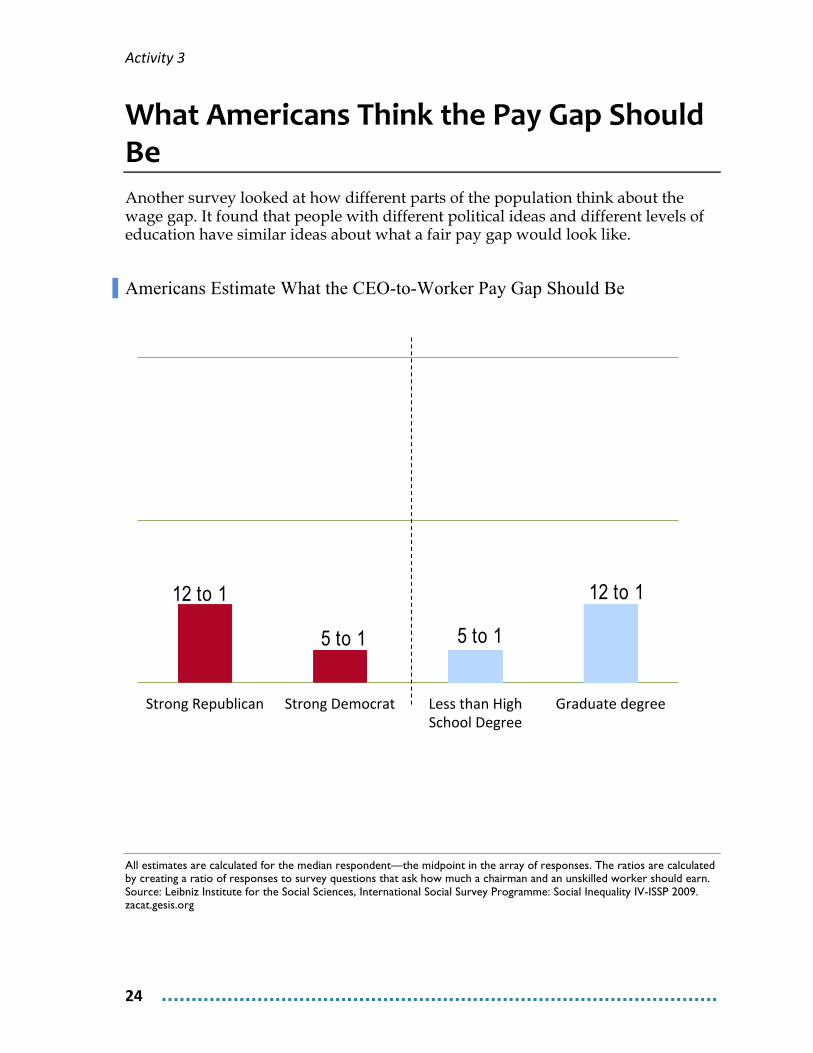
What Americans Think the Pay Gap Should Be Another survey looked at how different parts of the population think about the wage gap. It found that people with different political ideas and different levels of education have similar ideas about what a fair pay gap would look like.
Americans Estimate What the CEO-to-Worker Pay Gap Should Be
All estimates are calculated for the median respondent—the midpoint in the array of responses. The ratios are calculated by creating a ratio of responses to survey questions that ask how much a chairman and an unskilled worker should earn. Source: Leibniz Institute for the Social Sciences, International Social Survey Programme: Social Inequality IV-ISSP 2009. zacat.gesis.org
Strong Republican Strong Democrat Less than High School Degree
Graduate degree
12 to 1
5 to 1
12 to 1
5 to 1
Activity 3
25
Task 3a: Income vs. wealth
So far we’ve talked about income, or what we earn. Now we’ll look at wealth, which is what we own—our assets—minus our debts. To make sure we understand the difference, together in the large group we will list examples of income and wealth.
Income is what we’re paid by other people.
Wealth is what we’re able to accumulate over time.
Wealth matters because it can:
▪ be passed on to future generations;
▪ be a financial cushion during hard times;
▪ pay for higher education;
▪ provide a financially secure retirement.
Examples of income
▪
▪
▪
▪
▪
Examples of wealth
▪
▪
▪
▪
▪

Activity 3
26
Task 3b: The wealth gap by racial and ethnic group
The fact sheets in the following pages look at the ethnic/racial wealth gap from a variety of perspectives.
In your groups, please review the fact sheets on pages 26-30 and then select one fact sheet that you think would be the most useful to share with others at your workplaces or in your communities to highlight this severe wealth gap.
Page _______
Title of fact sheet ___________________________________________
Why did you choose this fact sheet?
Activity 3
27
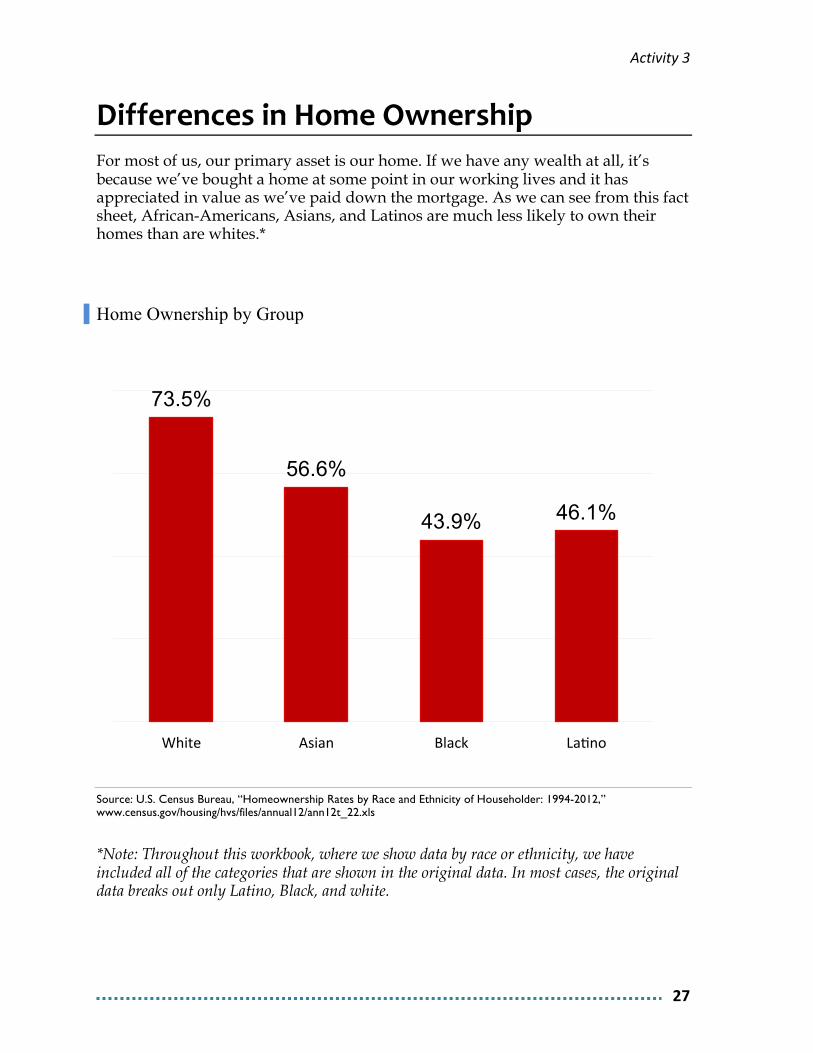
Differences in Home Ownership For most of us, our primary asset is our home. If we have any wealth at all, it’s because we’ve bought a home at some point in our working lives and it has appreciated in value as we’ve paid down the mortgage. As we can see from this fact sheet, African-Americans, Asians, and Latinos are much less likely to own their homes than are whites.*
Home Ownership by Group
Source: U.S. Census Bureau, “Homeownership Rates by Race and Ethnicity of Householder: 1994-2012,” www.census.gov/housing/hvs/files/annual12/ann12t_22.xls
*Note: Throughout this workbook, where we show data by race or ethnicity, we have included all of the categories that are shown in the original data. In most cases, the original data breaks out only Latino, Black, and white.
73.5%
56.6%
43.9% 46.1%
White Asian Black Laeno
Activity 3
28
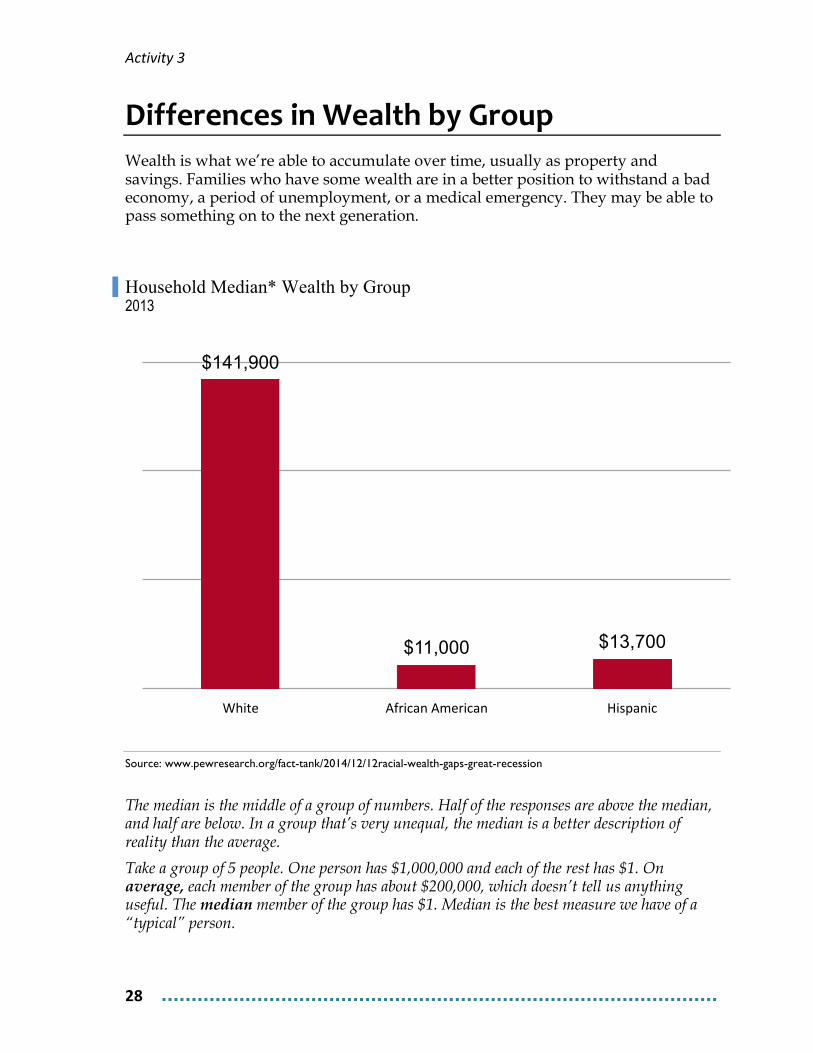
Differences in Wealth by Group Wealth is what we’re able to accumulate over time, usually as property and savings. Families who have some wealth are in a better position to withstand a bad economy, a period of unemployment, or a medical emergency. They may be able to pass something on to the next generation.
Household Median* Wealth by Group 2013
Source: www.pewresearch.org/fact-tank/2014/12/12racial-wealth-gaps-great-recession
The median is the middle of a group of numbers. Half of the responses are above the median, and half are below. In a group that’s very unequal, the median is a better description of reality than the average.
Take a group of 5 people. One person has $1,000,000 and each of the rest has $1. On average, each member of the group has about $200,000, which doesn’t tell us anything useful. The median member of the group has $1. Median is the best measure we have of a “typical” person.
$141,900
$11,000 $13,700
White African American Hispanic
Activity 3
29
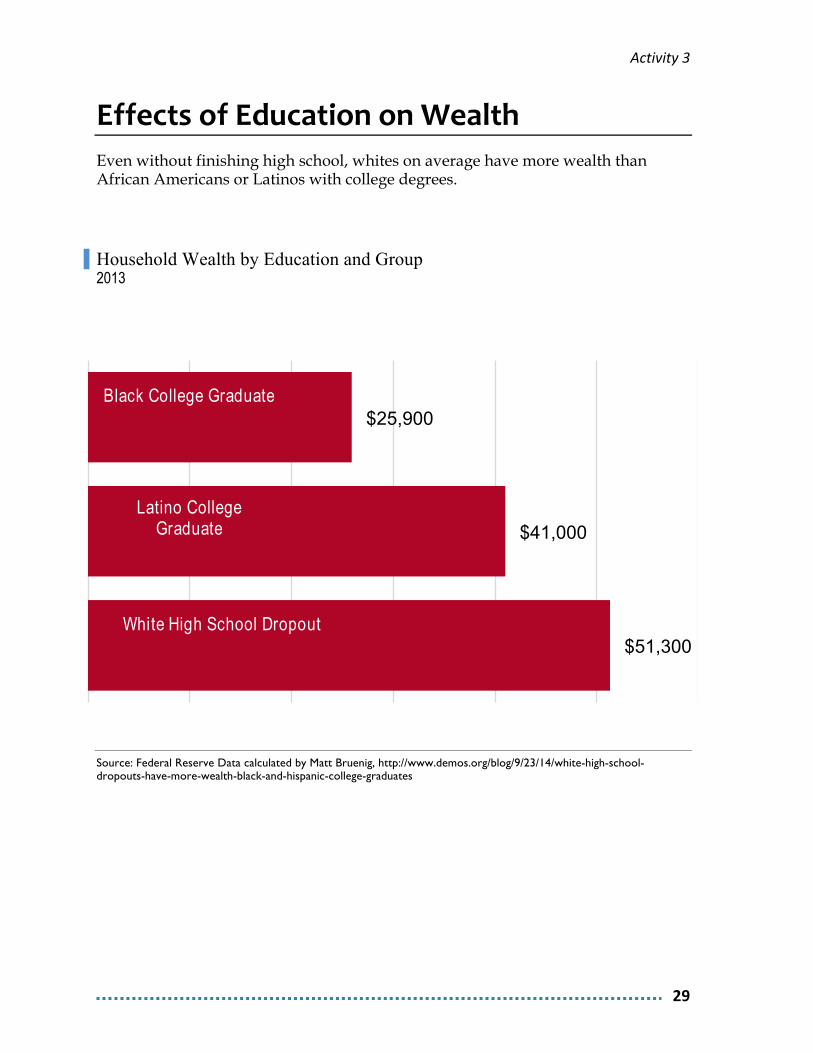
Effects of Education on Wealth Even without finishing high school, whites on average have more wealth than African Americans or Latinos with college degrees.
Household Wealth by Education and Group 2013
Source: Federal Reserve Data calculated by Matt Bruenig, http://www.demos.org/blog/9/23/14/white-high-school-dropouts-have-more-wealth-black-and-hispanic-college-graduates
$51,300
$41,000
$25,900 Black College Graduate
Latino College Graduate
White High School Dropout
Activity 3
30
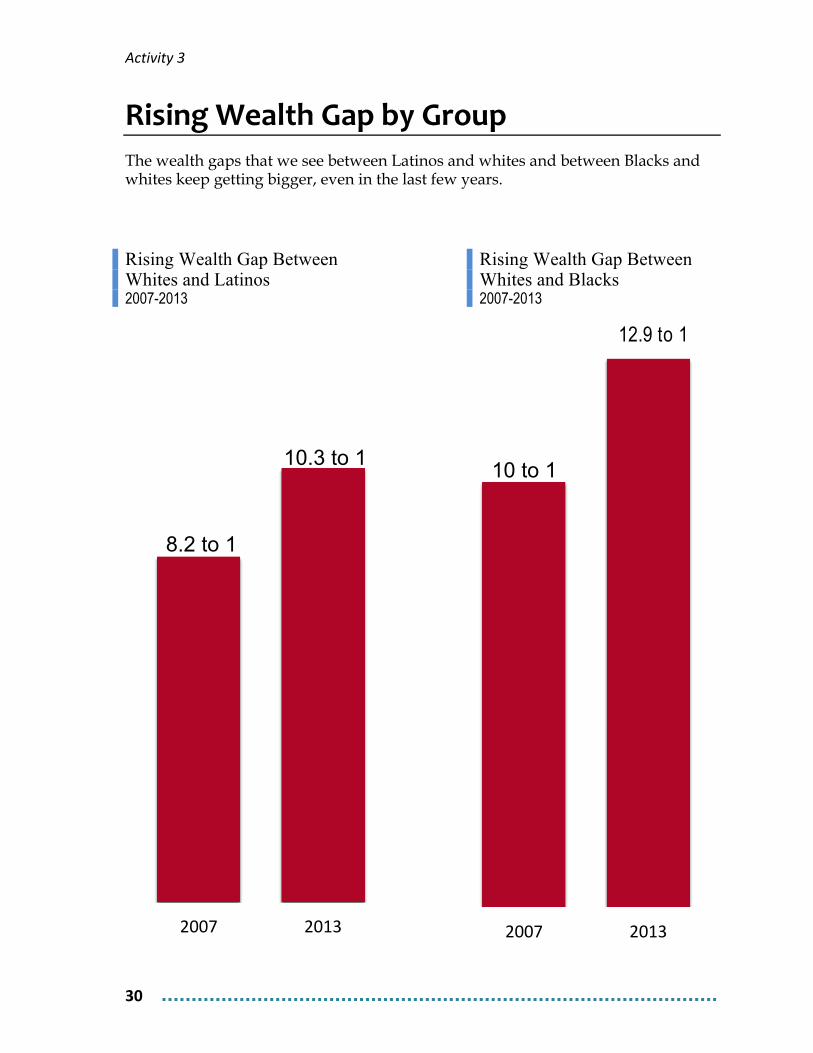
Rising Wealth Gap by Group The wealth gaps that we see between Latinos and whites and between Blacks and whites keep getting bigger, even in the last few years.
Rising Wealth Gap Between Whites and Latinos 2007-2013
Rising Wealth Gap Between Whites and Blacks 2007-2013
2007 2013
10.3 to 1
8.2 to 1
2007 2013
10 to 1
12.9 to 1
Activity 3
31
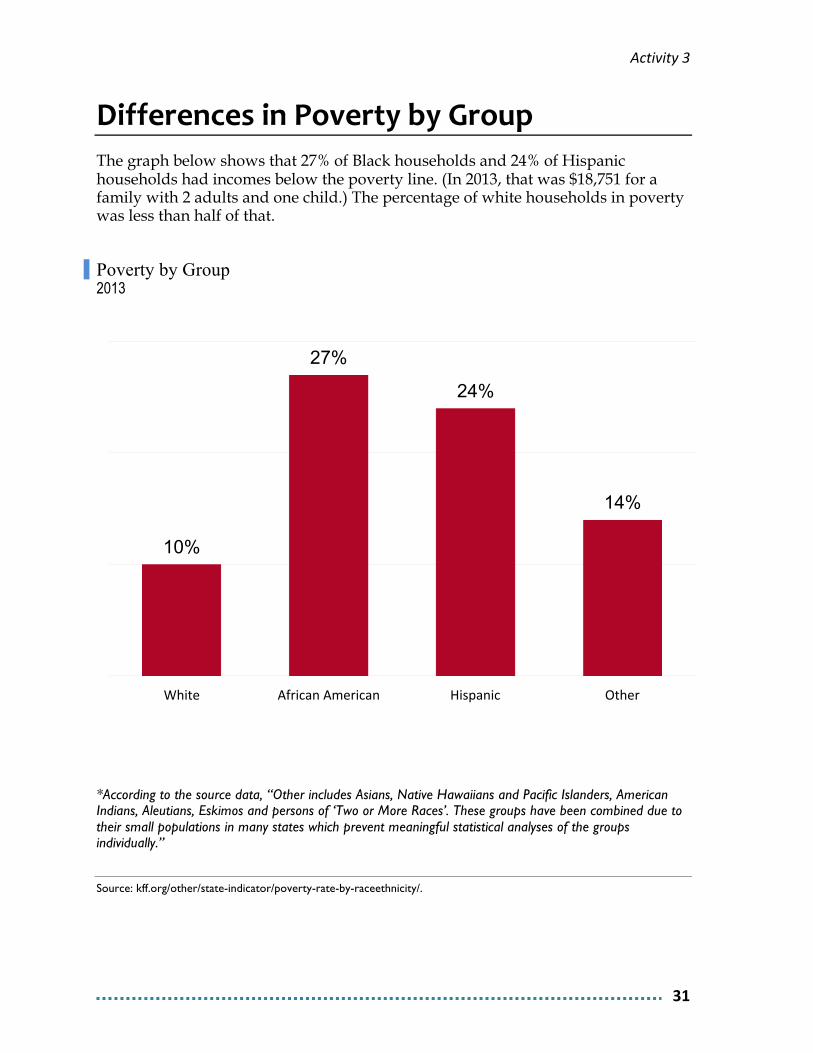
Differences in Poverty by Group The graph below shows that 27% of Black households and 24% of Hispanic households had incomes below the poverty line. (In 2013, that was $18,751 for a family with 2 adults and one child.) The percentage of white households in poverty was less than half of that.
Poverty by Group 2013
*According to the source data, “Other includes Asians, Native Hawaiians and Pacific Islanders, American Indians, Aleutians, Eskimos and persons of ‘Two or More Races’. These groups have been combined due to their small populations in many states which prevent meaningful statistical analyses of the groups individually.”
Source: kff.org/other/state-indicator/poverty-rate-by-raceethnicity/.
10%
27%
24%
14%
White African American Hispanic Other
Activity 3
32
SUMMARY 1. Economic inequality is growing, but most Americans have no idea how severe it
is. Americans will want to know how it got there, and what we can do about it.
2. Democratic and Republican voters alike want a much fairer wage gap.
3. Working people—Black, Latino, and white—are falling further and further behind as wealth increasingly accumulates in the hands of the few. But as always in American history, the hardest hit are those at the bottom.
4. If we are going to build a broad-based movement for economic justice, we also will have understand the enormous wealth gap among Black, white and Latino working people, and work diligently to close it.
Key takeaway: There are two important things most don’t know: how big the wage gap is and how big the wealth gap is among us.
Activity 4
33
ACTIVITY 4: THE PRODUCTIVITY AND WAGE GAP Purpose To understand why wages and productivity stopped rising together.
Task 1: Why did workers’ wages and productivity split apart?
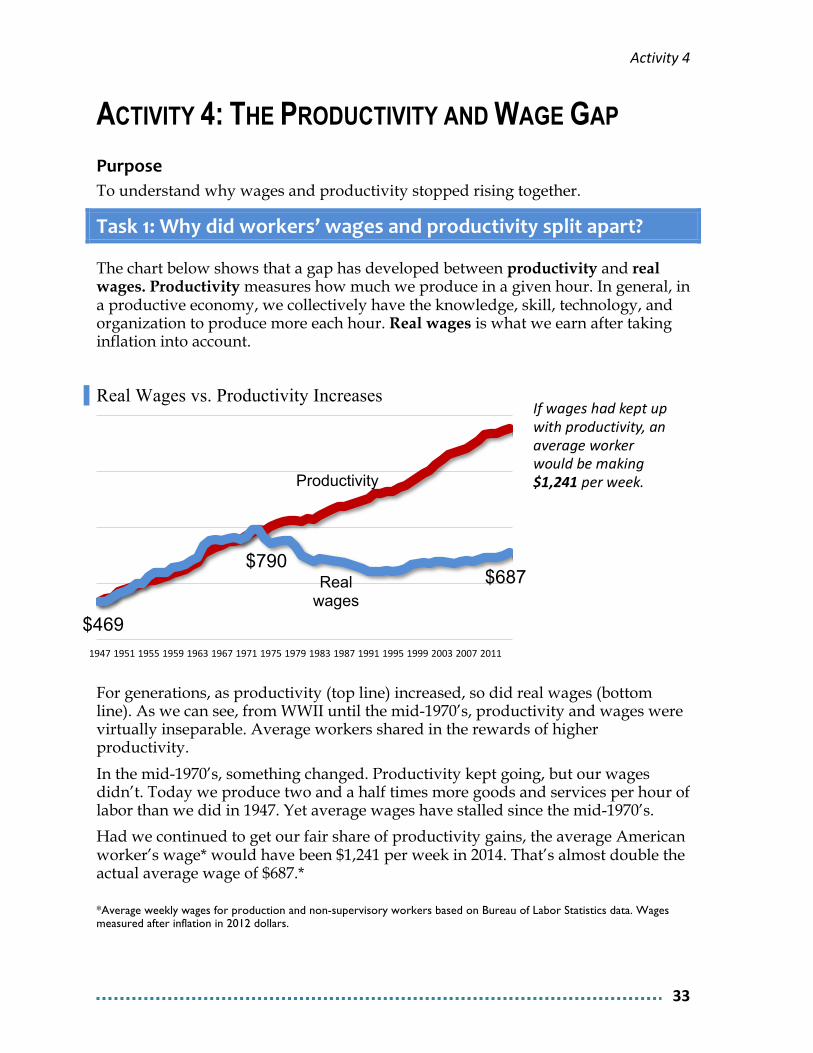
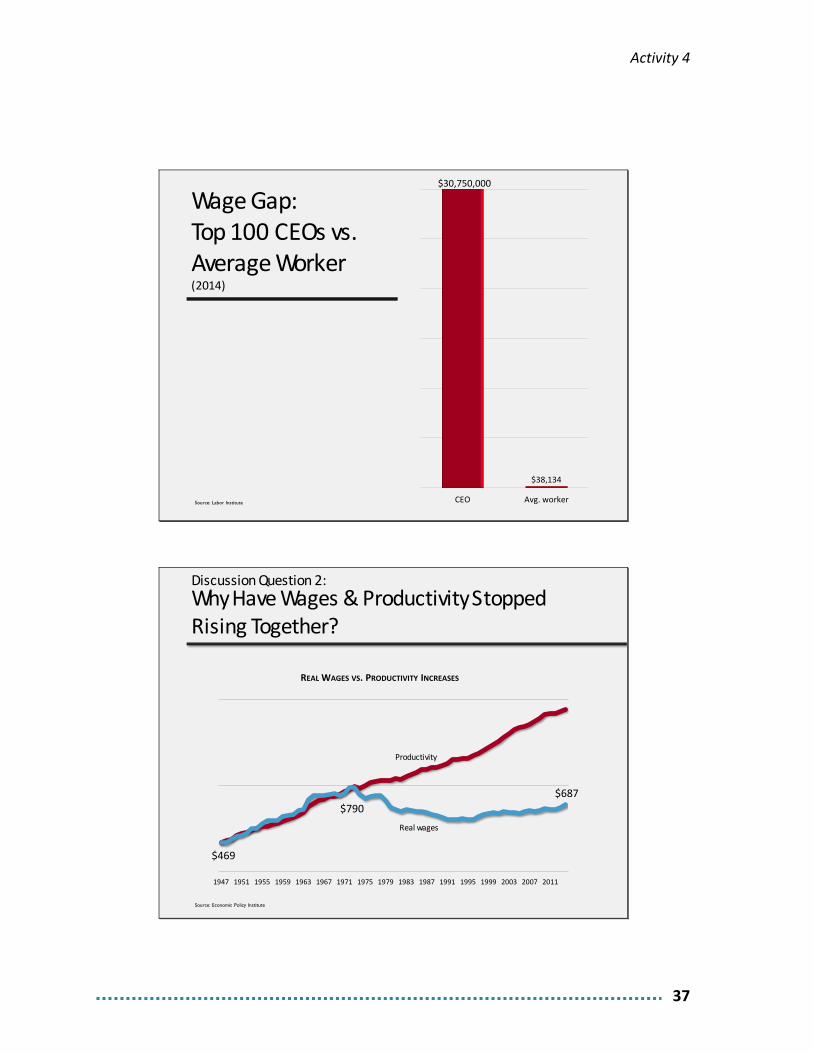
The chart below shows that a gap has developed between productivity and real wages. Productivity measures how much we produce in a given hour. In general, in a productive economy, we collectively have the knowledge, skill, technology, and organization to produce more each hour. Real wages is what we earn after taking inflation into account.
Real Wages vs. Productivity Increases
For generations, as productivity (top line) increased, so did real wages (bottom line). As we can see, from WWII until the mid-1970’s, productivity and wages were virtually inseparable. Average workers shared in the rewards of higher productivity.
In the mid-1970’s, something changed. Productivity kept going, but our wages didn’t. Today we produce two and a half times more goods and services per hour of labor than we did in 1947. Yet average wages have stalled since the mid-1970’s.
Had we continued to get our fair share of productivity gains, the average American worker’s wage* would have been $1,241 per week in 2014. That’s almost double the actual average wage of $687.*
*Average weekly wages for production and non-supervisory workers based on Bureau of Labor Statistics data. Wages measured after inflation in 2012 dollars.
If wages had kept up with productivity, an average worker would be making $1,241 per week.
Productivity
$469
$790 Real
wages $687
1947 1951 1955 1959 1963 1967 1971 1975 1979 1983 1987 1991 1995 1999 2003 2007 2011
Activity 4
34
Why do you think the two lines pulled apart? Please make a list of reasons.
▪
▪
▪
▪
▪
Activity 4
35
Task 2: Understanding financialization
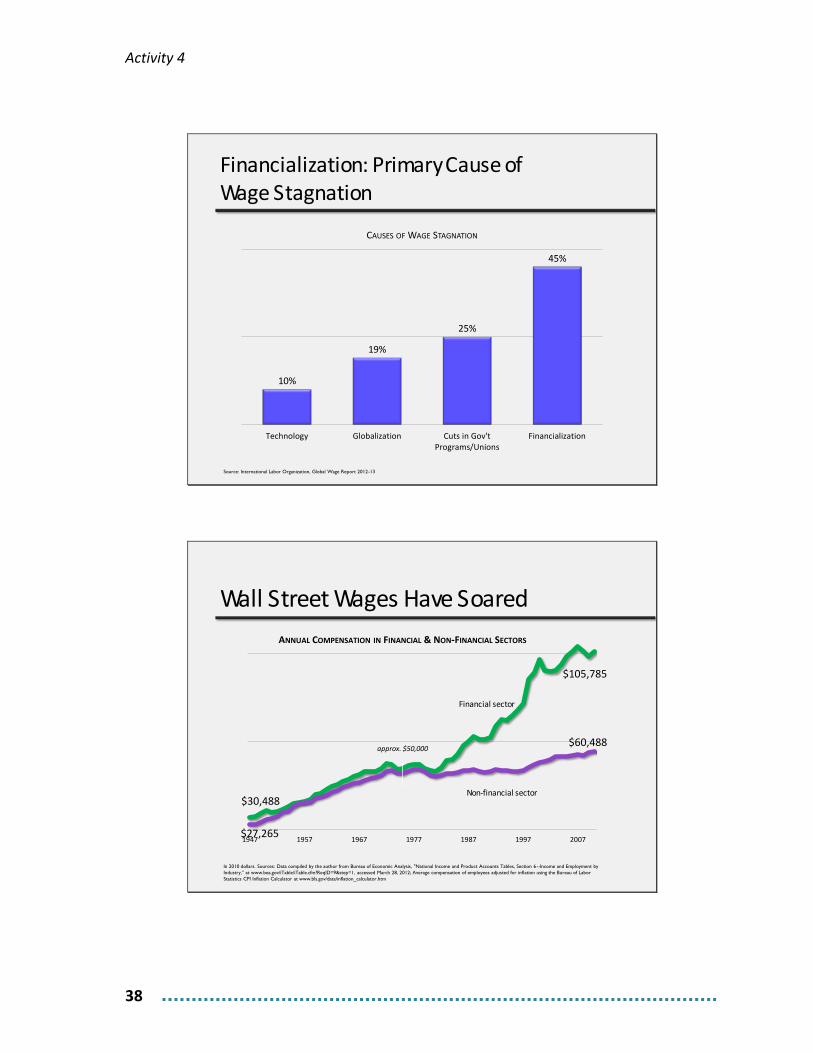
In 2012, the International Labor Organization published a study on the causes of wage stagnation in 70 developed countries. The researchers found that the largest cause is something called “financialization.”
Financialization means that the more an economy is based on the financial industry (Wall Street), the bigger the gap between productivity and wages.
How does financialization work? That’s the subject of a video by Les Leopold, author of Runaway Inequality. We’ll watch a 10-minute segment of that video now.
Activity 4
36
Financial strip-‐mining video, segment #1
How big is the pay gap between a top 100 CEO and the average worker?
Discussion Question 1:
CEO-‐to-‐Worker Pay Gap Soars
45 127
321
726
844
1970 1980 1990 2010 2014
AVERAGE CEO PAY (TOP 100 FIRMS) VS. AVERAGE STARTING WORKER
Sources: CEO pay from “CEO Compensation Survey,” Forbes, April or May issues, 1971-2012; earnings for workers from Bureau of Labor Statistics.
Activity 4
37
Wage Gap: Top 100 CEOs vs. Average Worker(2014)
$38,134
CEO Avg. worker
$30,750,000
Source: Labor Institute
Why Have Wages & Productivity Stopped Rising Together?
Productivity
$469
$790Real wages
$687
1947 1951 1955 1959 1963 1967 1971 1975 1979 1983 1987 1991 1995 1999 2003 2007 2011
REAL WAGES VS. PRODUCTIVITY INCREASES
Source: Economic Policy Institute
Discussion Question 2:
Activity 4
38
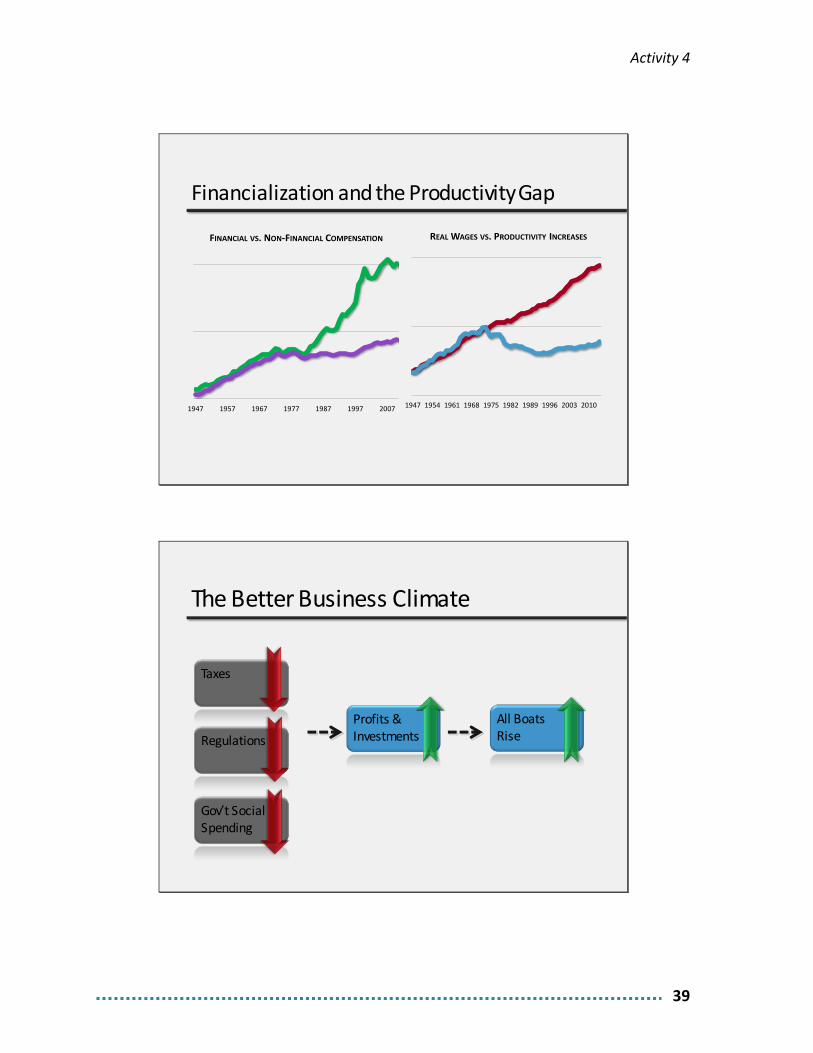
Financialization: Primary Cause of Wage Stagnation
10%
19%
25%
45%
Technology Globalization Cuts in Gov'tPrograms/Unions
Financialization
CAUSES OF WAGE STAGNATION
Source: International Labor Organization, Global Wage Report 2012-13
Wall Street Wages Have Soared
$30,488
Financial sector
$105,785
$27,265
Non-‐financial sector
$60,488
1947 1957 1967 1977 1987 1997 2007
ANNUAL COMPENSATION IN FINANCIAL & NON-‐FINANCIAL SECTORS
In 2010 dollars. Sources: Data compiled by the author from Bureau of Economic Analysis, "National Income and Product Accounts Tables, Section 6--Income and Employment by Industry,” at www.bea.gov/iTable/iTable.cfm?ReqID=9&step=1, accessed March 28, 2012; Average compensation of employees adjusted for inflation using the Bureau of Labor Statistics CPI Inflation Calculator at www.bls.gov/data/inflation_calculator.htm
approx. $50,000
Activity 4
39
Financialization and the Productivity Gap
1947 1954 1961 1968 1975 1982 1989 1996 2003 2010
REAL WAGES VS. PRODUCTIVITY INCREASES
1947 1957 1967 1977 1987 1997 2007
FINANCIAL VS. NON-‐FINANCIAL COMPENSATION
The Better Business Climate
Profits & Investments
All Boats RiseRegulations
Gov’t Social Spending
Taxes
Activity 4
40
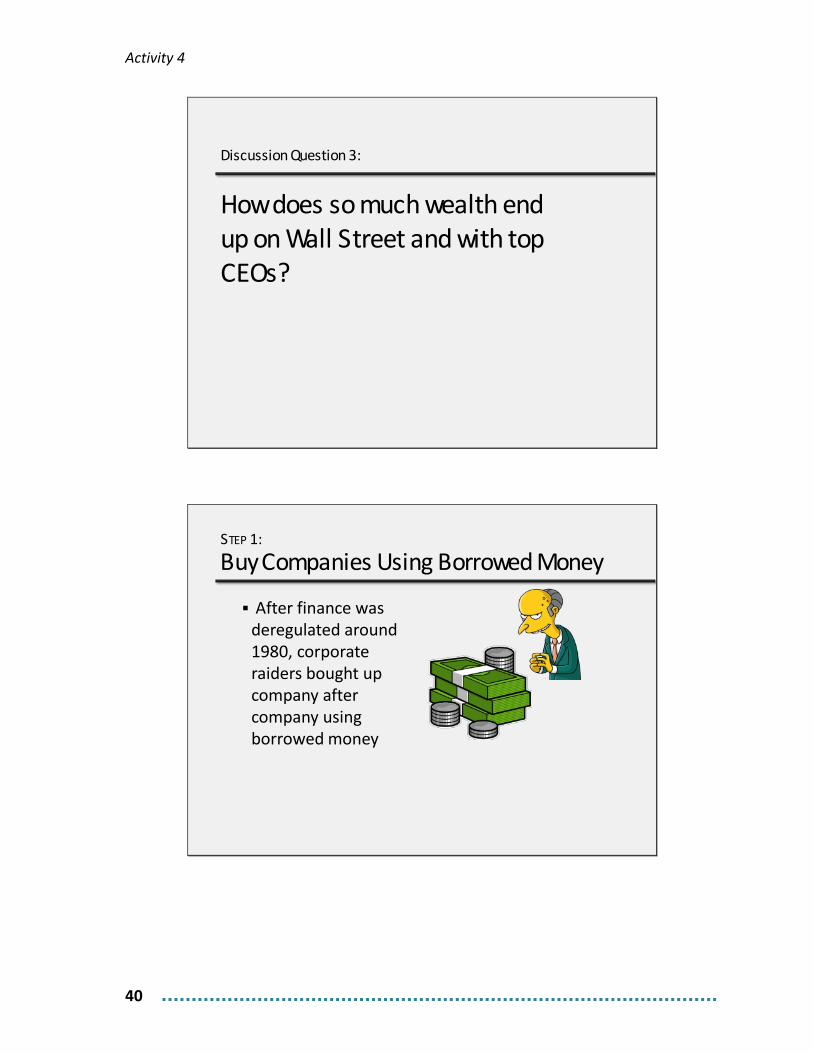
How does so much wealth end up on Wall Street and with top CEOs?
Discussion Question 3:
Buy Companies Using Borrowed Money
§ After finance was deregulated around 1980, corporate raiders bought up company after company using borrowed money
STEP 1:
Activity 4
41
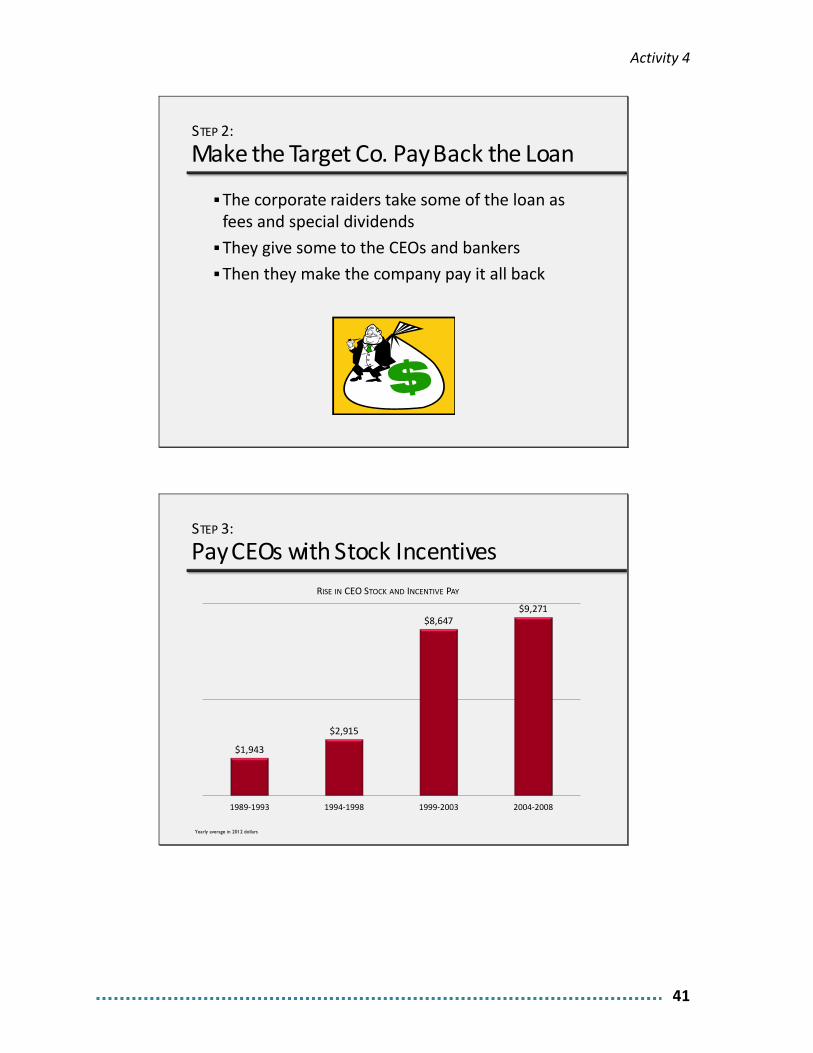
Make the Target Co. Pay Back the Loan
§The corporate raiders take some of the loan as fees and special dividends
§They give some to the CEOs and bankers§Then they make the company pay it all back
STEP 2:
Pay CEOs with Stock Incentives
$1,943
$2,915
$8,647 $9,271
1989-‐1993 1994-‐1998 1999-‐2003 2004-‐2008
RISE IN CEO STOCK AND INCENTIVE PAY
STEP 3:
Yearly average in 2012 dollars
Activity 4
42
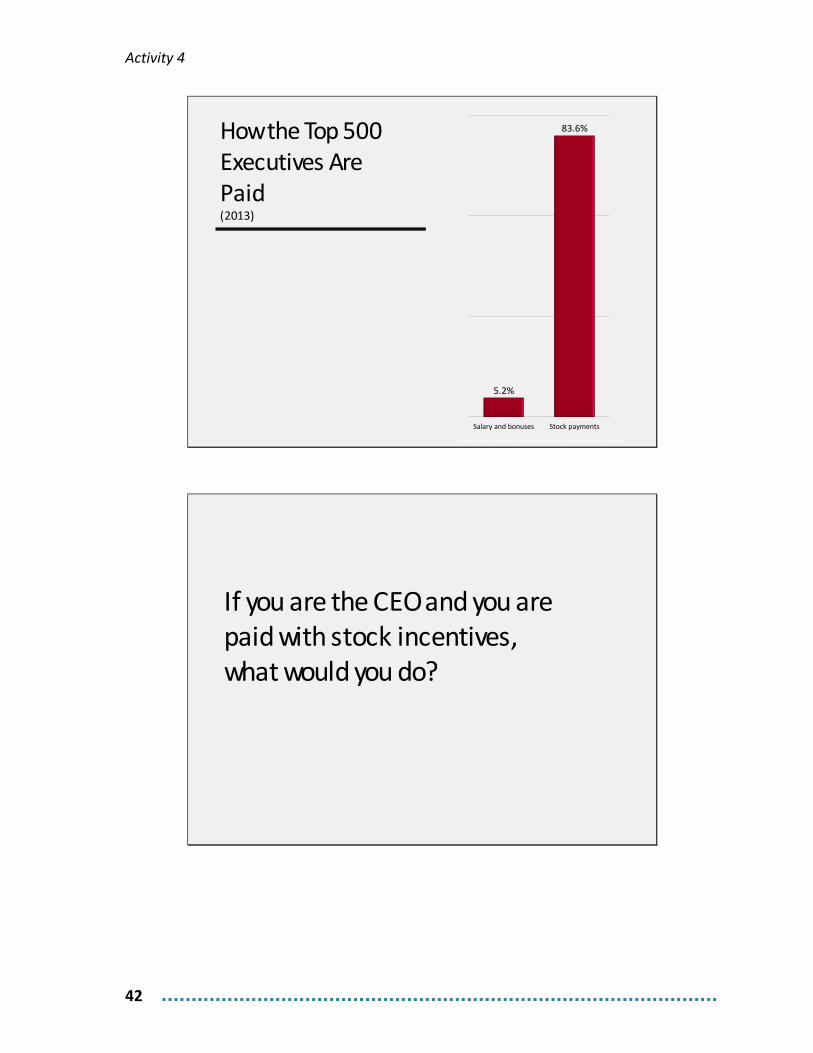
How the Top 500 Executives Are Paid(2013)
5.2%
83.6%
Salary and bonuses Stock payments
Source: Standard & Poor’s ExecuComp database, calculations by Matt Hopkins
If you are the CEO and you are paid with stock incentives, what would you do?
Activity 4
43
Task 3: CEO stock incentives
In your small groups, please answer the following question:
If you are the CEO and you are paid with stock incentives, what would you do?
We’ll now watch the next 6-minute segment of the video.

Activity 4
44
Financial strip-‐mining video segment #2
Use Profits to Buy Back Stock to Raise Its Price and Your Salary!
2%
34%
47%
75%
1981 1986 1991 1996 2001 2006
PERCENTAGE OF CORPORATE PROFITS USED TO BUY BACK STOCK
Source: Data made available by William Lazonick, The Academic-Industry Research Network
STEP 4:
Squeeze the Co. to Pay Back the Loans and to Buy Back Stock
§ Downsize through layoffs§ Ship production abroad § Sell off product lines and divisions§ Speed-‐up production§ Raid pension funds or discontinue them§ Cut wages and benefits§ From “Retain and Reinvest” to “Downsize and Distribute”
STEP 5:
Activity 4
45
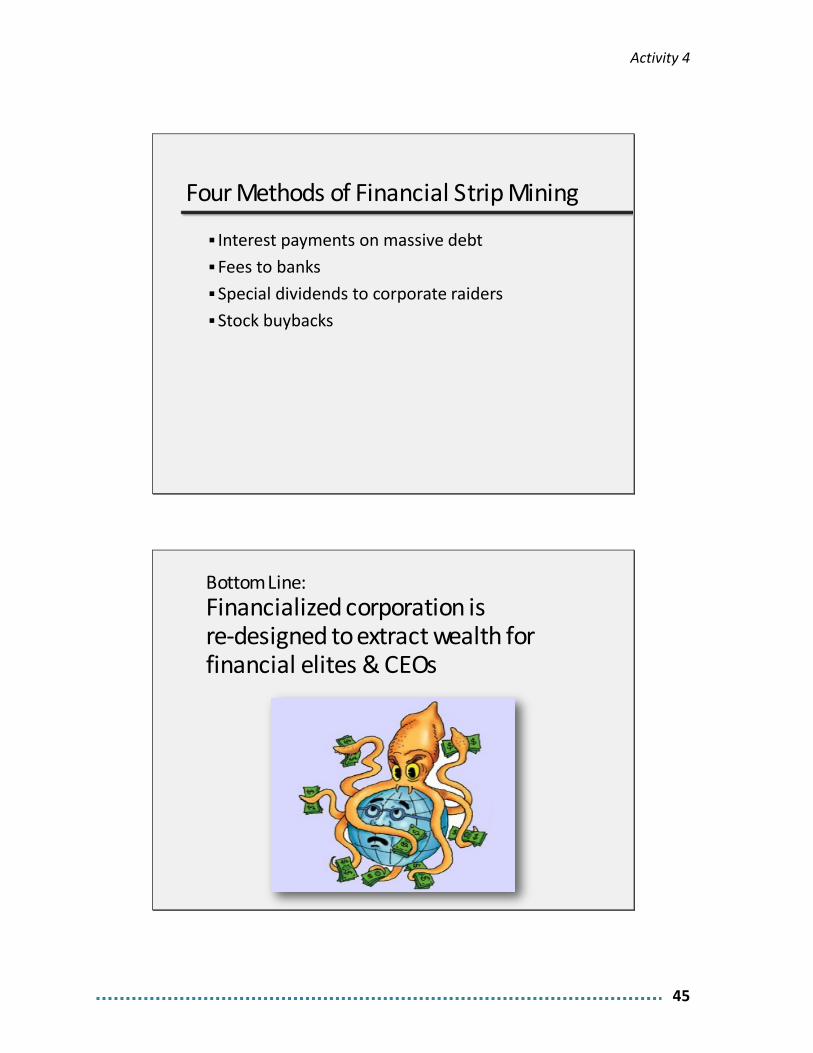
Four Methods of Financial Strip Mining
§ Interest payments on massive debt§Fees to banks§Special dividends to corporate raiders§Stock buybacks
Financialized corporation is re-‐designed to extract wealth for financial elites & CEOs
Bottom Line:

Activity 4
46
Outcomes of Financialization
§Average real wages stagnate§Financial and CEO incomes skyrocket§Good jobs and benefits decline
Activity 4
47
SUMMARY 1. Something big and powerful must have happened to so abruptly separate
average wages from productivity.
2. The biggest cause for stagnating wages is something called “financialization.” That means that the more an economy is based on the financial industry, the bigger the gap between productivity and wages.
3. Financialization means the financial strip-mining of our country�extraction of value from our workplaces by a combination of Wall Street hedge funds, private equity firms and CEOs.
Key takeaway: The huge change in our economy and society was caused by financial strip-‐mining by Wall Street and the rest of the 1%. The only way to stop it―and to reverse runaway inequality—is to build a new mass movement with staying power.


Activity 5
49
ACTIVITY 5: HOW DOES FINANCIAL STRIP-MINING AFFECT US?
Task 1: How does financial strip-‐mining affect you personally?
In your groups, please make a list of the ways that financial strip-mining affects you personally.
▪
▪
▪
▪
▪
Activity 5
50
Task 2: How does financial strip-‐mining affect our workplaces & communities?
Please review the information on pages 51-58. Then, in your groups, use those fact sheets and/or your own experience to answer the question below.
How do financial strip-‐mining and runaway inequality impact our workplaces and communities?
▪
▪
▪
▪
▪
Activity 5
51
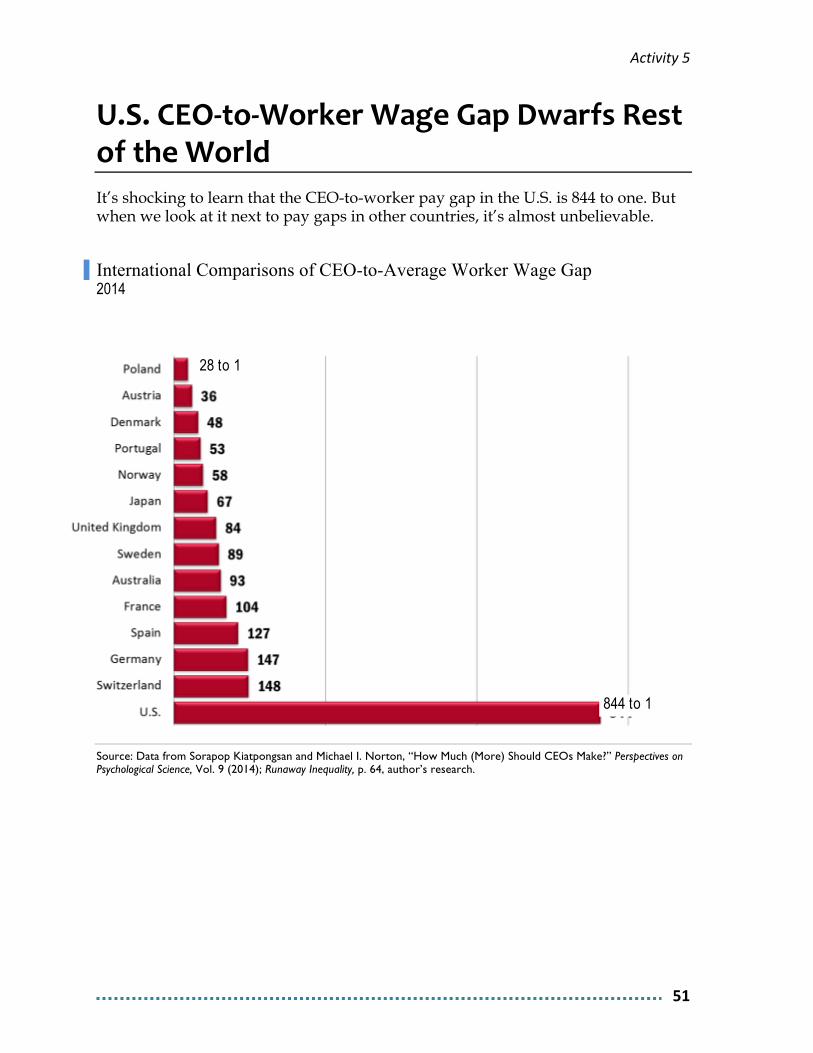
U.S. CEO-‐to-‐Worker Wage Gap Dwarfs Rest of the World It’s shocking to learn that the CEO-to-worker pay gap in the U.S. is 844 to one. But when we look at it next to pay gaps in other countries, it’s almost unbelievable.
International Comparisons of CEO-to-Average Worker Wage Gap 2014
Source: Data from Sorapop Kiatpongsan and Michael I. Norton, “How Much (More) Should CEOs Make?” Perspectives on Psychological Science, Vol. 9 (2014); Runaway Inequality, p. 64, author’s research.
28 to 1
28 to 1
844 to 1
Activity 5
52
$38,786 $40,346 $40,535 $41,367 $42,222
$45,451 $47,998
$53,292 $57,027
$60,953 $61,880 $63,000
$73,487 $79,371 $81,274 $81,610 $81,649
$87,137 $95,542 $95,685
$115,242 $115,245
$119,937 $123,710
$141,410 $153,967
$193,653
United States Kuwait Cyprus
Sweden Germany
Taiwan U.A.E. Spain Qatar
Ireland Netherlands
New Zealand Finland Norway France
Canada Austria
Switzerland Singapore
Iceland United Kingdom
Great Britain Belgium
Italy Japan
Luxembourg Australia
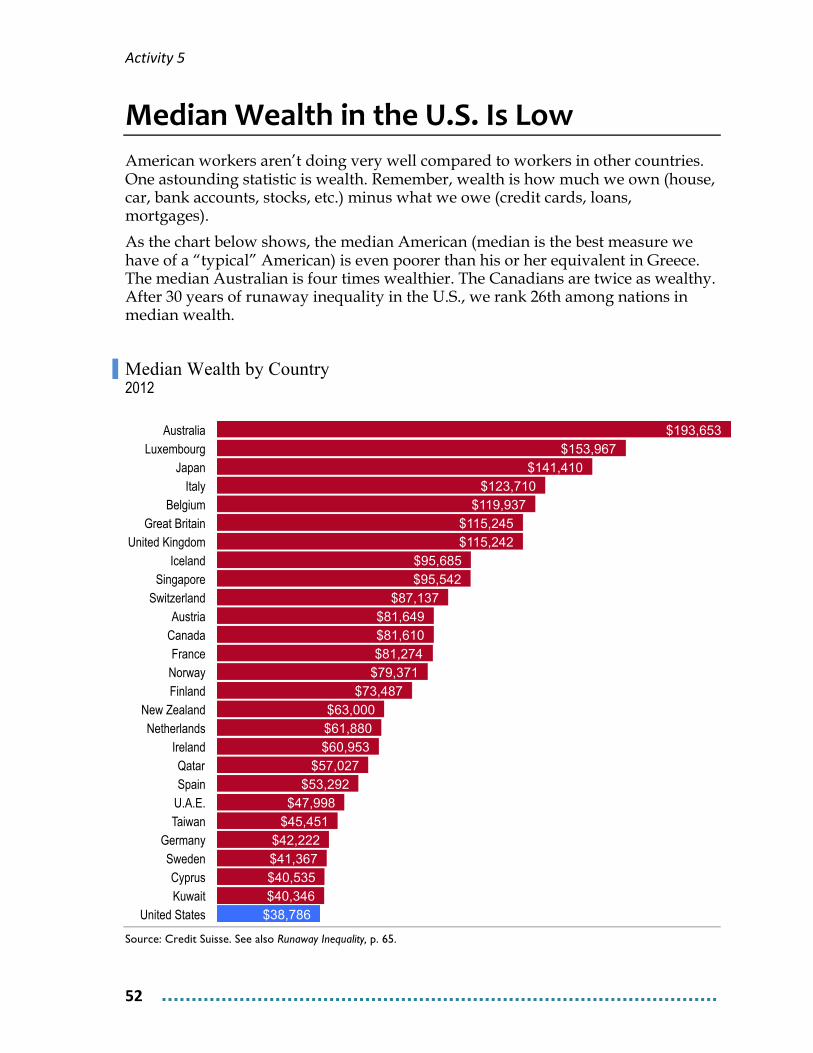
Median Wealth in the U.S. Is Low American workers aren’t doing very well compared to workers in other countries. One astounding statistic is wealth. Remember, wealth is how much we own (house, car, bank accounts, stocks, etc.) minus what we owe (credit cards, loans, mortgages).
As the chart below shows, the median American (median is the best measure we have of a “typical” American) is even poorer than his or her equivalent in Greece. The median Australian is four times wealthier. The Canadians are twice as wealthy. After 30 years of runaway inequality in the U.S., we rank 26th among nations in median wealth.
Median Wealth by Country 2012
Source: Credit Suisse. See also Runaway Inequality, p. 65.
Activity 5
53
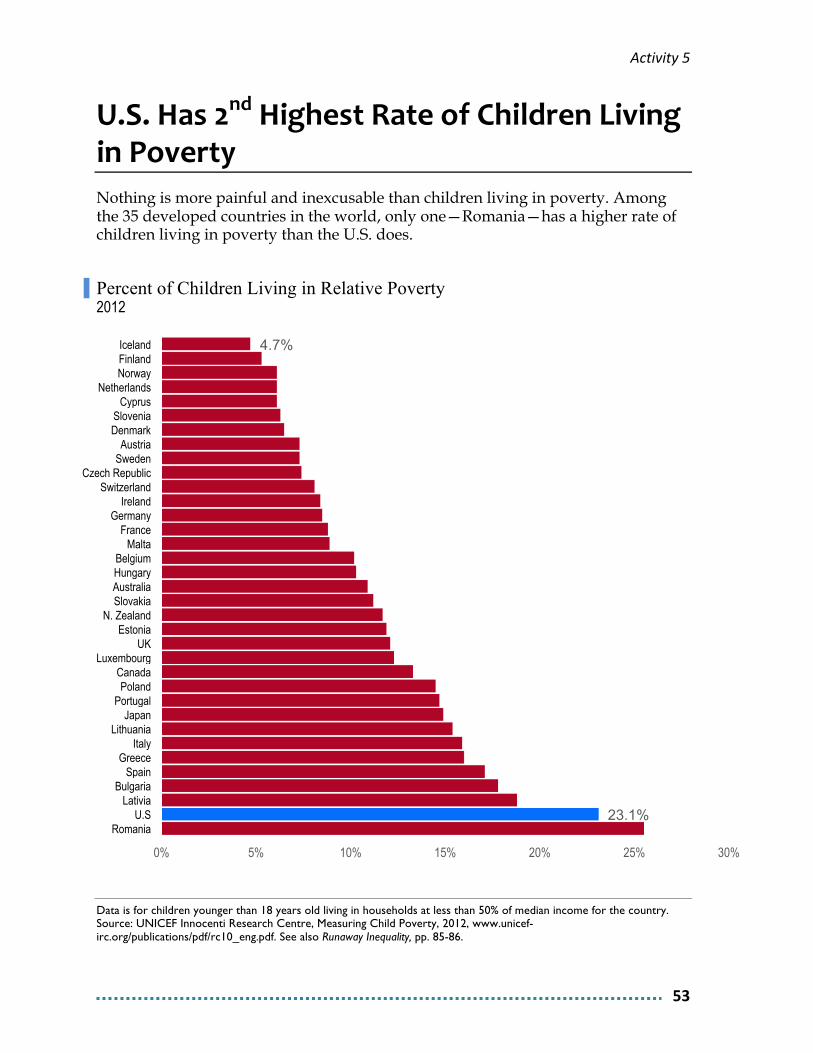
U.S. Has 2nd Highest Rate of Children Living in Poverty Nothing is more painful and inexcusable than children living in poverty. Among the 35 developed countries in the world, only one—Romania—has a higher rate of children living in poverty than the U.S. does.
Percent of Children Living in Relative Poverty 2012
Data is for children younger than 18 years old living in households at less than 50% of median income for the country. Source: UNICEF Innocenti Research Centre, Measuring Child Poverty, 2012, www.unicef-irc.org/publications/pdf/rc10_eng.pdf. See also Runaway Inequality, pp. 85-86.
23.1%
4.7%
0% 5% 10% 15% 20% 25% 30%
Romania U.S
Lativia Bulgaria
Spain Greece
Italy Lithuania
Japan Portugal
Poland Canada
Luxembourg UK
Estonia N. Zealand
Slovakia Australia Hungary Belgium
Malta France
Germany Ireland
Switzerland Czech Republic
Sweden Austria
Denmark Slovenia
Cyprus Netherlands
Norway Finland Iceland
Activity 5
54
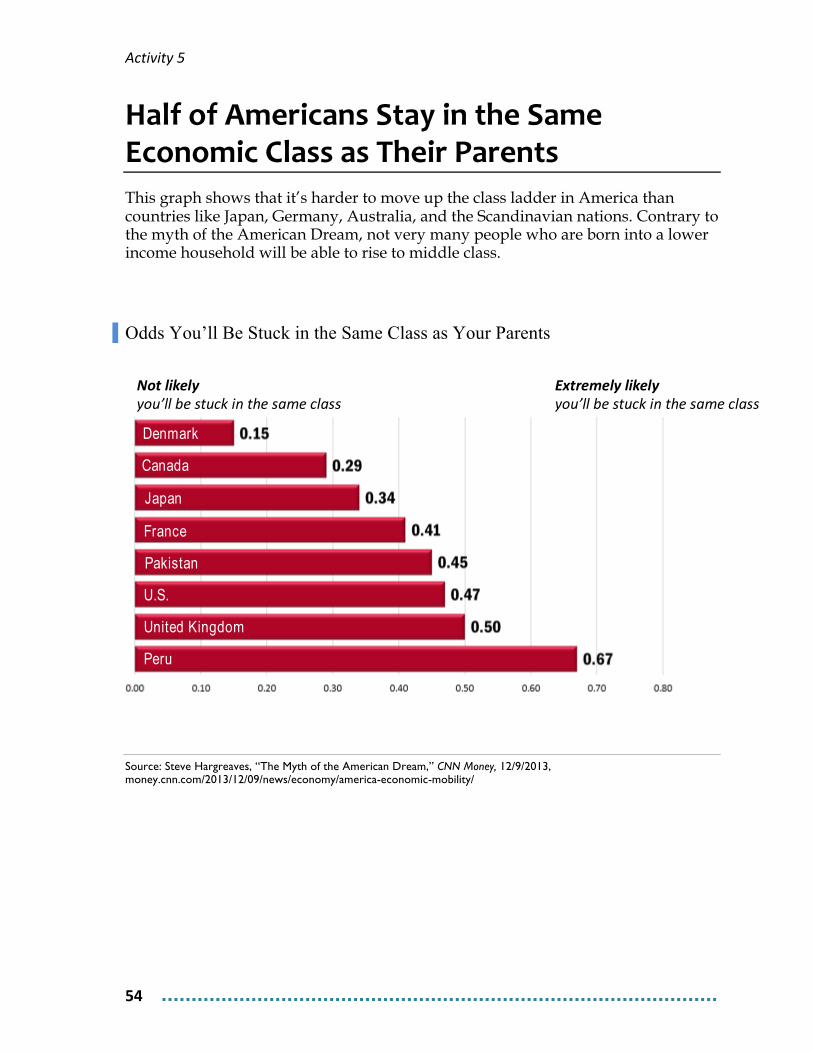
Half of Americans Stay in the Same Economic Class as Their Parents This graph shows that it’s harder to move up the class ladder in America than countries like Japan, Germany, Australia, and the Scandinavian nations. Contrary to the myth of the American Dream, not very many people who are born into a lower income household will be able to rise to middle class.
Odds You’ll Be Stuck in the Same Class as Your Parents
Source: Steve Hargreaves, “The Myth of the American Dream,” CNN Money, 12/9/2013, money.cnn.com/2013/12/09/news/economy/america-economic-mobility/
Not likely you’ll be stuck in the same class
Extremely likely you’ll be stuck in the same class
Denmark
Canada
Peru
Japan
France
Pakistan
U.S.
United Kingdom
Activity 5
55
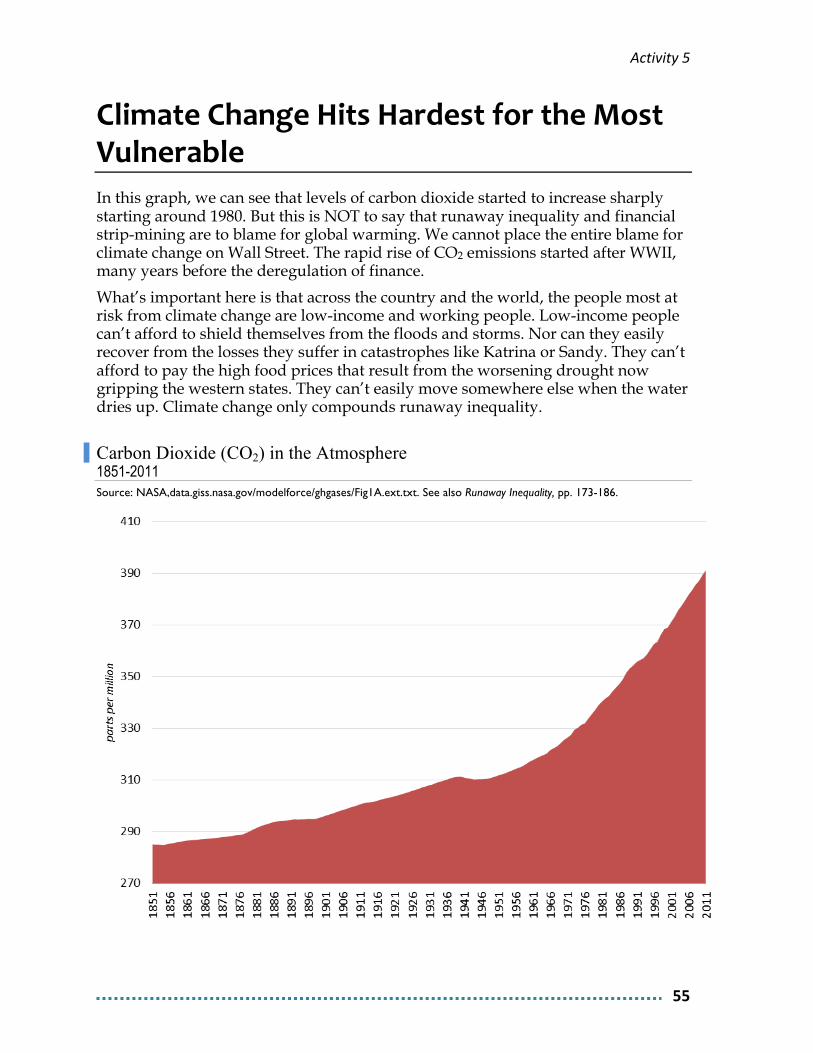
Climate Change Hits Hardest for the Most Vulnerable In this graph, we can see that levels of carbon dioxide started to increase sharply starting around 1980. But this is NOT to say that runaway inequality and financial strip-mining are to blame for global warming. We cannot place the entire blame for climate change on Wall Street. The rapid rise of CO2 emissions started after WWII, many years before the deregulation of finance.
What’s important here is that across the country and the world, the people most at risk from climate change are low-income and working people. Low-income people can’t afford to shield themselves from the floods and storms. Nor can they easily recover from the losses they suffer in catastrophes like Katrina or Sandy. They can’t afford to pay the high food prices that result from the worsening drought now gripping the western states. They can’t easily move somewhere else when the water dries up. Climate change only compounds runaway inequality.
Carbon Dioxide (CO2) in the Atmosphere 1851-2011 Source: NASA,data.giss.nasa.gov/modelforce/ghgases/Fig1A.ext.txt. See also Runaway Inequality, pp. 173-186.
Activity 5
56
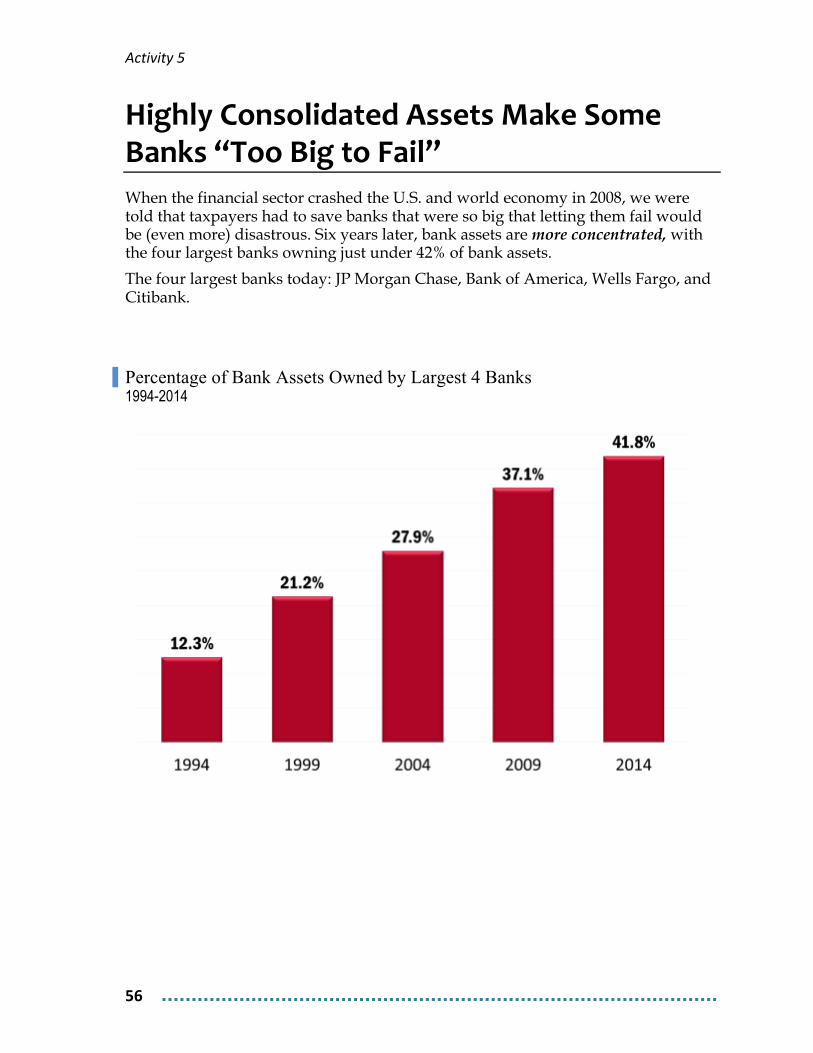
Highly Consolidated Assets Make Some Banks “Too Big to Fail” When the financial sector crashed the U.S. and world economy in 2008, we were told that taxpayers had to save banks that were so big that letting them fail would be (even more) disastrous. Six years later, bank assets are more concentrated, with the four largest banks owning just under 42% of bank assets.
The four largest banks today: JP Morgan Chase, Bank of America, Wells Fargo, and Citibank.
Percentage of Bank Assets Owned by Largest 4 Banks 1994-2014
Activity 5
57
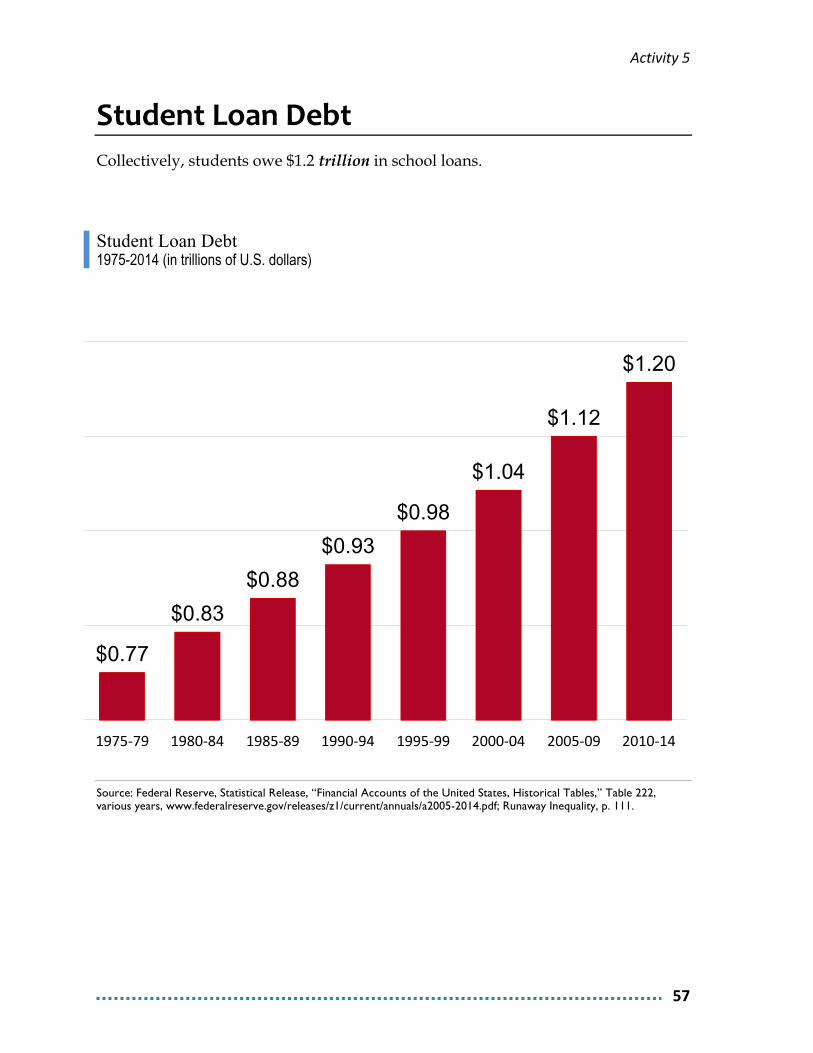
Student Loan Debt Collectively, students owe $1.2 trillion in school loans.
Student Loan Debt 1975-2014 (in trillions of U.S. dollars)
Source: Federal Reserve, Statistical Release, “Financial Accounts of the United States, Historical Tables,” Table 222, various years, www.federalreserve.gov/releases/z1/current/annuals/a2005-2014.pdf; Runaway Inequality, p. 111.
$0.77
$0.83 $0.88
$0.93 $0.98
$1.04
$1.12
$1.20
1975-‐79 1980-‐84 1985-‐89 1990-‐94 1995-‐99 2000-‐04 2005-‐09 2010-‐14
Activity 5
58
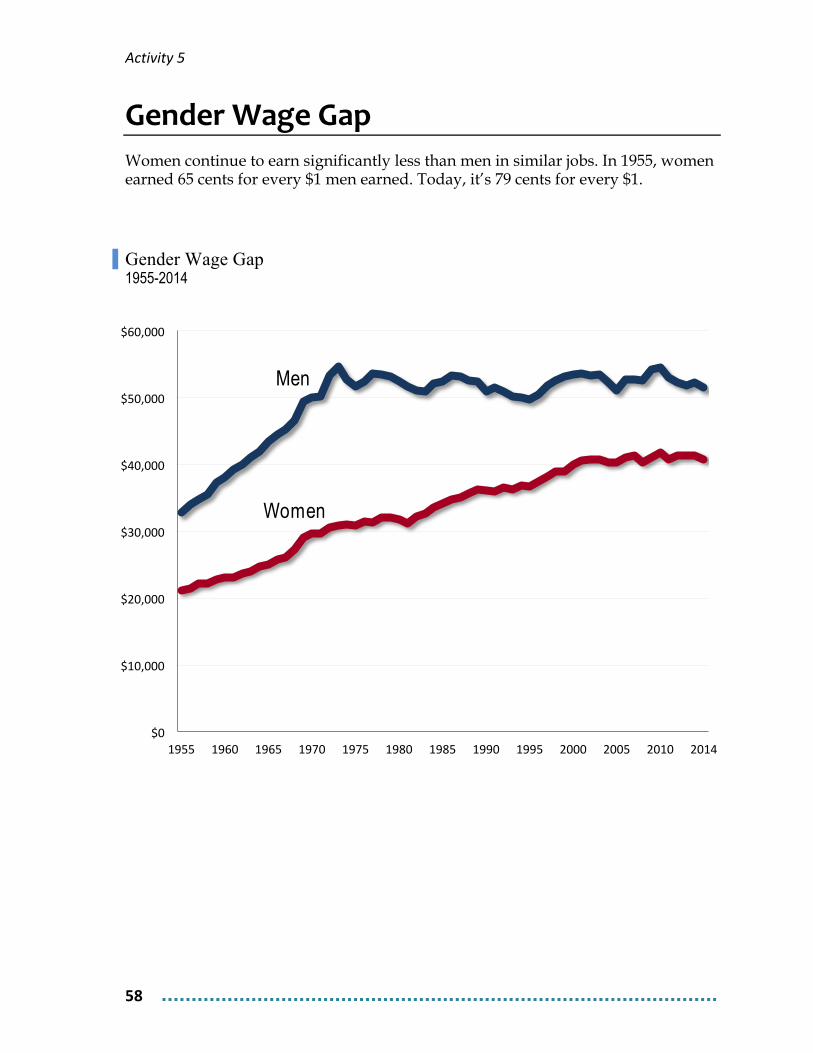
Gender Wage Gap Women continue to earn significantly less than men in similar jobs. In 1955, women earned 65 cents for every $1 men earned. Today, it’s 79 cents for every $1.
Gender Wage Gap 1955-2014
$0
$10,000
$20,000
$30,000
$40,000
$50,000
$60,000
1955 1960 1965 1970 1975 1980 1985 1990 1995 2000 2005 2010 2014
Men
Women
Activity 5
59
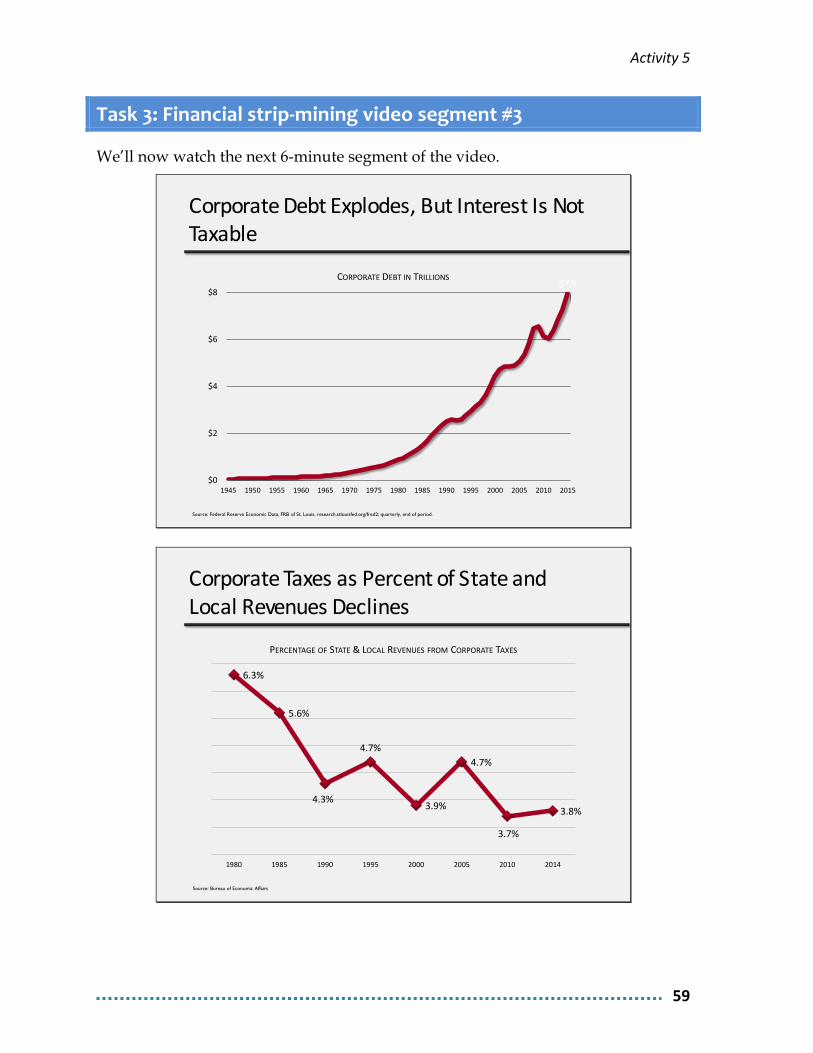
Task 3: Financial strip-‐mining video segment #3
We’ll now watch the next 6-minute segment of the video.
Corporate Debt Explodes, But Interest Is Not Taxable
$7.9
$0
$2
$4
$6
$8
1945 1950 1955 1960 1965 1970 1975 1980 1985 1990 1995 2000 2005 2010 2015
CORPORATE DEBT IN TRILLIONS
Source: Federal Reserve Economic Data, FRB of St. Louis, research.stlouisfed.org/fred2; quarterly, end of period.
Corporate Taxes as Percent of State and Local Revenues Declines
6.3%
5.6%
4.3%
4.7%
3.9%
4.7%
3.7%
3.8%
1980 1985 1990 1995 2000 2005 2010 2014
PERCENTAGE OF STATE & LOCAL REVENUES FROM CORPORATE TAXES
Source: Bureau of Economic Affairs
Activity 5
60
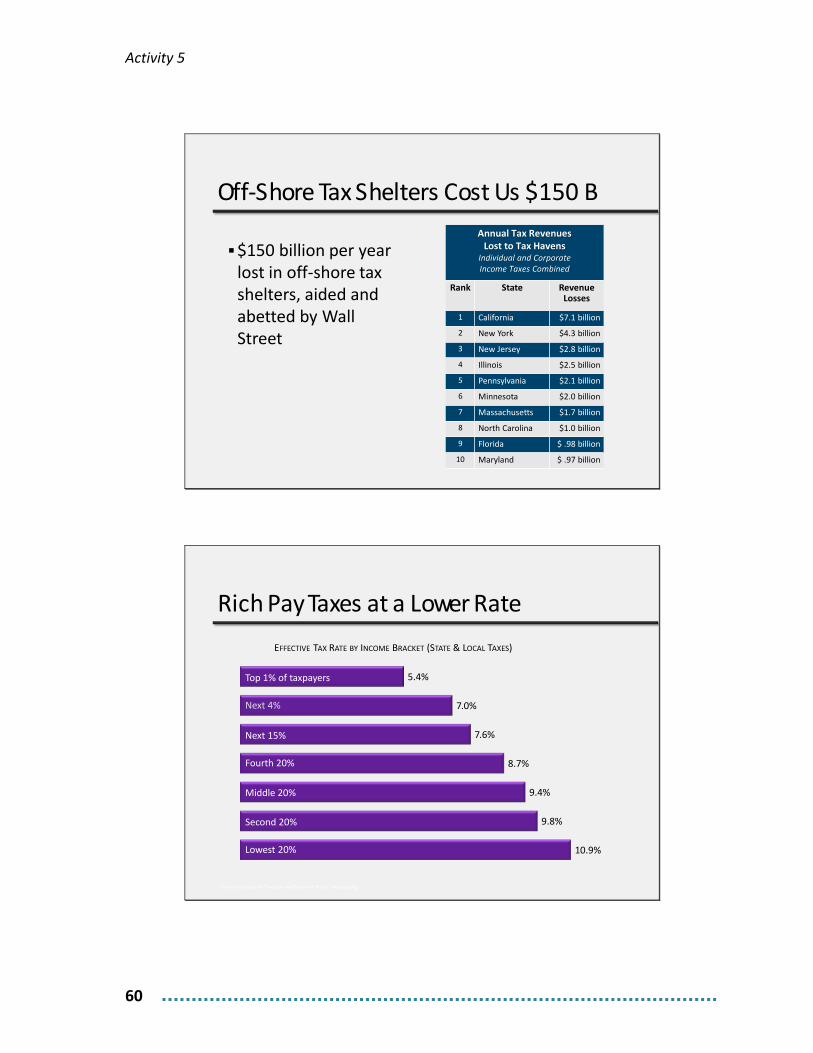
Off-‐Shore Tax Shelters Cost Us $150 B
§$150 billion per year lost in off-‐shore tax shelters, aided and abetted by Wall Street
Annual Tax Revenues Lost to Tax Havens
Individual and Corporate Income Taxes Combined
Rank State Revenue Losses
1 California $7.1 billion
2 New York $4.3 billion
3 New Jersey $2.8 billion
4 Illinois $2.5 billion
5 Pennsylvania $2.1 billion
6 Minnesota $2.0 billion
7 Massachusetts $1.7 billion
8 North Carolina $1.0 billion
9 Florida $ .98 billion
10 Maryland $ .97 billion
Rich Pay Taxes at a Lower Rate
10.9%
9.8%
9.4%
8.7%
7.6%
7.0%
5.4%
EFFECTIVE TAX RATE BY INCOME BRACKET (STATE & LOCAL TAXES)
Source: Institute on Taxation and Economic Policy, whopays.org
Top 1% of taxpayers
Next 4%
Next 15%
Fourth 20%
Middle 20%
Second 20%
Lowest 20%
Activity 5
61
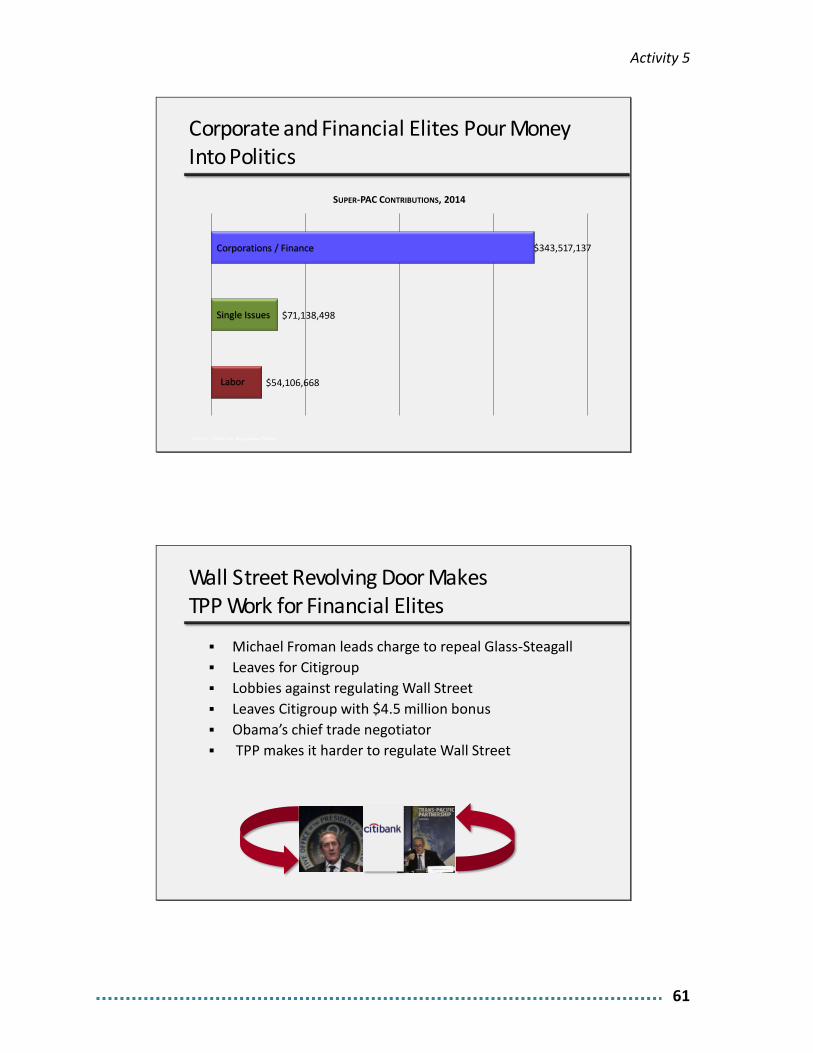
Corporate and Financial Elites Pour Money Into Politics
$54,106,668
$71,138,498
$343,517,137
SUPER-‐PAC CONTRIBUTIONS, 2014
Source: Center for Responsive Politics
Corporations / Finance
Single Issues
Labor
§ Michael Froman leads charge to repeal Glass-‐Steagall§ Leaves for Citigroup § Lobbies against regulating Wall Street§ Leaves Citigroup with $4.5 million bonus § Obama’s chief trade negotiator § TPP makes it harder to regulate Wall Street
Wall Street Revolving Door Makes TPP Work for Financial Elites
Activity 5
62
SUMMARY 1. Because of runaway inequality, we are falling behind many other nations of
the world in terms of childhood poverty, health, education, and worker rights.
2. As financial strip-mining grows, so do the largest banks as more and more areas of our economy go deeply into debt.
3. The combination of rising tax-deductible debt and tax avoidance by the super-rich has reduced their contribution to the public sector, placing more of the burden on the rest of us.
4. This has led to a crisis of the public sector where there never seems to be enough money for vital services and public employees wages and benefits.
Key takeaway: While the super-‐rich dodge taxes and corporations pour their profits into running up stock prices, we bear the burdens: millions of children in poverty, underfunded schools, infrastructure in desperate need of repair, impossible levels of debt.

Activity 6
63
ACTIVITY 6: INSTITUTIONAL RACISM HELPS THE 1% STAY IN POWER Purpose To understand how elites use racial division to maintain the political and economic structures that keep them in power.
Task 1: What is race?
Individuals, institutions, and social structures can discriminate based on race. In the tasks in this activity, we are concentrating on institutional/structural racial discrimination, not individual acts or attitudes.
Please read the fact sheets on pages 64-65. Then in your groups answer the following questions. Please choose a different group member to take notes and report back to the larger group.
Why do you think management created this chart?
Activity 6
64
The Creation of Race To justify enslaving Africans and exterminating indigenous “American Indians,” plantation owners and other economic elites came up with the idea that skin color means biological inferiority—that Blacks and American Indians were subspecies that deserved to be enslaved or killed.
By creating a racial hierarchy, slaveholders and the rest of the 1% of their day protected their economic interests: workers and poor people were divided from one another by race.
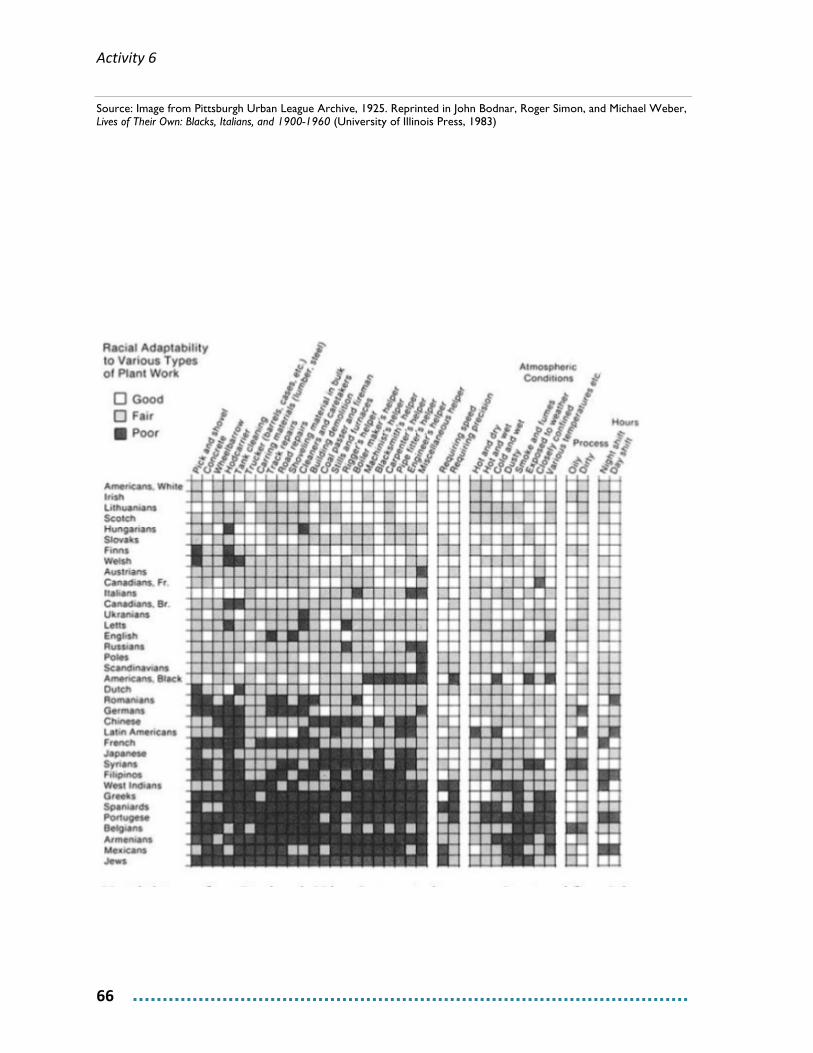
“Race Science” In the late 1800’s, a pseudoscience developed around the idea that race determines how smart we are and what we are capable of doing. By 1920, the Federal government used “race science” to rank groups who could immigrate to the U.S. At the time, nationalities and religions like Italian and Jewish were also assumed to be biological races.
Management at some companies also used “race science” to carve up the workforce into who was qualified to do what. The fact sheet on the next page shows the result of one such effort.
Activity 6
65
An Example of “Race Science” Run Wild
Employment fact sheet of the Central Tube Company, Pittsburgh, 1925: “Racial Adaptability to Various Types of Plant Work” 1925
Activity 6
66
Source: Image from Pittsburgh Urban League Archive, 1925. Reprinted in John Bodnar, Roger Simon, and Michael Weber, Lives of Their Own: Blacks, Italians, and 1900-1960 (University of Illinois Press, 1983)
Activity 6
67
Task 2: Institutional racism in U.S. history
Economic elites have a long history of using race to divide workers who would otherwise cooperate to challenge the powerful. Please read the historical examples on pages 66-69 and then answer the question below in your small groups.
What information in these fact sheets is new to you?
Activity 6
68
Slaves, Servants, Laborers Rebel in 1675 In the late 1600s, economic and social power in the Virginia colony was concentrated in the hands of a few planters. These elites refused to defend colonists’ land from attacks by indigenous people. One white property owner, Nathanial Bacon, decided to attack an indigenous village and stop the raids on the colony. He asked the planter elite for militia support, but they refused.
In response, Bacon
”managed to unite [Black] slaves, [Black and white] indentured servants and poor whites in a revolutionary effort to overthrow the planter elite. Although slaves clearly occupied the lowest positions in the social hierarchy and suffered the most under the plantation system, the condition of indentured whites was barely better, and the majority of free whites lived in extreme poverty…[Bacon] openly condemned the rich for their oppression of the poor and inspired alliance of white and black bond laborers, as well as slaves, who demanded an end to their servitude.”
The rebellion fought the colonial government for months, eventually burning down the capital building. While Bacon’s rebellion was eventually put down by reinforcements sent from England, the uprising was one of the first multiracial coalitions to combat the power of the ruling elite.
To prevent any future multiracial alliance against their interests, the planter elite and colonial authorities “abandoned their heavy reliance on indentured servants in favor of the importation of more black slaves.”
“Deliberately and strategically, the planter extended special privileges to poor whites in an effort to drive a wedge between them and black slaves. White settlers were allowed greater access to Native American lands, white servants were allowed to police slaves through slave patrols and militias, and barriers were created so that free labor would not be placed in competition with slave labor.”
This became know as the “racial bribe.”
“Poor whites suddenly had a direct, personal stake in the existence of a race-based system of slavery. Their own plight had not improved much, but at least they were not slaves.”
The threat of a future alliance between Black slaves and poor whites was effectively ended.
Source: Michelle Alexander The New Jim Crow: Mass Incarceration in the Age of Colorblindness, 2015.
The racial bribe: Give poor whites a direct stake in a race-based system
Activity 6
69
Woodrow Wilson Re-‐Segregates the Federal Government 1913-1921 When Woodrow Wilson, an avowed racist, became president, he imposed complete racial segregation in Washington, firing and demoting Black managers and closing jobs to Blacks.
Civil service jobs provided rare opportunities for advancement, better pay, and security to African Americans. Wilson “believed in white supremacy as government policy” and “destroyed the careers of thousands of talented and accomplished black civil servants.”
One of these civil servants was John Davis, hired in 1882 as a laborer and rising to midlevel management. He supervised both white and black employees.
Once Wilson became president, Davis was demoted and then transferred from one department to another in a number of menial jobs.
His grandson recounts the toll it took on Davis:
“John Davis, a self-made black man of achievement and stature in his community at the turn of the 20th century, was, by the end of Wilson’s first term, a broken man.”
“What is most striking is his sense of humiliation; after all, he had spent his career in a time and place where, whatever was happening in the South, African-Americans were able to get ahead. And then, suddenly, with Wilson’s election, that all changed.”
Thousands of other Black men and women suffered the same fate. Just a few years after Wilson’s election, almost all Black managers had been demoted to menial jobs or fired.
Sources: Gordon Davis, “What Woodrow Wilson Cost My Grandfather,” New York Times, 11/24/2015, www.nytimes.com/2015/11/24/opinion/what-woodrow-wilson-cost-my-grandfather.html; Eric S. Yellin, Racism in the Nation’s Service, uncpress.unc.edu/books/T-8889.html; “The Rise and Fall of Jim Crow,” www.pbs.org/wnet/jimcrow/stories_events_segregation.html
Woodrow Wilson believed in white supremacy as
Activity 6
70
Railroad Companies & Chinese Laborers 1860’s-1890’s
With the boom across the U.S. west, railroad companies like Central Pacific needed a huge amount of cheap labor. However, due to the hardship faced in building the transcontinental railroad, the company couldn’t keep workers for very long. After a wage dispute launched by Irish workers, the company focused its recruitment efforts on Chinese migrants. The Central Pacific Railroad recruited more than 12,000 Chinese laborers, mostly from the south of China.
The Chinese workers were paid less than white, usually Irish, workers ($27-30 per month versus $35 plus free board for Irish workers). Once the railroad was completed, the trains brought more workers west who displaced the Chinese. An anti-Chinese movement of laws and mob violence culminated in the Chinese Exclusion Act in 1882.
It was the first ban in the U.S. based on nationality. In 1924, the U.S. banned virtually all migrants from Asia; loopholes often allowed white people from those countries to migrate.
Sources: American Experience, “Transcontinental Railroad,” www.pbs.org/wgbh/americanexperience/features/general-article/tcrr-cprr/; “Modern Immigration Wave Brings 59 Million to U.S., Driving Population Growth and Change Through 2065,” www.pewhispanic.org/2015/09/28/chapter-1-the-nations-immigration-laws-1920-to-today/ September 28, 2015; Ancestors in the Americas,” www.pbs.org/ancestorsintheamericas/timeline.html; Larry Pletcher, It Happened in Massachusetts, Morris Books, 2009; Tomas Almaguer, Racial Fault Lines, University of California Press, 1994, 2009.
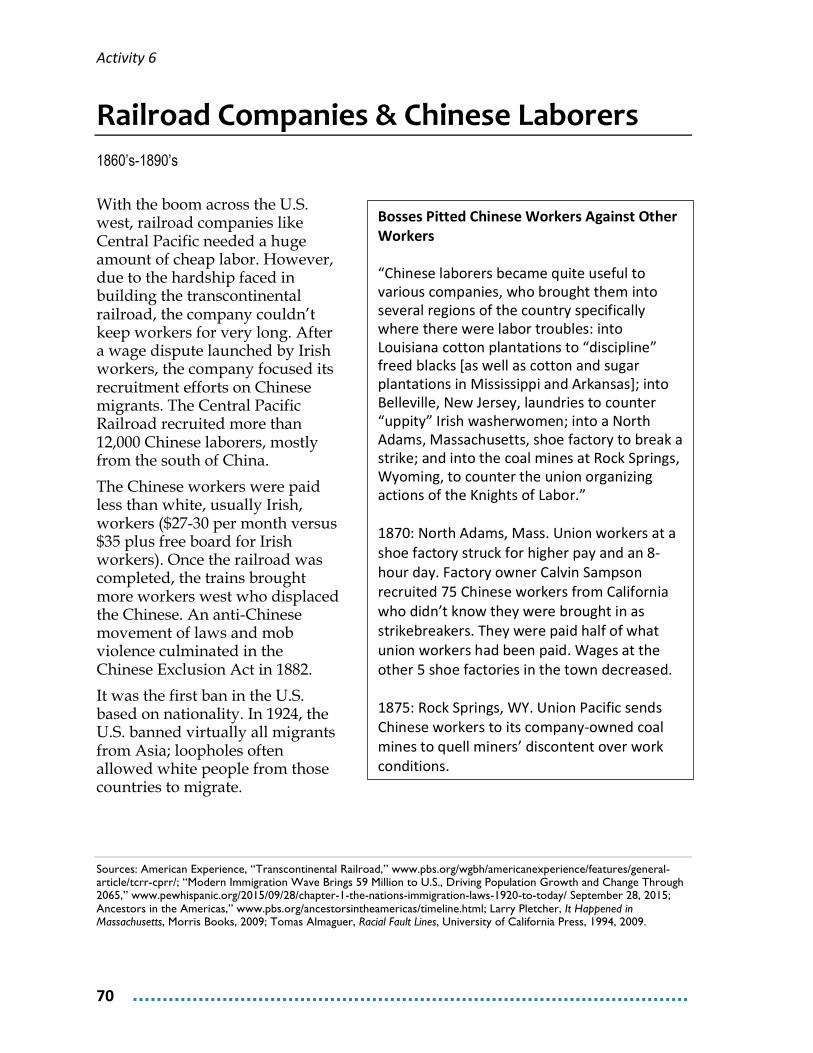
Bosses Pitted Chinese Workers Against Other Workers
“Chinese laborers became quite useful to various companies, who brought them into several regions of the country specifically where there were labor troubles: into Louisiana cotton plantations to “discipline” freed blacks [as well as cotton and sugar plantations in Mississippi and Arkansas]; into Belleville, New Jersey, laundries to counter “uppity” Irish washerwomen; into a North Adams, Massachusetts, shoe factory to break a strike; and into the coal mines at Rock Springs, Wyoming, to counter the union organizing actions of the Knights of Labor.”
1870: North Adams, Mass. Union workers at a shoe factory struck for higher pay and an 8-‐hour day. Factory owner Calvin Sampson recruited 75 Chinese workers from California who didn’t know they were brought in as strikebreakers. They were paid half of what union workers had been paid. Wages at the other 5 shoe factories in the town decreased.
1875: Rock Springs, WY. Union Pacific sends Chinese workers to its company-‐owned coal mines to quell miners’ discontent over work conditions.
Activity 6
71
Mexican Migrants Used as Disposable Labor by U.S Corporate Agriculture 1940’s-1960’s ‘In this camp, we have no names. We are called only by numbers.’ -- Mexican Bracero guest worker, 1950’s (quoted in Strangers in Our Fields, Ernesto Galraza)
The Bracero Program gave temporary entry into the U.S. to millions of Mexican agricultural workers between 1942 and 1964. Agriculture companies claimed that World War II would create a labor shortage. Unions countered that the program was simply a way to get cheaper labor.
Guest workers’ contracts gave them rights such as minimum or prevailing wage; adequate, sanitary, and free housing; and the right to recoup lost wages. The reality was vastly different. Housing was substandard, growers deducted money for food, housing and other expenses, while workers could wait around for months between jobs. Workers were not even allowed to enter the U.S. before being sprayed with DDT, a toxic pesticide eventually banned in the U.S. in 1972.
Labor organizer Ernesto Galarza concluded that workers were lied to, cheated and “shamefully neglected.” The U.S. Department of Labor officer in charge of the program, Lee G. Williams, described the program as a system of “legalized slavery.”
Braceros were pitted against workers from the U.S.:
“The availability of braceros undermined the ability of U.S. workers to demand higher wages. During the 1950s, growers brought in braceros when their U.S. workers either went on strike or merely threatened to do so. In the late 1950s and early 1960’s, Cesar Chavez mounted farmworker protests over the program and later said that organizing the United Farm Workers would have been impossible had the bracero program not been abolished in 1964.”
Sources: Southern Poverty Law Center, “Close to Slavery: Guestworker Programs in the United States,” 2013, www.splcenter.org/20130218/close-slavery-guestworker-programs-united-states; Bracero History Archive, www.braceroarchive.org; National Museum of American History ,”Opportunity or Exploitation: The Bracero Program”, amhistory.si.edu/onthemove/themes/story_51_5.html; David Bacon, “Fast Track to the Past: Is a New Bracero Program in Our Future? (and what was life like under the old one),” Aug. 8, 2002, dbacon.igc.org/Imgrants/17FastPast.htm
Cesar Chavez said that it would have been impossible to organize the United Farm Workers if the Bracero
Activity 6
72
Task 3: Legacies of Institutional racism
We’ll now watch a portion of an interview of Michelle Alexander, author of The New Jim Crow: Mass Incarceration in the Age of Colorblindness.
MSNBC, April 5, 2016
After we watch the video, please discuss the following question in your small groups:
What did you get out of the video?
Activity 6
73
Task 4: Institutional racism in the 21st century
In your small groups, please read the fact sheets on pages 73-78, then answer the question below.
How does institutional racism contribute to runaway inequality?
Activity 6
74
Segregated Housing Reinforces Inequity Researchers have quantified some of the economic impact of growing up in a poor neighborhood. One long-term study compared children whose families were relocated from Chicago public housing with children whose families remained in the area.
Children from the relocated families went on to earn 16% more than those who grew up in public housing. They were 9% more likely to be employed. Over all, being kicked out of public housing might add about $45,000 to each child’s lifetime earnings. The effects may be even larger for those who moved while they were young.
Segregated, Under-resourced Neighborhoods Are No Accident Like everything else about runaway inequality, the fact that a huge proportion of housing is segregated by both race/ethnicity and income is no accident.
In fact, federal policy was a major force in creating it. The Federal Housing Authority, established during the New Deal to help working people become homeowners, financed homes for millions of white families in the suburbs at the expense of “inner cities.”
Federal Policy Overtly Discriminated Against Non-whites The FHA helped more than 11 million families to buy homes in the suburbs from 1934-1975. The agency issued virtually no mortgages in the growing suburbs to anyone who wasn’t white, even when they qualified. The net result: almost all-Black and Latino urban ghettos and almost all-white suburbs.
The FHA further reinforced the racial segregation of neighborhoods through policies like:
▪ red-lining (making minority neighborhoods were ineligible for mortgages);
▪ “advising” developers and builders to draw up restrictive covenants which prohibited non-whites from buying homes in various neighborhoods.
Jobs Followed Housing to the White Suburbs Between 1954 and 1965, greater than half of the new businesses, stores, schools and hospitals were built outside the central cities. The new jobs that came with this boom were far from the central cities where so many African-Americans and Latinos were segregated.
Source: Justin Wolfers, “Growing Up in a Bad Neighborhood Does More Harm Than We Thought,” New York Times, 3/25/2016, www.nytimes.com/2016/03/27/upshot/growing-up-in-a-bad-neighborhood-does-more-harm-than-we-thought.html, citing Ed Chyn, “Moved to Opportunity,” 3/27/2016,
Activity 6
75
Voter Suppression
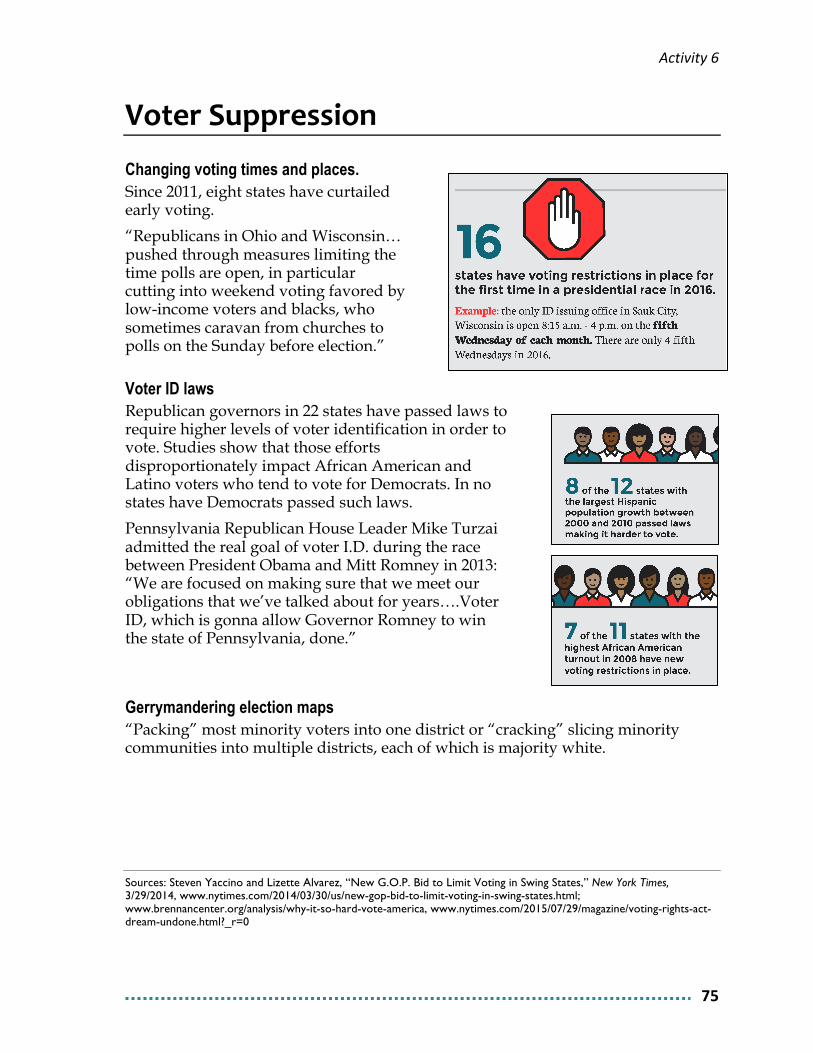
Changing voting times and places. Since 2011, eight states have curtailed early voting.
“Republicans in Ohio and Wisconsin… pushed through measures limiting the time polls are open, in particular cutting into weekend voting favored by low-income voters and blacks, who sometimes caravan from churches to polls on the Sunday before election.”
Voter ID laws Republican governors in 22 states have passed laws to require higher levels of voter identification in order to vote. Studies show that those efforts disproportionately impact African American and Latino voters who tend to vote for Democrats. In no states have Democrats passed such laws.
Pennsylvania Republican House Leader Mike Turzai admitted the real goal of voter I.D. during the race between President Obama and Mitt Romney in 2013: “We are focused on making sure that we meet our obligations that we’ve talked about for years….Voter ID, which is gonna allow Governor Romney to win the state of Pennsylvania, done.”
Gerrymandering election maps “Packing” most minority voters into one district or “cracking” slicing minority communities into multiple districts, each of which is majority white.
Sources: Steven Yaccino and Lizette Alvarez, “New G.O.P. Bid to Limit Voting in Swing States,” New York Times, 3/29/2014, www.nytimes.com/2014/03/30/us/new-gop-bid-to-limit-voting-in-swing-states.html; www.brennancenter.org/analysis/why-it-so-hard-vote-america, www.nytimes.com/2015/07/29/magazine/voting-rights-act-dream-undone.html?_r=0
Activity 6
76
6 Million People Disenfranchised Forty-eight states and the District of Columbia restrict felons’ right to vote. Currently, there are currently almost six million people who have served their sentences and are disenfranchised. These laws date back to the late 1800’s and early 1900’s “when Southern lawmakers were working feverishly to neutralize the black electorate.”
”Poll taxes, literacy tests, grandfather clauses and cross burnings were effective weapons in this campaign. But statutes that allowed correctional systems to arbitrarily and permanently strip large numbers of people of the right to vote were a particularly potent tool in the campaign to undercut African-American political power.”
State felony bans:
“exploded in number during the late 1860s and 1870s, particularly in the wake of the Fifteenth Amendment, which ostensibly guaranteed black Americans the right to vote.”
A study also “found that the larger the state’s black population, the more likely the state was to pass the most stringent laws that permanently denied people convicted of crimes the right to vote.”
“The white supremacists who championed such measures were very clear on their reasons. …[V]oting laws needed to be amended, lest whites be swept away at the polls by the black vote.”
Sources: The Sentencing Project; Brent Staples, “The Racist Origins of Felon Disenfranchisement,” New York Times,
11/18/2014, ; Angela Behrens, Christopher Uggen, and Jeff Manza.’Ballot Manipulation and the “Menace of Negro Domination”: Racial Threat and Felon Disenfranchisement in the United States, 1850-2000.’ American Journal of Sociology 109 (2003): 559-605.
Voting Rights Restored to 200,000
In 2016, Governor Terry McAuliffe of Virginia ended a lifetime felony ban and restored voting rights to more than 200,000 people. McAuliffe acknowledged the direct tie of felony disenfranchisement to Virginia’s racist history. “There’s no question that we’ve had a horrible history in voting rights as relates to African Americans—we should remedy it.”
Activity 6
77
Disproportionate Drug Sentencing White people use drugs at higher rates than African Americans or Latinos. Yet, blacks are arrested for drug possession more than three times as often as whites.
▪ Nearly 20 percent of whites have used cocaine, compared with 10 percent of blacks and Latinos
▪ African Americans and Latinos are disproportionately represented in the prison population.
▪ One reason was the hundredfold difference in sentencing between crack cocaine (used more by minorities) and powdered cocaine (used more by whites). A 5-year mandatory sentence was given for 500 grams of powered cocaine�or for 5 grams of crack cocaine.
▪ In 2010, the Fair Sentencing Act shrank the difference from 100:1 to 18:1.
A Human Rights Watch report, also offered a broader explanation for this discrepancy.
“The race issue isn’t just that the judge is going, ‘Oh, black man, I’m gonna sentence you higher,’“ she said. “The police go into low-income minority neighborhoods and that’s where they make most of their drug arrests. If they arrest you, now you have a ‘prior,’ so if you plead or get arrested again, you’re gonna have a higher sentence. There’s a kind of cumulative effect.”
The consequences have impacts long after someone has served their sentence:
▪ Students who have been convicted of drug possession are barred from receiving federal financial aid and substantial education tax credits.
▪ Public housing assistance can be denied to anyone who has been convicted of a felony drug offense.
▪ Employers often require applicants to disclose their criminal histories, despite a growing nationwide movement to ban that practice.
Sources: Human Rights Watch, 2009; Survey from the Substance Abuse and Mental Health Services Administration, 2011 (most recent data available); www.huffingtonpost.com/2013/09/17/racial-disparity-drug-use_n_3941346.html

Activity 6
78
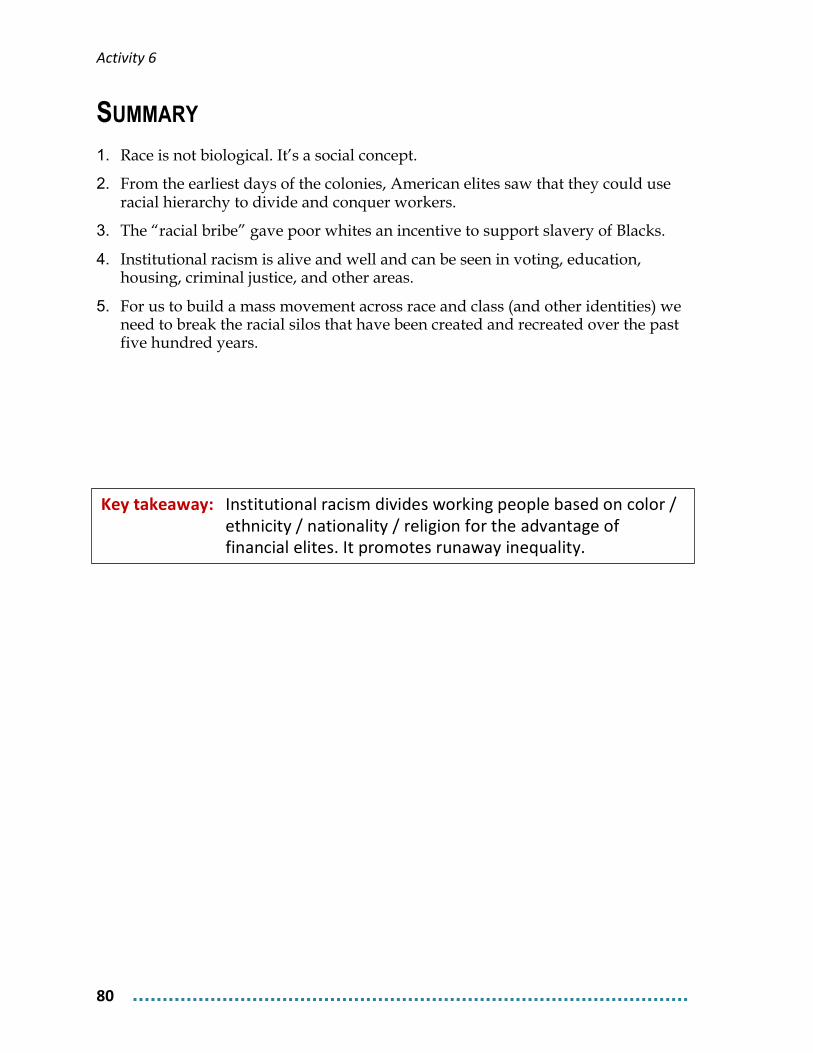
Disparate Effects on Health ‘
Latino Health Disparities (Compared to Non-Hispanic Whites)
African American Health Disparities (Compared to Non-Hispanic Whites)
Sour
ce: f
amili
esus
a.or
g/pr
oduc
t/af
rica
n-am
eric
an-h
ealth
-dis
pari
ties-
com
pare
d-to
-non
-hisp
anic
-whi
tes
Activity 6
79
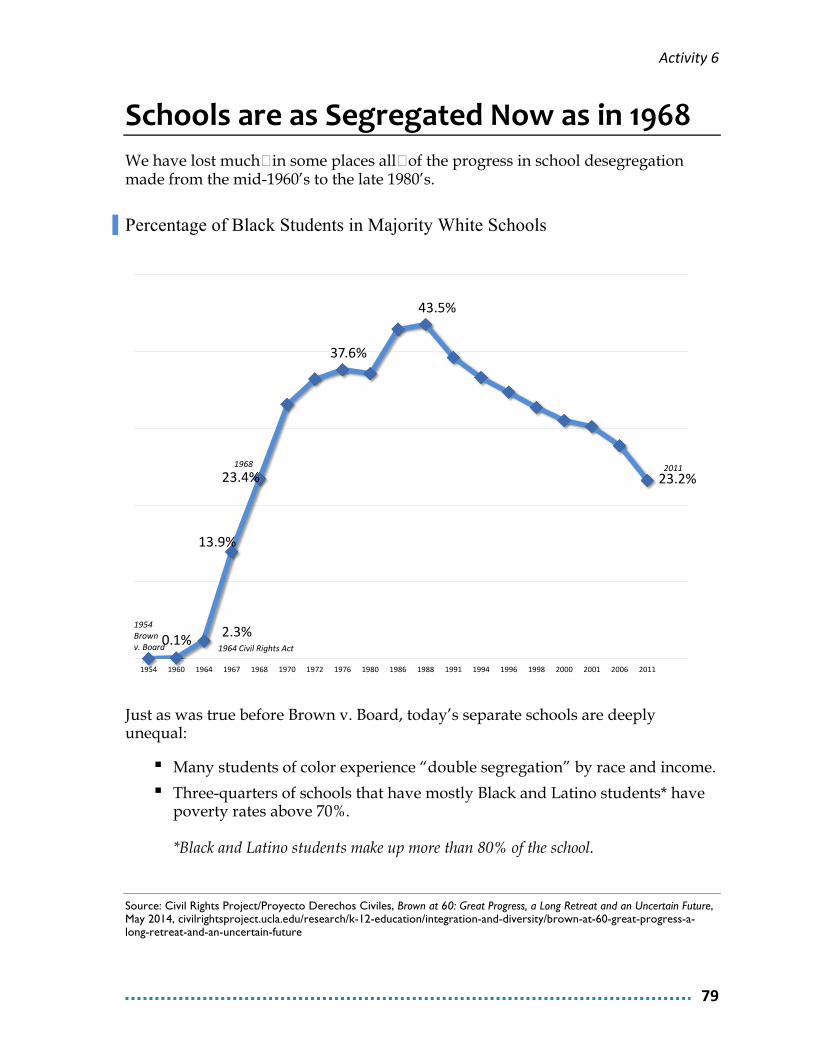
Schools are as Segregated Now as in 1968 We have lost much�in some places all�of the progress in school desegregation made from the mid-1960’s to the late 1980’s.
Percentage of Black Students in Majority White Schools
Just as was true before Brown v. Board, today’s separate schools are deeply unequal:
▪ Many students of color experience “double segregation” by race and income.
▪ Three-quarters of schools that have mostly Black and Latino students* have poverty rates above 70%. *Black and Latino students make up more than 80% of the school.
Source: Civil Rights Project/Proyecto Derechos Civiles, Brown at 60: Great Progress, a Long Retreat and an Uncertain Future, May 2014, civilrightsproject.ucla.edu/research/k-12-education/integration-and-diversity/brown-at-60-great-progress-a-long-retreat-and-an-uncertain-future
0.1% 2.3%
13.9%
23.4%
37.6%
43.5%
23.2%
1954 1960 1964 1967 1968 1970 1972 1976 1980 1986 1988 1991 1994 1996 1998 2000 2001 2006 2011
1964 Civil Rights Act
1954 Brown v. Board
1968 2011
Activity 6
80
SUMMARY 1. Race is not biological. It’s a social concept.
2. From the earliest days of the colonies, American elites saw that they could use racial hierarchy to divide and conquer workers.
3. The “racial bribe” gave poor whites an incentive to support slavery of Blacks.
4. Institutional racism is alive and well and can be seen in voting, education, housing, criminal justice, and other areas.
5. For us to build a mass movement across race and class (and other identities) we need to break the racial silos that have been created and recreated over the past five hundred years.
Key takeaway: Institutional racism divides working people based on color / ethnicity / nationality / religion for the advantage of financial elites. It promotes runaway inequality.
Activity 7
81
ACTIVITY 7: TAKING ON WALL STREET TO REVERSE RUNAWAY INEQUALITY Task
In your small groups, read the passage below, then follow the instructions on the next page.
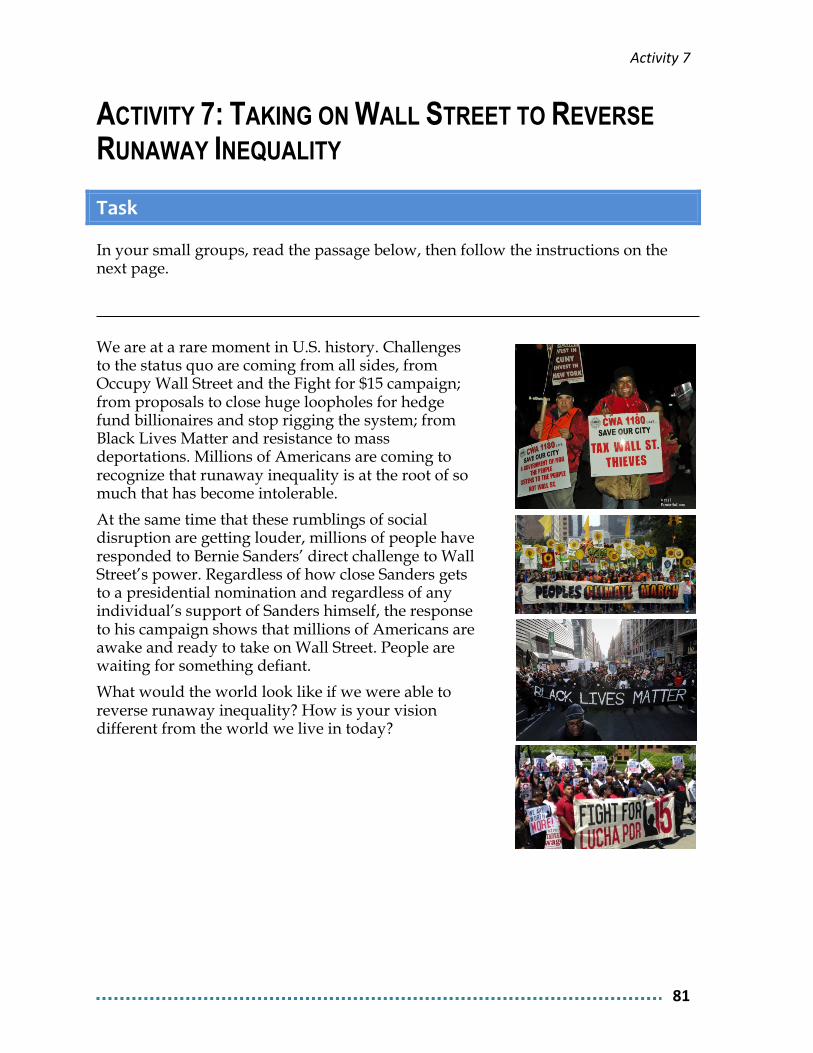
We are at a rare moment in U.S. history. Challenges to the status quo are coming from all sides, from Occupy Wall Street and the Fight for $15 campaign; from proposals to close huge loopholes for hedge fund billionaires and stop rigging the system; from Black Lives Matter and resistance to mass deportations. Millions of Americans are coming to recognize that runaway inequality is at the root of so much that has become intolerable.
At the same time that these rumblings of social disruption are getting louder, millions of people have responded to Bernie Sanders’ direct challenge to Wall Street’s power. Regardless of how close Sanders gets to a presidential nomination and regardless of any individual’s support of Sanders himself, the response to his campaign shows that millions of Americans are awake and ready to take on Wall Street. People are waiting for something defiant.
What would the world look like if we were able to reverse runaway inequality? How is your vision different from the world we live in today?

Activity 7
82
1. Your trainers will give each group a piece of easel paper and some markers. Please make a map or drawing of what your community might be like in a world without runaway inequality.
Each group will bring its drawing to the front of the room and describe their vision.
2. What is your role as a movement builder in creating this future?
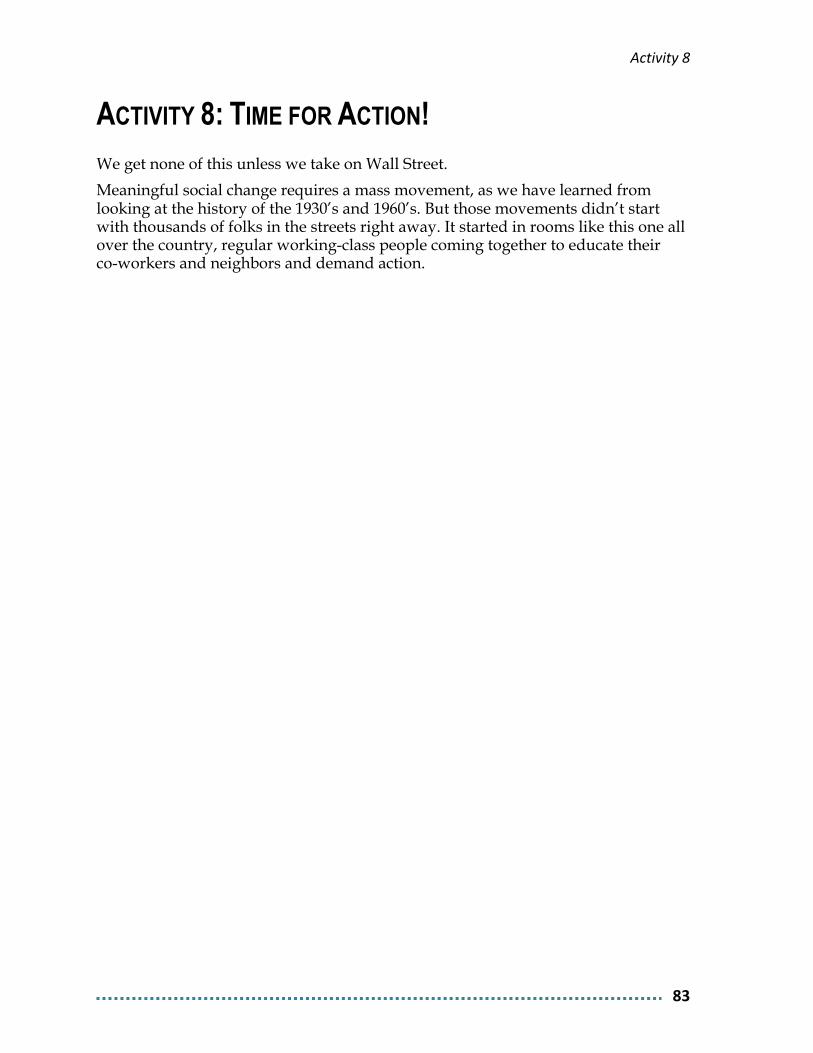
Activity 8
83
ACTIVITY 8: TIME FOR ACTION! We get none of this unless we take on Wall Street.
Meaningful social change requires a mass movement, as we have learned from looking at the history of the 1930’s and 1960’s. But those movements didn’t start with thousands of folks in the streets right away. It started in rooms like this one all over the country, regular working-class people coming together to educate their co-workers and neighbors and demand action.

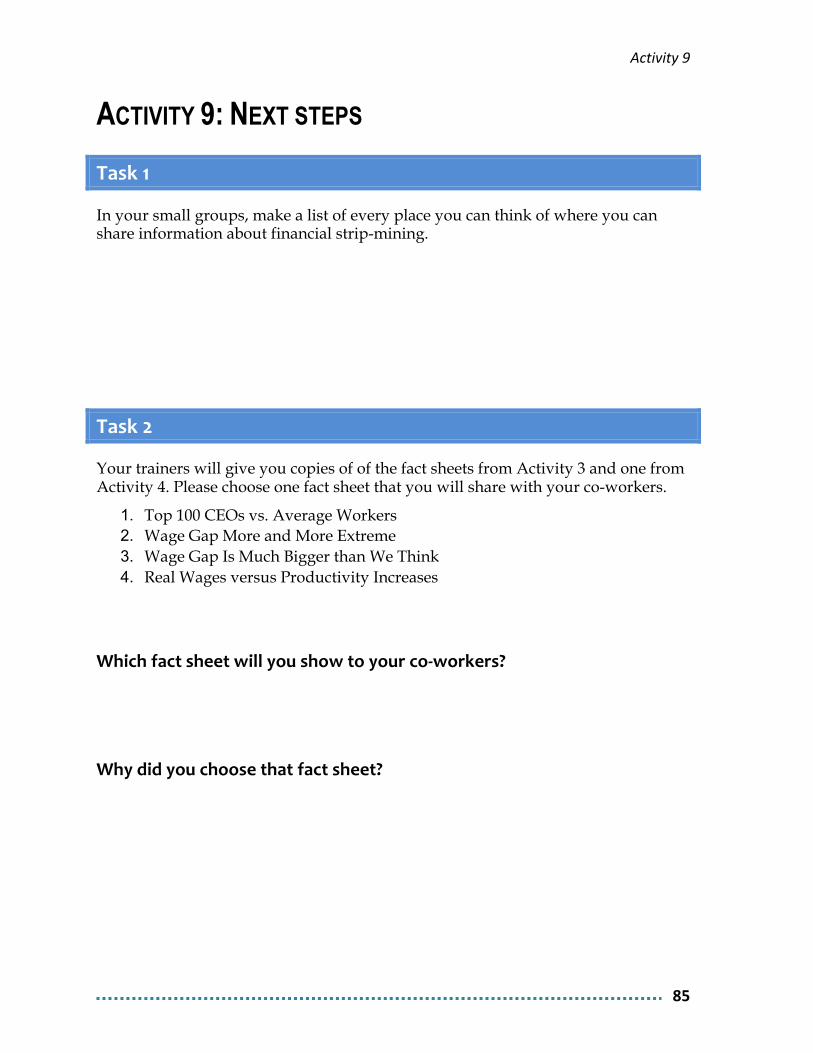
Activity 9
85
ACTIVITY 9: NEXT STEPS Task 1
In your small groups, make a list of every place you can think of where you can share information about financial strip-mining.
Task 2
Your trainers will give you copies of of the fact sheets from Activity 3 and one from Activity 4. Please choose one fact sheet that you will share with your co-workers.
1. Top 100 CEOs vs. Average Workers 2. Wage Gap More and More Extreme 3. Wage Gap Is Much Bigger than We Think 4. Real Wages versus Productivity Increases
Which fact sheet will you show to your co-‐workers?
Why did you choose that fact sheet?
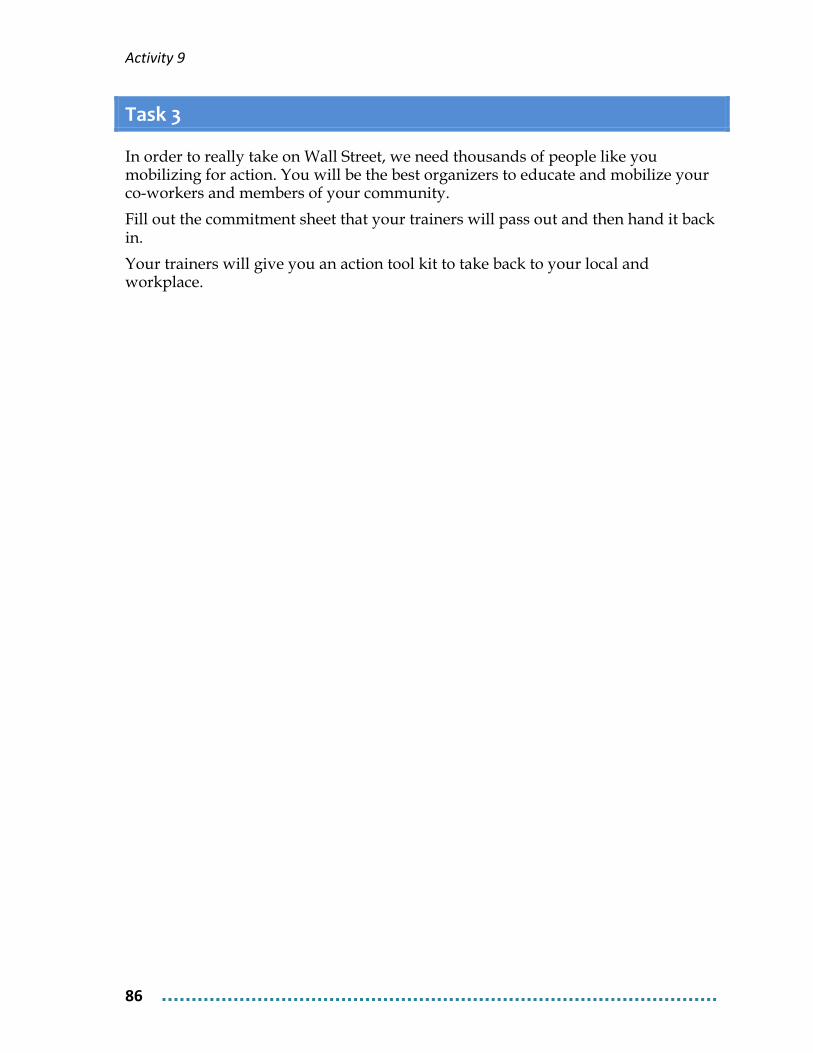
Activity 9
86
Task 3
In order to really take on Wall Street, we need thousands of people like you mobilizing for action. You will be the best organizers to educate and mobilize your co-workers and members of your community.
Fill out the commitment sheet that your trainers will pass out and then hand it back in.
Your trainers will give you an action tool kit to take back to your local and workplace.
Activity 9
87
FINAL TAKEAWAYS 1. Runaway inequality will not cure itself.
2. It will take a massive popular movement to counter runaway inequality.
3. We are the ones who will build that movement. We need to take on a new identity as silo busters and movement builders.

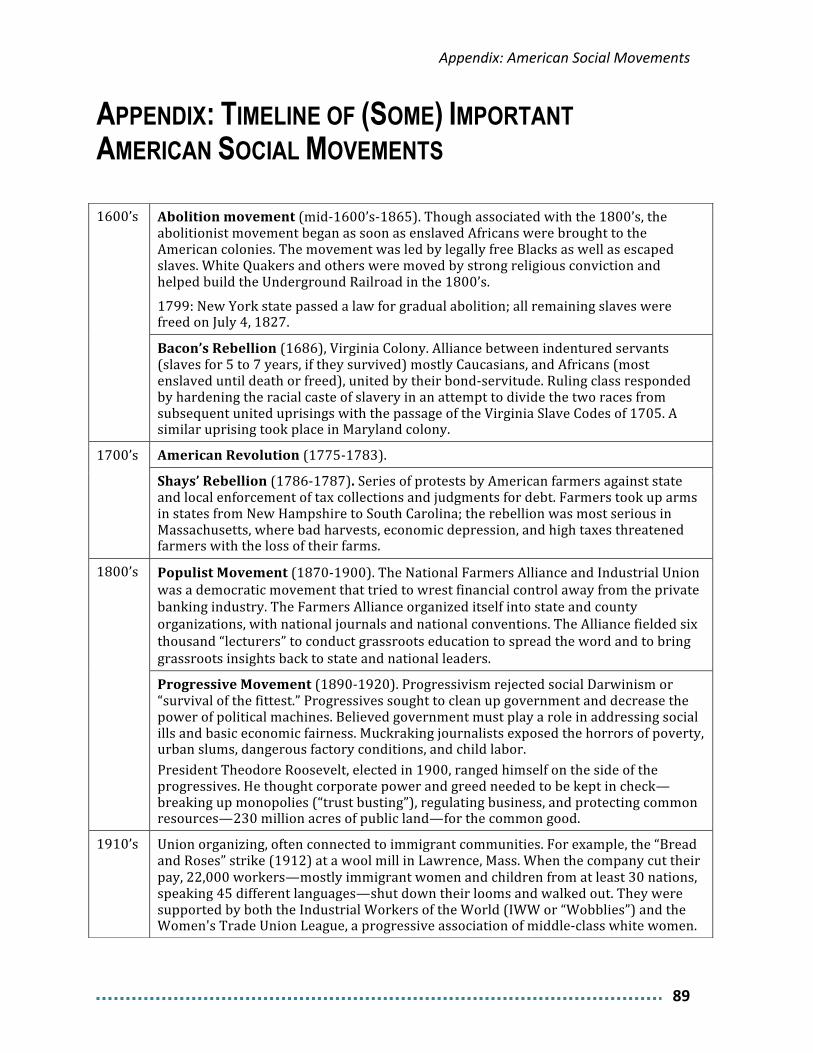
Appendix: American Social Movements
89
APPENDIX: TIMELINE OF (SOME) IMPORTANT AMERICAN SOCIAL MOVEMENTS
1600’s Abolition movement (mid-‐1600’s-‐1865). Though associated with the 1800’s, the abolitionist movement began as soon as enslaved Africans were brought to the American colonies. The movement was led by legally free Blacks as well as escaped slaves. White Quakers and others were moved by strong religious conviction and helped build the Underground Railroad in the 1800’s.
1799: New York state passed a law for gradual abolition; all remaining slaves were freed on July 4, 1827.
Bacon’s Rebellion (1686), Virginia Colony. Alliance between indentured servants (slaves for 5 to 7 years, if they survived) mostly Caucasians, and Africans (most enslaved until death or freed), united by their bond-‐servitude. Ruling class responded by hardening the racial caste of slavery in an attempt to divide the two races from subsequent united uprisings with the passage of the Virginia Slave Codes of 1705. A similar uprising took place in Maryland colony.
1700’s American Revolution (1775-‐1783).
Shays’ Rebellion (1786-‐1787). Series of protests by American farmers against state and local enforcement of tax collections and judgments for debt. Farmers took up arms in states from New Hampshire to South Carolina; the rebellion was most serious in Massachusetts, where bad harvests, economic depression, and high taxes threatened farmers with the loss of their farms.
1800’s
Populist Movement (1870-‐1900). The National Farmers Alliance and Industrial Union was a democratic movement that tried to wrest financial control away from the private banking industry. The Farmers Alliance organized itself into state and county organizations, with national journals and national conventions. The Alliance fielded six thousand “lecturers” to conduct grassroots education to spread the word and to bring grassroots insights back to state and national leaders.
Progressive Movement (1890-‐1920). Progressivism rejected social Darwinism or “survival of the fittest.” Progressives sought to clean up government and decrease the power of political machines. Believed government must play a role in addressing social ills and basic economic fairness. Muckraking journalists exposed the horrors of poverty, urban slums, dangerous factory conditions, and child labor. President Theodore Roosevelt, elected in 1900, ranged himself on the side of the progressives. He thought corporate power and greed needed to be kept in check—breaking up monopolies (“trust busting”), regulating business, and protecting common resources—230 million acres of public land—for the common good.
1910’s Union organizing, often connected to immigrant communities. For example, the “Bread and Roses” strike (1912) at a wool mill in Lawrence, Mass. When the company cut their pay, 22,000 workers—mostly immigrant women and children from at least 30 nations, speaking 45 different languages—shut down their looms and walked out. They were supported by both the Industrial Workers of the World (IWW or “Wobblies”) and the Women's Trade Union League, a progressive association of middle-‐class white women.
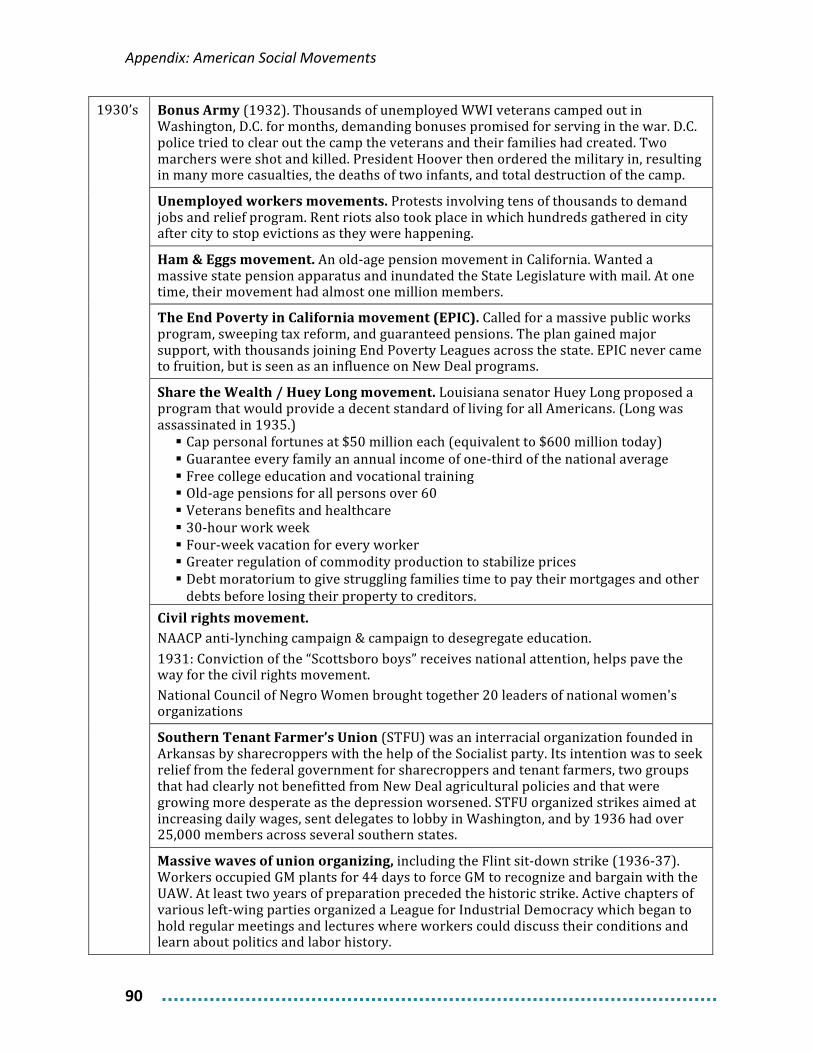
Appendix: American Social Movements
90
1930’s Bonus Army (1932). Thousands of unemployed WWI veterans camped out in Washington, D.C. for months, demanding bonuses promised for serving in the war. D.C. police tried to clear out the camp the veterans and their families had created. Two marchers were shot and killed. President Hoover then ordered the military in, resulting in many more casualties, the deaths of two infants, and total destruction of the camp.
Unemployed workers movements. Protests involving tens of thousands to demand jobs and relief program. Rent riots also took place in which hundreds gathered in city after city to stop evictions as they were happening.
Ham & Eggs movement. An old-‐age pension movement in California. Wanted a massive state pension apparatus and inundated the State Legislature with mail. At one time, their movement had almost one million members.
The End Poverty in California movement (EPIC). Called for a massive public works program, sweeping tax reform, and guaranteed pensions. The plan gained major support, with thousands joining End Poverty Leagues across the state. EPIC never came to fruition, but is seen as an influence on New Deal programs.
Share the Wealth / Huey Long movement. Louisiana senator Huey Long proposed a program that would provide a decent standard of living for all Americans. (Long was assassinated in 1935.)
§ Cap personal fortunes at $50 million each (equivalent to $600 million today) § Guarantee every family an annual income of one-‐third of the national average § Free college education and vocational training § Old-‐age pensions for all persons over 60 § Veterans benefits and healthcare § 30-‐hour work week § Four-‐week vacation for every worker § Greater regulation of commodity production to stabilize prices § Debt moratorium to give struggling families time to pay their mortgages and other debts before losing their property to creditors.
Civil rights movement. NAACP anti-‐lynching campaign & campaign to desegregate education. 1931: Conviction of the “Scottsboro boys” receives national attention, helps pave the way for the civil rights movement. National Council of Negro Women brought together 20 leaders of national women's organizations
Southern Tenant Farmer’s Union (STFU) was an interracial organization founded in Arkansas by sharecroppers with the help of the Socialist party. Its intention was to seek relief from the federal government for sharecroppers and tenant farmers, two groups that had clearly not benefitted from New Deal agricultural policies and that were growing more desperate as the depression worsened. STFU organized strikes aimed at increasing daily wages, sent delegates to lobby in Washington, and by 1936 had over 25,000 members across several southern states.
Massive waves of union organizing, including the Flint sit-‐down strike (1936-‐37). Workers occupied GM plants for 44 days to force GM to recognize and bargain with the UAW. At least two years of preparation preceded the historic strike. Active chapters of various left-‐wing parties organized a League for Industrial Democracy which began to hold regular meetings and lectures where workers could discuss their conditions and learn about politics and labor history.
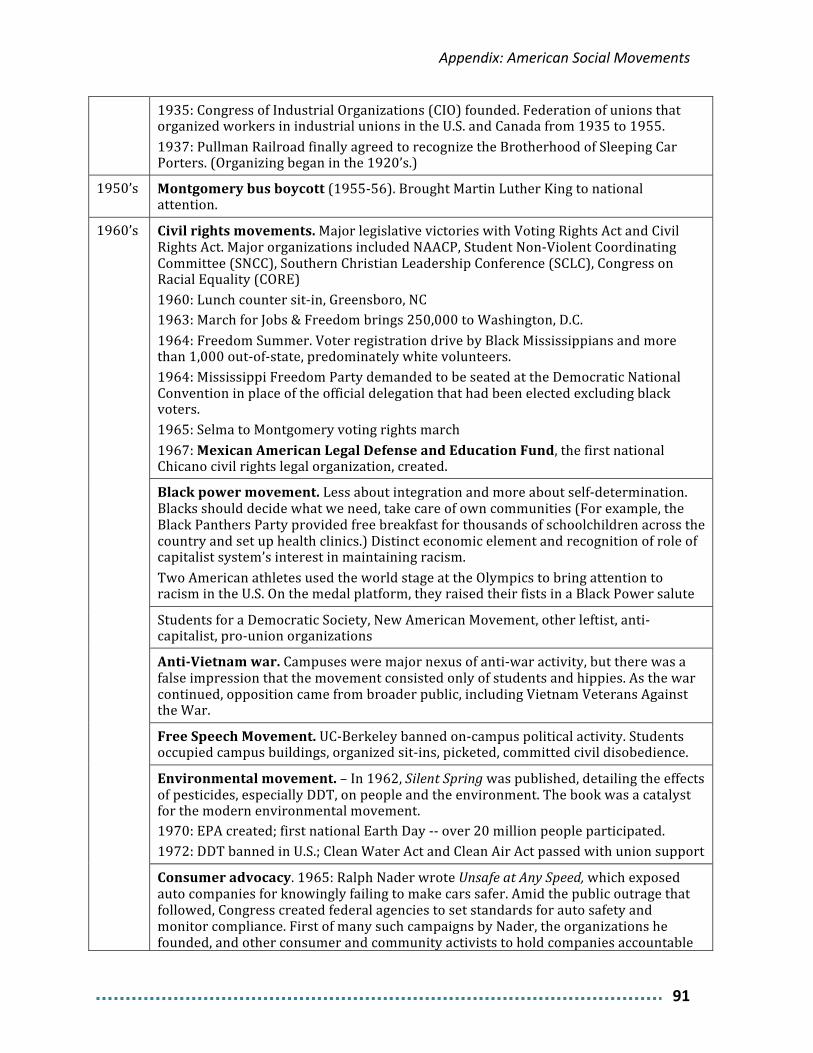
Appendix: American Social Movements
91
1935: Congress of Industrial Organizations (CIO) founded. Federation of unions that organized workers in industrial unions in the U.S. and Canada from 1935 to 1955. 1937: Pullman Railroad finally agreed to recognize the Brotherhood of Sleeping Car Porters. (Organizing began in the 1920’s.)
1950’s Montgomery bus boycott (1955-‐56). Brought Martin Luther King to national attention.
1960’s Civil rights movements. Major legislative victories with Voting Rights Act and Civil Rights Act. Major organizations included NAACP, Student Non-‐Violent Coordinating Committee (SNCC), Southern Christian Leadership Conference (SCLC), Congress on Racial Equality (CORE) 1960: Lunch counter sit-‐in, Greensboro, NC 1963: March for Jobs & Freedom brings 250,000 to Washington, D.C. 1964: Freedom Summer. Voter registration drive by Black Mississippians and more than 1,000 out-‐of-‐state, predominately white volunteers. 1964: Mississippi Freedom Party demanded to be seated at the Democratic National Convention in place of the official delegation that had been elected excluding black voters. 1965: Selma to Montgomery voting rights march 1967: Mexican American Legal Defense and Education Fund, the first national Chicano civil rights legal organization, created.
Black power movement. Less about integration and more about self-‐determination. Blacks should decide what we need, take care of own communities (For example, the Black Panthers Party provided free breakfast for thousands of schoolchildren across the country and set up health clinics.) Distinct economic element and recognition of role of capitalist system’s interest in maintaining racism. Two American athletes used the world stage at the Olympics to bring attention to racism in the U.S. On the medal platform, they raised their fists in a Black Power salute
Students for a Democratic Society, New American Movement, other leftist, anti-‐capitalist, pro-‐union organizations
Anti-‐Vietnam war. Campuses were major nexus of anti-‐war activity, but there was a false impression that the movement consisted only of students and hippies. As the war continued, opposition came from broader public, including Vietnam Veterans Against the War.
Free Speech Movement. UC-‐Berkeley banned on-‐campus political activity. Students occupied campus buildings, organized sit-‐ins, picketed, committed civil disobedience.
Environmental movement. – In 1962, Silent Spring was published, detailing the effects of pesticides, especially DDT, on people and the environment. The book was a catalyst for the modern environmental movement. 1970: EPA created; first national Earth Day -‐-‐ over 20 million people participated. 1972: DDT banned in U.S.; Clean Water Act and Clean Air Act passed with union support
Consumer advocacy. 1965: Ralph Nader wrote Unsafe at Any Speed, which exposed auto companies for knowingly failing to make cars safer. Amid the public outrage that followed, Congress created federal agencies to set standards for auto safety and monitor compliance. First of many such campaigns by Nader, the organizations he founded, and other consumer and community activists to hold companies accountable
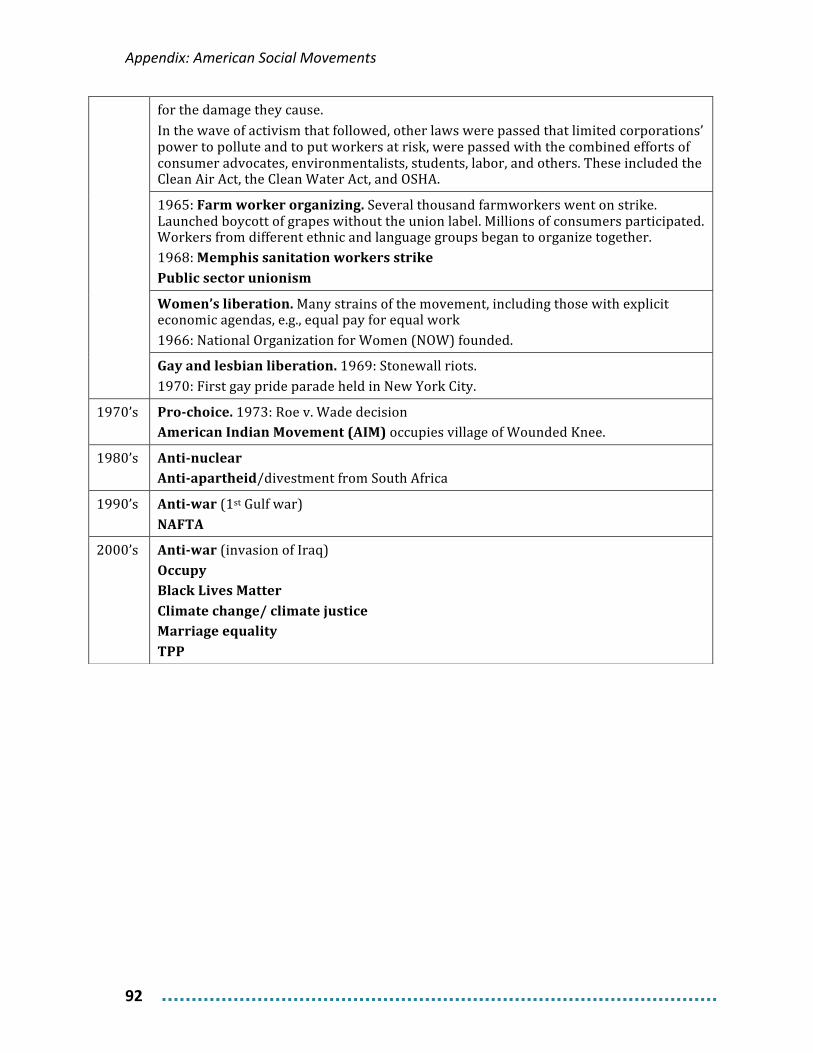
Appendix: American Social Movements
92
for the damage they cause. In the wave of activism that followed, other laws were passed that limited corporations’ power to pollute and to put workers at risk, were passed with the combined efforts of consumer advocates, environmentalists, students, labor, and others. These included the Clean Air Act, the Clean Water Act, and OSHA.
1965: Farm worker organizing. Several thousand farmworkers went on strike. Launched boycott of grapes without the union label. Millions of consumers participated. Workers from different ethnic and language groups began to organize together. 1968: Memphis sanitation workers strike Public sector unionism
Women’s liberation. Many strains of the movement, including those with explicit economic agendas, e.g., equal pay for equal work 1966: National Organization for Women (NOW) founded.
Gay and lesbian liberation. 1969: Stonewall riots. 1970: First gay pride parade held in New York City.
1970’s Pro-‐choice. 1973: Roe v. Wade decision American Indian Movement (AIM) occupies village of Wounded Knee.
1980’s Anti-‐nuclear Anti-‐apartheid/divestment from South Africa
1990’s Anti-‐war (1st Gulf war) NAFTA
2000’s Anti-‐war (invasion of Iraq) Occupy Black Lives Matter Climate change/ climate justice Marriage equality TPP
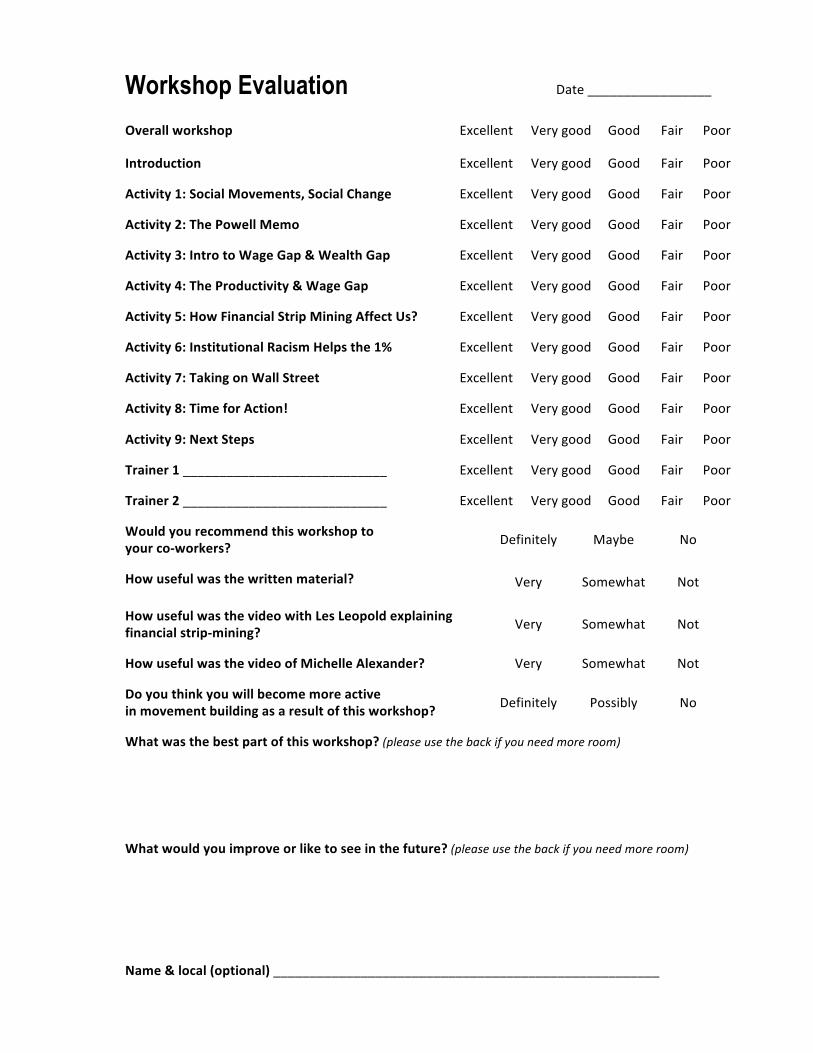
Workshop Evaluation Date _________________
Overall workshop Excellent Very good Good Fair Poor
Introduction Excellent Very good Good Fair Poor
Activity 1: Social Movements, Social Change Excellent Very good Good Fair Poor
Activity 2: The Powell Memo Excellent Very good Good Fair Poor
Activity 3: Intro to Wage Gap & Wealth Gap Excellent Very good Good Fair Poor
Activity 4: The Productivity & Wage Gap Excellent Very good Good Fair Poor
Activity 5: How Financial Strip Mining Affect Us? Excellent Very good Good Fair Poor
Activity 6: Institutional Racism Helps the 1% Excellent Very good Good Fair Poor
Activity 7: Taking on Wall Street Excellent Very good Good Fair Poor
Activity 8: Time for Action! Excellent Very good Good Fair Poor
Activity 9: Next Steps Excellent Very good Good Fair Poor
Trainer 1 ____________________________ Excellent Very good Good Fair Poor
Trainer 2 ____________________________ Excellent Very good Good Fair Poor
Would you recommend this workshop to your co-‐workers? Definitely Maybe No
How useful was the written material? Very Somewhat Not
How useful was the video with Les Leopold explaining financial strip-‐mining? Very Somewhat Not
How useful was the video of Michelle Alexander? Very Somewhat Not
Do you think you will become more active in movement building as a result of this workshop? Definitely Possibly No
What was the best part of this workshop? (please use the back if you need more room)
What would you improve or like to see in the future? (please use the back if you need more room) Name & local (optional) _____________________________________________________
Related Documents