International Journal of Economics, Commerce and Management United Kingdom ISSN 2348 0386 Vol. IX, Issue 7, July 2021 Licensed under Creative Common Page 156 http://ijecm.co.uk/ REVERSE LOGISTICS AND OPERATIONAL PERFORMANCE: THE MODERATING EFFECT OF PROCESS INNOVATION AMONG MANUFACTURING FIRMS IN KENYA Mwanyota L. Job PhD Candidate, Management Science Department, School of Business, University of Nairobi, Kenya [email protected]. Muranga Njihia Associate Professor, Management Science Department, School of Business, University of Nairobi, Kenya [email protected] Jackson Maalu Associate Professor, Department of Business Administration, School of Business, University of Nairobi, Kenya [email protected] X.N. Iraki Associate Professor, Management Science Department, School of Business, University of Nairobi, Kenya [email protected]

Welcome message from author
This document is posted to help you gain knowledge. Please leave a comment to let me know what you think about it! Share it to your friends and learn new things together.
Transcript

International Journal of Economics, Commerce and Management United Kingdom ISSN 2348 0386 Vol. IX, Issue 7, July 2021
Licensed under Creative Common Page 156
http://ijecm.co.uk/
REVERSE LOGISTICS AND OPERATIONAL PERFORMANCE:
THE MODERATING EFFECT OF PROCESS INNOVATION
AMONG MANUFACTURING FIRMS IN KENYA
Mwanyota L. Job
PhD Candidate, Management Science Department, School of Business,
University of Nairobi, Kenya
Muranga Njihia
Associate Professor, Management Science Department, School of Business,
University of Nairobi, Kenya
Jackson Maalu
Associate Professor, Department of Business Administration, School of Business,
University of Nairobi, Kenya
X.N. Iraki
Associate Professor, Management Science Department, School of Business,
University of Nairobi, Kenya

International Journal of Economics, Commerce and Management, United Kingdom
Licensed under Creative Common Page 157
Abstract
In the present day, countries and manufacturing establishments worldwide are concerned with
environmental sustenance. Implementation of reverse logistics has been regarded as a feasible
option to diminish the harmful environmental effects of manufacturing. However the question
has been whether reverse logistics generates operational performance gains. Similarly,
literature has opined that process innovation results in improved operational performance. The
study objective was to determine the moderating effect of process innovation on the association
between reverse logistics and operational performance. Using correlation cross-sectional survey
design, primary data was collected from 151, Kenya Association of Manufacturers (KAM)
registered firms. Covariance-based, Structural Equation Modeling (SEM) was used to test the
hypothesis. Results revealed the relationship linking reverse logistics and gaining internal
operational competency was significantly moderated by process innovation. It further confirmed
that there are factors that hinder or accelerate the diffusion of innovation rate depending on how
resources are mobilized. Policymakers within the manufacturing sector in Kenya should improve
the regulatory framework to upscale application of reverse logistics strategies in a manner that
also creates opportunities for improved process innovation. The research identified replication of
the study using direct measures for all variables and in other contexts as possible future
research streams.
Keywords: Reverse Logistics, Process Innovation, Diffusion of Innovation Theory, Covariance-
based SEM, Manufacturing firms in Kenya
INTRODUCTION
As a consequence of ensuring environmental sustainability, manufacturing firms today
are redesigning their systems to achieve both profitability and environmental sustenance.
(Govindan, Soleimani & Kannan, 2015; Prakash, Barua & Pandya, 2015). As a way of
addressing the repercussions of climate change, the emphasis of the United Nations (UN) has
been for countries and businesses alike to reexamine their value chains in order to devise new
and sustainable business models that create sustainable supply chains (United Nations
Environment Programme (UNEP), 2016). Today, it has become a requirement for
manufacturers to consider, reuse, recycling or safe disposal as part of the effort to conserve the
environment (Sheth, Sethia & Srinivas, 2011). The movement of “end-of-useful life” products
from consumers to manufacturers such that processes of recapturing value or environmentally
acceptable disposal is undertaken is the primary concern of reverse logistics (Stock, 1992).
While managing the product returns, firms also focus on operational performance improvements

©Author(s)
Licensed under Creative Common Page 158
(Stock, Speh & Shear, 2006). Similarly, the introduction of process innovation in managing
reverse logistics helps firms to create and execute strategies that result in efficient and effective
business models (Barney, 1991). While infusing innovations within a business model, the
diffusion of innovation theory creates a foundation for explaining factors obstructing or
facilitating the diffusion of innovations (Rogers, 2003).
Reverse logistics is a set of processes requiring manufacturing entities to reuse, recycle
or remanufacture “end-of-useful-life” products in an environmentally responsible manner or
ensure sustainably friendly disposal (Stock, 1992). Reverse logistics is a managerial activity
that facilitates movement of “end-of-useful-life” products back to the remanufacturing entities for
the purpose of value recapturing or apt disposal. It also includes value recapturing for products
found not to be useful by the end consumer (Rogers & Tibben-Lembke, 1999). The major
reasons leading to the emergence of reverse logistic are poor product quality, increased used of
environmental conscious policies among manufacturing firms, product variety causing rapid shift
in consumer tastes and preferences, more products being purchased over the internet and
shortened product life cycles (Bernon & Cullen, 2007; Ravi & Shankar, 2015). Reverse logistics
implementation approaches include outsourcing, collaborations, adopting green strategies or
using a product-life cycle perspective to implement reverse logistics. Outsourcing encourages
firms to remain focused on their core competencies. It also allows firms to share risks with third
parties and improve flexibility (He & Wang, 2005; Moghaddam, 2015; Hsu, Tan & Mohamad-
Zailani, 2016). Collaborations facilitate reverse logistics integration among supply chain
members in an industry through associations or consortia (Hung-Lau & Wang, 2009). Green
strategies encourage manufacturing firms to adopt environmentally sustainable manufacturing
policies and processes (Rogers & Tibben‐Lembke, 2001; Rao & Holt, 2005). Finally, the
product-life cycle perspective to implementing reverse logistics facilitates value recreation
through the closed-loop supply chain (Closs, Speier & Meacham, 2011; Govindan et al., 2015;
Sangwan, 2017).
Operational performance refers to how preplanned objectives of a firm are achieved
through processes that assess attributes of products and services (Shaw, 2003). Operational
performance establishes a criterion such that the firm’s processes are related to performance
using identifiable and measurable attributes. Operational performance monitors and takes
corrective action in attaining companywide goals efficiently and effectively (Carter, Kale &
Grimm, 2000). Studies have demonstrated the key operational performance indicators include
cost, time/speed, operations flexibility, dependability and quality (Carter et al., 2000; Brah &
Ying-Lim, 2006; Slack, Chambers & Johnston, 2010; De Souza & Brito, 2011; Chavez,
Gimenez, Fynes, Wiengarten & Yu, 2013) These indicators can further be operationalized using
International Journal of Economics, Commerce and Management, United Kingdom
Licensed under Creative Common Page 159
proxy indicators that include per unit variable cost of production, average leadtime, diversity of
product line, downtime, order fill rate and the number of customer complaints (Brah and Ying-
Lim, 2006; De Souza and Brito, 2011; Chavez et al., 2013).
Davenport (2013) notes that process innovation involves the radical development of new
services, products and production systems in a creative manner. This improves equipment,
production techniques or software. Keeley, Walters, Pikkel and Quinn (2013) classified
innovations into an offering, configuration and experience linked processes. Schumpeter (1934)
identified process innovation as consisting of new production approaches and new sources of
manufacturing inputs, semi-finished products or components. Adopting process innovation in a
multidimensional manner through process reengineering, value chain restructuring, resource
deployment, product redesign, and implementing information systems should guide organization
strategy (Jayaraman & Luo, 2007). Process reengineering involves an examination and
redesign of business processes to significantly improve on critical performance indicators
(Armbruster, Bikfalvi, Kinkel & Lay, 2008); Value chain restructuring involves an analysis of
internal organizational activities to develop and upgrade the value of products or processes
(Porter, 2008); Resource deployment is the way in which the organization methodologically
introduces programs, processes, and activities (Jayaraman & Luo, 2007). Product redesign
involves generating and developing ideas to improve the existing product(s) (Porter, 2008).
Information systems involves the use of computer and telecommunication systems to monitor
supply network activities, achieve visibility, and improve collaboration among supply chain
partners (Morgan, Richey Jr. & Autry, 2016). Further, interaction with suppliers, customers and
competitors together with the establishing of innovation systems are characteristic of innovative
organizations (Inauen & Schenker-Wicki, 2012).
Reverse logistics strategies have been presumed to hold present generations
environmentally accountable and thereby encourage environmental sustenance for future
generations (Sheth et al, 2011; Dias & Braga Jr., 2016; Sangwan, 2017). Research has
demonstrated that if these strategies are innovatively implemented, they create processes that
utilize a firm’s resources optimally which results to sanctioning negative environmental effects
on planet earth at a micro- level and generating operational performance gains at a macro-level
(Closs et al., 2011; Ravi & Shankar 2015). Although reverse logistics has been argued to
potentially create sustainable competitive capabilities research in supply chain has not given it
considerable attention until recently (Zhikang, 2017). Similarly the uptake of reverse logistics
programs by firms has been slow due to the challenges associated with implementation
(Huscroft, Skipper, Hazen, Hanna & Hall, 2013).

©Author(s)
Licensed under Creative Common Page 160
Research linking reverse logistics, process innovation and operational performance has
been exploratory (Hart, 2005: Armbruster et al., 2008; Jack, Powers & Skinner, 2010; Huang &
Yang, 2014). According to Christmann (2000) process innovation is essential for reverse
logistics since reverse logistical flows are distinct from forward logistics. Reverse logistics also
requires additional resources because of the uniqueness of handling systems (Zhikang, 2017).
Glenn-Richey, Genchev and Daugherty (2005) suggested that the strategy guiding resource
utilization in the firm should be based on building innovative competencies to handling product
returns. Despite the relative importance of how process innovation influences reverse logistics
and achieving internal operational proficiency, few studies have sought to examine the nature of
this relationship.
Despite the increasing cognizance of the importance of environmental protection at a
worldwide scale, adoption of approaches such as reverse logistics which focus on curbing the
negative environmental impact has experienced hindarances (Hung-Lau & Wang, 2009). This is
because practitioners and academicians alike have focused on developing efficient and
effective forward logistics information systems while reverse logistics systems have lagged at
infancy. Further, asset value recovery systems have not been substantially developed (Dekker,
Fleischmann, Inderfurth & van Wassenhove, 2013). In addition firms are not willing to invest
additional resources for the implementation of reverse logistics programs as these are
considered unnecessary additional cost on infrastructure which includes additional storage
facilities, equipment, labour and transportation (Rogers, Banasiak, Brokman, Johnson & Tibben-
Lembke, 2002). The other challenge has been forecasting demand for reverse logistics flow.
This requires more sophisticated algorithms to accurately predict flows in reverse compared to
forward flows. Again many firms are inclined to control product return processes individually and
not collectively as a supply chain. Finally, product return increases have enormously surpassed
firm capacity at the business unit level (Genchev, Glenn-Richey & Gabler, 2011).
Manufacturing firms in Kenya in their quest to protect the environment have not
harnessed the potential of reverse logistics programming. Key challenges have been cost
associated with reverse logistics programming and difficulties in developing accurate reverse
logistics forecasts (Rogers et al., 2002). Further an inadequate government policy framework
has hindered the development of asset recovery programs and processes (Dekker et al., 2013).
Only until recently have we seen the development of initiatives such as Kenya Green Economy
Strategy and Implementation Plan (K-GESIP) to increase uptake of environmental protection
(World Bank, 2016). Research on reverse logistics in the African context has also been sparse
(Somuyiwa & Adebayo, 2014; Kwateng, Debrah, Parker, Owusu & Prempeh, 2014; Meyer,
Niemann, Mackenzie & Lombaard, 2017). To account for differences across contexts and due to
International Journal of Economics, Commerce and Management, United Kingdom
Licensed under Creative Common Page 161
the prominence of developing economies in global business more research on reverse logistics
needs to be done in Africa.
LITERATURE REVIEW
This research was anchored on the diffusion of innovation theory that recognizes in a
societal system, innovations are spread widely within a certain time interval to members using
varying avenues at several levels of influence (Rogers, 2003). The theory is guided by certain
key tenets. First, innovations are spread using information streams founded on communication
network attributes established by the interconnectedness of individuals. Second, innovation
disseminators in their position as opinion leaders or seekers dictate how innovations will
disseminate in the network. Third, innovation characterisitcs namely relative advantage,
compatibility, simplicity, trialability and observability together with the innovation’s perceived
attributes, influence diffusion rate (Shoham & Ruvio, 2008). Relative advantage examines the
extent to which current process innovations are perceived to be better than those used
previously or those used by our competitors (M’Chirgui & Chanel, 2008). Compatibility examines
the extent to which current process innovations are deduced to be accordant with prevailing
values and the requirements of possible adopters. Simplicity determines the extent to which
current processes are discerned as easy to learn, apprehend and use (Shoham & Ruvio, 2008).
Trialability looks at the extent to which current processes can be explored or tested on a
restricted basis. Finally, observability looks at how current processes are visible to potential
adopters (Rogers, 2003). The theory was useful in testing the extent to which adoption
variations in process interventions affect innovation spread. Adoption variations were
established by measuring the degree to which innovation attributes influence diffusion rate.
Therefore, the theory advanced a basis to illustrate and forecast factors that accelerate or
hinder innovations spread in understanding how process innovation influences reverse logistics
and operational performance.
Hart (2005) observed that firms need to reposition current assets to gain innovative
capabilities in order to have higher operational performance and generate sustainability creating
processes at a strategic, tactical and operational level. Armbruster et al. (2008) opined that
innovations affect operational performance with regard to flexibility, dependability, productivity
and quality. Process innovation is useful in reverse logistical flows because they are distinct
from forward logistics operations (Christmann, 2000; Sangwan, 2017). Huang and Yang (2014)
observed that reverse logistics innovation positively influences firm performance. Glenn-Richey
et al. (2005) and Hsu et al. (2016) argued that developing innovative reverse logistics
capabilities using resources is important for improving operational performance and

©Author(s)
Licensed under Creative Common Page 162
competitiveness. Yet, until recently, research linking reverse logistics, process innovation and
operational performance has been scarce (Jack et al., 2010). Morgan et al. (2016) posited that
innovations in information technology moderate the relationship between collaboration and level
of reverse logistics capabilities. These studies have shown process innovation is a necessary
driver for the improved performance of a firm. However, the nature of the relationship among
reverses logistics, process innovation and operational performance remains unexplored. Based
on these the researcher posited the following: Process innovation has no significant moderating
influence on the association linking reverse logistics and operational performance. Figure 1
below provides the specific path diagram for the relationship between the latent constructs of
reverse logistics, process innovation and operational performance.
Figure 1 Path Diagram linking Reverse Logistics, Process Innovation
and Operational Performance
Figure 1 suggested that process innovation moderates the relationship between
reverse logistics with operational performance. Reverse logistics represented in the diagram
as RevLog had outsourcing, collaborative enterprising, green strategies and the product life
cycle each of these represented by the rectangular nodes RLOS1, RLCE1, RLGS1 and
RLPLCA1 respectively in the diagram. Process innovation represented as ProInno was
measured using information systems, product redesign, process reengineering, business

International Journal of Economics, Commerce and Management, United Kingdom
Licensed under Creative Common Page 163
value chain and resource deployment. These were diagrammatically represented using the
rectangular nodes PIIS1, PIPRD1, PIPRE1, PIBVA1 and PIRD1 respectively. Operational
performance represented in the diagram as OprPerf was operationalized using per unit
variable cost, order fill rate, number of product lines, machine availability and leadtime
represented as rectangular nodes labeled, OPUVC1, OPOFR1, OPPL1, OPDMA1 and
OPLTA1 respectively.
RESEARCH METHODOLOGY
The study applied correlation cross-sectional survey. Correlation research focuses on
indicating the direction, extent and nature of observed relationships (Zikmund, Babin, Carr &
Griffin, 2013). The study was cross-sectional because data was collected over a specific time
duration. Secondly, cross-sectional research also permitted the creation of homogenous
population strata in understanding the underlying strata attributes.
As at 30th June 2018 there were 903 firms registered as KAM members that formed the
target population of this study. KAM had the most comprehensive listing of manufacturing firms
in Kenya. Further KAM membership was considered appropriate for this study because the
association encourages members to have a reuse, reduce and recycling policy. The association
also encourages partner organizations to work closely with National Environmental
Management Authority (NEMA). Further KAM has an annual Energy Management Award (EMA)
that recognizes firms’ efforts towards energy conservation. These efforts reflect on efforts
towards implementation of reverse logistics practices. The sample size was 340 manufacturing
firms in Kenya after taking into account a non-response factor of 0.8 based on similar studies
(Mellat-Parast & Spillan, 2014; O'Cass & Viet, 2007). The study sought to use proportionate
stratified random sampling based on the manufacturing sub-sectors in the KAM directory and
the number of firms in each sub-sector. Proportionate stratified random sampling minimizes
sampling bias where the researcher can mutually exclusively classify members of the
population.
A total of 151 questionnaires were completed and returned. This represented a response
rate of 44.4%. Although high response rates ( > 70%) are preferable Mugenda and Mugenda
(1999) scholars have demonstrated that no statistically significant difference exists between
studies with high response rates and results from studies with response rates as low as 20%
(Keeter, Kennedy, Dimock, Best & Craighill, 2006: Curtin, Presser & Singer, 2000). Kaiser-
Meyer-Olkin (KMO) and Bartlett tests were conducted using the latent constructs of reverse
logistics, process innovation and operational performance. The KMO test yielded a value of
0.950 which is > 0.7. Sphericity test gave a p-value of 0.000 which is < 0.05.This means that

©Author(s)
Licensed under Creative Common Page 164
conducting Confirmatory Factor Analysis (CFA) will produce statistically reliable factors and
results. It also means that it is possible to conduct dimension reduction for both the measured
and structured model with reverse logistics, process innovation and operational performance.
Table 1 below provides details of the Cronbach’s alpha measuring the internal reliability of the
questionnaire items for reverse logistics and process innovation. These were expected to be
above 0.7.
Table 1 Cronbach Alpha Test Results Measuring Internal Reliability of Questionnaire Items
for Reverse Logistics and Process Innovation
Variables Cronbach Alpha
1 Outsourcing 0.708
2 Collaborative Enterprise 0.716
3 Green Strategies 0.729
4 Product Life Cycle Approach 0.707
5 Information Systems 0.704
6 Resource Deployment 0.744
7 Product Redesign 0.732
8 Process Reengineering 0.723
9 Business Value Chain 0.709
Based on table 1 above the Cronbach alpha coefficient to check whether the
questionnaire items were actually measuring the latent constructs for reverse logistics and
process innovation ranged between 0.707 and 0.744. Communality coefficient were checked
using Principal Component Analysis (PCA) and ranged between 0.307 to 0.889. This means
that the undeleted questionnaire items explained between 30.7% and 88.9 % of the variance of
the respective latent construct. Since these values were > 0.3 it indicated that latent constructs
have sufficient explanatory power on the latent variables (Field, 2013). Cronbach alpha
coefficient to check whether the latent constructs were actually measuring the latent variables
ranged between 0.908 and 0.972. These indicate sufficient internal consistency between the
latent constructs and the latent variables. The standardized factor loadings for all the latent
constructs of reverse logistics, process innovation and operational performance were > 0.5
except for the latent constructs PIRD1 and OPUVC1. For this reason they were deleted from the
model. To confirm convergent validity Average Variance Extraction (AVE) method was used as
shown in table 2 below.
International Journal of Economics, Commerce and Management, United Kingdom
Licensed under Creative Common Page 165
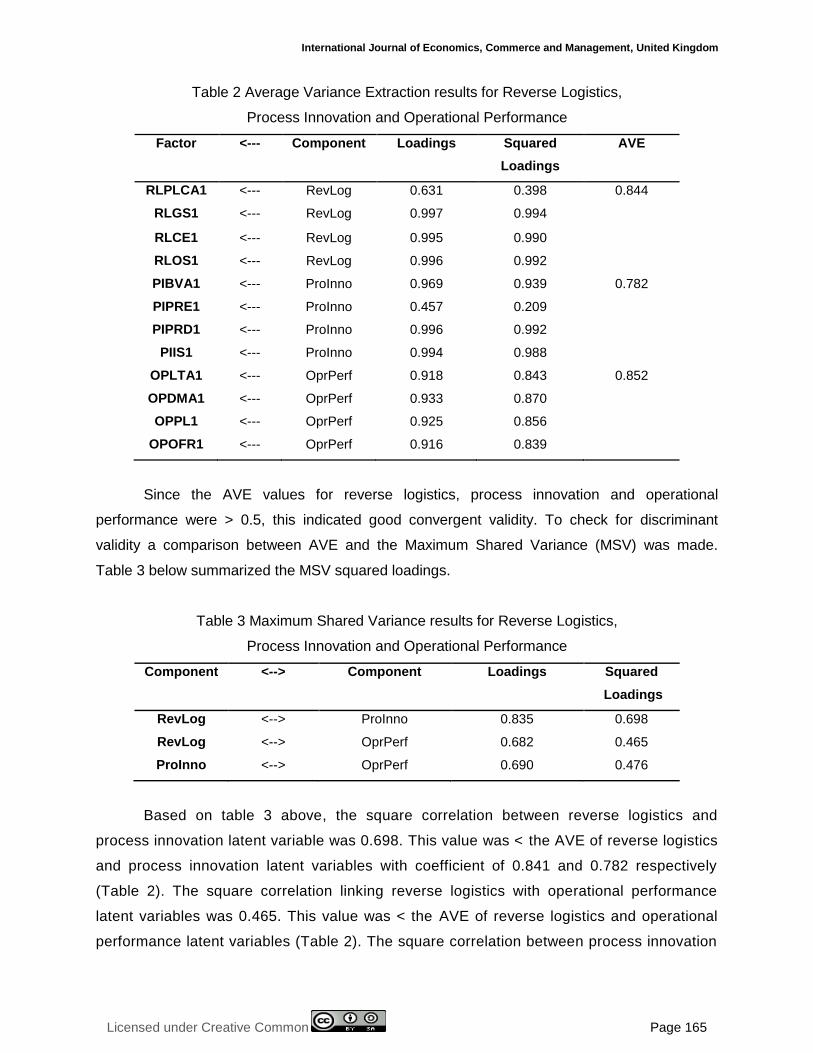
Table 2 Average Variance Extraction results for Reverse Logistics,
Process Innovation and Operational Performance
Factor <--- Component Loadings Squared
Loadings
AVE
RLPLCA1 <--- RevLog 0.631 0.398 0.844
RLGS1 <--- RevLog 0.997 0.994
RLCE1 <--- RevLog 0.995 0.990
RLOS1 <--- RevLog 0.996 0.992
PIBVA1 <--- ProInno 0.969 0.939 0.782
PIPRE1 <--- ProInno 0.457 0.209
PIPRD1 <--- ProInno 0.996 0.992
PIIS1 <--- ProInno 0.994 0.988
OPLTA1 <--- OprPerf 0.918 0.843 0.852
OPDMA1 <--- OprPerf 0.933 0.870
OPPL1 <--- OprPerf 0.925 0.856
OPOFR1 <--- OprPerf 0.916 0.839
Since the AVE values for reverse logistics, process innovation and operational
performance were > 0.5, this indicated good convergent validity. To check for discriminant
validity a comparison between AVE and the Maximum Shared Variance (MSV) was made.
Table 3 below summarized the MSV squared loadings.
Table 3 Maximum Shared Variance results for Reverse Logistics,
Process Innovation and Operational Performance
Component <--> Component Loadings Squared
Loadings
RevLog <--> ProInno 0.835 0.698
RevLog <--> OprPerf 0.682 0.465
ProInno <--> OprPerf 0.690 0.476
Based on table 3 above, the square correlation between reverse logistics and
process innovation latent variable was 0.698. This value was < the AVE of reverse logistics
and process innovation latent variables with coefficient of 0.841 and 0.782 respectively
(Table 2). The square correlation linking reverse logistics with operational performance
latent variables was 0.465. This value was < the AVE of reverse logistics and operational
performance latent variables (Table 2). The square correlation between process innovation

©Author(s)
Licensed under Creative Common Page 166
and operational performance latent variables was 0.476. This value was < the AVE of
process innovation and operational performance latent variables. This means that there
was evidence to suggest discriminant validity. The study used Statistical Product and
Services Solution – Analysis of Moment Structures (SPSS-AMOS) version 21 for SEM
testing.
RESULTS
Descriptive statistics for reverse logistics indicated outsourcing as the most prevalent
reverse logistics strategy among manufacturing firms in Kenya with a mean of 3.63 and a
standard deviation (Std.Dev = 0.51). Green strategies was the second most prevalent (Mean
= 3.56, Std.Dev = 0.41). Product life cycle approach and collaborative enterprise both had a
mean of 3.51 and (Std.Dev = 0.58 and 0.60 respectively). These generally indicated that the
respondents generally concurred with the statements to a large extent. The z-skewness
scores were between -0.06 and 0.11. The z-kurtosis scores were between -1.56 and -0.78.
These showed the distributions were fairly symmetrical and mesokurtic. For process
innovation, process reengineering and information systems were regarded as the most
prevalent approaches with a mean of 3.68 and 3.67 (Std.Dev = 0.43 and 0.43 respectively).
The least rated was business value chain (Mean = 3.26, Std.Dev = 0.37). These indicated
respondents agreed with the statements to a fairly large extent. Z-skewness scores were
between -0.06 and 0.32. Z-kurtosis scores were between -1.00 and -0.85. These suggested
that the distributions formed by the latent constructs of process innovation were symmetrical
and mesokurtic. For operational performance the order fill rate was 95.20% with a
Coefficient of Variation (CV) of 2.0%. The average number of product -lines among
manufacturing firms was 9.47 (CV = 36.6%). The capacity utilization rate was 91.26% (CV =
1.3%). Lead-time was 10.50 days (CV = 33.7%). Z-skewness scores were between 0.01 and
0.33 showing symmetry. Z-kurtosis scores ranged from - 1.33 to - 0.74, showing a fairly
mesokurtic distribution.
The results of the Kolmogorov-Smirnov and Shapiro-Wilk test ranged between 0.058
and > 0.200 and between 0.069 and 0.348 respectively. Because the p-values were > 0.05
then normality was presumed (Field, 2013). Durbin-Watson test statistic (D) was used to
test for autocorrelation of the first order. The Durbin-Watson calculated statistics values
ranged from 1.848 to 2.148, with an acceptance region of 1.788 to 2.212 meaning there
was no serial autocorrelation. The Variance Inflation Factor (VIF) values for the latent
constructs of reverse logistics and operational performance were between 1.082 and 5.597.
The corresponding tolerance values ranged between 0.179 to 0.924. Since the VIF

International Journal of Economics, Commerce and Management, United Kingdom
Licensed under Creative Common Page 167
coefficients were < 10 this indicated the latent variables were not multicollinearily
associated. Statistical heteroscedasticity was tested using the Koenker test. For this test if
the p-value is > 0.05 then heteroscedasticity is not present and homoscedasticity is
assumed (Hair, Black, Babin & Anderson, 2014). The Koenker calculated test statistics
value ranged from 0.055 to 0.702. Since these p-values were > 0.05, homoscedasticity was
presumed.
The number of iterations taken by AMOS to achieve model minimization was 27.
The overall model fit of the measured models was assessed through the absolute,
incremental and parsimonious model fitness tests as summarized in table 4 below. From
the results absolute fitness was assessed using chi-square value, p-value, Root Mean
Square Error of Approximation (RMSEA) and Goodness of Fit Index (GFI). Because these
were all within the decision criteria it indicated the models had good absolute fit.
Incremental model fitness was assessed using Adjusted Goodness of Fit Index (AGFI),
Comparative Fit Index (CFI), Normed Fit Index (NFI) and Tuker Lewis Index (TLI). Based
on the decision criteria, these values indicated that all the measured models had good
incremental fit.
Table 4 Overall Model Fit Results for the Measured Model
Test Decision
Criteria
Model Result
RevLog ProInno OprPerf
Chi-Square 0.319 0.253 5.050
Degrees of Freedom 1 2 2
p-value > 0.05 0.572 0.881 0.08
GFI > 0.90 0.999 0.999 0.983
CFI > 0.90 1.000 1.000 0.995
AGFI > 0.90 0.989 0.996 0.916
NFI 0.8 < NFI < 1.00 1.000 1.000 0.993
TLI > 0.90 1.003 1.005 0.986
RMSEA < 0.08 0.000 0.000 0.101
CMIN/DF < 5 0.319 0.126 2.525
Finally, Chi-square/Degrees of Freedom (CMIN/DF) values ranged between 0.126 and
2.525. These indicated good parsimonious fit. Table 5 below summarizes model fitness results
for the structured model.

©Author(s)
Licensed under Creative Common Page 168
Table 5 Overall Model Fit Results for the Structured Model
Test Decision Criteria Model Result
Chi-Square 183.970
Degrees of Freedom 58
GFI >0.90 0.848
CFI >0.90 0.970
AGFI >0.90 0.761
NFI 0.8<NFI<1.00 0.957
TLI >0.90 0.960
RMSEA <0.08 0.120
CMIN/DF <5 3.172
For the structured model, the chi-square value was 183.970, RMSEA was 0.120 which is
> 0.08 but sufficiently low to consider the model for analysis. The GFI of 0.848 was not
significantly < 0.90. This reveals that the model does have a fairly good absolute fit. AGFI, CFI,
NFI and TLI had coefficients of 0.761, 0.970, 0.957 and 0.960. NFI was within the range
between 0.80 and 1.00. CFI and TLI were > 0.9. Despite the low AGFI (0.761) this model
exhibited a fairly good incremental fit. Parsimonious model fitness was assessed using
CMIN/DF which was 3.172. This suggests a good parsimonious fit. In conclusion the model had
a fairly good overall fit. Figure 2 below revealed the overall structure of the CFA model.
Figure 2 Unstandardized Structural Equation Model for Reverse Logistics,
Process Innovation and Operational Performance
International Journal of Economics, Commerce and Management, United Kingdom
Licensed under Creative Common Page 169
The standard error of the estimates of the unstandardized factor loading and p-values
were calculated to assess statistical significance. The p-values were < 0.05 indicating statistical
significance of factor loadings. The least standardized factor loading was 0.631 and highest
0.997. This therefore meant that the factors explain the components to a large extent. To check
whether a statistically significant association among the latent variables of the structured model
was present, calculations of the standard error of the estimates and p-values were performed.
The p-values were < 0.05 indicating that the factor loadings were statistically significant. This
meant that the latent variables of the structured model had statistically significant relationship.
For the hypothesis test the study concluded that process innovation moderates the relationship
between reverse logistics and operational performance. The Common Method Variance (CMV)
which is supposed to be <0.5 was 0.0009 for each of the variables. This meant that the model
was not affected by spurious correlations.
DISCUSSION
This study sought to examine the relationships among reverse logistics, process
innovation, and operational performance among manufacturing firms in Kenya. This research
concluded that process innovation has significant moderating effect on the relationship between
reverse logistics and operational performance. According to Hart (2005) firms should reposition
current assets to gain innovative potentials in order to have higher operational performance and
improve sustainability. According to Armbruster et al. (2008), innovations influence operational
performance dimensions such as flexibility, dependability, productivity and quality. This study,
revealed that by innovatively developing reverse logistics competences from resources was
going to improve operational performance and sustainability (Huang and Yang, 2014; Glenn-
Richey et al., 2005; Hsu et al., 2016).
The findings also suggested that the manner in which process innovations were shared
is affected by communication network characteristics such as compatibility, relative advantage,
simplicity, observability and trialability and the innovation’s perceived attributes formed by the
interconnection of individuals (Shoham & Ruvio, 2008). This could either imply current process
innovations are deduced to be in harmony with prevailing values and the requirements of
possible adopters or current process innovations could be perceived to be better than those
used previously or those used by competitors (M’Chirgui & Chanel, 2008). It further could imply
current processes are perceived as easy to learn, understand and use (Shoham & Ruvio, 2008).
It could also be interpreted to mean current processes could be explored or tested or they had
visibility to potential adopters (Rogers, 2003).
©Author(s)
Licensed under Creative Common Page 170
The findings further agreed with conclusions made by Rogers (1976) that not all
innovations yield positive results and should not be wholesomely adopted. They further
concured that explaining the diffusion rate is arduous because of environmental dynamics and
power play among various business partners. These are brought about by the complexity of
understanding the difference between the effect individual characteristics have on a system and
the effect the system structure has on diffusion (Rogers, 2003). Therefore, the diffusion of
innovation theory provided the basis to describe and predict factors that accelerated or hindered
innovation spread.
SUMMARY AND CONCLUSION
The research observed that the effect of reverse logistics on operational performance is
dependent on process innovation. Developing innovative reverse logistics capabilities using
resources improved operational performance and competitiveness (Hart, 2005; Ambruster et al.,
2008; Huang and Yang, 2014; Glenn-Richey et al., 2005; Hsu et al., 2016). This could either
imply current process innovations may be consistent with prevailing objectives and
requirements of manufacturers in Kenya in so far as implementation of reverse logistics is
concerned. It could also imply that current process innovations could be perceived to be better
than those used previously or those used by competitors of manufacturing firms. Manufacturers
in Kenya could also be perceiving current process innovations as easy to implement within and
among supply chain partners.
From a diffusion of innovations theory this research contributed to the findings of Rogers
(1976) that not all innovations generate positive results and should not be adopted in totality.
Further it contributed to the proposition that explaining the diffusion rate is challenging as a
result of the complexity of understanding the difference between the effect individual
characteristics have on a system and the effect the system structure has on diffusion (Rogers,
2003).
IMPLICATIONS
These research findings directly impact policy and practice. The study provided a
framework for regulating policy in the implementation of reverse logistics in achieving
operational performance. The study suggested that by implementing reverse logistics as an
integrated intervention this would lead to firms’ improving on cost management, product quality,
delivery speed and product variety. Policy makers and practitioners through this study can
understand the strategic significance reverse logistics has both at a micro and macro-economic
level to the economy of Kenya. The study also demonstrated that while striving to gain

International Journal of Economics, Commerce and Management, United Kingdom
Licensed under Creative Common Page 171
economic benefits, through reverse logistics also contribute to social and environmental benefits
creating a triple bottom line effect.
The study observed that the effect of reverse logistics on operational performance was
dependent on process innovation. Previous studies have shown that developing process
innovations while implementing reverse logistics was likely to improve operational performance
and competitiveness (Hart, 2005; Ambruster et al., 2008; Huang and Yang, 2014; Glenn-Richey
et al., 2005; Hsu et al., 2016). This is attributed to the fact that process innovations remove the
requirement for disposal and associated costs thereof thereby improving the organization’s
image and its profitability. It also encourages reuse and remanufacture. These practices reduce
negative environmental impact apart from improving competitiveness and profitability for the
firm. Policy makers within the manufacturing sector in Kenya should therefore improve the
regulatory framework to enable firms to implement reverse logistics strategies. Such a
framework should encourage awareness creation on the significance of reverse logistics both at
the micro and macro-economic level. This would increase the use of
remanufactured/refurbished products. The end result is that it will have a triple bottom line effect
that is it will have social, environmental and organizational benefits.
LIMITATIONS AND FURTHER RESEARCH
The constructs used to measure reverse logistics namely; outsourcing, collaborative
enterprising, green strategies and closed-loop supply chain were not exhaustive. A more in-
depth review of reverse logistics literature would uncover additional strategies or
approaches to the implementation of reverse logistics. These additional approaches or
strategies could augment generalizability and validity of the results of the study models and
variables.
Reverse logistics and process innovation were measured using the Likert-type scale.
Direct measures remain consistent over a given time period and sectoral inconsistencies are
more controllable in the models. These make the models have better explanatory power.
Future researchers should consider using direct measures among the variables in
hypothesized relationships and more specifically when using covariance-based SEM in
analyzing data.
Increased attention of research in the service sector requires future research to aim at
generalizing the results beyond the context of manufacturing. This research could also be
replicated in other industries or countries with different cultural backgrounds. Similarly intra-
industry or intra-sectoral comparison of results could also be undertaken as a research stream.
These would require larger samples per industry or sector.
©Author(s)
Licensed under Creative Common Page 172
ACKNOWLEDGEMENT
We wish to extend our heartfelt gratitude to Rose Mutwiwa and Allan Kimonge for assisting in the coordination and
distribution of the data collection instrument and follow-up. We also thank survey respondents and their respective
firms for their immense contribution.
REFERENCES
Armbruster, H., Bikfalvi, A., Kinkel, S., & Lay, G. (2008). Organizational innovation: The challenge of measuring non-technical innovation in large-scale surveys. Technovation, 28(10), 644-657.
Barney, J. (1991). Firm resources and sustained competitive advantage. Journal of Management, 17(1), 99-120.
Bernon, M., & Cullen, J. (2007). An integrated approach to managing reverse logistics. International Journal of Logistics: Research and Applications, 10(1), 41-56.
Brah, S. A., & Ying-Lim, H. (2006). The effects of technology and TQM on the performance of logistics companies. International Journal of Physical Distribution & Logistics Management, 36(3), 192-209.
Carter, C. R., Kale, R., & Grimm, C. M. (2000). Environmental purchasing and firm performance: an empirical investigation. Transportation Research Part E: Logistics and Transportation Review, 36(3), 219-228.
Chavez, R., Gimenez, C., Fynes, B., Wiengarten, F., & Yu, W. (2013). Internal lean practices and operational performance: The contingency perspective of industry clockspeed. International Journal of Operations & Production Management, 33(5), 562-588.
Christmann, P. (2000). Effects of “best practices” of environmental management on cost advantage: The role of complementary assets. Academy of Management Journal, 43(4), 663-680.
Closs, D. J., Speier, C., & Meacham, N. (2011). Sustainability to support end-to-end value chains: the role of supply chain management. Journal of the Academy of Marketing Science, 39(1), 101-116.
Curtin, R., Presser, S., & Singer, E. (2000). The effects of response rate changes on the index of consumer sentiment. Public opinion quarterly, 64(4), 413-428.
Davenport, T. H. (2013). Process innovation: Reengineering work through information technology. Cambridge, Massachusetts, United States of America (USA): Harvard Business Press.
De Souza M. P. L., & Brito, L. A. L. (2011). Supply chain management measurement and its influence on operational performance. Journal of Operations and Supply Chain Management, 4(2), 56-70.
Dekker, R., Fleischmann, M., Inderfurth, K., & van Wassenhove, L. N. (Eds.). (2013). Reverse logistics: Quantitative models for closed-loop supply chains. Berlin, Germany: Springer Science & Business Media.
Dias, K. T., & Braga Jr., S. S. (2016). The use of reverse logistics for waste management in a Brazilian grocery retailer. Waste Management & Research, 34(1), 22-29.
Field, A. (2013). Discovering statistics using IBM SPSS statistics. Thousand Oaks, Carlifonia, USA: Sage.
Genchev, S. E., Glenn-Richey, R., & Gabler, C. B. (2011). Evaluating reverse logistics programs: A suggested process formalization. The International Journal of Logistics Management, 22(2), 242-263.
Glenn-Richey, R., Genchev, S. E., & Daugherty, P. J. (2005). The role of resource commitment and innovation in reverse logistics performance. International Journal of Physical Distribution & Logistics Management, 35(4), 233-257.
Govindan, K., Soleimani, H., & Kannan, D. (2015). Reverse logistics and closed-loop supply chain: A comprehensive review to explore the future. European Journal of Operational Research, 240(3), 603-626.
Hair, J. F., Black, W. C., Babin, B. J., & Anderson, R. E. (2014). Multivariate data analysis (7th ed.). Essex, England:
Pearson Education.
Hart, S. L. (2005). Capitalism at the crossroads: The unlimited business opportunities in solving the world's most difficult problems. Essex, England: Pearson.
He, X., & Wang, J. X. (2005). An overview of reverse logistics. International Journal of Plant Engineering and Management, 10(2), 120-124.
Hsu, C. C., Tan, K. C., & Mohamad-Zailani, S. H. (2016). Strategic orientations, sustainable supply chain initiatives, and reverse logistics: Empirical evidence from an emerging market. International Journal of Operations & Production Management, 36(1), 86-110.
International Journal of Economics, Commerce and Management, United Kingdom
Licensed under Creative Common Page 173
Huang, Y. C., & Yang, M. L. (2014). Reverse logistics innovation, institutional pressures and performance. Management Research Review, 37(7), 615-641.
Hung-Lau, K., & Wang, Y. (2009). Reverse logistics in the electronic industry of China: a case study. Supply Chain Management: An International Journal, 14(6), 447-465.
Huscroft, R. J., Skipper, B. J., Hazen, T. B., Hanna, B.J., & Hall, J. D. (2013). Reverse logistics: past research, current management issues, and future directions. The International Journal of Logistics Management, 24(3), 304-327.
Inauen, M., & Schenker-Wicki, A. (2012). Fostering radical innovations with open innovation. European Journal of Innovation Management, 15(2), 212-231.
Jack, E. P., Powers, T. L., & Skinner, L. (2010). Reverse logistics capabilities: antecedents and cost savings. International Journal of Physical Distribution & Logistics Management, 40(3), 228-246.
Jayaraman, V., & Luo, Y. (2007). Creating competitive advantages through new value creation: a reverse logistics perspective. The Academy of Management Perspectives, 21(2), 56-73.
Keeley, L., Walters, H., Pikkel, R., & Quinn, B. (2013). Ten types of innovation: The discipline of building breakthroughs. West Sussex, England: John Wiley & Sons.
Keeter, S., Kennedy, C., Dimock, M., Best, J., & Craighill, P. (2006). Gauging the impact of growing nonresponse on estimates from a national RDD telephone survey. International Journal of Public Opinion Quarterly, 70(5), 759-779.
Kwateng, K. O., Debrah, B., Parker, D. V., Owusu, R. N., & Prempeh, H. (2014). Reverse logistics practices in pharmaceutical manufacturing industry: experiences from Ghana. Global Journal of Business Research, 8(5), 17-26.
M’Chirgui, Z., & Chanel, O. (2008). The adoption and use of smart card technology in banking: An empirical evidence from the Moneo electronic purse in France. In Advances in Banking Technology and Management: Impacts of ICT and CRM (pp. 70-87). IGI Global.
Mellat-Parast, M., & Spillan,E. J. (2014). Logistics and supply chain process integration as a source of competitive advantage: An empirical analysis. The International Journal of Logistics Management, 25(2), 289-314.
Meyer, A., Niemann, W., Mackenzie, J., & Lombaard, J. (2017). Drivers and barriers of reverse logistics practices: A study of large grocery retailers in South Africa. Journal of Transport and Supply Chain Management, 11(1), 1-16.
Moghaddam, K. S. (2015). Fuzzy multi-objective model for supplier selection and order allocation in reverse logistics systems under supply and demand uncertainty. Expert Systems with Applications, 42(15-16), 6237-6254.
Morgan, T. R., Richey Jr, R. G., & Autry, C. W. (2016). Developing a reverse logistics competency: The influence of collaboration and information technology. International Journal of Physical Distribution & Logistics Management, 46(3), 293-315.
Mugenda, O. M., & Mugenda, A. G. (1999). Research methods: Quantitative and qualitative approaches. Acts press.
O'Cass, A., & Viet, N. L. (2007). Market orientation versus innovative culture: two routes to superior brand performance. European Journal of Marketing, 41(7/8), 868-887.
Porter, M. E. (2008). On competition. Cambridge, Massachusetts, USA: Harvard Business Press.
Prakash, C., Barua, M. K., & Pandya, K. V. (2015). Barriers analysis for reverse logistics implementation in Indian electronics industry using fuzzy analytic hierarchy process. Procedia-Social and Behavioral Sciences, 189(2015), 91-102.
Rao, P., & Holt, D. (2005). Do green supply chains lead to competitiveness and economic performance?. International Journal of Operations & Production Management, 25(9), 898-916.
Ravi, V., & Shankar, R. (2015). Survey of reverse logistics practices in manufacturing industries: an Indian context. Benchmarking: An International Journal, 22(5), 874-899.
Rogers, D. S., Banasiak, K., Brokman, K., Johnson, T., & Tibben-Lembke, R. (2002, January). Reverse logistics challenges. Paper presented at the 2001 Annual Conference Proceedings.
Rogers, D. S., & Tibben-Lembke, R. S. (1999). Going backwards: reverse logistics trends and practices (Vol. 2). Pittsburgh, Pennsylvania, USA: Reverse Logistics Executive Council.
Rogers, D. S., & Tibben-Lembke, R. S. (2001). An examination of reverse logistics practices, Journal of Business Logistics, 22(2), 129-149.
Rogers, E. M. (1976). New product adoption and diffusion. Journal of Consumer Research, 2(4), 290-301.
Rogers, E. M. (2003). Diffusion of innovations, (5th ed.). New York, New York, USA: Free Press.

©Author(s)
Licensed under Creative Common Page 174
Sangwan, K. S. (2017). Key activities, decision variables and performance indicators of reverse logistics. Procedia CIRP, 61(2017), 257-262.
Schumpeter, J. A. (1934). Theorie der Wirtschaftlichen Entwicklung: the theory of economic development: An inquiry into profits, capital, credit, interest and the business cycle. Cambridge, Massachusetts, USA: Harvard Business Press. Translated by …Redvers Opie.
Shaw, T. (2003). Performance measures of operational effectiveness for highway segments and systems (Vol. 311). Transportation Research Board.
Sheth, J. N., Sethia, N. K., & Srinivas, S. (2011). Mindful consumption: A customer centric approach to sustainability. Journal of the Academy of Marketing Science, 39(1), 21-39.
Shoham, A., & Ruvio, A. (2008). Opinion leaders and followers: A replication and extension. Psychology & Marketing, 25(3), 280-297.
Slack, N., Chambers, S., & Johnston, R. (2010). Operations management. (6th ed.). Essex, England: Pearson Education.
Somuyiwa, A. O., & Adebayo, I. T. (2014). Empirical study of the effect of reverse logistics objectives on economic performance of food and beverages companies in Nigeria. International Review of Management and Business Research, 3(3), 1484-1493.
Stock, J. R. (1992). Reverse logistics: White paper. Council of Logistics Management.
Stock, J., Speh, T., & Shear, H. (2006). Managing product returns for competitive advantage. MIT Sloan Management Review, 48(1), 57-62.
UNEP Report. (2016). Engaging people to protect the planet. Retrieved from http://www.unep.org/annualreport/2016/index.php.
World Bank. (2016). Economic Update: Kenya’s Ecconomy Strong in a Challenging Global Environment. Retrieved from http://www.worldbank.org/en/country/kenya/ publication
Zhikang, L. (2017). Research on Development Strategy of Automobile Reverse Logistics Based on SWOT Analysis. Procedia engineering, 174, 324-330.
Zikmund, W. G., Babin, B. J., Carr, J. C., & Griffin, M. (2013). Business research methods (9th ed.). Boston, Massachusetts, USA: Cengage Learning.
Related Documents