BUSINESS PROTECTION © 2014 – PROPRIETARY AND CONFIDENTIAL INFORMATION OF CVIDYA Revenue Assurance Industry Update Webinar, December, 2014 Dr. Gadi Solotorevsky CTO – cVidya Networks Ambassador, Distinguished Fellow and RA Team Leader – TM Forum

Revenue Assurance Industry Update - Webinar by Dr. Gadi Solotorevsky, cVidya's CTO
Jul 14, 2015
Welcome message from author
This document is posted to help you gain knowledge. Please leave a comment to let me know what you think about it! Share it to your friends and learn new things together.
Transcript

BUSINESS PROTECTION
© 2014 – PROPRIETARY AND CONFIDENTIAL INFORMATION OF CVIDYA
Revenue Assurance Industry Update
Webinar, December, 2014
Dr. Gadi Solotorevsky
CTO – cVidya Networks
Ambassador, Distinguished Fellow and RA Team Leader – TM Forum

2
What's New
Statistics & Surveys
RA best practices
New Businesses Models

3
What do you estimate your revenue and fraud leakage to be?
Source: Global revenue assurance survey 2013, E&Y

4
Leakage as a Percentage of Revenue
Source: KMPG Global Revenue Assurance Survey, 2012,
101 respondents
Source, TM Forum, Revenue Assurance Survey 2012

5
TM Forum Revenue Assurance KPI Study - 2011
98%
2%
Detected Leakage % of revenues
Revenues Leakage detected
31%
69%
Recovered %
Recovered Unrecovered43%
57%
Recoverable and Unrecoverable % of un-recovered revenues
Recoverable Unrecoverable

6
Percentage of Leakage Recovered
Source: Global revenue assurance survey 2013, E&Y

7
The RA Department
Source, TM Forum, Revenue Assurance Survey 2013
8
FTE in the RA Department
Source, TM Forum, Revenue Assurance Survey 2013

9
Main objective of RA functions
Source: KMPG Global Revenue Assurance Survey, 2012, 89 respondents

10
RA Activity Distribution
Source, TM Forum, Revenue Assurance Survey 2012

11
RA Involvement in Change Processes

12
Use of Best Practices1
Use of RA Best Practices Documents by TM Forum Members 20 Respondents, 180 Indications less 38 N/A = 142
13% 19% 19% 19% 25% 27% 33%
44% 38% 44% 50% 38% 33%47%
63% 56%44% 44% 38% 31% 38% 40%
20%
6%6%
38%31%
(16) (16) (16) (16) (16) (15)(15)(16)(16)
0%
100%
GB941-B (RAMM) GB941 Guidebook TR131 GB941-E [1] GB941-D GB941-A (RASK) GB941-E [3] GB941-E [2] GB941-C RFX
Not familiar with it and not using it Familiar with it but not using it Familiar with it and using it
1: Source, TM Forum, Revenue Assurance Survey 2012
13
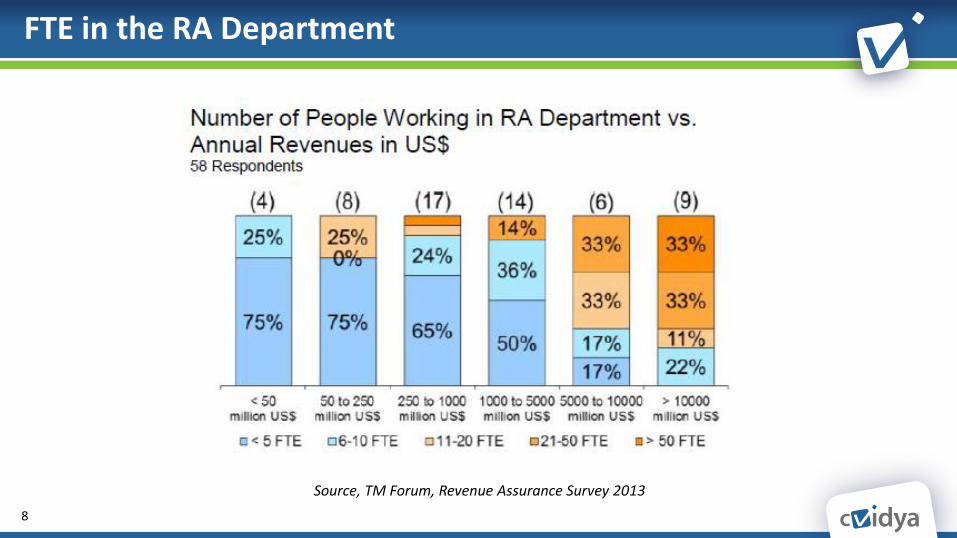
TM Forum RA Best Practices
14
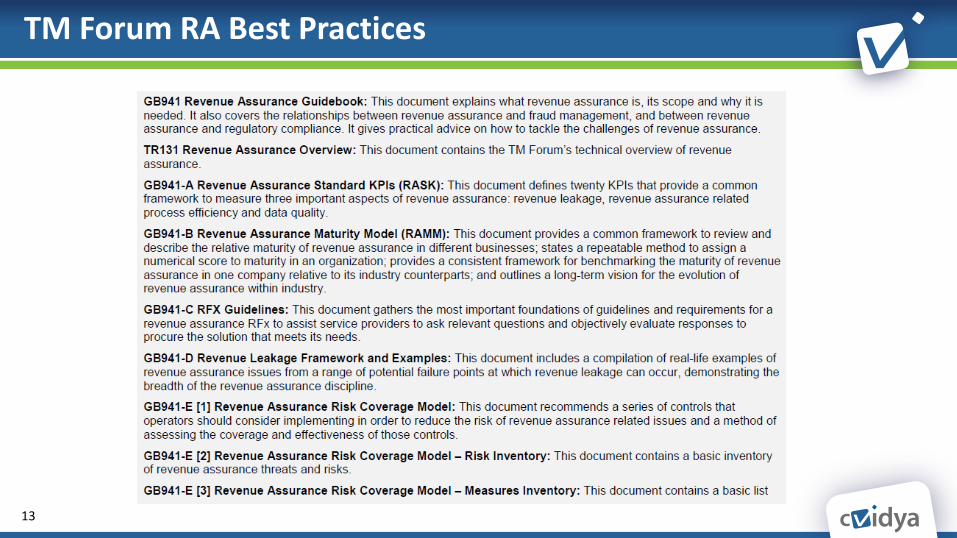
RA Maturity Model (RAMM)
Use of RA Best Practices Documents by TM Forum Members 20 Respondents, 180 Indications less 38 N/A = 142
13% 19% 19% 19% 25% 27% 33%
44% 38% 44% 50% 38% 33%47%
63% 56%44% 44% 38% 31% 38% 40%
20%
6%6%
38%31%
(16) (16) (16) (16) (16) (15)(15)(16)(16)
0%
100%
GB941-B (RAMM) GB941 Guidebook TR131 GB941-E [1] GB941-D GB941-A (RASK) GB941-E [3] GB941-E [2] GB941-C RFX
Not familiar with it and not using it Familiar with it but not using it Familiar with it and using it
Widely used by the industry
A blueprint to improve RA operations
Internal and external benchmarking
Based on Capability Maturity Model (CMM) principles

15
Revenue Assurance Maturity Model
Organization Process Measurement Technology
RA strategy
RA objectives, goals & incentives
Organizational fit
Sponsorship, ownership,
accountability and responsibility of
RA
Skill set of RA team
Business knowledge
Relationship with other
departments
Staffing levels
Communications
RA planning & review
Use of risk management
techniques
Change management involvement
& sign-off
In-life product reviews
Operation of primary controls
Operation of secondary controls
Investigation of discrepancies
Correction of identified issues
RA reporting
Adoption & sharing of industry best
practice
Measurement framework
RA control structure
Risk mitigation
RA control coverage & data quality
Leakage & benefits
RA control efficiency
RA control effectiveness
RA productivity metrics
Unmeasured leakage
Technology strategy
Technology acquisition
Functionality of RA toolset
Access to information
Data analysis
Use of RA technology
Ease of use
Degree of automation
Revenue coverage
Supplier management
Provides a method to assess the maturity of business activities that should
deliver revenue assurance objectives based on a quantitative maturity model
Maturity Model Assessment Areas:

16
The TM Forum RAMM2
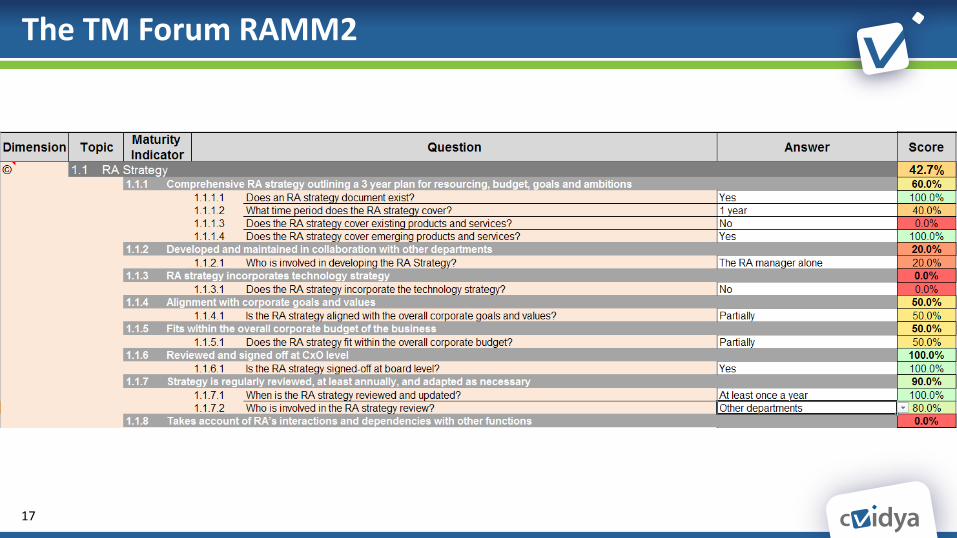
17
The TM Forum RAMM2
18
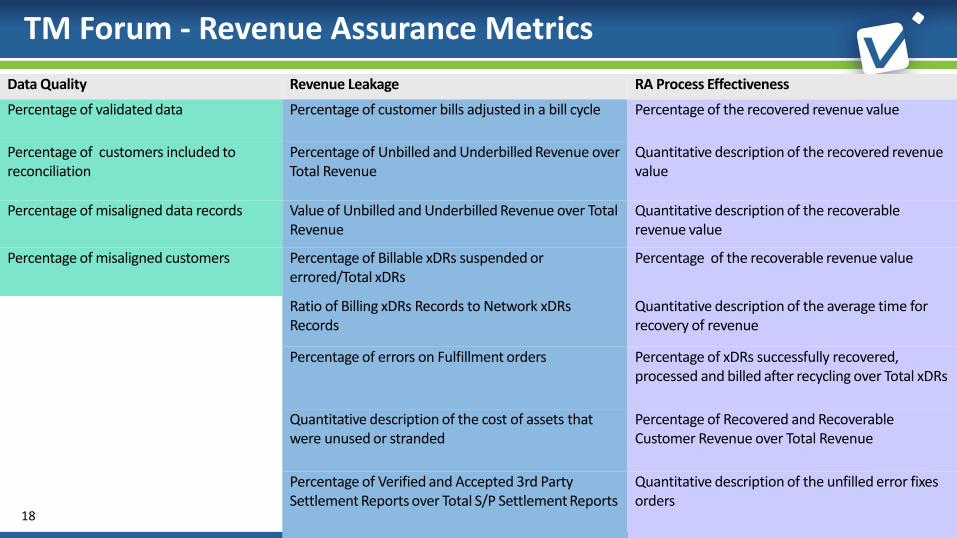
TM Forum - Revenue Assurance Metrics
Data Quality Revenue Leakage RA Process Effectiveness
Percentage of validated data Percentage of customer bills adjusted in a bill cycle Percentage of the recovered revenue value
Percentage of customers included to reconciliation
Percentage of Unbilled and Underbilled Revenue over Total Revenue
Quantitative description of the recovered revenue value
Percentage of misaligned data records Value of Unbilled and Underbilled Revenue over Total Revenue
Quantitative description of the recoverable revenue value
Percentage of misaligned customers Percentage of Billable xDRs suspended or errored/Total xDRs
Percentage of the recoverable revenue value
Ratio of Billing xDRs Records to Network xDRs Records
Quantitative description of the average time for recovery of revenue
Percentage of errors on Fulfillment orders Percentage of xDRs successfully recovered, processed and billed after recycling over Total xDRs
Quantitative description of the cost of assets that were unused or stranded
Percentage of Recovered and Recoverable Customer Revenue over Total Revenue
Percentage of Verified and Accepted 3rd Party Settlement Reports over Total S/P Settlement Reports
Quantitative description of the unfilled error fixes orders

19
Revenue Assurance Metrics, 2015 planned changes
Data Quality Revenue Leakage RA Process Effectiveness
Percentage of validated data Percentage of customer bills adjusted in a bill cycle Percentage of the recovered revenue value
Percentage of customers included to reconciliation
Percentage of Unbilled and Underbilled Revenue over Total Revenue
Quantitative description of the recovered revenue value
Percentage of misaligned data records Value of Unbilled and Underbilled Revenue over Total Revenue
Quantitative description of the recoverable revenue value
Percentage of misaligned customers Percentage of Billable xDRs suspended or errored/Total xDRs
Percentage of the recoverable revenue value
Ratio of Billing xDRs Records to Network xDRs Records
Quantitative description of the average time for recovery of revenue
Percentage of errors on Fulfillment orders Percentage of xDRs successfully recovered, processed and billed after recycling over Total xDRs
Quantitative description of the cost of assets that were unused or stranded
Percentage of Recovered and Recoverable Customer Revenue over Total Revenue
Percentage of Verified and Accepted 3rd Party Settlement Reports over Total S/P Settlement Reports
Quantitative description of the unfilled error fixes orders

20
Revenue Assurance Metrics, 2015 planned changes
Cost Assurance Maturity and Risk
Percentage of over payments to 3rd parties Maturity of Revenue Assurance operations as defined in GB941-B V.2.
Percentage of over payments of commissions and incentives
Change in the Maturity of Revenue Assurance operations
Percentage of discounts, goodwill credits, adjustments
RA residual risk level as defined in GB941-E
Percentage of unjustified discounts, goodwill credits, adjustments value
Risk reduction following RA controls as defined in GB941-E
RA coverage as defined in GB941-E

21
TM Forum - Big Data Analytics Catalyst
1. Harnessing the power of Big Data Analytics to improve customer experience and achieve business growth
2. Defining and implementing a new and innovative concept for a unified Analytics Big Data Repository (ABDR)
3. ABDR supporting multiple big data use cases and commercial data analytics systems, while avoiding data replications
22
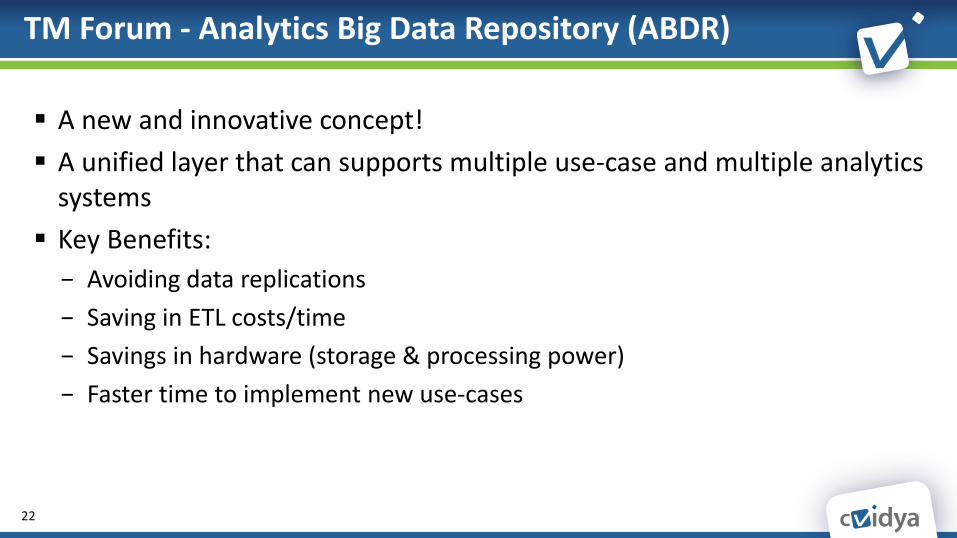
TM Forum - Analytics Big Data Repository (ABDR)
A new and innovative concept!
A unified layer that can supports multiple use-case and multiple analytics systems
Key Benefits:
− Avoiding data replications
− Saving in ETL costs/time
− Savings in hardware (storage & processing power)
− Faster time to implement new use-cases

23
Future trends
Revenue Assurance
Area or Problem Space Traditional Focus Future Trend
Mobile Billing Sophistication Relatively simple bills with bundled services to verify rating and usage.
Complex mobile data plans with usage limits, shared family plans. Onus moves to optmize prices for specific lifestyle plans
Charging Complexity
Prepaid and charging require an inordinate amount of revenue assurance due to multiple platforms on the backend.
Market adopts centrally managed, but distributed charging systems. Hybrid model allows postpaid subs to pay for certain content/services on the fly.
Targeted Areas of Process Improvement
Order-to-Provision & Bill-to-Cash
End-to-end processes that assure the customer experience in niches the business chooses to be excellent in
Customers to Assure Consumers and Small Business (single account)
VIPs across Enterprise, Consumer and Partner Markets (including group and hierarchical accounts)
RA Maturity Dimensions 1) Data Completeness & Accuracy 2) Rating Excellence
3) Margin Analysis 4) Cash Flow /Dispute Management 5) VIP Customer Synchronization
Enterprise billing
RA departments play limited role in enterprise business due to complexity of custom contracts and subaccount hierarchies
Expanding enterprise portfolio in wireless, cloud and IT outsourcing will require assurance monitoring, particularly to mid-sized enterprises.
Source, TRI, The Telecom Analytics & Big Data Solutions Market, 2014

24
Business models and products are changing − Flat rates
− LTE
− Family plans
− Sponsored data
− Privileged data (?)
− QoS on demand
− Data exchange
− M2M / IoT
How does it affect RA?
RA and New Business Models

25
France – will LTE remain premium?
25

26
Sponsored Data
Source: http://www.att.com/gen/press-room?pid=25183&cdvn=news&newsarticleid=37366&mapcode=

27
Data Exchange
Source: http://www.telecomasia.net/content/china-mobile-hk-opens-data-exchange-platform

28
Verizon “Share Everything” Data Plan 12/2013
Source: http://www.verizonwireless.com/b2c/plan-information/?page=share-everything

THANK YOU! www.cvidya.com
Related Documents