REVELATIONS IN POLICY STABILITY Revelations in Policy Stability: Political Climate, Legislative Strategy, and Chemical Dependency Treatment Policy in Minnesota 1995-2008 Bradley T. Conley University of Minnesota – Twin Cities Spring, 2014 Submitted under the supervision of Professor Andrew Karch to the University Honors Program at the University of Minnesota-Twin Cities in partial fulfillment of the requirements for the degree of Bachelor of Arts, summa cum laude in Political Science. May 1, 2014

Welcome message from author
This document is posted to help you gain knowledge. Please leave a comment to let me know what you think about it! Share it to your friends and learn new things together.
Transcript
REVELATIONS IN POLICY STABILITY
Revelations in Policy Stability:
Political Climate, Legislative Strategy, and
Chemical Dependency Treatment Policy in Minnesota
1995-2008
Bradley T. Conley
University of Minnesota – Twin Cities
Spring, 2014
Submitted under the supervision of Professor Andrew Karch to the University Honors Program
at the University of Minnesota-Twin Cities in partial fulfillment of the requirements for the
degree of Bachelor of Arts, summa cum laude in Political Science.
May 1, 2014
REVELATIONS IN POLICY STABILITY
ii
Dedicated to all who have been lost to chemical dependency, all who currently suffer, and all
who work tirelessly to help find mindful resolution.
REVELATIONS IN POLICY STABILITY
iii
Abstract
This thesis examines Minnesota’s Health and Human Services legislative committees through
seven biennia, from 1995 to 2008, to better understand the successes and challenges within the
current chemical dependency treatment system. Examination is carried out through the use of
individual and aggregate ideological data. Trends in both median and mean polarization reveal
the level of partisanship between bodies over time, while standard deviation that of homogeneity.
Beyond partisanship, three contrasting theories are used to analyze potential legislative strategy.
Polarization and theory are then used in conjunction to observe appropriations and policy output.
Analysis suggests strong relationships between legislation and polarization, homogeneity, and
the applicable strategic theory. This research proposes that legislative committee appointments
may indicate and predict a given session’s political climate, strategy, potential committee output
and its likelihood of passage.
Keywords: chemical dependency treatment, polarization, ideology, partisanship,
homogeneity, Conditional Party Government theory, Information and Legislative Organizational
theory, Major Party Cartel theory
REVELATIONS IN POLICY STABILITY
iv
Acknowledgements I would like to acknowledge my summa thesis advisor, Professor Andrew J. Karch,
Department of Political Science, for his incredible support, guidance, and patience in the
research, analysis, and assemblage of this thesis. I would also like to thank Robin Phinney,
Research Associate in the Department of Political Science, and Professor Christina Haas,
Department of Writing Studies, for their generous and professional advice and insight
during the writing and editing process.
REVELATIONS IN POLICY STABILITY
v
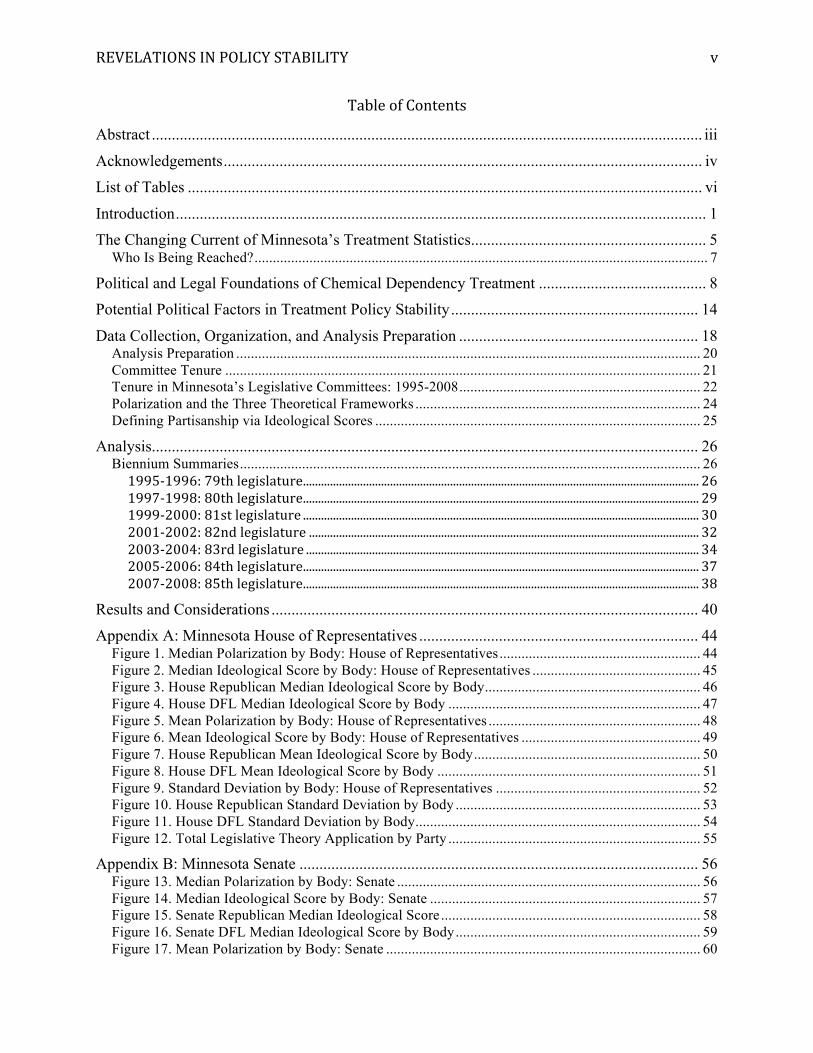
Table of Contents
Abstract .......................................................................................................................................... iii Acknowledgements ........................................................................................................................ iv List of Tables ................................................................................................................................. vi Introduction ..................................................................................................................................... 1 The Changing Current of Minnesota’s Treatment Statistics ........................................................... 5
Who Is Being Reached? ............................................................................................................................ 7 Political and Legal Foundations of Chemical Dependency Treatment .......................................... 8 Potential Political Factors in Treatment Policy Stability .............................................................. 14 Data Collection, Organization, and Analysis Preparation ............................................................ 18
Analysis Preparation ............................................................................................................................... 20 Committee Tenure .................................................................................................................................. 21 Tenure in Minnesota’s Legislative Committees: 1995-2008 .................................................................. 22 Polarization and the Three Theoretical Frameworks .............................................................................. 24 Defining Partisanship via Ideological Scores ......................................................................................... 25
Analysis......................................................................................................................................... 26 Biennium Summaries .............................................................................................................................. 26 1995-‐1996: 79th legislature .................................................................................................................................... 26 1997-‐1998: 80th legislature .................................................................................................................................... 29 1999-‐2000: 81st legislature .................................................................................................................................... 30 2001-‐2002: 82nd legislature .................................................................................................................................. 32 2003-‐2004: 83rd legislature ................................................................................................................................... 34 2005-‐2006: 84th legislature .................................................................................................................................... 37 2007-‐2008: 85th legislature .................................................................................................................................... 38
Results and Considerations ........................................................................................................... 40 Appendix A: Minnesota House of Representatives ...................................................................... 44
Figure 1. Median Polarization by Body: House of Representatives ....................................................... 44 Figure 2. Median Ideological Score by Body: House of Representatives .............................................. 45 Figure 3. House Republican Median Ideological Score by Body ........................................................... 46 Figure 4. House DFL Median Ideological Score by Body ..................................................................... 47 Figure 5. Mean Polarization by Body: House of Representatives .......................................................... 48 Figure 6. Mean Ideological Score by Body: House of Representatives ................................................. 49 Figure 7. House Republican Mean Ideological Score by Body .............................................................. 50 Figure 8. House DFL Mean Ideological Score by Body ........................................................................ 51 Figure 9. Standard Deviation by Body: House of Representatives ........................................................ 52 Figure 10. House Republican Standard Deviation by Body ................................................................... 53 Figure 11. House DFL Standard Deviation by Body .............................................................................. 54 Figure 12. Total Legislative Theory Application by Party ..................................................................... 55
Appendix B: Minnesota Senate .................................................................................................... 56 Figure 13. Median Polarization by Body: Senate ................................................................................... 56 Figure 14. Median Ideological Score by Body: Senate .......................................................................... 57 Figure 15. Senate Republican Median Ideological Score ....................................................................... 58 Figure 16. Senate DFL Median Ideological Score by Body ................................................................... 59 Figure 17. Mean Polarization by Body: Senate ...................................................................................... 60
REVELATIONS IN POLICY STABILITY
vi
Figure 18. Mean Ideological Score by Body: Senate ............................................................................. 61 Figure 19. Senate Republican Mean Ideological Score by Body ........................................................... 62 Figure 20. Senate DFL Mean Ideological Score by Body ...................................................................... 63 Figure 21. Standard Deviation by Body: Senate ..................................................................................... 64 Figure 22. Senate Republican Standard Deviation By Body .................................................................. 65 Figure 23. Senate DFL Standard Deviation by Body ............................................................................. 66
References ..................................................................................................................................... 67
List of Tables Table 1. Polarization Levels: 1995-1996………………………………………………………...27 Table 2. Polarization Levels: 1997-1998………………………………………………………...29 Table 3. Polarization Levels: 1999-2000………………………………………………………...31 Table 4. Polarization Levels: 2001-2002………………………………………………………...33 Table 5. Polarization Levels: 2003-2004………………………………………………………...35 Table 6. Polarization Levels: 2005-2006………………………………………………………...37 Table 7. Polarization Levels: 2007-2008………………………………………………………...39
REVELATIONS IN POLICY STABILITY
1
Revelations in Policy Stability:
Political Climate, Legislative Strategy, and
Chemical Dependency Treatment Policy in Minnesota
1995-2008
Introduction
It has been six decades since Minnesota first established itself as an innovator of
alcohol and drug abuse treatment, a reputation it has renewed on multiple occasions in
subsequent years. The “Minnesota Model” of chemical dependency (CD) treatment was first
developed for the chronic inebriate in the state hospital system and was quickly adopted by the
then-fledgling Hazelden Foundation in 1949 (Willenbring, 2010). This model integrates the 12-
step practice of Alcoholics Anonymous into the treatment environment and today serves as the
core for more than 90% of all treatment practices in the US (McLellan and Meyers, 2004). In
response to the growing demand for professionally trained counselors in the late 1960s,
Minnesota State Junior College in Minneapolis first offered what is now one of the longest
running addiction counseling degree programs in the country. This program and other curricula
led the way to graduate degree programs for addiction studies at numerous institutions including
the University of Minnesota.
E.M. Jellinek promulgated the concept of addiction as disease in 1960, an idea that
gained the support of counseling professionals and the scientific community. In Minnesota,
reform advocates urged legislative action regarding alcoholism and addiction, resulting in the
decriminalization of public intoxication in 1971 and the establishment of the current statewide
REVELATIONS IN POLICY STABILITY
2
county-based treatment system in 1973. Early treatment programs were dominantly oriented
toward the white male demographic, but programs aimed at minority populations such as
women, youth, and Native Americans were initiated in 1976. The Consolidated Chemical
Dependency Treatment Fund (CCDTF) was legislated in 1986 and soon became recognized as a
superior cost-containing measure ensuring public assistance for low-income citizens requiring
CD treatment.
In recent years there has been a rising tide of challenges to treatment in Minnesota, driven
by a decreasing number of those completing treatment, both in percentage and number, despite
greater access and utilization of the system than ever before. There is tremendous effort to
develop adequate theory and practice regarding the physiological, psychological, emotional,
familial, and social aspects of the circumstance, yet there is a general lack of research in a field
in which my research shows importance relevance: political science.
With this thesis I explore the political origins of the treatment system to better understand
current successes and challenges within the system. I propose we consider the system’s
legislative history and regard the issue more than one of public health; perhaps that politics may
be as strong a variable in effective treatment as any within the client or counselor. It may be
uncommon to consider a political relationship to CD treatment, yet as my research shows, there
are connections between a given political climate and its contemporary legislation. Through the
consideration of history and the thorough examination of the Health and Human Services
committees I intend to offer the possibility of predicting future trends, perhaps as a means of
curbing potential hindrances to treating populations in need.
REVELATIONS IN POLICY STABILITY
3
This thesis begins with an overview of chemical dependency in Minnesota in historic and
contemporary contexts. “The Changing Current of Minnesota’s Treatment Statistics” discusses
the personal and social importance of CD treatment, told through statewide statistics from 2006
to present day. Here I show as there are considerable negative impacts caused by chemical
dependency, there are indeed numerous, interconnected benefits to its treatment.
Second, “The Political and Legal Foundations” explores social, legal, and political
landmarks in the management of chemical dependency throughout the twentieth century. The
state has played a significant role in the classic and contemporary approach to CD treatment,
both at home and throughout the country, and it is paramount to understand the role the
legislature has played in this endeavor. Far more than simple legislative storytelling, this section
examines how seeming conflicting political and social systems and perspectives coordinate to
resolve crises and create fundamentally stable health and fiscal policy.
Third, “Potential Political Factors in Treatment Policy Stability” reviews the theoretical
lenses through which my research data has been conducted. The initial examination of my
research is of ideological polarization, or the level of partisanship between legislative chambers
and committees, parties and individuals. While polarization is ideal for examining distance
between parties and bodies, it does little in the way of revealing the rationale behind such
distance. For a more robust analysis, I have selected three opposing theories on the function of
legislative committees: Conditional Party Government, which demands party consensus for the
successful passage of legislation; Informational Theory, in which highly experienced and
REVELATIONS IN POLICY STABILITY
4
knowledgeable committee members serve only the best interest of the entire legislative chamber,
regardless of their party; and the Major Party Cartel theory, by which the majority party
strategizes a strict legislative agenda and uses its power of committee appointment for best
implementation.
I will then relate the steps I take to design, research, collect, and analyze my data. In
“Data Collection, Organization, and Analysis Preparation” I reveal that not only is there a
connection to the political, but that there are dozens of relationships to consider. Not only is valid
data collected pertaining to its specific topic, this same data is used to verify and validate
otherwise seeming unrelated data. Each perspective stands firmly alone, yet when used in
conjunction its robustness is genuine and formidable.
In “Analysis,” I discuss each legislative biennium in chronological order, elaborating on
the most relevant and appropriate data and theories. Median polarization, or the difference of
midpoints in ideological distribution of two bodies, is the technique that yields usable results in
each biennium. This measure both supports and is supported by one or more other perspectives,
whether it is mean polarization, homogeneity, or one of the three theoretical frameworks. I also
discuss treatment-relevant legislation, specifically that of the health omnibus bills that contain
appropriations and programmatic changes to CD treatment.
Finally, “Results and Considerations” ties together the seven biennia to reveal the
relationship between political climate and the policy decisions and legislation created within. As
the culmination of my research, this section offers an exciting and novel perspective on the
REVELATIONS IN POLICY STABILITY
5
political origins of CD treatment. In addition to the examination of the analysis results, I offer
pertinent considerations regarding the future use of said results in assessing potential legislative
climates. This section, as with the thesis as a whole, is not intended to offer definitive answers,
but to serve as a fresh perspective to common challenges.
The Changing Current of Minnesota’s Treatment Statistics
The attention paid to abuse and addiction in Minnesota has been driven by the
recognition of its vast personal and societal effects. Addiction does not happen in isolation; while
the potential for addiction may be personal, both the initial and ultimate steps of its process occur
within society. There are incredible costs to the individual, the family, the economy, and the
health care and criminal justice systems. Effective treatment services can provide tangible
savings in all of the areas.
The primary effects of any Substance Use Disorder (SUD) are those imposed on the
individual and their personal relations. In addition, in Minnesota those who suffer an SUD are
very likely to suffer an emotional or psychological disorder as well. A 2006 report from the
University of Minnesota School of Public Health reported 9.1% of the state’s adult population fit
the criteria for SUD (University of Minnesota, 2006). Currently up to 80% of all SUDs are
accompanied by a mental health disorder. This statistic reflects the affect on juveniles as well,
who show a reliance on substance use depending upon the mental illness: psychosis (29% SUD);
bipolar (19%); intermittent explosive (19%); depression (11%); anxiety (10%). The tendency for
future use is established in the adolescent years, and those who suffer from high risk of mental
REVELATIONS IN POLICY STABILITY
6
illness are twice as likely to use alcohol than low-risk adolescents (42% to 21.2%), nearly three
times as likely marijuana (22% to 7.6%) as well as tobacco (30% to 9.7%) (Godin, Mostrom, &
Aby, 2009).
The greatest physical harm one can suffer is of course the loss of one’s life. According to
the MNDHHS Drug Abuse Trends reports of June 2008 and June 2012, between 2000-2010
there were 1,190 drug-related deaths in Hennepin County alone: 410 from cocaine use (59 in
2007); 673 from various opiates (84 in 2008); and 107 from methamphetamines (19 in 2004)
(Minnesota Department of Human Services, 2008; Minnesota Department of Human Services
2012). At times the loss of life can be that of an innocent bystander; in the same period as above
there were 1,945 alcohol-related fatalities on Minnesota roads. The tendency for increased risk-
taking is also a factor in the spread of life-threatening sexually transmitted disease, and between
2010-2012 14% of Minnesota’s new HIV cases were associated with intravenous drug users
(Minnesota Department of Human Services, 2013).
In addition to the personal costs accrued by addiction, there are substantial economic
burdens on the health care and criminal justice systems. An oft-cited 1998 study by the U.S
Department of Health and Human Services (USHHS) shows that for every one dollar in
treatment costs saves seven dollars in the criminal justice system; savings are found through both
decreased likelihoods for being arrested (16%) and felony conviction (34%) when treatment is
completed. When savings from the health care system are included (through reduced hospital
visits and community psychiatric care visits, for example) the single dollar of cost can save
twelve. In California, every $100,000 spent on treatment results in an annual average health care
REVELATIONS IN POLICY STABILITY
7
savings of $487,000, and $700,000 in avoided criminal activity. Employers have also been
shown to benefit from reduced absenteeism, tardiness, on-site injuries, and disputes, and an
overall increase in productivity (U.S Department of Health and Human Services, 2009).
Who Is Being Reached?
Through increased appropriations to the CCDTF, more Minnesotans are entering
treatment with public funding than ever before, yet the state has long admitted the inability to
reach the vast majority of those in need. Using HHS population estimates with the 2010 census
reveals there are 482,657 Minnesota residents who fit SUD criteria. There were 50,124 reported
treatment admissions in the 2012 Chemical Dependency Provider Performance Measures
(CDPPM) (all facilities that receive state funding are required to report), meaning 9.6% of those
in need entered treatment (Minnesota Department of Human Services, 2013). Not only is the
affect of higher admissions diminished when adjusting for overall population growth, it is even
more so when taking into account 28,069 (56%) completed their program. Total completions in
2012 were lowest since 2003, when 30,379 successfully completed (66% of 46,029 admissions)
(Minnesota Department of Human Services, 2008; Minnesota Department of Human Services,
2013). This is part of a downward trend that began in 2007.
The stark contrast of admissions to completions is revealed between the earliest available
CDPPM in 2007 and that of 2012. By 2012 there was an 8% increase in the overall number of
admissions (46,412 to 50,124) but an identical decrease in completion rates (64% to 56%), for an
overall loss from 2007 of 1,634 completed programs. In addition, multiple dimensions within the
National Outcome Measures (NOMS) outpaced the increase in admissions: homeless on
REVELATIONS IN POLICY STABILITY
8
admission (currently 8.4%); not employed/student on admission (59.9%); drug use in past 30
days (41.3%); and no self-help group participation past 30 days (58.6%). The Summary
Measure, which indicates the overall percentage change (+/-) in all seven NOMS, fell 4.2% from
49.5% in 2007 to 45.3% in 2012 (Minnesota Department of Human Services, 2008; Minnesota
Department of Human Services, 2013).
In the same time period, there were sizable increases in the six Dimensions of Addiction,
which observe clients with chemical health severity ratings of moderate, serious, or extreme:
acute intoxication (9% to 14.2%); biomedical conditions and complications (14.8% to 17.1%);
emotional/behavioral/cognitive problems (55.6% to 72.3%); resistance to change (56.8% to
70%); relapse/continued use potential (86.6% to 96.2%); and unsupportive recovery environment
(71.8% to 90.2%). Here the Summary Measure decreased 7.8%, almost twice that of NOMS,
from 32% to 24.2% (Minnesota Department of Human Services, 2008; Minnesota Department of
Human Services, 2013). In light of increased admission rates, the above statistics suggest a
growing complexity for CD treatment, one in which a more focused political consideration may
be required. If policy has increased access for a socioeconomic demographic, and the conditions
by which said demographic exists has become more challenging, then policy must reflect those
challenges as well.
Political and Legal Foundations of Chemical Dependency Treatment
In this thesis I argue that treatment stabilization efforts in Minnesota are improved with
the consideration of the system’s political origins, both historically and contemporarily. Indeed,
my research reveals a long and complex history, one that involves multiple actors, motivations,
REVELATIONS IN POLICY STABILITY
9
and stages. The process of change was initially driven by the decriminalization of public
intoxication, as public, political, and professional sentiment changed to view chronic inebriation
not as a punishable offense but a treatable disease. In its history, Minnesota has experienced
three stages while establishing the current CD treatment system: criminal, transitional, and public
health.
The criminal stage of development, defined by the criminal processing of chronic
inebriates, was between 1899 and 1966, when Minnesota Statute 340.96 prohibited the act of
public intoxication by the voluntary consumption of intoxicating liquors. Enforcement of this
statute was carried out by municipal police departments throughout the state who acted
according to their given charter’s coordinating ordinances. The statute focused on the chronic
inebriate and it placed the burden of apprehending and housing offenders upon local law
enforcement, thereby diverting attention from more severe criminal activity. Hennepin County
was the first to take a step towards reform in 1966 when it established the Pre-Court Screening
Committee. The committee consisted of twelve members from local services familiar with
chronic inebriation, and whose responsibility it was to review and recommend drunkenness cases
to the bench. This was an innovative attempt to assist the skid-row inebriate who would
traditionally be processed by the courts.
The state’s transitional stage began on May 22, 1967, with the passage of the
Hospitalization and Commitment Act (Minn. Stat. Ann. §§ 253A.01-121, 1971), which provided
for the voluntary, involuntary, and emergency hospitalization and treatment of the chemically
dependent and mentally ill, including the chronically intoxicated. This act allowed both peace
REVELATIONS IN POLICY STABILITY
10
and health officers to transport and admit persons to health service facilities. It passed during a
substantial conservative majority in both the House (93-42) and Senate (67-45), and was signed
by Republican governor Harold LeVander.
Although the new statute provided means to direct chronic inebriates toward a more
healthful resolution, it did not eliminate the contradictory city ordinances by which local law
enforcement traditionally operated. The conflict between state statute and city charter came to
light on April 7, 1967, when a Mr. Bernard Fearon was arrested and found guilty in Ramsey
County of violating § 340.96. The defense unsuccessfully argued the statute did not apply to the
chronic inebriate, as due to his condition Mr. Fearon could not control his consumption, hence
the act was not voluntary. When appealing the decision to the Minnesota Supreme Court, the
defense also argued 8th Amendment protection against cruel and unusual punishment, citing
passage of the Hospitalization and Commitment Act as indication the state saw chronic
alcoholism as disease.
The Minnesota Supreme Court decision in State v. Fearon on March 21, 1969, held §
340.96 did not apply to the chronic inebriate, providing legal support to the disease model of
chemical dependency. In the opinion by Justice Frank T. Gallagher, the following grounds were
cited for appeal: 1) § 340.96 applies only to voluntary consumption, and that by the very nature
of the chronic inebriate, consumption is involuntary; 2) A previous US Supreme Court case to
uphold a similar Texas statute nonetheless revealed substantial doubt regarding the
constitutionality of such statutes; 3) It follows the evolved opinion of most professionals and
REVELATIONS IN POLICY STABILITY
11
authorities on the disease model of addiction; 4) The state accepted the disease model of
addiction, as reflected in the passage of the Hospitalization and Commitment Act.
The Supreme Court decision in State v. Fearon strengthened the perception of chemical
dependency as a public health issue in the eyes of the public and their elected officials alike. The
Minnesota legislature repealed § 340.96 on March 29, 1971, completely eliminating the criminal
processing of public intoxication and nullifying any inconsistent local ordinances. In it’s stead
was passed Minn. Stat. Ann. §§ 245.68 (h)-(k) (Supp. 1977) which mandated each area mental
health board establish at least one detoxification center; Hennepin County was to open the doors
to its first center the day of the bill’s signing. The act was passed during narrow conservative
majorities in the House (+5) and the Senate (+6), and signed by DFL governor Wendell R.
Anderson.
With area mental health boards opening detoxification centers across the state, the
legislature sought to establish administrative, service, and qualification guidelines that are the
essence of operations today. The Treatment for Alcohol and Drug Abuse Act (Minn. Stat. Ann.
§§ 254A.01-.07 (Supp. 1972)) was passed during a liberal majority in both House (+20) and
Senate (+7), and signed by DFL governor Wendell R. Anderson on May 23, 1973. The
legislation would serve as long-term reform that established a permanent administrative structure
for statewide operations, expanded services and the classes of individuals eligible for financial
assistance, and sanctioned the pick-up and transport of public inebriates by civilians to local
health facilities. It relieved local courts of the criminal processing of the public inebriate,
improved emergency care, and opened access for resocialization. Reform was possible through
REVELATIONS IN POLICY STABILITY
12
the coordinated efforts of legislators, civic, legal, and professional leaders, as well as state and
local commissions. By 1974, Minneapolis would open its second detoxification center, Southside
Detox, serving primarily the Native American community. Hennepin County already had plans
for numerous satellite facilities throughout the county.
While the chemical dependency program was still very young the 1976 Governor’s Bill,
from the desk of Wendell R. Anderson, initiated yet three more programs. These programs aimed
at more unique demographics: the employee assistance programs; youth and other underserved
populations; and American Indian chemical dependency programs. Even as the programs and
initiatives were well intentioned, a report from the Office of the Legislative Auditor, Evaluation
Report on the State Sponsored Chemical Dependency Programs (February 15, 1979), was
harshly critical of not only the cost of the Governor’s bill’s programs but also of the
effectiveness of the chemical dependency service system. The report found issues that are still
relevant today, namely reaching 10-15% of the total population in need of treatment services,
and inconsistent service costs around the state. In 1978, the state spent $22,000,000 on chemical
dependency services, which, when accounting for inflation, is roughly more than the amount the
state would spend in the 1995-1996 biennium, which is the first time frame analyzed with
polarization data in this thesis.
Following the audit of the fledgling chemical dependency division, the state responded
accordingly and in 1986 passed the Chemical Dependency Treatment Act (Minn. Stat. Ann. §§
254B.01-.14). The focus of the bill was the Consolidate Chemical Dependency Treatment Fund
(CCDTF), which combines state appropriations and federal grants into a singular funding
REVELATIONS IN POLICY STABILITY
13
mechanism. Within the CCDTF, centralized funds, client funding eligibility criteria, and service
site payment rates would work in concert to improve access to quality and cost-effective CD
treatment throughout the state.
Eligibility for CCDTF funding, or Rule 25, was originally distributed across the three
levels, known henceforth as Tier I, Tier II, and Tier III. Tier I was reserved for those who met
the same income eligibility requirements, or receiving Medical Assistance (MA) benefits,
General Assistance Medical Care (GAMC), or Minnesota Supplemental Assistance (MSA). Tier
II eligibility was for those not entitled to the above services but had a family income of 60% or
less of the state median income. Finally, Tier III was available for those between 60% and 115%
of the state median income. Entitlement funding was forecast and appropriated through the
health omnibus bills, and there was no limit to the number of individuals who could access
funding if eligible.
The CCDTF currently assists approximately 50% of all Minnesotans admitted into
treatment, or about 26,000 people every year. In addition to the direct benefit to the individual,
the CCDTF also offers treatment provider rates to help acquire similar costs across the state.
Lastly, the CCDTF reserve helps providers who extinguish their yearly allocation early and need
additional funds. Access to reserves is only possible if the provider is able to maintain their own
“maintenance of care,” in which they pay a small portion of the overall costs (typically 15-20%).
Despite all other important factors regarding treatment in Minnesota, I chose to focus this
paper on the appropriations and policy changes to the CCDTF. The program has been the
REVELATIONS IN POLICY STABILITY
14
primary funding mechanism for thousands of Minnesotans since 1988 and has been the single
greatest factor considered for legislative changes affecting CD treatment. My analysis assesses
the CCDTF within the political climate and strategic context of a given session, and I expect
CCDTF policy and appropriations to be restricted or progressed in either a partisan or bi-partisan
climate, respectively.
Potential Political Factors in Treatment Policy Stability
While Woodrow Wilson’s Congressional Government (1885) is fundamental to
scholarship on the U.S. congressional committee system, it was Richard Fenno’s theoretical
framework published in Congressmen in Committee (1973) that brought the potential power the
committee into modern thought. Developed in the pre-reform era with relatively low
polarization, or partisanship between parties, Fenno’s theory claims the committee is a means for
members to achieve reelection, power, and sound public policy. As the reforms of the 1970s
shifted power from the committee chairmanship to the majority party leadership, new theories
developed accordingly. These theoretical arguments are modeled on congressional behavior, yet
by applying them to the Minnesota Health and Human Services policy and finance committees I
am confident they will offer insight into the political shifts for chemical dependency treatment
between 1995-2008. I will observe using the following three theories, all of which have political
validity in Minnesota: Rohde’s Conditional Party Government (1991); Krehbiel’s Information
and Legislative Organization theory (1991); and Cox and McCubbins’ Major Party Cartel theory
(1993).
REVELATIONS IN POLICY STABILITY
15
Despite its reputation as a strong liberal state, Minnesota’s legislature had a conservative
majority in both chambers through most of the 20th century. The House had been under
conservative control 31 of 49 sessions, the Senate for 35, and the Governor’s office for 30.
Without ideological data, might it be safe to conclude this has been a state of relatively low
polarization? The steps toward decriminalization of public intoxication began under conservative
majorities in the 1960s, and advances in treatment were made under both conservative and
liberal administrations in the 1970s and 80s. Despite a lack of ideological data, cursory
observation of health and welfare committee memberships would reveal at least consistently
large rosters in the twenty years leading up to the period in question in this thesis, which would
indicate greater opportunity for minority voices to be effectively heard.
There are indications beginning 1995 that partisanship was taking hold of both chambers.
For instance, it was in this year that policy committees of both chambers were smaller than had
been in the previous twenty years. The average size of committees decreased, with the House
from 26 to 19 members, and the Senate from 15 to 13. The largest committees in the House from
1995-2008 were still smaller than any committee during the previous 12 years, and the Senate
also witnessed four committees with 12 or fewer members. Smaller committee sizes tend to
favor the majority by reducing the minority’s voice and their ability to influence votes. Another
potential indicator of partisanship in this period is that substantial changes to treatment policy
and funding transpired, taking steps unlike those in the past, especially in the 17 years since the
CCDTF began. Yet which of the three institutional theories, if any, could best explain what
transpired in the subsequent years?
REVELATIONS IN POLICY STABILITY
16
Rohde’s Conditional Party Government (CPG) asserts that party consensus on a given
policy is fundamental to its promotion. The theory operates on three principles: sufficient
homogeneity within the party; leverage for the party leadership; and party leadership that will
wield its power. Relative to Minnesota, the primary effect of conditional party government
would be the increase of committee bills that are more reflective of the majority party as a whole
(Rohde, 1991).
To ascertain CPG’s legitimacy in terms of my research, the median majority committee
member must reflect that of the majority party in the chamber. In addition, GPC portends the
increase of homogeneity across constituent concerns. Majority party unity greatly increases the
likelihood of a given bill’s passage, which in turn results in constituent satisfaction. Given the
nature of treatment funding in Minnesota, and the tendency toward support or refusal of public
funding as per party, CPG can be an effective tool for either party to accomplish a given goal.
Krehbiel’s Information and Legislative Organization theory (ILO) also relies
homogeneity, yet committees function to move bills that best serve the jurisdiction of the
committee and thus the whole legislature, not the preference of a singular committee member or
party. For MPC theory to be valid, members must be experts in their jurisdiction, can be flexible
and comfortable with a wide array of political theory and behavior, and recognize the goal is
never about individual needs (Krehbiel, 1991).
Krehbiel’s theory has the greatest ability to build strong bi-partisan coalitions
within the committee or across the chamber. With a coalition it is more likely that a given bill’s
REVELATIONS IN POLICY STABILITY
17
effect will have greater longevity due the support and familiarity of the legislature moving
forward. It is more likely to find this theory applied in times of relatively low polarization, where
cooperation is most favored.
Cox and McCubbins’ Major Party Cartel theory (MPC) claims that a party in the
majority will use its power to develop a legislative cartel, thus producing an environment that
perpetuates it’s own power (Cox & McCubbins, 1993). Through the committee system this is
accomplished by strategic placement of committee chairs and other members willing to pass bills
that are best for the majority party, perhaps most of all the leadership, at the expense of others.
The advantage of the majority party in part lies in controlling the legislative agenda from the
earliest stages of the committee all the way through to the chamber floor (Cox & McCubbins,
1993).
While MPC requires great strategizing and organization, it is quite easy to implement
when the majority is out of proportion. As policy outliers have the potential to derail efforts to
drive legislation, the greater the majority the more likely it is that a bill can pass without
disruption. In addition, MPC can be used to facilitate the stoppage of legislation as well, and
stopping a bill in committee, before it reaches the floor, can drive the success of the majority
party.
In terms of Minnesota’s chemical dependency policy and appropriations, I expect each
theory to produce substantially different legislation. As the most cooperative of the three
theories, ILO would produce legislation that works in the best interests of the treatment system
REVELATIONS IN POLICY STABILITY
18
and both parties, thus guaranteeing a substantial, if not unanimous affirmative vote. Whether
CPG is beneficial to treatment policy is dependent upon the party in which it is used, whether the
consensus in a given year acknowledges treatment as a necessary and important function of
government. Lastly, strong treatment policy within MPC theory is entirely dependent upon the
propensity for party leadership to adhere to the principals of social spending or strict fiscal
conservatism.
Data Collection, Organization, and Analysis Preparation
Data collection strategy is under constant development, and with almost every collection
and analysis yet another new and different perspective comes forward that warrants
consideration. Ultimately, the total amount of data offers the ability to view polarization in as
many as two dozen perspectives (available in the appendices), from those which stand on their
own validity to those whose presence adds robustness to separate sets of information. It is not
enough to simply gather and dissect ideological scores, although this is a fundamental step. I also
need to include policy and financial legislation, as well as the legislature’s foundational role
through bills and acts.
In Spring 2012, Boris Shor and Nolan McCarty released a comprehensive collection of
ideological scores for state legislatures from 1993-2011. The available data for Minnesota is
limited in breadth from 1995-2008, yet it provides a depth of analytic points for both chambers
as well as for individual legislators per session. In total, I am able to assemble two-dozen sets of
data per session to reveal various levels of polarization and homogeneity within chambers,
committees, and parties. There are three aspects under consideration throughout my analysis: the
REVELATIONS IN POLICY STABILITY
19
absolute difference in median ideological scores, or the difference between median scores as per
party, committee, and chamber; the distance in mean, or average ideological scores as per party,
committee, and chamber; and the standard deviation from the mean ideological score, or the
level of homogeneity, as per party, committee, and chamber. By using these in conjunction with
the three theoretical frameworks (discussed above) I am able to ascertain the climate and strategy
of a given session.
Next, I examine committee membership for each of the House Health and Human
Services (HHS) policy committees and finance subcommittees, as well as the Senate HHS policy
committees and finance subcommittees (or the equivalently titled committee/subcommittee of
the given session) from 1995-2008. To give context to the quantity of members per committee
for the era, I also collect committee membership going back to 1975 (this data is for comparing
committee size and has no bearing on actual polarization trends as per Shor-McCarty.) Using the
Shor-McCarty individual legislative data sets I assign the relevant ideological score to every
member, committee, subcommittee, and session. I am then able to calculate distances,
differences, and standard deviations between parties and the body as a whole for each committee
and session. I also take special note to identify committee chairperson score. As with the
chamber and national data points above, I use the individual-level data to construct committee-
level trend lines over time from 1995-2008.
I then select all legislation affecting treatment services signed by the governor from
1995-2008. The Minnesota state legislature website’s bill search function is of utmost usefulness
in this endeavor, although state, county, and professional service reports are integral in further
REVELATIONS IN POLICY STABILITY
20
identifying bill numbers and dates of importance. Of particular interest are the health services
omnibus bills as they contain funding allocations, eligibility criteria, programmatic changes, and
service site rate levels, for example. In addition to the content of such bills, I pay special
attention to the authors, the vote totals at passage in both chambers, and whether the level of
polarization might predict partisan bill authorship and vote count (higher polarization/more
partisan authorship/more partisan vote, and vice-versa.)
By itself, appropriation data does not reveal the decision making process, and in the
absence of committee minutes or any substantial movement between engrossments (if there were
more than one) I resort to the publications provided by the fiscal analysis offices of both
chambers. The Senate Fiscal Review is by and large thorough in its explanations of
appropriations and expenditures, whereas the House provides numerical comparisons between
appropriations within the House, Senate, and governor’s bills, as well as that of conference
committee. As a third, and often times more revealing display of the process, reference is made
to any HHS departmental documentation, especially presentations prepared for the legislature or
for inter-department/division use.
Analysis Preparation
In this thesis I report analysis as per-biennium from 1995-2008 (79th to 85th legislatures)
via ideological data that best represents the overall political climate in both chamber and
committee. Most important are the polarization measures by median (the mid-point of
ideological distribution of each party or body) and means (the average ideological score for each
party or body), as well as homogeneity or cohesion by standard deviation. In order to validate
REVELATIONS IN POLICY STABILITY
21
any of the three theoretical frameworks, I examine the individual party members in committee in
relation to their respective parties in the chamber and the chamber as a whole. I also examine the
policy decisions and output of each session, as well as legislation for CCDTF appropriations,
service site rate levels, and policy changes. Appropriations are often dissimilar to actual funding
levels, and when possible I account for these discrepancies with the addition of supplemental
bills primarily authored in the second year of the biennium. General data are presented in tables
for quick and easy assessment, while a wide selection of graphs is available in the Appendix.
The Shor-McCarty ideological scores for Minnesota are available from 1995-2008, which
is precisely the era in which substantial changes to CD treatment policy occur, visible not only
through polarization trends but in committee size and the legislative changes made to CD
treatment services in Minnesota. Without ideological data before 1995 I can only observe the
above changes and conclude an overall shift from a more moderate committee in which our
treatment service was established. The conclusion is drawn upon not only a highly polarized
legislature relative to its self but also all other states, amongst whom Minnesota ranked ninth
most polarized legislature in 2008.
Committee Tenure
Tenure is an important consideration, especially within the majority party, as it may help
reveal appointment strategy by the caucus committee and predict possible environment via
compatibility with any of the three theoretical frameworks. Each of these theories demands
specific committee membership. Under the Conditional Party Government (CPG) theory a
committee membership closely reflects the majority party ideological median, and a party may
REVELATIONS IN POLICY STABILITY
22
abandon inharmonious incumbency in favor of newly appointed members more willing to act on
behalf of the party consensus. A committee within the Information and Legislative Organization
theory (ILO) theory would reflect the best interests of the committee and that over which it has
jurisdiction, thus serving the whole legislative body. A committee as such would likely be
comprised of experienced, moderately ideological incumbents, or adequately knowledgeable and
suitably moderate members in lieu of available experience. In the Major Party Cartel (MPC)
theory the majority party leadership appoints committee members by their ready adherence to the
strict legislative agenda formulated by said leadership. Just as within CPG, the cartel committee
cannot contain policy outliers that may jeopardize a predictably divisive committee vote.
If three theories necessitate three different committee environments to be valid, can the
observation of committee membership at the onset of a given session predict policy decisions?
Neither incumbency nor freshmen status mean little without ideological identity, therefore the
replacement of an incumbent (necessitated by retirement or loss of elected position) may indicate
the strategic preference by party leaders via change in ideological score for the appointment (not
re-appointing an incumbent of course carries its own preference significance.)
Tenure in Minnesota’s Legislative Committees: 1995-2008
Of the 22 members of the DFL-controlled House policy committee in 1995, 12 had
continued from 1993-1994 (six Republican and six DFL), and 11 of the 1995 membership would
then remain for three or more consecutive legislative sessions. Also in this membership are
names that would become very familiar: Boudreau (1995-2004); Bradley (1995-2006);
Greenfield (1979-1998); Huntley (1993-2008); and Otremba (1995-2008). Committee
REVELATIONS IN POLICY STABILITY
23
incumbency is used to less effect by Republicans in the latter sessions, but initially it is widely
used by both parties. In 2001, twelve of all sixteen members would be incumbent, with multiple
members active since the first session: Boudreau (R); Bradley (R); Haas (R); Mulder (R); and
Otremba (DFL). Of this session, the Republican majority is comprised of nine members, eight of
whom are incumbents.
The 2002 election gave the House Republicans a 29-seat majority, the largest majority by
any party in 10 years. In this election 33 incumbents did not seek reelection, and while 10
incumbents lost their bids for reelection, five of these were to members of their own party. This
transition of majority party, coupled with the largest freshman class in decades will greatly affect
House committee membership in the following years and by the 2007-2008 biennium
incumbents will account for only three out of 15 policy, and three out of 21 finance
appointments.
The House finance subcommittee followed a similar path as policy, reaching peak mid-
period with all six members of the Republican majority in 2001 as incumbents, five of whom
have more than two consecutive years. The policy committee took a rare strategic move and
controlled fiscal decisions in 2005-2006. At this time both chamber and committee median
ideology would skyrocket with new committee appointments, perhaps signaling the direction of
the policy committee should the Republican majority hold.
The Senate committees are under DFL-control for the entirety of the period under
observation, and while incumbency challenges arise as they do in the House, the effect is felt in
REVELATIONS IN POLICY STABILITY
24
the Republican minority membership. While majority party incumbency would remain fairly
strong in Senate policy until 2007-2008, the Republicans would lose all but one incumbent by
2005, along with a defection by Sen. Kiscaden to the DFL in mid-2004. This overall pattern is
repeated in Senate finance where again only one Republican incumbent would remain by 2007-
2008.
Polarization and the Three Theoretical Frameworks
Polarization trends are invaluable in evaluating congressional behavior, yet in isolation
they cannot offer the robustness my research requires. Conversely, theoretical frameworks may
provide insight into strategic value of committee placement, yet they leave open many windows
for speculation, weakening an otherwise powerful tool. However, when used in conjunction, it is
possible to explain ideological polarization within a theoretical framework and the theories
themselves can be validated through ideological data.
As mentioned earlier, each of the three theories used in this research demand a certain
behavior from the membership, as well as from the party caucus leadership in its appointment
decisions. To only know the names and legislative history of committee members limits the
ability to assign ideological/partisan value, and hence the application of ideological scores is
necessary. By calculating the membership medians and means of each of the chamber, majority
party chamber, committee, and majority party committee, as well as the individual scores of the
House Speaker, Senate Majority Leader, and the committee chairs, it is possible to accurately
compare ideological similarities between bodies.
REVELATIONS IN POLICY STABILITY
25
By the proximity in scores between majority party committee membership and party,
party leadership, or chamber, the theoretical framework is revealed. For example, should the
majority party committee members fall within .025 points of the majority party chamber median,
.05 points of the chamber median, and 1.0 point of the party leadership score, it would be easy to
assess that Conditional Party Government theory is most applicable in this situation. Further
information is then used to create an even more robust analysis, for example the consideration of
committee and chamber vote totals, legislative authorship, and committee tenure as discussed
above.
To achieve the above I carry out a dozen calculations for each of the four committees in
each biennium. The results help to view the polarization trends this research is based upon by
offering potential strategic rationale behind the changes in trends. More importantly, the
combination of theory and ideological data may provide for the clearest behavioral explanation
for policy decisions and the opportunity to develop the foresight for future legislative sessions.
Defining Partisanship via Ideological Scores
Throughout this paper I have used the following definitions, and continue to do so for the
analysis:
0 to 0.499 (-0.499) Moderate partisan
0.5 to .999 (-0.499) Partisan
1.0 to 1.499 Strong partisan
1.5+ Very strong partisan
REVELATIONS IN POLICY STABILITY
26
Analysis
Biennium Summaries
1995-1996: 79th legislature
Minnesota’s 79th session serves as the analytic baseline as it is the first in which
Shor-‐McCarty data is available. Despite a lack of ideological data from previous years to
provide for a more accurate assessment, in this session there are departures from historic
trends that may indicate possible committee-‐level polarization and strategizing. In the
previous 10 sessions (1975-‐1994) the House policy committee was comprised of between
24 and 30 members, averaged 25.9, and had a mean of 26. In 1995, that number drops to
22, a number the committee would not exceed in any of the subsequent years of the
analysis. While this may not pose an abnormality on its own, this also occurs in the Senate
policy committee, which drops from an average of 14.5 members in the same 10 sessions to
only 10 members in 1995.
In this session, the median polarization between committees and chambers vary
drastically. The House committees are only .125 - .150 points higher than the House, which, at
1.549 is the most moderate of the research period. On the other hand, median polarization in the
Senate committees is between .33 and .39 lower than the chamber’s 1.443. This is one of the
very few instances of any of the four committees measuring below their given chamber in any of
the 28 observations.
REVELATIONS IN POLICY STABILITY
27
Mean polarization measurements are slightly higher per committee against the chamber.
Committee homogeneity is also fairly moderate, kept in check by Senate committees closer to
their mean than the chamber, the only time this would occur for all committees over time. Lastly,
policy committee chairs are more ideologically aligned with the leaders of their respective
chamber and thus are more moderate than the House and their committee medians, or more
liberal than the Senate and their committee medians.
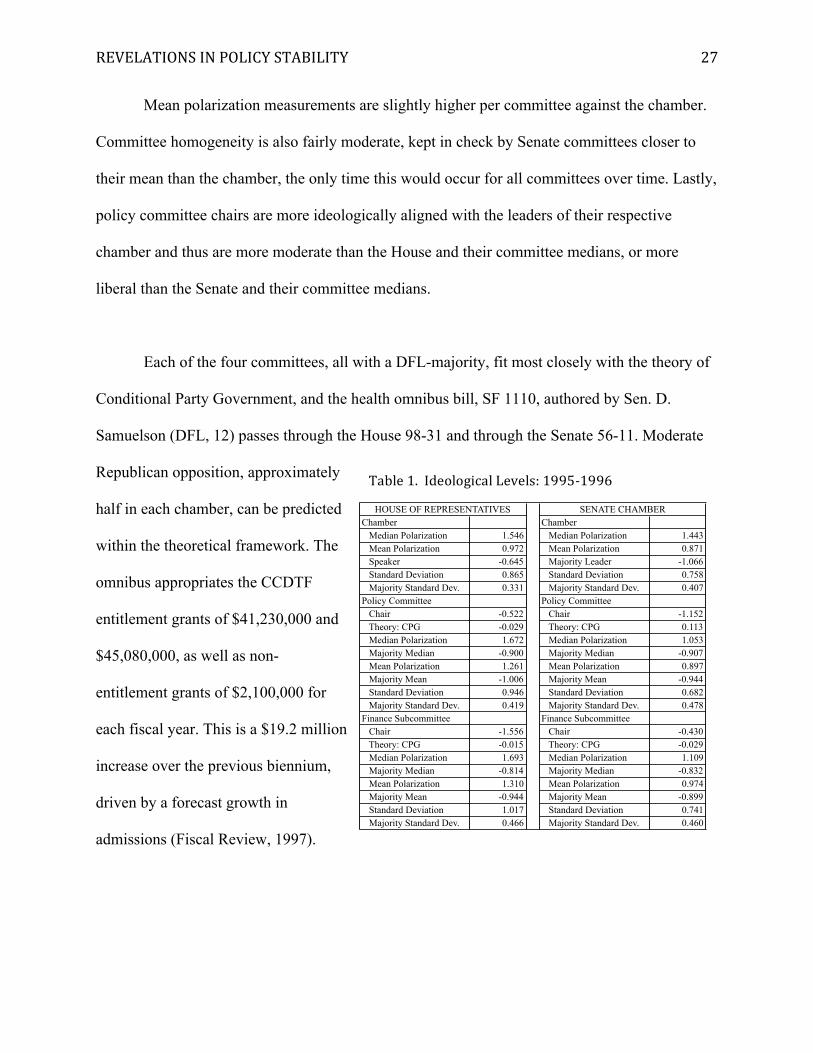
Each of the four committees, all with a DFL-majority, fit most closely with the theory of
Conditional Party Government, and the health omnibus bill, SF 1110, authored by Sen. D.
Samuelson (DFL, 12) passes through the House 98-31 and through the Senate 56-11. Moderate
Republican opposition, approximately
half in each chamber, can be predicted
within the theoretical framework. The
omnibus appropriates the CCDTF
entitlement grants of $41,230,000 and
$45,080,000, as well as non-
entitlement grants of $2,100,000 for
each fiscal year. This is a $19.2 million
increase over the previous biennium,
driven by a forecast growth in
admissions (Fiscal Review, 1997).
Chamber Chamber Median Polarization 1.546 Median Polarization 1.443 Mean Polarization 0.972 Mean Polarization 0.871 Speaker -0.645 Majority Leader -1.066 Standard Deviation 0.865 Standard Deviation 0.758 Majority Standard Dev. 0.331 Majority Standard Dev. 0.407Policy Committee Policy Committee Chair -0.522 Chair -1.152 Theory: CPG -0.029 Theory: CPG 0.113 Median Polarization 1.672 Median Polarization 1.053 Majority Median -0.900 Majority Median -0.907 Mean Polarization 1.261 Mean Polarization 0.897 Majority Mean -1.006 Majority Mean -0.944 Standard Deviation 0.946 Standard Deviation 0.682 Majority Standard Dev. 0.419 Majority Standard Dev. 0.478Finance Subcommittee Finance Subcommittee Chair -1.556 Chair -0.430 Theory: CPG -0.015 Theory: CPG -0.029 Median Polarization 1.693 Median Polarization 1.109 Majority Median -0.814 Majority Median -0.832 Mean Polarization 1.310 Mean Polarization 0.974 Majority Mean -0.944 Majority Mean -0.899 Standard Deviation 1.017 Standard Deviation 0.741 Majority Standard Dev. 0.466 Majority Standard Dev. 0.460
SENATE CHAMBERHOUSE OF REPRESENTATIVES
Table 1. Ideological Levels: 1995-‐1996
REVELATIONS IN POLICY STABILITY
28
Treatment provider rates are effectively frozen from January 1, 1995 until December 31,
1997, which, while a cost-saving measure of $4.9 million for the state, means providers will need
to bear a larger portion of costs in order to maintain services. This was the first time the state had
intervened in providers’ rates since the inception of the CCDTF in 1988. Previously, rates were
negotiated between provider and county, upwards of 3% a year, with the state providing
accordingly. In addition to locking in rates, the bill saves an additional $890,000 by not
reallocating unspent treatment funds from the CCDTF reserve.
Rep. Greenfield (DFL, 62A), author of the omnibus companion bill in the House also
authored HF 1442 with Rep. Leppik (IR, 45B) and Rep. Lourey (DFL, 8B). The bill modified
language regarding the counseling profession, including accreditation, education, and licensure.
It passed the Senate 61-0 and the House 93-30. In addition, he co-authored with Rep. Cooper
(DFL, 15B) HF 66, which established a licensing board for certain health providers, including
chemical dependency. The 1996 omnibus supplemental bill, HF1584, also authored by Rep.
Greenfield, responds to a downward forecast adjustment by reducing CCDTF appropriations by
$3,467,000 and $1,346,000, as biennial spending totals $81,497,000.
This first biennium reveals the predicted level of support from a majority party
historically known to support social services, as well as a moderate level of minority party
opposition predicted within the CPG framework.
REVELATIONS IN POLICY STABILITY
29
1997-1998: 80th legislature
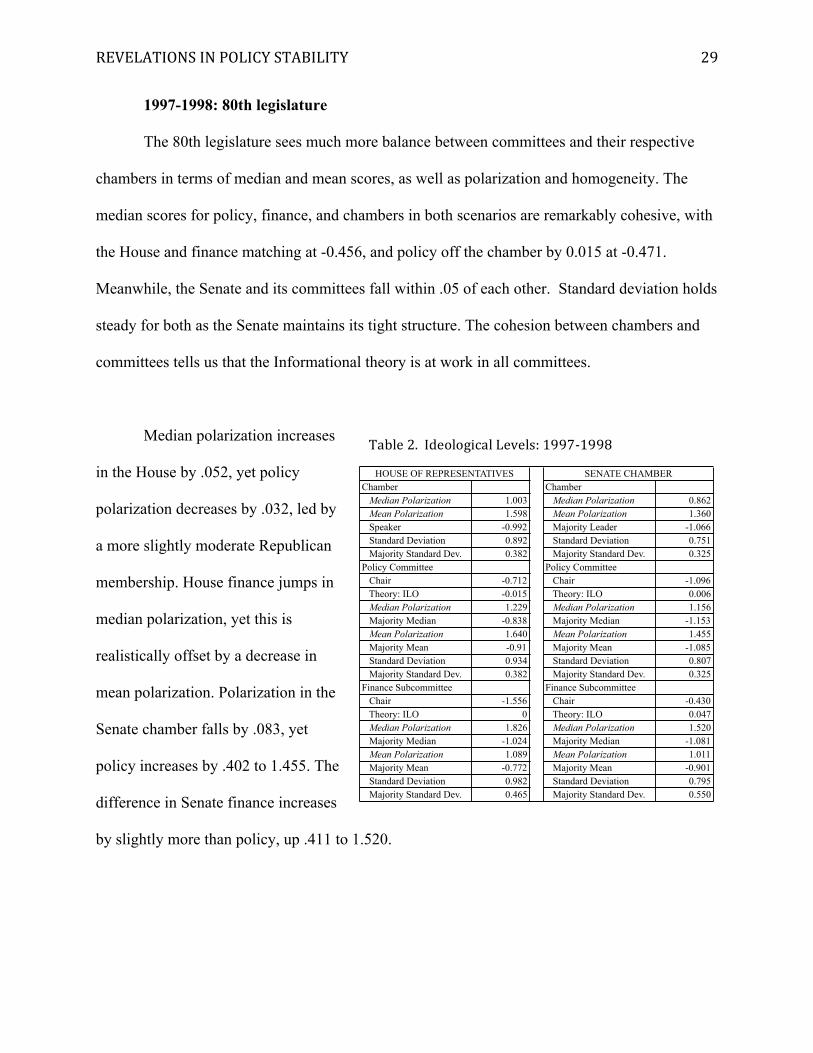
The 80th legislature sees much more balance between committees and their respective
chambers in terms of median and mean scores, as well as polarization and homogeneity. The
median scores for policy, finance, and chambers in both scenarios are remarkably cohesive, with
the House and finance matching at -0.456, and policy off the chamber by 0.015 at -0.471.
Meanwhile, the Senate and its committees fall within .05 of each other. Standard deviation holds
steady for both as the Senate maintains its tight structure. The cohesion between chambers and
committees tells us that the Informational theory is at work in all committees.
Median polarization increases
in the House by .052, yet policy
polarization decreases by .032, led by
a more slightly moderate Republican
membership. House finance jumps in
median polarization, yet this is
realistically offset by a decrease in
mean polarization. Polarization in the
Senate chamber falls by .083, yet
policy increases by .402 to 1.455. The
difference in Senate finance increases
by slightly more than policy, up .411 to 1.520.
Chamber Chamber Median Polarization 1.003 Median Polarization 0.862 Mean Polarization 1.598 Mean Polarization 1.360 Speaker -0.992 Majority Leader -1.066 Standard Deviation 0.892 Standard Deviation 0.751 Majority Standard Dev. 0.382 Majority Standard Dev. 0.325Policy Committee Policy Committee Chair -0.712 Chair -1.096 Theory: ILO -0.015 Theory: ILO 0.006 Median Polarization 1.229 Median Polarization 1.156 Majority Median -0.838 Majority Median -1.153 Mean Polarization 1.640 Mean Polarization 1.455 Majority Mean -0.91 Majority Mean -1.085 Standard Deviation 0.934 Standard Deviation 0.807 Majority Standard Dev. 0.382 Majority Standard Dev. 0.325Finance Subcommittee Finance Subcommittee Chair -1.556 Chair -0.430 Theory: ILO 0 Theory: ILO 0.047 Median Polarization 1.826 Median Polarization 1.520 Majority Median -1.024 Majority Median -1.081 Mean Polarization 1.089 Mean Polarization 1.011 Majority Mean -0.772 Majority Mean -0.901 Standard Deviation 0.982 Standard Deviation 0.795 Majority Standard Dev. 0.465 Majority Standard Dev. 0.550
SENATE CHAMBERHOUSE OF REPRESENTATIVES
Table 2. Ideological Levels: 1997-‐1998
REVELATIONS IN POLICY STABILITY
30
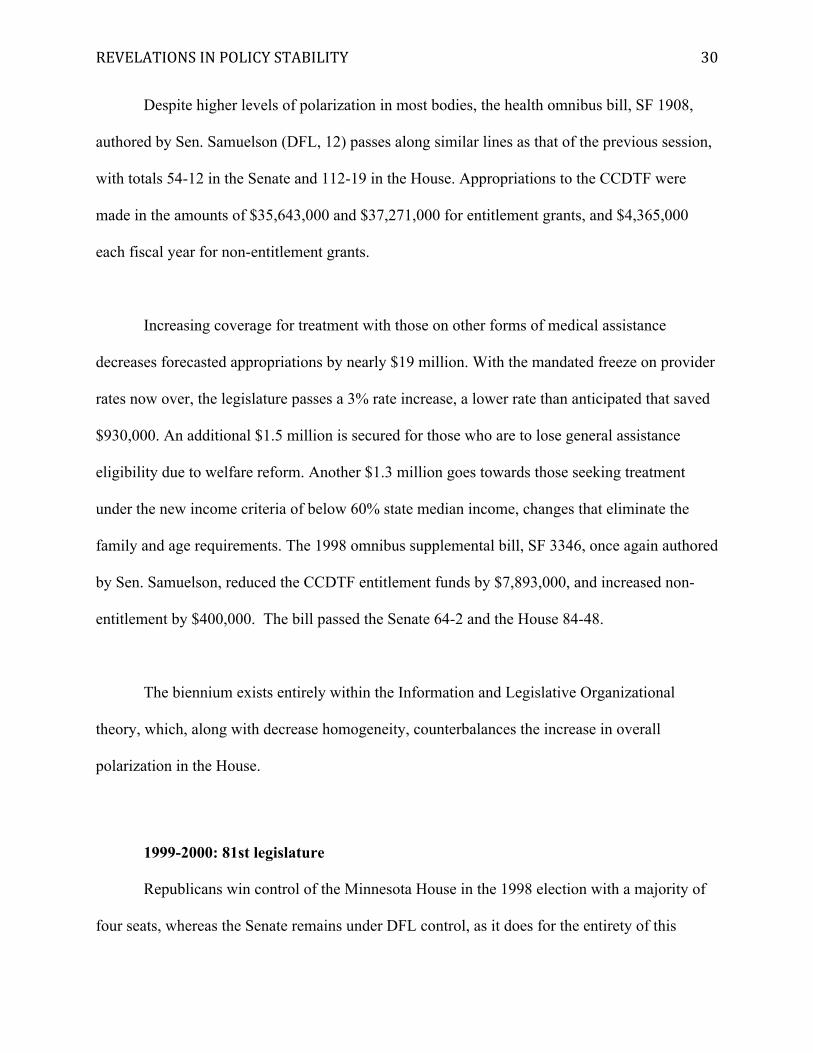
Despite higher levels of polarization in most bodies, the health omnibus bill, SF 1908,
authored by Sen. Samuelson (DFL, 12) passes along similar lines as that of the previous session,
with totals 54-12 in the Senate and 112-19 in the House. Appropriations to the CCDTF were
made in the amounts of $35,643,000 and $37,271,000 for entitlement grants, and $4,365,000
each fiscal year for non-entitlement grants.
Increasing coverage for treatment with those on other forms of medical assistance
decreases forecasted appropriations by nearly $19 million. With the mandated freeze on provider
rates now over, the legislature passes a 3% rate increase, a lower rate than anticipated that saved
$930,000. An additional $1.5 million is secured for those who are to lose general assistance
eligibility due to welfare reform. Another $1.3 million goes towards those seeking treatment
under the new income criteria of below 60% state median income, changes that eliminate the
family and age requirements. The 1998 omnibus supplemental bill, SF 3346, once again authored
by Sen. Samuelson, reduced the CCDTF entitlement funds by $7,893,000, and increased non-
entitlement by $400,000. The bill passed the Senate 64-2 and the House 84-48.
The biennium exists entirely within the Information and Legislative Organizational
theory, which, along with decrease homogeneity, counterbalances the increase in overall
polarization in the House.
1999-2000: 81st legislature
Republicans win control of the Minnesota House in the 1998 election with a majority of
four seats, whereas the Senate remains under DFL control, as it does for the entirety of this
REVELATIONS IN POLICY STABILITY
31
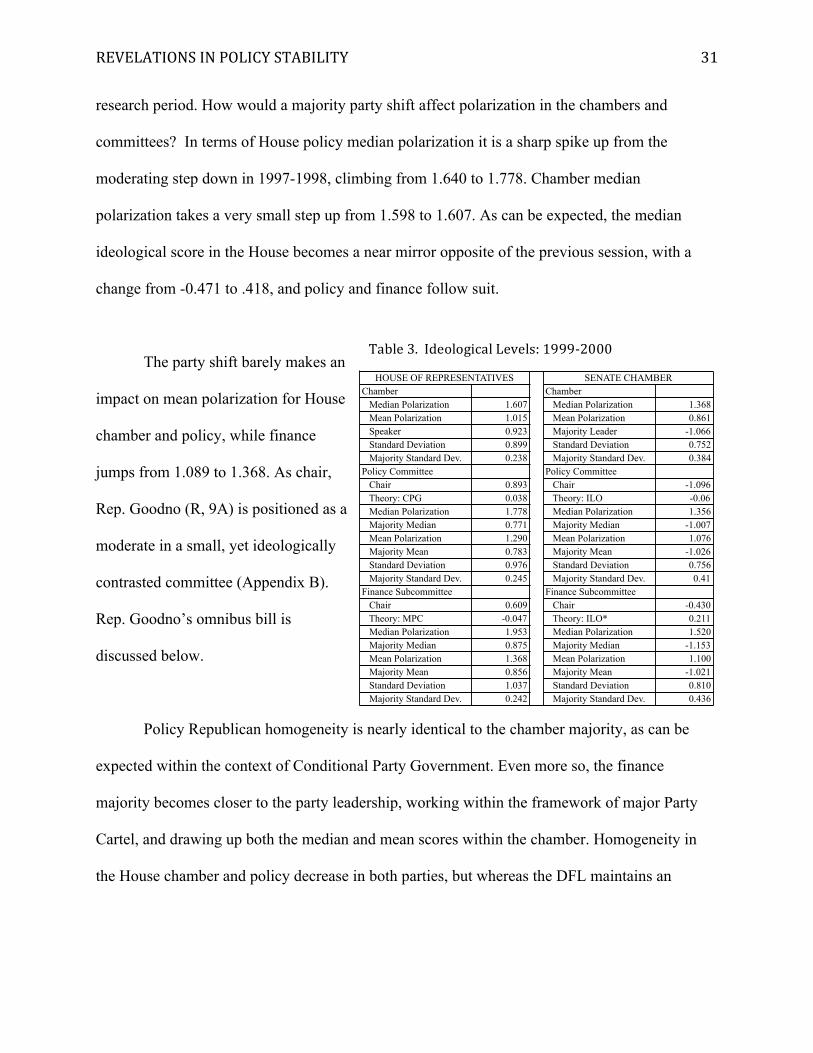
research period. How would a majority party shift affect polarization in the chambers and
committees? In terms of House policy median polarization it is a sharp spike up from the
moderating step down in 1997-1998, climbing from 1.640 to 1.778. Chamber median
polarization takes a very small step up from 1.598 to 1.607. As can be expected, the median
ideological score in the House becomes a near mirror opposite of the previous session, with a
change from -0.471 to .418, and policy and finance follow suit.
The party shift barely makes an
impact on mean polarization for House
chamber and policy, while finance
jumps from 1.089 to 1.368. As chair,
Rep. Goodno (R, 9A) is positioned as a
moderate in a small, yet ideologically
contrasted committee (Appendix B).
Rep. Goodno’s omnibus bill is
discussed below.
Policy Republican homogeneity is nearly identical to the chamber majority, as can be
expected within the context of Conditional Party Government. Even more so, the finance
majority becomes closer to the party leadership, working within the framework of major Party
Cartel, and drawing up both the median and mean scores within the chamber. Homogeneity in
the House chamber and policy decrease in both parties, but whereas the DFL maintains an
Chamber Chamber Median Polarization 1.607 Median Polarization 1.368 Mean Polarization 1.015 Mean Polarization 0.861 Speaker 0.923 Majority Leader -1.066 Standard Deviation 0.899 Standard Deviation 0.752 Majority Standard Dev. 0.238 Majority Standard Dev. 0.384Policy Committee Policy Committee Chair 0.893 Chair -1.096 Theory: CPG 0.038 Theory: ILO -0.06 Median Polarization 1.778 Median Polarization 1.356 Majority Median 0.771 Majority Median -1.007 Mean Polarization 1.290 Mean Polarization 1.076 Majority Mean 0.783 Majority Mean -1.026 Standard Deviation 0.976 Standard Deviation 0.756 Majority Standard Dev. 0.245 Majority Standard Dev. 0.41Finance Subcommittee Finance Subcommittee Chair 0.609 Chair -0.430 Theory: MPC -0.047 Theory: ILO* 0.211 Median Polarization 1.953 Median Polarization 1.520 Majority Median 0.875 Majority Median -1.153 Mean Polarization 1.368 Mean Polarization 1.100 Majority Mean 0.856 Majority Mean -1.021 Standard Deviation 1.037 Standard Deviation 0.810 Majority Standard Dev. 0.242 Majority Standard Dev. 0.436
HOUSE OF REPRESENTATIVES SENATE CHAMBER
Table 3. Ideological Levels: 1999-‐2000
REVELATIONS IN POLICY STABILITY
32
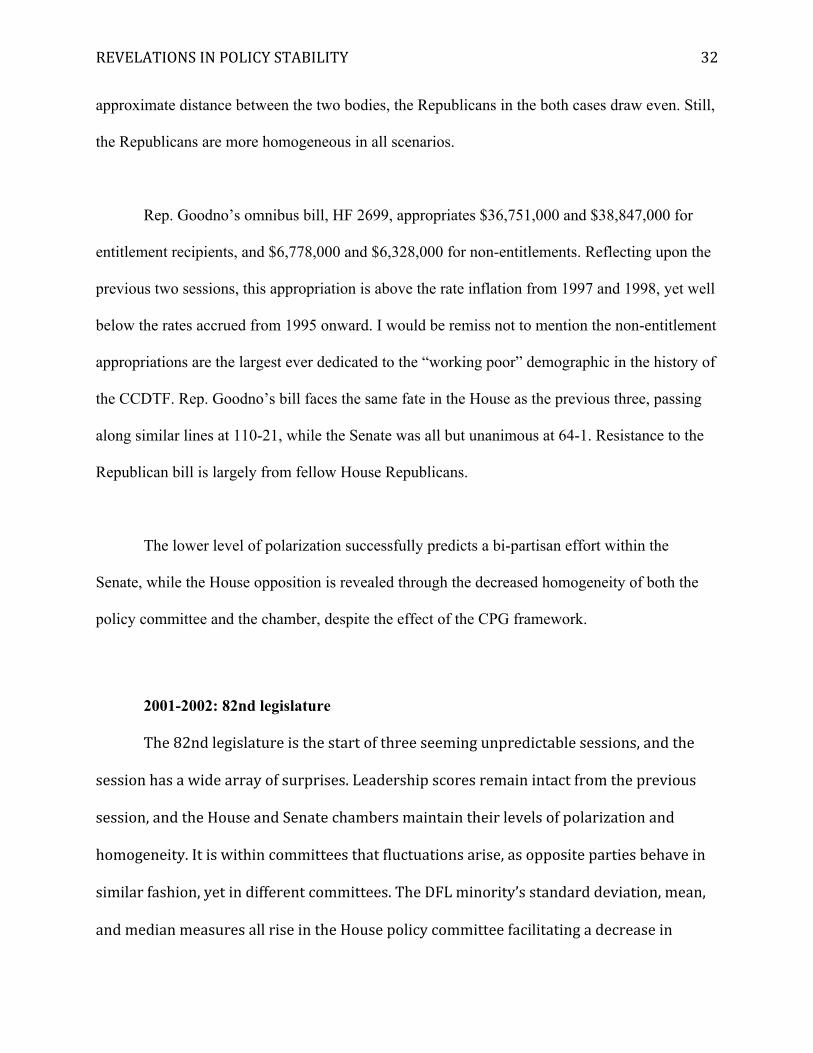
approximate distance between the two bodies, the Republicans in the both cases draw even. Still,
the Republicans are more homogeneous in all scenarios.
Rep. Goodno’s omnibus bill, HF 2699, appropriates $36,751,000 and $38,847,000 for
entitlement recipients, and $6,778,000 and $6,328,000 for non-entitlements. Reflecting upon the
previous two sessions, this appropriation is above the rate inflation from 1997 and 1998, yet well
below the rates accrued from 1995 onward. I would be remiss not to mention the non-entitlement
appropriations are the largest ever dedicated to the “working poor” demographic in the history of
the CCDTF. Rep. Goodno’s bill faces the same fate in the House as the previous three, passing
along similar lines at 110-21, while the Senate was all but unanimous at 64-1. Resistance to the
Republican bill is largely from fellow House Republicans.
The lower level of polarization successfully predicts a bi-partisan effort within the
Senate, while the House opposition is revealed through the decreased homogeneity of both the
policy committee and the chamber, despite the effect of the CPG framework.
2001-2002: 82nd legislature
The 82nd legislature is the start of three seeming unpredictable sessions, and the
session has a wide array of surprises. Leadership scores remain intact from the previous
session, and the House and Senate chambers maintain their levels of polarization and
homogeneity. It is within committees that fluctuations arise, as opposite parties behave in
similar fashion, yet in different committees. The DFL minority’s standard deviation, mean,
and median measures all rise in the House policy committee facilitating a decrease in
REVELATIONS IN POLICY STABILITY
33
overall committee median polarization to 1.635, the second lowest level of median
polarization in the period. The DFL also pulls down polarization in finance with a more
moderate membership. The Republican majority median in both committees remains level
form the previous session.
Median polarization within the Senate, however, reaches its highest level in any session,
increasing by .480 to 1.882. The Republican policy median increases by .413 to .673, and by
0.307 to 0.609 in finance. The DFL majority median falls slightly in both committees, pushing
levels even higher. Committee membership is also surprisingly low, and while House policy
plummets to 16 members for a 25-year low, Senate policy initiates its own series of unusually
low committee memberships (Appendix A).
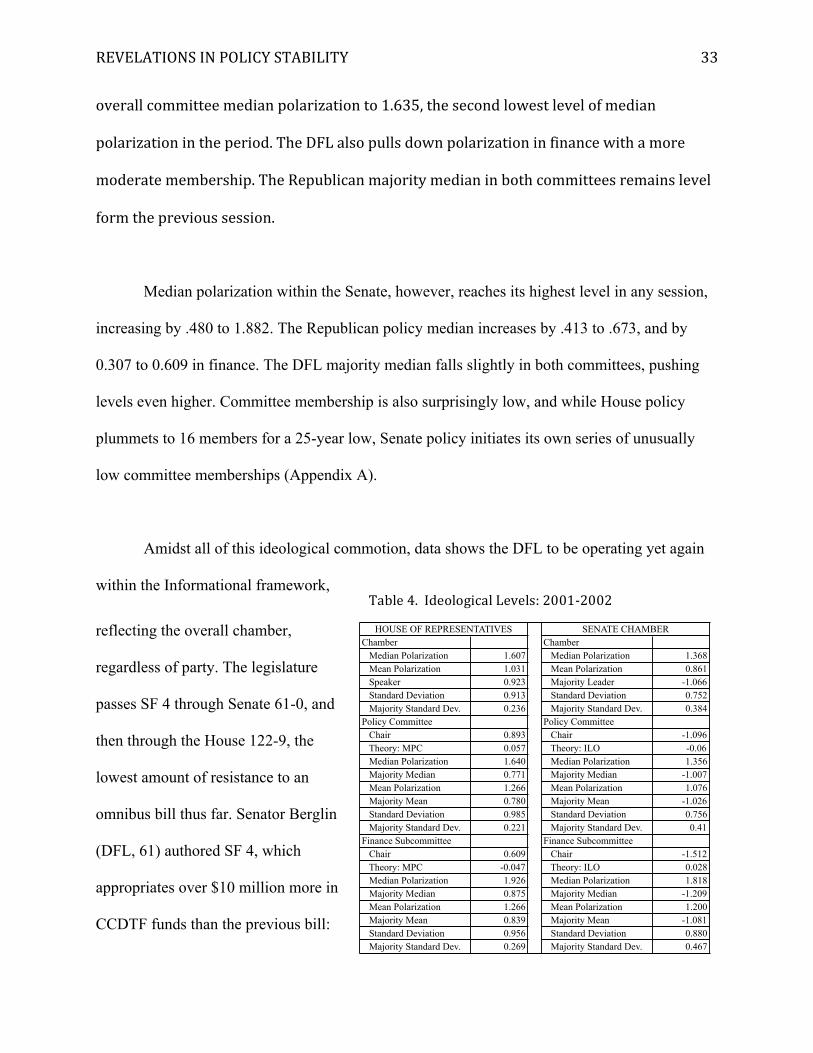
Amidst all of this ideological commotion, data shows the DFL to be operating yet again
within the Informational framework,
reflecting the overall chamber,
regardless of party. The legislature
passes SF 4 through Senate 61-0, and
then through the House 122-9, the
lowest amount of resistance to an
omnibus bill thus far. Senator Berglin
(DFL, 61) authored SF 4, which
appropriates over $10 million more in
CCDTF funds than the previous bill:
Chamber Chamber Median Polarization 1.607 Median Polarization 1.368 Mean Polarization 1.031 Mean Polarization 0.861 Speaker 0.923 Majority Leader -1.066 Standard Deviation 0.913 Standard Deviation 0.752 Majority Standard Dev. 0.236 Majority Standard Dev. 0.384Policy Committee Policy Committee Chair 0.893 Chair -1.096 Theory: MPC 0.057 Theory: ILO -0.06 Median Polarization 1.640 Median Polarization 1.356 Majority Median 0.771 Majority Median -1.007 Mean Polarization 1.266 Mean Polarization 1.076 Majority Mean 0.780 Majority Mean -1.026 Standard Deviation 0.985 Standard Deviation 0.756 Majority Standard Dev. 0.221 Majority Standard Dev. 0.41Finance Subcommittee Finance Subcommittee Chair 0.609 Chair -1.512 Theory: MPC -0.047 Theory: ILO 0.028 Median Polarization 1.926 Median Polarization 1.818 Majority Median 0.875 Majority Median -1.209 Mean Polarization 1.266 Mean Polarization 1.200 Majority Mean 0.839 Majority Mean -1.081 Standard Deviation 0.956 Standard Deviation 0.880 Majority Standard Dev. 0.269 Majority Standard Dev. 0.467
HOUSE OF REPRESENTATIVES SENATE CHAMBER
Table 4. Ideological Levels: 2001-‐2002
REVELATIONS IN POLICY STABILITY
34
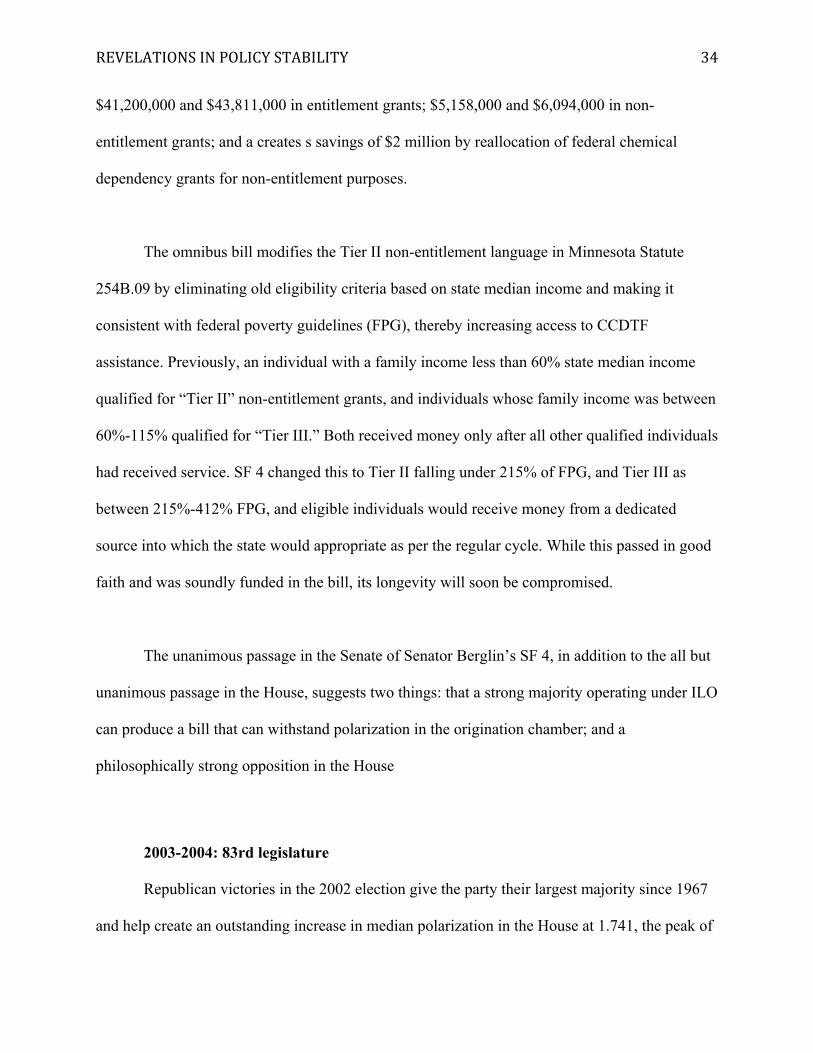
$41,200,000 and $43,811,000 in entitlement grants; $5,158,000 and $6,094,000 in non-
entitlement grants; and a creates s savings of $2 million by reallocation of federal chemical
dependency grants for non-entitlement purposes.
The omnibus bill modifies the Tier II non-entitlement language in Minnesota Statute
254B.09 by eliminating old eligibility criteria based on state median income and making it
consistent with federal poverty guidelines (FPG), thereby increasing access to CCDTF
assistance. Previously, an individual with a family income less than 60% state median income
qualified for “Tier II” non-entitlement grants, and individuals whose family income was between
60%-115% qualified for “Tier III.” Both received money only after all other qualified individuals
had received service. SF 4 changed this to Tier II falling under 215% of FPG, and Tier III as
between 215%-412% FPG, and eligible individuals would receive money from a dedicated
source into which the state would appropriate as per the regular cycle. While this passed in good
faith and was soundly funded in the bill, its longevity will soon be compromised.
The unanimous passage in the Senate of Senator Berglin’s SF 4, in addition to the all but
unanimous passage in the House, suggests two things: that a strong majority operating under ILO
can produce a bill that can withstand polarization in the origination chamber; and a
philosophically strong opposition in the House
2003-2004: 83rd legislature
Republican victories in the 2002 election give the party their largest majority since 1967
and help create an outstanding increase in median polarization in the House at 1.741, the peak of
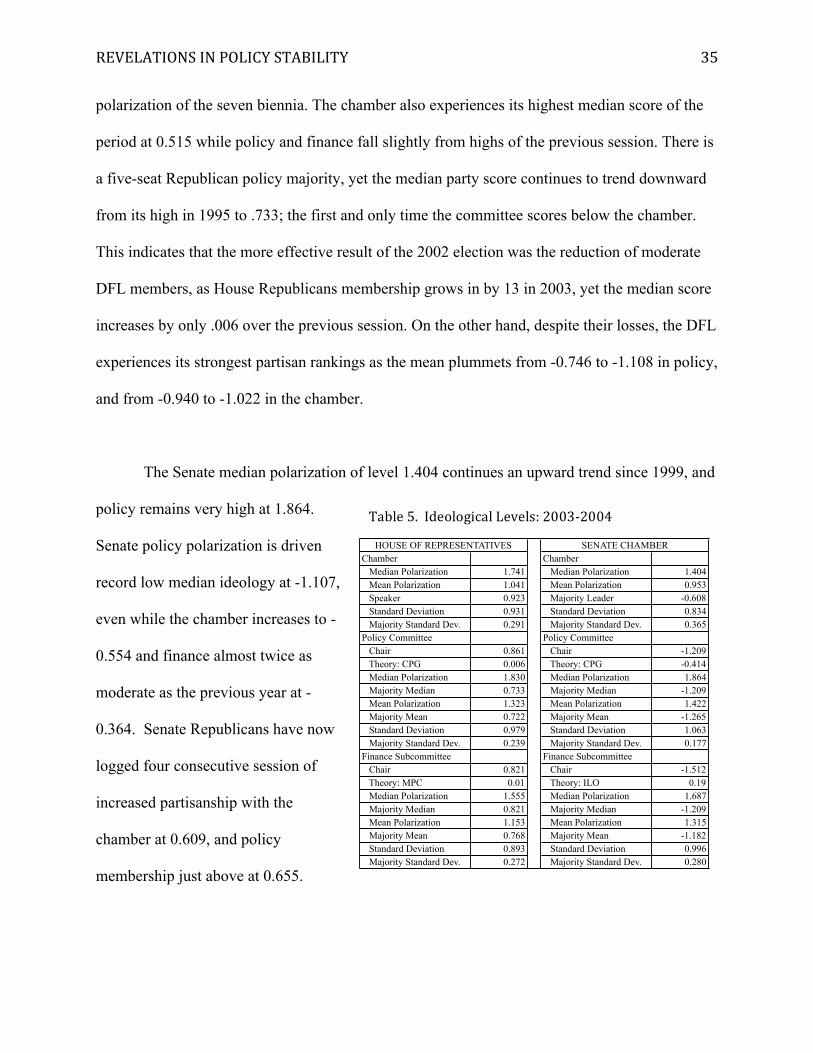
REVELATIONS IN POLICY STABILITY
35
polarization of the seven biennia. The chamber also experiences its highest median score of the
period at 0.515 while policy and finance fall slightly from highs of the previous session. There is
a five-seat Republican policy majority, yet the median party score continues to trend downward
from its high in 1995 to .733; the first and only time the committee scores below the chamber.
This indicates that the more effective result of the 2002 election was the reduction of moderate
DFL members, as House Republicans membership grows in by 13 in 2003, yet the median score
increases by only .006 over the previous session. On the other hand, despite their losses, the DFL
experiences its strongest partisan rankings as the mean plummets from -0.746 to -1.108 in policy,
and from -0.940 to -1.022 in the chamber.
The Senate median polarization of level 1.404 continues an upward trend since 1999, and
policy remains very high at 1.864.
Senate policy polarization is driven
record low median ideology at -1.107,
even while the chamber increases to -
0.554 and finance almost twice as
moderate as the previous year at -
0.364. Senate Republicans have now
logged four consecutive session of
increased partisanship with the
chamber at 0.609, and policy
membership just above at 0.655.
Chamber Chamber Median Polarization 1.741 Median Polarization 1.404 Mean Polarization 1.041 Mean Polarization 0.953 Speaker 0.923 Majority Leader -0.608 Standard Deviation 0.931 Standard Deviation 0.834 Majority Standard Dev. 0.291 Majority Standard Dev. 0.365Policy Committee Policy Committee Chair 0.861 Chair -1.209 Theory: CPG 0.006 Theory: CPG -0.414 Median Polarization 1.830 Median Polarization 1.864 Majority Median 0.733 Majority Median -1.209 Mean Polarization 1.323 Mean Polarization 1.422 Majority Mean 0.722 Majority Mean -1.265 Standard Deviation 0.979 Standard Deviation 1.063 Majority Standard Dev. 0.239 Majority Standard Dev. 0.177Finance Subcommittee Finance Subcommittee Chair 0.821 Chair -1.512 Theory: MPC 0.01 Theory: ILO 0.19 Median Polarization 1.555 Median Polarization 1.687 Majority Median 0.821 Majority Median -1.209 Mean Polarization 1.153 Mean Polarization 1.315 Majority Mean 0.768 Majority Mean -1.182 Standard Deviation 0.893 Standard Deviation 0.996 Majority Standard Dev. 0.272 Majority Standard Dev. 0.280
HOUSE OF REPRESENTATIVES SENATE CHAMBER
Table 5. Ideological Levels: 2003-‐2004
REVELATIONS IN POLICY STABILITY
36
The majority party ideological data places this session well within the scope of the CPG
framework. It is in fact as close as the 1997 DFL-controlled Senate policy committee was to the
ILO theory. The divisions exhibited in the figures above and in the appendices are also very
apparent in the legislation proposed and the clear lines drawn in the vote totals. The session’s
second omnibus bill, HF 6, Rep. Bradley (R, 29B), reduces the original entitlement appropriation
in the regular session’s omnibus bill by $18 million. In the previous session the criteria for non-
entitlement were expanded, yet HF 6 completely eliminates Tier III funding for individuals with
incomes over 215% FPG, saving $5 million. In addition, it effectively eliminates Tier II funding
by reducing the appropriations $12 million in 2001-02 to $2.1 million in 2003-04 and moving
forward. Tier II and III funding was predominantly used by employed men, but ancillary
programs for women, as well as youth-oriented, programs are also be cut, saving an additional $5
million. Finally, the reduction of 1% to provider rates saves $933,000.
HF 6 eliminated nearly $21 million from a steadily growing and well-received CD
treatment service. What it put in its place was $49,254,000 and $50,337,000, respectively into
Tier I funding, after inflation accounting to $7 million over the previous session, thereby setting
a trend for future legislation to focus on the bottom tier of eligibility only. As may be expected
by a bill created within the Major Party Cartel framework, HF 6 received partisan support, with a
final vote of 78-54 (the Republicans with a 81-53 House majority at the time of passage), and
much the same in the Senate where it passed on 34-28 (the DFL having a weak 35-31 majority).
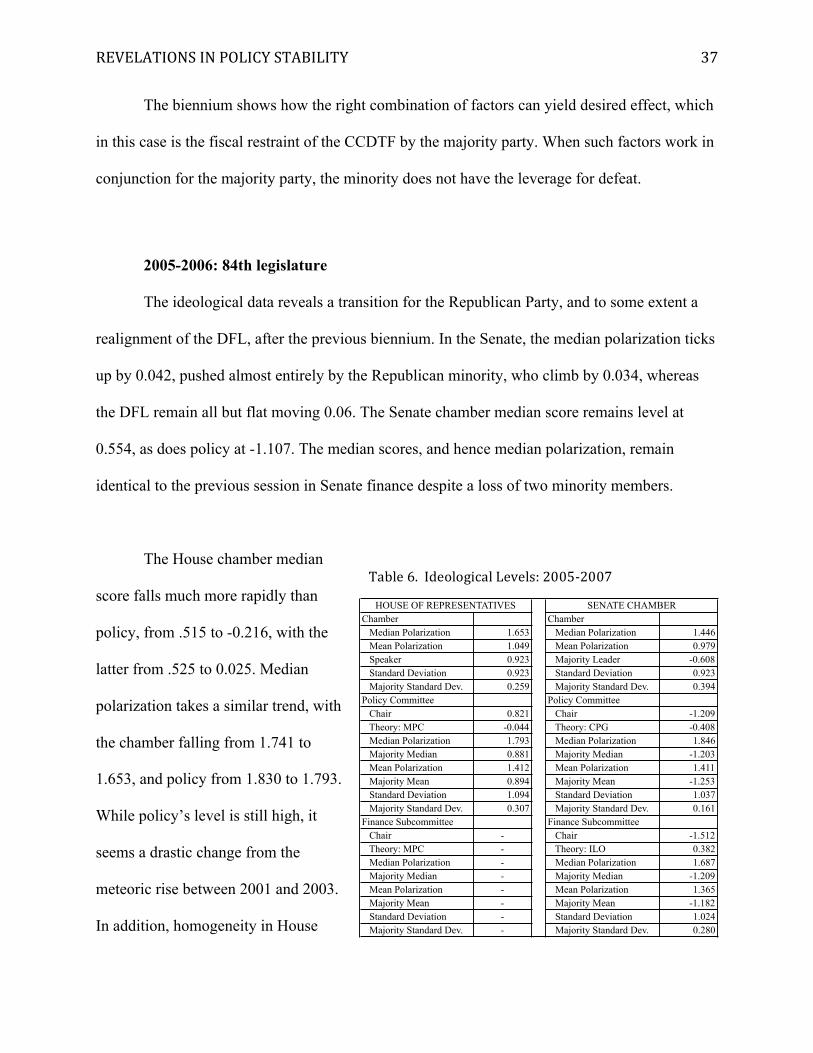
REVELATIONS IN POLICY STABILITY
37
The biennium shows how the right combination of factors can yield desired effect, which
in this case is the fiscal restraint of the CCDTF by the majority party. When such factors work in
conjunction for the majority party, the minority does not have the leverage for defeat.
2005-2006: 84th legislature
The ideological data reveals a transition for the Republican Party, and to some extent a
realignment of the DFL, after the previous biennium. In the Senate, the median polarization ticks
up by 0.042, pushed almost entirely by the Republican minority, who climb by 0.034, whereas
the DFL remain all but flat moving 0.06. The Senate chamber median score remains level at
0.554, as does policy at -1.107. The median scores, and hence median polarization, remain
identical to the previous session in Senate finance despite a loss of two minority members.
The House chamber median
score falls much more rapidly than
policy, from .515 to -0.216, with the
latter from .525 to 0.025. Median
polarization takes a similar trend, with
the chamber falling from 1.741 to
1.653, and policy from 1.830 to 1.793.
While policy’s level is still high, it
seems a drastic change from the
meteoric rise between 2001 and 2003.
In addition, homogeneity in House
Chamber Chamber Median Polarization 1.653 Median Polarization 1.446 Mean Polarization 1.049 Mean Polarization 0.979 Speaker 0.923 Majority Leader -0.608 Standard Deviation 0.923 Standard Deviation 0.923 Majority Standard Dev. 0.259 Majority Standard Dev. 0.394Policy Committee Policy Committee Chair 0.821 Chair -1.209 Theory: MPC -0.044 Theory: CPG -0.408 Median Polarization 1.793 Median Polarization 1.846 Majority Median 0.881 Majority Median -1.203 Mean Polarization 1.412 Mean Polarization 1.411 Majority Mean 0.894 Majority Mean -1.253 Standard Deviation 1.094 Standard Deviation 1.037 Majority Standard Dev. 0.307 Majority Standard Dev. 0.161Finance Subcommittee Finance Subcommittee Chair - Chair -1.512 Theory: MPC - Theory: ILO 0.382 Median Polarization - Median Polarization 1.687 Majority Median - Majority Median -1.209 Mean Polarization - Mean Polarization 1.365 Majority Mean - Majority Mean -1.182 Standard Deviation - Standard Deviation 1.024 Majority Standard Dev. - Majority Standard Dev. 0.280
HOUSE OF REPRESENTATIVES SENATE CHAMBER
Table 6. Ideological Levels: 2005-‐2007
REVELATIONS IN POLICY STABILITY
38
policy diminishes in the biennium. Amidst the leveling and diminishing polarization, the
Republican majority increases their median score by 0.161 to 0.894. The policy committee
conducted all fiscal business for the biennium.
HF 139, with bipartisan authors of Rep, Bradley and Rep. Huntley (DFL, 7A), offers no
surprises and passes the Senate 60-6, and the House 88-40 with bipartisan support. It is in mix of
political factors that seem to bring balance to the Major Party Cartel framework in which HF 139
was created: reduced polarization; increased homogeneity; and a near-balanced membership in
both chambers. Appropriations for CCDTF are $63,183,000 and $68,744,000, yet non-
entitlement remains essentially unfunded at $1,055,000 per year. Provider rates are frozen once
more in 2005, and then will go unrestricted for 2006. Lastly, in order to better handle the
growing methamphetamine problem in Minnesota, the bill sets aside $600,000 for an evidence-
based methamphetamine treatment program at the Willmar Regional Treatment Center.
2007-2008: 85th legislature
Observations in this final biennium are in much finer context than at the onset. With the
DFL winning back control of the House in 2006, all median scores in the House are nestled
closely together and below 1995 levels: chamber, -0.650; policy, -0.669; and finance, -0.659.
Median polarization level in the chamber is 1.592, policy is below 1995 levels at 1.616, and
finance is at 1.651. House Republicans have moderated to 0.648 in the chamber, and 0.716 in
policy, both constituting very sharp drops, and at least in policy that the 2005 spike may have
been an outlier. The House policy DFL median score has also become relatively moderate at -
0.900, and homogeneity has returned to previous levels, falling 0.409.
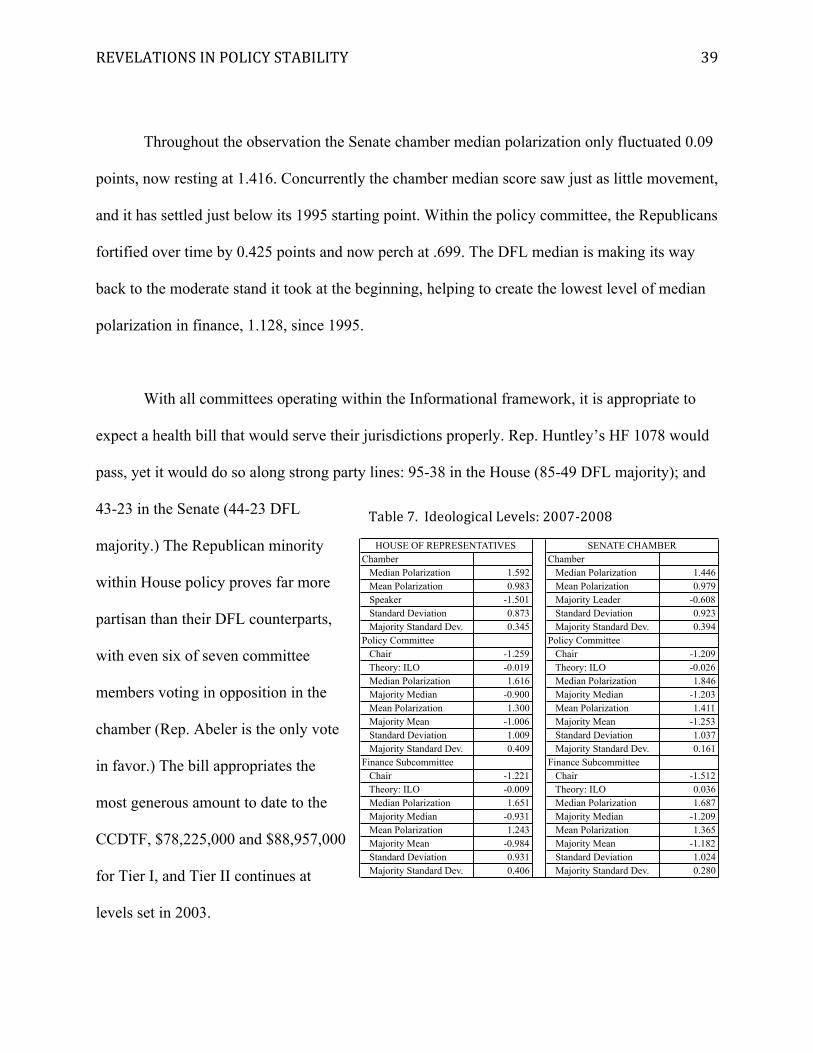
REVELATIONS IN POLICY STABILITY
39
Throughout the observation the Senate chamber median polarization only fluctuated 0.09
points, now resting at 1.416. Concurrently the chamber median score saw just as little movement,
and it has settled just below its 1995 starting point. Within the policy committee, the Republicans
fortified over time by 0.425 points and now perch at .699. The DFL median is making its way
back to the moderate stand it took at the beginning, helping to create the lowest level of median
polarization in finance, 1.128, since 1995.
With all committees operating within the Informational framework, it is appropriate to
expect a health bill that would serve their jurisdictions properly. Rep. Huntley’s HF 1078 would
pass, yet it would do so along strong party lines: 95-38 in the House (85-49 DFL majority); and
43-23 in the Senate (44-23 DFL
majority.) The Republican minority
within House policy proves far more
partisan than their DFL counterparts,
with even six of seven committee
members voting in opposition in the
chamber (Rep. Abeler is the only vote
in favor.) The bill appropriates the
most generous amount to date to the
CCDTF, $78,225,000 and $88,957,000
for Tier I, and Tier II continues at
levels set in 2003.
Chamber Chamber Median Polarization 1.592 Median Polarization 1.446 Mean Polarization 0.983 Mean Polarization 0.979 Speaker -1.501 Majority Leader -0.608 Standard Deviation 0.873 Standard Deviation 0.923 Majority Standard Dev. 0.345 Majority Standard Dev. 0.394Policy Committee Policy Committee Chair -1.259 Chair -1.209 Theory: ILO -0.019 Theory: ILO -0.026 Median Polarization 1.616 Median Polarization 1.846 Majority Median -0.900 Majority Median -1.203 Mean Polarization 1.300 Mean Polarization 1.411 Majority Mean -1.006 Majority Mean -1.253 Standard Deviation 1.009 Standard Deviation 1.037 Majority Standard Dev. 0.409 Majority Standard Dev. 0.161Finance Subcommittee Finance Subcommittee Chair -1.221 Chair -1.512 Theory: ILO -0.009 Theory: ILO 0.036 Median Polarization 1.651 Median Polarization 1.687 Majority Median -0.931 Majority Median -1.209 Mean Polarization 1.243 Mean Polarization 1.365 Majority Mean -0.984 Majority Mean -1.182 Standard Deviation 0.931 Standard Deviation 1.024 Majority Standard Dev. 0.406 Majority Standard Dev. 0.280
HOUSE OF REPRESENTATIVES SENATE CHAMBER
Table 7. Ideological Levels: 2007-‐2008
REVELATIONS IN POLICY STABILITY
40
The 2007-2008 biennium ends the research period much as it began. There is strong
support for treatment in a majority party historically known for such effort. Levels of
polarization are relatively low, especially in the House, which produces the beneficial bill.
Again, there is a strong number of factors acting in concert against potential detractors.
Results and Considerations
There is considerable effort toward resolving the multitude of challenges that arise
surrounding chemical dependency. The amount of scholarship regarding how and why we
experiment with substances to begin with, whether we become dependent or addicted, and
whether we succeed at treatment, is staggering. Yet, the focus on treatment remains on the
mechanisms and factors in place near the end of the process: willingness to change, quality of
counselor or facility, or adequate recovery environment, for example. The intent of my research
is to propose a novel way of viewing the challenges that confound our system: to look much
further back along the process, back to its political origins.
By observing the historical context of the laws that have come to shape our current
system, we can see there had been considerable bi-partisan effort during the drafting and passage
of the legislation that would be seen as pioneering in the field of treatment; decriminalization of
public intoxication; establishment of county-based treatment centers; and innovation in funding
through the Consolidated Chemical Dependency Treatment Fund. For every decade there were
strides forward in improving access, funding, and levels of care. My research of the legislative
sessions between 1995-2008 reveals a seeming more volatile environment for the creation of
stable and sustainable treatment policy.
REVELATIONS IN POLICY STABILITY
41
Throughout my research I examine the climate through numerous lenses to collect as
robust a perspective as possible. I use all available Shor-McCarty ideological data for Minnesota
from 1995-2008 to build ideological databases for the House of Representatives as well as its
Health and Human Services policy committee and finance subcommittee. I then do the same for
the Senate, thereby allowing dozens of techniques for observation. I calculate median (mid-
point) polarization trends for each body over time for familiarity and ease of use. In addition, I
verify these trends by the creating mean-based (average) polarization trends for each body over
time. Next, calculating the standard deviation from the mean for each body over time checks
homogeneity, the standard measure of cohesion and autonomy.
These measures reveal the inter- and intra-party dynamics of a given session, and
together offer a splendid examination of partisanship. Yet, I need to know more about the
decision making process for each session. I use three varying theoretical frameworks regarding
committee and party behavior and strategy. Krehbiel’s (1991) Information and Legislative
Organization theory shows how committees, when comprised of knowledgeable and/or
experienced members, creates legislation that is beneficial for the jurisdiction of the committee
and/or for the legislature as a whole. Narrowing this perspective slightly, there is the theory of
Rohde’s (1991) Conditional Party Government, which claims that through committee
appointment the majority party can draft and pass legislation only upon consensus of the party,
and that party leaders will not attempt to prohibit passage of said legislation. An even more
partisan perspective on the potential function of committees is that of Cox and McCubbins’
(1993) Major Party Cartel, in which the majority party leadership strategizes a legislative agenda
REVELATIONS IN POLICY STABILITY
42
most beneficial to the needs of the leadership and uses its power of committee appointment to sit
those who are most willing to satisfy said agenda.
By applying committee member ideological data into each of these three frameworks and
identifying that which gives greatest cohesion, I ascertain the overall desired strategy or method
of decision making within a committee, chamber, and session. My research shows the
Informational theory to be most widely used, albeit only by the DFL-majority, in fourteen of
twenty committees, or seventy percent. The Conditional Party Government theory applied to six
of twenty DFL committees (thirty percent) and two of seven Republican committees (thirty
percent). The Major Party Cartel theory was implemented by Republicans in five of seven
committees, for seventy percent. Hence, Conditional Party Government theory was either for
more partisan (DFL) or more moderate (Republicans) environments.
My research reveals that individually, none of either the ideological measures or
theoretical frameworks is strong enough to define any given climate. Certainly, polarization is
more clearly understood within the appropriate frame, and verification of any theory is only truly
complete with accompanying ideological data. Not only do they support themselves, they can
and will in conjunction nullify the properties of another, whereas an applicable framework can
be dismantled if polarization and standard deviation override the effect.
What does this bear on CD treatment in Minnesota? Legislatively speaking, the most
pivotal moment in the period is that of the passage of HF 6 in 2003. Many in the counseling
profession feel the elimination of Tier III funding, women’s ancillary services, and youth-
REVELATIONS IN POLICY STABILITY
43
oriented programs, along with the effective defunding of Tier II have had the most impact on
treatment services in Minnesota. Looking to the political elements leading to the bills passage,
we can see the following: both extremely high median polarization and scores in both House and
Senate, lower levels of cohesion among the DFL minority, and a large Republican majority
operating under the Conditional Party Government and Major Party Cartel frameworks. In other
sessions there are enough elements to offset dominant theories, yet in 2003 there are not. To
follow the trends over time is to witness a great climax within this very session, and an easing of
tensions afterward.
While this thesis does not contend to offer any type of definitive answer to the challenges
of CD treatment, it does offer a fresh means of understanding the climate in which stable policy
can thrive, and that in which it cannot. Future considerations for those who both advocate for
stable policy and those who create it are to observe and promote a healthy committee
environment. The research shows the current tendency for strides ahead followed by hesitation
and reluctance. The rich history of chemical dependency treatment in Minnesota is one of
bipartisan agreement and progress, initiated by those who understand the vast costs of addiction
and the incredible benefits of treatment. The results of my investigations shows that yes, there is
truly a political origin to the system of treatment; just as the environment for recovery is essential
to its success, such is true for the creation of stable and sustainable legislation that drives said
treatment.
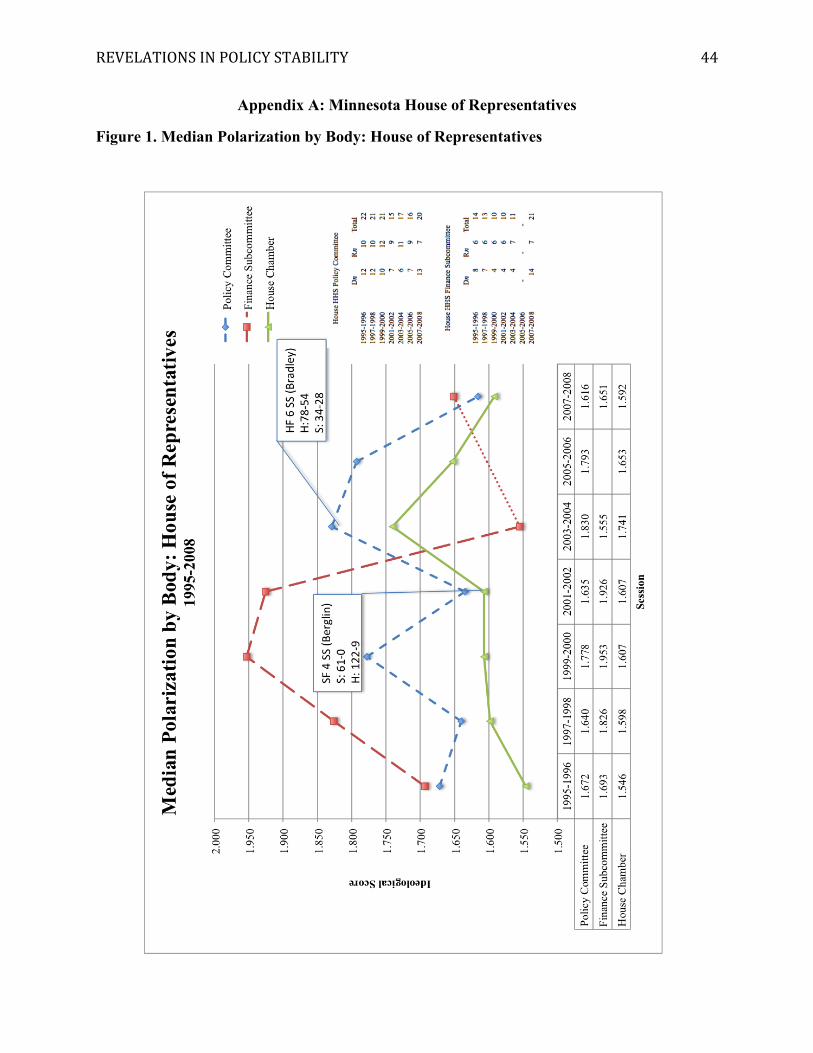
REVELATIONS IN POLICY STABILITY
44
Appendix A: Minnesota House of Representatives
Figure 1. Median Polarization by Body: House of Representatives
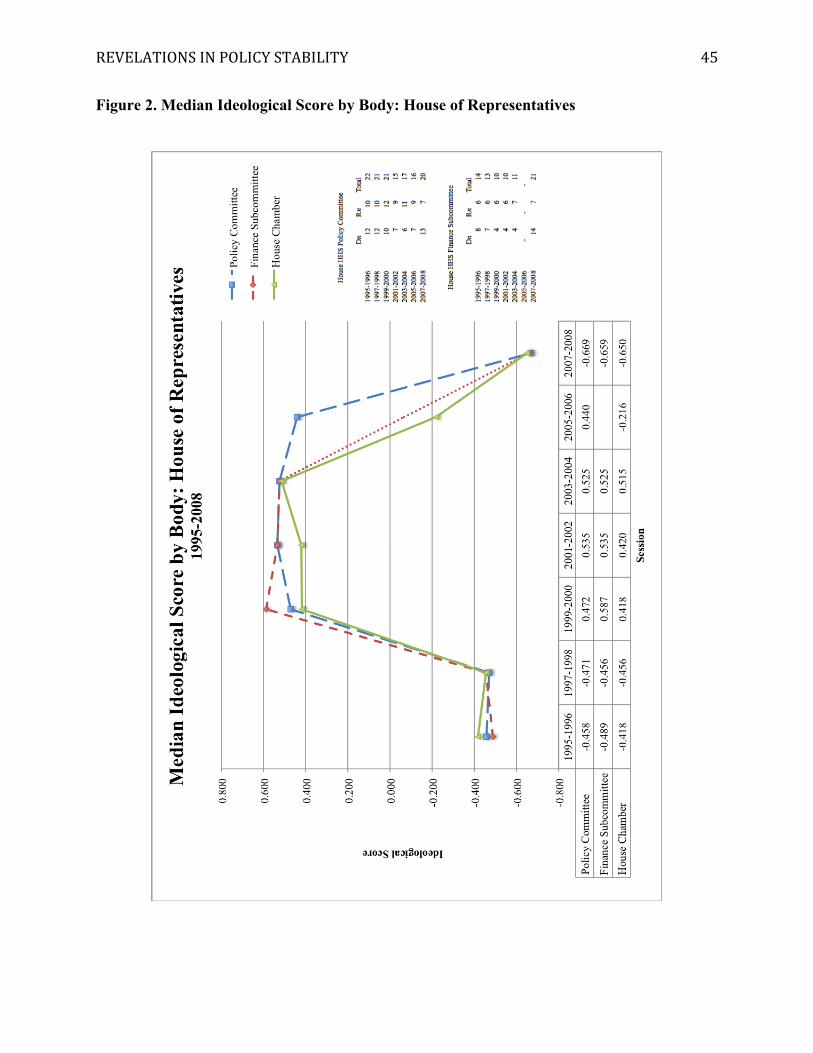
REVELATIONS IN POLICY STABILITY
45
Figure 2. Median Ideological Score by Body: House of Representatives
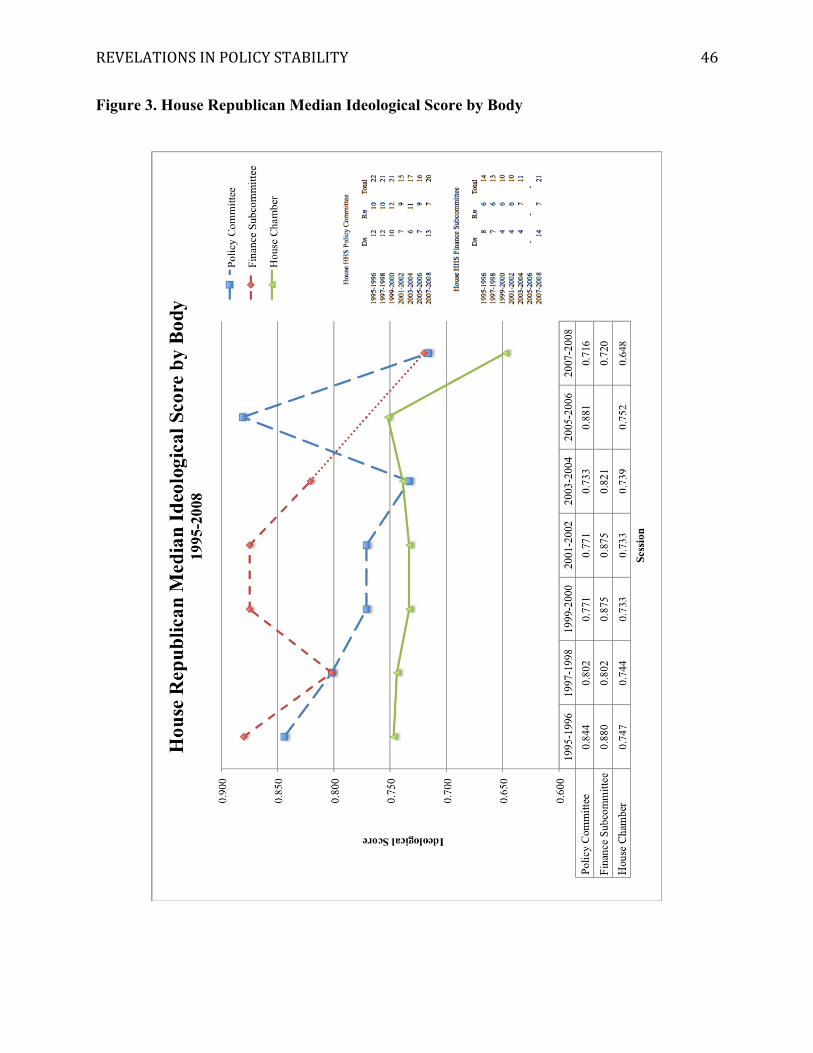
REVELATIONS IN POLICY STABILITY
46
Figure 3. House Republican Median Ideological Score by Body
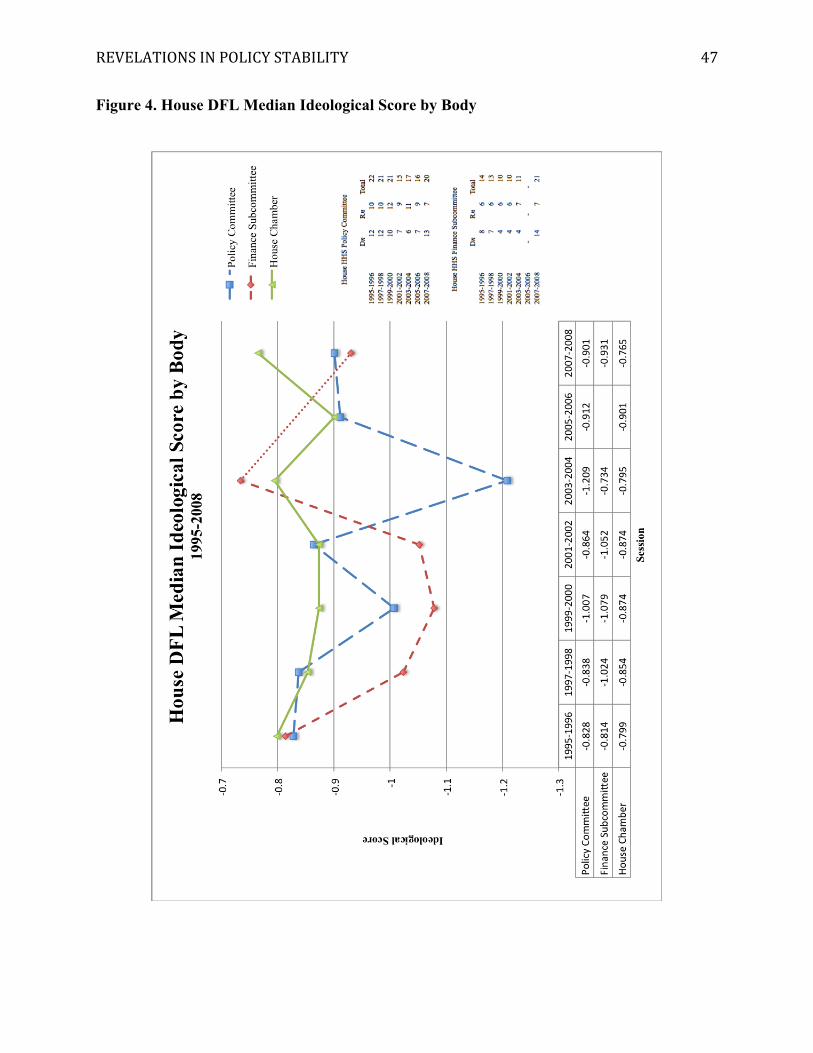
REVELATIONS IN POLICY STABILITY
47
Figure 4. House DFL Median Ideological Score by Body
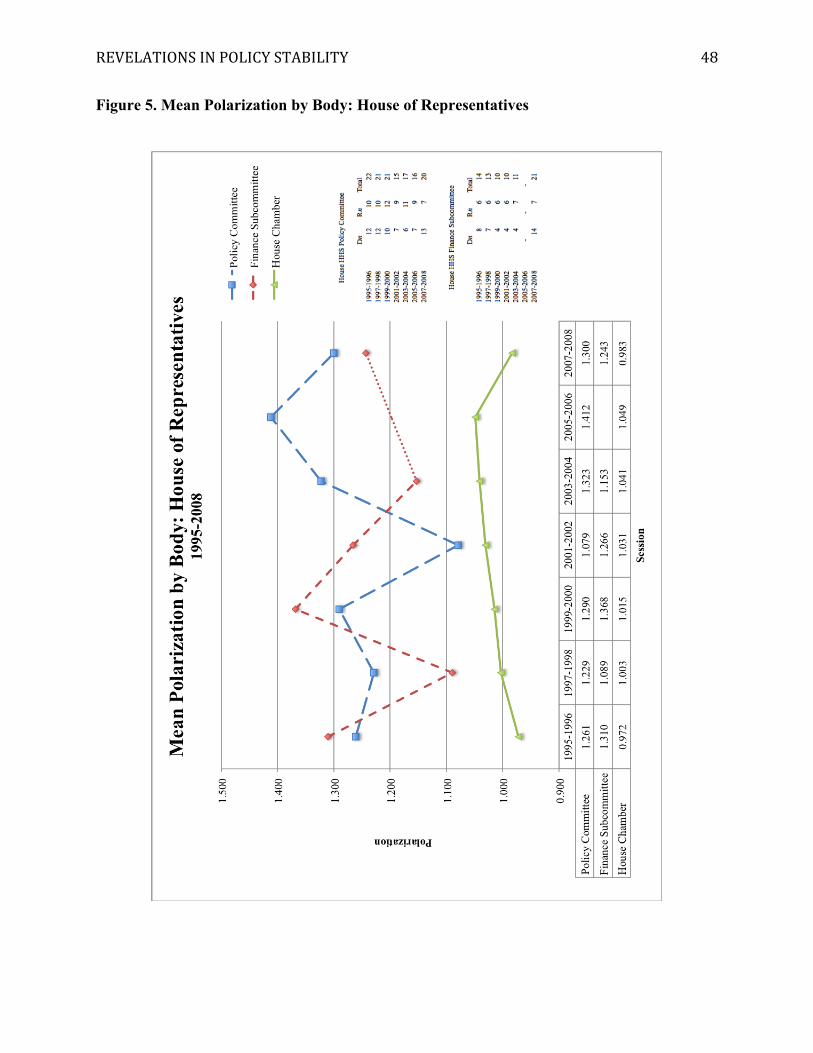
REVELATIONS IN POLICY STABILITY
48
Figure 5. Mean Polarization by Body: House of Representatives
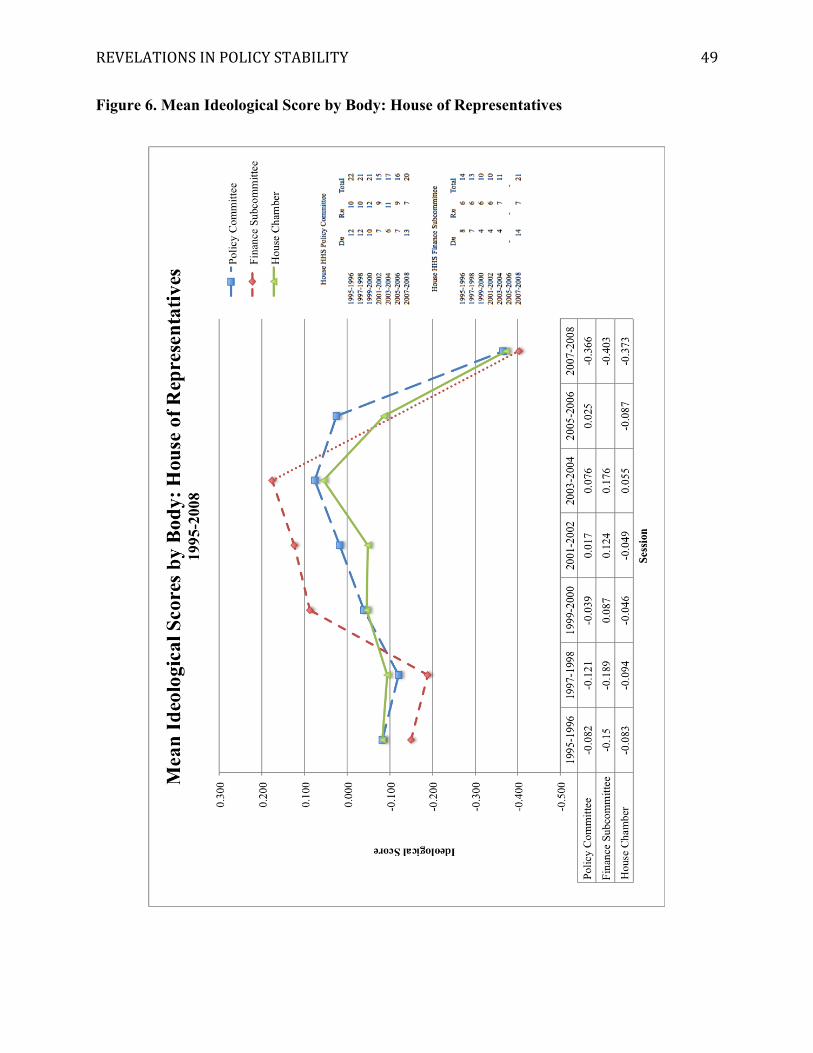
REVELATIONS IN POLICY STABILITY
49
Figure 6. Mean Ideological Score by Body: House of Representatives
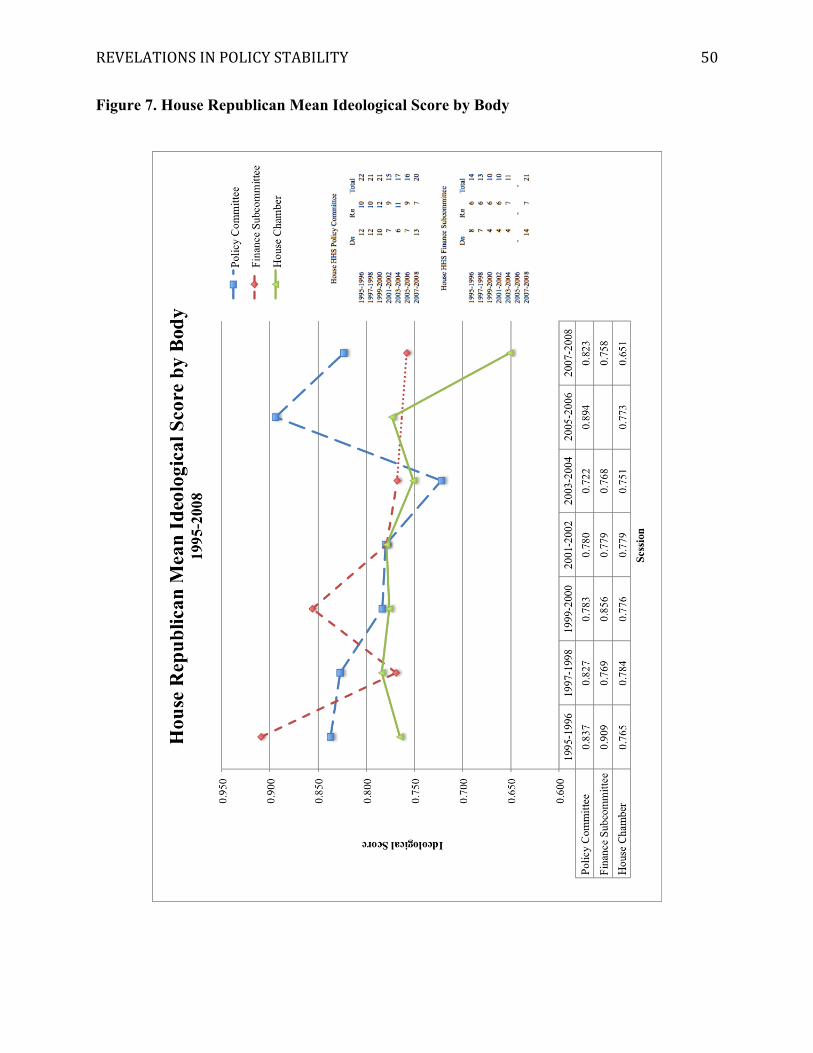
REVELATIONS IN POLICY STABILITY
50
Figure 7. House Republican Mean Ideological Score by Body
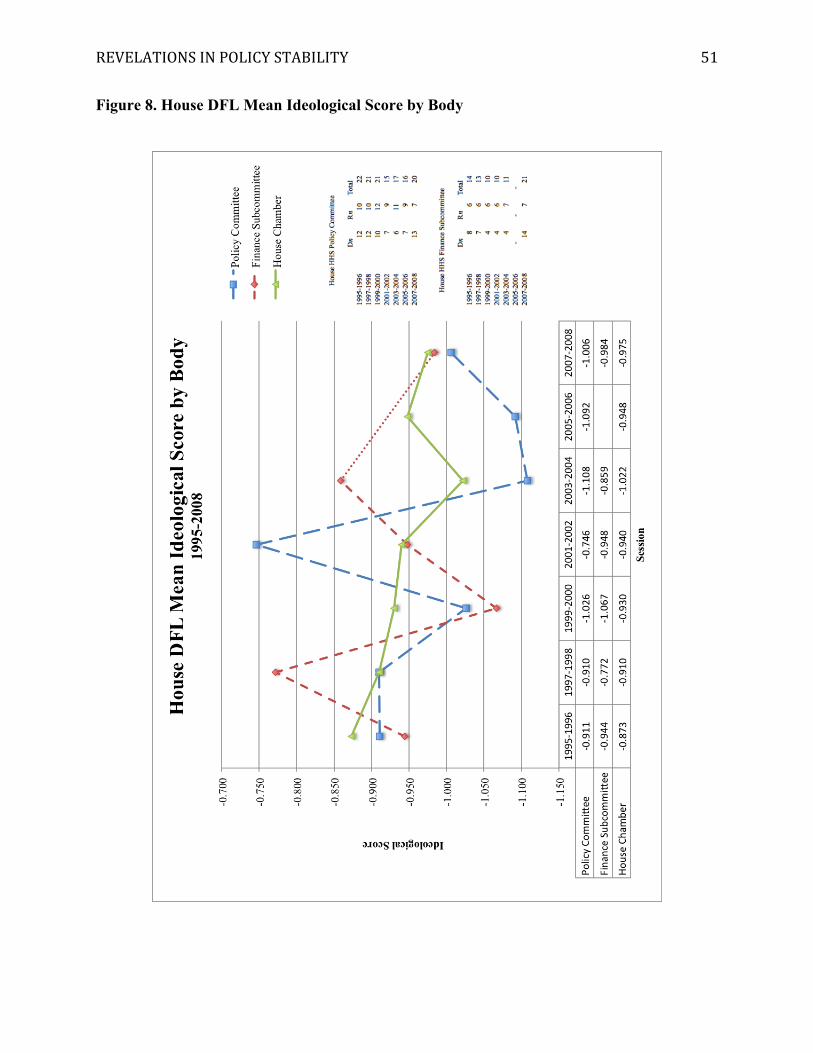
REVELATIONS IN POLICY STABILITY
51
Figure 8. House DFL Mean Ideological Score by Body
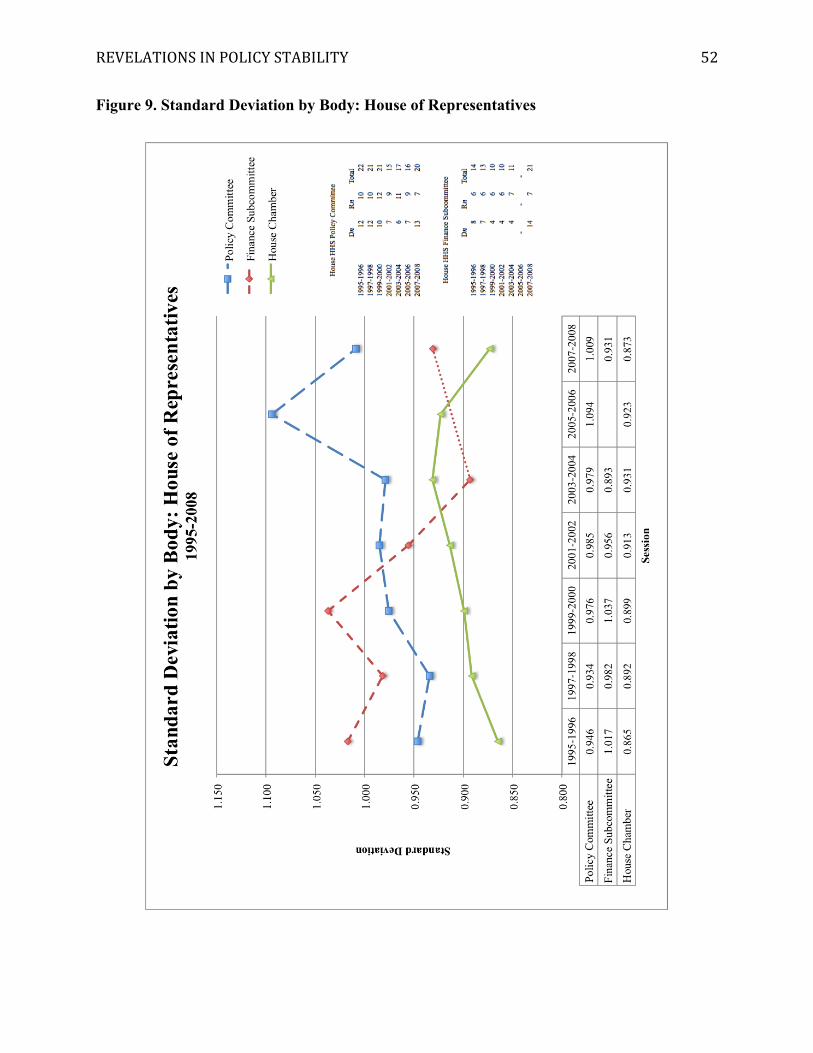
REVELATIONS IN POLICY STABILITY
52
Figure 9. Standard Deviation by Body: House of Representatives
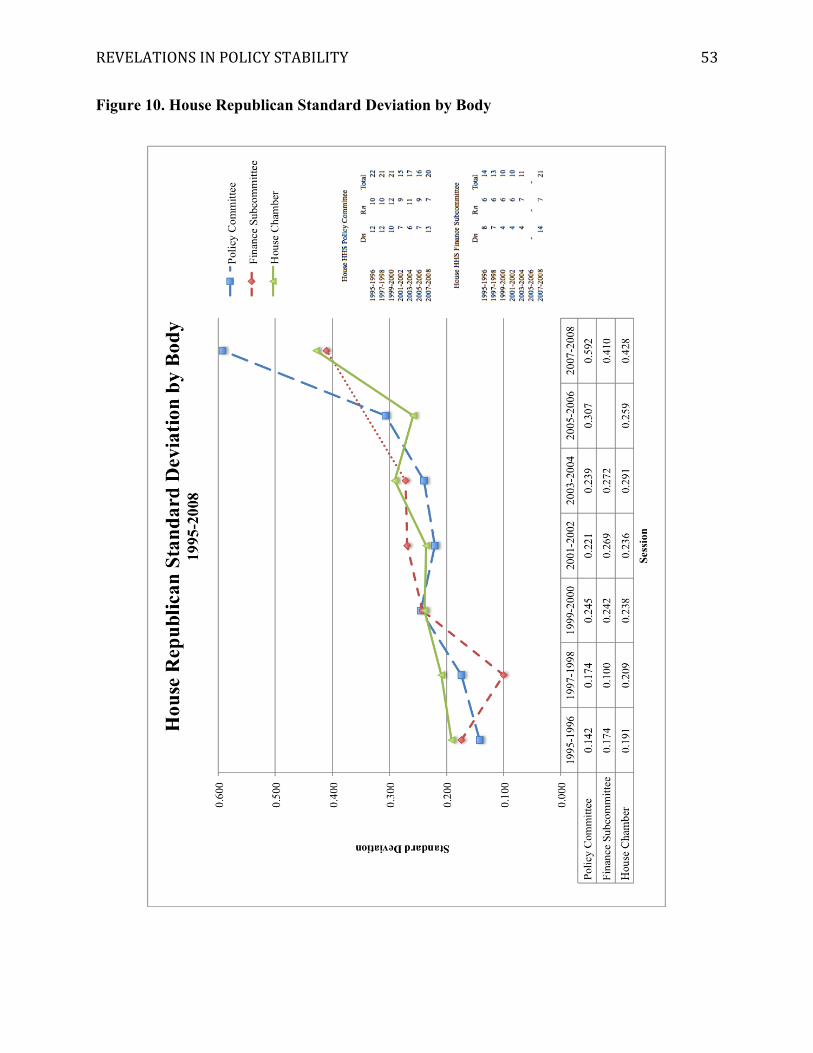
REVELATIONS IN POLICY STABILITY
53
Figure 10. House Republican Standard Deviation by Body
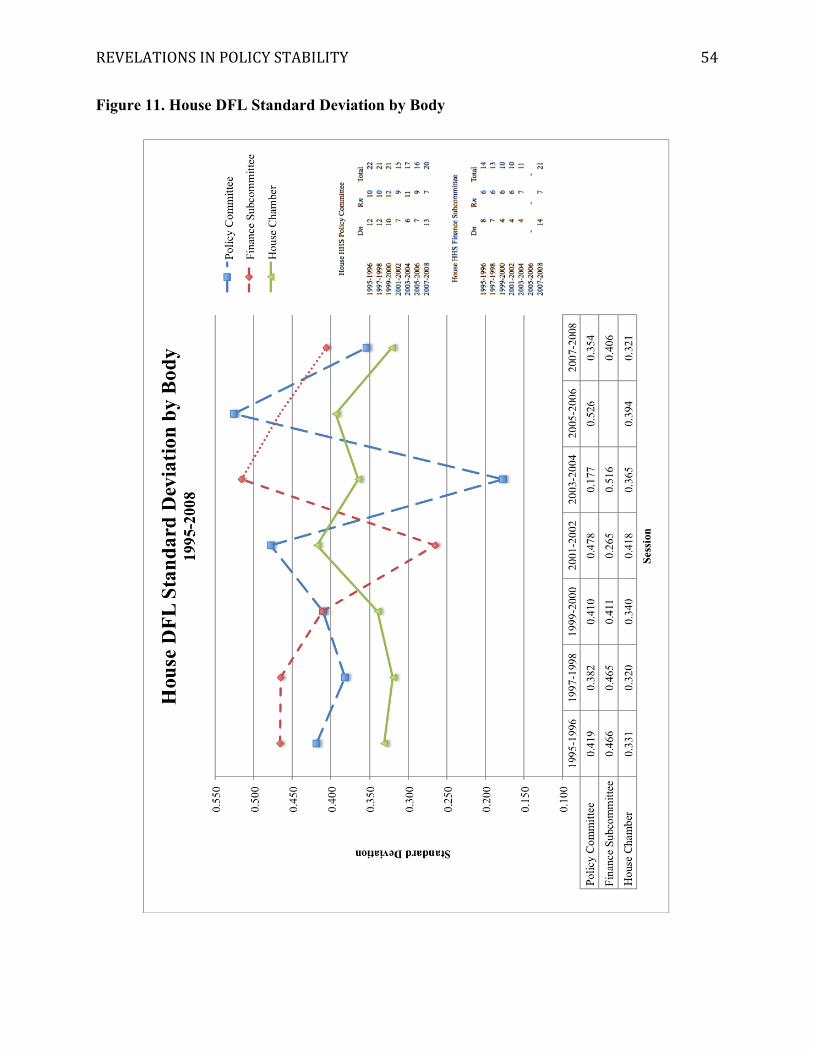
REVELATIONS IN POLICY STABILITY
54
Figure 11. House DFL Standard Deviation by Body
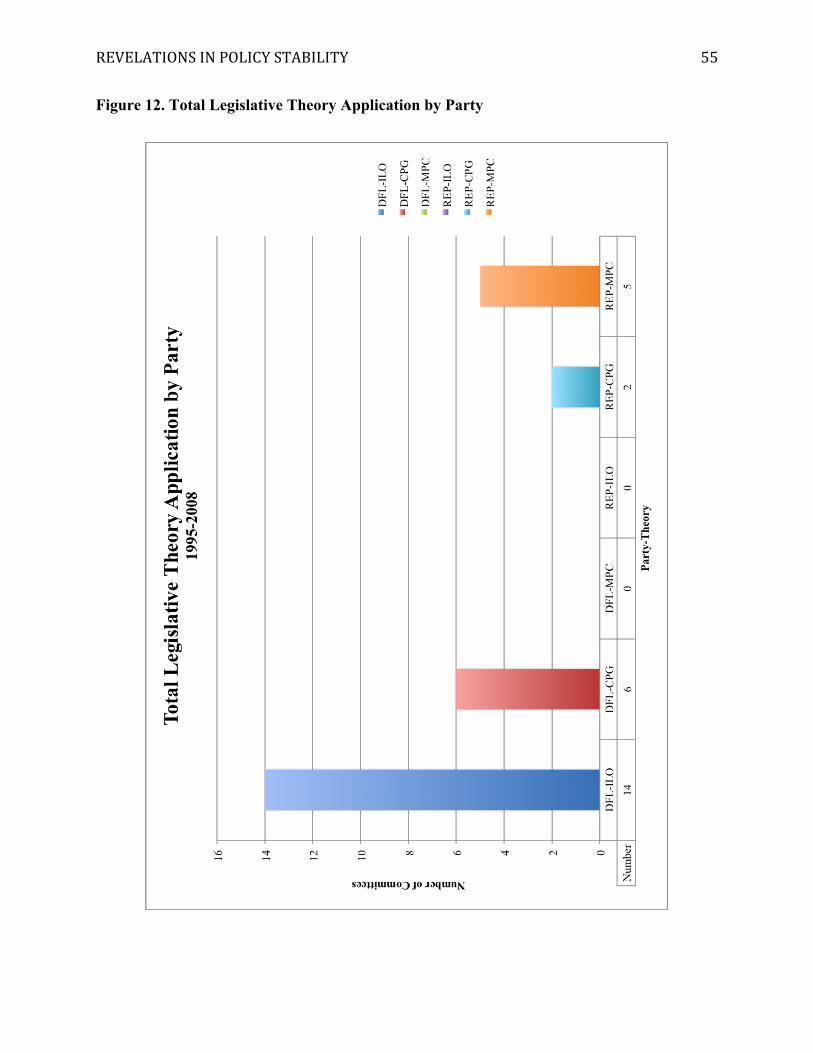
REVELATIONS IN POLICY STABILITY
55
Figure 12. Total Legislative Theory Application by Party
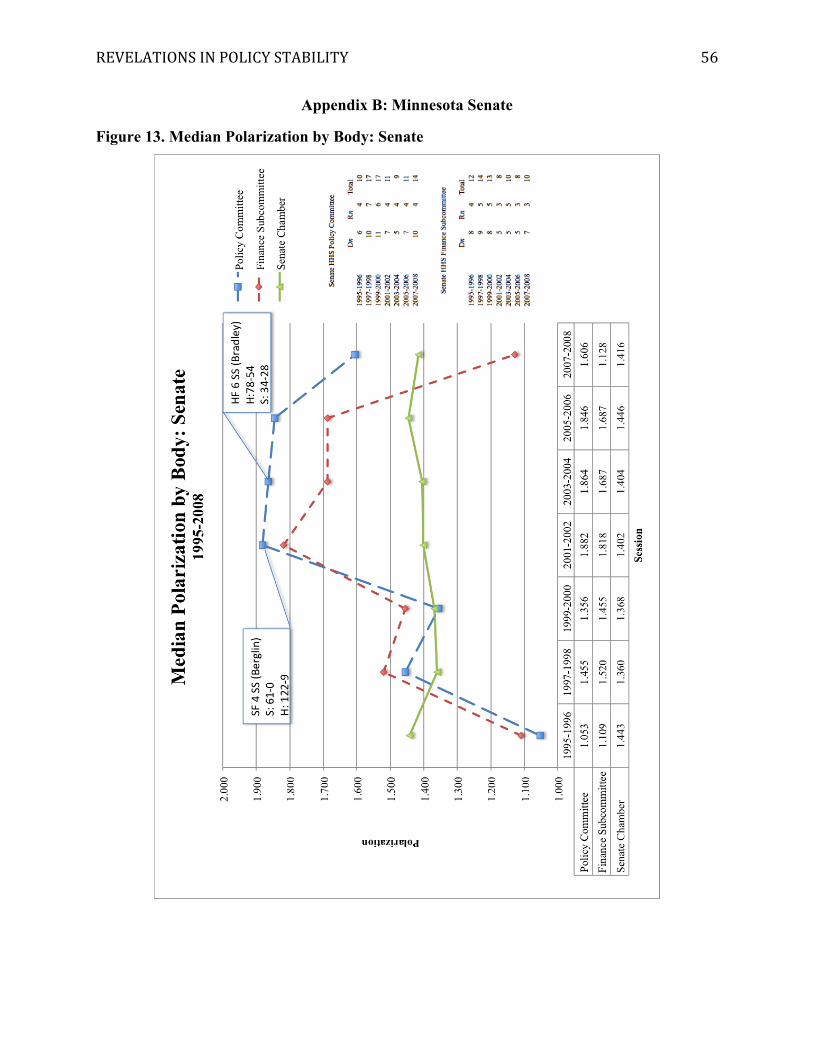
REVELATIONS IN POLICY STABILITY
56
Appendix B: Minnesota Senate
Figure 13. Median Polarization by Body: Senate
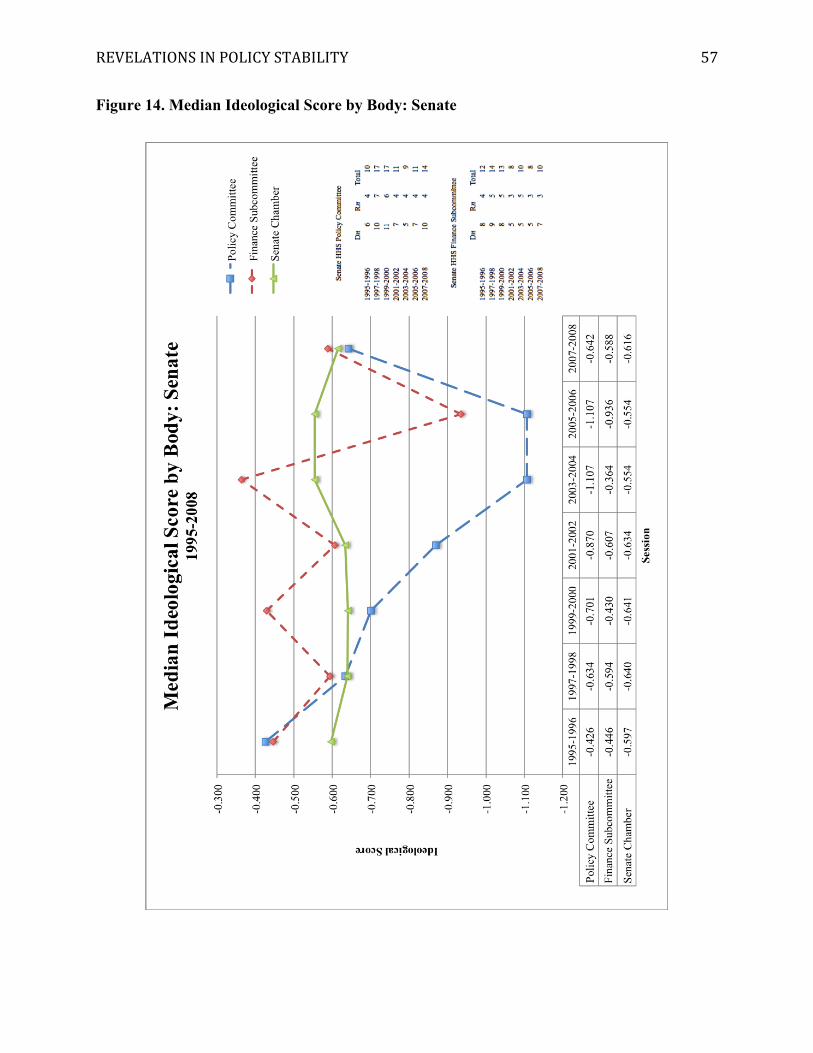
REVELATIONS IN POLICY STABILITY
57
Figure 14. Median Ideological Score by Body: Senate
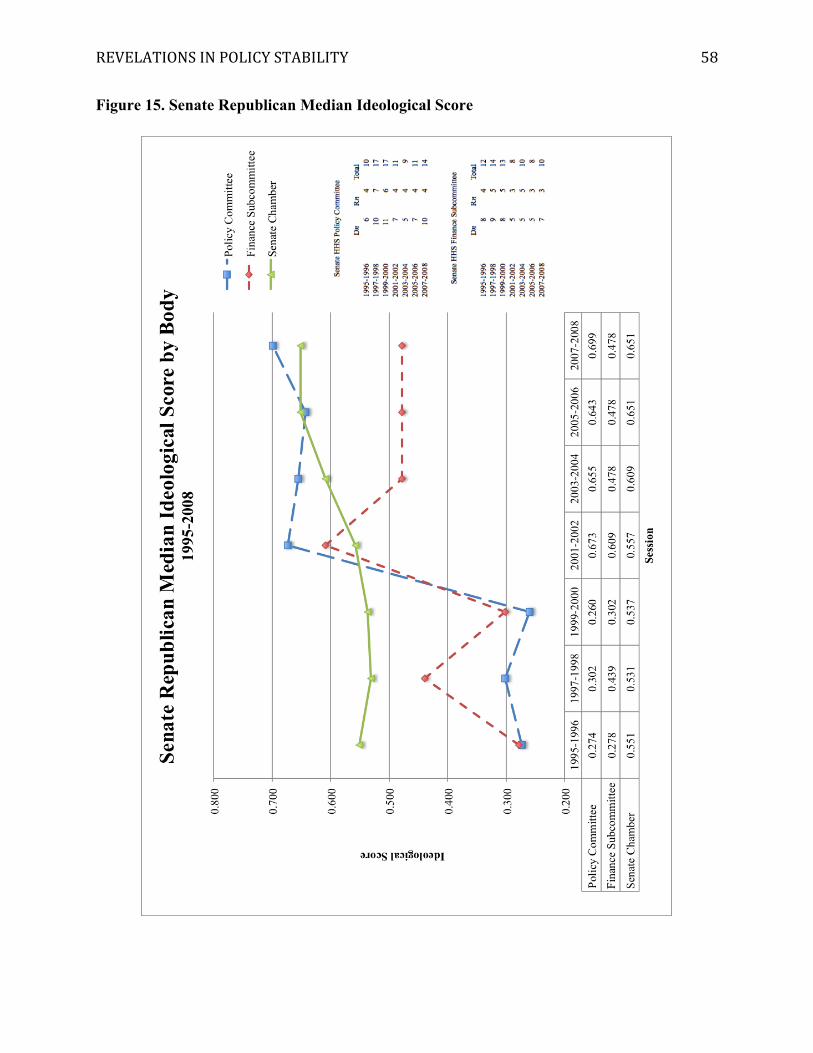
REVELATIONS IN POLICY STABILITY
58
Figure 15. Senate Republican Median Ideological Score
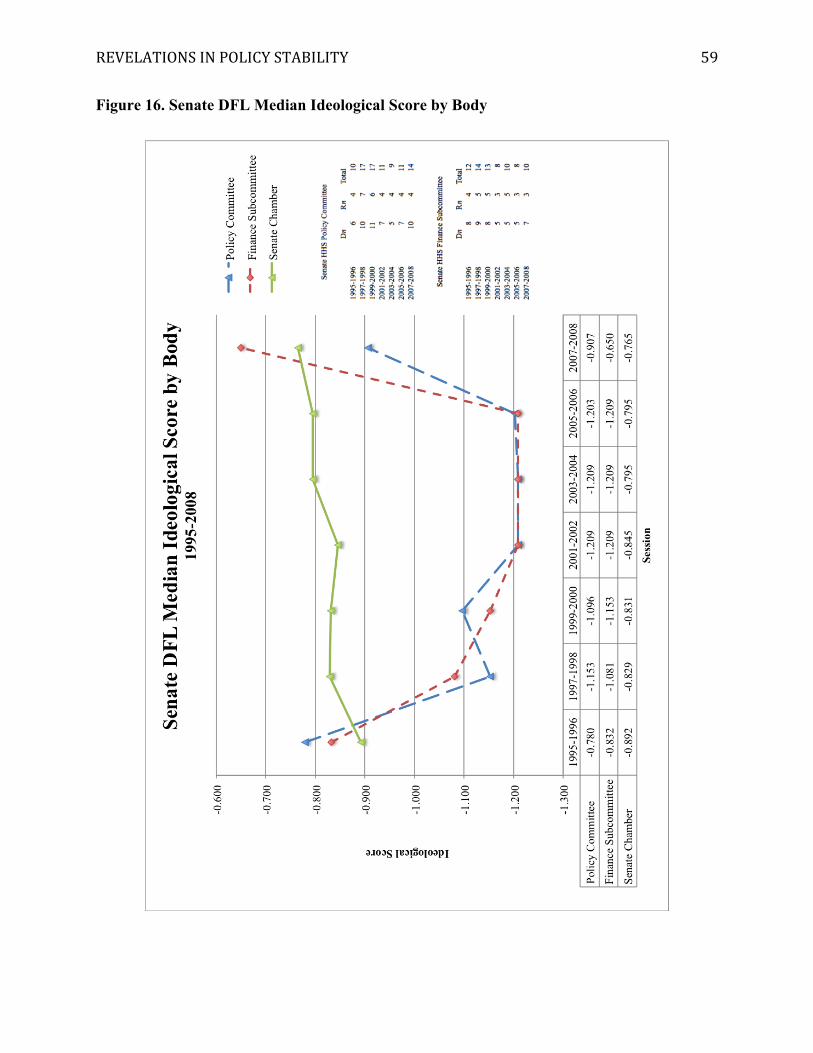
REVELATIONS IN POLICY STABILITY
59
Figure 16. Senate DFL Median Ideological Score by Body
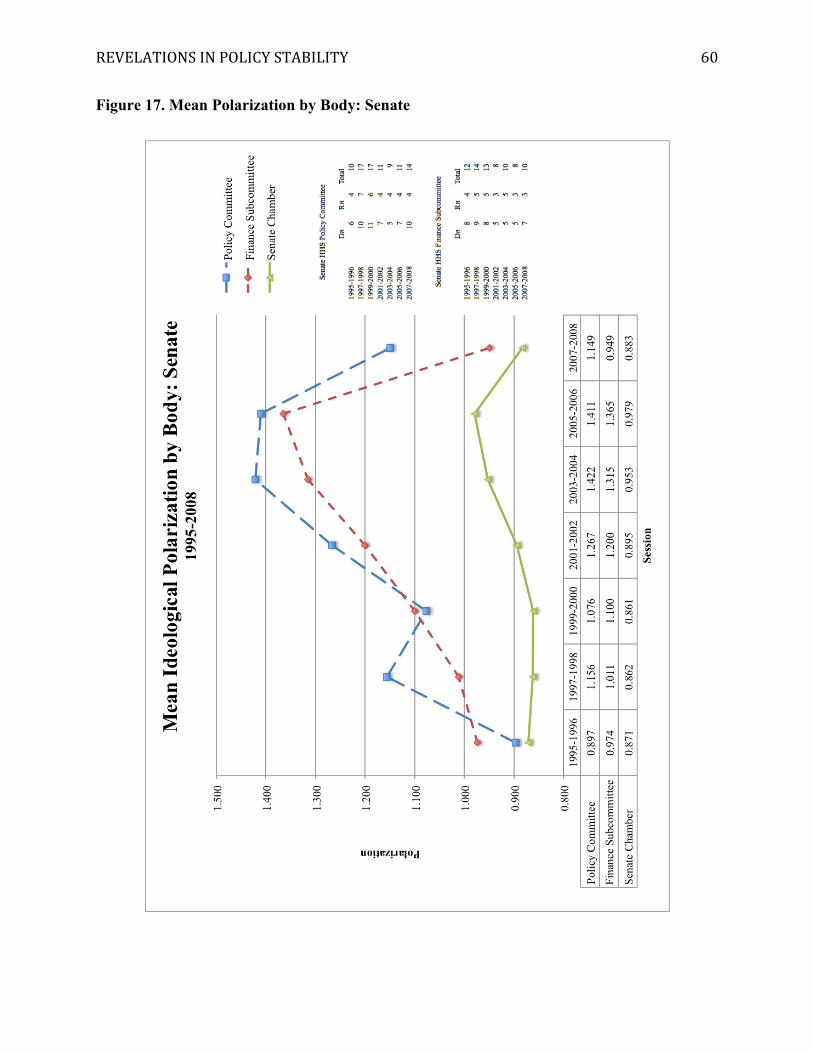
REVELATIONS IN POLICY STABILITY
60
Figure 17. Mean Polarization by Body: Senate
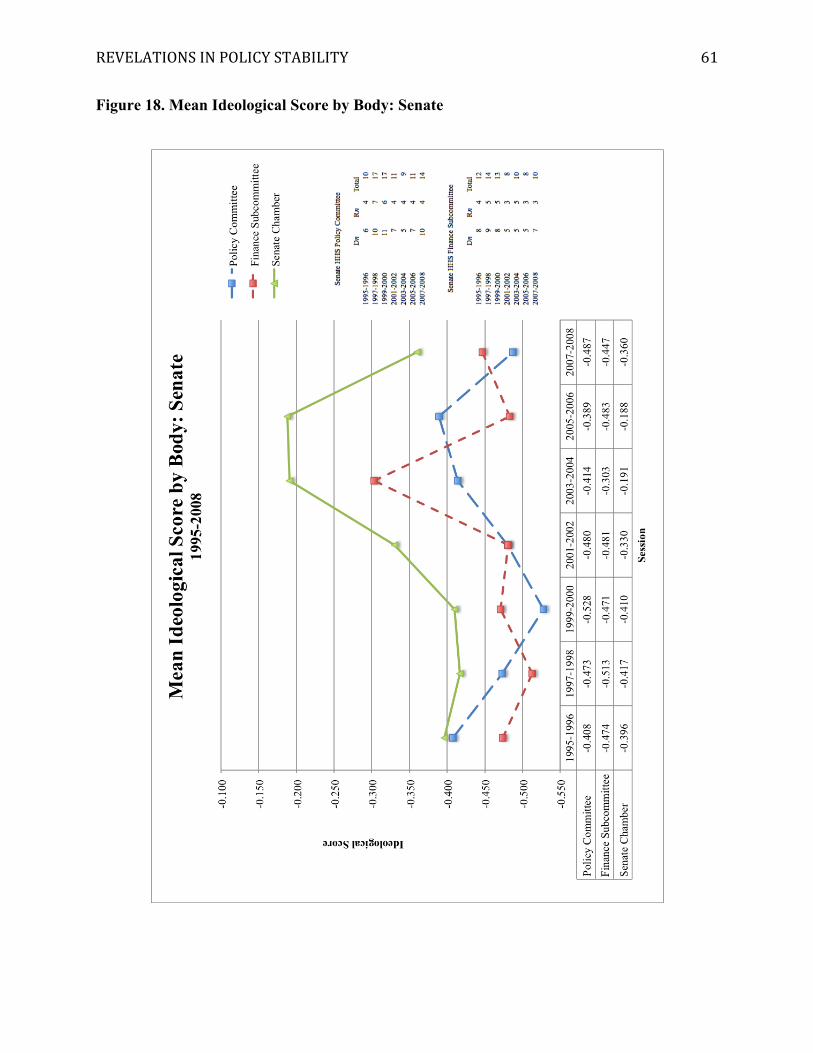
REVELATIONS IN POLICY STABILITY
61
Figure 18. Mean Ideological Score by Body: Senate
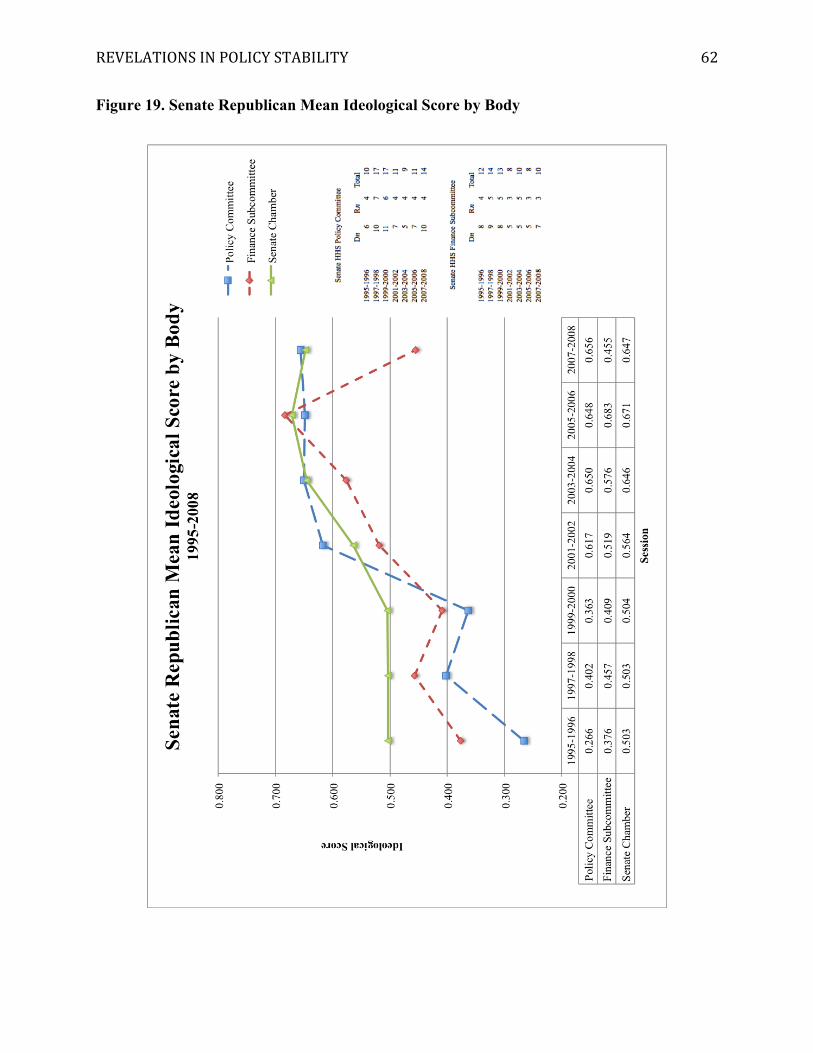
REVELATIONS IN POLICY STABILITY
62
Figure 19. Senate Republican Mean Ideological Score by Body
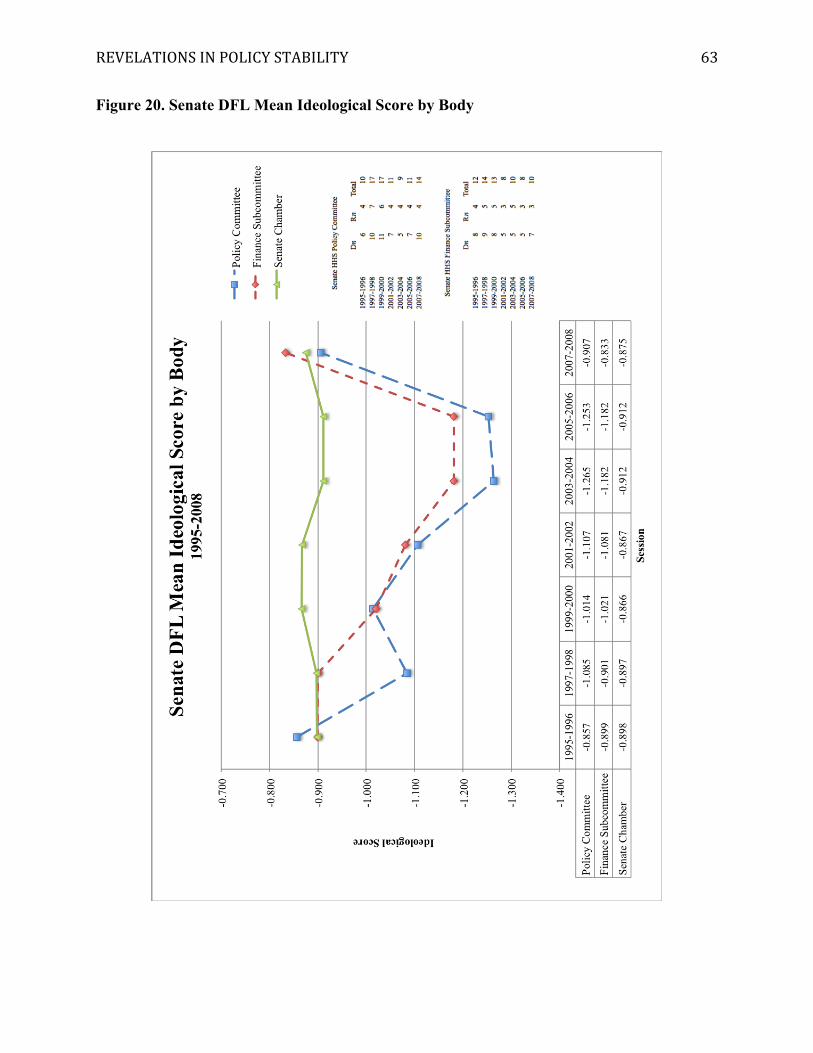
REVELATIONS IN POLICY STABILITY
63
Figure 20. Senate DFL Mean Ideological Score by Body
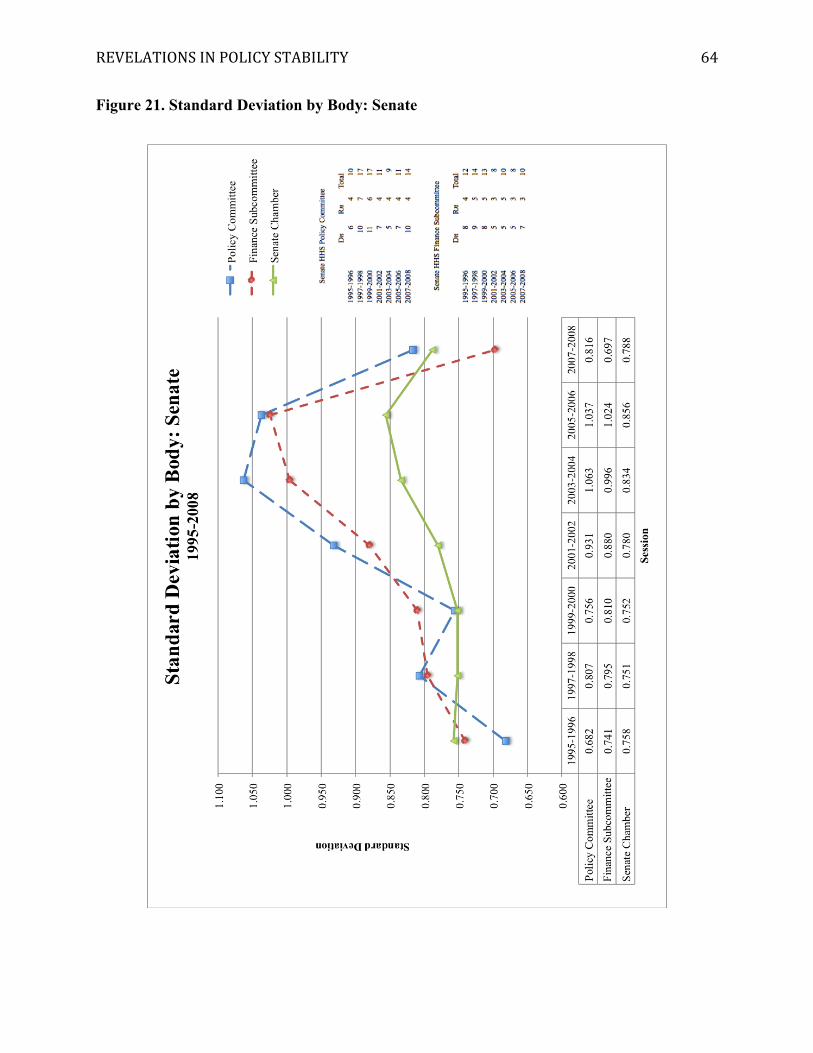
REVELATIONS IN POLICY STABILITY
64
Figure 21. Standard Deviation by Body: Senate
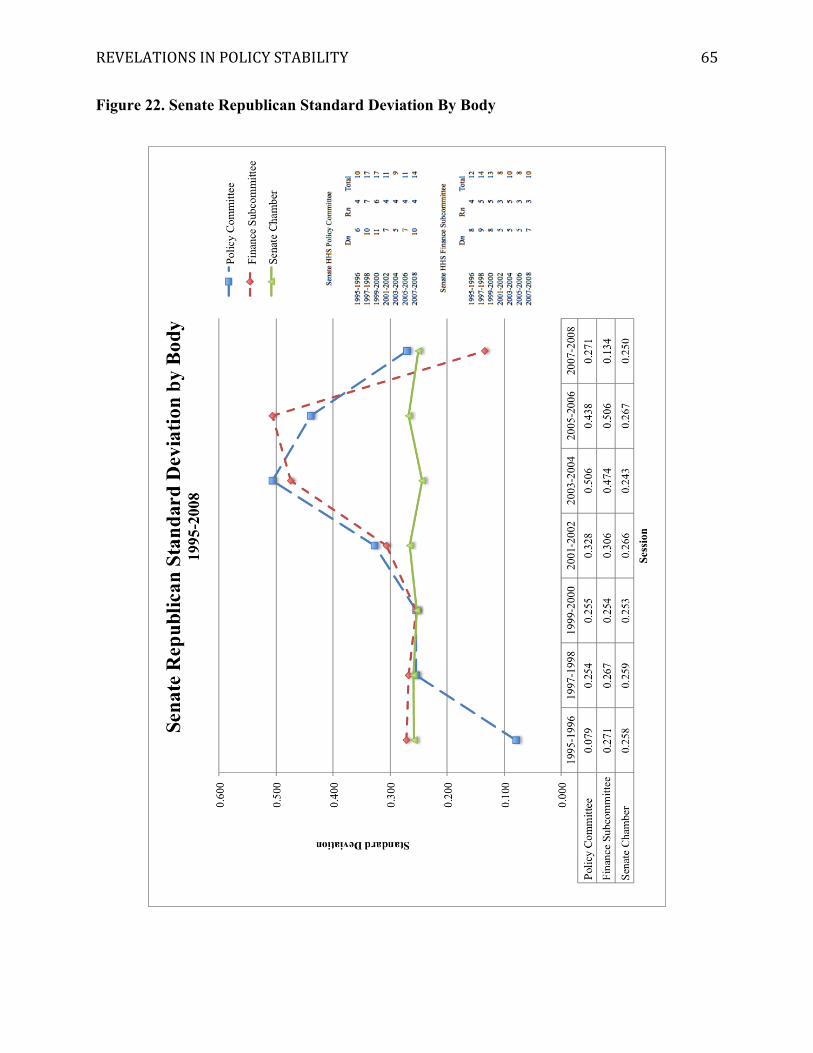
REVELATIONS IN POLICY STABILITY
65
Figure 22. Senate Republican Standard Deviation By Body
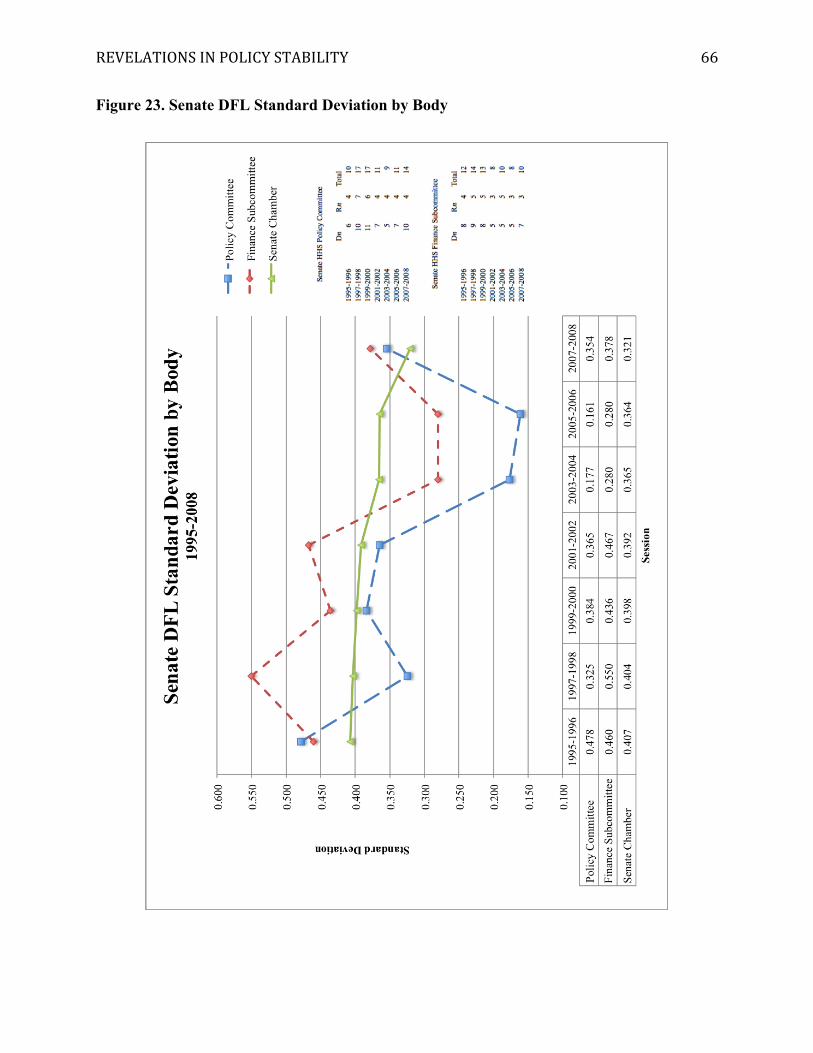
REVELATIONS IN POLICY STABILITY
66
Figure 23. Senate DFL Standard Deviation by Body
REVELATIONS IN POLICY STABILITY
67
References Cox, A., & McCubbins, M. (1993). Legislative leviathan. Berkeley, CA: University of California
Press.
Godin, C., Mostrom, K., & Aby, M. (2009). Screening for the possibility of co-‐occurring
mental illness and substance use disorder in the behavioral health setting. St Paul,
MN: Minnesota Department of Human Services
Krehbiel, K. (1991). Information and legislative organization. Ann Arbor, MI: University of
Michigan Press.
McClellan, A. T., K. Meyers. (2004). Contemporary addiction treatment: A review of systems
problems for adults and adolescents. Biological Psychiatry 56:(764–770). PMID:
15556121
Minnesota Department of Human Services, Chemical Health Division. (2008). Drug abuse
trends: Minneapolis/St Paul, Minnesota, June 2008. St. Paul, MN: Minnesota
Department of Human Services.
Minnesota Department of Human Services, Chemical Health Division. (2008). Chemical
dependency provider performance measures, 2007. St. Paul, MN: Minnesota
Department of Human Services.
REVELATIONS IN POLICY STABILITY
68
Minnesota Department of Human Services, Chemical Health Division. (2009). Chemical
dependency provider performance measures, 2008. St. Paul, MN: Minnesota
Department of Human Services.
Minnesota Department of Human Services, Chemical Health Division. (2010). Chemical
dependency provider performance measures, 2009. St. Paul, MN: Minnesota
Department of Human Services.
Minnesota Department of Human Services, Alcohol and Drug Abuse Division. (2011).
Chemical dependency provider performance measures, 2010. St. Paul, MN: Minnesota
Department of Human Services.
Minnesota Department of Human Services, Alcohol and Drug Abuse Division. (2012).
Chemical dependency provider performance measures, 2011. St. Paul, MN: Minnesota
Department of Human Services.
Minnesota Department of Human Services, Chemical Health Division. (2012). Drug abuse
trends in Minneapolis/St Paul, Minnesota: June 2012. St. Paul, MN: Minnesota
Department of Human Services.
Minnesota Department of Human Services, Alcohol and Drug Abuse Division. (2013).
Chemical dependency provider performance measures, 2012. St. Paul, MN: Minnesota
Department of Human Services.
REVELATIONS IN POLICY STABILITY
69
Minnesota Department of Human Services. (2013) Trends in completing treatment for
substance abuse disorders in Minnesota. St. Paul. MN: Minnesota Department of
Human Services.
Rohde, D. (1991). Parties and leaders in the postreform House. Chicago, IL: University of
Chicago Press.
University of Minnesota, School of Public Health. (2006). Estimating the need for treatment
for substance abuse among adults in Minnesota: 2004/2005 Minnesota treatment
needs assessment survey final report. Minneapolis, MN: McAlpine, D.D., Beebe, T.,
McCoy, K., & Davern, M.
U.S. Department of Health and Human Services, Substance Abuse and Mental Health
Services Administration. (2009). Cost of offset treatment services. Washington, D.C.:
U.S. Department of Health and Human Services.
Willenbring, M.L. (2010). The past and future of research on treatment of alcohol
dependence. Alcohol Research & Health, 33(1-‐2), 57-‐63.
Related Documents