ORIGINAL RESEARCH ARTICLE published: 21 November 2014 doi: 10.3389/fmars.2014.00065 Revealing the regime of shallow coral reefs at patch scale by continuous spatial modeling Antoine Collin 1,2 *, Philippe Archambault 3 and Serge Planes 2 1 Nadaoka Laboratory, Department of Mechanical and Environmental Informatics, Tokyo Institute of Technology, Tokyo, Japan 2 USR 3278 CNRS-EPHE, Centre de Recherches Insulaires et Observatoire de l’Environnement (CRIOBE), Papetoai, French Polynesia 3 Institut des Sciences de la Mer, Université du Québec à Rimouski, Rimouski, Canada Edited by: Alberto Basset, University of Salento, Italy Reviewed by: Simonetta Fraschetti, University of Salento and Consorzio Nazionale Interuniversitario per le Scienze del Mare, Italy Alberto Basset, University of Salento, Italy *Correspondence: Antoine Collin, Nadaoka Laboratory, Department of Mechanical and Environmental Informatics, Tokyo Institute of Technology, O-okayama 2-12-1-W8-13, Meguro-ku, Tokyo, 152-8552, Japan e-mail: [email protected] Reliably translating real-world spatial patterns of ecosystems is critical for understanding processes susceptible to reinforce resilience. However, the great majority of studies in spatial ecology use thematic maps to describe habitats and species in a binary scheme. By discretizing the transitional areas and neglecting the gradual replacement across a given space, the thematic approach may suffer from substantial limitations when interpreting patterns created by many continuous variables. Here, local and regional spectral proxies were used to design and spatially map at very fine scale a continuous index dedicated to one of the most complex seascapes, the coral reefscape. Through a groundbreaking merge of bottom-up and top-down approach, we demonstrate that three to seven-habitat continuous indices can be modeled by nine, six, four, and three spectral proxies, respectively, at 0.5m spatial resolution using hand- and spaceborne measurements. We map the seven-habitat continuous index, spanning major Indo-Pacific coral reef habitats through the far red-green normalized difference ratio over the entire lagoon of a low (Tetiaroa atoll) and a high volcanic (Moorea) island in French Polynesia with 84 and 82% accuracy, respectively. Further examinations of the two resulting spatial models using a customized histoscape (density function of model values distributed on a concentric strip across the reef crest-coastline distance) show that Tetiaroa exhibits a greater variety of coral reef habitats than Moorea. By designing such easy-to-implement, transferrable spectral proxies of coral reef regime, this study initiates a framework for spatial ecologists tackling coral reef biodiversity, responses to stresses, perturbations and shifts. We discuss the limitations and contributions of our findings toward the study of worldwide coral reef resilience following stochastic environmental change. Keywords: non-thematic mapping, coral reefs, spectral proxy, reefscape ecology, Moorea, Tetiaroa, French Polynesia, resilience INTRODUCTION Elucidating emergent properties of complex adaptive ecosystems composed of interacting ecological patches (i.e., elements of a hierarchy) requires an innovative conceptual, theoretical, and methodological framework (Holling, 2001). An overarching com- ponent of this framework is to better understand the non-linear dynamics of the ecological patches across various organizational and spatial scales (Cumming, 2011). Identifying the spatial pat- terns of these patches is traditionally done by quantifying the surface area occupied by the targeted elements (Gotelli and Colwell, 2001; Rooney et al., 2004; Collin et al., 2008). The eco- logical patches are thereby spatially referred to as homogeneous discrete patches. Depending on the level of ecological organiza- tion studied, patches are composed of either individual organisms or assemblages as well as habitats (Forman, 1995). Classifying populations, communities or habitats into categorical types has traditionally been accepted by ecologists (Turner et al., 2001). Studies so far mainly strive to monitor evolution between alter- nate spatially-enclosed domains of attraction or regimes (Folke, 2006). Since the advent of digital data acquisition, computation and storage, ecological research has increasingly used images to outline ecological patches separated from each other by sharp boundaries. However, the detection of these boundaries is heavily dependent on the capabilities of sensors and statistical classifiers. In addition, the binary approach underlying these boundaries has sparked off a wide-ranging theoretical debate on the ecological representativeness between real world and digitalized information (Austin, 2002, 2007). Investigating the spatial patterns of ecological patches in a continuous (or non-thematic) way has received relatively lit- tle attention so far. However, it is obvious that a continuous approach is better suited for describing natural pattern-process interactions that are emerging from a range of gradients and resources (Austin, 2007). The continuously ranging approach provides insights into the spatial modeling of species diversity (Harborne et al., 2008; Mellin et al., 2009) and can successfully map the variations in ecological processes by means of appropri- ate indicators such as the functional index (Borja et al., 2000), www.frontiersin.org November 2014 | Volume 1 | Article 65 | 1 MARINE SCIENCE

Welcome message from author
This document is posted to help you gain knowledge. Please leave a comment to let me know what you think about it! Share it to your friends and learn new things together.
Transcript
ORIGINAL RESEARCH ARTICLEpublished: 21 November 2014
doi: 10.3389/fmars.2014.00065
Revealing the regime of shallow coral reefs at patch scaleby continuous spatial modelingAntoine Collin1,2*, Philippe Archambault3 and Serge Planes2
1 Nadaoka Laboratory, Department of Mechanical and Environmental Informatics, Tokyo Institute of Technology, Tokyo, Japan2 USR 3278 CNRS-EPHE, Centre de Recherches Insulaires et Observatoire de l’Environnement (CRIOBE), Papetoai, French Polynesia3 Institut des Sciences de la Mer, Université du Québec à Rimouski, Rimouski, Canada
Edited by:
Alberto Basset, University ofSalento, Italy
Reviewed by:
Simonetta Fraschetti, University ofSalento and Consorzio NazionaleInteruniversitario per le Scienze delMare, ItalyAlberto Basset, University ofSalento, Italy
*Correspondence:
Antoine Collin, Nadaoka Laboratory,Department of Mechanical andEnvironmental Informatics, TokyoInstitute of Technology, O-okayama2-12-1-W8-13, Meguro-ku, Tokyo,152-8552, Japane-mail: [email protected]
Reliably translating real-world spatial patterns of ecosystems is critical for understandingprocesses susceptible to reinforce resilience. However, the great majority of studiesin spatial ecology use thematic maps to describe habitats and species in a binaryscheme. By discretizing the transitional areas and neglecting the gradual replacementacross a given space, the thematic approach may suffer from substantial limitationswhen interpreting patterns created by many continuous variables. Here, local and regionalspectral proxies were used to design and spatially map at very fine scale a continuousindex dedicated to one of the most complex seascapes, the coral reefscape. Througha groundbreaking merge of bottom-up and top-down approach, we demonstrate thatthree to seven-habitat continuous indices can be modeled by nine, six, four, and threespectral proxies, respectively, at 0.5 m spatial resolution using hand- and spacebornemeasurements. We map the seven-habitat continuous index, spanning major Indo-Pacificcoral reef habitats through the far red-green normalized difference ratio over the entirelagoon of a low (Tetiaroa atoll) and a high volcanic (Moorea) island in French Polynesiawith 84 and 82% accuracy, respectively. Further examinations of the two resulting spatialmodels using a customized histoscape (density function of model values distributed ona concentric strip across the reef crest-coastline distance) show that Tetiaroa exhibits agreater variety of coral reef habitats than Moorea. By designing such easy-to-implement,transferrable spectral proxies of coral reef regime, this study initiates a framework forspatial ecologists tackling coral reef biodiversity, responses to stresses, perturbations andshifts. We discuss the limitations and contributions of our findings toward the study ofworldwide coral reef resilience following stochastic environmental change.
Keywords: non-thematic mapping, coral reefs, spectral proxy, reefscape ecology, Moorea, Tetiaroa, French
Polynesia, resilience
INTRODUCTIONElucidating emergent properties of complex adaptive ecosystemscomposed of interacting ecological patches (i.e., elements of ahierarchy) requires an innovative conceptual, theoretical, andmethodological framework (Holling, 2001). An overarching com-ponent of this framework is to better understand the non-lineardynamics of the ecological patches across various organizationaland spatial scales (Cumming, 2011). Identifying the spatial pat-terns of these patches is traditionally done by quantifying thesurface area occupied by the targeted elements (Gotelli andColwell, 2001; Rooney et al., 2004; Collin et al., 2008). The eco-logical patches are thereby spatially referred to as homogeneousdiscrete patches. Depending on the level of ecological organiza-tion studied, patches are composed of either individual organismsor assemblages as well as habitats (Forman, 1995). Classifyingpopulations, communities or habitats into categorical types hastraditionally been accepted by ecologists (Turner et al., 2001).Studies so far mainly strive to monitor evolution between alter-nate spatially-enclosed domains of attraction or regimes (Folke,
2006). Since the advent of digital data acquisition, computationand storage, ecological research has increasingly used images tooutline ecological patches separated from each other by sharpboundaries. However, the detection of these boundaries is heavilydependent on the capabilities of sensors and statistical classifiers.In addition, the binary approach underlying these boundaries hassparked off a wide-ranging theoretical debate on the ecologicalrepresentativeness between real world and digitalized information(Austin, 2002, 2007).
Investigating the spatial patterns of ecological patches in acontinuous (or non-thematic) way has received relatively lit-tle attention so far. However, it is obvious that a continuousapproach is better suited for describing natural pattern-processinteractions that are emerging from a range of gradients andresources (Austin, 2007). The continuously ranging approachprovides insights into the spatial modeling of species diversity(Harborne et al., 2008; Mellin et al., 2009) and can successfullymap the variations in ecological processes by means of appropri-ate indicators such as the functional index (Borja et al., 2000),
www.frontiersin.org November 2014 | Volume 1 | Article 65 | 1
MARINE SCIENCE

Collin et al. Coral reef regime continuous mapping
the resilience index (Rowlands et al., 2012), and the vegetationindex (Tucker, 1979). Moreover, the latter two indices are of highimportance in natural resource management as they may revealor predict high biodiversity areas or hotspots (Myers et al., 2000).
Since the Normalized Difference Vegetation Index (NDVI) wasdesigned by Tucker (1979), it has benefited from self-selection interrestrial ecology work and come to the forefront of the studyof global change in, for instance, shedding light on the increasedplant growth in northernmost latitudes (Myneni et al., 1997;Sturm, 2010), and assessing the carbon balance and net primaryproduction of terrestrial ecosystems (Piao et al., 2009; Zhao andRunning, 2010). Based on the light interaction with vegetation,absorbing the red wavelengths and reflecting the near-infrared,the NDVI enables tree species, tree phenology and bare groundto be reliably discriminated over a vast range of spatial scales.Even though the use of the NDVI has become a key componentfor ecologists (Pettorelli et al., 2005), use of the index is stronglyconfined to terrestrial ecosystems. This is due to the fact thatnear-infrared wavelengths are substantially absorbed by water,incurring a great reduction in signal return/detection (Smithand Baker, 1981). Marine ecologists inevitably limit their inves-tigation of ecological patch’s spectral signatures to wavelengthsconstrained by the visible spectrum, i.e., 400–700 nm (Hochberget al., 2003; Collin and Planes, 2012).
An in-depth examination of the water-attenuated gamut nearboth range boundaries shows that a larger spectral window hasthe potential of delivering meaningful information from particu-lar ecological patches, hitherto neglected (Pegau et al., 2003; Leonet al., 2012). Specifically, insofar as the attenuation coefficientis moderately high in clear seawaters (Maritorena et al., 1994),the very near-infrared (between 700 and 750 nm) can reveal tar-gets interacting with light at these wavelengths. The interactioncan correspond to (1) the overall reflection by the chlorophyllpatches (i.e., red-shift effect), or, conversely, (2) the absorption bythe chlorophyll photosystem I (while the photosystem II absorbsthe red wavelengths, Koning, 1994), or (3) the absorption bythe recently discovered chlorophyll f, allowing reef building stro-matolites to absorb light around a 706 nm centered peak (Chenet al., 2010). If the interplay of these sparse findings turns out tobe fruitful, it would enhance the monitoring of shallow ecosys-tems, such as coral reefs, which are at the top marine biodiversityhotspots.
Remote surveying of coastal and marine ecosystem patterns athigh (∼10 m) and very high (∼1 m) spatial resolution is increas-ingly required. The launch of the WorldView-2 (WV2) sensor in2009 has been an incentive that greatly stimulates this study. Thisspaceborne sensor has doubled the spectral capabilities (notablya far red waveband) of all very high resolution counterpartswhilst furnishing ecological information down to 0.5 m. Basedon the WV2 synergistic spectral dataset, the coastal habitats andbathymetry can now be mapped at the submeter scale over ecosys-tems showing clear waters, typically over coral reefscapes (Collinand Planes, 2011; Collin and Hench, 2012). The shallow seascapeswere thereby selected as the study cases by virtue of their cur-rent socio-ecological paramountcy. Coral reefscapes are regardedas the beacon seascape given the essential ecological services theyprovide and the increased number of abiotic and biotic factors
threatening them (Emanuel, 2005; Hoegh-Guldberg et al., 2007;Wilkinson, 2008; AMAP Expert Group, 2011). Rapidly monitor-ing the regime of coral reefscapes across various spatial scales,while using a reliable proxy with little ground-truthing, consti-tutes an inevitable issue to be addressed in the near future, owingto the accelerating pace of reef loss (De’ath et al., 2012). In thisstudy, the regime of the coral reefscape refers to the set of the habi-tats that has the same essential structure, function and feedbacks(Walker et al., 2004).
The purpose of this study is to design, validate, and use a con-tinuously ranging spatial model of coral reefscape regime for thefirst time. Co-evolving with cutting-edge imagery (ground basedand remotely sensed), this model, dedicated to an ecologicallycomplex seascape, must be able to (1) concur with comprehensiveground measurements, and (2) reliably map components (i.e.,highlight live coral colonies) across various spatial scales whilebeing decreasingly sensitive to various algae taxa, bleached coraland sediment. As a first use, (3) the spatial model is employed toportray the regime akin to two entirely-modeled high (volcano)and low islands (atoll) in French Polynesia, outlining its potentialkey role in assessing the resilience of shallow coral reefs to globalenvironmental change.
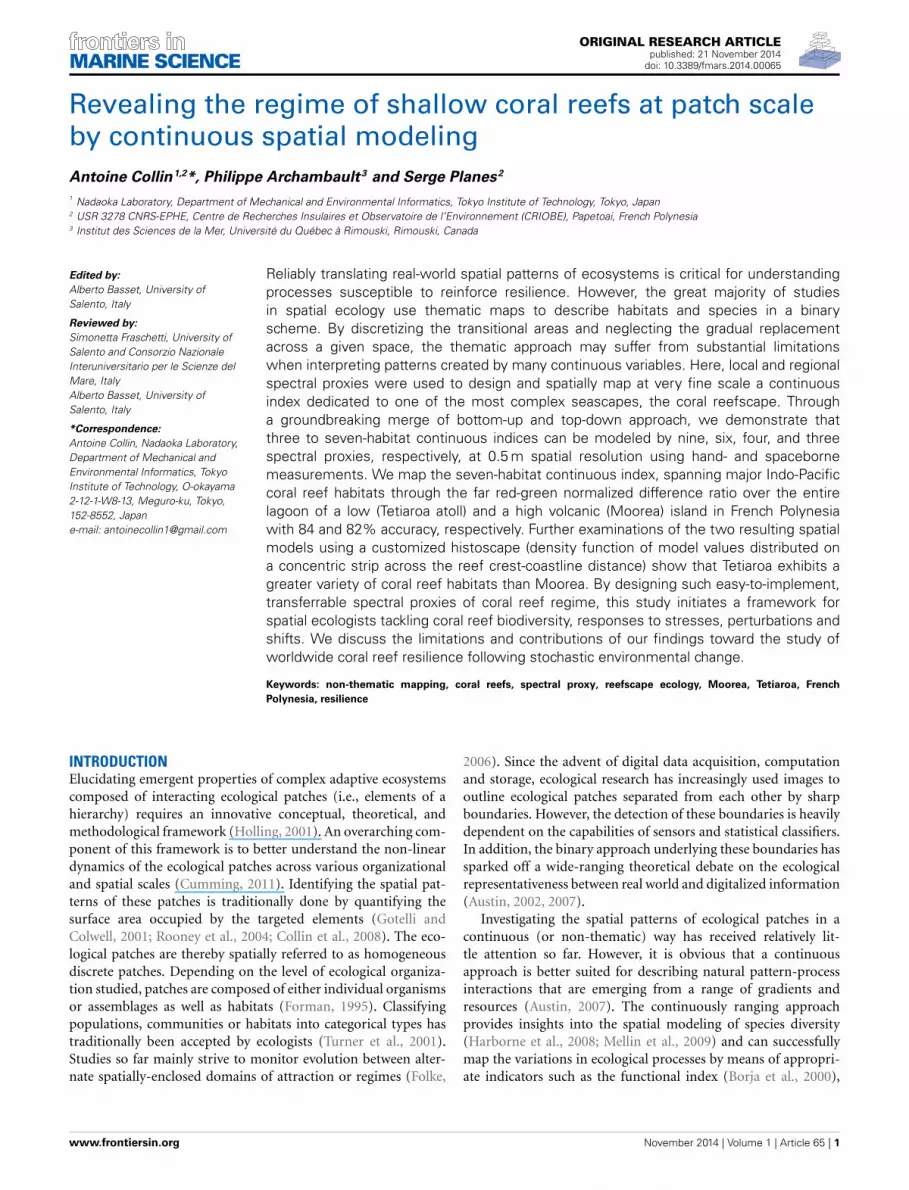
MATERIALS AND METHODSSTUDY SITEIndo-Pacific reefs exhibit diversified benthic communities, rang-ing from the sediment to healthy coral colonies through variousgenera of macroalgae. This high degree of seascape diversityseemed ideally suited to test and validate a continuous (non-thematic) coral index. The study was conducted around theislands of Tetiaroa (17◦0′S, 149◦33′W) and Moorea (17◦47′S,149◦80′W) in the Archipelago of the Society Islands (FrenchPolynesia) (Figure 1). Tetiaroa, located 53 km North of Tahiti,is a 34 km2 atoll (crown of reef peaking at 3 m), comprising 13islets (motu) and a 30 m deep lagoon with no reef pass. Benefitingfrom a relative anthropogenic-related protection due to its own-ership history (sacred location of the Tahitian kingship and finallyproperty of the Brando family), Tetiaroa shelters various coralcolonies (Porites sp., Synarea sp., Acropora sp., Pavona cactus)with attached lagoon organisms (pink whipray Himanturafai,black tip shark Carcharhinus melanopterus). Contrary to Tetiaroa,Moorea, as a 187 km2 volcanic island, peaked at 1207 m andexperiences an increase of demography pressure compoundedwith runoff disturbances (16,490 inhabitants, 2007 census pop-ulation). Located 17 km North-West of Tahiti, Moorea is situatedat the southeastern end of the Society volcanic chain, displacingto the northwest as the Pacific plate. Given the wide spectrum ofhabitats and species and the ease of sampling (clear, warm, andshallow waters), both islands fit the requirements for our study.
CORAL REEF HABITATSA field campaign conducted over the two islands between 21June 2010 and 16 November 2011, enabled a total of 897 sitesto be characterized in respect to their geographic location, waterdepth and benthic habitats. Supporting the accuracy assessmentof the spatial model and bridging the hand- and spaceborne mea-surements, these sites were classified in eight benthic habitats
Frontiers in Marine Science | Marine Ecosystem Ecology November 2014 | Volume 1 | Article 65 | 2
Collin et al. Coral reef regime continuous mapping
FIGURE 1 | Location and true color composite images (RGB:532) of the
two islands composing our study area in the Archipelago of the
Society Islands, French Polynesia: (A) Tetiaroa atoll and (B) Moorea
volcanic island.
based on an influential classification scheme (Hochberg et al.,2003) deemed representative of main habitats in global coralreefs (Roff and Mumby, 2012): brown stony coral (Acroporahyancinthus, Acropora pulchra, Pavona cactus, Pocillopora dam-icornis, Porites sp., Synarearus), blue stony coral (Montiporasp., Porites sp.), bleached stony coral (all previous taxa), brownfleshy algae (Padina boryana, Sargassum pacificum, Turbinariaornata), red fleshy algae (Actinotrichia fragilis), green fleshy algae(Halimeda opuntia, Cladophora patentiramea), red calcareousalgae (Lithotamniae), and calcareous sand. Over every site, ageoreferenced 0.5 × 0.5 m quadrat (matching the satellite spa-tial resolution) allowed the quantification of benthic habitatsusing a digitally-superimposed 6 × 6 grid. Since the quadrat wasrecorded using a high-resolution digital RGB camera, each of the
36 grid squares composing the grid were thoroughly examined(2.10−4 m resolution). The habitat dominating the grid composi-tion (>18 sub-quadrats) was considered as being representativeof the site. Since all grids were analyzed and classified by thesame analyst, we assume that the vision-inherent bias is suffi-ciently buffered by the 36 sub-quadrats for an acceptable accuracyin quadrat assignment. Benthic habitats not included in ourclassification scheme (i.e., Echinodermata and Porifera phyla)were recorded when encountered. Further, there was no effect ofincluding them as these habitats did not dominate any quadratand hence, affect site classification.
In addition to the photograph-derived habitat reconnaissance,the water depth was recorded for each georeferenced site usinga 0.1 m accuracy acoustic system. Whilst water depths greaterthan 1 m were surveyed with an aluminum boat and sea kayak,in Moorea and Tetiaroa, respectively, shallower sites were investi-gated by foot on and around both islands.
LOCAL SCALE MEASUREMENTSTargeting a statistical robustness, a total of 2300 spectral signa-tures collected for the eight coral reef habitats were individuallymeasured between 7 and 22 November 2011 in a coral nurseryenclosed in the Moorea Intercontinental Resort. The proxim-ity of the samples to a dry and powered pontoon enabled for acontrolled recording, requiring calm conditions and a continu-ous connection between the portable spectrographic instrumentand the software-supplied laptop. Provided with one nm wave-length accuracy (hyperspectral), each spectral measurement wasrecorded as a reflectance (R) signature (ratio situated between 0and 1) by virtue of the white correction. Reflectance signatureswere then averaged across replicates to provide a mean spec-tral signature representative of each benthic habitat (Figure 2).The spectral range (spanning 350–750 nm) recorded in thisstudy overcomes the gamut traditionally covered (400–700 nm)by other studies (Hochberg et al., 2003; Leiper et al., 2009).The traditional limitations take the light attenuation in waterinto account, measured by the attenuation coefficient (Mobleyet al., 2002). However, given (1) the magnitude of the coef-ficient encompassed in the new spectrum (Maritorena et al.,1994), and (2) the ground measured reflectance that remainsexploitable (coefficient < 2 m−1 and R < 1, respectively), wepoint out upfront that the spectral information tied to wave-lengths slightly greater (until 750 nm) than the arbitrary upperlimit (i.e., 700 nm) has the potential for underpinning the designof the coral reef indices. This assumption may be confirmed bythe amount of underwater habitats detectable by remotely-sensedwavelengths of interest.
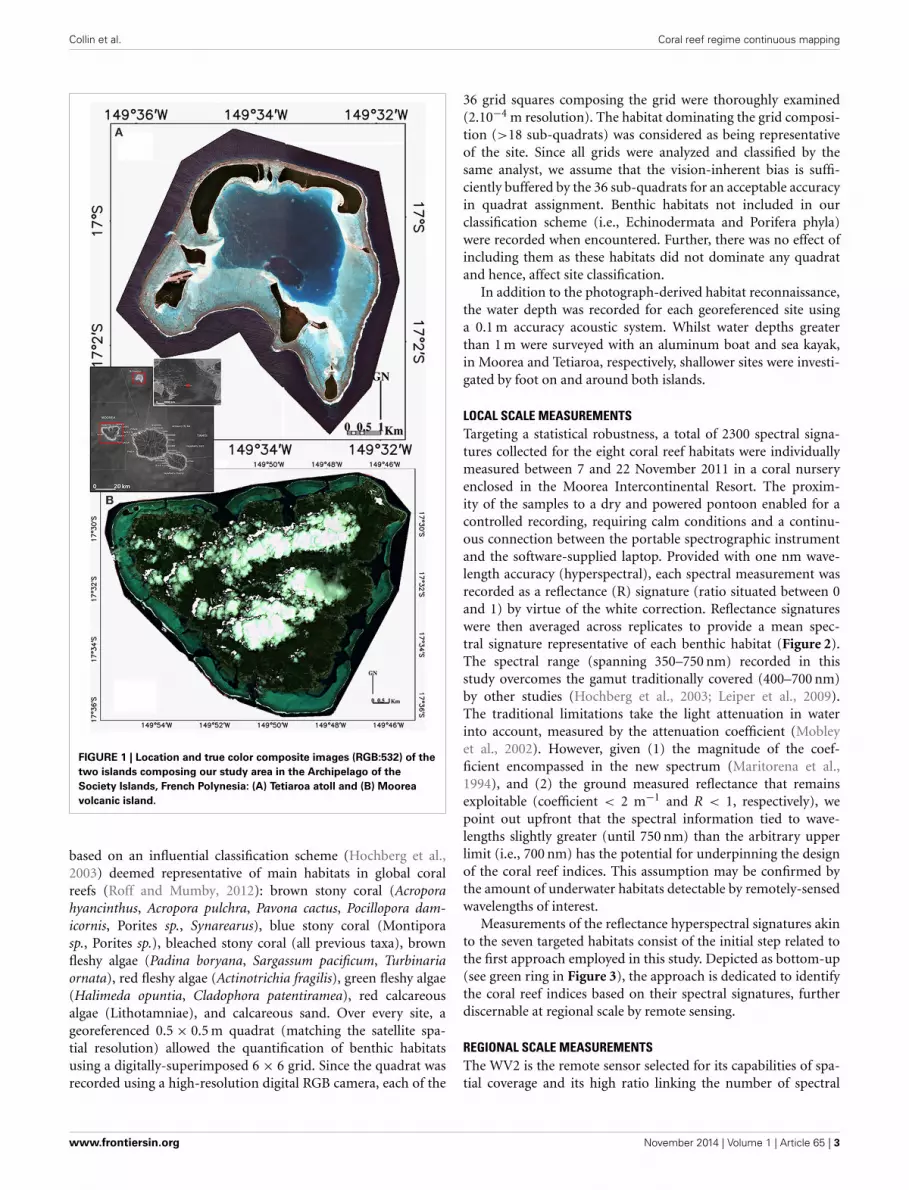
Measurements of the reflectance hyperspectral signatures akinto the seven targeted habitats consist of the initial step related tothe first approach employed in this study. Depicted as bottom-up(see green ring in Figure 3), the approach is dedicated to identifythe coral reef indices based on their spectral signatures, furtherdiscernable at regional scale by remote sensing.
REGIONAL SCALE MEASUREMENTSThe WV2 is the remote sensor selected for its capabilities of spa-tial coverage and its high ratio linking the number of spectral
www.frontiersin.org November 2014 | Volume 1 | Article 65 | 3

Collin et al. Coral reef regime continuous mapping
FIGURE 2 | Line plots of mean and standard error reflectances of
the eight coral reef habitats across wavelengths (350–750 nm with
1 nm accuracy). The left hand corner line plot, entitled stony coral,
synthesizes all reflectance measurements of brown and blue stonycoral. The white and gray lines represent the means and the standarderrors, respectively.
optical bands with the spatial resolution. Providing both six opti-cal bands (including the “red edge” band, 705–745 nm) with a2 m spatial resolution and one overarching band, called panchro-matic, with a 0.5 m spatial resolution across a 16.4 km swath,WV2 currently outperforms any space- and airborne sensors formapping coral reef habitats very finely over regional areas (Collinet al., 2013). The underlying premise of this sensor selection isthat coral reef indices will be operational for both space- andairborne sensors fitted with a greater amount of optical bands,irrespective of the decay of their spatial resolution. A total offour WV2 images covering 388 km2 (1.552 billion 0.5 m pixels)were collected over Moorea and Tetiaroa islands on 12 Februaryand 14 October 2010, respectively. WV2 imagery was correctedfor geometric distortions and atmospheric attenuation using theMODTRAN-4 algorithm (Matthew et al., 2000), resulting in sixwater-leaving reflectance matrices for each island (see blue ringin Figure 3 and Collin et al., 2013 for further details). The inno-vative use of the “red edge” band is encouraged to the extent thatthe amount of reliable information, empirically measured, is sig-nificant up to 2 m deep (Figure 4). The pansharpening method isthen applied to scale up the spatial resolution of the six bands(i.e., 2 m) to that of the panchromatic band (i.e., 0.5 m) usinga reliable fine-tuning procedure (Collin et al., 2013). Focusingonly on benthic habitats (possibly overshadowed by higher sig-nals common to air and terrestrial features), clouds and landwere masked out based on the probability density function of thestrongly-attenuated eighth band.
Water depth was mapped using the 897 field measurementscoupled with the ratio transform (Stumpf et al., 2003) applied tothe first and third WV2 bands (“coastal” and green, respectively),selected based on a systematic analysis (Collin and Hench, 2012).Based on the differential attenuation of optical wavelengths bywater, the transform “ratios” the natural logarithms of the twobands and furnishes a relative water depth model, suitable forobtaining actual water depths after calibration (Figures 4A,D).Given the increasing loss of benthic information in respect tothe water depth, areas deeper than 2 m were masked out, namely63.48% (32.37 km2) and 88.31% (14.73 km2) of Moorea andTetiaroa lagoon parts, respectively (Figure 4).
The pre-processing steps leading to the reflectance multi-spectral images are required to initialize the second approach.Described here as top-down (see blue ring in Figure 3), thisapproach aims to test the regional scale applicability of the coralreef indices derived from local scale measurements.
CORAL REEF INDICESThe methodology revolves around the fusion of the bottom-upand top-down approaches. The success of the methodology liesin the bridging of outcomes derived from the two processes(seerings in Figure 3). Based on hyperspectral data, the local scalecharacterization requires conversion with the spatial tool whichwill allow interpolation at the regional scale (based on multi-spectral data). The WV2 spectral sensitivity of the first six bandsillustrates the key function of joining the 500-bin hyperspectral
Frontiers in Marine Science | Marine Ecosystem Ecology November 2014 | Volume 1 | Article 65 | 4
Collin et al. Coral reef regime continuous mapping
FIGURE 3 | Flowchart of the overarching methodology portraying the
necessary steps leading to the spatial model of the Normalized
Difference Coral Reef Index (NDCRI). The overlapping zone between the
bottom-up (green ring) and the top-down (blue ring) approaches is of greatimportance and could only be made possible through theecologically-relevant spectral link.
measurements to the six-bin multispectral pixel data (Figure 5).Once the conversion is done for each hyperspectral signature,reflectance multispectral signatures are averaged by benthic habi-tat so that coral reef indices can be designed.
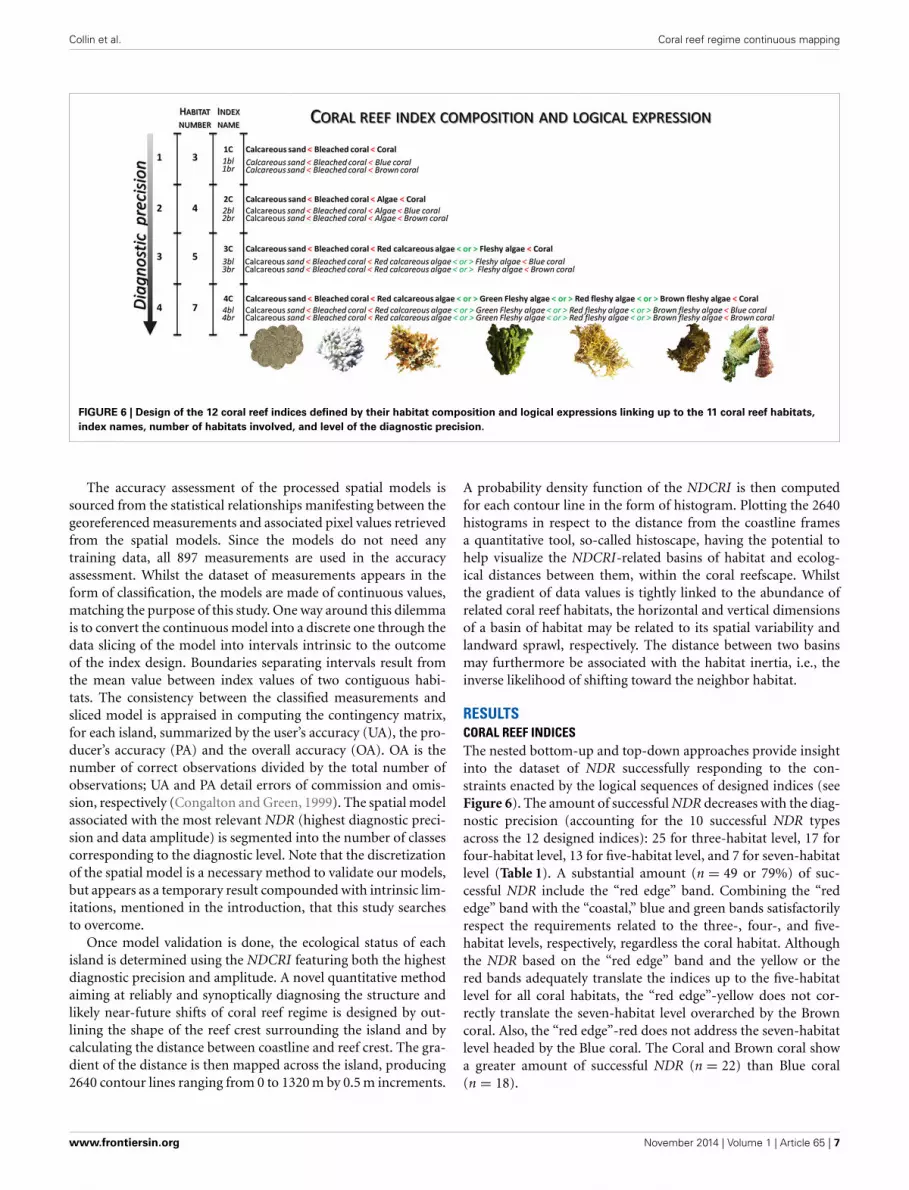
The core principle of the design consists in establishing indiceswhich allow attribution of the highest values for living coral,medium values for algae, and the lowest values for bleached coraland sediment. Beyond the traditional coral health index aiming atdiscriminating healthy and unhealthy corals in a dualistic (evensimplistic) way, our bespoke indices have the potential to over-arch the common Indo-Pacific shallow coral habitats in a rapid,spatially-fine and extensive way. Logical expressions of 12 coralreef indices, based on three, four, five and seven habitats, are builtto surrogate four categories of diagnostic precision (Figure 6).Each diagnostic category is subdivided into three coral reef indicesaccounting for either one coral super habitat or two coral habitats
depending on their color, i.e., blue or brown (Hochberg et al.,2003) (see Index name column in Figure 6). For each coral reefindex, the logical expressions between habitats are portrayed bystrict inequality signs (like thresholds values) except for the threealgae habitats for which there is no logical hierarchy (see < or >
in Figure 6). Encompassing the three algae habitats, a algae superhabitat is created since the far-reaching studies demonstratedthe ecological differentiation occurring between general coral-and macroalgae-dominated reefs (Bellwood et al., 2004; Roff andMumby, 2012).
Given the substantial scope of the NDVI spectral indexin major land-based ecological studies (Myneni et al., 1997;Pettorelli et al., 2005; Piao et al., 2009; Sturm, 2010; Zhao andRunning, 2010) and its facilitated use, the coral reef indices willbe revealed in the form of spectral Normalized Difference Ratios(NDR), mathematically formulated as follows:
www.frontiersin.org November 2014 | Volume 1 | Article 65 | 5

Collin et al. Coral reef regime continuous mapping
FIGURE 4 | Digital models of the water depth and reflectance of the
“red edge” band compounded with the water depth in respect to
the density function of the reflectance of the “red edge” band
related to Tetiaroa (A–C), and to Moorea (D–F). The water depth ispositively correlated with the darkness of the blue gradient (0–2 m). The
reflectance of the “red edge” is here represented by a rainbow-scaledgradient (0–0.11). Electro-magnetic radiation akin to the 705–745 nmgamut (i.e., spectral range of the “red edge” band) is reflected frombenthos as deep as 2 m, as revealed by the positive values of thedensity function values in both islands.
FIGURE 5 | Sequence of line plots describing (A) the local scale
measurement of hyperspectral reflectance data along with (B)
the spectral sensitivity of the regional scale sensor
(WorldView-2) and (C) the product of combining (A,B) to obtain
the multispectral reflectance signature, suitable for regional scale
spatial modeling.
NDRij = i − j
i + j(1)
where i, j ∈ {“coastal,” blue, green, yellow, red, “red edge” two-dimensional matrices} and i �= j. An exploratory dataset of 30NDR was computed as a result of the pair combinations of thesix optical bands. NDR are named according to the number indexof the two bands involved, i.e., “coastal,” blue, green, yellow, red,“red edge” related to 1, 2, 3, 4, 5, 6, respectively. An array of30 potential NDR by 11 habitats (eight single habitats + threesuper habitats: coral, algae, fleshy algae) is then subject to the 12logical expressions (see structure of Table 1). When one logicalexpression is successfully addressed by a NDR, the matching cellis highlighted in Table 1.
SPATIAL ANALYSISThe spatial mapping of the retained NDR is realized in applyingEquation (1) at each pixel of the two island imageries. Resulting
spatial models are then corrected for the water depth using anon-linear least squares fit, called the Gaussfit function (ResearchSystems 2005), based on a six-termed linear combination ofGaussian and quadratic functions. NDR residual values of thespatial model need only be scaled to the actual NDR values;namely:
NDCRI = m
∥∥∥∥∥∥∥∥∥∥X −
⎛⎜⎜⎜⎜⎝
A0e
⎛⎜⎝
− [ X−A1A2
]2/
2⎞⎟⎠
+ A3 + A4X + A5X2
⎞⎟⎟⎟⎟⎠
∥∥∥∥∥∥∥∥∥∥(2)
in which NDCRI means Normalized Difference Coral Reef Index,X refers to retained NDR, m is a tunable constant to scale theNDR residuals, and A0, A1, A2, A3, A4, and A5 are the unknownparameters of the non-linear depth regression.
Frontiers in Marine Science | Marine Ecosystem Ecology November 2014 | Volume 1 | Article 65 | 6
Collin et al. Coral reef regime continuous mapping
FIGURE 6 | Design of the 12 coral reef indices defined by their habitat composition and logical expressions linking up to the 11 coral reef habitats,
index names, number of habitats involved, and level of the diagnostic precision.
The accuracy assessment of the processed spatial models issourced from the statistical relationships manifesting between thegeoreferenced measurements and associated pixel values retrievedfrom the spatial models. Since the models do not need anytraining data, all 897 measurements are used in the accuracyassessment. Whilst the dataset of measurements appears in theform of classification, the models are made of continuous values,matching the purpose of this study. One way around this dilemmais to convert the continuous model into a discrete one through thedata slicing of the model into intervals intrinsic to the outcomeof the index design. Boundaries separating intervals result fromthe mean value between index values of two contiguous habi-tats. The consistency between the classified measurements andsliced model is appraised in computing the contingency matrix,for each island, summarized by the user’s accuracy (UA), the pro-ducer’s accuracy (PA) and the overall accuracy (OA). OA is thenumber of correct observations divided by the total number ofobservations; UA and PA detail errors of commission and omis-sion, respectively (Congalton and Green, 1999). The spatial modelassociated with the most relevant NDR (highest diagnostic preci-sion and data amplitude) is segmented into the number of classescorresponding to the diagnostic level. Note that the discretizationof the spatial model is a necessary method to validate our models,but appears as a temporary result compounded with intrinsic lim-itations, mentioned in the introduction, that this study searchesto overcome.
Once model validation is done, the ecological status of eachisland is determined using the NDCRI featuring both the highestdiagnostic precision and amplitude. A novel quantitative methodaiming at reliably and synoptically diagnosing the structure andlikely near-future shifts of coral reef regime is designed by out-lining the shape of the reef crest surrounding the island and bycalculating the distance between coastline and reef crest. The gra-dient of the distance is then mapped across the island, producing2640 contour lines ranging from 0 to 1320 m by 0.5 m increments.
A probability density function of the NDCRI is then computedfor each contour line in the form of histogram. Plotting the 2640histograms in respect to the distance from the coastline framesa quantitative tool, so-called histoscape, having the potential tohelp visualize the NDCRI-related basins of habitat and ecolog-ical distances between them, within the coral reefscape. Whilstthe gradient of data values is tightly linked to the abundance ofrelated coral reef habitats, the horizontal and vertical dimensionsof a basin of habitat may be related to its spatial variability andlandward sprawl, respectively. The distance between two basinsmay furthermore be associated with the habitat inertia, i.e., theinverse likelihood of shifting toward the neighbor habitat.
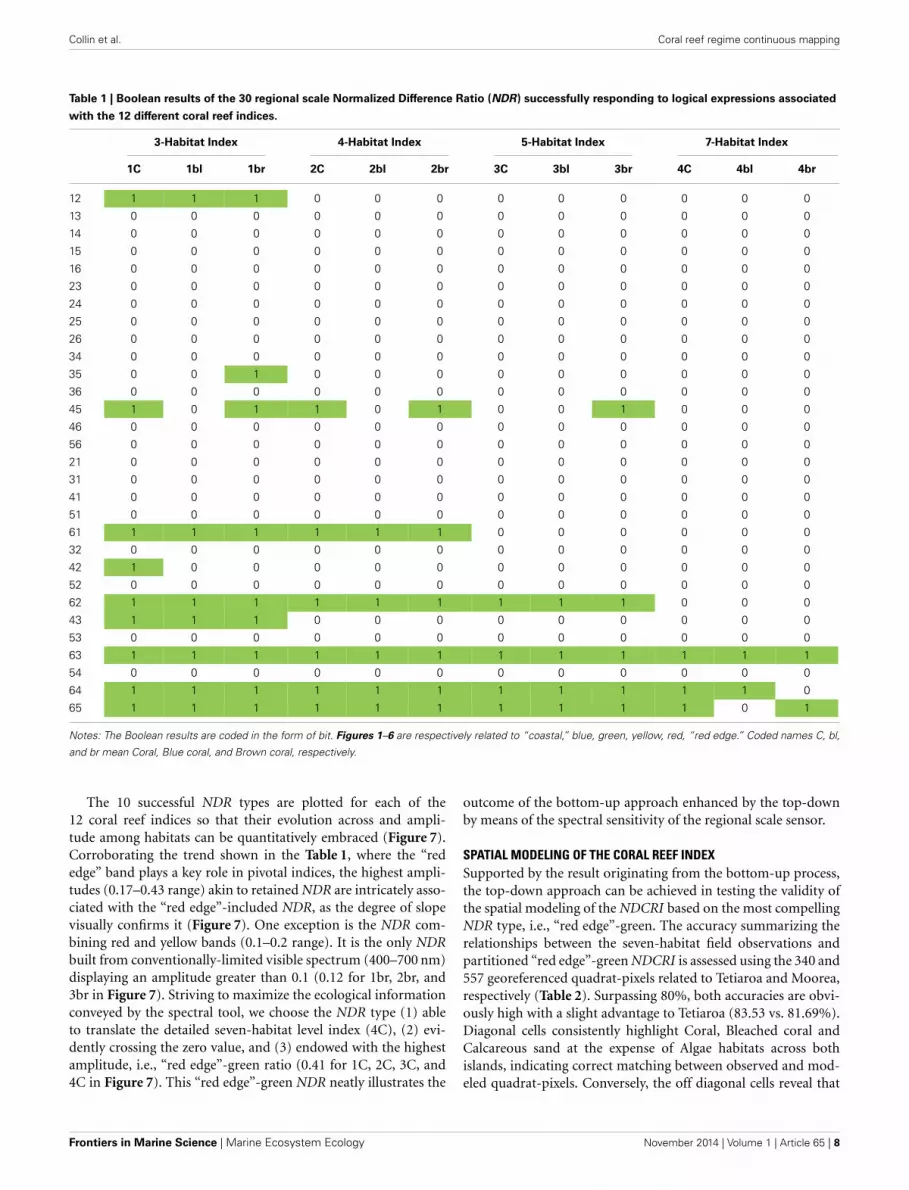
RESULTSCORAL REEF INDICESThe nested bottom-up and top-down approaches provide insightinto the dataset of NDR successfully responding to the con-straints enacted by the logical sequences of designed indices (seeFigure 6). The amount of successful NDR decreases with the diag-nostic precision (accounting for the 10 successful NDR typesacross the 12 designed indices): 25 for three-habitat level, 17 forfour-habitat level, 13 for five-habitat level, and 7 for seven-habitatlevel (Table 1). A substantial amount (n = 49 or 79%) of suc-cessful NDR include the “red edge” band. Combining the “rededge” band with the “coastal,” blue and green bands satisfactorilyrespect the requirements related to the three-, four-, and five-habitat levels, respectively, regardless the coral habitat. Althoughthe NDR based on the “red edge” band and the yellow or thered bands adequately translate the indices up to the five-habitatlevel for all coral habitats, the “red edge”-yellow does not cor-rectly translate the seven-habitat level overarched by the Browncoral. Also, the “red edge”-red does not address the seven-habitatlevel headed by the Blue coral. The Coral and Brown coral showa greater amount of successful NDR (n = 22) than Blue coral(n = 18).
www.frontiersin.org November 2014 | Volume 1 | Article 65 | 7
Collin et al. Coral reef regime continuous mapping
Table 1 | Boolean results of the 30 regional scale Normalized Difference Ratio (NDR) successfully responding to logical expressions associated
with the 12 different coral reef indices.
3-Habitat Index 4-Habitat Index 5-Habitat Index 7-Habitat Index
1C 1bl 1br 2C 2bl 2br 3C 3bl 3br 4C 4bl 4br
12 1 1 1 0 0 0 0 0 0 0 0 0
13 0 0 0 0 0 0 0 0 0 0 0 0
14 0 0 0 0 0 0 0 0 0 0 0 0
15 0 0 0 0 0 0 0 0 0 0 0 0
16 0 0 0 0 0 0 0 0 0 0 0 0
23 0 0 0 0 0 0 0 0 0 0 0 0
24 0 0 0 0 0 0 0 0 0 0 0 0
25 0 0 0 0 0 0 0 0 0 0 0 0
26 0 0 0 0 0 0 0 0 0 0 0 0
34 0 0 0 0 0 0 0 0 0 0 0 0
35 0 0 1 0 0 0 0 0 0 0 0 0
36 0 0 0 0 0 0 0 0 0 0 0 0
45 1 0 1 1 0 1 0 0 1 0 0 0
46 0 0 0 0 0 0 0 0 0 0 0 0
56 0 0 0 0 0 0 0 0 0 0 0 0
21 0 0 0 0 0 0 0 0 0 0 0 0
31 0 0 0 0 0 0 0 0 0 0 0 0
41 0 0 0 0 0 0 0 0 0 0 0 0
51 0 0 0 0 0 0 0 0 0 0 0 0
61 1 1 1 1 1 1 0 0 0 0 0 0
32 0 0 0 0 0 0 0 0 0 0 0 0
42 1 0 0 0 0 0 0 0 0 0 0 0
52 0 0 0 0 0 0 0 0 0 0 0 0
62 1 1 1 1 1 1 1 1 1 0 0 0
43 1 1 1 0 0 0 0 0 0 0 0 0
53 0 0 0 0 0 0 0 0 0 0 0 0
63 1 1 1 1 1 1 1 1 1 1 1 1
54 0 0 0 0 0 0 0 0 0 0 0 0
64 1 1 1 1 1 1 1 1 1 1 1 0
65 1 1 1 1 1 1 1 1 1 1 0 1
Notes: The Boolean results are coded in the form of bit. Figures 1–6 are respectively related to “coastal,” blue, green, yellow, red, “red edge.” Coded names C, bl,
and br mean Coral, Blue coral, and Brown coral, respectively.
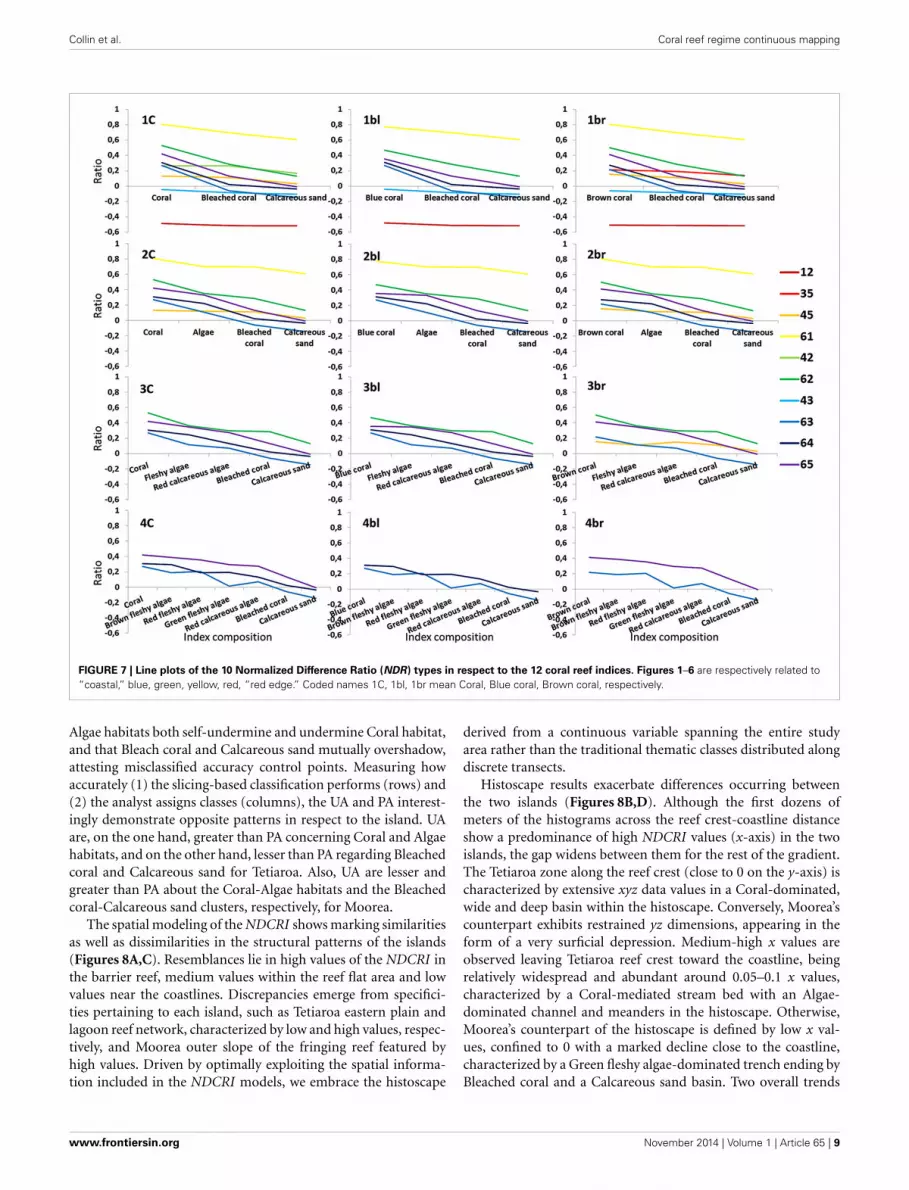
The 10 successful NDR types are plotted for each of the12 coral reef indices so that their evolution across and ampli-tude among habitats can be quantitatively embraced (Figure 7).Corroborating the trend shown in the Table 1, where the “rededge” band plays a key role in pivotal indices, the highest ampli-tudes (0.17–0.43 range) akin to retained NDR are intricately asso-ciated with the “red edge”-included NDR, as the degree of slopevisually confirms it (Figure 7). One exception is the NDR com-bining red and yellow bands (0.1–0.2 range). It is the only NDRbuilt from conventionally-limited visible spectrum (400–700 nm)displaying an amplitude greater than 0.1 (0.12 for 1br, 2br, and3br in Figure 7). Striving to maximize the ecological informationconveyed by the spectral tool, we choose the NDR type (1) ableto translate the detailed seven-habitat level index (4C), (2) evi-dently crossing the zero value, and (3) endowed with the highestamplitude, i.e., “red edge”-green ratio (0.41 for 1C, 2C, 3C, and4C in Figure 7). This “red edge”-green NDR neatly illustrates the
outcome of the bottom-up approach enhanced by the top-downby means of the spectral sensitivity of the regional scale sensor.
SPATIAL MODELING OF THE CORAL REEF INDEXSupported by the result originating from the bottom-up process,the top-down approach can be achieved in testing the validity ofthe spatial modeling of the NDCRI based on the most compellingNDR type, i.e., “red edge”-green. The accuracy summarizing therelationships between the seven-habitat field observations andpartitioned “red edge”-green NDCRI is assessed using the 340 and557 georeferenced quadrat-pixels related to Tetiaroa and Moorea,respectively (Table 2). Surpassing 80%, both accuracies are obvi-ously high with a slight advantage to Tetiaroa (83.53 vs. 81.69%).Diagonal cells consistently highlight Coral, Bleached coral andCalcareous sand at the expense of Algae habitats across bothislands, indicating correct matching between observed and mod-eled quadrat-pixels. Conversely, the off diagonal cells reveal that
Frontiers in Marine Science | Marine Ecosystem Ecology November 2014 | Volume 1 | Article 65 | 8
Collin et al. Coral reef regime continuous mapping
FIGURE 7 | Line plots of the 10 Normalized Difference Ratio (NDR) types in respect to the 12 coral reef indices. Figures 1–6 are respectively related to“coastal,” blue, green, yellow, red, “red edge.” Coded names 1C, 1bl, 1br mean Coral, Blue coral, Brown coral, respectively.
Algae habitats both self-undermine and undermine Coral habitat,and that Bleach coral and Calcareous sand mutually overshadow,attesting misclassified accuracy control points. Measuring howaccurately (1) the slicing-based classification performs (rows) and(2) the analyst assigns classes (columns), the UA and PA interest-ingly demonstrate opposite patterns in respect to the island. UAare, on the one hand, greater than PA concerning Coral and Algaehabitats, and on the other hand, lesser than PA regarding Bleachedcoral and Calcareous sand for Tetiaroa. Also, UA are lesser andgreater than PA about the Coral-Algae habitats and the Bleachedcoral-Calcareous sand clusters, respectively, for Moorea.
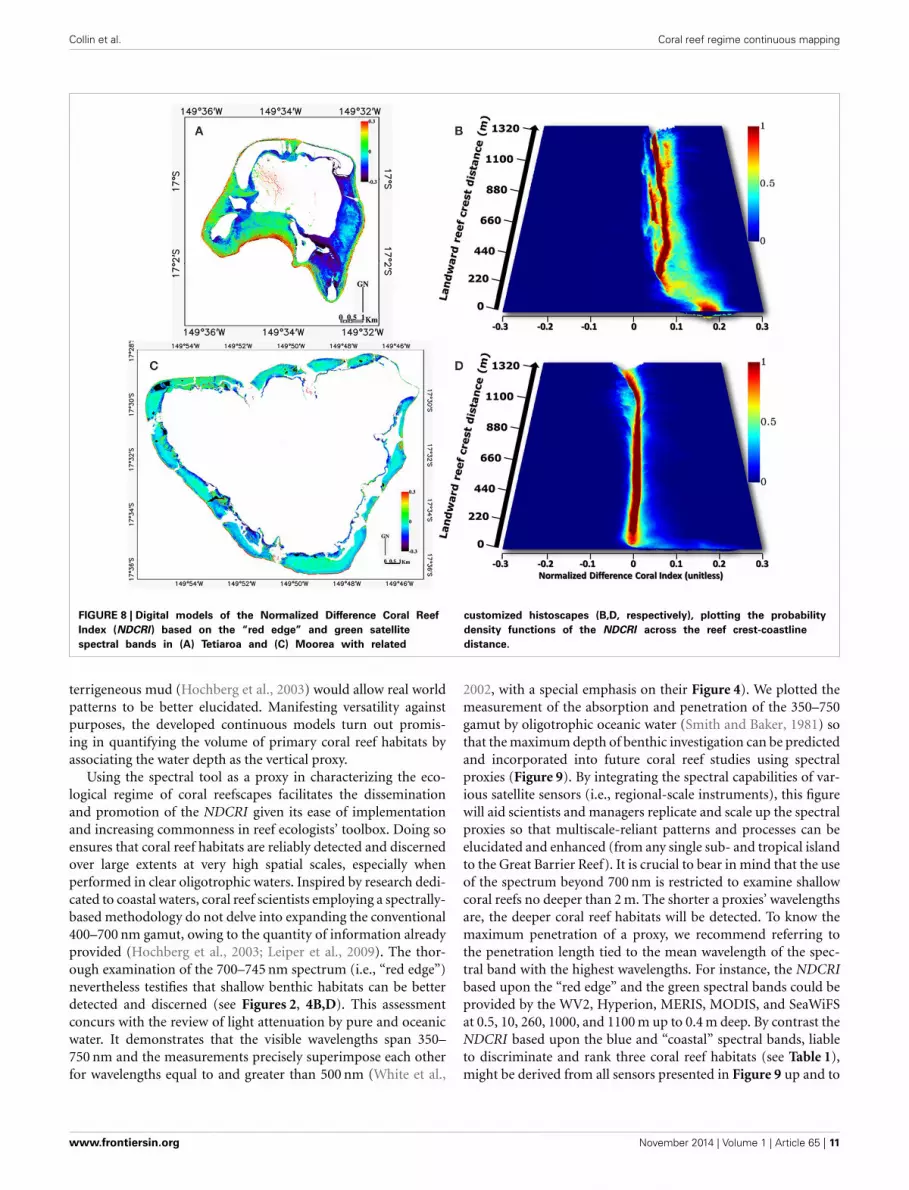
The spatial modeling of the NDCRI shows marking similaritiesas well as dissimilarities in the structural patterns of the islands(Figures 8A,C). Resemblances lie in high values of the NDCRI inthe barrier reef, medium values within the reef flat area and lowvalues near the coastlines. Discrepancies emerge from specifici-ties pertaining to each island, such as Tetiaroa eastern plain andlagoon reef network, characterized by low and high values, respec-tively, and Moorea outer slope of the fringing reef featured byhigh values. Driven by optimally exploiting the spatial informa-tion included in the NDCRI models, we embrace the histoscape
derived from a continuous variable spanning the entire studyarea rather than the traditional thematic classes distributed alongdiscrete transects.
Histoscape results exacerbate differences occurring betweenthe two islands (Figures 8B,D). Although the first dozens ofmeters of the histograms across the reef crest-coastline distanceshow a predominance of high NDCRI values (x-axis) in the twoislands, the gap widens between them for the rest of the gradient.The Tetiaroa zone along the reef crest (close to 0 on the y-axis) ischaracterized by extensive xyz data values in a Coral-dominated,wide and deep basin within the histoscape. Conversely, Moorea’scounterpart exhibits restrained yz dimensions, appearing in theform of a very surficial depression. Medium-high x values areobserved leaving Tetiaroa reef crest toward the coastline, beingrelatively widespread and abundant around 0.05–0.1 x values,characterized by a Coral-mediated stream bed with an Algae-dominated channel and meanders in the histoscape. Otherwise,Moorea’s counterpart of the histoscape is defined by low x val-ues, confined to 0 with a marked decline close to the coastline,characterized by a Green fleshy algae-dominated trench ending byBleached coral and a Calcareous sand basin. Two overall trends
www.frontiersin.org November 2014 | Volume 1 | Article 65 | 9
Collin et al. Coral reef regime continuous mapping
Table 2 | Contingency matrices depicting Tetiaroa (n = 340) and Moorea (n = 557) field-observed coral reef habitats vs. their classification
based on the seven-habitat slicing of the spatial model built from the Normalized Difference Ratio combining the “red edge” and the green
WorldView-2 bands.
Stony Brown fleshy Red fleshy Green fleshy Red calcareous Bleached Calcareous Row UA
coral algae algae algae algae stony coral sand Total
TETIAROA
Stony coral 42 2 0 1 2 1 1 49 85.71
Brown fleshy algae 1 40 0 2 2 1 2 48 83.33
Red fleshy algae 0 1 40 0 0 1 1 43 93.02
Green fleshy algae 2 0 0 38 4 0 0 44 86.36
Red calcareous algae 3 1 5 0 39 0 0 48 81.25
Bleached stony coral 2 3 0 3 0 41 4 53 77.366
Calcareous sand 0 2 0 2 3 4 44 55 80
Column Total 50 49 45 46 50 48 52 340
PA 84 81.63 88.89 82.61 78 85.42 84.61
MOOREA
Stony coral 70 4 2 0 4 3 1 84 83.33
Brown fleshy algae 4 64 2 0 0 2 4 76 84.21
Red fleshy algae 0 0 57 6 7 1 0 71 80.28
Green fleshy algae 5 0 5 65 1 9 3 88 73.86
Red calcareous algae 0 3 1 3 60 0 3 70 85.71
Bleached stony coral 2 1 1 7 1 68 6 86 79.07
Calcareous sand 0 3 0 2 0 6 71 82 86.59
Column Total 81 75 68 83 73 89 88 557
PA 86.42 85.33 83.82 78.31 82.19 76.40 80.68
Notes: UA and PA refer to user’s and producer’s accuracy, respectively. Bold values correspond to correctly classified validation pixels.
unequivocally typify the histoscapes inherent to the atoll andvolcanic island: a Coral/Algae-dominated wide stream bed withintertwined channels and a narrow Green fleshy algae-mediatedchannel, respectively.
DISCUSSIONSynergistically coupling bottom-up and top-down approaches,we find a continuous index discriminating and ranking the maincoral reef habitats and we spatially model it across two eco-geomorphologically opposed coral reefscapes. The histoscapesexplicitly highlight basins of habitat along the reef crest-coastlinedistance and show distinctions between the two islands.
ADVANCES AND LIMITATIONS OF THE CORAL REEF INDEXOpting for a continuous spatial model to identify and quan-tify the structure of complex ecosystems like coral reefs presentssubstantial advantages compared to thematic models, also calledclassifications. Tailored to mimic subtle variations in spatial pat-terns akin to the real world (Austin, 2007), continuous model-ing can also suitably document linear and non-linear dynamics(May, 2001; Harborne et al., 2006; Hastings and Wysham, 2010).Conversely, thematic modeling tends to perform well when defin-ing non-linear processes endowed with thresholds around whichregime shifts occur (Ives and Dakos, 2012), while aggregating
heterogeneous data into an average unit assigned to an overar-ching class. Specifically, spatial aggregation is very conducive ininducing misclassification when the related surface area encom-passes the unit, and the variability is substantial between neigh-bor or within-aggregate units. Interestingly, an array of coralreef indices positively respond to the designed logical sequencesagainst the diagnostic precision, i.e., the number of habitatsinvolved. Although the amount of successful NDR declines withthe precision, their variety shows great promise in addressing abroad list of purposes. In this study, the seven-habitat index is theonly index examined in-depth, mostly because of its suitabilityto our detailed analysis but also for the challenge it represents.Notwithstanding, the proxies for three-, four-, and five-habitatindices have the obvious potential to help stakeholders examinecoral bleaching, regime shifts occurring between coral and algae,and between coral and fleshy algae, respectively. A large body ofliterature seeking to demonstrate the regime shifts intrinsic tocoral reefs focuses on the ratio of the abundance of the coraland algae habitats (macroalgae more specifically) (see in Hugheset al., 2010). However, a very recent study shows that the tradi-tional coral-macroalgae ratio may have a low informational value(i.e., poor correlation) in terms of identifying the regime shift,but these limitations may be overcome using a ratio built on coraland fleshy macroalgae (Smith, 2012). Including the habitats com-monly tackled in coral reef studies, such as soft coral, seagrass or
Frontiers in Marine Science | Marine Ecosystem Ecology November 2014 | Volume 1 | Article 65 | 10
Collin et al. Coral reef regime continuous mapping
FIGURE 8 | Digital models of the Normalized Difference Coral Reef
Index (NDCRI) based on the “red edge” and green satellite
spectral bands in (A) Tetiaroa and (C) Moorea with related
customized histoscapes (B,D, respectively), plotting the probability
density functions of the NDCRI across the reef crest-coastline
distance.
terrigeneous mud (Hochberg et al., 2003) would allow real worldpatterns to be better elucidated. Manifesting versatility againstpurposes, the developed continuous models turn out promis-ing in quantifying the volume of primary coral reef habitats byassociating the water depth as the vertical proxy.
Using the spectral tool as a proxy in characterizing the eco-logical regime of coral reefscapes facilitates the disseminationand promotion of the NDCRI given its ease of implementationand increasing commonness in reef ecologists’ toolbox. Doing soensures that coral reef habitats are reliably detected and discernedover large extents at very high spatial scales, especially whenperformed in clear oligotrophic waters. Inspired by research dedi-cated to coastal waters, coral reef scientists employing a spectrally-based methodology do not delve into expanding the conventional400–700 nm gamut, owing to the quantity of information alreadyprovided (Hochberg et al., 2003; Leiper et al., 2009). The thor-ough examination of the 700–745 nm spectrum (i.e., “red edge”)nevertheless testifies that shallow benthic habitats can be betterdetected and discerned (see Figures 2, 4B,D). This assessmentconcurs with the review of light attenuation by pure and oceanicwater. It demonstrates that the visible wavelengths span 350–750 nm and the measurements precisely superimpose each otherfor wavelengths equal to and greater than 500 nm (White et al.,
2002, with a special emphasis on their Figure 4). We plotted themeasurement of the absorption and penetration of the 350–750gamut by oligotrophic oceanic water (Smith and Baker, 1981) sothat the maximum depth of benthic investigation can be predictedand incorporated into future coral reef studies using spectralproxies (Figure 9). By integrating the spectral capabilities of var-ious satellite sensors (i.e., regional-scale instruments), this figurewill aid scientists and managers replicate and scale up the spectralproxies so that multiscale-reliant patterns and processes can beelucidated and enhanced (from any single sub- and tropical islandto the Great Barrier Reef). It is crucial to bear in mind that the useof the spectrum beyond 700 nm is restricted to examine shallowcoral reefs no deeper than 2 m. The shorter a proxies’ wavelengthsare, the deeper coral reef habitats will be detected. To know themaximum penetration of a proxy, we recommend referring tothe penetration length tied to the mean wavelength of the spec-tral band with the highest wavelengths. For instance, the NDCRIbased upon the “red edge” and the green spectral bands could beprovided by the WV2, Hyperion, MERIS, MODIS, and SeaWiFSat 0.5, 10, 260, 1000, and 1100 m up to 0.4 m deep. By contrast theNDCRI based upon the blue and “coastal” spectral bands, liableto discriminate and rank three coral reef habitats (see Table 1),might be derived from all sensors presented in Figure 9 up and to
www.frontiersin.org November 2014 | Volume 1 | Article 65 | 11

Collin et al. Coral reef regime continuous mapping
FIGURE 9 | Theoretical limit of water depth detection in regard to the
spectral capabilities of the satellite sensors. The seven sensors, includingWV2 studied here, are very susceptible to provide meaningful spatial data for
coral reefs at various scales (ranging from 0.5 to 1100 m). Based on the spectralwindows inherent to each sensor, the name of the coral reef indices liable to beimplemented are shown. The coded name 1br means Brown coral.
30 m deep. However, the indicated water depths have to be con-sidered as theoretical thresholds that may over- or under-estimatethe actual limits. Even though the theoretical limit of the “rededge” band is near 0.7 m depth (Figure 9), the empirical relation-ships between the associated reflectance and water depth reveal alimit approximating 1.5 m depth (Figures 4C,F). Theoretical lim-its are deemed informational insofar as the magnitude of the sunglint and water clarity can be neglected. Integrating these two lim-itation factors into a decision-support tool will refine outcomes ofthe Figure 9 in order to optimize the spatial data acquisition andselection.
CONTINUOUS SPATIAL MODELSThe spatial modeling of ecological indicators has proven to beexcessively helpful in achieving conservation purposes duringthe process of area selection. From planning to outreach, anyconservation projects to date are to use maps. The spatially-explicit quantification of ecologically-relevant proxies proposes avisual support that may facilitate understanding to many stake-holders, irrespective of their technical skills. By virtue of itsversatility compared to sensors, and its ease to build through anyopen-source Geographical Information System and/or RemoteSensing software, the NDCRI lends strong support to man-agers tasking with coral reef sustainability and ecologists delving
into understanding coral reef regime shifts. Initiating the latteraspect, we design, deepen and apply the histoscape concept to theTetiaroa Pacific atoll and Moorea volcanic island. Summarizingthe spatial distribution of the NDCRI across the reef crest-coastline distance, histoscapes tied to both islands evidently man-ifest multiple basins composed of Coral, Brown, Red, and Greenalgae and a single deep basin of Green algae, for the atoll and thehigh island, respectively. The differences in the topology (field ofstudy of geometry and set theory) of both histoscapes may becaused by the sediment-, nutrient- and pollutant-laden runoffintrinsic to the populated high island. Specifically, the increasednutrient and pollutant discharge form urban and agriculturaldevelopment are well known to drastically reduce the water qual-ity required so that coral reef can thrive (Bellwood et al., 2004;Fabricius, 2005). The land-based anthropogenic inductions maythus explain why the fringing part depicted in Moorea’s his-toscape (1100–1300 m in Figure 8D) reveals lower NDCRI values,corresponding to Red calcareous algae and Bleached coral.
The histoscape tends to exemplify the probability density func-tion of the NDCRI values in respect to the reef crest-coastlinedistance. The spatial gradient selected results from the decisionprocess aimed at finding patterns that better suit the dynam-ics of coral reef ecosystems tied to islands (high and low), i.e.,a centripetal growth starting from the surrounding reef crest
Frontiers in Marine Science | Marine Ecosystem Ecology November 2014 | Volume 1 | Article 65 | 12
Collin et al. Coral reef regime continuous mapping
pseudo-circle. Rather than investigating the coral reef area ofan island monolithically, the histoscape may be insightful whenapplied to a set of areas segmented in respect to the spatial ecol-ogy. For instance, an East-West partition would be advocatedto meet the explicative scale of NDCRI changes in response tothe yearly-dominant Eastern winds and driven swell. In addi-tion, to aid in addressing long-term issues, the histoscape mayalso finely diagnose mid- and short-term variations followinganthropogenic and cyclone perturbations.
IMPLICATIONS FOR CORAL REEF RESILIENCEEven though this study focuses on a single mapping of coralreef regime, precluding any considerations of stressors or tem-poral analyses, the NDCRI histoscape may bridge the empiricalcharacterization of coral reef ecosystems and some theoreticalaspects of the ecological resilience (Holling, 1973). The depth ofa histoscape basin is very amenable to correlate with the magni-tude of disturbance that a habitat can absorb while conservingits intrinsic topology. Defining the complexity of a geometricalfigure, a comprehensive topology would require supplementaryparameters such as the length and width of the surface of abasin, which can intuitively be associated with the area of the(1) dominance occupied by a habitat and (2) influence exertedby a habitat toward its neighborhood. The influence of a habi-tat stops at the edge of the basin (threshold), beyond it anotherhabitat predominates. The depth, length and width of a histoscapebasin obviously remind the Resistance and Latitude terms forgedwith the stability landscape (Walker et al., 2004). Since the his-toscape represents the empirical basins of habitat across a spatialgradient, it does not have to be confounded with the stabilitylandscape in which a single ecosystem is a point defined by tridi-mensional coordinates into a state space diagram constituting ofputative basins of attraction (Walker et al., 2004). However, bothlandscapes can assist in weaving trends of the foreseeable dynam-ics. The histoscape, as regime or identity landscape, provides theactual habitat (basin) most likely to influence a concentric stripsummarizing an evenly-habitated distribution (plain). The sta-bility landscape indicates the position of the ecosystem withinits basin of attraction bottomed by the equilibrium state (theattractor), thus influencing the ecosystem’s trajectory. As a con-cise snapshot of the ecosystem’s regime, the histoscape is stronglysubject to changes due to external forces (e.g., runoff) and inter-nal processes (e.g., coral succession, predator-prey cycles), suchas changes in the number and topology of the basins. Thedecrease in the number of basins may be caused by a basin sprawl(increased surface area of a habitat) to the detriment of neigh-bors and explained by a linear growth followed by a non-linearphenomenon of coalescence, i.e., process by which two or morebasins rapidly merge during contact to form a single daughterbasin. In addition to taking the length and width of a basin intoaccount, the topology will incorporate in further studies the over-all and inherent structural complexity and diversity, such as therugosity and the entropy of morphometric features, respectively,since these readily interrelate with the degree of self-organizationthat an ecosystem and nested habitats can demonstrate. Fromthe glimpse of the dynamical aspect, we point out upfront thatTetiaroa, typified by multiple shallow basins, is more conducive
to exhibit ongoing adaptations to perturbations, comparatively toMoorea, characterized by a single deep channel. The parametersretrieved from the histoscape, such as depth, intrinsic topologyand the overall complexity and diversity respectively suit withthe three components of the definition of resilience commonlyadmitted (Carpenter et al., 2001): (1) the amount of distur-bance that a system can absorb while still remaining withinthe same identity, (2) the degree to which the system is capa-ble of self-organization, and (3) the degree to which the systemcan build and increase its capacity for adaptation and learn-ing. Although learning is not explicitly documented here, somestudies have revealed that corals that have experienced bleach-ing episodes may become thermally tolerant through adaptedsymbionts, suggesting an acclimation rather than genetic adap-tation (Hoegh-Guldberg et al., 2002; Rowan, 2004). Importantly,the scale, as critical issues for understanding pattern-processinteractions (Levin, 1992; Levin and Lubchenco, 2008), may bepartly examined through the histoscape. Offering the possibilityto modulate both the spatial (nested basins) and the diagnos-tic (habitat and super habitat) scale, the histoscape can tangiblyinvestigate the scaling relationships of the NDCRI. The resilienceof coral reefs can be acutely augmented in scaling up the organiza-tional level, that is to say in encapsulating the sociological aspectinto the system at stake. By networking coral reefs through multi-scale marine protected areas and stimulating ecological memory(Nystrom and Folke, 2001) through human incentives, scales ofhuman demands and ecological supplies (Cumming, 2011) willbe matched. The implementation of our easy-to-interpret spec-tral proxies of coral reef regime into decision-making processhas the potential to reinforce positive feedback loops essentialfor growing a resilient coral reefscape coping with inevitablestochasticity.
ACKNOWLEDGMENTSThis study is part of the CREM (Coral Reefscape Ecology andMapping) project, funded by the Marie Curie FP7-PEOPLE-2010-RG. The first author gratefully acknowledges the FrenchAgency of Marine Protected Areas and the University of Quebecin Rimouski for the purchase of Moorea’s imagery and theuse of the handborne spectroradiometer, respectively. Ground-based hyperspectral measurements have been achieved with theCRIOBE’s support, which has developed the coral nursery jointlywith the Total Foundation for the Biodiversity, Te Mana o teMoana association and Moorea Intercontinental Resort. We areindebted to CRIOBE staff for collecting 897 georeferenced pho-tographs and water depths.
REFERENCESAMAP Expert Group. (2011). Climate Change and POPS: Predicting the Impacts,
Arctic Monitoring and Assessment Programme. Oslo: Report of the UNEP/AMAPExpert Group.
Austin, M. P. (2002). Spatial prediction of species distribution: an interface betweenecological theory and statistical modelling. Ecol. Model. 157, 101–118. doi:10.1016/S0304-3800(02)00205-3
Austin, M. P. (2007). Species distribution models and ecological theory: a criti-cal assessment and some possible new approaches. Ecol. Modell. 200, 1–19. doi:10.1016/j.ecolmodel.2006.07.005
Bellwood, D. R., Hughes, T. P., Folke, C., and Nyström, M. (2004). Confronting thecoral reef crisis. Nature 429, 827–833. doi: 10.1038/nature02691
www.frontiersin.org November 2014 | Volume 1 | Article 65 | 13
Collin et al. Coral reef regime continuous mapping
Borja, A., Franco, J., and Pérez, V. (2000). A marine biotic index to establishthe ecological quality of soft-bottom benthos within European estuarine andcoastal environments. Mar. Pollut. Bull. 40, 1100–1114. doi: 10.1016/S0025-326X(00)00061-8
Carpenter, S. R., Walker, M., Anderies, J. M., and Abel, N. (2001). From metaphorto measurement: resilience of what to what? Ecosystems 4, 765–781. doi:10.1007/s10021-001-0045-9
Chen, M., Schliep, M., Willows, Z. R., Cai, D.-L., Neilan, B. A., and Scheer, H.(2010). A red-shifted chlorophyll. Science 329, 1318–1319. doi: 10.1126/sci-ence.1191127
Collin, A., Archambault, P., and Planes, S. (2013). Bridging ridge-to-reef patches:seamless classification of the coast using very high resolution satellite. RemoteSens. 5, 3583–3610. doi: 10.3390/rs5073583
Collin, A., and Hench, J. (2012). Towards deeper measurements of tropical reef-scape structure using the worldview-2 spaceborne sensor. Remote Sens. 4,1425–1447. doi: 10.3390/rs4051425
Collin, A., Long, B., and Archambault, P. (2008). Mapping the shallow water seabedhabitat with the SHOALS. IEEE Trans. Geosci. Remote Sens. 46, 2947–2955. doi:10.1109/TGRS.2008.920020
Collin, A., and Planes, S. (2011). “What is the value added of 4 bands within thesubmetric remote sensing of tropical coastscape? Quickbird-2 vs WorldView-2,”in Proceedings of the 31st IGARSS (Vancouver, BC).
Collin, A., and Planes, S. (2012). Enhancing coral health detection using spectraldiversity indices from worldview-2 imagery and machine learners. Remote Sens.4, 3244–3264. doi: 10.3390/rs4103244
Congalton, R., and Green, K. (1999). “Basic analysis techniques,” in Assessing theAccuracy of Remotely Sensed Data: Principles and Practices, Chapter 5, eds R.Congalton and K. Green (Boca Raton, FL: CRC Press).
Cumming, G. S. (2011). Spatial resilience: integrating landscape ecology, resilience,and sustainability. Landsc. Ecol. 26, 899–909. doi: 10.1007/s10980-011-9623-1
De’ath, G., Fabricius, K. E., Sweatman, H., and Puotinen, M. (2012). The 27-yeardecline of coral cover on the GreatBarrier Reef and its causes. Proc. Natl. Acad.Sci. U.S.A. 109, 17995–17999. doi: 10.1073/pnas.1208909109
Emanuel, K. (2005). Increasing destructiveness of tropical cyclones over the past30-years. Nature 436, 686–688. doi: 10.1038/nature03906
Fabricius, K. (2005). Effects of terrestrial runoff on the ecology of coralsand coral reefs: review and synthesis. Mar. Pollut. Bull. 50, 125–146. doi:10.1016/j.marpolbul.2004.11.028
Folke, C. (2006). Resilience: the emergence of aperspective for social-ecological system analyses. Glob. Environ. Change 16, 253–267. doi:10.1016/j.gloenvcha.2006.04.002
Forman, R. T. T. (1995). Land Mosaics: the Ecology of Landscapes and Regions.Cambridge: Cambridge University Press.
Gotelli, N. J., and Colwell, R. K. (2001). Quantifying biodiversity: procedures andpitfalls in the measurement and comparison of species richness. Ecol. Lett. 4,379–391. doi: 10.1046/j.1461-0248.2001.00230.x
Harborne, A. R., Mumby, P. J., Kappel, C. V., Dahlgren, C. P., Micheli, F., Holmes,K. E., et al. (2008). Tropical coastal habitats as surrogates of fish commu-nity structure, grazing, and fisheries value. Ecol. Appl. 18, 1689–1701. doi:10.1890/07-0454.1
Harborne, A. R., Mumby, P. J., Zychaluk, K., Hedley, J. D., and Blackwell, P. G.(2006). Modeling the beta diversity of coral reefs. Ecology 87, 2871–2881. doi:10.1890/0012-9658(2006)87[2871:MTBDOC]2.0.CO;2
Hastings, A., and Wysham, D. B. (2010). Regime shifts in ecological systemscan occur with no warning. Ecol. Lett. 13, 464–472. doi: 10.1111/j.1461-0248.2010.01439.x
Hochberg, E. J., Atkinson, M. J., and Andréfouët, S. (2003). Spectral reflectanceof coral reef bottom-types worldwide and implications for coral reef remotesensing. Remote Sens. Environ. 85, 159–173. doi: 10.1016/S0034-4257(02)00201-8
Hoegh-Guldberg, O., Jones, R. J., Ward, S., and Loh, W. K. (2002). Communicationarising. Is coral bleaching really adaptive? Nature 415, 601–602. doi:10.1038/415601a
Hoegh-Guldberg, O., Mumby, P. J., Hooten, A. J., Steneck, R. S., Greenfield,P., Gomez, E., et al. (2007). Coral reefs under rapid climate changeand ocean acidification. Science 318, 1737–1742. doi: 10.1126/science.1152509
Holling, C. S. (1973). Resilience and stability of ecological systems. Annu. Rev. Ecol.Syst. 4, 1–23. doi: 10.1146/annurev.es.04.110173.000245
Holling, C. S. (2001). Understanding the complexity of economic, ecological, andsocial systems. Ecosystems 4, 390–405. doi: 10.1007/s10021-001-0101-5
Hughes, T. P., Graham, N. A. J., Jackson, J. B. C., Mumby, P. J., and Steneck, R. S.(2010). Rising to the challenge of sustaining coral reef resilience. Trends Ecol.Evol. 25, 633–642. doi: 10.1016/j.tree.2010.07.011
Ives, A. R., and Dakos, V. (2012). Detecting dynamical changes in nonlinear timeseries using locally linear state-space models. Ecosphere 3, 58. doi: 10.1890/ES11-00347.1
Koning, R. E. (1994). Light. Plant Physiology Information Website.Available online at: http://plantphys.info/plant_physiology/phytochrome.shtml(Accessed August 11, 2012).
Leiper, I. A., Siebeck, U. E., Marshall, N. J., and Phinn, S. R. (2009). Coral healthmonitoring: linking coral colour and remote sensing techniques. Can. J. RemoteSens. 35, 276–286. doi: 10.5589/m09-016
Leon, J. X., Phinn, S. R., Hamylton, S., and Saunders, M. I. (2012). Filling the‘white ribbon’ - a seamless multisource digital elevation/depth model for LizardIsland, northern Great Barrier Reef. Int. J. Remote Sens. 34, 6337–6354. doi:10.1080/01431161.2013.800659
Levin, S. A. (1992). The problem of pattern and scale in ecology. Ecology 73,1943–1967. doi: 10.2307/1941447
Levin, S. A., and Lubchenco, J. (2008). Resilience, robustness, and marineecosystem-based management. Bioscience 58, 1–6. doi: 10.1641/B580107
Maritorena, S., Morel, A., and Gentili, B. (1994). Diffuse reflectance of oceanic shal-low waters: influence of water depth and bottom albedo. Limnol. Oceanogr. 39,1689–1703. doi: 10.4319/lo.1994.39.7.1689
Matthew, M. W., Adler-Golden, S. M., Berk, A., Richtsmeier, S. C., Levine,R. Y., Bernstein, L. S., et al. (2000). Status of atmospheric correctionusing a MODTRAN4-based algorithm. SPIE Proc. 4049, 199–207. doi:10.1117/12.410341
May, R. M. (2001). Stability and Complexity in Model Ecosystems. Princeton, NJ:Princeton University Press.
Mellin, C., Andréfouët, S., Kulbicki, M., Dalleau, M., and Vigliola, L. (2009).Remote sensing and fish–habitat relationships in coral reef ecosystems: reviewand pathways for systematic multi-scale hierarchical research. Mar. Pollut. Bull.58, 11–19. doi: 10.1016/j.marpolbul.2008.10.010
Mobley, C. D., Sundman, L. K., and Boss, E. (2002). Phase function effects onoceanic light fields. Appl. Opt. 41, 1035–1050. doi: 10.1364/AO.41.001035
Myers, N., Mittermeier, R. A., Mittermeier, C., Da Fonseca, G. A. B., and Kent, J.(2000). Biodiversity hotspots for conservation priorities. Nature 403, 853–858.doi: 10.1038/35002501
Myneni, R. B., Keeling, C. D., Tucker, C. J., Asrar, G., and Nemani, R. R. (1997).Increased plant growth in the northern high latitudes from 1981 to 1991. Nature386, 698–702. doi: 10.1038/386698a0
Nystrom, M., and Folke, C. (2001). Spatial resilience of coral reefs. Ecosystems 4,406–417 doi: 10.1007/s10021-001-0019-y
Pegau, S., Zaneveld, J. R. V., Mitchell, B. G., Mueller, J. L., Kahru, M., Wieland,J., et al. (2003). Inherent Optical Properties: Instruments, Characterizations, FieldMeasurements and Data Analysis Protocols. Ocean Optics Protocols for SatelliteOcean Color Sensor Validation. NASA Tech Memo, 211621.
Pettorelli, N., Vik, J. O., Mysterud, A., Gaillard, J.-M., Tucker, C. J., andStenseth, N. C. (2005). Using the satellite-derived NDVI to assess ecologi-cal responses to environmental change. Trends Ecol. Evol. 20, 503–510. doi:10.1016/j.tree.2005.05.011
Piao, S., Fang, J., Ciais, P., Peylin, P., Huang, Y., Sitch, S., et al. (2009). The car-bon balance of terrestrial ecosystems in China. Nature 458, 1009–1013. doi:10.1038/nature07944
Roff, G., and Mumby, P. J. (2012). Global disparity in the resilience of coral reefs.Trends Ecol. Evol. 27, 404–413. doi: 10.1016/j.tree.2012.04.007
Rooney, T. P., Wiegmann, S. M., Rogers, D. A., and Waller, D. M. (2004). Bioticimpoverishment and homogenization in unfragmented forest understory com-munities. Conserv. Biol. 18, 787–798. doi: 10.1111/j.1523-1739.2004.00515.x
Rowan, R. (2004). Coral bleaching: thermal adaptation in reef coral symbionts.Nature 430, 742. doi: 10.1038/430742a
Rowlands, G., Purkis, P., Riegl, B., Bruckner, B., and Renaud, P. (2012). Satelliteimaging coral reef resilience at regional scale. Mar. Pollut. Bull. 64, 1222–1237.doi: 10.1016/j.marpolbul.2012.03.003
Smith, J. (2012). “Baselines and degradation of central Pacific benthic reef commu-nities,” in Proceedings of the 12th International Coral Reef Symposium (Cairns,QLD).
Frontiers in Marine Science | Marine Ecosystem Ecology November 2014 | Volume 1 | Article 65 | 14
Collin et al. Coral reef regime continuous mapping
Smith, R. C., and Baker, K. S. (1981). Optical properties of the clearest naturalwa-ters (200-800nm). Appl. Opt. 20, 177–184. doi: 10.1364/AO.20.000177
Stumpf, R. P., Holderied, K., and Sinclair, M. (2003). Determination of waterdepth with high-resolution satellite imagery over variable bottom types. Limnol.Oceanogr. 48, 547–556. doi: 10.4319/lo.2003.48.1_part_2.0547
Sturm, M. (2010). Arctic plants feel the heat. Sci. Am. 302, 48–55. doi:10.1038/scientificamerican0510-66
Tucker, C. J. (1979). Red and photographic infrared linear combinations formonitoring vegetation. Remote Sens. Environ. 8, 127–150. doi: 10.1016/0034-4257(79)90013-0
Turner, M. G., Gardner, R. H., and O’Neill, R. V. (2001). Landscape Ecology inTheory and Practice. New-York, NY: Springer-Verlage.
Walker, B., Holling, C. S., Carpenter, S. R., and Kinzig, A. (2004). Resilience, adapt-ability and transformability in social–ecological systems. Ecol. Soc. 9:5. Availableonline at: http://www.ecologyandsociety.org/vol9/iss2/art5/
White, S. N., Chave, A. D., and Reynolds, G. T. (2002). Investigations of ambi-ent light emission at deep-sea hydrothermal vents. J. Geophys. Res. 107, B1. doi:10.1029/2000JB000015
Wilkinson, C. (2008). Status of Coral Reefs of the World: 2008. Townsville, QLD:Global Coral Reef Monitoring Network and Reef and Rainforest ResearchCentre.
Zhao, M., and Running, S. W. (2010). Drought-induced reduction in globalterrestrial net primary production from 2000 through 2009. Science 329,940–943. doi: 10.1126/science.1192666
Conflict of Interest Statement: The authors declare that the research was con-ducted in the absence of any commercial or financial relationships that could beconstrued as a potential conflict of interest.
Received: 13 May 2014; accepted: 05 November 2014; published online: 21 November2014.Citation: Collin A, Archambault P and Planes S (2014) Revealing the regime of shallowcoral reefs at patch scale by continuous spatial modeling. Front. Mar. Sci. 1:65. doi:10.3389/fmars.2014.00065This article was submitted to Marine Ecosystem Ecology, a section of the journalFrontiers in Marine Science.Copyright © 2014 Collin, Archambault and Planes. This is an open-access articledistributed under the terms of the Creative Commons Attribution License (CC BY).The use, distribution or reproduction in other forums is permitted, provided theoriginal author(s) or licensor are credited and that the original publication in thisjournal is cited, in accordance with accepted academic practice. No use, distribution orreproduction is permitted which does not comply with these terms.
www.frontiersin.org November 2014 | Volume 1 | Article 65 | 15
Related Documents


![Coral Microbial Ecology - USGSMicrobial Ecology of Deep-Sea Corals [Christina Kellogg] Most people are familiar with tropical coral reefs, located in warm, shallow waters. However,](https://static.cupdf.com/doc/110x72/60710c32309eab6c47176885/coral-microbial-ecology-usgs-microbial-ecology-of-deep-sea-corals-christina-kellogg.jpg)