1120 IEEE TRANSACTIONS ON BIOMEDICAL ENGINEERING, VOL. 58, NO. 4, APRIL 2011 Revealing Action Representation Processes in Audio Perception Using Fractal EEG Analysis Stelios K. Hadjidimitriou, Student Member, IEEE, Asteris I. Zacharakis, Panagiotis C. Doulgeris, Student Member, IEEE, Konstantinos J. Panoulas, Student Member, IEEE, Leontios J. Hadjileontiadis*, Senior Member, IEEE, and Stavros M. Panas, Member, IEEE Abstract—Electroencephalogram (EEG) recordings, and espe- cially the Mu-rhythm over the sensorimotor cortex that relates to the activation of the mirror neuron system (MNS), were acquired from two subject groups (orchestral musicians and nonmusicians), in order to explore action representation processes involved in the perception and performance of musical pieces. Two types of stim- uli were used, i.e., an auditory one consisting of an excerpt of Beethoven’s fifth symphony and a visual one presenting a con- ductor directing an orchestra performing the same excerpt of the piece. Three tasks were conducted including auditory stimulation, audiovisual stimulation, and visual stimulation only, and the ac- quired signals were processed using fractal [time-dependent frac- tal dimension (FD) estimation] and statistical analysis (analysis of variance, Mann-Whitney). Experimental results showed signif- icant differences between the two groups while desychronization of the Mu-rhythm, which can be linked to MNS activation, was observed during all tasks for the musicians’ group, as opposed to the nonmusicians’ group who exhibited similar response only when the visual stimulus was present. The mobility of the conductor was also correlated to the estimated FD signals, showing significantly higher correlation for the case of musicians compared to nonmu- sicians’ one. The present study sheds light upon the difference in action representation in auditory perception between musicians and nonmusicians and paves the way for better comprehension of the underlying mechanisms of the MNS. Index Terms—EEG, fractal dimension, motion, music. I. INTRODUCTION I T IS a common belief that music and motion constitute two strongly related notions. Numerous examples, derived from musical experience and performance, reveal processes of “trans- lating” music into motion and vice versa. A fine paradigm to Manuscript received December 24, 2009; revised February 23, 2010; ac- cepted March 18, 2010. Date of publication April 12, 2010; date of current version March 18, 2011. Asterisk indicates corresponding author. S. K. Hadjidimitriou, K. J. Panoulas, and S. M. Panas are with the Depart- ment of Electrical and Computer Engineering, Aristotle University of Thes- saloniki, Thessaloniki GR-54124, Greece (e-mail: [email protected]; [email protected]; [email protected]). A. I. Zacharakis is with the Centre for Digital Music, Department of Elec- tronic Engineering, Queen Mary University of London, London, E14NS, U.K. (e-mail: [email protected]). P. C. Doulgeris is with the Applied Geophysics and Petrophysics Section, Department of Geotechnology, Faculty of Civil Engineering and Geosciences, Technical University of Delft, Delft 2628CN, The Netherlands (e-mail: [email protected]). *L. J. Hadjileontiadis is with the Department of Electrical and Computer Engi- neering, Aristotle University of Thessaloniki, Thessaloniki GR-54124, Greece, and also with the State Conservatory of Thessaloniki, Thessaloniki GR-54625, Greece (e-mail: [email protected]). Digital Object Identifier 10.1109/TBME.2010.2047016 Fig. 1. (a) Hand trajectories that allow a musical conductor to convey elements of musical expression. (b) Areas of the human brain (the premotor cortex and the inferior parietal lobule) where mirror neuron activity has been observed [1]. describe a “motion-to-music” matching process is that of a con- ductor of a musical ensemble. Conducting is the act of directing a musical performance by way of visible gestures. The musi- cal director has the ability to communicate basic elements of musical expression, like tempo, dynamics, and articulation, by alternating the shape, size, or intensity of his hands’ move- ments [see Fig. 1(a)]. Musicians modulate their performance by perceiving the expressive elements conveyed by the related conducting gestures and thus producing the appropriate acoustic result. The inverse procedure of action representations induced during the passive listening of their associated musical features of expression is also plausible, as the trained musical brain bears mechanisms that are responsible for action recognition processes, such as the mirror neuron system (MNS). 0018-9294/$26.00 © 2011 IEEE

Welcome message from author
This document is posted to help you gain knowledge. Please leave a comment to let me know what you think about it! Share it to your friends and learn new things together.
Transcript
1120 IEEE TRANSACTIONS ON BIOMEDICAL ENGINEERING, VOL. 58, NO. 4, APRIL 2011
Revealing Action Representation Processes inAudio Perception Using Fractal EEG Analysis
Stelios K. Hadjidimitriou, Student Member, IEEE, Asteris I. Zacharakis,Panagiotis C. Doulgeris, Student Member, IEEE, Konstantinos J. Panoulas, Student Member, IEEE,
Leontios J. Hadjileontiadis*, Senior Member, IEEE, and Stavros M. Panas, Member, IEEE
Abstract—Electroencephalogram (EEG) recordings, and espe-cially the Mu-rhythm over the sensorimotor cortex that relates tothe activation of the mirror neuron system (MNS), were acquiredfrom two subject groups (orchestral musicians and nonmusicians),in order to explore action representation processes involved in theperception and performance of musical pieces. Two types of stim-uli were used, i.e., an auditory one consisting of an excerpt ofBeethoven’s fifth symphony and a visual one presenting a con-ductor directing an orchestra performing the same excerpt of thepiece. Three tasks were conducted including auditory stimulation,audiovisual stimulation, and visual stimulation only, and the ac-quired signals were processed using fractal [time-dependent frac-tal dimension (FD) estimation] and statistical analysis (analysisof variance, Mann-Whitney). Experimental results showed signif-icant differences between the two groups while desychronizationof the Mu-rhythm, which can be linked to MNS activation, wasobserved during all tasks for the musicians’ group, as opposed tothe nonmusicians’ group who exhibited similar response only whenthe visual stimulus was present. The mobility of the conductor wasalso correlated to the estimated FD signals, showing significantlyhigher correlation for the case of musicians compared to nonmu-sicians’ one. The present study sheds light upon the difference inaction representation in auditory perception between musiciansand nonmusicians and paves the way for better comprehension ofthe underlying mechanisms of the MNS.
Index Terms—EEG, fractal dimension, motion, music.
I. INTRODUCTION
I T IS a common belief that music and motion constitute twostrongly related notions. Numerous examples, derived from
musical experience and performance, reveal processes of “trans-lating” music into motion and vice versa. A fine paradigm to
Manuscript received December 24, 2009; revised February 23, 2010; ac-cepted March 18, 2010. Date of publication April 12, 2010; date of currentversion March 18, 2011. Asterisk indicates corresponding author.
S. K. Hadjidimitriou, K. J. Panoulas, and S. M. Panas are with the Depart-ment of Electrical and Computer Engineering, Aristotle University of Thes-saloniki, Thessaloniki GR-54124, Greece (e-mail: [email protected];[email protected]; [email protected]).
A. I. Zacharakis is with the Centre for Digital Music, Department of Elec-tronic Engineering, Queen Mary University of London, London, E14NS, U.K.(e-mail: [email protected]).
P. C. Doulgeris is with the Applied Geophysics and PetrophysicsSection, Department of Geotechnology, Faculty of Civil Engineering andGeosciences, Technical University of Delft, Delft 2628CN, The Netherlands(e-mail: [email protected]).
*L. J. Hadjileontiadis is with the Department of Electrical and Computer Engi-neering, Aristotle University of Thessaloniki, Thessaloniki GR-54124, Greece,and also with the State Conservatory of Thessaloniki, Thessaloniki GR-54625,Greece (e-mail: [email protected]).
Digital Object Identifier 10.1109/TBME.2010.2047016
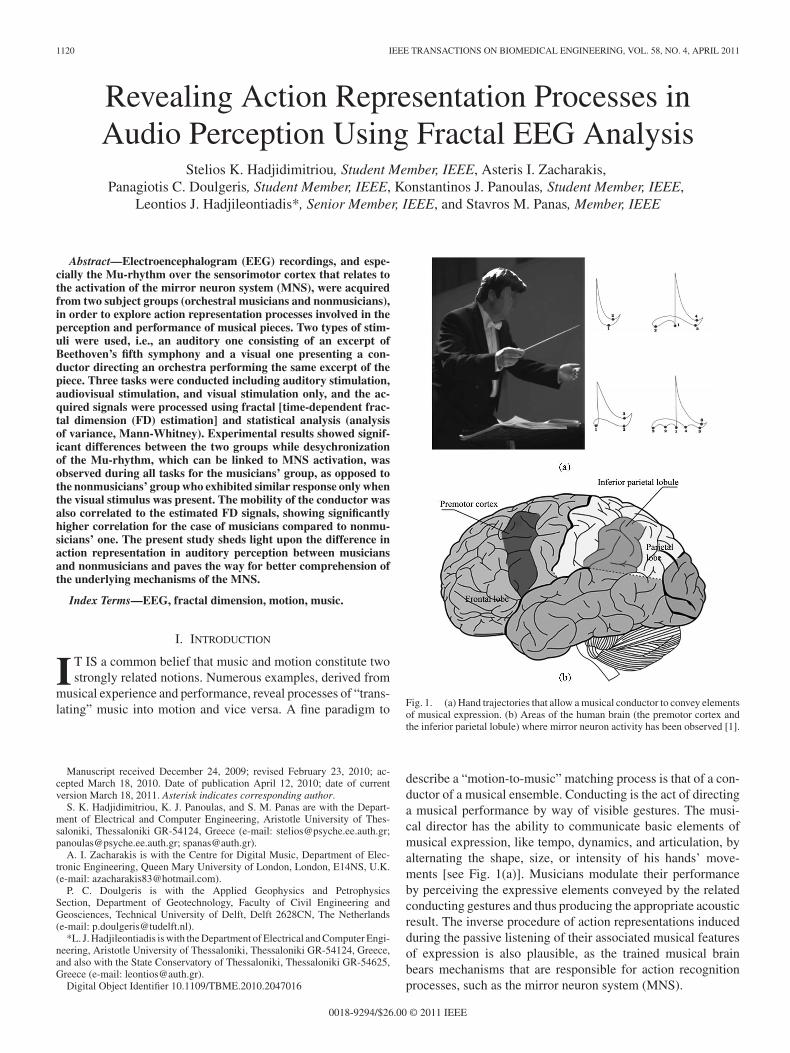
Fig. 1. (a) Hand trajectories that allow a musical conductor to convey elementsof musical expression. (b) Areas of the human brain (the premotor cortex andthe inferior parietal lobule) where mirror neuron activity has been observed [1].
describe a “motion-to-music” matching process is that of a con-ductor of a musical ensemble. Conducting is the act of directinga musical performance by way of visible gestures. The musi-cal director has the ability to communicate basic elements ofmusical expression, like tempo, dynamics, and articulation, byalternating the shape, size, or intensity of his hands’ move-ments [see Fig. 1(a)]. Musicians modulate their performanceby perceiving the expressive elements conveyed by the relatedconducting gestures and thus producing the appropriate acousticresult. The inverse procedure of action representations inducedduring the passive listening of their associated musical featuresof expression is also plausible, as the trained musical brainbears mechanisms that are responsible for action recognitionprocesses, such as the mirror neuron system (MNS).
0018-9294/$26.00 © 2011 IEEE
HADJIDIMITRIOU et al.: REVEALING ACTION REPRESENTATION PROCESSES IN AUDIO PERCEPTION USING FRACTAL EEG ANALYSIS 1121
The MNS is located in the premotor cortex and the inferiorparietal lobule of the human brain [see Fig. 1(b)] [1]. It wasfirst discovered in macaque monkeys, and it was proposed as aneural mechanism for matching executed actions with observedactions, retrieved during cognitive functions like imitation, theunderstanding of intentions and empathy [2]. Especially, the au-ditory MNS is responsible for action representation processesinduced by their associated sounds [3]. These neurons hold anabstract representation of heard actions assisting the individualto attribute meaning to them [4]. Thus, it is becoming evidentthat the implication of the MNS in musical performance andperception, where sound and action meet in order to produce anartistic result, is crucial. Audiovisual MNS activity in humansis not only limited to sounds of primitive biological significanceas referred in the aforementioned studies, but they also respondto more sophisticated audio stimuli, like speech [5]. A commu-nicative gesture made by a sender retrieves in the receiver theneural circuit encoding the motor representation of the samegesture, thus enabling the receiver to understand the gesture ormessage of the sender [6]. Evidently, it has been proposed thatlanguage evolved through a process of associating limb and fa-cial gestures to vocalizations, mediated by the MNS [7]. Signlanguage perception and performance can also be interpreted tosome extent within the context of the MNS [8], [9].
Several studies focusing on audiomotor processes during mu-sic perception and performance point to the crucial implica-tion of sensorimotor areas of the human brain, including thosewhere MNS activity has been observed. Certain works based onfunctional MRI (fMRI) analysis revealed shared networks forauditory and motor processing, including the premotor cortex(MNS) and Broca’s area [10], [11]. Furthermore, the activationof a fronto-parietal network comprising the premotor areas wasevaluated by an fMRI-based study involving music performanceand music imagery tasks [12]. Additionally, reviews of relatedworks also support the idea that motor-related brain areas playa major role in music perception and performance [13], [14].Moreover, another review postulates that auditory features thatare primarily processed in the auditory cortex are combinedwith motion information conveyed by the musical signal in theposterior inferior frontal gyrus and adjacent premotor cortex inorder to integrate the musical experience [15].
In this paper, the recruitment of sensorimotor areas of thehuman brain during the perception of sophisticated auditorystimuli is investigated, using musical and action related tasks.At first, the response of the sensorimotor cortex of trained musi-cians and untrained subjects due to passive listening of orches-tral performance is evaluated, and the hypothesis that this kindof response is caused by MNS activity is examined. Second,the way that the musical excerpt influences the sensorimotorresponse of both trained and untrained subjects during the as-similation of conducting gestures is investigated. At last, thecondition including the conducting performance without thepresence of auditory stimulation is examined as a control state.Brain activity was monitored using EEG recordings and focuswas placed upon Mu-rhythm fluctuations. Mu-rhythm is alpharange activity (8–13 Hz) that is seen over the sensorimotorcortex. Modulation of the rhythm, provoked by the desychro-
nization of the related cell assemblies, reflects audiomotor andvisuomotor processes [16], [17], and it has been linked to MNSactivation [18]–[21].
The EEG data were processed using fractal dimension (FD)estimation methods and statistical analysis. Fractal analysis em-beds nonlinear methods that are frequently used in biomedicalsignal processing and especially the EEG in order to measurethe complexity of the behavior of the human brain [22]. Itsimplementation in the present paper along with original music-related tasks leads to a novel study of the dynamic responseof the sensorimotor cortex through EEG processing. Addition-ally, in an effort to examine the effect of the motion previewedin the conductor’s video to the subjects’ EEG response, as re-flected through the FD analysis, a video-based mobility signalwas constructed and correlated to the estimated EEG-based FDsignal.
II. MATERIALS AND METHODS
A. Subjects
Twenty healthy subjects participated in the experiment. Theywere divided into two groups, i.e., the musicians’ group, whichconsisted of ten advanced orchestral musicians (OMG: eightmales and two females; age 28.3 ± 5.8 years) and the nonmusi-cians’ group (NMG: seven males and three females; age 27.8 ±6.6 years) that consisted of ten subjects with no musical experi-ence, serving as the control subject group. No statistical differ-ence was detected in age between the two subject groups by theone-way analysis of variance (ANOVA) test [F(1,19) = 0.032,p = 0.859� 0.05)]. Subjects participated in the experiment vol-untarily, after they had given written consent. Their anonymitywas verified and they had the right to leave the recording sessionat any time.
B. Acquisition System and Software
The EEG recordings were conducted using the g.MOBIlab(g.tec medical & electrical engineering, Guger Technologies,Graz, Austria) portable biosignal acquisition system (four EEGbipolar channels; filters: 0.5–30 Hz; sensitivity: 100 μV; dataacquisition: A/D converter with 16-bit resolution and sam-pling frequency of 256 Hz; data transfer: wireless, Bluetooth“Class I” technology, meets IEC 60601-1 for research applica-tion, no medical use). The stimuli were designed using AdobeAudition 2.0 and Adobe Premiere 7.0 (Adobe) and conductedwith Max/Msp 4.5 software (Cycling ‘74) on a PC (Pentium1.73 GHz, RAM 1 GB). In order to precisely synchronize theg.MOBIlab device with the Max/MSP software, an external ob-ject for Max/MSP was created in C++, using the g.MOBIlabAPI. This enabled us to open and close the device, start theacquisition and store the acquired data in text files (.txt) throughMax/MSP. The computer clock was used to estimate the delaybetween the beginning of the experiment and the beginning ofdata acquisition. The delay was smaller than 1 ms and by tak-ing into consideration the sampling frequency of the device itwas regarded as negligible. Real-time visualization of the ac-quired signals was also provided in the Max/MSP environment.
1122 IEEE TRANSACTIONS ON BIOMEDICAL ENGINEERING, VOL. 58, NO. 4, APRIL 2011
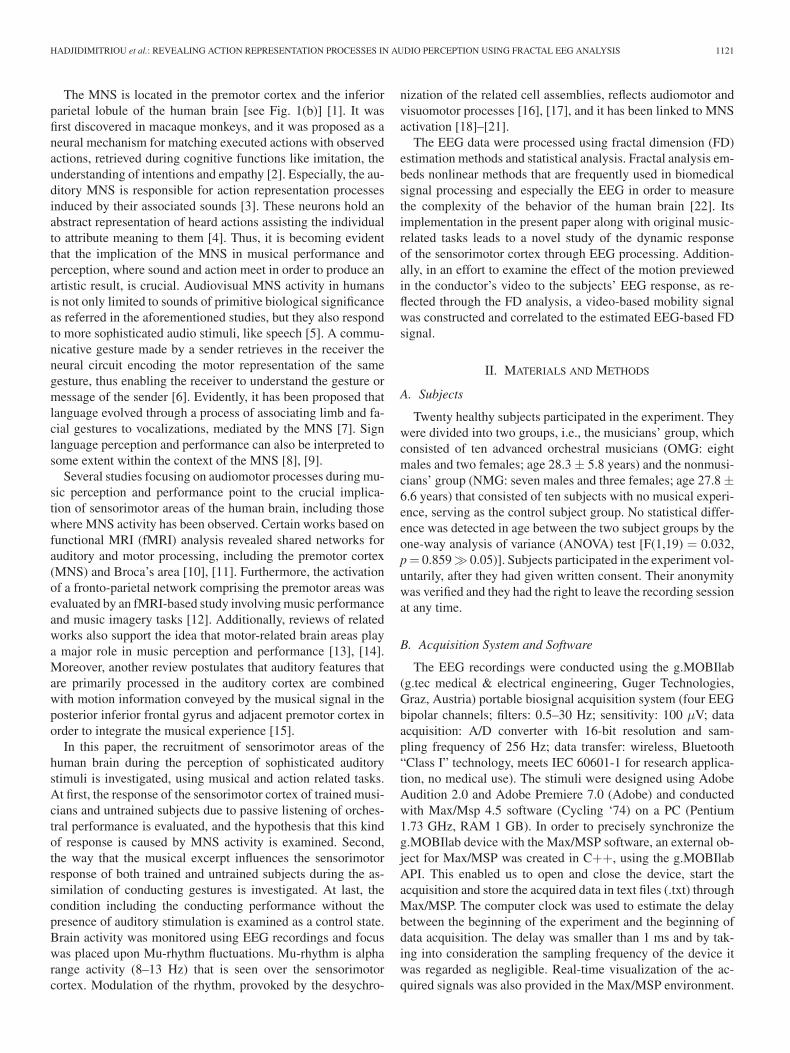
Fig. 2. (a) Designed interface of the experiment. (b) Snapshot of the visualstimulus (Arturo Toscanini conducting).
Fig. 2(a) illustrates the designed interface of the experiment.Data analysis was carried out using Matlab R2008a (The Math-works, Inc., Natick, MA) and SPSS 17.0 (SPSS, Inc., Chicago,IL) for signal processing and statistical analysis, respectively.
C. Experiment Structure
The stimuli consisted of two types, i.e., the auditory and thevisual one. During the auditory part, the subjects were providedwith an excerpt from the famous Beethoven’s fifth symphony.The excerpt consisted of the first 21 bars of the symphony in Cminor, and it was selected as being one of the most recognizablemusic themes, both to OMG and NMG. The visual stimuluscomprised a gray scale video, presenting a conductor, i.e., thefamous Arturo Toscanini, directing a musical orchestra that wasperforming the exact same musical excerpt; Toscanini’s direc-tion was selected due to the intensity and clarity of his gestures[see Fig. 2(b)] depicts a snapshot of the visual stimulus). Fifteentrials per subject were conducted in total, during three experi-mental modes; five trials with auditory stimulus (AS mode) only,five trials with synchronized auditory and visual stimuli (AVSmode) and five trials with visual stimulus only (MUTE mode).The duration of each type of stimuli (auditory/visual) was 21 s;before each trial, a 2-s time interval of relaxation preceded. Themodes were presented in a random order.
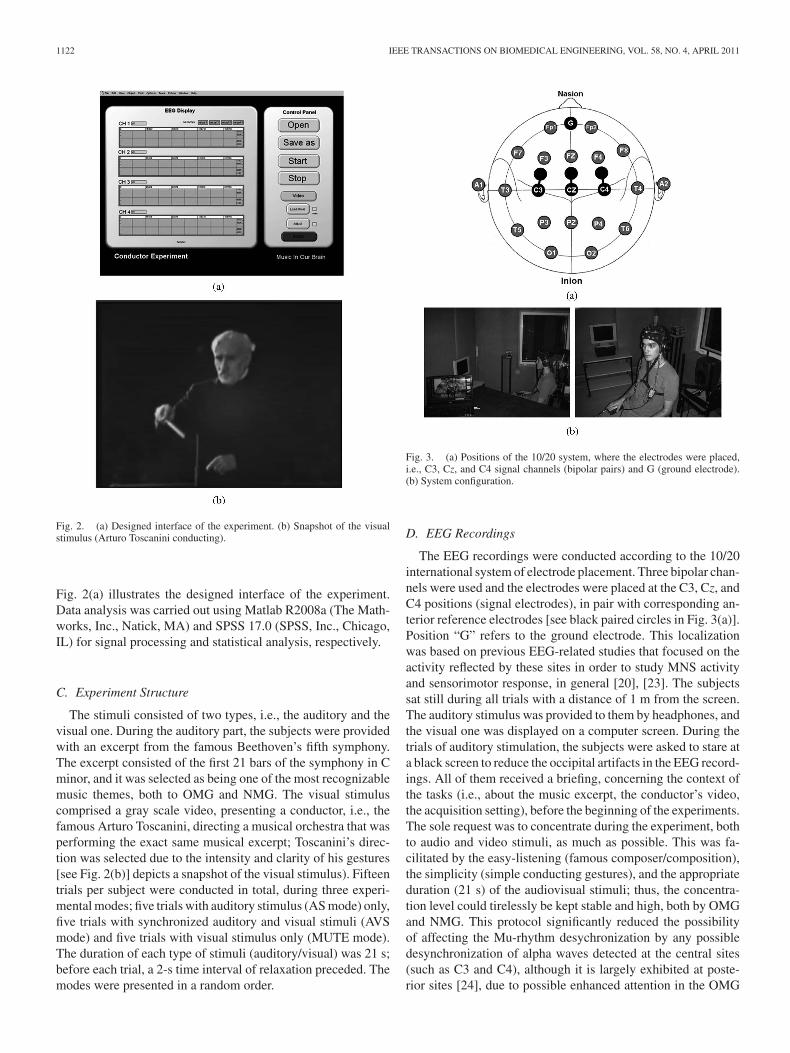
Fig. 3. (a) Positions of the 10/20 system, where the electrodes were placed,i.e., C3, Cz, and C4 signal channels (bipolar pairs) and G (ground electrode).(b) System configuration.
D. EEG Recordings
The EEG recordings were conducted according to the 10/20international system of electrode placement. Three bipolar chan-nels were used and the electrodes were placed at the C3, Cz, andC4 positions (signal electrodes), in pair with corresponding an-terior reference electrodes [see black paired circles in Fig. 3(a)].Position “G” refers to the ground electrode. This localizationwas based on previous EEG-related studies that focused on theactivity reflected by these sites in order to study MNS activityand sensorimotor response, in general [20], [23]. The subjectssat still during all trials with a distance of 1 m from the screen.The auditory stimulus was provided to them by headphones, andthe visual one was displayed on a computer screen. During thetrials of auditory stimulation, the subjects were asked to stare ata black screen to reduce the occipital artifacts in the EEG record-ings. All of them received a briefing, concerning the context ofthe tasks (i.e., about the music excerpt, the conductor’s video,the acquisition setting), before the beginning of the experiments.The sole request was to concentrate during the experiment, bothto audio and video stimuli, as much as possible. This was fa-cilitated by the easy-listening (famous composer/composition),the simplicity (simple conducting gestures), and the appropriateduration (21 s) of the audiovisual stimuli; thus, the concentra-tion level could tirelessly be kept stable and high, both by OMGand NMG. This protocol significantly reduced the possibilityof affecting the Mu-rhythm desychronization by any possibledesynchronization of alpha waves detected at the central sites(such as C3 and C4), although it is largely exhibited at poste-rior sites [24], due to possible enhanced attention in the OMG
HADJIDIMITRIOU et al.: REVEALING ACTION REPRESENTATION PROCESSES IN AUDIO PERCEPTION USING FRACTAL EEG ANALYSIS 1123
compared to the NMG. The recordings were conducted in asoundproof recording studio under low lighting conditions in or-der to avoid external auditory and visual nuisance [see Fig. 3(b)].The acquired EEG signals were subjected to a real-time inspec-tion by the researchers so to check the quality of the EEGrecordings, in terms of the presence of any artifacts (e.g., spikesdue to muscular movements, noise effect due to poor electrodeconductivity); in these rare cases (<4), the trial was repeated.A bandpass filter (Butterworth IIR with zero-phase shift, sixthorder, lower and upper cutoff frequencies of 8 and 13 Hz, re-spectively) was designed in order to isolate the alpha-range andconsequently the Mu-rhythm. The acquired EEG signals forfixed subject, electrode site (C3, Cz, and C4) and experimentalmode (AS, AVS, and MUTE) were synchronized, normalizedto their maximum value and processed using fractal analysis, asdescribed in the subsequent section.
E. FD Estimation
The FD is a feature based on fractal theory that is used toquantify the complexity and the self-similarity of a signal. Theterm refers to a noninteger or fractional dimension of geometricobject. Since the Euclidian dimensions of a plane and a line areequal to 2 and 1, respectively, if we consider a waveform, i.e.,EEG, as a geometric object, it is expected that the FD of thewaveform will always be between 1 and 2. The more the signalline fluctuates, the more the plane appears covered, and thus thegreater fragmentations of the waveform that are present; thenprovided each has self-similarity, the more the FD increases.Fluctuations of the FD of electrophysiological signals allowthe detection of different physiopathological conditions [25].For the present study, the Higuchi method for FD estimationwas applied on the data [26]. Higuchi’s algorithm is one ofthe most common methods of estimating the FD of biomedicalsignals directly in the time domain (considering the time seriesas a geometrical object), and it was selected because of itsestimation accuracy [25], [27], [28]. An epitomized descriptionof Higuchi’s method is given shortly.
From a time sequence of x(1), x(2), . . . , x(N), k new timeseries xk
m are constructed as xkm = {x(m), x(m + k), x(m +
2k), . . . , x(m + �(N − m)/k�k)}, for m = 1, 2, . . . , k, wherem indicates the initial time value, k indicates the discrete timeinterval between points (delay), and �·� denotes the integer part.For each of the curves or time series constructed, the averagelength Lm (k) is computed as
Lm (k) ={(N − 1)
∑�(N −m )/k�i=1 |x(m + ik) − x(m + (i − 1)k)|
�(N − m/k)� k
}1k
(1)
where N is the total length of the data sequence x and(N − 1)/�(N − m)/k� k is a normalization factor. An averagelength is computed for all time series having the same delay (orscale) k, as the mean of the k lengths Lm (k) for m = 1, . . . , k.
This procedure is repeated for each k ranging from 1 to kmax ,yielding a sum of average lengths L(k) for each k, i.e.,
L(k) =1k
k∑m=1
Lm (k). (2)
The total average length for scale k, L(k), is proportionalto k−D , where D is the FD. In the curve of ln(L(k)) versusln (1/k), the slope of the least squares linear best fit providesHiguchi’s FD estimate.
F. Realization and Statistical Analysis
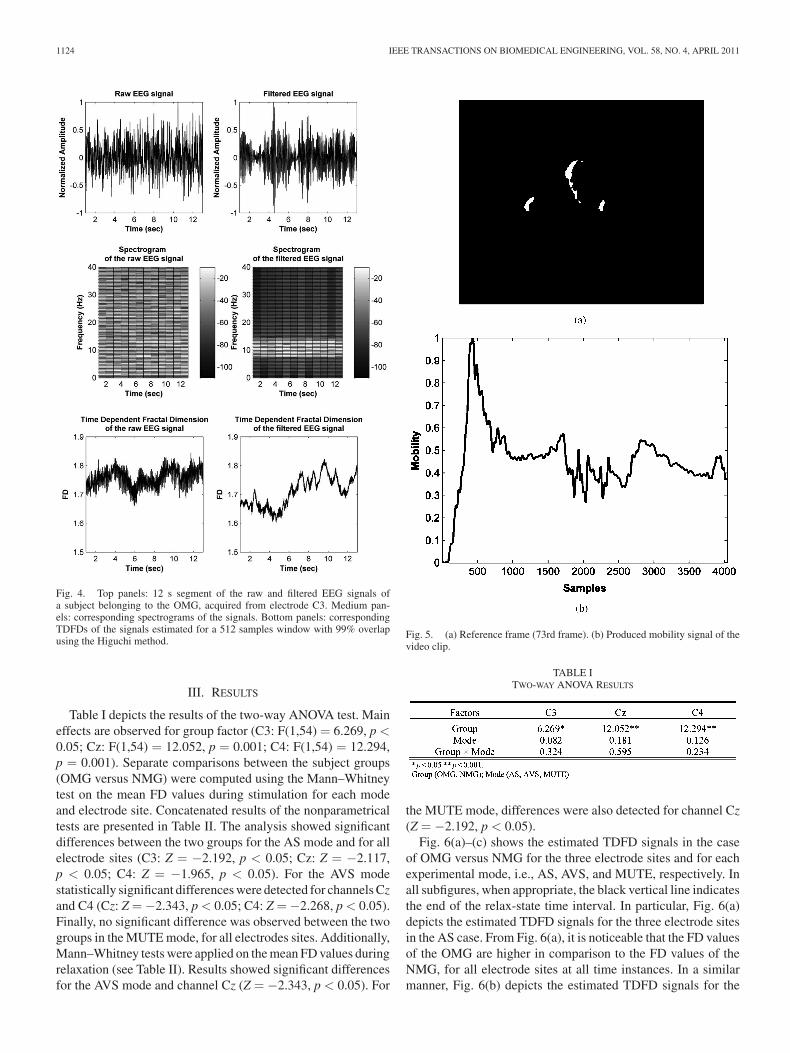
For the present analysis, the time dependent FD (TDFD) wascomputed by dividing each EEG signal from each trial intoepochs, using a 2-s time window with 99% overlap. The valueof k for the Higuchi method was set at 20 (=kmax ) in an em-pirical fashion, in order to reduce the variability of the FD val-ues and acquire a smoother TDFD signal. The resulted TDFDsignals were averaged across trials for fixed subject, channel,and experimental mode. Two-way analysis of variance ANOVA[group (two levels) and mode (three levels)] was applied onthe mean values of the FD during the stimulation period forthe three electrodes sites. Statistics were adjusted to accountfor post hoc multiple comparisons using the Games–Howelltest for unequal variances. Separate Mann–Whitney tests werecomputed for each significant factor. Moreover, an average FDsignal was produced per electrode site for each subject groupand experimental mode. The average FD signals were dividedinto 11 segments, using a 512 sample window. The medianvalue and the 10% and 90% of each segment were calculated,accordingly. It must be noted that, along with fractal analysis,a parallel approach of power spectral processing of the electro-physiological data was considered. However, this approach didnot yield satisfactory results on the present data, as describedin the following indicative example, and it was dropped. Fig. 4shows the representative raw and filtered EEG signals alongwith their corresponding spectrograms and TDFDs estimatedfor a 512 samples window with 99% overlap, using the Higuchimethod. It is evident that after the 2 s period of relaxation, theFD values of the Mu-rhythm begin to rise while no obviouschange is detected in power spectral density.
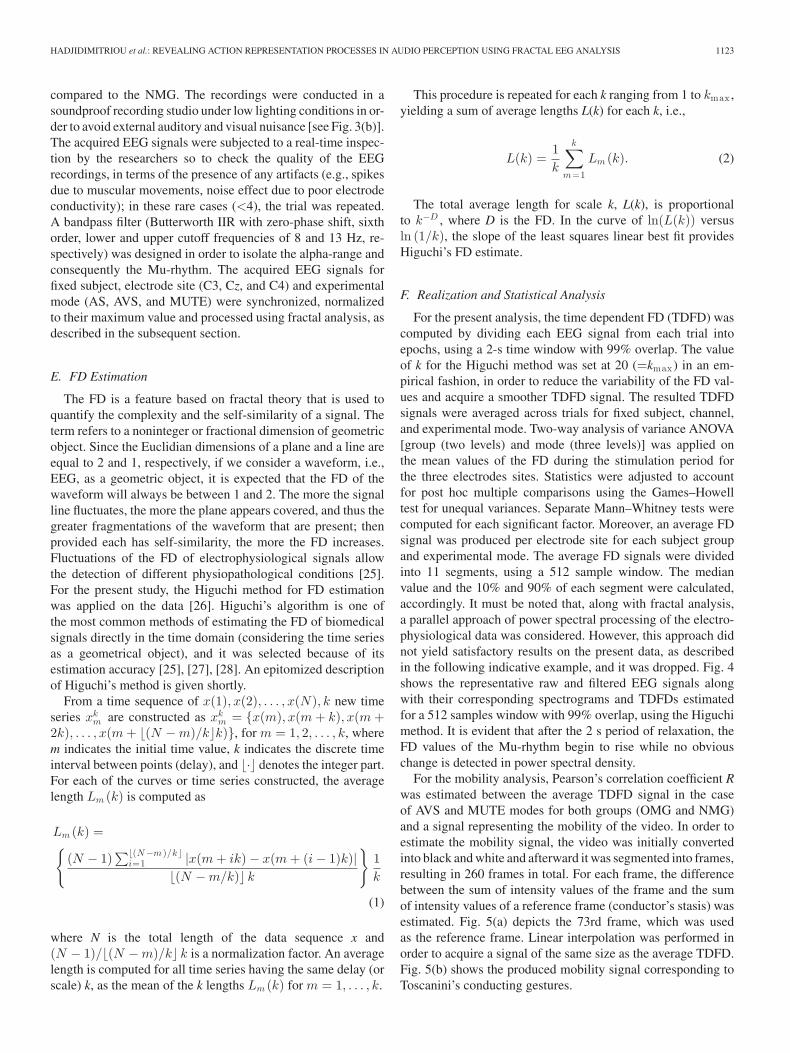
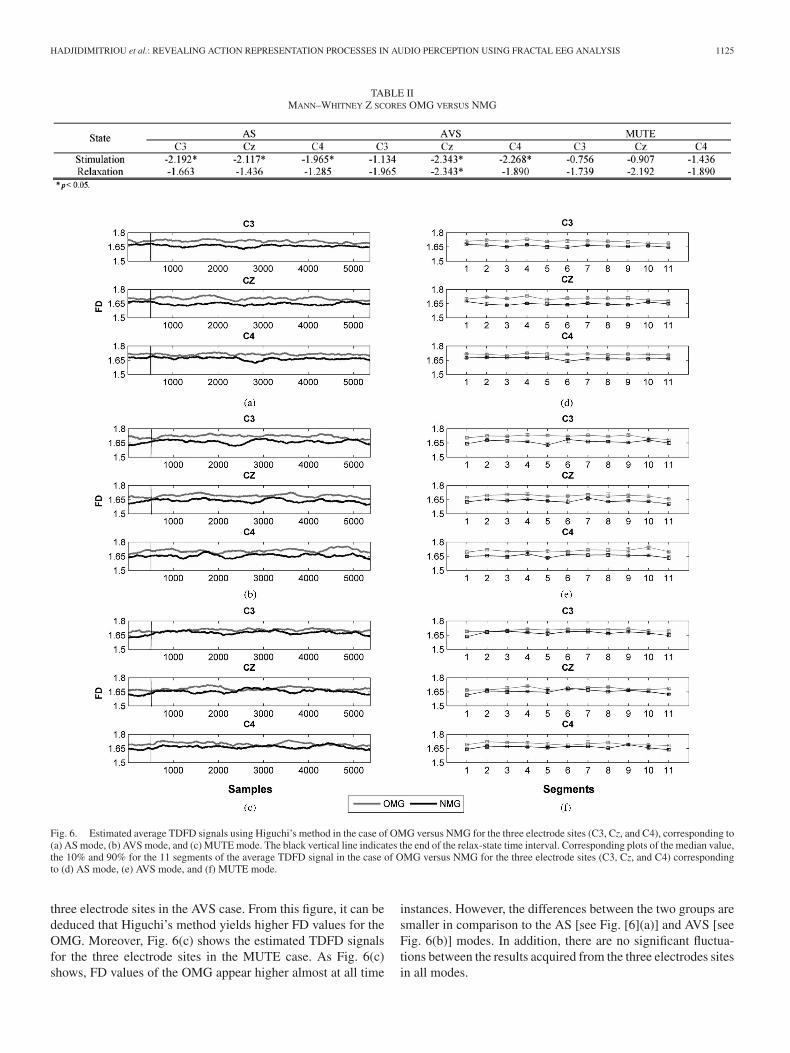
For the mobility analysis, Pearson’s correlation coefficient Rwas estimated between the average TDFD signal in the caseof AVS and MUTE modes for both groups (OMG and NMG)and a signal representing the mobility of the video. In order toestimate the mobility signal, the video was initially convertedinto black and white and afterward it was segmented into frames,resulting in 260 frames in total. For each frame, the differencebetween the sum of intensity values of the frame and the sumof intensity values of a reference frame (conductor’s stasis) wasestimated. Fig. 5(a) depicts the 73rd frame, which was usedas the reference frame. Linear interpolation was performed inorder to acquire a signal of the same size as the average TDFD.Fig. 5(b) shows the produced mobility signal corresponding toToscanini’s conducting gestures.
1124 IEEE TRANSACTIONS ON BIOMEDICAL ENGINEERING, VOL. 58, NO. 4, APRIL 2011
Fig. 4. Top panels: 12 s segment of the raw and filtered EEG signals ofa subject belonging to the OMG, acquired from electrode C3. Medium pan-els: corresponding spectrograms of the signals. Bottom panels: correspondingTDFDs of the signals estimated for a 512 samples window with 99% overlapusing the Higuchi method.
III. RESULTS
Table I depicts the results of the two-way ANOVA test. Maineffects are observed for group factor (C3: F(1,54) = 6.269, p <0.05; Cz: F(1,54) = 12.052, p = 0.001; C4: F(1,54) = 12.294,p = 0.001). Separate comparisons between the subject groups(OMG versus NMG) were computed using the Mann–Whitneytest on the mean FD values during stimulation for each modeand electrode site. Concatenated results of the nonparametricaltests are presented in Table II. The analysis showed significantdifferences between the two groups for the AS mode and for allelectrode sites (C3: Z = −2.192, p < 0.05; Cz: Z = −2.117,p < 0.05; C4: Z = −1.965, p < 0.05). For the AVS modestatistically significant differences were detected for channels Czand C4 (Cz: Z = −2.343, p < 0.05; C4: Z = −2.268, p < 0.05).Finally, no significant difference was observed between the twogroups in the MUTE mode, for all electrodes sites. Additionally,Mann–Whitney tests were applied on the mean FD values duringrelaxation (see Table II). Results showed significant differencesfor the AVS mode and channel Cz (Z = −2.343, p < 0.05). For
Fig. 5. (a) Reference frame (73rd frame). (b) Produced mobility signal of thevideo clip.
TABLE ITWO-WAY ANOVA RESULTS
the MUTE mode, differences were also detected for channel Cz(Z = −2.192, p < 0.05).
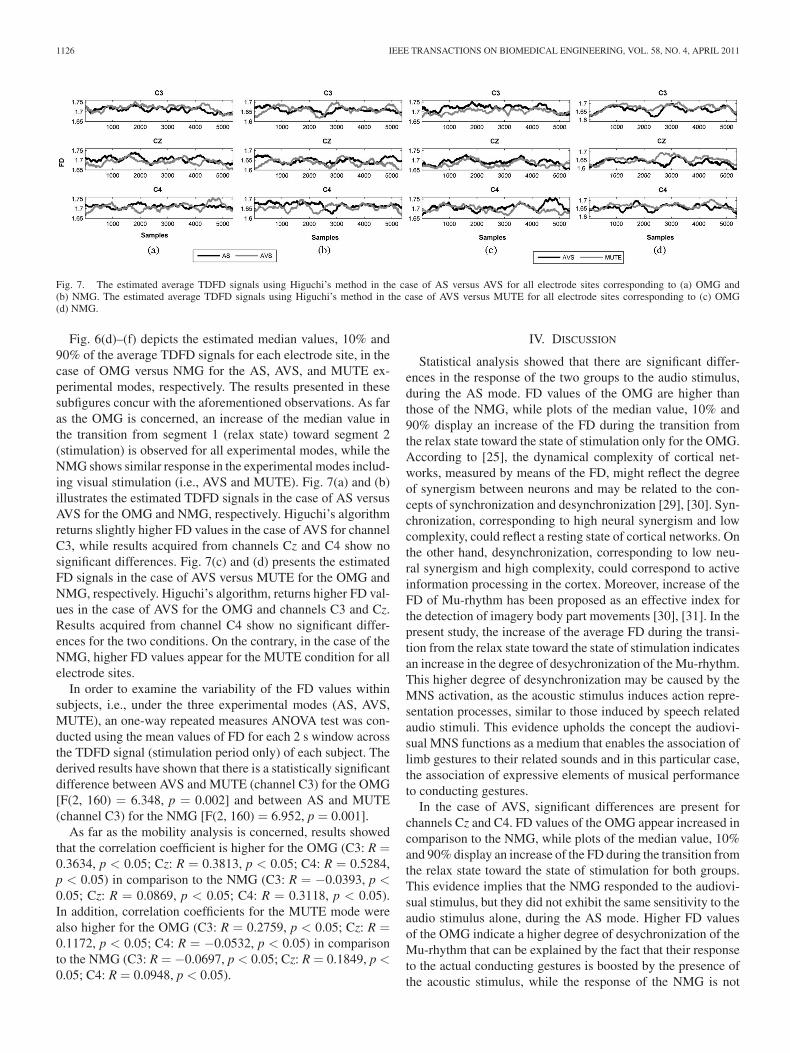
Fig. 6(a)–(c) shows the estimated TDFD signals in the caseof OMG versus NMG for the three electrode sites and for eachexperimental mode, i.e., AS, AVS, and MUTE, respectively. Inall subfigures, when appropriate, the black vertical line indicatesthe end of the relax-state time interval. In particular, Fig. 6(a)depicts the estimated TDFD signals for the three electrode sitesin the AS case. From Fig. 6(a), it is noticeable that the FD valuesof the OMG are higher in comparison to the FD values of theNMG, for all electrode sites at all time instances. In a similarmanner, Fig. 6(b) depicts the estimated TDFD signals for the
HADJIDIMITRIOU et al.: REVEALING ACTION REPRESENTATION PROCESSES IN AUDIO PERCEPTION USING FRACTAL EEG ANALYSIS 1125
TABLE IIMANN–WHITNEY Z SCORES OMG VERSUS NMG
Fig. 6. Estimated average TDFD signals using Higuchi’s method in the case of OMG versus NMG for the three electrode sites (C3, Cz, and C4), corresponding to(a) AS mode, (b) AVS mode, and (c) MUTE mode. The black vertical line indicates the end of the relax-state time interval. Corresponding plots of the median value,the 10% and 90% for the 11 segments of the average TDFD signal in the case of OMG versus NMG for the three electrode sites (C3, Cz, and C4) correspondingto (d) AS mode, (e) AVS mode, and (f) MUTE mode.
three electrode sites in the AVS case. From this figure, it can bededuced that Higuchi’s method yields higher FD values for theOMG. Moreover, Fig. 6(c) shows the estimated TDFD signalsfor the three electrode sites in the MUTE case. As Fig. 6(c)shows, FD values of the OMG appear higher almost at all time
instances. However, the differences between the two groups aresmaller in comparison to the AS [see Fig. [6](a)] and AVS [seeFig. 6(b)] modes. In addition, there are no significant fluctua-tions between the results acquired from the three electrodes sitesin all modes.
1126 IEEE TRANSACTIONS ON BIOMEDICAL ENGINEERING, VOL. 58, NO. 4, APRIL 2011
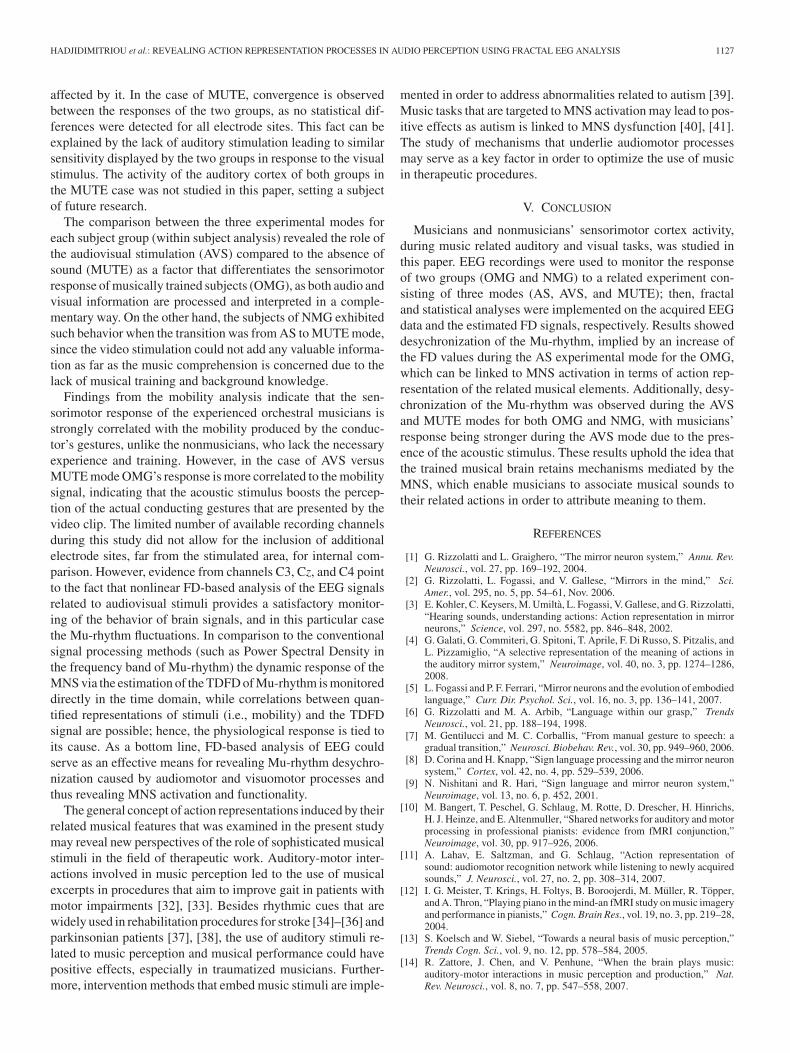
Fig. 7. The estimated average TDFD signals using Higuchi’s method in the case of AS versus AVS for all electrode sites corresponding to (a) OMG and(b) NMG. The estimated average TDFD signals using Higuchi’s method in the case of AVS versus MUTE for all electrode sites corresponding to (c) OMG(d) NMG.
Fig. 6(d)–(f) depicts the estimated median values, 10% and90% of the average TDFD signals for each electrode site, in thecase of OMG versus NMG for the AS, AVS, and MUTE ex-perimental modes, respectively. The results presented in thesesubfigures concur with the aforementioned observations. As faras the OMG is concerned, an increase of the median value inthe transition from segment 1 (relax state) toward segment 2(stimulation) is observed for all experimental modes, while theNMG shows similar response in the experimental modes includ-ing visual stimulation (i.e., AVS and MUTE). Fig. 7(a) and (b)illustrates the estimated TDFD signals in the case of AS versusAVS for the OMG and NMG, respectively. Higuchi’s algorithmreturns slightly higher FD values in the case of AVS for channelC3, while results acquired from channels Cz and C4 show nosignificant differences. Fig. 7(c) and (d) presents the estimatedFD signals in the case of AVS versus MUTE for the OMG andNMG, respectively. Higuchi’s algorithm, returns higher FD val-ues in the case of AVS for the OMG and channels C3 and Cz.Results acquired from channel C4 show no significant differ-ences for the two conditions. On the contrary, in the case of theNMG, higher FD values appear for the MUTE condition for allelectrode sites.
In order to examine the variability of the FD values withinsubjects, i.e., under the three experimental modes (AS, AVS,MUTE), an one-way repeated measures ANOVA test was con-ducted using the mean values of FD for each 2 s window acrossthe TDFD signal (stimulation period only) of each subject. Thederived results have shown that there is a statistically significantdifference between AVS and MUTE (channel C3) for the OMG[F(2, 160) = 6.348, p = 0.002] and between AS and MUTE(channel C3) for the NMG [F(2, 160) = 6.952, p = 0.001].
As far as the mobility analysis is concerned, results showedthat the correlation coefficient is higher for the OMG (C3: R =0.3634, p < 0.05; Cz: R = 0.3813, p < 0.05; C4: R = 0.5284,p < 0.05) in comparison to the NMG (C3: R = −0.0393, p <0.05; Cz: R = 0.0869, p < 0.05; C4: R = 0.3118, p < 0.05).In addition, correlation coefficients for the MUTE mode werealso higher for the OMG (C3: R = 0.2759, p < 0.05; Cz: R =0.1172, p < 0.05; C4: R = −0.0532, p < 0.05) in comparisonto the NMG (C3: R = −0.0697, p < 0.05; Cz: R = 0.1849, p <0.05; C4: R = 0.0948, p < 0.05).
IV. DISCUSSION
Statistical analysis showed that there are significant differ-ences in the response of the two groups to the audio stimulus,during the AS mode. FD values of the OMG are higher thanthose of the NMG, while plots of the median value, 10% and90% display an increase of the FD during the transition fromthe relax state toward the state of stimulation only for the OMG.According to [25], the dynamical complexity of cortical net-works, measured by means of the FD, might reflect the degreeof synergism between neurons and may be related to the con-cepts of synchronization and desynchronization [29], [30]. Syn-chronization, corresponding to high neural synergism and lowcomplexity, could reflect a resting state of cortical networks. Onthe other hand, desynchronization, corresponding to low neu-ral synergism and high complexity, could correspond to activeinformation processing in the cortex. Moreover, increase of theFD of Mu-rhythm has been proposed as an effective index forthe detection of imagery body part movements [30], [31]. In thepresent study, the increase of the average FD during the transi-tion from the relax state toward the state of stimulation indicatesan increase in the degree of desychronization of the Mu-rhythm.This higher degree of desynchronization may be caused by theMNS activation, as the acoustic stimulus induces action repre-sentation processes, similar to those induced by speech relatedaudio stimuli. This evidence upholds the concept the audiovi-sual MNS functions as a medium that enables the association oflimb gestures to their related sounds and in this particular case,the association of expressive elements of musical performanceto conducting gestures.
In the case of AVS, significant differences are present forchannels Cz and C4. FD values of the OMG appear increased incomparison to the NMG, while plots of the median value, 10%and 90% display an increase of the FD during the transition fromthe relax state toward the state of stimulation for both groups.This evidence implies that the NMG responded to the audiovi-sual stimulus, but they did not exhibit the same sensitivity to theaudio stimulus alone, during the AS mode. Higher FD valuesof the OMG indicate a higher degree of desychronization of theMu-rhythm that can be explained by the fact that their responseto the actual conducting gestures is boosted by the presence ofthe acoustic stimulus, while the response of the NMG is not
HADJIDIMITRIOU et al.: REVEALING ACTION REPRESENTATION PROCESSES IN AUDIO PERCEPTION USING FRACTAL EEG ANALYSIS 1127
affected by it. In the case of MUTE, convergence is observedbetween the responses of the two groups, as no statistical dif-ferences were detected for all electrode sites. This fact can beexplained by the lack of auditory stimulation leading to similarsensitivity displayed by the two groups in response to the visualstimulus. The activity of the auditory cortex of both groups inthe MUTE case was not studied in this paper, setting a subjectof future research.
The comparison between the three experimental modes foreach subject group (within subject analysis) revealed the role ofthe audiovisual stimulation (AVS) compared to the absence ofsound (MUTE) as a factor that differentiates the sensorimotorresponse of musically trained subjects (OMG), as both audio andvisual information are processed and interpreted in a comple-mentary way. On the other hand, the subjects of NMG exhibitedsuch behavior when the transition was from AS to MUTE mode,since the video stimulation could not add any valuable informa-tion as far as the music comprehension is concerned due to thelack of musical training and background knowledge.
Findings from the mobility analysis indicate that the sen-sorimotor response of the experienced orchestral musicians isstrongly correlated with the mobility produced by the conduc-tor’s gestures, unlike the nonmusicians, who lack the necessaryexperience and training. However, in the case of AVS versusMUTE mode OMG’s response is more correlated to the mobilitysignal, indicating that the acoustic stimulus boosts the percep-tion of the actual conducting gestures that are presented by thevideo clip. The limited number of available recording channelsduring this study did not allow for the inclusion of additionalelectrode sites, far from the stimulated area, for internal com-parison. However, evidence from channels C3, Cz, and C4 pointto the fact that nonlinear FD-based analysis of the EEG signalsrelated to audiovisual stimuli provides a satisfactory monitor-ing of the behavior of brain signals, and in this particular casethe Mu-rhythm fluctuations. In comparison to the conventionalsignal processing methods (such as Power Spectral Density inthe frequency band of Mu-rhythm) the dynamic response of theMNS via the estimation of the TDFD of Mu-rhythm is monitoreddirectly in the time domain, while correlations between quan-tified representations of stimuli (i.e., mobility) and the TDFDsignal are possible; hence, the physiological response is tied toits cause. As a bottom line, FD-based analysis of EEG couldserve as an effective means for revealing Mu-rhythm desychro-nization caused by audiomotor and visuomotor processes andthus revealing MNS activation and functionality.
The general concept of action representations induced by theirrelated musical features that was examined in the present studymay reveal new perspectives of the role of sophisticated musicalstimuli in the field of therapeutic work. Auditory-motor inter-actions involved in music perception led to the use of musicalexcerpts in procedures that aim to improve gait in patients withmotor impairments [32], [33]. Besides rhythmic cues that arewidely used in rehabilitation procedures for stroke [34]–[36] andparkinsonian patients [37], [38], the use of auditory stimuli re-lated to music perception and musical performance could havepositive effects, especially in traumatized musicians. Further-more, intervention methods that embed music stimuli are imple-
mented in order to address abnormalities related to autism [39].Music tasks that are targeted to MNS activation may lead to pos-itive effects as autism is linked to MNS dysfunction [40], [41].The study of mechanisms that underlie audiomotor processesmay serve as a key factor in order to optimize the use of musicin therapeutic procedures.
V. CONCLUSION
Musicians and nonmusicians’ sensorimotor cortex activity,during music related auditory and visual tasks, was studied inthis paper. EEG recordings were used to monitor the responseof two groups (OMG and NMG) to a related experiment con-sisting of three modes (AS, AVS, and MUTE); then, fractaland statistical analyses were implemented on the acquired EEGdata and the estimated FD signals, respectively. Results showeddesychronization of the Mu-rhythm, implied by an increase ofthe FD values during the AS experimental mode for the OMG,which can be linked to MNS activation in terms of action rep-resentation of the related musical elements. Additionally, desy-chronization of the Mu-rhythm was observed during the AVSand MUTE modes for both OMG and NMG, with musicians’response being stronger during the AVS mode due to the pres-ence of the acoustic stimulus. These results uphold the idea thatthe trained musical brain retains mechanisms mediated by theMNS, which enable musicians to associate musical sounds totheir related actions in order to attribute meaning to them.
REFERENCES
[1] G. Rizzolatti and L. Graighero, “The mirror neuron system,” Annu. Rev.Neurosci., vol. 27, pp. 169–192, 2004.
[2] G. Rizzolatti, L. Fogassi, and V. Gallese, “Mirrors in the mind,” Sci.Amer., vol. 295, no. 5, pp. 54–61, Nov. 2006.
[3] E. Kohler, C. Keysers, M. Umilta, L. Fogassi, V. Gallese, and G. Rizzolatti,“Hearing sounds, understanding actions: Action representation in mirrorneurons,” Science, vol. 297, no. 5582, pp. 846–848, 2002.
[4] G. Galati, G. Commiteri, G. Spitoni, T. Aprile, F. Di Russo, S. Pitzalis, andL. Pizzamiglio, “A selective representation of the meaning of actions inthe auditory mirror system,” Neuroimage, vol. 40, no. 3, pp. 1274–1286,2008.
[5] L. Fogassi and P. F. Ferrari, “Mirror neurons and the evolution of embodiedlanguage,” Curr. Dir. Psychol. Sci., vol. 16, no. 3, pp. 136–141, 2007.
[6] G. Rizzolatti and M. A. Arbib, “Language within our grasp,” TrendsNeurosci., vol. 21, pp. 188–194, 1998.
[7] M. Gentilucci and M. C. Corballis, “From manual gesture to speech: agradual transition,” Neurosci. Biobehav. Rev., vol. 30, pp. 949–960, 2006.
[8] D. Corina and H. Knapp, “Sign language processing and the mirror neuronsystem,” Cortex, vol. 42, no. 4, pp. 529–539, 2006.
[9] N. Nishitani and R. Hari, “Sign language and mirror neuron system,”Neuroimage, vol. 13, no. 6, p. 452, 2001.
[10] M. Bangert, T. Peschel, G. Schlaug, M. Rotte, D. Drescher, H. Hinrichs,H. J. Heinze, and E. Altenmuller, “Shared networks for auditory and motorprocessing in professional pianists: evidence from fMRI conjunction,”Neuroimage, vol. 30, pp. 917–926, 2006.
[11] A. Lahav, E. Saltzman, and G. Schlaug, “Action representation ofsound: audiomotor recognition network while listening to newly acquiredsounds,” J. Neurosci., vol. 27, no. 2, pp. 308–314, 2007.
[12] I. G. Meister, T. Krings, H. Foltys, B. Boroojerdi, M. Muller, R. Topper,and A. Thron, “Playing piano in the mind-an fMRI study on music imageryand performance in pianists,” Cogn. Brain Res., vol. 19, no. 3, pp. 219–28,2004.
[13] S. Koelsch and W. Siebel, “Towards a neural basis of music perception,”Trends Cogn. Sci., vol. 9, no. 12, pp. 578–584, 2005.
[14] R. Zattore, J. Chen, and V. Penhune, “When the brain plays music:auditory-motor interactions in music perception and production,” Nat.Rev. Neurosci., vol. 8, no. 7, pp. 547–558, 2007.
1128 IEEE TRANSACTIONS ON BIOMEDICAL ENGINEERING, VOL. 58, NO. 4, APRIL 2011
[15] I. Molnar–Szakacs and K. Overy, “Music and mirror neurons: From mo-tion to ‘e’motion,” Soc. Cogn. Affect. Neurosci., vol. 1, pp. 234–241,2006.
[16] J. Pineda, “The functional significance of mu rhythms: translating “seeing”and “hearing” into “doing”,” Brain Res. Rev., vol. 50, pp. 57–68, 2005.
[17] R. Hari, “Action representation and the cortical mu-rhythm,” Progr. BrainRes., vol. 159, pp. 253–260, 2006.
[18] E. L. Altschuler, A. Vankov, V. Wang, V. S. Ramachandran, andJ. A. Pineda, “Person see, person do: Human cortical electrophysiologicalcorrelates of monkey see monkey do cells,” Soc. Neurosci. Abstr., vol. 23,no. 2, p. 1848, 1997.
[19] S. Cochin, C. Barthelemy, S. Roux, and J. Martineau, “Observation andexecution of movement: similarities demonstrated by quantified electroen-cephalography,” Eur. J. Neurosci., vol. 11, pp. 1839–1842, 1999.
[20] S. Muthukumaraswamy, B. Johnson, and N. McNair, “Mu-rhythm modu-lation during observation of an object-directed grasp,” Cogn. Brain Res.,vol. 19, no. 2, pp. 195–201, 2004.
[21] E. Ulloa and J. Pineda, “Recognition of point-light biological motion: murhythms and mirror neuron activity,” Behav. Brain Res., vol. 183, no. 2,pp. 188–194, 2007.
[22] P. Paramanathan and R. Uthayakumar, “Application of fractal theory inanalysis of human electroencephalographic signals,” Comput. Biol. Med.,vol. 38, pp. 372–378, 2008.
[23] G. Pfurtscheller, C. Brunner, A. Schlogl, and F. H. Lopes da Silva, “Murhythm (de)synchronization and EEG single trial classification of differentmotor imagery tasks,” Neuroimage, vol. 31, pp. 153–159, 2006.
[24] A. Perez, P. V. Peers, M. Valdes-Sosa, L. Galan, L. Garcıa, and E. Martınez-Montes, “Hemispheric modulations of alpha-band power reflect the right-ward shift in attention induced by enhanced attentional load,” Neurophys-iologia, vol. 47, no. 1, pp. 41–49, 2009.
[25] A. Accardo, M. Affinito, M. Carrozzi, and F. Bouquet, “Use of fractaldimension for the analysis of electroencephalographic time series,” Biol.Cybern., vol. 77, pp. 339–350, 1997.
[26] T. Higuchi, “Approach to an irregular time series on the basis of the fractaltheory,” Phys. D, vol. 31, pp. 277–283, 1988.
[27] R. Esteller, G. Vachtsevanos, J. Echauz, and B. Litt, “A comparison ofwaveform fractal dimension algorithms,” IEEE Trans. Circuits Syst. I–Fundam. Theory Appl., vol. 48, no. 2, pp. 177–183, Feb. 2001.
[28] M. Phothisonothai and M. Nakagawa, “Fractal-based EEG data analysisof body parts movement imagery tasks,” J. Physiol. Sci., vol. 57, no. 4,pp. 217–226, 2007.
[29] F. H. Lopes da Silva, “Neural mechanisms underlying brain waves:from membranes to networks,” Electroencephalogr. Clin. Neurophysiol.,vol. 79, pp. 81–93, 1991.
[30] X. Li, Z. Deng, and J. Zhang, “Function of EEG temporal complexityanalysis in neural activities measurement,” in Lecture Notes in ComputerScience: Advances in Neural Networks, vol. 5551. Berlin, Germany:Springer-Verlag, 2009, pp. 209–218.
[31] M. Phothisonothai and M. Nakagawa, “EEG-based classification of mo-tor imagery tasks using fractal dimension and neural network for brain-Computer interface,” IEICE Trans. Inf. Syst., vol. E91-D, no. 1, pp. 44–53,2008.
[32] M. Staum, “Music and rhythmic stimuli in the rehabilitation of gait disor-ders,” J. Music Therapy, vol. 20, pp. 69–87, 1983.
[33] M. Thaut, Training Manual for Neurologic Music Therapy. Fort Collins,CO: Colorado State University, 1999.
[34] M. Thaut, G. McIntosh, S. Prassas, and R. Rice, “Effect of rhythmicauditory cuing on temporal stride parameters and EMG patterns in hemi-paretic gait of stroke patients,” Neurorehabil. Neural Repair, vol. 7, no. 1,pp. 9–13, 1993.
[35] S. Prassas, M. Thaut, G. McIntosh, and R. Rice, “Effect of auditory rhyth-mic cuing on gait kinematic parameters of stroke patients,” Gait Posture,vol. 6, pp. 218–223, 1997.
[36] K. H. Mauritz, “Gait training in hemiparetic stroke patients,” Eur. J. Phys.Rehabil. Med., vol. 130, pp. 165–178, 2004.
[37] M. Thaut, G. McIntosh, R. Rice, R. Miller, J. Rathbun, and J. Brault,“Rhythmic auditory stimulation in gait training with Parkinson’s diseasepatients,” Movement Disord., vol. 11, pp. 193–200, 1996.
[38] C. Pacchetti, F. Mancini, R. Aglieri, C. Fundaro, E. Martignoni, andG. Nappi, “Active music therapy in Parkinson’s disease: An integra-tive method for motor and emotional rehabilitation,” Psychosom. Med.,vol. 62, pp. 386–393, 2000.
[39] G. Dawson and R. Watling, “Interventions to facilitate auditory, visual,and motor integration in autism: a review of the evidence,” J. AutismDevelop. Disord., vol. 30, no. 5, pp. 415–421, 2004.
[40] J. H. G. Williams, A. Whiten, T. Suddendorf, and D. I. Perrett, “Imitation,mirror neurons and autism,” Neurosci. Biobehav. Rev., vol. 25, no. 4,pp. 287–295, 2001.
[41] L. M. Oberman, E. M. Hubbard, J. P. McLeery, E. L. Altschuler, V. S.Ramachandran, and J. A. Pineda, “EEG evidence of mirror neuron dys-function in autism spectrum disorders,” Cogn. Brain Res., vol. 29, no. 2,pp. 190–198, 2005.
Stelios K. Hadjidimitriou (S’10) was born inKarditsa, Greece, in 1984. He received the Diplomadegree in electrical and computer engineering fromthe Aristotle University of Thessaloniki, Thessa-loniki, Greece, in 2008. He is currently working to-ward the Ph.D. degree at the Department of Electri-cal and Computer Engineering, Aristotle Universityof Thessaloniki, affiliated with the Signal Processingand Biomedical Technology Unit of the Telecommu-nications Laboratory.
During the summers of 2006 and 2007, he waswith the Public Power Corporation S.A., Greece. His current research interestsinclude advanced signal processing, biomedical engineering, and neural pro-cesses concerning music perception and cognition.
Mr. Hadjidimitriou is a member of the Technical Chamber of Greece.
Asteris I. Zacharakis was born in Thessaloniki,Greece, in 1983. He received the Diploma degreein electrical and computer engineering from theAristotle University of Thessaloniki, Thessaloniki,Greece, in 2008, the M.Sc. degree in music and me-dia technologies from the City University of London,London, U.K., in 2009, and the Diploma degree incello performance from the State Conservatory ofThessaloniki, Greece. Since November 2009, he hasbeen working toward the Ph.D. degree at the Centrefor Digital Music, Department of Electronic Engi-
neering, Queen Mary University of London, London, U.K.His current research interests include musical signal processing, psychoa-
coustics, and interactive interfaces in the framework of musical timbre classifi-cation and transformation.
Mr. Zacharakis is a member of the Technical Chamber of Greece.
Panagiotis C. Doulgeris (S’09) was born inThessaloniki, Greece, in 1984. He received theDiploma degree in electrical and computer engineer-ing from the Aristotle University of Thessaloniki,Thessaloniki, Greece, in 2008. Since October 2008,he has been working toward the Ph.D. degree atthe Applied Geophysics and Petrophysics Section,Department of Geotechnology, Faculty of Civil En-gineering and Geosciences, Technical University ofDelft, Delft, The Netherlands.
His research project is part of the Acquisition andPreprocessing project of the DELPHI research consortium. His current researchinterests include signal processing with application on biomedical engineeringand seismic exploration.
Mr. Doulgeris is a member of the European Association of Geoscientists andEngineers and the Society of Exploration Geophysicists.
HADJIDIMITRIOU et al.: REVEALING ACTION REPRESENTATION PROCESSES IN AUDIO PERCEPTION USING FRACTAL EEG ANALYSIS 1129
Konstantinos J. Panoulas (S’99) was born inThessaloniki, Greece, in 1979. He received theDiploma degree in electrical and computer engineer-ing, in 2002 and the Ph.D. degree in electrical andcomputer engineering, in 2010, both from the Aristo-tle University of Thessaloniki, Thessaloniki, Greece.He is currently working toward the Ph.D. degree atthe Department of Electrical and Computer Engineer-ing, Aristotle University of Thessaloniki.
His current research interests include the biomed-ical signal processing and especially the analysis,
compression and transmission of biological signals, as well as the securityof computing systems and data transmission over the Internet.
Mr. Panoulas was the recipient of the Ericsson Award of Excellence inTelecommunications in 2002, for his diploma thesis titled: Processing andCompression of Electrocardiogram for Transmission Through Mobile Channel.
Leontios J. Hadjileontiadis (S’87–M’98–SM’11)was born in Kastoria, Greece, in 1966. He receivedthe Diploma degree in electrical engineering, in 1989,and the Ph.D. degree in electrical and computer engi-neering, in 1997, both from the Aristotle Universityof Thessaloniki, Thessaloniki, Greece, and the Ph.D.degree in music composition from the University ofYork, York, U.K., in 2004.
Since December 1999, he has been a FacultyMember at the Department of Electrical and Com-puter Engineering, Aristotle University of Thessa-
loniki, where he is currently an Associate Professor, and where he is engaged inresearch on lung sounds, heart sounds, bowel sounds, ECG data compression,seismic data analysis and crack detection in the Signal Processing and Biomedi-cal Technology Unit of the Telecommunications Laboratory. He is also currentlya Professor of composition at the State Conservatory of Thessaloniki, Thessa-loniki, Greece. His research interests include higher order statistics, alpha-stabledistributions, higher order zero crossings, wavelets, polyspectra, fractals, neuro-fuzzy modeling for medical, mobile, and digital signal processing applications.
Prof. Hadjileontiadis is a member of the Technical Chamber of Greece, theHigher-Order Statistics Society, the International Lung Sounds Association, andthe American College of Chest Physicians. He was also an open finalist at theStudent paper Competition (Whitaker Foundation) of the IEEE Engineering inMedicine and Biology Society 1997, Chicago, IL, and at the Student Paper Com-petition (in memory of Dick Poortvliet) of the Mediterranean Conference onMedical and Biological Engineering and Computing 1998, Lemesos, Cyprus. In2004, 2005, and 2007 he organized and served as a Mentor to three five-studentteams that have ranked as third, second, and seventh worldwide, respectively, atthe Imagine Cup Competition (Microsoft), Sao Paulo, Brazil (2004)/Yokohama,Japan (2005)/ Seoul, Korea (2007), with projects involving technology-basedsolutions for people with disabilities. He was the recipient of the second awardat the Best Paper Competition of the ninth Panhellenic Medical Conference onThorax Diseases 1997, Thessaloniki, and the Young Scientist Award of the 24thInternational Lung Sounds Conference 1999, Marburg, Germany.
Stavros M. Panas (M’79) was born in Edessa,Greece, in 1946. He received the B.Sc. degree inphysics from the Aristotle University of Thessaloniki,Thessaloniki, Greece, in 1971, the M.Sc. degree inelectrical engineering from the University of Okla-homa, Norman, in 1974, and the Ph.D. degree inelectrical engineering from the Aristotle Universityof Thessaloniki, Thessaloniki, Greece, in 1983.
Since 1976, he has been a member of the Telecom-munications Division of the Electrical and ComputerEngineering Department (E&CE), Aristotle Univer-
sity of Thessaloniki, where he is currently a Professor, and where he is also theDirector at the Telecommunications Laboratory and the Signal Processing andBiomedical Technology Unit and the Vice-Rector. From 1993 to 1997, he wasthe President at the E&CE Department, Aristotle University of Thessaloniki.He is the author or coauthor of more than 70 published refereed journal andconference papers. His research interest include eddy currents, electromagneticfields, signal processing, and applications in biomedical engineering and seis-mic signal processing.
Prof. Panas is a former member of the Board of Directors of OTE (GreekTelecommunications Organization) and a former member on behalf of OTE, ofthe Board of Directors of the Institute of Studies and Research on Telecommu-nications and Informatics for the Southeastern European Countries. He servedas the Chairman of the IT Committee of the Central Macedonia Region, a mem-ber of the Regional Working Group (RISU) of Central Macedonia Region, inthe framework of the EU Interregional Information Society Initiative (IRISI)Program, a member of the working group of the IRISI Teleworking Sector ofCentral Macedonia Region, and the Chairman of the Interstate Group of the sixEU peripheries in the Teleworking area.
Related Documents