Corporate Financial Risk Management Managing Interest Rate Expense Flows at Risk By: Darren Zuckerman, Solutions Consultant, Reval September 2011 CONTENT Executive Summary Inroduction Exposure Evaluation Exposure Measurement Exposure Management Conclusion

Welcome message from author
This document is posted to help you gain knowledge. Please leave a comment to let me know what you think about it! Share it to your friends and learn new things together.
Transcript
Corporate Financial Risk ManagementManaging Interest Rate Expense Flows at Risk
By: Darren Zuckerman, Solutions Consultant, Reval
September 2011
CONTENT
Executive Summary
InroductionExposure Evaluation Exposure MeasurementExposure Management
Conclusion
© 2011 Reval.com, Inc. All Rights Reserved | 2
Executive summary
In the corporate fi nancial risk management world, there are certain best practice
approaches that should be considered when it comes to managing exposures to
different risks. The scope of this paper will defi ne a step by step approach on how best
to manage interest rate risk in the post-Global Financial Crisis market environment.
These steps should to be taken to best control interest rate risk exposure, including
evaluating, quantifying, and managing risk subject to uncertain market conditions.
Introduction
Corporate fi nancial risk management has become a hot topic over the last couple of
years in light of the Global Financial Crisis (GFC) of 2007/08. The markets have changed
signifi cantly with there being a much higher level of uncertainty, more risk factors to
consider, and an ever-changing regulatory environment. As a result, corporate treasuries
have started to receive the board-level attention needed to allow for more optimal risk
management approaches.
The optimal risk management strategy should set out specifi c objectives and guidelines,
while properly aligning the risk management approach with core and non-core business
activities. A concrete methodology should also be set to evaluate the effectiveness of the
risk management strategies to continuously keep up with the changing market conditions.
Key steps to practical risk management include knowing why hedging is necessary,
knowing how to hedge, and knowing when to hedge. When managing interest rate risk,
it is therefore critical to understand the source of the risk, how much exposure to that
risk exists, and the best way to minimize the risk. In short, three steps should be taken
when assessing interest rate risk: 1. Exposure Evaluation; 2. Exposure Measurement; 3.
Exposure Management
About the author
Darren Zuckerman has fi ve
years of experience in the
banking and capital markets
industry where he has had
positions as an FX Spot Trader at
Forex Capital Markets, Financial
Analyst at Morgan Stanley, and
most recently, as a Solutions
Consultant at Reval. Darren has
been with Reval for three years
spending part of his tenure at the
company as a Consultant in the
Professional Service’s group in
New York. He can be reached at
ABOUT REVAL Reval provides
an award-winning Web-based
platform that automates
corporate fi nancial risk
management for a wide range of
interest rate, foreign exchange,
commodity and credit derivatives.
The world’s leading corporations
and fi nancial institutions use this
SOX-compliant Software-as-a-
Service to support and execute
hedging strategies from exposure
capture through performance
measurement and to comply
with international and domestic
accounting standards, including
ASC 815 (FAS 133), ASC 820
(FAS 157), IAS 39 and IFRS 7.
continued on next page
© 2011 Reval.com, Inc. All Rights Reserved | 3
Exposure Evaluation
The fi rst step is the exposure evaluation phase. This includes understanding the sources
of interest rate risk exposure as well as the reasons why these sources of risk may
occur. There are generally three categories that make up the sources of interest rate
risk exposure. Each of these categories has business-driven rationale for why these
exposures exist within in a corporation:
- Fixed/Floating Liabilities
▪ Fixed/Floating liabilities are issued to maintain and expand business operations
▪ Effi cient way of raising capital without diluting shareholder value
▪ Optimizing debt/equity ratios
▪ Examples include fi xed rate bonds, fl oating rate notes (FRNs)
- Fixed/Floating Assets
▪ Fixed/Floating investments made with excess cash, normally in short-term
debt or bank deposits
▪ Examples include Interest Rate futures, Treasuries, Money Market Funds
- Forecasted Transactions
▪ Meeting future corporate funding needs where capital is raised via commercial
paper, forecasted debt issuances, etc
Once a corporation evaluates the sources of interest rate risk, it is in a much better
place to understand how best to measure this risk exposure. Exposure measurement
is crucial for optimizing a corporations’ risk management strategy as it provides a
basis for how and when to hedge.
Exposure Measurement
The second step in managing interest rate exposure is the exposure measurement
phase. With interest rate risk, the main component being measured is forecasted interest
fl ows over the life of the exposure(s). As such, there are a few questions to ask when
performing the exposure quantifi cation phase:
About the author (continued)
Reval® deploys rapidly and
integrates easily with treasury
management and ERP systems.
The company’s SaaS platform
and team of fi nancial experts are
also available on an outsourced
basis through Reval Center™.
Reval was founded in 1999 and
is headquartered in New York,
with regional centers based
in Philadelphia, Chicago, San
Francisco, Toronto, London,
Frankfurt, Graz, Sydney, Hong
Kong, and Gurgaon.
For more information, visit www.
reval.com or email info@reval.
com
© 2011 Reval.com, Inc. All Rights Reserved | 4
- What are the forecasted interest fl ows under normal market conditions?
- What are the forecasted interest fl ows under stressed market conditions?
- What are the forecasted interest fl ows are at risk in a simulated market environment under a specifi ed time horizon?
Let’s discover measuring interest rate exposure in the form of an example:
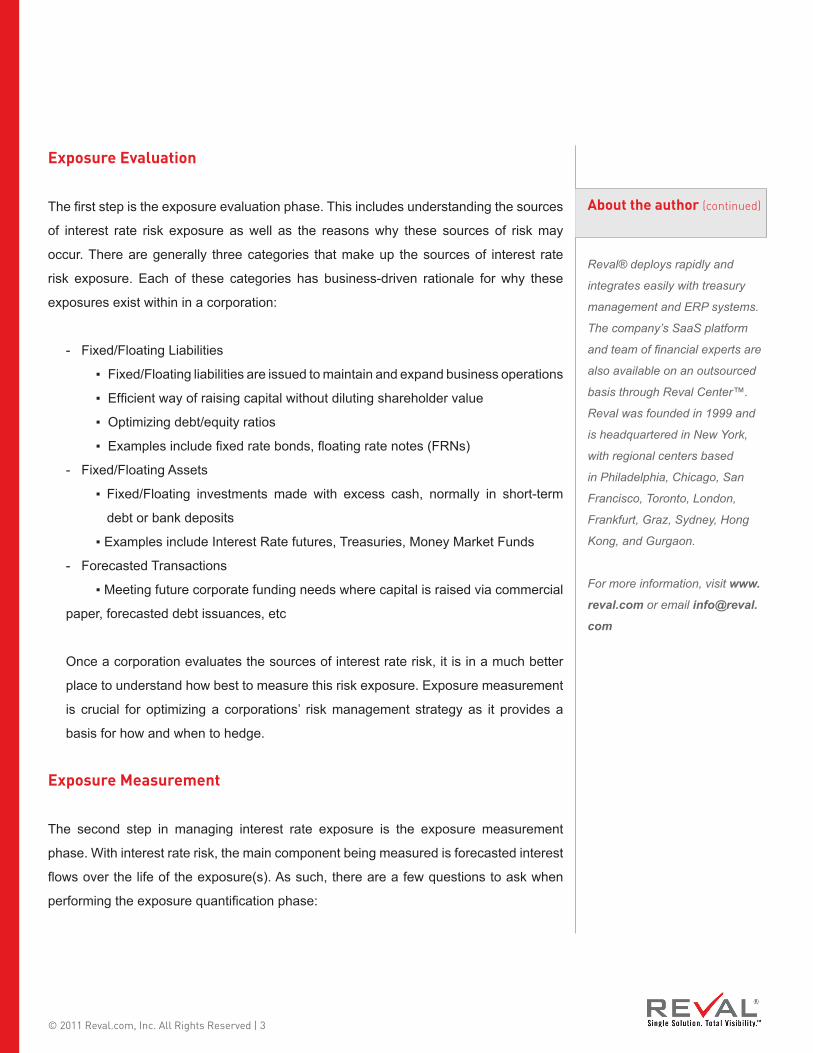
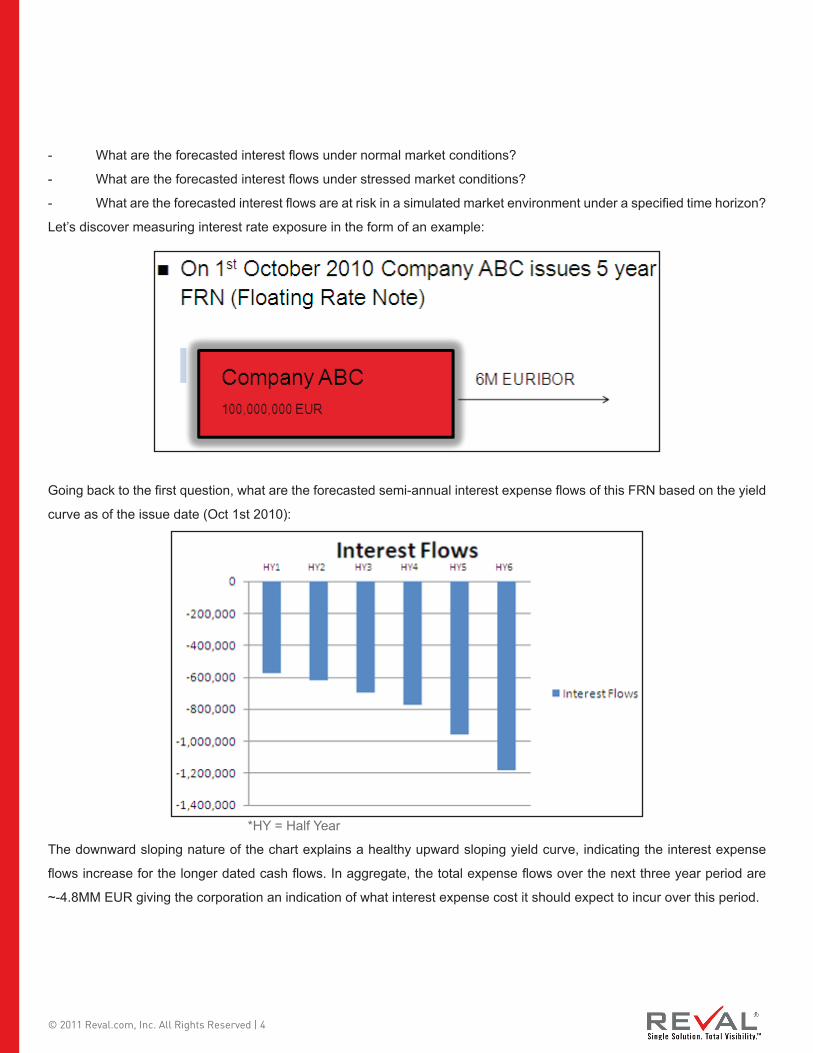
Going back to the fi rst question, what are the forecasted semi-annual interest expense fl ows of this FRN based on the yield
curve as of the issue date (Oct 1st 2010):
The downward sloping nature of the chart explains a healthy upward sloping yield curve, indicating the interest expense
fl ows increase for the longer dated cash fl ows. In aggregate, the total expense fl ows over the next three year period are
~-4.8MM EUR giving the corporation an indication of what interest expense cost it should expect to incur over this period.
*HY = Half Year
© 2011 Reval.com, Inc. All Rights Reserved | 5
However, if the last three years of market activity is any indication of the future, the forecasted interest expense fl ows under
current market conditions do not necessarily infer what the actual interest expense fl ows will be. To that end, it is crucial to
assess what are the forecasted interest fl ows under stressed market conditions?
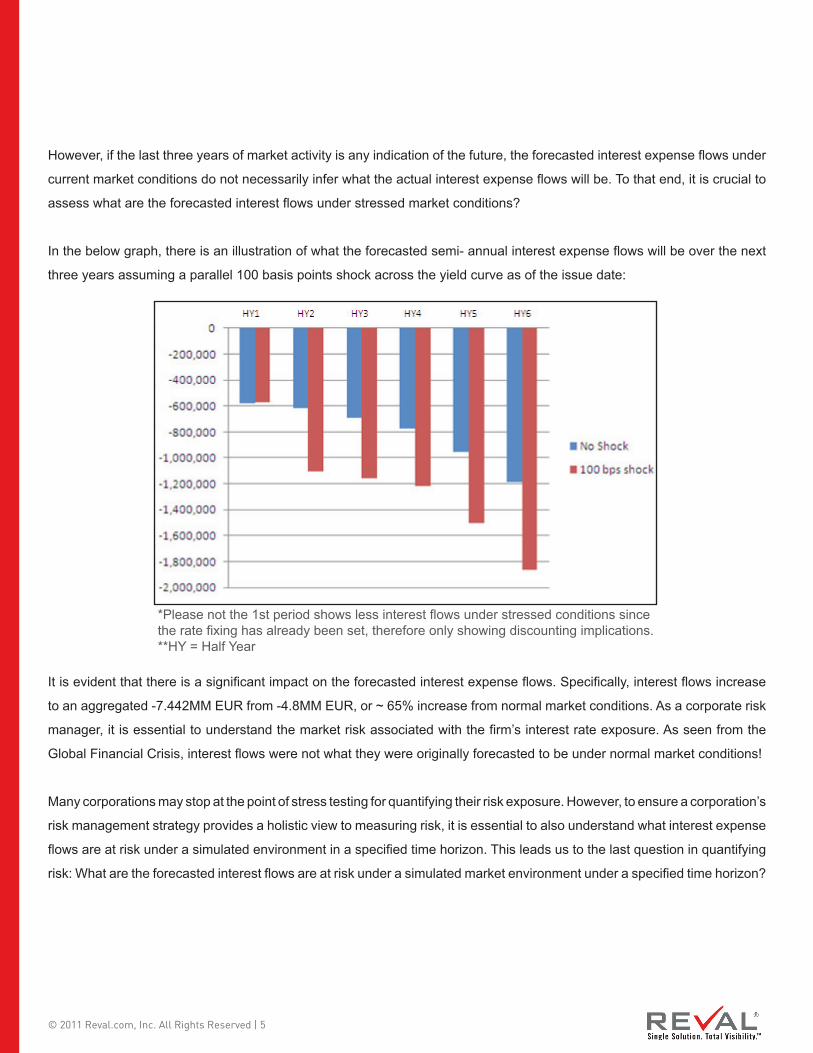
In the below graph, there is an illustration of what the forecasted semi- annual interest expense fl ows will be over the next
three years assuming a parallel 100 basis points shock across the yield curve as of the issue date:
It is evident that there is a signifi cant impact on the forecasted interest expense fl ows. Specifi cally, interest fl ows increase
to an aggregated -7.442MM EUR from -4.8MM EUR, or ~ 65% increase from normal market conditions. As a corporate risk
manager, it is essential to understand the market risk associated with the fi rm’s interest rate exposure. As seen from the
Global Financial Crisis, interest fl ows were not what they were originally forecasted to be under normal market conditions!
Many corporations may stop at the point of stress testing for quantifying their risk exposure. However, to ensure a corporation’s
risk management strategy provides a holistic view to measuring risk, it is essential to also understand what interest expense
fl ows are at risk under a simulated environment in a specifi ed time horizon. This leads us to the last question in quantifying
risk: What are the forecasted interest fl ows are at risk under a simulated market environment under a specifi ed time horizon?
*Please not the 1st period shows less interest fl ows under stressed conditions since the rate fi xing has already been set, therefore only showing discounting implications.**HY = Half Year
© 2011 Reval.com, Inc. All Rights Reserved | 6
A supplemental risk management tool that can be used to simulate what interest fl ows are at risk is running a Cash Flow at
Risk (CFaR) simulation. A CFaR simulation provides a more holistic view to a corporate’s interest fl ows at risk as it:
(1) Develops confi dence intervals on how much market risk exposure a corporation can except to have;
(2) Creates a risk profi le based on multiple risk factors (i.e. FX, Interest Rate, Credit, Equities);
(3) Incorporates correlations between those risk factors;
(4) Measures the effect that the correlations have on the underlying exposure being measured.
In other words, measuring the market risk of an FRN is simply not enough. Most corporations have exposures to multiple
risk factors, most of which may be correlated with the exposure being measured in question. The net result may be that the
FRN has more or less interest fl ows at risk than a simple stress test assessment.
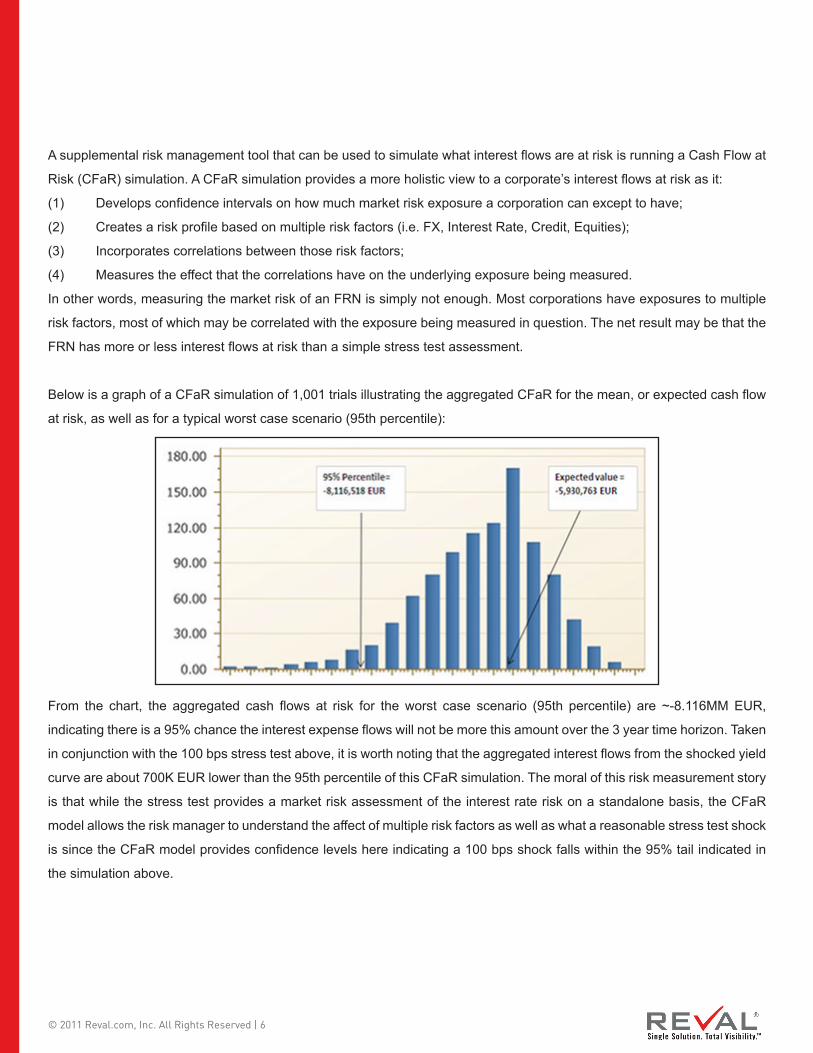
Below is a graph of a CFaR simulation of 1,001 trials illustrating the aggregated CFaR for the mean, or expected cash fl ow
at risk, as well as for a typical worst case scenario (95th percentile):
From the chart, the aggregated cash fl ows at risk for the worst case scenario (95th percentile) are ~-8.116MM EUR,
indicating there is a 95% chance the interest expense fl ows will not be more this amount over the 3 year time horizon. Taken
in conjunction with the 100 bps stress test above, it is worth noting that the aggregated interest fl ows from the shocked yield
curve are about 700K EUR lower than the 95th percentile of this CFaR simulation. The moral of this risk measurement story
is that while the stress test provides a market risk assessment of the interest rate risk on a standalone basis, the CFaR
model allows the risk manager to understand the affect of multiple risk factors as well as what a reasonable stress test shock
is since the CFaR model provides confi dence levels here indicating a 100 bps shock falls within the 95% tail indicated in
the simulation above.
© 2011 Reval.com, Inc. All Rights Reserved | 7
Exposure Management
The fi nal step is the management and minimization of the interest rate exposure. This process can be executed in a couple
of ways, whether it is an asset/liability matching exercise or hedging underlying exposure with derivative instruments. When
using derivatives, it is imperative to analyze the best instrument to hedge the underlying exposure in addition to the optimal
hedge coverage ratio to use.
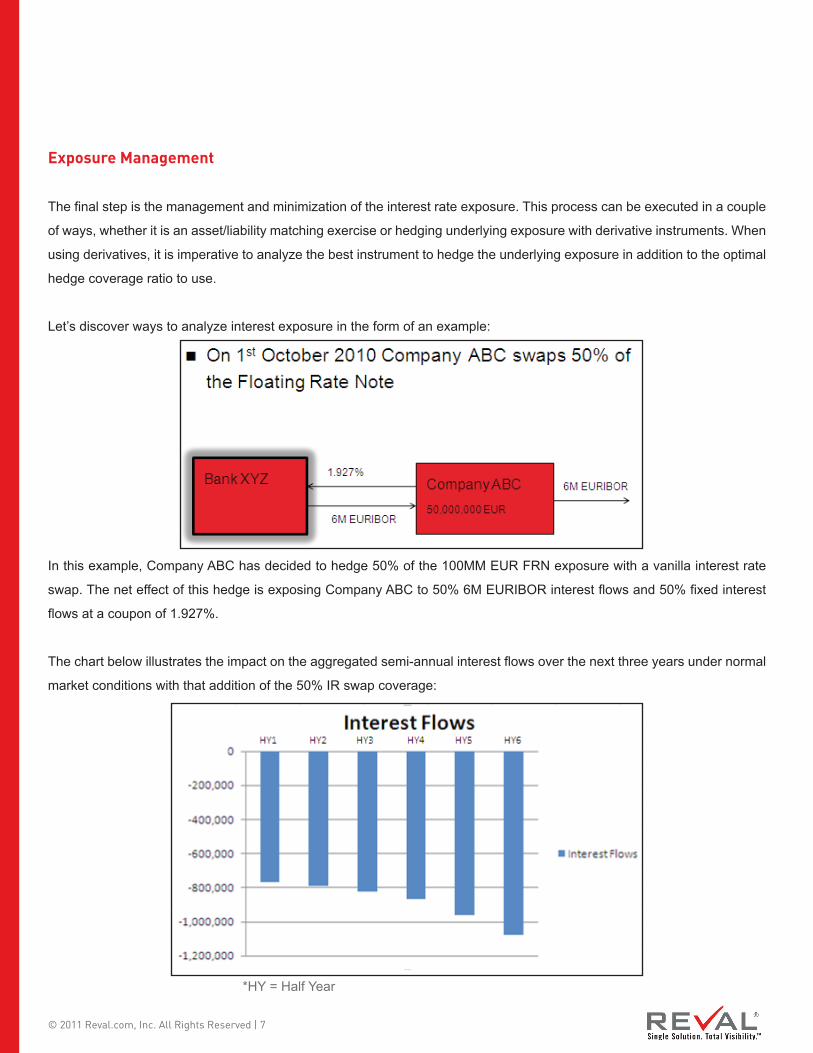
Let’s discover ways to analyze interest exposure in the form of an example:
In this example, Company ABC has decided to hedge 50% of the 100MM EUR FRN exposure with a vanilla interest rate
swap. The net effect of this hedge is exposing Company ABC to 50% 6M EURIBOR interest fl ows and 50% fi xed interest
fl ows at a coupon of 1.927%.
The chart below illustrates the impact on the aggregated semi-annual interest fl ows over the next three years under normal
market conditions with that addition of the 50% IR swap coverage:
*HY = Half Year
© 2011 Reval.com, Inc. All Rights Reserved | 8
We can see from the graph that interest fl ows actually increase and an aggregate basis to ~-5.291MM EUR, about 500K
higher than without hedging with an IR swap. This increase can be attributable to the fact that half of the interest fl ows are
locked into a fi xed rate of 1.927%, which is actually higher than the short end of the 6M EURIBOR curve under stable market
conditions. However, in prudent risk management it is not always about minimizing risk under normal market conditions, but
it is more so relevant for risk reduction to adverse market environments.
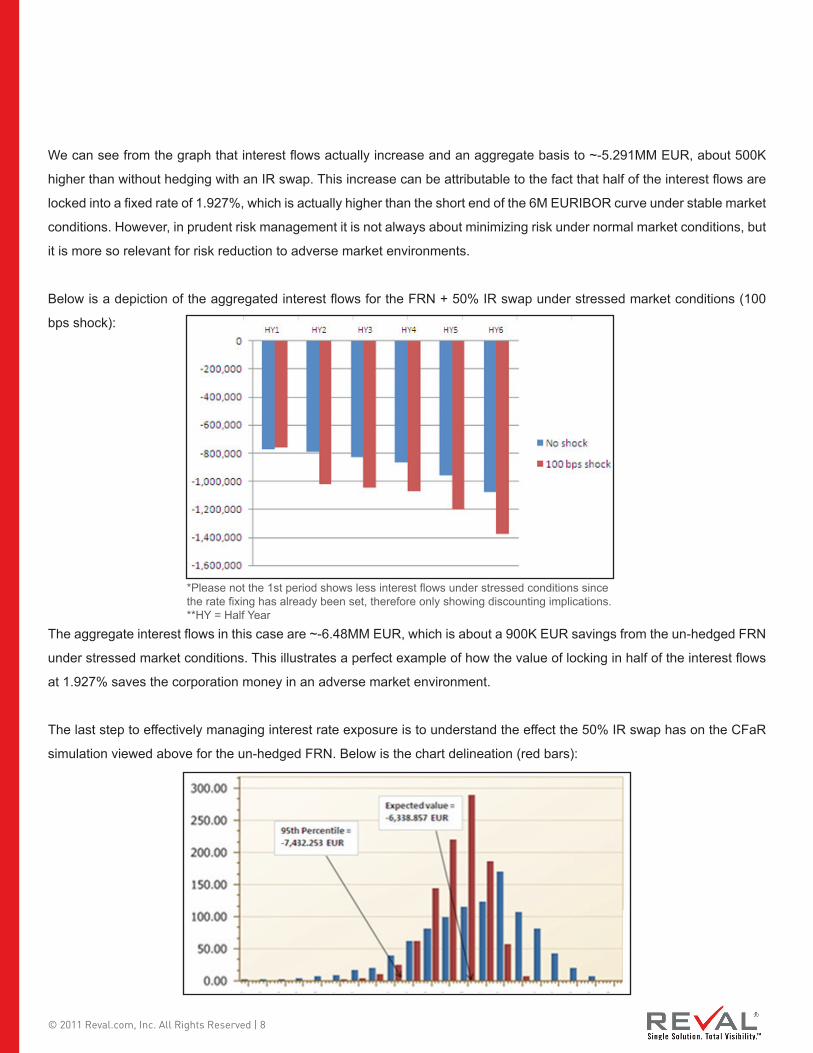
Below is a depiction of the aggregated interest fl ows for the FRN + 50% IR swap under stressed market conditions (100
bps shock):
The aggregate interest fl ows in this case are ~-6.48MM EUR, which is about a 900K EUR savings from the un-hedged FRN
under stressed market conditions. This illustrates a perfect example of how the value of locking in half of the interest fl ows
at 1.927% saves the corporation money in an adverse market environment.
The last step to effectively managing interest rate exposure is to understand the effect the 50% IR swap has on the CFaR
simulation viewed above for the un-hedged FRN. Below is the chart delineation (red bars):
*Please not the 1st period shows less interest fl ows under stressed conditions since the rate fi xing has already been set, therefore only showing discounting implications.**HY = Half Year
© 2011 Reval.com, Inc. All Rights Reserved | 9
In this case, the aggregated interest fl ows over the next 3 years in the worst case scenario (95th percentile) are ~
-7.432MM EUR, which is ~684K EUR savings from the CFaR results from an un-hedged position. It is therefore evident that
layering a 50% interest rate swap is effective in minimizing IR risk exposure in adverse market condition.
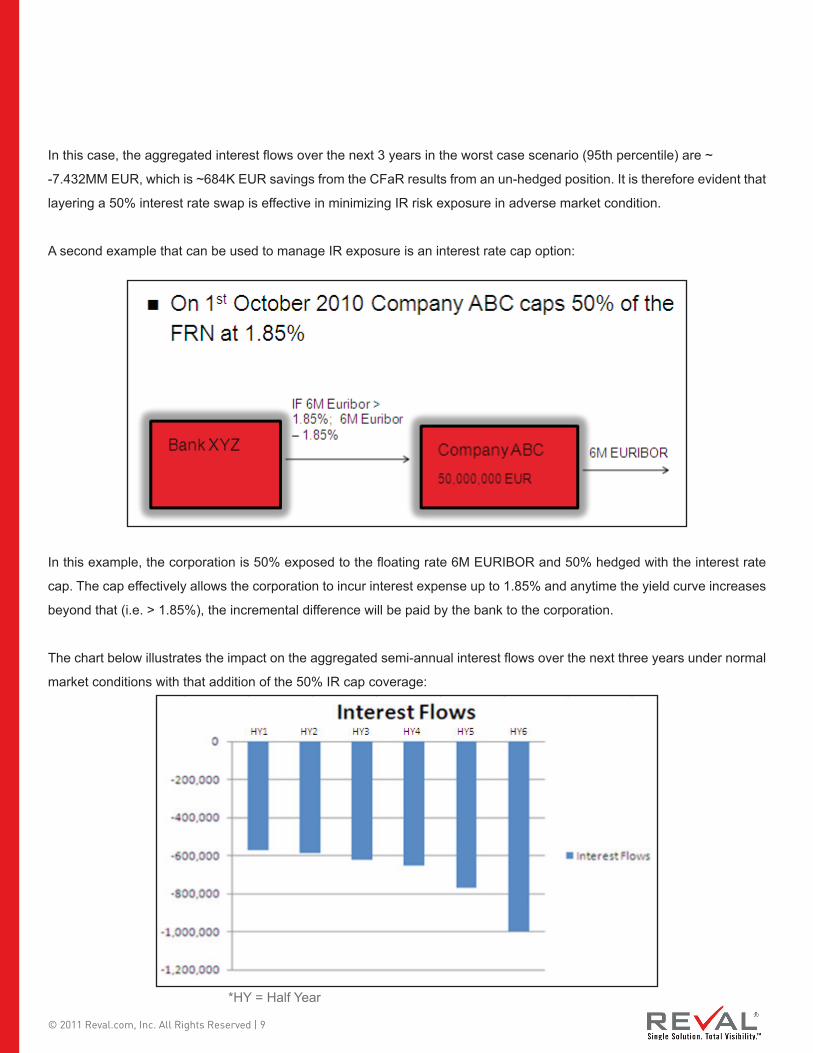
A second example that can be used to manage IR exposure is an interest rate cap option:
In this example, the corporation is 50% exposed to the fl oating rate 6M EURIBOR and 50% hedged with the interest rate
cap. The cap effectively allows the corporation to incur interest expense up to 1.85% and anytime the yield curve increases
beyond that (i.e. > 1.85%), the incremental difference will be paid by the bank to the corporation.
The chart below illustrates the impact on the aggregated semi-annual interest fl ows over the next three years under normal
market conditions with that addition of the 50% IR cap coverage:
*HY = Half Year
© 2011 Reval.com, Inc. All Rights Reserved | 10
We can see from the graph that interest fl ows decrease on an aggregate basis to ~-4.1MM EUR, about 700K less than an
un-hedged position. This decrease also illustrates the benefi t of using an interest rate cap instead of an interest rate swap to
hedge the FRN. Since the optionality of the cap allows the corporation to only fi x the interest rate fl ows in higher yield curve
environments, the corporation still benefi ts from the downside effect of interest rates.
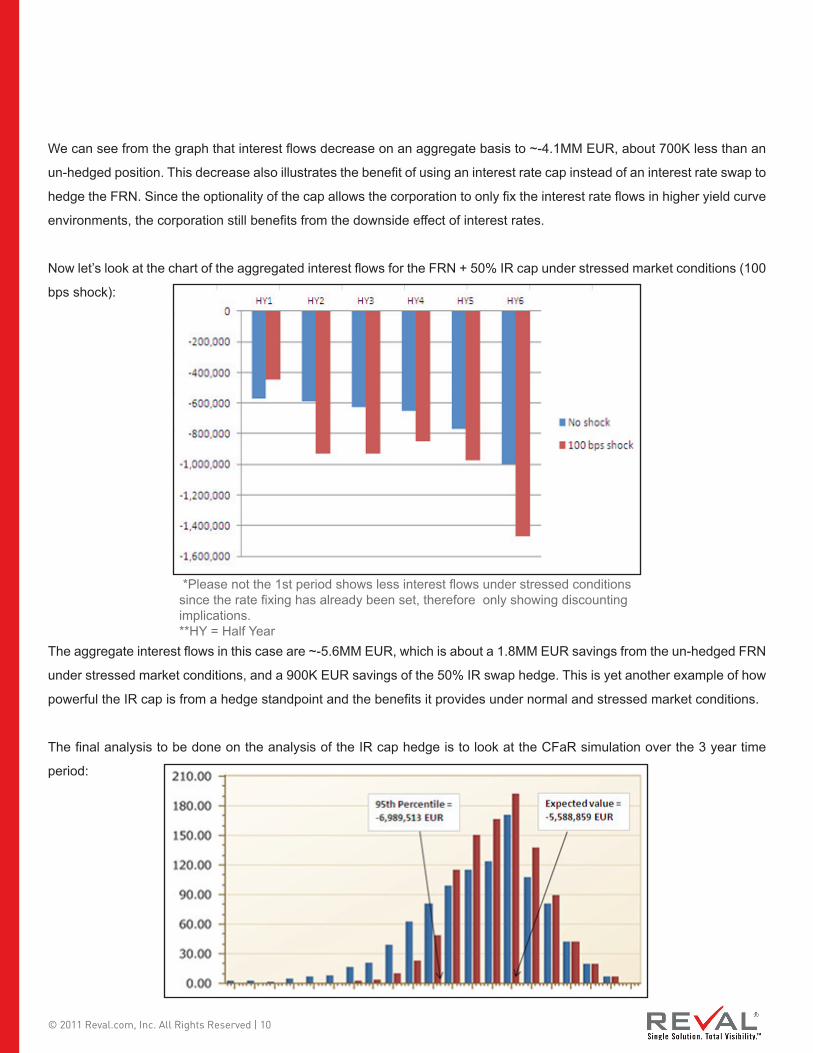
Now let’s look at the chart of the aggregated interest fl ows for the FRN + 50% IR cap under stressed market conditions (100
bps shock):
The aggregate interest fl ows in this case are ~-5.6MM EUR, which is about a 1.8MM EUR savings from the un-hedged FRN
under stressed market conditions, and a 900K EUR savings of the 50% IR swap hedge. This is yet another example of how
powerful the IR cap is from a hedge standpoint and the benefi ts it provides under normal and stressed market conditions.
The fi nal analysis to be done on the analysis of the IR cap hedge is to look at the CFaR simulation over the 3 year time
period:
*Please not the 1st period shows less interest fl ows under stressed conditions since the rate fi xing has already been set, therefore only showing discounting implications.**HY = Half Year
© 2011 Reval.com, Inc. All Rights Reserved | 11
The worst case scenario (95% percentile) cash fl ow at risk of a 50% IR cap hedging the FRN over three years is an
aggregated -6.69MM EUR. Like the stressed market condition, the CFaR was minimized as well using the IR cap hedge,
this time yielding a savings of about 800K EUR over a three year period.
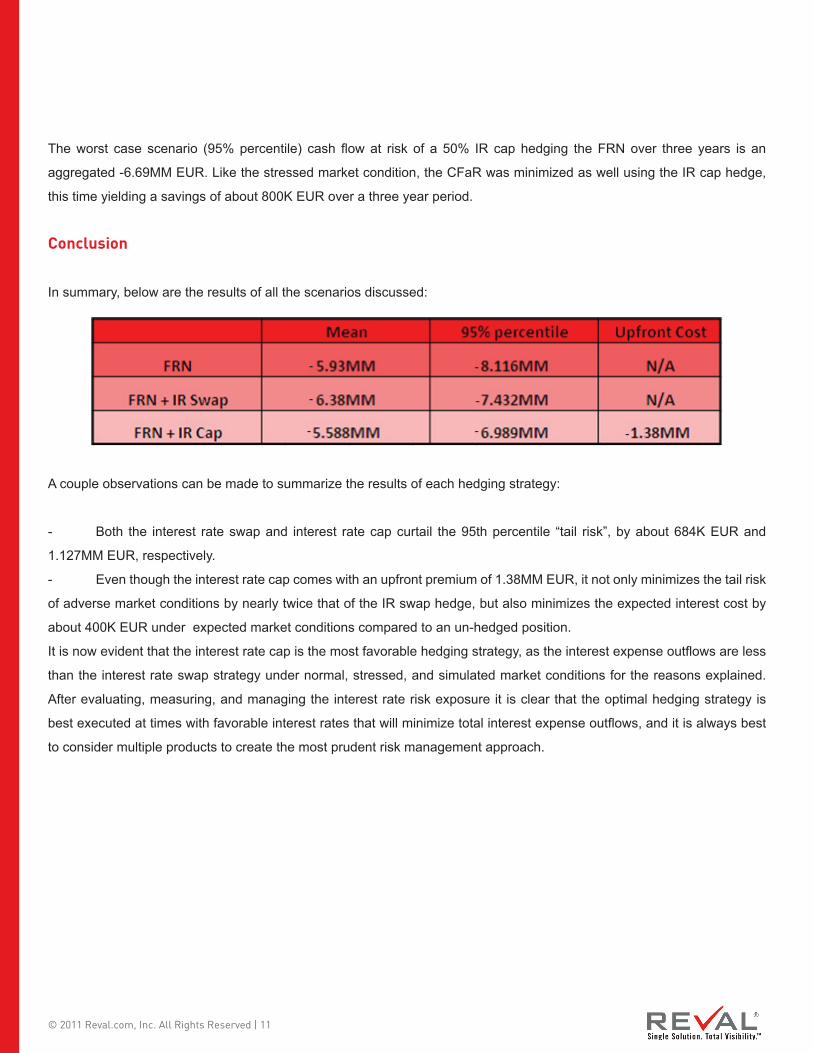
Conclusion
In summary, below are the results of all the scenarios discussed:
A couple observations can be made to summarize the results of each hedging strategy:
- Both the interest rate swap and interest rate cap curtail the 95th percentile “tail risk”, by about 684K EUR and
1.127MM EUR, respectively.
- Even though the interest rate cap comes with an upfront premium of 1.38MM EUR, it not only minimizes the tail risk
of adverse market conditions by nearly twice that of the IR swap hedge, but also minimizes the expected interest cost by
about 400K EUR under expected market conditions compared to an un-hedged position.
It is now evident that the interest rate cap is the most favorable hedging strategy, as the interest expense outfl ows are less
than the interest rate swap strategy under normal, stressed, and simulated market conditions for the reasons explained.
After evaluating, measuring, and managing the interest rate risk exposure it is clear that the optimal hedging strategy is
best executed at times with favorable interest rates that will minimize total interest expense outfl ows, and it is always best
to consider multiple products to create the most prudent risk management approach.
Related Documents