Rev. Integr. Bus. Econ. Res. Vol 4(1) 273 Copyright 2014 Society of Interdisciplinary Business Research (www.sibresearch.org ) ISSN: 2304-1013 (Online); 2304-1269 (CDROM) Does Managerial Overconfidence Influence on Financial Reporting?: The Relationship between Overinvestment and Conditional Conservatism Kookjae Hwang Sogang Univ., Korea [email protected] Myungki Cha * Sogang Univ., Korea [email protected] Youngjun Yeo Sogang Univ., Korea [email protected] ABSTRACT Prior researches report that firms' investment decisions are related to managerial overconfidence. And it also has been said that overconfident CEOs tend to overestimate future returns from their firms’ investments. Based on this line of research, in this paper we investigate whether overconfident CEOs tend to delay loss recognition and use less conservative accounting practices. Based on a sample of 11,906 firm-year observations of Korean listed firms from 2003 to 2011, we obtained a negative relationship between CEO overconfidence and accounting conservatism. In this paper, we used investment decisions of current CEOs as a measure of managerial overconfidence. And as a proxy of accounting conservatism, we used a measures of conditional conservatism based on Basu(1997) and Ball and Schivakumar (2006): Persistence of Earnings Changes Model, Timeliness of Earning to News Model, Cash Flows Model, DD Model, and Jones Model. Managerial overconfidence affects corporate investment, financing and other operating decisions. According to the prior studies, accounting conservatism provides several governance benefits, such as reducing agency problems and improving managerial investment decision, enhancing the efficiency of debt contracts and reducing litigation costs. And it has been reported that managerial overconfidence influence negatively on firm value. This paper contributes to the literature by reporting on the effects of managerial overconfidence on accounting conservatism. Keywords : overconfidence; conservatism; overinvestment; optimism 1. INTRODUCTION

Welcome message from author
This document is posted to help you gain knowledge. Please leave a comment to let me know what you think about it! Share it to your friends and learn new things together.
Transcript

Rev. Integr. Bus. Econ. Res. Vol 4(1) 273
Copyright 2014 Society of Interdisciplinary Business Research (www.sibresearch.org) ISSN: 2304-1013 (Online); 2304-1269 (CDROM)
Does Managerial Overconfidence Influence on Financial Reporting?: The Relationship between Overinvestment and Conditional Conservatism
Kookjae Hwang Sogang Univ., Korea
Myungki Cha*
Sogang Univ., Korea
Youngjun Yeo Sogang Univ., Korea
ABSTRACT
Prior researches report that firms' investment decisions are related to managerial overconfidence. And it also has been said that overconfident CEOs tend to overestimate future returns from their firms’ investments. Based on this line of research, in this paper we investigate whether overconfident CEOs tend to delay loss recognition and use less conservative accounting practices. Based on a sample of 11,906 firm-year observations of Korean listed firms from 2003 to 2011, we obtained a negative relationship between CEO overconfidence and accounting conservatism. In this paper, we used investment decisions of current CEOs as a measure of managerial overconfidence. And as a proxy of accounting conservatism, we used a measures of conditional conservatism based on Basu(1997) and Ball and Schivakumar (2006): Persistence of Earnings Changes Model, Timeliness of Earning to News Model, Cash Flows Model, DD Model, and Jones Model. Managerial overconfidence affects corporate investment, financing and other operating decisions. According to the prior studies, accounting conservatism provides several governance benefits, such as reducing agency problems and improving managerial investment decision, enhancing the efficiency of debt contracts and reducing litigation costs. And it has been reported that managerial overconfidence influence negatively on firm value. This paper contributes to the literature by reporting on the effects of managerial overconfidence on accounting conservatism.
Keywords : overconfidence; conservatism; overinvestment; optimism 1. INTRODUCTION

Rev. Integr. Bus. Econ. Res. Vol 4(1) 274
Copyright 2014 Society of Interdisciplinary Business Research (www.sibresearch.org) ISSN: 2304-1013 (Online); 2304-1269 (CDROM)
Among CEO's main characteristics, overconfidence affects corporate investment, financing, and dividend policies. Previous researches(Roll 1986, Malmendier and Tate 2005, 2008, Ben-David, Graham, and Harvey, 2010) in finance and accounting report that overconfident(or optimistic) CEO explains why firms engage in value-destroying mergers or acquisitions and distortions in other investment, financing, or accounting policies which can be costly. Alternatively, overconfidence can yield benefits under some conditions. For example, it is less costly to motivate overconfident managers to take risk-taking activities than others(Gervais, Heaton, and Odean 2011, Campbell et al. 2011). In this paper we investigate whether overconfident CEO overestimates future
return That is, he would like to delay loss recognition(bad news) and recognize gains(good news) timely (we could say he use less conditionally conservative accounting). For example, negative net present value projects may be erroneously perceived as good projects. More and more, overestimation of future returns may cause overconfident CEOs to overestimate assets’ values such as inventory, accounting receivables, or fixed assets, leading to use less unconditional conservatism. Therefore, we hypothesize that there is a negative relationship between managerial overconfidence and conservatism. We focus on conservatism because it has been argued to provide several
governance benefits, such as reducing agency problems and improving managerial investment decision(Holthausen and Watts 2001; Watts 2003; Ball and Shivakumar 2005), enhancing the efficiency of debt contracts (Ahmed et al. 2002; Zhang 2008), and reducing litigation costs (Watts 2003). Basu(1997) found that earnings reflect bad news more quickly than good news leading to timelier loss recognition which is academically referred as a conditional conservatism(Beaver and Ryan 2005; Ball and Shivakumar 2005). Our tests are based on a sample of 11,906 Korean firms’ firm-years
observations over 2003 to 2011. We use measures related to overinvestment which is a potential result of managerial overconfidence. We classify CEOs as having high optimism if their firm is in the top quintile of firms sorted on capital expenditures to lagged total assets in a given year. This proxy is based on the prior researches of Ben-David, Graham, and Harvey(2010) that firms with overconfident CEOs have larger capital expenditure and the findings of Malmendier and Tate(2005), which says that overconfident CEOs tend to overinvestment in capital projects. We also use measures related to "the higher verification to recognize good news as gains than to recognize bad news as losses (which is called asymmetric timeliness of earning)" which is a proxy of conditional conservatism. Because prior work did not demonstrated the presence of this
effect(overconfidence influences on conservatism), our study contributes to the literature by demonstrating that overconfidence significantly affects conservatism. Managerial overconfidence which immensely influence on selecting investment projects directly or indirectly impinges upon future cash flow affecting its sustainability. Other than overconfidence there are age, gender, academic background, business expertise(industry specialty), the

Rev. Integr. Bus. Econ. Res. Vol 4(1) 275
Copyright 2014 Society of Interdisciplinary Business Research (www.sibresearch.org) ISSN: 2304-1013 (Online); 2304-1269 (CDROM)
extent of media exposure, etc. as managerial characteristics which can be an object of study and other than conservatism, there are earning management, disclosure, credit rating, tax avoidance, etc. as a range of accounting information. Among the above various determinants, we concentrate on the relation between overconfidence and conservatism as a research topic. There are three limitations at least in our study. First, unlike prior studies,
only overinvestment is used as a proxy for managerial overconfidence. Prior researches used the use of the CEO option holding behavior and stock purchases, the executives' investment and financing decisions which are the industry-adjusted excess investment, industry-adjusted net dollars of acquisitions etc. and CEO's portrayal in the media as proxy of managerial overconfidence. Second, while our finding are robust to the use of observable firm-specific control variables, firm fixed effects, industry-adjusted variables, and alternative empirical specifications, we cannot definitely rule out the possibility that our results may be driven by an unidentified factors that is correlated with both conservatism and overconfidence. Third, both overconfidence and conservatism are difficult to measure. Therefore the validity of our inferences is critically dependent on the validity of our proxies for these constructs. The remainder of the paper is organized as follows. Section 2 presents the
discussion of the previous literature and develops the hypotheses. Section 3 presents the research design and data definitions. Section 4 presents the empirical results. Section 5 concludes the paper.
2. LITERATURE REVIEW AND HYPOTHESIS DEVELOPMENT
2.1 Managerial Overconfidence The research question of this paper is to investigate empirically whether
managerial characteristics influence on financial reporting. Even though there are many checks and balances systems such as board of directors, shareholder's meeting, audit committee, outsider directors, compensation commission, etc. there is no doubt that CEO's characteristics have a major effect on corporate decision making. The traditional explanations for CEO's individual characteristics are that they
are pretty flexible and have excellent adaptability depending on industry, macroeconomic circumstance and their specific situations. In case of Apple's i-Phone, the most popular smart-phone in many countries, it has been told that Steven Jobs's unique way of management has brought into a success. And India’s Tata Group's CEO’ philosophy for social welfare named 'Trust-based management' is the secret of its longevity and prosperity. The tone of top CEO1
1Dreng, Hanlon and Maydew(2010) argue that a CEO can affect tax avoidance by setting the “tone of the top” with regard to the firm’s tax activities. For example, some CEOs may change the relative emphasis of different functional areas of the firm and resource allocated to hiring different advisors both within and outside of the firm.

Rev. Integr. Bus. Econ. Res. Vol 4(1) 276
Copyright 2014 Society of Interdisciplinary Business Research (www.sibresearch.org) ISSN: 2304-1013 (Online); 2304-1269 (CDROM)
is usually reflected in the main strategies of his(her) firm and it is important for the interest group of corporation to catch "what kind of individual characteristics does CEO have?" Reporting system on accounting information is typically prepared and informed in the form of financial statements such as quarterly, semi-annual and annual reports and these reports are used extensively in compensation plan, investment management, credit rating, firm valuation and cost of capital determination. Therefore, if managerial characteristics consistently influence on the financial reporting, it is a valid research question which CEO's characteristics have an effect on the accounting information. In the finance literature, an overconfident manager is viewed as a CEO who
systematically overestimates future returns from the firm's projects or equivalently systematically overestimates the likelihood and impact of favorable events on his firms’ cash flows and/or underestimates the likelihood and impact of negative (adverse) events on his firm's cash flows (Heaton, 2002; Malmendier and Tate, 2005)2
Roll(1986) who assert that managerial hubris(i.e., overconfidence) is one explanation for value-destroying mergers and for overpayment for target firms. Heaton(2002) analytically shows that optimistic managers overvalue their firm's projects and equity as well as invest in negative NPV projects mistakenly perceiving them to be positive NPV investments. Malendier and Tate(2005, 2008) find that overconfidence leads to overinvestment and that overconfident managers engage in more acquisitions and value-destroying mergers, using measures of overconfidence based on managers' stock option holding. Cordeiro (2009) and Deshmush, Goel, and Howe(2010) document that overconfident managers tend to pay less dividends than other managers. Malmendier, Tate and Yan(2011) examine evidence consistent with overconfidence leading to distortions in corporate financial policies.
.
Recent study in accounting finds the implications of overconfidence for managerial forecasts of earnings(Hilary and Hsu, 2011; Hribar and Yang, 2011; Libby and Rennekamp, 2012) Among recent works, Schrand and Zechman(2011) document that managerial overconfidence is positively related to the likelihood of financial statement fraud and that higher internal/external monitoring through governance mechanisms does not mitigate this effect. According to Schrand and Zechman(2011), while the initial misstatement may or may not have been intentional, the subsequent misreporting that becomes the subject of SEC enforcement is intentional and of larger magnitude. Thus, an optimistically biased initial misstatement, even if unintentional, starts the executive on a "slippery slope" that leads to a greater probability of misstatement and SEC enforcement action3
2 Overconfidence flame builds upon prominent stylized facts from the social psychology literature, the
"better-than-average" effect(Weinstein, 1980 ; Weinstein and Klein, 1996). This effect extends to economic decision making and managerial behavior (Camerer and Loveallo, 1999)
.
3This description of the slippery slope is consistent with the story described in Myers et al. (2007) whereby managers engage in earnings management to show continued earnings growth with the hope that performance
Rev. Integr. Bus. Econ. Res. Vol 4(1) 277
Copyright 2014 Society of Interdisciplinary Business Research (www.sibresearch.org) ISSN: 2304-1013 (Online); 2304-1269 (CDROM)
2.2 Historical developments and theories of the role of conservatism In a world of uncertainty, managers often possess valuable private knowledge
about firm operations and asset values. If managerial compensation is linked to reported earnings, then managers have incentives to withhold any information on reported earnings that would adversely affect their compensation. Rational claimholders would reduce managerial compensation by the expected effect of such misconduct. The emergence of the conservatism principle and the preparation of audited financial statements can be ascribed to managerial attempts to bond against exploiting their asymmetrically informed position relative to other claimholders. Debtholders and other creditors also demand timely information about 'bad news' because the option value if their claims(Smith, 1979) are more sensitive to a decline than an increase in firm value4
Conservatism is argued to play efficient role in contracting between the parties constituting the firm. In other words, if accounting was not regulated, contracting parties would voluntarily agree that the accounting numbers used to partition cash flows amongst them should be determined conservatively. Consistent with this argument, Leftwich (1983) reports that all departures from GAAP specified in private debt covenants are conservative. FASB (1984), (SFAC 5, Para. 81) describes similar viewpoints to those above, expressing "In assessing the prospect that as yet uncompleted transactions will be concluded successfully, a degree of skepticism is often warranted. Moreover, as a reaction to uncertainty, more stringent requirements historically have been imposed for recognizing revenues and gains than recognizing expenses and losses, and those conservative reactions influence the guidance for applying the recognition criteria to components of earnings".
.
While contracting considerations appear to explain the origins of conservatism, taxation, litigation, finance, political process and regulatory forces have also influenced the degree of conservatism in GAAP. Specially, the Financial Accounting Standards Board (FASB) has mandated the recognition of formerly off-balance sheet liabilities such as pension, post-retirement health benefit obligations and environment liabilities, along with their associated expenses. The FASB also issued standards for asset impairment recognition. These standards have arguably increased accounting conservatism in 1990s. Both the costly contracting and regulatory rationales can explain the continuing importance of conservatism in GAAP. Accounting experts traditionally noted conservatism by the rule "anticipate
no profits but anticipate all losses". Basu(1997) express this rule as denoting
will improve enough to cover past misstatements. But, if performance does not improve managers seeking to avoid reporting earnings declines are forced to "engage in more aggressive accounting choices." refer to Schrand and Zechman(2011).
4This paragraph is quoted and modified from S. Basu (1997) pp.9.

Rev. Integr. Bus. Econ. Res. Vol 4(1) 278
Copyright 2014 Society of Interdisciplinary Business Research (www.sibresearch.org) ISSN: 2304-1013 (Online); 2304-1269 (CDROM)
accountants' tendency to require a high degree of verification to recognize good news as gains than to recognize bad news as losses. For example, Statement of financial Accounting Concepts(SFAC)2(FASB, 1980), para95 states: "if two estimates of amounts to be received or paid in the future are about equally likely, conservatism dictates using the less optimistic estimate". Lower of cost or market accounting for inventories (Accounting Research
Bulletin(ARB 43) is one example of conservatism. Other examples are the immediate recognition of changes in cost estimates if they results in future expected losses on long-term contracts, but not if they result in increased future profits (ARB45); the asymmetric recognition of the expected future results of discontinued operations(Accounting Principles Board(APB) Opinion 30); and the writing down of physical assets to reflect obsolescence or impairments, but not revaluing them upwards (APB Opinion 6). Thus, conservatism results in greater probability of timely accounting recognition of bad news than good news. On the other hand, conservatism is interpreted broadly as accountants'
preference for accounting methods that lead to lower reported values for shareholders' equity. For example, Belkaoui(1985, p.239) argued that conservatism "implies that preferably the lowest values of assets and revenues and the highest values of liabilities and expenses should be reported". At a conceptual level, FASB(SFAC2, 1980, para. 95) rejects this alternative view, stating: Conservatism no longer requires deferring recognition of income beyond the time that adequate evidence of its existence becomes available or justifies recognizing losses before there adequate evidence that they have been incurred". Financial accounting since early of 20th century has emphasized the income
statement, with a corresponding emphasis on conservatism in the income statement. CAP(1939), (ARB 2) states, " conservatism in the balance sheet is of dubious value if attained at the expense of conservatism in the income statement, which is far more significant"5
Asymmetrically timely loss recognition is an empirically significant property of accounting earning(Basu, 1997), but its implications for standard accruals models, and for model-dependent measures such as "discretionary" accruals and earnings quality, have not been directly addressed in the literature(Ball and Shivakumar, 2005). Evidence of nonlinear relation between accruals and cash flows is implicit in the work of Basu(1997), who reports that cash flow and earnings exhibit different incremental slopes when regressed on positive and negative stock returns, which proxy for gains and losses. A direct implication of the result is that accruals are a piecewise linear function of stock returns, though this implication does not in itself indicate the extent to which linear accrual models, such as the Jones and DD models, are affected by omitting the loss recognition asymmetry. Therefore, we also investigate that conservatism
. From the above and Basu(1997)'s view of point, this research conduct empirical tests on earnings, rather than on the statement of financial position.
5This paragraph is quoted from Basu(1997, p.7~8).

Rev. Integr. Bus. Econ. Res. Vol 4(1) 279
Copyright 2014 Society of Interdisciplinary Business Research (www.sibresearch.org) ISSN: 2304-1013 (Online); 2304-1269 (CDROM)
measurement method by use of accrual accounting functions to recognize unrealized gains and losses (that is, to incorporate them in reported earnings).
2.3 The effect of overconfidence on accounting conservatism Nobody in the world ever thought that Korea would be so successfully
developed in such a short period since the Korean Civil War in 1950. However, we cannot deny that the rapid development has brought side effects such as the cozy relation between politics and economics and corporate governance. The Asian Financial Crisis of 1997 made a significant impact on Korea
corporate governance. Daewoo Group ran into deep financial trouble in 1998 due to the 1997 Asian financial crisis and its poor financial management. It was founded on 22 March 1967 as Daewoo Industrial Cooperation and was dismantled in 1999. Prior to the Asian financial crisis, Daewoo was the second largest conglomerate in Korea after Hyundai Group, followed by LG Group and Samsung. In 1998, when the economic crisis forced most of the chaebol to cut back, but, in fact, Daewoo invested over 380 overseas projects mobilizing US$20 billion by the end of 1997 and added 14 new firms to its existing 275 subsidiaries. While Samsung and LG cut back in the midst of the economic crisis, Daewoo took on 40% more debt. After decades of Asian financial crisis, the liquidity crisis at the STX Group,
Korea’s 13th largest conglomerate, is weighing heavily on creditor banks amid dismal earnings outlook for the banking sector. Over the past year, business groups such as Tong Yang, STX and Woongjin have been on the verge of bankruptcy. Many analysts point out these corporations have common points: the overconfident strategy from wrong corporate governance was the major underlying cause for crisis. Companies specializing in specific products with excellent technology excel in business. The above unlucky companies, whereas, were guided by optimistic management strategy and were diversified into various industries in which they had no experience. It leads to the over-borrowing, over-investment and over-diversification. The cash flow of these Groups started to worsen when it continued to expand investments without making profits. They, therefore, manipulated its financial statement to hide losses. Financial Supervisory Commission of Korea was investigating Daewoo’s massive fraudulent manipulation of financial statement due to Daewoo’s overconfident leadership. Additionally the poor transparency, high debts and low profitability induced by the overconfident strategy from wrong corporate governance caused the chaebol, large family-controlled conglomerates of South Korea, to fall6
Korean companies stories above tell, managerial characteristics strongly influence on their fates. Specially, contrary to the U.S. or European companies which have internally rigid and executively monitoring system such as board of
.
6This paragraph is mainly quoted and adapted from Essays, UK. (November 2013). Kim Woo Choong And
Daewoo Group Economics Essay. Retrieved from http://www.ukessays.com/essays/ economics
Rev. Integr. Bus. Econ. Res. Vol 4(1) 280
Copyright 2014 Society of Interdisciplinary Business Research (www.sibresearch.org) ISSN: 2304-1013 (Online); 2304-1269 (CDROM)
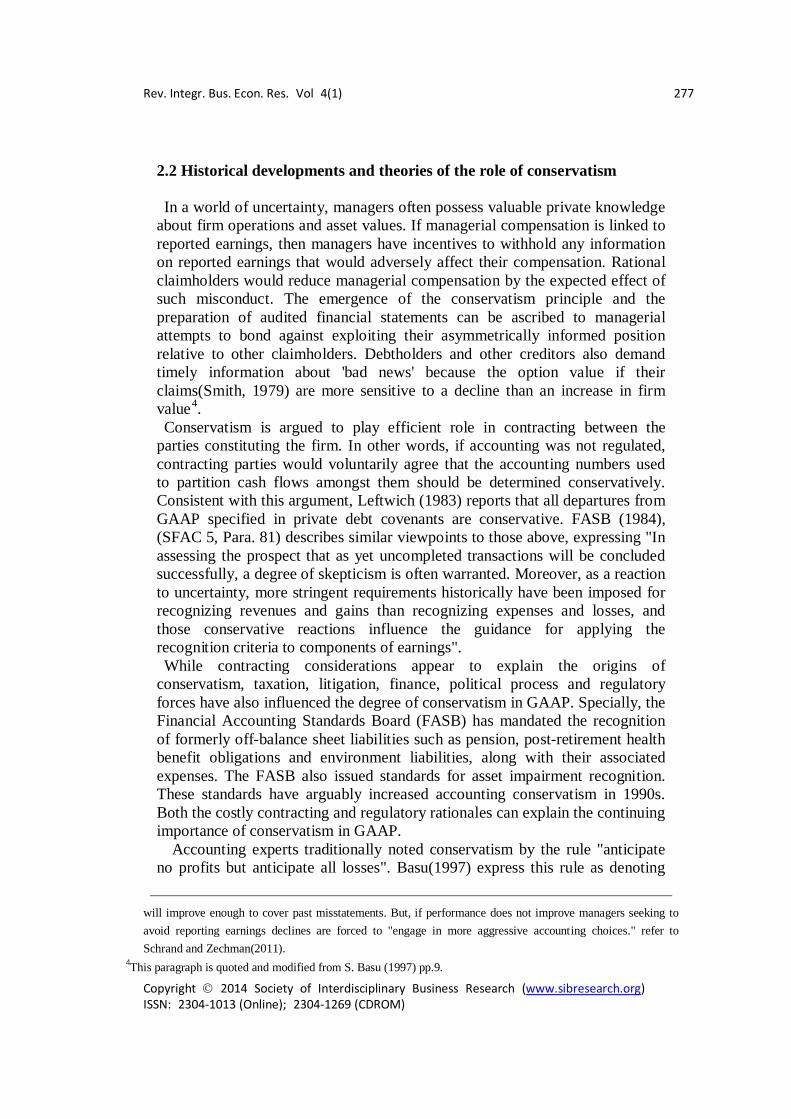
director, compensation committee, audit commission etc., companies in Asia and Korea which has a little experience on operating boards, committees and commissions. Therefore managerial characteristics of companies in Asia and Korea have more influenced on their decision-making or business strategies than those in the U.S. or Europe. Conservatism is viewed as requiring higher verification standard for
recognizing good news than bad news (Basu, 1997; Watts, 2003). Managerial estimates play a critical role in applying conservative accounting. For example, managers estimate the net realizable value of inventory in applying the "lower of cost or market" rule for inventory valuation. Overconfident managers overestimate future returns from their firms' projects. Thus, they are likely to overestimate the probability and magnitude of positive shocks to future cash flows from current projects and underestimate negative or adverse shocks to cash flows. CEOs who overestimate future returns or cash flows from the projects they
carry out currently have implications for their accounting decision-making. They are likely to recognize gain timely and delay losses. Even when they recognize the losses belatedly, they have a tendency of underestimating the degree of these losses. Thus, we hypothesize that overconfident manager would have a tendency of preferring to less conservative financial reporting. This lead to our hypothesis:
H : Managerial overconfidence influence on conservatism negatively. Although the above hypothesis is intuitive, it is possible for overconfidence to
be positively related to conservatism. Among the prior researches, Heaton, Gervais and Odean (2011) argue that overconfident CEOs self-select into risky growth firms. If these firms use more conservative accounting, then a positive relation between conservatism and overconfidence could result because of managers' self-selection. In the consideration of the counter researches, question on accounting conservatism is whether it is negatively related to overconfidence.
3. RESEARCH DESIGN 3.1 Measure of Overconfidence Malmendier and Tate (2005, 2008) and Ben-David, Graham and Harvy (2010)
suggest that firms' investment decisions are related to managerial overconfidence. This demonstrates that these decisions may contain information regarding the level of overconfidence (Campbell et al.: 2011). Thus, we use investment decisions of the current CEOas a measure of overconfidence. Investment-based proxy for overconfidence (CAPEX) is a dichotomous variable set equal to one if the capital expenditures deflated by lagged total assets in a given year is first(upper or top) quintile level among
Rev. Integr. Bus. Econ. Res. Vol 4(1) 281
Copyright 2014 Society of Interdisciplinary Business Research (www.sibresearch.org) ISSN: 2304-1013 (Online); 2304-1269 (CDROM)
capital expenditures deflated by lagged total assets in a given year in total firms' sample years, otherwise zero. This proxy is based on the findings in Ben-David, Graham and Harvy (2010) that firms with overconfident CEOs have larger capital expenditures and the findings of Malmendier and Tate(2005) that overconfident managers tend to overinvest in capital projects7
.
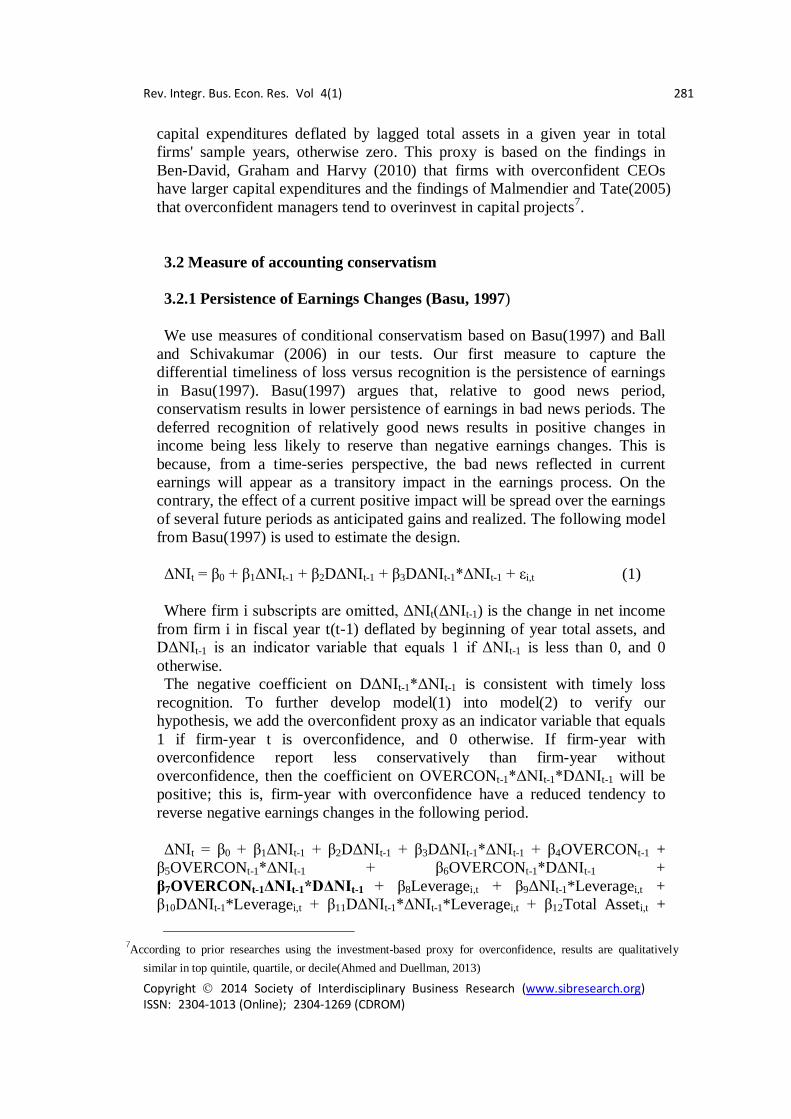
3.2 Measure of accounting conservatism 3.2.1 Persistence of Earnings Changes (Basu, 1997) We use measures of conditional conservatism based on Basu(1997) and Ball
and Schivakumar (2006) in our tests. Our first measure to capture the differential timeliness of loss versus recognition is the persistence of earnings in Basu(1997). Basu(1997) argues that, relative to good news period, conservatism results in lower persistence of earnings in bad news periods. The deferred recognition of relatively good news results in positive changes in income being less likely to reserve than negative earnings changes. This is because, from a time-series perspective, the bad news reflected in current earnings will appear as a transitory impact in the earnings process. On the contrary, the effect of a current positive impact will be spread over the earnings of several future periods as anticipated gains and realized. The following model from Basu(1997) is used to estimate the design. ΔNIt = β0 + β1ΔNIt-1 + β2DΔNIt-1 + β3DΔNIt-1*ΔNIt-1 + εi,t (1) Where firm i subscripts are omitted, ΔNIt(ΔNIt-1) is the change in net income
from firm i in fiscal year t(t-1) deflated by beginning of year total assets, and DΔNIt-1 is an indicator variable that equals 1 if ΔNIt-1 is less than 0, and 0 otherwise. The negative coefficient on DΔNIt-1*ΔNIt-1 is consistent with timely loss
recognition. To further develop model(1) into model(2) to verify our hypothesis, we add the overconfident proxy as an indicator variable that equals 1 if firm-year t is overconfidence, and 0 otherwise. If firm-year with overconfidence report less conservatively than firm-year without overconfidence, then the coefficient on OVERCONt-1*ΔNIt-1*DΔNIt-1 will be positive; this is, firm-year with overconfidence have a reduced tendency to reverse negative earnings changes in the following period. ΔNIt = β0 + β1ΔNIt-1 + β2DΔNIt-1 + β3DΔNIt-1*ΔNIt-1 + β4OVERCONt-1 +
β5OVERCONt-1*ΔNIt-1 + β6OVERCONt-1*DΔNIt-1 + β7OVERCONt-1ΔNIt-1*DΔNIt-1 + β8Leveragei,t + β9ΔNIt-1*Leveragei,t + β10DΔNIt-1*Leveragei,t + β11DΔNIt-1*ΔNIt-1*Leveragei,t + β12Total Asseti,t +
7According to prior researches using the investment-based proxy for overconfidence, results are qualitatively similar in top quintile, quartile, or decile(Ahmed and Duellman, 2013)
Rev. Integr. Bus. Econ. Res. Vol 4(1) 282
Copyright 2014 Society of Interdisciplinary Business Research (www.sibresearch.org) ISSN: 2304-1013 (Online); 2304-1269 (CDROM)
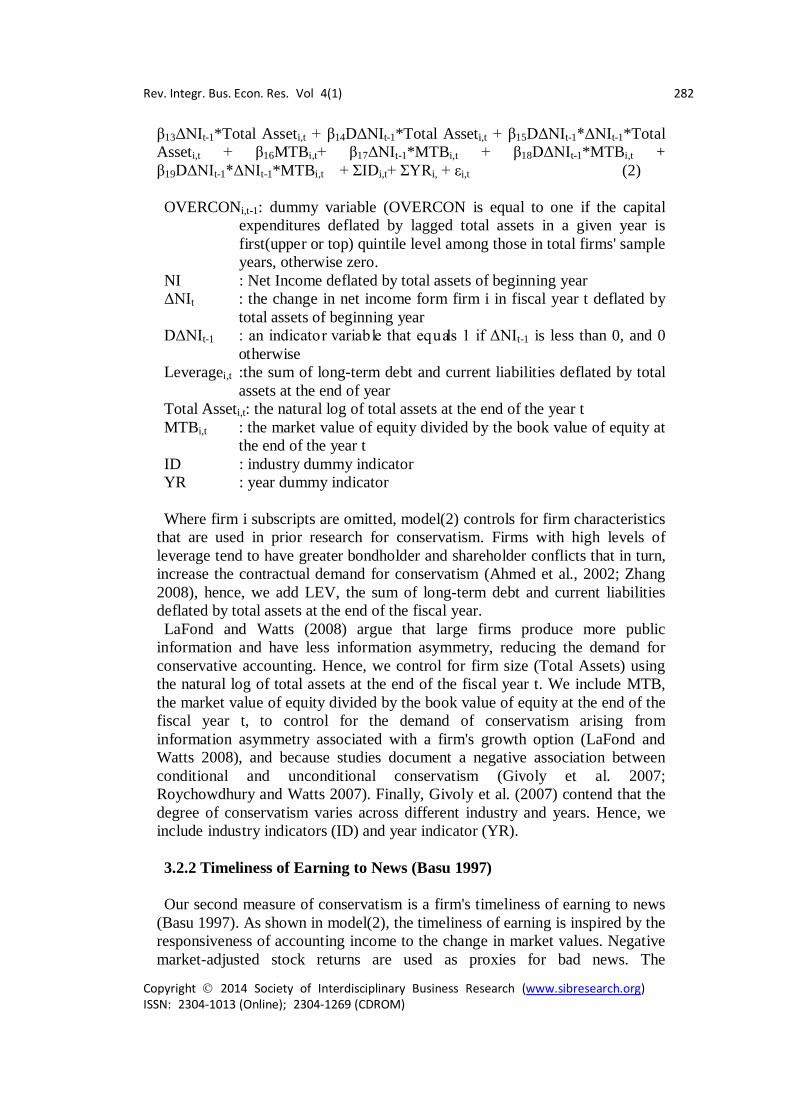
β13ΔNIt-1*Total Asseti,t + β14DΔNIt-1*Total Asseti,t + β15DΔNIt-1*ΔNIt-1*Total Asseti,t + β16MTBi,t+ β17ΔNIt-1*MTBi,t + β18DΔNIt-1*MTBi,t + β19DΔNIt-1*ΔNIt-1*MTBi,t + ΣIDi,t+ ΣYRi, + εi,t (2) OVERCONi,t-1: dummy variable (OVERCON is equal to one if the capital
expenditures deflated by lagged total assets in a given year is first(upper or top) quintile level among those in total firms' sample years, otherwise zero.
NI : Net Income deflated by total assets of beginning year ΔNIt : the change in net income form firm i in fiscal year t deflated by
total assets of beginning year DΔNIt-1 : an indicator variable that equals 1 if ΔNIt-1 is less than 0, and 0
otherwise Leveragei,t :the sum of long-term debt and current liabilities deflated by total
assets at the end of year Total Asseti,t: the natural log of total assets at the end of the year t MTBi,t : the market value of equity divided by the book value of equity at
the end of the year t ID : industry dummy indicator YR : year dummy indicator Where firm i subscripts are omitted, model(2) controls for firm characteristics
that are used in prior research for conservatism. Firms with high levels of leverage tend to have greater bondholder and shareholder conflicts that in turn, increase the contractual demand for conservatism (Ahmed et al., 2002; Zhang 2008), hence, we add LEV, the sum of long-term debt and current liabilities deflated by total assets at the end of the fiscal year. LaFond and Watts (2008) argue that large firms produce more public
information and have less information asymmetry, reducing the demand for conservative accounting. Hence, we control for firm size (Total Assets) using the natural log of total assets at the end of the fiscal year t. We include MTB, the market value of equity divided by the book value of equity at the end of the fiscal year t, to control for the demand of conservatism arising from information asymmetry associated with a firm's growth option (LaFond and Watts 2008), and because studies document a negative association between conditional and unconditional conservatism (Givoly et al. 2007; Roychowdhury and Watts 2007). Finally, Givoly et al. (2007) contend that the degree of conservatism varies across different industry and years. Hence, we include industry indicators (ID) and year indicator (YR). 3.2.2 Timeliness of Earning to News (Basu 1997) Our second measure of conservatism is a firm's timeliness of earning to news
(Basu 1997). As shown in model(2), the timeliness of earning is inspired by the responsiveness of accounting income to the change in market values. Negative market-adjusted stock returns are used as proxies for bad news. The

Rev. Integr. Bus. Econ. Res. Vol 4(1) 283
Copyright 2014 Society of Interdisciplinary Business Research (www.sibresearch.org) ISSN: 2304-1013 (Online); 2304-1269 (CDROM)
asymmetric recognition of economic losses relative to gains is showed by a positive coefficient on DR*R. NI = β0 + β1Ri,t + β2DRi,t + β3DRi,t*Ri,t + εi,t (3) NI is the net income for firm i in fiscal year t, deflated by the
beginning-of-year market value, R is the market-adjusted stock return for firm i over the fiscal year t, and DR is indicator variable that equals 1 if R is less than 0, and 0 otherwise. To verify our hypothesis, we design model (4). Negative coefficient on
OVERCON*R*DR notices that overconfident firm-years indicate lower conservatism than firm-years without such overconfidence; that is, the overconfident firm-years have lower incremental timeliness of earnings to bad news than to good news.
NI = β0 + β1Ri,t + β2DRi,t + β3DRi,t*Ri,t + β4OVERCONt-1 +
β5OVERCONt-1*Ri,t + β6OVERCONt-1*DRi,t + β7OVERCONt-1*Ri,tDRi,t+β8Leveragei,t + β9Ri,t*Leveragei,t + β10DRi,t*Leveragei,t + β11DRi,t*Ri,t*Leveragei,t + β12Total Asseti,t + β13Ri,t*Total Asseti,t + β14DRi,t*Total Asseti,t + β15DRi,t*Ri,t*Total Asseti,t + β16MTBi,t+ β17Ri,t*MTBi,t + β18DRi,t* MTBi,t + β19DRi,t*Ri,t*MTBi,t + ΣIDi,t+ ΣYRi, + εi,t (4)
NI : Net Income deflated by total assets of beginning year R : the market-adjusted stock returns for firm i over the fiscal year t DR : indicator variable that equals 1 if R is less than 0, and 0
otherwise ID : industry dummy indicator YR : year dummy indicator 3.2.3. Accrual-Based Loss recognition (Ball and Shivakumar 2006) With further inspiration of Ball and Shivakumar's research (2005), they
develop a model(2006) to describe the differential timeliness of gain and loss recognition that relies on the correlation between accruals and contemporaneous cash flows. In their regression (2005), as shown in model (5) below, they predict a positive coefficient on DCFOi,t*CFO for accounting conservatism.
ACCi,t = β0 + β1CFOi,t + β2DCFOi,t + β3DCFOi,t*CFOi,t + εi,t (5)
ACC(Accrual) is net income minus operating cash flows for firm i in fiscal year t deflated by beginning-of-year total assets. CFO is operating cash flows for firm i in fiscal year t deflated by beginning-of-year total assets. DCFO is an indicator variable that equals one if CFO is less than 0, and otherwise. To test

Rev. Integr. Bus. Econ. Res. Vol 4(1) 284
Copyright 2014 Society of Interdisciplinary Business Research (www.sibresearch.org) ISSN: 2304-1013 (Online); 2304-1269 (CDROM)
hypothesized asymmetry in relation between accruals and current-period cash flows, Ball and Shivakumar(2005) develop versions of the general piecewise linear regression model(5) the above. With the further development of 2005's model, they specify accrual model(2005) into three models in 2006: Cash flow(CF) Model : ACCi,t = β0 + β1CFOi,t + β2DCFOi,t + β3DCFOi,t*CFOi,t + εi,t (6.1) DD Model (Dechow and Dichev, 2002): ACCi,t = β0 + β1CFOi,t + β2DCFOi,t + β3DCFOi,t*CFOi,t + β4CFOi,t-1 + β5CFOi,t+1 + εi,t (6.2) Jones Model: ACCi,t = β0 + β1CFOi,t + β2DCFOi,t + β3DCFOi,t*CFOi,t + β4△REV,i,t + β5PPEi,t+ εi,t (6.3) Where △REV,i,t is change in total revenue from deflated by firm i in fiscal
year t by ending of year total assets and PPEi,t is the undepreciated acquisition cost of property, plant, and equipment from deflated by firm i in fiscal year t by beginning of year total assets. Based on the Ball and Shivakumar(2006), the above models are estimated first in their linear form, replicating the results of prior studies. The models then are re-estimated in a piecewise linear form, using different proxies for the existence of gains and losses in the current year. To examine the relation between conservatism and managerial overconfidence, we develop and modify models (6.1), (6.2) and (6.3) into the model (7), (8) and (9) under the theoretical ground of Ball and Shivakumar(2006). 3) Cash flow(CF) model
ACCi,t = β0 + β1CFOi,t + β2DCFOi,t + β3DCFOi,t*CFOi,t + β4OVERCONi,t-1 + β5OVERCONi,t-1*CFOi,t + β6OVERCONi,t-1*DCFOi,t + 7OVERCONi,t-1*DCFOi,t*CFOi,t + β8Leveragei,t + β9CFOi,t*Leveragei,t + β10DCFOi,t*Leveragei,t + β11DCFOi,t*CFOi,t*Leveragei,t + β12Total Asseti,t + β13CFOi,t*Total Asseti,t + β14DCFOi,t*Total Asseti,t + β15DCFOi,t*CFOi,t*Total Asseti,t + β16MTBi,t+ β17CFOi,t *MTBi,t + β18DCFOi,t* MTBi,t + β19DCFOi,t*CFOi,t*MTBi,t + ΣYR + ΣIDi,t + εi,t (7.1) 4) DD model ACCi,t = β0 + β1CFOi,t + β2DCFOi,t + β3DCFOi,t*CFOi,t + β4OVERCONi,t-1 + β5OVERCONi,t-1*CFOi,t + β6OVERCONi,t-1*DCFOi,t + β7OVERCONi,t-1*DCFOi,t*CFOi,t + β8Leveragei,t + β9CFOi,t*Leveragei,t + β10DCFOi,t*Leveragei,t + β11DCFOi,t*CFOi,t*Leveragei,t + β12Total Assetit + β13CFOi,t*Total Assetit + β14DCFOi,t*Total Assetit + β15DCFOi,t*CFOi,t*Total Assetit + β16MTBit+ β17CFOi,t *MTBit + β18DCFOi,t* MTBit + β19DCFOi,t*CFOi,t * MTBit + β20CFOi,t-1 + β21CFOi,t+1 + ΣYR + ΣIDi,t + εi,t
(7.2)
Rev. Integr. Bus. Econ. Res. Vol 4(1) 285
Copyright 2014 Society of Interdisciplinary Business Research (www.sibresearch.org) ISSN: 2304-1013 (Online); 2304-1269 (CDROM)
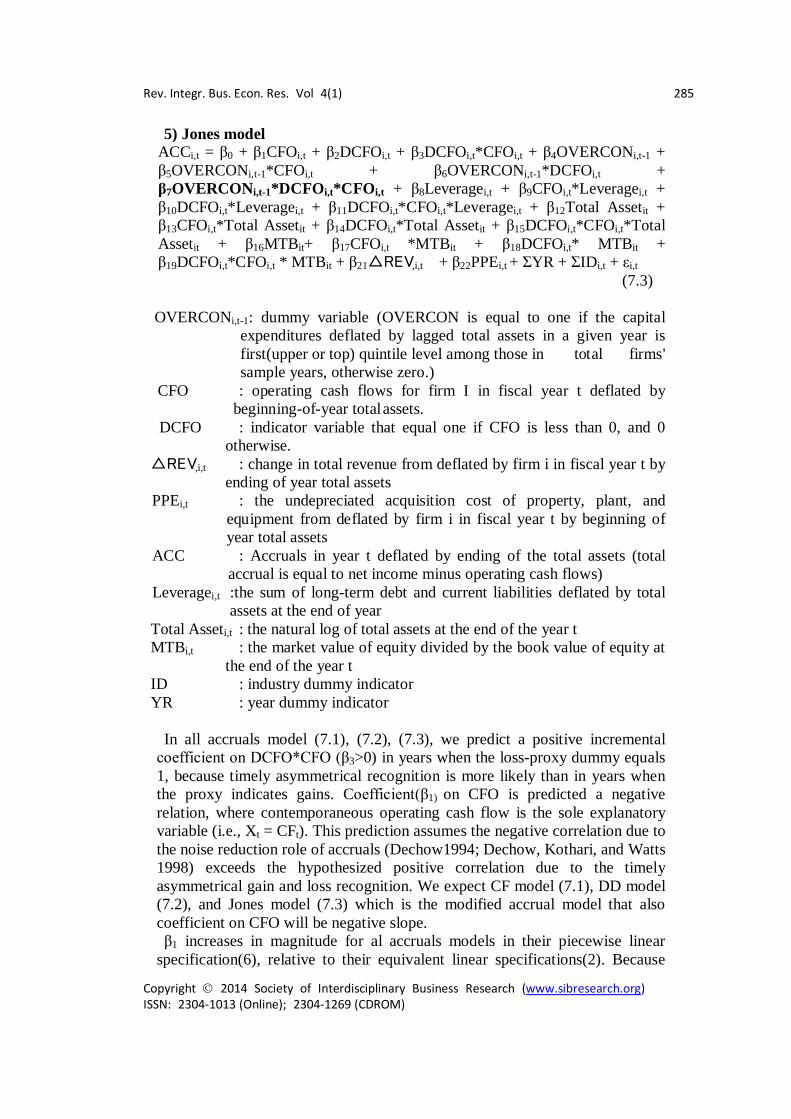
5) Jones model ACCi,t = β0 + β1CFOi,t + β2DCFOi,t + β3DCFOi,t*CFOi,t + β4OVERCONi,t-1 + β5OVERCONi,t-1*CFOi,t + β6OVERCONi,t-1*DCFOi,t + β7OVERCONi,t-1*DCFOi,t*CFOi,t + β8Leveragei,t + β9CFOi,t*Leveragei,t + β10DCFOi,t*Leveragei,t + β11DCFOi,t*CFOi,t*Leveragei,t + β12Total Assetit + β13CFOi,t*Total Assetit + β14DCFOi,t*Total Assetit + β15DCFOi,t*CFOi,t*Total Assetit + β16MTBit+ β17CFOi,t *MTBit + β18DCFOi,t* MTBit + β19DCFOi,t*CFOi,t * MTBit + β21△REV,i,t + β22PPEi,t + ΣYR + ΣIDi,t + εi,t
(7.3) OVERCONi,t-1: dummy variable (OVERCON is equal to one if the capital
expenditures deflated by lagged total assets in a given year is first(upper or top) quintile level among those in total firms' sample years, otherwise zero.)
CFO : operating cash flows for firm I in fiscal year t deflated by beginning-of-year total assets.
DCFO : indicator variable that equal one if CFO is less than 0, and 0 otherwise.
△REV,i,t : change in total revenue from deflated by firm i in fiscal year t by ending of year total assets
PPEi,t : the undepreciated acquisition cost of property, plant, and equipment from deflated by firm i in fiscal year t by beginning of year total assets
ACC : Accruals in year t deflated by ending of the total assets (total accrual is equal to net income minus operating cash flows)
Leveragei,t :the sum of long-term debt and current liabilities deflated by total assets at the end of year
Total Asseti,t : the natural log of total assets at the end of the year t MTBi,t : the market value of equity divided by the book value of equity at
the end of the year t ID : industry dummy indicator YR : year dummy indicator
In all accruals model (7.1), (7.2), (7.3), we predict a positive incremental
coefficient on DCFO*CFO (β3>0) in years when the loss-proxy dummy equals 1, because timely asymmetrical recognition is more likely than in years when the proxy indicates gains. Coefficient(β1) on CFO is predicted a negative relation, where contemporaneous operating cash flow is the sole explanatory variable (i.e., Xt = CFt). This prediction assumes the negative correlation due to the noise reduction role of accruals (Dechow1994; Dechow, Kothari, and Watts 1998) exceeds the hypothesized positive correlation due to the timely asymmetrical gain and loss recognition. We expect CF model (7.1), DD model (7.2), and Jones model (7.3) which is the modified accrual model that also coefficient on CFO will be negative slope. β1 increases in magnitude for al accruals models in their piecewise linear
specification(6), relative to their equivalent linear specifications(2). Because

Rev. Integr. Bus. Econ. Res. Vol 4(1) 286
Copyright 2014 Society of Interdisciplinary Business Research (www.sibresearch.org) ISSN: 2304-1013 (Online); 2304-1269 (CDROM)
there is a positive relation between loss accruals and current cash flows based on the prior research, we estimate the negative correlation between accruals(contains both loss and gain) and current cash flows. If managerial overconfidence results in lower(greater) accounting
conservatism, then the accruals can less(more) effectively and timely reflect the future expectation of negative change of cash flows. Then, β7coefficient on OVERCONi,t-1*DCFOi,t*CFO give us an information ; in case the firm-year is managerial overconfident characteristics, if β7 is negative direction, it shows that overconfident firm-year has influence against accounting conservatism.
3.3. Sample Selection We utilize a sample of Korean firms from 2003 to 2011 which are listed and
publicized at Korean stock exchange market. Using from the Korea Information Service (here in after KIS), we extract accounting data(15,448 firm-years). As our main tests require that we require a financial data, we drop firms that do not have available financial information(2,190 firm-years) and also remove bank and insurance industry firms (761firm-years)from the sample as they have relatively unique financial structures and are subject to regulatory constraints that may affect their reporting. Additional firm-years are removed because fiscal year-end is not December (591 firm-years). We focus on firms that have managerial overconfident firm-year because our main research question investigates the relation between overconfidence and conservatism. We deems a firm-year as managerial overconfident firm-years (2,323 firm-years)to overinvest among full sample years, which the capital expenditures deflated by lagged total assets in a given year is first(upper or top) quintile level among capital expenditures deflated by lagged total assets in a given year in total firms' sample years. Table 1 Sample selection Procedure and Industrial Classification
Panel A. Sample selection Procedure Observation with available KIS data from 2003
to 2011 15,44
8 Less ; firm-years with financial industries (761) 제외;ifirm-years without year-end fiscal years (591) 제외; firm-years with missing available data in
KIS (2,190)
Total firm-year observations used in descriptive statistics and testing H
11,906
Panel B. Sample Distribution by Year Year Full
Sample Overconfident
Sample Year N N %

Rev. Integr. Bus. Econ. Res. Vol 4(1) 287
Copyright 2014 Society of Interdisciplinary Business Research (www.sibresearch.org) ISSN: 2304-1013 (Online); 2304-1269 (CDROM)
2003 1,113 215 19.3 2004 1,220 238 19.5 2005 1,288 251 19.5 2006 1,334 260 19.5 2007 1,400 272 19.4 2008 1,392 272 19.5 2009 1,386 271 19.6 2010 1,374 269 19.6 2011 1,399 275 19.7
Total firm-year observations 11,906 2,323 19.5 Panel C. Samples by Industrial Classification
Classification by industries Full Sample
Overconfident sample
N N % Manufacture of Basic Metal Products1 604 117 19.4 Manufacture of Fabricated Metal
Products, Except Machinery and Furniture 186 35 18.8
Manufacture of Other Machinery and Equipment
763 149 19.5
Wholesale and retail trade 753 146 19.4 Mining and quarrying 196 36 18.4
Manufacture of Food Products 270 54 20.0 Manufacture of Medical, Precision and
Optical Instruments, Watches and Clocks 118 23 19.5
Manufacture of Pharmaceuticals, Medicinal Chemicals and Botanical Products
609 117 19.2
Manufacture of Motor Vehicles, Trailers 545 103 18.9 Other manufacturing 1,775 353 19.9 Professional, scientific and technical
activities 172 32 18.6
Professional Services 358 70 19.6 Manufacture of Electronic Components,
Communication Equipment and Apparatuses
1,850 366 19.8
General and special trade construction 505 96 19.0 Information and communications 471 92 19.5 Publishing activities 473 92 19.5 Computer programming, consultancy and
related activities 112 21 18.8
Manufacture of Basic Chemicals 705 137 19.4 Other industries 1,441 284 19.7

Rev. Integr. Bus. Econ. Res. Vol 4(1) 288
Copyright 2014 Society of Interdisciplinary Business Research (www.sibresearch.org) ISSN: 2304-1013 (Online); 2304-1269 (CDROM)
Total firm-year observations 11,906
2,323 19.5
1) Industrial classification is arranged by index based on Mid-classification of KIS-Value. 4. RESULTS
4.1 Descriptive Statistics and Correlation Analysis Descriptive statistics of the final sample are reported in Table 2 which shows
information on number of samples, mean and descriptive numerical value of median. Using the measure of overconfidence based on the overinvestment, APEX, the mean value of overconfidence is 19.51% because measure of overconfidence is equal that the capital expenditures deflated by lagged total assets in a given year is first(upper or top) quintile level among those in total firms' sample years.
Table 2 Descriptive Statistics
No. of
Sample
Mean Std. Dev. 1% Media
n 99%
OVERCON
11,906
0.1951
0.3963 0.00 0.00 1.00
ΔNIt 11,90
6 -0.003
8 0.198
8 -0.920
8 0.000 0.8544
ΔNIt-1 11,906
-0.0040
0.1887
-0.8611
0.0364
0.8226
DΔNIt-1 11,906
0.4780
0.4995 0.00 0.00 1.0
NI 11,906
-0.0618
0.5101
-3.0429
0.0549
0.5619
R 11,906
0.1454
0.7325
-0.9038
-0.0167
3.5217
DR 11,906
0.5153
0.4997 0 1 1
ACC 11,906
-0.0529
0.1738
-1.0325
-0.0232
0.2625
CFO 11,906
0.0289
0.1172
-0.0205
0.0370
0.3081
DCFO 11,906
0.3273
0.4692 0 0 1.0

Rev. Integr. Bus. Econ. Res. Vol 4(1) 289
Copyright 2014 Society of Interdisciplinary Business Research (www.sibresearch.org) ISSN: 2304-1013 (Online); 2304-1269 (CDROM)
Table 3 shows Pearson correlation coefficients between our overconfidence measure, firm-specific conservatism measures, and control variables. There is a significantly negative correlation between ΔNIt and ΔNIt-1 which are the main variables of Persistence of Earnings Changes Model(Basu, 1997). The net income is positively correlated with the market-adjusted stock return which are the main variables of Timeliness of Earning to News Model(Basu 1997), which is consistent with prior research(Basu 1997). Though we predict the positive correlation between Accrual and CFO which are the main variables of Cash flow Model(Ball and Schivakumar 2006), the result indicate that there is no significant correlation between them statistically. Except the correlations mentioned the above, we do not observe any unusual correlations among the variables in our regressions that warrant concern.
Table 3 Pearson Correlation OVERCON. ΔNIt ΔNIt-1 NI R ACC CFO
OVERCON. 1 0.00 -0.02 0.03 -0.01 -0.00 0.08*** ΔNIt 1 -0.35*** 0.39 0.17*** 0.48*** 0.13***
ΔNIt-1 1 0.12*** 0.016 0.10*** 0.12*** NI 1 0.23*** 0.64*** 0.39*** R 1 0.16*** 0.15***
ACC 1 0.00
CFO 1 ***, **, * denote statistical significance level at the 1, 5 and 10 percent in the
2-tailed tests, respectively. 4.2 Multivariate Regression Results
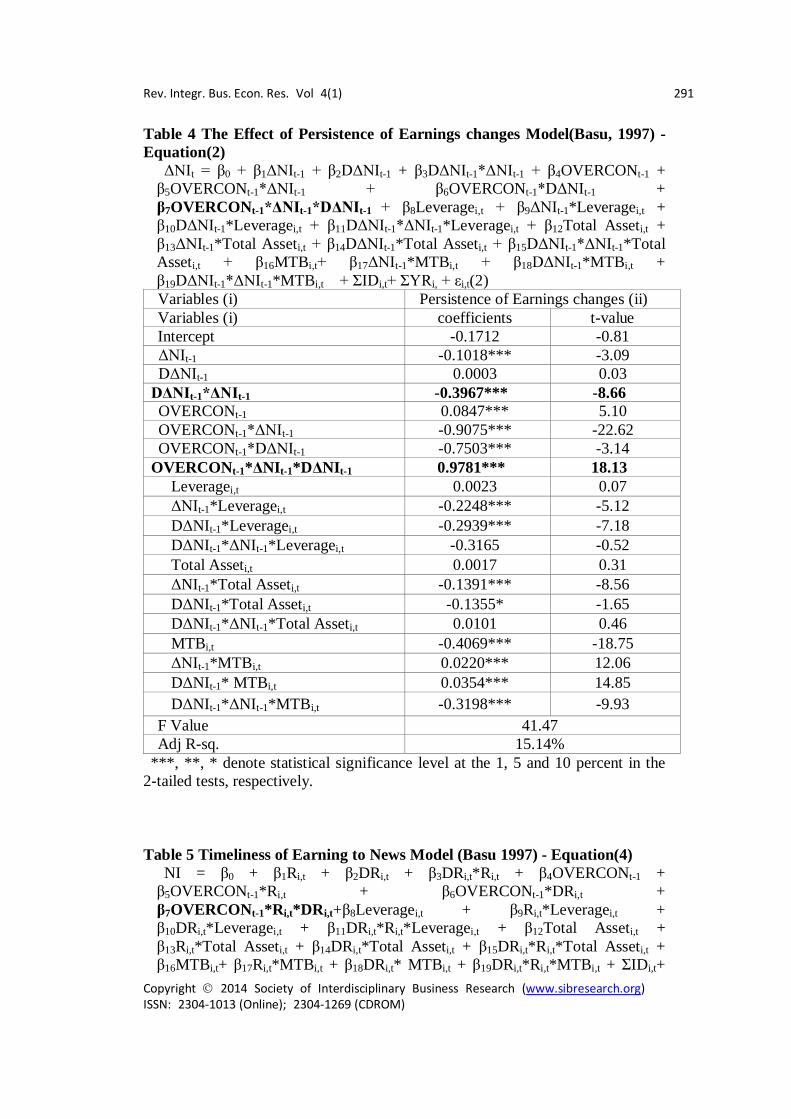
Table 4 presents the results of Hypothesis based on estimation of equation(2):
the persistence of earnings changes measure. All t-values are based on two-tailed significant tests using firms and year clustered standard errors. In column (ii), the effects of managerial overconfidence on asymmetric timeliness of earnings shows that the coefficient on DΔNIt-1*ΔNIt-1 is -0.3967 (t-value : -8.66), This implies that bad news is reflected in earnings on a timelier basis and confirms that financial reporting is conservative in general. We expect overconfident CEOs to accelerate good news recognition and delay loss recognition. The coefficient on OVERCONt-1*DΔNIt-1*ΔNIt-1 is 0.9781(t-value : 18.13), including the OVERCON interactive effects on DΔNIt-1*ΔNIt-1. This result in addition to factors affecting the demand for conservatism implies that managerial overconfident firm-years have a tendency to reverse fairly negative earnings changes in the following period (i.e., are less
Rev. Integr. Bus. Econ. Res. Vol 4(1) 290
Copyright 2014 Society of Interdisciplinary Business Research (www.sibresearch.org) ISSN: 2304-1013 (Online); 2304-1269 (CDROM)
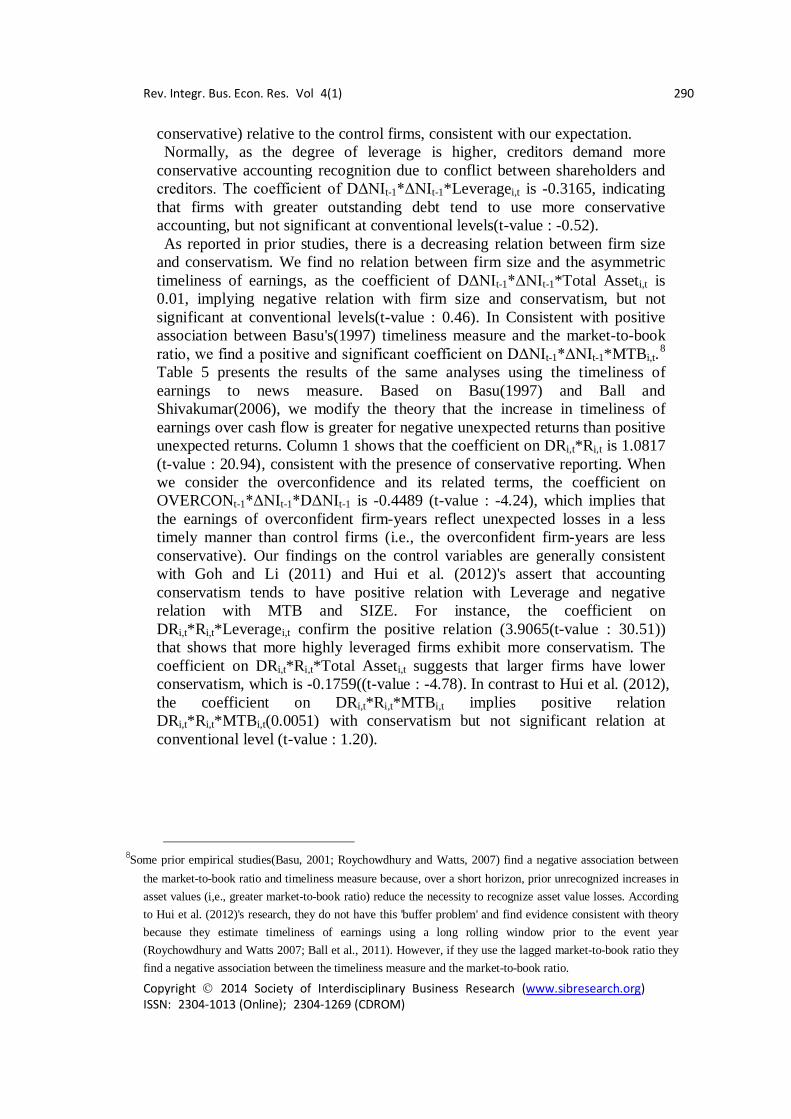
conservative) relative to the control firms, consistent with our expectation. Normally, as the degree of leverage is higher, creditors demand more
conservative accounting recognition due to conflict between shareholders and creditors. The coefficient of DΔNIt-1*ΔNIt-1*Leveragei,t is -0.3165, indicating that firms with greater outstanding debt tend to use more conservative accounting, but not significant at conventional levels(t-value : -0.52). As reported in prior studies, there is a decreasing relation between firm size
and conservatism. We find no relation between firm size and the asymmetric timeliness of earnings, as the coefficient of DΔNIt-1*ΔNIt-1*Total Asseti,t is 0.01, implying negative relation with firm size and conservatism, but not significant at conventional levels(t-value : 0.46). In Consistent with positive association between Basu's(1997) timeliness measure and the market-to-book ratio, we find a positive and significant coefficient on DΔNIt-1*ΔNIt-1*MTBi,t.8
Table 5 presents the results of the same analyses using the timeliness of earnings to news measure. Based on Basu(1997) and Ball and Shivakumar(2006), we modify the theory that the increase in timeliness of earnings over cash flow is greater for negative unexpected returns than positive unexpected returns. Column 1 shows that the coefficient on DRi,t*Ri,t is 1.0817 (t-value : 20.94), consistent with the presence of conservative reporting. When we consider the overconfidence and its related terms, the coefficient on OVERCONt-1*ΔNIt-1*DΔNIt-1 is -0.4489 (t-value : -4.24), which implies that the earnings of overconfident firm-years reflect unexpected losses in a less timely manner than control firms (i.e., the overconfident firm-years are less conservative). Our findings on the control variables are generally consistent with Goh and Li (2011) and Hui et al. (2012)'s assert that accounting conservatism tends to have positive relation with Leverage and negative relation with MTB and SIZE. For instance, the coefficient on DRi,t*Ri,t*Leveragei,t confirm the positive relation (3.9065(t-value : 30.51)) that shows that more highly leveraged firms exhibit more conservatism. The coefficient on DRi,t*Ri,t*Total Asseti,t suggests that larger firms have lower conservatism, which is -0.1759((t-value : -4.78). In contrast to Hui et al. (2012), the coefficient on DRi,t*Ri,t*MTBi,t implies positive relation DRi,t*Ri,t*MTBi,t(0.0051) with conservatism but not significant relation at conventional level (t-value : 1.20).
8Some prior empirical studies(Basu, 2001; Roychowdhury and Watts, 2007) find a negative association between
the market-to-book ratio and timeliness measure because, over a short horizon, prior unrecognized increases in asset values (i,e., greater market-to-book ratio) reduce the necessity to recognize asset value losses. According to Hui et al. (2012)'s research, they do not have this 'buffer problem' and find evidence consistent with theory because they estimate timeliness of earnings using a long rolling window prior to the event year (Roychowdhury and Watts 2007; Ball et al., 2011). However, if they use the lagged market-to-book ratio they find a negative association between the timeliness measure and the market-to-book ratio.
Rev. Integr. Bus. Econ. Res. Vol 4(1) 291
Copyright 2014 Society of Interdisciplinary Business Research (www.sibresearch.org) ISSN: 2304-1013 (Online); 2304-1269 (CDROM)
Table 4 The Effect of Persistence of Earnings changes Model(Basu, 1997) - Equation(2)
ΔNIt = β0 + β1ΔNIt-1 + β2DΔNIt-1 + β3DΔNIt-1*ΔNIt-1 + β4OVERCONt-1 + β5OVERCONt-1*ΔNIt-1 + β6OVERCONt-1*DΔNIt-1 + β7OVERCONt-1*ΔNIt-1*DΔNIt-1 + β8Leveragei,t + β9ΔNIt-1*Leveragei,t + β10DΔNIt-1*Leveragei,t + β11DΔNIt-1*ΔNIt-1*Leveragei,t + β12Total Asseti,t + β13ΔNIt-1*Total Asseti,t + β14DΔNIt-1*Total Asseti,t + β15DΔNIt-1*ΔNIt-1*Total Asseti,t + β16MTBi,t+ β17ΔNIt-1*MTBi,t + β18DΔNIt-1*MTBi,t + β19DΔNIt-1*ΔNIt-1*MTBi,t + ΣIDi,t+ ΣYRi, + εi,t(2) Variables (i) Persistence of Earnings changes (ii) Variables (i) coefficients t-value Intercept -0.1712 -0.81 ΔNIt-1 -0.1018*** -3.09 DΔNIt-1 0.0003 0.03 DΔNIt-1*ΔNIt-1 -0.3967*** -8.66 OVERCONt-1 0.0847*** 5.10 OVERCONt-1*ΔNIt-1 -0.9075*** -22.62 OVERCONt-1*DΔNIt-1 -0.7503*** -3.14
OVERCONt-1*ΔNIt-1*DΔNIt-1 0.9781*** 18.13 Leveragei,t 0.0023 0.07 ΔNIt-1*Leveragei,t -0.2248*** -5.12 DΔNIt-1*Leveragei,t -0.2939*** -7.18 DΔNIt-1*ΔNIt-1*Leveragei,t -0.3165 -0.52 Total Asseti,t 0.0017 0.31 ΔNIt-1*Total Asseti,t -0.1391*** -8.56 DΔNIt-1*Total Asseti,t -0.1355* -1.65 DΔNIt-1*ΔNIt-1*Total Asseti,t 0.0101 0.46 MTBi,t -0.4069*** -18.75 ΔNIt-1*MTBi,t 0.0220*** 12.06 DΔNIt-1* MTBi,t 0.0354*** 14.85 DΔNIt-1*ΔNIt-1*MTBi,t -0.3198*** -9.93
F Value 41.47 Adj R-sq. 15.14%
***, **, * denote statistical significance level at the 1, 5 and 10 percent in the 2-tailed tests, respectively.
Table 5 Timeliness of Earning to News Model (Basu 1997) - Equation(4)
NI = β0 + β1Ri,t + β2DRi,t + β3DRi,t*Ri,t + β4OVERCONt-1 + β5OVERCONt-1*Ri,t + β6OVERCONt-1*DRi,t + β7OVERCONt-1*Ri,t*DRi,t+β8Leveragei,t + β9Ri,t*Leveragei,t + β10DRi,t*Leveragei,t + β11DRi,t*Ri,t*Leveragei,t + β12Total Asseti,t + β13Ri,t*Total Asseti,t + β14DRi,t*Total Asseti,t + β15DRi,t*Ri,t*Total Asseti,t + β16MTBi,t+ β17Ri,t*MTBi,t + β18DRi,t* MTBi,t + β19DRi,t*Ri,t*MTBi,t + ΣIDi,t+

Rev. Integr. Bus. Econ. Res. Vol 4(1) 292
Copyright 2014 Society of Interdisciplinary Business Research (www.sibresearch.org) ISSN: 2304-1013 (Online); 2304-1269 (CDROM)
ΣYRi, + εi,t(4)
Variables(i) Timeliness of Earning to News Model (ii)
Variables(i) coefficients t-value Intercept 0.0501 1.59
Ri,t -0.0023 -0.24 DRi,t 0.1487*** 6.60 DRi,t*Ri,t 1.0817*** 20.94 OVERCONt-1 0.0070 0.24 OVERCONt-1*Ri,t 0.0117 0.47 OVERCONt-1*DRi,t -0.0688 -1.35
OVERCONt-1*Ri,t*DRi,t -0.4489*** -4.24 Leveragei,t -0.3466*** -6.38 Ri,t*Leveragei,t 0.0705*** 3.34 DRi,t*Leveragei,t 0.7950*** 8.88 DRi,t*Ri,t*Leveragei,t 3.9065*** 30.51 Total Asseti,t 0.0329*** 3.43 Ri,t*Total Asseti,t -0.0031 -0.40 DRi,t*Total Asseti,t -0.0347** -2.02 DRi,t*Ri,t*Total Asseti,t -0.1759*** -4.78 MTBi,t -0.0016 -0.64 Ri,t*MTBi,t 0.0010 0.64 DRi,t* MTBi,t 0.0044 1.20 DRi,t*Ri,t*MTBi,t 0.0051 1.20
F Value 105.60 Adj R-sq. 31.24% We repeat the above analyses using the accrual-based loss recognition
measure and present the results in Table 6, 7 and 8. The above Timeliness of Earning to News Model in Basu(1997) is popular and prevalent research design to measure the degree of accounting conservatism. The above model use reverse regression to investigate relation between earning and stock return which is that independent variable is stock return and dependent variable is earning(this is opposite place to normal theory.) This regression shows that how much its stock return do reflect timely accounting earning timely. There, however, are several problems to interpret results through utilizing reverse regression. For instance, Gigler and Hemmer(2001) argue that the firms using more conservative accounting have fewer incentives to make timely voluntary disclosure. Dietrich et al(2007) insist that Basu(1997)'s reverse regression method apply only to the case that stock return cause the accounting earnings. Therefore, to complement Basu(1997) model, we use Ball and
Shivakumar(2006) which is the latest model to measure accounting conservatism. Ball and Shivakumar(2006) document and argue that piecewise linear regressions, incorporating proxies for gains and losses, substantially

Rev. Integr. Bus. Econ. Res. Vol 4(1) 293
Copyright 2014 Society of Interdisciplinary Business Research (www.sibresearch.org) ISSN: 2304-1013 (Online); 2304-1269 (CDROM)
increase the explanatory power of accruals models which are Cash flow model based on Accrual-based Conservatism, DD model (2002) based on Accrual-based Conservatism and Jones model(1991) based on Accrual-based Conservatism and they exhibit substantial attenuation bias and explain substantially less of the variation in accruals. Table 6, 7, 8 presents the results of the same analyses using the accrual-based
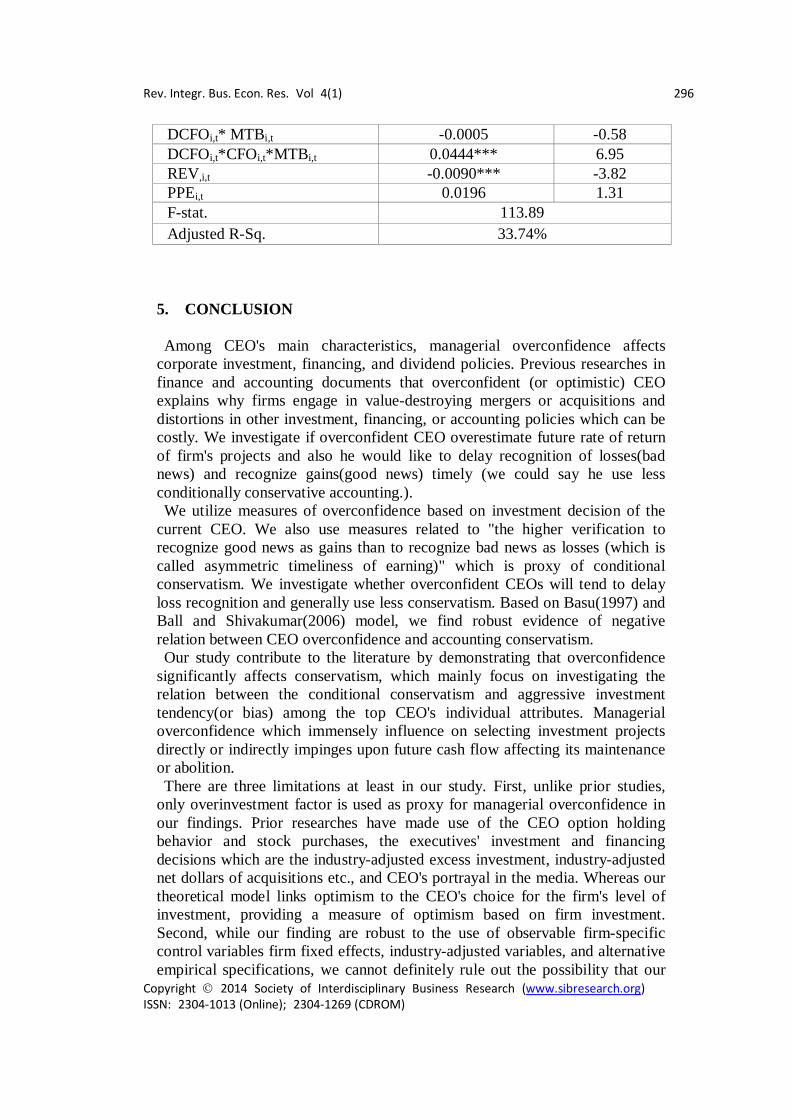
loss recognition measure. Ball and Shivakumar(2006) develop a model to describe the differential timeliness of gain and loss recognition that relies on the correlation between accruals and contemporaneous cash flows. In table 6, 7, and 8, each column 1 shows that the coefficients on DCFOi,t*CFOi,tare 0.0352(t-value : 4.52), 0.9559(t-value : 14.85), and 0.9225(t-value : 14.11) consistent with the presence of conservative reporting. When we consider the overconfidence and its related terms, the coefficients on OVERCONi,t-1*DCFOi,t*CFOi,t (table 6, 7, 8) are -0.2634 (t-value : -2.50), -0.2596((t-value : -2.47), and -0.2640((t-value : -2.51) which imply that the earnings of overconfident firm-years reflect unexpected negative operating cash flows in a less timely manner than control firms (i.e., the overconfident firm-years are less conservative). Our findings on the control variables are generally consistent with Goh and Li (2011) and Hui et al. (2012)'s assert that accounting conservatism tends to have positive relation with Leverage and negative relation with MTB and SIZE. For instance, the coefficients on DCFOi,t*CFOi,t*Leveragei,t(table 6, 7, 8)confirm the positive relation (1.6506 (t-value : 9.31), 1.6245(t-value : 9.17),and 1.6071(t-value : 9.06)) that show that more highly leveraged firms exhibit more conservatism. The coefficients on DCFOi,t*CFOi,t*Total Asseti,t suggest that larger firms have lower conservatism, which is -0.0925(t-value : -2.42), -0.0899(t-value : -2.36),and -0.1226(t-value : -3.15). In contrast to Hui et al. (2012), the coefficients on DCFOi,t*CFOi,t*MTBi,t imply positive relation with conservatism but not significant relation at conventional level.
Table 6 Cash flow model based on Accrual-based Conservatism - Equation(7.1)
ACCi,t = β0 + β1CFOi,t + β2DCFOi,t + β3DCFOi,t*CFOi,t + β4OVERCONi,t-1 + β5OVERCONi,t-1*CFOi,t + β6OVERCONi,t-1*DCFOi,t + β7OVERCONi,t-1*DCFOi,t*CFOi,t + β8Leveragei,t + β9CFOi,t*Leveragei,t + β10DCFOi,t*Leveragei,t + β11DCFOi,t*CFOi,t*Leveragei,t + β12Total Asseti,t + β13CFOi,t*Total Asseti,t + β14DCFOi,t*Total Asseti,t + β15DCFOi,t*CFOi,t*Total Asseti,t + β16MTBi,t+ β17CFOi,t *MTBi,t + β18DCFOi,t* MTBi,t + β19DCFOi,t*CFOi,t*MTBi,t + ΣYR + ΣIDi,t + εi,t (7.1)
Variables (i) Coefficient (ii) t-value Intercept 0.0255** 2.21 CFOi,t -0.6992*** -14.85 DCFOi,t 0.0352*** 4.52 DCFOi,t*CFOi,t 0.9695*** 15.06 OVERCON -0.0059 -0.51

Rev. Integr. Bus. Econ. Res. Vol 4(1) 294
Copyright 2014 Society of Interdisciplinary Business Research (www.sibresearch.org) ISSN: 2304-1013 (Online); 2304-1269 (CDROM)
OVERCONi,t-1*CFO 0.1665* i,t 1.82 OVERCONi,t-1*DCFOi,t 0.0492*** 2.87
OVERCONi,t-1*DCFOi,t*CFOi,t
-0.2634** -2.50
Leveragei,t -0.1057*** -4.61 CFOi,t*Leveragei,t -1.7026*** -9.61 DCFOi,t*Leveragei,t -0.5413*** -19.14 DCFOi,t*CFOi,t*Leveragei,t 1.6506*** 9.31 Total Asseti,t 0.0208*** 5.18 CFOi,t*Total Asseti,t -0.0335 -1.06 DCFOi,t*Total Asseti,t 0.0462*** 7.60 DCFOi,t*CFOi,t*Total Asseti,t -0.0925** -2.42 MTBi,t 0.0017** 2.21 CFOi,t *MTBi,t -0.0248*** -4.16 DCFOi,t* MTBi,t 0.0007 0.76 DCFOi,t*CFOi,t*MTBi,t 0.0393*** 6.29 F-stat. 117.89 Adjusted R-Sq. 33.65%
***, **, * denote statistical significance level at the 1, 5 and 10 percent in the 2-tailed tests, respectively.
Table 7 DD model based on Accrual-based Conservatism - Equation(7.2) ACCi,t = β0 + β1CFOi,t + β2DCFOi,t + β3DCFOi,t*CFOi,t + β4OVERCONi,t-1 +
β5OVERCONi,t-1*CFOi,t + β6OVERCONi,t-1*DCFOi,t + β7OVERCONi,t-1*DCFOi,t*CFOi,t + β8Leveragei,t + β9CFOi,t*Leveragei,t + β10DCFOi,t*Leveragei,t + β11DCFOi,t*CFOi,t*Leveragei,t + β12Total Assetit + β13CFOi,t*Total Assetit + β14DCFOi,t*Total Assetit + β15DCFOi,t*CFOi,t*Total Assetit + β16MTBit+ β17CFOi,t *MTBit + β18DCFOi,t* MTBit + β19DCFOi,t*CFOi,t * MTBit + β20CFOi,t-1 + β21CFOi,t+1 + ΣYR + ΣIDi,t + εi,t (7.2)
Variables (i) Coefficient (ii) t-value Intercept 0.0218* 1.89 CFOi,t -0.7158*** -15.16 DCFOi,t 0.0357*** 4.59 DCFOi,t*CFOi,t 0.9559*** 14.85 OVERCON -0.0061 -0.54 OVERCONi,t-1*CFO 0.1582* i,t 1.73 OVERCONi,t-1*DCFOi,t 0.0478*** 2.80
OVERCONi,t-1*DCFOi,t*CFOi,t
-0.2596** -2.47
Leveragei,t -0.1037*** -4.53 CFOi,t*Leveragei,t -1.6747*** -9.46 DCFOi,t*Leveragei,t -0.5394*** -19.08

Rev. Integr. Bus. Econ. Res. Vol 4(1) 295
Copyright 2014 Society of Interdisciplinary Business Research (www.sibresearch.org) ISSN: 2304-1013 (Online); 2304-1269 (CDROM)
DCFOi,t*CFOi,t*Leveragei,t 1.6245*** 9.17 Total Asseti,t 0.0205*** 5.12 CFOi,t*Total Asseti,t -0.0379 -1.20 DCFOi,t*Total Asseti,t 0.0462*** 7.33 DCFOi,t*CFOi,t*Total Asseti,t -0.0899** -2.36 MTBi,t 0.0018** 2.24 CFOi,t *MTBi,t -0.0248*** -4.14 DCFOi,t* MTBi,t 0.0006 0.71 DCFOi,t*CFOi,t*MTBi,t 0.0389*** 6.23 CFOi,t-1 0.0137 0.96 CFOi,t+1 0.0467*** 5.23 F-stat. 114.26 Adjusted R-Sq. 33.81%
Table 8 Jones model based on Accrual-based Conservatism - Equation(7.3)
ACCi,t = β0 + β1CFOi,t + β2DCFOi,t + β3DCFOi,t*CFOi,t + β4OVERCONi,t-1 + β5OVERCONi,t-1*CFOi,t + β6OVERCONi,t-1*DCFOi,t + β7OVERCONi,t-1*DCFOi,t*CFOi,t + β8Leveragei,t + β9CFOi,t*Leveragei,t + β10DCFOi,t*Leveragei,t + β11DCFOi,t*CFOi,t*Leveragei,t + β12Total Assetit + β13CFOi,t*Total Assetit + β14DCFOi,t*Total Assetit + β15DCFOi,t*CFOi,t*Total Assetit + β16MTBit+ β17CFOi,t *MTBit + β18DCFOi,t* MTBit + β19DCFOi,t*CFOi,t * MTBit + β21REV,i,t + β22PPEi,t + ΣYR + ΣIDi,t + εi,t(7.3)
Variables (i) Coefficient (ii) t-value Intercept 0.0199 1.59 CFOi,t -0.6907*** -14.65 DCFOi,t 0.0338*** 4.33 DCFOi,t*CFOi,t 0.9225*** 14.11 OVERCON -0.0080 -0.69 OVERCONi,t-1*CFO 0.1668* i,t 1.82 OVERCONi,t-1*DCFOi,t 0.0498*** 2.91
OVERCONi,t-1*DCFOi,t*CFOi,t
-0.2640** -2.51
Leveragei,t -0.1124*** -4.87 CFOi,t*Leveragei,t -1.6660*** -9.40 DCFOi,t*Leveragei,t -0.5426*** -19.17 DCFOi,t*CFOi,t*Leveragei,t 1.6071*** 9.06 Total Asseti,t 0.0208*** 5.17 CFOi,t*Total Asseti,t -0.0319 -1.01 DCFOi,t*Total Asseti,t 0.0456*** 7.50 DCFOi,t*CFOi,t*Total Asseti,t -0.1226** -3.15 MTBi,t 0.0025** 3.05 CFOi,t *MTBi,t -0.0315*** -5.07
Rev. Integr. Bus. Econ. Res. Vol 4(1) 296
Copyright 2014 Society of Interdisciplinary Business Research (www.sibresearch.org) ISSN: 2304-1013 (Online); 2304-1269 (CDROM)
DCFOi,t* MTBi,t -0.0005 -0.58 DCFOi,t*CFOi,t*MTBi,t 0.0444*** 6.95 REV,i,t -0.0090*** -3.82 PPEi,t 0.0196 1.31 F-stat. 113.89 Adjusted R-Sq. 33.74%
5. CONCLUSION Among CEO's main characteristics, managerial overconfidence affects
corporate investment, financing, and dividend policies. Previous researches in finance and accounting documents that overconfident (or optimistic) CEO explains why firms engage in value-destroying mergers or acquisitions and distortions in other investment, financing, or accounting policies which can be costly. We investigate if overconfident CEO overestimate future rate of return of firm's projects and also he would like to delay recognition of losses(bad news) and recognize gains(good news) timely (we could say he use less conditionally conservative accounting.). We utilize measures of overconfidence based on investment decision of the
current CEO. We also use measures related to "the higher verification to recognize good news as gains than to recognize bad news as losses (which is called asymmetric timeliness of earning)" which is proxy of conditional conservatism. We investigate whether overconfident CEOs will tend to delay loss recognition and generally use less conservatism. Based on Basu(1997) and Ball and Shivakumar(2006) model, we find robust evidence of negative relation between CEO overconfidence and accounting conservatism. Our study contribute to the literature by demonstrating that overconfidence
significantly affects conservatism, which mainly focus on investigating the relation between the conditional conservatism and aggressive investment tendency(or bias) among the top CEO's individual attributes. Managerial overconfidence which immensely influence on selecting investment projects directly or indirectly impinges upon future cash flow affecting its maintenance or abolition. There are three limitations at least in our study. First, unlike prior studies,
only overinvestment factor is used as proxy for managerial overconfidence in our findings. Prior researches have made use of the CEO option holding behavior and stock purchases, the executives' investment and financing decisions which are the industry-adjusted excess investment, industry-adjusted net dollars of acquisitions etc., and CEO's portrayal in the media. Whereas our theoretical model links optimism to the CEO's choice for the firm's level of investment, providing a measure of optimism based on firm investment. Second, while our finding are robust to the use of observable firm-specific control variables firm fixed effects, industry-adjusted variables, and alternative empirical specifications, we cannot definitely rule out the possibility that our

Rev. Integr. Bus. Econ. Res. Vol 4(1) 297
Copyright 2014 Society of Interdisciplinary Business Research (www.sibresearch.org) ISSN: 2304-1013 (Online); 2304-1269 (CDROM)
results may be driven by an unidentified factors that is correlated with both conservatism and overconfidence. Third, both overconfidence and conservatism are difficult to measure and therefore the validity of our inferences is critically dependent on the validity of our proxies for these constructs.
REFERENCES
[1] Ahmed, A. S., and S. Duellman.,(2013), "Managerial Overconfidence and Accounting Conservatism.", Journal of Accounting Research 51, 1-30
[2] Ahmed, A. S., and S. Duellman.,(2007), "Accounting Conservatism and Board of Director Characteristics: An Empirical Analysis.", Journal of Accounting and Economics 43, 411-437
[3] Ball, R., and L. Shivakumar, (2005), "Earning Quality in UK private firms: comparative loss recognition timeliness.”, Journal of Accounting and Economics 39, 83-128.
[4] Ball, R., and L. Shivakumar, (2006), “The Role of Accruals in Asymmetrically Timely Gain and Loss Recognition.”, Journal of Accounting Research 44 (2) : 207-242
[5] Ball, R., and L. Shivakumar, (2008), "Earning Quality at initial public offerings.”, Journal of Accounting and Economics 45, 324-349.
[6] Basu, S.(1997), "The conservatism principle and the asymmetric timeliness of earnings.", Journal of Accounting and Economics 24, 3-37.
[7] Beaver, W. H., and S. G. Ryan. (2005), "Conditional and unconditional conservatism: Concepts and modeling." Review of Accounting Studies 10(2-3), 269-309
[8] Ben-David, I., J. R. Graham and C. R. Harvey. (2010),"Managerial Miscalibration."Working paper, Duke University, 2010.
[9] Cambell, T. C., M. Galleyer, S. A. Johnson, J.Rutherford and B. W. Stanley.(2011) "CEO Optimism and Forced Turnover.", Journal of Financial Economics 101, 695-712
[10] Deshmukh, S, A. Goel. and K. Howe. (2010), "CEO Overconfidence and Dividend Policy." Working paper, DePaul University.
[11] Gervais S., J. B. Heaton, and T. Odean. (2011), "Overconfidence, Compensation Contracts, and Capital Budgeting." Journal of Finance 66, 1735-1777.
[12] Givoly, D., C. Hayn, and A. Natarajan.(2007) "Measuring Reporting Conservatism." The Accounting Review 82, 65-106
[13] Goh B. W., and D. Li. (2011), "Internal Control and Conditional Conservatism." The Accounting Review 86, 975-1005
[14] Graham, J. R., S. Li, and J.Qiu. (2012) "Managerial Attributes and Executive Compensation." The Review of financial Studies 24, 144-186
[15] Hilary, G., and C. Hsu. (2011), "Endogenous Overconfidence in Managerial Forecasts." Journal of Accounting and Economics 51, 300-313
[16] Hribar, P. and H. Yang (2012), "CEO Overconfidence and Management
Rev. Integr. Bus. Econ. Res. Vol 4(1) 298
Copyright 2014 Society of Interdisciplinary Business Research (www.sibresearch.org) ISSN: 2304-1013 (Online); 2304-1269 (CDROM)
Forecasting.", Working paper, University of Iowa. [17] Khan, M., and R. L. Watts. (2009), "Estimation and empirical properties of a
firm-year measure of accounting conservatism." Journal of Accounting and Economics 48,132-150
[18] Kim M. I, Choi J. H and Seo M. J.(2008), "The Association between Abnormal Audit and Non-Audit Fees and Conservatism of Client Firms", Korean Accounting Research, 175-210. (Printed in Korean)
[19] Lafond R., and S. Roychowdhry (2008), "Managerial Ownership and Accounting Conservatism."Journal of Accounting Research 46, 101-135
[20] Lafond R., and R. L. Watts.(2008), "The Information Role of Conservatism.", The Accounting Review 83, 447-478
[21] Libby, R., and K. Pennekamp.(2012), "Self-Serving Attribution Bias, Overconfidence, and Issuance of Management Forecasts." Journal of Accounting Research 50, 197-231
[22] Malmendier, U., and G. Tate, (2008), "Who makes acquisitions? CEO overconfidence and the market's reaction.”, Journal of Financial Economics 89, 20-43.
[23] Malmendier, U., and G. Tate,(2005), "CEO overconfidence and Corporate Investment.", Journal of Finance 60(Dec.), 2661-2700.
[24] Malmendier, U., G. Tate, and J. Yan(2011), "Overconfidence and Early Life Experiences: The effect of Managerial Traits on Corporate Financial Policies.", Journal of Finance 66, 1687-1733.
[25] Ruddock, C., S. Taylor, and S. Taylor, (2006), "Non-Audit Service and Earnings Conservatism: Is Auditor Independence Impaired?"Contemporary Accounting Research 23(3): 701-746
[26] Schrand, C. M., and S. L. Zechman, (2011), "Executive Overconfidence and the Slippery Slope to Financial Misreporting."Journal of Accounting and Economics, 53, 311-329
Related Documents