Siting Analysis for Underwater Compressed Air Energy Storage: A Case Study in the Gulf of Maine Gabriel E. Colón Reyes, Universidad de Puerto Rico, Mayagüez Carson Pete, Ph.D. Student Mentor, University of Massachusetts, Amherst Dr. Jon McGowan, Professor Advisor, University of Massachusetts, Amherst 1. Objectives • Find the optimal offshore Underwater Compressed Air Energy Storage (UW – CAES) locations in the Gulf of Maine when engineering, environmental, and social parameters are taken into consideration. • Evaluate the energy storage resource potential for these locations. • Determine any environmental implications and what species have the potential to be affected by this technology. 6. References 5. Applications This project is a leading step in the development of offshore energy storage technologies in the USA, and in the world. The implementation of this technology will day represent a way to store and use renewable energy sources, like offshore wind, more efficiently and effectively. 2. Background Renewable energy, like offshore wind, has some inherent grid integration problems due to its intermittent nature and also due to the potential negative impacts of siting energy facilities with coastal stakeholders. In order to help with this, UW – CAES is taken into consideration. UW – CAES has proven to be an effective way to store electrical energy in the form of compressed air, therefore it could help manage the intermittency of renewables [1]. Figure 1. Adiabatic UW–CAES process [1]. For this project, ArcGIS, a geospatial analysis program, was used to do a site suitability analysis in the Gulf of Maine (GoM), and determine the resource potential for different air compression techniques when considering engineering, environmental, and siting parameters. These include: electrical grid interconnect points, water depths, fishing and protected environmental areas, commercial boating lanes, and recreational use areas. M G C HX HX T UW Storage Thermal Storage 3. Methods Implementation and Analysis in ArcGIS Thermo Analysis Weighted Parameter Areas GIS Layers Social Environmental Engineering Bathymetry Marine Life Recreation W C P 0 ΔV = γ γ − 1 β 1 − β γ − 1 γ # $ % % & ' ( ( 1 0 1 C W P V γ γ β β γ = − Δ − ( ) 0 ln ISO W P V β β = Δ Optimal Locations Storage Resource Potential Figure 2. Top-down schematic of research procedure. Environmental Implications This work is supported in part by the National Science Foundation under NSF award number 1460461. Any opinions, findings, conclusions, or recommendations expressed in this material are those of the authors and do not necessarily reflect those of the National Science Foundation. 4. Analysis and Results Figure 3. The optimal UW–CAES areas in the GoM having a storage density class greater than 4. These areas were selected based on highest energy storage density while considering selected parameters and exclusions [2][3]. Region Class 7 Class 6 Class 5 Total Area km 2 Capacity GWh Area km 2 Capacity GWh Area km 2 Capacity GWh Area km 2 Capacity GWh 1 0 0 72 306 1,499 4,854 1,571 5,159 2 0 0 987 4,192 4,855 15,720 5,842 19,912 3 0 0 169 718 3,660 11,851 3,829 12,568 4 0 0 14 59 1,960 6,346 1,974 6,405 5 211 1,143 536 2,276 370 1,198 1,117 4,605 Table 1. Adiabatic UW – CAES Capacity for selected cases. Figure 4. Sightings of North Atlantic Right Whale during Spring [4]. Right Whale Sightings Winter Spring Summer Fall Area 1 10 – 100 10 – 100 1 – 10 1 – 10 Area 2 0 1 – 10 0 0 Area 3 0 10 – 100 10 – 100 0 Table 2. Example of Environmental Siting Implications. Area 3 Area 1 Area 2 Area 1 1. Kahrobaee, S., & Asgarpoor, S. (n.d.). Optimum planning and operation of compressed air energy storage with wind energy integration. 2013 North American Power Symposium (NAPS). 2. Maps were created using ArcGIS® software by Esri. ArcGIS® and ArcMap™ are the intellectual property of Esri and are used herein under license. Copyright © Esri. All rights reserved. For more information about Esri® software, please visit www.esri.com. 3. Source GIS Map Data: NE-ISO, NREL, NOAA CSC, NGDC and NMSP, Esri, DeLome, GEBCO, U.S. Census Bureau, USGS, BOEM, and SeaPlan 2012 Northeast Recreational Boater Survey. 4. Right Whale Consortium. North Atlantic Right Whale Consortium Sightings Database, 2010. New England Aquarium, Boston, MA.

Welcome message from author
This document is posted to help you gain knowledge. Please leave a comment to let me know what you think about it! Share it to your friends and learn new things together.
Transcript
Siting Analysis for Underwater Compressed Air Energy Storage: A Case Study in the Gulf of Maine
Gabriel E. Colón Reyes, Universidad de Puerto Rico, Mayagüez Carson Pete, Ph.D. Student Mentor, University of Massachusetts, Amherst
Dr. Jon McGowan, Professor Advisor, University of Massachusetts, Amherst
1. Objectives • Find the optimal offshore Underwater Compressed Air Energy Storage
(UW – CAES) locations in the Gulf of Maine when engineering, environmental, and social parameters are taken into consideration.
• Evaluate the energy storage resource potential for these locations. • Determine any environmental implications and what species have the
potential to be affected by this technology.
6. References
5. Applications This project is a leading step in the development of offshore energy storage
technologies in the USA, and in the world. The implementation of this technology will day represent a way to store and use renewable energy sources, like offshore wind, more efficiently and effectively.
2. Background Renewable energy, like offshore wind, has some inherent grid integration problems due to its intermittent nature and also due to the potential negative impacts of siting energy facilities with coastal stakeholders. In order to help with this, UW – CAES is taken into consideration. UW – CAES has proven to be an effective way to store electrical energy in the form of compressed air, therefore it could help manage the intermittency of renewables [1]. Figure 1. Adiabatic UW–CAES process [1]. For this project, ArcGIS, a geospatial analysis program, was used to do a site suitability analysis in the Gulf of Maine (GoM), and determine the resource potential for different air compression techniques when considering engineering, environmental, and siting parameters. These include: electrical grid interconnect points, water depths, fishing and protected environmental areas, commercial boating lanes, and recreational use areas.
M GC
HX HX
T
UW Storage
Thermal Storage
3. Methods
Implementation and Analysis in
ArcGIS
Thermo Analysis
Weighted Parameter
Areas GIS Layers
Social
Environmental
Engineering Bathymetry
Marine Life
Recreation
WC
P0ΔV=
γγ −1
β 1−βγ−1γ
#
$%%
&
'((
1
0 1CW
P Vγγ
β βγ
⎛ ⎞⎛ ⎞= −⎜ ⎟⎜ ⎟⎜ ⎟⎜ ⎟Δ − ⎝ ⎠⎝ ⎠
( )0
lnISOWP V
β β=Δ
Optimal Locations
Storage Resource Potential
Figure 2. Top-down schematic of research procedure.
Environmental Implications
This work is supported in part by the National Science Foundation under NSF award number 1460461. Any opinions, findings, conclusions, or recommendations expressed in this material are those of the authors and do not necessarily reflect those of the National Science Foundation.
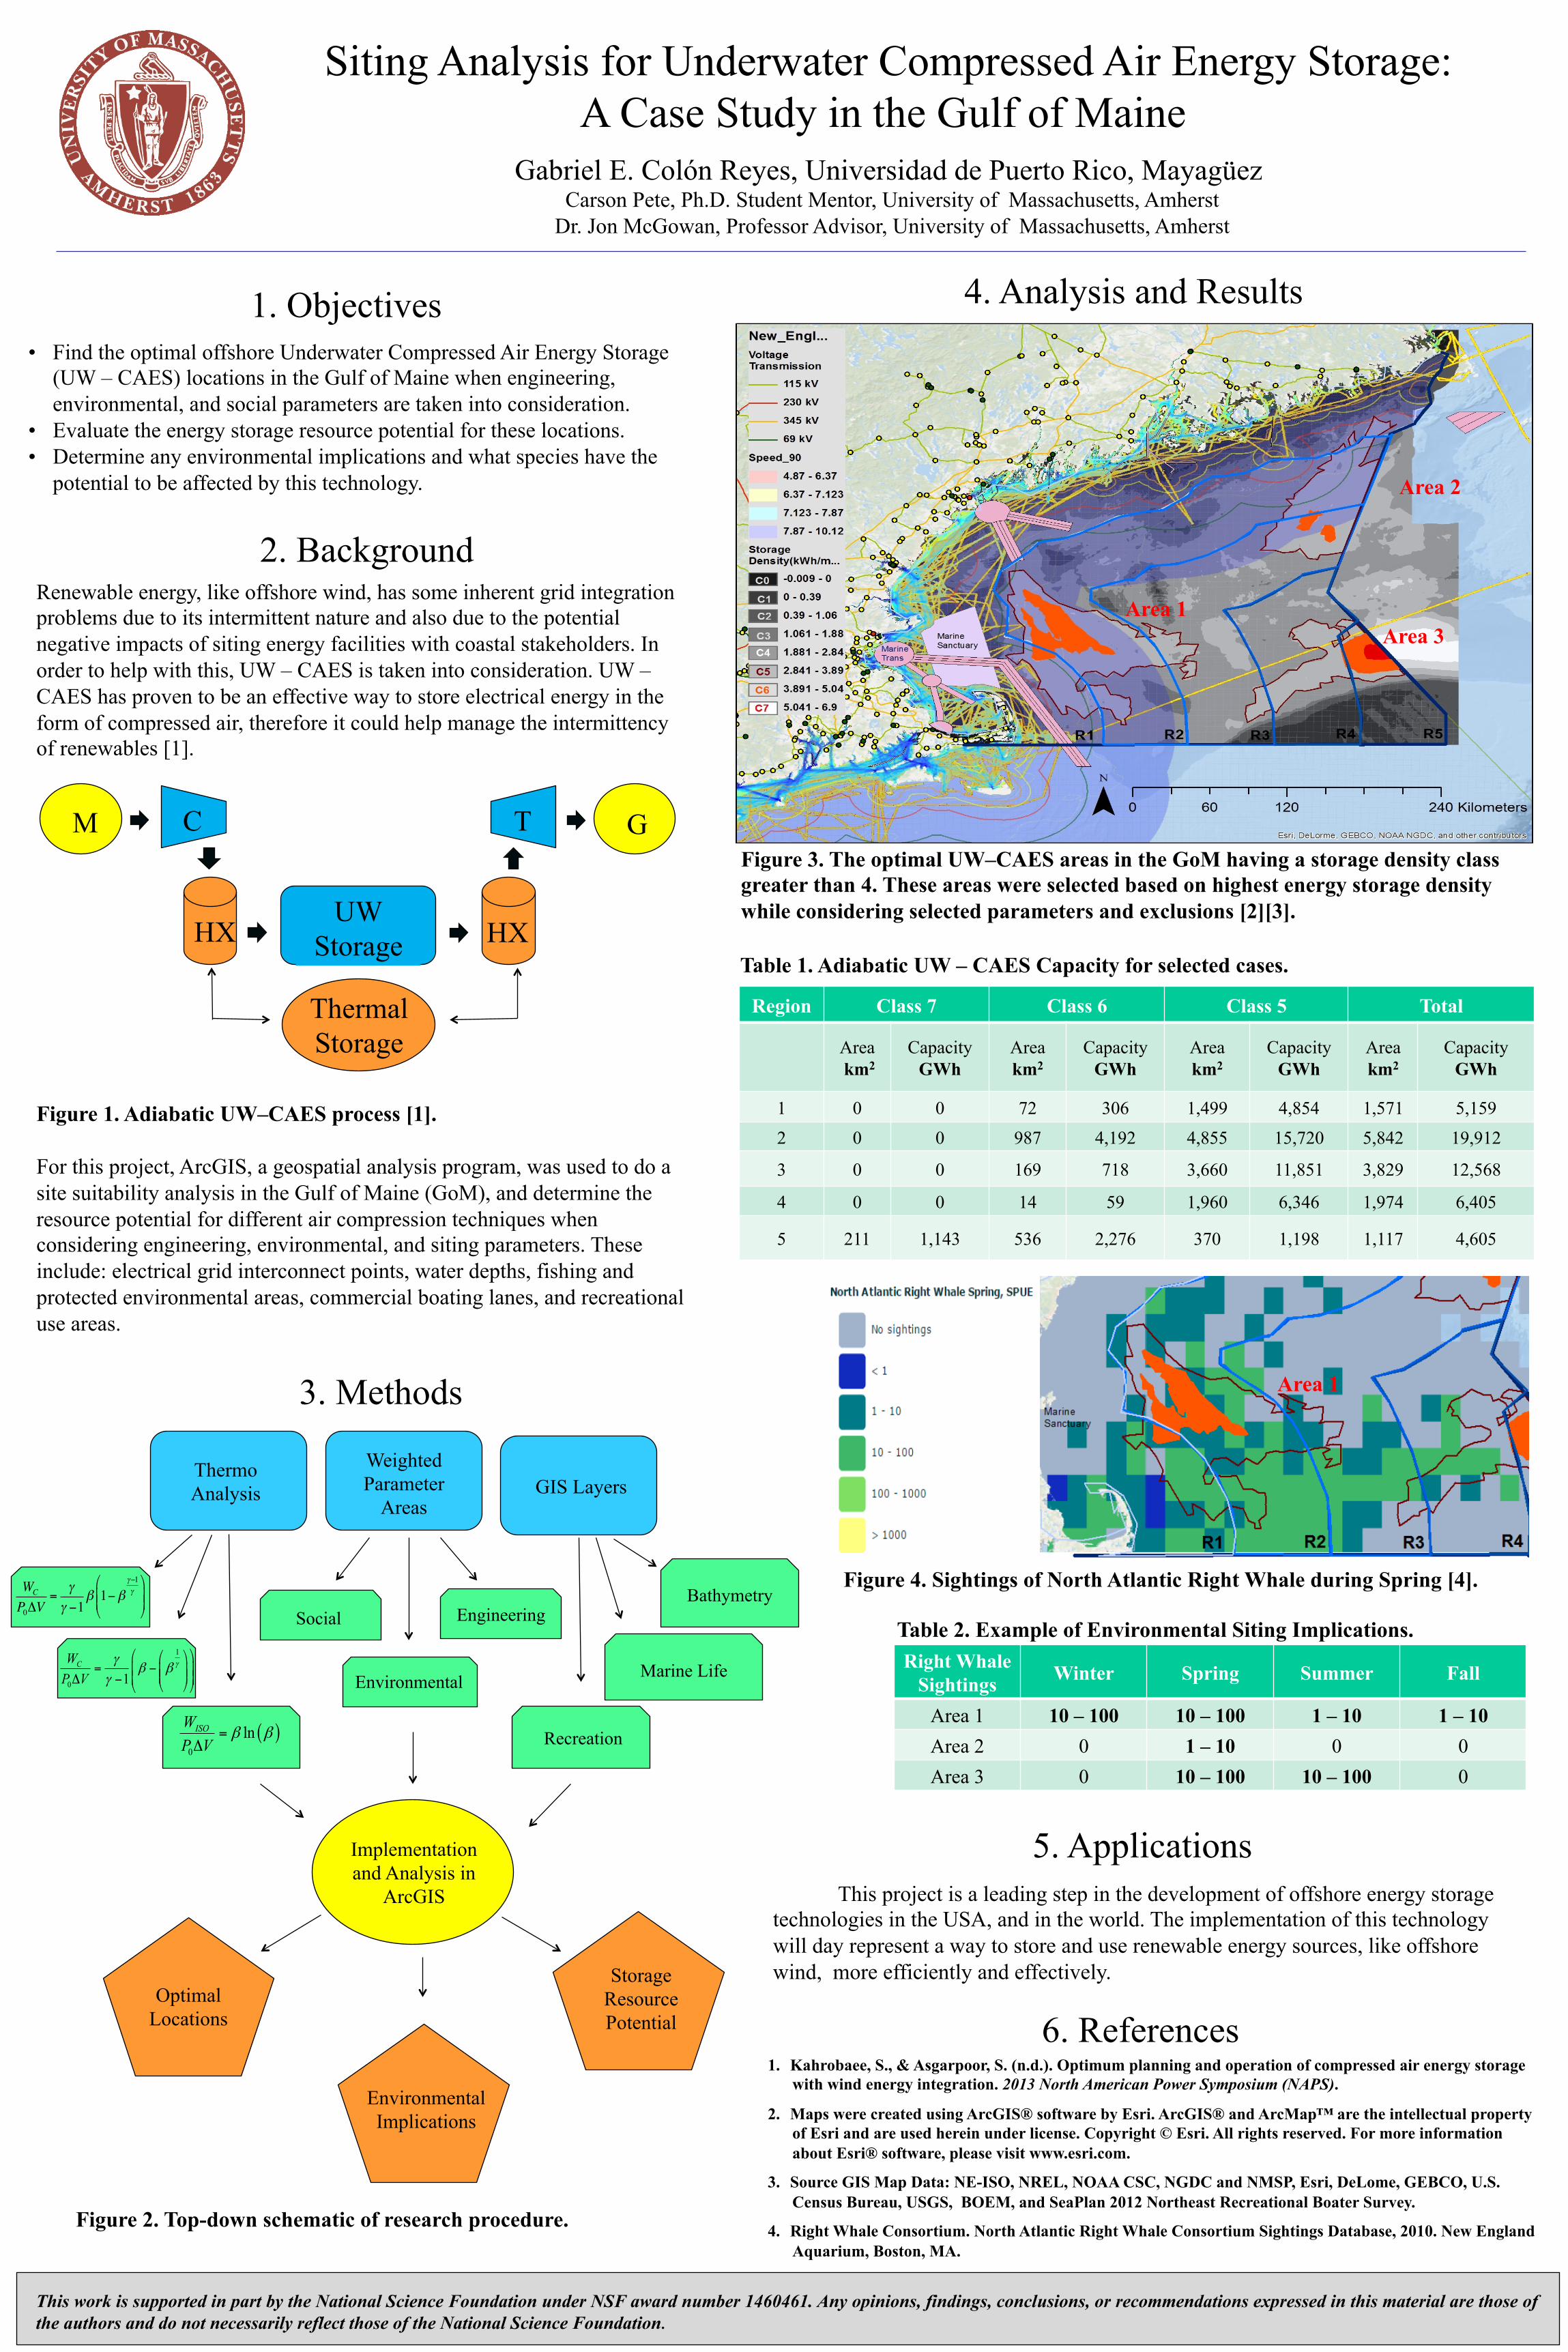
4. Analysis and Results
Figure 3. The optimal UW–CAES areas in the GoM having a storage density class greater than 4. These areas were selected based on highest energy storage density while considering selected parameters and exclusions [2][3].
Region Class 7 Class 6 Class 5 Total
Area km2
Capacity GWh
Area km2
Capacity GWh
Area km2
Capacity GWh
Area km2
Capacity GWh
1 0 0 72 306 1,499 4,854 1,571 5,159 2 0 0 987 4,192 4,855 15,720 5,842 19,912
3 0 0 169 718 3,660 11,851 3,829 12,568
4 0 0 14 59 1,960 6,346 1,974 6,405
5 211 1,143 536 2,276 370 1,198 1,117 4,605
Table 1. Adiabatic UW – CAES Capacity for selected cases.
Figure 4. Sightings of North Atlantic Right Whale during Spring [4].
Right Whale Sightings Winter Spring Summer Fall
Area 1 10 – 100 10 – 100 1 – 10 1 – 10 Area 2 0 1 – 10 0 0 Area 3 0 10 – 100 10 – 100 0
Table 2. Example of Environmental Siting Implications.
Area 3 Area 1
Area 2
Area 1
1. Kahrobaee, S., & Asgarpoor, S. (n.d.). Optimum planning and operation of compressed air energy storage with wind energy integration. 2013 North American Power Symposium (NAPS).
2. Maps were created using ArcGIS® software by Esri. ArcGIS® and ArcMap™ are the intellectual property of Esri and are used herein under license. Copyright © Esri. All rights reserved. For more information about Esri® software, please visit www.esri.com.
3. Source GIS Map Data: NE-ISO, NREL, NOAA CSC, NGDC and NMSP, Esri, DeLome, GEBCO, U.S. Census Bureau, USGS, BOEM, and SeaPlan 2012 Northeast Recreational Boater Survey.
4. Right Whale Consortium. North Atlantic Right Whale Consortium Sightings Database, 2010. New England Aquarium, Boston, MA.
Related Documents


![Ross J REU Poster [Read-Only]reu-mse.mme.wsu.edu/past/2005/JohnsonRoss2005.pdfMaterials Research REU site program under grant number NSF Contract Number: 12V-3825-5133 Title Microsoft](https://static.cupdf.com/doc/110x72/5f3bc7a8b82a6e511f12e5da/ross-j-reu-poster-read-onlyreu-msemmewsuedupast2005-materials-research-reu.jpg)