RETURl'J TO K- Ar dating: atmospheric argon contamina AC .H3 no.K74 15370 1111111111111111111111111111111 llll Keeling, David Leon SOEST Library HAWAII INSTITUTE OF GEOPHYSICS LIBRARY R00\11

Welcome message from author
This document is posted to help you gain knowledge. Please leave a comment to let me know what you think about it! Share it to your friends and learn new things together.
Transcript

RETURl'J TO
K- Ar dating: atmospheric argon contamina AC .H3 no.K74 15370
1111111111111111111111111111111 llll Keeling, David Leon
SOEST Library
HAWAII INSTITUTE OF GEOPHYSICS LIBRARY R00\11
K-Ar DATING: ATMOSPHERIC ARGON
CONTJU.-ITNATION IN VOLCANIC ROCKS
A DISSERTATION SUBMITTED TO THE GRADUATE DIVISION OF THE UNIVERSITY OF HAWAII IN PARTIAL FULFILLMENT
OF THE REQUIREMENTS FOR THE DEGREE OF
DOCTOR OF PHILOSOPHY
IN CHEMISTRY
AUGUST 1974
By
David Leon Keeling
Thesis Committee:
John J. Naughton, Chairman Robert w. Buddemeier
John W. Gilje Peter M. Kroopnick
David w. Muenow
ACKNOWLEDGMENTS
Grateful acknowledgmept is made to those who helped and
encouraged along the way, especially:
Professor John J. Naughton for patience when we disagreed;
Diana Keeling for all the ways in which she helped;
Dr. Robert Buddemeier, Stephen Hammond and John Halunen for
working very hard and risking too much en the Hilina Pali;
Professor Richard G. Inskeep, Professor Gordon A. Macdonald
and Dr. Herbert H. Veeh for their earlier participation on
my thesis committee;
Virginia Lewis for potassium analyses;
Dr. Robert Tilling for samples from Mauna Ulu;
Dr. Karl Seff and Peter Leung for help in the zeolite preparation.
ii
ABSTRACT
Atmospheric argon contamination complicates the detection of
radiogen:i.c argon and limits the precision and ultimately the success
of the pota:rnium~rgon age dating method 'When it is applied to rocks
younger than about 5-10 HY. Previous studies have disagreed on the
time when the air argon is obtained, the location in which it resides,
and the ease with which it may be removed. With these problems in
mind, the nature of air argon contamination in volcanic rocks was
investigated.
The argon analysis capabilities were improved by instrranental
and procedural developments. Source magnets and a new emission
regulator increased the sensitivity of the mass spectrometer. A
problem with chloride contamination was uncovered and new gas
purification procedures were implemented to avoid it.
HF and dilute nitric acid were each somewhat effective in lowering
the air argon contamination. Nitric acid is preferred because it was
less erratic, left no visible residue on the surfaces, and allo~ed for
safer testing for H2S release which may be indicative of excess argon.
Moderate crushing of a number of samples also reduced the atmospheric
argon contamination, demonstrating that much of the air argon in such
cases was located on surfaces. These results indicated that laboratory
additions as a result of adsorption on fresh surfaces were not impor
tant. They also gave a useful technique for reducing air argon and
age-dating errors resulting from potassium inhomogen.eity ..
Air argon contents .of samples from a flow in Hanauma Bay, Oahu,
showed no increase over others from its dike feeder after the sa.mpJ.es
iii
were crushed and treated with acid, which indicated that the amount
of initi8.l exposure to air did not determine the contamination level .
A high air argon content in one dike sample was attributable to its
location where more severe weathering occurs. This field added
component was removable by crushing and acid treatments.
Over 900 analyses from the literature showed that older samples
tended to have higher air argon contents, which is best explained by
the occurrence of field additions.
Air argon contents in quenched glasses were consistently high,
12-6ox1o-7 cc/g, and the argon was mainly contained in vesicles. In
fresh crystalline samples which cooled at a slower rate the initial
air argon contents were much lower, commonly less than 2x1o-7 cc/g.
Most of the air argon that is deduced to be in the melt thus is believed
to be exsolved by the cooling and crystallization.
In a single sample out of which olivine, feldspar, and pyroxene
were separated, the pyroxene had a much higher air argon content.
Extremely high air argon contents were observed in analyses of
secondary minerals such as some zeolites which contained 4000-
5000x10-7 cc/g. Such large a.mounts imply that a very small fraction
present would add significantly to the total air argon content of a
rock. The mechanism of field addition as a result of the formation
of minor amounts of alteration prod~cts is able to resolve much of
the conflict in the literature concerning atmospheric argon.
The 40/36 ratios of a variety of samples which were too young to
have detectable radiogenic argon were indistinguishable from air argon
in most instances. One sample had a small apparent excess of argon 36.
iv
TABLE OF CONTENTS
ACKNOWLEDGMENTS •••• • • • • •• ••••• • • • ••• • ••• ii
iii
viii
ABSTRACT • • • • • • • • • • • • • • • • • ••••••••••
LIST OF TABLES • • • • • • • • • • • • • • • • • • • • • • ••
LIST OF ILLUSTRATIONS • • • • ••••• • • • • • • • ••••• x
I. BACKGROUND •••••• • •••••• • • • • ••• • • • • 1
II.
A. POTASSIUM-ARGON METHOD • • • • • • • • • • • • • • • • 1
1
2
B.
1. Introduction • • • • • • • • • • • • • • • • •••
2. Basis • • • • • • • • • • • • • • • • • • • • • • •
3. Assumptions • • • • • • • • • • • • • • • • • • • • 5
4. Problems \Tith Young Samples • • • • • • • • • • • • 9
a. Atmospheric argon contamination • • • • • • • • 10
b. Initial argon composition • • • • • • • • • • • 21
c. Chloride contamination • • • • • • • • • • • •
DESCRIPTION OF THE PROBLEM • • • • • • • • • • • • • •
30
31
1. Purpose • • • • • • • • • • • • • • • • • • • • • • 31
2. Improvement of Argon Analysis • • • • • • • • • • • 31
3. Time of Addition • • • • • • • • • • • • • • • • • 32
4. Location of Atmospheric Argon • • • • • • • • • • • 33
5. Applications • • • • • • • • • • • • • • • • • • •
EXPERIMENTAL PROCEDURES • • • • • • • • • • • • • • • • •
34
36
A. SAMPLE PREPARATION •••••••••••••• • • • • 36
1. Selection Criteria • • • • • • • • • • • • • • • • 36
2. Crushing, Sieving, and Mineral Separation • • • • • 37
3.
4.
Acid Treatment • • • • • • •
Other • • • • • • • • • • • •
v
• • • • • • • • •
• • • • • • • • •
• •
• •
38
39
B. POTASSIUM ANALYSIS • • • • • • • • • • • • • • • • • • 39
40
41
45
50
52
53
55
57
57
c. ARGON ANALYSIS • • • • • • • • • • • • • • • • • •••
1.
2.
3.
4.
5.
6.
7.
Equipment Description • •
Preliminary Degassing • •
• • •
• • •
• • • • • •
• • • • ••
Blank • • • • • • • ••• • • • • • • • • •
Calibration • • • • • • • • • • • • • •••
Extraction • • • • • • • • • • • • • ! • •
Purification ••• • • • • • • • • • • • •
Mass Spectrometric • • • • • • • • • • • •
••••
• •••
• •••
• • • •
••••
••••
• • • •
a. Instrument modifications • • • • • • • • • • •
b. Argon transfer • • • • • • • • • • • • • • • • 59
c. Scanning • • • • • • • • • • • • • • • • • • • 59
8. Chart Analysis • • • • • • • • • • • • • • • • • • 66
9. Mass Discrimination • • • • • • • • • • • • • • • • 69
D. PRECISION AND ACCURACY • • • • • • • • • • • • • • • • 70
III. RESULTS AND DISCUSSION •••••••••
A. TIME OF ADDITION OF ATMOSPHERIC ARGON •
• •
• •
• • • •••
• • • • • •
1. Laboratory Addition • • • •• • • • • • •• • • • • •
2. Field Addition • • • • • • • • • • • • • • • • • •
75
75
75
80
a. Hanauma Bay dike and flo~ • • • • • • • • • • • 80
3.
b. Literature evidence supporting field addition • 91
Initial Argon Concentrations • • • • • • • • • • •
a. Glasses • • • • • • • • • • • • • • • • • • • • •
b. Historic volcanics • • • • • • • • • • • •••
c. Intrusives and submarine basalts
vi
• • • • •••
100
101
104
106
B. LOCATION OF ATMOSPHERIC ARGON • • • • • • • • •• • •• 109
1. Summary of Information from the TIME OF' ADDITION Section • • • • • • • • • • • • • • • • • • • • • • 109
2. Surf'aces • • • • • • • • • • • • • • • • • • • • • 109
a. More severe crushing • • ~ • • • • • • • • • • 109
b. Artificial weathering • • • • • • • • • • • • • 116
3. Air Argon in Primary Minerals • • • • • • ••• • • ll6
4. Atmospheric Argon in Secondary Minerals • • • • • • 124
c. REEXAMINATION OF LITERATURE DATA ON AIR ARGON • • • • • 128
D. LOW LEVEL CHLORIDE CONTAMINATION • • • • • • • • • 0 • 131
1. Detectable Chloride • • • • • • • • • • ••• • • • 131
2. Undetectable Chloride Contamination • • • • • • • • 132
E. 40/36 RATIOS AND EXTRANEOUS ARGON • • • • • • • • • •• 136
1. Mass Discrimination Determinations • • • • • • • • 136
2. Hanauma Bay Dike and Flow • • • • • • • • • • • • • 1.36
3. Historic Lavas • • • • • • • • • • • • • • • • • • 139
Uwekahuna Laccolith, Koolau Dike, Manana Island • • 140
5. Hilina Pali • • • • • • • • • • • • •••• • • • 6
IV. SUMMARY AND CONCLUSIONS • • • • • • • • • • • • • • • • • 144
APPENDIX • • • • • • • • • • • • • • • • • • • • • • • • • • • 147
BIBLIOGRAPHY • • • • • • • • • • • • • • • • • • • • • • • • • 155
vii
TABLE
I
II
III
IV
v
VI
. VII
VIII
IX
x
XI
XII XIII
XIV
xv
XVI
XVII
LIST OF TABLES
The Isotopic Abundance of Argon in the Atmosphere (Nier, 1950)
Measured Atmospheric 40Ar Content in Argon Extractions on Geological Materials (McDougall, 1966)
The Effect of Mass Spectrometer Settings on the Rate of 40Ar Accumulation from the Memory Effect
The Effect of HF Etching on the A.ir Argon Content of Whole Rock Basalts
The Effect of a Dilute HN03 Treatment on the .Air Argon Content of Whole Rock Basalts
The Air Argon Content of Various Particle Sizes of Koko Flow
The Air Argon Contents of Block Samples from the Dike and Flow in Hanauma Bay
The Air Argon Contents of Crushed Samples from the Dike and Flow in Hanauma Bay
The Air Argon Contents of Crushed and Nitric Acid Treated Samples from the Dike and Flow in Hanauma Bay
References for Air Argon vs. Age Histograms in Figure 17
A Summary of the Air Argon Contents of Rocks from the from the Hawaiian Islands Calculated from Published K-Ar Data
Air Argon in Quenched Silicate Melts
Air Argon in Historic Volcanic Material
The Air Argon Contents of Intrusive Samples
Air Argon Contents of Submarine Basalt Rims
The Air Argon Content of Various Particle Sizes of HAN-4
The Air Argon Content of Various Particle Sizes of the Tholeiitic Basalt KC-71
viii
PAGE
10
13
49
76
77
78
83
87
90
93
98
102
105
108
110
112
115
LIST OF TABLES {Continued)
TABLE PAGE
XVIII The Air Argon Content of Various Particle Sizes of 117 Sample CGL, the Residual Glass from Earlier Fusions
XIX Results of Attempts to Add Atmospheric Argon to Rocks 118 by Lab Processes
XX The Air Argon Content of Olivine, Pyroxene, and 121 Plagioclase Min.eral Separates
XXI The Air Argon Content of Minerals Separated from 123 Uwekahuna Laccolith
XXII 40/36 Ratio Determinations on Pure Atmospheric Argon 137
XXIII The 40/36 Ratios of Samples from Hanauma Bay 138
· XXIV Apparent Excess 36Ar in the Fine Crushed Partiule 140 Sizes of HAN-4
40/36 Ratios of Samples from the Hilina Pali
ix
FIGURE
1
2
3
4
5
6
7
8
9
10
11
12
13
14
15
16
LIST OF ILLUSTRATIONS
PAGE ·40 EnereY Diagram of K Decay 3
Error Magnification in Radiogenic Argon as a Result of 11 Increasing Atmospheric Argon Contamination (Baksi et al., 1967)
A Hypothetical Argon Release Pattern of an 80 MY Old 18 Rock Analyzed by the 40Arj39Ar Age Spectrum Technique
An Example of an Initial Argon Diagr3.Ill 24
An Isochron Diagram Illustrating Some of the Possible 27 Correlations (Roddick and Farrar, 1971)
Diagram of the Argon Analysis System l2
The Accumulation of 40Ar in the Mass Spectrometer as a 49 Result of the Memory Effect
Pumping Speed vs. Pressure for 50 l/sec Titanium 56 Sublimation Pump
Time Required to Expand Argon into the Mass Spectrometer 59
Portions of a Scan Showing the Difficulty in Peak Inter- 61 polations Caused by the Rapid Change in Peak Intensity and Complicated by the Use of the xlO Scale Expansion
The Change in Intensity .of the Mass 40 Peak in the Later 62 Minutes of a scan
Argon Intensity vs. Time in the Mass Spectrometer 65
The Air Argon Content of Various Particle Sizes of Koko 78 Flov
Sketch of the Dike and Flow in Hanauma Bay Showing the 82 Sample Locations
Argon Content vs. Sample Number for the Hanauma Bay Dike 84 and Floy Showing Block, Crushed, and Nitric .Acid Treated Samples
The Air Argon Content of Various Particle Sizes of HAN-7 88
x
· FIGURE
17
18
19
LIST OF ILLUSTRATIONS (Continued)
Number of Flows vs. Air Argon Content for 0-1, 1-5 and 5-16 MY Old Mafic Lava Flows
Number of Flows vs. Potassium Concentration
The Air Argon Content of HAN-.4. vs. Particle Size
xi
PAGE
94
96
11.3
I• BACKGROUND
A. POTASSIUM-ARGON METHOD
1. Introduction
The advent and development of the various methods of
geochronology have influenced many areas of science. Cosmochemistry,
geology including geochemistry and geophysics, the many branches of
paleontology, archaeology, and anthropology, in particular, are
united by their interest in determining when in the past various
events took place. Age-dating techniques extend our calendar
backward beyond written communication and tell when cities were
built and artifacts made. The geologic time scale stretches like a
ruler over the fossil record with its numerals supplied by countless
geochronologists, aiding in tracing the development of the many
species with which we share our planet. The formation and destruction
of mountains and the drifting of continents may be charted. The
times of birth of the solar system and even the universe have been
postUlated based on dating techniques (e.g. Hamilton, 1965).
The potassium-argon method is one of the most reliable
and widely used age-dating techniques. It is useful for almost
any rock type and most minerals as the crustal abundance of
potassium is high. Old samples may be dated since the half-life
of the radioactive potassium isotope is long enough to have
avoided complete 40K depletion. In addition, the detection of
extremely small volumes of radiogenic argon has allowed rather
young samples to be successfully dated. It was suggested as a
1
possible chronometer by Goodman and Evans (1941) before argon had
even been proven to be involved in the potassium decay scheme. The
method was first successf'ully applied by Smits and Gentner (1950)
and by Gerling et al. (1952). The interesting history of the
development of the method has been given in some detail by Dalrymple
and Lanphere (1969).
2. Basis
The accumulation of argon 40 in a rock (or mineral) as
a result of the steady decay of potassium is the basis of the
potassium-argon method. The 11 clock 11 is set when the rock cools from
an elevated temperature, for example in an extruded lava flow. Argon,
a noble gas, escapes from rock systems at high temperatures as long
as unusually high partial pressures are ·not involved. However on
cooling diff'usion rates become negligible and the argon remains
trapped in the minerals' crystal lattices, presenting upon subsequent
analysis an indication of how much time has elapsed since the heating
event took place.
The fraction of naturally occurring potassium that is
radioactive has been determined by Nier (1950) and others
(Reutersward, 1952, 1956; White et al., 1956). Nier 1s (1950)
value of 0.0119% 4°K was used in the few age determinations of
this research. Its decay is branched, occurring either by electron
capture (e) to argon 40 or by beta decay (b) to calcium 40. The
decay constants, Ae and Xb' and the branching ratio (R = ~9/Ab) have been determined by many workers. Reviews such as Wetherill
2
(1966), Aldrich and Wetherill (1958), and Houtermans (1966) have
summarized the different experimental approaches and resultso In
this research the suggested constants of Aldrich and Wetherill (1958)
~ -10 -1 -10 -1 were used, Ae = o.,85x10 yr , Ab= 4.72xl0 yr and R = 0.124.
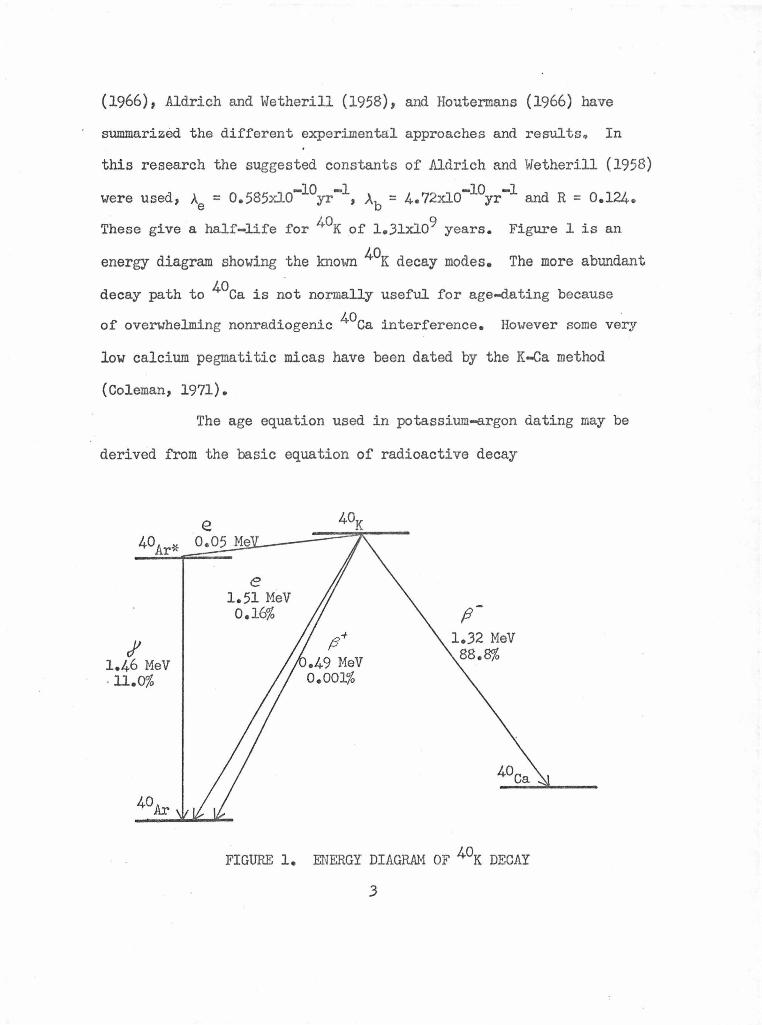
These give a half-life for 40K of l.3lx109 years. Figure 1 is an
energy diagram showing the known 40K decay modes. The more abundant
decay path to 40ca is not normally useful for age-dating because
of overwhelming nonradiogenic 4°ca interference. However some very
low calcium pegmatitic micas have been dated by the K-Ca method
(Coleman, 1971).
The age equation used in potassium-argon dating may be
derived from the basic equation of radioactive decay
e 40Ar* 0.05 Me
~ 1.46 MeV · 11.~
40Ar
e 1.51 MeV
0.16%
FIGURE 1. ENERGY DIAGRAM OF 40K DECAY
3
N = N e-At (1) 0
where N is the number of parent atoms remaining undecayed at any
time t, N is the initial' number of parent atoms, and A is the 0
decay constant. By definition
N = N + D (2) 0
where D is the number of daughter atoms. Substitution of equation
(2) into equation (1) g"ives
Multiplying both sides of equation (3) by ext and collecting terms
gives
D = N(eAt - 1).
(3)
(4)
For the branched decay of 40K with daughters 40Ar and 40ca equation
(4) becomes
40Ar + 4°ca = 40K[exp(,,\ + >i )t - iJ. (5) rad rad e b
The fraction of 40K atoms that decay to 40Ar is
40Ar \ rad A e = 4o Ar + 4o Ca .A + A
rad rad e b
( 6)
or
( 7)
Substitution of equation (7) into equation (5) and multiplication
(8)
which is the potassium-argon age equation. For routine use in age
4
calculations numerical values are substituted for the decay
constants and the equation is solved for t
40Ar 9 ( rad t = l.885x10 ln 9.068 40 + 1).
K
For samples less than about 40 million years old
which allows equation (9) to be simplified to
t = l.709xl0l0(40Ar J'i-OK). rad
If the 40Ar is converted from atoms to std cc/g and the 40K from
atoms to percent K, the age equation finally becomes
t = 2.487xlo13(40Ar d)(std cc/g)/K(%). ra
3. Assumptions
As in any age-dating technique, the potassium-argon
method requires the use of several fundamental assumptions before
it can be applied. The ultimate meaning of any age determination
(9)
(10)
(11)
(12)
depends on the degree of the sample's adherence to these assumptions.
a. First of all, the decay of 4°K must be constant,
that is completely independent of the physical and chemical state
of the potassium. It is noteworthy that electron capture decay
does involve an orbital electron and in 7Be the rate of this type
of decay may be influenced slightly by changes in the chemical
environment (Segre and Wiegand, 1949; Kraushaar et al., 1953).
However a similar effect has not been detected in 40K (Dalrymple
and Lanphere, 1969) and would not be expected since the potassium
nucleus is much larger than that of beryllium.
5
b. Since onlY the total potassium content is measured
it must be assumed that its isotopic composition is not variant.
This assumption has been rather thoroughly tested (Verbeek and
Schreiner, 1967; Kendall, 1960; Burnett et al., 1966; Mullins
and Zerahn, 1948) and seems to be invalid only in very unusual
circumstances and even then only to a small degree.
c. The time of cooling, that is the time during which
the clock is partially set 'With some radiogenic argon being retained,
must be short compared to the age of the sample. The validity of
this assumption is not obvious in metamorphic systems where the
rate of cooling may be very slow. In typical volcanic activity
there is little difficulty in making this assumption.
d. The potassium and argon analyses are conventionally
performed on separate portions of the sample. Most researchers
then must assume that the potassium is evenly distributed through
out the sample. Engels and Ingamells (1970) have shown that inhomo
geneity may introduce an error that is appreciable compared to the
analytical errors when dating less than pure mineral separates.
They demonstrated how the effect decreases as smaller particles
are split for analyses. Dalrymple and Hirooka (1965) found the
potassium content of a single basaltic lava flow varied from 2.18
to 2.74% K2o on seven samples collected over a three kilometer
distance. At the same time, samples from 'Within a single hand
specimen were reasonably consistent, ranging only from 2o54 to
2.60% K2o on twelve samples, or only about 2%. This same absolute
variation would be much more significant on samples with a lower
6
potassium content.
e. The system must be assumed to have been closed
since the clock was set. That means that except for radioactive
decay, neither potassium nor radiogenic argon has been added or
removed from the sample. This is not a severe restriction for
potassium except perhaps in soluble salts. However argon may be
lost with widely differing ease from minerals by heating. A very
large portion of the early literature in K-Ar dating is devoted to
the determination of the argon retentivity of various minerals.
Summaries of these many studies are given by Fechtig and Kalbitzer
(1966), Mussett (1969), and Dalrymple and Lanphere (1969). Certain
low temperature feldspars are not adequately retentive even at
room temperature, whereas other minerals such as muscovite,
hornblende, sanidine and volcanic plagioclases are quite resistant
to the loss of argon.
Diffusional losses from whole rock basalts were
expected because of their fine grain size by such samples have been
reliable when the potassium is located in minerals that are
themselves retentive (Evernden et al., 1964; McDougall, 1969 among
many others given in this study).
Glasses as a group are undesirable for dating.
They may give reliable ages (Evernden et al., 1964; McDougall et al.,
1966) but have sometimes unaccountably exhibited argon loss.
Devitrification, which is difficult to detect initially, certainly
resUlts in the loss of radiogenic argon (Dalrymple, 1964; Mankinen
and Dalrymple, 1972).
7
f. The argon is usually assumed to consist only of
radiogenic argon, defined as being from the decay of potassium
after the clock is set, and argon contamination from the atmo
sphere. All of the argon from previous decay is assumed to have
been eliminated by the event that sets the clock. A correction
for atmospheric argon contamination may be applied if the isotopic
composition of the argon in the sample is measured, since atmo
spheric argon has a known composition. Some workers are presently
avoiding this correction by using an isochron approach which
will be discussed later.
The general validity of the assumption is supported
by internal agreement (Wanless and Lowdon, 1961, 1963a, 1963b)
and favorable comparison with other geochronometers (Kulp and
Engels, 1963). However there are a substantial number of instances
in which extraneous argon has been detected. Excess argon 40 has
been found at one time or another in most dateable minerals and
the problem has been summarized by Damon et al. (1967) and Dalrymple
and Lanphere (1969). Among the most clear-cut examples were samples
which gave 11ages 11 older than the presently accepted age of the
earth (McDougall and Green, 1964).
In basalts, excess argon may result from incomplete
initial degassing, as in deep sea samples (Dymond, 1970; Noble and
Naughton, 1968) and in the quenched glassy margin of dikes (Damon
et al., 1967). Xenoliths in basalts may contain excess argon
(McDougall et al., 1969), sometimes held in fluid inclusions
(Funkhouser, 1966; Noble, 1969).
8
4. Problems with Young Samples
It is inevitable that any age-dating technique will be
applied to as wide an age range as possible. The potassium-argon
method has been successfully used on the oldest known terrestrial
and extraterrestrial rocks (Kulp, 1961; Krankowsky and Zahringer,
1966; Turner, 1970). Its practical lower limit was successively
lowered through the 1950 1s by many improvements in vacuum techno-
logy and mass spectrometry used in the argon analysis. Prominent
among these improvements were the development of high vacuum
techniques (Bayard and Alpert, 1950), all metal bakeable valves
and completely bakeable systems (Alpert, 1953; Alpert and Buritz,
1954), the use of induction heating for melting the sample (Carr
and Kulp, 1957), and the design of a more sensitive mass spectro
meter for isotopic noble gas analysis (Reynolds, 1956).
With the aid of these improvements, a few ages as
young as lxl06 years were obtained by Cox et al. (1963), Evernden
et al. (1964) and by McDougall (1964). The most. heralded series
of young ages was obtained by Evernden and Curtis (1965) on samples
~rom Olduvai Gorge, taken from the same beds as the primitive
hominoid remains. More recently, even younger ages have been
reported, with Dalrymple (1967) dating sanidine samples only
6000 years old!
Obtaining such young ages presents special problems
concerning argon, both in its analysis and in regard to its assumed
initial isotopic composition. The two major problems are contam-
9
I ination from atmospheric argon and excess radiogenic argon. A
third problem of chloride contamination is presumably less common,
but is equally important. Each of these limitations will be
discussed below in considerable detail.
a. Atmospheric argon contamination
The foremost dating limitation arises from the
unavoidable presence of atmospheric argon contamination. Argon
in the atmosphere unfortunately consists mainly of 40Ar accumulated
after billions of years of potassium decay in terrestrial rocks
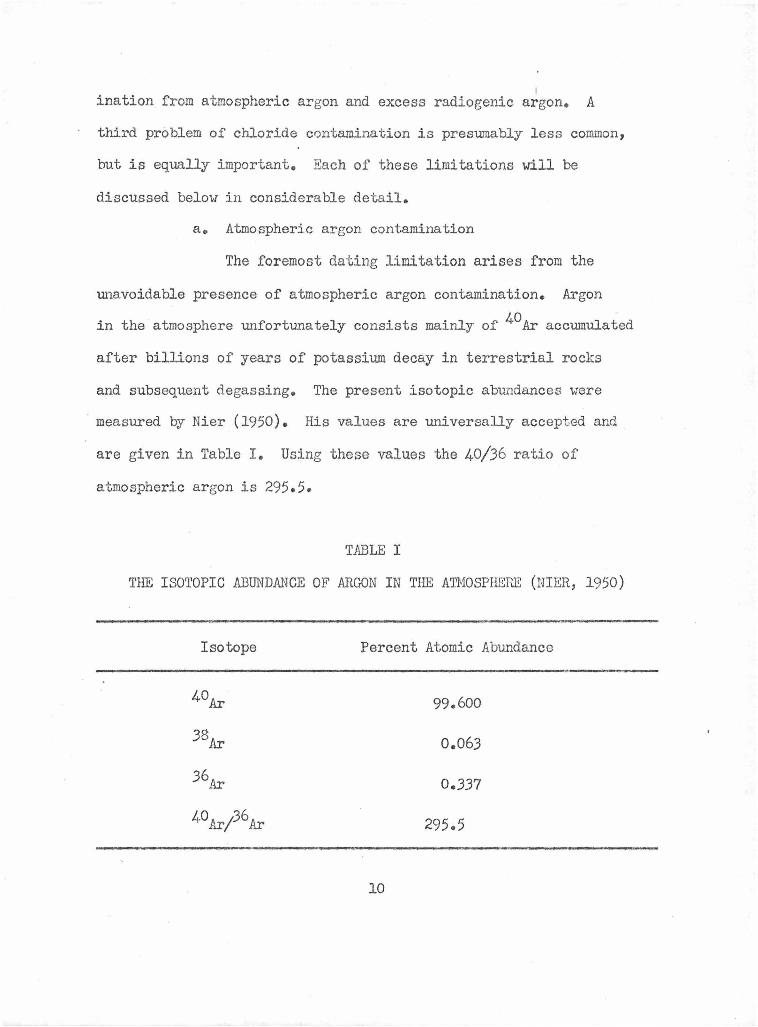
and subsequent degassing. The present isotopic abundances were
measured by Nier (1950). His values are universally accepted and
are given in Table I. Using these values the 40/36 ratio of
atmospheric argon is 295.5.
TABLE I
THE ISOTOPIC ABUNDANCE OF ARGON IN THE ATMOSPHERE (NIER, 1950)
Isotope Percent Atomic Abundance
40Ar 99.600
38Ar 0.063
36Ar 0.337
11.0 Ax/36 Ar 295.5
10
given by·
The radiogenic argon content of a sample is thus
40Ar radiogenic
40Ar 36 = total - 295 •5 Ar t h · • a mosp eric
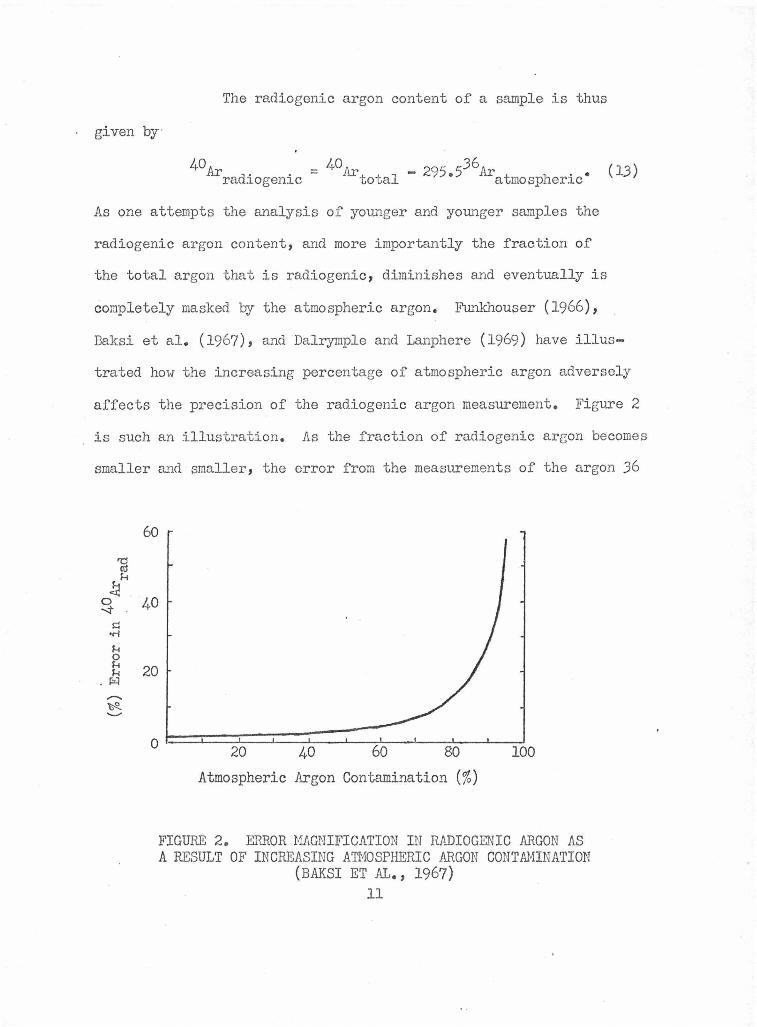
As one attempts the analysis of younger and younger samples the
radiogenic argon content, and more importa.ntly the fraction of
the total argon that is radiogenic, diminishes and eventually is
(13)
completely masked by the atmospheric argon. Funkhouser (1966),
Baksi et al. (1967), and Dalrymple and Lanphere (1969) have illus-
trated how the increasing percentage of atmospheric argon adversely
affects the precision of the radiogenic argon measurement. Figure 2
is such an illustration. As the fraction of radiogenic argon becomes
smaller and smaller, the error from the measurements of the argon 36
'C ro H
~ 0 ~
s;:: •rl
H 0 H H
• r:<:l .......... ~ ..........
60
40
20
Atmospheric Argon Contamination (%)
FIGURE 2. ERROR MAGNIFICATION IN RADIOGENIC ARGON AS A RESULT OF INCREASING ATMOSPHERIC ARGON CONTAMINATION
(BAKSI ET .AL., 1967) 11
peaks and the 40/36 ratios overwhelmingly become the largest
source of error in the age determination.
Atmospheric argon has necessarily been a major
concern in K-Ar dating studies involving ·ery young samples but
has usually been treated peripherally. The findings of various
studies described in the following paragraphs have been apparently
contradictory in some fundamental areas, but all tend to show that
the atmospheric argon contamination is more tenaciously held thari
would have been predicted from its ordinary chemical behavior.
One of the earliest reports was a diffusion study
by Evernden et al. (1960). They found that much of the atmospheric
argon was released at lower temperatures than radiogenic argon,
which indicated that it was a surface or near surface component.
They theorized that air argon was slowly diffusing into the samples
in the field. Evernden et al. (1964), Evernden and James (1964), and
most prominently Evernden and Curtis (1965) later applied this infor-
mation, mainly in dating feldsp~r concentrates, by removing the
surface layers with an HF treatment. The atmospheric argon contam-
ination was reduced by 90% in some samples, with the greatest improve-
ment in phenocrysts concentrated out of tuff material. Typical air
-7 I argon contents of 0.2-0.6x10 cc g remained after treatment. Evernden
and Curtis (1965) reported that the etching was "noticeably" more
efficient if the treated samples were loaded into the extraction system
immediately, rather than waiting days or weeks, indicating a gradual
re-attachment. The measured ages of several samples were increased
12
slightly by the treatment. They explained this as being due to
the HF aided removal of small bits of devitrified glass which was
part of the host tu.ff material.
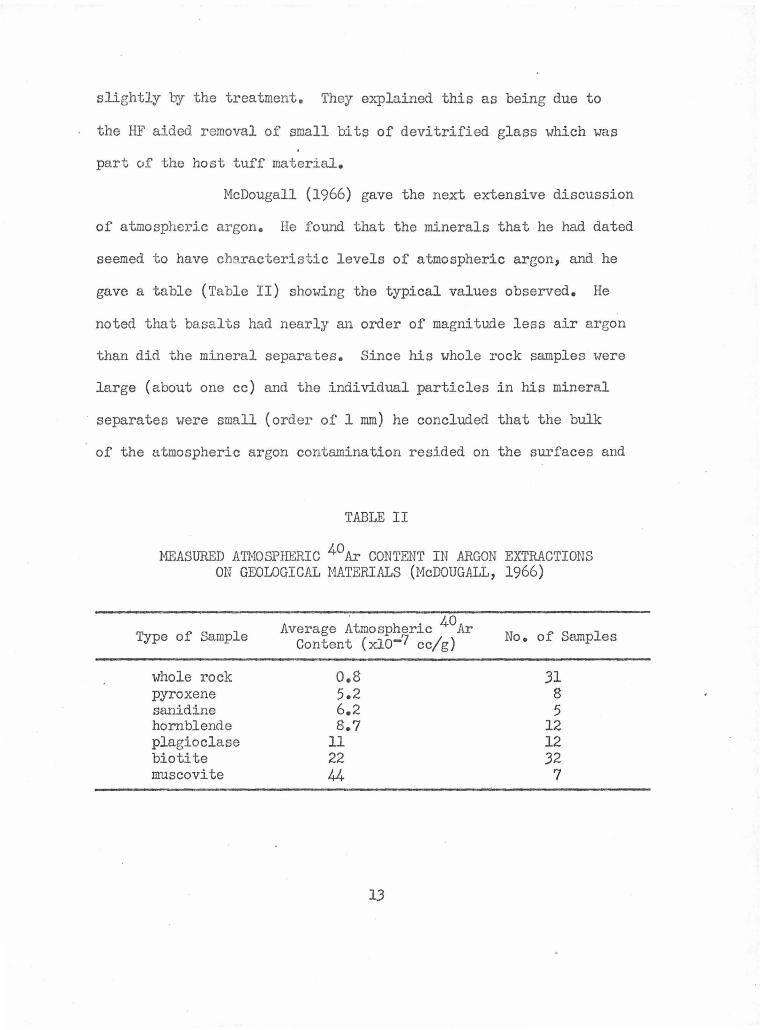
McDougall (1966) gave the next extensive discussion
of atmospheric argon. He found that the minerals that he had dated
seemed to have characteristic levels of atmospheric argon, and he
gave a table (Table II) showing the typical values observed. He
noted that basalts had nearly an order of magnitude less air argon
than did the mineral separates. Since his whole rock samples were
large (about one cc) and the individual particles in his mineral
separates were small (order of 1 mm) he concluded that the bulk
of the atmospheric argon contamination resided on the surfaces and
TABLE II
MEASURED ATMOSPHERIC 4oAr CONTENT IN ARGON EXTRACTIONS ON GEOLOGICAL MATERIALS (McDOUGALL, 1966)
Type of Sample
whole rock pyroxene sanidine hornblende plagioclase biotite muscovite
. 40 Average Atmospheric Ar
Content (xio-7 cc/g)
o.s 5.2 6.2 8.7
11 22 44
13
No. of Samples
31 8 5
12 12 32
7
was acquired during laboratory crushing and handling.
McDougall et al. (1966) and McDougall (1971) noted
that samples which were aitered tended to have higher air argon
contents. They did not give any specific explanation for the
relationship.
An investigation that studied atmospheric argon
exclusively was made by Mussett and Dalrymple (1968). They attempted
three experiments in hopes of determining if the contamination was
acquired in the lab. In an exposure experiment, basalt samples were
handled in an argon free glove box. Sawing but no crushing was
accomplished under a nitrogen atmosphere. The samples were analyzed
after various degrees of deliberate exposure to argon, ranging from
none to storage under pure argon for 59 days. They observed "no
spectacular systemic variation of the air argon contamination with
exposure". In the second experiment test samples were stored under
vacuum for various lengths of time and they showed no air argon
reduction due to prolonged vacuum storage. Finally, three sanidine
samples were HF etched under nitrogen and compared to HF etching
under air. There was no significant difference. Their overall
conclusion was that most of the atmospheric argon was not acquired
in the lab and they suggested that it must be within the rock.
Later studies by Lanphere and Dalrymple (1971)
have tended to reinforce that idea. Using incremental heating
in 40Ar/39Ar experiments they observed that 36Ar, the indicator of
atmospheric argon, was released over a broad temperature range,
14
approximately J00-1200°c. They concluded that much of the atmospheric
argon was held in lattice positions throughout the samples.
Gramlich (1970) presented a brief study of atmos-
pheric argon contamination. He measured the air argon content of
some augite phenocrysts from Sa.lt Lake Crater, Oahu. These pheno-
crysts are believed to have been formed within the earth's mantle,
and therefore should have had no atmospheric argon exposure until
their extrusion. He made a study of the atmospheric argon content
as a function of particle size recalculated in terms of surface
area on samples from 40-60 mesh (""JOO;-<) down to 1-10)1• He found
a continuous increase in atmospheric argon as the particle sizes
-7 I -7 I became smaller, from 3xl0 cc1g to 27xl0 cc1g. He concluded
that the increase was a resuJ.t of the greater surface area in
smaller particles, in agreement with the work of Evernden and of
McDougall as outlined above.
Dalrymple (1969) and Krummenacher (1970) analyzed
historic lava flows and volcanic material. The air argon contents
are significant in that they are not unusually low. Since the field
exposures of these samples were minimal, the air argon was more than
likely acquired initially or in the lab.
A number of techniques have been utilized to help
minimize air argon contamination. McDougall (1966) recommended
the use of massive rather than vesicular rocks. Dalrymple, Evernden,
McDougall, and Gramlich have all, among others used and advocated
the use of large blocks or chunks for dating young basalts to avoid
15
extra exposure of surfaces. HF etching has been successfully used on
feldspar concentrates (Evernden and Curtis, 1965) but has had less
use and has been used less successfully on whole rock samples
(Amaral et al., 1966; Fwuchouser, 1966). Sample and extraction
system bakeout before analysis is routinely used to achieve a low
air argon content. Degassing the crucible at rock fusion temper-
atures in vacuo helps further reduce instrumental air argon
(Charlton and Mussett, 1973 ) . Sample bakeout temperatures ranging 0
from 50-450 C have been employed. This large spread makes it
difficult to compare directly the air argon results of various
workers. The higher bakeout temperatures can only give lower
atmospheric argon contamination, but risk the loss of radiogenic
argon a·s shown by Frechen and Lippolt (1965) and Lanphere and Dalrymple
(1971). Little detail is known about the temperature dependence of
radiogenic argon release from basalts, so it is not presently
possible to know with certainty when the optimum bakeout temperature
is being used.
In summary, despite a number of studies neither the
crystal location nor the time of addition of atmospheric argon has
been unambiguously determined. Surface contamination explains
some data (McDougall, 1966; Evernden and Curtis, 1965; Gramlich,
1970) but an intracrystalline location is indicated by other work
(Mussett and Dalrymple, 1968; Lanphere and Dalrymple, 1971) .
Laboratory additions may (McDougall, 1966) or may not (Mussett and
Dalrymple , 1968) be important.
16
An advance which initially offered the hope of a
solution to the atmospheric argon problem is the 40Ar/39Ar tech-
nique of potassium-argon dating. It was proposed by Merrihue
(1965 ) and used initially by Merrihue and Turner (1966) and Armstrong
(1966). The technique is based on the production of 39Ar from the
irradiation of 39K with fast neutrons by the 39K(n,p)39Ar reaction.
Under known radiation conditions the amount of 39Ar produced is a
measure of the potassium content of the sample. If the sample is
then heated, a potassium-argon age can be calculated from the
measurement of argon ratios only. Since all measured species are
argon and since only ratios are needed, it is not necessary for
all of the gas to be released from the sample. In practice this
is used to great advantage by measuring the ratios in incremental
heating experiments.
The 40Ar/39Ar method has several advantages over the
conventional technique of measuring the potassium by flame photometry
and the argon separately by fusion and isotope d~lution. First the
11 potassium 11 and argon determinations are made on the same sample,
eliminating any errors arising from inhomogeneous potassium dis-
tribution. Since only ratios are needed, absolute elemental abundances
are not required for either potassium or argon. This advantage is
partially offset by the corresponding new requirement that comparable
irradiation and ratio measurement must be performed on standard
samples. The method is conducive to very small sample weights.
On old material, less than 10 mg was used by Turner (1970). This is
17
particularly helpful on valuable samples such as lunar material
and meteorites.
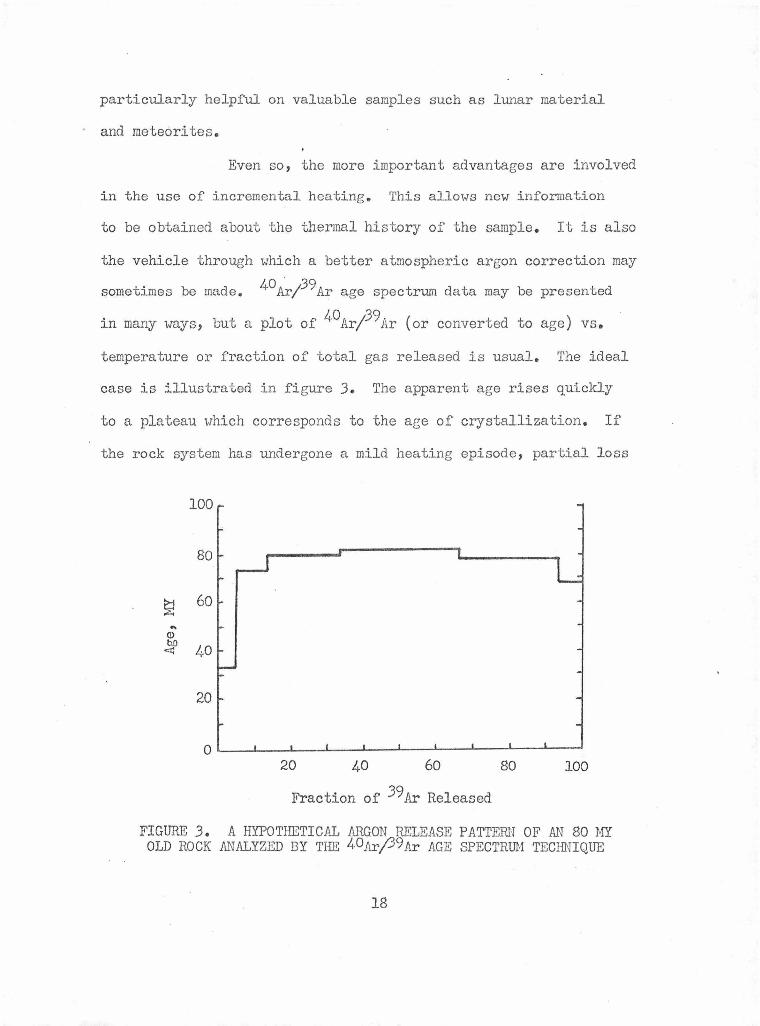
Even so, the more i mportant advantages are involved
in the use of incremental heating. This allows new information
to be obtained about the thermal history of the sample. It is also
the vehicle through which a better atmospheric argon correction may
sometimes be made. 40~;39Ar age spectrum data may be presented
in many ways, but a plot of 40Ar/39Ar (or converted to age) vs.
temperature or fraction of total gas released is usual. The ideal
case is ::.llustrated .in figure 3. The apparent age rises quickly
to a plateau which corresponds to the age of crystallization. If
the rock system has undergone a mild heating episode, partial loss
... Q)
~
20 40 60 80 100
Fraction of 39Ar Released
FIGURE 3. A HYPOTHETICAL ARGON P..ELEASE PATTERN OF AN 80 MY OLD ROCK ANALYZED BY Tiffi 40Ar/39Ar AGE SPECTRUM TECHNIQUE
18
of radiogenic argon may have resulted. Fitch et al. (1969)
predicted and observed release patterns representing such circum
stances. While the interpretation of complex release patterns
is somewhat speculative (Lanphere and Dalrymple, 1971), it is
nonetheless reasonable. Also the absence of such compleyJ.ties
is strong evidence that the sample has suffered no post-clock
setting heating events.
If the release of atmospheric argon occurs pre
ferentially in low temperature regions, it follows that the high
temperature heating steps will be enriched in radiogenic ar gon
and a potentially more accurate age may be obtained (Merrihue and
Turner, 1966). Reduction in the percent atmospheric argon at
higher temperatures was obtained by Fitch et al. (1969) and by
Lanphere and Dalrymple (1971). The latter authors noted that
the reduction was more the result of an increase in radiogenic
argon in the higher temperatures, rather than a decrease in the
atmospheric argon which was released rather uniformly over a
large temperature range.
A final advantage is that the individual heating
steps provide the necessary data for an isochron type analysis
(Brereton, 1972) which avoids making a direct correction for
atmospheric argon. Details concerning the isochron approach are
given in the next section.
The drawback to the 40A:r/39Ar technique is that
unwanted nuclear reactions produce argon interferences. These
19
reactions have been discussed most thoroughly by Brereton (1970)
and Turner (1971). Brereton (1970) ·lists some 19 reactions which
produce argon isotopes. The major interfering reaction for young
samples is 40ca(n,no<) 36Ar. This calcium reaction interferes with
the atmospheric argon correction. It is especially important in
basalts and other mafic rocks and those minerals whose calcium to
potassium ratio is high. A calcium correction is made by measuring
the argon 37 produced by another nuclear reaction involving calcium,
40ca(n,ol..)37Ar, and knowing the 37Ar/36Ar ratio produced from the
neutron irradiation of a pure calcium salt such as CaF2•
The magnitude of the interferences on young samples
was shown by Dalrymple and Lanphere (1971). They analyzed two
basalt samples which had uncorrected apparent ages of 1.76 and
l.OJ MY. After correction for Ca derived interferences, the ages
became 7.67 and 3.36 MY. While the corrections can be applied
rather well, the net result in this instance was a greater overall
uncertainty than was achieved by the conventional technique. The
authors concluded as did Brereton (1972) that the technique is not
preferred on samples less than 10 MY old. Armstrong (1970) in
another comparison with the conventional technique found the con-
ventional approach more precise for any age.
Another new K-Ar method similar to the 40Ar/39Ar
technique has been described by Mitchell (1972). The sample is
irradiated by ganuna rays rather than neutrons and use is made of
the J9K(r,n)38K !..!.. 38Ar reaction. Ages are obtained from the
20
40Ar/38Ar ratio. The extent of calcium or other interferences has
not been determined but unfortunately no correction comparable to
that in the 40/39 method can be made. The eventual utility of
this method is presently unknown.
b. The second problem that becomes extremely impor-
tant in young samples concerns the sample's initial argon isotopic
composition. That is its precise adherence to the assumption that
all of the argon is either radiogenic or unfractionated atmospheric
argon. Any small initial deviation will cause a larger percent
error in young samples. In recent studies this assumption has been
increasingly criticized as sources and occurrences of extraneous
argon have been reported.
Lambert et al. (1966) calculated that significant
quantities of 36Ar could be produced from cosmic ray induced nuclear
reactions involving thermal neutrons and 36c1 among others. They
pointed out that the effect would be more important in surface
rocks of high altitude. Its importance must also be dependent on
the K/Cl ratio of the sample, and a few percent apparent loss in
age could result in some samples.
Dalrymple (1969) reported argon analyses on known
age lavas of world wide distribution. He chose samples from
historic lava flows to test if small amounts of extraneous argon
were likely to be a serious problem in K/A:r dating of young rocks.
Twenty-six flows were analyzed and five had detectable excesses of
mass 40. Included in his study were three samples from Mauna Loa
21
and Kilauea which were normal and a sample of the 1801 flow on
HuaJ.alai which had the most excess 40 of his samples. Three
flows had small excesses of 36 (40/36 < 295.5). He suggested
that this may have been from isotopic fractionation of atmospheric
argon but pointed out that t here was no obvious reason why
fractionation would have occurred in only three of the samples.
By 14c dating of preserved bits of charcoal,
McDougall et al. (1969) were able to establish that many of the
flows in the Auckland volcanic field, New Zealand, were less than
50 1000 years old. K-Ar ages on the associated lava flows gave
apparent ages of 145,000 to 465,000 years. The excess 40Ar was
evenly distributed throughout wide areas, which meant that the K-Ar
ages were internally consistent and would have appeared normal
without the contrary 14c evidence. They suggested that excess
argon may be a more serious problem in continental regions, where
the magma has to penetrate thicker, older more potassium-rich
crustal layers.
Krummenacher (1970) attempted to resolve how
extraneous argon was acquired by the rocks. He measured the
40/36 ratios of 27 modern surface rocks. He found the 2/3 of the
samples contained unfractionated atmospheric argon. Of the instances
where the 40/36 ratios were anomalous, three were apparently due
to excess argon 40 which had not been removed from the magma, and
sic others were caused by fractionation of atmospheric argon. Three
of those fractionated samples had anomalous low 40/36 ratios and
the other three were high.
22
Damon et al. (1967) and Brereton (1972) have
pointed out that it would be reasonable for a small amount of
magmatic argon to normally remain in the melt upon extrusion and
become extraneous argon. Since the argon in magmatic gases may
have 40/36 ratios greater than (Zartman et al., 1961) or less than
(Cherdyntsev and Shitov, 1967) the atmospheric value, a residual
component in a rock could make the age appear either too old or
too young.
In some cases isochron plots have been useful in
helping to detect and avoid the problems of excess argon or initial
40/36 ratios different than that of the present day atmosphere. As
the name implies this graphical aide requires samples of a single
age. Normally they also must have a range of potassium concentra-
tions.
11, a
When time is constant in the age equation, equation
plot of 40Ar d vs. 40K for different samples gives a straight ra
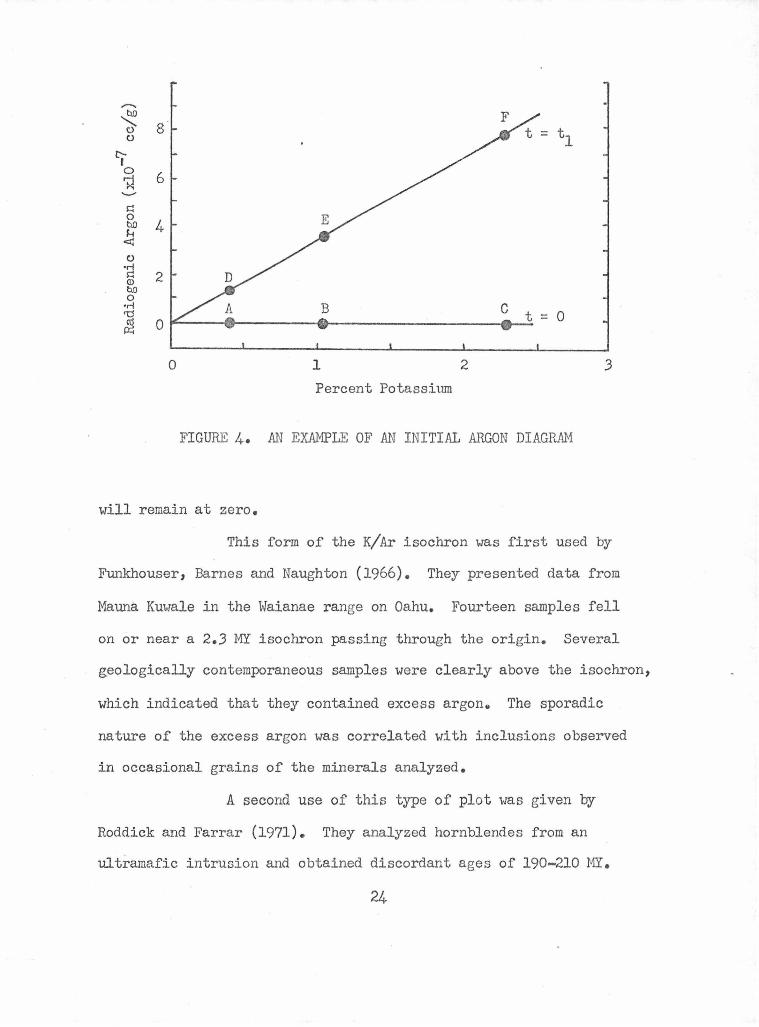
line .with the slope related to the age. This is illustrated in
figure 4. It is a hypothetical plot of radiogenic argon versus
percent potassium. A, B, and C represent minerals of different
potassium contents, as they are ideally formed, i.e. with no excess
argon. As time passes radiogenic argon accumulates in each mineral
proportionally to its potassium content. At t = t 1 the radiogenic
argon content for each potassium concentration is different, minerals
A, B, and C will have radiogenic argon contents corresponding to
points D, E, and F which will always be linear and the intercept
23
0 1 2 3
Percent Potassium
FIGURE 4. AN EXAMPLE OF AN INITIAL ARGON DIAGRAM
will remain at zero.
This form of the K/Ar isochron was first used by
Funkhouser, Barnes and Naughton (1966). They presented data from
Matma Kuwale in the Waianae range on Oahu. Fourteen samples fell
on or near a 2.3 MY isochron passing through the origin. Several
geologically contemporaneous samples were clearly above the isochron,
which indicated that they contained excess argone The sporadic
nature of the excess argon was correlated with inclusions observed
in occasional grains of the minerals analyzed.
A second use of this type of plot was given by
Roddick and Farrar (1971). They analyzed hornblendes from an
ultramafic intrusion and obtained discordant ages of 190-210 MY.
24
The data however fit a straight line isochron of 175.5 ± only 2.8
MY. The ·straight line, unlike that produced by Funkhouser et al.
(1966) did not go through the origin. The discordant data is
explained by the isochron plot as a constant amount of excess argon
in all of the samples, in this case, l.6x10-6 cc/g. This type of
plot was called an initial argon diagram by Roddick and Farrar
(1971) and they point out that it still assumes that all of the
36Ar is from the atmosphere and that all of the atmospheric argon
had a 40/36 ratio of 295.5.
A more general isochron treatment developed by
McDougall, Polach and Stipp (1969) has been used to avoid these
assumptions. They point out that the argon 40 comes from three
sources, that is:
40Ar = 40Ar + 40Ar + 40Ar total radiogenic excess atmospheric"
By substitution using the equivalent of equation (11) and dividing
by 36Ar, they obtained the general isochron equation:
40Ar 40K 36 = (constant)(t)~ +
Ar total Ar
In this presentation the 40Ar/36Ar. •t is a combination of any · 1n1
unescaped 40Ar excess ~ 36Ar from whatever source, that tra-
velled with the magma or was mixed with it {atmospheric) before
the clock 1'18.s set. It would be close to the atmospheric value if
that were the source of most of the initial argon. This initial
argon value accomodates three potentially troublesome problems;
25
(14)
(15)
excess argon ltO, non-atmospheric 36Ar, and fractionation of any
atmospheric argon acquired dtu~ing cooling, either into or out of
the magma. In this nomenclature the fundamental assumption in
conventional K/Ar dating would be that 40Ar/36Arinit equals either
zero or 295.5. The 40Ar/36Ar t is any argon added to the sample am
from the atmosphere after t = o, up to and including analyt.ical
sources. This is a more restricted definition of atmospheric
argon than is used in more general discussions.
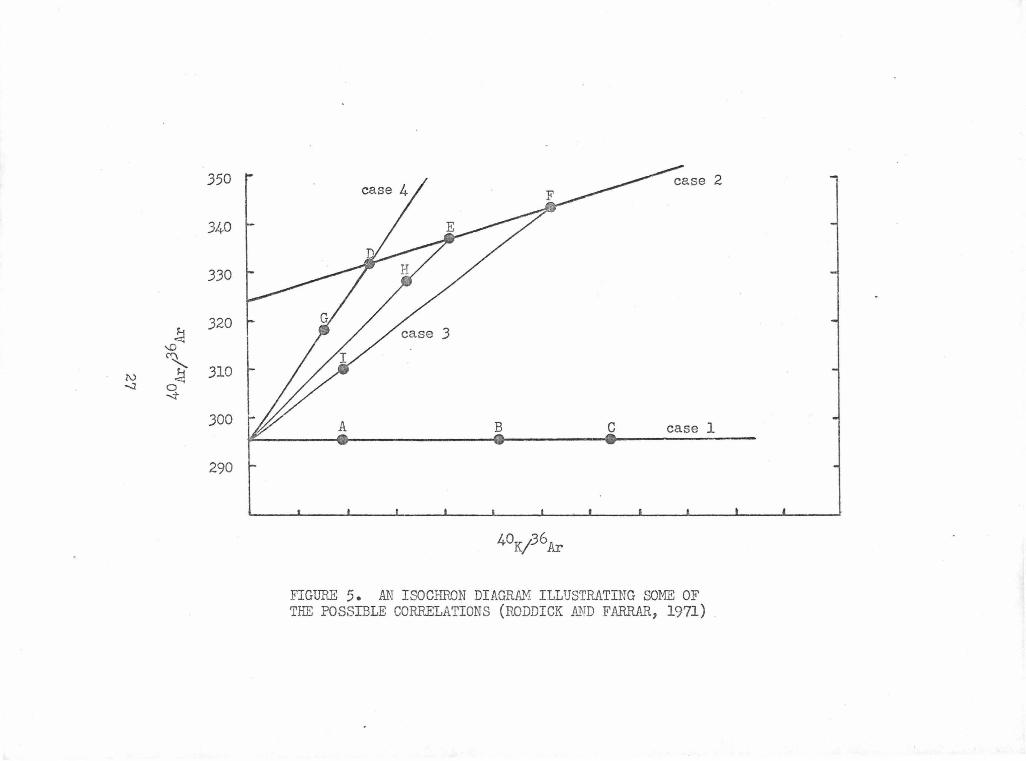
If this form of the isochron is used a plot is made
40 ;:36 40 36 of Ar Ar total vs. K/ Ar. Figure 5 helps explain the poss-
ibilities that may arise:
Case 1: If no initial argon is present or if it
has a 40/36 ratio of 295.5 a straight line will be obtained whose
intercept is 295.5. At t = 0 samples with no initial argon form
the line ABC with slope zero. The slope of the line increases
with age. The spread in the points along the line may be due to
both· potassium concentration variation and varying amounts of
atmospheric argon.
McDougall (197lb) obtained three excellent Case 1
isochron plots for young oceanic subaerial basalts.
Case 2: If the initial argon ratio is constant,
a straight line will be obtained if no atmospheric argon contamination
has been added. An example would be line DEF in figure 5. Hayatsu
and Carmichael (1970) have probably been the most successful in
using the isochron approach to resolve discordant data. They found
26
.350
.340
.3.30
!;J .320
'° ' .310 l\) .;i -..J 0
--:t
.300
290 ~
A B c case 1 • ~ •
40K/.36Ar
FIGURE 5. AN ISOCHRON DIAGRAM ILLUSTRATING SOME OF THE POSSIBLE CORRELATIONS (RODDICK A.~D FARRAR, 1971)
three instances (two from the literature) fitting Case 2; that is
with a constant initial argon ratio, without added air argon, and
with a wide range of potassium contents available for samples of
a single agG. In their own study of metamorphosed samples they
obtained discordant conventional ages ranging from 400 to 900 MY.
However all of the samples fell on an isochron of t = 394 MY and
initial argon ratio of 488. The discordant sets of analyses from
the literature which were successfully treated with isochrons
were also from metamorphic systems.
Increasing amounts of added atmospheric argon
contamination on the points D, E, and F in figure 5 would cause
each of them to decrease along straight lines towards 40Ar/36Artot
= 295.5 (points G, H, and I). Linearity would be maintained only
when the atmospheric contents were fortuitously balanced and the
slope of such a line would have no meaning.
Case 3: In general, nonlinearity will occur
whenever either the initial or the atmospheric argon contents
are not constant. Roddick and Farrar (1971) attempted to fit
tgeir data to an isochron. As mentioned earlier they had good
success with hornblendes. However pyroxene, biotite, and whole
rock samples did not give any coherent pattern.
Case 4: An exception to Case 3 will occur if the
potassium concentrations as well as the initial 40
Ar/36Ar ratios
are constant. Under these special conditions, a straight line
wili be obtained whose intercept is 295.5. The points are spread
28
along the 4°K/36Ar axis only by changes in the atmospheric argon
content. The straight lines would be like GD and would not have
zero slope at age zero. These lines (called apparent isochrons
by McDougall) would be indistinguishable from those produced in
samples with no initial argon and a real age (Case 1).
Thus, a variation in potassium is necessary for
the unambiguous interpretation of linear data which intercepts
40 36 . the Ar/ Artotal axis at or near 295.5. McDougall et al. (1969)
encountered this special case with three sets of data on basalts.
It was not surprising that the potassium content in a suite of
basaltic rocks did not vary significantly. They used independent
14c data to show that the apparent isochrons were caused by a
constant amount of excess argon, rather than by radiogenic argon.
The enthusiasm of the various authors towards
the isochron approach has been roughly proportional to their
success with it. Hayatsu and Carmichael (1970) recommend it for
all K-Ar dating. Roddick and Farrar (1971) indicate it should be
used for young or low potassium rocks. McDougall et al. (1969)
concluded that it was useful, but not as helpful as they had hoped.
The requirements for an isochron treatment are not
insignificant. Multiple samples of a single age, with varying
potassium contents and constant initial argon ratios are required,
with no atmospheric argon added after the clock had been set.
Extra analyses are carefully avoided in isotope ratio mass spectrometry
where the throughput is limited. Obtaining a significant range in
29
potassium contents on whole rock basalt samples of a single age would
be difficult if not impossible in some areas. From a consideration
of the sources of extraneous argon, initial argon ratios in volcanic
systems certainly would not always be expected to be constant. Vari
able amounts of atmospheric . argon according to McDougall et al. (1969)
and Baksi et al. (1967) are the rule rather than the exception. The
idea of using the isochron approach to obtain more meaningf'ul K-Ar ages
on young samples is well founded theoretically. However, the practical
difficulties in applying it make its utility in this area less certain.
Also it should be pointed out that although the isochron approach may
avoid a direct correction for air argon, this still would limit the
method. One would simply shift from measuring small fractions of
radiogenic argon to attempting to resolve a near-zero slope.
A possibility which the isochron approach does not
guard against, is an excess argon content which is proportional to
the potassium content. . This situation was also observed in the data
of McDougall et al. (1969). It produced a false isochron which
required independent evidence to expose. The above authors suggested
that this type of anomaly results when the potassium in the lava was
concentrated in contamination material with an older real age.
c. The final critical concern in the measurement of the
radiogenic argon content in young samples is chloride contamination.
Chloride can be volatilized in the form of hydrochloric acid and
H35c1, if present in the mass spectrometer, interferes with the
crucial 36Ar measurement.
The chloride content of typical basalts is 0.01%
30
(Kuroda and Sandell, 1963). Further, HCl is one of the most stable
chlorides at elevated temperatures such as those used in the argon
extraction, and the equilibrium (Iuasaki and Katsura, 1967) favors
release of the HCl from the rock. The volume of HCl potentially
released from a normal young basalt sample then is about eight
orders of magnitude greater than the total amount of 36Ar.
Fortunately HCl is easily removed by gettering (described under
ARGON ANALYSIS) and gross contamination is never observed.
A check for residual chloride contamination is
normally made in the mass spectrometric analysis by scanning masses
35 and 37. Hydrochloric acid gives peaks at these masses which
represent chloride ion isotopes, 35c1 and 37c1, produced by frag
mentation in the ion source. If these peaks are present the results
are thro\.1!1 out but if they are absent chloride is concluded not
to be present (McDougall, 1966; Dalrymple, 1969; Krummenacher, 1970).
·B. DESCRIPTION OF THE PROBLEM
1. Purpose
The purpose of this research was to investigate
atmospheric argon contamination in very young volcanic rocks with
respect to its limiting effects on K-Ar dating. The following
interrelated areas were to be considered.
2. Improvement of .Argon .Analysis
Preparation of samples and any chemical or physical
pretreatment had been based on intuition as much as anything else.
31
Further evaluation of the effectiveness of HF in reducing atmospheric
argon was needed as the r?sults of Evernden and Curtis (1965 ) showed
that it was very beneficial while those of Amaral et al. (1966)
indicated that it was detrimental. The suggestion that argon is
adsorbed on surfaces by McDougall (1966), Evernden and Curtis (1965)
and Gramlich (1970) provided encouragement that some chemical or
physical treatment should remove it.
Successful K-Ar dating of young samples with a high
fraction of atmospheric argon requires precise isotopic argon
analysis. The most recent previous work with the instrumentation
in this laboratory by Gramlich (1970) was quite successful, reporting
mass spectrometric precision of ± 0.1%. Unfortunately both the
stability and precision of the mass spectrometer had degraded
unaccountably before this research had begun. The isotopic argon
analysis procedure was to be further modified so samples containing
only a small radiogenic argon component could be dated accurately
and precisely. This was to include each area of analysis ;
extraction, gas purification and mass spectrometric analysis. The
possibility of chloride interference was to be especially considered.
Increased mass spectrometric sensitivity was an avenue proposed to
allow the more accurate detection of small quantities of radiogenic
argon.
3. Time of Addition
The possible times of addition of atmospheric argon
are while the lava is hot, called here initial argon; during its
32
exposure to the atmosphere after cooling, or field addition; and in
the laboratory. Atmospheric argon pickup in molten lava whether in
the magma chamber, conduit, or upon the surface has little chance of
being detected first hand. It was hoped that quenched glass material
might give useful information of initial argon contentso Mussett and
Dalrymple (1968) suggested that a study of intrusives might resolve
whether atmospheric argon is obtained at or after extrusion. This
suggestion was to be investigated. Accumulation in the field could
possibly arise from either gradual adsorption, diffusion (Evernden et
al., 1960), or from any alteration process occurring in which atmos
pheric argon is available. Field additions are implied in the work
of McDougall (1971a). The occurrence of laboratory additions is
disputed, with the researchers favoring surface adsorption also
reporting lab additions, whereas Mussett and Dalrymple (1968) found
none. Lab and field additions and their mechanisms are important and
also important to know about if the isochron approach is used as the
linearity of such plots is at stake. The Hawaiian Islands were
thought to be an excellent source of samples for resolving when
~tmospheric argon becomes attached. A wide variety of extrusive and
intrusive rocks are exposed which have had known histories of initial
and field exposures.
4. Location of Atmospheric Argon
The major uncertainty of the location of atmospheric
argon concerned the importance of surface vs. intracrystalline
locations, which also is involved in the question of the time of
33
air argon addition. The resolution of this issue was a major goal.
In addition, it was considered desirable to obtain more specific
information about possible locations. The relative importances of
vesicles, microvesicles, interstitial glass, alteration, and
alteration products were not known. The distribution of air argon
among the minerals in common mafic volcanic rocks was not well
known, however McDougall (1966) and Dalrymple and Lanphere (1969)
had compiled some data. Experiments using mineral separates,
volcanic glasses, crushed basalts and various other physical and
chemical treatments were to be devised in order to determine where
· in the sample atmospheric argon is located.
5. Applications
Several useful applications were foreseen to be avail
able for any overall improvements that might be made in the analysis
of argon released from basalts. In fact, each very young date
carefully obtained is useful at this stage for purposes of continued
evaluation of the concept of applying the K-Ar method to its analyt
ical extremes. Age studies in the Hawaiian Islands (McDougall, 1964)
h~ve shown the rates of island building to be quite rapid, and
further work in the vicinity of the current activity could give
more information about current rates. Also, any small fractionation
of atmospheric argon in basalts or initial argon ratios slightly
different than 40/36 = 295.5 can best be detected when the total
contamination is low, and of course when the precision of measure
ment is high. Finally, with some researchers calling for the use of
34
an isochron approach in K-Ar dating, especially for young or low
potassium rocks, it was felt that the usefulness and necessity
of this approach should be evaluated by any appropriate results.
35
II. EXPERIMENTAL PROCEDURES
A. SAMPLE PREPARATION
1. Selection Criteria
In contrast to the data on atmospheric argon, recommended
criteria for the selection of whole-rock samples for K-Ar dating are
harmonious. The most authoritarian guidelines have been given by
Evernden (Evernden et al., 1964; Evernden and James, 1964; Evernden
and Curtis, 1965) 1 McDougall (1966), and by Dalrymple and Lanphere
(1969). Basically, if the potassium is located in a mineral which
itself retains its radiogenic argon adequately, then the whole rock
should be suitable for dating.
Potassium is not easily accomodated in the major components
of most basalts, pyroxenes and olivine, and can be accepted only to
a small extent in calcic plagioclases (Mason, 1968). Electron
microprobe studies (Mankinen and Dalrymple, 1972) have shoYn that
potassium is usually incorporated in the final minerals to crystallize,
often being deposited along grain boundaries in small potassium
feldspar crystals or even remaining uncrystallized in interstitial
glass. All of the various possible primary mineral locations in
volcanic rocks are acceptable in terms of argon retention, even
though the observed potassium concentrations in them may be too
small for practical use. Glasses, however, especially after
devitrification, are not adequately retentive (Evernden et al., 1964;
Dalrymple and Lanphere, 1969). Because of this, dating whole rock
samples with interstitial glass should be avoided.
36
The point vhich is invariably stressed above all others is
that the · sample should be unaltered. Evernden et al. (1964) report
"For dating purposes the sample must be virtually unaffected by uea
thering or post-depositional chemical alteration". McDougall (1966)
mentions that blasting is sometimes required to obtain fresh samples.
Such drastic measures are not always practical, and completely un
altered rocks are often difficult if not impossible to find. All
agree that a thin-section examination is absolutely required. The
concern arises from the fine grain texture of most basalts, particu
larly the late crystallizing potassium containing portion. Because
the crystals are so small, it is felt that radiogenic argon could
be lost from only moderate heating. Also since the potassium is
normally concentrated in a small fraction of the total volume of
basalts, a relatively small amount of alteration could have profound
effects on the potassium's environment. Kaneoka (1972) suggested that
the H2o(+) content of volcanic rocks could be used as a criterion for
judging a sample's suitability • . There is an exception to the rule of
no alteration allowed. Since olivine contains practically no potassium,
the above authors all allow that olivine may be altered to iddingsite
without harm.
The samples used in this research were selected with the
above in mind. However numerous samples that were of interest
because of their air argon contents would not have been adequate for
K-Ar dating. Specific sample descriptions are given when they are
related to the results.
2. Crushing, Sieving, and Mineral Separation
The use of large chunks of rock had been widely
37
recommended as a means of minimizing air argon (McDougall, 1966;
Dalrymple and Lanphere, 1969; Gramlich, 1970). Accordingly,
blocks as large as 10 g were occasionally analyzed. Many other
samples were crushed before analysis. The crushing was performed
with an iron mortar and pestle, without grinding. The crushed
material was transferred to the sieves frequently in order to
remove sufficiently crushed particles. The process was either
wet or dry, and this aspect will be discussed in detail later.
Metal sieves as small as 100 mesh which were hand
cleaned and checked for contamination were used. Disposable cloth
sieves were used between 100 and 400 mesh. On one occasion
particles less than 400 mesh were separated using a gravitational
settling technique described by Gramlich (1970).
Mineral separations were attempted occasionally on
a Frantz Isodyna.mic Separator. Olivine phenocrysts could usually
be easily removed from material crushed as fine as the phenocrysts.
Groundmass minerals on the other hand, were almost always too fine
to be significantly separated on any sievable particle size.
3. Acid Treatment ·
. A variety of HF etching conditions were attempted.
Concentrations ranging from 1-10%1 and treatment times of a few
minutes to 40 minutes were used. After etching, the samples would
be thoroughly rinsed with deionized water in the ultrasonic cleaner.
Other samples were washed with nitric acid. About
10 ml of a 1% solution was used per gram of rock, usually for a
38
40 minute treatment. On a few occasions the acid was completely
consumed by this room temperature treatment and a second volume
of acid was used.
4. Other
All samples were rinsed in the ultrasonic cleaner
after any other treatment and dried in air at 140°c. Crushed
samples were split on a Jones type microsplitter into portions
for argon and potassium analyses when necessary. They were then ·
wrapped in copper foil before loading. All samples were baked
under vacuum at 200-250°C for at least 24 hours in the extraction
system.
B. POTASSIUM ANALYSIS
Potassium analyses were performed by atomic absorption
using the method given by Bernas (1968) as modified by Gramlich
(1970).
The portion of sample for potassium analysis was poYdered.
Usually, three aliquots of about 100-200 mg were placed in small
~eflon bombs. A small amount of deionized water was used to wet
the samples, then 3 ml of 48% hydrofluoric acid was added and the
lid was sealed by a stainless steel outer container. The bomb
was heated in an oven at ll0°c for one hour, and at the elevated
temperature and pressure, the rock was rapidly dissolved and a
large volume of acid was avoided.
After cooling, the bomb was opened and the solution was
diluted with 5 ml of deionized water. About 3 grams of boric acid
was added and more water was used as necessary to transfer the sample
39
and undissolved boric acid into a 100 ml polyethylene volumetric
flask. The flask was filled to the mark with deionized water,
at which point all of the solids had dissolved. Duplicate 5 ml
aliquo~s of the above solution were pipetted into 50 ml volumetric
flasks. About 3 mg of lithium as a dissolved salt was added to
enhance the potassium response in the flame. A standard addition
of exactly 10 micrograms potassium was added to one of the flasks
after vhich they vere diluted to volume with deionized water.
A Perkin-Elmer Model 303 atomic absorption spectrophotometer
utilizing an air-acetylene flame was used for the instrumental
analysis. F.a.ch final solution was aspirated at least ti.dee. The
potassium content of the sample was calculated by standard textbook
procedures (Willard et al., 1965, P• 342).
C. ARGON ANALYSIS
Along i.tith developments in sample pretreatment procedures,
a scrutinizing evaluation and further improvement of the argon
analysis were the chemical avenues to the geochemically oriented
studies. After giving a description of the equipment, the analysis
procedure which was developed is presented. It is described in
some detail to explain the changes ·which have been implemented and
also because drastic effects can be incurred in the final results
through seemingly insignificant modifications in many steps of the
analysis procedure. A step-by-step 11 cookbook11 description is given
in Append.ix A which may be used as a guide or to note details of
the procedure.
40
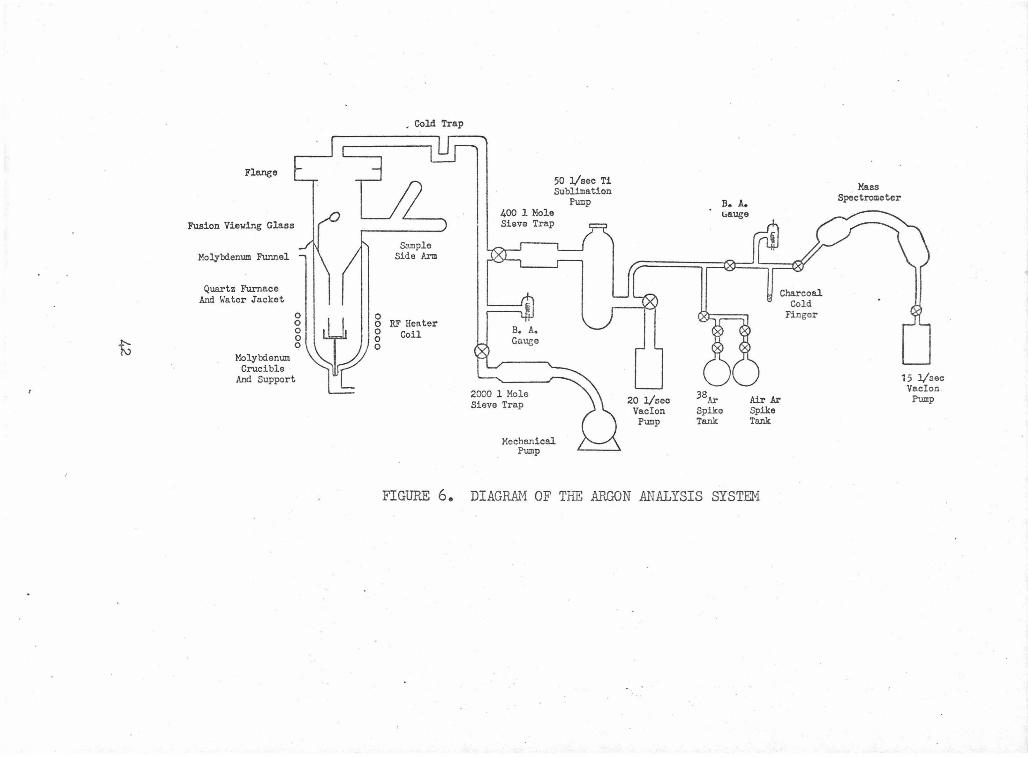
1. Equipment Description
Isotopic analysis of argon for K-Ar dating requires
means of achieving a high vacuum, extracting argon out of the rock,
purifying it from the released gases, and finally measuring it
in a mass spectrometer. The system in use at this facility at the
beginning of this research was the evolutionary result of its
most recent users, Funkhouser (1966), Noble (1969) and Gramlich
(1970). Their theses may be consulted for more detail concerning
the installation and modifications of any particular component.
A diagram of the entire system is given in figure 6.
A high vacuum is necessary in the entire system before
a sample can be analyzed. A mechanical pump in series with a
2000 liter molecular sieve trap was used to achieve pressures of
about lxl0-5 torr. A Varian Vacion pump on the mass spectrometer
and another on the extraction-purification sections further reduced
-8 each section's pressure. A base pressure of about lxlO torr was
usu~ily achieved after bakeout. · Fortunately, the mass spectrometer ·
required bakeout only after the rather infrequent exposure to the
atmosphere for replacing the filament. The gas extraction-purifi-
cation section was routinely baked after sample loading or sublima-
tion pump filament replacement. A network of heating tapes, re-
sistance furnaces, and a Maranite oven with four quartz I. R.
lamps were used to bake these sections at 200-J50°c. All metal
bakeable valves were used to isolate each pump from the different
sections for analyses, and also to separate the various sections
41
t
Flange
Fusion Viewing Glass
Molybdenum Funnel
Quartz Furnace And Water Jacket
Molylxiemll!I Crucible
And Support
0
, Cold Trap
S..'Ullple Side Arm
o RF Heater g Coil 0
400 1 Mole Sieve Trap
B. A. Gauee
2000 1 Mole Sieve Trap
50 1/sec Ti Sublimation
Pump
Mechanical Pump
20 1/sec Vacion
Pump
B. A. 1.rauge
38Ar
Spike Tank
Charcoal Cold
Finger
Air Ar Spike Tank
FIGURE 6. DIAGRAM OF THE ARGON ANALYSIS SYSTEM
Mass Spectrometer
15 1/sec Vaclon .
Pump
from each other for convenience in parts of the sample analysis,
for leak testing, and to maintain as much of the total system as
possible under vacuum when loading samples.
Argon was extracted by induction heating exclusively
in this work. A Lepel Model T-5-3-KC-L-S high frequency heater
was used. A maximum temperature of 1350°c, measured by an optical
pyrometer, was attained in the molybdenum crucible used for fusion
of the samples. Higher temperatures could have been achieved if
a smaller crucible had been used but they were unnecessary for
melting Hawaiian basalts. The crucible was supported in a quartz
furnace by a molybdenum stand. A water jacket around the furnace
protected it from radiative heat from the crucible. In order to
have the capability of running several samples without breaking
vacuum, and to be able to degas the crucible thoroughly at sample
mel ting temperatures, the samples were not loaded directly into the
crucible. Rather, they were loaded and stored in a horizontal
glass tube above the crucible. A bar magnet in the tube with the
samples could be moved with an external hand magnet. These magnets
~ere employed to move the sample when desired and to drop it through
a molybdenum funnel, into the degassed crucible. A side arm in
the tube allowed the sample analysis order to be changed at will.
The advantages of this arrangement have been discussed by Charlton
and Mussett (1973) and Baksi (1973).
The quartz furnace, water jacket, and sample sidearm
were attached to the remainder of the system by a ~- inch metal
43
flange, allowing new samples and clean crucibles to be added without
requiring the services of a glassblower. This modification greatly
increased the convenience of loading samples. A glass disk was
mounted at an angle over the crucible above the molybdenum funnel.
Metallic volatiles released from the crucible or sample quickly
mirror coated this glass and the course of the fusion could be
viewed.
Large quantities of gases are released from all types
of samples upon fusion. Adjacent and connected to the furnace is
the gas purification section. A liquid nitrogen cold trap was
available for condensing much of the water vapor and co2• A 400
liter molecular sieve trap (Linde 13x) helps further remove water
and some hydrocarbons. A Varian 50 l/s titanium sublimation pump
acts as a general getter for active gases. A large current, about.
40 amps, is passed through one of three available titanium filaments.
Titanium is flashed from the filament and condenses as a very
active surface on the water cooled outer walls. It forms stable
non-volatile compounds with such species as N2, o2, H2o, and co2•
The course of the gas purification is followed by measuring the
total gas pressure with a Bayard-Alpert ionization gauge. After
gettering, argon among the other noble gases remains. It is collected
on activated charcoal in a cold finger using liquid nitrogen, and then
it is expanded into the mass spectrometer.
The isotopic analyses were performed on a glass tube
Reynolds type mass spectrometer with a 4.5 inch radius of curvature
and a 60 degree magnetic deflection. The tube, magnet, and magnet
regulator were purchased from Nuclide Corporation. A Fluke Model
412b DC Power Supply was used to supply a 2 KV accelerating voltage.
A Faraday cup collector was used, connected to a Cary Model .31
Vibrating Reed Electrometer. The amplified signal was fed to a
Leeds and Northrup Model G Speedomax 10 inch recorder, which had
been rebuilt by the National Bureau of Standards.
2. Preliminary Degassing
Before the analysis proper is begun, the vacuum system
must be degassed as thoroughly as possible. This is essential
in order to keep the instrumental contribution of argon to the
sample as small as possible. There are five main sources of argon
to be dealt with: leaks, the crucible, getter filament, ion gauge
and mass spectrometer. Much could be said about leaks, but since
they cannot be reduced by any degassing technique they will not
be treated here, but rather assumed to have been previously reduced
to tolerable rates.
The crucible acquires large quantities of argon when-
eyer it is exposed to the atmosphere. ~ About 10 cc (Dalrymple
and Lanphere, 1969), a significant amount, remains even after the
0 normal bakeout at 350 c, a foreboding testimony to the ability of
argon to be strongly held. It is effectively degassed by heating
to temperatures at or above those used in the analysis. Because
gases are continually adsorbed on the crucible and its support when
cooi, they are heated just prior to the analysis. After the first
45
sample of a batch has been run, the crucible needs to be degassed
for a different reason. Some gases, such as water vapor, are
released from the sample melt for a far longer period of time
than argon. Therefore after a sample ana~ysis the crucible must
be further heated to reduce the amount of extraneous gases which
would have to be gettered in subsequent analyses. Normal heating
was 70 minutes, 40 immediately after a sample run and 30 immediately
before.
The getter filament is the largest source of instru
mental argon, and gives off argon throughout its short (about 8
working hours) lifetime. The most effective means of degassing
it is long term, low current use. With a 25-30 amp current, the
filament is hot enough to give off much of its gas, while very
little titanium is used. Overnight degassing at these currents
was adopted when it reduced blank argon values by one half. The
filament is also degassed for fifteen minutes at the highest used
currents (42-45 amps) just before the analysis.
The ion gauge acts as a pillnp when it is on. The ion
~urrent which is measured and related to the pressure is a stream
of particles which are accelerated onto the surrounding glass
envelope and partially sorbed. This pumping may introduce isotopic
fractionation since the velocities achieved are inversely pro
portional to mass (Barnes, 1963). Further complicating matters is
the unknown rate of desorption, which must also occur. The ion
gauge has a heater circuit which is used before an analysis for
46
degassing. At first, to minimize the problems posed by the ion
gauge, it was used as little as possible and degassed extensively.
A more satisfactory solut1on was to change the ion gauge control
unit from one having a minimum filament emission of 2 ma to a
Veeco Model RGS-6 with a continuously variable emission. By
operating at 20)-'a no pumping was observed in agreement with
Barnes (1963). At the lower emission the gauge required degassing
only after high pressures were encountered, presumably because
of adsorption on the grid.
Degassing the mass spectrometer is a new procedure
at this facility. It became necessary because of the large increase
in sensitivity acquired with the new use of source magnets. The
Reynolds type mass spectrometer has what is called the "memory"
effect. When a gas is analyzed, the ions produced are accelerated
down the flight tube with considerable energy. Many are sorbed
onto the walls and remain after neutralization. At the same time
the sorbed species are being bombarded by other ions and some are
dislodged. This gives rise to easily .detectable concentrations
of species that were sorbed during earlier analyses. This memory
effect causes the mass spectrometer to contribute argon to the
sample and blank whenever the accelerating voltage is on. Pumping
and release occur simultaneously. Pumping predominates for any
isotope when its partial pressure is high, and conversely reemission
will predominate if any isotope 1s partial pressure is lower than
normal. The system equilibrates very slowly because of the strength
47
of the sorption. In tests equilibrium was not reached in a six
hour run. Reemission is most troublesome in the blank where after
a few minutes of buildup it may comprise a significant fraction
of the argon. The sensitivity was improved by increasing the
number of accelerated ions, which caused the memory effect and
in turn the difficulty in making the blank correction to increase.
Repeated bakeout of the mass spectrometer to reduce
the effect of the memory is definitely impractical, because it
would require moving the main magnet, source magnets , and electro
meter preamplifier, each of which requires precise positioning.
The more practical means of speeding the removal of sorbed argon
is to turn on the accelerating voltage and allow the residual gas in
the tube to dislodge argon from the surfaces. Figure 7 shows a
plot of the buildup of 40Ar with time in the isolated mass spec-
trometer tube. This test interrupted routine analyses, so the
amount of argon released cannot be considered atypical. This
p~ot shows that substantial amounts of argon may potentially be
released as a result of the memory effect, and that it is released
faster when some gases are present in the tube.
Table III shows the rate of release of argon as a
f'unction of a few important instrumental parameters. Argon is
released more rapidly with an increase in filament emission. It
is also increased by scanning in and around mass 28. During the
normal analysis, the mass spectrometer is only ·scanned from mass
.35~0. This means that most of the argon which is accelerated
48
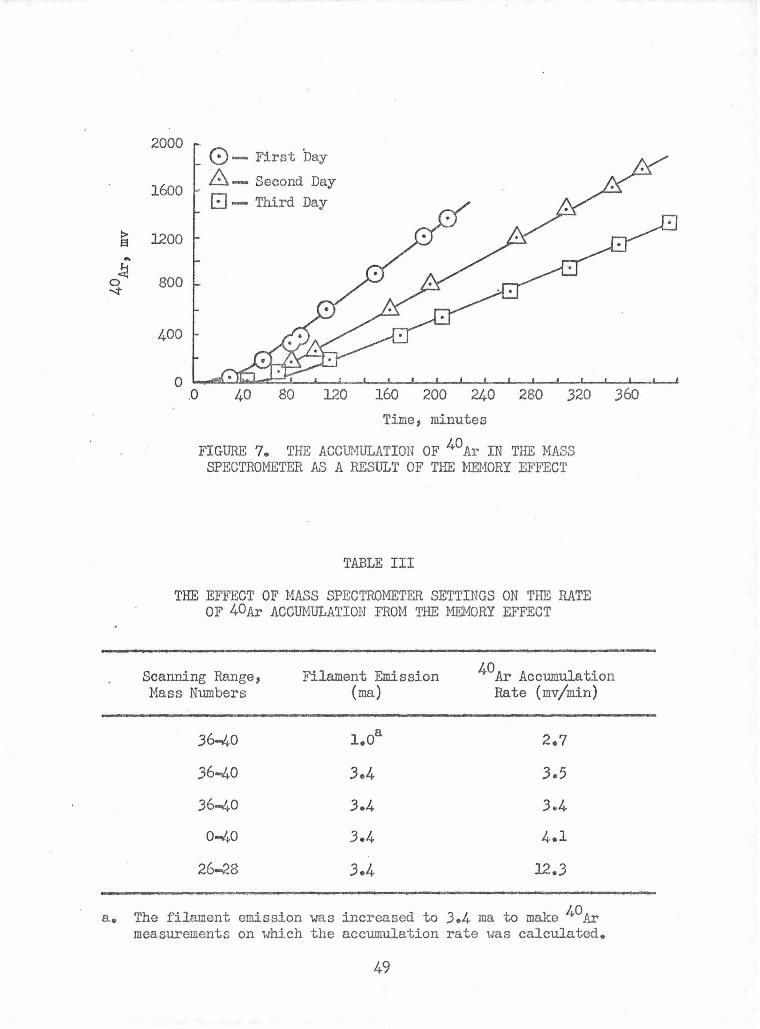
~ .. ~
0 ...;t
2000 0- First Day
1600 8- Second Day GJ - Third Day
1200
800
400
0 "-i&...::....Lll.o-'-~.1.--L---L--lL--....._--'--L~L--'--'--L~L--1--L.---1~.L-J
.0 40 80 120 160 200 240 280 .320 .360
Time, minutes
FIGURE 7. THE ACCTJMULATION OF 40 Ar IN THE MASS SPECTROMETER AS A RESULT OF THE MEMORY EFFECT
TABLE III
THE EFFECT OF MASS SPECTROMETER SETTINGS ON THE RATE OF 40Ar ACCUMULATION FROM THE MEMORY EFFECT
Scanning Range, Filament Emission 40Ar Accumulation Mass Numbers (ma) Rate (mv/min)
.36-40 l.Oa 2.7
36-40 3.4 3.5
36-40 3.4 3.4
0-40 .3.4 4.1
26-28 3.4 12.3
a. The filament emission was increased to 3.4 ma to make 40Ar measurements on which the accumulation rate was calculated.
49
down the flight tube impinges at or near the detector. If the
instrument is focused in the vicinity of mass 28, the most intense
peak of the background spectrum, molecular nitrogen, is bombard
ing the area where the argon is sorbed.
A procedure of routine degassing of the mass spectro
meter by scanning around mass 28, with the accelerating voltage on
and the instrument isolated from the Vacion pump, was adopted. The
length of time varied with the amount of argon which had been
analyzed, but several hours was common.
The entire degassing procedure did little to lower the
measured system pressure. It did however reduce the blank to levels
that were tolerably small, and reasonably consistent.
3. Blank
The object in running a blank is to duplicate the
procedures that are used in the sample analysis, so a correction
can be made for the instrumental argon contribution. Earlier
p~ocedures called for heating the crucible at maximum temperature
for five minutes after the last evidence of degassing, and after
that gettering the gases released until the pressure was a min
imum. Using these guidelines for the blank, the crucible was
heated for only five minutes since degassing was not observed,
and onJ.y about fifteen minutes of gettering was required because
little gas was released. Samples invariably required longer
heating, gettering, and overall analysis time, thereby making
the sample analysis consistently different from the blank in
50
practice, although not in written procedure.
There are a couple of reasons why this practice was
undesirable. Since the getter filament contributes significantly
to the blank, operating it for less time then than in the sample
led to artificially low blanks. This must be avoided particularly
in studies of atmospheric argon (as opposed to age-dating studies)
so that none of the contribution from the instrument would appear
to be from the sample. In addition, and much more importantly,
the blank needs to duplicate the sample procedure in order to
make the best possible correction for any isotopic fractionation
that may take place. Such fractionation is not known to occur,
but may take place to a very small degree. The ion gauge has been
mentioned in this regard; gases released from the getter filament
could also be fractionated; and any small leak should be enriched
in the crucial .36 isotope. Such fractionation must be small,
since blank runs normally analyze identical to atmospheric argon.
The blank procedure now used duplicates the sequence
to be follm.md in the sample analysis in every detail except for
the omission of an argon J8 spike. This was facilitated by
changes in .both the sample heating and gettering criteria which
were made for other reasons. -7 Usually blank values of O.l-0.5xl0
cc argon were achieved. Not infrequently though, small leaks would
increase the blank to 0.5-lxlo-7 cc. Samples expected to have
high air argon contents were coordinated with the poorer blanks
so that the percent contribution was kept low.
51
4. Calibration
In contrast to the other steps in the argon analysis,
the calibration procedure used was not changed at all from that
used by Grrunlich (1970). The method of isotope dilution using
argon 38 is used. A 877 ml stainless steel tank contains a
reservoir of 99.4% argon 38 at about lo-3 torr. It is separated
from the gas purification section by a much smaller (0 .877 ml)
stainless steel gas pipet with two Metal Products Co. metal
valves. An argon 38 spike is added to begin the analysis by first
allowing the tank to equilibrate with the pipet (3.0 minutes),
and then isolating the tank and admitting the portion in the pipet
to the system (5.0 minutes). The amount of argon in successive
spikes decreases exponentially according to the equation
~ 38Ar = Ae~.993lxl0 x
where 4.993lxl0~ is a constant which depends on the relative
(16)
sizes of . the tank and pipet, xis the number of the spike admitted,
and A is a constant. The value of A, and with it the calibration
of the spike tank itself is determined by analyzing a USGS standard
muscovite, P-207. The radiogenic argon content of this sample
has been d~termined in many labs and a composite value of 2.824xlo-5
std cc/g has been set by Lanphere and Dalrymple (1967). By £'using
P-207, a known amount of argon 40 may be extracted. Admitting an
argon 38 spike, and measuring the 40Ar d/38Ar "k ratio allows ra spi e
a determination of the amount of argon 38 in that spike. This
value may be substituted into equation 16 to find a value for Ao
52
5 • Extraction
The first concern of the extraction portion of the
analysis is completeness. After the sample had been dropped into
the crucible and an argon 38 spike added to the system, it was
heated below the melting temperature for one minute, two times.
These short heating i ntervals released much gas from the sample
and helped to prevent too rapid release. The old heating criteria
mentioned in the blank section, generally meant that the sample
was heated for about 8 minutes at maximum temperatures. This
compares with 15 minutes by McDougall (1964), 20-30 minutes by
Evernden and Curtis (1965) and 20 minutes by Kirsten (1966). Based
on these sources, it was considered prudent to lengthen the
heating time. Twenty minutes at 1350°c was chosen. After the
sample had melted, sometimes small unbroken bubbles would remain
on the surface of the melt. Evernden and Curtis (1965) reported
no apparent error arising from these bubbles. However to avoid
them; the heater was turned off once after the sample had melted.
The unevenly cooling melt produced strains in the glass formed,
and these bubbles would generally crack. A smooth surfaced melt
was obtained upon reheating.
Secondly the extraction procedure must avoid isotopic
fractionation. This has been a feared product of glow discharges
(Gramlich, 1970). A glow discharge is the description of a plasma
formation caused by the induction heater if the pressure around
the crucible ri ses to about lo-3 torr. They are generally avoided
53
by spacing the release of the gases with the two short heating
intervals. In the unusual event of a glow discharge, the heater
is immediately turned off and several extra minut es allowed for
gettering t o reduce the pressure.
Also preferential treatment of the argon from either
the spike or sample must be minimized. Formerly, liquid nitrogen
was placed on the cold finger containing activated charcoal as
the argon spike was added, and kept on throughout the extraction ·
step so that argon and other gases were collected. This helped
to avoid glow discharges and incidentally reduced the amount of
argon present in the vapor phase which could redissolve in the
melt. Such solution was not however expected to be significant.
This usage produced the undesirable result of having the argon 38
spike mainly adsorbed on the cold finger while most of the sample's
argon was moving about in the extraction-gas purification section.
Argon may be trapped at this time by the metallic volatiles which
are released by the melted sample only to condense on the nearby
cooler surfaces (Barnes, 1963). If the spike were proportionally
~vailable, this loss would not introduce any error •
. A compromise procedure was adopted to avoid dispro
portionate sample argon loss. First, the trap was not cooled
while the 38 spike was added so that no argon was initially on
the trap. Liquid nitrogen was added when the heating was begun
only if necessary to prevent glow discharges, and maintained only
until the pressure began to decrease when gettering became more
54
rapid than gas release. This corresponded with the melting of
the sampie in the worst cases.. The liquid nitrogen was then
removed for the remaining three fourths of the heating. Cooling
the trap was not required at all for most clean samples.
6. Purification
Another possible location where trapping may occur
is on the liquid nitrogen cold trap (without activated charcoal ) .
This trap is along the "line-of-sight" for gases corning out of
the furnace. On samples with a large water content a visible film
could be seen outlining the area of direct blow-by. Although argon
would not be adsorbed at this temperature the rapid accumulation
of large amounts of water can trap it rather effectively (Wampler
and Yanase, 1974). Also, adsorbed co2 has been reported to trap
argon in the same fashion by Hay (1963). Although no evidence of
trapping was noted in this study, the use of the cold trap was
discontinued in the latter part of this research because o.f' the
uncertainty that it added.
The combination of the molecular sieve trap and titanium
sublimation pump made for very fast gettering anyway. The bulk
of the active gases had usually been gettered before the extraction
step had been completed.
A shortcoming in the design of the titanium sublimation
pump required a revision. The water coolant was only routed along
the length of the tube-shaped pump and not on either end. These
ends became very hot during use and reduced the pumping speed
55
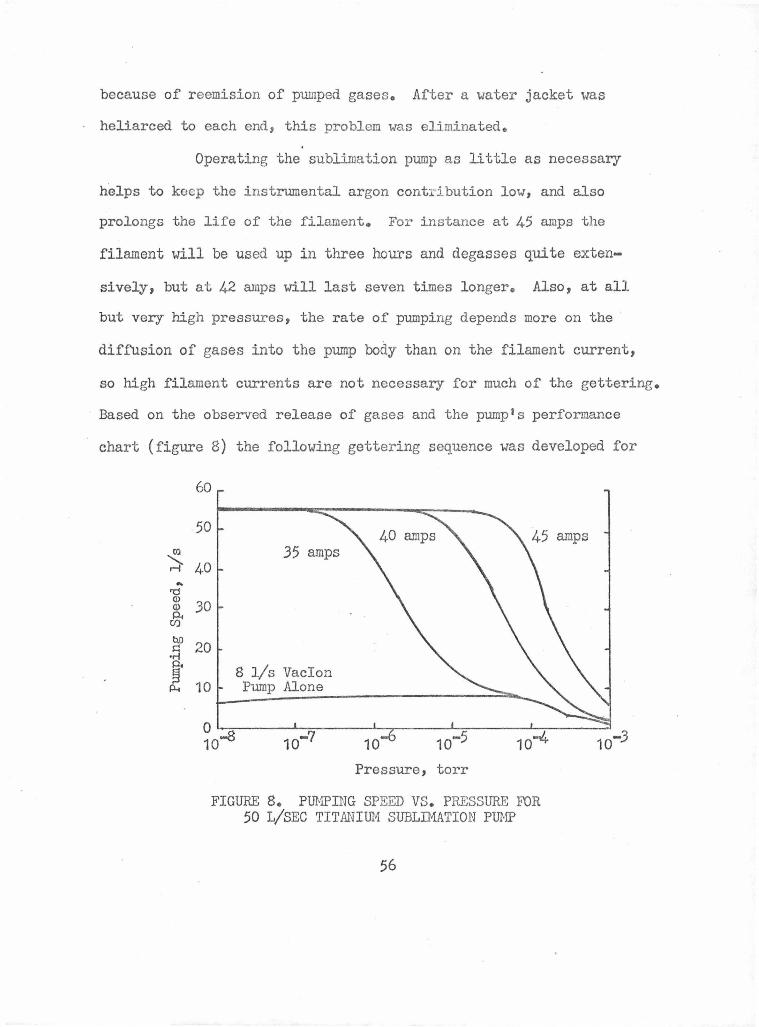
because of reemision of pumped gases. After a water jacket was
heliarced to each end, this problem was eliminated.
Operating the sublimation pump as little as necessary
helps to keep the instrumental argon contribution low, and also
prolongs the life of the filament. For instance at 45 amps the
filament will be used up in three hours and degasses quite exten-
sively, but at 42 amps will last seven times longer. Also, at all
but very high pressures, the rate of pumping depends more on the
diffusion of gases into the pump body than on the filament current,
so high filament currents are not necessary for much of the gettering.
Based on the observed release of gases and the pump's performance
chart (figure 8) the following gettering sequence was developed for
60
50
.. re ~ JO ~ bD 20 .~
35 amps
~ 8 l/s Vacion P.. 10 Pump Alone
L---;__~~~~~~~__;~-
Pressure, torr
FIGURE 8. PUMPING SPEED VS. PRESSURE FOR 50 L/SEC TITANIUM SUBLIMATION PUMP
56
a normal 5 gram sample: 45 amps for 5-15 minutes, 42 amps for
5-10 minutes, 40 amps for.25 minutes, 35 amps for JO minutes,
with a total of 75 minutes. During the gettering at 40 amps the
gas purification section's pressure was at or very near its ultimate
low. In data to be presented later the minimum pressure was demon
strated to be an unreliable gauge of adequate getterlng. The extra
gettering was +,o allow more time for the removal of the last traces
of chloride.
After the completion of the gettering step, liquid
nitrogen was put on the cold finger with activated charcoal and
the argon was collected for forty minutes.
7. Mass Spectrometric
The mass spectrometric procedure is the most difficult
part of the argon analysis. It uses the most temperamental elec
tronics, and has the strictest tolerances. Small variations in
the mass spectrometer performance or procedure can result in a
scatter over 5%. Much attention to detail was necessary to main
tain the overall analysis precision at 0.1-0.2%.
a. Instrument modifications
In order to improve the performance of the mass
spectrometer, several important changes were made. A new emission
regulator designed and built at the National Bureau of Standards
was installed. This regulator featured more stable electronics,
and substantially more power than the older one. (The extra power
proved to be the demise of several filaments before it was fully
57
appreciated.)
The spring tension, pressure pin that connects the
mass spectrometer collector to the electrometer pre-amplifier must
be as noise-free as possible, because of the very small signal
currents involved before amplification. This connector had been
a problem with each earlier worker. Gramlich (1970) had the best
success by silver plating it and enclosing the immediately sur
rounding area in a plastic case containing silica gel which he
frequently changed. Severe noise problems encotmtered in this
research, traceable to this connector, refused to be quieted, even
by a replating. The noise was suitably reduced by changing the
connector from the spring tension type to a small screw-held one.
This more rigid arrangement gave acceptable noise without further
trouble for the duration of the research. It did however call for
extra care in handling the metal shield arotmd the preamplifier.
The addition of source magnets was a simple change
physically, but had very substantial effects on the mass spectrometric
isotopic analysis. Weak (about 75 gauss) magnets were placed above
and below the filament, external to the flight tube. These magnets
cause the elnitted electrons to follow a spiral course as they are
accelerated toward the trap. Thus, they present a broader cross-
sectional beam for ionization of the sample gas, leading in turn
to greater sensitivity. At the outset of this research the sensiti
vity was l.lxl0-9 cc/mv. After installation of the new emission
regulator and adjustment of the source magnets the sensitivity was
58
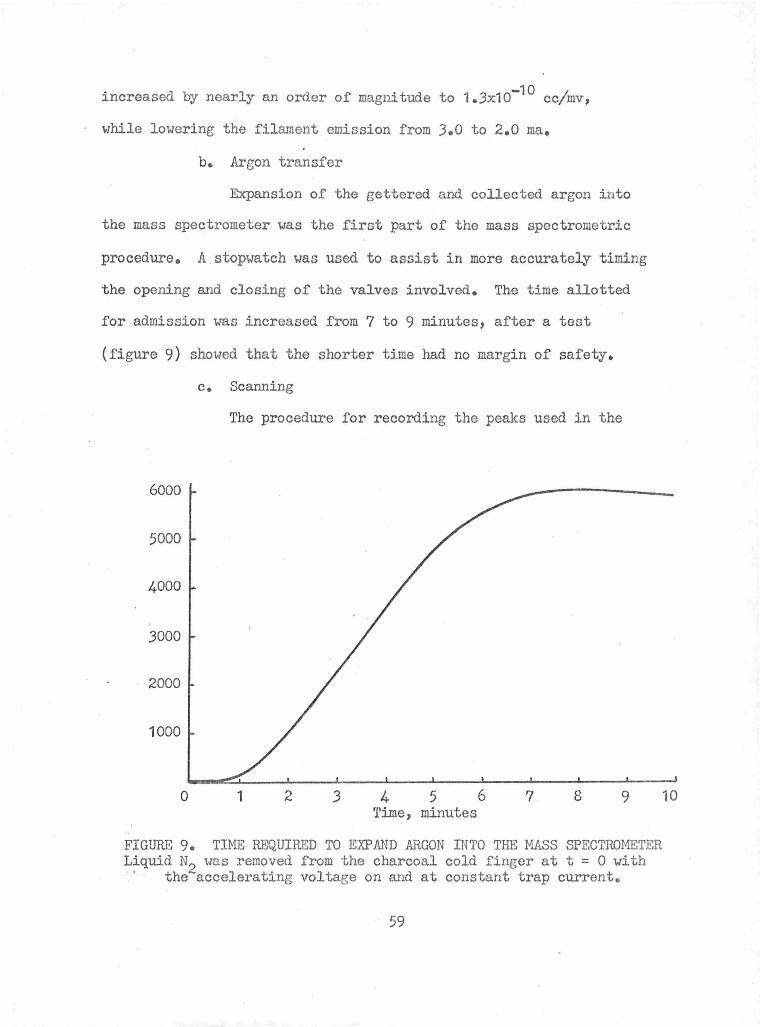
increased by nearly an order of magnitude to 1.3x1o-10 cc/mv,
while lowering the filament emission from J.O to 2.0 ma.
b. A:rgon transfer
Expansion of the gettered and collected argon into
the mass spectr ometer was the first part of the mass spectrometric
procedure. A stopwatch was used to assist in more accurately timing
the opening and closing of the valves involved. The time allotted
for admission was increased from 7 to 9 minutes, after a test
(figure 9) showed that the shorter time had no margin of safety.
c. Scanning
The procedure for recording the peaks used in the
6000
5000
4000
3000
2000
1000
0 1 2 J 4 5 6 7 8 9 Time, minutes
FIGURE 9. TIME REQUIRED TO EXPAND ARGON INTO THE MASS SPECTROMETER Liquid N2 was removed from the charcoal cold finger at t = 0 with · · the accelerating voltage on and at constant trap current.
59
10
argon analysis developed from an action-reaction series of modifi
cations. The primary limitation in Gramlich's analyses was the
sensitivity. The critical 36 peak was only 5-10 mv for typical
samples and its measurement was limited by instrumental noise.
With the large increase in sensitivity from the described addition
of source magnets, the 36 peak was measured on the JO or 100 mv
electrometer attenuation and noise was often not noticeable.
Several deleterious side effects accompanied the sensitivity
increase. They negated a large part of the anticipated improve
ment in analysis accuracy and precisio~.
The most severe problem arose from an increase
in the rate of change of the peak heights. The worsening of
the memory effect in the blank has already been mentioned. To
eventually obtain sets of ratios, interpolation of the peaks of
at least one mass is necessary. The increase in the rate of change
made interpolation more non-linear and therefore more difficult.
Another manifestation of the more rapid rate of
peak height change was the requ.ired use of several decades of the
recorder 1s expanded scale to record masses 40 and 38. These scale
changes created further difficulties in peak interpolation. These
problems are illustrated in figure 10. Interpolation of the 38
mass peak was made difficult by both a scale change and the response
change. The uncertainty in the 38/36 ratio at 3 minutes is over
3%.
fill interesting mass spectrometer nuance was also
60
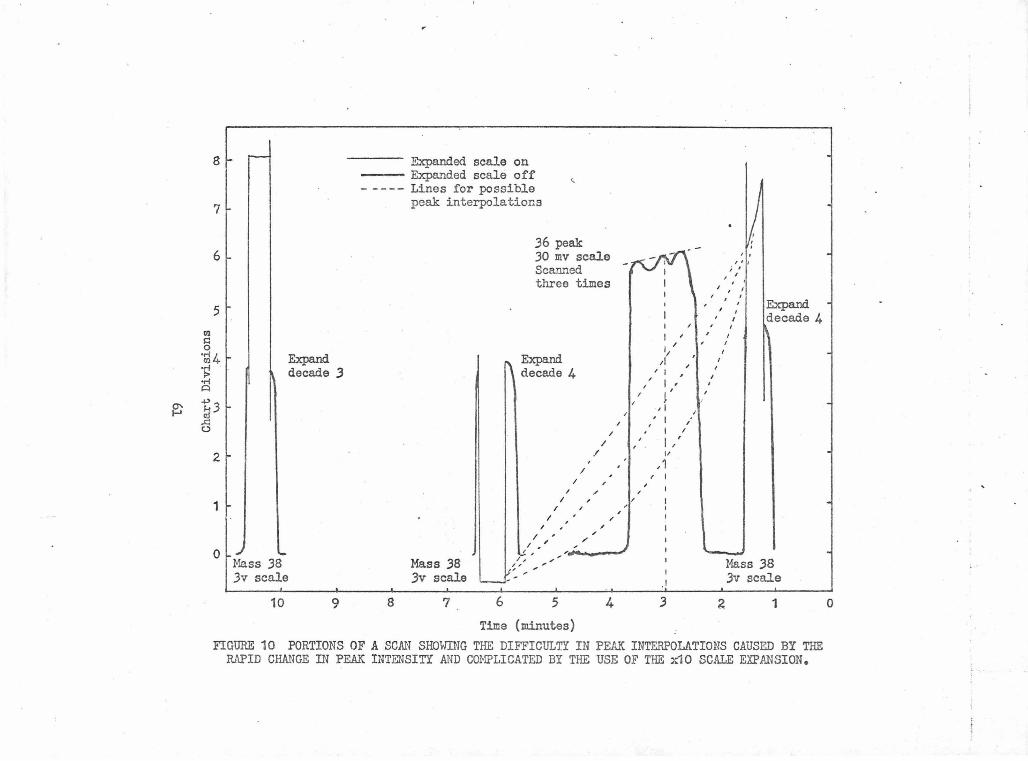
O' I-'
8
7
6
5
Ol ~ 0
·@41 J l Expand
~ · decade .3 -M Q
~3 al
.<:: 0
2
1
0. Mass 38 3v scale
10 9
Expanded scale on ~~~ Expanded scale off - ---- Lines for possible
peak interpolations
<..
36 peak 30 mv scale Scanned three times
8
Mass 38 3v scale
7
Expand decade 4
;
I I
I I
I
I
I
/
I
/ /
·'
I I ,,
/ , I ,
~ , ~ /~, ,. "·--·· ... ----'' l' ,,. ,
6 5 4
Time (minutes)
I I ,
I 11
A I , I I
, I I
I/ i I
, , I
,, , I /
I I
I , ' I,
,1 I I
3
'" , , It ; I
I I II
I 1 I I I
I I
I I
I
I
J I
I
Expand decade 4
Mass .38 3v scale
4 1
FIGURE 10 PORTIONS OF A SCAN SHOWING THE DIFFICULTY IN PEAK INTERPOLATIONS CAUSED BY THE RAPID CHANGE IN PEAK INTENSITY AND COMPLICATED BY THE USE OF THE x10 SCALE EXPANSION.
0
! -
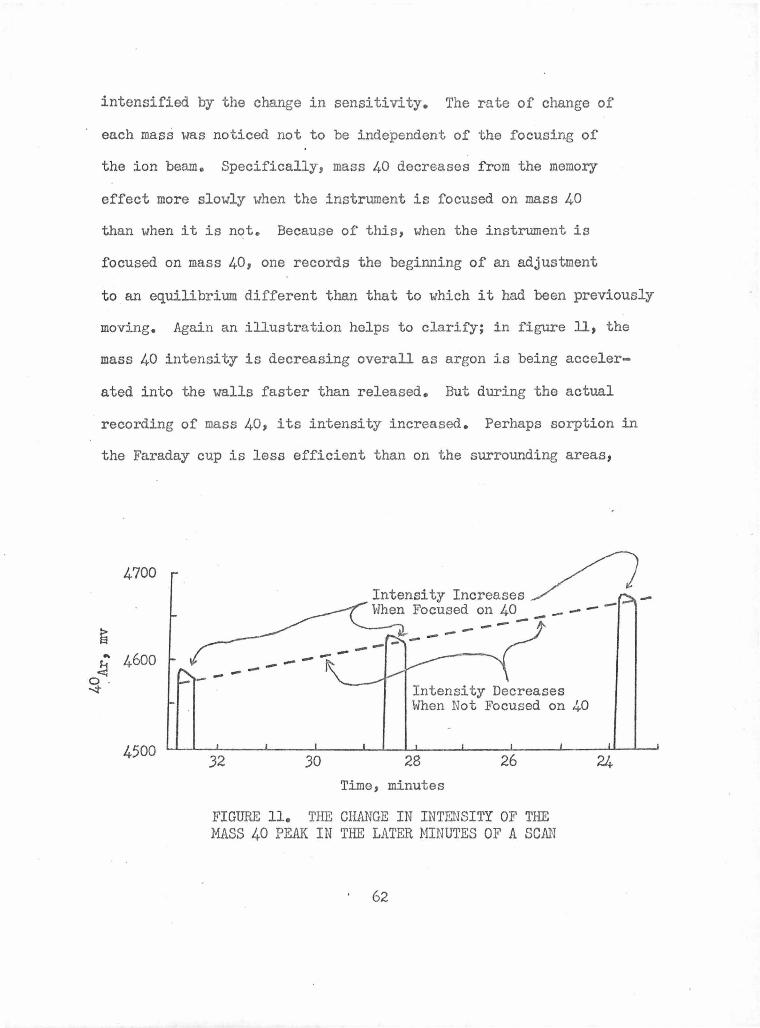
intensified by the change in sensitivity. The rate of change of
each mass was noticed not to be independent of the focusing of
the ion beam. Specifically, mass 40 decreases from the memory
effect more slowly when the instrument is focused on mass 40
than when it is not. Because of this, when the instrument is
focused on mass 40, one records the beginning of an adjustment
to an equilibrium different than that to which it had been previously
moving. Again an illustration helps to clarify; in figure ll, the
mass 40 intensity is decreasing overall as argon is being acceler-
ated into the walls faster than released. But during the actual
recording of mass 40, its intensity increased. Perhaps sorption in
the Faraday cup is less efficient than on the surrounding areas,
4700
4600
4500
---
32
---
30
Intensity Increases /) -When Focused on 40 _ - - -
- -- --Intensity Decreases When Not Focused on 40
28 26 24 Time, minutes
FIGURE 11. THE CHANGE IN INTENSITY OF THE MASS 40 PEAK IN THE LATER MINUTES OF A SCAN
62
allowing release to occur slightly faster when mass 40 is focusedo
This effect was most pronounced late in the scan when the rate of
change of peak intensities was not so severe. It also made peak
interpolations somewhat more difficult or at least made recording
peak tops for 30 seconds of no use.
The first step in reducing the new interpolation
difficulties was to shorten the time required to obtain a set of
peaks. The 38 and 40 peaks were scanned slowly to record the
maximum, but the peak was not "sat on", as this was no longer an
aid in interpolation. By eliminating this, both a 40 and 38
peak could be recorded in about one minute, half the previous time.
The 36 peak could also be recorded more rapidly because the signal
to noise ratio had been improved. Previously it was necessary
to scan it very slowly three times because of the noise to get
a good average value. This was decreased to a single, very slow pass.
A good 36 peak could then be recorded in 1 to 2 minutes. The overall
sequence was reduced from 5 to 2-3 minutes per set of peaks, cutting
by nearly one half the length of interpolations.
The rate of change problems had been magnified
by the use of the recorder's expanded scale on the 40 and 38 peaks.
Because of these problems, in addition to the unchanged disadvantage
of using different scales for recording a peak's top and baseline,
the expanded scale was no longer improving the overall ratio
analysis and its use was discontinued. This did not cause any
change in the observed analysis precision. It did simplify the
manual procedure, so that considerably less effort was required to
63
record the peaks.
The l argest problem in the scanning procedure
remaining after these changes and counter-changes had been made,
was in obtaining good ratios at the beginning of the scan. The
nonlinearity was greatest there (figure 10) leading to the greatest
interpolation difficulties. The problem was not completely solved;
however, one contributor was eliminated. Previously the filament
current had been increased from a standby level to the operating
level during t he expansion of the gases into the mass spectrometer,
only moments before the scanning was initiated. It was discovered
that the filament current and emission regulator take as much as
ten minutes to 11 settle down 11 after an adjustment, so any such
adjustments were ther eafter made at least fifteen minutes before
scanning.
When this was done, an entirely new problem was
uncovered. On many scans the response now increased at the outset
of the analysis, then leveled briefly, and then decreased as before
(figure l2). This initial behavior made interpolations no easier
than before. The effect was more severe on samples when the initial
pressure in the tube was higher. Evidently peak suppression was
occurring diminishingly as the pressure was reduced by the pumping
portion of the memory effect. Along with the actual output, the
trap current proVided a measure of the surmised suppression. It
increased with the response initially and then remained constant
after the peak heights began to decrease. This was used as a guide
64
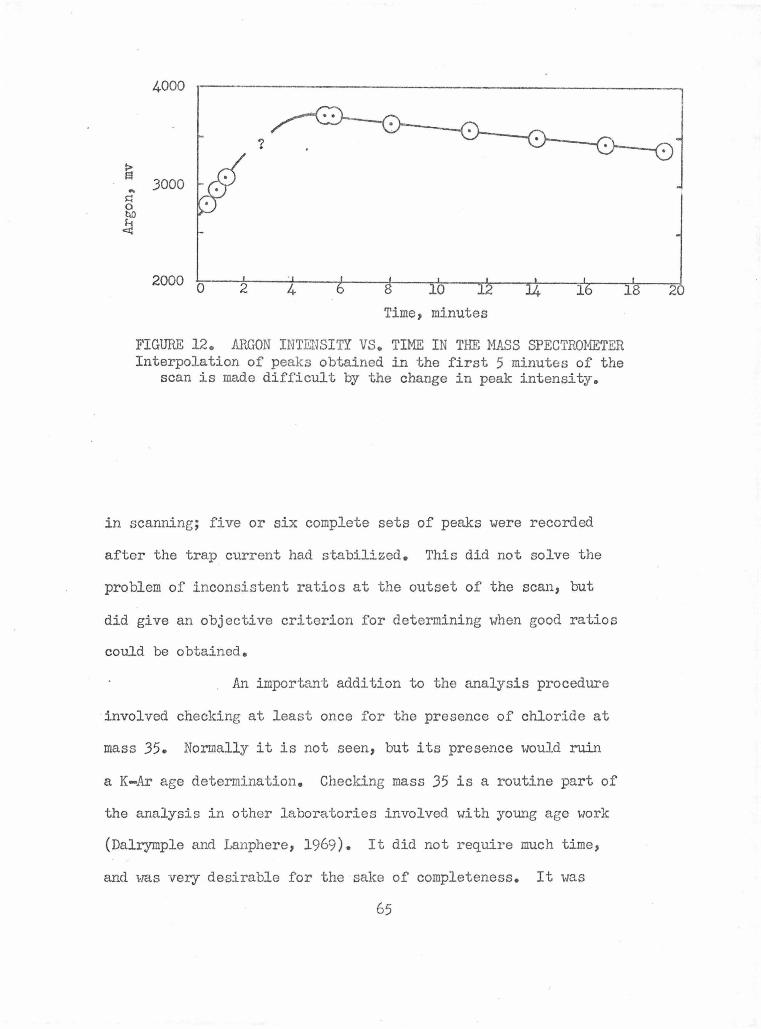
4000
3000
Time, minutes
FIGURE 12. ARGON INTENSITY VS. TIME IN THE MASS SPECTROMETER Interpolation of peaks obtained in the first 5 minutes of the
scan is made difficult by the change in peak intensity.
in scanning; five or six complete sets of pea.ks were recorded
after the trap current had stabilized. This did not solve the
problem of inconsistent ratios at the outset of the scan, but
did give an objective criterion for determining when good ratios
could be obtained.
An important addition to the analysis procedure
involved checking at least once for the presence of chloride at
mass 35. Normally it is not seen, but its presence would ruin
a K-Ar age determination. Checking mass 35 is a routine part of
the analysis in other laboratories involved with young age work
(Dalrymple and Lanphere, 1969). It did not require much time,
and was very desirable for the sake of completeness. It was
65
normally checked either at the beginning or at the end of the scan.
If for any reason the presence of chloride wan suspected, the 35
peak area was scanned several times.
8. Chart Analysis
After 5 or 6 good sets of peaks had been recorded, the
accelerating voltage was turned off and the instrumental portion
of the analysis was complete. The most critical portion of the
subsequent chart analysis was the blank correction, which ora.s
another are& in which the final results could be completely changed
by varying the procedure.
A mass spectrometer correction is necessary because
this instrument has a small but persistent excess of mass 36.
Gramlich (1970) attributed it to argon, but in view of the chloride
contamination ratio, which is discussed in the RESULTS section,
a small chloride contamination must be considered at least as likely.
Gramlich (1970) reported the excess at Oo03 to 0.05 mv. With the
increase in sensitivity it increased to a more noticeable O.l to
0.3 mv. Translated to dating, if no correction was made a 5 gram
~ock with 1% potassium would appear to be 50,000 years too young.
A blank correction is important as mentioned, to correct
for the instrumental argon contribution, and also to reduce the
error from any fractionation that occurs in the extraction, purifi
cation and transfer of the argon in this system. Formerly the
blank was merely checked for any unusual fractionation and only
a mass spectrometer 11memory 11 correction was applied to the sample
66
data as described below. A mass spectrometer background was run
for the same length of time as a sample and a smooth curve was
drawn connecting the peak tops of each masso Then a different
background value was subtracted from each sample peak. This
method assumed that the memory effect observed in the mass spectro-
meter background run occurred to the same extent while running the
sample. That is, that argon was very slowly being added to the
sample. Since much more gas was in the tube during the sample
runs, undoubtedly argon was released much more rapidly then. Since
release occurs simultaneously with sorption and each occurs at
a rate different than observed in the background, no correction
can be made for the changes that occur in the mass spectrometer
during the course of the analysis.
In view of the above, the method of applying corrections
to the sample scan was modified. The sample blank was used to
determine the corrections and the effect of the mass spectrometer
was automatically included. A single blank value was obtained for
each mass by extrapolating its peaks in the blank back to time
~ero. This blank value was then subtracted from each of the peaks
of that mass in the sample run. Extreme care was required in the
extrapolation of the .36 peak, as it contained the excess from the
mass spectrometer. It was useful in this regara, if extra care
had been taken in tne blank run to scan the 36 peak top very slowly
and to record adequate sections of baseline.
The blank is assumed to be reproducible in this and
67
any other blank correction. Actually if replicate blank analyses
are run the second is somewhat smaller than the first, as the
system has been degassed more completely by the first blanko The . 7
amount of the decrease was O.l-Oe3xl0- cc argon in several tests.
This indicates that the normal blank correction may actually be
a slight overcorrection for atmospheric argon.
In most K-Ar dating, 40/38 and 38/36 ratios are measured.
The former is used to determine the total amount of argon and the
latter to make the air argon correction. Because the atmospheric
argon content varied widely from sample to sample, the 38/36 ratio
also ranged widely. However all samples analyzed in this study
had 40/36 ratios close to that of pure aire Therefore the memory
effect typically changed the 40/36 ratio much less than the 38/36
ratio. Having a slope closer to zero allowed the 40/ 36 ratio to
be extrapolated slightly more precisely, so 40/36 ratios were
measured. A small side benefit resulted from changing from measur-
ing 38/36 ratios to using the 40/36 ratio. The slope of the 40/36
ratio line for pure atmospheric argon was slightly positive con-
sistently, as it was for samples with too little radiogenic argon
t o be detected. However in most cases when radiogenic argon could
be detected the slope was slightly negative, adding credence to
the sometimes vanishingly small quantity measured. The only time
this tipoff failed was when a very young sample was analyzed after
a not so young onee It nonetheless was a rather usef'ul observation.
One of the changes in the chart analysis procedure was
68
made to further reduce the di fficulty of interpolating peak values
to obtain ratios. Formerly the 40/38 ratio was obtained by extending
the adjacent 40 and 38 peaks to a convenient place between them. In
this research 40/38 ratios were calculated at the 38 peak so that
only the 40 peak value needed to be interpolated.
Ultimately the measured 40/36 and 40/38 ratios were
plotted against time and least squares straight line fits were
obtained using an electronic calcul~tor. The intercept was the
time when the accelerating voltage was turned on and was assumed
to give the best values for the true ratios of the argon in the
sample.
In some samples, only air argon contents were of
interest. If the combined uncertainty in the air argon content
as a result of uncertainties in the blank correction, and variationE
in bakeout times and temperatures were large, the extra effort
of obtaining least squares fits was neither useful nor necessary.
In these samples graphical tec~iques were used to obtain the
necessary 40/38 ratios.
9. Mass Discrimination
Nier 1s (1950) 40/36 ratio value of 295.5 for atmospheric
argon is considered to be the standard in K-Ar dating. Small
deviations a~ay from this value are commonly encountered in atmos
pheric argon analyses and are assumed to be mass discrimination
effects in the mass spectrometer. A reservoir of atmospheric argon
was kept in a spike tank similar to the one with argon 380 This
69
reservoir was a convenient source of suitably sized spikes which
were used for mass discrimination determinations. The mass
discrimination of this instrument has varied, but usually in
response to some physical or electrical disturbance such as
repositioning the source magnets or power failures.
A mass discrimination must be applied to each argon
determination and the proper correction had to be determined
frequently because of the possibility of discrimination changes.
A discrimination determination was made whenever any instrumental
change o~curred. In periods of stability a mass discrimination
run was made after every fifth sample, the same frequency as
Krummenacher (1970).
When the chart analysis procedure was changed so that
40/36 rather than 38/36 ratios were measured, the need for a J8
spike in the discrimination run was eliminated. Only 40/36 ratios
were measured rather than 40/38 and 38/36 ratios, making the
frequent discrimination determinations easier.
D. PRECISION AND ACCURACY
Seldom in K-Ar dating are enough replicate analyses performed
on a sample to allow the precision of the results to be rigorously
determined. All researchers use some estimate of the precision of
a single analysis. McDougall (1964, 1966) determined his precision
once, and uses that value as an overall estimate on many of his
analyses. This simple method is adequate when the atmospheric argon
corrections are similar for the analyses.
70
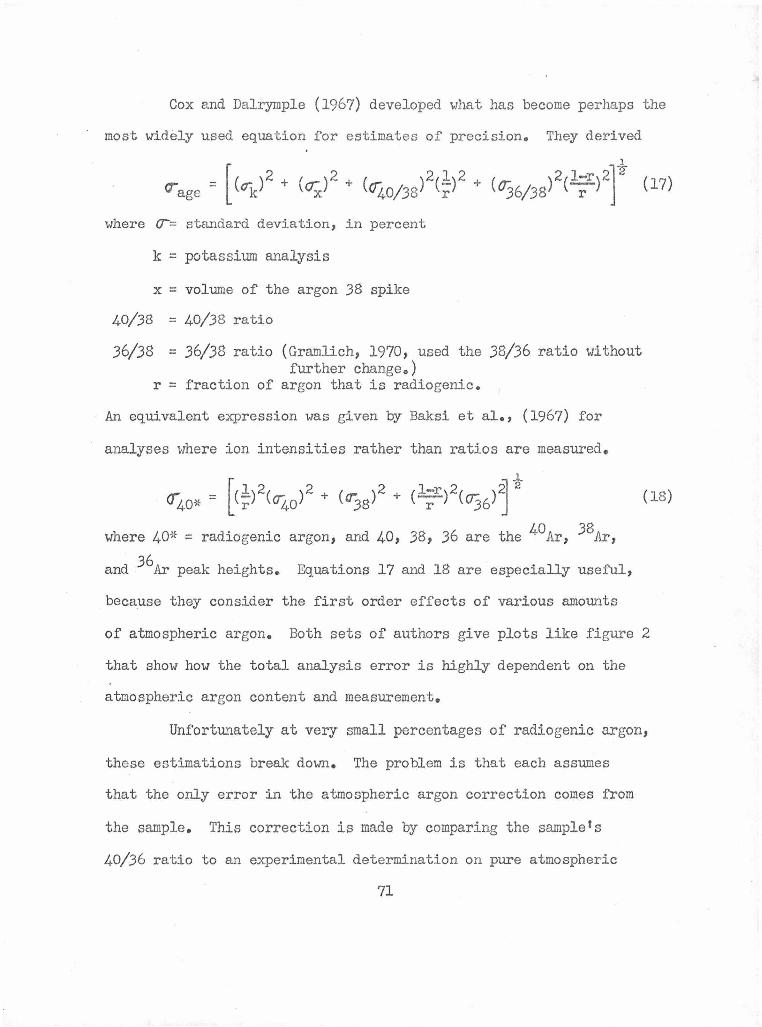
Cox and Dalrymple (1967) developed what has become perhaps the
· most widely used equation f'or estimates of precision. They derived
1
a-age " [ k-J + <o;J2 + <11i,o/3sl2<~l2 + <<7J6/3sl2<1;rl2J" <11)
where CT= standard deviation, in percent
k = potassium analysis
x = volume of the argon 38 spike
40/38 = 40/38 ratio
36/38 = 36/38 ratio (Gramlich, 1970, used the 38/36 ratio without further change.)
r = fraction of argon that is radiogenic.
An equivalent expression was given by Baksi et al., (1967) for
analyses where ion intensities rather than ratios are measured.
J ...
- l,(1)2( )2 + ( )2 + (1=1:)2( )21 2
<1'""40* - L r 0-40 GJ8 r 0J6 J where 40* = radiogenic argon, and 40, 38, 36 are the 40A:r, 38.Ax,
and 36.Ax peak heights. Equations 17 and 18 are especially useful,
beca.use they consider the first order effects of various amounts
(18)
of atmospheric argon. Both sets of authors give plots like figure 2
that show how the total analysis error is highly dependent on the
atmospheric argon content and measurement.
Unfortunately at very small percentages of radiogenic argon,
these estimations break down. The problem is that each assumes
that the only error in the atmospheric argon correction comes from
the sample. This correction is made by comparing the sample's
40/36 ratio to an experimental determination on pure atmospheric
71
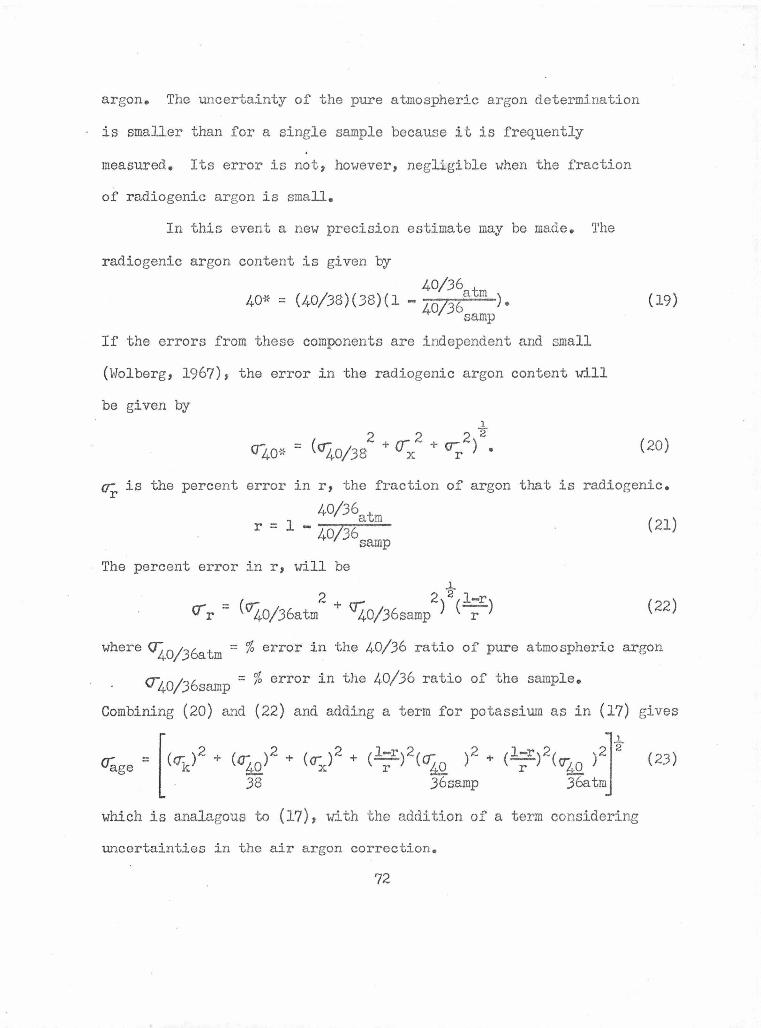
argon. The uncertainty of the pure atmospheric argon determination
is smaller than for a single sample because it is frequently
measured. Its error is not, however, negligible when the fraction
of radiogenic argon is small.
In this event a new precision estimate may be made. The
radiogenic argon content is given by
40/36 t 40* = (40/38)(38)(1 - 40736a m ).
samp
If the errors from these components are independent and small
(Wolberg, 1967), the error in the radiogenic argon content will
be given by .1.
2 2 2 2
<r40-::- = ( °40/38 + crx + u;. ) •
(19)
(20)
er: is the percent error in r, the fraction of argon that is radiogenic. r
40/36atm r = 1 - 40/36samp
The percent error in r, will be .1.
_ ( 2 + 2) 2 (1-r) err - °4o/36atm ~0/36samp r
(21)
(22)
where <J4o/3batm = % error in the 40/36 ratio of pure atmospheric argon
o-40; 36samp = % error in the 40/36 ratio of the sample.
Combining (20) and (22) and adding a term for potassium as in (17) gives
= [(c-, )2 + (a-; )2 + (er:: )2 + (1=1:.)2(cr: )2 + (1::!:.)2( )21Jt (23)
<Ta.ge k £& x r £& r c:r40 38 36samp 36atm
which is analagous to (17), with the addition of a term considering
uncertainties in the air argon correction.
72
Since the 40/38 ratio is not used in the atmospheric argon
correction in this work as opposed say to Cox and Dalrymple (1967),
the (~) 2 factor does not appear in the °4.o/38 term in equations
(20) and (23). In comparing Cox and DalrJmple's (1967) equation
(17) with (23), it may be seen that (23) will usually give a larger
estimate for <'age if "L;.o/Jbatm is greater than OZ.o/Js• Since
~0138 is typically 0.1-0.2% and °4o/J6atm is 0.2-0.5%, crage from
(23) was always somewhat larger in this research. Equation 23
was considered to be a closer estimation of the true precision of
analyses.
The sources of the values for the error terms in (23)
are as follows: <lk is determined from the replicate potassium
analyses; rr., is estimated at 1%. Dalrymple achieves 0.5% using x
a similar arrangement. The deviation in the determination of the
constant in the spike tank dilution equation (16) was about 1%
for Gramlich (1970); 04,o/38 is the deviation from linearity of the
ratio as determined by a least ?quares fit; "4.o/Jbatm was determined
analytically from the pool of atmospheric argon determinations;
CJ4o/J6samp is the deviation from linearity of the 40/36 ratios of
the srunple, as determined by a least squares fit.
The precision estimate of air argon contents is much simpler.
The combined uncertainty from bakeout variation and the blank
correction is estimated at 0.5xl0-7 cc air argon. The estimated
uncertainty then is this value divided by the sample we1ght.
The accuracy of the analytical determination is more diffi-
cult to evaluate, since standard samples with small and known
73
amounts of radiogenic argon are not available. The best indicat ion
available of the accuracy, both analytically and geologically, is
from analyses of rocks of known zero age. Several such samples
were run in this research with interesting results.
74
III. RESULTS AND DISCUSSION
The areas of research as outlined in the STATEMENT OF THE
PROBLEM are strongly interrelated. It followed that the experiments
performed a.r...d the results were equally overlapping. The discussion
of many result.s could take place under several headings. Each was
placed according to the main purpose of the study tempered by an
attempt to present the information in a reasonable sequence. The
introductory remarks are repetitive, but hopefully only enough to
reestablish the purposes and problems.
A. TIME OF ADDITION OF A™OSPHERIC ARGON
1. Laboratory Addition
A knowledge of the extent of laboratory additions of
atmospheric argon is necessary in order to develop methods that
avoid them and to allow a better evaluation of the earlier potential
times of addition.
HF etching was used on whole rock samples with very
unpredictable results. Table IV lists analyses where comparison
is possible with untreated samples. Etching made a definite improve
ment in the air argon content of HAN-7 and HAN-2, had no net effect
on Koko flow, and caused a large increase in HAN-1 (10-16 mesh)e
The increase is a definite case of lab addition of air argon.
Opposing effects must be occurring. Etching the surfaces has the
potential of lowering the air argon. The increase was puzzling at
first. Then it was noted that the lighter appearance after etching
was not the result of preferential removal of dark minerals, but
75
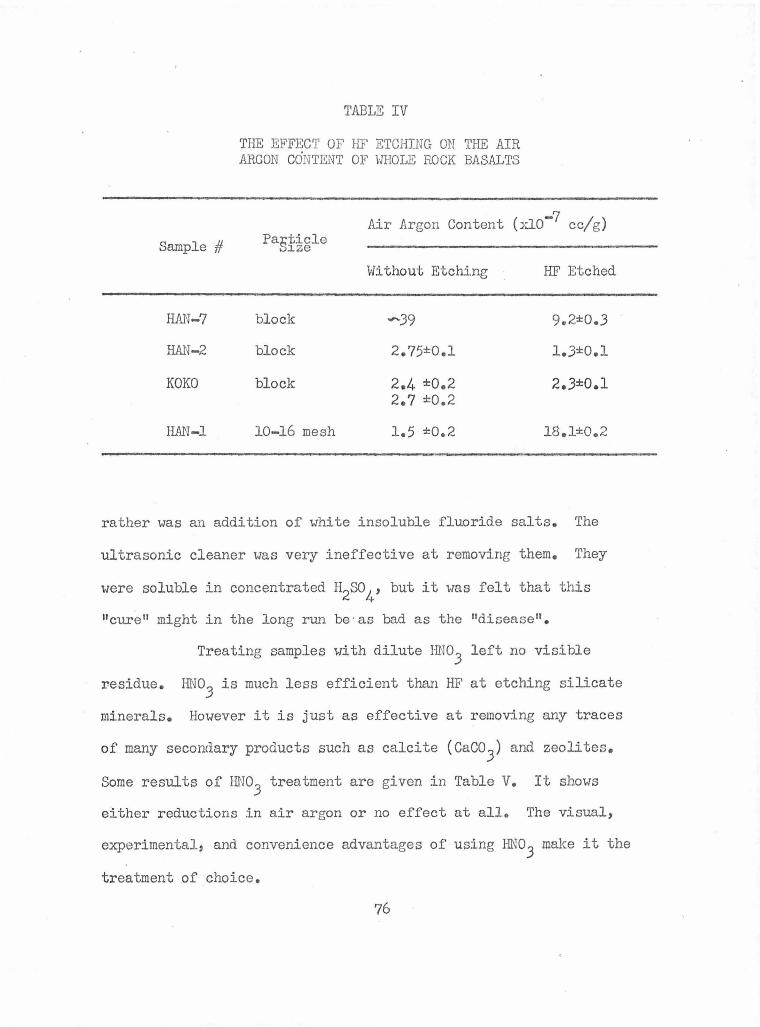
Sample #
HAN-7
HAN-2
KOKO
H.AN-1
TABLE IV
THE EFFECT OF HF ETCHING ON THE AIR ARGON CONTENT OF WHOLE ROCK BASALTS
Air Argon Content (xlo-7 cc/g) Pa3ticle ize
Without Etching HF Etched
block -39 9.2±0.3
block 2.75±0.1 1.3±0.l
block 2.4 ±0.2 2 • .3±0.l 2.7 ±0.2
10-16 mesh 1.5 ±0.2 18.1±0.2
rather was an addition of white insoluble fluoride salts. The
ultrasonic cleaner was very ineffective at removing them. They
were soluble in concentrated H2so4, but it was felt that this
11 cure 11 might in the long run be ·as bad as the "disease".
Treating samples with dilute HN03
left no visible
r.esidue. HN03
is much less efficient than HF at etching silicate
minerals. However it is just as effective at removing any traces
of many secondary products such as calcite (Caco3) and zeolites.
Some results of HN03
treatment are given in Table V. It shows
either reductions in air argon or no effect at all. The visual,
experimental, and convenience advantages of using HN03 make it the
treatment of choice.
76
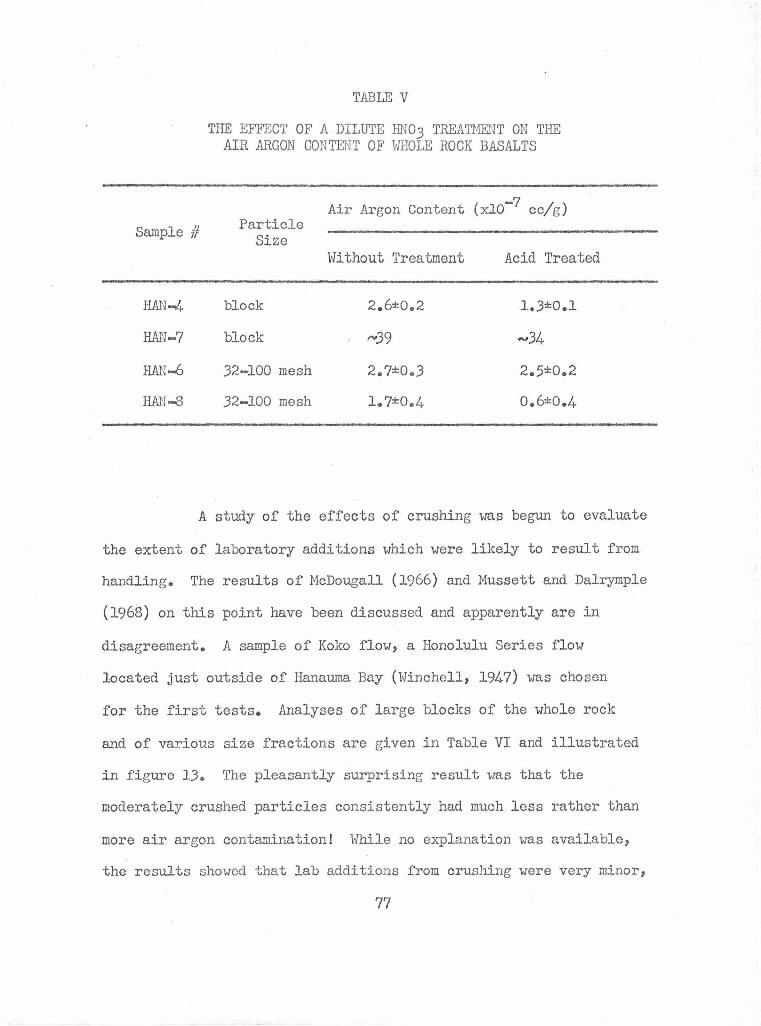
Sample #
HAN~
HAN-7
HAN-6
HAN-8
TABLE V
THE EFFEC'l' OF A DILUTE HN03 TREATM~ENT ON THE AIR ARGON CONTENT OF WHOLE ROCK BASALTS
Air Argon Content (xlo-7 cc/g) Particle
Size Without Treatment Acid Treated
block 2.6:1:0.2 i.3:1:0.1
block ,...39 _.34
32-100 mesh 2.7±003 2.5:1:0.2
32-100 mesh 1. 7:1:0.4 0.6±0.4
A study of the effects of crushing was begun to evaluate
the extent of laboratory additions which were likely to result from
handling. The results of McDougall (1966) and Mussett and Dalrymple
(1968) on this point have been discussed and apparently are in
disagreement. A sample of Koko flow, a Honolulu Series flow
located just outside of Hanauma Bay (Winchell, 1947) was chosen
for the first tests. Analyses of large blocks of the whole rock
a...~d of various size fractions are given in Table VI and illustrated
in figure 13~ The pleasantly surprising result was that the
moderately crushed particles consistently had much less rather than
more air argon contamination! While no explanation was available,
the results showed that lab additions from crushing were very minor,
77
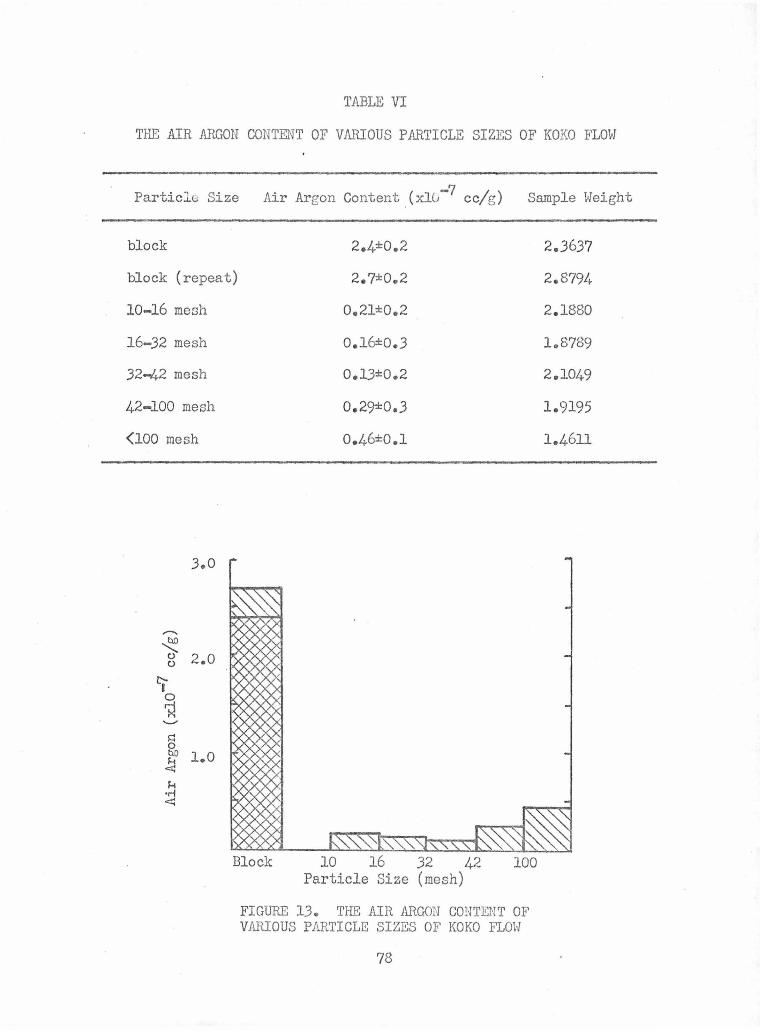
TABLE VI
THE AIR ARGON CONTENT OF VARIOUS PARTICLE SIZES OF KOKO FLOW
Particle Size Air Argon Content .(xlu-7 cc/g) Sample Weight
block 2.4±0.2
block (repeat) 2.7±0.2
10-16 mesh
16-32 mesh
32-.4.2 mesh
42-100 mesh
(100 mesh
3.0
..........
~ C) 2.0 C)
~ 0
~ ..........
~ 0 M 1.0 ~ F-4
·H ~
0.21±0.2
0.16±0.3
0.13::1:0.2
0.29±0.3
0.46::1:0.1
Block 10 16 32 42 100 Particle Size (mesh)
FIGURE lJ. THE AIR ARGON CONTENT OF VARIOUS PARTICLE SIZES OF KOKO FLOW
78
2.3637
2.8794
2.1880
1 .. 8789
2.1049
1.9195
1.4611
and of course did not appear to occur at all.
Subsequently other samples have been crushed and com-
parisons with analyses on large chunks have confirmed that reductions
in air argon can result from moderate crushing. The analyses are
presented throughout the remainder of the RESULTS AND DISCUSSION
section in connection with subsequent parts of the air argon
study.
Evernden and Curtis (1965) had mentioned that HF
treatment was more effective if the sample was placed in the vacuum
system as soon as possible after etching. Different portions of
HAN-1 (10-16 mesh) were analyzed, the first without delay after
crushing and the second after exposure to the air for five months.
The air argon contents of 1.5 and l.2xlo-7 cc/g showed that air
argon was not being added at a detectable rate as a result of sitting
in the lab.
The important overall result of nitric acid treatment,
moderate crushing, and exposure to the atmosphere in the lab was
that little or no air argon was added. A significant bonus was
that at least sometimes these chemical and physical treatments could
reduce air argon contamination. The argon which was removed had
to be associated with surfaces in some way, but no single reason for
its presence or release was demanded.
Variable lab additions resulting from more severe
crushing were found in later studies and will be discussed in the
section on Surface Location.
79
2. Field Addition
Additions of atmospheric argon occurring after the rock
has cooled and the 11 clock 11 is set but before any lab acquisition
are termed field additions. Field and lab additions would cause
nonlinearity in isochron plots. The nature of this type of addition
suggests that it should be removable with the proper treatment. The
observed removal of an air argon component by crushing suggested the
possibility of it being a field addition.
a. Hanauma Bay dike and flow
A study was made of the air argon in a basaltic
lava f low and its accompanying dike feeder in Hanauma Bay, on
Oahu, Hawaii. This flow was chosen because it offered a possibility
of determining if the air argon became attached on extrusion or
upon later exposure to air. The dike and flow are practically iden
tical in most respects including age and chemical composition.
However the flow would have had a greater exposure to air while
cooling, and thus opportunity for increased air argon uptake. If
atmospheric argon was acquired mainly upon crystallization, the
flow would be expected to have a greater atmospheric argon contamination.
The geology of Hanauma Bay has been described by
Stearns and Vaksvik (1935) and others (Winchell, 1947; Hay and Iijima,
1968). It consists of two nested tuff cones on the Koko rift zone
and is probably the site of the most recent volcanic activity of
Oahu. The seaward sides of the craters have been removed by marine
erosion and a distinct bench now rings their interior a few feet
80
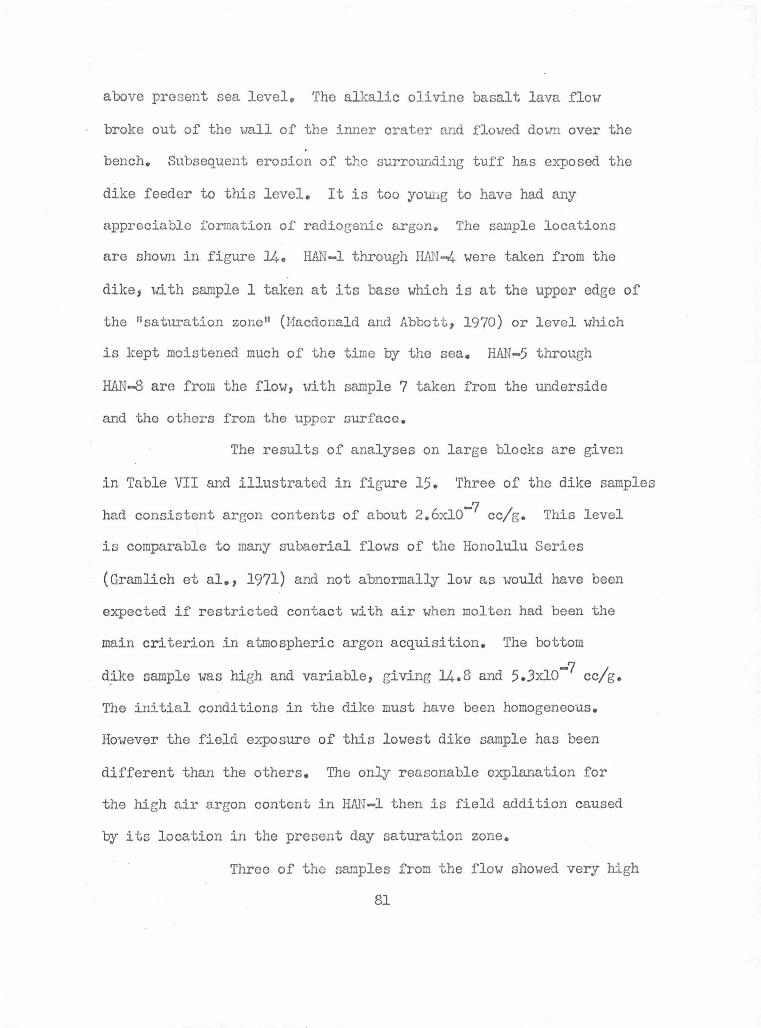
above present sea level. The alkalic olivine basalt lava flow
broke out of the wall of the inner crater and flowed doim over the
bench. Subsequent erosion of t he surrounding tuff has exposed the
dike feeder to this level. It is too yoill!g to have had any
appreciable formation of radioeenic argon. The sample locations
are sho\.m in figure 14. H.AN-1 through HAN-4 were taken from the
dike, with sample 1 taken at its base which is at the upper edge of
the 11 saturation zone 11 (Macdonald and Abbott, 1970) or level which
is kept moistened much of the time by the sea. HAN-5 through
HAN-8 are from the flow, with sample 7 taken from the underside
· and the others from the upper surface.
The results of analyses on large blocks are given
in Table VII and illustrated in figure 15. Three of the dike samples
-7 I had consistent argon contents of about 2.6x10 cc1 g. This level
is comparable to many subaerial flows of the Honolulu Series
(Gramlich et al., 1971) and not abnormally low as would have been
expected if restricted contact with air when molten had been the
main criterion in atmospheric argon acquisition. The bottom
dike sample was high and variable, giving 14.8 and 5.Jxlo-7 cc/g.
The initial conditions in the dike must have been homogeneous.
However the field exposure of this lowest dike sample has been
different than the others. The only reasonable explanation for
the high air argon content in HAN-1 then is field addition caused
by its location in the present day saturation zone.
Three of the samples from the flow showed very high
81
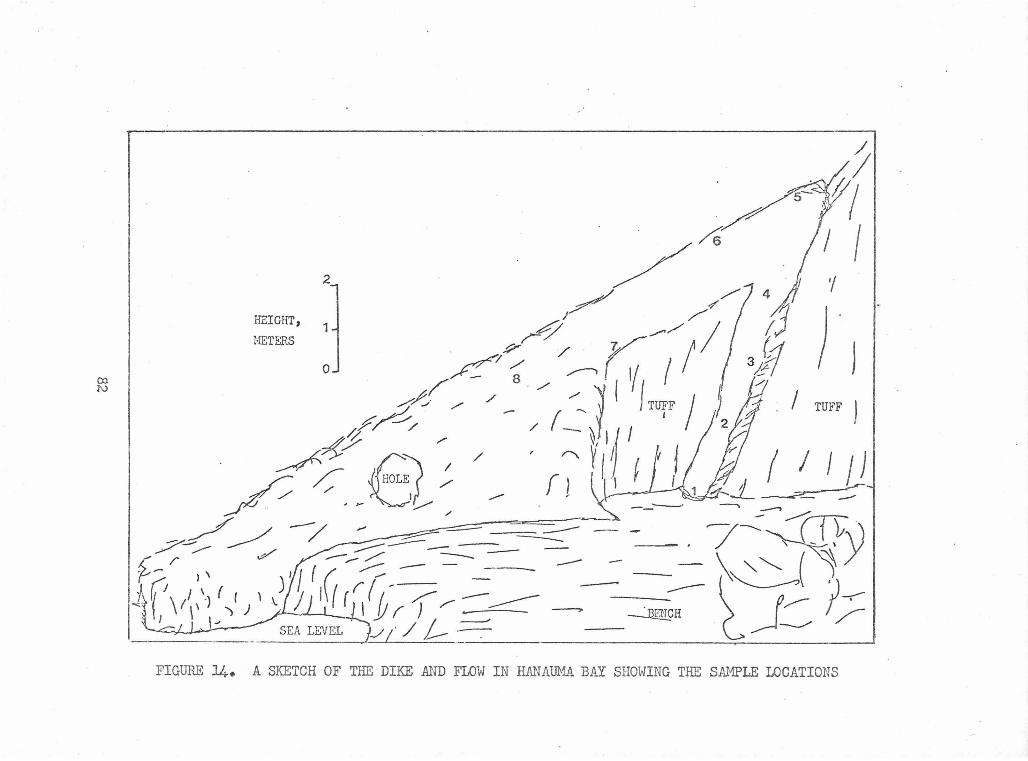
00 N
2 '/
HEIGHT, 1
METERS
0 )j
,
FIGURE J4. A SKETCH OF THE DIKE AND FLOW IN HANAUMA BAY SHOWING THE SAMPLE LOCATIONS
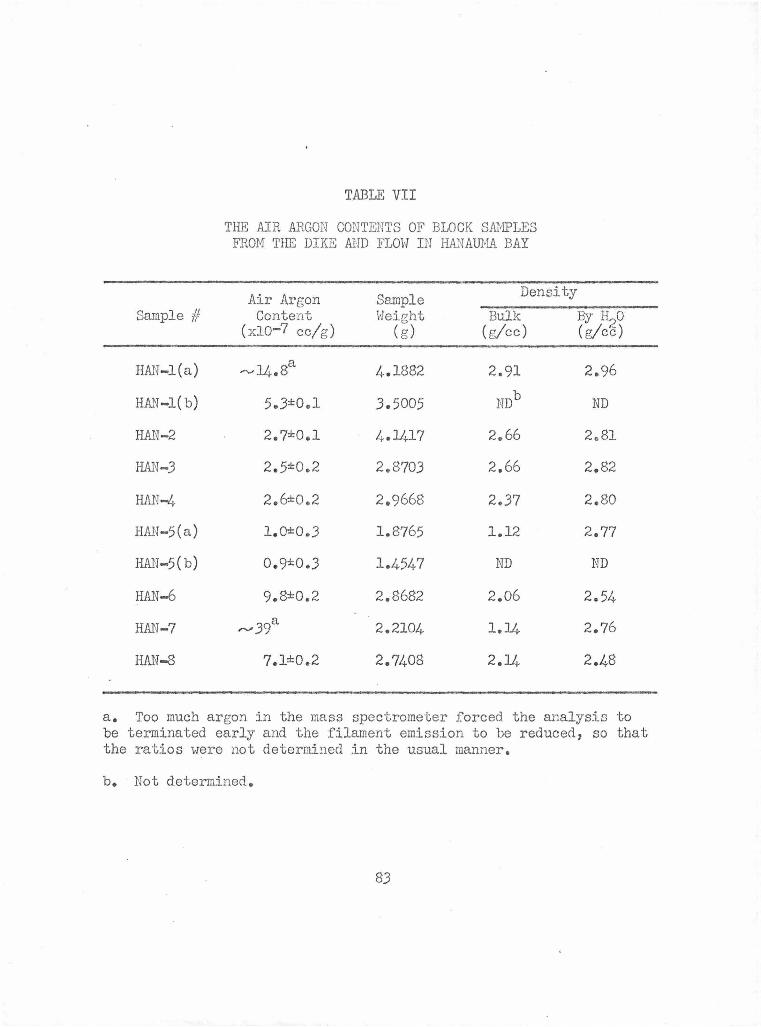
TABLE VII
THE AIR ARGON CONTENTS OF BLOCK SAMPLES FROM THE DIKE AND FLOW IN HA.\fAUMA BAY
Air Argon Sample Density
Sample # Content Weight Bulk By H20 (xlo-7 cc/g) (g) (g/cc) (g/cc)
HAN-l(a) ..-vl4.8 a 4.1882 2.91 2.96
HAN-l(b) 5.3±0.l 3.5005 NDb ND
HAN-2 2.7:1:0.1 4.1417 2.66 2e81
HAN-3 2.5:1:0.2 2.8703 2.66 2.82
HAN-4 2.6±0.2 2.9668 2.37 2.80
HAN-5(a) 1.0±0.3 1.8765 1.12 2.77
HAN-5(b) 0.9:1:0.3 1.4547 ND ND
H.AN-6 9.8±0.2 2.8682 2.06 2.54
HAN-7 ,..,, 39a 2.2104 1.14 2.76
HAN-8 7.1±0.2 2.7408 2.14 2.48
a. Too much argon in the mass spectrometer forced the analysis to be terminated early and the f.ilament emission to be reduced, so that the ratios were not determined in the usual manner.
b. Not determined.
83
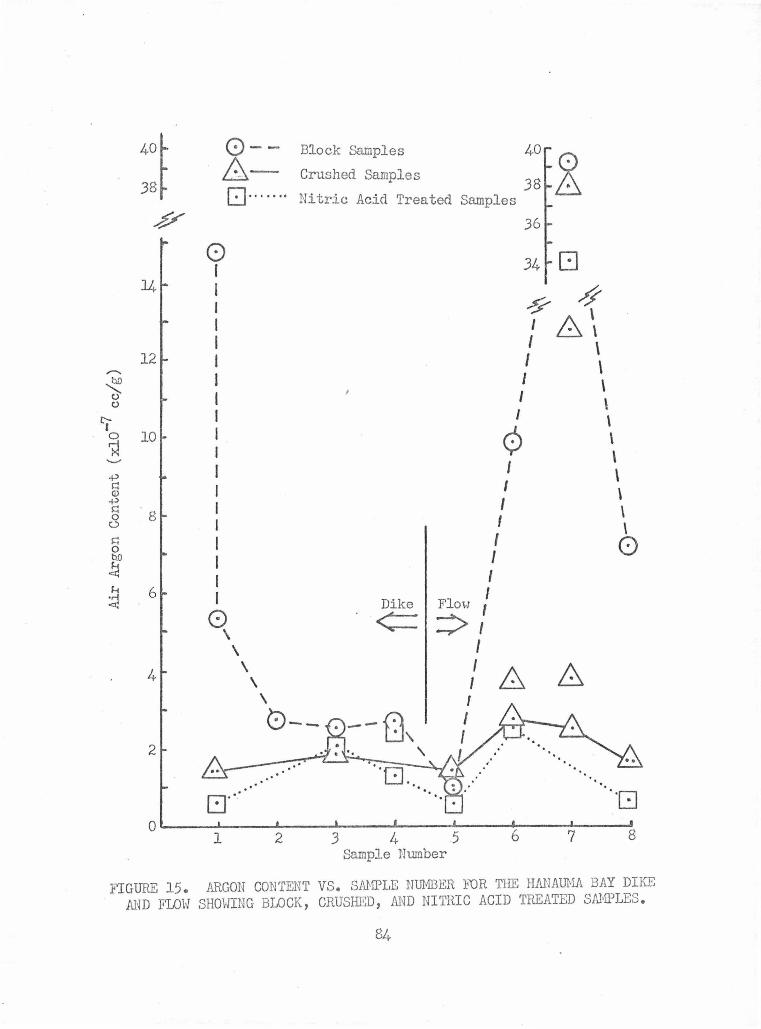
40~ J8~
14
12
10
8
6
4
2
0-&c::J-· ... ..
0 I I I I I I I I I I I I I I I I I I I
0 \
\ \
\ \
Block Samples
Crushed Samples
Nitric Acid Treated Samples J8
40 g 36
J4 G
* ~ \ I 8_ \ I \ I \ I \ I \ I \
0 \ \
Dike
<=
I I I I I I I
Flow I
=> ,' I I 18
\ \ \ \ 0
0-- . __ (.) L:.h
I I I I
. ..
T:J. . .. c:J" I:J
2 J 4 5 6 7 8 Sample lh.unber
FIGURE 15. ARGON CONTENT VS. S.ANPLE NUMBER FDR THE HANAUMA BAY DIKE AND FLOW SHOWING BLOCK, CRUSHED, AND NITRIC ACID TREATED SAMPLES.
84
argon contents. However, the evidence for increased attachment at
the time .of extrusion is not complete, as HAN-5, from the top of
the flow, had less argon than any of the dike samples, giving
-7 I 1.0 and 0.9xl0 cc1 g. As a result, no simple relationship existed
between the dike and flow sample analyses of large blocks which
indicated unambiguously when the atmospheric argon became attached.
The vesicularity of the samp1es was examined to
determine the extent of its relationship to the observed argon
contents. Because more vesicular rocks have a larger macroscopic
surface area per unit weight and since an increase in surface area
offers more sites for atmospheric argon adsorption, densities had
been calculated by two different methods to see if they would be
related to the argon content. Bulk densities were determined by
measuring and weighing cubes cut on the diamond saw. It was noted
(Table VII) that the lowest and highest argon contents came from
samples of almost identical and very low bulk density, 1.12 and
1.14· g/cc. Densities were secondly measured by water displacement.
Air in vesicles exposed to the surface is replaced by water in this
technique, and the samples which had the lowest bulk densities
were measured to be nearly as dense as the dike samples (Table VII).
If all of the vesicles had been exposed, the densities would have
been equal, at about J.O g/cc. The least dense samples by this
method (HAN-6 and HAN-8), that is the ones with the greatest amount
of apparently trapped gas, were high in argon with 9.8 and 7.lxlO-?
cc/g respectively but complete correspondence did not exist. In
85
these rocks then, gross vesiculation had no consistent controlling
effect on the argon content. In other rocks, vesicles seem to be
good places for air argon to be added via field additions, as in
the Manana Island sample, but do not in and of themselves cause
any addition~l air argon. For instance in addition to HAN-5,
KC-71 was quite vesicular but had a very low air argon content.
Thin sections were examined for signs of alteration
and the samples generally appeared quite fresh. The olivine
phenocrysts have rims of iddingsite in samples 5 and 6, but only
traces were observed in the others. The interstitial minerals are
also altered in 5 and 6, and these would have been rejected as
unsuitable for K-Ar dating. Otherwise interstitial alteration
is limited largely to the edges of an occasional vesicle. Zeolites
are uncommon but present. H.AN-7 had a small region with a glassy
matrix, which could help explain its extremely high air argon
content. This was the only suggestive correlation observed.
Analyses of different size fractions of HAN-7c
(Table VIII, figure 16) showed again that the argon content could
be reduced by crushing. It fell from 39xl0-7 cc/g in the whole
rock block to 2.5xl0-7 cc/g in the 100-250 mesh sample. The other
crushed samples (Table VIII) were also lower in argon in general.
-7 I Only HAN~5 showed a small increase, from 1.0 to l.5xl0 cc1 g.
Very large reductions were observed in each of the sample locations
(both dike and flow) that had given high whole rock analyses. The
decrease from crushing acted to level the argon contents so compar-
86
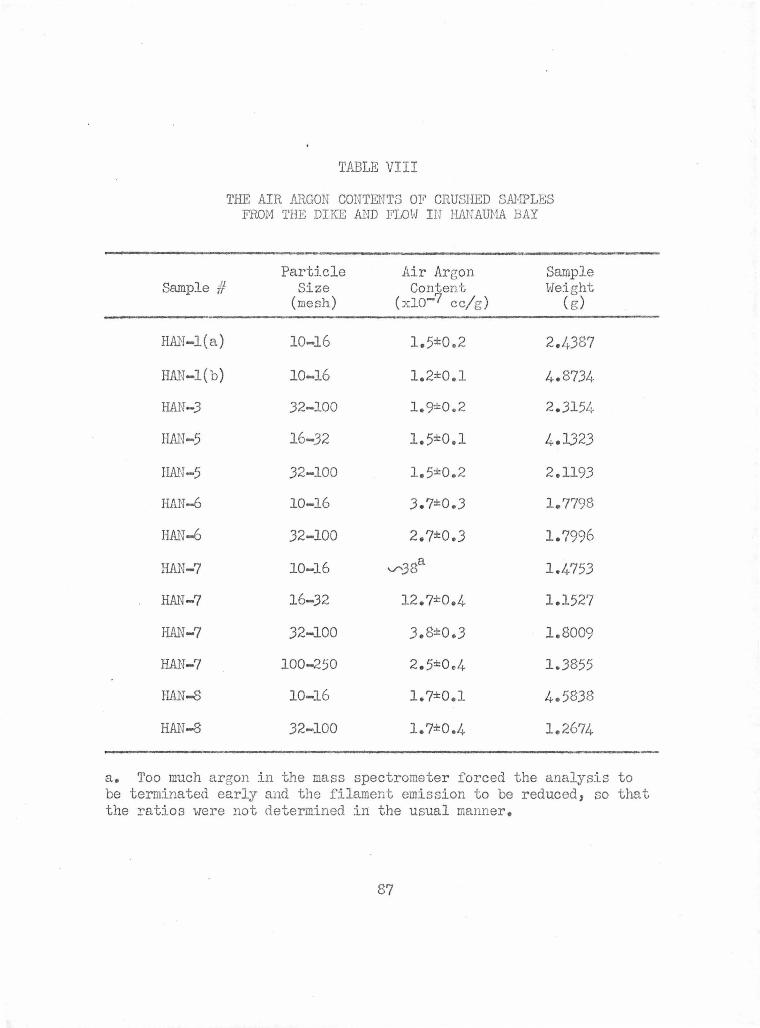
a. be
Sample #
HAN-l(a)
HAN-l(b)
HAN-3
HAN-5
HAN-5
HA.N-6
HAN-fJ
HAN-7
HAN-7
HAN-7
HAN-7
HAN-8
HAN-8
TABLE VIII
THE AIR ARGON CONTENTS OF CRUSHED SAMPLES FROM THE DIKE AND FLOW I H HANAUMA BAY
Particle Air Argon Sample Size Content We.i. ght
(mesh) (xio-7 cc/g) ( g)
10-16 1.5±0.2 2.4387
10-16 1.2±0.l 4.8734
32-100 1.9±0.2 2.31511-
16-32 1.5±0.l 4.1323
.32-100 1.5±0.2 2.1193
10-16 3. 7±0 • .3 1.7798
.32-100 2.7±0.3 1.7996
10-16 V"J8a 1.4753
16-.32 12.7±0.4 1.1527
.32-100 .3.8±0 • .3 1.8009
100-250 2.5:1:0.,4 1.3855
10-16 1.7±0.1 4.5838
32-100 l. 7±0.4 1.2674
Too much argon in the mass spectrometer forced the analysis terminated early and the filament emission to be reduced, so
the ratios were not determ.ined .in the usual manner.
87
to that
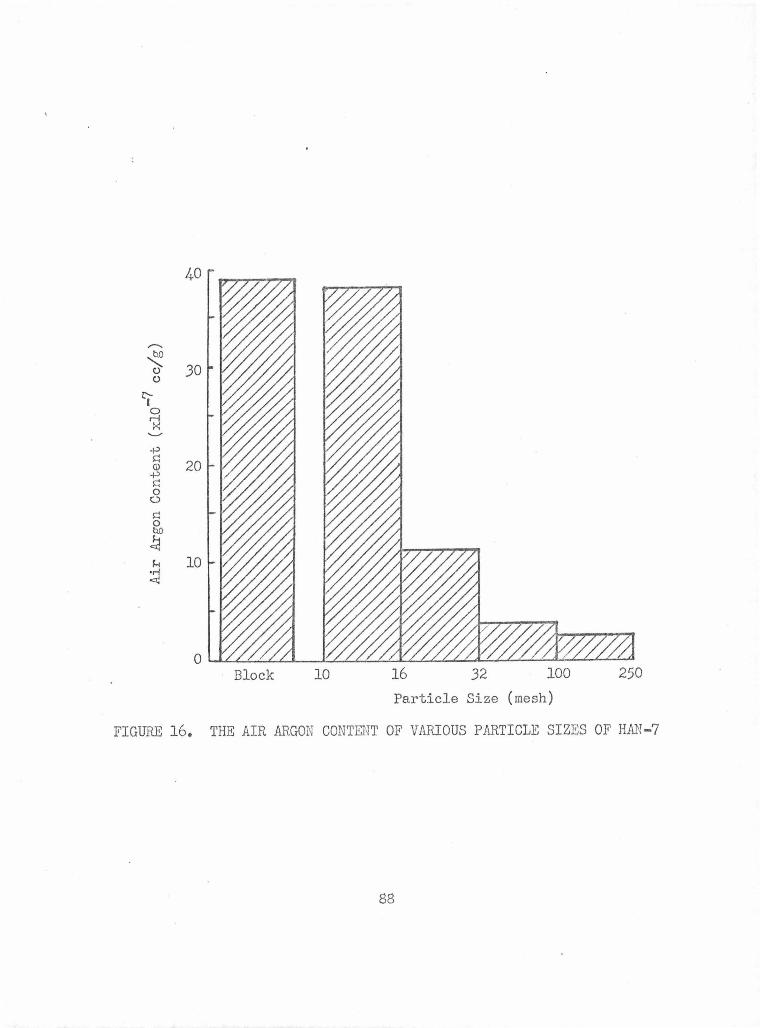
,...._
~ 30 ('..) ('..)
)" 0 rl ~
+' ~ 20 Cl>
+:J i:: 0
0
i:: 0 bO
~ ~ 10
·rl ~
Block 10 16 32 100 250
Particle Size (mesh)
FIGURE 16. THE AIR ARGON CONTENT OF VARIOUS PARTICLE SIZES OF HAN-7
88
ison of the flou and dike data of the crushed samples (figure 15)
gives little indication that air argon uptake occurred as the lava
cooled. The argon content was reduced at least to 2.?xlo-7 cc/g
in the flow samples, as compared .to l.9xl0-7 in the dike.
Acid treatments also usually gave reductions as
shown earlier in Tables IV and V. Nitric acid treated crushed
samples from Hanauma Bay are listed in Table IX. Nitric acid and
crushing were at least partially complementary in reducing atmos
pheric argon. The argon remaining after both treatments did not
show any systematic increase in samples taken from the flow over
those from the dike (figure 15). In fact, samples from the bottom
of the dike and the top and bottom of the flo'W all had identical
levels of residual argon, 0.6xl0-7 cc/g. Possibly most of this
residual argon is located within the crystals.
Argon concluded to be added in the field to HAN-1
was removable by moderate crushing and acid treatment. It seems
very reasonable, if not absolutely necessary, that the removable
component in all of these samples was added in the field. From
this viewpoint the samples with the least air argon by any treat
ment best represent what the initial concentrations were. In
figure 15 this interpretation would imply that the extra air
exposure upon extrusion was not reflected in a higher air argon
content. Also, field additions are many times greater than the
initial content in this flow so that this source of air argon
is seen to be a very important one.
89
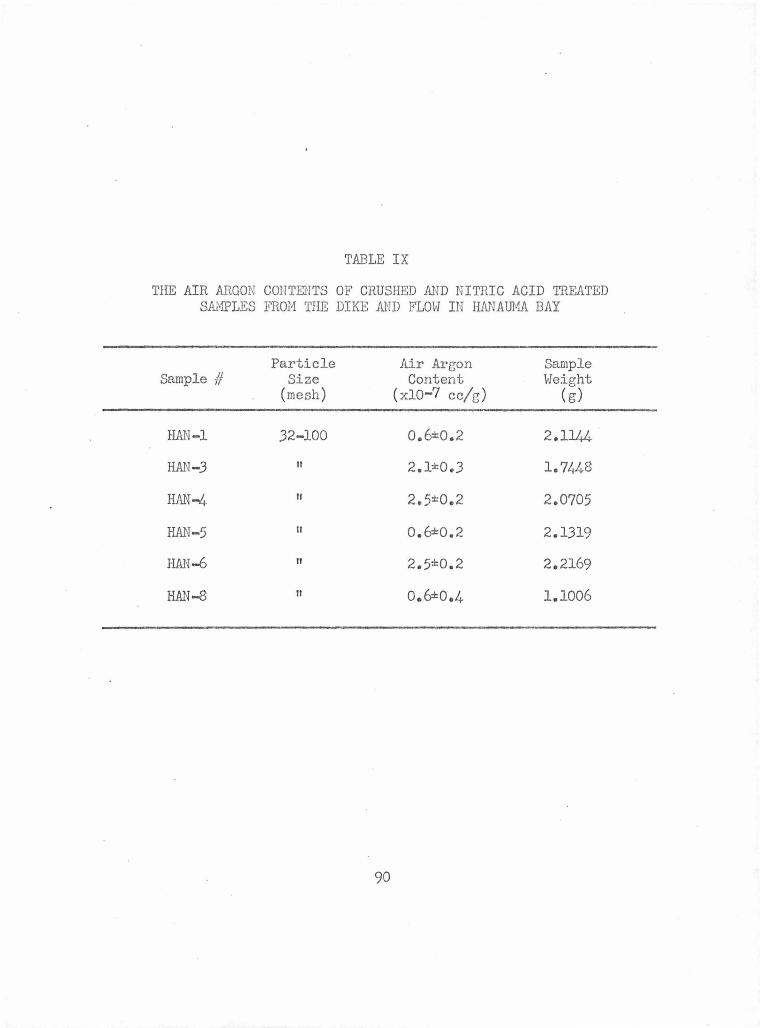
TABLE IX
THE AIR ARGON COHTENTS OF CRUSHED AND NITRIC ACID TREATED Sili\1PLES FROM THE DIKE AND FLOW IN HAN.AUMA BAY
Particle Air Argon Sample Sample # Size Content Weight
(mesh) (xl0-7 cc/e) ( g)
HAN-1 32-100 0. 6±0.2 2.1144
HAN-3 II 2.1±0.3 1.7448
HAN-4 II 2.5±0.2 2.0705
HAN-5 II 0.6±0.2 2.1319
HAN-6 II 2.5±0.2 2.2169
HAN-8 II 0.6±0.4 1.1006
90
b. Literature evidence supporting field adctition
The occurrence of a fairly large field added air
argon component in the relatively fresh Hanaurna Bay samples raised
the questiou of the extent of such contamination in general. The
only references that suggested field additions were EveYnden et al.
(1960) and McDougall et al. (1966), while Hayatsu and Carmichael (1970)
and Lanphere and Dalrymple (1971) inferred that they were not likely.
It seemed unlikely that field additions would be common and yet
not commonly discussed. Nevertheless the air argon contents of
whole rock volcanic samples with reported ages ranging from 0-16 MY
were examined for possible trends which would detect field additions.
The undoubtedly oversimplifying asswnption was not that field additions
require millions of years, but rather that they were more likely
to have occurred at one time or another in older samples. The air
argon contents usually had to be back calculated because most
authors choose to present only ages and the percent of argon that
is radiogenic. In an attempt to obtain a reasonably homogeneous
pool of data, the following criteria were applied in selecting the
literature values to be used:
1. Material more felsic than andesites was not
considered in order to avoid as much as
possible, inherent differences in air argon
caused by different mineral assemblages.
For instance, biotite which is common in
felsic rocks usually has a greater air argon
91
content than the corresponding pyroxenes
in mafic r ocks.
2. Replicate analyses of a single flow were
averaged to give a single air argon value.
J. Samples where alteration was mentioned, however
slight, except for the formation of iddingsite,
were not included.
4. At least one flow in each article must have
contained less than Jxl0-7 cc/g air argon.
This helps to avoid possible effects of inferior
analyses, although it by no means implies that
any such analyses are inferior.
5. The compilation was stopped when over 500
flows were included.
Three age subgroups were selected, 0-1 MY, 1-5 MY,
and 5-16 MY. All of the air argon contents were converted to units . 7
of 10- cc/g. The references which had samples fitting the above
criteria are listed in Table X and histograms of the compilations
are shown in figure 17. In each age category, the median air argon
content was computed. The median rather than the average was used
so that a feu samples with extremely high air argon contents uould
not have too great a bearing on the overall result. Average values
would have caused the observed trend to appear more severe.
The 0-1 MY samples will be assumed to best represent
the case of no field addition (figure 17a). The median value of
92
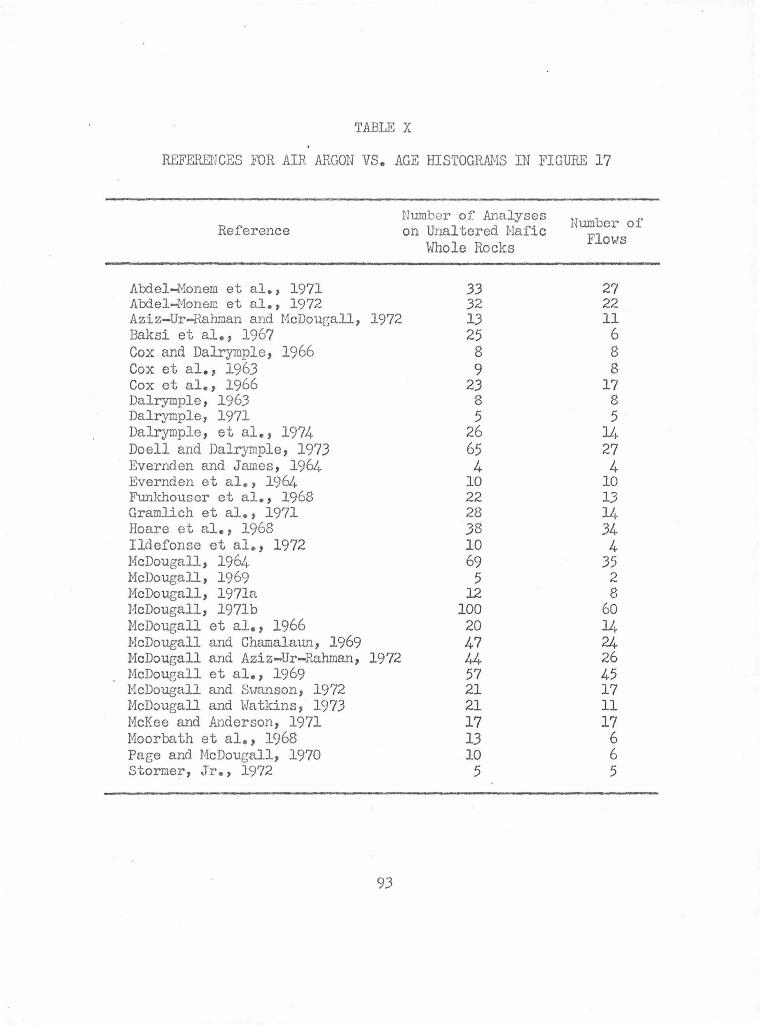
TABLE X
REFERENCES FDR AIR ARGON VS. AGE HISTOGRAMS IN FIGURE 17
Number of Analyses Number of Reference on Unaltered Hafic Flows Whole Rocks
Abdel-Monem et al., 1971 33 27 Abdel-Monem et al., 1972 32 22 Aziz-Ur-Rahman and McDougall, 1972 13 11 Baksi et al., 1967 25 6 Cox and Dalrymple, 1966 8 8 Cox et al., 1963 9 8 Cox et al., 1966 23 17 Dalrymple, 1963 8 8 Dalrymple, 1971 5 5 Dalrymple, et al., 1974 26 11, Doell and Dalrymple, 1973 65 27 Evernden and James, 1964 4 4 Evernden et al., 19611- 10 10 Funkhouser et al., 1968 22 13 Gramlich et al., 1971 28 14 Hoare et al., 1968 38 34 Ildefonse et al., 1972 10 4 McDougall, 1964 69 35 McDougall, 1969 5 2 McDougall, 197la 12 8 McDougall, 197lb 100 60 McDougall et al., 1966 20 14 McDougall and Chamalaun, 1969 47 24 McDougall and Aziz-Ur-Rahman, 1972 44 26 McDougall et al., 1969 57 45 McDougall and Swanson, 1972 21 17 McDougall and Watkins, 1973 21 11 McKee and Anderson, 1971 17 17 Moorbath et al., 1968 13 6 Page and McDougall, 1970 10 6 Stormer, Jr., 1972 5 5
93
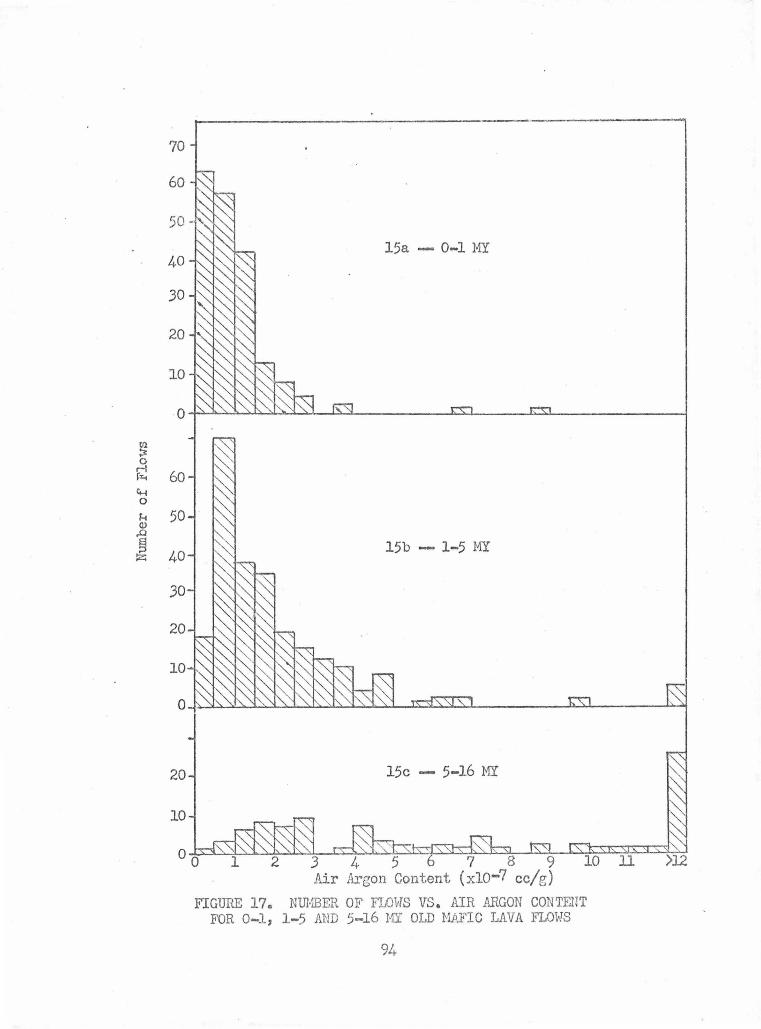
70
20
10
15c - 5-16 MY
4 5 Air Argon Content
FIGURE 17. NUMBER OF F1.0WS VS. AIR ARGON CONTEHT FOR 0-1, 1-5 AND 5-16 MY OLD MAFIC LAVA FLOWS
94
0.8xl0-? cc/g is very low and the spread is qu.ite small. Ninety
. ~ I percent of the flows fall within ±1.lxlO cc g of the median. In
the 238 fl01.,rs included in the 1-5 MY bracket (figure 17b) a small
but distinct overall increase is observed~ The median value and
spread approximately doubled, to l.5xlo-7 cc/g, and ±2.5xlo-7 cc/g
to include 90% of the flows. The percentage of flows with air argon
contents )J.Oxl0-7 increased from 2.1 to 19%. In the final age
group of only 89 flows (figure 17c) the median increased to
-7 I 5.0xlO cc;g. These "older" samples had air areon contents greater
-7 I than JxlO cc g 62% of the time. The population of this aee group
was diminished significantly by the restriction that at least. one
analysis per article had to have (Jxl0-7 cc/g air argon. The papers
which were so eliminated had dated older samples almost exclusively.
Basic volcanic rocks older than 16 MY seem to continue the trend of
higher average and increasing ranges of air argon contents, but a
compilation has not been made.
It is not likely that the average initial air argon
content of lavas has changed during the past 16 million years. There
are however a number of other potential explanations besides field
additions for the above trends which will be considered in the
following paragraphs.
The chemical composition, while restricted, is still
quite broad. Using the available potassium concentrations as an
indication of the changes in overall composition, two histograms
were prepared and are given in figure 18. The samples which had
95
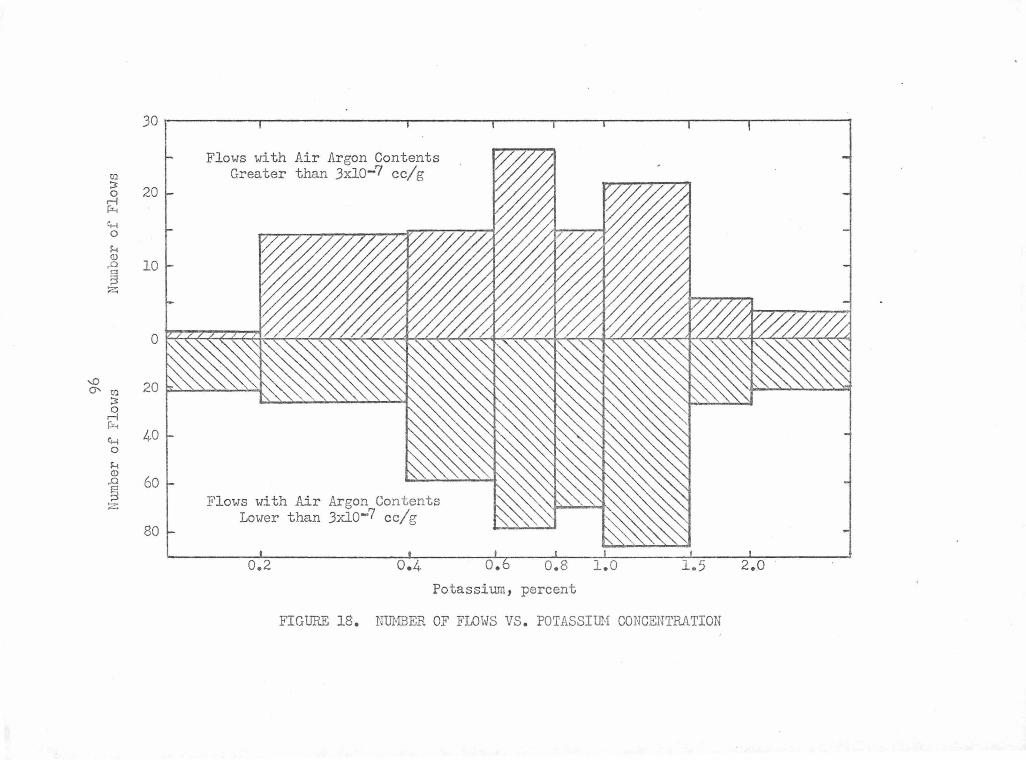
'°
30 .--~~~-T--~~~~~~...-~~~...--~--.,--~....-~~~.....-~--.,--~~~-
ti)
~ 20 rl Ii-<
<+-1 0
H
2 10 § z
Flows with Air Argon Contents Greater than 3xlo-7 cc/g
0 r { { ( < ( ( ( (" ( { ( { ( ( ( { ( < ( ( ~ ( < ( < ( ( ( ~ .. ( ( .:: < [ 4 ( ( ~ < < x < ' <. r, q ' ( '<" « <',. « ' « «"' '<: '<: ('I
Ci' ti) 20 p: ) ) ) ) ) ) ) 'l ::>=
~ ~ 0
H Q)
..a § z
40
60
80
Flows with Air Argon Contents Lower than Jxlo-7 cc/g
0.2 0.4 o. 0.8
Potassium, percent
1 . 0 1.5
FIGURE 18. NUNBER OF FLOWS VS. POTASSIUM CONCENTRATION
2.0
-7 I air argon contents greater than JxlO cc/g we:ce proportionally
distributed over the entire range of potassium concentrations.
The air argon content thus does not detectably vary with composition
over the range of composition chosen.
Dalrymple and Lanphere (1969) noted regional differences
in air argon content of basalts. It was possible that many older
samples might have been selected from areas which had higher
inherent air argon contents. The Hawaiian Island chain is perhaps
the most thoroughly studied geological area in the world. Table XI
summarizes the published K-Ar work on this region from the references
listed in Table X. The air argon contents typically increase in the
older but otherwise similar samples. The i ncrease is observable
separately in the data of McDougall and associates, Dalrymple and
associates, and Naughton and associates. The observation of the
trend within a single area does not mean that regional differences
do not exist, but rather that they cannot be the exclusive explan-
ation of the tendency for older samples to have higher air argon
contents. It does mean that presumed regional differences may be
principally the result of comparing samples ~~th different age
ranges which have had different lengths of time for field additions
to occur. Comparison of air argon contents of samples from oceanic
islands with those from the generally older continental regions
would be misleading unless this was considered.
Argon analyses on older samples are performed using
smaller weights since larger quantities of radiogenic argon are
97
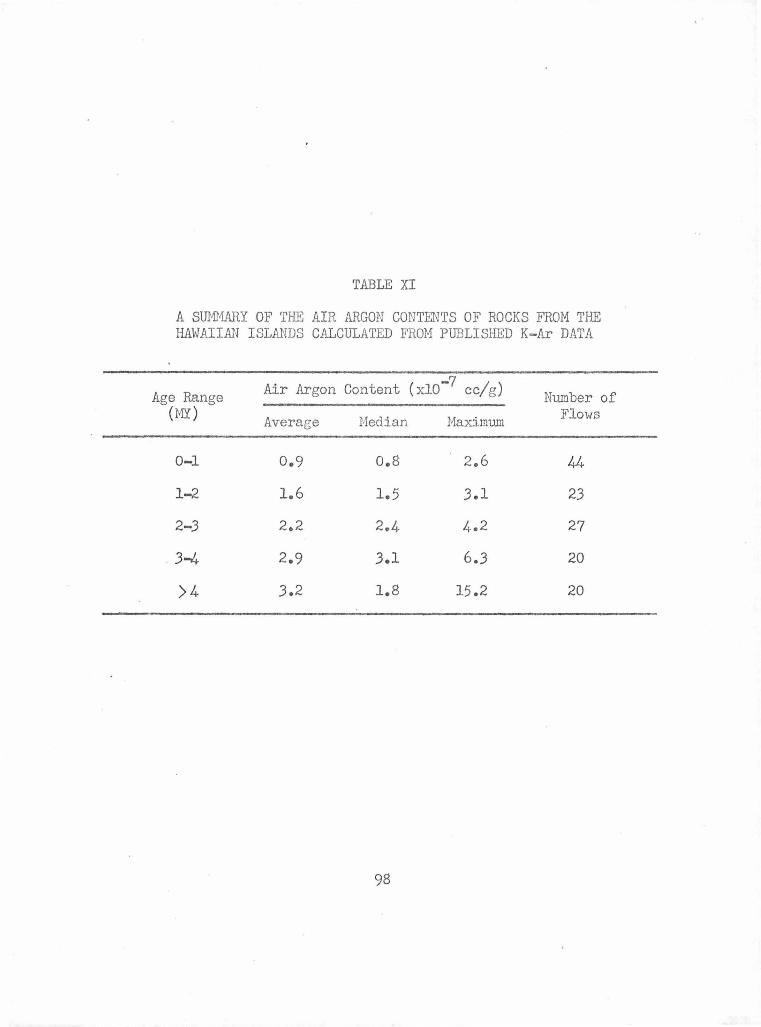
TABLE XI
A SUMMARY OF THE AIR ARGON CONTENTS OF ROCKS FROM THE HAWAIIAN ISLANDS CALCULATED FROM PUBLISHED K-Ar DATA
Age Range Air Argon Content (xlo-7 cc/g) Number of (MY) Average Median Maximum Flows
0-1 0.9 0.8 2.6 44
1-2 1.6 1.5 .3.1 2.3
2-.3 2.2 2.4 4.2 27
. .3-4 2.9 .3.1 6 • .3 20
)4 .3 .2 1.8 15.2 20
98
present. The relati vely constant instrument al sources of air argon
will therefore have a larger effect on these samples, causing them
to appear as if they had a gr eater air argon content. It may be
estimated i'rom reported blank values, commonly lxl0-7 cc, and the
smallest common sample weights t hat this could account for an
apparent increase of only l-2xl0-7 cc/g over the entire time interval
of consideration assuming no instrumental blank correction is made.
This type of apparent air argon increase could not explain the much
larger values observed in many of the older samples.
Differences in facilities and procedures could
partially explain the increases. The requirement that each reference
cited must have at least one analysis with an air argon content less
than 3xlo-7 cc/g guarantees however that analytical differences
are not too great.
Another possible explanation is that many young
samples with high air argon contents are missing from the histograms
and plots because the analyses had too low of a fraction of radiogenic
argon to give a meaningful age, causing the analyst not to list them.
Dpell and Dalrymple (1973) reported having some such rejected samples.
Others have stated that no samples had to be rejected, while still
others have made no mention of this at all. Because of the latter
group this explanation cannot be completely discarded. However it
is not felt to pose a serious threat to the overall trend, as too
many unreported samples would be required.
One final possibility is that the number of samples
99
is not large enough to allow intracomparisons. Over 500 lava flows and
900 argon analyses have been considered in the compilation.
It seems to be more likely that field additions of
air argon cc occur in samples whose degree of alteration is not
great enough to cause them no t to be analyzed. On the basis of
these analyses air argon additions should be considered as a poss-
ible cause in any holocrystalline basic flow whose air argon content
is greater than about 2-Jxl0-7 cc/g. This does not imply that
field additions are not important below this value. They certainly
were in the Hanauma Bay samples. It is impossible to tell when
all of the field and lab added air argon has been removed, so
these components could be important down to much lower regions.
This data may be used only to point out the likelihood of larger
additions.
Since this compilation was made Armstrong (personal
communication, 1974) has also noted an increase in air argon
content with age in 190 analyse~ of rocks from Idaho.
3. Initial .Argon Concentrations
When magma nears or reaches the surface, magmatic and
atmospheric argon begin exchanging at unknown rates. A net release
of argon oust normally occur, since argon with an isotopic composition
enriched over air in either mass 40 or mass 36 is observed in
gaseous emissions associated with volcanism (Zartman et al., 1961;
Cherdyntsev and Shitov, 1967). The widespread success of K-.Ar
dating applied to volcanic rocks indicates that the exchange is
100
normally thorough so that the isotopic composition of the melt
becomes very close to the atmospheric value. The resulting argon
concentration is limited either by its solubility1 of which little
is lmown for cooling silicate melts 7 or by the extent of the exposure
which is undoubtedly variable.
The Hanauma Bay data indicated that the initial exposure
was not overly critical7 so attention was given to the possibility
of initial control by solubility.
a. Glasses
The type of sample which can give information about
solubilities in melts is rapidly quenched glass. Table XII lists
analyses both from the literature and this study. A wide range of
conditions and resultant air argon contents is evident. The data
from the literature shows just how little the question of solubility
has been studied.
Fresh .glassy samples from Kilauea Volcano gave
interesting results. A sample from the chilled upper edge of a
pahoehoe lava flow 1 two samples of spatter, and a portion of a dipped
lava sample each had very high air argon contents 1 ranging from
-7 / 12-60x10 cc g. These samples were similar in appearance; dark1
glassy, lustrous and dense 1 but with a fairly large number of small
spherical vesicles. These high air argon contents can be inter-
preted two ways. Each small sample would be a special case where
the conditions that caused the sample to cool rapidly to a glass
also gave it an exposure to air argon that was abnormally high. The
101
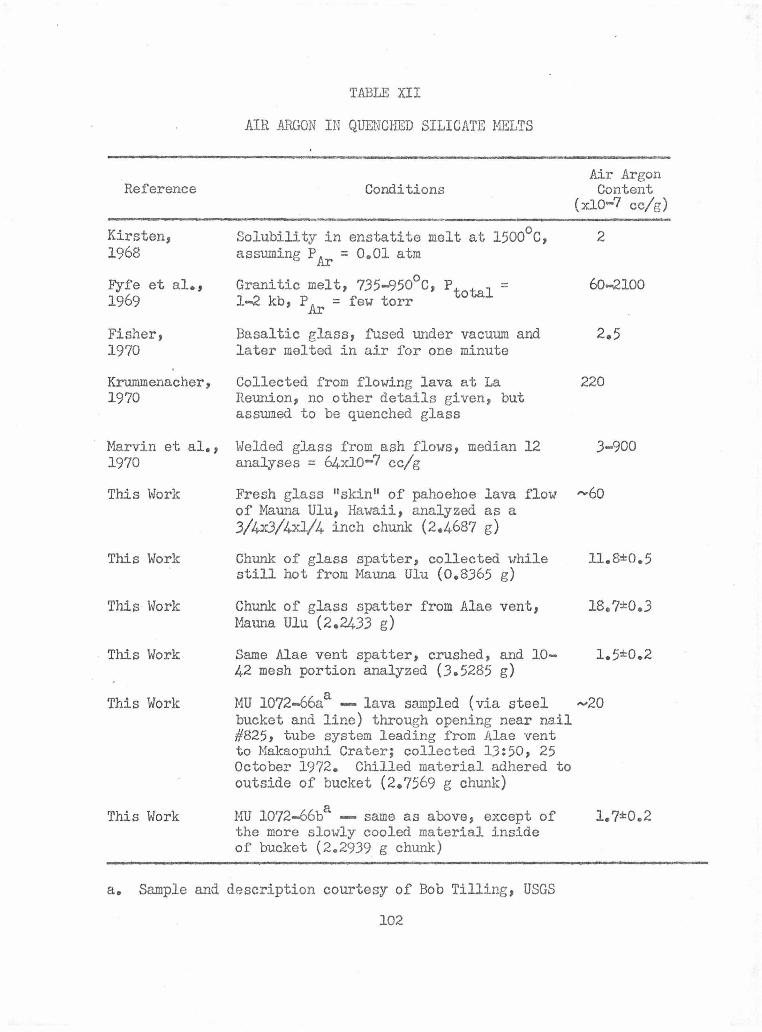
Reference
Kirsten, 1968
Fyfe et al., 1969
Fisher, 1970
Krummenacher, 1970
Marvin et al. , 1970
This Work
This Work
This Work
This Work
TABLE XII
AIR ARGON IN QUENCHED SILICATE MELTS
Conditions
Solubility in enstatite melt at 1500°c, assuming PAr = 0.01 atm
Granitic melt, 735-950°c, Ptotal = 1-2 kb, PAr = few torr
Basaltic glass, fused under vacuum and later melted in air for one minute
Collected from flowing lava at La Reunion, no other details given, but assumed to be quenched glass
Welded glass from ash flows, median 12 analyses = 64xJ.0-7 cc/g
Fresh glass "skin" of pahoehoe lava flow of Mauna Ulu, Hawaii, analyzed as a 3/4x3/4xl/4 inch chunk (2.4687 g)
Chunk of glass spatter, collected while still hot from Mauna Ulu (0.8365 g)
Chunk of glass spatter from Alae vent, Mauna Ulu (2.2433 g)
Sa.me Alae vent spatter, crushed, and 10-42 mesh portion analyzed (3.5285 g)
Air Argon Content
(xlo-7 cc/g)
2
60-2100
2.5
220
3-900
-60
This Work MU 1072-66aa -- lava sampled (via steel ""20
This Work
bucket and line) through opening near nail #825, tube system leading from Alae vent to Makaopuhi Crater; collected 13:50, 25 October 1972. Chilled material adhered to outside of bucket (2.7569 g chunk)
MU 1072-66ba - same as above, except of the more slowly cooled material inside of bucket (2 .2939 g chunk)
a. Sample and description courtesy of Bob Tilling, USGS
102
1.72=0.2
result would be that the air argon contents would have no relation
to the magmas from wh.ich they were quenched. On the other hand
the samples could be representative of the melt. If th.is is the
case some explanation must be found to explain how the melt can
have up to 60xl0-7 cc/g while most crystalline lavas usually bave
(Jxl0-7 cc/g.
The explanation may lie in the other analyses in
Table XII. A crushed portion of one chunk of spatter gave only
l.5x10-7 cc/g. That means that over 9Cf% of the argon was removable
by crushing. In this sample which was collected on the day of its
eruption, field addition is not likely. The obvious location of
the argon is in a few gas-tight vesicles. The use of glass in
vacuum systems certainly illustrates that it is capable of holding
gases. The location of air argon in these enclosed vesicles means
that the argon was not going into the glass when it was quenched,
but rather that it was coming out. As pointed out by Dalrymple and
Lanphere (1969) there is no reason to suspect that a species
' diffusing into a sample would collect itself in preformed cavities.
This offers a mechanism for removal of air argon in going from a melt
to a crystalline rock. The data suggest that the solubility decreases
in the temperature region where solidification occurs.
The second portion of the dipped lava sample, from
the interior of the metal dipper, cooled slowly enough so that
microscopic crystals were abundant and a glassy luster was not
observed. This sample should have had a significant exposure
103
to the air, much like the outer dipped portiono The air argon content
of only l.7xJ.0-7 cc/g indicates that the slower cooling was more
important than the extra exposure.
The implication of these ::mmples is that the extent
of the initial exposure may not determine the ultimate air argon
content. The rate of cooling appears to be more important in that
rejection of prev1ously dissolved or entrained air argon (or any
other argon) takes place at this time. This is consistent with the
Hanauma Bay samples which did not show a net increase in the initial
air argon contents as a result of greater exposure to the atmosphere.
Another observation that requires less tenuous
reasoning is that volcanic glass is a potential source of unusually
high air argon contents, particularly in samples that are all glass
or nearly all glass.
b. Historic volcanics
The air argon content in melts is interesting in
thatit gives information about the mechanism of air argon acquisition.
Still, the initial air argon content in rocks after cooling but
before any field additions can best be determined by a study of
rocks that are as young as possible. Dalrymple (1969) and
Krummenacher (1970) have made studies of historic lava flows and
volcanic material. Air argon contents may be calculated from their
data and are presented in Table XIII. Also shown are the results
of the 0-1 MY samples compiled and previously shown in figure 17.
The analyses of Dalrymple (1969) are somewhat higher than these
104
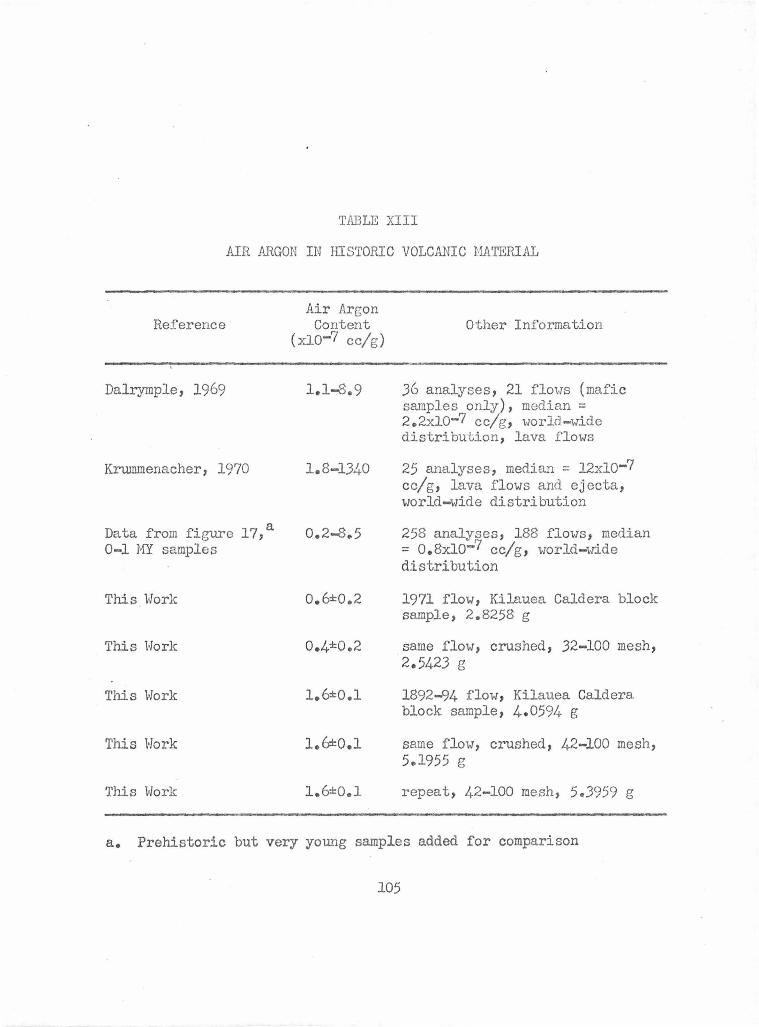
TABLE XIII
AIR ARGON IN HISTORIC VOLCANIC MATERIAL
Reference
Dalrymple, 1969
Krwnmenacher, 1970
Data from figure 17,a 0-1 MY samples
This . Work
This Work
This Work
This Work
This Work
Air Argon Content Other Information
(xio-7 cc/g )
1.1-8.9 .36 analyses, 21 flows (mafic samples only), median= 2.2xio-7 cc/g, world-wide distribution, lava flows
1.8-1.340 25 analyses, median = 12xlo-7 cc/g, lava flows and ejecta, world-wide distribution
0.2-8.5
0.6:1:0.2
0.4:1:0.2
1.6±0.1
1.6±0.1
1.6±0.l
258 analyses, 188 flows, median = 0.8xlo-7 cc/g, world-wide distribution
1971 flow, Kilauea Caldera block sample, 2.8258 g
same flow, crushed, .32-100 mesh, 2.542.3 g
1892-94 flow, Kilauea Caldera. block sample, 4.0594 g
same flow, crushed, 42-100 mesh, 5.1955 g
repeat, 42-100 mesh, 5.3959 g
a. Prehistoric but very you.~g samples added for comparison
105
0-1 MY samples, but this could mainly represent analytical differences.
The data of Krummenacher (1970) clearly call for some
comment. His air argon contents show a tremendous range and no
explanation is given in his article. He did not have sufficient
material in most cases to prepare thin sections (D. Krummenacher,
personal communication, 19'74) so the extent of alteration cannot
be evaluated. Another clue is that one sample was reported to be
from flowing lava (La Reunion, Table XII ). The dipped samples from
flowing lava of Kilauea were largely or wholly glass . Krummenacher
(1970) did not specify whether his analyses were on glass or crys
talline material, so some of the high air argon contents could
easily be the result of analyzing quenched glass. These potential
explanations are admittedly less than satisfactory. It is unfortunate
that more data is not available.
To obtain further information on recent lavas two
historic flows from the caldera of Kilauea Volcano were sampled.
The dense aa flow of 1892-94 and the vesicular pahoehoe 1971 flow
were chosen. Each sample was collected from 1-2 feet below the
upper surface out of fissures to obtain the densest, least glassy
material available. Their air argon contents are also given in
Table XIII. They are more consistent with the 0-1 MY samples than
the other historic flows. Moderate crushing had no significant
effect on the air argon contents. This reinforces the earlier
finding that crushing removed field added argon.
c. Intrusives and submarine basalts
Samples of quenched glass and of historic volcanic
106
material represent systems where the exposure to the air is rather
significant. An effort was made to obtain samples whose initial
exposure to the air -was zero or nearly so. The problem is that as
the initial exposure gets lower, so does the availability of the
sample. The dike at Hanauma Bay penetrated tuf'f material, coral
deposits and probably some clay sediments or soil, so that its
exposure to atmospheric gases may not have been as restricted as
in other dikes. Two other intrusive samples were chosen; from
Uwekahuna laccolith (Daly, 19ll), a very young but shallou intrusive
now exposed in the wall of Kilauea•s caldera; and from a dike in
the Koolau range, which, on the basis of the geology of the area
given by Macdonald and Abbott (1970), must have been many thousands
of feet below the surface when intruded. But it is older and there-
fore has had more time for field additions of atmospheric argon. The
air argon contents given in Table XIV give no evidence for restricted
initial air contact. Field added argon is likely in the Koolau dike,
since it has a removable component.
Perhaps a better source of rocks with little exposure
to the atmosphere are _submarine basaltso The outer glassy rims of
submarine flows quench rapidly enough to maintain much of their
magmatic gas, including argon (Noble and Naughton, 1968; Dalrymple
and Moore,1968)a The seawater contamination of such rims is
slight, so the exposure to dissolved atmospheric argon must also
be small. All of the 36Ar in such samples may be assumed to be
atmospheric briefly, in order to determine the maximum air contam-
107
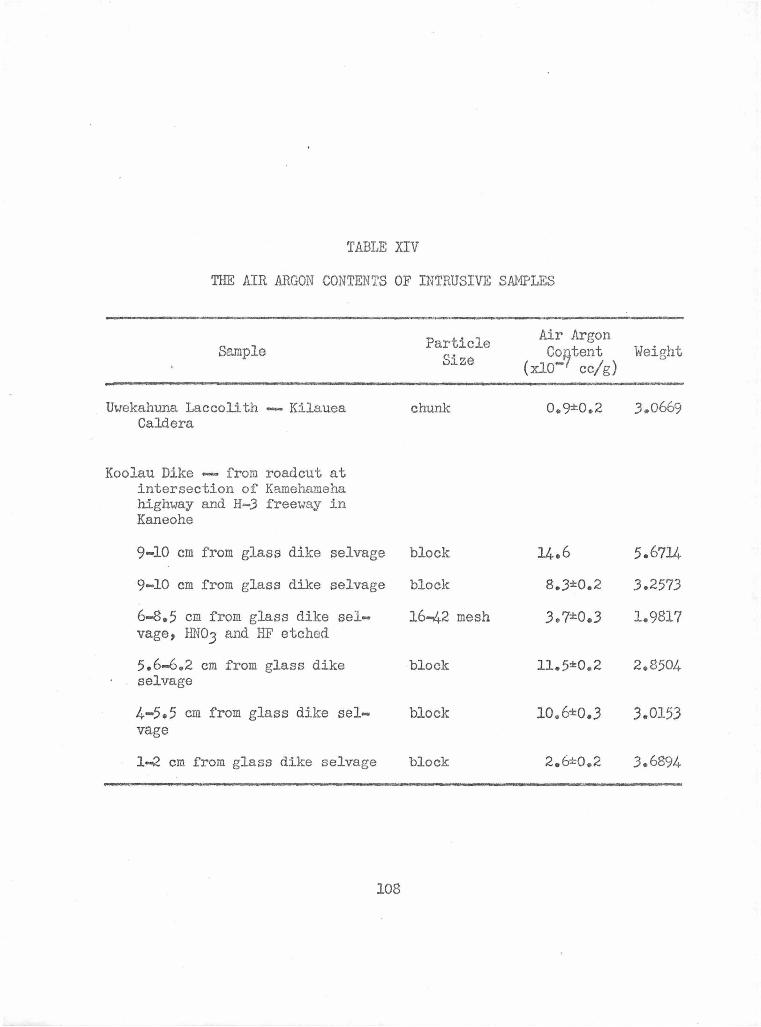
TABLE XIV
THE AIR ARGON CONTENTS OF INTRUSIVE SAMPLES
Sample
Uwekahuna Laccolith -- Kilauea Caldera
Koolau Dike -- from roadcut at intersection of Kamehameha highway and H-3 freeway in Kaneohe
Particle Size
chunk
9-10 cm from glass dike selvage block
9-10 cm from glass dike selvage block
6-8.5 cm from glass dike sel- 16-42 mesh vage, HN03 and HF etched
5.6-6.2 cm from glass dike block selvage
4-5.5 cm from glass dike selvage
1-2 cm from glass dike selvage
block
block
108
Air Argon Co~tent Weight
(xlo- cc/g)
O.C)±0.2 3.0669
14.6
8.3±0.2
11.5±0. 2
10.6±0.3
2.6:1:0.2
5.6714
3.2573
1.9817
2.8504
3.0153
3.6894
ination. Calculations based on literature analyses are given in
Table xv. Again de3pite the lack of initial exposure to the
atmosphere, 36Ar is ubiq~tously present. Since magmatic 36.A:r
cannot be distinguished from atmospheric 36.A:r, the exact amount
of air contamination via reasonably rapid additions from seawater
by submarine weathering is not known.
The combined uncertainties from residual magmatic 36Ar,
initial contributions from the surrounding country rock, . and field
additions make it very difficult to find samples which have air argon
contents th.at are low enough to claim the low value is the result of
restricted contact vith the atmosphere. Perhaps initial air argon con-
tents of zero will never be conclusively found in terrestrial samples.
B. LOCATION OF AWOSPHERIC ARGON
1. Summary of Information from the TIME OF ADDITION Section
The results of moderate crushing and mild acid treatment
gave some important information concerning the location of atmospheric
argon. The removal of a field added component by these techniques
required a surface location. Secondly, and seeming somewhat in
contradiction, the lack of increase in air argon by crushing
suggested that adsorption on surfaces was not important.
2. Surfaces
a. More severe crushing
The release of air argon by crushing is exactly
opposite to the additions Gramlich (1970) found when he crushed
augite from Salt Lake Crater, Oahu. As he had used some very
109
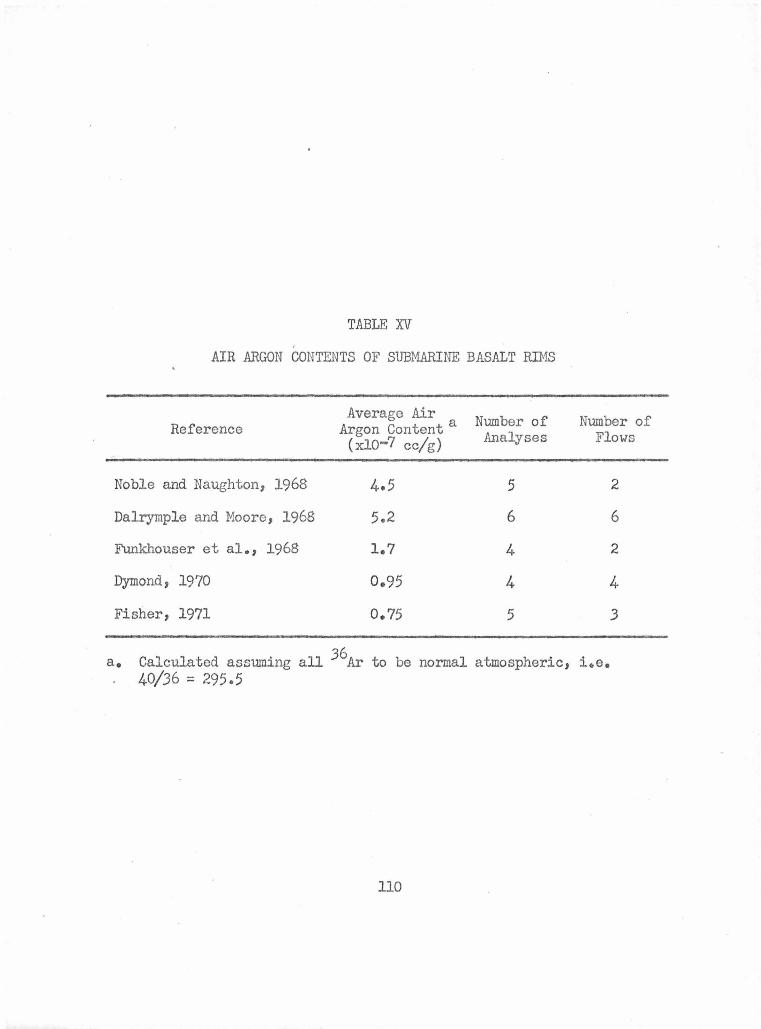
TABLE Il
AIR ARGON CONTENTS OF SUBMARINE BASALT RIMS
Average Air Number of Number of Reference Argon Content a (xlo-7 cc/g) Analyses Flows
Noble and Naughton, 1968 4.5 5 2
Dalrymple and Moore, 1968 5.2 6 6
Funkhouser et al., 1968 1.7 4 2
Dymond, 1970 0.95 4 4
Fisher, 1971 0.75 5 3
a. Calculated assuming all 36Ar to be normal atmospheric, i.e. 40/36 = 295 .5
110
small particle sizes it was thought that moder ate crushing of
basalt samples had not created a significant number of 11new11
surfaces, but had only broken the samples apart mainly along pre
existing microcracks and grain boundaries which were already
exposed. Some additional crushing experiments were therefore
undertaken using smaller particles in order to better resolve the
importance of adsorption and the use of crushed sampleso
H.AN-4 was chosen because its density, lack of
apparent alteration, and air argon content seemed most typical.
A fairly large portion was crushed to pass a 32 mesh screen and
sieved. The (400 mesh fraction was saved and f'urther separated
by the same gravitational settling technique used by Gramlich
(1970). Fractions with particle sizes (lP, 1-lOp-, and 10-38?
(400 mesh) were obtained, although there was some unavoidable
overlapping. The results of the analyses are given in Table XVIo
Figure 19 illustrates the results and shows the initial decrease
by crushing (H.AN-4 is not the best example). However the sizes
smaller than lOf'- show dramatic air argon increases. The 10-38?
and 200-400 mesh sizes are about the same as large chunks. They
represent the crossover from removal to addition. The addition
could have resulted from either physical fractionation of a
component with a high air argon content into the fine siz~s, or
could have been a direct result of the crushing.
The sample of lava from the 1971 flow in Kilauea
Caldera was crushed further, because it had a low air argon content
111
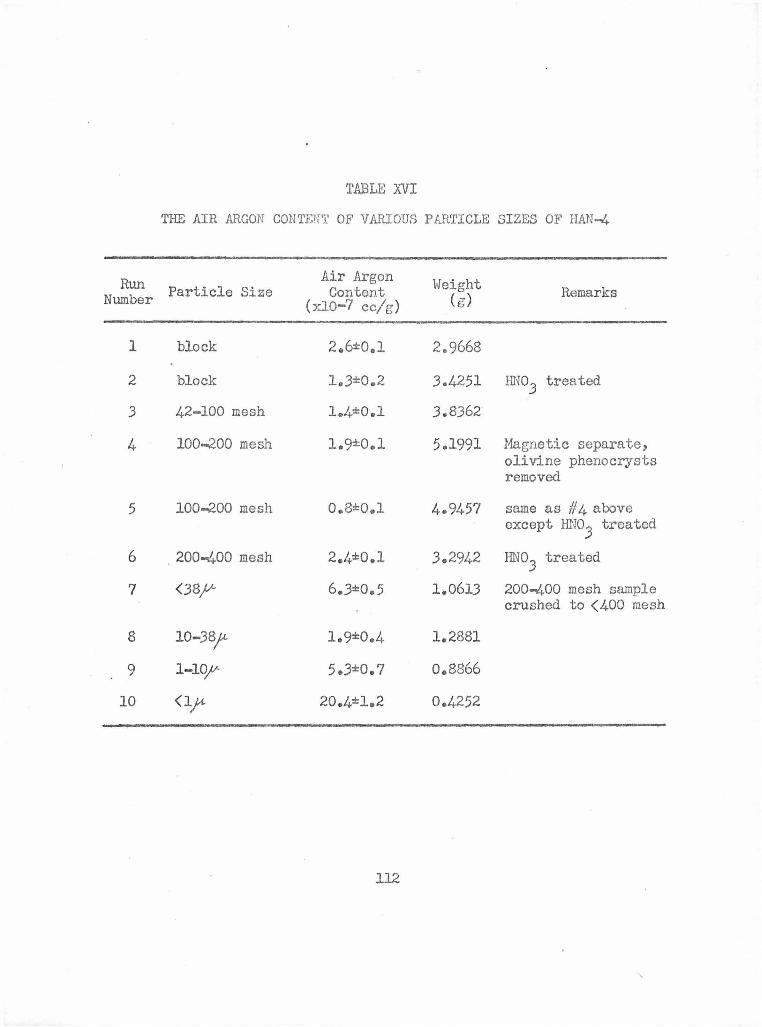
TABLE XVI
THE AIR ARGON CONTENT OF VARIOUS PARTICLE SIZES OF I:IAN-4
Run Air Argon Weight Particle Size Content Remarks Number (xl0-7 cc/g) (5)
1 block 2.6:1:0.1 2. 9668
2 block 1.,3:1:0.2 3.4251 HNO 3 treated
3 42-100 mesh 1.,4:1:0.1 3.8362
4 100-200 mesh 1.9±0.,l 5.1991 Magnetic separate, olivine phenocrysts removed
5 100-200 mesh 0.8±0.1 4.9457 same as #4 above except HN0
3 treated
6 . 200-400 mesh 2.M=O.l 3.2942 HN03 treated
7 <38? 6.3:1:0.5 1.0613 200~00 mesh sample crushed to (400 mesh
8 10-38f- 1.,9:1:0.4 1.2881
9 1-1q,v- 5.3:1:0.7 o.8866
10 <ir 20.4'!=1.2 0.4252
112
20-0----1
~10 u u 8
" 'o )(6
64 ~3 <(
1.0 0.8
0
A= acid-treate d O=not acid-treated
0 0
0 0 -.:::l'
0 0 0
0 0 0 0 0 0 "'1' 0
AVERAGE PARTICLE SIZE,MICRONS
FIGURE 19. THE AIR ARGON CON1'ENT OF HAN-4 VS. PARTICLE SIZE The vertical error bars are the analytical (lcr} estimates arising mainly from the blank correction. The horizontal
bars1 show the range of particle sizes.
ll.3
in the block sample. Because of this, the crushing could not
cause significant fractionation of any high air argon component.
The results are given in Table XVII. Increases were again observed
in the smallest sizes. This \78.S an example of a laboratory addition,
but the addition was only significant in particle sizes that were
smaller than anyone would want to handle routinely in a vacuum
system anyway.
Another crushing on this sample was performed to
resolve whether or not the addition was the result of adsorption
on newly exposed surfaces. While the sample was .crushed, it was
kept wet with acetone to reduce the air exposure and the localized
heat produced on impact. Such a wetting agent has been used to
help reduce the surface oxidation of ferrous iron in samples
crushed in iron mortars (Hillebrand and Lundell, 19531 pp. 812-
813). The air argon contents of these samples are also given in
Table XVII and were distinctly lower than the corresponding dry
crushed ones. Larger average particle sizes seemed to result from
the 'Wet crushing but this could only explain part1 not all of the
d,ifference. The air argon addition was definitely related to the
crushing technique. Adsorption was not noticeably involved.
A final crushing experiment was performed on the
residual glass chipped out of several cracked molybdenum sample
crucibles. The remains of previous sample analyses, this glass
has an air argon content in its interior that for all practical
purposes is zero. Any argon found in analyses of this sample
1J4
Run Number
1
2
.3
4
5
6
7
8
9
TABLE XVII
THE AIR ARGON CONTENT OF VARIOUS PARTICLE SIZES OF THE THOLEIITIC BASALT KC-71
Air Argon Particle Size Content Weight Remarks
(xio-7 cc/g) {g)
block 0.6±0.2 2.8258
block 1.2±0.2 2.9107
.32-100 mesh o.4:eo.2 2.542.3
100-250 mesh 2.0±0.2 2.0899
100-325 mesh 3.6±0.1 3.6500
100-.325 mesh 5.0±0.1 J.4768 Not ultrasonically cleaned
( .325 mesh 16.7±0 • .3 2.8964
100-325 mesh 1.0±0.2 2.0278 Wet 'With acetone while crushing
( 325 mesh 2.2:eo.2 0.9488 Wet 'With acetone while crushing
115
must be surface associated. Several crushed portions were analyzed
and an increase in air argon was observed as a result of severe
crushing (Table XVIII). The 100-325 mesh fraction was split into
two portions. One was analyzed routinely and the other was etched
'With HF prior to analysis. The surface area of these samples
must have been equivalent, but the HF etching removed most of the
air argon which the crushing had added. This result again illus
trates that adsorption is not the important factor. Crushing must
cause some surface damage which contains or traps the air argon
that is added.
b. Artificial weathering
Atmospheric argon added in the field is located on
surfaces and is probably related to incipient alteration in the
sample. An attempt was made to speed up the normal weathering
processes in the lab to illustrate the ease 'With which field additions
take place. Descriptions of the various treatments and results
are given in Table XIX. The overall result was that air argon w.s
more difficult to add than had been expected. This means that
these are a poor illustration of how field additions affect surfaces,
but a good indication that laboratory additions as a result of
ordinary handJjng would be inconsequential.
3. Air Argon in Primary Minerals
The distribution of air argon 'Within a rock is probably
not homogeneous. McDougall (1966) (whose data was given in Table II)
and Dalrymple and Lanphere (1969) noted that minerals tended to have
116
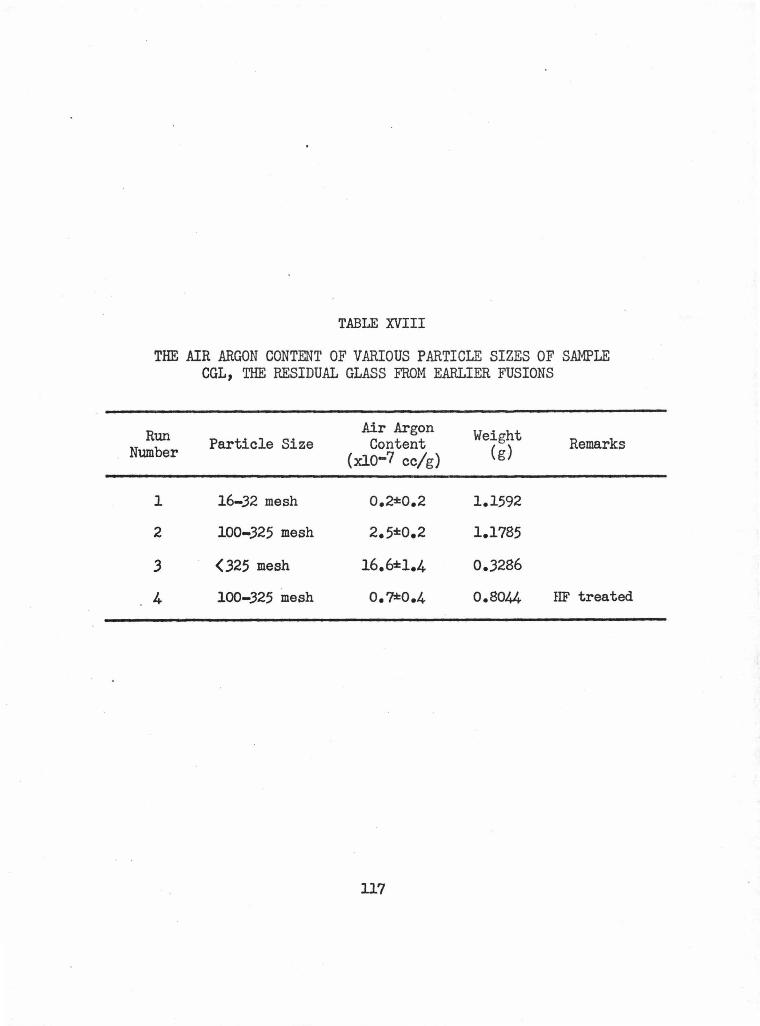
TABLE XVIII
THE AIR ARGON CONTENT OF VARIOUS PARTICLE SIZES OF SAMPLE CGL, THE RESIDUAL GLASS FROM EARLIER FUSIONS
Run Air Argon Weight Particle Size Content Remarks Number (xlo-7 cc/g) (g)
1 16-32 mesh 0.2*0.2 1.1592
2 100-325 mesh 2.5:1:0.2 1.1785
3 (325 mesh 16.62:1.4 0.3286
4 100-325 mesh o. 7*-0.4 0.8044 HF treated
117
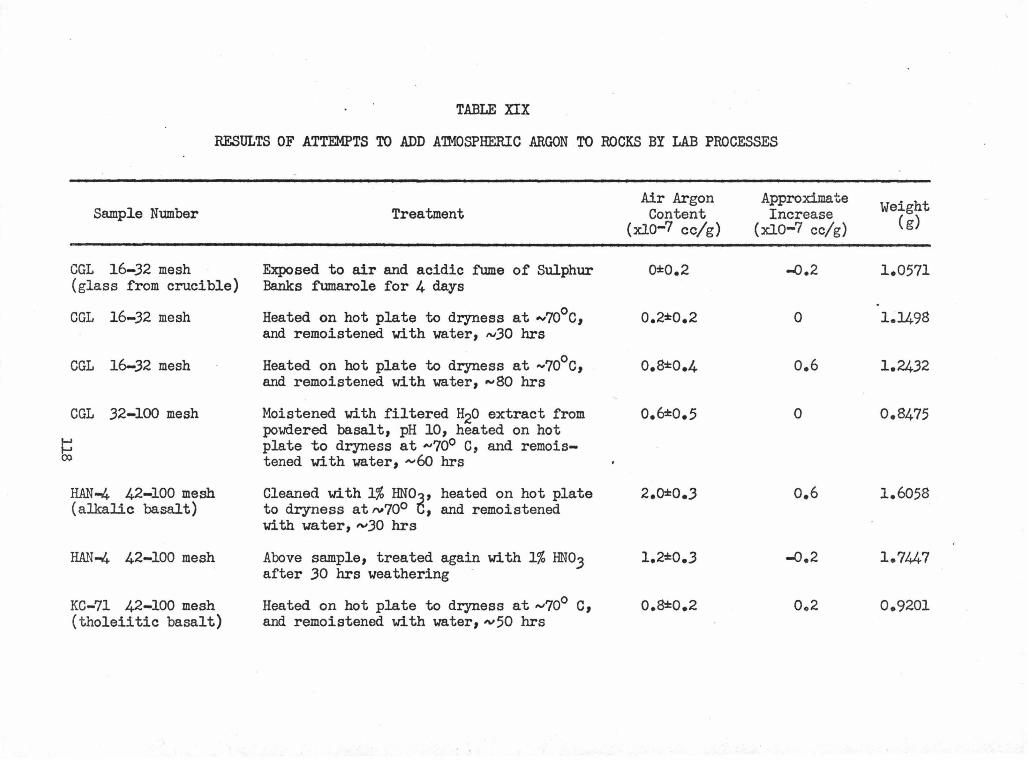
TABLE XIX
RESULTS OF ATTEMPTS TO ADD A™OSPHERIC ARGON TO ROCKS BY LAB PROCESSES
Air Argon Approximate Weight Sample Number Treatment Content Increase (xlo-7 cc/g) (xJ.0-7 cc/g) ( g)
CGL 16-32 mesh Exposed to air and acidic fume of Sulphur 0:1:0.2 -0.2 1.0571 (glass from crucible) Banks fumarole for 4 days
CGL 16-32 mesh Heated on hot plate to dryness at ~10°c 1 0.2*0.2 0 1.1498 and remoistened 'With water, N30 hrs
CGL 16-32 mesh Heated on hot plate to dryness at -7o0 c, 0.8*0.4 o.6 1.2432 and remoistened 'With water, .... 30 hrs
CGL 32-100 mesh Moistened 'With filtered H2o extract from powdered basalt, pH 10, heated on hot
0.6:1:0.5 0 o.8475
..... plate to dryness at N?o0 c, and remois-..... 00. tened Yi.th water1 ""60 hrs
HAN~ 42-100 mesh Cleaned 'With 1% HNO~, heated on hot plate 2.0:1:0.3 o.6 1.6058 (alkalic basalt) to dryness at tv70° , and remoistened
'With water, .vJO hrs
HAN~ 42-100 mesh Above sample, treated again 'With 1% HN03 1.2:1:0.3 -0.2 1.7447 after .30 hrs yea the ring -
KC-71 42-100 mesh Heated on hot plate to dryness at~?o0 c, 0.8±0.2 0.2 0.9201 (tholeiitic basalt) and remoistened 'With water1 -v50 hrs
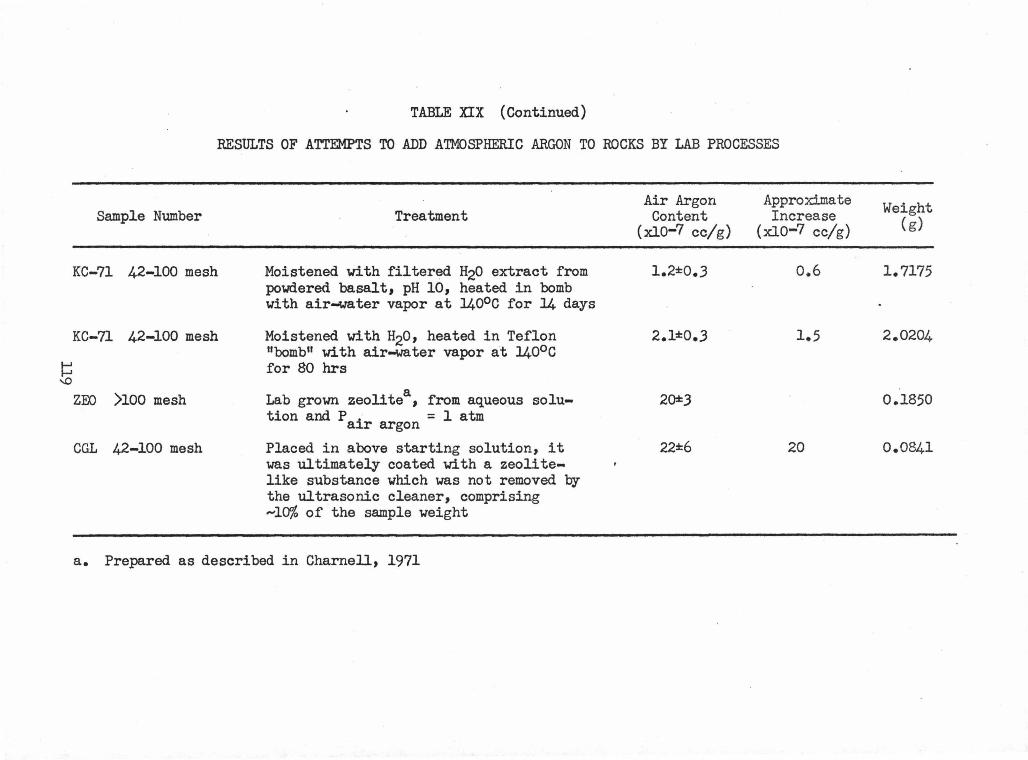
TABLE XIX (Continued)
RESULTS OF ATTEMPTS TO ADD A™OSPHERIC ARGON TO ROCKS BY LAB PROCESSES
Air Argon Approximate Weight Sample Number Treatment Content Increase (xlo-7 cc/g) (xl0-7 cc/g) ( g)
KC-71 42-100 mesh Moistened vi.th filtered H20 extract from 1.2±0.3 o.6 1.7175 powdered basalt, pH 10, heated in bomb vith air-Yater vapor at 140°c for l4 days
KC-71 42-100 mesh Moistened 'With H2o, heated in Teflon 2.1±0.3 1.5 2.0204 "bomb" vi.th air-water vapor at 140°c
i:: for 80 hrs
'° ZEO )100 mesh a Lab grovn zeolite , from aqueous solu- 2():1:3 0.1850 tion and P i = 1 atm a r argon
CGL 42-100 mesh Placed in above starting solution, it 22±6 20 0.0841 was ultimately coated 'With a zeolite-like substance which ws not removed by the ultrasonic cleaner, comprising -100/o of the sample weight
a. Prepared as described in Charnell, 1971
characteristic amounts of air argon contamination. Of the common
minerals in basic volcanic rocks which make up the Hawaiian Islands,
only plagioclase has been separately analyzed more than a few times.
Olivine and pyroxene are so low in potassimn that they have not
been of much interest in age dating projects. The air argon contents
associated with reported age determinations on minerals separated
from mafic rocks were calculated and are listed in Table xx. A wide
range is not surprising in view of the spread found in whole rock
samples shown in figure 17. The effects of field addition on the
mineral separates may have been important in some cases as the ages
of the separates ranged upward to over 100 MY.
These data are of little use in trying to apportion the
air argon within any single sample. The analyses were on different
samples, from various sources, of many ages, by a plurality of
techniques. In order to reduce the number of variables, a single
rock vas chosen for mineral separation and analysis.
Uvekahuna laccolith is an intrusive body exposed in
the valls of Kilauea's caldera (Daly, 1911). It is a picrite
gabbro and consists mainly of olivine, pyroxene (augite), and
plagioclase feldspar. A sample of it vas crushed, and these minerals
were separated. A 42-115 mesh fraction gave reasonably pure olivine
and plagioclase using the Frantz Isodynamic Separator. The pyroxene
fraction .vas contaminated with both olivine and plagioclase and its
purity vas estimated at about 80%. A number of larger olivine
phenocrysts were somewhat resistant to crushing and were collected
120
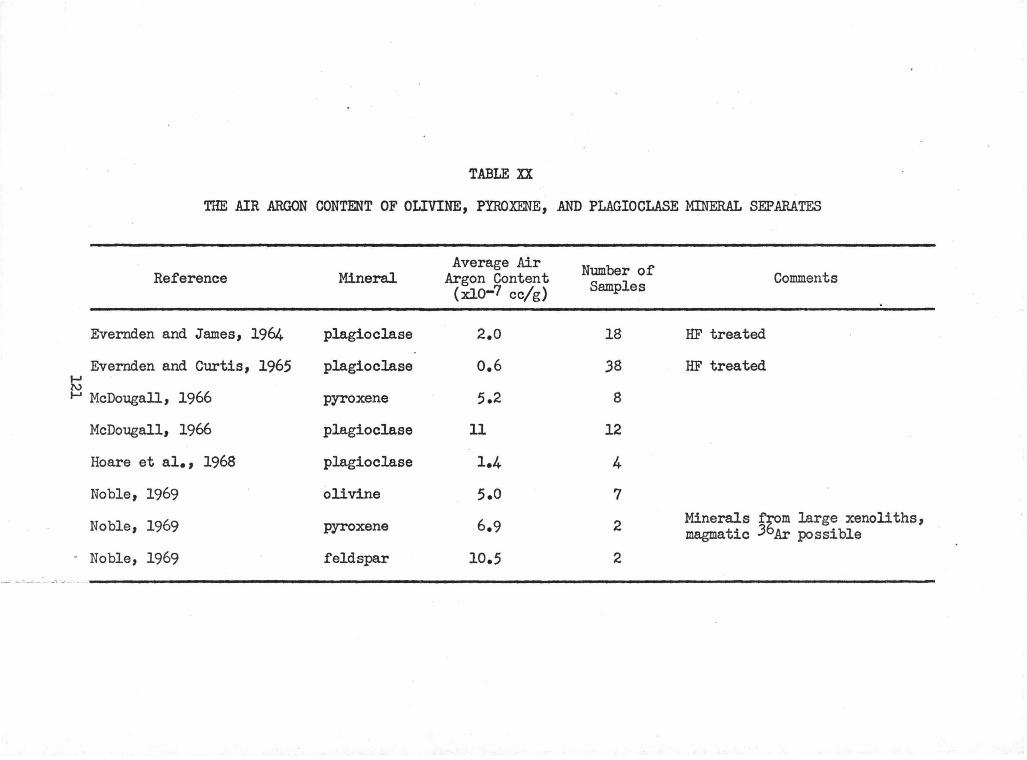
TABLE XI
THE AIR ARGON CONTENT OF OLIVINE, PYROXENE, AND PLAGIOCLASE MINERAL SEPARATES
Average Air Number of Reference Mineral Argon Content Samples Comments (xlo-7 cc/g)
Evernden and James, 1964 plagioclase 2.0 18 HF treated
Evernden and Curtis, 1965 plagioclase o.6 38 HF treated l-' l\)
J-J McDougall, 1966 pyroxene 5.2 8
McDougall, 1966 plagioclase 11 12
Hoare et al., 1968 plagioclase 1.4 4
Noble, 1969 olivine 5.0 7
Noble, 1969 pyroxene 6.9 2 Minerals f~m large xenoli ths, magmatic 3 Ar possible
Noble, 1969 feldspar 10.5 2 -- __ .. ....;.._. -· -~ ---..
separately. The separated minerals were washed with 1% HN03
• The
surfaces of the olivine phenocrysts ·were distinctly shinier after
the treatment and examination under the stereomicroscope showed
that a thin discontinuous white film had been removed. Analyses
of the three major mineral species and of a large whole rock
chunk are shown in Table XXI.
The results clearly show that in this rock the air
argon content is determined almost solely by the pyroxene.
Although it comprises only about 25% of the whole rock, it apparently
contributes about 80% of the atmospheric argon. The plagioclase is
similar to the lowest averge value in Table :XX, which was obtained
by Evernden and Curtis (1965) on HF etched samples. The olivine
phenocrysts contain very little atmospheric argon. The olivine
incidentally would not melt by itself at the temperature of l350°c
used in this study. However by not making it the first sample in
a batch, the residual melt from previous samples acted as a flux
and ·the olivine was dissolved in a length of time only slightly
longer than required for normal melting. The close agreement
between the whole rock chunk and the sum of the mineral contributions
is somewhat fortuitous. The major factor is the percent pyroxene
which was not measured all that precisely and could be a number of
percent higher or lower than indicated by the recoveries from the
crushing process. The agreement is certainly good, but may not
have been as exact as it appears in Table XXI.
The advantage of working with a single sample was that
122
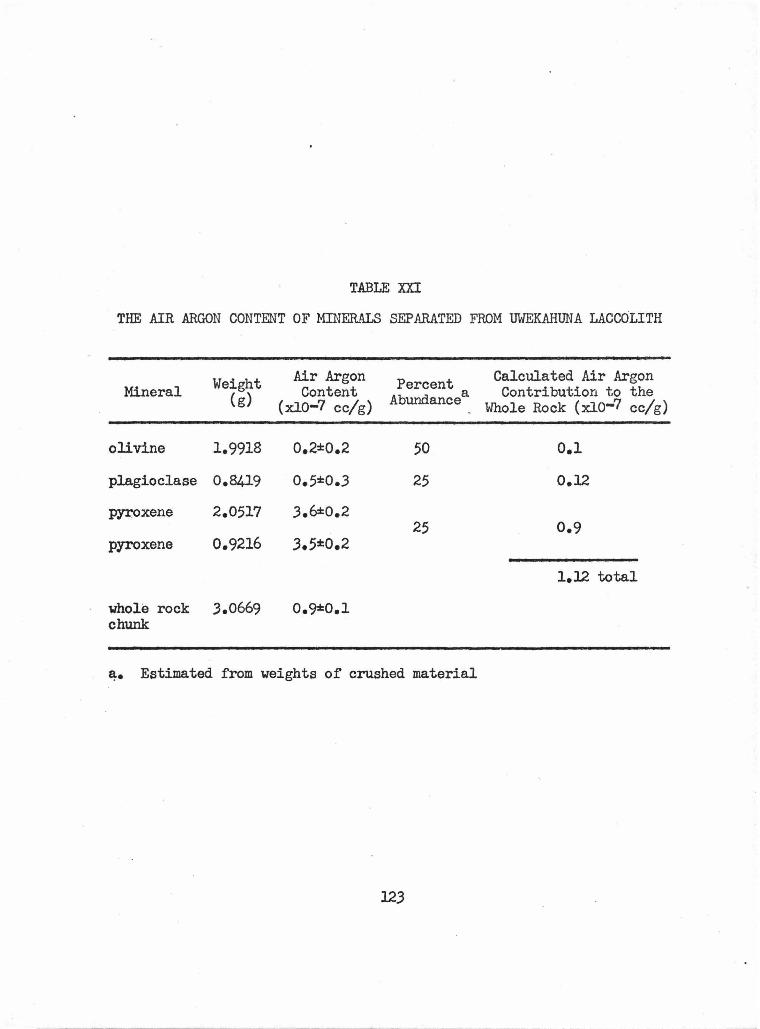
TABLE XXI
THE AIR ARGON CONTENT OF MINERALS SEPARATED FROM UWEKAHUNA LACCOLITH
Weight Air Argon Percent Calculated Air Argon Mineral Content Contribution to the (g) (xlo-7 cc/g) Abundance a Whole Rock (xlo-7 cc/g)
olivine 1.9918 0.2:1:0.2 50 0.1
plagioclase 0.8419 o.5:eo.3 25 0.12
pyroxene 2.0517 3.6:1:0.2 25 0.9
pyroxene 0.9216 3.5:1:0.2
1.12 total
vhole rock 3.0669 O.CJ:t:O.l chunk
B:• Estimated from weights of crushed material
123
valid intracomparisons could be made. The disadvantage is that it
is more difficult to generalize the importance of the results from
a single rock. The finding that air argon is disproportionately
located in the pyroxene, if generally true, could be very important
in K-Ar dating. Combined with the knowledge that crushing can be
used without adding air argon, it would appear to be of some
advantage to try to reject pyroxene from rocks before dating.
4. Atmospheric Argon in Secondary Minerals
Mechanisms for adding air argon to rocks have not been
proposed in detail. Evernden et al. (1960) suggested air argon was
diffusing into feldspars in near-surface envixonments. They did
not discuss whether such conditions would also necessarily allow
radiogenic argon loss, or how widespread such conditions might exist.
McDougall (1966) had favored additions via adsorption, but the
amount of air argon physically adsorbed onto rock surfaces would
not be expected to increase with time, without some other concurrent
change. In fact adsorption of ~rgon would not ~ppear to be a problem
at all from a purely theoretical viewpoint (Gregg and Sing, 1967;
~eBoer, 1968). McDougall (1971) has also linked incipient alteration /
t 'With larger air argon contents. It was this final possibility which
seemed most reasonable. Alteration is scrupulously avoided in K-Ar
dating, but earlier results show field additions in spite of this.
A brief study was made of some common alteration products, to see
if they would help explain field additions.
Calcite is an alteration product whose presence, since
124
it is formed at low temperatures and does not contain significant
potassium, should not affect the accuracy of the age determination.
A chunk of recrystallized' calcite from the Waimanalo quarry (crystal
size lxlx4 II'..m ) gave about 80x10-? cc/g air argon. Lippolt and Gentner
(1962) found 10 and 150xl0-? cc/g in two mollusk shells (also calcium
carbonate) and later (Lippolt and Gentner, 1963) reported 60-?..60xl0-7
cc/g in calcite from limestone.
Hematite is a common alteration product. It is similar
to magnetite which has recently been shown (Lancet and Anders, 1973)
to have an incredibly high capacity to dissolve argon, 3.6x10-?.. cc/g
(at PAr = 0.01 atm)! While the same solubility measurements have not
been made for hematite it must certainly be treated with suspicion. A
sample of hematite (rust) scraped from an iron surface and washed on a
325 mesh screen to remove dust sized particles gave ~6oxJ.o-7 cc/g.
Zeolites are an entire category of secondary products,
vhich because of their cage-like structures are particularly suited
for air argon containment. Studies by Barrer and Vaughan (1971) showed
that sodalite and cancrinite had sites for as much as 40-50 cc/g and
they were able to fill over half of them! The argon located in such
sites was only removable at temperatures over 500°c. A mixture of
naturally occurring zeolites (phillipsite, chabazite, analcime, Hay
and Iijima, 1967) taken from tuff material at Hanauma Bay gave
4000 and 5000xJ.o-7 cc/g in replicate analyses, even after a bakeout
of at least 24 hours at 250°c during which extensive degassing was
observed. Clearly, zeolites with such levels of air argon would be
disastrous in a young sample being dated, even if they were present
125
in very slight concentrations.
A brief word concerning the formation of zeolites appears
to be in order, in view of their potential importance. The two common
requirements for effective zeolitization are glass {feldspar and
nepheline to a lesser extent) and an alkaline aqueous solution (Hay,
1966). Sudo and Matsuoka (1959) were able to form zeolites from glass
tuff material with NaOH solutions in the lab. Zeolites are particularly
abundant in tuff and ash deposits with their abundance o:f glass.
Alkaline solutions are produced by the percolation of ground ya.ter down
through ordinary volcanic rocks and sea \.18.ter also has an ideal pH for
zeolitization. Prime locations for zeolite formation then are around
tuff or ash beds, in lava that is or has been submarine, and in lava
from thick exposures where the pH of percolating ya.ter may have been
high.
Noble (1969) found only 3.9xl0-? cc/g in iddingsite, a
common product of deuteric alteration and oxidation of olivine.
Clay minerals are another class of alteration products.
They have been examined in other studies 'With regard to their
suitability for K-Ar dating of sediments. An exhaustive check of
all clay minerals -was not made, but air argon contents of l00-
200xl0-7 cc/g seem common {Evernden et al., 1961; Hurley, 1966).
In general, a wide range of air argon contents would
be expected in any alteration product. It would depend on the
temperature and speed of formation, and the availability of argon
·126
relative to other contaminants such as Yater. It would be difficult
to estimate the degree of alteration that may have taken place
before various analysts would reject the sample. No doubt the range
is large and depends on the importance of the sample as well.
If an alteration product with the air argon content of the zeolites
analyzed in this study was distributed evenly over the surface of
a mineral with a grain size of 1 mm cubes, a layer only a few tenths
of one micron thick would give the sample JxJ.o-7 cc/g atmospheric
argon. It can be seen from this calculation that any attempt to
completely avoid the possibility of field added argon must make
a thorough check of the surfaces; not for adsorption, but for
alteration products.
Indeed when one thinks of metals such as aluminum and
the greater stability and rapid formation of the oxide in air,
the possibility of drawing an analogy is almost irresistable.
Primary silicate minerals are similarly less stable in air than
more· oxidized compounds. A thip protective coating of some
alteration product might exist on many minerals. Work with the
~unar samples may illustrate the point. Holmes et al. (1973)
and Cadenhead et al. (1973) have reported that exposure of lunar
samples to the Earth's atmosphere and especially water vapor has
caused irreversible but ill-defined changes in their surfaces.
This type of alteration in terrestrial rocks may be pivotal in
adding atmospheric argon.
When the magnitude of the air argon contents of alteration
127
products is compared with the amount of air argon that typically
appears to be added in the field, one need only require a maximum
of a few percent alteration to generate the additions, and much
less than this at least for some types of zeolitic alteration.
Even the upper value is not an unreasonably high degree of altera
tion, although it would certainly be detectable in thin section.
The mechanism of air argon additions via high air argon contents
in products of incipient alteration is substantiated.
C. REEXAMINATION OF LITERATURE DATA ON AIR ARGON
Using the ideas developed from the results of the present
work, earlier important studies of air argon were reexamined to
determine if some of the apparent conflicts might be explained.
The results of Evernden and Curtis (1965) showed that
as much as 90% of the atmospheric argon could be removed from
feldspar mineral concentrates by HF etching. They attributed
the reduction to removal of surface layers from the feldspars
which were collected from tuff in Olduvai Gorge. Hay (1963) has
discussed the extensive zeolitization of these exposures. Since
zeolites have been sho'Wll to sometimes have extremely high air argon
contents and are soluble in acid, it appears likely that at least
some if not all of the reduction Yas the result of zeolite dissolution
rather than feldspar surface removal. The noted removal of detrital
glass also could have caused the air argon reduction. The success
of HF etching would in general depend on the type of low level
contaminants rather than the nature of the major mineral being etched.
128
The data of McDougaJJ. (1966) has been referred to a
number of ti.mes. He interpreted it to show air argon additions via
adsorption from crushing in the lab. The vhole rock samples 'With
low air argon contents were from young mafic rocks. Most of them
were from the Hawaiian Islands and less than 5 MY old. The pyroxene
and plagioclase mineral separates by contrast were mainly on samples
over 100 l.fY old. The possibility of field additions causing the
untreated mineral separates to have higher air argon contents rather
than lab handling "Wa.S not considered. On the basis of the present
study this possibility seems more than a little bit likely.
McDougall {personal communication, 1974) has agreed that adsorption
probably "Wa.S not the best explanation for these results.
Diffusion data on air argon has been somewhat difficult
to explain. Evernden et al. (1960) labeJJ.ed as a surface component
air argon that was released at lower temperatures than radiogenic
argon. This study vould suggest that this surface component is not
held. by a strange type of adsorption, but is argon 'Within the lattice
of a thin surface layer of some alteration product. The diffusion
of argon out of such systems vould require considerably more energy
than to remove an adsorbed species, but would be likely to require
less energy than for argon within the matrix of a higher melting
primary mineral grain. Very high temperature release of air argon
observed by Lanphere and Dalrymple (1971) could be from throughout
the primary minerals as they suggest, but some could also be located
129
in alteration products that may be as retentive as the primary
minerals• Presently the retentive properties of secondary minerals
are unknown.
The air argon additions that Gramlich (1970) found upon
crushing augite from Salt Lake Crater were greater and occurred on
much larger particle sizes than in this study. He reported air
argon contents ranging .from 3.Jxlo-7 cc/g (42-60 mesh) up to
27xJ..0-7 cc/g (1-10.fL). Since tuff material comprises the primary
matrix at Salt Lake, the possible occurrence of zeolitic or other
alteration product contamination seemed possible. Particularly,
· the crater area has much more calcite of a ground-water origin
than other volcanics of the Honolulu Series (O'Neill et al., 1970).
A leftover portion of the 100-150 mesh size from Gramlich•s study
was treated with 1% HNo3• A stereomicroscopic comparison indicated
that some deposits had dissolved. The air argon content of this
size was reduced from 5.7 (Gramlich, 1970) to 2.1%0.Jxl0-7 cc/g.
The reduction Yas significant and verified that alteration products
can be concentrated into small particle sizes by crushing. Their
S!Jlall size, lack of hardness, and surface location make them much
more likely to wind up crushed finer than the primary minerals.
Baksi (1972) reported a fractionated air argon component
that was released on moderate crushing in some basalt samples.
He has just recently (Baksi, 1974) attributed the removable component
to field added air argon which he believes may be located in altera
tion products (mainly clay minerals) comprising less than 5% of the
130
rocks. This is in striking agreement with the results of this
study. The relatively large amounts of "loosely held" air argon,
up to 550xl0-7 cc/g, implies that the air argon content of these
alteration products must have been very ln.rge.
D. LOW LEVEL CHIDRIDE CONTAMINATION
The most disappointing aspect of this research vas caused
by chloride contamination and the implication of unseen chloride ·
contamination.
1. Detectable Chloride
When the mass spectrometric check- for chloride at mass
35 ws added to the analysis procedure, chloride contamination ws
not considered likely. The gettering step \Tith the titanium
sublimation pump should getter HCl very effectively. However
40/36 ratios lower than the value for pure air argon were noted in
a number of samples and it was felt that the formality of a routine
check for chloride would bolste~ the argument for real anomalous
ratios.
However in a number of samples a barely detectable 35
peak ws observed. The samples (from Hanauma Bay) which showed the
contamination had no other peculiar characteristic which indicated
that they vere abnormal. The gettering criterion at the time vas
to getter until the pressure ws a minimum. For sample weights
of 2-.3 grams this might only take 20-30 minutes, and 40-50 minutes
vere often used, the extra time being required to be sure that the
pressure was at a minimum. Because of detectable chloride in a few
131
samples gettered in this manner, the gettering time was increased..
The minimum pressure was a necessary but not suf'ficient criterion
to indicate the complete gettering of chloride. The common gettering
time 'WB.S increased to 60 and then to at loast 75 minutes.
It is felt that the problem of lack of complete removal
may be related to the polar nature of the HCl molecule. Like water,
its polarity should allov it to be adsorbed rather strongly. This
would imply that its movement about in the vacuum system would be
much slower, because it 'WOuld spend relatively long periods of time
adsorbed. on surfaces (DeBoer, 1968). The removal probably is
limited more by this slow diff'usion process than by the reaction
with titanium. The longer gettering times have removed chloride
well enough so that it is not detected at mass 35.
2. Undetectable Chloride Contamination
The area of undetectable chloride contamination at first
sounds like a misnomer. If it isn't detectable, how could it still
be a problem? The answer lies in what will be called the contam
ination ratio; that is the ratio of H35c1/35c1 response in the
1!18-SS spectrometer. McLafferty (1967) gave a value of 100/12
(=8.J) and another reference spectra book (Conru and Massot, 1966)
had a similar value of 1000/80 (=12.5). Since the 35c1 peak is a
fragment, the precise contamination ratio might be expected. to vary
among different mass spectrometers because of differences in ion
source arrangements. The contamination ratio could be very impor-
tarit any time it is greater than unity. This situation would mean
that there would be a finite range of chloride contamination (as HCl)
132
which would be too small to be detectable at mass 35, and yet
would be · positively interfering at mass 36. The mass 37 chloride
fragment peak must alvays be smaller than the 35 peak, and the
38 ~7c1 peak will be hidden by the much much larger argon 38
spike peak. The range of concern for this type of contamination
vould depend on the sample size, mass spectrometer sensitivity,
and of course the exact contamination ratio.
The possible effect on age-dating may be seen from the
folloYing illustration: Assume that the chloride contamination in
the mass spectrometer is about 0.15 mv at mass 35 and that the
· noise level of 0.10 mv prohibits positive detection. A contamin
ation ratio of 10 would mean that 1.5 mv of the 36 peak would be
undetectable chloride contamination and would be mistakenly assumed
to be atmospheric argon 36. The atmospheric argon correction of
295.5 times the 36Ar vould incorrectly mask 490 mv of radiogenic
argon. If the sensitivity of the mass spectrometer was equal to
. 4 that of the one here at the outset of this research, 5.4xlO cc
of radiogenic argon would be "lost". To finish the horror story,
if this was the argon from a 3 gram sample with 1% K, it would
appear to be 4.5 MY too young!
The picture can change pretty rapidly 'With a lower
contamination ratio and better sensitivity. It is important to
try not to overemphasize what is only "possible", but at the same
time the potential problem should not be swept under an 11unlikely11
rug. The possibility of undetectable chloride contamination has
133
not been discussed in the literature.
A crude attempt was made to determine the contamination
ratio for this instrument·. The Hanauma Bay samples in which mass
35 was detected, albeit only barely in most cases, were used.
A real 40/36 ratio equal to the air value was assumed. Then the
observed decrease below this value was assumed to be the result of
the chloride contamination. The calculated contamination ratios
ranged from 1.5 to .4.3 and averaged 2.5%0.8 for five determinations.
This value should be considered a first order approximation only,
and is definitely not meant as a proof that the contamination ratio
could not be higher. Using this estimate, as -much as 5x10-ll cc
113611 per analysis could be contributed from HCl before detection,
even with the improved sensitivity.
The uncertainties introduced by the possibility of an
undetectable contaminant cause justifiable suspicion on analyses
with small radiogenic argon components. In the author's opinion
the nev gettering procedures ar~ on probation until further samples
have been run by someone which challenge the usual assumptions;
that is samples with a low air argon content and a very young age.
Since the problem is undetectable in a single sample, a recommended
procedure would be to run duplicates of young samples and use
different gettering times. Apparently older ages corresponding to
longer gettering times -would imply a chloride problem.
The problem of undetectable chloride in virtually all
previous age-dating studies would have remained just that. In
134
older samples slightly too young ages would be unnoticed or
attributed to argon loss. Even in young samples unless the at
mospheric argon contamination is very low, any small excess 36
would be masked. The magnitude of the problem is easily large
enough to potentially explain five of the six samples 'W'ith "excess"
argon 36 found by Dalrymple (1969) and Krummenacher (1970). This
does not mean that it is the explanation however, as both Dalrymple
(personal communication, 1973) and Krummenacher (personal commun
ication, 1973) feel that their gettering procedure removed all of
the chloride.
Another potential source of chloride contamination was
pointed out by Damon (personal communication, 1974). He mentioned
that ungettered hydrogen reacts in the mass spectrometer 'W'ith some
chlorine containing compound on the hot tungsten filament to produce
HCl. The chloride is apparently a residual component from the
manufacturing process. A hydrogen peak of a few hundred millivolts
vhich rapidly decreased, was noted in this system for samples even
'W'ith extra gettering. Most of the hydrogen certainly was not
forming HCl since the 35 peak did not even become detectable during
any scan. However a small amount of H35c1 could have been formed
undetectably in situ in the mass spectrometer. To avoid this
potential problem, ungettered H2 was pumped out of the system by
the ion pump. This could be done without loss of argon after the
argon had been collected on the activated charcoal, since the
hydrogen was not adsorbed. This procedural change was made only
135
for the very final sample analyses.
The question of undetectable chloride contamination,
particularly with regard to the speed of gettering and the con
tamination ratio, clearly needs further study.
E. 40/36 RATIOS AND EXTRANEOUS ARGON
1. Mass Discrimination Determinations
The mass spectrometer has sholo111 a slight but persistent
discrimination against lower masses. Gramlich•s (1970) air argon
40/36 ratios were near 302. Results of analyses of atmospheric
argon in this study which span over one year are given in Table XXII.
In view of the evolution of analysis procedures during this time
period, the range is not considered unsatisfactory. The gradual
trend to'WB.rds a larger discrimination seems to be real.
2. Hanauma Bay Dike and Flow
The Hanauma Bay samples were run 'While the chloride and
gettering problem 'WB.S being evaluated. The observed 40/36 ratios
·are summarized in Table XXIII. The samples 'With high air argon
~ontents had 40/36 ratios equivalent to the air argon spikes,
vhich was reasonable. However the samples in which the air argon
contamination was low tended to have low 40/36 ratios even when
chloride was not detected.
One possible explanation was that the mass discrimination
of the mass spectrometer changed with the amount of argon in the
tube. Three small air argon spikes were run to test this idea.
They were prepared by expanding a regular spike into the extraction
136
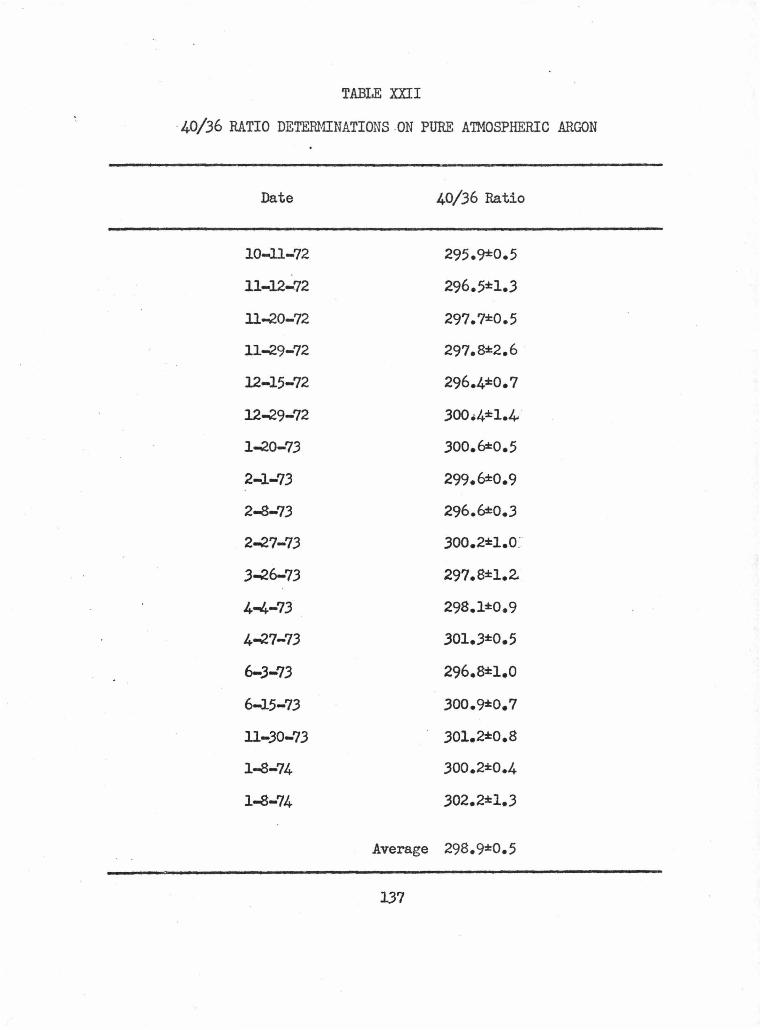
TABI.E xnr
·40/36 RATIO DETERMINATIONS .ON PURE ATMOSPHERIC ARGON
Date 40/36 Ratio
10-11-72 295.<)%0.5
11-12-72 296.5::t:l.3
11-20-72 297.7*0.5
11-29-72 297.8±2.6
12-15-72 296.4±0. 7
12-29-72 300.4±1.4
1-20-7.3 300.6±0.5
2-1-73 299.6±0.9
2-8-73 296.6±0.3
2-27-73 300.2±1.0:
3-26-73 297.8±1.2.
4-4-73 298.l::t:0.9
4-27-73 301.3*0.5
6-3-73 296.82:1.0
6-15-73 300.92:0.7
ll-30-73 301.2::t:0.8
1-8-74 300.2*0.4
1-8-74 302.2::t:l • .3
Average 298.9*0.5
137
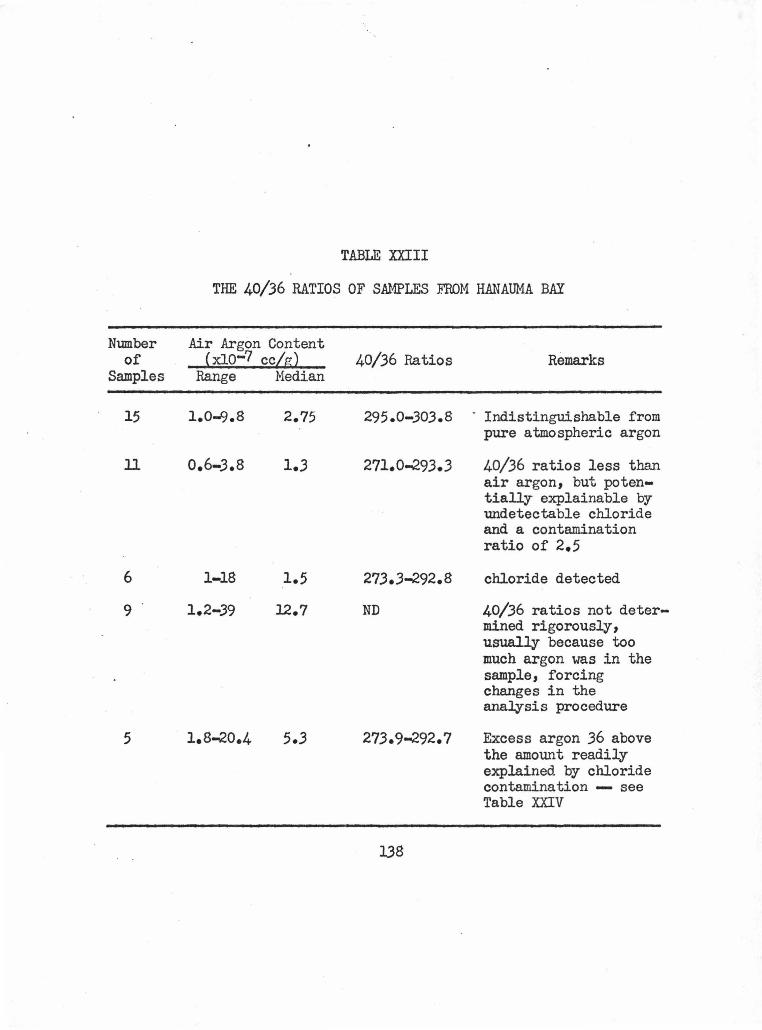
TABLE IDII
THE 40/36 RATIOS OF SAMPLES FROM HANAUMA BAY
Number Air Argon Content of (xio-7 ccigl 40/36 Ratios Remarks
Samples Range Median
15 1.0-9.8 2.75 295.0-303.8 · Indistinguishable from pure atmospheric argon
11 o.6-3.8 1.3 271.0-293.3 40/36 ratios less than air argon, but poten-tially explainable by undetectable chloride and a contamination ratio of 2.5
6 1-18 1.5 273.3-292.8 chloride detected
9 1.2-39 12.7 ND 40/36 ratios not deter-mined rigorously, usually because too much argon was in the sample, forcing changes in the analysis procedure
5 1.8-20.4 5.3 273.9-292.7 Excess argon 36 above the amount readily explained by chloride contamination -- see Table IDV
138
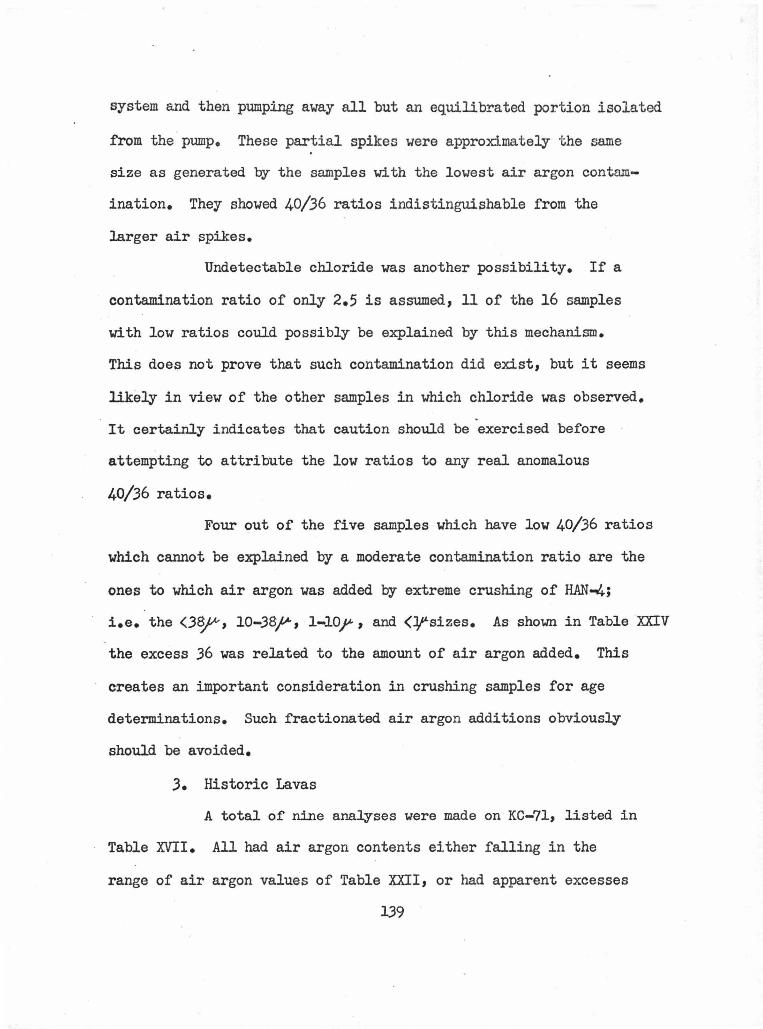
system and then pumping away all but an equilibrated portion isolated
from the pump. These partial spikes were approximately the same
size as generated by the samples with the lowest air argon contam
ination. They showed 40/36 ratios indistinguishable from the
larger air spikes.
Undetectable chloride was another possibility. If a
contamination ratio of only 2.5 is assumed, 11 of the 16 samples
'With low ratios could possibly be explained by this mechanism.
This does not prove that such contamination did exist, but it seems
likely in view of the other samples in which chloride was observed.
It certainly indicates that caution should be exercised before
attempting to attribute the low ratios to any real anomalous
40/36 ratios.
Four out of the five samples which have low 40/36 ratios
which cannot be explained by a moderate contamination ratio are the
ones to which air argon vas added by extreme crushing of HAN-.4.;
i.e. the <3~, l0-38f.t', 1-lOj", and (Jf"sizes. As shown in Table XXIV
the excess 36 vas related to the amount of air argon added. This
creates an important consideration in crushing samples for age
determinations. Such fractionated air argon additions obviously
should be avoided.
3. Historic Lavas
A total of nine analyses were made on KC-71, listed in
Table XVII. All had air argon contents either falling in the
range of air argon values of Table XXII, or had apparent excesses
139
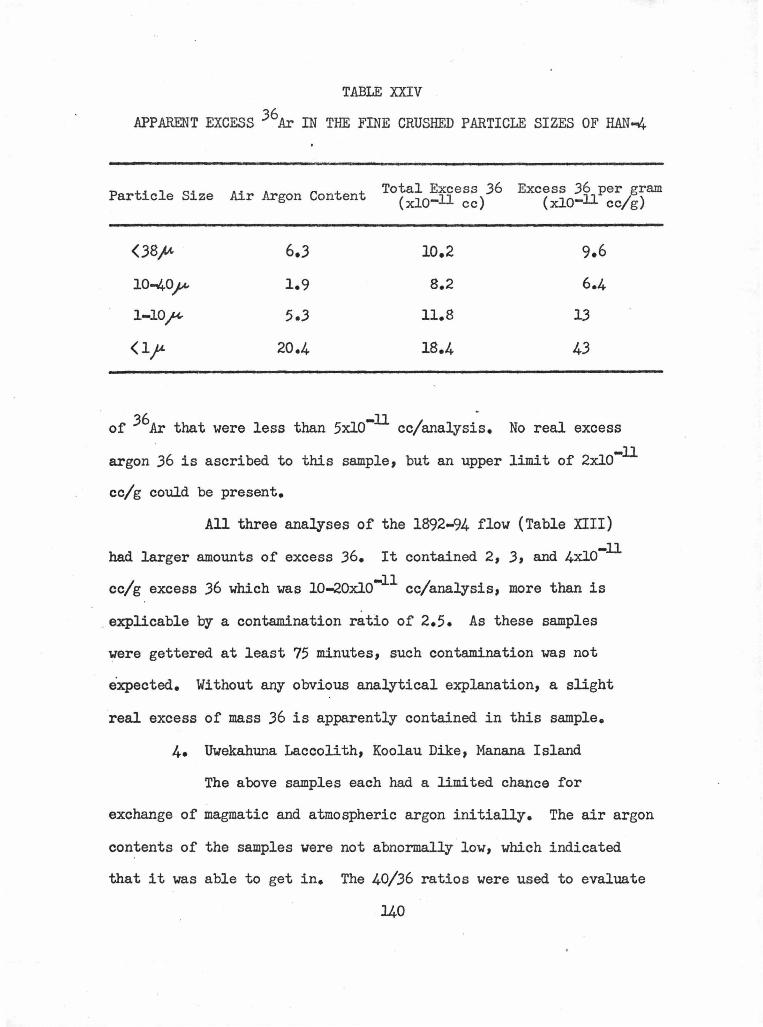
TABLE XXIV
APPARENT EXCESS 36Ar IN THE FINE CRUSHED PARTICLE SIZES OF HAN-4
Particle Size Air Argon Content Total Excess 36 (xio-11 cc)
Excess 36 per gram (xlo-11 cc/g)
(38,,.« 6.3 10.2 9.6
10-40)"' 1.9 8.2 6.4
1-10.f" 5.3 11.8 13
(l? 20.4 18.4 43
. 36 -ll / of Ar that were less than 5xl0 cc1 analysis. No real excess
argon 36 is ascribed to this sample, but an upper limit of 2xl0-ll
cc/g could be present.
All three analyses of the 1892-94 flow {Table XIII) -ll had larger amounts of excess 36. It contained 2, 3, and 4xl0
cc/g excess 36 which was 10-20xl0-11 cc/analysis, more than is
_explicable by a contamination ratio of 2.5. As these samples
were gettered at least 75 minutes, such contamination was not
expected. Without any obvious analytical explanation, a slight
real excess of mass 36 is apparently contained in this sample.
4. Uwekahuna Laccolith, Koolau Dike, Manana Island
The above samples each had a limited chance for
exchange of magmatic and atmospheric argon initially. The air argon
contents of the samples were not abnormally low, which indicated
that it was able to get in. The 40/36 ratios were used to evaluate
140
the effectiveness of magmatic argon escape.
Uwekahuna laccolith had .a 40/36 ratio within the air
argon range. No excess 40 or 36 was indicated.
The Koolau dike had substantial amounts of excess argon
40, as have other dike samples of Damon et al. (1967). A potassium
concentration of 0.94*0.01% was determined. Apparent ages of 2.1
to 6.9 MY were obtained· from the analyses listed before in Table XIV.
Older apparent ages corresponded vith high air argon contents. The
alteration which added the air argon may well have occurred
deuterically, that is as the dike cooled. It is entirely possible
. that much of the excess argon was released from the crystallizing
magma only to be incorporated into an alteration product nearby.
A lava bomb sample was collected from the tuff material
on Manana Island, one of the Honolulu Series Volcanics. The potassium
content of l.00*0.02% and a thin-section examination indicate that
the bomb is not a block of earlier Koolau lava. The specimen has
many · small vesicles which are partially filled with a zeolitic
alteration product. An analysis of a block sample gave 3.3*0.lxl0-7
cc/g air argon and an apparent age of l.O MY which is probably much
too old (Gramlich et al., 1971; Winchell, 1947). Nitric acid
treatment of a 42-100 mesh portion gave 2.0:0.lxlo-7 cc/g and
0.3 MY. The age is still older than expected and complete initial
degassing of the bomb may not have occurred~
The utility of a 1% nitric acid treatment may extend
beyond removal of an added air argon component. In both the Koolau
dike and the bomb from Manana Island, the amount of excess argon
and air argon was reduced after treatment, albeit incompletely.
Also it may offer an indication of the presence of excess argon
before the analysis. In these two samples where excess argon was
observed, H2s was released during the acid cleaning. The odor is
easily detectable and was absent during treatment of more thoroughly
degassed samples. The release of sulfur gases may indicate that
the sample was not thoroughly .degassed initially. The opportunity
for both detection and removal of excess argon is a strong incentive
to acid treat more samples.
5. Hilina Pali
The Hilina Pali on the island of Hawaii exposes over
1000 feet of thin lava flows from Kilauea. The Hilina Series
comprises the lower 800 feet (Stearns and Macdonald, 1946; Macdonald
and Abbott, 1970). It is capped and separated from the Puna Series
above by a deep ash layer called the Pahala ash, Yhich in separate
places vas dated by the 14c method at 10,000 and 17,000 years
(Rubin and Berthold, 1961). Samples were collected from most of
t~e exposed flows from the type location as described by Stearns
and Macdonald (1946). The samples are a stern test of the K-Ar
age dating method • . The stratigraphy makes the relative ages
unambiguous. The rapid extrusion of Hawaiian lavas from any single
volcano (McDougall, 1964) combined with the upper age limit of
only 17,000 years has created a good supply of very young rocks.
Five analyses made after the improved gettering
142
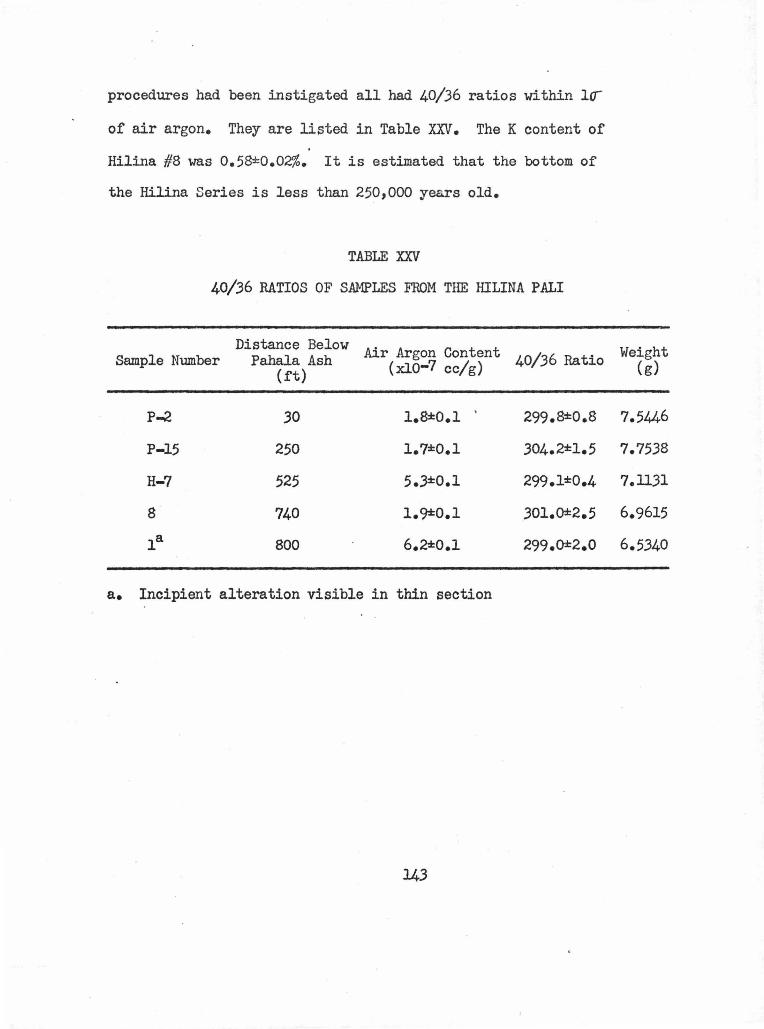
procedures had been instigated all had 40/36 ratios within 10-
of air argon. They are listed in Table x:x:v. The K content of
Hilina #8 was 0.58±0.02%. It is estimated that the bottom of
the Hilina Series is less than 250,000 years old.
TABLE X:X:V
40/36 RATIOS OF SAMPLES FROM THE HILINA PALI
Distance Below Air Argon Content Sample Number Pahala Ash 40/36 Ratio (ft) (xlo-7 cc/g)
P-2 30 1.8±0.l . 299.8±0.8
P-15 250 1.7:1::0.1 304.2±1.5
H-7 525 5.3%0.l 299.1±0.4
8 740 1.9±0.1 301.0:l::2.5
la 800 6.2:1:0.1 299.0:l::2.0
a. Incipient alteration visible in thin section
143
Weight (g)
7.5446
7.7538
7.ll31
6.9615
6.5340
IV. SUMMARY AND CONCLUSIONS
The capability for isotopically ·analyzing argon in rocks has
been improved through a series of changes which pervade the analysis
equipment and procedure. Sample heating and gettering times were
lengthened. The sensitivity of the mass spectrometer was increased
and the scanning procedure simplified. A new equation for estimating
the precision of a single analysis was derived which is more
applicable to samples with a large fraction of atmospheric argon
contamination.
The contributions of various possible times of addition and
· locations of atmospheric argon have been evalUa.ted and a coherent
overall pattern has emerged. The melt may dissolve at least
12-60xlo-7 cc/g atmospheric argon before cooling. The processes of
crystallization and cooling combine to exsolve most of the argon
back into the atmosphere. The initial content of fresh crystalline
lavas is normally less than 2xlo-7 cc/g. Vesiculation in crystalline
rocks and its attendant increase in surface area does not inherently
produce high air argon contents; however vesicles in quenched
glass do contain trapped air argon. Atmospheric argon is added in
widely varying amounts to the surfaces of the rocks in the field
as a result of incipient alteration. Alteration products have very
high air argon contents, ranging up to at least 4000-5000xl0-7 cc/g
for some zeolites. They therefore need to be formed in only minor
quantities to contribute significantly to the total air argon
content. Because of the practical problem of insuring that all
144
such altered material has been removed from any surface, the importance
of field .additions on samples with low air argon contents is difficult
to evaluate.
Atmospheric argon is not evenly distributed throughout the rocks.
In a single intrusive sample, augite pyroxene had 6-10 times more
air argon than either plagioclase feldspar or olivine.
The occurrence of a field added component of air argon located
in alteration products facilitates explaining a number of apparent
discrepancies and difficulties in the literature.
In the laboratory, sample handling is not likely to cause any
. .f'urther additions. In fact, the technique of moderate crushing has
been show.n to remove some alteration related atmospheric argon.
Acid etching with HF is effective sometimes, but it is difficult to
avoid having insoluble fluoride salts contaminate the sample. Nitric
acid cleaning is better because it creates no insoluble residue, it
dissolves many secondary products effectively and it therefore
reduces air argon contamination. It also may allow detection and
some correction for excess argon by noting when H2s is released
upon treatment. Crushing and nitric acid treatment are recommended
for dating all young rocks, as opposed to the accepted procedure of
using large chunks or blocks. The advantages in addition to those
just mentioned include a reduction in errors due to potassium
inhomogeneity. Also, in coarse grained rocks potassium bearing
minerals could be concentrated and potassium poor minerals or those
with high air argon contents could be rejected.
145
Very extensive crushing can add significant amounts of air argon
contamination. Particle sizes on the order of 325 mesh are normally
required. The addition is related to the crushing technique, and
is not a result of adsorption on newly formed surfaces. It may be
avoided by crushing wet rather than dry samples and since the
added component appears to be fractionated such wet crushing is
recommended. Adsorption has been shown not to contribute
significantly to the air argon content.
A new area of mass spectrometric interference by HCl has been
described. The unfavorable ratio of H35cl/35c1 response means
that chloride contamination may escape detection while still present
in large enough quantities to induce a noticeable error in argon
ratio determinations. Such an interference was observed and ' new
gas purification procedures were instituted to eliminate the problem.
Nine different samples which are too young to have detectable
radiogenic argon were ana.lyzed and eight had 40/36 ratios indis
tinguishable from air argon. One had a small (NJxlo-11 cc/g)
excess of mass 36.
146
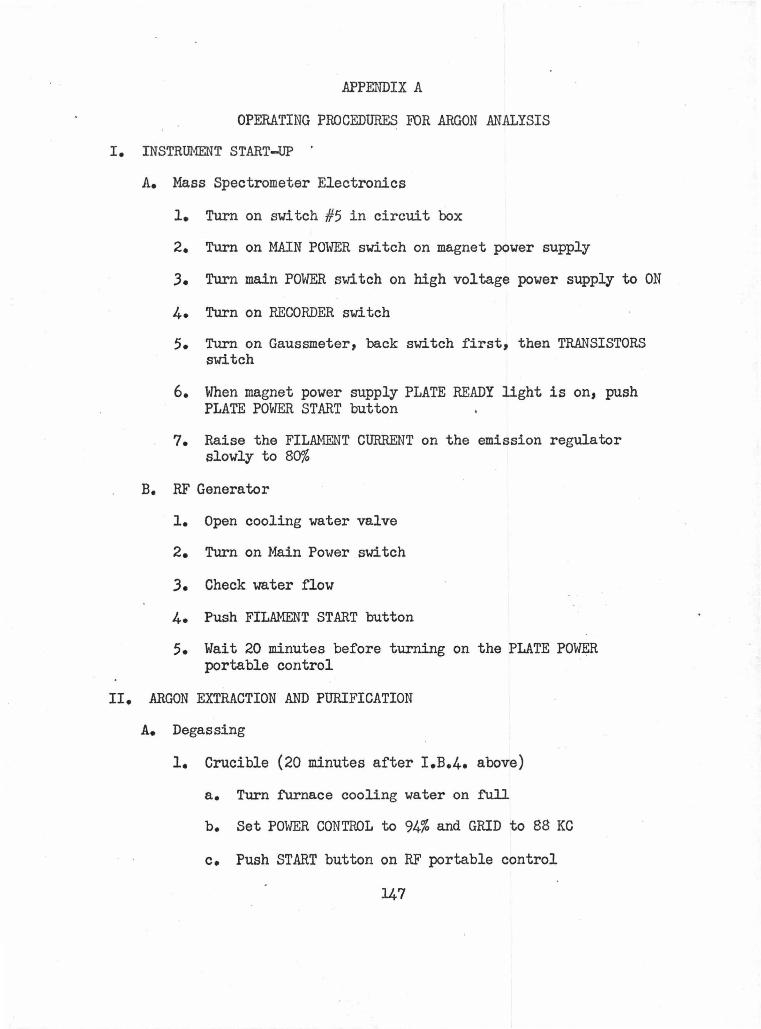
APPENDIX A
OPERATING PROCEDURES FOR ARGON ANALYSIS
I. INSTRUMENT START-UP .
A. Mass Spectrometer Electronics
1. Turn on switch #5 in circuit box
2. Turn on MAIN POWER s"1itch on magnet power supply
3. Turn main POWER sl<ltch on high voltage power supply to ON
4. Turn on RECORDER sl<ltch
5. Turn on Gaussmeter, back s"1itch first, then TRANSISTORS s"1itch
6. When magnet power supply PLATE READY light is on, push PLATE POWER START button
7. Raise the FILAMENT CURRENT on the emission regulator slowly to 80%
B. RF Generator
1. Open cooling water valve
2. Turn on Main Power sl<ltch
3. Check water flow
4. Push FILAMENT START button
5. Wait 20 minutes before turning on the PLATE POWER portable control
II. ARGON EXTRACTION AND PURIFICATION
A. Degassing
1. Crucible (20 minutes after I.B.4. above)
a. Turn furnace cooling water on full
b. Set POWER CONTROL to 94% and GRID to 88 KC
c. Push START button on RF portable control
147
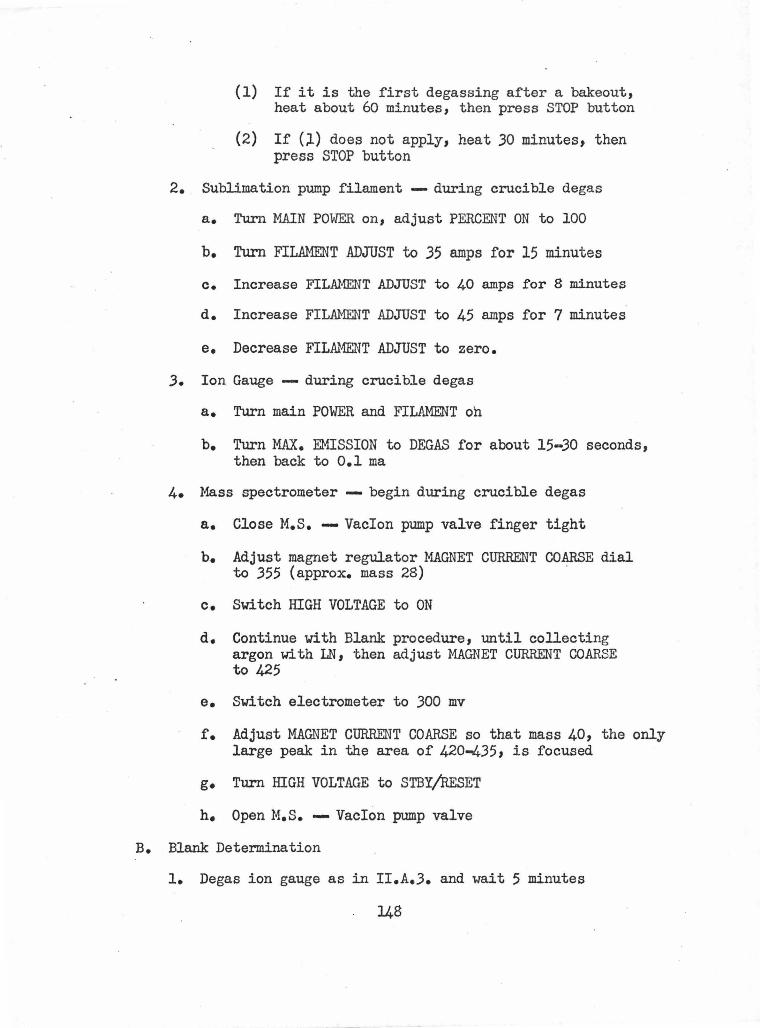
(1) If it is the first degassing after a bakeout, heat about 60 minutes, then press STOP button
(2) If (~) does not apply, heat 30 minutes, then press STOP button
2. Sublimation pump filament -- during crucible degas
a. Turn MAIN POWER on, adjust PERCENT ON to 100
b. Turn FILAMENT ADJUST to 35 amps for 15 minutes
c. Increase FILAMENT ADJUST to 40 amps f'or 8 minutes
d. Increase FILAMENT ADJUST to 45 amps for 7 minutes
e. Decrease FILAMENT ADJUST to zero •
.3. Ion Gauge - during crucible degas
a. Turn main POWER and FILAMENT oh
b. Turn MAX. EMISSION to DEGAS for about 15-30 seconds, then back to O.l ma
4. Mass spectrometer -- begin during crucible degas
a. Close M.s. -- Vacion pump valve finger tight
b. Adjust magnet regulator MAGNET CURRENT COARSE dial to 355 (approx. mass 28) ·
c. Switch HIGH VOLTAGE to ON
d. Continue with Blank procedure, until collecting argon with LN, then adjust MAGNET CURRENT COARSE to 425
e. Switch electrometer to 300 mv
f. Adjust MAGNET CURRENT COARSE so that mass 40, the only large peak in the area of 420~35, is focused
g. Turn HIGH VOLTAGE to STBY/RESET
h. Open M.s. -- Vacion pump valve
B. Blank Determination
1. Degas ion gauge as in II.A.3. and wait 5 minutes
148
2. Note pressure and turn ion gauee FILAMENT off
3. Close extraction system -- Vacion pump valve (35 ft-lbs)
4. Wait for time' required to add tracer spike -- 8 minutes
5. Heat crucible (and begin gettering, step 6)
a. One minute on, one minute off, two times
b. Then heat 20 minutes
6. Gettering (moderately clean samples, up to 6 gramsl
a. Turn FILAMENT ADJUST to 45 amps for 7 minutes
b. Turn FILAMENT ADJUST to 42 amps for 8 minutes
c. Turn FILAMENT ADJUST to 40 amps for 40 minutes
d. Turn FILAMENT ADJUST to 35 amps for 20 minutes
7. Turn ion gauge FILAMENT on momentarily to record pressure
8. Put LN on charcoal finger and collect 40 minutes (finish M.s. degas, step II.A.4.)
c. Sample Determination
1. Close furnace -- gas purification section valve
2. Drop sample
3. Open furnace -- gas .purification section valve
4. Degas ion gauge, wait 5 minutes, record pressure and turn off ion gauge
5. Close extraction system -- Vacion pump valve
6. Add argon 38 tracer
a. Close 38 top valve (TV)
b. Open 38 bottom valve (BV) exactly 3 minutes -caution, valves sometimes need aid to open fully
c. Close 38 BV
d. Open, 38 TV for exactly 5 minutes
149
e. Close TV
7. Heat crucible {and begin gettering, step 8) as in blank if possible
a. If a glow discharge occurs, shut off RF for several minutes and place LN on charcoal finger; if glow discharge occurs again upon heating, put LN on cold trap and maintain for duration of sample run
b. Remove LN from charcoal finger no more than 10 minutes after glow discharges cease
c. Watch melting in mirror, if sample melts too violently turn furnace off as required
d. If melt lake has bubbles unbroken after 10 minutes of heating, turn furnace off, let crucible cool until no glow is visible, then resume heating
8. Getter as in blank if possible
a. Check pressure after gettering at 42 amps, it should be less than l.xlo-5 torr - if it isn 1t, abandon blank gettering schedule and getter as required. This condition signifies a very gassy sample, and in all probability will not yield a good run anyway
b. Check pressure after gettering at 40 amps, it should be less than 5xl0-7 torr - if it isn't getter at 40 amps ten additional minutes, recheck pressure; if it hasn't decreased return to blank schedule, if it decreases continue gettering at 40 amps as required
c. Record pressure after gettering
9. Put LN on charcoal finger and collect 40 minutes
III. MASS SPECTROMETER ANALYSIS
A. Sample Expansion (after collecting argon for 40 minutes)
1. Open extraction system -- Vacion pump valve, start stop watch t = 0 sec
2. Close extraction system -- charcoal cold finger valve t = 2 min
3. Remove LN from charcoal cold finger
150
4. Turn getter FILAMENT ADJUST to zero
5. Close M.s. -- Vacion pump valve t = 3 min 30 sec
6. Open extraction system -- M.s. valve t = 4 mi 1 While argon is expanding into M.s., continue 'th step III.B
7. Close extraction system -- M.S. valve t = 11 min
8. Record pressure
9. Open extraction system -- charcoal cold finger valve
10. Start scan t = 12 min
B. Preliminary Mass Spectrometer Adjustment, during step III.A.6.
1. Plug in gauss probe and adjust the CALIBRATE knob so that the readout is 3.825 KG
2. Turn the magnet regulator SWEEP control to ON
3. Set the electrometer to 1 v for blank runs, 10 v for sample runs, and 30 v for mass discrimination runs
4. Adjust the chart paper so that the pen falls on a division
c. Scanning {mass spectrometer is focused on mass 40.)
1. Turn HIGH VOLTAGE to ON and the CHART switch on simultaneously
2. Scan up at SWEEP RATE + 1 MA/SEC until the 40 peak begins to decrease
3. Scan down at SWEEP RATE - 1 MA/SEC and the SWEEP INCREASE at 5 o'clock , back over the top of the mass 40 peak, record the emission regulator TRAP CURRENT
·4. Scan do'Wll at - 10 MA/SEC, and SWEEP INCREASE at 9 o 1clock
5. When the pen returns to the baseline, set the electrometer to the 38 peak attenuation; any low setting for blank (100 mv), 3 v for samples
6. Reduce scan rate to - 1 MA/SEC at 3.75 KG for blanks, at first appearance of the 38 peak for sample scans
?. Reduce $WEEP INCREASE to 3 o1clock for sample scans
151
8. Scan over the top of the 38 peak, set SWEEP INCREASE back to 9 o1clock, and scan down at - 10 MA/SEC to 3.65 KG
9. Continue scanhing doYn at - 1 MA/SEC and set the electrometer to the 36 peak attenuation, 10 mv for blanks, 100 mv for samples
10. Scan over the 36 peak top at SWEEP INCREASE between 12 and 2 o1clock, the slower speed whenever the noise 'Will limit the peak measurement
11. Set the SWEEP INCREASE back to 9 o1clock and record at least 30 seconds of 36 peak baseline
12.
13.
)4.
a. If it is the first set of peaks, set the electrometer on 10 mv, continue scanning to 3.55 KG to check for chloride contamination
b. If it is not the first set of peaks, and no 35 peak was observed the first time, step 11.a. may be omitted; if a 35 peak was observed or if it ws uncertain, mass 35 should be recorded in successive sets of peaks
Switch the electrometer to the 40 peak attenuation
Scan up at + 100 MA/SEC until the 38 peak is recorded
Continue scanning up at + 10 MA/SEC until the first appearance of the 40 peak, then scan up at + 1 MA/SEC
15. Repeat steps 2-14 until five sets of peaks are recorded after the TRAP CURRENT has stabilized
16. After completion of the final mass 40 peak, turn the SWEEP RATE to HOLD and the SWEEP control to OFF
17. Turn the CHART drive off and the HIGH VOLTAGE to STBY/RESET
18. Set the electrometer to 30 v
19. Unplug gauss probe
20. Open M.s. - Vacion pump valve
152
IV. MASS DISCRI11INATION DETERMINATION
A. Blank
1. Record pressure and turn ion gauge FILAMENT off
2. Close extraction system -- Vacion pump valve
3. Wait for time required to add tracer spike -- 8 minutes
4. Turn getter FILAMENT ADJUST to 40 amps for 5 minutes, then reduce to 35 amps
5. Put LN on charcoal finger and collect 40 minutes
B. Mass Bias Determination
1. Record pressure and turn off ion gauge
2. Close extraction system -- Vacion valve
3. Add an air argon spike
a. Close air argon top valve (TV)
b. Open air argon bottom valve (BV) exactly 3 minutes
c. Close BV
d. Open TV exactly 5 minutes
e. Close TV
4. Turn getter FILAMENT ADJUST to 40 amps for 5 minutes, then reduce to 35 amps
5. Put LN on charcoal finger and collect 40 minutes
V. SHUT DOWN
A. Mass Spectrometer Electronics
1. Turn emission regulator FILAMENT CURRENT to 68%
2. Turn magnet regulator MAGNET CURRENT COARSE dial to zero
3. Set electrometer on 30 v scale
4. Turn off RECORDER switch
153
5. Turn main POWER switch on high voltage power supply off
6. Turn off gaussmeter, TRANSISTORS first
7. Turn off switch #5 in the circuit box
B. RF Generator
1. Turn off RF main switch
2. After 10-20 minutes wait, turn off water supply to RF
3. Turn off Yater to furnace unless a sublimation pump filament is to be degassed overnight
154
BIBLIOGRAPHY
Abdel-l1onem, A., N. D. Watkins and P. w. Gast, 1971, Potassium-argon ages, volcanic stratigraphy, and geomagnetic polarity history of the Canary Islands: Lanzarote, Fuerteventura, Gran Canaria, and La Gomera, Am. J. Sci., 271, 490-521.
Abdel-Monem, A., N. D. Watkins and P. W. Gast, 1972, Potassium-argon ages, volcanic stratigraphy, and geomagnetic polarity history of the Canary Islands: Tenerife, La Palma, and Hierro, Am. J. Sci., 272, 805-825.
Aldrich, L. T. and G. w. Wetherill, 1958, Geochronology by radioactive decay, Ann. Rev. Nuclear Sci., 8, 257-298.
Alpert, D., 1953, New developments in the production and measurement of ultra high vacuum, J. Applied Phys., 24, 860-876.
Alpert, D. and R. s. Buritz, 1954, Ultra-high vacuum. II. Limiting factors on the attainment of very low press~es, J. Applied Phys., 25, 202-209.
Amaral, G., u. G. Corciani, K. KaYashita and J. H. Reynolds, 1966, Potassium-argon dates of basaltic rocks from Southern Brazil, Geochim. Cosmochim. Acta, 30, 159-189.
Armstrong, R. L., 1966, K-Ar dating using neutron activation for Ar analysis: granitic plutons of the eastern Great Basin, Nevada and Utah, Geochim. Cosmochim. Acta, 30, 565-600.
Armstrong, R. L., 1970, K-Ar dating using neutron activation for Ar analysis: Comparison with isotope dilution Ar analyses, Geochim. Cosmochim. Acta, 34, 233-236.
Armstrong, R. L., 1974, Personal Communication, from manuscript of R. L. Armstrong, w. P. Leeman, and H. E. Malde, K-Ar dating, Neogene volcanic rocks of the Snake River Plain, Idaho, to be published in Am. J. Sci.
Aziz-Ur-Rahman and I. McDougall, 1972, Potassium-argon ages on the Newer Volcanics of Victoria, Proc. Roy. Soc. Victoria, 85, 61-70.
Baksi, A. K., 1972, The age of the Picture Gorge basalts, Central Oregon, Geol. Soc. Am. Abstracts with Programs, 4 {no. 7), 441.
Baksi, A. K., 1973, K-Ar dating -- loading techniques in argon extraction work and sources of air argon contamination, Can. J. Earth Sci., 10, 1678-1684.
155
Baksi, A. K., 1974, Isotopic fractionation of a loosely held atmospheric argon component in the Picture Gorge basalts, Earth Planet. Sci. Lett., 21, 431-.4.38.
Baksi, A. K., ·n. York and' N. D. Watkins, 1967, Mountain geomagnetic polarity transition, 72, 62g9-6308.
Age of the Steens J. Geophys. Res.,
Barnes, I. L., 1963, An investigation of a new method for potassiumargon age determinations, Ph. D. Dissertation, University of Hawaii, 114 PP•
Barrer, R. M. and D. E. w. Vaughan, 1971, in sodalite and cancrinite crystals, 32, 731-743.
Trapping of inert gases J. Phys. Chem. Solids,
Bayard, R. T. and D. Alpert, 1950, range of the ionization gauge,
Extension of the low pressure Rev. Sci. Inst., 21, 571-572.
Bernas, B., 1968, A new method for decomposition and comprehensive analysis of silicates by atomic absorption spectrometry, Anal. Chem., 40, 1682-168p.
Brer~0on, 0~. R., 1970, Corrections for interfering isotopes in the Ar/ Ar dating method, Earth Planet. Sci. Lett., 8, 427-.4.33.
Brereton, N. R., 1972, A reappraisal of the 40Ar/39Ar stepwise degassing technique, Geoppys. J. R. astr. Soc., 27, 449-.4.78.
Burnett, D. s., H. J. Lippolt and G~.l..~· Wasserburg, 1966, The relative isotopic abundance of K"'" in terrestrial and meteoritic samples, J. Geophys. Res., 71, 1249-1269.
Cadenhead, D. A., B. R. Jones, W. G. Buergel and J. R. Stetter, 1973, Solar wind and terrestrial atmosphere effects on lunar sample surface composition, Proc. Fourth Lunar Sci. Conf. (Suppl. 4, Geochim. Cosmochim. Acta), 3, 2391-2401.
Carr, D. R. and J. L. Kulp, 1957, Potassium-argon method of geochronometry, Geol. Soc. Am. Bull., 68, 763-784.
Charlton, s. R. and A. E. Mussett, 1973, Crucible contribution to atmospheric contamination, in connection with K-Ar dating, Chem. Geol., 11, 237-241.
Charnell, J. F., 1971, Gel growth of large crystals of sodium A and sodium X zeolites, J. Crystal Growth, 8, 291.
Cherdyntsev, V. v. and Y. v. Shitov, 1967, Excess argon-36 in volcanic and post-volcanic gases, Geokhimiya, 5, 618-620.
156
Coleman, M. L., 1971, Potassium-calcium dates from pegmatitic micas, Earth Planet. Sci. Lett., 12, 399...t+.05.
Conru, A. and R. Massot, )966, Compilation of Mass Spectral Data, Heyden and Son Limited, London, p. 2B.
Cox, A., R. R. Doell and G. B. Dalrymple, 1963, Geomagnetic polarity epochs: Sierra Nevada II, Science, 142, 382-385.
Cox, A. and G. B. Dalrymple, 1966, Paleomagnetism and potassiumargon ages of some volcanic rocks from the Galapagos Islands, Nature, 209 1 776-777.
Cox, A. and G. B. Dalrymple, 1967, Statistical analysis of geomagnetic reversal data and precision of potassium-argon dating, J. Geophys. Res., 72, 2603-2614.
Cox, A., D. M. Hopkins and G. B. Dalrymple, 1966, Geomagnetic polarity epochs: Pribilof Islands, Alaska, Geol. Soc. Am. Bull. 77, 883-910.
Dalrymple, G. B., 1963, Potassium-argon dates of some Cenozoic volcanic rocks of the Sierra Nevada, California, Geol. Soc. Am. Bull., 74, 379-390.
Dalrymple, G. B., 19641 Potassium-argon dates of three Pleistocene interglacial basalt flows from the Sierra Nevada, California, Geol. Soc. Am. Bull., 75, 753-758.
Dalrymple, G. B., 1967, Potassium-argon ages of Recent rhyolites of the Mono and Inyo Craters, California, Earth Planet. Sci. Lett. 3, 289-298.
Dalrymple, G. B., 1969, 40Ar/36Ar analyses of historic lava flows, Earth Planet. Sci. Lett., 6, 47-55.
Dalrymple, G. B., 1971, Potassium-argon ages from the Pololu Volcanic Series, Kohala Volcano, Hawaii, Geol. Soc. Am. Bull., 82, 1997-2000.
Dalrymple, G. B., 1973, Personal communication.
Dalrymple, G. B. and K. Hirooka, 19651 Variation of potassium, argon, and calculated age in a late Cenozoic basalt, J. Geophys. Res., 70, 5291-5296.
Dalrymple, G. B. and M. A. Lanphere, 1969, Potassium-Argon Dating, w. H. Freeman and Co., San Francisco.
157
Dalrymple, G. B. and M. A. Lanphere, 1971, 40Ar/39Ar technique of K-Ar dating: A comparison with the conventional technique, Earth Planet. Sci. Lett., 12, 300-308.
Dalrymple, G. B., M. A. Lanphere and E. D. Jackson, 1974, Contributions to the petrography and geochronology of volcanic rocks from the Leeward Hawaiian Islands, Geol. Soc. Am. Bull., 85, 727-738.
Dalrymple, G. B. and J. G. Moore, 1968, Argon-4.0: Excess in submarine pillow basalts from Kilauea Volcano, Hawaii, Science, 161, 1132-1135.
Daly, R. A., 1911, Magmatic differentiation in Hawaii, J. Geol., 19, 298-317.
Damon, P. E., 1974, Personal communication.
Damon, P. E., A. w. Laughlin and J. K. Percious, 1967, Problem of excess argon-4.0 in volcanic rocks, in Radioactive Dating and Methods of Low-Level Counting, International .Atomic Energy Agency, Vienna, pp. 463-4-81.
deBoer, J. H., 1968, The Dynamical Character of Adsorption, 21nd Ed., Clarendon Press, Oxford, 240 pp.
Doell, R. R. and G. B. Dalrymple, 1973, Potassium-argon ages and paleomagnetism of the Waianae and Koolau Volcanic Series, Oahu, Hawaii, Geol. Soc. Am. Bull., 84, 1217-1242.
Dymond, J './.:1970, Excess argon in submarine basalt pillows, Geol. Soc. Am. Bull., 81, 1229-1232.
Engels, J. c. and c. o. Ingamells, 1970, Effect of sample inhomogeneity in K-Ar dating, Geochim. Cosmochim. Acta, 34, 1007-1017.
Evernden, J. F. and G. H. Curtis, 1965, The potassium-argon dating of late Cenozoic rocks in East Africa and Italy, Current Anthropology, 6, 343-385.
Evernden, J. F., G. H. Curtis, R. w. Kistler, and J. Obradovich, 1960, Argon diffusion in glauconite, microcline, sanidine, leucite and phlogopite, Am. J. Sci., 258, 583-604.
Evernden, J. F., G. H. Curtis, J. Obradovich and R. w. Kistler, 1961, On the evaluation of glauconite and illite for dating sedimentary rocks by the potassium-argon method, Geochim. Cosmochim. Acta, 23, 78..l)9.
Evernden, J. F. and G. T. James, 1964, Tertiary floras of North America,
158
/
Potassium-argon dates and the Am. J. Sci., 262, 945-974.
Evernden, J. F., D. E. Savage, G. H. Curtis and G. T. James, 1964, Potassium-argon dates and the Cenozoic mammalian chronology of North America, Am. J. Sci., 262, 145-198.
Fechtig, H. and s. Kalbitzer, 1966, The diffusion of argon in potassium-bearing solids, in Potassium-Argon Dating, compiled by o. A. Schaeffer and J. Zahringer, Springer-Verlag, Inc., New York, pp. 68 106.
Fisher, D. E., 1970, Heavy rare gases in a Pacific seamount, Earth Planet. Sci. Lett., 9, 331-335.
Fisher, D. E., 1971, Incorporation of Ar in East Pacific basalts, Earth Planet. Sci. Lett., 12, 321-324.
Fitch, F. J., J. A. Miller and J. G. Mitchell, 1969, A new approach to radio-isotopic dating in orogenic belts, in Time and Place in Orogeny, Geol. Soc. London, Great Britain, pp. 157-195.
Frechen, J. and H. J. Lippolt, 1965, Kalium-Argon-Daten zum Alter des Laacher Vulkanismus, der Rheinterrassen und der Eiszeiten, Eiszeitalter und Gegenwart, 16, 5-30.
Funkhouser, J. G., 1966, The determination of a series of ages of a Hawaiian volcano by the potassium-argon method, Ph. D. Dissertation, University of Hawaii, 168 pp.
Funkhouser, J. G., I. L. Barnes and J. J. Naughton, 1966, Problems in the dating of volcanic rocks by the potassium-argon method, Bull. Volcanologique, 29, 709-718.
Funkhouser, J. G., I. L. Barnes and J. J. Naughton, 1968, The determination of a series of ages of Hawaiian volcanoes by the potassium-argon method, Pacific Science, 22, 369-372.
Fyfe, w. s., M. A. Lanphere afB G. B. Dalrymple, 1969, Experimental introduction of excess Ar into a granitic melt, Contr.
· Mineral. and Petrol., 23, 189-193.
Gerling, E. K., G. M. Ermolin, N. v. Baranovskaya and N. E. Titov, 1952, First experience with the application of the argon method for the determination of the age of minerals, Doklady Akad, Nauk. S.S.S.R., 86, 593-596, quoted from G. B. Dalrymple and M. A. Lanphere, 1969.
Goodman, c. and R. D. Evans, 1941 1 Age measurements by radioactivity, Geol. Soc. Am. Bull., 52, 491-544.
159
Gramlich, J. w., 1970, Improvements in the potassium-argon dating method and their application to studies of the Honolulu Volcanic Series, Ph. D. Dissertation, University of Hawaii, 160 pp.
Gramlich, J. w., v. A. Lewis and J. J. Naughton, 1971, Potassiumargon dating of Holocene basalts of the Honolulu Volcanic Series, Geel. Soc. Am. Bull., 82, 1399-1404.
Gregg, s. J. and K. s. w. Sing, 1967, Adsorption, Surface Area and Porosity, Academic Press, Nev York and London, 371 pp.
Hamilton, E. I., 1965, Applied Geochronology, Academic Press, New York, 267 PP•
Hay, R. L., 1963, Zeolitic weathering in Olduvai Gorge, Tanganyika, Geel. Soc. Am. Bull., 74, 1281-1286.
Hay, R. L., 1966, Zeolites and zeolitic reactions in sedimentary rocks, Special GSA Papers No. 85, Geol. Soc • . Am., New York, 130 pp.
Hay, R. L. and A. Iijima, 1968, Petrology of palagonite tuffs of Koko Craters, Oahu, Hawaii, Contr. Mineral. Petrol., 17, 141-154.
Hayatsu, A. and c. M. Carmichael, 1970, K-Ar isochron method and initial argon ratios, Earth Planet. Sci. Lett., 8, 71-76.
Hillebrand, w. F. and G. E. F. Lundell, 1953, Applied Inorganic Analysis, 2nd Ed., Revised by G. E. F. Lundell, H. A. Bright and J. I. Hoffman, Wiley and Sons, Inc., New York, 809-827.
Hoare, J. M., w. H. Condon, A. Cox and G. B. Dalrymple, 1968, Geology, paleomagnetism, and potassium-argon ages of basalts from Nunivak Island, Alaska, Geol. Soc. Am. Memoir 116, 377~.
Holme~,H. F., E. L. Fuller and R. B. Gammage, 1973, Interaction of gases with lunar materials: Apollo 12, 14, and 16 samples, Proc. Fourth Lunar Sci. Conf. (Supplement 4, Geochim. Cosmochim Acta), 37 2413-2423.
Houtermans, F. G., 1966, History of the K/Ar method of geochronology in Potassium-Argon Dating, compiled by o. A. Schaeffer and J. Zahringer, Springer-Verlag, New York, 1-6.
Hurley, P. M., 1966, K-Ar dating of sediments in Potassium-Argon Dating, compiled by O. A. Schaeffer and J. Zahringer, SpringerVerlag, New York, 134-151.
160
Ildefonse, J. P., H. Bellon, A. Pantaloni and J. c. Philippet, 1972, Mise en evidence de la transition paleomagnetique Gauss-Matu:yama dans les formations volcaniques de 1 1escandorgue, Herault, France, Earth Planet. Sci. Lett., 14, 249-254.
!'W8.saki, B. and T. Katsura, 1967, The solubility of hydrogen chloride in volcanic rock melts at a total pressure of one atmosphere and at temperatures of 1200°c and 1290°c under anhydrous conditions, Bull. Chem. Soc. Japan, 40, 554-561.
Kaneoka, I., 1972, volcanic rocks,
The effect of hydration on the K/Ar ages of Earth Planet. Sci. Lett., 14, 216-220.
Kendall, B. R. F., 196o, Isotopic composition of potassium, Nature, 186, 225-226.
Kirsten, T., 1966, Determination of radiogenic argon, in PotassiumArgon Dating, compiled by o. A. Schaeffer and J. Zahringer, Springer-Verlag, New York, pp. 7-39.
Kirsten, T., 1968, Incorporation of rare gases in solidifying · enstatite melts, J. Geophys. Res., 73, 2807-2810. .-·
Krankowsky, D. and J. Zahringer, 1966, K-Ar ages of meteorites, in Potassium-Argon Dating, compiled by o. A. Schaeffer and J. Zahringer, Springer-Verlag, New York, pp. 174-199.
Kraushaar, J. J., E. D. Wilson and K. T. Bainbridge, 1953, Comparison of the values of the disintegration constant of Be7 in Be, BeO, and BeF2, Phys. Rev., 90, 610-614.
Krummenacher, D., 1970, Isotopic composition of argon in modern ~urface volcanic rocks, Earth Planet. Sci. Lett., 8, 109-117.
Krummenacher, D., 1973, Personal communication.
Krummenacher, D., 1974, Personal communication.
Kulp, J. L., 1961, Geologic time scale, Science, 1331 1105-1114.
Kulp, J. L. and J. Engels, 1963, Discordances in K-Ar and Rb-Sr isotopic ages, in Radioactive Dating, Internat. At. En. Ag., Vienna, pp. 219-238.
Kuroda, P. K. and E. B. Sandell, 1953, Chlorine in igneous rocks, Geol. Soc. Am. Bull., 64, 879-896.
Lambert, G., J. Labeyrie and P. Dumesnil, 1966, A remark on the · .correction for "atmospheric" argon in dating rocks by the potas
sium-argon method, Earth Planet. Sci. Lett., 1, 443-.445.
Lancet, M. s. and E. Anders, 1973, Solubilities of noble gases in magnetite: implications for planetary gases in meteorites, Geochim. Cosmochim. Acta, 37, 1371-1388.
161
Lanphere, M. A. and G. B. Dalrymple, 19671 K-Ar and Rb-Sr measurements of P-207, the u.s.G.s. interlaboratory standard muscovite, Geochim. Cosmochim. Acta, 31, 1091-1094.
- . 40 39 Lanphere, M. A. and G. B. Dalrymple, 1971, A test of the Ar/ Ar
age spectrum technique on some terrestrial materials, Earth Planet. Sci. Lett., 12, 359-372.
Lippolt, H. J. and w. Gentner, 1962, Argonbestimmungen an KaliumMineralien -- X, Versuche der Kalium-Argon-Datierung von Fossilien, Geochim. Cosmochim. Acta, 26, 1247-1253.
Lippolt, H. J. and W. Gentner, 1963, K-Ar dating of some limestones and fluorites (examples of K-Ar ages Yi.th low Ar-concentrations) in Radioactive Dating, Int. Atomic Energy Agency, Vienna, 440 pp.
Macdonald, G. A. and A. T. Abbott, 1970, Volcanoes in the Sea, University of Hawaii Press, Honolulu, 441 pp.
Mankinen, E. A. and G. B. Dalrymple, 1972, Electron microprobe evaluation of terrestrial basalts for whole-rock K-Ar dating, Earth Planet. Sci. Lett., 17, 89-94.
Marvin, R. F., H. H. Mehnert and D. c. Noble, 1970, Use of Ar36 to evaluate the incorporation of air by ash flows, Geol. Soc. Am. Bull., 81, 3385-3392.
Mason, B., 1968, Principles of Geochemistry, Wiley and Sons, Inc., New York, 329 PP•
McDougall, I., 1964., Potassium-argon ages from lavas of the Hawaiian Islands, Geol. Soc. Am. Bull., 75, 107-128.
McDougall, I., 1966, Precision methods of potassium-argon isotopic age determination on young rocks in Methods and Techniques in Geophysics Vol. II, s. K. Runcorn, Editor, Interscience, London, pp. 279-304.
McDougall, I., 1969, Potassium-argon ages on lavas of Kohala Volcano, Hawaii, Geol. Soc. Am. Bull., 80, 2597-2600.
McDougall, I., 197la, Geochronology, reprinted from Marion and Prince Edward Islands, E. M. van Zinderen Bakker, J. M. Winterbottom and R. A. Dyer, Editors, pp. 72-77.
McDougall, I., 197lb, The geochronology and evolution of the young volcanic island of Reunion, Indian Ocean, Geochim. Cosmochim. Acta, 35 1 261-288.
162
McDougall, I., 19741 Personal communication.
McDougall, I., H. L. Allsopp and F. H. Chamalaun, 1966, Isotopic dating of the Newer V9lcanics of Victoria, Australia, and geomagnetic polarity epochs, J. Geophys. Res., 71, 6107-6118.
McDougall, I. and Aziz-Ur-Rahman, 1972, Age of the Gauss-l1atuyama boundary and of the Kaena and Mammoth events, Earth Planet. Sci. Lett., 14, 367-380.
McDougall, I. and F. H. Chamalaun, 1969, Isotopic dating and geomagnetic polarity studies on volcanic rocks from Mauritius, Indian Ocean, Geol. Soc. Am. Bull., 80, 1419-1442.
McDougall, I. and D. H. Green, 1964, Excess radiogenic argon in · pyroxenes and isotopic ages on minerals from NorYegian eclogites, Norsk Geologisk.Tidsskrift, 44, 183-196.
McDougall, I., H. A. Polach and J. J. Stipp, 1969, Excess radiogenic argon in young subaerial basalts from the Auckland volcanic field, New Zealand, Geochim. Cosmochim. Acta, 33, 1485-1520.
McDougall, I. and D. A. Swanson, 1972, Potassium-argon ages of lavas from the Rawi and Pololu Volcanic Series, Kohala Volcano, Hawaii, Geol. Soc. Am. Bull., 83, 3731-3738.
McDougall, I. and N. D. Watkins, 1973, Reunion geomagnetic polarity event, 19, 443~52.
Age and duration of the Earth Planet. Sci. Lett.,
McKee, E. H. and c. A. Anderson, 1971, Age and chemistry of Tertiary volcanic rocks in North-Central Arizona and relation of the rocks to the Colorado Plateaus, qeol. Soc. Am. Bull., 82, 2767-2782.
McLafferty, F. w., 1967, Interpretation of Mass Spectra, w. A. Benjamin, Inc., New York, 229 pp.
Merrihue, c., 1965, Trace-element determinations and potassium-argon dating by mass spectroscopy of neutron-irradiated samples (abstract), Trans. Am. Geophys. Union, 46, 125.
Merrihue, c. and G. Turner, 1966, Potassium-argon dating by activation \/ith fast neutrons, J. Geophys. Res., 71, 2852-2857.
Mitchell, J. G., 1972, Potassium argon dating of gamma-irradiated minerals, Earth Planet. Sci. Lett., 14, 91-96.
Moorbath, s., H. Sigurdsson and R. Goodwin, 1968, K-Ar ages of the ·oldest exposed rocks in Iceland, Earth Planet. Sci. Lett., 4, 197-205.
1~3
Mullins, L. J. and K. Zerahn, 1948, isotopes in biological material,
The distribution of potassium J. Biol. Chem., 174, 107-113.
Mussett, A. E., 1969, Diffusion measurements and the potassium.argon method of dating , Geophys. J. R. astr. Soc., 18, 257-303.
Mussett, A. E. and G. B. Dalrymple, 1968, An investigation of the source of air Ar contamination in K-Ar dating, Earth Planet. Sci. Lett., 4, 422-426.
Nier, A. o., 1950, A redetermination of the relative abundances of the isotopes of carbon, nitrogen, oxygen, argon, and potassium, Phys. Rev., 77, 789-793.
Noble, c. s., 1969, Investigation of the inert gas content of Hawaiian inclusions that exhibit anomalous ages, Ph. D. Dissertation, University of Hawaii, 107 pp.
Noble, c. s. and J. J. Naughton, 1968, Deep-ocean basalts: Inert gas content and uncertainties in age dating, . Science, 162, 265-267.
O'Neill, J. R., c. E. Hedge and E. D. Jackson, 1970, Isotopic investigations of xenoliths and host basalts from the Honolulu Volcanic Series, Earth Planet. Sci. Lett., 8, 253-257.
Page, R. W. and I. McDougall, 1970, Potassium-argon dating of the Tertiary f 1_2 stage in New Guinea and its bearing on the geological time scale, Am. J. Sci., 269, 321-342.
Reutersward, c., 1951, Isotopic abundance of 40K, Arkiv. Fysik, 4, 203-205.
Reuterswa.rd, c., 1956, On the isotopic constitution of potassium, mass discrimination in a hot-a.node ion source, Arkiv. Fysik, 11, 1-54.
Reynolds, J. H., 1956, High sensitivity mass spectrometer for noble gas analysis, Rev. Sci. Instr., 27, 928-934.
Roddick, J. c. and E. Farrar, 1971, High initial argon ratios in hornblendes, Earth Planet. Sci. Lett., 12, 208-214.
Rubin, M. ands. M. Berthold, 1961, U. S. Geological Survey radiocarbon dates VI, Am. J. Sci., Radiocarbon, 3, 86-98.
Segre, E. and c. E. Wiegand, 1949, Experiments on the effect of atomic electrons on the decay constant of Be?, Phys, Rev., 75, 39-43.
164
Smits, F. and W. Gentner, 1950, Argonbestimmungen an KaliumMineralien I. Bestimmungen an tertiaren Kalisalzen, Geochim. Cosmochim. Acta, 1, 22-27.
Stearns, H. T. and G. A. Macdonald, 1946, Geology and ground-water recources of the island of Hawaii, Haw. Div. Hydrography Bull., 9, 363 pp.
Stearns, H. T. and K. N. Vaksvik, 1935, Geology and groundwater recources of Oahu, Hawaii, Haw. Div. Hydrography Bull., 1, 479 pp.
Stormer, Jr., J. c., 1972, Ages and nature of volcanic activity on the southern high plains, New Mexico and Colorado, Geol. Soc. Am. Bull., 83, 2063-2072.
Sudo, T. and M. Matsuoka··. , 1959, Artificial crystallization of volcanic glass to sodalite and a zeolite structure, Geochim. Cosmochim. Acta, 17, 1-5.
Turner, G., 1970, 40Ar-39Ar age determination o~ lunar rock 12013, Earth Planet. Sci. Lett., 9, 177-180.
Turner, G., 1971, Argon 40- argon 39 dating: The optimization of irradiation parameters, Earth Planet. Sci. Lett., 10, 227-234.
Verbeek, A. A. and G. D. L. Schreiner, 1967, Variations in 39K:41K ratio and movement of potassium in a granite-amphibolite contact region, Geochim. Cosmochim. Acta, 31, 2125-2133.
Wampler, J. M. and Y. Yanase, 1974, Argon adsorption and trapping by cold trap ice (abstract), EOS Trans. Am. Geophys. Union, 55, 472.
Wanless, R. K. and J. A. Lowd.on, 1961, coeval minerals and mineral pairs, Tech. Surv., Paper 61-17, 119-124.
Isotopic age measurements on Can. Geol. Surv., Dept. Mines
Wanless, R. K. and J. A. Lowd.on, 1963a, K-Ar age measurements on mineral pairs, Can. Geol. Surv., Dept. Mines Tech. Surv., Paper 62-17, 121-122.
Wanless, R. K. and J. A. Lowd.on, 196Jb, K-Ar age measurements on biotite-muscovite pairs, Can. Geol. Surv., Dept. Mines Tech. Surv., Paper 63-17, 122-124.
Wetherill, G. w., 1966, Radioactive decay constants and energies, in S. P. Clark, Jr., ed., Handbook of Physical Constants, Geol. Soc. Am. Memoir, 97, pp. 513-519.
165
White, F. A., T. L. Collins and F. M. Rourke, 1956, Search for possible naturally occurring isotopes of low abundance, Phys. Rev., .101, 1786-1791.
Willard, H. H.; L. L. Merritt and J. A. Dean, 1965, Instrumental Methods of Analysis, D. ·Van Nostrand Co., Inc., New York, 342 pp.
Winchell, H., 1947, Honolulu Series, Oahu, Hawaii, Geol. Soc. Am. Bull., 58, 1-48.
Wolberg, J. R., 1967, Prediction Analysis, D. Van Nostrand Co., Inc., Princeton, New Jersey, 291 pp.
Zartman, R. E., G. J. Wasserburg and J. H. Reynolds, 1961, Helium, argon, and carbon in some natural gases, J. Geophys. Res., 66, · 277-306.
166
Related Documents