Supplementary Information for: Retroviral promoters in the human genome Andrew B. Conley, Jittima Piriyapongsa and I. King Jordan School of Biology, Georgia Institute of Technology, 310 Ferst Drive, Atlanta, GA, 30306 Supplementary Methods Paired end ditags (PETs) Gene identification signature (GIS) analysis is a sequencing and mapping strategy that allows for the high-throughput demarcation of gene transcription boundaries, i.e. the 5’ and 3’ gene termini (Ng, et al., 2005). The GIS analysis procedure that produced the data we analyzed started with the isolation of polyA+ RNA from cells lines subject to different treatments: 1) the log phase of MCF7 cells, 2) MCF7 cells treated with estrogen (10nM beta-estradiol) for 12 hours, 3) HCT116 cells treated with 5FU (5-fluorouracil) for 6 hours, 4) the log phase of embryonic stem cell hES3 in feeder free culture condition. Full-length cDNAs (flcDNA) were generated from RNA and selected using the biotynlated CAP trapper method (Carninci, et al., 1996). The CAP trapper method relies on the introduction of a biotin group to the cap structure found at the 5’ end of full length mRNAs followed by first strand cDNA synthesis. Biotin residues are selected using streptavidin-coated magnetic beads, which results in the retention of only flcDNAs. BamHI and MmeI restriction sites are ligated to the 5’ and 3’ termini of the flcDNAs, which are then cloned to produce the GIS-flcDNA library. This library is digested with MmeI to yielding 18bp sequence fragments (signatures) from the 5’ and 3’ ends of flcDNAs. The 3’ end of the signature includes two A residues from the polyA tail. The 5’ and 3’ flcDNA signatures are covalently ligated to form 36bp paired-end ditags (PETs), each of which represents an individual transcript. PETs are exised using BamHI digestion and then concatenated and cloned for high-throughput sequencing. A single sequencing read of ~700bp leads, on average, to the characterization of 15 distinct PETs. The GIS cloning and sequence analysis resulted in 584,624 PETs for the log phase MCF7 cells, 153,179 PETs for the estrogen-treated MCF7 cells, 280,340 PETs for the HCT116 cells, and 1,799,970 PETs for the hES3 cells. These PETs were then mapped to the human genome using the following criteria: paired 5’ and 3’ ends must be on the same chromosome, they must be in the correct 5’-to-3’ order and orientation, they must be within 1 million base pairs, there must be a 16bp contiguous sequence match (out of 18bp) for the 5’ end of the PET and a 14bp contiguous match (out of 16bp) for the 3’ end of the PET. Using these criteria, most of the PET sequences (>90%) mapped to single locations in the human genome, but PETs mapping to 2-10 locations were also included in the analysis. The quality and mapping specificity of PETs has been confirmed in a number of different ways (Ng, et al., 2005). For instance, >95% of PETs map to known human gene transcripts and the vast majority fell within 10bp of the transcription start and termination sites. Most relevant to our study is the fact that the GIS analysis has been shown to be 30 times more efficient than standard cDNA methods for characterizing transcript and has resulted in the discovery of numerous previously uncharacterized transcripts. Thus, GIS is particularly suited to the discovery of alternative transcripts in the human genome of the kind initiated by ERV sequences. Cap Analysis of Gene Expression (CAGE) The CAGE technique was developed for the high-throughput characterization of transcription start sites (TSS) (Shiraki, et al., 2003). CAGE uses a similar technology to that described above 1

Welcome message from author
This document is posted to help you gain knowledge. Please leave a comment to let me know what you think about it! Share it to your friends and learn new things together.
Transcript

Supplementary Information for: Retroviral promoters in the human genome Andrew B. Conley, Jittima Piriyapongsa and I. King Jordan School of Biology, Georgia Institute of Technology, 310 Ferst Drive, Atlanta, GA, 30306 Supplementary Methods Paired end ditags (PETs) Gene identification signature (GIS) analysis is a sequencing and mapping strategy that allows for the high-throughput demarcation of gene transcription boundaries, i.e. the 5’ and 3’ gene termini (Ng, et al., 2005). The GIS analysis procedure that produced the data we analyzed started with the isolation of polyA+ RNA from cells lines subject to different treatments: 1) the log phase of MCF7 cells, 2) MCF7 cells treated with estrogen (10nM beta-estradiol) for 12 hours, 3) HCT116 cells treated with 5FU (5-fluorouracil) for 6 hours, 4) the log phase of embryonic stem cell hES3 in feeder free culture condition. Full-length cDNAs (flcDNA) were generated from RNA and selected using the biotynlated CAP trapper method (Carninci, et al., 1996). The CAP trapper method relies on the introduction of a biotin group to the cap structure found at the 5’ end of full length mRNAs followed by first strand cDNA synthesis. Biotin residues are selected using streptavidin-coated magnetic beads, which results in the retention of only flcDNAs. BamHI and MmeI restriction sites are ligated to the 5’ and 3’ termini of the flcDNAs, which are then cloned to produce the GIS-flcDNA library. This library is digested with MmeI to yielding 18bp sequence fragments (signatures) from the 5’ and 3’ ends of flcDNAs. The 3’ end of the signature includes two A residues from the polyA tail. The 5’ and 3’ flcDNA signatures are covalently ligated to form 36bp paired-end ditags (PETs), each of which represents an individual transcript. PETs are exised using BamHI digestion and then concatenated and cloned for high-throughput sequencing. A single sequencing read of ~700bp leads, on average, to the characterization of 15 distinct PETs.
The GIS cloning and sequence analysis resulted in 584,624 PETs for the log phase MCF7 cells, 153,179 PETs for the estrogen-treated MCF7 cells, 280,340 PETs for the HCT116 cells, and 1,799,970 PETs for the hES3 cells. These PETs were then mapped to the human genome using the following criteria: paired 5’ and 3’ ends must be on the same chromosome, they must be in the correct 5’-to-3’ order and orientation, they must be within 1 million base pairs, there must be a 16bp contiguous sequence match (out of 18bp) for the 5’ end of the PET and a 14bp contiguous match (out of 16bp) for the 3’ end of the PET. Using these criteria, most of the PET sequences (>90%) mapped to single locations in the human genome, but PETs mapping to 2-10 locations were also included in the analysis.
The quality and mapping specificity of PETs has been confirmed in a number of different ways (Ng, et al., 2005). For instance, >95% of PETs map to known human gene transcripts and the vast majority fell within 10bp of the transcription start and termination sites. Most relevant to our study is the fact that the GIS analysis has been shown to be 30 times more efficient than standard cDNA methods for characterizing transcript and has resulted in the discovery of numerous previously uncharacterized transcripts. Thus, GIS is particularly suited to the discovery of alternative transcripts in the human genome of the kind initiated by ERV sequences. Cap Analysis of Gene Expression (CAGE) The CAGE technique was developed for the high-throughput characterization of transcription start sites (TSS) (Shiraki, et al., 2003). CAGE uses a similar technology to that described above
1

for the generation of PETs in GIS. The main difference is that CAGE only characterizes the 5’ ends, as opposed to both 5’ and 3’ PET ends, of flcDNAs. CAGE also employs the isolation of flcDNAs using biotinylated mRNA caps as described for GIS. Once flcDNAs are isolated, linkers with MmeI restriction sites are ligated to the 5’ ends of the flcDNAs, and the first 20 bp of the cDNAs is cleaved with a MmeI restriction digest. The resulting 5’ end cDNA fragments (so-called CAGE tags) are amplified, concatenated and sequenced. This procedure allows for the high-throughput characterization of the 5’ ends of mRNAs, and mapping of the resulting sequence fragments to the genome identifies transcriptional start sites (TSS). CAGE tags are mapped to the human genome mandating a contiguous match of 18 out of 20bp. Approximately 60% of CAGE tags can be unambiguously mapped to the genome in this way. Only CAGE tags that mapped to one location in the genome were used in our study.
CAGE is a slightly more mature technology than GIS and it has been extensively validated (Carninci, et al., 2006; Kodzius, et al., 2006). In addition to the ability of CAGE tags to converge on known TSS in the human genome, CAGE also identifies thousands of previously unknown TSS. This is consistent with our discovery that numerous ERV-derived TSS correspond to alternative transcripts. Gene expression analysis Human and mouse gene expression data were taken from the Novartis mammalian gene expression atlas version 2 (GNF2) (Su, et al., 2004). GNF2 data are based on Affymetrix microarray experiments conducted in replicate on 79 human and 61 mouse tissues. For each Affymetrix probe, signal intensity values (i.e. expression levels) were median and log2 normalized across tissues. Affymetrix probes were mapped to GenBank RefSeq gene accessions using the UCSC Table Browser utility (Karolchik, et al., 2004). Human-mouse orthologous gene pairs and 28 corresponding tissue pairs were identified as described previously (Jordan, et al., 2004). Similarity between human-mouse orthologous gene pair tissue-specific expression profiles was measured using the Pearson correlation co-efficient (r) as described previously (Jordan, et al., 2005). An adjusted r-value threshold of 0.5789, above which human-mouse orthologous gene pairs can be considered to have correlated expression patterns across n=28 tissues, was computed using the formula t=r*sqrt((n- 2) /(1–r2)), where t follows the Student-t distribution with n-2 degrees of freedom. The r-value threshold was based on a P-value of 0.00125 computed using a Bonferroni correction with the number of comparisons (40) performed (i.e. P=0.05/40).
The GNF2 data were also used to compare the values of a number of gene expression parameters for human genes that have ERV-TSS that yield chimeric transcripts (ERV+) versus all other human genes (ERV-) with Novartis expression data. Average values for the following gene expression parameters across the two sets were compared: 1) average expression, 2) maximum expression, 3) breadth of expression and 4) tissue-specificity of expression. Average, maximum and breadth of expression were computed as described previously in (Jordan, et al., 2005). Tissue-specificity was computed using the τ parameter described in (Yanai, et al., 2005). The values of τ range between 0 and 1 with more tissue-specific genes having higher values. Human gene tissue-specific expression profiles from the GNF2 data were used to group genes into 20 clusters of co-expressed genes with K-means clustering using the program Genesis (Sturn, et al., 2002). The observed counts of ERV+ genes in each of these clusters were compared to the expected counts based on the whole genome distribution using a chi-square test.
2

Human ESTs were mapped to ERV-derived TSS and associated genes and the tissues (or cell lines) from which they were characterized were determined using the Human ESTs track of the UCSC Genome Browser (Karolchik, et al., 2003). The distribution of EST tissue types across alternative versus primary promoters was compared using a joint chi-square test. Observed EST tissues counts for the alternative versus the primary TSS were compared with expected counts based on the pooled tissue counts to compute a chi-square value for each promoter and the joint chi-square probability for the two promoters was computed. Gene ontology (GO) analysis The set of human genes with ERV-TSS that yield chimeric ERV-gene transcripts (ERV+) were evaluated for enrichment of biological process and molecular function GO terms using the program using the program GOTree Machine (GOTM) (Zhang, et al., 2004). The GOTM program was used to implement a hypergeometric test comparing GO term frequencies in the ERV+ human gene set against a background set made up of all human genes with corresponding Affymetrix probes. GOTM produces a list of enriched GO terms along with a view of the GO directed acyclic graph (DAG) showing the parent-child relationships among enriched GO terms. ERV age analysis ERVs accumulate mutations after inserting into the genome. Thus, the relative ages of ERVs, i.e. the time since insertion, can be estimated using the sequence divergence levels between ERVs and their consensus sequences (Lander, et al., 2001). ERV-to-consensus divergence levels were taken from the RepeatMasker output. Average levels of ERV-to-consensus divergence were compared for all ERVs, ERVs that overlap with ESTs, ERVs that overlap with CAGE tags and ERVs that overlap with PETs.
3
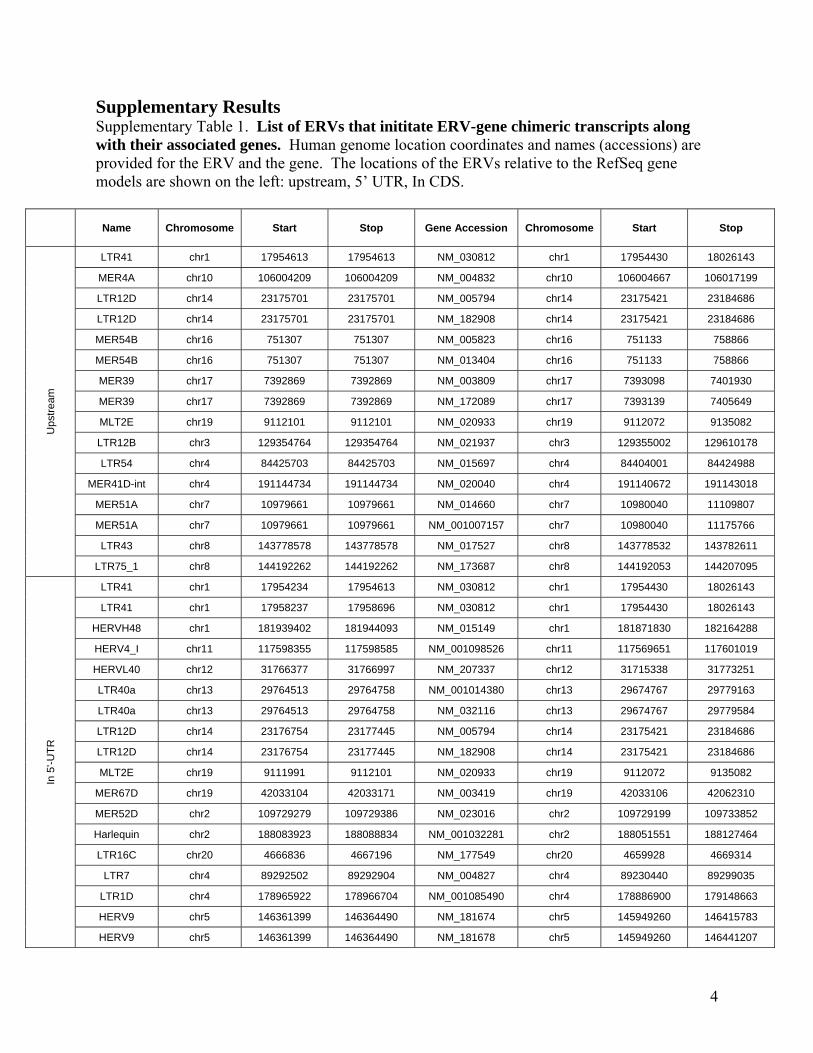
Supplementary Results Supplementary Table 1. List of ERVs that inititate ERV-gene chimeric transcripts along with their associated genes. Human genome location coordinates and names (accessions) are provided for the ERV and the gene. The locations of the ERVs relative to the RefSeq gene models are shown on the left: upstream, 5’ UTR, In CDS.
Name Chromosome Start Stop Gene Accession Chromosome Start Stop
LTR41 chr1 17954613 17954613 NM_030812 chr1 17954430 18026143
MER4A chr10 106004209 106004209 NM_004832 chr10 106004667 106017199
LTR12D chr14 23175701 23175701 NM_005794 chr14 23175421 23184686
LTR12D chr14 23175701 23175701 NM_182908 chr14 23175421 23184686
MER54B chr16 751307 751307 NM_005823 chr16 751133 758866
MER54B chr16 751307 751307 NM_013404 chr16 751133 758866
MER39 chr17 7392869 7392869 NM_003809 chr17 7393098 7401930
MER39 chr17 7392869 7392869 NM_172089 chr17 7393139 7405649
MLT2E chr19 9112101 9112101 NM_020933 chr19 9112072 9135082
LTR12B chr3 129354764 129354764 NM_021937 chr3 129355002 129610178
LTR54 chr4 84425703 84425703 NM_015697 chr4 84404001 84424988
MER41D-int chr4 191144734 191144734 NM_020040 chr4 191140672 191143018
MER51A chr7 10979661 10979661 NM_014660 chr7 10980040 11109807
MER51A chr7 10979661 10979661 NM_001007157 chr7 10980040 11175766
LTR43 chr8 143778578 143778578 NM_017527 chr8 143778532 143782611
Ups
tream
LTR75_1 chr8 144192262 144192262 NM_173687 chr8 144192053 144207095
LTR41 chr1 17954234 17954613 NM_030812 chr1 17954430 18026143
LTR41 chr1 17958237 17958696 NM_030812 chr1 17954430 18026143
HERVH48 chr1 181939402 181944093 NM_015149 chr1 181871830 182164288
HERV4_I chr11 117598355 117598585 NM_001098526 chr11 117569651 117601019
HERVL40 chr12 31766377 31766997 NM_207337 chr12 31715338 31773251
LTR40a chr13 29764513 29764758 NM_001014380 chr13 29674767 29779163
LTR40a chr13 29764513 29764758 NM_032116 chr13 29674767 29779584
LTR12D chr14 23176754 23177445 NM_005794 chr14 23175421 23184686
LTR12D chr14 23176754 23177445 NM_182908 chr14 23175421 23184686
MLT2E chr19 9111991 9112101 NM_020933 chr19 9112072 9135082
MER67D chr19 42033104 42033171 NM_003419 chr19 42033106 42062310
MER52D chr2 109729279 109729386 NM_023016 chr2 109729199 109733852
Harlequin chr2 188083923 188088834 NM_001032281 chr2 188051551 188127464
LTR16C chr20 4666836 4667196 NM_177549 chr20 4659928 4669314
LTR7 chr4 89292502 89292904 NM_004827 chr4 89230440 89299035
LTR1D chr4 178965922 178966704 NM_001085490 chr4 178886900 179148663
HERV9 chr5 146361399 146364490 NM_181674 chr5 145949260 146415783
In 5
'-UTR
HERV9 chr5 146361399 146364490 NM_181678 chr5 145949260 146441207
4

LTR5B chr5 177414929 177415182 NM_001080544 chr5 177414995 177415888
LTR50 chr8 12873949 12874595 NM_020844 chr8 12847553 12931655
LTR43 chr8 143778243 143778578 NM_017527 chr8 143778532 143782611
HERVH chrX 113744197 113747503 NM_000868 chrX 113724806 114050880
LTR41 chrX 134693953 134694178 NM_152582 chrX 134693879 134701914
LTR41 chrX 134693953 134694178 NM_001017436 chrX 134693879 134719184
LTR41 chrX 134781361 134781586 NM_001007551 chrX 134773630 134781660
LTR41 chrX 134798611 134798836 NM_001017438 chrX 134790881 134798910
MER54B chr16 725416 725902 NM_022493 chr16 719771 730998
LTR9 chrX 2729224 2729740 NM_175569 chrX 2680114 2743960
MER51A chr2 3339561 3340106 NM_003310 chr2 3171749 3360605
MER21C chr7 5933542 5933818 NM_001099697 chr7 5932302 5976840
MER21C chr7 5933542 5933818 NM_173565 chr7 5932302 5976840
MER31B chr8 11702728 11703173 NM_004462 chr8 11697598 11734226
LTR36 chr22 17028682 17028800 NM_017414 chr22 17012757 17040162
MER41A-int chr12 26797075 26797151 NM_002223 chr12 26379553 26877398
LTR12 chr12 29480709 29481473 NM_183378 chr12 29471755 29541886
HERVE chr12 31165336 31165939 NM_001080502 chr12 31158726 31250355
LTR27B chr7 33358011 33358250 NM_001033604 chr7 33135676 33612205
LTR27B chr7 33358011 33358250 NM_001033605 chr7 33135676 33612205
LTR27B chr7 33358011 33358250 NM_014451 chr7 33135676 33612205
LTR27B chr7 33358011 33358250 NM_198428 chr7 33135676 33612205
MLT2B2 chr17 34767819 34768179 NM_032875 chr17 34670366 34811402
MER41G chr22 34984494 34985070 NM_003661 chr22 34979069 34993522
MER41G chr22 34984494 34985070 NM_145343 chr22 34979069 34993522
LTR7 chr18 38577764 38578263 NM_002930 chr18 38577189 38949655
MER68 chr4 38951204 38951750 NM_025132 chr4 38860418 38963824
LTR19C chr13 42526886 42527709 NM_013238 chr13 42495361 42581304
MER61F-int chr15 43131729 43132168 NM_003104 chr15 43102632 43154331
MER92C chr4 46920855 46921054 NM_000812 chr4 46728335 47123202
LTR12C chr13 50224579 50226004 NM_198989 chr13 50184759 50315886
MER4C-int chr7 50525903 50526498 NM_000790 chr7 50493627 50596262
MER4C-int chr7 50525903 50526498 NM_001082971 chr7 50493627 50600648
MER4D chr3 54650117 54651004 NM_018398 chr3 54131732 55083622
MER21C chr5 54816203 54816867 NM_003711 chr5 54756441 54866630
MER21C chr5 54816203 54816867 NM_176895 chr5 54756441 54866630
MER34B chr4 62321975 62322273 NM_015236 chr4 62045433 62620762
HERV4_I chr19 63452392 63453769 NM_014480 chr19 63431881 63466820
MER57A-int chr6 64070948 64072854 NM_016571 chr6 64047518 64087841
MER52A chr4 64888385 64889631 NM_001010874 chr4 64826015 64957773
In C
DS
LTR12 chr7 68888991 68889595 NM_015570 chr7 68702254 69895790
5

MER52A chr13 69395827 69397313 NM_020866 chr13 69172726 69580460
MER4B-int chr12 74045504 74047192 NM_152779 chr12 74014729 74050436
MER34B chr9 74532752 74533337 NM_138691 chr9 74326536 74641087
MLT2F chr7 75145897 75146022 NM_005338 chr7 75001344 75206215
MLT2B2 chr12 79840894 79841339 NM_004664 chr12 79715301 79855825
HERV17 chr8 81814505 81817335 NM_001033723 chr8 81713323 81949571
LTR54 chr1 85637738 85638265 NM_012137 chr1 85556756 85703411
HERVH chr10 92557476 92561145 NM_000872 chr10 92490557 92607651
HERVH chr10 92557476 92561145 NM_019859 chr10 92490557 92607651
HERVH chr10 92557476 92561145 NM_019860 chr10 92490557 92607651
HERVH chr4 93581454 93584375 NM_001510 chr4 93444572 94912672
LTR9 chr7 98858058 98858575 NM_015545 chr7 98854689 98874355
MER34D chr13 99168644 99168812 NM_206808 chr13 99056936 99342824
HERVH chr14 101779943 101781050 NM_014226 chr14 101764930 101841284
MLT2D chr7 110096425 110096839 NM_032549 chr7 110090345 110989583
LTR12C chr4 110124142 110125521 NM_198721 chr4 109954420 110443248
LTR12C chr4 110124142 110125521 NM_032518 chr4 109964489 110443248
HERVH chr8 110382902 110385440 NM_032869 chr8 110322324 110415491
LTR16C chr12 116670959 116671316 NM_173598 chr12 116375221 116777724
LTR22B chr10 117136681 117136898 NM_207303 chr10 116843113 117698484
LTR7Y chr3 117306893 117307327 NM_002338 chr3 117011839 117647068
HERVH chr3 117309183 117312335 NM_002338 chr3 117011839 117647068
LTR7Y chr3 117312335 117312765 NM_002338 chr3 117011839 117647068
LTR16B chr9 118368734 118369128 NM_198188 chr9 118227327 118489334
LTR16B chr9 118368734 118369128 NM_014010 chr9 118227327 119217138
LTR16B chr9 118368734 118369128 NM_198186 chr9 118227327 119217138
LTR16B chr9 118368734 118369128 NM_198187 chr9 118227327 119217138
HUERS-P3 chr6 119008185 119016806 NM_001042475 chr6 118892931 119079713
HUERS-P3 chr6 119008185 119016806 NM_206921 chr6 118919289 119079713
MER41B chr8 119012088 119012717 NM_000127 chr8 118880782 119193239
MLT2B4 chr8 119444631 119445182 NM_001101676 chr8 119270875 119703365
LTR38B chr6 119666263 119666850 NM_005907 chr6 119540967 119712625
LTR12C chr3 120273950 120275501 NM_152538 chr3 120102170 120347588
LTR7 chr6 123945179 123945578 NM_006073 chr6 123579181 123999641
MER52A chr4 124247306 124248778 NM_145207 chr4 124063674 124460054
MER21A chr6 124675036 124675939 NM_001040214 chr6 124166767 125188483
LTR22C chr7 126086080 126086529 NM_000845 chr7 125865892 126670546
LTR40a chr8 126207807 126207882 NM_173685 chr8 126173276 126448543
MLT2A2 chr3 126756469 126756970 NM_022776 chr3 126730393 126796624
LTR10C chr5 133976397 133976985 NM_001033503 chr5 133970018 133996426
LTR10C chr5 133976397 133976985 NM_016103 chr5 133970018 133996426
6

PABL_A chr9 135137645 135138270 NM_020469 chr9 135120383 135140451
MER21C chr2 137646118 137646928 NM_001080427 chr2 137464931 138151757
HERV9 chr5 146361399 146364490 NM_181676 chr5 145949260 146415671
HERV9 chr5 146361399 146364490 NM_181677 chr5 145949260 146441207
LTR1B chr7 146429315 146430028 NM_014141 chr7 145444385 147749019
LTR8A chr7 147352928 147353621 NM_014141 chr7 145444385 147749019
MER21A-int chr4 147875445 147878401 NM_031956 chr4 147847628 148086484
MER4A1-int chr3 151891622 151892158 NM_152394 chr3 151860366 151904432
HERV30 chr3 155568283 155571737 NM_001038705 chr3 155538155 155630198
MER41B chr6 160579903 160580541 NM_003058 chr6 160557783 160599949
HUERS-P2 chr3 168448261 168451231 NM_024687 chr3 168440778 168580765
LTR10G chr3 168474996 168475504 NM_024687 chr3 168440778 168580765
LTR7 chr4 187400103 187400470 NM_000892 chr4 187385665 187416618
HERVH chr4 187402139 187405364 NM_000892 chr4 187385665 187416618
HERVL40 chr2 202090151 202090443 NM_152525 chr2 202060401 202192146
MER21C chr1 223825852 223826508 NM_001008493 chr1 223741156 223907468
MER21C chr1 223825852 223826508 NM_018212 chr1 223741156 223907468
LTR49-int chr2 231087179 231087883 NM_003113 chr2 230989114 231089486
LTR49-int chr2 231087179 231087883 NM_001080391 chr2 230989114 231118561
7

Supplementary Figure 1. ERV-derived promoter of the LY6K gene. A) The LTR43 (red) ERV sequence is located in the proximal promoter region and overlaps the LY6K 5’ UTR. The locations of PET sequences (green) and spliced ESTs (black) are shown. B) The LTR43 (red) sequence region is enlarged and the individual PET sequences (green) and spliced ESTs (black) that support the existence of this promoter are shown. C) Evolutionary conservation of LY6K versus LY6K.
Human Chimp Rhesus Bushbaby Mouse Rat
A
B
C
LY6K
PET
EST
LY6K
Conservation
LTR43
LTR43
LTR43
PETEST
Human Chimp Rhesus Bushbaby Mouse Rat
A
B
C
LY6K
PET
EST
LY6K
Conservation
PETEST
LTR43
LTR43
LTR43
8

Supplementary Figure 2. Gene expression profiles and correlations for human and mouse GSTO1 and GSTO2. A) Relative expression values resulting from median and log2 normalization of Affymetrix signal intensity values across tissues. B) Pearson correlation coefficient values (r) showing the correlation, or lack thereof, for tissue-specific expression between human paralogs and human-mouse orthologs.
Hs GSTO1
Mm GSTO1
Hs GSTO2
Mm GSTO2
0.0059
-0.0578
A
B
0.7647
Hs GSTO1
Mm GSTO1
Hs GSTO20.0059
-0.0578
A
B
0.7647
Mm GSTO2
9

Supplementary Figure 3. Ranked list of r-values showing the correlation between human-mouse orthologous gene tissue-specific expression profiles for all human genes that have a lineage-specific ERV-derived TSS that generates a chimeric ERV-gene transcript. An r-value≥0.5789, dotted line, corresponds to significantly co-expressed orthologous gene pairs.
-0.3
-0.2
-0.1
0
0.1
0.2
0.3
0.4
0.5
0.6
0.7r-
valu
e
-0.3
-0.2
-0.1
0
0.1
0.2
0.3
0.4
0.5
0.6
0.7r-
valu
e
10

Supplementary Table 2. Human gene expression values for genes with ERV-TSS versus all other genes.
Expression1 ERV+2 ERV-3 t4 P4 Average 378.3 ± 52.9 600.6 ± 10.0 3.97 7.3e-5 Maximum 1920.1 ± 309.9 3143.5 ± 50.33 3.76 1.7e-4 Breadth 23.9 ± 2.6 27.0 ± 0.1 1.18 2.4e-1 Tissue-specificity 0.75 ± 0.01 0.71 ± 0.00 2.88 4.0e-3 1Expression parameters measured using the Novartis GNF2 data as described 2Average and standard error for human genes possessing an ERV that promotes an ERV-gene chimeric transcript 3Average and standard error for all other human genes 4Test statistic and significance level for the Student’s t-test comparing the ERV+ and ERV- values
11

Supplementary Figure 4. Co-expressed clusters of human genes. Average tissue-specific expression profiles across 79 tissues are shown for each cluster. Clusters enriched for genes with ERV-TSS that generate chimeric transcripts are boxed in red. Chi-square statistical analysis indicating enrichment in cluster 1 (brain) and cluster 20 (testis) is shown below the clusters. cluster #probe Observed Expected chi-square
1 1753 12 3.87598 17.02787535 brain2 2926 4 6.469548 0.94267273 1936 1 4.280603 2.5142149614 1852 4 4.094874 0.002198155 452 2 0.999397 1.0018105016 550 2 1.21608 0.50533667 1016 4 2.246432 1.3688373158 1499 1 3.314372 1.6160881559 1837 3 4.061709 0.277524844
10 3799 6 8.399799 0.68561583711 1725 1 3.81407 2.0762574412 4167 4 9.213467 2.95005568213 534 1 1.180704 0.0276561914 4268 7 9.436784 0.62923088215 4169 14 9.217889 2.48089125716 2005 7 4.433166 1.48621502417 2639 7 5.834975 0.2326117218 3828 5 8.46392 1.41763385719 3040 6 6.721608 0.07746928420 780 8 1.724623 22.83418023 testis
44775 99 60.15437598 Chi-square value3.65815E-06 P -value
12

Supplementary Figure 5. Human gene co-expression cluster 1 (brain) and cluster 20 (testis) are shown. Average relative expression levels are indicated on the y-axis and the tissue-names are shown on the x-axis below the second panel.
13

Supplementary Figure 6. Tissue distribution of ERV CAGE tags. Observed counts for ERV CAGE tags are compared to expected counts based on all CAGE tags for brain, testis and the average of all other tissues. χ2=3,249 P=0.
0
2000
4000
6000
8000
Brain Testis Other
ER
V C
AGE
tag
coun
t
ObservedExpected
14

Supplementary Table 3. Statistically over-represented (enriched) GO biological process terms for human genes with an ERV-derived TSS generating a chimeric ERV-gene transcript.
AffyIDa ERV-geneb GOc P-valued
201563_at NM_003104 GO:0019751 polyol metabolic process 0.0015 205311_at NM_000790,
NM_001082971 GO:0006066 alcohol metabolic process 0.0034
206463_s_at NM_005794, NM_182908
GO:0008202 steroid metabolic process 0.0030
208647_at NM_004462 GO:0008299 isoprenoid biosynthetic process 0.0013 209546_s_at NM_003661,
NM_145343 GO:0008202 steroid metabolic process 0.0030
210946_at NM_003711, NM_176895
GO:0044255 cellular lipid metabolic process 0.0089
213379_at NM_015697 GO:0008299 isoprenoid biosynthetic process 0.0013 218304_s_at NM_022776 GO:0008202 steroid metabolic process 0.0030
aAffyID mapped to ERV-related gene bERV-related gene cOver-represented biological process GO term and description dP-value associated with that GO term
15

Supplementary Figure 7. GO directed acyclic graph showing the parent-child relationships of statistically over-represented (enriched) GO biological process and molecular function terms for human genes with an ERV-derived TSS generating a chimeric ERV-gene transcript. Significantly enriched GO terms are shown in red.
16

Supplementary Figure 8. Relative frequency of ERV-derived TSS detected by PET versus all ERVs in the genome. ERV types correspond to family names from the RepeatMasker output.
0%
5%
10%
15%
20%
25%
30%
35%
40%
45%
50%
Hare
lequ
ins
HERV
s
HUER
LTRs
MER
sMLT
Other
s
ERV Type
Perc
en
t of
ER
Vs
PET TSS ERVsAll ERVs
17

Supplementary Table 4. Average percent divergence between ERVs and their consensus sequences. Divergence is shown for all ERVs and for ERVs that overlap ESTs, CAGE tags and PET tags.
ERVs % Divergence Number All ERVs 19.6 ± 0.01 322,408 EST ERVs 16.5 ± 0.15 2,678 CAGE ERVs 19.7 ± 0.04 39,559 PET ERVs 13.8 ± 0.16 2,249
18

Supplementary References Carninci, P., et al. (1996) High-efficiency full-length cDNA cloning by biotinylated CAP trapper, Genomics, 37, 327-336. Carninci, P., et al. (2006) Genome-wide analysis of mammalian promoter architecture and evolution, Nat Genet, 38, 626-635. Jordan, I.K., et al. (2005) Evolutionary significance of gene expression divergence, Gene, 345, 119-126. Jordan, I.K., et al. (2004) Conservation and coevolution in the scale-free human gene coexpression network, Mol Biol Evol, 21, 2058-2070. Karolchik, D., et al. (2003) The UCSC Genome Browser Database, Nucleic Acids Res, 31, 51-54. Karolchik, D., et al. (2004) The UCSC Table Browser data retrieval tool, Nucleic Acids Res, 32, D493-496. Kodzius, R., et al. (2006) CAGE: cap analysis of gene expression, Nat Methods, 3, 211-222. Lander, E.S., et al. (2001) Initial sequencing and analysis of the human genome, Nature, 409, 860-921. Ng, P., et al. (2005) Gene identification signature (GIS) analysis for transcriptome characterization and genome annotation, Nat Methods, 2, 105-111. Shiraki, T., et al. (2003) Cap analysis gene expression for high-throughput analysis of transcriptional starting point and identification of promoter usage, Proc Natl Acad Sci U S A, 100, 15776-15781. Sturn, A., et al. (2002) Genesis: cluster analysis of microarray data, Bioinformatics, 18, 207-208. Su, A.I., et al. (2004) A gene atlas of the mouse and human protein-encoding transcriptomes, Proc Natl Acad Sci U S A, 101, 6062-6067. Yanai, I., et al. (2005) Genome-wide midrange transcription profiles reveal expression level relationships in human tissue specification, Bioinformatics, 21, 650-659. Zhang, B., et al. (2004) GOTree Machine (GOTM): a web-based platform for interpreting sets of interesting genes using Gene Ontology hierarchies, BMC Bioinformatics, 5, 16.
19
Related Documents