2254 IEEE TRANSACTIONS ON GEOSCIENCE AND REMOTE SENSING, VOL. 42, NO. 10, OCTOBER 2004 Retrieval of Semitransparent Ice Cloud Optical Thickness From Atmospheric Infrared Sounder (AIRS) Measurements Heli Wei, Ping Yang, Jun Li, Bryan A. Baum, Hung-Lung Huang, Steven Platnick, Yongxiang Hu, and Larrabee Strow Abstract—An approach is developed to infer the optical thick- ness of semitransparent ice clouds (when optical thickness is less than 5) from Atmospheric Infrared Sounder (AIRS) high spectral resolution radiances. A fast cloud radiance model is developed and coupled with an AIRS clear-sky radiative transfer model for simu- lating AIRS radiances when ice clouds are present. Compared with more accurate calculations based on the discrete ordinates radia- tive transfer model, the accuracy of the fast cloud radiance model is within 0.5 K (root mean square) in terms of brightness temperature (BT) and runs three orders of magnitude faster. We investigate the sensitivity of AIRS spectral BTs and brightness temperature dif- ference (BTD) values between pairs of wavenumbers to the cloud optical thickness. The spectral BTs for the atmospheric window channels within the region 1070–1135 cm are sensitive to the ice cloud optical thickness, as is the BTD between 900.562 cm (located in an atmospheric window) and 1558.692 cm (located in a strong water vapor absorption band). Similarly, the BTD be- tween a moderate absorption channel (1587.495 cm ) and the strong water absorption channel (1558.692 cm ) is sensitive to ice cloud optical thickness. Neither of the aforementioned BTDs is sensitive to the effective particle size. Thus, the optical thickness of semitransparent ice clouds can be retrieved reliably. We have developed a spectrum-based approach and a BTD-based method to retrieve the optical thickness of semitransparent ice clouds. The present retrieval methods are applied to a granule of AIRS data. The ice cloud optical thicknesses derived from the AIRS measure- ments are compared with those retrieved from the Moderate Res- olution Imaging Spectroradiometer (MODIS) 1.38- and 0.645- m bands. The optical thicknesses inferred from the MODIS measure- ments are collocated and degraded to the AIRS spatial resolution. Results from the MODIS and AIRS retrievals are in reasonable agreement over a wide range of optical thicknesses. Index Terms—Atmospheric Infrared Sounder (AIRS), ice clouds, infrared radiation transfer, optical thickness, retrieval. Manuscript received February 9, 2004; revised June 16, 2004. This work was supported in part by the GIFTS-IOMI MURI Project, in part by the Na- tional Science Foundation Physical Meteorology Program (managed by Dr. W. A. Cooper) under CAREER Award Grant ATM-0239605, in part by the Na- tional Aeronautics and Space Administration Radiation Science Program (man- aged by Dr. H. Maring, previously by Dr. D. Anderson) under Research Grant NAG-1-02002, and in part by the National Oceanic and Atmospheric Adminis- tration under ABI/HES Program NA07 EC00676. H. Wei and P. Yang are with the Department of Atmospheric Sci- ences, Texas A&M University, College Station, TX, 77843 USA (e-mail: [email protected]). J. Li and H.-L. Huang are with Cooperative Institute for Meteorological Satel- lite Studies, University of Wisconsin-Madison, Madison, WI 53706 USA. B. A. Baum and Y. Hu are with NASA Langley Research Center, Hampton, VA 23681 USA. S. Platnick is with the NASA Goddard Space Flight Center, Greenbelt, MD 20771 USA. L. Strow is with the Physics Department, University of Maryland Baltimore County, Baltimore, MD 21250 USA. Digital Object Identifier 10.1109/TGRS.2004.833780 I. INTRODUCTION I CE CLOUDS cover a substantial portion of the globe [1] and are important to understanding the earth’s en- ergy budget and climate [2]–[4]. Because of the difficulty in detecting and analyzing optically thin ice clouds in satellite imager data, more uncertainties remain for ice clouds than for water clouds. In situ measurements of cirrus are relatively scarce because these clouds are located at high altitudes, and accurate detection and analysis are problematic. An approach based on the visible and near-infrared (IR) spectral signatures, originally developed by Nakajima and King [5], has been used to infer cloud properties (in particular, effective particle size and optical thickness) acquired from the Moderate Resolution Imaging Spectroradiometer (MODIS) on the National Aero- nautics and Space Administration (NASA) Earth Observing System (EOS) Terra and Aqua platforms, as described by King et al. [6] and Planick et al. [7]. Other algorithms developed by Ou et al. [8], [9] and Minnis et al. [10], [11] have been applied to different satellite sensors such as the Advanced Very High Resolution Radiometer (AVHRR). Baran et al. [12] and Doutriaux-Boucher et al. [13] used Along Track Scanning Radiometer 2 (ASTR-2) and Polarization and Directionality of the Earth’s Reflectances (POLDER) data, respectively; these instruments provide dual or multiple-viewing of a target. Re- cently, the MODIS 0.645- and 1.38- m bands have been used to derive ice cloud reflectance and optical thickness [14], [15]. Such approaches, however, are limited to daytime application because solar illumination is necessary. To derive ice cloud properties using an alternative method- ology that is independent of solar illumination, the IR split window technique [16]–[18] has been developed on the basis of the different absorption properties of ice at the two wave- lengths of 11 and 12 m. High spectral resolution IR radiation measurements have been available from aircraft platforms and are now available from spaceborne platforms. As part of EOS, the Atmospheric Infrared Sounder (AIRS) [19] is designed to provide profiles of atmospheric temperature, moisture, and other gases with high accuracy. The spatial resolution of AIRS is 13.5 km at nadir. Most of the observed AIRS fields of view (FOVs) are not cloud free, and the upwelling IR ra- diances are modulated strongly by ice clouds. The radiances contaminated by clouds are more problematic for sounding retrievals, requiring the use of cloud-clearing techniques [20]. The AIRS has 2378 IR channels, measuring radiances within 649.5–1136.5 cm (15.40–8.80 m), 1216.5–1613.7 cm 0196-2892/04$20.00 © 2004 IEEE

Welcome message from author
This document is posted to help you gain knowledge. Please leave a comment to let me know what you think about it! Share it to your friends and learn new things together.
Transcript

2254 IEEE TRANSACTIONS ON GEOSCIENCE AND REMOTE SENSING, VOL. 42, NO. 10, OCTOBER 2004
Retrieval of Semitransparent Ice Cloud OpticalThickness From Atmospheric Infrared
Sounder (AIRS) MeasurementsHeli Wei, Ping Yang, Jun Li, Bryan A. Baum, Hung-Lung Huang, Steven Platnick, Yongxiang Hu, and Larrabee Strow
Abstract—An approach is developed to infer the optical thick-ness of semitransparent ice clouds (when optical thickness is lessthan 5) from Atmospheric Infrared Sounder (AIRS) high spectralresolution radiances. A fast cloud radiance model is developed andcoupled with an AIRS clear-sky radiative transfer model for simu-lating AIRS radiances when ice clouds are present. Compared withmore accurate calculations based on the discrete ordinates radia-tive transfer model, the accuracy of the fast cloud radiance model iswithin 0.5 K (root mean square) in terms of brightness temperature(BT) and runs three orders of magnitude faster. We investigate thesensitivity of AIRS spectral BTs and brightness temperature dif-ference (BTD) values between pairs of wavenumbers to the cloudoptical thickness. The spectral BTs for the atmospheric windowchannels within the region 1070–1135 cm 1 are sensitive to theice cloud optical thickness, as is the BTD between 900.562 cm 1
(located in an atmospheric window) and 1558.692 cm 1 (locatedin a strong water vapor absorption band). Similarly, the BTD be-tween a moderate absorption channel (1587.495 cm 1) and thestrong water absorption channel (1558.692 cm 1) is sensitive toice cloud optical thickness. Neither of the aforementioned BTDs issensitive to the effective particle size. Thus, the optical thicknessof semitransparent ice clouds can be retrieved reliably. We havedeveloped a spectrum-based approach and a BTD-based methodto retrieve the optical thickness of semitransparent ice clouds. Thepresent retrieval methods are applied to a granule of AIRS data.The ice cloud optical thicknesses derived from the AIRS measure-ments are compared with those retrieved from the Moderate Res-olution Imaging Spectroradiometer (MODIS) 1.38- and 0.645- mbands. The optical thicknesses inferred from the MODIS measure-ments are collocated and degraded to the AIRS spatial resolution.Results from the MODIS and AIRS retrievals are in reasonableagreement over a wide range of optical thicknesses.
Index Terms—Atmospheric Infrared Sounder (AIRS), iceclouds, infrared radiation transfer, optical thickness, retrieval.
Manuscript received February 9, 2004; revised June 16, 2004. This workwas supported in part by the GIFTS-IOMI MURI Project, in part by the Na-tional Science Foundation Physical Meteorology Program (managed by Dr. W.A. Cooper) under CAREER Award Grant ATM-0239605, in part by the Na-tional Aeronautics and Space Administration Radiation Science Program (man-aged by Dr. H. Maring, previously by Dr. D. Anderson) under Research GrantNAG-1-02002, and in part by the National Oceanic and Atmospheric Adminis-tration under ABI/HES Program NA07 EC00676.
H. Wei and P. Yang are with the Department of Atmospheric Sci-ences, Texas A&M University, College Station, TX, 77843 USA (e-mail:[email protected]).
J. Li and H.-L. Huang are with Cooperative Institute for Meteorological Satel-lite Studies, University of Wisconsin-Madison, Madison, WI 53706 USA.
B. A. Baum and Y. Hu are with NASA Langley Research Center, Hampton,VA 23681 USA.
S. Platnick is with the NASA Goddard Space Flight Center, Greenbelt, MD20771 USA.
L. Strow is with the Physics Department, University of Maryland BaltimoreCounty, Baltimore, MD 21250 USA.
Digital Object Identifier 10.1109/TGRS.2004.833780
I. INTRODUCTION
I CE CLOUDS cover a substantial portion of the globe[1] and are important to understanding the earth’s en-
ergy budget and climate [2]–[4]. Because of the difficulty indetecting and analyzing optically thin ice clouds in satelliteimager data, more uncertainties remain for ice clouds thanfor water clouds. In situ measurements of cirrus are relativelyscarce because these clouds are located at high altitudes, andaccurate detection and analysis are problematic. An approachbased on the visible and near-infrared (IR) spectral signatures,originally developed by Nakajima and King [5], has been usedto infer cloud properties (in particular, effective particle sizeand optical thickness) acquired from the Moderate ResolutionImaging Spectroradiometer (MODIS) on the National Aero-nautics and Space Administration (NASA) Earth ObservingSystem (EOS) Terra and Aqua platforms, as described by Kinget al. [6] and Planick et al. [7]. Other algorithms developedby Ou et al. [8], [9] and Minnis et al. [10], [11] have beenapplied to different satellite sensors such as the Advanced VeryHigh Resolution Radiometer (AVHRR). Baran et al. [12] andDoutriaux-Boucher et al. [13] used Along Track ScanningRadiometer 2 (ASTR-2) and Polarization and Directionality ofthe Earth’s Reflectances (POLDER) data, respectively; theseinstruments provide dual or multiple-viewing of a target. Re-cently, the MODIS 0.645- and 1.38- m bands have been usedto derive ice cloud reflectance and optical thickness [14], [15].Such approaches, however, are limited to daytime applicationbecause solar illumination is necessary.
To derive ice cloud properties using an alternative method-ology that is independent of solar illumination, the IR splitwindow technique [16]–[18] has been developed on the basisof the different absorption properties of ice at the two wave-lengths of 11 and 12 m. High spectral resolution IR radiationmeasurements have been available from aircraft platforms andare now available from spaceborne platforms. As part of EOS,the Atmospheric Infrared Sounder (AIRS) [19] is designedto provide profiles of atmospheric temperature, moisture,and other gases with high accuracy. The spatial resolution ofAIRS is 13.5 km at nadir. Most of the observed AIRS fieldsof view (FOVs) are not cloud free, and the upwelling IR ra-diances are modulated strongly by ice clouds. The radiancescontaminated by clouds are more problematic for soundingretrievals, requiring the use of cloud-clearing techniques [20].The AIRS has 2378 IR channels, measuring radiances within649.5–1136.5 cm (15.40–8.80 m), 1216.5–1613.7 cm
0196-2892/04$20.00 © 2004 IEEE
WEI et al.: RETRIEVAL OF SEMITRANSPARENT ICE CLOUD OPTICAL THICKNESS 2255
(8.22–6.20 m), and 2181.3–2665.0 cm (4.58–3.74 m),with a spectral resolution of , where is thewavenumber, and is the width of the band. Recent studieshave shown that the high spectral resolution radiances containimportant information on high-altitude ice clouds [21]–[23].Recently, DeSousa-Machado et al. [24] performed global re-trievals of cloud properties using the AIRS measured radiances.Kahn et al. [25] investigated the infrared spectral feature ofvery small cirrus particles using the AIRS measurements.Huang et al. [26] studied the information content of veryhigh-resolution IR spectra to study thin cirrus clouds.
This study is intended to explore a methodology for retrievingice cloud optical thickness from AIRS radiances. A fast cloudradiance model is developed to provide the forward simulationswhen ice clouds are present. Sensitivity studies are carried outto investigate the relationship between the IR spectral bright-ness temperatures (BTs) and the brightness temperature differ-ence (BTD) between pairs of channels to the optical propertiesof ice clouds. Based on the sensitivity study, an algorithm is de-veloped for inferring the optical thickness of semitransparentice clouds. The AIRS-based retrieval results are compared withthose derived from the MODIS 1.38- and 0.645- m bands thathave been collocated and spatially degraded to match the AIRSFOVs.
This paper is organized as follows. Section II discusses thefast radiative transfer model for cloudy conditions. The sensi-tivity studies and the retrieval algorithm for deriving ice cloudoptical thickness are presented in Sections III and IV. A casestudy is presented in Section V. A brief discussion and summaryare given in Section VI.
II. FAST CLOUD RADIATIVE TRANSFER MODEL
Although an existing radiative transfer model, such as theline-by-line atmospheric molecular optical thickness computa-tion [27], can be combined with the discrete ordinates radiativetransfer (DISORT) [28] method to simulate cloud high-resolu-tion IR spectral radiances, the computational requirements arequite demanding. A fast, yet accurate, model for simulating highspectral resolution cloud radiances would be quite useful forAIRS analyses. Strow et al. [29], [30] developed a fast modelto simulate clear-sky AIRS radiances. The fast model uses re-alistic profiles to produce the transmittance coefficients for at-mospheric gas constituents within an atmosphere modeled ashaving a discrete number of vertical layers. The effective layertransmittances for a given profile are computed quickly by cal-culating the appropriate predictor values for the profile and mul-tiplying them by the coefficients. Fishbein et al. [31] simulatedAIRS radiances by adding a random variable cloud amount. Ourapproach to the development of a fast cloud radiative transfermodel is presented in the following section.
A. Single-Scattering Properties of Ice Clouds
Ice clouds are composed of ice crystals with complex non-spherical shapes. The importance of using more realistic icecrystal scattering models in satellite imager-based retrievals hasbeen demonstrated by Mishchenko et al. [32]. Heymsfield andIaquinta [33] showed that in the upper portions of cirrus clouds,
the ice particles tend to be quite small, with aspect ratios (i.e.,the ratio of particle length to its width) close to unity. Yang et al.[34] suggested that the shape of these small ice crystals maybe represented by the droxtal geometry. In situ measurementsfrom the First International Satellite Cloud Climatology ProjectRegional Experiment-II (FIRE-II) held in Coffeyville, KS, in1991, have shown that the middle layers of midlatitude synop-tical-scale cirrus clouds are often composed of pristine particlessuch as hexagonal columns (see [33, Fig. 15]). In the lower por-tions of cirrus clouds, the ice particles tend to be larger and com-posed of irregular aggregates. Based on these observations, weassume a general habit distribution for ice clouds: droxtals forsmall particles (0–50 m), pristine hexagonal columns for mod-erately sized particles (50–300 m), and aggregates for largeparticles m .
There are numerous methods for computing the single-scat-tering properties of nonspherical ice crystal particles (see [35]and references cited therein), but no one method is applicableto calculate the single-scattering properties of ice crystals witha variety of shapes and sizes. In the present study, the scatteringefficiencies, absorption efficiencies, and asymmetry factors ofdroxtals, pristine hexagonal columns, and aggregates are com-puted using the finite-difference time-domain (FDTD) method[36], [37] for small particles. A composite method originallydeveloped by Fu et al. [38], [39] is used to derive the extinc-tion efficiencies, absorption efficiencies, and asymmetry factorfor moderate to large particles from a combination of an im-proved geometric optics method (IGOM) [40] and an equivalentsphere approximation. The technical details of this approach canbe found in [38], [39], and [41].
Ice particle extinction efficiency, absorption efficiency, andasymmetry factor are shown in Fig. 1 as functions of the par-ticle maximum dimension (left panel) and effective particle size(right panel) for randomly oriented droxtals, pristine hexagonalcolumns, and aggregates. The effective diameter or effectiveparticle size of a crystal is defined as the ratio of its volumeto its projected area and multiplied by 1.5. The aspect ratioand geometry of hexagonal columns are defined by Yang et al.[41]. The geometries of the droxtal and aggregate are defined byZhang et al. [42] and Yang and Liou [43], respectively. We com-pute the single-scattering properties in 76 size bins ranging from1–10 000 m (in maximum dimension) for hexagonal columns,36 size bins from 1–10 000 m for aggregates, and 28 size binsfrom 1–1000 m for droxtals.
The extinction efficiencies have several maxima due to thephase interference of waves through the particles. The positionsand amplitudes of maxima are different for each crystal habit.The first maximum in the extinction efficiency occurs at max-imum dimensions of 14.3, 18.1, and 55.9 m for the hexagonalcolumn, droxtal, and aggregate, respectively. For small particleshaving aspect ratios close to unity, the hexagonal column hasthe largest volume and effective diameter because the maximumdimension of a hexagon column is defined as its length, whilethe aggregate has smallest volume and effective diameter. Note,however, that the use of the aggregate shape may not be very re-alistic for the simulation of very small crystals. The first peak ofthe extinction efficiency occurs at a smaller particle dimension

2256 IEEE TRANSACTIONS ON GEOSCIENCE AND REMOTE SENSING, VOL. 42, NO. 10, OCTOBER 2004
for hexagonal crystals than for droxtals and aggregates. Addi-tionally, the first peak of the extinction efficiency for droxtalsfalls between those for the hexagonal column and the aggregate.When the maximum dimension of an ice crystal is larger than500 m, the extinction efficiencies for the three ice habits con-verge to 2, the asymptotic limit of the geometric optics solution.The optical properties as functions of effective size are providedon the right panel of Fig. 1. The differences are smaller relativeto the left panel, particularly for small particle sizes. The mainpoint is that the scattering properties of ice crystals are differentover a wide range of particle sizes.
The comparisons of absorption efficiencies and asymmetryfactors for the three habits are quite similar to the case for theextinction efficiency. Although the patterns of these curves forthree ice crystal habits are similar, the amplitudes or the posi-tions of the maxima for each habit are different. When the parti-cles are large, the absorption efficiencies and asymmetry factorsgradually converge to their asymptotic values. The tunneling ef-fect discussed by Baran et al. [44], [45] may partially explainthe difference of absorption efficiency for the various habits.Mitchell [46] and Mitchell et al. [47] discussed and measuredthe contribution of photon tunneling to extinction and absorp-tion efficiencies.
Bulk ice cloud single-scattering properties are derived by av-eraging the single-scattering properties of individual ice crys-tals over 30 particle size distributions adopted from [38]. Theaverage is carried out with respect to the ice crystal maximumdimension, and particles sizes can range from 1–10 000 m. Thewavenumber-dependent bulk extinction efficiencies, absorptionefficiencies, and asymmetry factors are parameterized subse-quently as functions of the effective particle sizes using the samemethod as [48].
Fig. 2 shows the mean extinction efficiencies, absorption ef-ficiencies, asymmetry factors, and single-scattering albedos de-rived from the parameterizations at four wavenumbers: 900,1102, 1231, and 1587 cm . The wavenumber 1102 cm ischosen because it is located in the middle of the atmosphericwindow between 1070–1135 cm .
The single-scattering properties of these wavenumbersshowed in Fig. 2 are used in following sections to retrieve icecloud properties. The single-scattering properties for each dis-tribution are strongly dependent on the effective particle size inthe IR region, particularly for small sizes and are also sensitiveto the wavenumber. The sensitivity to crystal size betweenthose wavenumbers is due fundamentally to the change incomplex refractive index for ice between those wavenumbers.Because the wavenumber at 900 cm is located in a strongice absorption band, the absorption efficiency is larger, andthe single-scattering albedo is smaller than at other wavenum-bers, particularly for particles of small effective diameter. Thedifference between the single-scattering albedos at 1231 and900 cm increases with decreasing effective particle size. Asa result, some information regarding particle size is containedin the BTD between these two channels. The BTD betweenthese two channels has been used to infer particle size by someinvestigators [49]. The single-scattering properties at 1102,1231, and 1587 cm have similar variations with effective
particle size; thus, the ice cloud BTD between these threewavebumbers depends less on effective particle size.
B. Coupling the Fast Cloud Model With the Clear-SkyAIRS Model
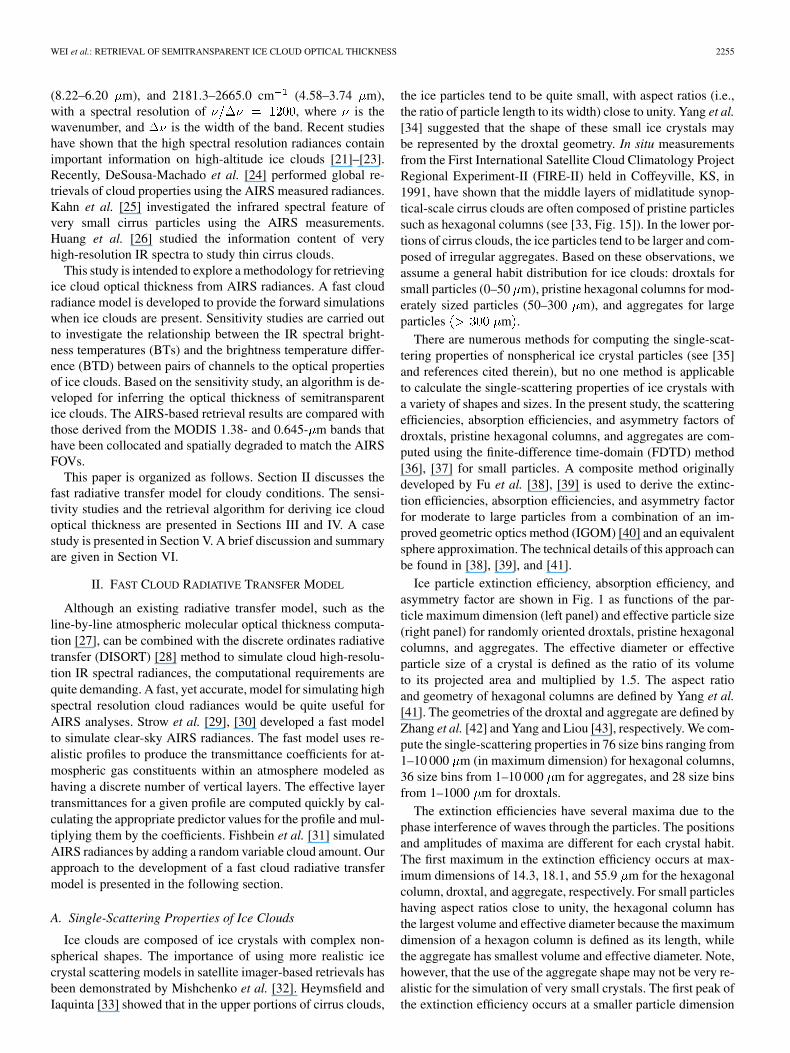
The ice cloud reflection and transmission functions can becoupled with the AIRS clear-sky fast radiative transfer modeldeveloped by Strow et al. [30]. We refer to this combinationas the “fast cloud ratiative transfer (RT)” model, which isshown schematically in Fig. 3. In the model, we assume thatthe clouds are located in a plane-parallel, single homogeneous,and isothermal layer in a given FOV. The vertical arrows inFig. 3 indicate the isotropic radiation, while the slanted arrowsrepresent radiation that is dependent on the observing zenithangle. The terms T and R in the figure are transmissionand reflection functions of clouds, respectively. , inwhich is the satellite observing zenith angle. The upwellingradiances at the top of the atmosphere (TOA) are composed ofthe following four parts.
1) The transmission of emission from the lower atmosphereand the surface, and the radiation reflected by the surface
, in which T is the transmission of clouds(including direct transmission and diffuse transmission).I is the upward radiation at cloud-base (including the ra-diation from the surface, the lower atmosphere, and sur-face reflectance)
(1)
where is the surface emisivity, and is clear-sky at-mospheric transmittance from the TOA to some altitude.
is the atmospheric transmittance from the TOA tothe surface. is atmospheric transmittance from TOAto cloud-top. is atmospheric transmittance betweencloud base and the surface. is the surface temperature.
is the Planck radiance at temperature , is thedownward radiation at the surface from the atmosphereand clouds, and is the radiation reflected by thesurface. Because the surface reflectance in the IR region issmall, only the first-order scattering between the surfaceand clouds is considered. The multiple-scattering eventsbetween the surface and clouds are ignored. The upwardradiation below the cloud is assumed to be isotropic in IRregion.
2) The radiation emitted from the clouds, denoted as ,in which is the cloud radiation given by
(2)
where is the reflectance of the clouds, and is thecloud temperature.
3) The atmospheric radiation emitted above the cloud ,given by
(3)

WEI et al.: RETRIEVAL OF SEMITRANSPARENT ICE CLOUD OPTICAL THICKNESS 2257
Fig. 1. Comparisons of the single-scattering properties of randomly oriented droxtals, hexagons, and aggregates at a wavenumber of 1250 cm as functions of(left) maximum dimension and (right) effective particle size.
Fig. 2. Parameterized mean extinction efficiency, absorption efficiency,asymmetry factor, and single-scattering albedo as a function of effectivediameter for four wavenumbers.
4) The reflected radiation by the clouds from the upper at-mosphere , in which the is the downwardradiation at the top of the cloud
(4)
where is the solar radiation. is solar zenith angle. Inthe mid-IR region, the contribution from solar radiation issmall compared with the radiation emitted from the sur-face and the atmosphere.
The total radiation at the top of atmosphere is the sum of thefour parts
(5)
The downwelling radiation at the surface in (1) is
(6)
2258 IEEE TRANSACTIONS ON GEOSCIENCE AND REMOTE SENSING, VOL. 42, NO. 10, OCTOBER 2004
Fig. 3. Schematic of IR radiative transfer in a cloudy atmosphere.
The atmospheric transmittance from the TOA to each layercan be calculated from the AIRS clear-sky fast model [30].
Given the observing zenith angle, wavenumber, cloud effectiveparticle size, and optical thickness, the cloud transmission andreflection functions are computed through interpolation usingthe precomputed database described in Section II-C. The radi-ance at the top of the atmosphere in direction can be efficientlycalculated from (1)–(6).
C. Database of Reflection and Transmission Functions forIce Clouds
If the radiation emitted from the surface and atmospherebelow the cloud is isotropic, the ice cloud reflection and trans-mission functions can be calculated by the DISORT method[28]. Because the ice particle’s size parameter is large at avisible wavelength (e.g., 0.55 m), the extinction efficiency ata visible wavelength is close to the geometric optics asymptoticvalue of 2. At other wavelengths, the optical thickness can beapproximated by
(7)
where is the mean extinction efficiency at the wave-length of , and is the ice cloud optical thickness at a visiblewavelength (say 0.55 m). The optical thickness involved in theremainder of the study is defined as being relative to that at thevisible wavelength.
Detailed information on the phase function is unnecessaryfor radiative transfer calculations at IR wavenumbers becausethe mutiple-scattering effect is only on the order of a fewpercent. The Henyey–Greenstein (H–G) phase function is oftenused as an approximation to the phase function in the AIRSIR wavelength region [50], [51]. The H–G phase functioncan be derived from the parameterization of the asymmetry
factor in a straightforward manner. Thus, the single-scatteringalbedo, optical thickness, and scattering phase function can bederived from the aforementioned parameterizations, given thewavenumber, visible optical thickness, and effective particlesize. These single-scattering parameters are input into DISORTfor the computation of the reflection and transmission func-tions. In this manner, a database of reflection and transmissionfunctions is derived at satellite observing zenith angles rangingfrom 0 to 80 , wavelengths ranging from 3–20 m, opticalthicknesses ranging from 0.04–100, and effective particle sizesranging from 15–200 m. The database is prepared in advanceand used for fast interpolation during the radiance simulation.
D. Comparisons Between the Fast Cloud Model With DISORT
The fast cloud RT model is validated by comparing the bright-ness temperatures from this method to the more precise calcula-tions obtained from DISORT. An example involving cloud op-tical thickness is shown in Fig. 4. The atmospheric profile inthe calculation is from the European Center for Medium-RangeWeather Forecasts (ECMWF) model data. The cloud-top tem-perature is assumed to be 222 K, and the surface temperature is291.4 K. The BTD between DISORT and the fast cloud modelis less than 0.5 K (root mean square) for most cloudy cases.Because the database of reflection and transmission functionsis precalculated, and the interpolation from the lookup tablerequires little computational time, the fast model is quite effi-cient computationally. On the basis of some computations on adesktop workstation (Dell 530), our fast model requires 0.1 sof CPU time to calculate radiances for a 100-layer atmospherewith one cloud layer for 2378 AIRS channels. It takes 279 s torun 16 streams DISORT for the same set of conditions. The fastmodel runs more than three orders of magnitude faster than thecorresponding DISORT.
III. SENSITIVITY STUDIES
In the following discussions, we study the sensitivity of AIRSspectral BTs or BTD to the ice cloud microphysical properties.
A. Optical Thickness
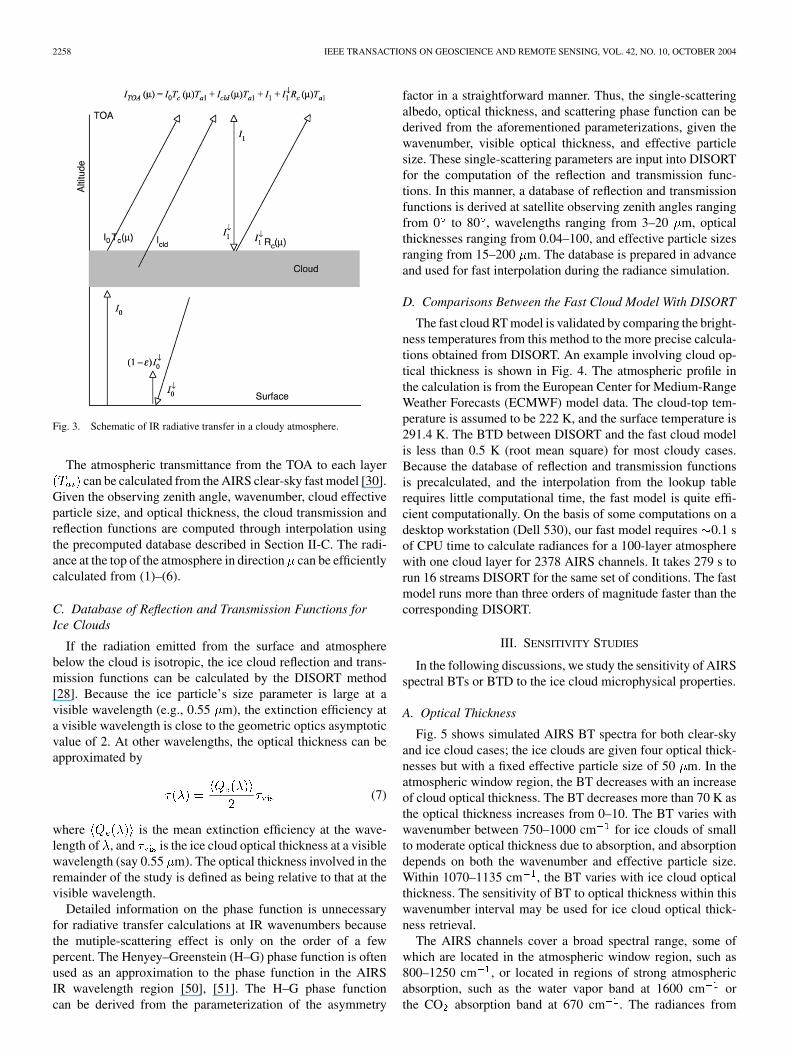
Fig. 5 shows simulated AIRS BT spectra for both clear-skyand ice cloud cases; the ice clouds are given four optical thick-nesses but with a fixed effective particle size of 50 m. In theatmospheric window region, the BT decreases with an increaseof cloud optical thickness. The BT decreases more than 70 K asthe optical thickness increases from 0–10. The BT varies withwavenumber between 750–1000 cm for ice clouds of smallto moderate optical thickness due to absorption, and absorptiondepends on both the wavenumber and effective particle size.Within 1070–1135 cm , the BT varies with ice cloud opticalthickness. The sensitivity of BT to optical thickness within thiswavenumber interval may be used for ice cloud optical thick-ness retrieval.
The AIRS channels cover a broad spectral range, some ofwhich are located in the atmospheric window region, such as800–1250 cm , or located in regions of strong atmosphericabsorption, such as the water vapor band at 1600 cm orthe CO absorption band at 670 cm . The radiances from
WEI et al.: RETRIEVAL OF SEMITRANSPARENT ICE CLOUD OPTICAL THICKNESS 2259
Fig. 4. Brightness temperature spectra calculated using the fast model anddeviations relative to the more “exact” DISORT model (�BT) for a clear-skycase and three ice cloud optical thicknesses, assuming that the effective particlesize is 50 �m, the cloud-top temperature is 222 K, and the surface temperatureis 291.4 K.
Fig. 5. Simulated upwelling brightness temperature spectra at the top of theatmosphere for a clear-sky case and four ice cloud optical thicknesses (listed inthe figure, corresponding to the curves from top to bottom) assuming an effectiveparticle size of 50 �m, a cloud temperature of 222 K, and a surface temperatureof 291.4 K.
wavenumbers located in strong absorption bands contain upperatmospheric information. However, radiances at window chan-nels include information from the surface and lower atmosphere,depending on the opacity of any clouds or aerosols that maybe present in the column. Four channels marked as A, B, C,and X in Table I are used to study the sensitivity of AIRS
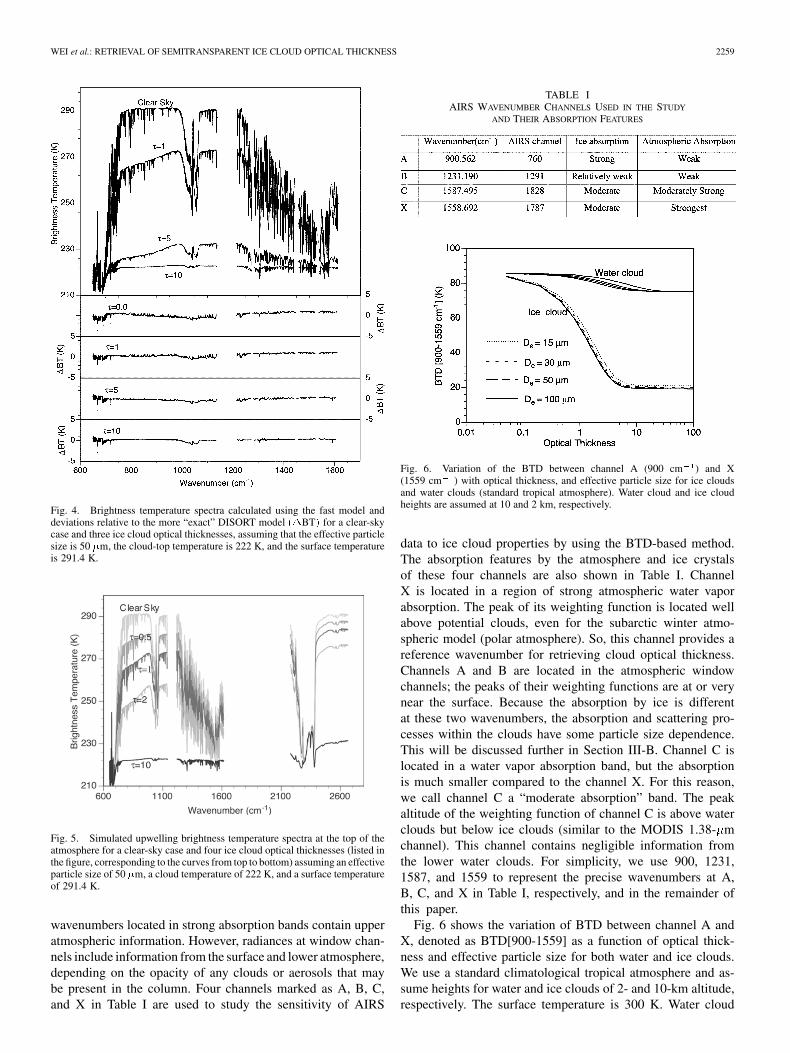
TABLE IAIRS WAVENUMBER CHANNELS USED IN THE STUDY
AND THEIR ABSORPTION FEATURES
Fig. 6. Variation of the BTD between channel A (900 cm ) and X(1559 cm ) with optical thickness, and effective particle size for ice cloudsand water clouds (standard tropical atmosphere). Water cloud and ice cloudheights are assumed at 10 and 2 km, respectively.
data to ice cloud properties by using the BTD-based method.The absorption features by the atmosphere and ice crystalsof these four channels are also shown in Table I. ChannelX is located in a region of strong atmospheric water vaporabsorption. The peak of its weighting function is located wellabove potential clouds, even for the subarctic winter atmo-spheric model (polar atmosphere). So, this channel provides areference wavenumber for retrieving cloud optical thickness.Channels A and B are located in the atmospheric windowchannels; the peaks of their weighting functions are at or verynear the surface. Because the absorption by ice is differentat these two wavenumbers, the absorption and scattering pro-cesses within the clouds have some particle size dependence.This will be discussed further in Section III-B. Channel C islocated in a water vapor absorption band, but the absorptionis much smaller compared to the channel X. For this reason,we call channel C a “moderate absorption” band. The peakaltitude of the weighting function of channel C is above waterclouds but below ice clouds (similar to the MODIS 1.38- mchannel). This channel contains negligible information fromthe lower water clouds. For simplicity, we use 900, 1231,1587, and 1559 to represent the precise wavenumbers at A,B, C, and X in Table I, respectively, and in the remainder ofthis paper.
Fig. 6 shows the variation of BTD between channel A andX, denoted as BTD[900-1559] as a function of optical thick-ness and effective particle size for both water and ice clouds.We use a standard climatological tropical atmosphere and as-sume heights for water and ice clouds of 2- and 10-km altitude,respectively. The surface temperature is 300 K. Water cloud

2260 IEEE TRANSACTIONS ON GEOSCIENCE AND REMOTE SENSING, VOL. 42, NO. 10, OCTOBER 2004
Fig. 7. Same as Fig. 6, but for the BTD between channel C (1587 cm ) andX (1559 cm ).
Fig. 8. Simulated upwelling brightness temperature at the top of theatmosphere for three ice cloud effective particle sizes. The optical thickness isfixed at a value of 2.
scattering properties are calculated from Lorenz–Mie theory, as-suming Gamma particle size distributions. The BTD[900-1559]is sensitive to optical thickness of ice clouds, with the value ofthe BTD increasing to more than 60 K as the optical thicknessincreases from 0–5. The BTD[900-1559] is essentially indepen-dent of the effective particle size. Note that the BTD[900-1559]for ice clouds no longer has any sensitivity once the opticalthickness becomes larger than 10. As for water clouds, the sen-sitivity of the BTD optical thickness is much smaller than thatfor ice clouds, providing an indication that the BTD[900-1559]is not very sensitive to low-level water clouds.
Fig. 7 shows the similar calculations for BTD between chan-nels C and X, denoted as BTD[1587-1559]. Although channelC (1587 cm ) is located in a water vapor absorption band, thebrightness temperature is nearly 40 K higher than for channelX (1559 cm ) under clear sky conditions. The BTD betweenchannels C and X is also sensitive to optical thickness, but insen-sitive to effective particle size. The BTD[1587-1559] decreasesto 20 K as optical thickness increases from 0–5. Fig. 7 alsoshows the behavior of the BTD for a water cloud. Since the BTDbetween these two channels contains no information on lowerlevel water clouds, only the optical thickness of ice clouds isderived from the BTD[1587-1559].
Fig. 9. BTD between channel B and A (BTD1231-900) as a function of icecloud optical thickness and effective particle size.
The results in Figs. 5–7 may be summarized as follows. Somesensitivity to ice cloud optical thickness is contained in the spec-tral BTs within the atmospheric windows channels or BTD[900-1559] or BTD[1587-1559]. However, there is little sensitivity tothe presence of low-level water clouds.
B. Effective Size
The sensitivity of the BT spectra to the effective particle sizeis demonstrated in Fig. 8. The slope of the BT at wavenum-bers between 790–960 cm is sensitive to the effective particlesize, especially for small particles. The slope of BT within thiswavenumber range increases with a decrease of particle size.But the sensitivity decreases significantly once the effective par-ticle size approaches or exceeds 50 m. The sensitivity is alsorelated to optical thickness.
One of the widely used retrieval algorithms is the so-calledsplit window technique [16], which is based on the differentabsorption features of ice at two channels located in the atmo-spheric window. Ackerman et al. [52] studied the BTD between8–11 m of aircraft-based IR interferometer observations for re-trieving cirrus cloud properties. Similarly, we show the variationof BTD[1231-900] with optical thickness and effective particlesizes of ice clouds in Fig. 9. The BTD between these two chan-nels is relatively insensitive to the optical thickness, but sensitiveto small particle sizes for semitransparent ice cloud, since thesingle-scattering albedoes of ice clouds at these two channelsvary differently with effective size for small particle ice clouds[see Fig. 2(d)].
C. Ice Cloud Identification
Because the absorption between channels A and B is greatlydifferent for water and ice clouds, Strabala et al. [49] and Baumet al. [53] used the BTD between 8.5–11 m (which is close tothe channels B and A defined in present studies) to determinecloud thermodynamic phase. We also calculate the BTD be-tween 1231 and 900 cm for water clouds, as shown in Fig. 10.Compared to Fig. 9, Fig. 10 shows that BTD[1231-900] for icecloud tends to be positive or close to zero when the optical thick-ness is larger than 0.5, and the BTD[1231-900] for water cloudsis always negative and usually less than 2 K. The difference

WEI et al.: RETRIEVAL OF SEMITRANSPARENT ICE CLOUD OPTICAL THICKNESS 2261
Fig. 10. BTD between channel B and A (BTD1231-900) as a function of watercloud optical thickness and effective particle size.
of BTD[1231-900] for ice clouds and water clouds is used foridentifying the ice cloud FOV in the study (see next section ).
IV. ICE CLOUD OPTICAL THICKNESS RETRIEVAL
METHOD AND ERROR ANALYSIS
A. Retrieval Methods
Based on the sensitivity studies in Section III, we develop twoapproaches to derive ice cloud optical thickness, one based onthe spectral BTs within the window and one based on BTDs.In the spectrum-based approach, spectral BTs at atmosphericwindow channels (1070–1135 cm ) are used to retrieve icecloud optical thickness. The slope in brightness temperature be-tween 790–960 cm is used to adjust the effective particle sizeduring the retrieval. In the BTD-based method, the BTD[900-1559] and the BTD[1587-1559] are used to retrieve ice cloudoptical thickness.
The methodology is applied to an AIRS granule of data, butthe retrieval in this paper is limited to the AIRS FOVs wherean ice cloud is present. The MODIS bispectral IR approach forthermodynamic phase [7], [53] is used to select FOVs that con-tain ice clouds for the optical thickness retrieval. Based on thesimulation in Figs. 9 and 10, we assume an FOV contains someice clouds if the BT at 900 cm is lower than 238 K, or theBTD[1231-900] is higher than 0.5 K, or the BTD[1231-900] ishigher than 0.5 K and BT900 is higher than 285 K.
To simulate the BTs of AIRS observations, atmosphericprofiles from the ECMWF gridded meteorological product arecollocated to AIRS pixels in time and location. The profilesinclude the atmospheric temperature, water vapor, and ozone.These atmospheric profiles are interpolated to 101 pressurelevels and input to the AIRS fast cloud model to calculate theclear-sky and cloud AIRS radiances. Cloud-top pressure isprovided in the MODIS cloud products [7]. The most probableMODIS cloud-top pressure within an AIRS FOV is chosen as acollocated cloud-top pressure.
The flowchart for retrieving ice cloud optical thickness isshown in Fig. 11. Given an initial optical thickness and effectiveparticle size, the mean brightness temperature difference BTbetween the observed and simulated from 1070–1135 cm iscomputed using the fast cloud model. The ice cloud opticalthickness is adjusted until BT is below a threshold
Fig. 11. Flowchart for the retrieval algorithm of ice cloud optical thickness.
K , resulting in a “first guess” optical thickness. Subse-quently, the effective particle size is adjusted until the simu-lated slope between 790–960 cm matches the observed slope.The final ice optical thickness is produced when both the sim-ulated BTs between 1070–1135 cm and the slope between790–960 cm match the measurements.
The BTD-based retrieval procedure, using the BTD[900-1559] or BTD[1587-1559], are almost the same as the retrievalprocedure from the spectrum-based approach mentioned inthe previous paragraph, except that the mean difference be-tween observed and simulated BTs from 1070–1135 cmis replaced by the difference between simulated and AIRSobserved BTD[900-1559] and BTD[1587-1559], respectively.Finally, the results based on the BTD[900-1559] are used forthe comparison with MODIS.
B. Error Analysis
The accuracy of the retrieved cloud optical thickness de-pends on the accuracy of both measurements and simulations,which involve both the radiative transfer model and cloudsingle-scattering properties. A number of factors will affect themodel accuracy, such as uncertainty in the surface temperature,surface emissivity, cloud-top temperature, and atmosphericprofiles, along with the inhomogeneous and partial cloudinesswithin a pixel. Partial and inhomogeneous cloudiness within aFOV is not considered in the present fast cloud radiative transfermodel. Thus, the result from application of our model is theaverage optical thickness over an AIRS FOV. The uncertaintyof the clear-sky fast model is less than 0.1 K within atmosphericwindow channels [30]. The uncertainty of our fast cloud modelis generally within 0.5 K. Thus, the most uncertainty in theinferred optical thickness probably stems from the errors ofatmospheric profile, cloud-top temperature, and the surfacetemperature.
Huang et al. [21] studied the effects of surface temperatureand cloud temperature on the retrieved accuracy of cloud opticalthickness using airborne IR spectral observations. The generalconclusions of their study are as follows. The error of cloud-top
2262 IEEE TRANSACTIONS ON GEOSCIENCE AND REMOTE SENSING, VOL. 42, NO. 10, OCTOBER 2004
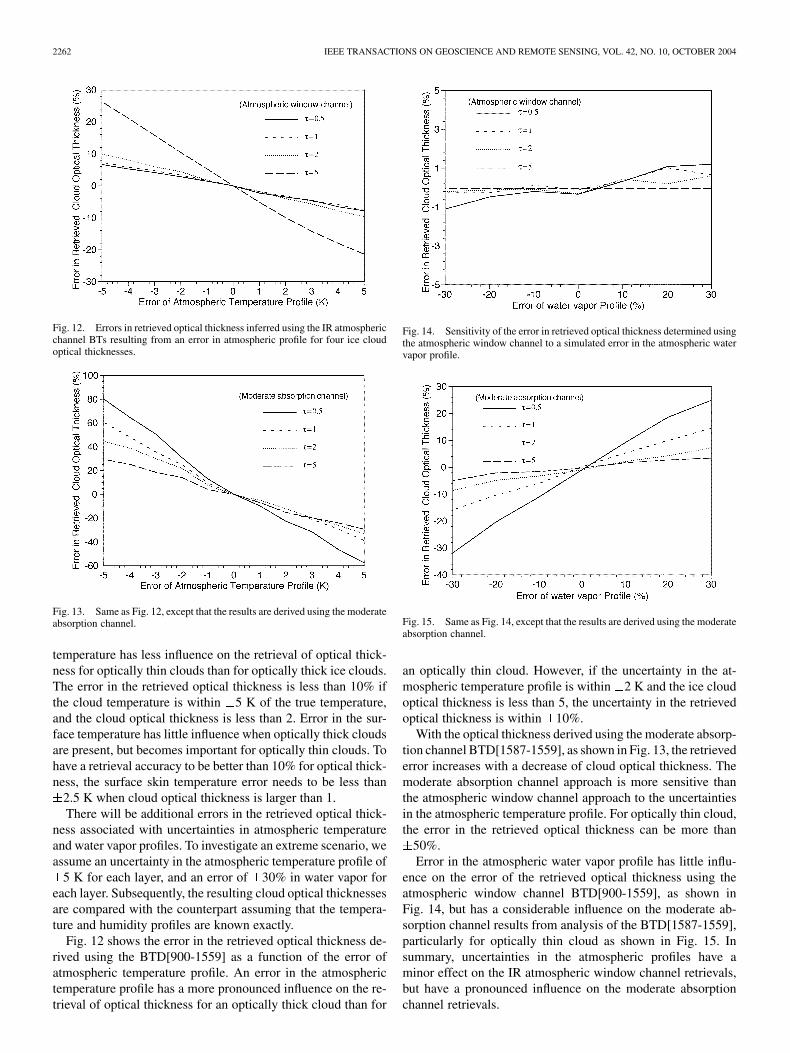
Fig. 12. Errors in retrieved optical thickness inferred using the IR atmosphericchannel BTs resulting from an error in atmospheric profile for four ice cloudoptical thicknesses.
Fig. 13. Same as Fig. 12, except that the results are derived using the moderateabsorption channel.
temperature has less influence on the retrieval of optical thick-ness for optically thin clouds than for optically thick ice clouds.The error in the retrieved optical thickness is less than 10% ifthe cloud temperature is within 5 K of the true temperature,and the cloud optical thickness is less than 2. Error in the sur-face temperature has little influence when optically thick cloudsare present, but becomes important for optically thin clouds. Tohave a retrieval accuracy to be better than 10% for optical thick-ness, the surface skin temperature error needs to be less than
2.5 K when cloud optical thickness is larger than 1.There will be additional errors in the retrieved optical thick-
ness associated with uncertainties in atmospheric temperatureand water vapor profiles. To investigate an extreme scenario, weassume an uncertainty in the atmospheric temperature profile of
5 K for each layer, and an error of 30% in water vapor foreach layer. Subsequently, the resulting cloud optical thicknessesare compared with the counterpart assuming that the tempera-ture and humidity profiles are known exactly.
Fig. 12 shows the error in the retrieved optical thickness de-rived using the BTD[900-1559] as a function of the error ofatmospheric temperature profile. An error in the atmospherictemperature profile has a more pronounced influence on the re-trieval of optical thickness for an optically thick cloud than for
Fig. 14. Sensitivity of the error in retrieved optical thickness determined usingthe atmospheric window channel to a simulated error in the atmospheric watervapor profile.
Fig. 15. Same as Fig. 14, except that the results are derived using the moderateabsorption channel.
an optically thin cloud. However, if the uncertainty in the at-mospheric temperature profile is within 2 K and the ice cloudoptical thickness is less than 5, the uncertainty in the retrievedoptical thickness is within 10%.
With the optical thickness derived using the moderate absorp-tion channel BTD[1587-1559], as shown in Fig. 13, the retrievederror increases with a decrease of cloud optical thickness. Themoderate absorption channel approach is more sensitive thanthe atmospheric window channel approach to the uncertaintiesin the atmospheric temperature profile. For optically thin cloud,the error in the retrieved optical thickness can be more than
50%.Error in the atmospheric water vapor profile has little influ-
ence on the error of the retrieved optical thickness using theatmospheric window channel BTD[900-1559], as shown inFig. 14, but has a considerable influence on the moderate ab-sorption channel results from analysis of the BTD[1587-1559],particularly for optically thin cloud as shown in Fig. 15. Insummary, uncertainties in the atmospheric profiles have aminor effect on the IR atmospheric window channel retrievals,but have a pronounced influence on the moderate absorptionchannel retrievals.

WEI et al.: RETRIEVAL OF SEMITRANSPARENT ICE CLOUD OPTICAL THICKNESS 2263
Fig. 16. Image derived using the AIRS brightness temperature for channel 760(11.1 �m, 900.562 cm ).
V. CASE STUDY
The preceding methodology is applied to an entire granuleof AIRS data. Fig. 16 is an image of the channel 760 (11.1 m;900.562 cm ) brightness temperatures at 1917 UTC onSeptember 6, 2002. The center of the image is located at(94 W, 42 N) over the central United States. There are 90135 FOVs in the granule. The solar zenith angle ranges from24.6 to 51.6 . The satellite scanning zenith angle ranges from0 to 57.1 . Our analyses are limited to the AIRS FOVs whereice clouds are present. The FOVs of ice clouds are determinedby analysis of the BT at 900 cm and BTD[1231-900] asdiscussed earlier. We assume a land-model surface spectralemission in the retrieval. The emissivity varies between 0.91and 0.998 in IR 500–3000 cm . The retrievals of opticalthickness are based on the AIRS BTs or BTDs for the followingspectral region and bands: 1) 1070–1135 cm spectral data;2) 900 and 1559 cm ; and 3) 1587 and 1559 cm , respec-tively. The retrieved optical thickness based on BTD[900-1559]is compared with the results from MODIS 0.645- and 1.38- mbands.
A. Spectrum-Based Ice Cloud Optical Thickness Retrieval
Fig. 17 shows the retrieved ice clouds optical thickness de-rived from data within the 1070–1135 cm spectral region.The horizontal and vertical axes in Fig. 17 indicate crosstrackand along-track FOVs in the AIRS granule, respectively. Theoptical thickness results in Fig. 17 and subsequent figures areprovided using a logarithmic scale to better display the range ofvalues. In some FOVs, the optical thickness is much larger (redor dark red pixels), indicating areas of convection.
Fig. 18 shows comparisons between simulated and observedAIRS spectral BTs for two FOVs. The brightness temperaturedifferences between observations and simulations are alsoshown in the bottom panels of Fig. 18. One FOV [upper curvesin Fig. 18(a) and (b)] contains extremely thin cirrus, and the
Fig. 17. Ice cloud optical thickness retrieved using AIRS 1070–1135 cmspectral data.
Fig. 18. Comparisons between simulated and observed AIRS spectral BTs forclear and cloudy sky scenes within (a) an atmospheric window band and (b) thewater vapor (strong absorption) band. The brightness temperature differences(�BT) between observations and simulations are also shown.
retrieved optical thickness is 0.17. The other FOV [lower curvesin Fig. 18(a) and (b)] is chosen from an optically thick ice cloudwhere the retrieved optical thickness is 8.67. The BTs for theatmospheric window channels are at about 220 K, and there areno atmospheric molecular absorption features. Fig. 18(a) showsthe comparison of simulated to observed cloud radiances withinthe atmospheric window channels (750–1135 cm ). The sim-ulated BT compares well with observed AIRS data both forclear and cloudy skies except in the 9.6 m O absorption bandand is probably due to limitations in the ECMWF model fields.Within a strong water vapor absorption band (e.g., 6.2 m)shown in Fig. 18(b), the agreement between the simulated BTsand observed BTs is still close, although the variation in BTdue to ice clouds is much smaller than in the window channels.
The retrieval based on the BTD[900-1559] provides similaroptical thickness results to those in Fig. 17. Fig. 19 shows ascatterplot based on a comparison of retrieved optical thicknessfrom AIRS atmospheric window spectral channels (1070–1135cm ) to values based on AIRS BTD[900-1559]. Basically,the retrieved results from our spectrum-based approach and

2264 IEEE TRANSACTIONS ON GEOSCIENCE AND REMOTE SENSING, VOL. 42, NO. 10, OCTOBER 2004
Fig. 19. Comparison of the ice cloud optical thickness retrieved from AIRSatmospheric window spectral channels (1070–1135 cm ) and the AIRSBTD[900-1559].
the BTD-based method compare well with each other; thedeviation (root mean square) is 0.115.
B. Comparison of AIRS With MODIS Optical ThicknessRetrievals
It is useful to compare the AIRS-derived optical thicknesswith that derived from the MODIS 0.645- and 1.38- mreflectance bands [14]. In this study, we have chosen to usethese two bands rather than the operational product basedon the 0.645-, 1.6-, and 2.1- m bands discussed by Platnicket al. [7]. The 1.38- m band is quite sensitive to upper levelclouds. Meyer et al. [15] developed a method to retrieve theoptical thickness of tropical ice clouds using MODIS 0.645-and 1.38- m reflectances. In their approach, an optical thick-ness lookup library is generated using previously calculatedsingle-scattering data in conjunction with the DISORT radia-tive transfer model. The inference of optical thickness for eachpixel in a MODIS granule is based on this lookup library. TheMODIS nadir spatial resolution for the 0.645- and 1.38- mbands is 1 km, whereas the AIRS spatial resolution is 13.5 km.To compare the MODIS and AIRS results, MODIS opticalthicknesses are collocated with each AIRS FOV and degradedto match the AIRS spatial resolution [54] by averaging the op-tical thickness over all MODIS pixels within each AIRS FOV.An AIRS FOV can include up to 250 MODIS pixels. Fig. 20shows the spatially degraded mean ice cloud optical thicknessimage derived from MODIS 1.38- and 0.645- m channels.From comparison of Fig. 17 and Fig. 20, it may be seen that theoverall features of the AIRS retrieved ice cloud optical thick-nesses and MODIS results are in reasonable agreement. Fig. 21shows a scatterplot comparing the ice cloud optical thicknessfrom MODIS and AIRS BTD[900-1559]. The retrieved opticalthickness from AIRS coincides with that from MODIS for thinto moderate thick cirrus clouds (optical thickness less than5). Retrieved optical thickness for AIRS tends to be smallercompared to MODIS as optical thickness increases. This ismay be due to the saturation of the BTD signal for large optical
Fig. 20. Retrieved ice cloud optical thickness inferred from use of the MODIS0.645- and 1.38-�m bands.
Fig. 21. Comparison of the ice cloud optical thickness values between theMODIS retrievals and the AIRS BTD[900-1559] retrievals.
thickness values (see Fig. 6). For optically thin ice clouds, thepoints show greater scatter, indicating greater uncertainty in theresults. The scattering may be due to the random error of cloudtemperature, surface temperature, inhomogeneous and subscaleclouds, the error of collocated pixels, and measurement noise,etc.
The optical thickness retrieved from the BTD[1587-1559](not shown here) has similar results with those from the at-mospheric window channels for ice clouds of moderate opticalthickness, i.e., when the optical thickness is larger than 1. Butdifferences do exist for those FOVs that contain optically thinclouds. Upon further investigation, we found disagreements be-tween the simulated and observed AIRS BTs. One possibilitythat may be causing this disagreement is that the atmosphericprofiles provided by the ECMWF product at altitudes of about

WEI et al.: RETRIEVAL OF SEMITRANSPARENT ICE CLOUD OPTICAL THICKNESS 2265
5–10 km (the altitude of weighting function of this moderate ab-sorption channel) may not represent the true atmospheric con-dition. As shown in Section IV, the retrieved optical thicknessfrom the moderate absorption channel is more sensitive to un-certainties in the atmospheric profile and water vapor profile(see Figs. 13 and 15).
VI. DISCUSSION AND SUMMARY
In this study, we demonstrate the use of AIRS data for infer-ring ice cloud optical thickness. The retrievals involving atmo-spheric window channels have a stronger sensitivity to ice cloudoptical thickness and are relatively insensitive to the cloud par-ticle size and the error in atmospheric profiles. The results froma moderate absorption channel is primarily sensitive to the pres-ence of ice clouds, but is more sensitive to uncertainties in theatmospheric temperature and water vapor profiles.
There are some restrictions to the application of the presentmethods. The ice cloud signal in the AIRS data tends to sat-urate when the optical thickness is larger than 5. This impliesthat the retrieval of optical thickness from AIRS IR data is onlysuitable for nonopaque ice clouds. Additionally, IR BT calcula-tions are sensitive to the profiles of the atmospheric temperatureand water vapor profiles, particularly for simulations in a strongabsorption band. Within atmospheric window channels, the sur-face temperature is also important for optically thin clouds. Be-cause of the spatial and time mismatch of ECMWF and AIRSdata, the profiles of ECMWF data may not be accurate enoughto be used for retrieving optical thickness based on the BTDbetween moderate absorption and strong absorption bands. Per-haps the AIRS-derived profiles of atmospheric temperature andmoisture could be used to improve the accuracy using the mod-erate absorption channel.
A fast cloud radiative transfer model was developed to sim-ulate AIRS radiances when clouds are present. The fast cloudradiance model includes consideration of the single-scatteringproperties of mixtures of ice crystals and their subsequent pa-rameterizations, a database of transmission and reflection func-tions for ice clouds calculated from DISORT, and a radiativetransfer algorithm coupled with the existing AIRS clear-sky fastmodel. Compared with DISORT, the discrepancy of the fastcloud model is within 0.5 K (root mean square) in BT. How-ever, the computation is three orders of magnitude faster thanDISORT in terms of CPU time requirements and allows the in-ference of ice cloud properties in AIRS data in a timely manner.
We investigate the sensitivity of AIRS spectral BTs and BTDvalues between pairs of wavenumbers to the cloud optical thick-ness. The spectral BTs in the atmospheric window channelswithin 1070–1135 cm , and the BTD between 900.562 cm(located in an atmospheric window) and 1558.692 cm (lo-cated in a strong water vapor absorption band) are sensitiveto the ice cloud optical thickness. Similarly, the BTD betweena moderate absorption channel (1587.495 cm ) and a strongwater absorption channel (1558.692 cm ) is sensitive to icecloud optical thickness, but insensitive to the presence of low-level water clouds. Neither of the aforementioned BTD pairs issensitive to the effective particle size. The optical thickness of
thin to moderately thick ice cloud (optical thickness less than 5)can be retrieved using the method.
A case study regarding the retrieval of optical thickness froma granule of AIRS data is reported. The ECMWF atmosphericprofiles are used in the retrieval process to generate atmosphericabsorption properties. The retrieved ice clouds optical thicknessfor each AIRS FOV that contains ice clouds is compared withthe collocated and degraded MODIS optical thickness retrievedfrom the MODIS 1.38- and 0.645- m channels. The retrievedice cloud optical thicknesses from the AIRS IR atmosphericwindow channels compare well with MODIS for the thin tomoderately thick ice clouds.
ACKNOWLEDGMENT
The authors thank F. Sun for providing collocated MODISand AIRS data and appreciate the helpful suggestions from thetwo anonymous reviewers.
REFERENCES
[1] D. P. Wylie, W. P. Menzel, H. M. Woolf, and K. L. Strabala, “Fouryears of global cirrus cloud statistics using HIRS,” J. Clim., vol. 7, pp.1972–1986, 1994.
[2] K. N. Liou, “Influence of cirrus clouds on weather and climate processes:A global perspective,” Mon. Weather Rev., vol. 114, pp. 1167–1199,1986.
[3] G. L. Stephens, S.-C. Tsay, P. W. Stackhouse, and P. J. Flatau, “Therelevance of the microphysical and radiative properties of cirrus cloudsto climate and climatic feedback,” J. Atmos. Sci., vol. 47, pp. 1742–1753,1990.
[4] D. K. Lynch, K. Sassen, D. O. Starr, and G. Stephens, Eds.,Cirrus. New York: Oxford Univ. Press, 2002.
[5] T. Nakajima and M. D. King, “Determination of the optical thicknessand effective particle radius of clouds from reflected solar radiationmeasurements. Part I: Theory,” J. Atmos. Sci., vol. 47, pp. 1878–1893,1990.
[6] M. D. King, W. P. Menzel, Y. J. Kaufman, D. Tanré, B. C. Gao, S.Platnick, S. A. Ackerman, L. A. Remer, R. Pincus, and P. A. Hubanks,“Cloud and aerosol properties, precipitable water, and profiles of temper-ature and humidity from MODIS,” IEEE Trans. Geosci. Remote Sensing,vol. 41, pp. 442–458, Feb. 2003.
[7] S. Platnick, M. D. King, S. A. Ackerman, W. P. Menzel, B. A. Baum, J.C. Riédi, and R. A. Frey, “The MODIS cloud products: Algorithms andexamples from Terra,” IEEE Trans. Geosci. Remote Sensing, vol. 41, pp.459–473, Feb. 2003.
[8] S. C. Ou, K. N. Liou, M. D. King, and S. C. Tsay, “Remote sensingof cirrus cloud parameters based on a 0.63–3.7 �m radiance correlationtechnique applied to AVHRR data,” Geophys. Res. Lett., vol. 26, pp.2437–2440, 1999.
[9] S. C. Ou, K. N. Liou, Y. Takano, G. J. Higgins, A. George, andR. Slonaker, “Remote sensing of cirrus cloud optical thickness andeffective particle size for the National Polar-orbiting OperationalEnvironmental Satellite System Visible/Infrared Imager RadiometerSuite: Sensitivity to instrument noise and uncertainties in environmentalparameters,” Appl. Opt., vol. 42, pp. 7202–7214, 2004.
[10] P. Minnis, K. N. Liou, and Y. Takano, “Inference of cirrus cloud prop-erties using satellite-observed visible and infrared radiances, Part I: Pa-rameterization of radiance fields,” J. Atmos. Sci., vol. 50, pp. 1279–1304,1993.
[11] P. Minnis, P. W. Heck, and D. F. Young, “Inference of cirrus cloud prop-erties using satellite-observed visible and infrared radiances. Part II: Ver-ification of theoretical cirrus radiative properties,” J. Atmos. Sci., vol. 50,pp. 1305–1322, 1993.
[12] A. J. Baran, S. Havemann, P. N. Francis, and P. D. Watts, “A consistentset of single-scattering properties for cirrus cloud: Tests using radiancemeasurements from a dual-viewing multi-wavelength satellite-based in-strument,” J. Quant. Spectrosc. Radiat. Transf., vol. 79, pp. 549–567,2003.

2266 IEEE TRANSACTIONS ON GEOSCIENCE AND REMOTE SENSING, VOL. 42, NO. 10, OCTOBER 2004
[13] M. Doutriaux-Boucher, J. C. Buriez, G. Brogniez, L. Labonnote, andA. J. Baran, “Sensitivity of retrieved POLDER directional cloud opticalthickness to various ice particle models,” Geophys. Res. Lett., vol. 27,pp. 109–112, 2000.
[14] B. C. Gao, P. Yang, W. Han, R.-R. Li, and W. J. Wiscombe, “An al-gorithm using visible and 1.38-�m channels to retrieve cirrus cloud re-flectances from aircraft and satellite data,” IEEE Trans. Geosci. RemoteSensing, vol. 40, pp. 1659–1688, Aug. 2002.
[15] K. Meyer, P. Yang, and B.-C. Gao, “Optical thickness of tropical cirrusclouds derived from the MODIS 0.645- and 1.38-�m channels,” IEEETrans. Geosci. Remote Sensing, vol. 42, pp. 833–841, Apr. 2004.
[16] T. Inoue, “On the temperature and effective emissivity determinationof semi-transparent cirrus clouds by bispectral measurements in the 10micron windows region,” Meteorol. Soc. Jpn., vol. 63, pp. 88–99, 1985.
[17] C. Prabhakara, R. S. Fraser, G. Dalu, M.-L. Wu, and R. J. Curran, “Thincirrus clouds-seasonal distribution over oceans deduced from Nimus-4IRIS,” J. Appl. Meteorol., vol. 27, pp. 379–399, 1988.
[18] F. Parol, J. C. Buriez, G. Brognies, and Y. Fouquart, “Information con-tent of AVHRR channels 4 and 5 with respect to particle size,” J. Appl.Meteorol., vol. 30, pp. 973–984, 1991.
[19] H. H. Aumann, M. T. Chahine, C. Gautier, M. D. Goldberg, E. Kalnay,L. M. McMillin, L. M. H. Revercomb, P. W. Rosenkranz, W. L. Smith,D. H. Staelin, L. L. Strow, and J. Susskind, “AIRS/AMSU/HSB on theAqua mission: Design, science objectives, data products, and processingsystems,” IEEE Trans. Geosci. Remote Sensing, vol. 41, pp. 253–264,Feb. 2003.
[20] J. Susskind, C. D. Barnet, and J. M. Blaisdell, “Retrieval of atmosphericand surface parameters from AIRS/AMSU/HSB data in the presence ofclouds,” IEEE Trans. Geosci. Remote Sensing, vol. 41, pp. 390–409, Feb.2003.
[21] A. H. Huang, P. Yang, H.-L. Wei, B. A. Baum, Y.-X. Hu, P. Antonelli,and S. A. Ackerman, “Retrieval of ice cloud properties from highspectral resolution infrared observations,” IEEE Trans. Geosci. RemoteSensing, vol. 42, pp. 842–853, Apr. 2004.
[22] S. Chung, S. Ackerman, P. F. Van Delst, and W. P. Menzel, “Model calcu-lations and interferometer measurements of ice-clouds characteristics,”J. Appl. Meteorol., vol. 39, pp. 634–644, 2000.
[23] J. Bantges, J. E. Russell, and J. D. Haigh, “Cirrus cloud top-of-atmos-phere radiance spectra in the thermal infrared,” J. Quant. Spectrosc. Ra-diat. Transf., vol. 63, pp. 487–498, 1999.
[24] S. DeSouza-Machado, L. Strow, S. Hanon, and J. Gou, “Measurementsof cirrus cloud parameters using AIRS,” Proc. SPIE, vol. 5235, pp.49–58, 2003.
[25] B. H. Kahn, A. Eldering, S. A. Clough, E. J. Fetzer, E. Fishbein, M. R.Gunson, S. Y. Lee, P. F. Lester, and V. J. Realmuto, “Near micron-sizedcirrus cloud particles in high-resolution infrared spectra: An orographiccase study,” Geophys. Res. Lett., vol. 30, pp. 24.1–24.4, 2003.
[26] X. L. Huang, Y. L. Yung, and J. S. Margolis, “Use of high-resolutionmeasurements for the retrieval of temperature and gas concentration pro-files from outgoing infrared spectra in the presence of cirrus clouds,”Appl. Opt., vol. 42, pp. 2155–2165, 2003.
[27] S. A. Clough, M. J. Tacono, and J. L. Moncet, “Line-by-line calculationsof atmospheric fluxes and cooling rates: Application to water vapor,” J.Geophys. Res., vol. 97, pp. 15 761–15 785, 1992.
[28] K. Stamnes, S.-C. Tsay, W. Wiscombe, and K. Jayaweera, “Numeri-cally stable algorithm for discrete-ordinate-method radiative transfer inmultiple scattering and emitting layered media,” Appl. Opt., vol. 27, pp.2502–2509, 1988.
[29] L. L. Strow, H. E. Motteler, R. G. Benson, S. E. Hannon, and S. Souza-Machado, “Fast computation of monochromatic infrared atmospherictransmittances using compressed look-up tables,” J. Quant. Spectrosc.Radiat. Transf., vol. 59, pp. 481–493, 1998.
[30] L. L. Strow, S. E. Hannon, S. Souza-Machado, H. E. Motteler, and D.Tobin, “An overview of the AIRS radiative transfer model,” IEEE Trans.Geosci. Remote Sensing, vol. 41, pp. 303–313, Feb . 2003.
[31] E. Fishbein, C. B. Farmer, S. L. Granger, D. T. Gregorich, M. R. Gunson,S. E. Hannon, M. D. Hofstadter, S. Y. Lee, S. S. Leroy, and L. L. Strow,“Formulation and validation of simulated data for the Atmospheric In-frared Sounder (AIRS),” IEEE Trans. Geosci. Remote Sensing, vol. 41,pp. 314–329, Feb. 2003.
[32] M. I. Mishchenko, W. B. Rossow, A. Macke, and A. A. Lacis, “Sen-sitivity of cirrus cloud albedo, bidirectional reflectance, and opticalthickness retrieval to ice-particle shape,” J. Geophys. Res., vol. 101, pp.16 973–16 985, 1996.
[33] J. Heymsfield and J. Iaquinta, “Cirrus crystal terminal velocities,” J.Atmos. Sci., vol. 5, pp. 916–938, 2000.
[34] P. Yang, B. A. Baum, A. J. Heymsfield, Y. X. Hu, H.-L. Huang, S.-C.Tsay, and S. Ackerman, “Single-scattering properties of droxtals,” J.Quant. Spectrosc. Radiat. Transf., vol. 79–80, pp. 1159–1169, 2003.
[35] M. I. Mishchenko, J. W. Hovenier, and L. D. Travis, Eds., Light Scat-tering by Nonspherical Particles: Theory, Measurements, and Applica-tions. San Diego, CA: Academic, 2000.
[36] P. Yang and K. N. Liou, “Finite-difference time domain method for lightscattering by small ice crystals in three-dimensional space,” J. Opt. Soc.Amer., vol. A13, pp. 2072–2085, 1996.
[37] P. Yang, K. N. Liou, M. I. Mishchenko, and B.-C. Gao, “An efficientfinite difference time domain scheme for light scattering by dielectricparticles: Application to aerosols,” Appl. Opt., vol. 39, pp. 3727–3737,2000.
[38] Q. Fu, P. Yang, and W. B. Sun, “An accurate parameterization of the in-frared radiative properties of cirrus clouds for climate models,” J. Clim.,vol. 25, pp. 2223–2237, 1998.
[39] Q. Fu, W. B. Sun, and P. Yang, “On modeling of scattering and ab-sorption by cirrus nonspherical ice particles at thermal infrared wave-lengths,” J. Atmos. Sci., vol. 56, pp. 2937–2947, 1999.
[40] P. Yang and K. N. Liou, “Geometric-optics-integral-equation method forlight scattering by nonspherical ice crystals,” Appl. Opt., vol. 35, pp.6568–6584, 1996.
[41] P. Yang, B. C. Gao, B. A. Baum, Y. X. Hu, W. J. Wiscombe, S. C. Tsay,D. M. Winker, and S. L. Nasiri, “Radiative properties of cirrus cloudsin the infrared (8–13 �m) spectral region,” J. Quant. Spectrosc. Radiat.Transf., vol. 70, pp. 473–504, 2001.
[42] Z. Zhang, P. Yang, G. W. Kattawar, S.-C. Tsay, B. A. Baum, H.-L.Huang, Y. X. Hu, A. J. Heymsfield, and J. Reichardt, “Geometric opticssolution to light scattering by droxtal ice crystals,” Appl. Opt., vol. 43,pp. 2490–2499, 2004.
[43] P. Yang and K. N. Liou, “Single-scattering properties of complex icecrystals in terrestrial atmosphere,” Contr. Atmos. Phys., vol. 71, pp.223–248, 1998.
[44] A. J. Baran, P. N. Francis, and P. Yang, “A process study of the depen-dence of ice crystal absorption on particle geometry: Application to air-craft radiometric measurements of cirrus cloud in the terrestrial windowregion,” J. Atmos. Sci., vol. 60, pp. 417–427, 2003.
[45] A. J. Baran, S. Haveman, P. N. Francis, and P. Yang, “A study of theabsorption and extinction properties of hexagonal ice columns and platesin random and preferred orientation, using exact T-matrix theory andaircraft observations of cirrus,” J. Quant. Spectrosc. Radiat. Transf., vol.70, pp. 505–518, 2001.
[46] D. L. Mitchell, “Effective diameter in radiation transfer: Generaldefinition, applications and limitations,” J. Atmos. Sci., vol. 59, pp.2330–2346, 2002.
[47] D. L. Mitchell, W. P. Arnott, C. Schmitt, A. J. Baran, S. Havemann, andQ. Fu, “Contributions of photon tunneling to extinction in laboratorygrown hexagonal columns,” J. Quant. Spectrosc. Radiat. Transf., vol.70, pp. 761–776, 2001.
[48] P. Yang, M. G. Mlynczak, H. L. Wei, D. P. Kratz, B. A. Baum, Y. X.Hu, W. J. Wiscombe, A. Heidinger, and M. I. Mishchenko, “Spectralsignature of cirrus clouds in the far-infrared region: Single-scatteringcalculation and radiative sensitivity study,” J. Geophys. Res., vol. 108,pp. 4569–4584, 2003.
[49] K. I. Strabala, S. A. Ackerman, and W. P. Menzel, “Cloud propertiesinferred from 8–12 �m data,” J. Appl. Meteorol, vol. 33, pp. 212–229,1994.
[50] D. D. Turner, S. A. Ackerman, B. A. Baum, H. E. Revercomb, and P.Yang, “Cloud phase determination using ground-based AERI observa-tions at SHEBA,” J. Appl. Meteorol., vol. 42, pp. 701–715, 2003.
[51] T. J. Garrett, L. F. Radke, and P. V. Hobbs, “Aerosol effects on cloudemissivity and surface longwave heating in the arctic,” J. Atmos. Sci.,vol. 59, pp. 769–778, 2002.
[52] S. A. Ackerman, W. L. Smith, A. D. Collard, X. L. Ma, H. E. Revercomb,and R. O. Knuteson, “Cirrus cloud properties derived from high spectralresolution infrared spectrometry during FIRE II. Part II: Aircraft HISresults,” J. Atmos. Sci., vol. 52, pp. 4246–4263, 1995.
[53] B. A. Baum, P. F. Soulen, K. I. Strabala, M. D. King, S. A. Ackerman,W. P. Menzel, and P. Yang, “Remote sensing of cloud properties usingMODIS airborne simulator imagery during SUCCESS. II. Cloudthermodynamic phase,” J. Geophys. Res., vol. 105, pp. 11 781–11 792,2000.
[54] J. Li, W. P. Menzel, F. Sun, T. J. Schmit, and J. Gurka, “AIRS sub-pixelcloud characterization using MODIS cloud products,” J. Appl. Mete-orol., vol. 43, pp. 1083–1094, 2004.

WEI et al.: RETRIEVAL OF SEMITRANSPARENT ICE CLOUD OPTICAL THICKNESS 2267
Heli Wei received the M.S. degree in atmosphericphysics from Anhui Institute of Optics and FineMechanics, Chinese Academy of Sciences, Hefei, in1992.
He is currently a Senior Research Associate withthe Department of Atmospheric Sciences, TexasA&M University, College Station. He has beenconducting research in the infrared atmosphericradiative transfer, radiative properties of clouds, andremote sensing of cirrus clouds with high-resolutionIR spectra.
Ping Yang received the Ph.D. degree in meteorologyfrom University of Utah, Salt Lake City, in 1995.
He is currently an Assistant Professor in theDepartment of Atmospheric Sciences, Texas A&MUniversity, College Station. After graduation fromthe University of Utah, he remained with the uni-versity for two years, working as a PostdoctoralResearcher. Later, he was an Assistant ResearchScientist at University of California, Los Angeles,as well as with the Goddard Earth Sciences andTechnologies Center, University of Maryland Bal-
timore County, Baltimore, as an Associate Research Scientist. His researchinterests are in remote sensing and radiative transfer. He has been activelyconducting research in modeling of optical and radiative properties of cloudsand aerosols, in particular, cirrus clouds and their applications to spaceborneand ground-based remote sensing.
Jun Li received the B.S. degree in mathematicsfrom Peking University, Beijing, China, in 1987, andthe M.S. and Ph.D. degrees in atmospheric sciencefrom the Institute of Atmospheric Physics, ChineseAcademy of Sciences, Beijing, in 1990 and 1996,respectively.
In 1997, he jointed the Space Science andEngineering Center (SSEC), University of Wis-consin–Madison, where he was responsible fordeveloping the algorithms to retrieve atmosphericand cloud parameters from the MODIS, NPOESS
Airborne Sounder Testbed-Interferometer, and the AIRS measurements. Hisresearch interests include deriving atmospheric temperature and moistureprofiles, as well as cloud properties from the hyperspectral sounder and themultispectral imager data. He is currently an Associate Scientist with SSEC andthe Principal Investigator of future Geostationary Operational EnvironmentalSatellite Hyperspectral Environmental Suite and Advanced Baseline Imagerstudies at the Cooperative Institute for Meteorological Satellite Studies.
Bryan A. Baum received the Ph.D. degree in atmo-spheric sciences from the Georgia Institute of Tech-nology, Atlanta, in 1989.
He is currently a Senior Research Scientist withthe Radiation and Aerosols Branch, NASA LangleyResearch Center (LaRC), Hampton, VA, but isstationed at the Cooperative Institute for Meteo-rological Satellite Studies (CIMSS), University ofWisconsin–Madison. His research activities havefocused on satellite, aircraft, and surface-basedremote sensing of multilayered cloud properties
from multispectral imagery, regional and global cloud-top property retrievalsderived from satellite data, global fire and smoke detection, and the effect ofclouds and aerosols on the earth’s radiation budget.
Hung-Lung Huang was born in Taipei, Taiwan,R.O.C., in 1955. He received the B.S. degree inatmospheric science from National Taiwan Uni-versity, Taipei, in 1979, and the M.S. and Ph.D.degrees in meteorology from the University ofWisconsin–Madison (UW), in 1986 and 1989,respectively.
From 1979 to 1984, he was a Satellite Meteorol-ogist with the meteorological satellite ground stationof the Taiwan Central Weather Bureau. Since 1989,he has been with Cooperative Institute for Meteoro-
logical Satellite Studies (CIMSS), UW, as a Research Scientist, conducting re-mote sensing research in the areas of atmospheric sounding retrieval, informa-tion content analysis, satellite and aircraft high spectral resolution sounding in-strument data processing, data compression, instrument design and performanceanalysis, and cloud property characterization. He is currently a Senior Scientistwith CIMSS, a GIFTS Mission Scientist, and an Adjunct Professor with theNanjing Institute of Meteorology, Nanjing, China.
Dr. Huang is a science council member of CIMSS, a council member of theSpace Science and Engineering Center of the UW, and is serving a two-yearterm as the Chair of Committee on Environmental Satellite Data Utilization ofthe National Research Council of the National Academies.
Steven Platnick received the B.S. degree from Duke University, Durham, NC,and the M.S. degree from the University of California, Berkeley, both in elec-trical engineering, and the Ph.D. degree in atmospheric sciences from the Uni-versity of Arizona, Tucson.
He joined the National Aeronautics and Space Administration (NASA) God-dard Space Flight Center (GSFC), Greenbelt, MD, in January 2003, and is cur-rently Deputy Project Scientist of NASA’s Aqua satellite. Prior to this appoint-ment, he was a Research Associate Professor in the Joint Center for Earth Sys-tems Technology, University of Maryland Baltimore County, from 1996 to 2002.He has worked in collaboration with NASA GSFC since 1993, and prior to thatheld engineering positions at Hewlett-Packard Company for six years as wellas a National Research Council Resident Research Associate position at NASAAmes Research Center. His research experience includes theoretical and exper-imental studies of satellite, aircraft, and ground-based cloud remote sensing, in-cluding applications to MODIS. He is a member of the MODIS Science Team.
Yongxiang Hu received the Ph.D. degree in atmo-spheric sciences from the University of Alaska, Fair-banks, in 1994.
He is currently a Senior Research Scientist at theRadiation and Aerosols Branch, NASA Langley Re-search Center, Hampton, VA. He was a PostdoctoralResearcher at the College of William and Mary and aResearch Professor at Hampton University before hejoined NASA in 1999. His research interests includeradiative transfer, passive and active atmospheric re-mote sensing, and satellite onboard data analysis.
Larrabee Strow received the B.S. degree from theUniversity of Maryland Baltimore County (UMBC),Baltimore, in 1974, and M.S. and Ph.D. degrees fromthe University of Maryland, College Park, in 1977and 1981, respectively, all in physics.
He is currently a Professor with the Departmentof Physics, UMBC. His research interests includemolecular spectroscopy, especially spectral lineshapes, and atmospheric remote sensing. He is amember of the AIRS Science Team.
Related Documents