PLEASE SCROLL DOWN FOR ARTICLE This article was downloaded by: [Delegido, Jesús] On: 9 November 2008 Access details: Access Details: [subscription number 905243299] Publisher Taylor & Francis Informa Ltd Registered in England and Wales Registered Number: 1072954 Registered office: Mortimer House, 37-41 Mortimer Street, London W1T 3JH, UK International Journal of Remote Sensing Publication details, including instructions for authors and subscription information: http://www.informaworld.com/smpp/title~content=t713722504 Retrieval of chlorophyll content and LAI of crops using hyperspectral techniques: application to PROBA/CHRIS data J. Delegido a ; G. Fernández a ; S. Gandía a ; J. Moreno a a Department of Earth Physics and Thermodynamics, Faculty of Physics, University of Valencia, Valencia, Spain Online Publication Date: 01 December 2008 To cite this Article Delegido, J., Fernández, G., Gandía, S. and Moreno, J.(2008)'Retrieval of chlorophyll content and LAI of crops using hyperspectral techniques: application to PROBA/CHRIS data',International Journal of Remote Sensing,29:24,7107 — 7127 To link to this Article: DOI: 10.1080/01431160802238401 URL: http://dx.doi.org/10.1080/01431160802238401 Full terms and conditions of use: http://www.informaworld.com/terms-and-conditions-of-access.pdf This article may be used for research, teaching and private study purposes. Any substantial or systematic reproduction, re-distribution, re-selling, loan or sub-licensing, systematic supply or distribution in any form to anyone is expressly forbidden. The publisher does not give any warranty express or implied or make any representation that the contents will be complete or accurate or up to date. The accuracy of any instructions, formulae and drug doses should be independently verified with primary sources. The publisher shall not be liable for any loss, actions, claims, proceedings, demand or costs or damages whatsoever or howsoever caused arising directly or indirectly in connection with or arising out of the use of this material.

Welcome message from author
This document is posted to help you gain knowledge. Please leave a comment to let me know what you think about it! Share it to your friends and learn new things together.
Transcript
PLEASE SCROLL DOWN FOR ARTICLE
This article was downloaded by: [Delegido, Jesús]On: 9 November 2008Access details: Access Details: [subscription number 905243299]Publisher Taylor & FrancisInforma Ltd Registered in England and Wales Registered Number: 1072954 Registered office: Mortimer House,37-41 Mortimer Street, London W1T 3JH, UK
International Journal of Remote SensingPublication details, including instructions for authors and subscription information:http://www.informaworld.com/smpp/title~content=t713722504
Retrieval of chlorophyll content and LAI of crops using hyperspectraltechniques: application to PROBA/CHRIS dataJ. Delegido a; G. Fernández a; S. Gandía a; J. Moreno a
a Department of Earth Physics and Thermodynamics, Faculty of Physics, University of Valencia, Valencia,Spain
Online Publication Date: 01 December 2008
To cite this Article Delegido, J., Fernández, G., Gandía, S. and Moreno, J.(2008)'Retrieval of chlorophyll content and LAI of cropsusing hyperspectral techniques: application to PROBA/CHRIS data',International Journal of Remote Sensing,29:24,7107 — 7127
To link to this Article: DOI: 10.1080/01431160802238401
URL: http://dx.doi.org/10.1080/01431160802238401
Full terms and conditions of use: http://www.informaworld.com/terms-and-conditions-of-access.pdf
This article may be used for research, teaching and private study purposes. Any substantial orsystematic reproduction, re-distribution, re-selling, loan or sub-licensing, systematic supply ordistribution in any form to anyone is expressly forbidden.
The publisher does not give any warranty express or implied or make any representation that the contentswill be complete or accurate or up to date. The accuracy of any instructions, formulae and drug dosesshould be independently verified with primary sources. The publisher shall not be liable for any loss,actions, claims, proceedings, demand or costs or damages whatsoever or howsoever caused arising directlyor indirectly in connection with or arising out of the use of this material.
Retrieval of chlorophyll content and LAI of crops using hyperspectraltechniques: application to PROBA/CHRIS data
J. DELEGIDO*, G. FERNANDEZ, S. GANDIA and J. MORENO
Department of Earth Physics and Thermodynamics. Faculty of Physics, University of
Valencia, C/Dr Moliner, 50, E-46100 Burjassot, Valencia, Spain
(Received 1 February 2007; in final form 5 August 2007 )
Hyperspectral/multiangular data allow the retrieval of important vegetation
properties at canopy level, such as the Leaf Area Index (LAI) and Leaf
Chlorophyll Content. Current methods are based on the relationship between
biophysical properties and retrievals from those spectral bands (from the complete
hyperspectral/multiangular information) where specific absorption features are
present within the considered spectral range. Furthermore, new sensors such as
PROBA/CHRIS provide continuous hyperspectral reflectance measurements that
can be considered as a continuous function of wavelength. The mathematical
analysis of these continuous functions allows a new way of exploiting the
relationships between spectral reflectance and biophysical variables by more
powerful and stable mathematical tools, in particular for the retrieval of LAI and
chlorophyll content. Within the overall context of the European Space Agency
(ESA) Spectra Barrax Campaign (SPARC) experiment, an extensive field study
was carried out in La Mancha, Spain, simultaneously to the overflight of airborne
imaging spectrometers (AHS, HyMAP, ROSIS) and the overpass of CHRIS-
PROBA and MERIS sensors. During the SPARC-2003 and SPARC-2004
campaigns, numerous ground measurements were made in the Barrax study area
(covering LAI, fCover, leaf chlorophyll a + b, leaf water content and leaf biomass),
together with other complementary data, and a total of 17 CHRIS-PROBA images
were acquired. Representative points have been selected from a total of nine
different crops, and also retrieved from the CHRIS-PROBA images acquired
within the days of the field campaign. About 250 reflectance spectra from five
different observation angles have been analysed. Hyperspectral reflectance spectra
have been adjusted by means of third-degree polynomial functions between 500 nm
and 750 nm, and correlations observed between LAI values and the coefficients of
these polynomials yielded LAI as a result of the mathematical fitting. On the other
hand, the area under the spectral reflectance curves has been calculated in the
interval from 600 nm to 700 nm, the region of the red spectral interval where strong
absorption features for chlorophyll have been observed, though areas under the
curves are also strongly correlated to the chlorophyll content of the crops.
Furthermore, a linear relationship between these areas and the chlorophyll content
is proposed in this work. This relationship allows the retrieval of leaf chlorophyll
by satellite data, based on the spectral information. Both of the proposed methods
are almost independent of the observation angles employed. The high number of in
situ measurements acquired simultaneously to satellite overpasses, and the broad
available range of data, have allowed validation of both methods, with a large
number of data and in a statistically consistent manner.
*Corresponding author. Email: [email protected]
International Journal of Remote Sensing
Vol. 29, No. 24, 20 December 2008, 7107–7127
International Journal of Remote SensingISSN 0143-1161 print/ISSN 1366-5901 online # 2008 Taylor & Francis
http://www.tandf.co.uk/journalsDOI: 10.1080/01431160802238401
Downloaded By: [Delegido, Jesús] At: 10:13 9 November 2008
1. Introduction
The increasingly widespread use of hyperspectral/multiangular information from
aircraft- and satellite-born sensors provides a new tool for studying the biophysical
properties of vegetation (Curran et al. 1991, Gitelson and Merzlyak 1998, Kokaly
and Clark 1999).
Spectral reflectance of vegetation in the visible (VIS) region of the electromagnetic
spectrum is primarily governed by chlorophyll pigments (Thomas and Gausman
1977). Many studies have focused on the relationship between pigment concentra-
tion and optical properties of leaves (Horler et al. 1983, Jacquemoud et al. 1996,
Lichtenthaler et al. 1996). A number of investigators have studied the relationship
between canopy spectral reflectance and canopy characteristics for major crops
(Baret et al. 1987, Gilabert et al. 1996, Jackson and Pinter 1986). For example,
spectral vegetation indices calculated as linear combinations of near infrared and red
reflectance have been found to be well correlated with canopy cover, leaf area index
(LAI), and absorbed photosynthetically active radiation (Price 1992, Myneni and
Williams 1994, Elvidge and Chen 1995).
The wavelength region located in the visible-near infrared transition zone has
been shown to offer a high information content for vegetation spectra (Collins 1978,
Horler et al. 1983). The spectral reflectance of vegetation in this region is
characterized by very low reflectance in the red part of the spectrum followed by an
abrupt increase in reflectance at 700–740 nm wavelengths. This spectral reflectance
pattern of vegetation is generally referred to as the ‘red edge’ (Dawson and Curran
1998, Clevers et al. 2002). Several studies have shown that measures based on the red
edge position or shape are likewise well correlated with biophysical variables at
canopy level, as LAI and leaf chlorophyll content (Clevers 1994) but are less
sensitive to spectral noise caused by the soil background and by atmospheric effects
(Demetriades-Shah et al. 1990, Baret et al. 1992, Mauser and Bach 1995).
A large number of regularly separated spectral bands within the visible range allows
the continuous mathematical shape of spectral reflectance to be obtained (Richardson
et al. 2002) as a key to retrieve information on surface properties and biophysical
variables at canopy level. Through the use of mathematical functions, and by means
of spectral fitting techniques, it has been possible to retrieve information from the
reflectance curves on two of the most important vegetation variables: chlorophyll
content and LAI. Canopy chlorophyll content is directly related to photosynthetic
activity (Holden 1976, Lichtenthaler 1987, Sagardoy et al. 2006), and information
relating to LAI is fundamental for identifying the vegetative stage of plants (Pearce
et al. 1965, Beadle 1993, Jensen and Binford 2004). For this reason, many studies in
recent years have focused on LAI and chlorophyll content retrieval by applying
remote sensing techniques (Baret and Guyot 1991, Martin et al. 1998, Dash and
Curran 2004, Vuolo et al. 2006, Baret et al. 2007). Different indices have been used to
estimate LAI, such as the NDVI (Carlson and Ripley 1997, Green et al. 1997);
alternatively, multivariable regression approaches have been adopted (Fassnacht et al.
1997). Other options include artificial neural networks (Haykin 1994, Jensen and
Binford 2004, Bacour et al. 2006) or the inversion of radiative transfer models
(Jacquemoud 1993, Chaurasia and Dadhwal 2004, Baret et al. 2007). Recently, the
European Space Agency (ESA) has incorporated a product for studying chlorophyll
through the MERIS Terrestrial Chlorophyll Index (MTCI) (Dash and Curran 2004),
which can also be used for classification (Dash et al. 2007) or for studying salt stress in
vegetation (Curran et al. 2007).
7108 J. Delegido et al.
Downloaded By: [Delegido, Jesús] At: 10:13 9 November 2008
The study of different indices (Richardson et al. 2002, Haboudane et al. 2004,
Jimenez-Munoz et al. 2005) provides information on the product of chlorophyll
content and Fractional Vegetation Cover (FVC) and on the chlorophyll product for
LAI for FVC (Gandia et al. 2004) but these indices are not able to decouple factors
for the isolated study of chlorophyll or LAI. In fact, the effect of chlorophyll content
variations on the vegetation index that calculates LAI remains an unsolved problem
(Haboudane et al. 2004). A method for studying these variables separately is
proposed in the present work, based on third-degree polynomial functions between
500 nm and 750 nm, in the case of LAI, and calculating the areas under the
reflectance curves in the interval from 600 nm to 700 nm to retrieve chlorophyll.
2. Methods
The main objective of this paper is to analyse a methodology to separate retrievals of
LAI and leaf chlorophyll by exploring the multi-angular and enhanced spectral
capabilities of PROBA/CHRIS data. In order to retrieve leaf chlorophyll we need to
look at specific chlorophyll absorption features. However, we also need to have
spectral signature not contaminated by chlorophyll absorption to determine the
amount of absorber by means of some kind of ‘differential absorption’ algorithm.
The problem in this case is that such reference reflectance, which is free from leaf
chlorophyll absorption effects, is in fact contaminated by LAI effects. That is, it is
not a true absolute reference but a variable reference that is also a function of LAI.
Thus, alternative techniques are needed.
2.1. LAI
In order to derive LAI from spectral reflectance curves, we need to consider a
spectral range with variable spectral absorption by some pigment in the leaf or by
the water contained in the leaf. LAI comes from the ‘differential absorption’ as a
function of the also varying scattering. In fact, we need at least one absorption
feature to retrieve LAI, but we also need a strong contrast in the absorption levels
across the considered spectral range to increase the accuracy in LAI ditermination.
For the retrieval of LAI, we have analysed the reflectance curves of different
crops, particularly in the spectral range between 500 nm and 750 nm—this being the
region where plant physiological characteristics have a more direct impact on the
shape of the spectral reflectance curve. Although different functions have been
tested (Vuolo et al. 2006), including Gaussian (Maire et al. 2004) potentials,
logarithmic functions and others, in this particular spectral region pixel reflectance
as a wavelength function can be better adjusted to third-degree polynomials. This
function has been selected as the simplest option that offers the best adjustments,
because it is the function with the fewest number of coefficients requiring adjustment
and yields higher correlation coefficients. The four polynomial coefficients provide
information on LAI. We propose a potential relationship between these coefficients
and LAI. The results obtained provide information on the spatial variability of LAI
by remote sensing techniques when applied to full images.
2.2. Chlorophyll content
In order to retrieve leaf chlorophyll content we need as a minimum two spectral
bands, one fully free from chlorophyll absorption and one quite affected by such
Chlorophyll content retrieval and LAI of crops 7109
Downloaded By: [Delegido, Jesús] At: 10:13 9 November 2008
absorption. However, because the absorption varies with the amount of absorber in
a nonlinear way, several absorption bands are preferable for a better compensation
of such nonlinear effects. On the other hand, measuring only the depth of the
absorption is not enough in most cases, while other indicators such as spectral slopes
or the area under the reference continuum tend to provide most stable estimates.
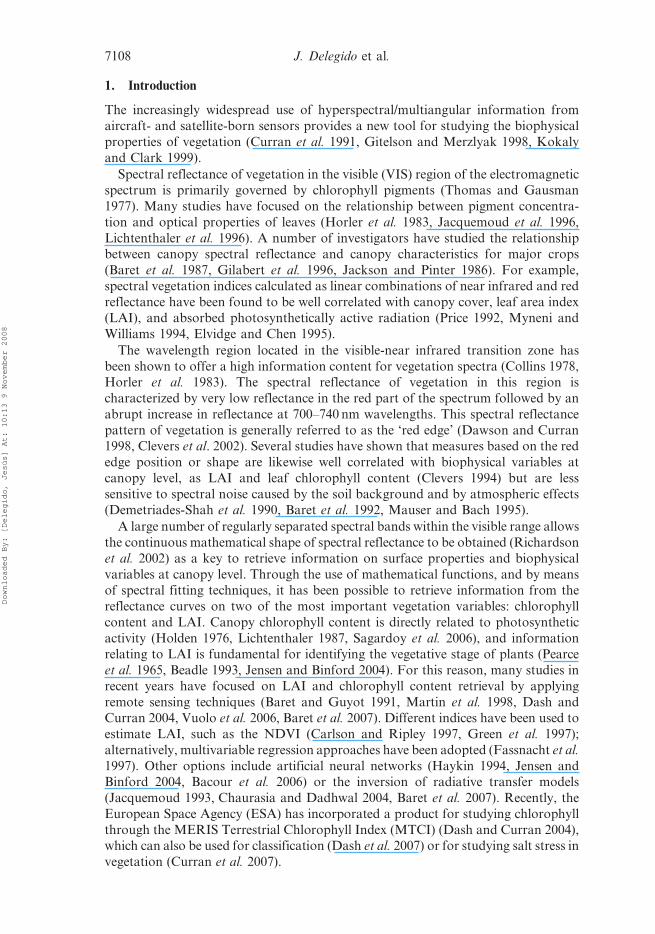
In the chlorophyll absorption spectrum (figure 1) we observe two absorption
peaks in the blue and red regions. Since in the blue region the contribution of
atmospheric aerosols is important (Niang et al. 2006) and introduces distortion due
to the coupling of several pigment absorptions, we have focused the derivation of
chlorophyll content information on the study of the area under the spectral
reflectance curve between 600 nm and 700 nm (Miller et al. 1990, Curran et al. 1991,
1997, Richardson et al. 2002). The analysis was centred on this wavelength interval,
which is large enough to provide feasible results, though without including spectral
regions where other factors and absorption features can exert an influence.
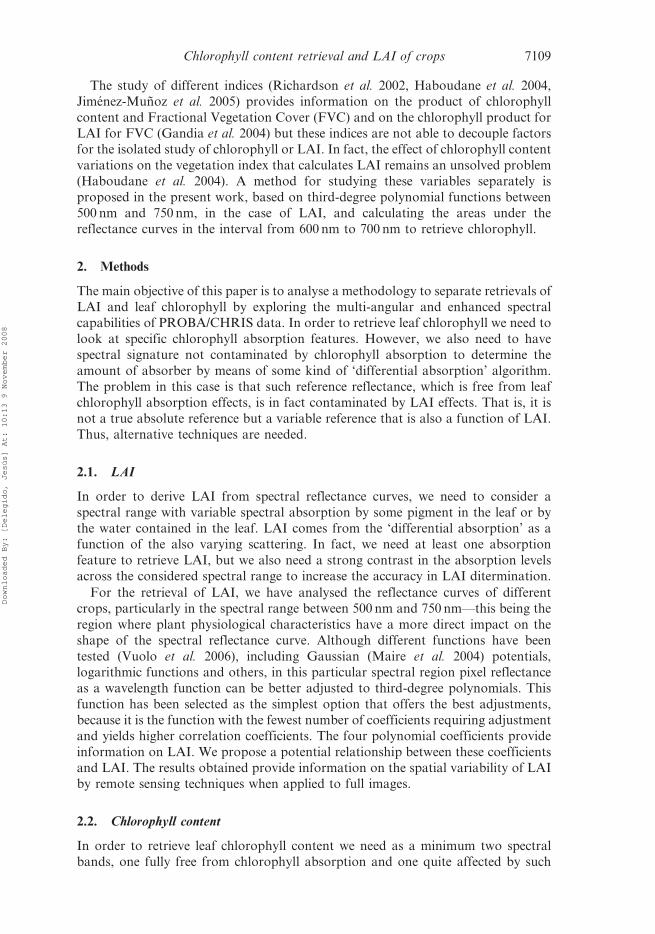
The greater the chlorophyll content, the greater the absorption observed in that
spectral region, and therefore reflectance will be smaller. Figure 2 represents the
typical vegetation reflectance curve without chlorophyll absorption and the different
curves as a function of leaf chlorophyll content. These curves have been represented
starting from the spectra obtained by PROBA/CHRIS, selecting crops with different
chlorophyll contents from our experimental data. A strong negative correlation is
evident, as expected, between chlorophyll content and the area under the curve. This
relationship, which can be calculated experimentally (based on a highly
representative number of data with broad variability), provides a method to
evaluate plant chlorophyll content using remote sensing techniques. A similar
procedure originating from the Chlorophyll Absorption Integral (CAI) concept has
been used by Oppelt and Mauser (2004) to monitor wheat chlorophyll during the
vegetation period.
Figure 1. Leaf pigment absorption spectrum, showing the optimum spectral range forchlorophyll retrievals where chlorophyll is the sole dominant absorber (600–700 nm).
7110 J. Delegido et al.
Downloaded By: [Delegido, Jesús] At: 10:13 9 November 2008
We propose the calculation of the area under the spectral reflectance curve,
defined as
S~
ð700
600
r dl ð1Þ
where r is the spectral reflectance and l the wavelength (nm). Based on statistical
analysis, it can be demonstrated that the relationship between chlorophyll and this
area is linear. Equalling this equation to zero, we would obtain the value of the areaunder the curve for the case of a crop with chlorophyll content zero. Therefore, it
can be introduced as a constant, area0, yielding the following expression:
Ch~k S0{Sð Þ ð2Þ
where Ch is chlorophyll content and k is an experimental constant. Therefore, we
can use this approach for monitoring crop chlorophyll content by remote sensingtechniques.
3. Materials
3.1. In situ measurements
The data used in this study were obtained during the SPARC-2003 (Spectra Barrax
Campaign) and SPARC-2004 campaigns in Barrax, La Mancha, Spain (coordinates
30u 39 N, 2u 69 W, 700 m altitude). The selection of the Barrax site was justified by
extensive experience in using this area as a test site for many previous satellite and
airborne experiments. The test area has a rectangular form and an extent of 5 km 610 km, and is characterized by a flat morphology and large, uniform land-use units.
Differences in elevation range from 5 m to 10 m only. The region consists of
Figure 2. Typical crop reflectivity (r) curves with different chlorophyll contents in the 600–700 nm interval. l is wavelength.
Chlorophyll content retrieval and LAI of crops 7111
Downloaded By: [Delegido, Jesús] At: 10:13 9 November 2008
approximately 65% dry land and 35% irrigated land. The climatic conditions show
Mediterranean features: important precipitation in spring and autumn, and
minimum rain in summer. The annual rainfall average is about 400 mm.
Furthermore, the region has typical continental climate, with thermal oscillations
during all seasons. La Mancha represents one of the driest regions in Europe
(Moreno et al. 2004).
The 2003 campaign was carried out from 12 to 14 July, and included
measurements of different physical and physiological variables of a large number
of crops. LAI was measured with a digital analyser (LI-COR LAI-2000, Lincoln,
Nebraska, USA), which works by comparing the intensity of diffuse incident
illumination measured at the bottom of the canopy with that arriving at the top (LI-
COR technical report) (Welles and Norman 1991). Each LAI value used in the
present study was obtained as a statistical mean of several measures with variable
standard errors between 5% and 10% (Fernandez et al. 2005).
The chlorophyll a + b measurements were made with a CCM-200 Chlorophyll
Content Meter specifically calibrated during the campaign by means of laboratory
analyses of about 100 samples based on spectroscopic and High Performance Liquid
Chromatography (HPLC) methods (Gandia et al. 2004). The three determinations
of leaf chlorophyll concentration (by CCM/Minolta devices, by direct chemical
spectroscopic analysis and by HPLC methods) were extensively analysed and
compared, yielding a consistent dataset of well established chlorophyll values with
identified accuracy and established measurements errors and intrinsic variability for
each elementary sampling unit (ESU).
For calibration of the CCM-200 instrument, during the SPARC-2003 campaign
50 samples were obtained of leaves of alfalfa, corn, beet, wheat, garlic, onion and
potato. Chlorophyll content was analysed following the methodology described by
Inskeep and Bloom (1984), based on the determination of the extinction coefficients
of chlorophyll a (Cha), chlorophyll b (Chb) and total chlorophyll (Chab) dissolved in
N,N-dimethylforamide (DMF).
The absorptivity (A) for 647 nm and 664.5 nm (A647 and A664.5, respectively)
wavelengths was measured for each sample by means of a CARY-UV-Visible
spectrophotometer, allowing calculation of the chlorophyll contents (mg l21) by
means of the following equations:
Cha~12:70 A664:5{2:79 A647 ð3Þ
Chb~20:70 A647{4:62 A664:5 ð4Þ
Chab~17:90 A647z8:08 A664:5 ð5Þ
Finally, and after testing different calibration functions, the best data fit for
chlorophyll versus the measurements with the CCM-200 instrument (in DC, digital
counts) was found to be a logarithmic function of the following kind (in mg m22):
Chab~m1zm2|log DCð Þ ð6Þ
where m1 and m2 are calibration constants presenting values (with the statistical
errors of the fit) shown to be (in mg m22): m15(120¡30) and m25(345¡19).
7112 J. Delegido et al.
Downloaded By: [Delegido, Jesús] At: 10:13 9 November 2008
The error associated with the total chlorophyll content obtained on applying this
calibration function varied between 5% for the highest values with the CCM-200
and 10% for the lowest values.
A total of 113 ESUs were measured for different crops. In the 2004 campaign,
carried out on 15 and 16 July, a total of 140 ESUs of LAI and 18 chlorophyll
measurements were collected among the different crops. The methodology applied
to obtain the in situ chlorophyll data consisted of measuring about 50 samples with
the CCM-200 meter, to characterize each ESU previously selected for the
characterization of LAI. The analysis of the chlorophyll values obtained in the
SPARC 2003 campaign shows good agreement with the values obtained inthe SPARC 2004 campaign (Gandia et al. 2005). Table 1 shows the plot number of
each of the crops in the two campaigns. Globally for the two years we have a total of
nine crops, with field-measured values of LAI that vary between 0.4 and 6.3, and
chlorophyll contents of between 20 mg and 550 mg m22. Further details on the
measurements and their statistical study can be found in Fernandez et al. (2005).
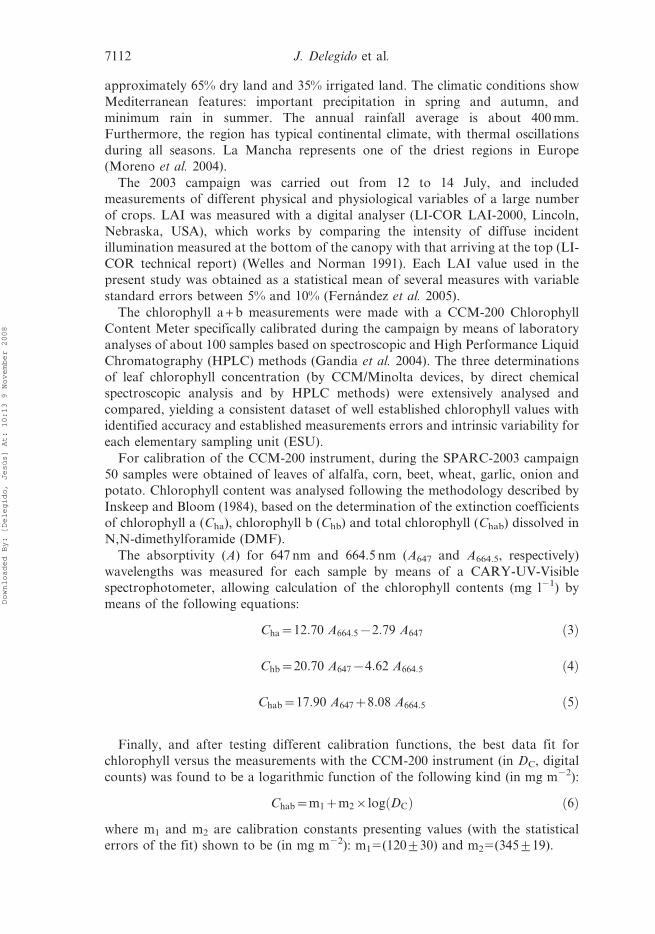
Figure 3 shows the LAI and chlorophyll values measured in the two campaigns.
The most important information reported in figure 3 is that we have a good and
even distribution of chlorophyll and LAI measured data for the whole interval.
Also, it is observed that for some crops (for example wheat and vineyard), there is
little dispersion of measured data.
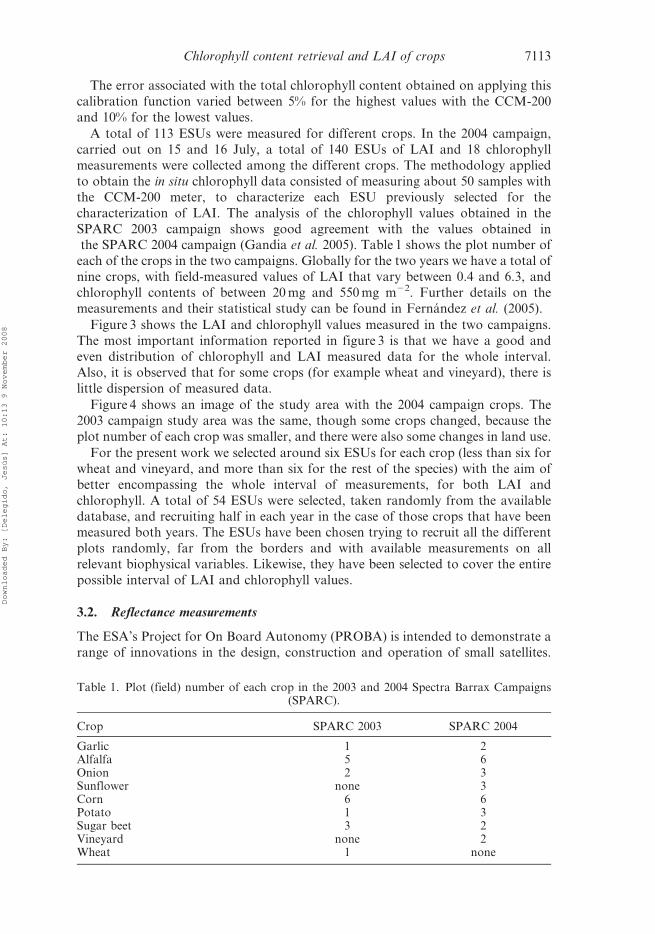
Figure 4 shows an image of the study area with the 2004 campaign crops. The
2003 campaign study area was the same, though some crops changed, because the
plot number of each crop was smaller, and there were also some changes in land use.
For the present work we selected around six ESUs for each crop (less than six for
wheat and vineyard, and more than six for the rest of the species) with the aim of
better encompassing the whole interval of measurements, for both LAI and
chlorophyll. A total of 54 ESUs were selected, taken randomly from the available
database, and recruiting half in each year in the case of those crops that have beenmeasured both years. The ESUs have been chosen trying to recruit all the different
plots randomly, far from the borders and with available measurements on all
relevant biophysical variables. Likewise, they have been selected to cover the entire
possible interval of LAI and chlorophyll values.
3.2. Reflectance measurements
The ESA’s Project for On Board Autonomy (PROBA) is intended to demonstrate a
range of innovations in the design, construction and operation of small satellites.
Table 1. Plot (field) number of each crop in the 2003 and 2004 Spectra Barrax Campaigns(SPARC).
Crop SPARC 2003 SPARC 2004
Garlic 1 2Alfalfa 5 6Onion 2 3Sunflower none 3Corn 6 6Potato 1 3Sugar beet 3 2Vineyard none 2Wheat 1 none
Chlorophyll content retrieval and LAI of crops 7113
Downloaded By: [Delegido, Jesús] At: 10:13 9 November 2008
Figure 3. Leaf area index (LAI) and chlorophyll measured values in the 2003 and 2004Spectra Barrax Campaigns (SPARC).
Figure 4. Land use map for selected crops in the 2004 Spectra Barrax Campaign (SPARC).The points marked with ( + ) indicate points where LAI was measured. Chlorophyll was alsomeasured at some of those points where LAI was characterized. The grid reflects the UTM-projection coordinates, where north is towards the top of the image.
7114 J. Delegido et al.
Downloaded By: [Delegido, Jesús] At: 10:13 9 November 2008
The Compact High Resolution Imaging Spectrometer (CHRIS) sensor on the
PROBA platform constitutes a low-cost new generation of satellite remote sensing
systems. CHRIS provides high spatial resolution hyperspectral/multiangular data,
acquiring five consecutive images from five different view zenith angles in one single
satellite overpass (0u, + 36u, 236u, + 55u and 255u). Also, CHRIS measures over the
visible/near-infrared spectra from 400 nm to 1050 nm. It can operate in different
modes, thus compromising the number of spectral bands and the spatial resolution
because of storage reasons. CHRIS Mode 1 (62 bands, full spectral information) has
a spatial resolution of 34 m at nadir. The spectral resolution provides a bandwidth of
1.25 nm at 415 nm, increasing to 11.25 nm at 1050 nm. This multiple-view-angle
imaging capability, in conjunction with high spectral and spatial resolution,
provides new opportunities for scientific investigation of the Earth’s surface and
atmosphere (Barnsley et al. 2004).
For this study we have used PROBA/CHRIS data in Mode 1 for the four
mentioned campaign days, where in situ measurements of surface properties were
measured simultaneously to satellite overpass. The images were geometrically
corrected (Alonso and Moreno 2005), followed by atmospheric correction according
to the method proposed by Guanter et al. (2005a). The method simultaneously
derives a set of calibration coefficients and an estimation of water vapour content
and aerosol optical thickness from the data themselves. The atmospheric correction
of the data was validated by direct comparison of CHRIS/PROBA-derived
reflectance retrievals with simultaneous ground-based measurements acquired
during the campaign, as described in Guanter et al. (2005a, b).
Based on these images, the 5465 pixel spectra corresponding to 54 selected ESUs
and five observation angles have been obtained. Since we have two images per year,
we have randomly selected images corresponding to one or the other day for each
crop, so that the total number of spectra is distributed evenly among the four days.
Three bare soil pixels have also been included in the study, assigning zero values of
LAI and chlorophyll to those points.
4. Results and discussion
4.1. Leaf area index
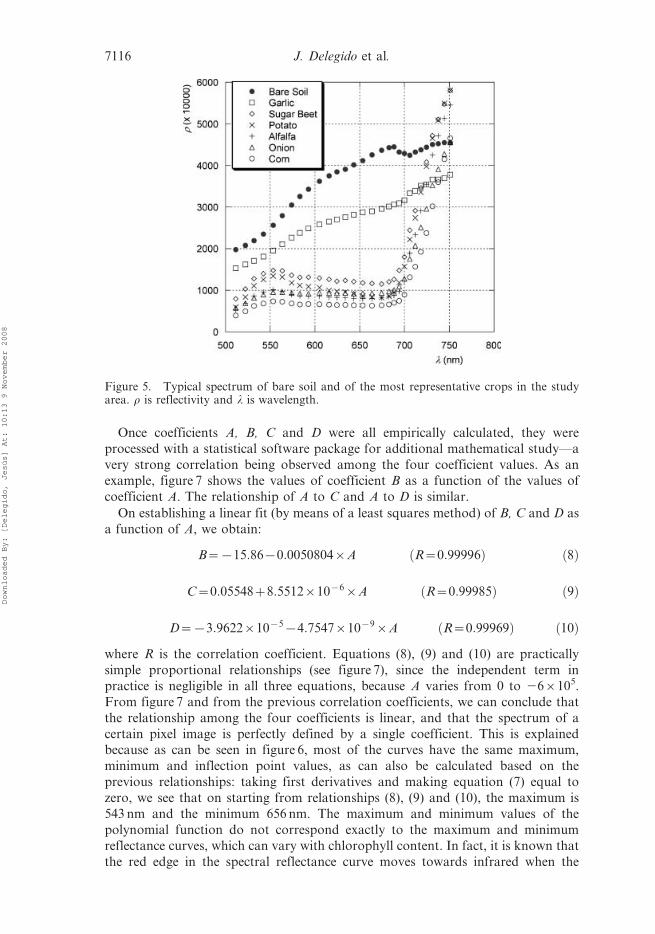
Figure 5 illustrates typical reflectance values of some crops and bare soil for
wavelengths in the range between 511.53 nm (CHRIS band 9) and 751.36 nm
(CHRIS band 37). All the reflectance spectra, in the given wavelength range, have
been adjusted to third degree polynomial functions in the following way:
Rr~AzB lzC l2zD l3 ð7Þ
where Rr is reflectance r 610 000, l is wavelength (in nm), and A, B, C and D are
the coefficients obtained by the minimum squares method. Use has been made of r6 10 000, since this is the presentation offered by the PROBA/CHRIS images,
with the purpose of using integers rather than decimals. In all cases, and for all
studied crops, correlation coefficients greater than 0.97 have been obtained.
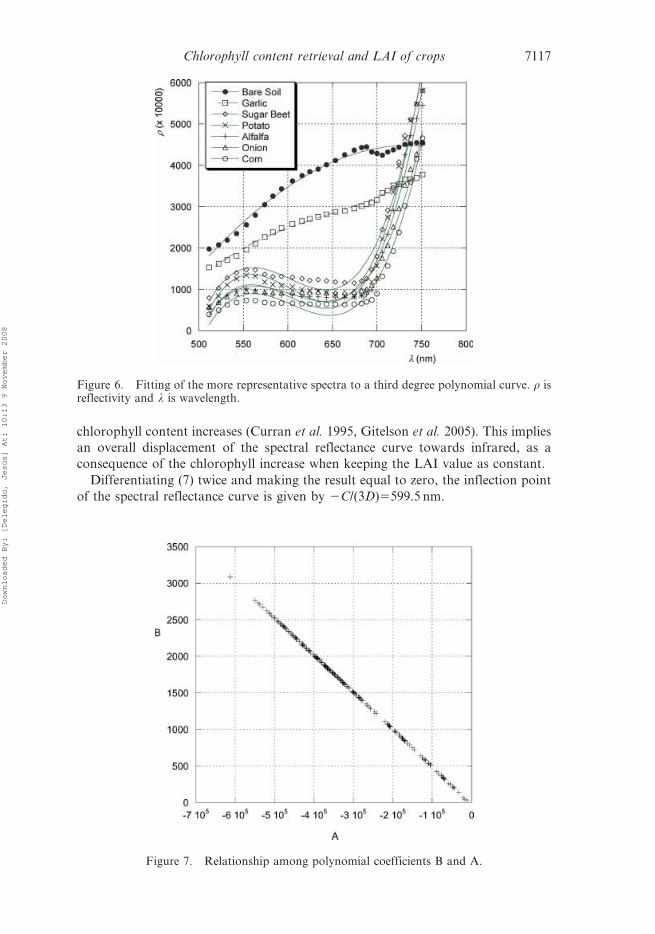
Figure 6 shows the curves obtained for typical values of some crops. Although as
can be seen the curves do not exhibit a detailed fit, for the present study we are
interested in establishing functions that are representative for the entire interval,
with good correlation coefficients, even if exact point-by-point reproduction is
lacking.
Chlorophyll content retrieval and LAI of crops 7115
Downloaded By: [Delegido, Jesús] At: 10:13 9 November 2008
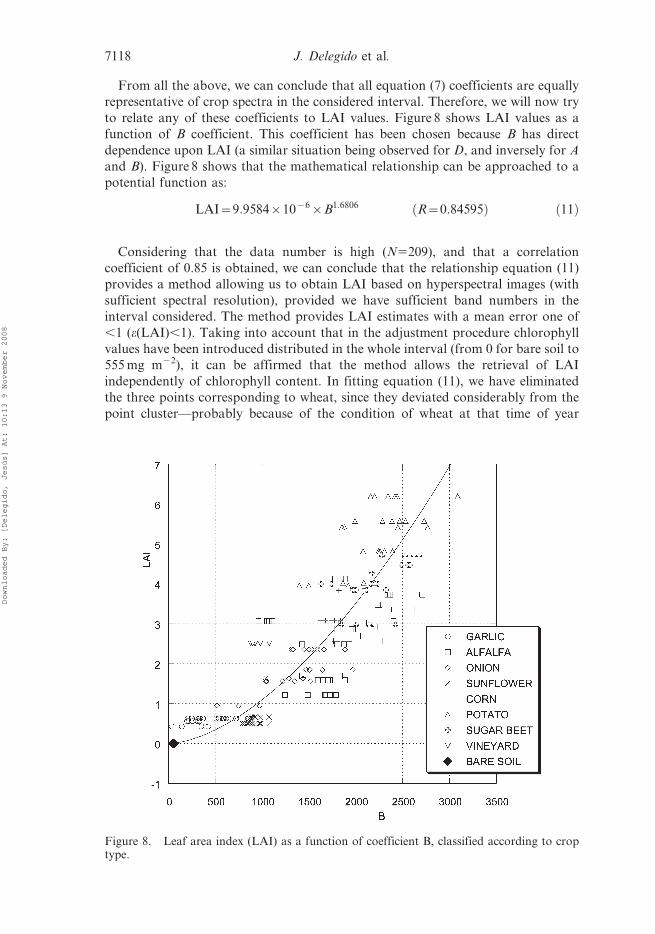
Once coefficients A, B, C and D were all empirically calculated, they were
processed with a statistical software package for additional mathematical study—a
very strong correlation being observed among the four coefficient values. As an
example, figure 7 shows the values of coefficient B as a function of the values of
coefficient A. The relationship of A to C and A to D is similar.
On establishing a linear fit (by means of a least squares method) of B, C and D as
a function of A, we obtain:
B~{15:86{0:0050804|A R~0:99996ð Þ ð8Þ
C~0:05548z8:5512|10{6|A R~0:99985ð Þ ð9Þ
D~{3:9622|10{5{4:7547|10{9|A R~0:99969ð Þ ð10Þ
where R is the correlation coefficient. Equations (8), (9) and (10) are practically
simple proportional relationships (see figure 7), since the independent term in
practice is negligible in all three equations, because A varies from 0 to 266105.
From figure 7 and from the previous correlation coefficients, we can conclude that
the relationship among the four coefficients is linear, and that the spectrum of a
certain pixel image is perfectly defined by a single coefficient. This is explained
because as can be seen in figure 6, most of the curves have the same maximum,
minimum and inflection point values, as can also be calculated based on the
previous relationships: taking first derivatives and making equation (7) equal to
zero, we see that on starting from relationships (8), (9) and (10), the maximum is
543 nm and the minimum 656 nm. The maximum and minimum values of the
polynomial function do not correspond exactly to the maximum and minimum
reflectance curves, which can vary with chlorophyll content. In fact, it is known that
the red edge in the spectral reflectance curve moves towards infrared when the
Figure 5. Typical spectrum of bare soil and of the most representative crops in the studyarea. r is reflectivity and l is wavelength.
7116 J. Delegido et al.
Downloaded By: [Delegido, Jesús] At: 10:13 9 November 2008
chlorophyll content increases (Curran et al. 1995, Gitelson et al. 2005). This implies
an overall displacement of the spectral reflectance curve towards infrared, as a
consequence of the chlorophyll increase when keeping the LAI value as constant.
Differentiating (7) twice and making the result equal to zero, the inflection point
of the spectral reflectance curve is given by 2C/(3D)5599.5 nm.
Figure 6. Fitting of the more representative spectra to a third degree polynomial curve. r isreflectivity and l is wavelength.
Figure 7. Relationship among polynomial coefficients B and A.
Chlorophyll content retrieval and LAI of crops 7117
Downloaded By: [Delegido, Jesús] At: 10:13 9 November 2008
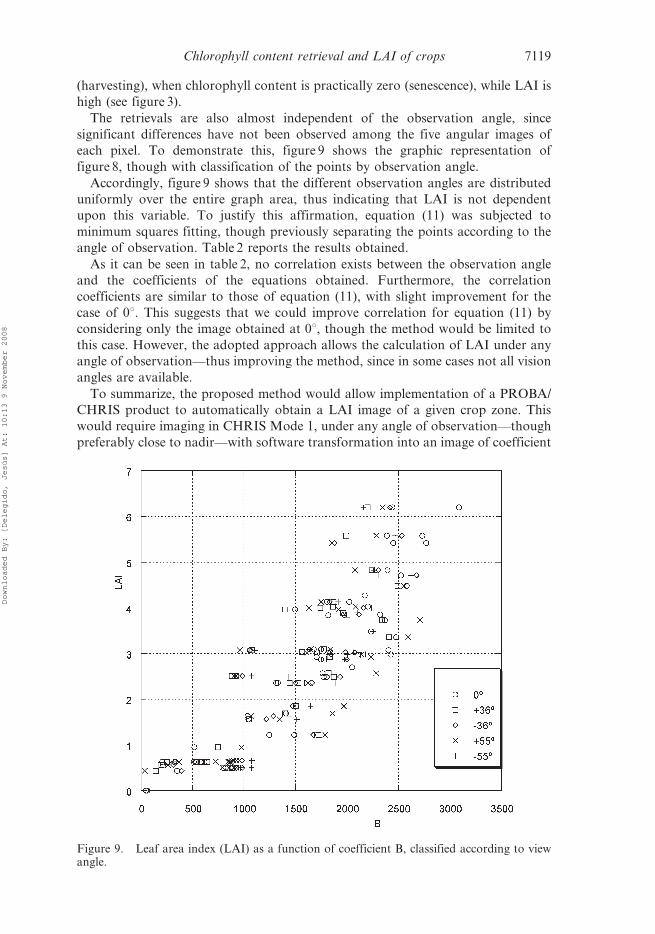
From all the above, we can conclude that all equation (7) coefficients are equally
representative of crop spectra in the considered interval. Therefore, we will now try
to relate any of these coefficients to LAI values. Figure 8 shows LAI values as a
function of B coefficient. This coefficient has been chosen because B has direct
dependence upon LAI (a similar situation being observed for D, and inversely for A
and B). Figure 8 shows that the mathematical relationship can be approached to a
potential function as:
LAI~9:9584|10{6|B1:6806 R~0:84595ð Þ ð11Þ
Considering that the data number is high (N5209), and that a correlation
coefficient of 0.85 is obtained, we can conclude that the relationship equation (11)
provides a method allowing us to obtain LAI based on hyperspectral images (with
sufficient spectral resolution), provided we have sufficient band numbers in the
interval considered. The method provides LAI estimates with a mean error one of
,1 (e(LAI),1). Taking into account that in the adjustment procedure chlorophyll
values have been introduced distributed in the whole interval (from 0 for bare soil to
555 mg m22), it can be affirmed that the method allows the retrieval of LAI
independently of chlorophyll content. In fitting equation (11), we have eliminated
the three points corresponding to wheat, since they deviated considerably from the
point cluster—probably because of the condition of wheat at that time of year
Figure 8. Leaf area index (LAI) as a function of coefficient B, classified according to croptype.
7118 J. Delegido et al.
Downloaded By: [Delegido, Jesús] At: 10:13 9 November 2008
(harvesting), when chlorophyll content is practically zero (senescence), while LAI is
high (see figure 3).
The retrievals are also almost independent of the observation angle, since
significant differences have not been observed among the five angular images of
each pixel. To demonstrate this, figure 9 shows the graphic representation of
figure 8, though with classification of the points by observation angle.
Accordingly, figure 9 shows that the different observation angles are distributed
uniformly over the entire graph area, thus indicating that LAI is not dependent
upon this variable. To justify this affirmation, equation (11) was subjected to
minimum squares fitting, though previously separating the points according to the
angle of observation. Table 2 reports the results obtained.
As it can be seen in table 2, no correlation exists between the observation angle
and the coefficients of the equations obtained. Furthermore, the correlation
coefficients are similar to those of equation (11), with slight improvement for the
case of 0u. This suggests that we could improve correlation for equation (11) by
considering only the image obtained at 0u, though the method would be limited to
this case. However, the adopted approach allows the calculation of LAI under any
angle of observation—thus improving the method, since in some cases not all vision
angles are available.
To summarize, the proposed method would allow implementation of a PROBA/
CHRIS product to automatically obtain a LAI image of a given crop zone. This
would require imaging in CHRIS Mode 1, under any angle of observation—though
preferably close to nadir—with software transformation into an image of coefficient
Figure 9. Leaf area index (LAI) as a function of coefficient B, classified according to viewangle.
Chlorophyll content retrieval and LAI of crops 7119
Downloaded By: [Delegido, Jesús] At: 10:13 9 November 2008
B, obtained on fitting the bands from 9 to 37 to a third-degree polynomial function.
Based on this image, and applying equation (11), a LAI map would be obtained.
4.2. Chlorophyll content
As we have pointed out above, the increase in chlorophyll content in crop leaves
must cause a decrease in the area under the spectral reflectance curve, in the interval
between 600 nm and 700 nm. With the objective of studying this phenomenon, the
areas under the curves have been calculated by numerical integration in this interval,
which corresponds to bands 18 to 28, both inclusive, of CHRIS sensor Mode 1,
corresponding to 604.97 and 694.19 nm, respectively:
S~
ð700
600
Rr dl ð12Þ
where S is the area between l 5 600 nm and l 5 700 nm and Rr is the reflectance (r6 10000) after atmospheric correction.
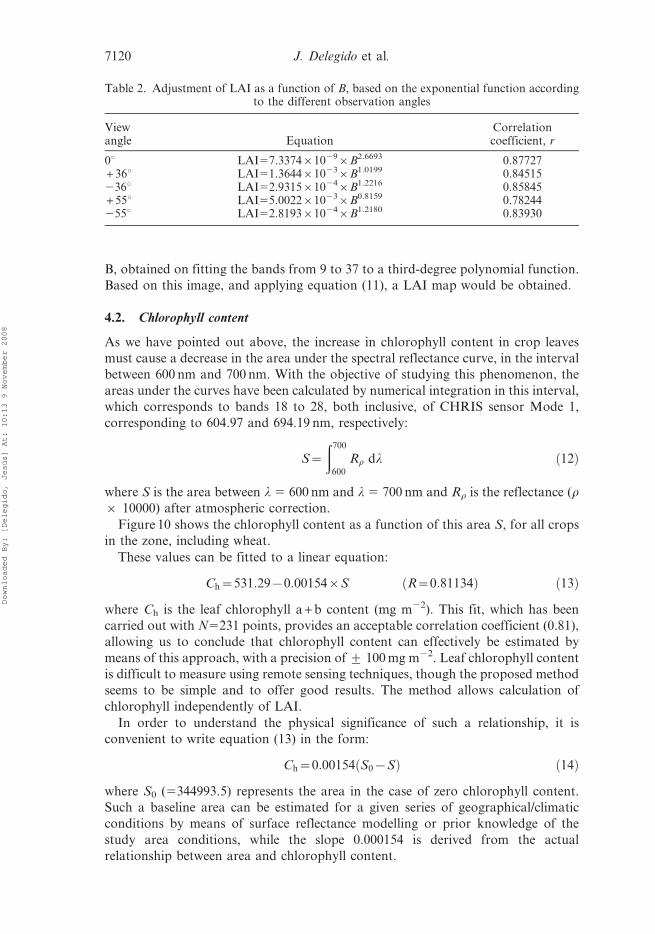
Figure 10 shows the chlorophyll content as a function of this area S, for all crops
in the zone, including wheat.
These values can be fitted to a linear equation:
Ch~531:29{0:00154|S R~0:81134ð Þ ð13Þ
where Ch is the leaf chlorophyll a + b content (mg m22). This fit, which has been
carried out with N5231 points, provides an acceptable correlation coefficient (0.81),
allowing us to conclude that chlorophyll content can effectively be estimated by
means of this approach, with a precision of ¡ 100 mg m22. Leaf chlorophyll content
is difficult to measure using remote sensing techniques, though the proposed method
seems to be simple and to offer good results. The method allows calculation of
chlorophyll independently of LAI.
In order to understand the physical significance of such a relationship, it is
convenient to write equation (13) in the form:
Ch~0:00154 S0{Sð Þ ð14Þ
where S0 (5344993.5) represents the area in the case of zero chlorophyll content.
Such a baseline area can be estimated for a given series of geographical/climatic
conditions by means of surface reflectance modelling or prior knowledge of the
study area conditions, while the slope 0.000154 is derived from the actual
relationship between area and chlorophyll content.
Table 2. Adjustment of LAI as a function of B, based on the exponential function accordingto the different observation angles
Viewangle Equation
Correlationcoefficient, r
0u LAI57.3374610296B2.6693 0.87727+ 36u LAI51.3644610236B1.0199 0.84515236u LAI52.9315610246B1.2216 0.85845+ 55u LAI55.0022610236B0.8159 0.78244255u LAI52.8193610246B1.2180 0.83930
7120 J. Delegido et al.
Downloaded By: [Delegido, Jesús] At: 10:13 9 November 2008
It would be interesting for future studies to examine whether S0 and the slope are
dependent upon the local conditions (climate, type of soil, etc.), or whether
contrarily they are one and the same for any region and climate, since atmospheric
influence has been eliminated from the images as a result of the atmospheric
correction applied.
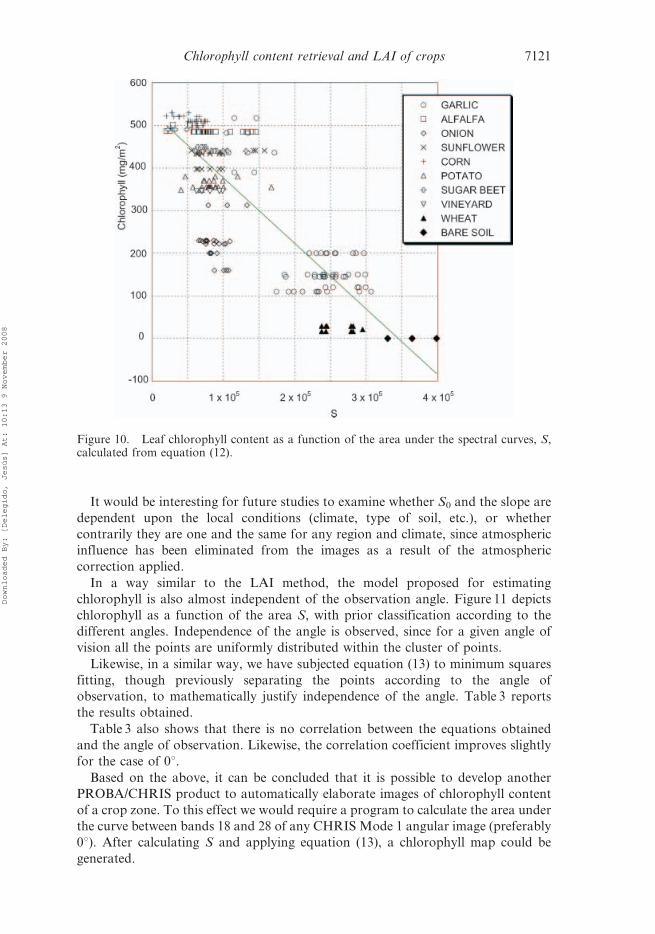
In a way similar to the LAI method, the model proposed for estimating
chlorophyll is also almost independent of the observation angle. Figure 11 depicts
chlorophyll as a function of the area S, with prior classification according to the
different angles. Independence of the angle is observed, since for a given angle of
vision all the points are uniformly distributed within the cluster of points.
Likewise, in a similar way, we have subjected equation (13) to minimum squares
fitting, though previously separating the points according to the angle of
observation, to mathematically justify independence of the angle. Table 3 reports
the results obtained.
Table 3 also shows that there is no correlation between the equations obtained
and the angle of observation. Likewise, the correlation coefficient improves slightly
for the case of 0u.Based on the above, it can be concluded that it is possible to develop another
PROBA/CHRIS product to automatically elaborate images of chlorophyll content
of a crop zone. To this effect we would require a program to calculate the area under
the curve between bands 18 and 28 of any CHRIS Mode 1 angular image (preferably
0u). After calculating S and applying equation (13), a chlorophyll map could be
generated.
Figure 10. Leaf chlorophyll content as a function of the area under the spectral curves, S,calculated from equation (12).
Chlorophyll content retrieval and LAI of crops 7121
Downloaded By: [Delegido, Jesús] At: 10:13 9 November 2008
4.3. Validation of both methods
With the purpose of confirming the validity of both methods, they have been tested
with data obtained in another campaign and using a different sensor. In the context
of the ESA Sentinel-2 and Fluorescence Experiment (SEN2FLEX-2005), chlor-
ophyll and LAI measurements of different crops have been carried out in the
Barrax, Spain study area. CASI imagery (288 bands with 2 nm resolution) available
from the SEN2FLEX campaign has been used in combination with AHS (airborne
hyperspectral scanner) data, obtained in July 2005.
Measurements were made of the chlorophyll content of seven different plant
species: alfalfa, corn, onion, garlic, sugar-beet, vineyard and Quercus ilex (pine),
using the same methodology as previously described for the SPARC campaigns.
Based on the spectra obtained with the CASI sensor, calculation was made of the
area under the curve between 600 nm and 700 nm. Different indices were also
Figure 11. Leaf chlorophyll content as a function of the area under the spectral curves, S,classified according to view angle.
Table 3. Fitting of chlorophyll content, Ch (mg m22), as a function of S, based on a linearfunction according to the different angles of observation
View angle Equation Correlation coefficient, r
0u Ch5530.75 – 0.0014706S 0.85988+ 36u Ch5551.32 – 0.0017096S 0.81339236u Ch5533.44 – 0.0014916S 0.81796+ 55u Ch5520.76 – 0.0016156S 0.79050255u Ch5543.88 – 0.0016166S 0.76202
7122 J. Delegido et al.
Downloaded By: [Delegido, Jesús] At: 10:13 9 November 2008
determined: the Quotient Index, GMI defined by Gitelson and Merzlyak (1998), the
Modified Chlorophyll Absorption in Reflectance Index (MCARI) (Daughtry et al.
2000), the Transformed CARI (TCARI) (Haboudane et al. 2002) and the MERIS
Terrestrial Chlorophyll Index (MTCI) (Dash and Curran 2004). Comparing the
chlorophyll data measured in the plants with these indices, and with the area under
the curve, it can be concluded that the precision obtained by the latter is similar to
that afforded by the different indices—as can be seen in Gandıa et al. (2006).
Similarly, in the same crops, LAI was measured using the same methodology as in
the SPARC campaigns. In total, 97 LAI measurements (ESUs) were made using
four LAI-2000 instruments. Data from four different crops (alfalfa, corn, onion and
sugar-beet), and a total of nine plots were used to test the results. A large number of
spectral indices were calculated with the spectral information available (Fernandez
et al. 2006). The best results were found for the MCARI-1 index, proposed by
Haboudane et al. (2004), and based on the MCARI index. On the other hand,
hyperspectral reflectance spectra have been adjusted between 500 nm and 750 nm,
calculating LAI by mathematical fitting by means of third degree polynomial
functions. On comparing the experimental values of LAI with those obtained by
mathematical fitting, a correlation was found (R50.83) similar to that obtained in
this work by means of equation (11) (Fernandez et al. 2006).
5. Conclusions
Knowledge of the canopy leaf area index and chlorophyll content, and its spatial
distribution, is fundamental for studying ecosystem behaviour and productivity.
The increased use of sensors such as PROBA/CHRIS, with multiple-view-angle
imaging capability, in conjunction with high spectral and spatial resolution, provides
new opportunities to test and develop new algorithms and approaches to forestry and
agriculture. The high number of bands in visible and infrared intervals allows us to
treat these spectra as continuous mathematical functions. The method proposed in the
present work demonstrates that the exploitation of these continuous functions can
yield information on plant biophysical variables such as LAI and chlorophyll a + b
content. In addition, the approach described in this paper provides a practical method
for estimating these variables by means of remote sensing techniques.
Using PROBA/CHRIS data from the SPARC 2003 and 2004 campaigns, and
simultaneously employing in situ measurements of LAI and chlorophyll content for
10 different crops, we analysed almost 250 spectra from different days and with
different observation angles corresponding to points of different crops with a great
variety of LAI and chlorophyll content values. We have observed that in the spectral
interval of interest (between 500 nm and 750 nm for the calculation of LAI), the
spectra can be adjusted with good precision to third degree polynomials. Based on
the experimental data, we have seen a very strong correlation among the four
coefficients values, with calculation of the latter.
We have observed a close correlation (R50.85) between one of these coefficients
and LAI that has allowed us to define a potential formula relating the coefficient to
LAI. A method is thus afforded that allows us to obtain LAI from hyperspectral
data, provided there are sufficient available bands in the interval considered. The
method provides LAI with a mean error of ,1, independently of the observation
angle and chlorophyll content.
On the other hand, we have calculated the area under the spectral reflectance
curves between 600 nm and 700 nm, this being the interval where chlorophyll exerts
Chlorophyll content retrieval and LAI of crops 7123
Downloaded By: [Delegido, Jesús] At: 10:13 9 November 2008
a dominant influence. We have observed a close correlation (R50.81) between these
areas and crop chlorophyll contents when adjusted to a linear function. This
provides a method for retrieving chlorophyll content by remote sensing techniques,
independently of observation angle and LAI, with a precision of ¡ 100 mg m22.
The large number of field data and different crops used in this study, and the
broad variability observed, directly relating variables measured in situ with remote
sensing data from several different years, confirms the statistical validity of both
methods.
Both methods, initially developed over 2003 and 2004 data, have been tested with
data obtained from another campaign in 2007 and compared to results obtained by
using a different sensor (airborne CASI), thus providing robustness to this
approach.
The fact that the images used have previously been subjected to atmospheric
correction indicates that both methods should be validated under other conditions.
This could be the subject of future research. It would be equally interesting to
evaluate the methods in application to other soil types, with extrapolation to any
region and climate, and even to other vegetation contexts such as forests, rainforests
or bushes.
ReferencesALONSO, L. and MORENO, J., 2005, Advances and limitations in a parametric geometric
correction of CHRIS/PROBA data. Proceedings of the 3rd CHRIS/PROBA
Workshop, ESA/ESRIN, Frascati, Italy. Available online at: http://earth.esa.int/
workshops/chris_proba_05/papers/06_alonso.pdf.
BACOUR, C., BARET, F., BEAL, D., WEISS, M. and PAVAGENAU, K., 2006, Neural network
estimation of LAI, fAPAR, fCover and LAI6Cab, from top of canopy MERIS
reflectance data: principles and validation. Remote Sensing of Environment, 105, pp.
313–325.
BARET, F. and GUYOT, G., 1991, Potentials and limits of vegetation indices for LAI and
APAR assessment. Remote Sensing of Environment, 35, pp. 161–173.
BARET, F., CHAMPION, I., GUYOT, G. and PODAIRE, A., 1987, Monitoring wheat canopies
with a high spectral resolution radiometer. Remote Sensing of Environment, 22, pp.
367–378.
BARET, F., JACQUEMOUD, S., GUYOT, G. and LEPRIEUR, C., 1992, Modelled analysis of the
biophysical nature of spectral shifts and comparison with information content of
broad bands. Remote Sensing of Environment, 41, pp. 133–142.
BARET, F., HOULES, V. and GUERIF, M., 2007, Quantification of plant stress using remote
sensing observations and crop models: the case of nitrogen management. Journal of
Experimental Botany, 58, pp. 869–880.
BARNSLEY, M.J., SETTLE, J.J., CUTTER, M.A., LOBB, D.R. and TESTON, F., 2004, The
PROBA/CHRIS Mission. A low-cost smallsat for hyperspectral multiangle observa-
tions of the Earth surface and atmosphere. IEEE Transactions on Geoscience and
Remote Sensing, 42, pp. 1512–1520.
BEADLE, C.L., 1993, Growth analysis. In Photosynthesis and Production in a Changing
Environment: A field and laboratory manual, pp. 36–46 (London: Chapman & Hall).
CARLSON, T.N. and RIPLEY, D.A., 1997, On the relation between NDVI, fractional vegetation
cover, and leaf area index. Remote Sensing of Environment, 62, pp. 241–252.
CHAURASIA, S. and DADHWAL, V.K., 2004, Comparison of principal component inversion
with VI-empirical approach for LAI estimation using simulated reflectance data.
International Journal of Remote Sensing, 25, pp. 2881–2887.
7124 J. Delegido et al.
Downloaded By: [Delegido, Jesús] At: 10:13 9 November 2008
CLEVERS, J.G.P.W., 1994, Imaging spectrometry in agriculture—plant vitality and yield
indicators. In Imaging Spectrometry—A Tool for Environmental Observations, J. Hill
and J. Megier (Eds), pp. 193–219 (Dordrecht: Kluwer Academic).
CLEVERS, J.G.P.W., DE JONG, S.M., EPEMA, G.F., VAN DER MEER F.D., BAKKER, W.H.,
SKIDMORE, A.K. and SCHOLTE, K.H., 2002, Derivation of the red edge index using the
MERIS standard band setting. International Journal Remote Sensing, 23, pp.
3169–3184.
COLLINS, W., 1978, Remote sensing of crop type and maturity. Photogrammetric Engineering
and Remote Sensing, 26, pp. 43–55.
CURRAN, P., DUGAN, J., MACLER B. and PLUMMER, S., 1991, The effect of a red leaf pigment
on the relationship between red edge and chlorophyll concentration. Remote Sensing
of Environment, 35, pp. 69–76.
CURRAN, P.J., WINDHAM, W.R. and GHOLZ, H.L., 1995, Exploring the relationship between
reflectance red edge and chlorophyll concentration in slash pine leaves. Tree
Physiology, 15, pp. 203–206.
CURRAN, P.J., KUPIEC, J.A. and SMITH, G.M., 1997, Remote sensing the biochemical
composition of a slash pine canopy. IEEE Transactions on Geoscience and Remote
Sensing, 35, pp. 415–420.
CURRAN, P.J., DASH, J. and LLEWELLYN, G.M., 2007, Indian Ocean tsunami: the use of
MERIS (MTVI) data to infer salt stress in coastal vegetation. International Journal of
Remote Sensing, 28, pp. 729–735.
DASH, J. and CURRAN, P.J., 2004, The MERIS terrestrial chlorophyll index. International
Journal Remote Sensing, 25, pp. 5403–5413.
DASH, J., MATHUR, A., FOODY, G.M., CURRAN, P.J., CHIPMAN, J.W. and LILLESAND, T.M.,
2007, Land cover classification using multi-temporal MERIS vegetation indices.
International Journal Remote Sensing, 28, pp. 1137–1159.
DAUGHTRY, C.S.T., WALTHALL, C.L., KIM, M.S., BROWN dE COLSTOUN, E. and MCMURTREY
III, J.E., 2000, Estimating corn leaf chlorophyll concentration from leaf and canopy
reflectance. Remote Sensing of Environment, 74, pp. 229–239.
DAWSON, T.P. and CURRAN, P.J., 1998, A new technique for interpolating the reflectance red
edge position. International Journal Remote Sensing, 19, pp. 2133–2139.
DEMETRIADES-SHAH, T.H., STEVEN, M.D. and CLARK, J.A., 1990, High resolution derivative
spectra in remote sensing. Remote Sensing of Environment, 33, pp. 55–64.
ELVIDGE, C.D. and CHEN, Z., 1995, Comparison of broad-band and narrow-band red and
near-infrared vegetation indices. Remote Sensing of Environment, 54, pp. 38–48.
FASSNACHT, K.S., GOWER, S.T., MACKENZIE, M.D., NORDHEIM, E.V. and LILLESAND, T.M.,
1997, Estimating the leaf area index of North-central Wisconsin forest using the
Landsat Thematic Mapper. Remote Sensing of Environment, 61, pp. 229–245.
FERNANDEZ, G., MORENO, J., GANDIA, S., MARTINEZ, B., VUOLO, F. and MORALES, F., 2005,
Statistical variability of field measurements of biophysical parameters in SPARC-
2003 and SPARC-2004 campaigns. Proceedings of the SPARC Workshop, ESA,
Enschede, The Netherlands. CD-ROM WPP-250, ISSN 1022-6656.
FERNANDEZ, G., DELEGIDO, J., GARCIA-LLONGO, J. and MORENO, J., 2006, Implications on
retrieving leaf area index by using Sentinel-2 spectral bands. Proceedings of Final
Workshop of SEN2FLEX, ESA- Estec, The Netherlands, 31 October 2006, CD-ROM.
GANDIA, S., FERNANDEZ, G., GARCIA, J.C. and MORENO, J., 2004, Retrieval of vegetation
biophysical variables from CHRIS/PROBA data in the SPARC campaign.
Proceedings of the 2nd CHRIS/Proba Workshop, ESA/ESRIN, Frascati, Italy.
Available online at: http://earth.esa.int/workshops/chris_proba_04/papers/12_
Gandia.pdf.
GANDIA, S., MORENO, J., FERNANDEZ, G. and MORENO, D., 2005, Chlorophyll measurements
in SPARC campaigns. Proceedings of the SPARC Workshop, ESA, Enschede, The
Netherlands. CD-ROM WPP-250, ISSN 1022-6656.
Chlorophyll content retrieval and LAI of crops 7125
Downloaded By: [Delegido, Jesús] At: 10:13 9 November 2008
GANDIA, S., MORENO, J. and DELEGIDO, J., 2006, Retrieval of crops chlorophyll content from
CASI images and SENTINEL-2 bands simulation. Proceedings of Final Workshop of
SEN2FLEX, ESA-Estec, The Netherlands, 31 October 2006, CD-ROM.
GILABERT, M.A., GANDIA, S. and MELIA, J., 1996, Analyses of spectral–biophysical
relationships for a corn canopy. Remote Sensing of Environment, 55, pp. 11–20.
GITELSON, A.A. and MERZLYAK, M.N., 1998, Remote sensing of chlorophyll concentration in
higher plant leaves. Advances in Space Research, 22, pp. 689–692.
GITELSON, A.A., VINA, A., CIGANDA, V., RUNDQUIST, D.C. and ARKEBAUER, T.J., 2005,
Remote estimation of canopy chlorophyll content in crops Geophysical Research
Letters, 32, L08403, doi:10.1029/2005GL022688.
GREEN, E.P., MUMBY, P.J., EDWARDS, A.J., CLARK, C.D. and ELLIS, A.C., 1997, Estimating
leaf area index of mangroves from satellite data. Aquatic Botany, 58, pp. 11–19.
GUANTER, L., ALONSO, L. and MORENO, J., 2005a, A method for the surface reflectance
retrieval from PROBA/CHRIS data over land: application to ESA SPARC
campaigns. IEEE Transactions on Geoscience and Remote Sensing, 43, pp. 2908–2917.
GUANTER, L., ALONSO, L. and MORENO, J., 2005b, First results from the PROBA/CHRIS
hyperspectral/multiangular satellite system over land and water targets. IEEE
Geoscience and Remote Sensing Letters, 2, pp. 250–254.
HABOUDANE, D., MILLER, J.R., TREMBLAY, N., ZARCO-TEJADA, P.J. and DEXTRAZE, L.,
2002, Integral narrow-band vegetation indices for prediction of crop chlorophyll
content for application to precision agriculture. Remote Sensing of Environment, 81,
pp. 416–426.
HABOUDANE, D., MILLER, J.R., PATTEY, E., ZARCO-TEJADA, P.J. and STRACHAN, I.S., 2004,
Hyperspectral vegetation indices and novel algorithms for predicting green LAI of
crop canopies: modeling and validation in the context of precision agriculture. Remote
Sensing of Environment, 90, pp. 337–352.
HAYKIN, S., 1994, Neural Networks a Comprehensive Foundation (Upper Saddle River, NJ:
Prentice-Hall).
HOLDEN, M., 1976, Chlorophylls. In Chemistry and Biochemistry of Plant Pigments, vol 2 T.W.
Goodwin (Eds), pp. 1–37 (London: Academic Press).
HORLER, D.N.H., DOCKRAY, M. and BARBER, J., 1983, The red edge of plant leaf reflectance.
International Journal of Remote Sensing, 4, pp. 273–288.
INSKEEP, W.P. and BLOOM, P.R., 1984, Extinction coefficients of chlorophyll a and b in NN-
dimethylforamide and 80% acetone. Plant Physiology, 77, pp. 483–485.
JACKSON, R.D. and PINTER JR, P.J., 1986, Spectral response of architecturally different wheat
canopies. Remote Sensing of Environment, 20, pp. 43–56.
JACQUEMOUD, S., 1993, Inversion of the PROSPECTzSAIL canopy reflectance model from
AVIRIS equivalent spectra: theoretical study. Remote Sensing of Environment, 44, pp.
281–292.
JACQUEMOUD, S., USTIN, S.L., VERDEBOUT, J., SCHMUCK, G., ANDREOLI, G. and
HOSGOOD, B., 1996, Estimating leaf biochemistry using the PROSPECT leaf optical
properties model. Remote Sensing of Environment, 56, pp. 194–202.
JENSEN, R.R. and BINFORD, M.W., 2004, Measurements and comparison of leaf area index
estimators derived from satellite remote sensing techniques. International Journal of
Remote Sensing, 20, pp. 4251–4265.
JIMENEZ-MUNOZ, J.C., SOBRINO, J.A., GUANTER, L., MORENO, J., PLAZA, A. and
MARTINEZ, P., 2005, Fractional Vegetation Cover estimation from PROBA/CHRIS
data: methods, analysis of angular effects and application to the land surface
emissivity retrieval. Proceedings of the 3rd CHRIS/PROBA Workshop, ESA/ESRIN,
Frascati, Italy. Available online at: http://earth.esa.int/workshops/chris_proba_05/
papers/26_Jime.pdf.
KOKALY, R.F. and CLARK, R.N., 1999, Spectroscopic determination of leaf biochemistry
using band depth analysis of absorption features and stepwise multiple linear
regression. Remote Sensing of Environment, 67, pp. 267–287.
7126 J. Delegido et al.
Downloaded By: [Delegido, Jesús] At: 10:13 9 November 2008
LICHTENTHALER, H.K., 1987, Chlorophylls and carotenoids: pigments of photosynthetic
biomembranes. Methods in Enzymology, 148, pp. 350–382.
LICHTENTHALER, H.K., GITELSON, A.A. and LANG, M., 1996, Non destructive determination
of chlorophyll content of leaves of a green and an aurea mutant of tobacco by
reflectance measurements. Journal of Plant Physiology, 148, pp. 483–493.
MAIRE, G., FRANCOIS, C. and DUFRENE, E., 2004, Towards universal broad leaf chlorophyll
indices using PROSPECT simulated database and hyperspectral reflectance
measurements. Remote Sensing of Environment, 89, pp. 1–28.
MARTIN, M.E., NEWMAN, S.D., ABER, J.D. and CONGALTON, R.G., 1998, Determining forest
species composition using high spectral resolution remote sensing data. Remote
Sensing of Environment, 65, pp. 249–254.
MAUSER, W. and BACH, H., 1995, Imaging spectroscopy in hydrology and agriculture—
determination of model parameters. In Imaging Spectrometry—a Tool for
Environmental Observations, J. Hill and J. Megier (Eds), pp. 261–283 (Dordrecht:
Kluwer Academic).
MILLER, J.R., HARE, E.W. and WU, J., 1990, Quantitative characterisation of the vegetation
red edge reflectance I. An inverted-Gaussian reflectance model. International Journal
of Remote Sensing, 11, pp. 1755–1773.
MORENO, J., ALONSO, L., FERNANDEZ, G., FORTEA, J.C., GANDIA, S., GUANTER, L.,
GARCIA, J.C. and MARTI, J.M., 2004, The spectra Barrax campaign (SPARC):
overview and first results from CHRIS data. Proceedings of the 2nd CHRIS/PROBA
Workshop, ESA/ESRIN, Frascati, Italy. Available online at: http://earth.esa.int/
workshops/chris_proba_04/papers/10_MOREN.pdf.
MYNENI, R.B. and WILLIAMS, D.L., 1994, On the relationship between FAPAR and NDVI.
Remote Sensing of Environment, 49, pp. 200–211.
NIANG, A., BADRAN, F., MOULIN, C., CREPON, M. and THIRIA, S., 2006, Retrieval of aerosol
type and optical thickness over the Mediterranean from SeaWiFS images using an
automatic neural classification method. Remote Sensing of Environment, 100, pp.
82–94.
OPPELT, N. and MAUSER, W., 2004, Hyperspectral monitoring of physiological of parameters
of wheat during a vegetation period using AVIS data. International Journal of Remote
Sensing, 25, pp. 145–159.
PEARCE, R.B., BROWN, R.H. and BLASER, R.E., 1965, Relationships between leaf area index,
light interception and net photosynthesis in orchardgrass. Crop Science, 5, pp.
553–556.
PRICE, J.C., 1992, Estimating vegetation amount from visible and near infrared reflectance
measurements. Remote Sensing of Environment, 41, pp. 29–34.
RICHARDSON, A., DUIGAN, S. and BERLYN, G., 2002, An evaluation of non invasive methods
to estimate foliar chlorophyll content. New Phytologist, 153, pp. 185–194.
SAGARDOY, R., GANDIA, S., MORENO, J. and MORALES, F., 2006, Crop photosynthetic
pigment composition during the SEN2FLEX campaigns. Proceedings of Final
Workshop of SEN2FLEX, ESA-Estec, The Netherlands 31 October 2006, CD-ROM.
THOMAS, J.R. and GAUSMAN, H.W., 1977, Leaf reflectance vs leaf chlorophyll and cartenoid
concentrations for eight crops. Agronomy Journal, 69, pp. 799–802.
WELLES, J.M. and NORMAN, J.M., 1991, Instrument for indirect measurement of canopy
architecture. Agronomy Journal, 83, pp. 818–825.
VUOLO, F., DINI, L. and D’URSO, G., 2006, Retrieval of leaf area index from remote sensing
data: how much do you pay for what you get? 2nd Recent Advances in Quantitative
Remote Sensing, Torrent, Valencia, 2006, GCU (Ed.), pp. 266–271.
Chlorophyll content retrieval and LAI of crops 7127
Downloaded By: [Delegido, Jesús] At: 10:13 9 November 2008
Related Documents