ARTICLES PUBLISHED ONLINE: 16 JANUARY 2011 | DOI: 10.1038/NGEO1061 Retreat of the East Antarctic ice sheet during the last glacial termination Andrew Mackintosh 1 * , Nicholas Golledge 1 , Eugene Domack 2 , Robert Dunbar 3 , Amy Leventer 4 , Duanne White 5 , David Pollard 6 , Robert DeConto 7 , David Fink 8 , Dan Zwartz 1 , Damian Gore 5 and Caroline Lavoie 2 The retreat of the East Antarctic ice sheet at the end of the last glacial period has been attributed to both sea-level rise and warming of the ocean at the margin of the ice sheet, but it has been challenging to test these hypotheses. Given the lack of constraints on the timing of retreat, it has been difficult to evaluate whether the East Antarctic ice sheet contributed to meltwater pulse 1a, an abrupt sea-level rise of approximately 20m that occurred about 14,700 years ago. Here we use terrestrial exposure ages and marine sedimentological analyses to show that ice retreat in Mac. Robertson Land, East Antarctica, initiated about 14,000 years ago, became widespread about 12,000 years ago, and was completed by about 7,000 years ago. We use two models of different complexities to assess the forcing of the retreat. Our simulations suggest that, although the initial stage of retreat may have been forced by sea-level rise, the majority of the ice loss resulted from ocean warming at the onset of the Holocene epoch. In light of our age model we conclude that the East Antarctic ice sheet is unlikely to have been the source of meltwater pulse 1a, and, on the basis of our simulations, suggest that Antarctic ice sheets made an insignificant contribution to eustatic sea-level rise at this time. G eological records from Antarctica’s continental margin provide a history of ice-sheet retreat that is significantly longer than modern observations, and span the period when Earth was undergoing its most recent major climate warming. During the last glacial termination, sea level rose by 125 ± 5 m, mostly owing to melting of Northern Hemisphere ice sheets 1–3 , with Antarctic air temperatures 4,5 and the Southern Ocean 6,7 warming to near-modern levels. Rising ocean temperatures over recent decades have resulted in significant ablation beneath Antarctic Peninsula and West Antarctic ice shelves 8 , and might also have controlled ice-sheet mass balance over longer periods 9–11 . Sea-level rise in the instrumental era has been too small to influence present-day Antarctic ice extent, but geological evidence indicates that larger sea-level changes over glacial–interglacial cycles may have forced ice advance and retreat 12,13 . These geological studies as well as some ice-sheet modelling experiments 14 indicate that both sea-level and ocean-temperature changes may be needed to bring about major Antarctic ice-sheet fluctuations. So far, few studies have specifically combined empirical and modelling data, or a full consideration of palaeoenvironmental changes described by proxy archives, especially for the East Antarctic ice sheet (EAIS), the largest on Earth. Here, we describe an ice-sheet retreat chronology from onshore and offshore empirical records in Mac. Robertson Land, East Antarctica (Fig. 1), climate-proxy records reflecting changes in global forcings and perturbations, and ice-sheet modelling experiments of varying complexity to understand the key processes that drove ice-sheet recession through the last glacial termination. These data enable a new appraisal of hypotheses surrounding 1 Antarctic Research Centre, Victoria University of Wellington, Wellington 6012, New Zealand, 2 Department of Geosciences, Hamilton College, Clinton, New York 13323, USA, 3 Environmental Earth System Science, Stanford University, Stanford, California 94305, USA, 4 Department of Geology, Colgate University, Hamilton, New York 13346, USA, 5 Department of Environment and Geography, Macquarie University, New South Wales 2109, Australia, 6 Earth and Environmental Systems Institute, Pennsylvania State University, University Park, Pennsylvania 16802, USA, 7 Department of Geosciences, University of Massachusetts, Amherst, Massachusetts 01003, USA, 8 Institute for Environmental Research, ANSTO, Menai, New South Wales 2234, Australia. *e-mail: [email protected]. the likely contribution of East Antarctica to meltwater pulse 1a (MWP 1a; refs 1,15,16). Geological evidence from Mac. Robertson Land Interpretation of swath bathymetric maps of the Mac. Robertson Land continental shelf allows us to resolve the nature and extent of former ice-sheet grounding (Fig. 1). The well-preserved nature of these subglacial features and their associated grounding-zone deposits located within troughs containing postglacial sediments (Fig. 2) suggests that they date from the most recent expansion of the ice sheet onto the continental shelf during the Last Glacial Maximum (LGM). Evidence of highly attenuated megascale glacial lineations (MSGLs) in both Nielsen Basin and Iceberg Alley reflects the presence of streaming ice, and indicates ice-sheet grounding to >1 km below modern-day sea level (Fig. 1). In Iceberg Alley streaming occurred preferentially in the deeper part of the trough, from the mid- to outer shelf, whereas in Nielsen Basin fast-flowing ice was prevalent along all of its grounded length and MSGLs indicate ice flow into the trough from the adjacent West Storegg Bank. Maximal ice-sheet extent in Iceberg Alley and Nielsen Basin is marked by grounding-zone sediment wedges located near the continental-shelf break at identical water depths (-388 m; Fig. 1). These landforms broadly coincide with transitions from fluted substrate (indicative of grounded ice) to dense populations of keel marks (marking iceberg flotillas). Postglacial sediment drifts located landward of the maximum ice extent provide a high-resolution sediment record of the transition from the last glacial to the Holocene, permitting assessment of NATURE GEOSCIENCE | ADVANCE ONLINE PUBLICATION | www.nature.com/naturegeoscience 1

Welcome message from author
This document is posted to help you gain knowledge. Please leave a comment to let me know what you think about it! Share it to your friends and learn new things together.
Transcript
ARTICLESPUBLISHED ONLINE: 16 JANUARY 2011 | DOI: 10.1038/NGEO1061
Retreat of the East Antarctic ice sheet during thelast glacial terminationAndrew Mackintosh1*, Nicholas Golledge1, Eugene Domack2, Robert Dunbar3, Amy Leventer4,Duanne White5, David Pollard6, Robert DeConto7, David Fink8, Dan Zwartz1, Damian Gore5
and Caroline Lavoie2
The retreat of the East Antarctic ice sheet at the end of the last glacial period has been attributed to both sea-level rise andwarming of the ocean at the margin of the ice sheet, but it has been challenging to test these hypotheses. Given the lackof constraints on the timing of retreat, it has been difficult to evaluate whether the East Antarctic ice sheet contributedto meltwater pulse 1a, an abrupt sea-level rise of approximately 20 m that occurred about 14,700 years ago. Here weuse terrestrial exposure ages and marine sedimentological analyses to show that ice retreat in Mac. Robertson Land, EastAntarctica, initiated about 14,000 years ago, became widespread about 12,000 years ago, and was completed by about 7,000years ago. We use two models of different complexities to assess the forcing of the retreat. Our simulations suggest that,although the initial stage of retreat may have been forced by sea-level rise, the majority of the ice loss resulted from oceanwarming at the onset of the Holocene epoch. In light of our age model we conclude that the East Antarctic ice sheet is unlikelyto have been the source of meltwater pulse 1a, and, on the basis of our simulations, suggest that Antarctic ice sheets made aninsignificant contribution to eustatic sea-level rise at this time.
Geological records from Antarctica’s continental marginprovide a history of ice-sheet retreat that is significantlylonger thanmodern observations, and span the period when
Earth was undergoing its most recent major climate warming.During the last glacial termination, sea level rose by 125± 5m,mostly owing tomelting of NorthernHemisphere ice sheets1–3, withAntarctic air temperatures4,5 and the Southern Ocean6,7 warming tonear-modern levels. Rising ocean temperatures over recent decadeshave resulted in significant ablation beneath Antarctic Peninsulaand West Antarctic ice shelves8, and might also have controlledice-sheet mass balance over longer periods9–11. Sea-level rise inthe instrumental era has been too small to influence present-dayAntarctic ice extent, but geological evidence indicates that largersea-level changes over glacial–interglacial cycles may have forcedice advance and retreat12,13. These geological studies as well assome ice-sheet modelling experiments14 indicate that both sea-leveland ocean-temperature changes may be needed to bring aboutmajor Antarctic ice-sheet fluctuations. So far, few studies havespecifically combined empirical and modelling data, or a fullconsideration of palaeoenvironmental changes described by proxyarchives, especially for the East Antarctic ice sheet (EAIS), the largeston Earth. Here, we describe an ice-sheet retreat chronology fromonshore and offshore empirical records in Mac. Robertson Land,East Antarctica (Fig. 1), climate-proxy records reflecting changesin global forcings and perturbations, and ice-sheet modellingexperiments of varying complexity to understand the key processesthat drove ice-sheet recession through the last glacial termination.These data enable a new appraisal of hypotheses surrounding
1Antarctic Research Centre, Victoria University of Wellington, Wellington 6012, New Zealand, 2Department of Geosciences, Hamilton College, Clinton,New York 13323, USA, 3Environmental Earth System Science, Stanford University, Stanford, California 94305, USA, 4Department of Geology, ColgateUniversity, Hamilton, New York 13346, USA, 5Department of Environment and Geography, Macquarie University, New South Wales 2109, Australia, 6Earthand Environmental Systems Institute, Pennsylvania State University, University Park, Pennsylvania 16802, USA, 7Department of Geosciences, University ofMassachusetts, Amherst, Massachusetts 01003, USA, 8Institute for Environmental Research, ANSTO, Menai, New South Wales 2234, Australia.*e-mail: [email protected].
the likely contribution of East Antarctica to meltwater pulse 1a(MWP 1a; refs 1,15,16).
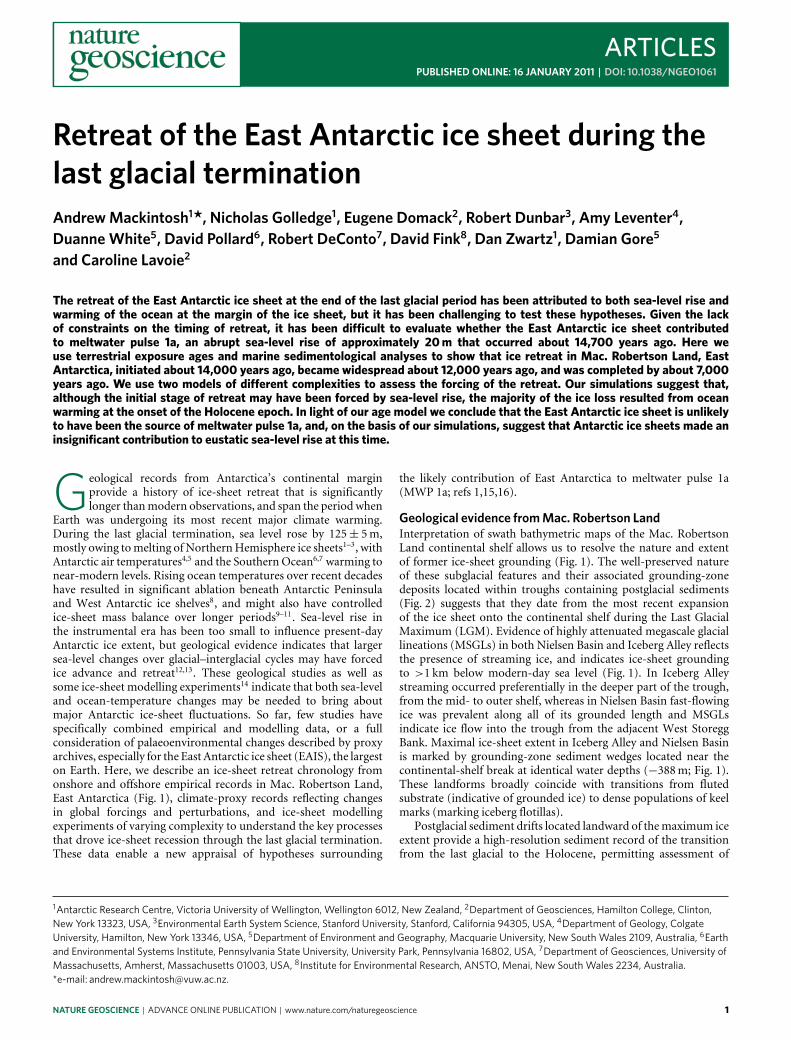
Geological evidence from Mac. Robertson LandInterpretation of swath bathymetric maps of the Mac. RobertsonLand continental shelf allows us to resolve the nature and extentof former ice-sheet grounding (Fig. 1). The well-preserved natureof these subglacial features and their associated grounding-zonedeposits located within troughs containing postglacial sediments(Fig. 2) suggests that they date from the most recent expansionof the ice sheet onto the continental shelf during the Last GlacialMaximum (LGM). Evidence of highly attenuated megascale glaciallineations (MSGLs) in both Nielsen Basin and Iceberg Alley reflectsthe presence of streaming ice, and indicates ice-sheet groundingto >1 km below modern-day sea level (Fig. 1). In Iceberg Alleystreaming occurred preferentially in the deeper part of the trough,from the mid- to outer shelf, whereas in Nielsen Basin fast-flowingice was prevalent along all of its grounded length and MSGLsindicate ice flow into the trough from the adjacent West StoreggBank. Maximal ice-sheet extent in Iceberg Alley and Nielsen Basinis marked by grounding-zone sediment wedges located near thecontinental-shelf break at identical water depths (−388m; Fig. 1).These landforms broadly coincide with transitions from flutedsubstrate (indicative of grounded ice) to dense populations of keelmarks (marking iceberg flotillas).
Postglacial sediment drifts located landward of themaximum iceextent provide a high-resolution sediment record of the transitionfrom the last glacial to the Holocene, permitting assessment of
NATURE GEOSCIENCE | ADVANCE ONLINE PUBLICATION | www.nature.com/naturegeoscience 1
ARTICLES NATURE GEOSCIENCE DOI: 10.1038/NGEO1061
66° E65° E64° E63° E
66° E65° E64° E63° E
67° 0
' S6
7° 30' S
FramnesMtns
Mawson (Aus)
West Storegg Bank
¬200 m
¬100 m
¬150 m
¬125 m
¬75 m¬50 m
¬25 m
¬1,000 m
¬2,000 m
¬500 m
East Antarctic Ice sheet
JPC40 Core site
East Storegg Bank
ACC
ASC
GZW
GZW
GZW
GZW
66° 0' E65° 55' E
0 2,000 4,0001,000
(m)
Wat
er d
epth
(m
)
Nielsen Basin
B
63° E62° 30' E
A
B
B
C
C
DavidRange
Mt. Henderson
NorthMassonRange
MSGLs
IcebergAlley
Nielsen Basin
JPC43B
JPC40
Continental shelf
BrownRange
Mawson
Framnes Mtns
Y’
Y
Icebergkeel marks
LGM ice sheet
1,000 m
500 m
200 m
100 m
x
x’
CentralMassonRange
z’
40° E0°40° W
50° S
50° S
IANB
SCPB
MNTWRS
ETGLaALaB
PD
B B’
MSGLs
MSGLs
Profile distance (m)
Wat
er d
epth
(m
)
¬290
¬280
¬270
0 500 1,000 1,500 2,000 2,500
A A'Keel marks
Profile distance (m)
Wat
er d
epth
(m
)
A
(km)
0
63° 18' E63° 14' E
0 1,500 3,000750(m) A
¬250
¬450
Wat
er d
epth
(m
)
IcebergAlley
Profile distance (m)
Wat
er d
epth
(m
)
GZW
Z Z’
0
¬387.7 m
0Profile distance (m)
Wat
er d
epth
(m
)
GZWX
¬388.1 m
X’
WAIS EAIS
CHIRPprofile
Weddell
Ross
Amery
Amund-sen
¬300
¬350
¬400
¬450
¬5001,000 3,000 5,000 7,000
¬360
¬380
¬400
¬420
¬440
¬4605,000 10,000 15,000 20,000 25,000
¬700
¬740
¬780
¬820
2,000 6,000 10,000 14,000
10 25
20
10
GZW
MSGLs
Keelmarks
A’
B’
¬600
Palaeo-ice-stream flowlines and axial lineations of MSGLs
Present ice sheet and flowlines(interpreted from satellite imagery)Grounding-zone wedge interpretedfrom marine geomorphology
Iceberg keel-mark axial trendinterpreted from swath bathymetry
¬50
¬1,600
Swat
h w
ater
dept
h (m
)
66
° 48
' S6
6° 5
0' S
67°
18
' S6
7° 2
2' S
67° 4
5' S
68° 0
' S
¬900
Latit
ude
Longitude
Longitude
Latitude
Figure 1 | Mac. Robertson Land, East Antarctica, showing marine swath bathymetry, core locations, satellite image of field sites and Antarctic insetmap. Grounding-zone wedges (GZW), mega-scale glacial lineations (MSGLs), iceberg keel marks and terrestrial cosmogenic ages in Framnes Mountainswere used to constrain the character and extent of ice flow at the LGM. Abbreviations are ACC, Antarctic Circumpolar Current; ASC, Antarctic ShelfCurrent; EAIS, East Antarctic Ice Sheet; WAIS, West Antarctic Ice Sheet; IA, Iceberg Alley; NB, Nielsen Basin; PB, Prydz Bay; SC, Svenner Channel; MNT,Mertz Ninnis Trough; WRS, Western Ross Sea; ETG, Erebus and Terror Gulf; LaA, Larsen A; LaB, Larsen B; PD, Palmer Deep.
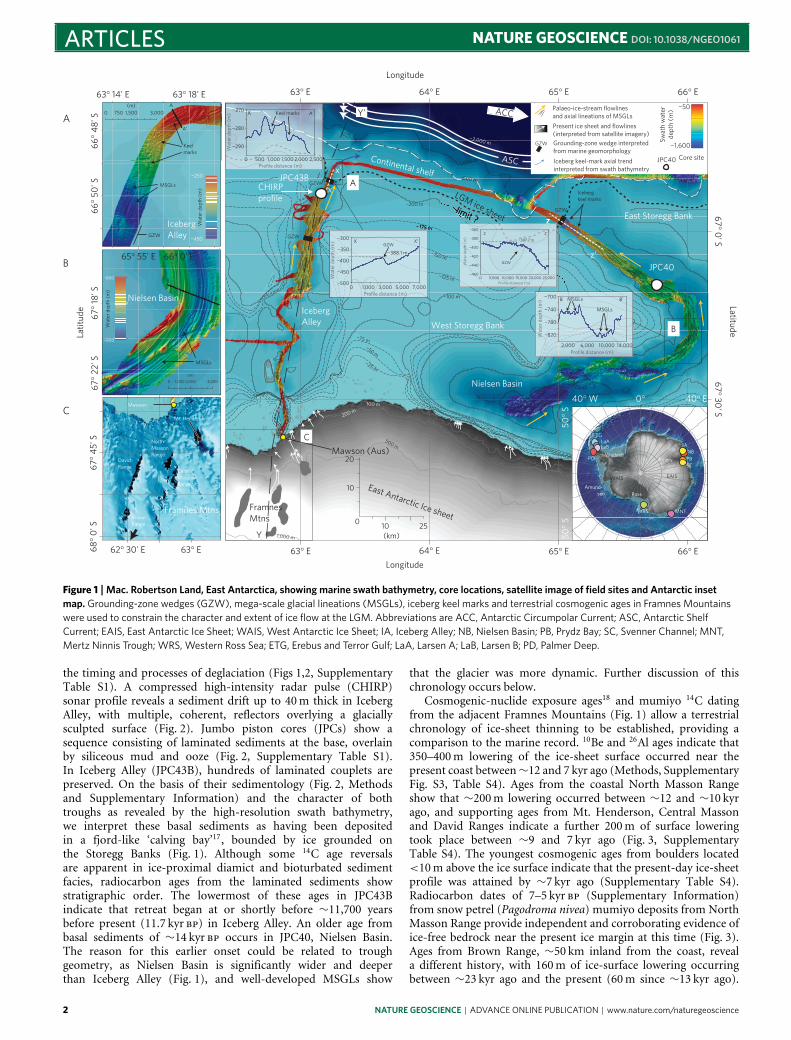
the timing and processes of deglaciation (Figs 1,2, SupplementaryTable S1). A compressed high-intensity radar pulse (CHIRP)sonar profile reveals a sediment drift up to 40m thick in IcebergAlley, with multiple, coherent, reflectors overlying a glaciallysculpted surface (Fig. 2). Jumbo piston cores (JPCs) show asequence consisting of laminated sediments at the base, overlainby siliceous mud and ooze (Fig. 2, Supplementary Table S1).In Iceberg Alley (JPC43B), hundreds of laminated couplets arepreserved. On the basis of their sedimentology (Fig. 2, Methodsand Supplementary Information) and the character of bothtroughs as revealed by the high-resolution swath bathymetry,we interpret these basal sediments as having been depositedin a fjord-like ‘calving bay’17, bounded by ice grounded onthe Storegg Banks (Fig. 1). Although some 14C age reversalsare apparent in ice-proximal diamict and bioturbated sedimentfacies, radiocarbon ages from the laminated sediments showstratigraphic order. The lowermost of these ages in JPC43Bindicate that retreat began at or shortly before ∼11,700 yearsbefore present (11.7 kyr bp) in Iceberg Alley. An older age frombasal sediments of ∼14 kyr bp occurs in JPC40, Nielsen Basin.The reason for this earlier onset could be related to troughgeometry, as Nielsen Basin is significantly wider and deeperthan Iceberg Alley (Fig. 1), and well-developed MSGLs show
that the glacier was more dynamic. Further discussion of thischronology occurs below.
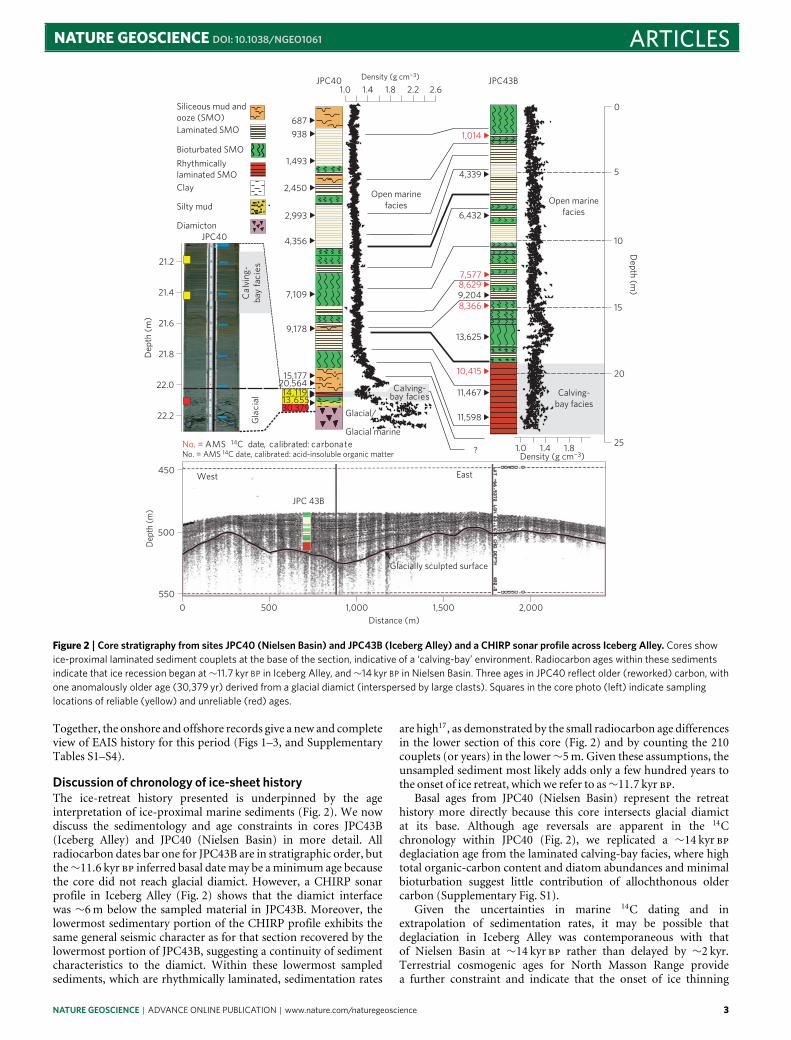
Cosmogenic-nuclide exposure ages18 and mumiyo 14C datingfrom the adjacent Framnes Mountains (Fig. 1) allow a terrestrialchronology of ice-sheet thinning to be established, providing acomparison to the marine record. 10Be and 26Al ages indicate that350–400m lowering of the ice-sheet surface occurred near thepresent coast between∼12 and 7 kyr ago (Methods, SupplementaryFig. S3, Table S4). Ages from the coastal North Masson Rangeshow that ∼200m lowering occurred between ∼12 and ∼10 kyrago, and supporting ages from Mt. Henderson, Central Massonand David Ranges indicate a further 200m of surface loweringtook place between ∼9 and 7 kyr ago (Fig. 3, SupplementaryTable S4). The youngest cosmogenic ages from boulders located<10m above the ice surface indicate that the present-day ice-sheetprofile was attained by ∼7 kyr ago (Supplementary Table S4).Radiocarbon dates of 7–5 kyr bp (Supplementary Information)from snow petrel (Pagodroma nivea) mumiyo deposits from NorthMasson Range provide independent and corroborating evidence ofice-free bedrock near the present ice margin at this time (Fig. 3).Ages from Brown Range, ∼50 km inland from the coast, reveala different history, with 160m of ice-surface lowering occurringbetween ∼23 kyr ago and the present (60m since ∼13 kyr ago).
2 NATURE GEOSCIENCE | ADVANCE ONLINE PUBLICATION | www.nature.com/naturegeoscience
NATURE GEOSCIENCE DOI: 10.1038/NGEO1061 ARTICLES
JPC43B
1,014
10,415
7,5778,629
11,598
11,467
13,625
9,204
6,432
4,339
8,366
No. = AMS 14C date, calibrated: carbonate?
4,356
15,177
7,109
9,178
14,119
2,993
2,450
20,564
1,493
938
687
30,37913,655
21.2
21.4
21.6
21.8
22.0
22.2
5
10
15
20
0
25
Gla
cial
JPC 43B
West East
Dep
th (
m)
450
550
500
JPC40
0 500 1,000 1,500 2,000Distance (m)
Siliceous mud andooze (SMO)Laminated SMO
Bioturbated SMO
Rhythmicallylaminated SMOClay
Silty mud
Diamicton
Dep
th (
m)
Cal
ving
-ba
y fa
cies
No. = AMS 14C date, calibrated: acid-insoluble organic matter
Glacial/
Glacial marine
Calving-bay facies
JPC401.0 1.4 1.8 2.2 2.6
Density (g cm¬3)
Open marinefacies
Depth (m
)
Open marinefacies
Calving-bay facies
1.0 1.4 1.8Density (g cm¬3)
Glacially sculpted surface
Figure 2 | Core stratigraphy from sites JPC40 (Nielsen Basin) and JPC43B (Iceberg Alley) and a CHIRP sonar profile across Iceberg Alley. Cores showice-proximal laminated sediment couplets at the base of the section, indicative of a ‘calving-bay’ environment. Radiocarbon ages within these sedimentsindicate that ice recession began at∼11.7 kyr BP in Iceberg Alley, and∼14 kyr BP in Nielsen Basin. Three ages in JPC40 reflect older (reworked) carbon, withone anomalously older age (30,379 yr) derived from a glacial diamict (interspersed by large clasts). Squares in the core photo (left) indicate samplinglocations of reliable (yellow) and unreliable (red) ages.
Together, the onshore and offshore records give a new and completeview of EAIS history for this period (Figs 1–3, and SupplementaryTables S1–S4).
Discussion of chronology of ice-sheet historyThe ice-retreat history presented is underpinned by the ageinterpretation of ice-proximal marine sediments (Fig. 2). We nowdiscuss the sedimentology and age constraints in cores JPC43B(Iceberg Alley) and JPC40 (Nielsen Basin) in more detail. Allradiocarbon dates bar one for JPC43B are in stratigraphic order, butthe∼11.6 kyr bp inferred basal datemay be aminimum age becausethe core did not reach glacial diamict. However, a CHIRP sonarprofile in Iceberg Alley (Fig. 2) shows that the diamict interfacewas ∼6m below the sampled material in JPC43B. Moreover, thelowermost sedimentary portion of the CHIRP profile exhibits thesame general seismic character as for that section recovered by thelowermost portion of JPC43B, suggesting a continuity of sedimentcharacteristics to the diamict. Within these lowermost sampledsediments, which are rhythmically laminated, sedimentation rates
are high17, as demonstrated by the small radiocarbon age differencesin the lower section of this core (Fig. 2) and by counting the 210couplets (or years) in the lower∼5m. Given these assumptions, theunsampled sediment most likely adds only a few hundred years tothe onset of ice retreat, which we refer to as∼11.7 kyr bp.
Basal ages from JPC40 (Nielsen Basin) represent the retreathistory more directly because this core intersects glacial diamictat its base. Although age reversals are apparent in the 14Cchronology within JPC40 (Fig. 2), we replicated a ∼14 kyr bpdeglaciation age from the laminated calving-bay facies, where hightotal organic-carbon content and diatom abundances and minimalbioturbation suggest little contribution of allochthonous oldercarbon (Supplementary Fig. S1).
Given the uncertainties in marine 14C dating and inextrapolation of sedimentation rates, it may be possible thatdeglaciation in Iceberg Alley was contemporaneous with thatof Nielsen Basin at ∼14 kyr bp rather than delayed by ∼2 kyr.Terrestrial cosmogenic ages for North Masson Range providea further constraint and indicate that the onset of ice thinning
NATURE GEOSCIENCE | ADVANCE ONLINE PUBLICATION | www.nature.com/naturegeoscience 3
ARTICLES NATURE GEOSCIENCE DOI: 10.1038/NGEO1061
0
250
500
750
1,000
1,250
1,500
Elev
atio
n (m
)
0 2 4 6 8 10 12 14 16 18 20
Years (kyr ago)
0
25
50
¬10
0
10
20
30
¬175
¬150
¬125
¬100
¬75
¬50
¬25
0
e.s.
l. (m
)
0 2 4 6 8 10 12 14 16 18 20
Years (kyr ago)
3.0
3.5
4.0
4.5
5.0
5.5
6.00 2 4 6 8 10 12 14 16 18 20
Years (kyr ago)
0 2 4 6 8 10 12 14 16 18 20
Years (kyr ago)
0
2
4
6
8
10
12
14
6
8
10
12
¬450
¬435
¬420
¬405
¬390
¬375
¬28
¬26
¬24
¬22
¬20
200
250
300
425
450
475
500
525
550
575
600
Tahiti SLBarbados SLICE5G_Barb. SLFleming SLSpecmap SLICE5G_MacRob. Rel.SL∂z/∂t ICE5G_MacRob.
SO SSTBenthic δ18O∂z/∂t benthic δ18OSO opal flux
Law Dome δ18O EPICA Dome C δD EPICA Dome C CO2Jul. insol. 65° NJan. insol. 65° S
Exposure age
BR
DR
CMR
NMR
MH
Chronology Sea level
Ocean temp. Atmosphere
a b
c d
IANBPBSCMNTWRSPDLaBLaAETG
Terr. 14C ageMar. 14C age
ICE5G
_MacRob. RSL (m
)
∂z/∂t ICE5G
_MacRob. (m
m yr ¬
1)
Opa
l flu
x (g
cm
¬2
kyr¬
1 )
Bent
hic
δ18O
(
)
Sea-surface temperature (°C
) EPIC
A D
ome
C C
O2
(ppm
v)
EPIC
A D
ome
C δD
(
SM
OW
)
Insolation (W m
¬2)
Law D
ome δ
18O ( SM
OW
)
Figure 3 | Chronology from Mac. Robertson Land, East Antarctica, and comparison with climate-proxy records for the period 20–0 kyr ago. a, Greybanding spans the period from the onset to the end of ice-sheet recession. Circled ages are outliers and proximity to older ages shows that they areminimum ages. Locations are in Fig. 1. Onshore massifs are Brown Range (BR), David Range (DR), Central Masson Range (CMR), North Masson Range(NMR) and Mount Henderson (MH). The horizontal-elevation scale applies to cosmogenic ages and terrestrial (Terr.) 14C ages on snow petrel deposits.Timings of marine sedimentation onset (Mar. 14C ages) are from circum-Antarctic sites (Fig. 1). b–d, Ice-sheet retreat lagged behind Northern Hemisphereinsolation46, deep-ocean benthic δ18O (ref. 47), atmospheric CO2 levels5 and Antarctic air temperatures1,4,5. Retreat initiated when eustatic sealevel1,2,45,48 (e.s.l.) and local (relative) sea level1 (RSL) increased rapidly during MWP 1a at∼14 kyr ago (b). Southern Ocean sea-surface temperatures7 (c)and Antarctic air temperatures (d) cooled at this time (Antarctic Cold Reversal). Oceanic warming increased between∼12 and 10 kyr ago whenwind-driven Southern Ocean upwelling (opal flux) peaked6 and modern SSTs were achieved. Ice-sheet stabilization at∼7 kyr ago occurred withoutsignificant atmospheric, oceanic or sea-level forcing. Error bars in 14C ages represent 1-σ uncertainty. Error bars in cosmogenic ages are standard meanerror of paired 10Be and 26Al ages (ref. 18). Error bars in b indicate the depth ranges of the sea-level indicators48, or combined depth range and Earthrheology uncertainty2. Error bars in c represent the standard error (per mil; ref. 47).
immediately inland from Iceberg Alley started at 12.0± 0.7 kyrago (Fig. 3, Supplementary Information), supporting our primaryhypothesis that retreat in Iceberg Alley was delayed. However,exposure ages include uncertainty in the absolute value ofcosmogenic production rates that precludes them from fullyresolving this issue. For example, the nominal ‘global average’ 10Beproduction rate used in this study18 may be >10% too high19,20
(see Supplementary Information for details). If a regional 10Beproduction rate for New Zealand20 is used to recalculate this age,it increases the North Masson deglaciation age to 13.9± 0.8 kyr.This means that we cannot completely rule out the possibility thatdeglaciation of both troughs began at∼14 kyr ago.
The style of deglaciation observed in Iceberg Alley, NielsenBasin and elsewhere within cross-shelf troughs on the Antarcticmargin17,21,22 involves rapid onset of conditions of high primaryproductivity in a fjord-like setting (Supplementary Fig. S1), asrecorded by rhythmically laminated sediments, once ice retreatedfrom the trough itself. Significant to this calving-bay re-entrantmodel is that it involves remnant ice masses on the surroundingbanks (Fig. 1) and hence the timing of deglaciation pre-datesmost of the ice loss from the interfluves bounding the troughs.Consequently, the data presented from the two cores from Iceberg
Alley and Nielsen Basin point to most ice loss on the adjacent shelfas postdating∼14 kyr bp.
Drivers of ice-sheet retreat and cessationComparing this chronology with global climate/sea-level-proxyrecords (Fig. 3) enables us to relate ice-sheet changes to global andlocal forcings. We identify the following. (1) Initial ice retreat inMac. Robertson Land began∼14 kyr ago, coincident with the mostrapid period of relative sea-level rise in the past 20 kyr (Fig. 3).(2) Between ∼12 and 10 kyr ago, ice recession was evident inboth marine and terrestrial records. Although we lack informationregarding ocean temperatures adjacent to the Antarctic continentalshelf during this period, the warmest sea-surface conditions in thepast 20 kyr recorded south of Australia and New Zealand werebetween 12 and 10 kyr ago7, and Southern Ocean upwelling rateswere∼3 times higher than during theHolocene6 (Fig. 3), suggestinga potentially important role for circumpolar deep water drivingocean warming on the shelf with consequences for melt rates atice-sheet grounding lines. (3) Ice-sheet recession between∼10 and7 kyr ago occurred without further increases in ocean temperatureor relative sea level (Fig. 3), consistent with ongoing retreat dueto internal ice-sheet processes. In summary, our data suggest a
4 NATURE GEOSCIENCE | ADVANCE ONLINE PUBLICATION | www.nature.com/naturegeoscience
NATURE GEOSCIENCE DOI: 10.1038/NGEO1061 ARTICLES
1,500
1,000
500
0
¬50021
2019181716
15
141312
11.5
LGMGL
JPC43B
60,000 50,000 40,000 30,000
¬68.5 ¬68.0 ¬67.5 ¬67.0Latitude (° S) Latitude (° S)
¬66.5¬68.0 ¬67.5 ¬67.0
d
Ice surface
Floatation
threshold
Brown Range
North MassonRange
200,000 150,000 100,000 50,000 0
1,500
1,000
500
0
¬500
1,500
1,000
500
0
¬500
1,500
1,000
500
0
¬500
1,500
1,000
500
0
¬500
Ice
Bed Ocean
t = ¬17 kyr agot = ¬16 kyr agot = ¬15 kyr ago
t = ¬11 kyr agot = ¬10 kyr agot = ¬ 9 kyr ago
t = ¬14 kyr agot = ¬13 kyr agot = ¬12 kyr ago
t = ¬8 kyr agot = ¬7 kyr agot = ¬6 kyr ago
150
100
c
a b
e f
50
Distance (m)Distance (m)
Elevation (m)
Elevation (m)
Elevation (m)El
evat
ion
(m)
Elev
atio
n (m
)El
evat
ion
(m)
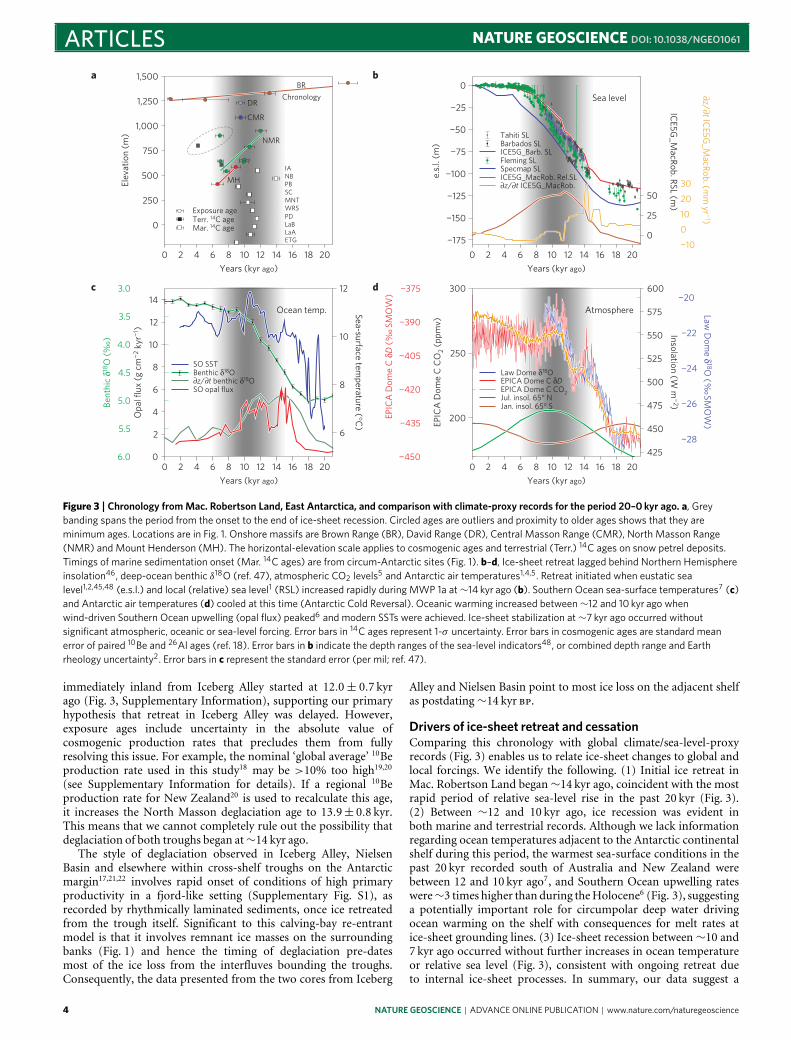
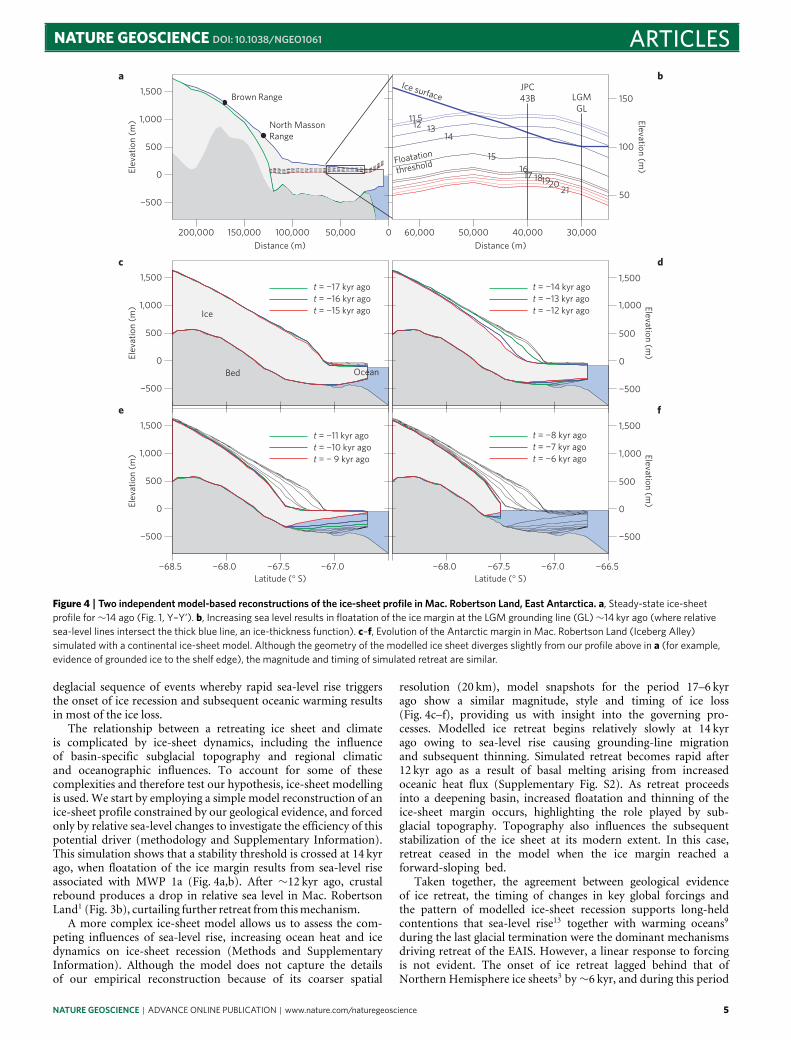
Figure 4 | Two independent model-based reconstructions of the ice-sheet profile in Mac. Robertson Land, East Antarctica. a, Steady-state ice-sheetprofile for∼14 ago (Fig. 1, Y–Y’). b, Increasing sea level results in floatation of the ice margin at the LGM grounding line (GL)∼14 kyr ago (where relativesea-level lines intersect the thick blue line, an ice-thickness function). c–f, Evolution of the Antarctic margin in Mac. Robertson Land (Iceberg Alley)simulated with a continental ice-sheet model. Although the geometry of the modelled ice sheet diverges slightly from our profile above in a (for example,evidence of grounded ice to the shelf edge), the magnitude and timing of simulated retreat are similar.
deglacial sequence of events whereby rapid sea-level rise triggersthe onset of ice recession and subsequent oceanic warming resultsin most of the ice loss.
The relationship between a retreating ice sheet and climateis complicated by ice-sheet dynamics, including the influenceof basin-specific subglacial topography and regional climaticand oceanographic influences. To account for some of thesecomplexities and therefore test our hypothesis, ice-sheet modellingis used. We start by employing a simple model reconstruction of anice-sheet profile constrained by our geological evidence, and forcedonly by relative sea-level changes to investigate the efficiency of thispotential driver (methodology and Supplementary Information).This simulation shows that a stability threshold is crossed at 14 kyrago, when floatation of the ice margin results from sea-level riseassociated with MWP 1a (Fig. 4a,b). After ∼12 kyr ago, crustalrebound produces a drop in relative sea level in Mac. RobertsonLand1 (Fig. 3b), curtailing further retreat from thismechanism.
A more complex ice-sheet model allows us to assess the com-peting influences of sea-level rise, increasing ocean heat and icedynamics on ice-sheet recession (Methods and SupplementaryInformation). Although the model does not capture the detailsof our empirical reconstruction because of its coarser spatial
resolution (20 km), model snapshots for the period 17–6 kyrago show a similar magnitude, style and timing of ice loss(Fig. 4c–f), providing us with insight into the governing pro-cesses. Modelled ice retreat begins relatively slowly at 14 kyrago owing to sea-level rise causing grounding-line migrationand subsequent thinning. Simulated retreat becomes rapid after12 kyr ago as a result of basal melting arising from increasedoceanic heat flux (Supplementary Fig. S2). As retreat proceedsinto a deepening basin, increased floatation and thinning of theice-sheet margin occurs, highlighting the role played by sub-glacial topography. Topography also influences the subsequentstabilization of the ice sheet at its modern extent. In this case,retreat ceased in the model when the ice margin reached aforward-sloping bed.
Taken together, the agreement between geological evidenceof ice retreat, the timing of changes in key global forcings andthe pattern of modelled ice-sheet recession supports long-heldcontentions that sea-level rise13 together with warming oceans9during the last glacial termination were the dominant mechanismsdriving retreat of the EAIS. However, a linear response to forcingis not evident. The onset of ice retreat lagged behind that ofNorthern Hemisphere ice sheets3 by∼6 kyr, and during this period
NATURE GEOSCIENCE | ADVANCE ONLINE PUBLICATION | www.nature.com/naturegeoscience 5
ARTICLES NATURE GEOSCIENCE DOI: 10.1038/NGEO1061
e.s.
l. (m
)
0 5 10 15 20Time (kyr)
Sea-level contribution
EAIS
EAIS + WAIS
Ice loss since 14 kyr ago
15¬14 kyr ago: ¬0.31 (¬0.26) m e.s.l. 14¬13 kyr ago: 0.52 (0.05) m e.s.l.
13¬12 kyr ago: 0.92 (0.21) m e.s.l. 12¬11 kyr ago: 0.77 (¬0.09) m e.s.l.
11¬10 kyr ago: 1.63 (0.07) m e.s.l. 10¬9 kyr ago: 1.37 (0.09) m e.s.l.
0
1
2
3
0
1
2
3
0
1
2
3
0
1
2
3
0
90° E
90° E
90° E
90° E
1
2
3
0
1
2
3
0
1
2
3
¬10
¬5
0
a b
c d
e f
g h
0°
0°
0°
0°
180°
180°
180°
180°
90° E
90° E 90° E
0°
0° 0°
180°
180° 180°
(km
)(k
m)
(km
)(k
m)
(km
)(k
m)
(km
)
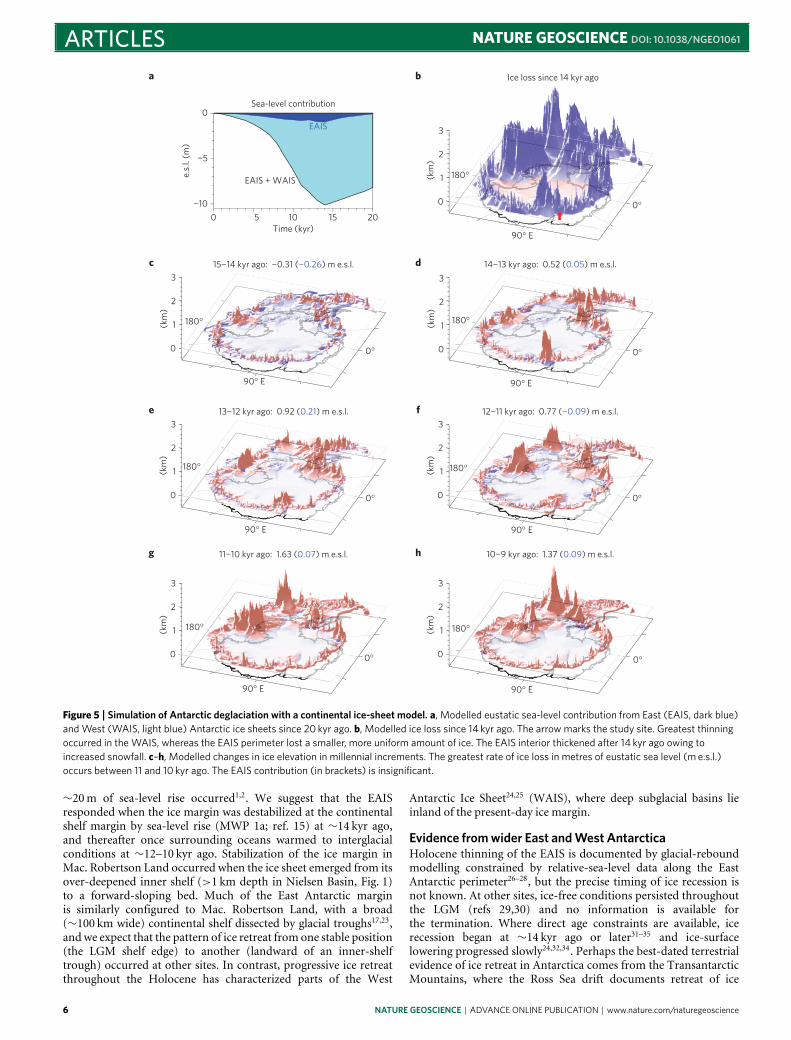
Figure 5 | Simulation of Antarctic deglaciation with a continental ice-sheet model. a, Modelled eustatic sea-level contribution from East (EAIS, dark blue)and West (WAIS, light blue) Antarctic ice sheets since 20 kyr ago. b, Modelled ice loss since 14 kyr ago. The arrow marks the study site. Greatest thinningoccurred in the WAIS, whereas the EAIS perimeter lost a smaller, more uniform amount of ice. The EAIS interior thickened after 14 kyr ago owing toincreased snowfall. c–h, Modelled changes in ice elevation in millennial increments. The greatest rate of ice loss in metres of eustatic sea level (m e.s.l.)occurs between 11 and 10 kyr ago. The EAIS contribution (in brackets) is insignificant.
∼20m of sea-level rise occurred1,2. We suggest that the EAISresponded when the ice margin was destabilized at the continentalshelf margin by sea-level rise (MWP 1a; ref. 15) at ∼14 kyr ago,and thereafter once surrounding oceans warmed to interglacialconditions at ∼12–10 kyr ago. Stabilization of the ice margin inMac. Robertson Land occurred when the ice sheet emerged from itsover-deepened inner shelf (>1 km depth in Nielsen Basin, Fig. 1)to a forward-sloping bed. Much of the East Antarctic marginis similarly configured to Mac. Robertson Land, with a broad(∼100 km wide) continental shelf dissected by glacial troughs17,23,and we expect that the pattern of ice retreat from one stable position(the LGM shelf edge) to another (landward of an inner-shelftrough) occurred at other sites. In contrast, progressive ice retreatthroughout the Holocene has characterized parts of the West
Antarctic Ice Sheet24,25 (WAIS), where deep subglacial basins lieinland of the present-day ice margin.
Evidence from wider East and West AntarcticaHolocene thinning of the EAIS is documented by glacial-reboundmodelling constrained by relative-sea-level data along the EastAntarctic perimeter26–28, but the precise timing of ice recession isnot known. At other sites, ice-free conditions persisted throughoutthe LGM (refs 29,30) and no information is available forthe termination. Where direct age constraints are available, icerecession began at ∼14 kyr ago or later31–35 and ice-surfacelowering progressed slowly24,32,34. Perhaps the best-dated terrestrialevidence of ice retreat in Antarctica comes from the TransantarcticMountains, where the Ross Sea drift documents retreat of ice
6 NATURE GEOSCIENCE | ADVANCE ONLINE PUBLICATION | www.nature.com/naturegeoscience
NATURE GEOSCIENCE DOI: 10.1038/NGEO1061 ARTICLESsourced from both the EAIS and WAIS (refs 31,32). Here, the icesheet remained at its maximum position until ∼14–15 kyr bp andonly ∼40m of thinning had occurred by ∼12.7 kyr bp (refs 31,32)(Supplementary Information).
Basal 14C ages from marine sediment cores from the Antarcticperimeter provide further constraint on the timing of deglaciation(Fig. 3). Marine records from the East Antarctic margin17,23, theRoss Sea36 and the northern Antarctic Peninsula21,37–39 reveal resultsthat are broadly consistent with the terrestrial chronology, showingthat recession of the Antarctic ice margin mostly began between∼14 kyr and 12 kyr bp (Fig. 3). We suggest that variability in thetiming of initial retreat of both West and East Antarctic Ice Sheetsmay reflect the efficiency of the trigger (sea level), which dependson the basin-specific geometry of the ice margin in question,the dynamic characteristics of the glacier and the relative-sea-level history. In our example from Mac. Robertson Land, thestrongest sea-level influence occurred at ∼14 kyr ago, but retreatmay have been earlier or later depending on these characteristics, aproposition that can be tested with an ice-sheetmodel.
Implications for the source of meltwater pulse 1aChronological data presented in this paper indicate that, althoughthe initial retreat of the EAIS may have coincided with MWP 1a(within dating uncertainties), most ice loss occurred significantlylater. We now use our continental ice-sheet model to assess possiblemeltwater contributions from Antarctica during MWP 1a anddeglaciation as a whole (Fig. 5).
The simulated pattern of ice-sheet recession (Fig. 5) reflectsthe model’s primary forcing by changing oceanic heat at theice-sheet boundary10 (Supplementary Information). Consequently,modelled ice-sheet loss since 14 kyr ago preferentially occurs at themargin of both the EAIS and WAIS, mostly at the present-daycontinental shelf (Fig. 5b). Ice-sheet thinning of similar scale tothat observed in Mac. Robertson Land is evident along most of theEAIS perimeter. In contrast, the model indicates a small postglacialthickening of the EAIS interior due to increased accumulation,consistent with geological evidence40,41 (Fig. 5b). The peak inmodelled ice volume in Antarctica occurs at 14 kyr ago (Fig. 5a),similar to that observed in Mac. Robertson Land and elsewhere32,33,and the contribution to sea-level rise after this time from recessionof both ice sheets of ∼10m e.s.l. (eustatic sea level) is similar toother recent model-derived estimates14,40,42,43.
Ice-sheet modelling (Fig. 5 and Supplementary Table SM1)indicates a small thickening of the EAIS between 15 and 14 kyr agoduring the time of MWP 1a. The total modelled EAIS contributionto postglacial sea-level rise of 1m.e.s.l between 14 kyr ago andthe present (Fig. 5, Supplementary Information), which can beconsidered an upper-bound on a possible MWP 1a contribution,is still a small fraction of the meltwater pulse. The WAIS issimilarly unlikely to have been a major source of MWP 1a, withthe model presented here suggesting a minor increase in ice volumebetween 15 and 14 kyr ago, and this ice sheet making a ∼9m e.s.lcontribution to sea-level rise between 14 kyr ago and the present.Both ice sheets therefore lose volume only after 14 kyr ago andpeak loss occurs at 10 kyr ago (Fig. 5). In line with this study andothers24,32,34, deglaciation takes thousands of years, and thus ourinterpretation on the basis of proximal geological evidence andice-sheet modelling is thatMWP 1a is unlikely to have been sourcedfrom Antarctica. Rather, it is probable that this sea-level pulseinitiated ice-sheet recession in Antarctica, enabling subsequentmass loss due to increased basal melt and grounding-line retreat asthe SouthernOceanwarmed during the earlyHolocene.
MethodsAustralian National Antarctic Research Expeditions (ANARE) to the FramnesMountains and marine investigations of Iceberg Alley and Nielsen Basin
immediately offshore (Fig. 1) were conducted during cruise NBP0101 of (RV/IB)Nathaniel B. Palmer. Together, these data allow the spatial extent of glaciationand timing of ice recession in Mac. Robertson Land to be documented indetail. Building on previously published material17,18, this study includes 13 newradiocarbon ages for core JPC40, high-resolution swath bathymetry, a CHIRPsonar profile of the sediment drift in Iceberg Alley, high-resolution photographsof the basal sediment facies in JPC40 and new total organic carbon and diatomabundance data for the basal section of JPC40. In addition, two terrestrial 14C agesfrom snow petrel (Pagodroma nivea) mumiyo deposits in Framnes Mountainsprovide support for the exposure ages. See Supplementary Information for adetailed description of each data source.
The interpretation of postglacial sedimentation involving description ofthe calving-bay re-entrant was developed on the basis of comparison of theIceberg Alley (JPC43B) and Nielsen Basin (JPC40) records with that from PalmerDeep21,37, where the model for a calving-bay re-entrant was first described. InPalmer Deep and similar cross-shelf troughs of the East Antarctic margin17, thestratigraphic succession shows that the late Pleistocene glacial diamict is overlaindirectly by highly laminated diatom ooze. This sequence is also observed inthe lowermost sediments of both JPC43B and JPC40 (Fig. 2). The laminatedsequences are excellent targets for 14C dating. See Supplementary Informationfor more information.
A simple modelling experiment (Fig. 4a,b) was carried out by using onshoreand offshore field observations as temporal and geometric constraints on formerice extent and BEDMAP data44 for present ice-surface elevation and thickness.This enabled a surface profile of the ice sheet to be reconstructed for the period at∼14 kyr ago, immediately before retreat (Fig. 4a). Experiments were conductedto investigate the likely timing of decay along a flowline from the ice-sheet dividethrough Framnes Mountains to Iceberg Alley. On the basis of relative sea-level datafrom the ICE-5Gmodel for Mac. Robertson Land1, we iteratively increased sea leveluntil the ice-sheet profile achieved floatation. We carried out a similar experimentwith the Fleming sea-level curve2and locally adjusted isostatic loading, as a checkagainst any biases in the ICE 5G model, such as the hemispheric source of MWP1a. A similar pattern of response was observed, suggesting that this result is notvery sensitive to the sea-level assumptions made. See Supplementary Informationfor more information.
A more complete ice-sheet modelling experiment (Fig. 4c–f) was used toinvestigate the role of increasing ocean heat and feedbacks between the retreatingice margin and its underlying topography. A three-dimensional ice-sheet model10,incorporating thermodynamics, sea-level and oceanic heat flux forcings, ice shelvesand grounding-line processes was used. The model has previously been used tocarry out a multi-million-year simulation of Antarctic ice-sheet fluctuations10(at a coarser spatial resolution). In this study, a 20 km version of the model wasapplied to the last deglaciation. Model boundary conditions were initialized fromthe longer integration10 at 20 kyr ago, near LGM time and extent, so there is littleuncertainty in the validity and dependence of results on the initial conditions. Sealevel and ocean heat forcing were parameterized mainly from the SPECMAP δ18Ostack45, a proxy for global ice volume and deep-ocean temperature. In the case ofsea-level forcing the SPECMAP record closely resembles the direct sea-level dataderived from tropical coral reefs (Fig. 3), but it does not contain events such asMWP 1a. Precipitation and air temperatures are based on modern climatology,perturbed straightforwardly for the past in proportion to δ18O (ref. 10). Theocean-heat parameterization is less straightforward, because we lack a proxydataset for intermediate ocean water temperatures on the Antarctic continentalshelf, proximal to our study sites. Ocean temperatures are not prescribed explicitly;instead, oceanic subice melt rates are specified, with temporal variations dependingmainly on δ18O and calibrated to achieve realistic glacial–interglacial transitionsand extents10. The SPECMAP record45 does not show the detailed sea-surfacetemperature fluctuations evident in a stacked Southern Ocean record7 (Fig. 3),and neither represent ocean changes directly at the margin of the former ice sheet.Nevertheless, model snapshots from 17 to 6 kyr ago (Fig. 4c–f) provide insight intohow a marine ice-sheet margin of a particular geometry responds to increasingocean temperature and sea-level rise.
We also calculated modelled ice-thickness changes and plotted them forAntarctica in millennial-scale snapshots between 20 kyr ago and the present(Fig. 5). This continental model was used for qualitative comparison with thegeological record, and to calculate ice volume and sea-level contributions fromAntarctica during MWP 1a and for deglaciation as a whole. Further information isavailable in Supplementary Information.
Received 21 July 2010; accepted 8 December 2010;published online 16 January 2011
References1. Peltier, W. R. Global glacial isostasy and the surface of the ice-age Earth:
The ICE-5G (VM2) model and GRACE. Annu. Rev. Earth Planet. Sci. 32,111–149 (2004).
2. Fleming, K. et al. Refining the eustatic sea-level curve since the Last GlacialMaximum using far and intermediate-field sites. Earth Planet. Sci. Lett. 163,327–342 (1998).
NATURE GEOSCIENCE | ADVANCE ONLINE PUBLICATION | www.nature.com/naturegeoscience 7
ARTICLES NATURE GEOSCIENCE DOI: 10.1038/NGEO1061
3. Clark, P. U. et al. The Last Glacial Maximum. Science 325, 710–714 (2009).4. Morgan, V. et al. Relative timing of deglacial climate events in Antarctica and
Greenland. Science 297, 1862–1864 (2002).5. Jouzel, J. et al. A new 27 ky high resolution East Antarctic climate record.
Geophys. Res. Lett. 28, 3199–3202 (2001).6. Anderson, R. F. et al. Wind-driven upwelling in the southern ocean and the
deglacial rise in atmospheric CO2. Science 323, 1443–1448 (2009).7. Barrows, T., Juggins, S., De Deckker, P., Calvo, E. & Pelejero, C. Long-term sea
surface temperature and climate change in the Australian–New Zealand region.Paleoceanography 22, PA2215 (2007).
8. Rignot, E. & Jacobs, S. S. Rapid bottom melting widespread near Antarctic icesheet grounding lines. Science 296, 2020–2023 (2002).
9. Mercer, J. West Antarctic ice sheet and CO2 greenhouse effect: A threat ofdisaster. Nature 271, 321–325 (1978).
10. Pollard, D. & DeConto, R. M. Modelling West Antarctic ice sheet growth andcollapse through the past five million years. Nature 458, 329–332 (2009).
11. Alley, R. B., Anandakrishnan, S., Dupont, T. K., Parizek, B. R. & Pollard, D.Effect of sedimentation on ice-sheet grounding-line stability. Science 315,1838–1841 (2007).
12. Heroy, D. C. & Anderson, J. B. Radiocarbon constraints on Antarctic Peninsulaice sheet retreat following the Last Glacial Maximum (LGM). Quat. Sci. Rev.26, 3286–3297 (2007).
13. Denton, G. H., Hughes, T. J. & Karlén, W. Global ice-sheet system interlockedby sea level. Quat. Res. 26, 3–26 (1986).
14. Huybrechts, P. Sea-level changes at the LGM from ice-dynamic reconstructionsof theGreenland andAntarctic ice sheets during the glacial cycles.Quat. Sci. Rev.21, 203–231 (2002).
15. Fairbanks, R. G. A 17,000-year glacio-eustatic sea level record: Influence ofglacial melting rates on the Younger Dryas event and deep-ocean circulation.Nature 342, 637–642 (1989).
16. Clark, P. U., Mitrovica, J. X., Milne, G. A. & Tamisiea, M. E. Sea-levelfingerprinting as a direct test for the source of global Meltwater Pulse IA.Science 295, 2438–2441 (2002).
17. Leventer, A. et al. Marine sediment record from the East Antarctic marginreveals dynamics of ice sheet recession. GSA Today 16, 4–10 (2006).
18. Mackintosh, A. et al. Exposure ages frommountain dipsticks inMac. RobertsonLand, East Antarctica, indicate little change in ice-sheet thickness since the LastGlacial Maximum. Geology 35, 551–554 (2007).
19. Balco, G. et al. Regional beryllium-10 production rate calibration for late-glacialnortheastern North America. Quat. Geochronol. 4, 93–107 (2009).
20. Putnam, A. E. et al. In situ cosmogenic 10Be production-rate calibration fromthe Southern Alps, New Zealand. Quat. Geochronol. 5, 392–409 (2010).
21. Domack, E. et al. Subglacial morphology and glacial evolution of the Palmerdeep outlet system, Antarctic Peninsula. Geomorphology 75, 125–142 (2006).
22. Eittreim, S. L., Cooper, A. K. &Wannesson, J. Seismic stratigraphic evidence ofice-sheet advances on the Wilkes Land margin of Antarctica. Sedim. Geol. 96,131–156 (1995).
23. Siegert, M. J. et al. Recent advances in understanding Antarctic climateevolution. Antarct. Sci. 20, 313–325 (2008).
24. Stone, J. O. et al. Holocene deglaciation of Marie Byrd Land, West Antarctica.Science 299, 99–102 (2003).
25. Conway, H., Hall, B. L., Denton, G. H., Gades, A. M. & Waddington, E. D.Past and future grounding-line retreat of the West Antarctic ice sheet. Science286, 280–283 (1999).
26. Verleyen, E., Hodgson, D. A., Milne, G. A., Sabbe, K. & Vyverman, W.Relative sea-level history from the Lambert Glacier region, East Antarctica,and its relation to deglaciation and Holocene glacier readvance. Quat. Res. 63,45–52 (2005).
27. Goodwin, I. D. Holocene deglaciation, sea-level change, and the emergence ofthe Windmill Islands, Budd Coast, Antarctica. Quat. Res. 40, 70–80 (1993).
28. Zwartz, D., Bird, M., Stone, J. & Lambeck, K. Holocene sea-level change andice-sheet history in the Vestfold Hills, East Antarctica. Earth Planet. Sci. Lett.155, 131–145 (1998).
29. Hodgson, D. A. et al. Were the Larsemann Hills ice-free through the LastGlacial Maximum? Antarct. Sci. 13, 440–454 (2001).
30. Gore, D. B. et al. Bunger Hills, East Antarctica: Ice free at the Last GlacialMaximum. Geology 29, 1103–1106 (2001).
31. Denton, G. H., Bockheim, J. G., Wilson, S. C. & Stuiver, M. LateWisconsin andEarly Holocene glacial history, Inner Ross Embayment, Antarctica. Quat. Res.31, 151–182 (1989).
32. Hall, B. L. & Denton, G. H. Radiocarbon chronology of Ross Sea Drift, EasternTaylor Valley, Antarctica: Evidence for a grounded ice sheet in the Ross Sea atthe Last Glacial Maximum. Geogr. Ann. A 82, 305–336 (2000).
33. Bentley, M. J. et al. Deglacial history of the West Antarctic Ice Sheet in theWeddell Sea embayment: Constraints on past ice volume change. Geology 38,411–414 (2009).
34. Johnson, J. S., Bentley, M. J. & Gohl, K. First exposure ages from the AmundsenSea Embayment, West Antarctica: The Late Quaternary context for recentthinning of Pine Island, Smith, and Pope Glaciers. Geology 36, 223–226 (2008).
35. Todd, C., Stone, J., Conway, H., Hall, B. & Bromley, G. Late Quaternaryevolution of Reedy Glacier, Antarctica. Quat. Sci. Rev. 29, 1328–1341 (2010).
36. McKay, R. M. et al. Retreat history of the Ross ice sheet (Shelf) since theLast Glacial Maximum from deep-basin sediment cores around Ross Island.Palaeogeogr. Palaeoclimatol. Palaeoecol. 260, 245–261 (2008).
37. Domack, E. et al. Chronology of the Palmer Deep site, Antarctic Peninsula: AHolocene palaeoenvironmental reference for the circum-Antarctic. Holocene11, 1–9 (2001).
38. Brachfeld, S. et al. Holocene history of the Larsen-A Ice Shelf constrained bygeomagnetic paleointensity dating. Geology 31, 749–752 (2003).
39. Domack, E. et al. Stability of the Larsen B ice shelf on the Antarctic Peninsuladuring the Holocene epoch. Nature 436, 681–685 (2005).
40. Denton, G. H. & Hughes, T. J. Reconstructing the Antarctic ice sheet at theLast Glacial Maximum. Quat. Sci. Rev. 21, 193–202 (2002).
41. Lilly, K., Fink, D., Fabel, D. & Lambeck, K. Pleistocene dynamics of the interiorEast Antarctic ice sheet. Geology 38, 703–706 (2010).
42. Ivans, E. & James, T. Antarctic glacial isostatic adjustment: A new assessment.Antarct. Sci. 17, 541–553 (2005).
43. Philippon, G. et al. Evolution of the Antarctic ice sheet throughout the lastdeglaciation: A study with a new coupled climate–north and south hemisphereice sheet model. Earth Planet. Sci. Lett. 248, 750–758 (2006).
44. Lythe, M. B. & Vaughan, D. G. BEDMAP—Bed Topography of the Antarctic(British Antarctic Surv., 2000).
45. Imbrie, J. D. & McIntyre, A. SPECMAP Time Scale Developed by Imbrie etal., 1984 Based on Normalized Planktonic Records (Normalized O-18 vs Time,Specmap.017) (PANGAEA, 2006).
46. Berger, A. & Loutre, M. F. Insolation values for the climate of the last 10 millionyears. Quat. Sci. Rev. 10, 297–317 (1991).
47. Lisiecki, L. E. & Raymo, M. E. A Pliocene–Pleistocene stack of 57 globallydistributed benthic δ18O records. Paleoceanography 20, PA1003 (2005).
48. Bard, E., Hamelin, B. & Delanghe-Sabatier, D. Deglacial Meltwater Pulse 1Band Younger Dryas sea levels revisited with boreholes at Tahiti. Science 327,1235–1237 (2010).
AcknowledgementsThe New Zealand team acknowledges financial support from VUW Foundationgrants ARCCIM, ARCMORG and New Zealand FRST ANDRILL and ANZICE grantsCO5X1001 and VICX0704. The US team thanks the scientific staff, Captain J. Borkowskiand his ECO crew, and the Raytheon Polar Services staff who participated on cruiseNBP0101. The marine work was supported by National Science Foundation grantsOPP-9909367 to A.L., OPP-9909837 to R.D. and NSF-OPP grant 0732467 to E.D. TheAustralian team thanks the Australian Antarctic Division (AAS1071, 1332), AustralianInstitute of Nuclear Science and Engineering (03/048), Australian Research Council(DP0556728) and Macquarie University for logistic and financial support. We also thankstaff at the Antarctic Marine Geology Research Facility at Florida State University, andT. Fanning, J. Pickard and T. Labrum for field assistance. K. Fleming provided modelledeustatic sea-level data. R. Peltier and R. Drummond provided both eustatic and relativesea-level data for the Mac. Robertson Land coast. B. Hall calibrated and interpreted 14Cages from Taylor Valley.
Author contributionsA.M. contributed to all aspects of the work, wrote the manuscript and led the fieldproject in Framnes Mountains. N.G. carried out the balance profile experiment,interpretation of swath bathymetry, drafted Figs 1–4 and contributed to writing. E.D.developed the idea with A.M., contributed to interpretation, writing and discussionof Antarctic-wide marine chronologies. R.D. carried out the marine radiocarbondating/age modelling and contributed to the discussion of Antarctic-wide chronologiesas well as to writing. A.L. led the NBP0101 cruise to Iceberg Alley and Nielsen Basin,helped draft Fig. 2, and contributed to the writing. D.W. carried out exposure datingchemistry, terrestrial radiocarbon dating and contributed to methodology. D.P. andR.D.C. provided ice-sheet model results and contributed to discussions concerningmodel interpretation. D.F. facilitated and modelled cosmogenic exposure age data andcommented on the manuscript. D.Z. calculated modelled ice volume changes, draftedFig. 5 and commented on the manuscript. D.G. led the AAS, AINSE and ARC projects,and commented on the manuscript. C.L. processed and interpreted swath bathymetryand contributed to the methodology.
Additional informationThe authors declare no competing financial interests. Supplementary informationaccompanies this paper on www.nature.com/naturegeoscience. Reprints and permissionsinformation is available online at http://npg.nature.com/reprintsandpermissions.Correspondence and requests formaterials should be addressed to A.M.
8 NATURE GEOSCIENCE | ADVANCE ONLINE PUBLICATION | www.nature.com/naturegeoscience
Related Documents