Retinal imaging with polarization-sensitive optical coherence tomography and adaptive optics Barry Cense *1 , Weihua Gao 1 , Jeffrey M. Brown 1 , Steven M. Jones 2 , Ravi S. Jonnal 1 , Mircea Mujat 3 , B. Hyle Park 4 , Johannes F. de Boer 5 , and Donald T. Miller 1 1 Indiana University, School of Optometry, Bloomington IN 47405 2 Lawrence Livermore National Laboratory, Livermore, CA 74550 3 Physical Sciences, Andover, MA 01810 4 UC Riverside, Riverside, CA 92521 5 VU University, Amsterdam and Rotterdam Ophthalmic Institute, Rotterdam, the Netherlands * [email protected] Abstract: Various layers of the retina are well known to alter the polarization state of light. Such changes in polarization may be a sensitive indicator of tissue structure and function, and as such have gained increased clinical attention. Here we demonstrate a polarization-sensitive optical coherence tomography (PS-OCT) system that incorporates adaptive optics (AO) in the sample arm and a single line scan camera in the detection arm. We quantify the benefit of AO for PS-OCT in terms of signal-to-noise, lateral resolution, and speckle size. Double pass phase retardation per unit depth values ranging from 0.25°/μm to 0.65°/μm were found in the birefringent nerve fiber layer at 6° eccentricity, superior to the fovea, with the highest values being noticeably higher than previously reported with PS- OCT around the optic nerve head. Moreover, fast axis orientation and degree of polarization uniformity measurements made with AO-PS-OCT demonstrate polarization scrambling in the retinal pigment epithelium at the highest resolution reported to date. ©2009 Optical Society of America OCIS codes: (170.4500) Optical coherence tomography; (010.1080) Adaptive optics; (170.4470) Ophthalmology; (330.4300) Noninvasive assessment of the visual system; (170.4580) Optical diagnostics for medicine; References and Links 1. H. A. Quigley, E. M. Addicks, and W. R. Green, “Optic nerve damage in human glaucoma. III. Quantitative correlation of nerve fiber loss and visual field defect in glaucoma, ischemic neuropathy, papilledema, and toxic neuropathy,” Arch. Ophthalmol. 100(1), 135–146 (1982). 2. D. Huang, E. A. Swanson, C. P. Lin, J. S. Schuman, W. G. Stinson, W. Chang, M. R. Hee, T. Flotte, K. Gregory, C. A. Puliafito, and J. G. Fujimoto, “Optical coherence tomography,” Science 254(5035), 1178–1181 (1991). 3. B. E. Bouma, and G. J. Tearney, eds., Handbook of Optical Coherence Tomography (Marcel Dekker, Inc., New York, 2002). 4. F. A. Medeiros, L. M. Zangwill, C. Bowd, and R. N. Weinreb, “Comparison of the GDx VCC scanning laser polarimeter, HRT II confocal scanning laser ophthalmoscope, and stratus OCT optical coherence tomograph for the detection of glaucoma,” Arch. Ophthalmol. 122(6), 827–837 (2004). 5. M. Wojtkowski, R. Leitgeb, A. Kowalczyk, T. Bajraszewski, and A. F. Fercher, “In vivo human retinal imaging by Fourier domain optical coherence tomography,” J. Biomed. Opt. 7(3), 457–463 (2002). 6. N. Nassif, B. Cense, B. H. Park, S. H. Yun, T. C. Chen, B. E. Bouma, G. J. Tearney, and J. F. de Boer, “In vivo human retinal imaging by ultrahigh-speed spectral domain optical coherence tomography,” Opt. Lett. 29(5), 480– 482 (2004). 7. T. E. Ogden, “Nerve fiber layer of the primate retina: thickness and glial content,” Vision Res. 23(6), 581–587 (1983). 8. J. F. de Boer, T. E. Milner, M. J. C. van Gemert, and J. S. Nelson, “Two-dimensional birefringence imaging in biological tissue by polarization-sensitive optical coherence tomography,” Opt. Lett. 22(12), 934–936 (1997). 9. J. F. de Boer, T. E. Milner, and J. S. Nelson, “Determination of the depth-resolved Stokes parameters of light backscattered from turbid media by use of polarization-sensitive optical coherence tomography,” Opt. Lett. 24(5), 300–302 (1999). (C) 2009 OSA 23 November 2009 / Vol. 17, No. 24 / OPTICS EXPRESS 21634 #117025 - $15.00 USD Received 10 Sep 2009; revised 4 Nov 2009; accepted 6 Nov 2009; published 11 Nov 2009

Welcome message from author
This document is posted to help you gain knowledge. Please leave a comment to let me know what you think about it! Share it to your friends and learn new things together.
Transcript

Retinal imaging with polarization-sensitive optical coherence tomography and adaptive
optics
Barry Cense*1
, Weihua Gao1, Jeffrey M. Brown
1, Steven M. Jones
2, Ravi S. Jonnal
1,
Mircea Mujat3, B. Hyle Park
4, Johannes F. de Boer
5, and Donald T. Miller
1
1Indiana University, School of Optometry, Bloomington IN 47405 2Lawrence Livermore National Laboratory, Livermore, CA 74550
3Physical Sciences, Andover, MA 01810 4UC Riverside, Riverside, CA 92521
5VU University, Amsterdam and Rotterdam Ophthalmic Institute, Rotterdam, the Netherlands * [email protected]
Abstract: Various layers of the retina are well known to alter the polarization state of light. Such changes in polarization may be a sensitive indicator of tissue structure and function, and as such have gained increased clinical attention. Here we demonstrate a polarization-sensitive optical coherence tomography (PS-OCT) system that incorporates adaptive optics (AO) in the sample arm and a single line scan camera in the detection arm. We quantify the benefit of AO for PS-OCT in terms of signal-to-noise, lateral resolution, and speckle size. Double pass phase retardation per unit depth values ranging from 0.25°/µm to 0.65°/µm were found in the birefringent nerve fiber layer at 6° eccentricity, superior to the fovea, with the highest values being noticeably higher than previously reported with PS-OCT around the optic nerve head. Moreover, fast axis orientation and degree of polarization uniformity measurements made with AO-PS-OCT demonstrate polarization scrambling in the retinal pigment epithelium at the highest resolution reported to date.
©2009 Optical Society of America
OCIS codes: (170.4500) Optical coherence tomography; (010.1080) Adaptive optics; (170.4470) Ophthalmology; (330.4300) Noninvasive assessment of the visual system; (170.4580) Optical diagnostics for medicine;
References and Links
1. H. A. Quigley, E. M. Addicks, and W. R. Green, “Optic nerve damage in human glaucoma. III. Quantitative correlation of nerve fiber loss and visual field defect in glaucoma, ischemic neuropathy, papilledema, and toxic neuropathy,” Arch. Ophthalmol. 100(1), 135–146 (1982).
2. D. Huang, E. A. Swanson, C. P. Lin, J. S. Schuman, W. G. Stinson, W. Chang, M. R. Hee, T. Flotte, K. Gregory, C. A. Puliafito, and J. G. Fujimoto, “Optical coherence tomography,” Science 254(5035), 1178–1181 (1991).
3. B. E. Bouma, and G. J. Tearney, eds., Handbook of Optical Coherence Tomography (Marcel Dekker, Inc., New York, 2002).
4. F. A. Medeiros, L. M. Zangwill, C. Bowd, and R. N. Weinreb, “Comparison of the GDx VCC scanning laser polarimeter, HRT II confocal scanning laser ophthalmoscope, and stratus OCT optical coherence tomograph for the detection of glaucoma,” Arch. Ophthalmol. 122(6), 827–837 (2004).
5. M. Wojtkowski, R. Leitgeb, A. Kowalczyk, T. Bajraszewski, and A. F. Fercher, “In vivo human retinal imaging by Fourier domain optical coherence tomography,” J. Biomed. Opt. 7(3), 457–463 (2002).
6. N. Nassif, B. Cense, B. H. Park, S. H. Yun, T. C. Chen, B. E. Bouma, G. J. Tearney, and J. F. de Boer, “In vivo human retinal imaging by ultrahigh-speed spectral domain optical coherence tomography,” Opt. Lett. 29(5), 480–482 (2004).
7. T. E. Ogden, “Nerve fiber layer of the primate retina: thickness and glial content,” Vision Res. 23(6), 581–587 (1983).
8. J. F. de Boer, T. E. Milner, M. J. C. van Gemert, and J. S. Nelson, “Two-dimensional birefringence imaging in biological tissue by polarization-sensitive optical coherence tomography,” Opt. Lett. 22(12), 934–936 (1997).
9. J. F. de Boer, T. E. Milner, and J. S. Nelson, “Determination of the depth-resolved Stokes parameters of light backscattered from turbid media by use of polarization-sensitive optical coherence tomography,” Opt. Lett. 24(5), 300–302 (1999).
(C) 2009 OSA 23 November 2009 / Vol. 17, No. 24 / OPTICS EXPRESS 21634#117025 - $15.00 USD Received 10 Sep 2009; revised 4 Nov 2009; accepted 6 Nov 2009; published 11 Nov 2009
10. C. K. Hitzenberger, E. Goetzinger, M. Sticker, M. Pircher, and A. F. Fercher, “Measurement and imaging of birefringence and optic axis orientation by phase resolved polarization sensitive optical coherence tomography,” Opt. Express 9(13), 780–790 (2001).
11. J. F. de Boer, and T. E. Milner, “Review of polarization sensitive optical coherence tomography and Stokes vector determination,” J. Biomed. Opt. 7(3), 359–371 (2002).
12. Y. Yasuno, S. Makita, Y. Sutoh, M. Itoh, and T. Yatagai, “Birefringence imaging of human skin by polarization-sensitive spectral interferometric optical coherence tomography,” Opt. Lett. 27(20), 1803–1805 (2002).
13. X. R. Huang, and R. W. Knighton, “Microtubules contribute to the birefringence of the retinal nerve fiber layer,” Invest. Ophthalmol. Vis. Sci. 46(12), 4588–4593 (2005).
14. B. Cense, T. C. Chen, B. H. Park, M. C. Pierce, and J. F. de Boer, “Invivo depth-resolved birefringence measurements of the human retinal nerve fiber layer by polarization-sensitive optical coherence tomography,” Opt. Lett. 27(18), 1610–1612 (2002).
15. B. Cense, T. C. Chen, B. H. Park, M. C. Pierce, and J. F. de Boer, “In vivo birefringence and thickness measurements of the human retinal nerve fiber layer using polarization-sensitive optical coherence tomography,” J. Biomed. Opt. 9(1), 121–125 (2004).
16. B. Cense, T. C. Chen, B. H. Park, M. C. Pierce, and J. F. de Boer, “Thickness and birefringence of healthy retinal nerve fiber layer tissue measured with polarization-sensitive optical coherence tomography,” Invest. Ophthalmol. Vis. Sci. 45(8), 2606–2612 (2004).
17. B. Cense, M. Mujat, T. C. Chen, B. H. Park, and J. F. de Boer, “Polarization-sensitive spectral-domain optical coherence tomography using a single line scan camera,” Opt. Express 15(5), 2421–2431 (2007).
18. M. Mujat, B. H. Park, B. Cense, T. C. Chen, and J. F. de Boer, “Autocalibration of spectral-domain optical coherence tomography spectrometers for in vivo quantitative retinal nerve fiber layer birefringence determination,” J. Biomed. Opt. 12(4), 041205 (2007).
19. E. Götzinger, M. Pircher, B. Baumann, C. Hirn, C. Vass, and C. K. Hitzenberger, “Retinal nerve fiber layer birefringence evaluated with polarization sensitive spectral domain OCT and scanning laser polarimetry: A comparison,” J. Biophoton. 1(2), 129–139 (2008).
20. M. Yamanari, M. Miura, S. Makita, T. Yatagai, and Y. Yasuno, “Phase retardation measurement of retinal nerve fiber layer by polarization-sensitive spectral-domain optical coherence tomography and scanning laser polarimetry,” J. Biomed. Opt. 13(1), 10 (2008).
21. X. R. Huang, H. Bagga, D. S. Greenfield, and R. W. Knighton, “Variation of peripapillary retinal nerve fiber layer birefringence in normal human subjects,” Invest. Ophthalmol. Vis. Sci. 45(9), 3073–3080 (2004).
22. B. Cense, “Optical coherence tomography for retinal imaging,” PhD thesis, Twente University, (2005). 23. M. Pircher, E. Goetzinger, R. Leitgeb, and C. K. Hitzenberger, “Transversal phase resolved polarization sensitive
optical coherence tomography,” Phys. Med. Biol. 49(7), 1257–1263 (2004). 24. M. Pircher, E. Götzinger, R. Leitgeb, H. Sattmann, O. Findl, and C. K. Hitzenberger, “Imaging of polarization
properties of human retina in vivo with phase resolved transversal PS-OCT,” Opt. Express 12(24), 5940–5951 (2004).
25. E. Götzinger, M. Pircher, and C. K. Hitzenberger, “High speed spectral domain polarization sensitive optical coherence tomography of the human retina,” Opt. Express 13(25), 10217–10229 (2005).
26. M. Pircher, E. Götzinger, O. Findl, S. Michels, W. Geitzenauer, C. Leydolt, U. Schmidt-Erfurth, and C. K. Hitzenberger, “Human macula investigated in vivo with polarization-sensitive optical coherence tomography,” Invest. Ophthalmol. Vis. Sci. 47(12), 5487–5494 (2006).
27. E. Götzinger, M. Pircher, W. Geitzenauer, C. Ahlers, B. Baumann, S. Michels, U. Schmidt-Erfurth, and C. K. Hitzenberger, “Retinal pigment epithelium segmentation by polarization sensitive optical coherence tomography,” Opt. Express 16(21), 16410–16422 (2008).
28. Y. Zhang, B. Cense, J. Rha, R. S. Jonnal, W. Gao, R. J. Zawadzki, J. S. Werner, S. Jones, S. Olivier, and D. T. Miller, “High-speed volumetric imaging of cone photoreceptors with adaptive optics spectral-domain optical coherence tomography,” Opt. Express 14(10), 4380–4394 (2006).
29. B. Cense, E. Koperda, J. M. Brown, O. P. Kocaoglu, W. Gao, R. S. Jonnal, and D. T. Miller, “Volumetric retinal imaging with ultrahigh-resolution spectral-domain optical coherence tomography and adaptive optics using two broadband light sources,” Opt. Express 17(5), 4095–4111 (2009).
30. C. E. Saxer, J. F. de Boer, B. H. Park, Y. H. Zhao, Z. P. Chen, and J. S. Nelson, “High-speed fiber based polarization-sensitive optical coherence tomography of in vivo human skin,” Opt. Lett. 25(18), 1355–1357 (2000).
31. J. F. de Boer, “Systems and methods for imaging a sample,” (General Hospital Corporation, USA, 2005). 32. R. J. Zawadzki, S. M. Jones, S. S. Olivier, M. T. Zhao, B. A. Bower, J. A. Izatt, S. Choi, S. Laut, and J. S.
Werner, “Adaptive-optics optical coherence tomography for high-resolution and high-speed 3D retinal in vivo imaging,” Opt. Express 13(21), 8532–8546 (2005).
33. N. A. Nassif, B. Cense, B. H. Park, M. C. Pierce, S. H. Yun, B. E. Bouma, G. J. Tearney, T. C. Chen, and J. F. de Boer, “In vivo high-resolution video-rate spectral-domain optical coherence tomography of the human retina and optic nerve,” Opt. Express 12(3), 367–376 (2004).
34. D. G. Green, and F. W. Campbell, “Effect of Focus on Visual Response to a Sinusoidally Modulated Spatial Stimulus,” J. Opt. Soc. Am. 55(9), 1154–1157 (1965).
35. L. N. Thibos, X. Hong, A. Bradley, and X. Cheng, “Statistical variation of aberration structure and image quality in a normal population of healthy eyes,” J. Opt. Soc. Am. A 19(12), 2329–2348 (2002).
36. E. Götzinger, M. Pircher, R. A. Leitgeb, and C. K. Hitzenberger, “High speed full range complex spectral domain optical coherence tomography,” Opt. Express 13(2), 583–594 (2005).
(C) 2009 OSA 23 November 2009 / Vol. 17, No. 24 / OPTICS EXPRESS 21635#117025 - $15.00 USD Received 10 Sep 2009; revised 4 Nov 2009; accepted 6 Nov 2009; published 11 Nov 2009

37. W. H. Gao, B. Cense, Y. Zhang, R. S. Jonnal, and D. T. Miller, “Measuring retinal contributions to the optical Stiles-Crawford effect with optical coherence tomography,” Opt. Express 16(9), 6486–6501 (2008).
38. Y. Yasuno, Y. J. Hong, S. Makita, M. Yamanari, M. Akiba, M. Miura, and T. Yatagai, “In vivo high-contrast imaging of deep posterior eye by 1-um swept source optical coherence tomography and scattering optical coherence angiography,” Opt. Express 15(10), 6121–6139 (2007).
39. B. H. Park, M. C. Pierce, B. Cense, S. H. Yun, M. Mujat, G. J. Tearney, B. E. Bouma, and J. F. de Boer, “Real-time fiber-based multi-functional spectral-domain optical coherence tomography at 1.3 microm,” Opt. Express 13(11), 3931–3944 (2005).
40. B. H. Park, M. C. Pierce, B. Cense, and J. F. de Boer, “Real-time multi-functional optical coherence tomography,” Opt. Express 11(7), 782–793 (2003).
41. B. H. Park, C. Saxer, S. M. Srinivas, J. S. Nelson, and J. F. de Boer, “In vivo burn depth determination by high-speed fiber-based polarization sensitive optical coherence tomography,” J. Biomed. Opt. 6(4), 474–479 (2001).
42. B. H. Park, M. C. Pierce, B. Cense, and J. F. de Boer, “Jones matrix analysis for a polarization-sensitive optical coherence tomography system using fiber-optic components,” Opt. Lett. 29(21), 2512–2514 (2004).
43. B. H. Park, M. C. Pierce, B. Cense, and J. F. de Boer, “Optic axis determination accuracy for fiber-based polarization-sensitive optical coherence tomography,” Opt. Lett. 30(19), 2587–2589 (2005).
1. Introduction
Glaucoma causes irreversible damage to the retinal ganglion cells and its axons [1]. Axons of the ganglion cells aggregate in arcuate bundles at the inferior and superior poles of the optic nerve head. These axons disappear during glaucoma progression, causing a characteristic retinal nerve fiber layer thinning at the retinal poles, which can be diagnosed and monitored with retinal imaging systems such as scanning laser ophthalmoscopy (SLO), scanning laser polarimetry (SLP) and optical coherence tomography (OCT).
OCT is an established non-contact method for retinal imaging at unprecedented axial resolution and sensitivity [2,3]. Earlier time-domain OCT modalities, however, did not have sufficient accuracy to detect the subtle thinning of the retinal nerve fiber layer that occurs in early-stage glaucoma [4]. With the introduction of spectral-domain OCT [5], retinal tomograms could be acquired two-orders of magnitude faster without loss in sensitivity, enabling video-rate OCT retinal imaging [6]. Intensity-based imaging with SD-OCT has proven highly successful, yet its effectiveness for detecting early-stage glaucoma is challenged by the subtle thickness changes and compositional changes of the retinal nerve fiber layer that accompany the disease. The latter is evident even in healthy eyes in which the glial content of nerve fiber bundles is known to vary significantly (18% to 42% of the cross sectional area in primates) [7]. Such variation cannot be distinguished with intensity-based SD-OCT.
Polarization-sensitive OCT (PS-OCT) enables simultaneous intensity and depth-resolved measurements of the polarization state in turbid media [8–12]. Microtubules in the retinal nerve fiber layer (RNFL) – unlike glial cells– are intrinsically birefringent, and cause a phase retardation in reflection [13]. PS-OCT measures the double pass phase retardation and nerve fiber thickness simultaneously. It can therefore be used to determine the double pass phase retardation per unit depth (DPPR/UD), which is proportional to the birefringence [14]. Subsequent to the development of SD-OCT, polarization-sensitive SD-OCT systems were developed for retinal imaging. Studies with these systems on more than 10 healthy subjects in three different labs demonstrated that the RNFL birefringence varies as a function of location around the optic nerve head, indicating a spatial variation in microtubule density [14–20]. Lowest values of 0.1°/µm were found temporal and nasal to the optic nerve head, while higher values were found inferior and superior, around 0.35°/µm. Similar results were obtained in a measurement that combined results from OCT and scanning laser polarimetry [21]. Preliminary measurements on three glaucoma patients indicated that the disease causes a reduction in retinal nerve fiber layer tissue birefringence around the optic nerve head [19,20,22]. PS-OCT has also been used to determine the degree of polarization uniformity (DOPU) of scattering tissue such as the retinal pigment epithelium (RPE) [23–26]. A change in the DOPU can be attributed to a change of the fast axis orientation over a short distance, which is most likely caused by scattering. A change in phase retardation over a small distance also causes a change in DOPU, but these changes are relatively small due to the low birefringence of retinal tissue.
(C) 2009 OSA 23 November 2009 / Vol. 17, No. 24 / OPTICS EXPRESS 21636#117025 - $15.00 USD Received 10 Sep 2009; revised 4 Nov 2009; accepted 6 Nov 2009; published 11 Nov 2009

PS-OCT is not without limitations. Quantitative RNFL birefringence measurements with PS-OCT have been restricted to the area surrounding the optic nerve head, where the RNFL is thick (approximately 50 µm to 250 µm) and provides a large DPPR signal (up to ~70°) for birefringence measurements. Regions of thin RNFL (<50 µm), such as the macula lutea, have significantly less birefringent tissue and require more sensitive detection. In part because of this reason, birefringence measurements of these thinner regions have yet to be reported with PS-OCT. Another limitation of PS-OCT is its relatively coarse spatial resolution. This limitation stems from two factors. First is the requirement of a small pupil (< 2 mm) so as to optimally balance blur caused by diffraction and ocular aberrations, i.e., maximize image quality. Second, the birefringence is small, and the measurement of small changes in the polarization state requires averaging of Stokes vectors to reduce the influence of speckle noise. The combined effect is a relatively coarse spatial resolution that prevents PS-OCT from probing highly localized changes of birefringence that might exist on a microscopic level in the retina, for example variations in birefringence of adjacent retinal nerve fiber bundles.
The integration of AO into PS-OCT represents a potential solution to these problems. AO permits access to the full retinal reflection that exits a large pupil of the eye (>6 mm). This translates into higher lateral resolution at the plane of focus (~3 µm), a smaller lateral speckle size throughout the entire volume image (~3 µm), and higher collection efficiency for light backscattered from the retina (~6 dB).
The purpose of this paper is to demonstrate the benefit of AO for PS-OCT measurements. To this end, we integrated polarization-sensitive imaging into an existing AO-OCT system. Two different beam sizes were used for imaging the same patch of retina. For AO-PS-OCT measurements a 6.0 mm pupil diameter was used and the beam diameter was decreased to 1.2 mm to mimic a standard PS-OCT system without AO. Differences in signal-to-noise ratio (SNR) were quantified and Stokes vectors were analyzed to determine the benefit of AO for PS-OCT. The speckle size in the human retina was compared for these two systems, using an autocorrelation method. AO-PS-OCT measurements were then performed on the retinal nerve fiber in the macula lutea to quantify the birefringence of thin retinal nerve fiber bundles that cannot be measured with standard PS-OCT. Furthermore, the fast axis orientation and standard deviation of the fast axis orientation were determined and compared with the degree of polarization uniformity (DOPU) in the RPE [27].
2. Method
2.1 AO-PS-OCT system
An adaptive optics SD-OCT system [28,29] was re-designed for polarization-sensitive detection based on a polarization-sensitive methodology described previously [17,18]. In the source arm, the polarization state of near-infrared light from a superluminescent diode (Superlum HP-371, ∆λ = 50 nm (full width at half maximum (FWHM)), λc = 840 nm, P = 10 mW) was modulated at 13.1 kHz between two polarization states, orthogonal in the Poincaré sphere [30]. Nominally, the states were linearly and circularly polarized light. The detection method is inherently sensitive to birefringence present along the entire path of the beam including that in the system (e.g., due to stress in the single mode fiber) and ocular media through which the beam passes. To extract only the portion contributed by the retina, polarimetric measurements were referenced to the retinal/vitreal interface thereby removing the accumulation of unwanted birefringence in the system and preceding ocular media [14]. The spectrometer was calibrated for k-space mapping with two glass slides of different thickness [18]. The superluminescent diode was protected from reflections returning from the system with an optical isolator. An 80/20 fiber-coupler sent 80% of the power into the reference arm and the remaining 20% into the sample arm. The reference and sample arm lengths were matched in optical path length distance. Chromatic dispersion mismatch was compensated with software [31]. The reference arm contained a linear polarizer to ensure that regardless of the polarization state after the polarization modulator, an equal amount of power for each polarization state was directed to the detection arm [30].
(C) 2009 OSA 23 November 2009 / Vol. 17, No. 24 / OPTICS EXPRESS 21637#117025 - $15.00 USD Received 10 Sep 2009; revised 4 Nov 2009; accepted 6 Nov 2009; published 11 Nov 2009

In the sample arm, multiple relay telescopes composed of spherical mirrors conjugated the Shack-Hartmann wave front sensor (SHWS), two deformable mirrors, and two galvanometer scanners to the pupil of the eye [28]. The proportion transmitted through the sample arm (total of 18 optical elements) was 52% in single pass as measured with a broadband power meter (Ophir, Logan, UT). Four pellicle beam splitters were employed at different locations in the setup. Compared to ordinary (cube) beam splitters, pellicle beam splitters are attractive in that they cause no ghost reflections. On the other hand, they generate diattenuation that can destroy orthogonality of the two polarization states, a critical requirement for the polarization-sensitive detection scheme chosen here. Thus minimizing diattenuation in the system is critical; measures to reduce it in our system are detailed in the appendix.
The low order aberrations of the eye were corrected primarily with a 36-actuator AOptix bimorph mirror, which also provided the necessary stroke (16 µm) to dynamically adjust focus within the retina [28,32]. The remaining aberrations were corrected with a 140-element Boston Micromachines Corporation (BMC) deformable mirror (3.8 µm stroke). Note that only the central 10 × 10 elements of the 14 × 14 BMC array provided correction as the system beam size had been designed for an earlier version of mirror with a smaller actuator footprint. The resulting large stroke of the woofer-tweeter system permitted correction of moderate sphere and cylinder refractive error (up to ± 5.25D), without the need of trial lenses.
Light returning from sample and reference arms was detected with a polarization-sensitive high-speed spectrometer. A Wollaston prism with a 6° separation angle split the two orthogonal states, redirecting them to opposite halves of a single line scan camera (Atmel SM 2048). The center 1400 detector elements of this 2048 element camera with 14 µm x 14 µm detector elements were used, with the two orthogonal states illuminating 700 elements each (1400 elements total). As a side note, the original design of the Wollaston-based spectrometer incorporated a 2048 element 10 µm x 10 µm Basler L104-2k camera, but noise analysis [33] revealed that the Basler camera could not reach the shot noise limit. An internal gain setting in the camera was set too high and could not be adjusted, making this camera unusable for our experiments.
In an earlier design of the Wollaston-based spectrometer, the Wollaston prism was positioned between the transmission grating and the photographic lens (Nikon) [17]. This arrangement is preferred from the standpoint that the transmission grating operates at Littrow angle for both polarization states. Here the Wollaston prism was positioned after the collimator and as close as possible to the transmission grating, allowing the use of a significantly smaller and less expensive Wollaston prism with a length and width of only 10 mm. A potential drawback of this scheme is that the two orthogonal polarization states strike the grating at different angles. Since the grating efficiency is angle dependent, a loss of efficiency may occur, which will vary with polarization and wavelength. For the transmission grating used here (Wasatch Photonics, Logan, UT), however, the manufacturer’s specifications show a shallow and symmetric drop off of efficiency about Littrow angle. Thus as long as the angles are equal and opposite of sign for the two orthogonal polarization states (for instance ± 3° for the two orthogonal states), the difference in efficiency is negligible.
The line scan camera was synchronized with the polarization modulator [17]. Data was acquired at 26,300 A-scans/s and the integration time for one A-scan was equal to 32 µs. The efficiency of the spectrometer was measured 22 ± 2%, using noise analysis [33]. A difference in focus at the detector between the two orthogonal states can introduce birefringence artifacts through a difference in sensitivity decay with depth [17,18], making PS-OCT measurements unreliable. Correct alignment of the spectrometer is critical to avoid this birefringence artifact. Despite the position of the Wollaston prism (between collimator and grating), measurements on a planar mirror in a model eye positioned at different optical path length differences showed a negligible difference in sensitivity decay as a function of depth between the two polarization states. This outcome confirmed that the two polarization states indeed shared a common focus and that the spectrometer was well aligned [17,18]. A second source of birefringence artifacts is caused by incorrect mapping of the spectra to k-space. This problem was addressed by inserting two glass slides in the source arm for k-space calibration [18].
(C) 2009 OSA 23 November 2009 / Vol. 17, No. 24 / OPTICS EXPRESS 21638#117025 - $15.00 USD Received 10 Sep 2009; revised 4 Nov 2009; accepted 6 Nov 2009; published 11 Nov 2009
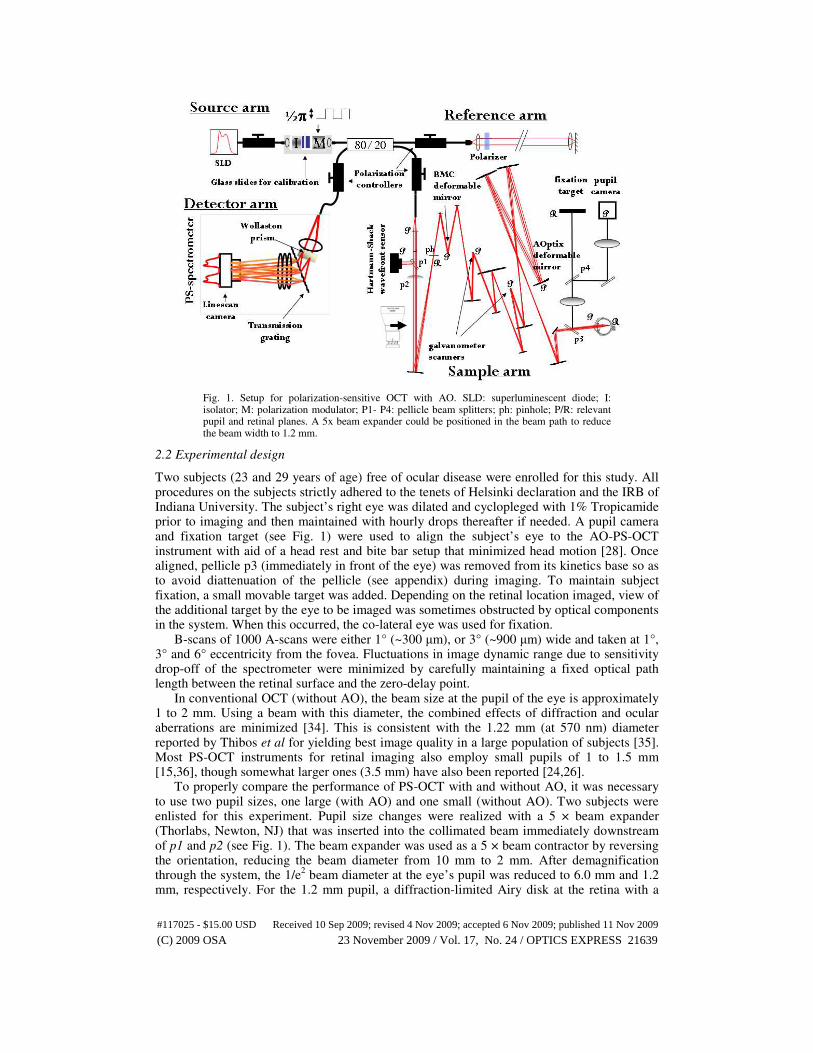
Fig. 1. Setup for polarization-sensitive OCT with AO. SLD: superluminescent diode; I: isolator; M: polarization modulator; P1- P4: pellicle beam splitters; ph: pinhole; P/R: relevant pupil and retinal planes. A 5x beam expander could be positioned in the beam path to reduce the beam width to 1.2 mm.
2.2 Experimental design
Two subjects (23 and 29 years of age) free of ocular disease were enrolled for this study. All procedures on the subjects strictly adhered to the tenets of Helsinki declaration and the IRB of Indiana University. The subject’s right eye was dilated and cyclopleged with 1% Tropicamide prior to imaging and then maintained with hourly drops thereafter if needed. A pupil camera and fixation target (see Fig. 1) were used to align the subject’s eye to the AO-PS-OCT instrument with aid of a head rest and bite bar setup that minimized head motion [28]. Once aligned, pellicle p3 (immediately in front of the eye) was removed from its kinetics base so as to avoid diattenuation of the pellicle (see appendix) during imaging. To maintain subject fixation, a small movable target was added. Depending on the retinal location imaged, view of the additional target by the eye to be imaged was sometimes obstructed by optical components in the system. When this occurred, the co-lateral eye was used for fixation.
B-scans of 1000 A-scans were either 1° (~300 µm), or 3° (~900 µm) wide and taken at 1°, 3° and 6° eccentricity from the fovea. Fluctuations in image dynamic range due to sensitivity drop-off of the spectrometer were minimized by carefully maintaining a fixed optical path length between the retinal surface and the zero-delay point.
In conventional OCT (without AO), the beam size at the pupil of the eye is approximately 1 to 2 mm. Using a beam with this diameter, the combined effects of diffraction and ocular aberrations are minimized [34]. This is consistent with the 1.22 mm (at 570 nm) diameter reported by Thibos et al for yielding best image quality in a large population of subjects [35]. Most PS-OCT instruments for retinal imaging also employ small pupils of 1 to 1.5 mm [15,36], though somewhat larger ones (3.5 mm) have also been reported [24,26].
To properly compare the performance of PS-OCT with and without AO, it was necessary to use two pupil sizes, one large (with AO) and one small (without AO). Two subjects were enlisted for this experiment. Pupil size changes were realized with a 5 × beam expander (Thorlabs, Newton, NJ) that was inserted into the collimated beam immediately downstream of p1 and p2 (see Fig. 1). The beam expander was used as a 5 × beam contractor by reversing the orientation, reducing the beam diameter from 10 mm to 2 mm. After demagnification through the system, the 1/e
2 beam diameter at the eye’s pupil was reduced to 6.0 mm and 1.2
mm, respectively. For the 1.2 mm pupil, a diffraction-limited Airy disk at the retina with a
(C) 2009 OSA 23 November 2009 / Vol. 17, No. 24 / OPTICS EXPRESS 21639#117025 - $15.00 USD Received 10 Sep 2009; revised 4 Nov 2009; accepted 6 Nov 2009; published 11 Nov 2009
diameter of 14.2 µm is expected. In contrast, the 6.0 mm pupil setting creates a theoretical Airy disk on the retina of 2.9 µm. In the return path the full 6.0 mm pupil collects reflected light, which benefits the SNR. In theory, due to a more efficient collection over a larger aperture of 6.0 mm, the light intensity reflected from the retina, a gain of approximately 8 to 12 dB is expected, based on the angular distribution of reflected light expected due to the Stiles-Crawford effect [37]. The difference in SNR between the two systems with different beam sizes was quantified, and the speckle size of the corresponding OCT B-scans of the retina were compared using an autocorrelation method. The data sets were acquired under similar conditions using the same power level at the pupil (~350 µW) and imaging essentially the same patch of retina (1 degree eccentricity superior to the fovea). One degree eccentricity was chosen due to its proximal location to the fovea, yet still containing all retinal layers that exhibit polarization properties other than the retinal nerve fiber layer, which was measured in a separate experiment. Compared to the foveal center, the one degree location avoids the bright reflection from the retinal/vitreal interface, the specular nature of which makes polarization-sensitive measurements more difficult to obtain. Horizontally oriented measurements were made with the same scan length (3 degrees or ~900 µm long). Focus of the AO system was set at the outer plexiform layer.
In order to quantify the birefringence of nerve fiber bundles close to the fovea, stationary B-scans oriented vertically (superior/inferior) and centered at 6° eccentricity superior to the fovea with a length of 3° (~900 µm) were acquired. Measurements were performed in the right eye of a 29-year old healthy female subject that was imaged recently with our UHR-AO-OCT system (case 7) [29]. A vertical scan orientation was chosen because at this angle the B-scans are roughly perpendicular to the direction of nerve fiber bundles, which improves the visibility of individual nerve fibers. The focus of the AOptix mirror was set at the nerve fiber layer.
To determine the performance of the woofer-tweeter design, the 29-year old subject with 4.75D of negative sphere was imaged with the AO system without the use of trial lenses. OCT data was recorded for 10 s at 1° eccentricity superior to the fovea, with a stationary 3° long horizontal scan. First, the AOptix loop was closed until equilibrium was reached and then held. Next, the loop for the BMC mirror was closed. AO focus was set at the photoreceptor layer. The performance of the AO system was quantified by analyzing the SHWS and OCT data.
2.3 Data post processing
Spectra were mapped to k-space [18] and multiplied with a complex phase function for chromatic dispersion compensation prior to Fourier transformation [31,38]. Stokes vectors were retrieved from the real and imaginary parts of the Fourier transformed spectra [39]. A rolling average filter was applied to the Stokes vectors to diminish the effects of phase noise that originates from speckle. The kernel size of the filter was adapted depending on the application and intended goal.
To retrieve the cumulative double pass phase retardation, surface Stokes vectors were compared with Stokes vectors at incrementally greater depths [14,30,40,41]. The retardation data was masked with a thresholded intensity image, such that phase retardation pixels that were deemed unreliable were masked out. Empirically, it was found that a value of 12 dB above the noise floor masks out unreliable data points. However, applied to the data taken with the inverted beam expander (i.e., small beam), almost half of the data points were masked out. A value of 7 dB was applied in this case. Similarly, a threshold value of 10 dB was applied for the data taken with the AO system and a 6.0 mm beam at 1 degree eccentricity.
To enhance the reliability of cumulative double pass phase retardation images, the surface Stokes vectors were averaged over all A-lines within one B-scan. For the analysis of nerve fiber bundle retardation however, individual surface Stokes vectors were averaged within the speckle reduction averaging procedure, over 4 × 16 pixels corresponding to 14 µm × 14 µm. This approach is consistent with retinal nerve fiber layer birefringence measurements
(C) 2009 OSA 23 November 2009 / Vol. 17, No. 24 / OPTICS EXPRESS 21640#117025 - $15.00 USD Received 10 Sep 2009; revised 4 Nov 2009; accepted 6 Nov 2009; published 11 Nov 2009
previously reported in the literature, and carries an additional advantage in that it avoids an offset in double pass phase retardation that complicates the calculation of the DPPR slope [17].
Since Götzinger et al reported the presence of a change in DOPU in the RPE, our data was analyzed with a DOPU algorithm as well, similar to their algorithm [27], using normalized
Stokes vectors: DOPU = √((Q/I)m2 + (U/I)m
2 + (V/I)m
2). (Q/I)m is the mean value of the
normalized Stokes vector element Q within a kernel sized 4 × 16 pixels corresponding to 14 µm × 14 µm. (U/I)m and (V/I)m are defined similarly. A mask was created by thresholding the intensity image at 12 dB above the noise floor. Prior to determination of the normalized Stokes vectors, the Stokes vector data was masked. Data points that were masked out because of a low intensity were not included in the DOPU calculation. Finally, the resulting DOPU plot was multiplied again with the mask to remove unreliable DOPU points. The fast axis of the tissue was mapped as well [40]. A large standard deviation of the fast axis over neighboring pixels indicates large changes in fast axis orientation (polarization scrambling) and therefore the presence of highly scattering tissue. These pixels should therefore correspond to the same pixels that were identified by the DOPU algorithm as the RPE. For the calculation of the fast axis orientation, intensity weighting was applied by multiplying the Q, U and V Stokes vector elements with the intensity Stokes vector element I prior to rolling averaging (4 × 16 pixels corresponding to 14 × 14 µm), using the imfilter.m function in Matlab. These operations were performed separately for the two input polarization states. The intensity weighted Stokes vectors were only used to improve the fast axis orientation determination; the cumulative DPPR was calculated according to the method described by Park et al [40].
(C) 2009 OSA 23 November 2009 / Vol. 17, No. 24 / OPTICS EXPRESS 21641#117025 - $15.00 USD Received 10 Sep 2009; revised 4 Nov 2009; accepted 6 Nov 2009; published 11 Nov 2009

3. Results
3.1 Adaptive Optics performance
Fig. 2. OCT retinal image (top left), RMS of residual wavefront aberrations & Strehl ratio (top right), point spread function (bottom left) and residual wavefront aberrations (bottom right) as a function of time. Prior to AO compensation, the OCT image is dim and of poor quality, and the Strehl ratio is low. Note that not all centroids of the SHWS were measurable during the first ~3
seconds as the large aberrations (primarily from −4.75 D of sphere corresponding to a wavefront RMS of approximately 3.5 µm RMS) were beyond the dynamic range of the sensor. As such, the reported residual wavefront RMS, Strehl ratio and corrected PSF overestimate actual image quality during this interval, which is demarcated by the yellow background in the upper right panel. Using the AOptix mirror, both the OCT image quality and the Strehl ratio improve, and the diffraction limit (Strehl > 0.8) is reached when the loop for the BMC deformable mirror is closed. (Media 1)
The ten-second movie of Fig. 2 demonstrates the performance of the AO woofer-tweeter
system on the right eye of a 29-year old subject with a refractive error of −4.75D of sphere. Prior to wavefront correction (t = 0 s), the AOptix and BMC mirrors were driven to pre-calibrated voltages that minimized the aberrations of the AO-PS-OCT system (system flat) and provided diffraction-limited image quality. Approximately 2 s into the movie, the AOptix is switched on and operating at a closed loop rate of 11 Hz, increases the Strehl ratio to approximately 0.12 and reduces the residual wavefront RMS to approximately 0.25 µm RMS. After the AOptix DM stabilizes (t = ~6 s), the mirror is held fixed for continued static correction, and the BMC DM is switched on, also operating at 11 Hz (t = ~7s). The wavefront RMS falls well below 0.1 µm RMS and the Strehl ratio improves to more than 0.8, indicating diffraction limited performance, as measured by the SHWS. As an independent measure of image quality, the dynamic range of the OCT video (captured simultaneously with the SHWS measurements) was observed to improve from 17 dB at the start of the movie (due primarily because of the large uncorrected refractive error of the subject) to more than 40 dB in the last frames (woofer-tweeter correction), an increase of more than 20 dB or 100 times. The OCT result clearly demonstrates that the AO system substantially improves image quality, is effective at correcting moderately large amounts of sphere (relinquishes the need for trial lenses), and both mirrors contribute to the correction. For this subject, we consistently achieved diffraction limited performance. Similar AO results were obtained on the second subject (23 years of age).
(C) 2009 OSA 23 November 2009 / Vol. 17, No. 24 / OPTICS EXPRESS 21642#117025 - $15.00 USD Received 10 Sep 2009; revised 4 Nov 2009; accepted 6 Nov 2009; published 11 Nov 2009

3.2 Comparison between PS-OCT and AO-PS-OCT
Fig. 3. Intensity (top) and corresponding double pass phase retardation (bottom) images taken at 1 degree eccentricity, without (left, 1.2 mm beam (Media 2)) and with (right, 6.0 mm beam (Media 3)) AO. The right image was taken with the focus of the AOptix mirror near the inner plexiform layer. Data was scaled in the vertical direction assuming an index of refraction of 1.38 and scale bars indicate a length of 100 µm. The intensity displays 42 dB of signal above the noise floor (white) encoded over 256 gray values. The cumulative double pass phase retardation images are color coded over 90 degrees, with blue representing 0° and red representing 90°. By clicking on the images, a movie covering ~4.4 s of data acquisition will be shown. The Stokes vectors were moving averaged over 2 × 2 pixels, corresponding to 2 µm × 7 µm, to reduce the influence of speckle noise. In the intensity images, the size of the red block (follow green arrow) represents the footprint (width × depth) of the AO-OCT point spread function at the plane of focus as well as the mean speckle size throughout the entire retina. In the DPPR image, the red block represents the 2 µm × 7 µm averaging kernel.
In Fig. 3 intensity and double pass phase retardation images are given for two data sets acquired through a 1.2 mm pupil (without AO) and 6.0 mm pupil (with AO) at the eye. The data sets were acquired under similar conditions using the same power level at the pupil (~350 µW) and imaging essentially the same patch of retina (1 degree superior retinal eccentricity). The dynamic range averaged across 100 B-scans for the 1.2 mm pupil was 35 dB. For the data set taken with 6.0 mm and AO, the dynamic range averaged over 90 frames (the last 10 frames were lost due to eye motion) was equal to 39 dB. The focus of the AOptix mirror was located at the inner plexiform layer for this particular data set. A higher dynamic range (an additional 4 dB) can be obtained with focus positioned at the bright RPE, photoreceptor, or retinal nerve fiber layer, the latter whenever the nerve fiber layer is thick enough to provide a strong reflection.
The phase retardation plots (Fig. 3, bottom) show a phase retardation value close to 0° in the upper layers, with large variations up to 90° in the RPE, which are attributed to large spatial changes in the fast axis orientation in RPE tissue. Some spatial variation in coloring (phase retardation) is visible in the upper layers as well. The origin of the changes in retardation values is twofold. First, the changes near the ELM are caused by low intensity Stokes vectors that are averaged with high intensity Stokes vectors. This effect is more
(C) 2009 OSA 23 November 2009 / Vol. 17, No. 24 / OPTICS EXPRESS 21643#117025 - $15.00 USD Received 10 Sep 2009; revised 4 Nov 2009; accepted 6 Nov 2009; published 11 Nov 2009

evident when the threshold mask is reduced (<12 dB), resulting in more pixels of multiple color. Second, speckle noise causes large changes in Stokes vector orientation, thereby inducing large changes in phase retardation. These variations can be reduced by spatial averaging. However, too much averaging washes out local changes in birefringence.
Fig. 4. Upper left: B-scan of 1000 A-scans taken with a 1.2 mm beam. Upper right: three dimensional autocorrelation plot of the area demarcated by a thin black line in the B-scan. Middle left: B-scan of 1000 A-scans taken with a 6.0 mm beam and AO. Only the upper retinal layers were included in the analysis, because the autocorrelation algorithm was sensitive to abrupt changes in intensity. Focus of the AOptix mirror for the bottom image was near the outer plexiform layer. The three dimensional autocorrelation plot of the demarcated area in the B-scan is given in the middle right image. The autocorrelation plots for a 1.2 mm and 6.0 mm beam are shown in the bottom graph.
Speckle analysis was performed on 10 intensity B-scans of 1000 A-scans, covering 1 degree long patches, taken at 3 degrees superior in the same subject. 3 degree eccentricity was selected over the previous 1 degree location owing to the thicker inner retina, which benefited the speckle analysis. In Fig. 4 two examples are given: without (top, 1.2 mm beam) and with (middle, 6.0 mm beam) AO. The autocorrelation was sensitive to the abrupt reflectance differences that occur between adjacent bright and dim neural layers, in particular those
(C) 2009 OSA 23 November 2009 / Vol. 17, No. 24 / OPTICS EXPRESS 21644#117025 - $15.00 USD Received 10 Sep 2009; revised 4 Nov 2009; accepted 6 Nov 2009; published 11 Nov 2009
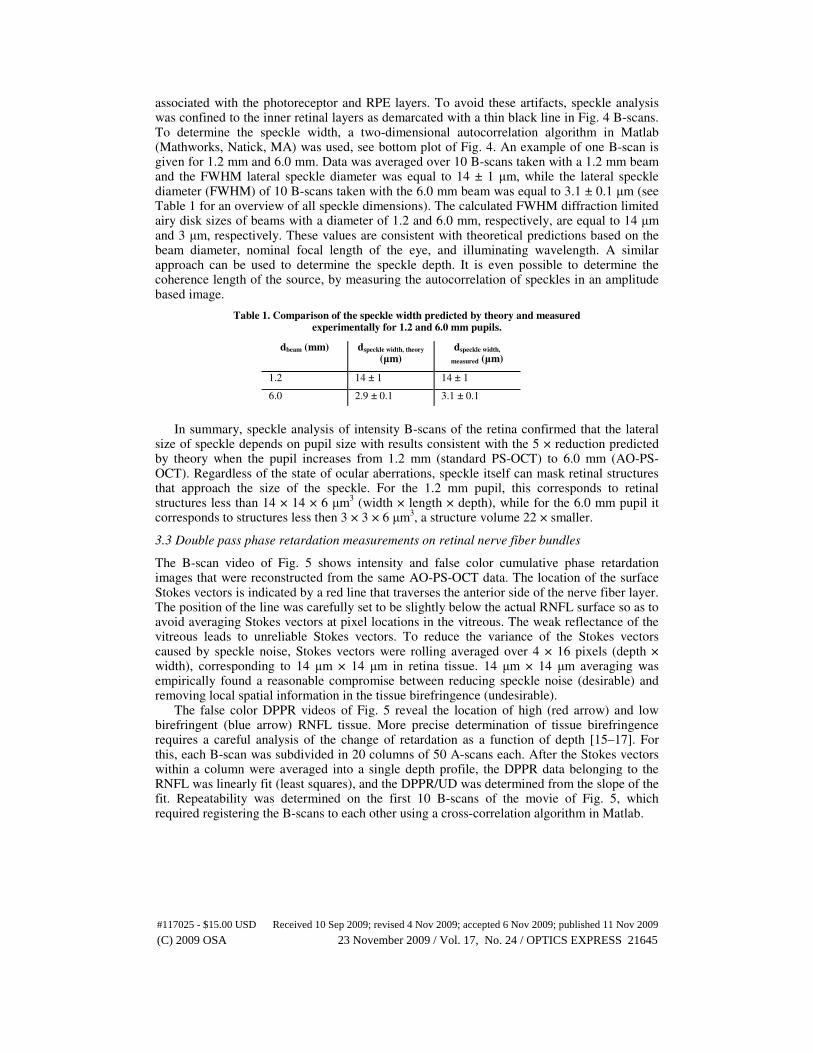
associated with the photoreceptor and RPE layers. To avoid these artifacts, speckle analysis was confined to the inner retinal layers as demarcated with a thin black line in Fig. 4 B-scans. To determine the speckle width, a two-dimensional autocorrelation algorithm in Matlab (Mathworks, Natick, MA) was used, see bottom plot of Fig. 4. An example of one B-scan is given for 1.2 mm and 6.0 mm. Data was averaged over 10 B-scans taken with a 1.2 mm beam and the FWHM lateral speckle diameter was equal to 14 ± 1 µm, while the lateral speckle diameter (FWHM) of 10 B-scans taken with the 6.0 mm beam was equal to 3.1 ± 0.1 µm (see Table 1 for an overview of all speckle dimensions). The calculated FWHM diffraction limited airy disk sizes of beams with a diameter of 1.2 and 6.0 mm, respectively, are equal to 14 µm and 3 µm, respectively. These values are consistent with theoretical predictions based on the beam diameter, nominal focal length of the eye, and illuminating wavelength. A similar approach can be used to determine the speckle depth. It is even possible to determine the coherence length of the source, by measuring the autocorrelation of speckles in an amplitude based image.
Table 1. Comparison of the speckle width predicted by theory and measured experimentally for 1.2 and 6.0 mm pupils.
dbeam (mm) dspeckle width, theory (µm)
dspeckle width,
measured (µm)
1.2 14 ± 1 14 ± 1
6.0 2.9 ± 0.1 3.1 ± 0.1
In summary, speckle analysis of intensity B-scans of the retina confirmed that the lateral size of speckle depends on pupil size with results consistent with the 5 × reduction predicted by theory when the pupil increases from 1.2 mm (standard PS-OCT) to 6.0 mm (AO-PS-OCT). Regardless of the state of ocular aberrations, speckle itself can mask retinal structures that approach the size of the speckle. For the 1.2 mm pupil, this corresponds to retinal structures less than 14 × 14 × 6 µm
3 (width × length × depth), while for the 6.0 mm pupil it
corresponds to structures less then 3 × 3 × 6 µm3, a structure volume 22 × smaller.
3.3 Double pass phase retardation measurements on retinal nerve fiber bundles
The B-scan video of Fig. 5 shows intensity and false color cumulative phase retardation images that were reconstructed from the same AO-PS-OCT data. The location of the surface Stokes vectors is indicated by a red line that traverses the anterior side of the nerve fiber layer. The position of the line was carefully set to be slightly below the actual RNFL surface so as to avoid averaging Stokes vectors at pixel locations in the vitreous. The weak reflectance of the vitreous leads to unreliable Stokes vectors. To reduce the variance of the Stokes vectors caused by speckle noise, Stokes vectors were rolling averaged over 4 × 16 pixels (depth × width), corresponding to 14 µm × 14 µm in retina tissue. 14 µm × 14 µm averaging was empirically found a reasonable compromise between reducing speckle noise (desirable) and removing local spatial information in the tissue birefringence (undesirable).
The false color DPPR videos of Fig. 5 reveal the location of high (red arrow) and low birefringent (blue arrow) RNFL tissue. More precise determination of tissue birefringence requires a careful analysis of the change of retardation as a function of depth [15–17]. For this, each B-scan was subdivided in 20 columns of 50 A-scans each. After the Stokes vectors within a column were averaged into a single depth profile, the DPPR data belonging to the RNFL was linearly fit (least squares), and the DPPR/UD was determined from the slope of the fit. Repeatability was determined on the first 10 B-scans of the movie of Fig. 5, which required registering the B-scans to each other using a cross-correlation algorithm in Matlab.
(C) 2009 OSA 23 November 2009 / Vol. 17, No. 24 / OPTICS EXPRESS 21645#117025 - $15.00 USD Received 10 Sep 2009; revised 4 Nov 2009; accepted 6 Nov 2009; published 11 Nov 2009

Fig. 5. Intensity (top left) and cumulative double pass phase retardation (bottom left) obtained with AO-PS-OCT. 3° B-scan bisects the nasal/temporal retina with the left and right edges at 4.5° and 7.5° superior of the foveal center, respectively. RNFL birefringence causes the cumulative double pass phase retardation to increase from 0° (dark blue) to approximately 30° (light blue / green) over a depth of less than 50 µm. The red and blue arrows point to RNFL regions that exhibit high and low birefringence, respectively. Distance between these regions of extreme RNFL birefringence is just 200 µm. The black arrow points to a 70 µm wide small blood vessel that was identified as arterial. Large changes in phase retardation spanning more than 50° is evident in the RPE and is suggestive of rapid changes in fast axis orientation associated with polarization scrambling. In the intensity image, the size of the red block (follow green arrow) represents the footprint (width × depth) of the AO-OCT point spread function at the plane of focus as well as the mean speckle size throughout the entire retina. In the DPPR image, the red block represents the 14 µm × 14 µm averaging kernel. Data was scaled in the vertical direction assuming an index of refraction of 1.38 and scale bars indicate a length of 100 µm. The two plots on the right show data that encompasses the blood vessel (a) and data that was taken next to the vessel (b). The relative intensity and DPPR are plotted as a function of depth, with least squares fits going through DPPR data that is estimated to belong to the RNFL.
As evident in Fig. 6, RNFL thickness varies considerably over the 3° section. A blood vessel – about 70 µm diameter – is evident in the center of the B-scan and appears to separate thick from thin RNFL tissue. Whether this separation is coincidental or an actual consequence of the vessel presence is unclear. RNFL thickness varies from 16 µm directly above the vessel to 44 µm immediately to the right of it. From the figure it is clear that the thinner RNFL tissue on the left (nearer to the fovea) is approximately 50% more birefringent than the thicker tissue on the immediate right. Further right, the DPPR/UD gradually increases again reaching a value of about 0.5 °/µm near the B-scan edge. Surprisingly, the tissue immediately above the small blood vessel (at around 450 µm) appears extremely birefringent, up to three times more than the surrounding RNFL tissue.
It is unlikely that this spike in birefringence is a spurious effect of the underlying vessel lumen and the dynamics of blood flow as that is counter to what has been reported in the
(C) 2009 OSA 23 November 2009 / Vol. 17, No. 24 / OPTICS EXPRESS 21646#117025 - $15.00 USD Received 10 Sep 2009; revised 4 Nov 2009; accepted 6 Nov 2009; published 11 Nov 2009

literature for large vessels. Specifically, previous PS-OCT analysis around the optic nerve head demonstrated a significant decrease (not increase) in the local retardation when large vessels were included [17]. It was for this reason that data containing vessels was ignored in these earlier studies [14–17]. To assure that the birefringent spike in our data was not an anomaly, we analyzed nine additional sets of the same patch of retina and fit the DPPR across the RNFL using linear least squares. The least squares fit yielded consistent results for the 10 data sets, even for the 16 µm section above the vessel. Given that the RNFL is unlikely to generate such a large birefringence (1.0°/µm), the remaining candidate is the vessel wall. The vessel was identified as arterial from the associated fundus image that was acquired on this subject [29]. In a separate AO-PS-OCT data set of essentially the same patch of retina (not shown), a smaller vein was discovered to cross over the above artery, but unlike the artery, the vein did not generate retardation in the PS-OCT image. Based on these observations, it is plausible that the high values in retardation are caused by smooth muscle cells and connective tissue intrinsic to the arterial wall, cells that are present in much smaller quantities in the vein. Since the artery wall is uniform in composition, a similarly high DPPR is expected along the vessel underside. Stokes vector measurements at this location, however, proved unreliable likely because of the influence of the artery’s blood flow [17].
Fig. 6. RNFL thickness (open black squares) and DPPR/UD (blue squares) as a function of
lateral position in the B-scan of Fig. 5. Thickness and DPPR/UD were averaged over 10 data
sets with error bars representing the standard deviation across the sets. Distances of 0 µm and 900 µm correspond to 4.5° and 7.5° superior of the fovea, respectively. The DPPR/UD spike of ~1°/µm originates from tissue close to a small vessel.
4. Discussion
4.1 AO benefit for PS-OCT
The comparison between measurements taken with the 1.2 mm beam without AO and the 6.0 mm beam with AO demonstrated an increase in dynamic range of at least 4 dB for the latter. This number can be further increased by an estimated 4 dB when the AO system is focused at a highly reflective surface, such as the RPE. Adding these numbers, the total gain would be 8 dB, which is close to the 8 to 12 dB estimation that originated from a difference in aperture size, taking the Stiles-Crawford effect into account [37].
The speckle measurements demonstrated that the experimental speckle width results matched the values predicted from the diffraction-limited spot size, which were based on the beam diameter measurement. The Strehl ratio and point spread function calculations that were
(C) 2009 OSA 23 November 2009 / Vol. 17, No. 24 / OPTICS EXPRESS 21647#117025 - $15.00 USD Received 10 Sep 2009; revised 4 Nov 2009; accepted 6 Nov 2009; published 11 Nov 2009

based on Shack-Hartmann measurements (Fig. 2), demonstrated a diffraction-limited performance of the AO-PS-OCT system. Since the speckle size is equal to the diffraction-limited spot size, and the speckle width was equal to 3.1 ± 0.1 µm, the resolution of this system is approximately 3 µm, which is a factor of 5 times better than the resolution of a system without AO and a 1.2 mm beam.
4.2 Fast axis scrambling in the photoreceptor layer
Both PS-OCT and AO-PS-OCT movies of Fig. 3 show relatively large amounts of retardation (up to 90°) in the RPE layer. Unlike the RNFL and Henle’s fiber layer, which also exhibits significant retardation, the RPE retardation fluctuates rapidly on a spatial scale approaching the resolution limit of the OCT instrument. The rapid fluctuations are likely caused by significant scatter in the RPE that induces quick changes in the orientation of the fast axis. The fast axis and the standard deviation in fast axis orientation were determined, the latter quantifying the extent to which the fast axis changes its orientation within the 14 µm by 14 µm averaging kernel. A smaller averaging kernel will lead to a higher standard deviation, but also more spurious data points within the retinal layers above the RPE. In the middle-lower panel of Fig. 7 the standard deviation in fast axis is plotted, encoded over 10°. These results were compared with results obtained using a degree of polarization uniformity (DOPU) algorithm [27], to determine if both methods could accurately identify the RPE. A mask was created that thresholded the intensity image, zeroing all pixels within 12 dB of the noise floor. Empirically, this threshold gave the most reliable images, i.e. least number of spurious points. The DPPR image, the standard deviation of the fast axis image and the DOPU image were multiplied with this mask (Fig. 7).
In a second step, a second mask was created for the DOPU and standard deviation of the fast axis images. For each image a different threshold value was chosen that gave the most consistent results within an image, i.e. no spurious points and a continuous RPE layer. For the DOPU overlaid image, all data points with a DOPU value below 0.55 are marked red; for the standard deviation of the fast axis orientation, all data points with a value higher than 1.9° are colored red. The mask was overlaid on top of the intensity image, to identify the RPE (the two images on the right). Although both images do not show a continuous RPE layer, all red pixels fall within the RPE layer, with only a few red pixels showing up above the RPE in the standard deviation image. Using one threshold value for a whole data set of 100 B-scans, the DOPU method gave the most consistent result. The plots of the standard deviation of the fast axis and DOPU have a theoretical relation, since they are both a measure of a spatial change in Stokes vector orientation.
(C) 2009 OSA 23 November 2009 / Vol. 17, No. 24 / OPTICS EXPRESS 21648#117025 - $15.00 USD Received 10 Sep 2009; revised 4 Nov 2009; accepted 6 Nov 2009; published 11 Nov 2009

Fig. 7. Top - intensity, DOPU (color coded from 0 (blue) to 1 (red)) and thresholded DOPU overlaid on intensity image of the retina. The data was taken at 1° eccentricity. Bottom - retardation (encoded over 50°), standard deviation of the fast axis orientation (encoded over 10°), and a thresholded standard deviation fast axis image overlaid on the intensity image.
In the lower left plot of Fig. 7 one can also observe a slight increase in DPPR near the photoreceptor layer, which is attributed to birefringence in Henle’s fiber layer.
4.3 Retinal nerve fiber layer retardation
In the DPPR image of Fig. 5, the phase retardation at certain locations appears to fluctuate (decreases and increases) with depth, an effect inconsistent with retardation accumulation that must always increase. The source of this discrepancy is likely intensity and speckle noise that generates random deviations in Stokes vector orientation that are added to that accumulated from tissue birefringence. While spatial averaging reduces this unwanted effect it cannot completely eliminate it as averaging also reduces local phase retardation of tissue birefringence, which we seek to measure.
Over a relatively short distance of 900 µm across the retinal surface (Figs. 5 and 6), the DPPR/UD of the RNFL was found to change substantially from 0.25 to 0.65 °/µm (the largest value closest to the fovea), indicating a significant change in microtubule density [13]. Although no measurements were performed around the optic nerve head of this subject, the highest DPPR/UD values reported to date in healthy subjects fall below ~0.5°/µm with typical values between 0.1°/µm and 0.35°/µm [14–18]. Note that AO-PS-OCT B-scans sectioned the RNFL bundles roughly perpendicular to their orientation, thus effectively cutting across many individual bundles. The 0.25 to 0.65 °/µm variation therefore corresponds to variation across many bundles as opposed to variation across a single bundle. This finding is consistent with the large variation of glial content (18-42% variation in cross sectional area) across RNFL bundles as reported by Ogden [7]. Interestingly in the same report, the proportion of bundle area occupied by glia was strongly independent of the nerve fiber layer thickness even for the same bundle. This suggests that bundles might retain their microtubule density along their entire length, from optic disc to peripheral retina. Our measurements in conjunction with ordinary PS-OCT measurements around the optic disc, however, do not support this finding: DPPR/UD measurements around the optic nerve fall well below 0.65°/µm, while those near the fovea readily reach this value. Perhaps a possible explanation may reside with the limitation of current (non-AO) polarimetric instruments. Specifically current polarimeters require significant averaging across many bundles to gain sufficient signal to noise, thus averaging out high and low DPPR/UD values that happen to be in the same averaging window. Unlike standard PS-OCT, AO-PS-OCT does not share these limitations, at least not to the same extent. Perhaps the larger DPPR/UD values measured near the fovea with AO-PS-
(C) 2009 OSA 23 November 2009 / Vol. 17, No. 24 / OPTICS EXPRESS 21649#117025 - $15.00 USD Received 10 Sep 2009; revised 4 Nov 2009; accepted 6 Nov 2009; published 11 Nov 2009

OCT are simply a consequence of the higher resolution and sensitivity afforded by AO. In principle, AO-PS-OCT opens the possibility to measure birefringence along the length of the same bundle, for example from fovea to optics disc. Such measurements would provide a strong test of microtubule preservation in the same bundle. Moreover, these measurements will provide more insight in the microtubule density as a function of depth and location. In the bottom graph of Fig. 5 for instance, the slope in DPPR through the first 5 µm of RNFL tissue is very similar to the slope in the top graph, suggesting similar birefringence and microtubule content.
It is interesting to compare the DPPR of the RNFL on the left and right sides of Fig. 6. The left side is thinner with a higher DPPR/UD, while the right side is thicker with a lower DPPR/UD. Specifically, the average thickness (n = 10) of tissue left of the blood vessel is 26.8 µm, while the average DPPR/UD is 0.47°/µm. These give an average DPPR of 12.6°. Similarly, on the right side (n = 9) of the blood vessel, the average RNFL thickness is 34.1 µm, and the average DPPR/UD is 0.37°/µm, giving an average DPPR of 12.6°. The same DPPR values suggest very similar microtubule content on the left and right sides. The same DPPR values but different thicknesses, however, suggest that the right side contains more glia.
5. Conclusions
The woofer-tweeter AO system demonstrated diffraction-limited correction in both subjects
examined, even in the one subject with a large refractive error (−4.75D of sphere). AO offers three distinct advantages for PS-OCT measurements: an increased signal-to-noise ratio (which leads to a more reliable detection of Stokes vectors), a higher lateral resolution and a smaller speckle size. PS-OCT measurements with AO (6.0 mm beam) were compared to measurements in a standard setup, without AO (1.2 mm beam), on the same subject and at the same retinal location. The measured speckle sizes compared well with that predicted from theory. In both system configurations, a change in polarization uniformity was observed in the RPE. An analysis of the orientation of the fast axis in the AO-PS-OCT data showed relatively large changes of the fast axis orientation in the RPE as well.
A thin retinal nerve fiber layer varying between 11 and 44 µm of a healthy subject was successfully imaged with AO-PS-OCT and analyzed to determine tissue birefringence. The DPPR/UD varied from 0.25°/µm to 0.65°/µm, with still higher values of ~1.0°/µm localized anterior of a superficial 70-µm-diameter artery. We suspect the birefringent muscle cells and connective tissue of the arterial wall are responsible for the birefringent spike. The high DPPR/UD value of 0.65°/µm in the RNFL is significantly higher than that previously reported in healthy subjects, measurements that have been restricted to around the optic nerve (0.35°/µm), indicating a higher average density of microtubules in the nerve fiber layer near the fovea.
Appendix: Minimizing system diattenuation caused by pellicle beam splitters
For wavefront measurements, a 90/10 pellicle beam splitter is used in the OCT sample channel to redirect a small proportion of the retinal reflection towards the SHWS. Pellicle beam splitters consist of a 1-2 µm membrane of nitrocellulose. Compared to a beam splitter cube, a pellicle beam splitter does not have a reflecting surface perpendicular towards the incident beam, so that specular reflections can be avoided. Since a SHWS is sensitive to back reflections a pellicle beam splitter is ideal for AO applications. The beam that passes through this thin beam splitter is shifted with respect to the incoming beam by only a few µm, while the chromatic dispersion is kept to a minimum. According to the transmission graph from the manufacturer (National Photocolour Lab) that accompanied the 90/10 pellicle beam splitter, the beam splitter is highly diattenuating, with significantly different transmission values for S and P polarized light. Our detection scheme for birefringence measurements becomes less reliable when system parts are diattenuating [42].
We minimized the diattenuation of the system by positioning another diattenuating pellicle beam splitter close to the first one. While the first pellicle beam splitter directs ~10% of the
(C) 2009 OSA 23 November 2009 / Vol. 17, No. 24 / OPTICS EXPRESS 21650#117025 - $15.00 USD Received 10 Sep 2009; revised 4 Nov 2009; accepted 6 Nov 2009; published 11 Nov 2009

light parallel to the optical table towards the SHWS, the second beam splitter directs ~10% light perpendicular to the optical table. Power measurements in our system indicated that diattenuation was negligible for the two controlled polarization states that were going towards the eye, while light that returned from the eye (which can be in any polarization state) could be diattenuated in a worst case by 0.03. The average angular displacement of a polarization state on the Poincaré sphere due to diattenuation is therefore equal to (40*0.03)° = 1.2° [42]. In comparison, the deviation due to Poisson noise (shot noise) at an SNR of an estimated 35
dB is equal to √(2/SNR), or 0.03 radians, or 1.7° [43], demonstrating that the worst case diattenuation causes a deviation smaller than changes caused by Poisson noise. These deviations do not play a role in highly birefringent tissue that causes large amounts of retardation and therefore a large retardation angle in the Poincaré sphere, but can explain measured variations in tissue birefringence in thin tissue with a low birefringence [15].
The system contained a third pellicle beam splitter that was positioned in front of the eye, where a pupil camera was used to center the beam on the pupil. Before a measurement, this beam splitter was removed to avoid diattenuation.
Acknowledgements
The authors are indebted to the subjects who volunteered for this study. They also thank Daniel Jackson and William Monette for machining and electronic support. Furthermore, fruitful discussions with Drs Robert Knighton and Steve Burns are acknowledged. Financial support was provided by the National Eye Institute grants 5R01 EY014743 and 1R01 EY018339. This work was also supported in part by the National Science Foundation Science and Technology Center for Adaptive Optics, managed by the University of California at Santa Cruz under cooperative agreement No. AST-9876783.
(C) 2009 OSA 23 November 2009 / Vol. 17, No. 24 / OPTICS EXPRESS 21651#117025 - $15.00 USD Received 10 Sep 2009; revised 4 Nov 2009; accepted 6 Nov 2009; published 11 Nov 2009
Related Documents