Rethinking Performance Measurement Performance measurement remains a vexing problem for business firms and other kinds of organizations. This book explains why: the performance we want to measure (long-term cash flows, long-term viability) and the perfor- mance we can measure (current cash flows, customer satisfaction, etc.) are not the same. The “balanced scorecard,” which has been widely adopted by US firms, does not solve these underlying problems of performance mea- surement and may exacerbate them because it provides no guidance on how to combine dissimilar measures into an overall appraisal of performance. A measurement technique called activity-based profitability analysis (ABPA) is suggested as a partial solution, especially to the problem of combining dissimilar measures. ABPA estimates the revenue consequences of each ac- tivity performed for the customer, allowing firms to compare revenues with costs for these activities and hence to discriminate between activities that are ultimately profitable and those that are not. marshall w. meyer is Richard A. Sapp Professor and Professor of Man- agement and Sociology at The Wharton School of the University of Pennsyl- vania.

Welcome message from author
This document is posted to help you gain knowledge. Please leave a comment to let me know what you think about it! Share it to your friends and learn new things together.
Transcript
Rethinking PerformanceMeasurement
Performance measurement remains a vexing problem for business firms andother kinds of organizations. This book explains why: the performance wewant to measure (long-term cash flows, long-term viability) and the perfor-mance we can measure (current cash flows, customer satisfaction, etc.) arenot the same. The “balanced scorecard,” which has been widely adoptedby US firms, does not solve these underlying problems of performance mea-surement and may exacerbate them because it provides no guidance on howto combine dissimilar measures into an overall appraisal of performance.A measurement technique called activity-based profitability analysis (ABPA)is suggested as a partial solution, especially to the problem of combiningdissimilar measures. ABPA estimates the revenue consequences of each ac-tivity performed for the customer, allowing firms to compare revenues withcosts for these activities and hence to discriminate between activities that areultimately profitable and those that are not.
marshall w. meyer is Richard A. Sapp Professor and Professor ofMan-agement and Sociology at The Wharton School of the University of Pennsyl-vania.


RethinkingPerformanceMeasurement
Beyond the BalancedScorecard
marshall w. meyerThe Wharton School, University of Pennsylvania

CAMBRIDGE UNIVERSITY PRESS
Cambridge, New York, Melbourne, Madrid, Cape Town, Singapore, São Paulo, Delhi
Cambridge University Press
The Edinburgh Building, Cambridge CB2 8RU, UK
Published in the United States of America by Cambridge University Press, New York
www.cambridge.org
Information on this title: www.cambridge.org/9780521103268
© Marshall W. Meyer 2002
This publication is in copyright. Subject to statutory exception
and to the provisions of relevant collective licensing agreements,
no reproduction of any part may take place without the written
permission of Cambridge University Press.
First published 2002
Reprinted 2004
This digitally printed version 2009
A catalogue record for this publication is available from the British Library
ISBN 978-0-521-81243-6 hardback
ISBN 978-0-521-10326-8 paperback
Contents
List of figures page vii
List of tables x
Preface xi
Introduction 1
1 Why are performance measures so bad? 19
2 The running down of performance measures 51
3 In search of balance 81
4 From cost drivers to revenue drivers 113
5 Learning from ABPA 145
6 Managing and strategizing with ABPA 168
Notes 187
Index 198
v

Figures
I.1 The performance chain of the firm page 101.1 Location in time of three types of performance 231.2 Shifting the timeframe backward 231.3 United Way thermometer 251.4 The seven purposes of performance measures 311.5 Organizational design and performance measures of
unitary and multiunit firms 391.6 Measures circa 1960 441.7 Measures circa 1990 452.1 Differences between mean batting averages and batting
averages for highest and lowest 10 percent of majorleague players 53
2.2 Standard deviation of batting average by year 542.3 Average length of patient stay for voluntary, for-profit,
and government hospitals by year 552.4 Average cost per in-patient day for voluntary, for-profit,
and government hospitals by year 562.5 Occupancy rates for voluntary, for-profit, and
government hospitals by year 572.6 Number of scrams for ten best and ten worst nuclear
plants 582.7 Number of safety system actuations for ten best and ten
worst nuclear plants 582.8 Standard deviations of yields, all MMMFs 632.9 Standard deviations of yields, prime corporate
MMMFs 642.10 Standard deviations of yields, high yield MMMFs 642.11 Market betas by logarithm of company age for IPOs,
July 1977–December 1984 662.12 Unsystematic variance by logarithm of company age for
IPOs, July 1977–December 1984 67
vii
viii List of figures
2.13 Twenty-day total variance by logarithm of companyage for IPOs, July 1977–December, 1984 67
2.14 Return on assets for commercial banks 703.1 1992 business model for GFS US retail operations 843.2 Balanced scorecard for GFS US retail operations,
1996 883.3 Flowchart of PIP 913.4 Flowchart of balanced scorecard 923.5 Business model of GFS Western region (using
branch-quality index) 983.6 Business model of GFS Western region (using
components of branch-quality index) 993.7 The elements of balance 1023.8 Decomposition of earnings 1103.9 Balance and fee revenues for eighteen Eastern region
and twelve Western region branches, July–December1999 111
4.1 The impact of activities on customer revenues 1164.2 Separating cost drivers from revenue drivers: the need
for product specifications 1184.3 ABPA connects customer transactions, activity costs,
and customer profitability 1234.4 Using ABPA to estimate the impact of transaction and
product utilization on customer profitability 1264.5 The cost and revenue consequences of problem
resolution activity 1324.6 Business model of the injury-free workplace 1435.1 ABPA screens 1525.2 Action implications of ABPA 1535.3 Improve customer revenues and profitability 1575.4 Recalibrate bands 1585.5 Tradeoffs between ease of implementation and quality
of measurement 1656.1 Organizational design for implementing ABPA:
transaction flows 1706.2 Organizational design for implementing ABPA:
information flows 1716.3 Organizational design for implementing ABPA:
administrative hierarchy and accountabilities 171

List of figures ix
6.4 Late-1960s model of manufacturing firm: core isbuffered from the environment 174
6.5 Mid-1980s model of manufacturing firm: coreis exposed to environment 175
6.6 Organization and metrics of web portals 1776.7 Tradeoffs between low-cost and differentiation
strategies 1796.8 Limits of mass customization and distributed
network strategies 1806.9 How ABPA connects low-cost and differentiation
strategies 1826.10 The changing significance of the balanced
scorecard 184

Tables
1.1 Everyday notions of performance and performancemeasures page 21
1.2 Types of measures by locus and purposes served 353.1 Evolution of the PIP System, 1993–1995 934.1 Country A quality measures 1294.2 Problem incidence and problem resolution in Latin
American markets 1345.1 Comparison of financial measures, the balanced
scorecard, and ABPA 161
x
Preface
Performance measurement is in an uproar. The collapse of the internetbubble, the bankruptcy of Enron, and the erosion of confidence in theaccounting profession have placed the problem of measuring the per-formance of the firm – and of other kinds of organizations – squarelyin the public arena. Enron’s bankruptcy, in particular, is a watershedevent. On the surface, it raises the issue of how a firm reporting pre-tax profits of $1.5 billion from the third quarter of 2000 through thethird quarter of 2001 could file for bankruptcy the next quarter. Theanswers proffered so far are the expected: sharp if not fraudulent fi-nancial practices, cozy relationships with auditors and their consultingarms, even cozier relationships with Wall Street analysts, and directorsso dazzled by Enron’s growth and generous directors’ fees that theyfailed to exercise proper fiduciary responsibility.But there remains an underlying problem so daunting that to raise it
is almost heretical: can we accurately measure the performance of firmslike Enron or, for that matter, any firm? I raise this question because theanswer is not clear. For decades we have accepted that the perfor-mance of non-profit organizations like hospitals and universities is dif-ficult to gauge. To be sure, performance measures for hospitals anduniversities abound (mortality/morbidity/acceptance/graduation rates,patient/student satisfaction, professional reputation), but most are un-satisfactory because they are incomplete or susceptible to deliberatedistortion or both.Until recently, firms have been privileged because we have assumed
that the profitmotive simplifies themeasurements of their performance.Perhaps it once did. But no longer. As the internet bubble, Enron, andthe travail of the accounting profession have shown, metrics (e.g. proforma earnings) and accounting practices (e.g. off-balance-sheet assets)now commonplace have obscured the performance of firms. But formanagers simplicity has long since vanished. The appearance of thebalanced scorecard ten years ago signaled how complicated – and
xi
xii Preface
uncertain – performance measurement has become. The balancedscorecard was intended to make sense of the myriad of financial andnon-financial performance measures that emerged in the 1980s andearly 1990s by organizing them into four broad categories. But thescorecard has floundered as a device for measuring and rewarding per-formance. This book shows why (see chapter 3). Nevertheless, thescorecard has remained immensely popular as a tool for trackingprogress toward strategic objectives, an aspiration far more modestthan measuring and rewarding the performance of the firm and itspeople.Why has performance measurement proved so challenging? Part of
the answer lies in the gap between what we want to measure and whatwe can measure. We want to measure (or predict, if we cannot mea-sure) how people and firms will perform. But we can only measure howpeople and firms have performed in the past. And the past is not nec-essarily a reliable guide to the future. Part of the answer lies in humannature: people will exploit the gap between what we want to measureandwhat we canmeasure by delivering exactly what is measured ratherthan the performance that is sought but cannot be measured. Part ofthe answer lies in the complexity of organizations we have created: themore complicated the organization, the more performance measuresare taken and the more dissimilar those measures are – hence the moredifficult it is to understand the actual performance of the organization.(It is likely that Enron’s managers understood this principle better thantheir auditors.)The gap between what we want to measure and what we can mea-
sure is endemic. The gap will not go away unless, of course, we revertto a command economy and quotas – the hallmarks of the failed ex-periment called socialism. Human nature will not change, but we canmonitor measures and replace measures no longer discriminating goodperformance from bad because people have learned too well how todeliver what is measured rather than what is sought. Organizationalcomplexity will not go away either. But we can analytically simplifyotherwise complex organizations and reduce, if not eliminate, the dis-similarity of measures.What I call ABPA – activity-based profitability analysis – is intended
to accomplish this simplification by addressing some basic questions:what does the firm do for each of its customers, what does it cost,and what will customers pay for it? ABPA, to be sure, is not an
Preface xiii
all-purpose performance measurement tool. ABPA is not a panaceafor all the underlying problems of performance measurement. Neitheris the balanced scorecard, as will be amply demonstrated. However,ABPA, unlike the scorecard, has the virtue of focusing attention onthe basics: what are we doing, what does it cost, and what will thecustomer pay for it? My hypothesis is that firms that persistently askthese questions will do better than firms that don’t. ABPA is simply astructure for asking these questions in a disciplined way.This project began from a persistent observation: the most common
measures of organizational performance are statistically uncorrelated(see chapter 2). There are two ways to interpret this. One interpre-tation is that organizational performance lacks construct validity, inother words, that organizational performance does not exist. Morethan a few of my colleagues have taken this position, and many havehad successful academic careers. Another interpretation is that sloppythinking pervades performance measurement. This occurs because wehave confused performance measures with performance. It is easy tomeasure something and call it performance (and then to rate and rankfirms on the measure and publicize the ranking so that the measure be-comes performance in people’s minds). It is far more difficult to answerthe fundamental questions, first, what is performance – that is, organi-zational performance – and, second, how tomeasure it. It turns out thatorganizational performance is not in the dictionary, which may be sur-prising because theatrical performance, mechanical performance, andpsychological performance all are. It also turns out that theatrical per-formance, mechanical performance, and psychological performance,which are observable, are much easier to measure than organizationalperformance, which is not. The skeptic may argue that the performanceof a firm is captured in its earnings and share prices. My answer is thatearnings and share prices capture performance partially but far fromcompletely. Consider the internet bubble. Consider Enron.
I owe a substantial debt to Professor Robert K. Merton. In the earlystages of this research Merton persistently asked whether I was con-fusing performance measures with performance, in other words, had Ifallen into the trap similar to operationalism, a doctrine of the 1930s as-serting that the physical sciences should deal only with observables? Ittook me six months to understand Merton’s question and much longereven to begin to answer it, and I am still not sure that I have done
xiv Preface
so satisfactorily. I am also indebted to Beth Bechky, Chris Ittner, DaveLarcker, Ian MacMillan, and Sarah Mavrinac for comments on themanuscript. Mavrinac treated the manuscript like a draft of a PhDdissertation – there were handwritten comments on practically everypage. Chris Harrison of Cambridge University Press is responsible,among other things, for the title of the book. Chris is one of thesmartest editors I have ever encountered. My work on performancemeasurement would not have been possible without the backing ofseveral organizations, including the Reginald H. Jones Center of theUniversity of Pennsylvania, the Russell Sage Foundation, where I wasa visiting scholar for the 1993–94 academic year, and the Citibank Be-havioral Sciences Research Council, which funded the research on thebalanced scorecard. My deepest thanks go to all those who supportedthis project and to Judy, Josh, and Gabe who smiled whenever theyasked, “Where’s the book?”
Introduction
D issatisfaction with performance measurement systemsruns high. Many firms, perhaps the majority, suspect that theyhaven’t got it right. A 1995 article in Chief Financial
Officer begins, “According to a recent survey, 80 percent of largeAmerican companies want to change their performance measurementsystems . . .”1 Unsurprisingly, the turmoil in performance measurementis ongoing. Startup companies struggling for capital must continuallyadjust their metrics.2 And it is commonplace for large firms to under-take annual overhauls of their performance measurement systems.3
Why the turmoil and dissatisfaction? One cause is the ongoing searchfor non-financial predictors of financial performance: “Yesterday’s ac-counting results say nothing about the factors that actually help growmarket share and profits – things like customer service innovation,R&D effectiveness, the percent of first-time quality, and employee de-velopment.”4 Another cause, ironically, is a surfeit of measures: manycorporate controllers cite the burdens imposed by “newfangled per-formance measures” as a key source of burnout.5 Anecdotal reportssuch as these suggest that executives are seeking measures that con-trollers and chief financial officers have so far been reluctant or unableto deliver. The result is frustration on both sides.
Whether the problem is too few or too many measures, many ac-countants believe that corporate performance measurement systemsdo not support management objectives well. According to the Instituteof Management Accountants, the proportion of accountants ratingtheir performance measures as “poor” or “less than adequate,” thebottom two categories on a six-point scale where the fourth categoryis “adequate,” has remained substantial, ranging from 35 percent in1992 to 43 percent in 1993, 38 percent in 1995, 43 percent in 1996,34 percent in 1997, 40 percent in 2000, and 33 percent in 2001.6 Theyear-to-year changes are small and do not reveal a trend, but theseIMA surveys suggest that while performance measures are changing
1
2 Rethinking Performance Measurement
rapidly, management accountants do not experience these changes asimprovements.
Avoiding bedrock issues: the “balanced scorecard”
Firms and non-business organizations alike can no longer afford toavoid bedrock issues of performance measurement. Let’s be frank. Forthe last decade, discussion of performance measurement has been dom-inated by the “balanced scorecard.” Many books, articles, and casesabout the balanced scorecard have appeared during that period, theHarvard Business Review has called the balanced scorecard one of themost important management ideas in the last seventy-five years, andan organization called the Balanced Scorecard Collaborative servesas a central clearing house for what it calls the “balanced scorecardmovement.”7 What is missing from the spin surrounding the balancedscorecard is a simple fact about performance measures, the significanceof which is not widely appreciated: common-sense measures used togauge the performance of a firm are generally uncorrelated. In otherwords, look across a large number of firms or their business units andyou will find that profitability, market share, customer satisfaction,and operating efficiency are weakly and sometimes negatively corre-lated. These measures move in different directions about as often asthey move in tandem. Social scientists have known this for years andhave drawn two conclusions. First, measuring performance is difficult(since it is not clear that performance is a single construct). Second, thechoice of performance measures is often arbitrary (since it is difficultto prove that any one measure is better than others). Though nei-ther of these conclusions is particularly useful, they would not surprisemanagers.
Beginning in 1992, Robert Kaplan and David Norton transformedthe persistent observation that measures are generally uncorrelated intoa prescription for business practice: just as pilots track multiple instru-ments to gauge the performance of an aircraft, managers should trackmultiple measures to gauge the performance of their firms. “Managerswant a balanced presentation of both financial and operational mea-sures . . . The scorecard brings together, in a single management report,many of the seemingly disparate elements of a company’s competitiveagenda . . .”8 Not only is the analogy between cockpit instruments andthe measures needed to guide firms compelling, but its logic is also
Introduction 3
impeccable. Consider the counterfactual. Ask whether multiple mea-sures would be necessary if measures were strongly correlated, that is ifthe most common performance measures rose and fell together. The an-swer is this: if performance measures were strongly correlated, then allwould contain essentially the same information, any one of them wouldcontain complete information about the performance of the firm, andthere would be no need for multiple measures or a “balanced score-card.”9 For example, if customer satisfaction and bottom-line resultswere strongly correlated, there would be no need, except for comfort,to measure customer satisfaction since bottom-line results would sig-nal the level of customer satisfaction. Now consider the actual. Again,performance measures are weakly correlated. Each contains differentinformation about the performance of the firm, and scorecards utilizingmultiple measures are needed to capture the performance of the firmcompletely. In other words, customer satisfaction (and operational per-formance, innovation, and so on) must be measured alongside financialresults because they are different.
Unfortunately, the logic lying behind the scorecard approach to per-formance measurement can go awry when measures are put to use.While there are good reasons to measure multiple dimensions of perfor-mance, there are also strong pressures to appraise performance alongone dimension: better or worse. These pressures are strongest whencompensating and rewarding people’s performance, but they are alsopresent when making investment decisions. Whenever managers askwhether firm A performs better than B, whether division C performsbetter than D, or, most poignantly, if employee E is a better performerand hence should be compensated more generously than F, G, and H,they are tacitly if not explicitly trying to reduce performance to a singledimension.
Even Kaplan and Norton recognize these limitations of the “bal-anced scorecard” and are reluctant to recommend scorecards to ap-praise and compensate performance. Consider the following:
Norton: . . . firms often hesitate to link the scorecard to compensation.Kaplan: They should hesitate, because they have to be sure they have theright measures [on the scorecard]. They want to run with the measures forseveral months, even up to a year, before saying they have confidence in them.Second, they may want to be sure of the hardness of the data, particularlysince some of the balanced scorecard measures are more subjective. Com-pensation is such a powerful lever that you have to be pretty confident that
4 Rethinking Performance Measurement
you have the right measures and have good data for the measures [beforemaking the link].10
Note that Kaplan and Norton construe the compensation problem nar-rowly, as a problem of finding the “right measures.” The compensationproblem, in fact, is much broader. It exposes the tension between mea-suring performance along several dimensions and appraising perfor-mance ultimately on one dimension. Remember: scorecard measuresare necessarily different. If they weren’t, then they would be redundantand there would be no need for the balanced scorecard because any onemeasure would do. The compensation problem, moreover, raises thequestion of whether the “right measures” can in fact be found. “Rightmeasures,” to be sure, can be found in static environments where theparameters of performance are well understood. Go back to the cock-pit analogy. Pilots know how an aircraft must perform in order tocomplete its mission and rely on their instruments to compare actualto required performance. In competitive environments, however, theperformance required to produce a satisfactory return can change un-predictably; in other words, measures that were right can be renderedobsolete or pernicious overnight.
Rather than tackling these bedrock problems of performance mea-surement, Kaplan and Norton have recast the “balanced scorecard”as a management system intended to communicate strategies and ob-jectives more effectively than non-scorecard systems: “Measurementcreates focus for the future. The measures chosen by managers com-municate important messages to all organizational units and employ-ees . . . the Balanced Scorecard concept evolved from a performancemeasurement system to become the organizing framework, the op-erating system, for a new strategic management system.”11 I am skep-tical about basing strategy on performance measures. I worry aboutunintended consequences, especially unintended consequences of im-perfect measures – as will be shown, all performance measures areimperfect. In particular, I worry about measurement systems becom-ing arteriosclerotic, turning into the rigid quota systems that ruinedsocialist economies. “What you measure is what you get” captures theproblem: if you cannot measure what you want, then you will not getwhat you want.
I’m not saying that we can do without performance measures, but Iam saying that we should tackle bedrock issues before basing strategies
Introduction 5
on such measures. Again, the specter of quotas haunts me. I think thatwe should approach the bedrock issues realistically. We should assumethat measuring performance is difficult. If performance measurementweren’t difficult, then it wouldn’t be the chronic problem that it is.I also think we should assume that performance measurement is dif-ficult for good reasons. The good reasons, I suspect, lie in both thenature of organizations and the people in them.
Consider organizations first. The dilemma created by organizationsis illustrated by Adam Smith’s pin-making factory, where every workeris like an independent business – one cuts wire, a second sharpens thewire, a third solders pin heads onto the sharpened wire, a fourth boxespins, and so forth – engaging in cash transactions with co-workers.There is no performance measurement problem because each workerhas his or her own revenues and costs. There is an efficiency problem,however, since intermediate inventories will accumulate if workers failto coordinate their efforts and produce at different rates – if the wirecutter works faster than the sharpener, for example. The solution tothe efficiency problem is placing the workers under a common supervi-sor charged with coordinating the process; in other words, creating anorganization. But solving the efficiency problem creates a performancemeasurement problem. There is no simple way to measure separatelythe contributions of the wire cutter, the wire sharpener, the solderer,and the boxer to the performance of the organization that has been cre-ated because one revenue stream has replaced the independent revenuestreams that formerly existed.
Now consider the people problem. People will assume performancemeasures to be consequential and will strive to improve measuredperformance even if the performance that is measured is not theperformance that is actually sought – teaching to test is illustrative.Performance measures, as a consequence, get progressively worse withuse, and managers face the challenge of searching out newer and bettermeasures – better, that is, until they deteriorate – while retaining thesemblance of clarity and consistency of direction. That organizationsand the people in them create impediments to measuring performanceas well as we would like is central to the rethinking of performancemeasurement I shall propose.
The message and metaphor of the balanced scorecard were, ofcourse, important first steps in getting at bedrock issues of performancemeasurement. The notion that a tool as complicated as a baseball
6 Rethinking Performance Measurement
scorecard might be needed to gauge corporate performance has jarredmanagers into realizing there is more to performance than the bottomline. But the message and the metaphor are now ten years old. It is timeto rethink performance measurement once more.
Ideal performance measurement
The rethinking of performance measurement begins with a simple ques-tion: what properties do we look for in performance measures? Ideally,the performance measures of choice would meet the following require-ments:
� Parsimony. There would be relatively few measures to keep track of,perhaps as few as three financial measures and three non-financialmeasures. (I have chosen three plus three arbitrarily, but I think thesenumbers are realistic.) Cognitive limits would be exceeded and in-formation would actually be lost were there many more measures.
� Predictive ability. The non-financial measures would predict sub-sequent financial performance, in other words, the non-financialswould serve as leading performance indicators and the financials aslagging indicators, as measures summarizing performance after itoccurred. Non-financial measures not demonstrated to be leadingindicators would be discarded unless, of course, they were trackedas matters of regulation, ethics, and security – “must-dos” for firms.
� Pervasiveness. These measures would pervade the organization – thesame measures would apply everywhere. Measures pervading the or-ganization have three key advantages over highly specific measures:they can be summed from the bottom to the top of the organization,which allows people to see connections between their results andthe results of the firm; they can be decomposed downward, whichgives senior managers drill-down capability; and they can be com-pared horizontally across different units, which facilitates improve-ment and performance appraisal.
� Stability. The measurement system would be stable. Measures wouldchange gradually so as to maintain people’s awareness of long-termgoals and consistency in their behavior.
� Applicability to compensation. People would be compensated forperformance on these measures, that is for financial results and resultsof non-financial measures known to be leading indicators of financialresults.
Introduction 7
The requirements of ideal performance measurement are very stringent,far more stringent than the requirements of the balanced scorecard.The balanced scorecard imposes only the two requirements on mea-sures, parsimony and predictive ability: in principle, scorecard mea-sures are more parsimonious than the potpourri of measures trackedby most large firms, and non-financial scorecard measures predict fi-nancial results. The scorecard does not address pervasiveness otherthan acknowledging that scorecards and scorecard measures are likelyto vary across different parts of the organization. Nor does the score-card address the stability of measures. Moreover, as noted, Kaplan andNorton are cautious about using scorecard measures to compensatepeople – for good reason, as will be seen below.
Rarely if ever do we find performance measures meeting thesecommon-sense requirements. Here is why:
� Firms are swamped with measures, and the problem of too manymeasures is, if anything, getting worse, the balanced scorecard with-standing. It is commonplace for firms to have fifty to sixty top-levelmeasures, both financial and non-financial. One of the longest listsof top-level measures I have seen includes twenty financial measures,twenty-two customer measures, sixteen measures of internal process,nineteen measures of renewal and development, and thirteen humanresources measures.12 Many firms, I am sure, have even more top-level measures.
� Our ability to create and disseminate measures has outpaced, atleast for now, our ability to separate the few non-financial measurescontaining information about future financial performance from themany that do not. To be sure, research studies show that a myriad ofnon-financial measures such as customer and employee satisfactionaffect financial performance, but their impact is modest, often firm-and industry-specific, and discoverable only after the fact.
� Few non-financial measures pervade the organization. It is easierto find financial measures that pervade the organization, but keep inmind that many firms have struggled unsuccessfully to drive measuresof shareholder value from the top to the bottom of the organization.
� Performance measures, non-financial measures especially, neverstand still. With use they lose variance, sometimes rapidly, and hencethe capacity to discriminate good from bad performance. This is theuse-it-and-lose-it principle in performance measurement. Managersrespond by continually shuffling measures.
8 Rethinking Performance Measurement
� Compensating people for performance on multiple measures is ex-tremely difficult. Paying people on a single measure creates enoughdysfunctions. Paying them on many measures creates more. Theproblem is combining dissimilar measures into an overall evalua-tion of performance and hence compensation. If measures are com-bined formulaically, people will game the formula. If measures arecombined subjectively, people will not understand the connectionbetween measured performance and their compensation.
There is a still more fundamental reason for the gap between idealperformance measurement and performance measurement as it is. Themodern conception of performance, which is the economic conceptionof performance, renders the performance of the firm not entirely mea-surable. The modern conception of performance is future cash flows –“cash flows still to come”13 – discounted to present value. In otherwords, we think of the firm as assets capable of generating current andfuture cash flows.14 Future cash flows, by definition, cannot be mea-sured. Nor can we measure the long-term viability and efficiency of thefirm in the absence of which cash flows will dwindle or vanish. Whatwe can and do measure are current cash flows (financial performance),potential predictors of future cash flows (non-financial measures), andproxies for future cash flows (share prices). All of these are imperfect.They are, at best, second-best measures. Note the paradox that is at theheart of efforts to improve performance measurement: knowing thatmost measures are second best compels us to search for better mea-sures that are inevitably second best. If we had a different conceptionof performance – for example if we believed a firm’s performance wasits current assets rather than future cash flows – then measuring theperformance of the firm would be no more complicated than measur-ing the performance of an airplane. One point deserves emphasis: I’mnot saying that everyone subscribes to the notion of economic perfor-mance, of performance as future cash flows or even as the long-termviability and efficiency of the firm. Managers, in particular, think of per-formance as meeting the targets they have been assigned. I am saying,however, that our unease with most of the performance measures wehave is due to the gap between what we can measure – current financialand non-financial results – and the future cash flows we would measureif we could.
Introduction 9
The performance chain
To search intelligently for better, albeit second-best, performance mea-sures, we may have to rethink the firm and the relevant units formeasuring performance. Right now, we think of firms as black boxes:investment flows into the firm, activities take place, products are madeand sold to customers as a result of these activities, and an incomestatement, balance sheet, and market valuation of the firm follow. Sincefinancial results – the income statement, balance sheet, and market val-uation – accrue to the firm as a whole or, internally, to large chunksof the firm called business units, we look for drivers of financial per-formance, that is non-financial measures describing internal processes,products, and customers, at the level of the entire firm or its businessunits. The problem with the black-box approach to the firm and per-formance measurement is that it masks differences within firms andtheir business units: so many processes take place, so many productsare produced, and so many customers are served that firm- or businessunit-level performance measures – which I’ll call aggregate measures –conceal important sources of variation. The things a firm does well arelumped together with the things it does poorly, making it difficult toknow, for example, precisely where to invest and where to cut costs.Importantly, the larger the firm and its business units, the more in-formation about performance is obscured by aggregate performancemeasures.15
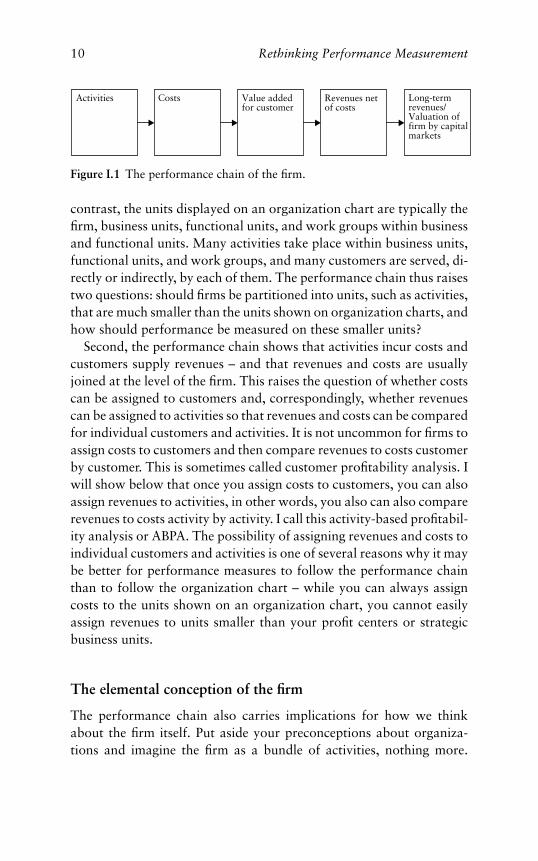
The rethinking of the firm and of the relevant units for measuringperformance begins by asking where the performance of the firm comesfrom. The performance of the firm originates in what the firm does,in its activities or routines. These activities give rise to costs, but theyalso generate revenues in excess of costs to the extent that the firm’sproducts and services add value for customers. These cash flows andthe expectation of future cash flows in turn give rise to the valuationof the firm in capital markets. The causal chain running from activitiesto costs to revenues to the valuation of the firm in capital markets isshown in figure I.1. This ‘performance chain’ is an extension of MichaelPorter’s idea of the value chain that incorporates costs.16
The performance chain carries some immediate implications for per-formance measurement. First, the units in the performance chain bearlittle resemblance to the units on a typical organization chart. Thereare three principal units: the firm, the customer, and the activity. By
10 Rethinking Performance Measurement
Activities Costs Revenues netof costs
Long-termrevenues/Valuation offirm by capitalmarkets
Value addedfor customer
Figure I.1 The performance chain of the firm.
contrast, the units displayed on an organization chart are typically thefirm, business units, functional units, and work groups within businessand functional units. Many activities take place within business units,functional units, and work groups, and many customers are served, di-rectly or indirectly, by each of them. The performance chain thus raisestwo questions: should firms be partitioned into units, such as activities,that are much smaller than the units shown on organization charts, andhow should performance be measured on these smaller units?
Second, the performance chain shows that activities incur costs andcustomers supply revenues – and that revenues and costs are usuallyjoined at the level of the firm. This raises the question of whether costscan be assigned to customers and, correspondingly, whether revenuescan be assigned to activities so that revenues and costs can be comparedfor individual customers and activities. It is not uncommon for firms toassign costs to customers and then compare revenues to costs customerby customer. This is sometimes called customer profitability analysis. Iwill show below that once you assign costs to customers, you can alsoassign revenues to activities, in other words, you also can also comparerevenues to costs activity by activity. I call this activity-based profitabil-ity analysis or ABPA. The possibility of assigning revenues and costs toindividual customers and activities is one of several reasons why it maybe better for performance measures to follow the performance chainthan to follow the organization chart – while you can always assigncosts to the units shown on an organization chart, you cannot easilyassign revenues to units smaller than your profit centers or strategicbusiness units.
The elemental conception of the firm
The performance chain also carries implications for how we thinkabout the firm itself. Put aside your preconceptions about organiza-tions and imagine the firm as a bundle of activities, nothing more.
Introduction 11
These activities incur costs. These activities may also add value forcustomers, although they may not. When activities add value for cus-tomers, customers supply revenues to the firm. When activities do notadd value, customers hold on to their wallets. The elements of the firm,then, are activities, costs, customers (who decide which activities addvalue and which do not), and revenues. Under the elemental concep-tion, attention is shifted from the performance of the firm as a wholeto the activities performed by the firm and the revenues and costs as-sociated with these activities. The problem for the firm is finding thoseactivities that add value for the customer and generate revenues in ex-cess of costs, extending those activities, and reducing or eliminatingactivities that incur costs in excess of revenues. Finding the right mea-sures of that performance becomes less of an issue, although, as weshall see, actually measuring the costs and revenues associated withactivities is not always easy. Importantly, the problem of balancingor combining dissimilar measures, which is a major limitation of thebalanced scorecard, disappears.
The elemental conception of the firm is a radical departure fromestablished precepts of organizational design, but it may be time torethink these precepts. The range of organizational designs suggestedby academics and consultants is staggering. These designs include sim-ple hierarchy, functional organization, divisional organization, matrixorganization combining functional and divisional designs, circular or-ganization, hybrid organization that is part hierarchy and part market,and network organization where lateral ties take precedence over verti-cal ties. All of these organizational designs fix attention on the internalarchitecture of the firm. What they overlook is the fact that internalarchitecture has receded in significance as external relationships havedrawn an increasing share of managers’ attention. This has occurredfor several reasons: there are many more firms than ever; firms, on aver-age, have grown somewhat smaller; firms have many more alliance andjoint venture partners than they once did; managers depend increas-ingly on information originating outside of organizational channels;and, most importantly, work has shifted from manufacturing wherevalue is added in the factory to services where value is added at thepoint of contact with the customer.17
The elemental conception of the firm has the advantage of simplify-ing the environment – the key decision criteria are what am I doing,what does it cost, who is the customer, and what is the customer willing
12 Rethinking Performance Measurement
to pay – even as the environment becomes more complicated. Whetheror not firms can act on these criteria will depend on our capacity to de-liver reliable cost and revenue information to our people. The contrastbetween the success many firms have had in cutting costs and theirinability, so far, to understand the revenue consequences of the coststhey incur suggests that the tools firms have used to manage costs, suchas activity-based costing, could be transformed into performance mea-surement tools by applying them to both the revenue and the cost sidesof the ledger. Just as activity-based costing reduces total costs to thecosts of performing individual activities, can total revenues be reducedto revenues resulting from each of the activities performed by the firm?
Reductionism is an established principle in science. Modern scienceteaches us to reduce complex phenomena, whether physical systemsor firms, to simpler elements in order to understand and control them.Often, of course, the simple questions raised by reductionist methodsdo not always admit of simple answers and sometimes they do notadmit of any answers at all. This is especially true in the realm ofmanagement where we think of firms as more than the sum of theirpeople and processes – firms have irreducible cultures, routines, repu-tations, and the like. But this does not mean that reductionist methodsshould not be tried, especially in performance measurement where theholistic approach may have created or compounded more problemsthan it has solved. This said, an important caution is in order: reducingfirms to activities, costs, customers, and revenues may help us find bet-ter second-best measures, but it will not solve the underlying problemthat all measures are second best. The gap between the performancewe would like to measure and what we can measure can be narrowed,but it will not vanish.
A brief itinerary
This book addresses eight large questions: (1) What is meant by perfor-mance? (2) Is there an inherent gap between the prevailing conceptionof performance and our ability to measure performance? (3) Does thisgap increase as firms grow larger and lags between actions and theireconomic results lengthen? (4) Do people exploit the gap between whatwe would like to measure and what we can measure, and how muchdoes this affect the capacity of measures to discriminate good from badperformance? (5) Does the balanced scorecard correct the limitations
Introduction 13
and distortions inherent in almost all performance measures, does itcompound these limitations and distortions, or does it create new ones?(6) Can we measure performance better by reducing the performance ofthe firm to the performance of its activities? (7) What are the strategicand managerial implications of reducing the performance of the firm tothe performance of its activities? (8) Finally, and by implication, mightthe persistent gap between what we would like to measure and whatwe can measure ultimately prove advantageous even though it makesperformance measurement difficult?
Chapter 1 raises some very basic issues about measurement and theperformance of the firm. Modern performance measurement searchesfor what firms do that generates revenues in excess of costs. But, hav-ing set this agenda, performance measurement begins with the firmand its financial results, asks how the functioning of the parts of thefirm shown on the organization chart contributes to these results, andthen searches for measures of the functioning that predict financialresults. This approach, I believe, goes awry due to a part-whole prob-lem: it is difficult to connect measures of functioning that are dispersedthroughout the organization with financial results accruing to the firmas a whole without losing a great deal of information.
Chapters 2 and 3 turn to the human element and why people’s behav-ior renders performance measurement so challenging. One challengelies in what people do when they are exposed to performance measures:they either improve actual performance or they improve measured butnot actual performance, and it is all but impossible to tell the differ-ence between the two unless you are measuring exactly what you wantto accomplish (for firms, long-term economic results; for governmentand non-profit organizations what you want is less certain). The con-sequence is that measures are always in turmoil. Chapter 2 locates thesource of this turmoil in the running down of performance measures,the tendency of almost all measures to lose variance and hence the ca-pacity to discriminate between good and bad performance. Runningdown is attenuated in turbulent environments, but this creates a furthercomplication for performance measurement: either you are in a placidenvironment where the variance of your measures collapses and leavesyou unable to differentiate good from bad performance, or you arein a turbulent environment where your measures retain variance butthe high level of uncertainty renders it difficult to predict the economicresults you seek from the measures you have.
14 Rethinking Performance Measurement
The human element also enters when we try to combine fundamen-tally different measures in order to appraise people’s overall perfor-mance and compensate them. Many businesses have tried to appraiseand pay their people using a combination of financial and non-financialmeasures suggested by the balanced scorecard. Chapter 3 reports onthe efforts of a global financial services firm to compensate its people onboth financial and non-financial measures in the 1990s. The companyfound that a formula-driven compensation system was susceptible togaming, like any system where measures are fixed. Weighting measuressubjectively, however, undermined people’s motivation – they couldnot understand how they were paid. Since there is no middle groundbetween combining measures formulaically and combining them sub-jectively, the initial conclusion is that the balanced scorecard is notan effective performance measurement tool. This conclusion, however,does not mean that imbalance is a good thing. The same global fi-nancial services firm abandoned the balanced scorecard in 1999 andfocused almost exclusively on sales performance. Compensating peopleon sales had the unintended consequence of accelerating customer at-trition, most likely because customer service was ignored, even thoughrevenues continued growing. Thus, while managers should understandthe limits of the balanced scorecard and take care to distinguish theperformance measurement from the strategic functions of the balancedscorecard, they should never forget that measuring performance in onlyone domain invites distortions in domains not measured.
Chapter 4 explores whether the main limitation of the balancedscorecard, the choice between subjective and formulaic weighting ofdissimilar measures, can be overcome by developing comparable met-rics for performance in different domains. Toward this end, the chaptershifts attention from the organization to the customer and ultimatelythe activity as the fulcrum of performance measurement. The chap-ter starts with a success story: when products or services are made tospecifications known to add value for the customer, activities and thecosts they incur can be removed and performance improved so longas specifications are not compromised. This observation is at the coreof activity-based costing, and its application is responsible for manyproductivity improvements, especially in manufacturing. But can per-formance be similarly improved in settings where specifications addingvalue for the customer are not known? Or, more precisely, can perfor-mance be similarly improved where the activities incurring costs cannot
Introduction 15
be easily separated from the specifications adding value, which oftenoccurs in services?
The chapter suggests that activity-based profitability analysis orABPA, which is a revenue analog of activity-based costing, can help im-prove performance where specifications adding value for the customerare not known. ABPA uses the results of customer profitability analy-sis to estimate the profitability of different kinds of activities. What isimportant about ABPA is that it follows the performance chain, parti-tions the firm first by customers and revenues and then by activities andcosts, and it then attaches costs to customers and revenues to activities.ABPA, in other words, is an alternative to following the organizationchart, partitioning the firm into business units, functional units andwork groups, and then trying to connect the firm’s functioning, whichoccurs mainly in functional units and work groups, to the financialperformance of business units and the firm as a whole.
Chapter 5 is about using ABPA, although it is hardly a “how to doit” guide. The chapter explores how firms using ABPA learn about thedrivers of bottom-line performance and then compensate people’s con-tribution to the bottom line. Learning takes place as experience accu-mulates and the drivers of customer profitability are revealed over time.People are then compensated on customer profitability, which can bedriven deeper in the organization than conventional bottom-line mea-sures.
Chapter 6 is about implementing ABPA. ABPA requires the firm tobe designed around front-end customer units where activities, costs,customers, and revenues are joined. These customer units link back-end functional units, where many of the firm’s activities and costs areincurred with customers who supply revenues to the firm. Customerunits and their people are accountable for customer profitability. Func-tional units, in turn, support customer units by supplying products andservices at costs and to specifications determined by customer units, butthey are not directly responsible for customer profitability. This exer-cise in organizational design might not be important but for its conse-quences for forming and implementing strategy. Most of our thinkingabout strategizing assumes that strategy remains a senior managementprerogative. The ABPA approach to performance measurement opensthe possibility of decentralized strategizing, which nurtures strategiz-ing capabilities at the local level where customers interface with firm.Decentralized strategizing capabilities, I argue, are especially important
16 Rethinking Performance Measurement
for global service firms offering huge arrays of products to multiplecustomer segments.
Some bedrock issues are beyond the purview of this book. Amongthem is whether we would be better off in a world where measure-ment is precise, that is, where measures correspond to the objectiveswe seek and people are compensated on these measures, or in a worldwhere measurement is imprecise, where the correspondence betweenmeasures and objectives is imperfect and compensating people on thesemeasures is problematic. There is no simple answer. There is a strongcase for precision. A myriad of experimental studies demonstrate thatmotivation is strongest when people are given specific, challenging ob-jectives. But the argument – I should say arguments – for imperfectmeasurement cannot be dismissed. The arguments for imperfectioncome from many sources, including Weber’s The Protestant Ethic andthe Spirit of Capitalism, where discipline and motivation come fromnot knowing what leads to salvation of the soul; from the notion ofgoal displacement, which suggests that the means organizations use toachieve their goals often become ends in themselves and hence deeplydistorted; and from decades of research on command economies show-ing that quota systems lead to suboptimal performance because peopleanticipate that quotas once met will be raised; and from organizationaltheory and organizational economics, where it is taken for granted thatfirms pursue the dual objectives of efficiency, which can be measured,and adaptability, which cannot be.
The more immediate question addressed here is how firms will con-tinue to improve performance as the business environment becomesmore challenging. Most of the low-hanging fruit has been picked. Manyof the performance gains of the 1990s were made by cutting costsand selling aggressively. Think, for example, of Jack Welch at GeneralElectric or Sanford Weil at Citigroup. Whether the same strategy oftreating costs and revenues as independent events – in the vernacular,cut costs on the one hand and drive revenues on the other – will workgoing forward is uncertain. The problem is not intent: when man-agers must cut costs, they seek to cut expenditures not contributingto revenues. The problem, rather, is that, absent analytic tools linkingexpenditures to revenues, the wrong costs are often cut. These analytictools require a great deal of data, ideally data capturing all of the ac-tivities performed by the firm. Collecting these data and using thesetools effectively, moreover, will require a rethinking of how the firm
Introduction 17
is organized and how it strategizes. This rethinking will allow firmssimultaneously to pursue profit-maximizing strategies in front-endcustomer units and cost-minimizing strategies in back-end functionalunits.
The bottom line
For ease of review, each chapter will end with a condensation of itsargument into a few bullet points.
� There is widespread dissatisfaction with existing performance mea-sures.
� This dissatisfaction occurs because most performance measurementsystems fail to meet some basic requirements, e.g. there should be rel-atively few measures, non-financial measures of functioning shouldpredict financial performance, these measures should pervade the or-ganization, they should be stable, and they should be used to appraiseand compensate people’s performance.
� While the balanced scorecard meets many of these requirements, itcannot be easily used to appraise and compensate people’s perfor-mance. As a consequence, the scorecard has been recast as a frame-work for strategic management.
� Meeting the basic requirements of performance measurement is dif-ficult because of the gap between how we would ideally measurea firm’s performance, by connecting what a firm does with its fu-ture cash flows, or nearly equivalently its long-term viability andefficiency, and how we actually measure performance, by looking atmeasures of a firm’s functioning and current financial results. Thisgap is exacerbated by a number of factors including large size, lengthylags, and inertia in organizations, by the tendency of most measuresto lose variance with use, and by the inherent difficulty of combiningdisparate functional and financial measures into an overall appraisalof performance. Much of this book concerns the fundamental proper-ties of performance measures and factors exacerbating the problemsof measuring performance.
� The performance chain and the elemental conception of the firmprovide starting points for narrowing the gap between how wewould ideally measure performance within the firm and how we cur-rently measure performance: they locate performance in the activities
18 Rethinking Performance Measurement
performed by the firm and measure performance by the cost and rev-enue consequences of these activities.
� A specific technique derived from activity-based costing, activity-based performance analysis or ABPA, is suggested as a means ofimplementing the performance chain and the elemental conception ofthe firm. ABPA measures costs and revenue consequences of activitiesand customer transactions performed throughout the firm.
� ABPA, though difficult to implement, combines fine-grained mea-surement of activities with measures of customer profitability. ABPAthus facilitates both learning about the drivers of financial perfor-mance and compensating people for bottom-line performance.
� ABPA changes how large service firms are managed. Under ABPA,the firm is organized around front-end customer units responsiblefor connecting the activities of back-end functional units and theircosts with customers who supply revenues to the firm. Firms are thusable to pursue strategies of differentiation and customer profitabilitymaximization in front-end customer units and cost minimization inback-end functional units simultaneously.
1 Why are performancemeasures so bad?
A brief detour into abstraction may help illuminate why per-formance measures are often unsatisfactory and why perfor-mance measurement often proves frustrating, especially in
large and complicated firms. Outside of the realm of business andeconomics, performance is what people and machines do: it is theirfunctioning and accomplishments. This is codified in the dictionary.For example, The Oxford English Dictionary defines performance as:
Performance. The action of performing, or something performed . . . Thecarrying out of a command, duty, purpose, promise, etc.; execution, dis-charge, fulfillment. Often antithetical to promise . . . The accomplishment,execution, carrying out, working out of anything ordered or undertaken;the doing of any action or work; working, action (personal or mechanical);spec. the capabilities of a machine or device, now esp. those of a motor ve-hicle or aircraft measured under test and expressed in a specification . . . Theobservable or measurable behaviour of a person or animal in a particular,usu. experimental, situation . . . The action of performing a ceremony, play,part in a play, piece of music, etc. . . .1
In other words, performance resides in the present (in the act of per-forming or functioning) or the past (in the form of accomplishments)and can therefore, at least in principle, be observed and measured. Per-formance is not in the future. To repeat the phrase I have italicized,performance is often “ . . . antithetical to promise.”2
Economic performance, by contrast, involves an element of antic-ipation if not promise. Following Franklin Fisher, the economic per-formance of the firm is “the magnitude of cash flow still to come,”3
discounted to present value. This definition of economic performancecan be easily generalized. Substitute efficiency for cash flow and allowdiscount rates to vary, even to fall below zero, and economic perfor-mance becomes the long-term efficiency and viability of a firm. Whatis important is that neither “cash flow still to come” nor long-term
19
20 Rethinking Performance Measurement
efficiency and viability are past actions or current accomplishments.Instead, they are outcomes of accomplishments and actions. As such,they will be revealed only as we move forward in time.
Note the tension between the dictionary definition and the economicdefinition of performance. The dictionary definition is current or back-ward looking, while the economic definition is forward looking. Thistension plays out in different ways. In the day-to-day management offirms, we use the dictionary definition of performance by setting targetsand comparing accomplishments to these targets, but we also use theeconomic definition of performance when driving measures of share-holder value into the firm. In academic research, we mix the dictionaryand economic definitions of performance. The dictionary definitionof performance is assumed where performance is measured by opera-tional measures or current financial results, but the economic definitionof performance is implicit in studies where performance is measuredby share prices.
The dictionary and the economic definitions of performance – yourpast accomplishments and current functioning, and the future benefitsresulting from accomplishments and functioning – are not tied to spe-cific performance measures. But everyday definitions of performancetend to be more restrictive and closely tied to specific measures. Forexample, we can both define and measure the performance of the firmas profitability. Or we can both define and measure the performanceof the firm as value delivered to shareholders. Alternatively, we can de-fine performance as meeting requirements in the domains of financialresults, operations, performance for the customer, and learning andinnovation, in which case performance measures correspond to score-card measures. Or we can define the performance of the firm as meetingthe requirements of diverse stakeholder groups and gauge performanceby stakeholders’ appraisals of the firm’s performance.
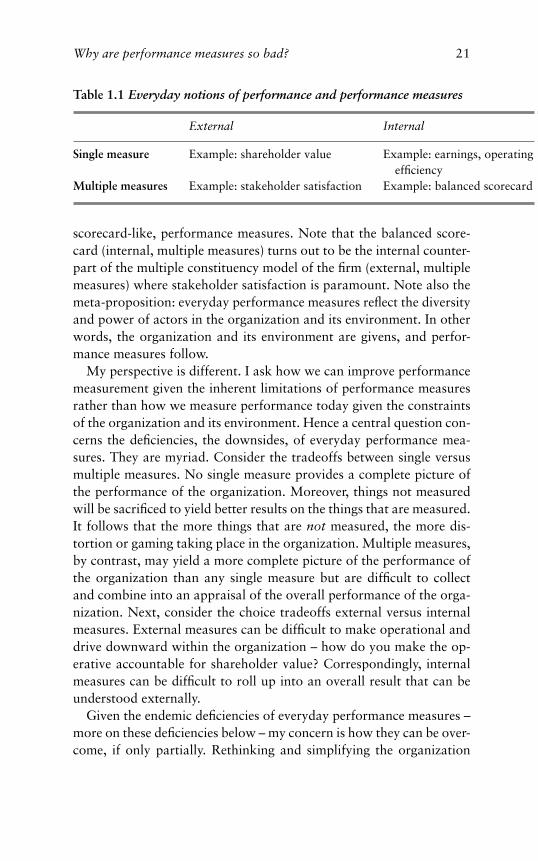
Note that we can array everyday notions of performance and per-formance measures along two dimensions, external versus internaland single versus multiple measures. The array looks something liketable 1.1. Some common-sense propositions follow from this array.One proposition is that the more constituencies (both external and in-ternal) and the greater their power, the more performance measures.It follows, for example, that organizations with more stakeholderswill have more stakeholder measures. It also follows that the largerand more differentiated the organization, the more internal, that is
Why are performance measures so bad? 21
Table 1.1 Everyday notions of performance and performance measures
External Internal
Single measure Example: shareholder value Example: earnings, operatingefficiency
Multiple measures Example: stakeholder satisfaction Example: balanced scorecard
scorecard-like, performance measures. Note that the balanced score-card (internal, multiple measures) turns out to be the internal counter-part of the multiple constituency model of the firm (external, multiplemeasures) where stakeholder satisfaction is paramount. Note also themeta-proposition: everyday performance measures reflect the diversityand power of actors in the organization and its environment. In otherwords, the organization and its environment are givens, and perfor-mance measures follow.
My perspective is different. I ask how we can improve performancemeasurement given the inherent limitations of performance measuresrather than how we measure performance today given the constraintsof the organization and its environment. Hence a central question con-cerns the deficiencies, the downsides, of everyday performance mea-sures. They are myriad. Consider the tradeoffs between single versusmultiple measures. No single measure provides a complete picture ofthe performance of the organization. Moreover, things not measuredwill be sacrificed to yield better results on the things that are measured.It follows that the more things that are not measured, the more dis-tortion or gaming taking place in the organization. Multiple measures,by contrast, may yield a more complete picture of the performance ofthe organization than any single measure but are difficult to collectand combine into an appraisal of the overall performance of the orga-nization. Next, consider the choice tradeoffs external versus internalmeasures. External measures can be difficult to make operational anddrive downward within the organization – how do you make the op-erative accountable for shareholder value? Correspondingly, internalmeasures can be difficult to roll up into an overall result that can beunderstood externally.
Given the endemic deficiencies of everyday performance measures –more on these deficiencies below – my concern is how they can be over-come, if only partially. Rethinking and simplifying the organization
22 Rethinking Performance Measurement
and its environment can remedy some of these deficiencies but not allof them. And no amount of rethinking and simplification will allowus to measure economic performance directly. This holds whether eco-nomic performance is construed narrowly as “cash flow still to come”or broadly as the long-term efficiency and viability of the organization.
Why all performance measures are second best
Performance as defined in the dictionary – accomplishments, function-ing – can be observed directly and hence quantified, compared, andappraised. But economic performance, whether revenues not yet re-alized or the long-term efficiency and viability of the organization,cannot be observed and hence cannot be measured directly because itlies in the future. Economic performance must thus be inferred frommeasurable indicators of accomplishments or functioning. The indi-cators used to make inferences about economic performance may befinancial (e.g. earnings or share prices) or non-financial (e.g. customersatisfaction). Though these indicators may predict (and if prediction isvery good, appear to promise) economic performance, they remain in-dicators from which uncertain inferences about economic performancemust be drawn rather than direct measures that gauge economic per-formance with certainty. Absent first-best measures, all measures ofeconomic performance are second best. Some second-best measures,to be sure, will be better than others, but all performance measures areflawed so long as we are trying to measure economic performance orsomething akin to it.
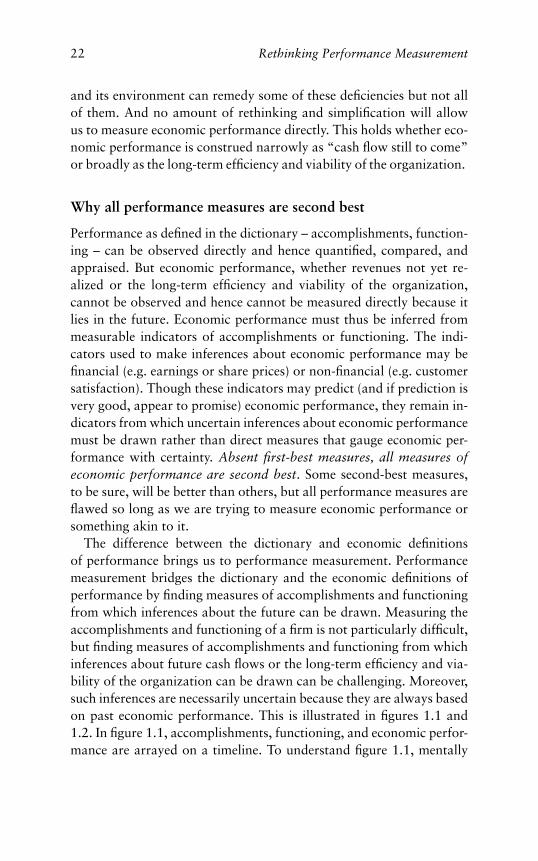
The difference between the dictionary and economic definitionsof performance brings us to performance measurement. Performancemeasurement bridges the dictionary and the economic definitions ofperformance by finding measures of accomplishments and functioningfrom which inferences about the future can be drawn. Measuring theaccomplishments and functioning of a firm is not particularly difficult,but finding measures of accomplishments and functioning from whichinferences about future cash flows or the long-term efficiency and via-bility of the organization can be drawn can be challenging. Moreover,such inferences are necessarily uncertain because they are always basedon past economic performance. This is illustrated in figures 1.1 and1.2. In figure 1.1, accomplishments, functioning, and economic perfor-mance are arrayed on a timeline. To understand figure 1.1, mentally
Why are performance measures so bad? 23
Timet�1 t
Accomplishments
EconomicperformanceFunctioning
Figure 1.1 Location in time of three types of performance
Timet�2 t�1
Accomplishments
Functioning
Economicperformance
t
Figure 1.2 Shifting the timeframe backward
plant your feet at t, which represents today. Looking backward fromt, you can observe recent accomplishments. Looking at the present,you can observe current functioning. Looking forward from t, how-ever, you cannot observe economic performance because it has not yetbeen realized. Thus, without additional information, you are unableto draw inferences about economic performance from the functioningand accomplishments of a firm.
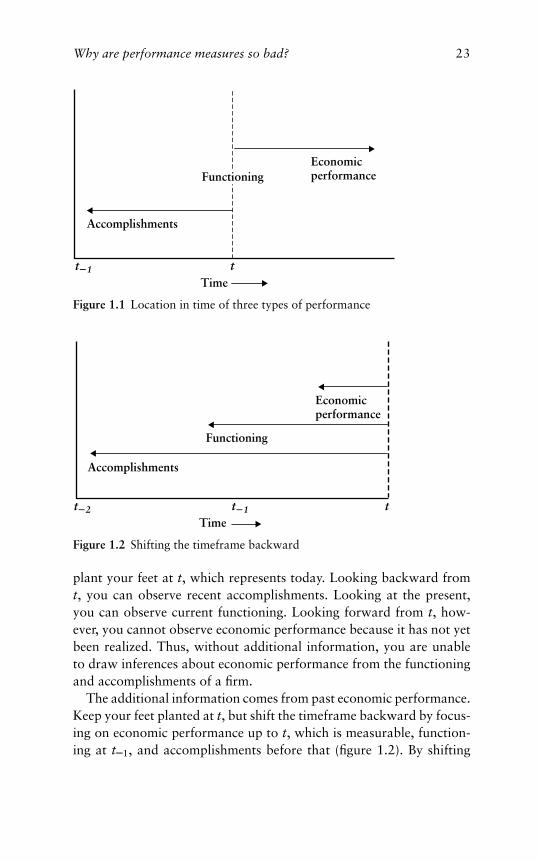
The additional information comes from past economic performance.Keep your feet planted at t, but shift the timeframe backward by focus-ing on economic performance up to t, which is measurable, function-ing at t–1, and accomplishments before that (figure 1.2). By shifting
24 Rethinking Performance Measurement
the timeframe backward in this way, you can observe and measureeconomic performance – that is, past economic performance. You canalso measure past accomplishments and functioning. Performance mea-surement, then, connects the dictionary and the economic definitionsof performance by shifting the timeframe backward and then askinghow past accomplishments (including past financial performance) andfunctioning affected subsequent economic performance.
Defined in this way, performance measurement neither measures norexplains economic performance. Instead, it draws inferences about eco-nomic performance by looking forward to the present from the vantageof the past. Economic performance, however, lies ahead. Performancemeasurement is thus always surrounded by uncertainty because it de-pends on inference rather than direct measurement and observation.The amount of uncertainty varies with the lags between measures andtheir impact on economic performance, and the volatility of the busi-ness environment. This uncertainty notwithstanding, it is critical forfirms to draw inferences about economic performance from the kinds ofperformance they can measure. Absent these inferences, firms wouldnot know how well they are doing, and capital markets would notknow how to value them. And absent these inferences, firms would beunable to improve their processes and, as a consequence, improve theireconomic performance.
It is also important to emphasize that not all measures of accomplish-ments and functioning are performance measures. The test of whethermeasures of accomplishments and functioning are also performancemeasures is this: did these measures predict economic performancein the past, and can they therefore reasonably be expected to predictfuture economic performance? Performance measurement, then, callsfor more than quantifying the accomplishments, functioning, and eco-nomic performance of a firm. It also requires inferences to be drawnabout economic performance from measured functioning and accom-plishments. Whether valid inferences about economic performancecan be drawn from the most widely used performance measures isa critical issue in performance measurement and a central issue of thisbook.
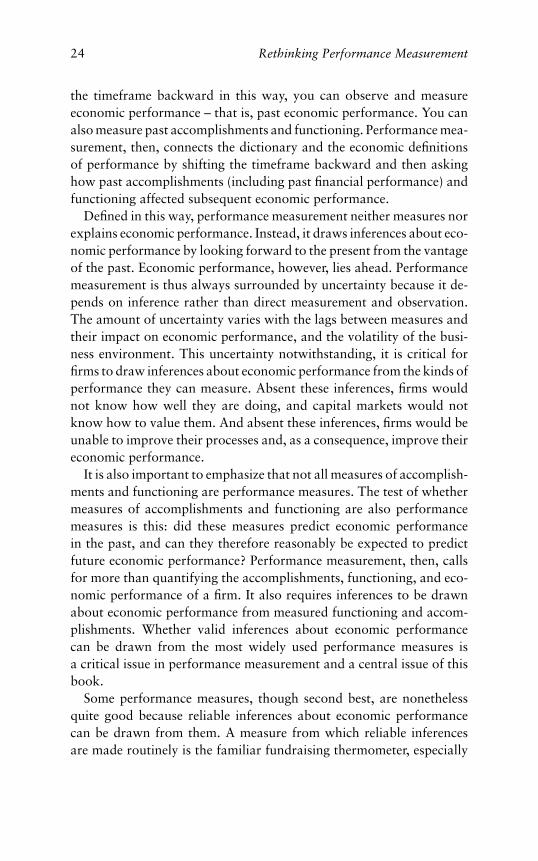
Some performance measures, though second best, are nonethelessquite good because reliable inferences about economic performancecan be drawn from them. A measure from which reliable inferencesare made routinely is the familiar fundraising thermometer, especially
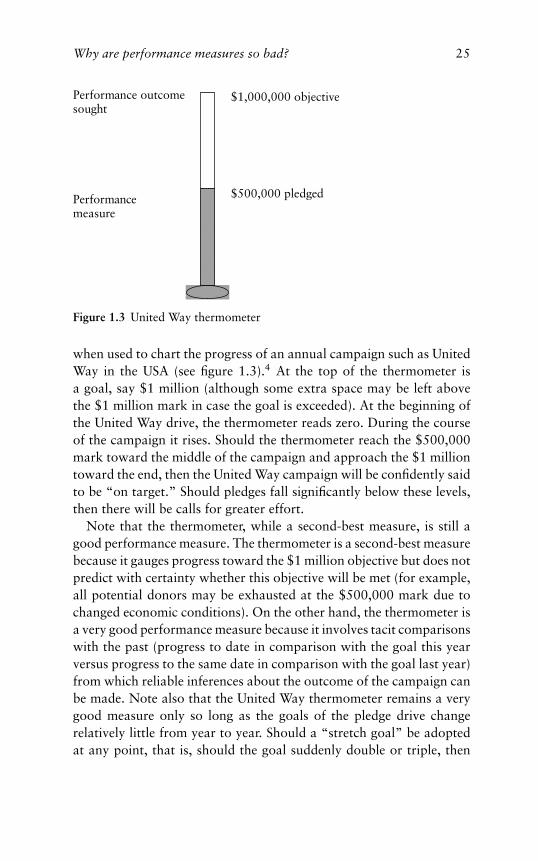
Why are performance measures so bad? 25
$1,000,000 objective
$500,000 pledged
Performance outcomesought
Performancemeasure
Figure 1.3 United Way thermometer
when used to chart the progress of an annual campaign such as UnitedWay in the USA (see figure 1.3).4 At the top of the thermometer isa goal, say $1 million (although some extra space may be left abovethe $1 million mark in case the goal is exceeded). At the beginning ofthe United Way drive, the thermometer reads zero. During the courseof the campaign it rises. Should the thermometer reach the $500,000mark toward the middle of the campaign and approach the $1 milliontoward the end, then the United Way campaign will be confidently saidto be “on target.” Should pledges fall significantly below these levels,then there will be calls for greater effort.
Note that the thermometer, while a second-best measure, is still agood performance measure. The thermometer is a second-best measurebecause it gauges progress toward the $1 million objective but does notpredict with certainty whether this objective will be met (for example,all potential donors may be exhausted at the $500,000 mark due tochanged economic conditions). On the other hand, the thermometer isa very good performance measure because it involves tacit comparisonswith the past (progress to date in comparison with the goal this yearversus progress to the same date in comparison with the goal last year)from which reliable inferences about the outcome of the campaign canbe made. Note also that the United Way thermometer remains a verygood measure only so long as the goals of the pledge drive changerelatively little from year to year. Should a “stretch goal” be adoptedat any point, that is, should the goal suddenly double or triple, then
26 Rethinking Performance Measurement
comparisons based on past experience might cease to yield reliableinferences about the current campaign.
By contrast with the United Way thermometer, promoters of mu-tual funds routinely make performance claims based on comparisonof their past financial results with the financial results of competitors.Such comparisons are intended to suggest inferences about future fi-nancial results even though they are followed by the usual disclaimerthat “past performance is not a guide to future returns.” In this case, thedisclaimer is more accurate than the inference drawn from past results –over the last two decades past results have been a very poor guide tofuture returns of mutual funds.5 Indeed, the most parsimonious modelof market behavior may be a random walk where successive pricechanges in a security are statistically independent.6 The lesson here isthat a measure, even a measure of past economic performance, doesnot contain information about current economic performance simplybecause differences exist on that measure. Rather, measures containinformation about economic performance to the extent that inferencesabout economic performance can be drawn from them. The better theseinferences, the better the measure, even though it is still a second-bestmeasure.
How size and complexity complicate performancemeasurement
Performance measurement is complicated by large size and complexityin organizations. Imagine a firm so small that it cannot be reduced tostill smaller units, a one-person, one-activity, one-product firm. Mea-sures of the firm’s functioning and its financial results describe the sameunit, one person, making it easy for this person to plot financial resultsas a function of his or her functioning and hence to draw inferencesabout economic performance from measured functioning.
Performance measurement in an entrepreneurial firm
In small firms, it can be easy to draw inferences about economic per-formance from measures of functioning. Small firms, entrepreneurialfirms especially, find it relatively easy to connect their functioning withfinancial results and hence to draw inferences about economic perfor-mance (provided, of course, they are not pioneering new technologies,in which case all bets are off).
Why are performance measures so bad? 27
Envirosystems Corporation leases sanitary waste treatment plantsto mobile home parks, schools, shopping centers, military bases, golfcourses, and large construction sites. The waste treatment business is asimple one despite the sizable dollars involved. There is no real compe-tition. The technology is stable, modularized, and highly transportable,and Envirosystems’ customers are extremely predictable. Finding cus-tomers is mainly a matter of scanning building permits for large projectsnot served by sewer mains, and then offering options to contractorsbidding on the project. Retaining customers is even easier, since leasesare non-cancelable. And the underlying economics of the business areextremely favorable: waste treatment plants have a service life of abouttwenty years, but can be depreciated in five to seven years and are oftenamortized over the initial one or two leases. Envirosystems, then, is asimple business even though its annual turnover is in the range of $100million.
Envirosystems’ owner, entrepreneur Ed Moldt operates more than200 niche businesses whose total revenues exceed $1 billion annually.He manages these businesses by tracking three to five non-financialmeasures that are leading indicators of financial performance, settingtargets on these measures, monitoring measures daily, rewarding peo-ple for performance so measured, and allowing the profits to take careof themselves. Moldt uses trial and error to find non-financial mea-sures that are leading indicators of financial performance and usuallyhits on the right measures after two or three tries. Invariably, the rightmeasures are unique to each business.7
The three performance measures Moldt uses to manage Envirosys-tems are the number of new leases, the number of terminating leases,and the number of postcards sent to consulting engineers newly listedin professional directories as specializing in sanitary waste. The num-ber of leases in force (that is, existing leases plus new leases minusterminating leases) drives short-term revenues, and hence profitabil-ity because Envirosystems’ operating costs are essentially fixed. Thenumber of postcards sent to newly listed consulting engineers driveslong-term revenues: the recipient typically files it and responds when aproject requires temporary waste treatment facilities. Moldt also tracksEnvirosystems’ profitability – “I look at the bottom line all the time.”But Moldt has found profitability to be redundant information becausethe number of new leases, terminating leases, and postcards predict rev-enues within 1–2 percent over the next five to eight years. Note thatperformance measures serve several purposes for Moldt. The number
28 Rethinking Performance Measurement
of new leases, terminating leases, and postcards look forward – theypredict revenues. The bottom line looks backward – it captures pastperformance and allows Moldt to determine which non-financial mea-sures predicted revenues. Moldt also uses measures to motivate hismanagers to perform and to compensate them for measured perfor-mance.
Performance measurement in a large firm
Drawing inferences about economic performance from measured ac-complishments and functioning is relatively easy in small firms wheremeasures are sparse to begin with, time lags are short, and organi-zational complexity does not impede intuitive mapping of measuredaccomplishments and functioning onto subsequent financial results.Large firms, however, have myriad measures, lengthy lags, and severallayers of organization (from top to bottom, the firm, business units,functional units, and work groups) separating functioning from finan-cial results. Publicly traded firms are understandably preoccupied withthe valuation of their shares in capital markets. Firms more complicatedthan Envirosystems must also track myriad non-financial measures – itis not uncommon for large firms to have upward of 1000 operationalmeasures. Inertia also increases with the size and complexity of theorganization, extending the lags between a firm’s functioning and itsfinancial results.8 Most importantly, non-financial and financial perfor-mance reside in different parts of the organization in large, complicatedfirms. Measures of functioning are scattered throughout the firm, whilefinancial results accrue to the firm as a whole and its business units.
An internal study done by a global pharmaceutical firm illustrateshow size (and, by inference, organizational complexity) affects the ac-curacy of revenue projections (and, by inference, performance measure-ment). The study plotted the accuracy of revenue forecasts for countrybusinesses as a function of their size. The measure of size was prioryear sales (in US dollars), while the measure of forecast accuracy wasthe absolute value of the percentage deviation of actual from projectedsales in the current year. The data showed that forecast accuracy de-clined sharply with size – in other words, the deviation of actual fromprojected sales increased with the size of the business. This occurredeven though the large country businesses used sophisticated modelingtools unavailable to the small businesses. There are many plausible
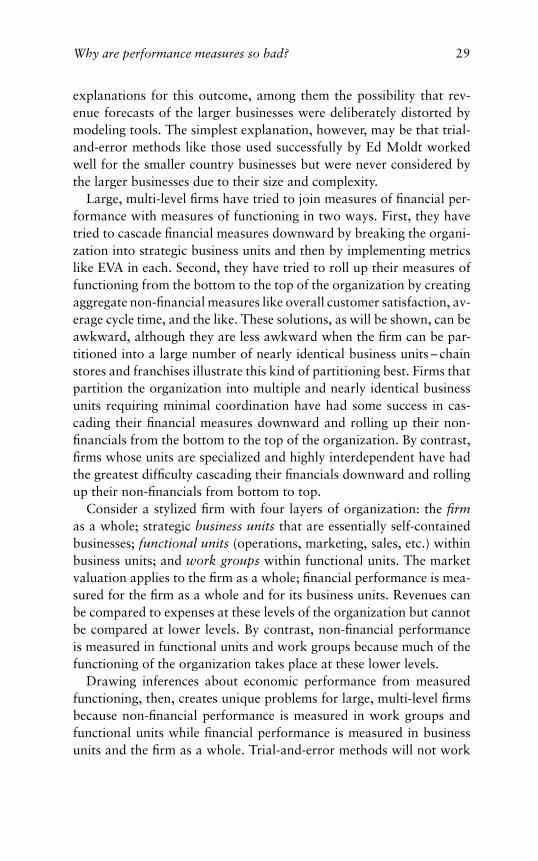
Why are performance measures so bad? 29
explanations for this outcome, among them the possibility that rev-enue forecasts of the larger businesses were deliberately distorted bymodeling tools. The simplest explanation, however, may be that trial-and-error methods like those used successfully by Ed Moldt workedwell for the smaller country businesses but were never considered bythe larger businesses due to their size and complexity.
Large, multi-level firms have tried to join measures of financial per-formance with measures of functioning in two ways. First, they havetried to cascade financial measures downward by breaking the organi-zation into strategic business units and then by implementing metricslike EVA in each. Second, they have tried to roll up their measures offunctioning from the bottom to the top of the organization by creatingaggregate non-financial measures like overall customer satisfaction, av-erage cycle time, and the like. These solutions, as will be shown, can beawkward, although they are less awkward when the firm can be par-titioned into a large number of nearly identical business units – chainstores and franchises illustrate this kind of partitioning best. Firms thatpartition the organization into multiple and nearly identical businessunits requiring minimal coordination have had some success in cas-cading their financial measures downward and rolling up their non-financials from the bottom to the top of the organization. By contrast,firms whose units are specialized and highly interdependent have hadthe greatest difficulty cascading their financials downward and rollingup their non-financials from bottom to top.
Consider a stylized firm with four layers of organization: the firmas a whole; strategic business units that are essentially self-containedbusinesses; functional units (operations, marketing, sales, etc.) withinbusiness units; and work groups within functional units. The marketvaluation applies to the firm as a whole; financial performance is mea-sured for the firm as a whole and for its business units. Revenues canbe compared to expenses at these levels of the organization but cannotbe compared at lower levels. By contrast, non-financial performanceis measured in functional units and work groups because much of thefunctioning of the organization takes place at these lower levels.
Drawing inferences about economic performance from measuredfunctioning, then, creates unique problems for large, multi-level firmsbecause non-financial performance is measured in work groups andfunctional units while financial performance is measured in businessunits and the firm as a whole. Trial-and-error methods will not work
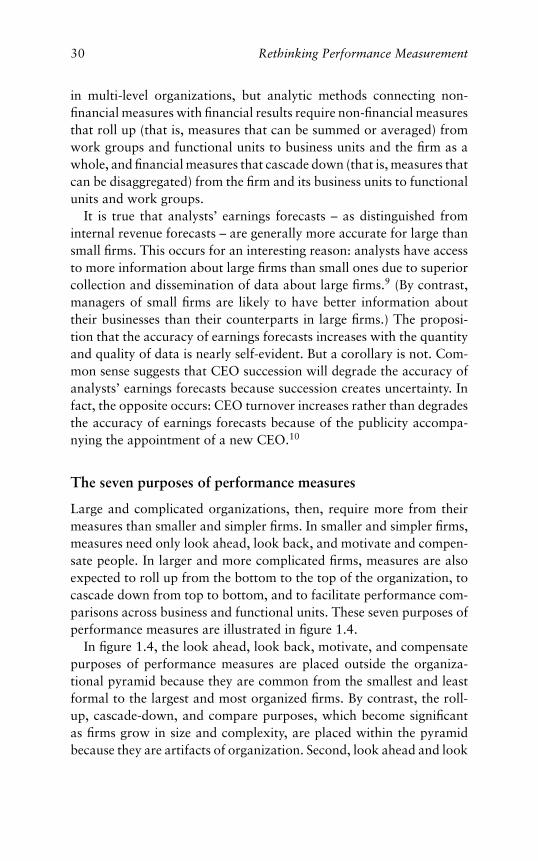
30 Rethinking Performance Measurement
in multi-level organizations, but analytic methods connecting non-financial measures with financial results require non-financial measuresthat roll up (that is, measures that can be summed or averaged) fromwork groups and functional units to business units and the firm as awhole, and financial measures that cascade down (that is, measures thatcan be disaggregated) from the firm and its business units to functionalunits and work groups.
It is true that analysts’ earnings forecasts – as distinguished frominternal revenue forecasts – are generally more accurate for large thansmall firms. This occurs for an interesting reason: analysts have accessto more information about large firms than small ones due to superiorcollection and dissemination of data about large firms.9 (By contrast,managers of small firms are likely to have better information abouttheir businesses than their counterparts in large firms.) The proposi-tion that the accuracy of earnings forecasts increases with the quantityand quality of data is nearly self-evident. But a corollary is not. Com-mon sense suggests that CEO succession will degrade the accuracy ofanalysts’ earnings forecasts because succession creates uncertainty. Infact, the opposite occurs: CEO turnover increases rather than degradesthe accuracy of earnings forecasts because of the publicity accompa-nying the appointment of a new CEO.10
The seven purposes of performance measures
Large and complicated organizations, then, require more from theirmeasures than smaller and simpler firms. In smaller and simpler firms,measures need only look ahead, look back, and motivate and compen-sate people. In larger and more complicated firms, measures are alsoexpected to roll up from the bottom to the top of the organization, tocascade down from top to bottom, and to facilitate performance com-parisons across business and functional units. These seven purposes ofperformance measures are illustrated in figure 1.4.
In figure 1.4, the look ahead, look back, motivate, and compensatepurposes of performance measures are placed outside the organiza-tional pyramid because they are common from the smallest and leastformal to the largest and most organized firms. By contrast, the roll-up, cascade-down, and compare purposes, which become significantas firms grow in size and complexity, are placed within the pyramidbecause they are artifacts of organization. Second, look ahead and look
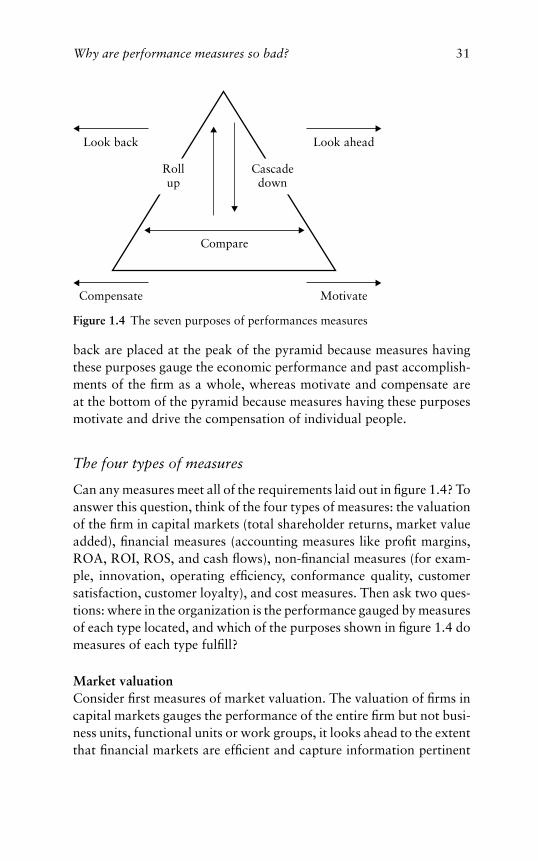
Why are performance measures so bad? 31
Rollup
Cascadedown
Compare
Look back Look ahead
MotivateCompensate
Figure 1.4 The seven purposes of performances measures
back are placed at the peak of the pyramid because measures havingthese purposes gauge the economic performance and past accomplish-ments of the firm as a whole, whereas motivate and compensate areat the bottom of the pyramid because measures having these purposesmotivate and drive the compensation of individual people.
The four types of measures
Can any measures meet all of the requirements laid out in figure 1.4? Toanswer this question, think of the four types of measures: the valuationof the firm in capital markets (total shareholder returns, market valueadded), financial measures (accounting measures like profit margins,ROA, ROI, ROS, and cash flows), non-financial measures (for exam-ple, innovation, operating efficiency, conformance quality, customersatisfaction, customer loyalty), and cost measures. Then ask two ques-tions: where in the organization is the performance gauged by measuresof each type located, and which of the purposes shown in figure 1.4 domeasures of each type fulfill?
Market valuationConsider first measures of market valuation. The valuation of firms incapital markets gauges the performance of the entire firm but not busi-ness units, functional units or work groups, it looks ahead to the extentthat financial markets are efficient and capture information pertinent
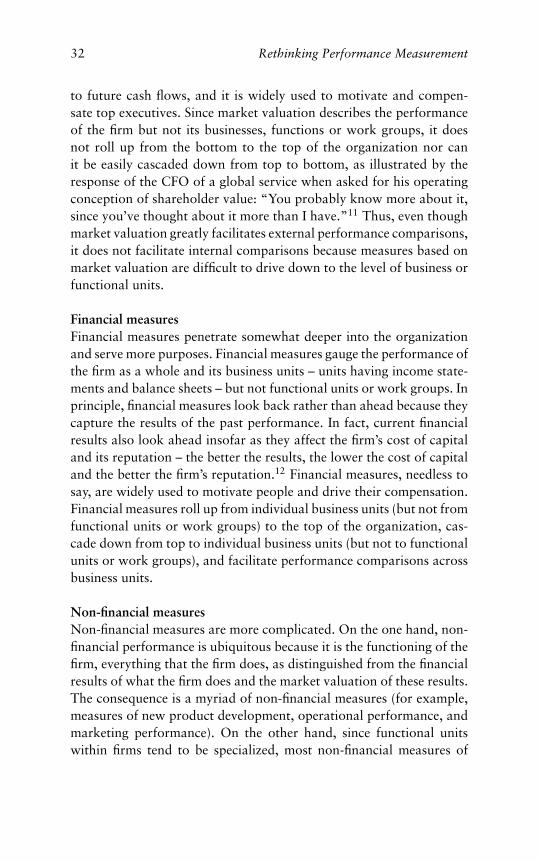
32 Rethinking Performance Measurement
to future cash flows, and it is widely used to motivate and compen-sate top executives. Since market valuation describes the performanceof the firm but not its businesses, functions or work groups, it doesnot roll up from the bottom to the top of the organization nor canit be easily cascaded down from top to bottom, as illustrated by theresponse of the CFO of a global service when asked for his operatingconception of shareholder value: “You probably know more about it,since you’ve thought about it more than I have.”11 Thus, even thoughmarket valuation greatly facilitates external performance comparisons,it does not facilitate internal comparisons because measures based onmarket valuation are difficult to drive down to the level of business orfunctional units.
Financial measuresFinancial measures penetrate somewhat deeper into the organizationand serve more purposes. Financial measures gauge the performance ofthe firm as a whole and its business units – units having income state-ments and balance sheets – but not functional units or work groups. Inprinciple, financial measures look back rather than ahead because theycapture the results of the past performance. In fact, current financialresults also look ahead insofar as they affect the firm’s cost of capitaland its reputation – the better the results, the lower the cost of capitaland the better the firm’s reputation.12 Financial measures, needless tosay, are widely used to motivate people and drive their compensation.Financial measures roll up from individual business units (but not fromfunctional units or work groups) to the top of the organization, cas-cade down from top to individual business units (but not to functionalunits or work groups), and facilitate performance comparisons acrossbusiness units.
Non-financial measuresNon-financial measures are more complicated. On the one hand, non-financial performance is ubiquitous because it is the functioning of thefirm, everything that the firm does, as distinguished from the financialresults of what the firm does and the market valuation of these results.The consequence is a myriad of non-financial measures (for example,measures of new product development, operational performance, andmarketing performance). On the other hand, since functional unitswithin firms tend to be specialized, most non-financial measures of
Why are performance measures so bad? 33
functioning will not apply across units having different functions (forexample, measures gauging the speed of new product developmentwill not apply to manufacturing and marketing units) and cannot eas-ily be compared across functional units or combined into measuressummarizing the performance of these units. The consequence is thefollowing: first, non-financial measures gauge the performance of func-tional units but not the performance of its business units or of the firmas a whole. Second, non-financial measures capturing the functioningof the firm may or may not, depending on the measure, look aheadto future cash flows. In other words, some but not all non-financialmeasures look ahead, and there are no hard-and-fast rules for distin-guishing non-financials that look ahead from those that do not. Third,non-financial measures believed to look ahead to future cash flowsare used to motivate and compensate people – one would not moti-vate and compensate people on non-financial measures not believedto look ahead unless they were absolute “must-dos” such as safety.Fourth, most non-financial measures cannot easily be rolled up fromthe bottom to the top of the organization or cascaded down from topto bottom. Generally, the more specific the information about the firm’sfunctioning contained in a non-financial measure, the more difficult itis to roll it up or cascade it down.13 Fifth, non-financial measures canfacilitate internal performance comparisons provided the same func-tion is carried out at several points in the organization. Non-financialmeasures can also facilitate external comparisons where benchmarkdata are available.
Cost measuresCost measures are limited in comparison with other types of measuresbecause they measure performance incompletely – performance is moreclosely approximated by revenues in comparison with costs rather thanby costs alone. Costs look back in the sense that costs tell you whatyou have spent. The trajectory of costs, of course, looks ahead. Failureto control costs will have adverse consequences for the organization.Cutting costs can have either favorable or unfavorable consequencesdepending on which costs are cut – chapter 4 begins with a case wherecutting costs by eliminating the quality function would have had dis-astrous consequences for the organization. And costs are not normallyused to motivate or to compensate people, although they can be so usedwhen cost control is critical. Cost measures do have two interesting
34 Rethinking Performance Measurement
properties, however. First, costs penetrate the organization more deeplythan other types of measures. Costs can be readily rolled up from theworking level of the organization to the top and cascaded down fromtop to the working level, even though hard and fast rules for allocatingcosts do not always exist. Indeed, activity-based costing allows coststo be disaggregated to the level of individual activities performed bythe firm. And costs can be compared laterally across any level of theorganization regardless of the functions performed at that level.
Comparing the four types of measures
Table 1.2 compares the four types of performance measures with re-spect to where performance they measure is located in the organizationand the purposes served by measures of each type. The table shows thatmeasures that actually or potentially look ahead – measures from whichinferences about economic performance can be drawn – usually do notroll up or cascade down the organization. Specifically, the market val-uation of the firm does not cascade down the organization easily, andmeasures of the firm’s functioning do not roll up easily. As a result,it is difficult to find measures applying across different levels of theorganization from which inferences about economic performance canbe made. Financial measures look ahead only in the short term, rollup from business units to the firm as a whole and cascade down fromthe firm to business units, but do not penetrate to functional units andwork groups. Some non-financial measures look ahead, although manydo not, and most have neither roll-up nor cascade-down capability.Finally, cost measures do not look ahead, although the trajectory ofcosts does, and can be easily rolled up from work groups to functionalunits, business units, and the firm as a whole and cascaded down fromthe firm to work groups.
Given that all measures have strengths and limitations, managerswould like guidance as to what kinds of measures are best. What ev-idence there is does not provide a great deal of guidance. On the onehand, analysts’ earnings forecasts often ignore basic information con-tained in financial statements14 as well as more sophisticated measureslike EVA,15 current dividends,16 competitors’ earnings,17 and the like.On the other hand, according to research done by Ernst & Young’sCenter for Business Innovation, analysts tend to weight non-financialmeasures more heavily than is generally supposed, but the weights
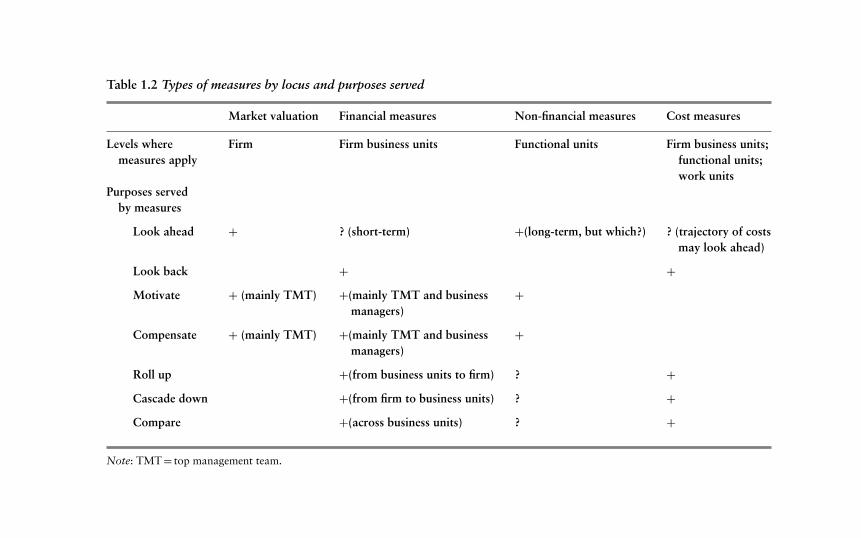
Table 1.2 Types of measures by locus and purposes served
Market valuation Financial measures Non-financial measures Cost measures
Levels where Firm Firm business units Functional units Firm business units;measures apply functional units;
work unitsPurposes served
by measures
Look ahead + ? (short-term) +(long-term, but which?) ? (trajectory of costsmay look ahead)
Look back + +Motivate + (mainly TMT) +(mainly TMT and business +
managers)
Compensate + (mainly TMT) +(mainly TMT and business +managers)
Roll up +(from business units to firm) ? +Cascade down +(from firm to business units) ? +Compare +(across business units) ? +
Note: TMT = top management team.
36 Rethinking Performance Measurement
attached to different non-financial measures vary dramatically from in-dustry to industry. For example, strength in new product developmentis weighted more heavily in pharmaceuticals than in other industries.Moreover, the greater the importance of intangible assets, as in tech-nology and internet-related industries, the more weight is attached tonon-financial measures.18
The paradox of large organizations
All of this translates readily into managerial language. Managers expectmeasures to look ahead so that inferences about economic performancecan be drawn from them. Managers also expect measures to roll upand cascade down the organization so that people at different levelswill act in concert. (This is called alignment or “line of sight.”) Thisanalysis suggests that the types of measures that look ahead – mainlymarket valuation and non-financial measures – tend not to have roll-up and cascade-down capability, whereas measures having roll-up andcascade-down capability – mainly financial and cost measures – tendnot to look ahead. This then is the paradox of large organizations.Firms grow because they are successful, but as they grow they specializeinternally. The result of specialization is that many kinds of functioningand many measures of functioning are dispersed throughout the orga-nization. In order to make inferences about economic performance,these dispersed measures of functioning must somehow be connectedwith financial results accruing at the level of the firm or its businessunits. While it is possible to draw inferences about economic perfor-mance from the measured functioning of small firms, as the case ofEnvirosystems shows, this becomes much more difficult as firms growin size and complexity and their functioning no longer takes place inthe units where financial results accrue.
At this point, it may be useful to go back to the United Way ther-mometer in figure 1.3 and ask why large firms cannot operate like aUnited Way drive by setting a specific goal, measuring progress towardthis goal at all levels of the organization, and holding individual peo-ple accountable for progress toward this goal; in other words, whydo large firms have difficulty following the precepts of textbook mo-tivation theory when deciding performance measures? There are tworeasons. First, like the United Way drive, firms can set only short-term,measurable objectives to motivate people, whereas unlike the $1m
Why are performance measures so bad? 37
objective of the United Way campaign, the economic performance firmsseek extends into the future and is beyond measurement. Second, likethe United Way drive, firms would like to cascade measures from thetop to the bottom of the organization, but unlike the United Way drivefirms find this very difficult to do because of the complexity of the orga-nization itself – it is difficult, for example, to find measures connectingwhat front-line workers do with shareholder value.
We yearn for simplicity in performance measurement. But we alsoseek the benefits of specialization and construct complex organizationsto reap these benefits. Thus, while finding performance measures thatlook ahead, look back, motivate, compensate, roll up, cascade down,and facilitate performance comparisons is relatively easy in settingslike the United Way where objectives are short-term and specific, it is amuch more daunting task in organizations seeking long-term economicperformance that are of substantially greater size and complexity.
How firms have sought to improve measurement
The paradox of large organizations – firms succeed, grow, specialize in-ternally, disperse their functioning, and then find it difficult to connectmeasures of functioning with financial results and long-term economicperformance – is at the core of the performance measurement prob-lems many firms experience. Few firms, however, recognize the extentto which the requirements of organization have contributed to theperformance measurement problem. They view the problem as mea-surement, and the solution as finding better measures. Specifically, theylook for measures of market valuation and financial measures that canbe readily cascaded down from the top of the organization, and non-financial measures that can be rolled up from bottom to top just asreadily to link non-financial measures with bottom-line financial re-sults.
Driving financial measures downward
Firms have persistently tried to drive financial measures to the lowestpossible level of the organization. This effort began in the 1920s whenlarge firms such as General Motors and DuPont replaced their unitaryorganizations with multiunit organizations that divided the larger firminto business units responsible for bottom-line performance. By the
38 Rethinking Performance Measurement
1960s, reorganization of the firm along the lines of the multiunit waswidely accepted as the solution to the problems of measuring opera-tional efficiency and promoting efficiency in the allocation of capital,and few unitary organizations remained.
The multiunit firm as a tracking mechanismIn unitary firms, the central office coordinated the activities of func-tional subunits such as manufacturing and sales, tracked costs andoperational performance in detail, but had no common measures withwhich to compare the performance of subunits. In multiunit firms, bycontrast, the central office coordinated strategic planning, monitoredthe performance of subunits engaged in different lines of business us-ing common financial measures, and allocated capital to business unitsbased on financial performance. In effect, the central office managedthe firm as an internal capital market, one potentially more efficientthan external capital markets because of its power to inspect and, ifnecessary, intervene in individual business units. Figure 1.5 comparesthe organization and performance measures of primitive unitary andmultiunit firms. The unitary firm shown in figure 1.5 has three func-tions, purchasing, production, and sales, while the multiunit firm hasthree business units (whether units differ by product, geography, orcustomers is immaterial), each having the same functions as the uni-tary organization. (Staff functions such as accounting are omitted forthe sake of simplicity.) The performance measures available to theseprimitive firms differ dramatically. In the unitary firm, there are sev-eral measures, none common to all three units. The performance of thepurchasing function is gauged by costs and availability of raw materi-als; the performance of manufacturing is gauged by capacity utilization,down time, and defects; and sales performance is gauged by gross salesless returns. Absent common measures, there is no way to compare theperformance of the purchasing, manufacturing, and sales units, there isno rational way to allocate resources among these units, and the firm’sperformance suffers as a consequence.
Consider now the multiunit firm. Because multiunits have commonperformance measures, revenues and earnings in figure 1.5, perfor-mance can be compared across business units, resources can be al-located rationally among units, and the performance of the firm isenhanced as a consequence. As Oliver Williamson has observed: “Theorganization and operation of the large enterprise along the lines of
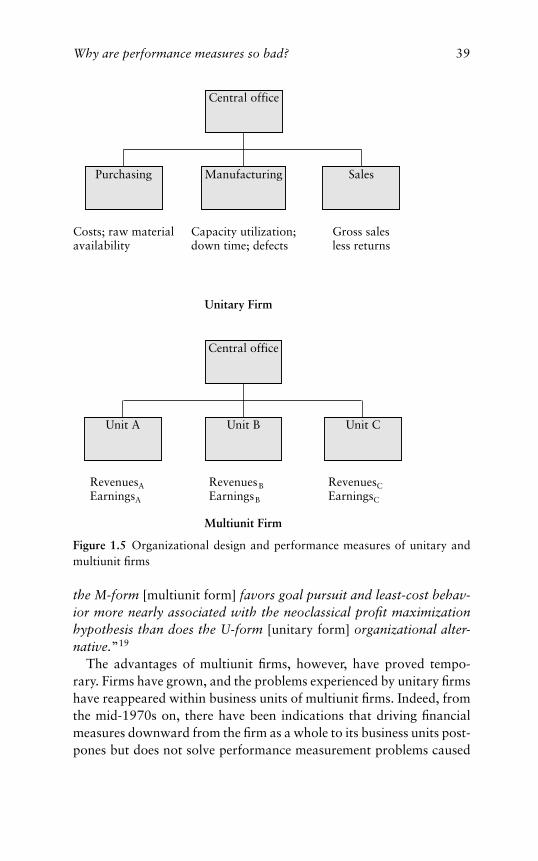
Why are performance measures so bad? 39
Central office
Manufacturing SalesPurchasing
Costs; raw materialavailability
Capacity utilization;down time; defects
Gross salesless returns
Central office
Unit B Unit CUnit A
RevenuesAEarningsA
RevenuesBEarningsB
RevenuesCEarningsC
Unitary Firm
Multiunit Firm
Figure 1.5 Organizational design and performance measures of unitary andmultiunit firms
the M-form [multiunit form] favors goal pursuit and least-cost behav-ior more nearly associated with the neoclassical profit maximizationhypothesis than does the U-form [unitary form] organizational alter-native.”19
The advantages of multiunit firms, however, have proved tempo-rary. Firms have grown, and the problems experienced by unitary firmshave reappeared within business units of multiunit firms. Indeed, fromthe mid-1970s on, there have been indications that driving financialmeasures downward from the firm as a whole to its business units post-pones but does not solve performance measurement problems caused
40 Rethinking Performance Measurement
by large size and complexity. In 1976, Louis Gerstner (former chairmanof IBM) and A. Helen Anderson argued that the financial measures usedto gauge the performance of business units were artificially constructedand possibly worthless:
In many corporations during the 1960s . . . earnings per share – on a yearly,quarterly, or even monthly basis – was the name of the game . . . Today, manyof these same companies recognize that short-term EPS data can be mislead-ing as an index of a company’s true strength and, by the same token, that asomewhat arbitrarily constructed profit figure may be worthless as a perfor-mance measure for a department or division of a decentralized organization.In short, measuring current profit performance, though obviously still im-portant, is no longer sufficient. This is why a growing number of companieshave begun to monitor a broader set of variables: in particular, asset intensity,return on investment, and non-accounting data.20
Today, of course, dissatisfaction with performance measures isendemic – most measures are believed deficient, not just business-unitlevel financial measures.
Economic value addedFrom the beginning of the stock market boom in the early 1980s on-ward there have also been efforts to drive market valuation from thelevel of the firm to business units and below. Few firms attempt to disag-gregate the market valuation of their shares into market valuations fortheir business units. Many firms do, however, attempt to compare therates of return generated by their business units with market rates of re-turn. The measure that has gained the widest acceptance in the businesscommunity because it appears to come closest to measuring whetherreturns are above, at, or below market is economic value added orEVA, which has been trademarked by Stern, Stewart & Co. Joel Stern,a principal of Stern, Stewart, argues that EVA offers a better measureof returns relative to the market or residual income than conventionalaccounting measures:
Incentivizing management to increase shareholder value means nothing tomanagement unless the executives understand how value is created. Share-holder value depends largely on two basic factors: (1) the rate of returnearned on total investor capital relative to the required rate of return, knownas the “cost of capital,” and (2) the amount of investor capital tied up in thebusiness.
Why are performance measures so bad? 41
Shareholder value is created only when the rate of return on capital (r)exceeds the cost of that capital (c). The precise amount of value added isequal to the amount of total capital invested (TC) multiplied by the differencebetween r and c. In essence, this is best described as “residual income” – theonly internal measure of corporate performance to tie directly to value. Welike to refer to it as economic value added (EVA).21
The two key components of EVA, earnings and capital costs, are pub-licly available. What renders EVA unique is an adjustment of earningsthat involves up to 160 factors, the comparison of adjusted earningswith capital costs, and the ranking of firms by EVA in Stern, Stewart’s“Performance 1000.” EVA has drawn many encomiums from the busi-ness press. In 1993, for example, Fortune proclaimed EVA “the realkey to creating wealth.”22 More recently, Fortune announced that EVAhas displaced EPS as the critical performance metric for many firms:
For years, earnings per share has been the most popular girl at the party . . .Hundreds of companies, from AT&T to Brahma Beer, have renounced EPSand her whole GAAP family as a means of measuring performance . . . WallStreet, no slouch, is also jumping on the bandwagon: CS First Boston hastrained its research staff in EVA analysis, and Goldman Sachs is about tointroduce EVA . . .23
While EVA measures residual income rather than earnings, it is notclear that EVA contains information about economic performance notcontained in earnings or standard financial ratios like return on as-sets (ROA). The small number of academic studies now available sug-gest that EVA contains little unique information. Using Stern, Stewart’s“Performance 1000” data, Gary Biddle, Robert Bowen and James Wal-lace find, for example, that earnings are better predictors of share valuesthan EVA: “all of the evidence points to earnings having at least equal(and often higher) relative information content [than EVA].”24 JamesL. Dodd and Shimin Chen, also using the Stern, Stewart database, re-port that while EVA is somewhat predictive of share prices, ROA is amuch better predictor.25 The problem with EVA appears not to be sus-ceptibility to short-run manipulation of its earnings component since,according to Dodd and Chen, earnings and ROA are subject to thesame manipulations. It remains possible, of course, that EVA looksforward to future cash flows better than current earnings or ROA, butits failure to predict share prices as well as accounting ratios like ROAsuggests that it may not.
42 Rethinking Performance Measurement
Placing non-financial measures on an equal footing withfinancial measures
Paralleling efforts to drive financial measures downward, firms havetried to place non-financial measures – measures gauging a firm’sfunctioning, including operational measures, marketing measures, andcustomer measures – on an equal footing with financial measures.Increased top-level attention to non-financial measures has been moti-vated by the belief that both financial and non-financial measurementare needed to convey the full picture of the firm’s performance.
The balanced scorecard approachThe initial impetus for non-financial measurement came from the qual-ity movement and, in particular, the Malcolm Baldrige award competi-tion, which encouraged firms to measure and report employee morale,product quality, and customer satisfaction. More recently, the impetusfor non-financial measurement has come from Kaplan and Norton’snotion of the balanced scorecard, where balance is defined as measure-ment in the domains of innovation, internal process, customer satisfac-tion, and financial performance. The balanced scorecard is particularlysignificant because it has diffused rapidly and is now used for purposesother than those originally intended. Although the scorecard was con-ceived as a means of communicating the firm’s strategy rather than asa template for performance measurement, today the scorecard domi-nates discussions of performance measurement, and compensation isroutinely based on scorecard measures. Chapter 3 will look at the useof the balanced scorecard in compensation.26
Business models of performanceIn order to place non-financial measures on an equal footing with finan-cial measures, firms have had to construct business models sketchingplausible linkages between financial and non-financial performance.To illustrate a fairly complicated business model: product quality in-creases customer satisfaction, which contributes to market share; mar-ket share, in turn, promotes profitability through increased revenuesand decreased unit costs; and profitability improves share prices, yield-ing gains in employee commitment and investment and hence gains inproduct quality.27 Business models of performance need not be circular
Why are performance measures so bad? 43
as in this instance but may, instead, may be sequential and terminatewith an outcome state such as shareholder value. Whether circular orsequential, business models usually specify relationships among con-structs such as product quality and customer satisfaction. These con-structs assume that the non-financial performance of a firm can bereduced to a relatively small number of constructs and summary mea-sures of these constructs.
It turns out that the constructs used in even the simplest businessmodels raise some subtle but very important performance measure-ment issues. A business model used by Sears, Roebuck and Companycalled the employee-customer profit chain illustrates these issues.28 Theidea motivating the employee-customer profit chain was that Sears’profitability depended on its being a compelling place to work and acompelling place to shop. The model reduced to a formula: work ×shop= invest. Measures of employee satisfaction and customer satis-faction were used to gauge whether Sears was a compelling place towork and shop. An initial set of seventy employee measures was re-duced to ten measures and two constructs – six measures of attitudeabout the job (e.g. “I like the kind of work I do”), and four measuresof attitude about the company (e.g. “I feel good about the future ofthe company”) – assumed to reflect the quality of management becausethey predicted employee behaviors associated with customer satisfac-tion. The model was predictive of financial outcomes for 800 Searsstores over two quarters. An increase in employee attitudes of 5 unitsled to a 1.3 unit increase in customer satisfaction which, in turn, pro-duced a 0.5 percent increase in revenue growth.29 The model wasalso folded into Sears’ compensation plan. Beginning in 1996, long-term incentives were based one-third on employee satisfaction, one-third on customer satisfaction, and one-third on traditional investormeasures.
The performance measurement issue raised by Sears’ employee-customer profit chain is this: employee satisfaction and customer sat-isfaction are performance measures in that they carry implications forSears’ economic performance. Sears’ business results leave no doubtabout that, at least for the stores and the time period covered by theresearch. But the performance – performance as defined in the dictio-nary – that adds value for customer, and hence profits Sears, is notemployee and customer satisfaction. This performance, instead, lies in
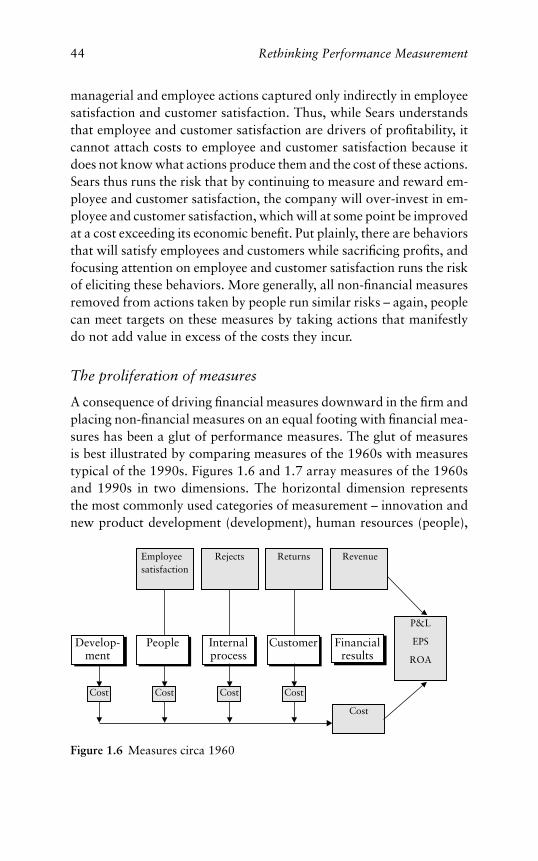
44 Rethinking Performance Measurement
managerial and employee actions captured only indirectly in employeesatisfaction and customer satisfaction. Thus, while Sears understandsthat employee and customer satisfaction are drivers of profitability, itcannot attach costs to employee and customer satisfaction because itdoes not know what actions produce them and the cost of these actions.Sears thus runs the risk that by continuing to measure and reward em-ployee and customer satisfaction, the company will over-invest in em-ployee and customer satisfaction, which will at some point be improvedat a cost exceeding its economic benefit. Put plainly, there are behaviorsthat will satisfy employees and customers while sacrificing profits, andfocusing attention on employee and customer satisfaction runs the riskof eliciting these behaviors. More generally, all non-financial measuresremoved from actions taken by people run similar risks – again, peoplecan meet targets on these measures by taking actions that manifestlydo not add value in excess of the costs they incur.
The proliferation of measures
A consequence of driving financial measures downward in the firm andplacing non-financial measures on an equal footing with financial mea-sures has been a glut of performance measures. The glut of measuresis best illustrated by comparing measures of the 1960s with measurestypical of the 1990s. Figures 1.6 and 1.7 array measures of the 1960sand 1990s in two dimensions. The horizontal dimension representsthe most commonly used categories of measurement – innovation andnew product development (development), human resources (people),
Employeesatisfaction
Returns RevenueRejects
P&L
EPS
ROA
Cost
Financialresults
CustomerInternalprocess
Cost CostCostCost
PeopleDevelop-ment
Figure 1.6 Measures circa 1960
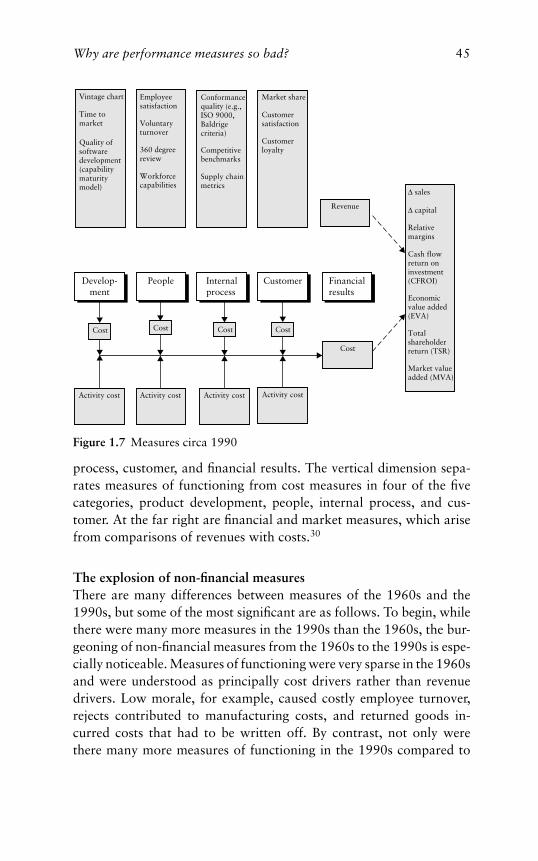
Why are performance measures so bad? 45
Cost
Activity costActivity costActivity costActivity cost
Develop-ment
Conformancequality (e.g.,ISO 9000,Baldrigecriteria)
Competitivebenchmarks
Supply chainmetrics
Vintage chart
Time tomarket
Quality ofsoftwaredevelopment(capabilitymaturitymodel)
Employeesatisfaction
Voluntaryturnover
360 degreereview
Workforcecapabilities
Market share
Customersatisfaction
Customerloyalty
∆ sales
∆ capital
Relativemargins
Cash flowreturn oninvestment(CFROI)
Economicvalue added(EVA)
Totalshareholderreturn (TSR)
Market valueadded (MVA)
Cost
Revenue
Financialresults
CustomerPeople Internalprocess
CostCostCost
Figure 1.7 Measures circa 1990
process, customer, and financial results. The vertical dimension sepa-rates measures of functioning from cost measures in four of the fivecategories, product development, people, internal process, and cus-tomer. At the far right are financial and market measures, which arisefrom comparisons of revenues with costs.30
The explosion of non-financial measuresThere are many differences between measures of the 1960s and the1990s, but some of the most significant are as follows. To begin, whilethere were many more measures in the 1990s than the 1960s, the bur-geoning of non-financial measures from the 1960s to the 1990s is espe-cially noticeable. Measures of functioning were very sparse in the 1960sand were understood as principally cost drivers rather than revenuedrivers. Low morale, for example, caused costly employee turnover,rejects contributed to manufacturing costs, and returned goods in-curred costs that had to be written off. By contrast, not only werethere many more measures of functioning in the 1990s compared to
46 Rethinking Performance Measurement
the 1960s, but measures of functioning were also understood differ-ently, as leading indicators of revenues rather than as drivers of costs.To illustrate: time to market was believed to predict profit margins (theless time to market, the higher the margins), the ratio of new productsto all products shown on vintage charts was believed to predict thesustainability of profits, and employee satisfaction was believed to con-tribute to customer satisfaction, the latter understood as an indicatorof the firm’s reputation and hence a predictor of the volume of bothnew and repeat business.
The preoccupation with market valuationA comparison of figures 1.6 and 1.7 reveals another significant changein measures from the 1960s to the 1990s: the shift toward measurescapturing the market valuation of the firm and financial measures be-lieved to influence market valuation. Two key market valuation mea-sures used in the 1990s were total shareholder return (TSR), dividendsplus appreciation as a percentage of market valuation at the beginningof the period, and market value added (MVA), the difference betweenthe market’s current valuation of the firm and the firm’s historical cap-ital investment.31 EVA, already discussed, and cash flow return oninvestment (CFROI), cash flows relative to the inflation-adjusted costof capital, are residual income measures that in theory if not in practicegauge performance relative to capital costs and should be reflected inmarket valuations. Relative margins reflect a firm’s advantage or disad-vantage vis-a-vis competitors, growth of capital indicates the trajectoryof capital costs that will impair or improve performance depending onthe rate of return on capital, and sales growth reflects the trajectory ofthe business.
The emphasis on costsAnother change from the 1960s to the 1990s was the introduction ofactivity-based costing (ABC), especially in manufacturing. ABC drovecosting very deeply into the organization by identifying the actual costsof labor, equipment, and premises associated with each activity per-formed by the firm rather than relying on arbitrary formulas to allo-cate overhead. We will look closely at ABC and its implications forperformance measurement in chapter 4.
Why are performance measures so bad? 47
The compression principle in measurement
Taken singly, most of the measures of the 1990s make sense. Together,however, they may not. Measurement is not measuring more. Measure-ment, rather, compresses or condenses information by ordering whatwould otherwise be unordered bits of data so as to focus on criticalproperties of the object at hand. This principle can be demonstratedby considering the infinite number of points on a line. When we mea-sure the length of the line, we are concerned only with the distancebetween the two end points. Nothing else is relevant – neither the dis-tance between the other points nor the location of the line – that is, thelocation of its infinite points in space – is relevant to its length. NewYork Times science writer George Johnson explains the compressionprinciple as follows: “We partition the universe into an area of interestand an environment to which we can banish excess information. Andso we can make rough predictions. Iguses [information-gathering-and-utilizing systems] exist by virtue of this myopia, this inherent inabilityto keep track of every detail . . . If you know everything, you knownothing.”32 The compression principle is also understood by consul-tants who view the proliferation of measures shown in figures 1.6 and1.7 as evidence of “measurement disintegration,” that is, our capacityto produce performance measures faster than we can distinguish thosemeasures containing information about economic performance fromthose that do not.33
The challenge of simplifying measurement
Performance measurement, as we have seen, involves making inferencesabout economic performance, which cannot be observed and measuredbecause it lies ahead, from what can be observed and measured. Suchinferences are needed for firms to appraise how well they are doing andto improve what they are doing, and for capital markets to value firms.In order to make such inferences we are compelled to rely on past expe-rience, which means that our inferences about economic performancegoing forward will always be uncertain. This uncertainty means thatwe can never be confident that we have the right measures. Uncertaintyis endemic in performance measurement, and there is very little we cando about it.
48 Rethinking Performance Measurement
Our ability to make inferences about economic performance is lim-ited by two further factors: the vast array of performance measures thatnow exist and the difficulty of cascading standard financial measuresfrom the top to the bottom of the organization while rolling up a largenumber of non-financial measures from the bottom to the top. Theseproblems are minimal in firms that have few layers and the ability touse trial-and-error methodology to converge on a few non-financialpredictors of financial results quickly. Envirosystems, which is smalland highly focused, illustrates this type of firm. These problems canalso be minimized in large, multi-layered firms provided they can bepartitioned into large numbers of similar business units with commonperformance measures. Sears, whose 800 retail outlets use standardmeasures of employee and customer satisfaction, is an example of thistype of firm.
Firms that are larger and less focused than Envirosystems and can-not be partitioned into hundreds of similar business units like Searsface the challenge of simplifying their measures – of compressing manymeasures into few – before they can begin to make reasonable infer-ences about their economic performance from what they can measure.This simplification will occur in one of two ways. Some large firmswill devolve into smaller, nimbler firms like Envirosystems or will bereplaced by smaller, nimbler firms. Firms that remain large in order torealize scale or scope economies, for example, consumer product andfinancial service firms, may take a very different path by partitioningthemselves into units that are minuscule in comparison with the unitsnow shown on organization charts and then applying common mea-sures to these units. As suggested in the introduction, this partitioningmight take place activity by activity and customer by customer pro-vided that revenues and costs can be linked at the level of activities andcustomers. In chapters 4 and 5 we will examine whether these link-ages can be established, specifically whether revenues can be assignedto activities and costs assigned to customers once activity costs andcustomer revenues are known.
Before addressing this issue, chapters 2 and 3 will explore othervulnerabilities of performance measures that compound the problemof making inferences about economic performance from what we canmeasure. One vulnerability lies in what people do to measures. Al-most all conventional performance measures are susceptible to runningdown, that is, loss of variance, which ultimately makes it difficult to
Why are performance measures so bad? 49
discriminate good from bad performance. Another vulnerability sur-faces when we try to use several performance measures to appraise peo-ple’s performance and compensate them based on this appraisal. Com-bining disparate non-financial and financial measures into an overallperformance appraisal turns out to be unexpectedly difficult becausethere are no good choices – measures are either combined by formula,in which case people will game the formula, or they are combined sub-jectively, in which case people are demotivated because they do notknow how they are compensated.
The bottom line
Although this chapter was mainly conceptual, four key points shouldbe taken away:
� Performance measures are intended, among other things, to give usinsight into the future, the long-term economic performance of thefirm, which is beyond the reach of measurement. All performancemeasures, as a consequence, are imperfect indicators of an uncertainfuture. Still, some measures are better than others.
� The larger and more complicated the firm, the greater the imperfec-tion of performance measures. This occurs for several reasons: thereis a more intensive division of labor and hence more measures offunctioning in large firms than in small firms; the time lags betweenthe actions taken by a firm and their economic consequences tend tobe longer in large than in small firms (although lags can be very longin small firms with unproven technologies); and, most importantly,the functioning of large firms is dispersed across specialized unitswhereas financial results accrue to its businesses and the firm as awhole, making it difficult to connect the two.
� Firms have sought to improve performance measurement by cas-cading financial measures from the top to the bottom of the or-ganization, rolling up non-financial measures from the bottom tothe top, and seeking new measures thought to contain informationnot in existing measures. The strategy of cascading financials down-ward while rolling up non-financial measures has been successfulmainly in firms partitioned into large numbers of homogeneous busi-ness units. For other firms, this strategy has resulted in a glut ofmeasures.

50 Rethinking Performance Measurement
� To reduce this glut of measures, large firms may have to partitionthemselves into units much smaller than those now shown on organi-zation charts, specifically activities (which incur costs) and customers(who supply revenues). By partitioning the firm activity by activityand customer by customer and then assigning costs to customers andrevenues to activities, it may be possible to construct a performancechain connecting what a firm does with its costs and revenues, andhence with its financial performance.
2 The running down ofperformance measures
T his chapter introduces the role of people in performance mea-surement. It explores how performance measures change aspeople use them. The focus, in other words, is more on what
people do to measures than what measures do to people. The under-lying argument is that what measures do to people causes people tobehave in ways that erode the capacity of measures to discriminategood from bad performance. This phenomenon compounds the prob-lems of measuring performance laid out in chapter 1. Managers thusface two challenges when considering performance measures. The firstis finding performance measures that contain information about cashflows still to come. The second challenge is examining their measurescontinuously and replenishing them as existing measures deteriorate.
This chapter is grounded in several premises. The first we have al-ready encountered: all performance measures are second-best indica-tors of an uncertain future, although some second-best measures arebetter than others. The second premise is common sense, but witha twist: people will generally improve what is measured, and some-times, people will improve what is measured without improving theunderlying performance that is sought. It can be difficult to distinguishimprovement in the measure from improvement in performance be-cause the performance that is sought lies in the future and cannot bemeasured directly. The third premise will be demonstrated presently:improvement in what is measured, with or without accompanying im-provement in performance, usually shrinks differences in measuredperformance and hence in the capacity of measures to discriminategood from bad performance as well. I call this diminution of differ-ences the running down of performance measures. It is the use-it-and-lose-it principle in performance measurement. A fourth premise fol-lows from the third: as existing measures run down, new measurescapable of discriminating good from bad performance are sought.The result is that performance measures never stand still. Instead,
51
52 Rethinking Performance Measurement
firms change their performance measures continuously and sometimesabruptly.
My approach in this chapter is eclectic. I take measures from wher-ever I can get them, sometimes from business but often not, to illustraterunning down. Since there are more baseball statistics in the USA thanstatistics of any other kind, one of the key examples is from that sport.But there are also examples from hospitals, the nuclear power industry,public bureaucracies, education, money market mutual funds, commer-cial banks, quality ratings in the automotive industry, and the marketfor initial public offerings. I use the example of one company, GeneralElectric, to demonstrate that stellar firms can and do shift their mea-sures dramatically, but I also draw a large database describing manycompanies to illustrate that performance measures are more often dis-parate than consistent.
Why performance measures run down
The running down of performance measures is nearly ubiquitous.Running down occurs when differences in measured performance di-minish to such a degree that it is no longer possible to discriminate goodfrom bad performance. Running down, as will be shown, has severalcauses, and it can be difficult to distinguish among them. These causesinclude positive learning, perverse learning, selection, suppression, andsocial consensus.
Positive learning
Batting averages in major league baseballMany performance measures lose their ability to convey informationabout performance because their variability declines as performanceimproves. Perhaps the most vivid illustration of running down due topositive learning comes from the history of batting averages in majorleague baseball, which has been documented by paleontologist StephenJay Gould.1 The facts are straightforward: from 1876 through 1980,there was virtually no change in the mean batting average, which hov-ered consistently around .260, plus or minus ten points. Over the sametime period, however, variance in batting averages eroded substantially.This is illustrated in figures 2.1–2.2. Figure 2.1 displays differences be-tween the five highest individual batting averages and the mean batting
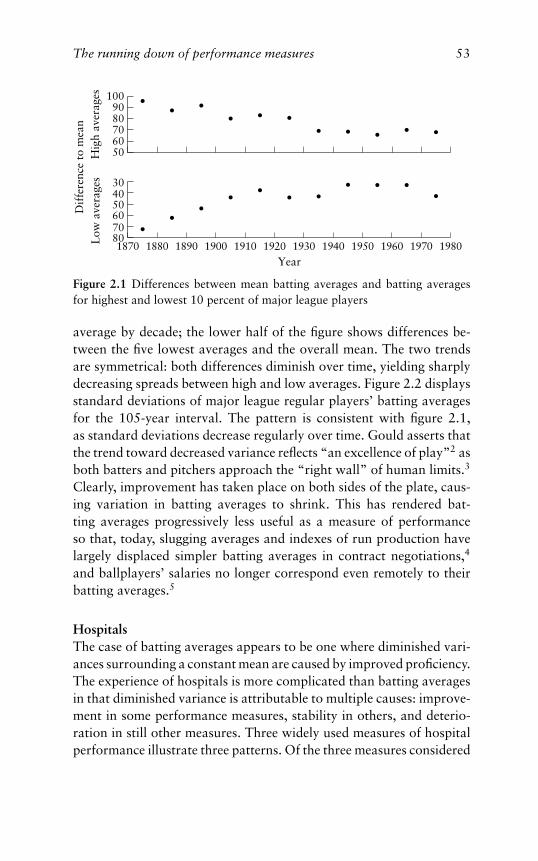
The running down of performance measures 53
1870 1880 1890 1900 1910 1920 1930 1940 1950 1960 1970 1980
1009080706050
304050607080
Dif
fere
nce
to m
ean
Year
Low
ave
rage
sH
igh
aver
ages
Figure 2.1 Differences between mean batting averages and batting averagesfor highest and lowest 10 percent of major league players
average by decade; the lower half of the figure shows differences be-tween the five lowest averages and the overall mean. The two trendsare symmetrical: both differences diminish over time, yielding sharplydecreasing spreads between high and low averages. Figure 2.2 displaysstandard deviations of major league regular players’ batting averagesfor the 105-year interval. The pattern is consistent with figure 2.1,as standard deviations decrease regularly over time. Gould asserts thatthe trend toward decreased variance reflects “an excellence of play”2 asboth batters and pitchers approach the “right wall” of human limits.3
Clearly, improvement has taken place on both sides of the plate, caus-ing variation in batting averages to shrink. This has rendered bat-ting averages progressively less useful as a measure of performanceso that, today, slugging averages and indexes of run production havelargely displaced simpler batting averages in contract negotiations,4
and ballplayers’ salaries no longer correspond even remotely to theirbatting averages.5
HospitalsThe case of batting averages appears to be one where diminished vari-ances surrounding a constant mean are caused by improved proficiency.The experience of hospitals is more complicated than batting averagesin that diminished variance is attributable to multiple causes: improve-ment in some performance measures, stability in others, and deterio-ration in still other measures. Three widely used measures of hospitalperformance illustrate three patterns. Of the three measures considered
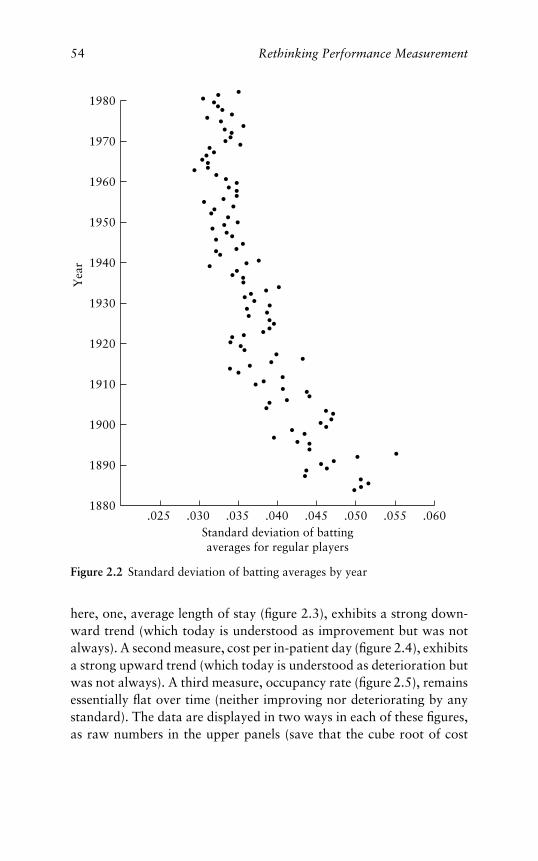
54 Rethinking Performance Measurement
.025 .030 .035 .040 .045 .050 .055 .060
1980
1970
1960
1950
1940
1930
1920
1910
1900
1890
1880
Yea
r
Standard deviation of battingaverages for regular players
Figure 2.2 Standard deviation of batting averages by year
here, one, average length of stay (figure 2.3), exhibits a strong down-ward trend (which today is understood as improvement but was notalways). A second measure, cost per in-patient day (figure 2.4), exhibitsa strong upward trend (which today is understood as deterioration butwas not always). A third measure, occupancy rate (figure 2.5), remainsessentially flat over time (neither improving nor deteriorating by anystandard). The data are displayed in two ways in each of these figures,as raw numbers in the upper panels (save that the cube root of cost
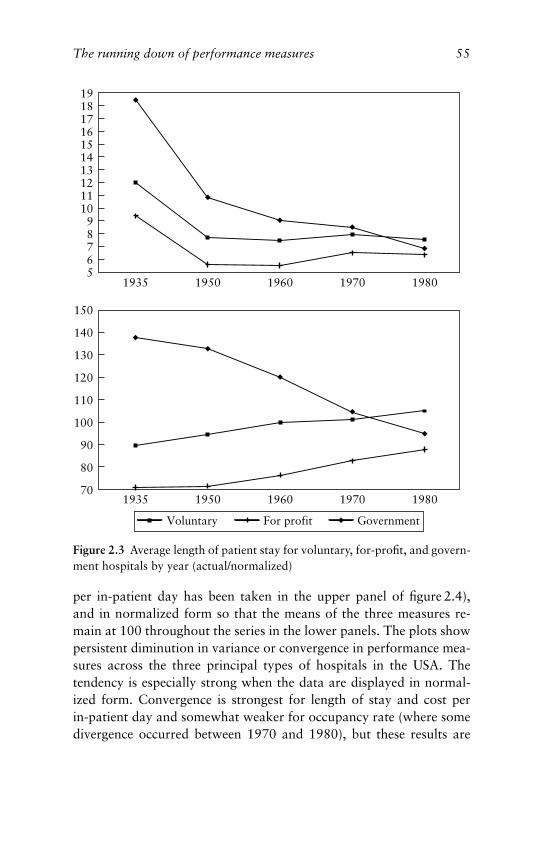
The running down of performance measures 55
1918171615141312111098765
150
140
130
120
110
100
90
80
70
1935 1950 1960 1970 1980
1935 1950 1960 1970 1980
Voluntary GovernmentFor profit
Figure 2.3 Average length of patient stay for voluntary, for-profit, and govern-ment hospitals by year (actual/normalized)
per in-patient day has been taken in the upper panel of figure 2.4),and in normalized form so that the means of the three measures re-main at 100 throughout the series in the lower panels. The plots showpersistent diminution in variance or convergence in performance mea-sures across the three principal types of hospitals in the USA. Thetendency is especially strong when the data are displayed in normal-ized form. Convergence is strongest for length of stay and cost perin-patient day and somewhat weaker for occupancy rate (where somedivergence occurred between 1970 and 1980), but these results are
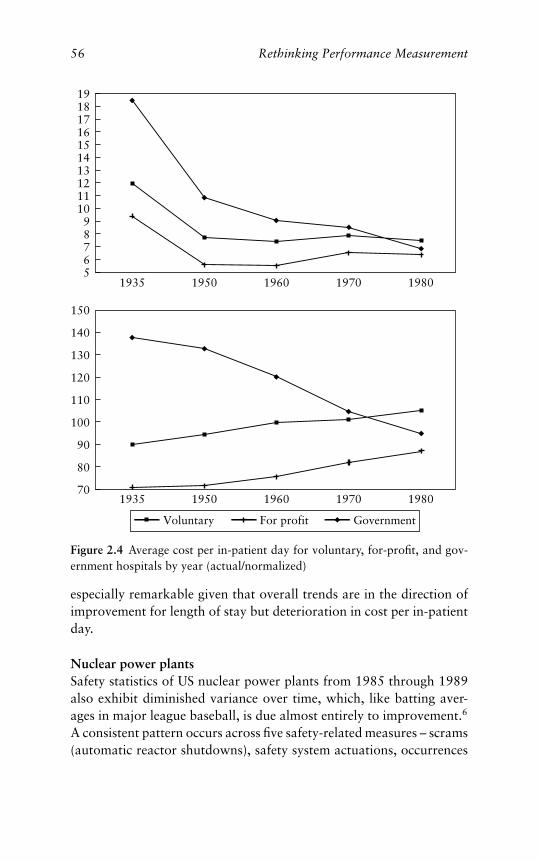
56 Rethinking Performance Measurement
1918171615141312111098765
150
140
130
120
110
100
90
80
70
1935 1950 1960 1970 1980
1935 1950 1960 1970 1980
Voluntary GovernmentFor profit
Figure 2.4 Average cost per in-patient day for voluntary, for-profit, and gov-ernment hospitals by year (actual/normalized)
especially remarkable given that overall trends are in the direction ofimprovement for length of stay but deterioration in cost per in-patientday.
Nuclear power plantsSafety statistics of US nuclear power plants from 1985 through 1989also exhibit diminished variance over time, which, like batting aver-ages in major league baseball, is due almost entirely to improvement.6
A consistent pattern occurs across five safety-related measures – scrams(automatic reactor shutdowns), safety system actuations, occurrences
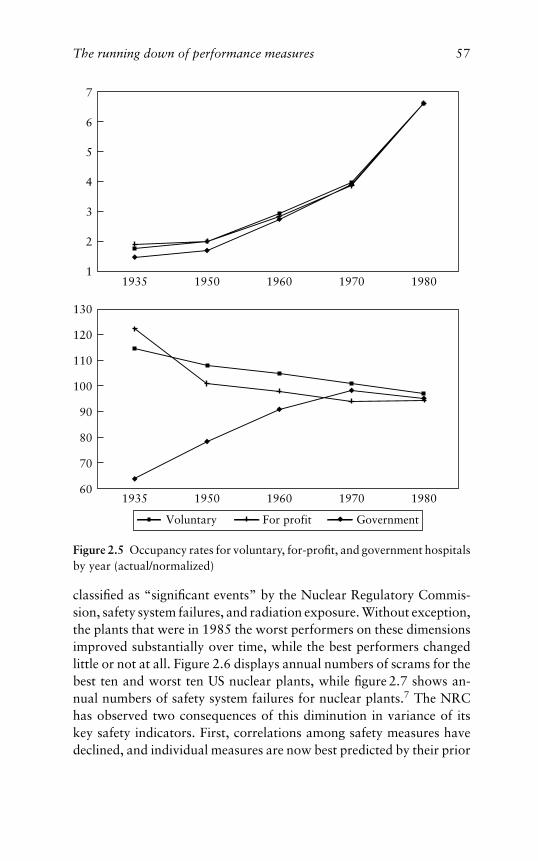
The running down of performance measures 57
7
6
1
5
4
3
2
130
120
110
100
90
80
60
70
1935 1950 1960 1970 1980
1935 1950 1960 1970 1980
Voluntary GovernmentFor profit
Figure 2.5 Occupancy rates for voluntary, for-profit, and government hospitalsby year (actual/normalized)
classified as “significant events” by the Nuclear Regulatory Commis-sion, safety system failures, and radiation exposure. Without exception,the plants that were in 1985 the worst performers on these dimensionsimproved substantially over time, while the best performers changedlittle or not at all. Figure 2.6 displays annual numbers of scrams for thebest ten and worst ten US nuclear plants, while figure 2.7 shows an-nual numbers of safety system failures for nuclear plants.7 The NRChas observed two consequences of this diminution in variance of itskey safety indicators. First, correlations among safety measures havedeclined, and individual measures are now best predicted by their prior
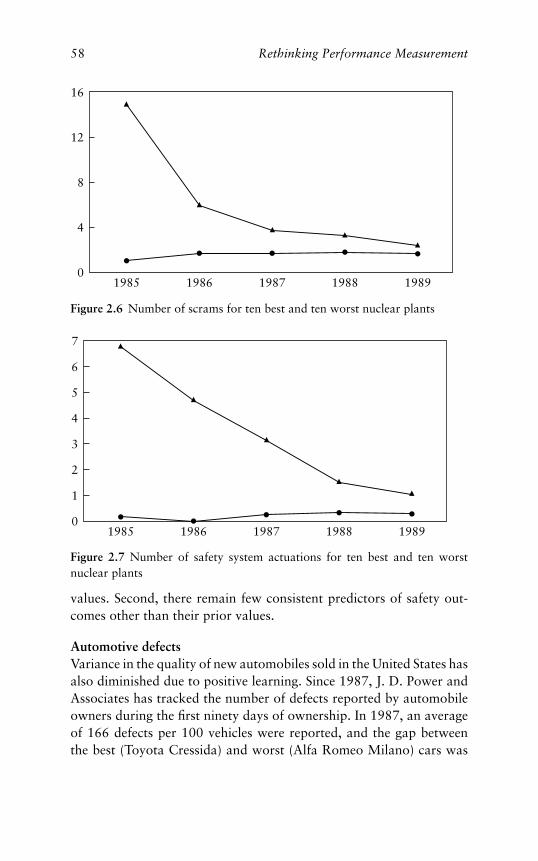
58 Rethinking Performance Measurement
16
12
4
8
01985 1986 1987 1988 1989
Figure 2.6 Number of scrams for ten best and ten worst nuclear plants
7
6
5
4
3
2
1
01985 1986 1987 1988 1989
Figure 2.7 Number of safety system actuations for ten best and ten worstnuclear plants
values. Second, there remain few consistent predictors of safety out-comes other than their prior values.
Automotive defectsVariance in the quality of new automobiles sold in the United States hasalso diminished due to positive learning. Since 1987, J. D. Power andAssociates has tracked the number of defects reported by automobileowners during the first ninety days of ownership. In 1987, an averageof 166 defects per 100 vehicles were reported, and the gap betweenthe best (Toyota Cressida) and worst (Alfa Romeo Milano) cars was
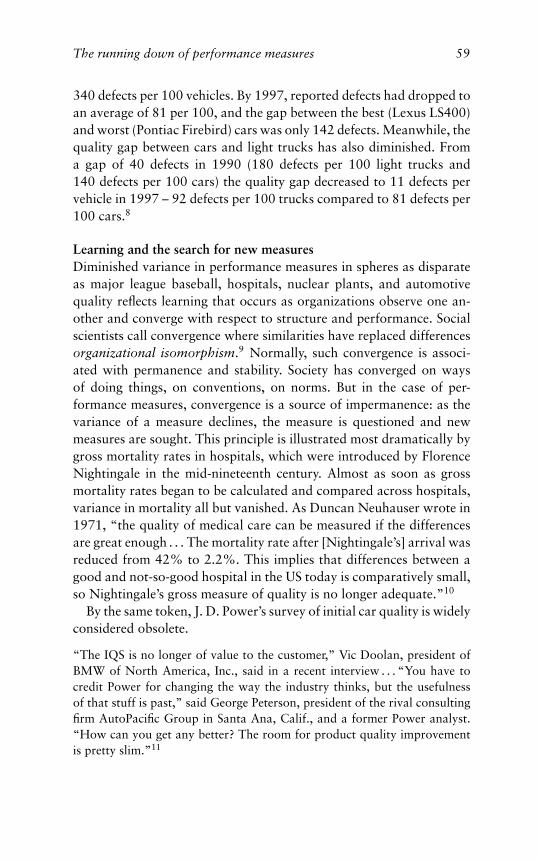
The running down of performance measures 59
340 defects per 100 vehicles. By 1997, reported defects had dropped toan average of 81 per 100, and the gap between the best (Lexus LS400)and worst (Pontiac Firebird) cars was only 142 defects. Meanwhile, thequality gap between cars and light trucks has also diminished. Froma gap of 40 defects in 1990 (180 defects per 100 light trucks and140 defects per 100 cars) the quality gap decreased to 11 defects pervehicle in 1997 – 92 defects per 100 trucks compared to 81 defects per100 cars.8
Learning and the search for new measuresDiminished variance in performance measures in spheres as disparateas major league baseball, hospitals, nuclear plants, and automotivequality reflects learning that occurs as organizations observe one an-other and converge with respect to structure and performance. Socialscientists call convergence where similarities have replaced differencesorganizational isomorphism.9 Normally, such convergence is associ-ated with permanence and stability. Society has converged on waysof doing things, on conventions, on norms. But in the case of per-formance measures, convergence is a source of impermanence: as thevariance of a measure declines, the measure is questioned and newmeasures are sought. This principle is illustrated most dramatically bygross mortality rates in hospitals, which were introduced by FlorenceNightingale in the mid-nineteenth century. Almost as soon as grossmortality rates began to be calculated and compared across hospitals,variance in mortality all but vanished. As Duncan Neuhauser wrote in1971, “the quality of medical care can be measured if the differencesare great enough . . . The mortality rate after [Nightingale’s] arrival wasreduced from 42% to 2.2%. This implies that differences between agood and not-so-good hospital in the US today is comparatively small,so Nightingale’s gross measure of quality is no longer adequate.”10
By the same token, J. D. Power’s survey of initial car quality is widelyconsidered obsolete.
“The IQS is no longer of value to the customer,” Vic Doolan, president ofBMW of North America, Inc., said in a recent interview . . . “You have tocredit Power for changing the way the industry thinks, but the usefulnessof that stuff is past,” said George Peterson, president of the rival consultingfirm AutoPacific Group in Santa Ana, Calif., and a former Power analyst.“How can you get any better? The room for product quality improvementis pretty slim.”11
60 Rethinking Performance Measurement
As a general proposition, convergence of a performance measure trig-gers a search for alternative measures. For example, diminished vari-ance in its safety measures has caused the Nuclear Regulatory Com-mission to search continually for new measures.12 The convergenceof functional performance measures has been followed by the reemer-gence of patient mortality as a performance measure for hospitals, butthe new mortality measures are procedure-specific rather than hospital-wide. The convergence of the J. D. Power’s Initial Quality, which hasbeen the principal measure of automotive quality for the last decade,has led to calls for its replacement.
Perverse learning
Perverse learning – learning that is perverse in the sense that the wronglessons are learned – can also diminish variance in measured perfor-mance outcomes. Perverse learning takes place when diminished vari-ance surrounding a constant or increasing mean occurs without effecton and perhaps to the detriment of actual performance outcomes.Illustrations of perverse learning abound. Teachers teach to test, whichis aimed at improving performance in the lower tail of this distribution.The commercial test-preparation industry does this unabashedly – thegoal is to insure that clients’ test scores are high enough to be com-petitive candidates for admission.13 Police investigators elicit multipleconfessions from suspects in order to maintain clearance rates, whichmay bear little relation to the actual number of crimes solved.14 Inbusiness, short-term earnings and return-on-investment (ROI) targetsin business can also give rise to perverse learning. Managers forced tomeet earnings and ROI targets will sometimes meet them by deferringexpenses, booking revenues not yet earned, and deferring depreciationactually incurred. In each of these instances, measured performanceimproves and the variance of measured performance declines, leavingactual performance no better and often worse.
Two cases, one classic and one current, illustrate how measure-ment potentially or actually triggers perverse learning. The classiccase involves the performance of interviewers in a public employmentagency in the late 1940s:
The distorting influence of the measuring instrument is a serious prob-lem in social research. In this bureaucracy, the collection of data on oper-ations, such as the number of interviews each official held, also influenced
The running down of performance measures 61
the interviewer’s conduct. The knowledge that his superior would learn howmany clients he had interviewed and would evaluate him accordingly in-duced him to work faster . . . this direct effect constituted the major functionof performance records for bureaucratic operations . . . dysfunction resultsfrom the fact that indices are not perfectly related to the phenomena theypurport to measure. Since interviewers were interested in maximizing their“figures,” they tried to do so by various means. Occasionally, a client whohad been temporarily laid off expected to return to his former job withinthe next few days. After confirming this with the employer, the interviewermade out a job order and referred the client to this job. In this way he im-proved his number of referrals and of placements (and the correspondingproportional indices) without having accomplished the objective these in-dices were designed to measure, that is, without having found a job for theclient.15
As this passage illustrates, both positive learning (working faster) andperverse learning (placing workers in jobs from which they had beenlaid off temporarily) can be triggered by the same performance mea-sure. This is not unusual: the effects of positive and perverse learningoften cannot be separated, and a manager does not know how much ofthe improvement in a measure reflects actual improvement. All man-agers do know is that measured performance has improved while itsvariability has diminished.
The contemporary case involves alleged grade inflation at Harvard.In the spring of 2001, the dean of Harvard College reported that 49 per-cent of undergraduate grades were As, up from 23 percent in 1986, trig-gering a wide-ranging debate on grade inflation. Some viewed the dou-bling of A grades as positive and reflecting improved performance sinceHarvard College students are brighter (as measured by SAT scores, butsee below on the commercial test-preparation industry) and harder-working than ever. But some perceived that professors have learnedthat giving poor grades can be costly. One cost is internal (“There’s afeeling that you shouldn’t pass judgment in a way that might hurt some-one’s self-esteem,” according to Professor Harvey Mansfield). Anotheris exposure to relentless student pressure (a Boston Globe reporterwrote, “While badgering a professor for a higher grade was once con-sidered audacious, many students paying tens of thousands of dollarsin tuition today feel a right to lobby for a higher grade . . .”16).
A key question, of course, is whether higher grades or compressionof grades is the problem. NewYork Times education columnist Richard
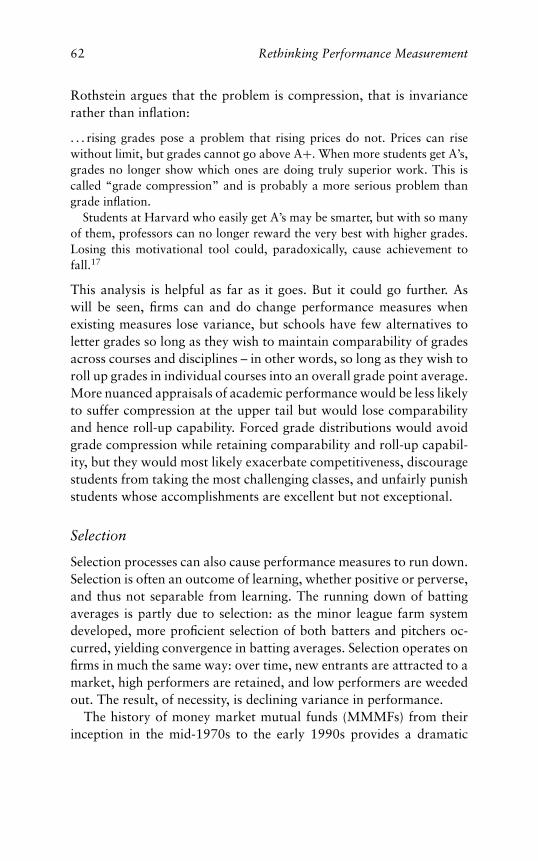
62 Rethinking Performance Measurement
Rothstein argues that the problem is compression, that is invariancerather than inflation:
. . . rising grades pose a problem that rising prices do not. Prices can risewithout limit, but grades cannot go above A+. When more students get A’s,grades no longer show which ones are doing truly superior work. This iscalled “grade compression” and is probably a more serious problem thangrade inflation.
Students at Harvard who easily get A’s may be smarter, but with so manyof them, professors can no longer reward the very best with higher grades.Losing this motivational tool could, paradoxically, cause achievement tofall.17
This analysis is helpful as far as it goes. But it could go further. Aswill be seen, firms can and do change performance measures whenexisting measures lose variance, but schools have few alternatives toletter grades so long as they wish to maintain comparability of gradesacross courses and disciplines – in other words, so long as they wish toroll up grades in individual courses into an overall grade point average.More nuanced appraisals of academic performance would be less likelyto suffer compression at the upper tail but would lose comparabilityand hence roll-up capability. Forced grade distributions would avoidgrade compression while retaining comparability and roll-up capabil-ity, but they would most likely exacerbate competitiveness, discouragestudents from taking the most challenging classes, and unfairly punishstudents whose accomplishments are excellent but not exceptional.
Selection
Selection processes can also cause performance measures to run down.Selection is often an outcome of learning, whether positive or perverse,and thus not separable from learning. The running down of battingaverages is partly due to selection: as the minor league farm systemdeveloped, more proficient selection of both batters and pitchers oc-curred, yielding convergence in batting averages. Selection operates onfirms in much the same way: over time, new entrants are attracted to amarket, high performers are retained, and low performers are weededout. The result, of necessity, is declining variance in performance.
The history of money market mutual funds (MMMFs) from theirinception in the mid-1970s to the early 1990s provides a dramatic
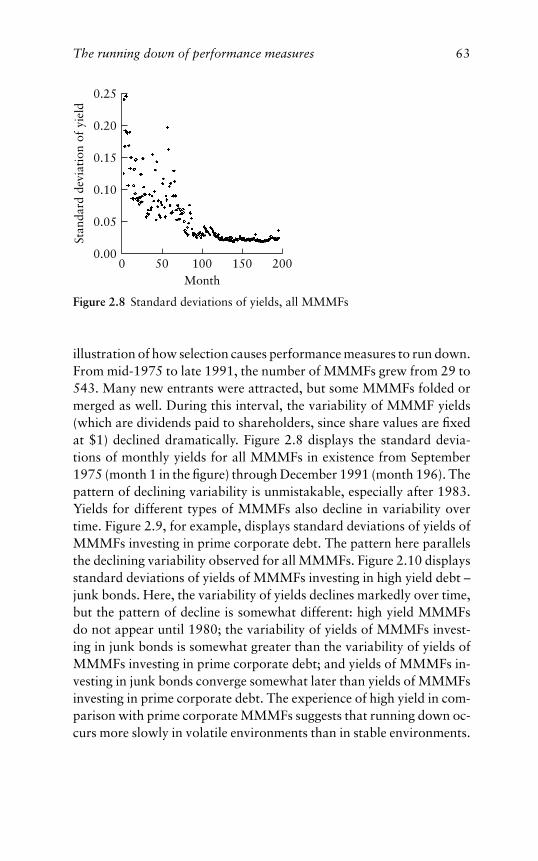
The running down of performance measures 63
0.25
0.20
0.15
0.10
0.05
0.000 50 100 150 200
Stan
dard
dev
iati
on o
f yi
eld
Month
Figure 2.8 Standard deviations of yields, all MMMFs
illustration of how selection causes performance measures to run down.From mid-1975 to late 1991, the number of MMMFs grew from 29 to543. Many new entrants were attracted, but some MMMFs folded ormerged as well. During this interval, the variability of MMMF yields(which are dividends paid to shareholders, since share values are fixedat $1) declined dramatically. Figure 2.8 displays the standard devia-tions of monthly yields for all MMMFs in existence from September1975 (month 1 in the figure) through December 1991 (month 196). Thepattern of declining variability is unmistakable, especially after 1983.Yields for different types of MMMFs also decline in variability overtime. Figure 2.9, for example, displays standard deviations of yields ofMMMFs investing in prime corporate debt. The pattern here parallelsthe declining variability observed for all MMMFs. Figure 2.10 displaysstandard deviations of yields of MMMFs investing in high yield debt –junk bonds. Here, the variability of yields declines markedly over time,but the pattern of decline is somewhat different: high yield MMMFsdo not appear until 1980; the variability of yields of MMMFs invest-ing in junk bonds is somewhat greater than the variability of yields ofMMMFs investing in prime corporate debt; and yields of MMMFs in-vesting in junk bonds converge somewhat later than yields of MMMFsinvesting in prime corporate debt. The experience of high yield in com-parison with prime corporate MMMFs suggests that running down oc-curs more slowly in volatile environments than in stable environments.
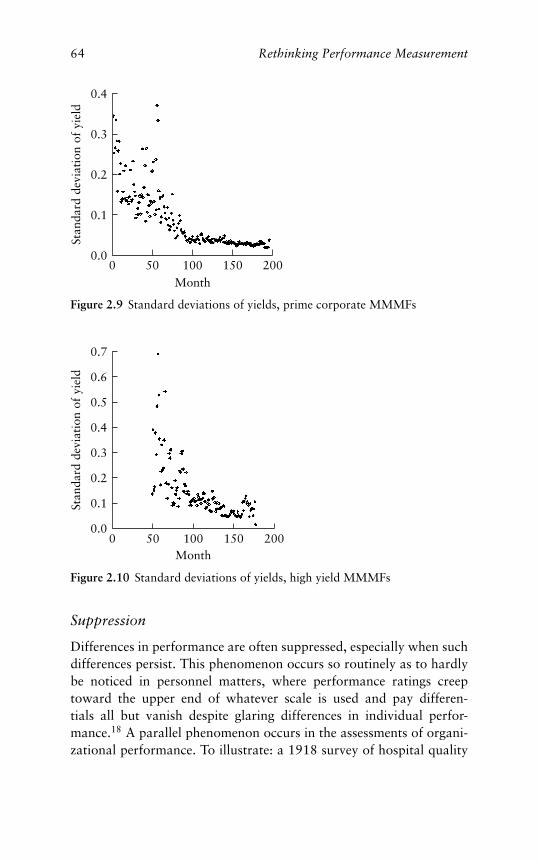
64 Rethinking Performance Measurement
0 50 100 150 200
0.4
0.3
0.2
0.1
0.0
Month
Stan
dard
dev
iati
on o
f yi
eld
Figure 2.9 Standard deviations of yields, prime corporate MMMFs
0.7
0.6
0.5
0.4
0.3
0.2
0.1
0.00 50 100 150 200
Month
Stan
dard
dev
iati
on o
f yi
eld
Figure 2.10 Standard deviations of yields, high yield MMMFs
Suppression
Differences in performance are often suppressed, especially when suchdifferences persist. This phenomenon occurs so routinely as to hardlybe noticed in personnel matters, where performance ratings creeptoward the upper end of whatever scale is used and pay differen-tials all but vanish despite glaring differences in individual perfor-mance.18 A parallel phenomenon occurs in the assessments of organi-zational performance. To illustrate: a 1918 survey of hospital quality
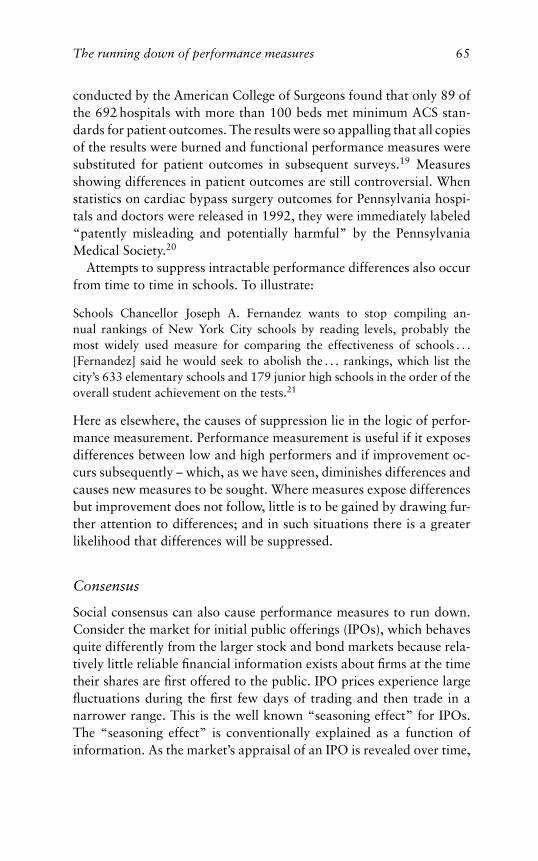
The running down of performance measures 65
conducted by the American College of Surgeons found that only 89 ofthe 692 hospitals with more than 100 beds met minimum ACS stan-dards for patient outcomes. The results were so appalling that all copiesof the results were burned and functional performance measures weresubstituted for patient outcomes in subsequent surveys.19 Measuresshowing differences in patient outcomes are still controversial. Whenstatistics on cardiac bypass surgery outcomes for Pennsylvania hospi-tals and doctors were released in 1992, they were immediately labeled“patently misleading and potentially harmful” by the PennsylvaniaMedical Society.20
Attempts to suppress intractable performance differences also occurfrom time to time in schools. To illustrate:
Schools Chancellor Joseph A. Fernandez wants to stop compiling an-nual rankings of New York City schools by reading levels, probably themost widely used measure for comparing the effectiveness of schools . . .[Fernandez] said he would seek to abolish the . . . rankings, which list thecity’s 633 elementary schools and 179 junior high schools in the order of theoverall student achievement on the tests.21
Here as elsewhere, the causes of suppression lie in the logic of perfor-mance measurement. Performance measurement is useful if it exposesdifferences between low and high performers and if improvement oc-curs subsequently – which, as we have seen, diminishes differences andcauses new measures to be sought. Where measures expose differencesbut improvement does not follow, little is to be gained by drawing fur-ther attention to differences; and in such situations there is a greaterlikelihood that differences will be suppressed.
Consensus
Social consensus can also cause performance measures to run down.Consider the market for initial public offerings (IPOs), which behavesquite differently from the larger stock and bond markets because rela-tively little reliable financial information exists about firms at the timetheir shares are first offered to the public. IPO prices experience largefluctuations during the first few days of trading and then trade in anarrower range. This is the well known “seasoning effect” for IPOs.The “seasoning effect” is conventionally explained as a function ofinformation. As the market’s appraisal of an IPO is revealed over time,
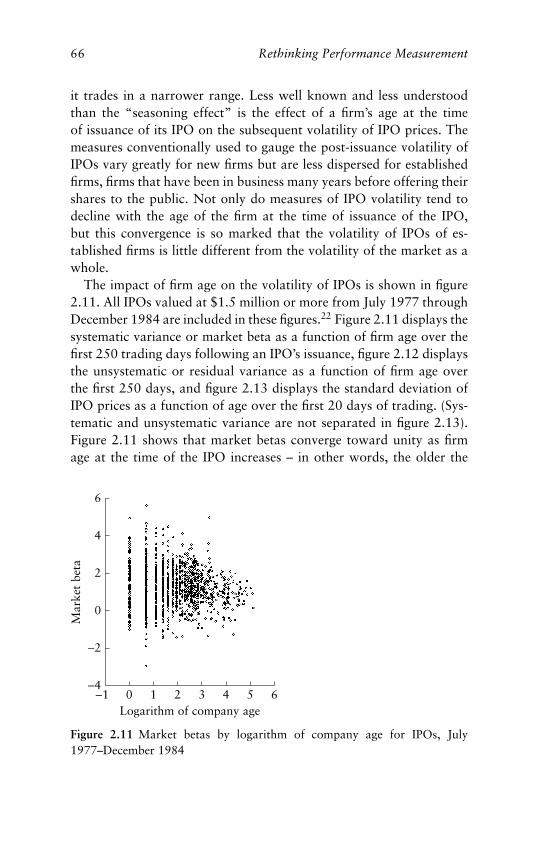
66 Rethinking Performance Measurement
it trades in a narrower range. Less well known and less understoodthan the “seasoning effect” is the effect of a firm’s age at the timeof issuance of its IPO on the subsequent volatility of IPO prices. Themeasures conventionally used to gauge the post-issuance volatility ofIPOs vary greatly for new firms but are less dispersed for establishedfirms, firms that have been in business many years before offering theirshares to the public. Not only do measures of IPO volatility tend todecline with the age of the firm at the time of issuance of the IPO,but this convergence is so marked that the volatility of IPOs of es-tablished firms is little different from the volatility of the market as awhole.
The impact of firm age on the volatility of IPOs is shown in figure2.11. All IPOs valued at $1.5 million or more from July 1977 throughDecember 1984 are included in these figures.22 Figure 2.11 displays thesystematic variance or market beta as a function of firm age over thefirst 250 trading days following an IPO’s issuance, figure 2.12 displaysthe unsystematic or residual variance as a function of firm age overthe first 250 days, and figure 2.13 displays the standard deviation ofIPO prices as a function of age over the first 20 days of trading. (Sys-tematic and unsystematic variance are not separated in figure 2.13).Figure 2.11 shows that market betas converge toward unity as firmage at the time of the IPO increases – in other words, the older the
6
4
2
0
−2
−4−1 0 1 2 3 4 5 6
Logarithm of company age
Mar
ket
beta
Figure 2.11 Market betas by logarithm of company age for IPOs, July1977–December 1984
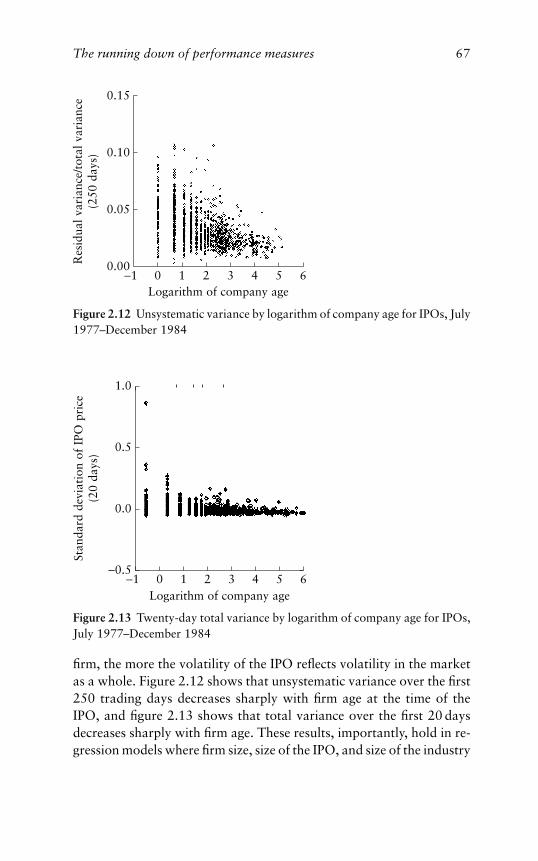
The running down of performance measures 67
0.15
0.10
0.05
0.00−1 0 1 2 3 4 5 6
Logarithm of company age
Res
idua
l var
ianc
e/to
tal v
aria
nce
(250
day
s)
Figure 2.12 Unsystematic variance by logarithm of company age for IPOs, July1977–December 1984
−1 0 1 2 3 4 5 6
1.0
0.5
0.0
−0.5
Logarithm of company age
Stan
dard
dev
iati
on o
f IP
O p
rice
(20
days
)
Figure 2.13 Twenty-day total variance by logarithm of company age for IPOs,July 1977–December 1984
firm, the more the volatility of the IPO reflects volatility in the marketas a whole. Figure 2.12 shows that unsystematic variance over the first250 trading days decreases sharply with firm age at the time of theIPO, and figure 2.13 shows that total variance over the first 20 daysdecreases sharply with firm age. These results, importantly, hold in re-gression models where firm size, size of the IPO, and size of the industry
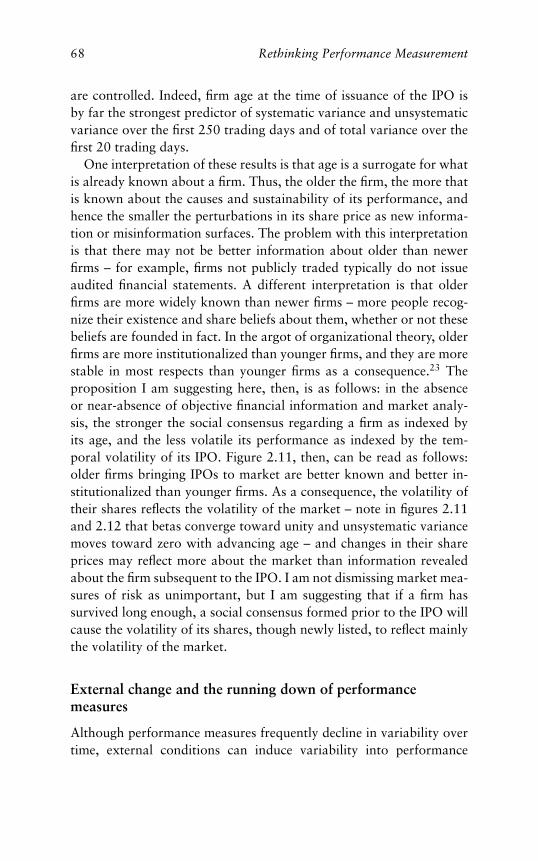
68 Rethinking Performance Measurement
are controlled. Indeed, firm age at the time of issuance of the IPO isby far the strongest predictor of systematic variance and unsystematicvariance over the first 250 trading days and of total variance over thefirst 20 trading days.
One interpretation of these results is that age is a surrogate for whatis already known about a firm. Thus, the older the firm, the more thatis known about the causes and sustainability of its performance, andhence the smaller the perturbations in its share price as new informa-tion or misinformation surfaces. The problem with this interpretationis that there may not be better information about older than newerfirms – for example, firms not publicly traded typically do not issueaudited financial statements. A different interpretation is that olderfirms are more widely known than newer firms – more people recog-nize their existence and share beliefs about them, whether or not thesebeliefs are founded in fact. In the argot of organizational theory, olderfirms are more institutionalized than younger firms, and they are morestable in most respects than younger firms as a consequence.23 Theproposition I am suggesting here, then, is as follows: in the absenceor near-absence of objective financial information and market analy-sis, the stronger the social consensus regarding a firm as indexed byits age, and the less volatile its performance as indexed by the tem-poral volatility of its IPO. Figure 2.11, then, can be read as follows:older firms bringing IPOs to market are better known and better in-stitutionalized than younger firms. As a consequence, the volatility oftheir shares reflects the volatility of the market – note in figures 2.11and 2.12 that betas converge toward unity and unsystematic variancemoves toward zero with advancing age – and changes in their shareprices may reflect more about the market than information revealedabout the firm subsequent to the IPO. I am not dismissing market mea-sures of risk as unimportant, but I am suggesting that if a firm hassurvived long enough, a social consensus formed prior to the IPO willcause the volatility of its shares, though newly listed, to reflect mainlythe volatility of the market.
External change and the running down of performancemeasures
Although performance measures frequently decline in variability overtime, external conditions can induce variability into performance
The running down of performance measures 69
measures that might otherwise converge. Commercial banks are a casein point. Massive regulatory changes in the late 1970s and early 1980s(which, among other things, placed commercial banks in competitionwith S&Ls) coupled with upward shifts in interest rates created op-portunities for some banks but difficulties for others, disadvantagingmainly smaller banks. Figure 2.14 displays series for return on total as-sets for US commercial banks from 1968 through 1982, the only yearsfor which such data are available consistently. ROA is displayed forbanks of different size ranges, under $5 million in assets, assets between$5 and $10 million, $10 to $25 million, $25 to $100 million, and over$100 million. Some shifting of banks between categories occurred astheir assets grew, so the data are not strictly comparable over time.Even so, these series show that performance differences across banksof different sizes increased substantially over time, and markedly sotoward the end of the series. The same pattern, it should be noted,holds for return on equity and other indicators of bank financial per-formance. Running down is not evident – quite the opposite occurs, infact. The same pattern, it should be noted, holds for two other bankperformance measures not displayed, rate of return on loans and theratio of wages to assets.
In examining these series, it is useful to keep in mind changes ininterest rates occurring in the 1968–82 interval. The prime rate lendingcharged to the most creditworthy customers had remained at about4.5 percent through 1965 but moved above 8 percent toward the endof 1969 before declining somewhat. A second spike in the prime rateoccurred in 1974, when it approached 11 percent. And from 1980through 1982, the prime rate reached unprecedented levels, stayingabove 15 percent through much of this interval and peaking, in 1981,at 19 percent. Looking across the series in figure 2.14, it is clear that theperformance measures diverged noticeably when interest rates peakedfirst in 1974 and when rates rose dramatically from 1980 through1982. It is also clear that the regulatory changes of the early 1980swere very much to the disadvantage of small banks.
These results carry an interesting, indeed a paradoxical implication.In stable environments, performance measures run down and hencelose some if not all of their capacity to discriminate good from badperformance. Running down can be caused by several forces – positivelearning, perverse learning, selection, suppression, and consensus –and it can be very difficult to distinguish these causes. Running down
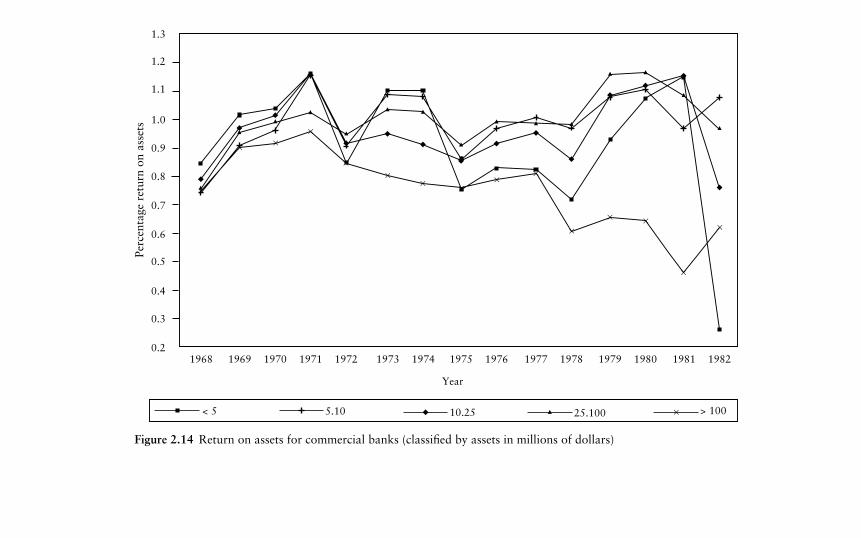
1968 1970 1972 1974 1976 1978 1980 19821969 1971 1973 1975 1977 1979 1981
< 5 5.10 10.25 25.100 > 100
0.2
0.3
0.4
0.5
0.6
0.7
0.8
0.9
1.0
1.1
1.2
1.3
Year
Perc
enta
ge r
etur
n on
ass
ets
Figure 2.14 Return on assets for commercial banks (classified by assets in millions of dollars)
The running down of performance measures 71
is, apparently, attenuated by turbulence in the environment. But tur-bulence in the environment makes measurement noisy in the sense thatit diminishes our ability to project from the present to the future andhence our confidence that any measure contains meaningful informa-tion about the economic performance of the firm, which lies ahead. Notonly, then, is there the “use-it-and-lose-it” principle in performancemeasurement, but there is the obverse risk that measures that have re-tained their variability due to environmental turbulence will lose theircapacity to anticipate future economic results due to this turbulence.
Changing measures
When existing measures run down, will organizations seek new perfor-mance measures that differ slightly or sharply from existing ones? Asimple thought experiment yields a counterintuitive result. On the onehand, when existing measures have run down, the new measures soughtwill not be sharply different from existing measures. Businesses willnot replace financial measures with measures of social performance,and professors will not replace measures of research productivity withmeasures of student contact hours. On the other hand, new measuresthat are strongly correlated with existing measures will not be soughteither, because such measures would be redundant and would sim-ply substitute one set of measures that have run down for another.Fahrenheit and centigrade temperature scales, for instance, containidentical information. Thus, if an existing measure has run down, anynew measure strongly correlated with that measure will also have rundown. The likelihood, then, is that new measures will be weakly corre-lated or uncorrelated but not negatively correlated with measures thathave run down. In other words, the new measures that will be soughtwhen existing measures have run down will be different from but notantagonistic to existing measures.
The case of General Electric
The experience of General Electric illustrates the tendency of firmsto seek new measures different from but not antagonistic to existingmeasures. Since the 1950s, GE has changed its performance measuresseveral times, oscillating between simple and well-defined measuresand complicated and in some instances ill-defined measures. Before
72 Rethinking Performance Measurement
GE was decentralized in the early 1950s, planning and budgeting werecentralized in the upper echelons of the company, and the performanceof operating units was assessed largely against budgetary targets. Oncea fully divisionalized organizational structure was in place, centralizedplanning and budgeting no longer made sense. It seemed appropriateto develop a set of measures that would permit business unit managersto assess past accomplishments and project future performance.
GE’s “Measurements Project,” initiated in 1951, was intended todevelop performance metrics that could be applied on a decentralizedbasis. The Measurements Project had three subprojects: operationalmeasurement, functional measurements, and measurements of thework of managing. Eight categories of operational measures emergedover time: profitability, market position, productivity, product leader-ship, personnel development, employee attitudes, public responsibility,and balance between short-range and long-range goals.
Primary and secondary measures were sought for each class of opera-tional measures. For example, profitability measures included residualdollar profit (basically, profits less the cost of capital, much like today’sEVA) and the ratio of residual profits to value added (sales minus ma-terials and parts costs). Measures of market position included share ofmarkets now served as well as share of potential markets. Productivitymeasures, interestingly, were never decided by the staff of the Mea-surements Project during its twenty years of existence. These measuresencountered some resistance at first, particularly from the comptroller’sstaff, but they gradually took hold as the middle-management ranks ofGE swelled. Not only were the new performance measures dramaticallydifferent from the budgetary targets used previously without being an-tagonistic to these targets, but they were also very different from eachother.24 The Measurements Project wound down in the early 1970sbefore its work was completed. A definitive set of metrics for Gen-eral Electric was never established, in all likelihood because at GE aselsewhere no metrics are definitive for long.
General Electric’s performance measures shifted dramatically in thelate 1970s when Jack Welch became GE’s chairman. Welch perceivedthat the company’s existence was imperiled and embarked on a pro-gram of weeding out inefficient business units. The selection criteriawere of the utmost simplicity and severity: units not either first or sec-ond in profitability and growth in their respective industries wouldbe either sold or shut. This policy was pursued for nearly thirteen
The running down of performance measures 73
years – one should keep in mind that the measures produced by theMeasurements Project had been in place for nearly three decades beforethey were changed – during which time Mr. Welch earned the nickname“Neutron Jack” for firing people while the buildings remained stand-ing. The company’s profitability grew substantially during this periodwhile its employee roster shrunk.
But as General Electric has prospered, its attention has also shifted tonew ventures and markets, especially in Asia, and there has been grad-ual recognition of limits to continual rationalization of the company.Of particular concern is the adverse impact on employee commitmentand initiative, both recognized as essential to any fast-moving globalenterprise. For this reason and for other reasons as well, new and verydifferent values for General Electric were announced by Mr. Welch in1992:
Mr. Welch exemplified the relentless executive willing to mow down any em-ployees standing between him and a brighter bottom line. Through layoffs,plant closings, and the sale of businesses, he eliminated 100,000 jobs, leaving284,000. As his company’s profits increased, his style was widely respectedand imitated.
Now Mr. Welch has arrived at a “set of values we believe we will need totake this company forward, rapidly, through the 1990s and beyond.” Trustand respect between workers and managers is essential, he said. Managersmust be “open to ideas from anywhere.”
In Mr. Welch’s view, the sort of manager who meets numerical goals but hasold-fashioned attitudes is the major obstacle to carrying out these concepts.“This is the individual who typically forces performance out of people ratherthan inspires it: the autocrat, the big shot, the tyrant,” he said.
Still, tyrants will get a taste of Jack Welch’s older motivational techniques.
They will adapt, or GE will “part company with them if they cannot.”25
General Electric’s “work-out” program, a policy requiring managersto respond to suggestions from their staff, and 360-degree evaluationof managers followed from the values of empowerment, boundaryless-ness, and openness to new ideas.
Yet another chapter in the saga of performance measurement atGE unfolded in the late 1990s. While not renouncing empowerment,boundarylessness, and openness, CEO Jack Welch determined thatquality control is now the company’s number one priority, a matter ofsurvival. GE’s quality program . . . involves training “Black Belts” forfour months in statistical and other quality-enhancing measures. The
74 Rethinking Performance Measurement
Black Belts then spend all their time roaming GE plants and setting upquality improvement projects. Welch has “told young managers thatthey haven’t much future at GE unless they are selected to become BlackBelts. The company has trained 2,000 of them and plans to increasethat number to 4,000 by year end and to 10,000 by year 2000.”26 Formore senior managers, there is a different incentive for implementingthe quality control program. Forty percent of their bonuses depend onsuccessful implementation of it.
General Electric’s experience since the 1950s suggests several pat-terns. First, dramatic changes in performance measures do occur instellar firms like GE, suggesting that performance measures tend toexhaust themselves as strategies succeed. New performance measures,moreover, tend to be very different from existing measures, althoughrarely antagonistic to them (note, however, the contrast between thenew and the “older motivational technique” above). Changing per-formance measures thus does not signal failure and may augur wellfor success. Second, the changes in performance measures at GE weresometimes in the direction of elaboration and sometimes in the direc-tion of consolidation, suggesting that successful firms are attentive tothe number of measures they are tracking. In the 1950s and 1960s,the “Measurements Project” elaborated measures. In the 1970s, JackWelch consolidated measures (first or second – or else). In the early1990s, Mr. Welch elaborated measures (“work-out”), but in the late1990s he consolidated measures again (quality control). Third, firmsless confident than GE may be less willing to discard spent metrics and,as a consequence, find themselves less able to make strategic choicesand focus on a limited set of objectives.
A quantitative test
The proposition that new performance measures tend to be uncorre-lated with earlier measures is difficult to prove. A corollary of thisproposition can be tested, however. If information is lost as earlierperformance measures run down but restored when new performancemeasures uncorrelated with earlier measures are added, then perfor-mance measures used by more successful firms should exhibit some-what weaker correlations than performance measures used by less suc-cessful firms. In fact, one of the PIMS (Profit Impact of Market Strategy)databases shows that the most rapidly growing business units exhibit
The running down of performance measures 75
the weakest corrrelations among measured performance outcomes.Eight performance measures describing some 2700 business units arein the SPI4 data file of the PIMS database.27 Of the eight measures,three are returns-based, including return on investment, and return onsales, and internal rate of return. Three are non-financial measures:productivity, gauged as change in value added per employee, productquality, which taps change in quality relative to a firm’s top three com-petitors, and image, which is measured as change in comparison withthe three largest competitors. Finally, there are two growth measures:growth in sales and growth in market share. Three sets of correlationsamong these performance measures were computed, one for businessunits experiencing rapid growth in assets, a second for units whoseassets remain essentially flat, and the third for business units with de-clining assets. These correlations are lowest for businesses whose as-sets are growing and highest for declining-asset business units. Of thetwenty-eight correlations among the eight performance measures, tenare negative for business units whose assets are growing, nine are nega-tive for business units whose assets are flat, but only one is negative forbusiness units whose assets are declining.28 This pattern holds whenother variables, industry and stage of product life cycle are controlled.29
These data suggest, although they do not necessarily prove, that havingperformance measures that are different from but not antagonistic toeach other – in other words, uncorrelated performance measures – mayadvantage a firm, or, somewhat differently, that uncorrelated measuresdo not necessarily disadvantage a firm.
To recapitulate, I suggested that as performance measures run down,new measures uncorrelated with existing measures appear. As we sawearlier, the correlation of batting averages with newer measures ofplayer performance is low; hospitals replaced outcome measures withfunctional measures but are returning to outcome-based performancemeasures; J. D. Power is actively considering new measures of auto-motive quality differing from the number of defects reported in theirInitial Quality Survey. Uncorrelated measures may actually advantagefirms. The recent history of measurement at General Electric, which hasmoved from budget-based performance measures prior to the 1950s,to the elaborate performance assessment scheme developed by the“Measurements Project” of the 1960s and 1970s, to Jack Welch’s sim-ple but severe regimen of the 1980s, to a corporate philosophy rifewith fuzzy concepts requiring multiple measures in the early 1990s,
76 Rethinking Performance Measurement
and recently to a new emphasis on quality control, is consistent withthis proposition. So are some quantitative results based on the PIMSdata showing business units having the lowest correlations among per-formance measures to have the highest rates of business growth.
There are several ways to interpret these observations. The simplestis that simple and stable performance measures do not lead to busi-ness success. More realistically, while small and stable measures maylead to success for small firms in stable environments – keep in mindEnvirosystems from chapter 1 – success in large organizations mayhinge on having a larger set of measures that are different from butnot antagonistic to each other and on replacing measures as they rundown.
Can running down be inconsequential?
There are, of course, some circumstances where the variance of a per-formance measure is unimportant and measures do not change even ifthey do run down. But these circumstances are unusual. Consider oncemore the United Way thermometer discussed in chapter 1. Not only isthe same thermometer used every year, but the same measure – pledgesto date – is used to gauge performance year after year. The simplestexplanation for the persistence of pledges to date is that it is knownto predict the result sought. A department achieving 50 percent of itstarget in the first two days of a five-day pledge drive is on target andperforming well; a department failing to meet 50 percent of its target ismissing the mark. Cross-departmental variation is almost immaterialunder the circumstances. What is material is the comparison of eachdepartment’s pledges to date with its target, from which it is possible tojudge performance because the likelihood of meeting the target givencurrent pledges is known from experience.
Relative performance measurement and running down
Now let’s alter these circumstances. Imagine extending the United Waydrive to a year, or even two years. Lacking experience with an extendeddrive, coordinators will not know what fraction of pledges at the endof the first week is indicative of being on target, nor will they knowwhether pledges at the end of the first week bear any relevance to theultimate outcome of the campaign.
The running down of performance measures 77
Now imagine an extended United Way drive without a specific tar-get but, rather, a goal of maximizing contributions. Because there is notarget, no amount of experience would enable coordinators to judgewhether pledges at the end of the first week or at any point in the cam-paign are on target. Extending the time horizon and substituting max-imization for specific targets, then, makes it impossible to judge per-formance by comparing pledges to date with a target for total pledges.As a consequence, coordinators will begin watching one another andcomparing pledges to date. Such comparisons allow coordinators torate their performance relative to each other, although the conclusionsthey draw from these ratings may prove misleading because short-term accomplishments may have little bearing on long-term results.Such comparisons, moreover, will cause coordinators to imitate eachother’s behavior and ultimately to perform similarly, since it is a lawof human behavior that people who watch one another will eventu-ally behave like one another.30 Extending the United Way drive andreplacing specific targets with the goal of maximizing pledges, in otherwords, eventually causes differences in pledges to date to diminish andthe measure to run down.
Many performance measures more closely resemble those of a pro-tracted United Way campaign whose objective is to maximize the resultthan those of a typical one-week United Way campaign with a specifictarget. In business, as in the protracted United Way drive, performanceis measured relative to peers rather than relative to a target – thinkof any measure used to benchmark firms against one another. The re-lationship of performance measures to the result sought is uncertainbecause the result lies far ahead. Performance measures lose varianceover time because people who watch one another in order to appraisetheir performance also learn from one another. The impact of battingaverages on team standings is uncertain since success at bat does notalways translate into runs and wins, baseball players nonetheless striveto improve their batting averages, and the combined forces of learningand selection produce better batters (and better pitchers as well) whosebatting averages have become nearly indistinguishable and hence oflittle consequence for the game. Automotive quality measured by ini-tial defects, similarly, is judged against the competition. The impactof numbers of initial defects on sales and profits is uncertain becausemany other factors influence sales and profits, automobile manufac-turers nonetheless strive to reduce defects, and the combined forces of
78 Rethinking Performance Measurement
learning and selection also produce cars that are so nearly defect-freein the first 90 days that initial defects have become of little consequencefor sales and profits.
The use-it-and-lose-it principle in performance measurement
There are many lessons for managers. The most important is this:the use-it-and-lose-it principle operates in performance measurement.Measures that initially discriminate, or appear to discriminate, goodfrom bad performance lose the capacity to discriminate as their vari-ability declines and they run down. Measures run down for severalreasons, including positive learning, perverse learning or gaming, selec-tion of people or organizations with superior performance attributes,suppression of measures that fail to show improvement, and socialconsensus.
Running down is caused by people’s behavior when they are exposedto performance measures. Often, however, it is difficult to pinpointwhich kind of behavior causes measures to run down – specifically,positive learning or less desirable behavior – and for this reason mea-sures that have run down must be replaced by measures that have not.New measures with variability, in particular, must be different fromrun-down measures having little variability. Thus, slugging percentagereplaces batting average, functional measures of hospital performancereplace gross mortality, new-car defects weighted by severity replaceunweighted defects.
A secondary lesson is that running down is attenuated by turbulencein the environment. But turbulence, in turn, erodes the capacity of anymeasure to anticipate future cash flows, which comprise the economicperformance of the firm.
The running down of performance measures forces changes in somemeasures and leaves the remainder largely uncorrelated with the newmeasures, creating some ambiguity as to how performance should bemeasured. This ambiguity is at the core of the performance measure-ment enterprise. One way of addressing this ambiguity is to make avirtue of necessity and treat the performance of the firm as if it weremultidimensional because our performance measures happen multidi-mensionally. Multidimensionality is the essence of the balanced score-card. The problem is that treating performance as multidimensionalmakes it very difficult to appraise the overall performance of the firm or
The running down of performance measures 79
to compensate people for their performance. The next chapter, whichconcerns the “balanced scorecard,” focuses on the problem of com-bining diverse performance measures into a single appraisal of perfor-mance.
The bottom line� An important test of any performance measure is its ability to dis-
criminate good from bad performance. In other words, the measuremust reveal differences in performance.
� Many, although not all, performance measures lose the capacity todiscriminate good from bad performance with use. This is the run-ning down of performance measures.
� There are several causes of running down, among them positive learn-ing, perverse learning (gaming), selection, suppression, and socialconsensus. Since it is difficult to distinguish improvement from othercauses of running down, all measures that have run down are suspect.
� Turbulent environments attenuate the running down of performancemeasures. But, paradoxically, such turbulence makes it less certainthat measures will contain information about the economic perfor-mance of the firm, which lies ahead.
� Firms seek new and different measures to replace measures that haverun down. Since new measures strongly correlated with measures thathave run down will themselves have run down, the new measures willbe weakly correlated with existing measures. Performance measuresthus may be uncorrelated for good reason.
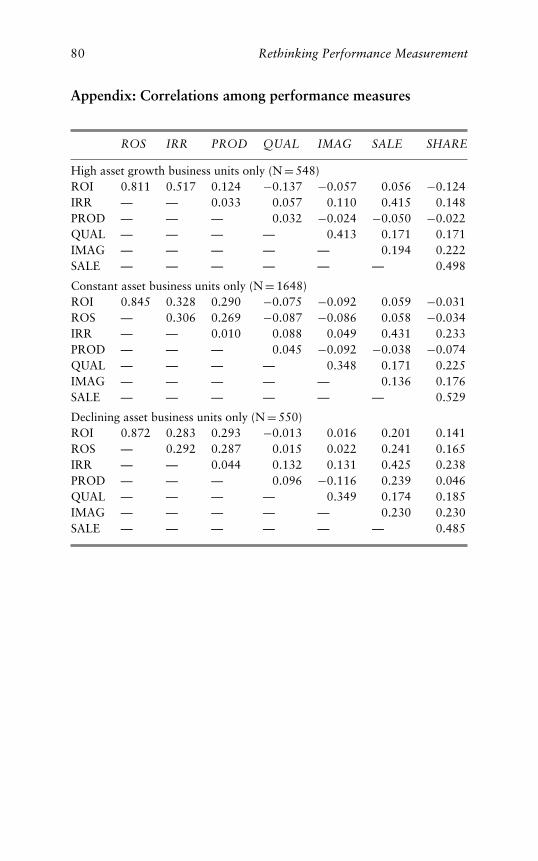
80 Rethinking Performance Measurement
Appendix: Correlations among performance measures
ROS IRR PROD QUAL IMAG SALE SHARE
High asset growth business units only (N = 548)ROI 0.811 0.517 0.124 −0.137 −0.057 0.056 −0.124IRR — — 0.033 0.057 0.110 0.415 0.148PROD — — — 0.032 −0.024 −0.050 −0.022QUAL — — — — 0.413 0.171 0.171IMAG — — — — — 0.194 0.222SALE — — — — — — 0.498
Constant asset business units only (N = 1648)ROI 0.845 0.328 0.290 −0.075 −0.092 0.059 −0.031ROS — 0.306 0.269 −0.087 −0.086 0.058 −0.034IRR — — 0.010 0.088 0.049 0.431 0.233PROD — — — 0.045 −0.092 −0.038 −0.074QUAL — — — — 0.348 0.171 0.225IMAG — — — — — 0.136 0.176SALE — — — — — — 0.529
Declining asset business units only (N = 550)ROI 0.872 0.283 0.293 −0.013 0.016 0.201 0.141ROS — 0.292 0.287 0.015 0.022 0.241 0.165IRR — — 0.044 0.132 0.131 0.425 0.238PROD — — — 0.096 −0.116 0.239 0.046QUAL — — — — 0.349 0.174 0.185IMAG — — — — — 0.230 0.230SALE — — — — — — 0.485
3 In search of balance
B alanced performance measurement is an appealing concept,but in practice it is very difficult. Balanced measurement in-volves measuring both financial and non-financial performance.
Often, non-financial performance is measured in several domains – forexample the customer, internal processes, and learning and innovation.The problem posed by balanced measurement is not measuring non-financial performance alongside financial performance; as we saw inchapter 1, most firms do this routinely. The problem, rather, is find-ing the right non-financial measures and then using these measuresin combination with financial measures to appraise and compensateperformance.
A balanced set of measures will include non-financial measures thatadd information about the economic performance of the firm beyondwhat is contained in financial measures – in other words, non-financialmeasures that look ahead. But as we saw in chapter 1, finding non-financial measures that actually look ahead, as opposed to measuresthat plausibly look ahead, can be challenging. Finding a satisfactoryway to combine ratings on several measures into an overall appraisal ofperformance is also challenging. It is easy to rate and rank, and henceappraise and compensate, performance based on a single measure. Butit is difficult to combine ratings on several measures into an overallperformance rating in a way that does not have pernicious effects.
As early as the 1970s, managers were skeptical that the performanceof the firm could be captured by a single financial measure such asearnings per share. But few managers were compensated on both fi-nancial and non-financial measures until the 1990s. This reluctance tofold financial and non-financial measures together changed with thepublication of two Harvard Business Review articles: Robert Eccles’“The performance measurement manifesto” (1991) and Robert Kaplanand David Norton’s “The balanced scorecard: measures that driveperformance” (1992). The two articles conveyed a similar message:
81
82 Rethinking Performance Measurement
financial measures alone are insufficient to gauge business perfor-mance. Eccles suggested that business models, which are conceptualrepresentations of relationships between non-financial measures andfinancial results, be used to identify the non-financial drivers of busi-ness outcomes. Kaplan and Norton recommended that measurementshould take place in the four domains of performance: financial,customer, internal business, and learning and innovation.
Kaplan and Norton’s notion of the “balanced scorecard” ultimatelyproved more influential than Eccles’ call for business performance mod-els, although not in the way intended. Kaplan and Norton viewed the“balanced scorecard” primarily as a tool for communicating strategy –in their terms “a framework for action” – and only secondarily as acompensation tool. “The Balanced Scorecard translates an organiza-tion’s mission into a comprehensive set of performance measures thatprovides the framework for a strategic measurement and managementsystem.”1 By the mid-1990s, however, between a third and two-thirdsof US companies had adopted the balanced scorecard or some variantof it for purposes of appraising and compensating the performance oftheir managers. Using the balanced scorecard to appraise and compen-sate performance, it turns out, is more difficult than using the scorecardfor strategic measurement. Finding the right scorecard measures – es-pecially non-financial measures that look ahead – is essential both forstrategic measurement and for appraising and compensating perfor-mance. Combining these measures into an appraisal of overall per-formance, however, while not essential to strategic measurement, isessential to compensating performance.
From financial measurement to balanced measurement andback again
The difficulty of achieving balanced measurement is well illustratedby intensive analysis of a single case, that of the US retail business ofGlobal Financial Services (GFS) and its Western region in particular.In 1993, GFS shifted from a performance appraisal and compensationsystem based on a single earnings measure to a balanced-scorecardapproach. There were two versions of the “balanced scorecard.” Ini-tially, GFS implemented formula-driven compensation in which theweights attached to measures were specified in advance. After two and ahalf years, formula-driven compensation proved unsatisfactory. It was
In search of balance 83
replaced by a highly subjective system in which the weights attached toindividual measures were not fixed in advance but revealed as compen-sation decisions were made. This subjective compensation system, inturn, encountered considerable resistance from GFS’s employees and,ultimately, its senior managers. In 1999, the effort to compensate peo-ple on both financial and non-financial performance was scrapped andreplaced by a system sensitive only to sales and earnings.
The focus on financial results: business unit earnings andmargins
Throughout the 1980s and early 1990s, the principal units of the busi-ness were its retail and commercial businesses. All GFS business unitswere held accountable mainly for financial results. The principal met-ric was business-unit earnings (essentially revenues less expenditures).The five regional units and more than 400 local branches in the US re-tail business were responsible for revenues, expenditures, and margins(the difference between revenues and expenditures). However, the sub-stantial costs of operating centralized check-clearing, collection, anddata-processing units were not charged to regional units and branchoperations. Thus, the margins these units reported were much higherthan actual earnings. Bonuses for regional and branch staff were con-tingent on meeting revenue and margin targets and were calculated aspercentages of base salaries. In other words, the compensation systemwas formulaic.
GFS encountered the shortcomings of financial measurement in theearly 1990s when the US real estate market collapsed, leaving thecommercial side of the business saddled with several billion dollars ofnon-performing assets. The initial response was to apply a tourniquet:expenditures and staff were cut dramatically. Once the cash hemor-rhage slowed, GFS’s management determined that it was critical tomeasure risks alongside earnings. Specifically, management declaredmulti-faceted or “textured” performance measurement should replacethe exclusive emphasis on financial results. In 1992, the US retail busi-ness developed a business model linking non-financial aspects of perfor-mance to financial performance. Customer satisfaction was identifiedas the key driver of profitability and market share and made pivotal tothe business model (see figure 3.1). The business model also groupednineteen activities into five categories of activity driving customer
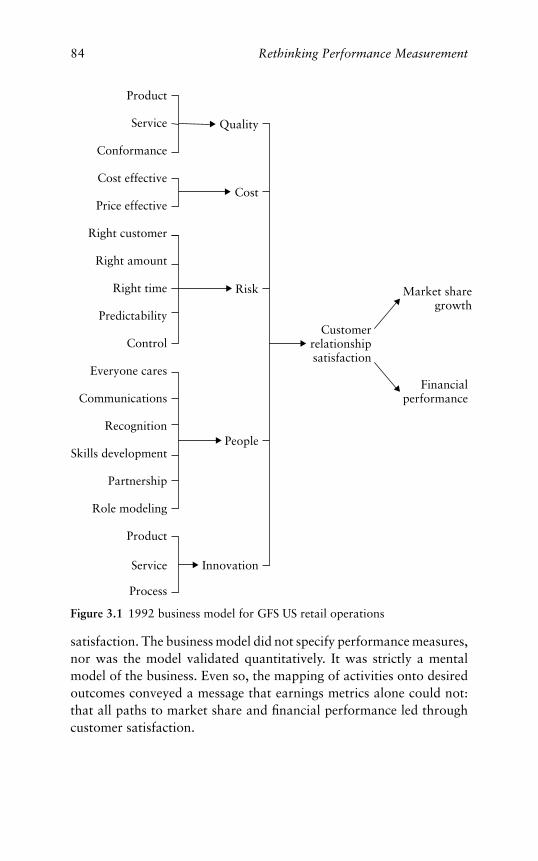
84 Rethinking Performance Measurement
Product
Service Quality
Conformance
Cost effectiveCost
Price effective
Right customer
Right amount
Right time Risk Market share growth
PredictabilityCustomer
relationshipsatisfaction
Control
Everyone caresFinancial
performanceCommunications
RecognitionPeople
Skills development
Partnership
Role modeling
Product
Service Innovation
Process
Figure 3.1 1992 business model for GFS US retail operations
satisfaction. The business model did not specify performance measures,nor was the model validated quantitatively. It was strictly a mentalmodel of the business. Even so, the mapping of activities onto desiredoutcomes conveyed a message that earnings metrics alone could not:that all paths to market share and financial performance led throughcustomer satisfaction.
In search of balance 85
The “performance improvement program”
In 1993 the business model was translated into a compensation scheme,the “performance improvement program,” also known as the “Per-formance Incentive Plan” (PIP). The purpose of PIP was to promoteGFS’s strategic mission of being “the best and only place for target cus-tomers and businesses to manage all of their money anytime, anywhere,any way they want” and to compensate staff for their accomplish-ments.
The Performance Incentive Plan was intended to be both balancedand formulaic: it included both financial and non-financial measures,and bonuses were determined by explicit formulas. The measures andformulas used by PIP are summarized in figure 3.1. To receive a quar-terly bonus, branches were required to receive satisfactory scores oninternal operational audits and to pass a customer-satisfaction hur-dle, as measured by a survey of customer satisfaction. The customer-satisfaction measures, like the PIP compensation formulas, evolvedover time. In 1993 and 1994, a single question asked customers torate their overall satisfaction with their primary branch on a seven-point scale. For each branch, the percentage of customers answering inthe top two categories, very satisfied and satisfied, was calculated. In1993, branches with customer-satisfaction levels in the top 75 percentreceived passing scores. In 1994, customer satisfaction levels statis-tically equal to or greater than the regional means received passingscores. In 1995, the single question was replaced by a branch qualityindex, a composite of twenty items believed to have better psychome-tric properties.2 Branch-quality indices that were statistically equal toor greater than the regional mean received passing scores in the 1995version of PIP.
In 1993, branches that passed the customer-satisfaction hurdle re-ceived quarterly bonuses for meeting targets in any one of the per-formance objectives related to growing the business, resource man-agement, and “overall performance.” In 1994, branches were alsorequired to meet at least four of the eight performance objectives tobe eligible to receive a quarterly bonus. In 1995, the objectives shiftedagain: to be eligible for bonuses, branches had to pass the branch-quality and audit-score hurdles and meet their financial (revenue andmargin) targets as well.
86 Rethinking Performance Measurement
In sum, new hurdles and goals were added to PIP each year. Thedocument outlining each year’s program grew accordingly from ninepages in 1993 to seventy-eight pages in 1995. The growing complexityof the PIP formulas had two causes. The first was management’s frustra-tion with a formula-driven compensation system that allowed branchesto earn bonuses without delivering financial results – in other words,management’s belief that PIP was being gamed. Thus, the 1995 PIPprogram added a financial hurdle that made it much more difficult forunprofitable branches to receive bonuses. The second cause was man-agement’s belief that retail banking customers were ultimately clientsof GFS, rather than a particular branch, and that their overall satisfac-tion with GFS was more significant for long-term business results thantheir satisfaction with their branches. As a senior GFS officer statedin 1994, “If we take a focus that ‘everything is all right with my areabut there’s something else wrong out there which is not my concern,’we will lose long term. You own the customer. That’s the fundamen-tal building block we have.” Thus, overall satisfaction with GFS wasadded as a performance objective in 1995 – at the same time that the 20-item branch-quality hurdle replaced the single-item branch-satisfactionhurdle. The available data do not permit an objective assessment, butPIP’s demise in 1995 suggests that GFS management judged its overallresults unsatisfactory.
The balanced scorecard
In early 1995, GFS refined its corporate strategy to focus on five“imperatives” for success over time: achieving good financial results,delivering for customers, managing costs strategically, managing risk,and having the right people in the right jobs. To evaluate progressagainst these imperatives, each of GFS’s principal businesses was re-quired to develop a “balanced scorecard” of related measures. A seniorexecutive outlined the goals of the balanced-scorecard approach inGFS’s employee newsletter:
The Balanced Scorecard is a simple matrix that leads us to examine howeach business, as well as the whole, does in all of those performance blocks.In the process, we can also assess individual performance against the samecriteria. It not only sums up what we want to do, it does it in a way thatassures everyone in the company knows what we are trying to accomplishand what is important in getting the job done.
In search of balance 87
Perhaps the most important thing about how it works is the balance. Ourpast problems can almost always be traced to too much of a single-mindedfocus on bottom-line earnings, or building revenues, or something else to theexclusion of other important issues. By forcing us to focus on all of the keyperformance factors, the Balanced Scorecard keeps us in balance.
The Western region of GFS’s US retail business replaced PIP with thebalanced scorecard performance evaluation and compensation systemin May 1995, and other regions followed in January 1996.
Six categories of performance made up the scorecard: financial per-formance, strategy implementation, customer performance, control,people-related performance, and standards. The first three score-card categories were measured using multiple quantitative indicators.Financial performance was measured by revenues, expenses, and mar-gins. Strategy implementation was measured by the number of premier,retail, and business/professional households, household attrition, as-sets under management, and assets per household through the firstquarter of 1996.3 After that, the strategy measures were retail as-set balances, market share, and new households and net revenueper household for each customer category (premier,4 retail, and busi-ness/professional) replacing household attrition, assets under manage-ment, and assets per household. Customer performance was measuredby overall satisfaction with GFS and the branch quality index, bothcarried over from the 1995 PIP program.
The remaining categories were measured by qualitative indicators.Control was assessed by the results of periodic internal audits of op-erations, regulatory compliance, and the integrity of business resultsreviews. People-related performance was judged by performance man-agement, teamwork, training and development, and employee satis-faction.5 Standards were judged by leadership, business ethics and in-tegrity, customer interaction and focus, community involvement, andcontribution to the overall business.
Unlike the formula-driven PIP, the balanced scorecard required areadirectors supervising branch managers to weight various performancemeasures subjectively. First, performance was compared with targetsfor each of the financial, strategy implementation, and customer mea-sures, resulting in a “par rating” for each measure. (“Below par,”“at par,” and “above par” signified performance relative to targets.)Ratings on individual measures were then combined subjectively into
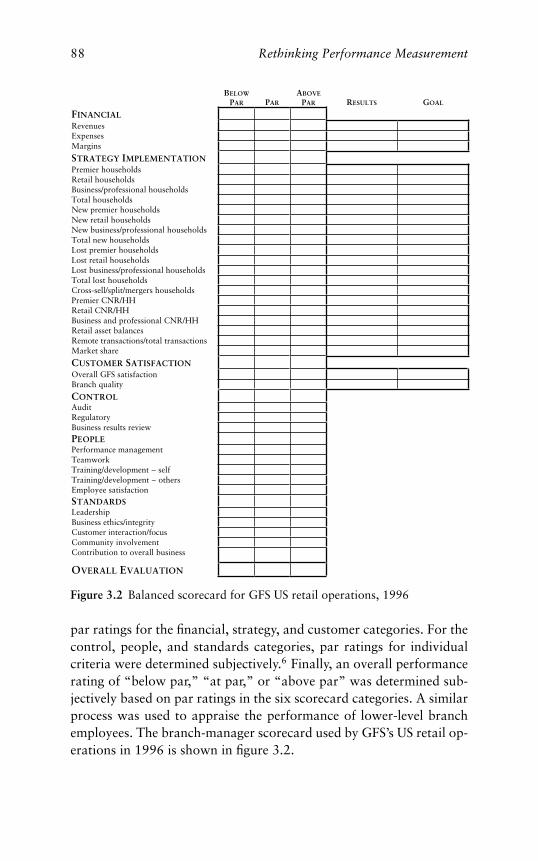
88 Rethinking Performance Measurement
BELOW
PAR
ABOVE
PARPAR RESULTS GOAL
FINANCIALRevenuesExpensesMargins
STRATEGY IMPLEMENTATIONPremier householdsRetail householdsBusiness/professional householdsTotal householdsNew premier householdsNew retail householdsNew business/professional householdsTotal new householdsLost premier householdsLost retail householdsLost business/professional householdsTotal lost householdsCross-sell/split/mergers householdsPremier CNR/HHRetail CNR/HHBusiness and professional CNR/HHRetail asset balances Remote transactions/total transactionsMarket share
CUSTOMER SATISFACTIONOverall GFS satisfaction Branch quality
CONTROLAuditRegulatoryBusiness results review
PEOPLEPerformance managementTeamworkTraining/development -- selfTraining/development -- othersEmployee satisfaction
STANDARDSLeadershipBusiness ethics/integrityCustomer interaction/focusCommunity involvementContribution to overall business
OVERALL EVALUATION
Figure 3.2 Balanced scorecard for GFS US retail operations, 1996
par ratings for the financial, strategy, and customer categories. For thecontrol, people, and standards categories, par ratings for individualcriteria were determined subjectively.6 Finally, an overall performancerating of “below par,” “at par,” or “above par” was determined sub-jectively based on par ratings in the six scorecard categories. A similarprocess was used to appraise the performance of lower-level branchemployees. The branch-manager scorecard used by GFS’s US retail op-erations in 1996 is shown in figure 3.2.
In search of balance 89
Area directors also recommended quarterly bonuses based on overallpar ratings of branch managers. Overall par ratings and bonus recom-mendations were discussed at meetings of the head of the region, hisstaff (the finance director, human resource director, compensation man-ager, and service quality director), and all Western region area directors.Discussions typically focused on the justification for the overall ratingrecommended for the branch manager, particularly above-par ratingsmaking managers eligible for substantial bonuses. The tenor of thesediscussions shifted from quarter to quarter in response to GFS’s shift-ing priorities. Sometimes, at-par financial performance disqualified amanager from an above-par overall rating. A below-par rating on cus-tomer performance could also preclude an above-par overall ratingregardless of financial performance. A below-par evaluation on con-trol, which meant that a branch had failed an audit, always precludedan above-par overall evaluation.
Quarterly bonuses were intended to achieve total market-based com-pensation levels (salary plus bonus) appropriate for a branch manager’slabor grade and performance level. For example, assume that totalcompensation for branch managers in the highest of the three laborgrades is targeted at up to $75,000 annually if performance is at par, upto $90,000 if performance is above par, and up to $105,000 (or more)if performance is exceptional. If a manager in this labor grade earned asalary of $80,000 and had an above-par performance rating, the max-imum quarterly bonus would be $2,500 ($10,000/4). If the manager’ssalary were $90,000 or more, no bonus would be awarded despitethe above-par performance. The PIP formula, by contrast, awardeda bonus percentage regardless of base salary (e.g., a branch managerearning $80,000 and eligible for a 15 percent bonus would receive a$3,000 quarterly bonus; at a salary of $90,000 the same person wouldreceive $3,375).
Almost from the outset, the balanced scorecard encountered threekinds of problems. First, the process proved to be extremely complexand time consuming, at least initially. Some area directors spent asmuch as ten to twelve days per quarter completing scorecards, review-ing them with branch managers, and defending their recommendations.Eighteen months into the process, area directors in the Western regionstill spent an average of six days per quarter on scorecard issues. Saidone, “We dread it every time.” Second, branch managers and theiremployees could not understand how they were compensated. Third,
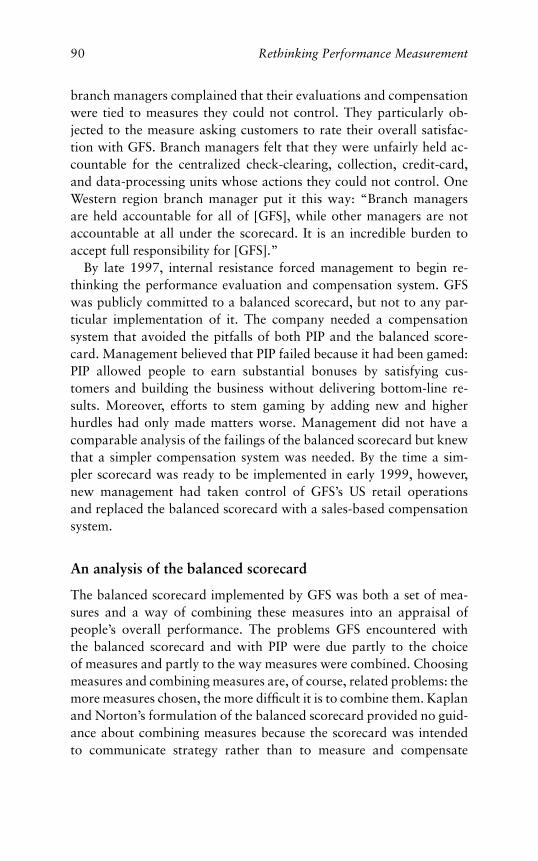
90 Rethinking Performance Measurement
branch managers complained that their evaluations and compensationwere tied to measures they could not control. They particularly ob-jected to the measure asking customers to rate their overall satisfac-tion with GFS. Branch managers felt that they were unfairly held ac-countable for the centralized check-clearing, collection, credit-card,and data-processing units whose actions they could not control. OneWestern region branch manager put it this way: “Branch managersare held accountable for all of [GFS], while other managers are notaccountable at all under the scorecard. It is an incredible burden toaccept full responsibility for [GFS].”
By late 1997, internal resistance forced management to begin re-thinking the performance evaluation and compensation system. GFSwas publicly committed to a balanced scorecard, but not to any par-ticular implementation of it. The company needed a compensationsystem that avoided the pitfalls of both PIP and the balanced score-card. Management believed that PIP failed because it had been gamed:PIP allowed people to earn substantial bonuses by satisfying cus-tomers and building the business without delivering bottom-line re-sults. Moreover, efforts to stem gaming by adding new and higherhurdles had only made matters worse. Management did not have acomparable analysis of the failings of the balanced scorecard but knewthat a simpler compensation system was needed. By the time a sim-pler scorecard was ready to be implemented in early 1999, however,new management had taken control of GFS’s US retail operationsand replaced the balanced scorecard with a sales-based compensationsystem.
An analysis of the balanced scorecard
The balanced scorecard implemented by GFS was both a set of mea-sures and a way of combining these measures into an appraisal ofpeople’s overall performance. The problems GFS encountered withthe balanced scorecard and with PIP were due partly to the choiceof measures and partly to the way measures were combined. Choosingmeasures and combining measures are, of course, related problems: themore measures chosen, the more difficult it is to combine them. Kaplanand Norton’s formulation of the balanced scorecard provided no guid-ance about combining measures because the scorecard was intendedto communicate strategy rather than to measure and compensate
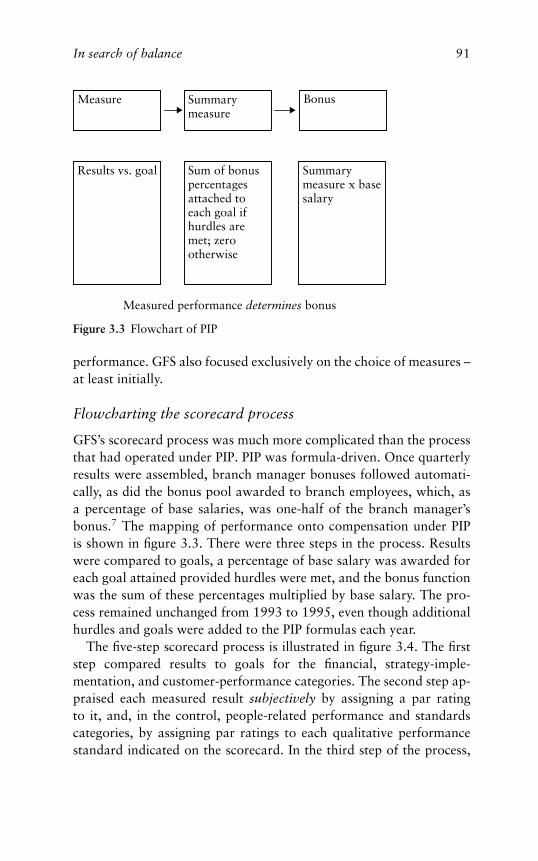
In search of balance 91
Summarymeasure x basesalary
BonusSummarymeasure
Measure
Results vs. goal Sum of bonuspercentagesattached toeach goal ifhurdles aremet; zerootherwise
Measured performance determines bonus
Figure 3.3 Flowchart of PIP
performance. GFS also focused exclusively on the choice of measures –at least initially.
Flowcharting the scorecard process
GFS’s scorecard process was much more complicated than the processthat had operated under PIP. PIP was formula-driven. Once quarterlyresults were assembled, branch manager bonuses followed automati-cally, as did the bonus pool awarded to branch employees, which, asa percentage of base salaries, was one-half of the branch manager’sbonus.7 The mapping of performance onto compensation under PIPis shown in figure 3.3. There were three steps in the process. Resultswere compared to goals, a percentage of base salary was awarded foreach goal attained provided hurdles were met, and the bonus functionwas the sum of these percentages multiplied by base salary. The pro-cess remained unchanged from 1993 to 1995, even though additionalhurdles and goals were added to the PIP formulas each year.
The five-step scorecard process is illustrated in figure 3.4. The firststep compared results to goals for the financial, strategy-imple-mentation, and customer-performance categories. The second step ap-praised each measured result subjectively by assigning a par ratingto it, and, in the control, people-related performance and standardscategories, by assigning par ratings to each qualitative performancestandard indicated on the scorecard. In the third step of the process,
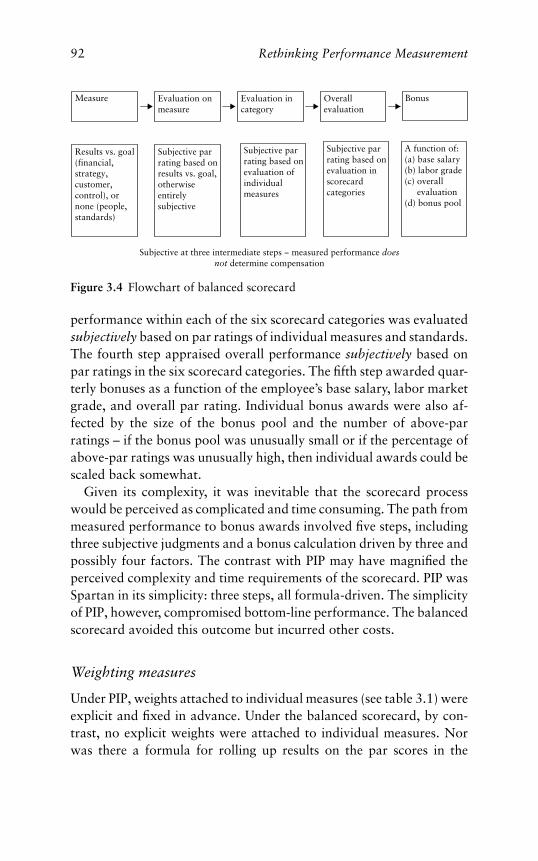
92 Rethinking Performance Measurement
BonusOverallevaluation
Subjective parrating based onevaluation ofindividualmeasures
Subjective parrating based onevaluation inscorecardcategories
A function of:(a) base salary(b) labor grade(c) overall evaluation(d) bonus pool
Evaluation incategory
Evaluation onmeasure
Measure
Results vs. goal(financial,strategy,customer,control), ornone (people,standards)
Subjective parrating based onresults vs. goal,otherwiseentirelysubjective
Subjective at three intermediate steps -- measured performance doesnot determine compensation
Figure 3.4 Flowchart of balanced scorecard
performance within each of the six scorecard categories was evaluatedsubjectively based on par ratings of individual measures and standards.The fourth step appraised overall performance subjectively based onpar ratings in the six scorecard categories. The fifth step awarded quar-terly bonuses as a function of the employee’s base salary, labor marketgrade, and overall par rating. Individual bonus awards were also af-fected by the size of the bonus pool and the number of above-parratings – if the bonus pool was unusually small or if the percentage ofabove-par ratings was unusually high, then individual awards could bescaled back somewhat.
Given its complexity, it was inevitable that the scorecard processwould be perceived as complicated and time consuming. The path frommeasured performance to bonus awards involved five steps, includingthree subjective judgments and a bonus calculation driven by three andpossibly four factors. The contrast with PIP may have magnified theperceived complexity and time requirements of the scorecard. PIP wasSpartan in its simplicity: three steps, all formula-driven. The simplicityof PIP, however, compromised bottom-line performance. The balancedscorecard avoided this outcome but incurred other costs.
Weighting measures
Under PIP, weights attached to individual measures (see table 3.1) wereexplicit and fixed in advance. Under the balanced scorecard, by con-trast, no explicit weights were attached to individual measures. Norwas there a formula for rolling up results on the par scores in the
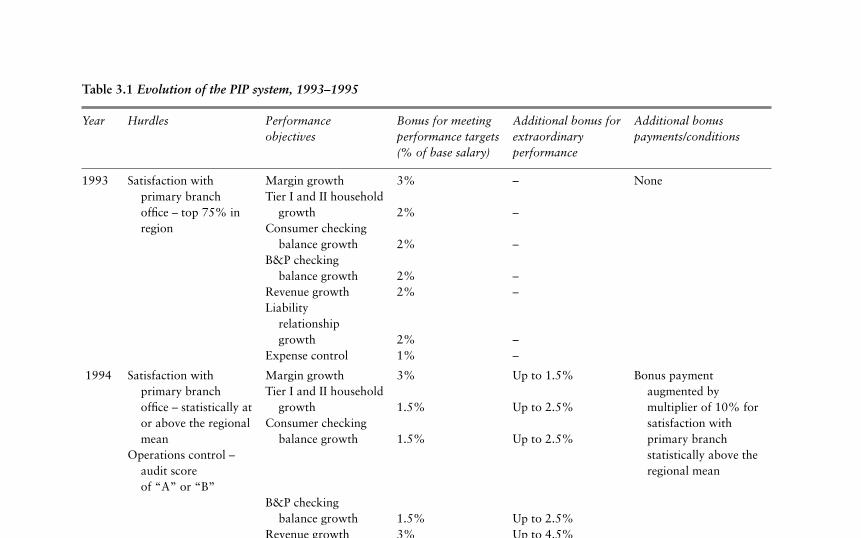
Table 3.1 Evolution of the PIP system, 1993–1995
Year Hurdles Performance Bonus for meeting Additional bonus for Additional bonusobjectives performance targets extraordinary payments/conditions
(% of base salary) performance
1993 Satisfaction with Margin growth 3% – Noneprimary branch Tier I and II householdoffice – top 75% in growth 2% –region Consumer checking
balance growth 2% –B&P checking
balance growth 2% –Revenue growth 2% –Liability
relationshipgrowth 2% –
Expense control 1% –
1994 Satisfaction with Margin growth 3% Up to 1.5% Bonus paymentprimary branch Tier I and II household augmented byoffice – statistically at growth 1.5% Up to 2.5% multiplier of 10% foror above the regional Consumer checking satisfaction withmean balance growth 1.5% Up to 2.5% primary branch
Operations control – statistically above theaudit score regional meanof “A” or “B”
B&P checkingbalance growth 1.5% Up to 2.5%
Revenue growth 3% Up to 4.5%
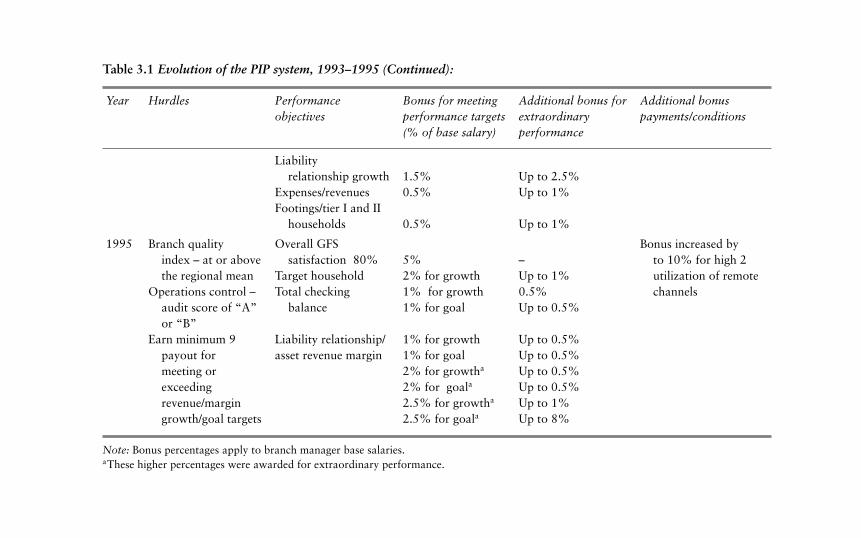
Table 3.1 Evolution of the PIP system, 1993–1995 (Continued):
Year Hurdles Performance Bonus for meeting Additional bonus for Additional bonusobjectives performance targets extraordinary payments/conditions
(% of base salary) performance
Liabilityrelationship growth 1.5% Up to 2.5%
Expenses/revenues 0.5% Up to 1%Footings/tier I and II
households 0.5% Up to 1%
1995 Branch quality Overall GFS Bonus increased byindex – at or above satisfaction 80% 5% – to 10% for high 2the regional mean Target household 2% for growth Up to 1% utilization of remote
Operations control – Total checking 1% for growth 0.5% channelsaudit score of “A” balance 1% for goal Up to 0.5%or “B”
Earn minimum 9 Liability relationship/ 1% for growth Up to 0.5%payout for asset revenue margin 1% for goal Up to 0.5%meeting or 2% for growtha Up to 0.5%exceeding 2% for goala Up to 0.5%revenue/margin 2.5% for growtha Up to 1%growth/goal targets 2.5% for goala Up to 8%
Note: Bonus percentages apply to branch manager base salaries.aThese higher percentages were awarded for extraordinary performance.
In search of balance 95
six scorecard categories into an evaluation of overall performance oractual quarterly bonus payouts. Instead, weights were attached to mea-sures and par scores in the six categories only implicitly during perfor-mance evaluations.
As it turned out, the implicit weights of par ratings in the six score-card categories varied dramatically from quarter to quarter. The im-pact of par ratings for financial performance, strategy implementa-tion, customer performance, financial control, people management,and standards on branch managers’ overall par ratings varied dra-matically throughout the fifteen quarters of the balanced scorecard’simplementation in GFS’s Western region (the second quarter of 1995through the fourth quarter of 1998). Eta-squared statistics, which mea-sure the incremental explanatory power of each measure, range from0.21 to 0.62 for the financial par score, from 0.01 to 0.27 for the strat-egy par score, from 0.01 to 0.47 for the customer par score, from 0.00to 0.19 for the control par score, from 0.00 to 0.27 for the people parscore, and from 0.00 to 0.25 for the par score for standards over thefifteen quarters of scorecard implementation. The median eta-squaredstatistics over these quarters was 0.41 for the financial par score, 0.11for the strategy par score, 0.27 for the customer par score (which, inturn, was driven entirely by overall GFS satisfaction and not at all bythe branch quality index), and 0.04, 0.07, and 0.02 respectively for thecontrol, people, and standards par scores.
The impact of par ratings in the same six categories on quarterlybonus payouts was smaller, but still varied greatly. Here, the eta-squared statistics range from 0.07 to 0.51 for the financial par score,from 0.01 to 0.24 for the strategy par score, from 0.00 to 0.37 for thecustomer par score, and were quite small and statistically insignificantin all but a few instances for the control, people, and standards parscores. The median eta-squared statistics over the fifteen quarters was0.24 for the financial par score, 0.05 for the strategy par score, 0.08for the customer par score, and 0.05, 0.03, and 0.01 respectively forthe control, people, and standards par scores.
The overall picture that emerges is one of considerably variabilityin the implicit weights attached to different elements of GFS’s score-card and hence substantial uncertainty about the impact of par scoresin the six scorecard-category bonus payouts. This said, the impact ofthe financial par score on overall par ratings and on quarterly bonuseswas greater than that of the par scores in the other five categories. The
96 Rethinking Performance Measurement
implication should not be missed: since financial performance was re-warded more consistently than performance in other categories whileperformance in the people, control, and standards categories was rarelyif ever rewarded, the subjectivity of the scorecard process had the unin-tended consequence of focusing attention on financial performance. Inother words, the balanced scorecard, as implemented at GFS, createdboth uncertainty (because performance in all six scorecard categorieswas rewarded inconsistently) and imbalance (because performance inthree of the six scorecard categories was rarely rewarded).
The critical question, of course, is whether the level of uncertainty in-duced by the subjectivity of the scorecard process was desirable. Fromthe perspective of management, some subjectivity was desirable be-cause it precluded the kind of gaming that had been endemic to PIP.Additionally, subjectivity allowed the compensation system to adapt tochanging circumstances of the business and individual branches. Fromthe perspective of branch managers and their employees (and virtuallyall theories of motivation), however, the level of subjectivity created bythe scorecard was undesirable because it eroded perceived connectionsbetween measured performance (save for financial performance), theevaluation of performance, and compensation for this performance.The tension between these perspectives is understandable, but it wasaggravated by the need to combine several dissimilar measures into anappraisal of overall performance and a bonus payout.
This raises the question of whether the balanced scorecard imposesinconsistent requirements when used to appraise and compensate per-formance. One requirement is measurement of non-financial perfor-mance alongside financial performance in the expectation that at leastsome non-financial measures will contain information about long-termeconomic performance not contained in financial measures. Of neces-sity, the more domains of non-financial performance measured, themore dissimilar measures will be. Another requirement is combin-ing dissimilar measures into an appraisal of overall performance. Ifmeasures are combined by formula, as under PIP, they will be gamedquickly and become unreliable as people reach for the low-hangingfruit. But if measures are combined subjectively, as under GFS’s versionof the balanced scorecard, perceived connections between performanceand rewards will erode, and motivation will suffer correspondingly.One possibility is that scorecards can be made more parsimonious sothat there are fewer dissimilar measures and hence less gaming of them
In search of balance 97
and less subjectivity in combining them – GFS’s scorecard did havemore measures than the scorecards of other financial service firms.8
But to make scorecards truly parsimonious, firms must be able to sep-arate the few non-financial measures that contain information abouteconomic performance from the many measures that do not.
Finding measures that look aheadto bottom-line performance
GFS’s management implemented the balanced scorecard to compensatepeople for performance on measures that drive future business resultsas well as for current business results. Financial performance, as wehave seen, was weighted more consistently and heavily in compen-sation decisions than performance in other scorecard categories. Thisraised the question of whether any of the non-financial measures on thescorecard, especially items that were measured objectively, containedinformation about future financial performance. The analysis modeledchanges in branch margins as a function of earlier changes in six strat-egy implementation measures (number of customers and customer netrevenue for three segments, premier households, retail households, andbusiness/professional relationships, and two customer measures, over-all GFS satisfaction and the branch quality index, the latter a compositeof twenty questionnaire items covering most aspects of branch service.The results, though straightforward, were surprising: the branch qual-ity index had a powerful impact on revenues and margins9 as well ason the number of retail and business/professional households.10 Thenumber of premier and retail households and business/professional re-lationships, however, had no impact on revenues and margins, whilethe single-item GFS satisfaction measure had no discernible impact onrevenues, margins, or households. Figure 3.5 illustrates these resultsschematically.
When the branch quality index was examined to determine whichof its components actually drove revenues and margins, the outcomewas also surprising.11 It had been anticipated that overall satisfactionwith the quality of branch service, a single item that was weighted 45percent in the branch-quality index, would have the greatest impact onrevenues and margins. This expectation was not confirmed. Instead, theitem that dominated bottom-line results was: “Please rate the overallquality of the teller who last served you . . .”12 The perceived quality of
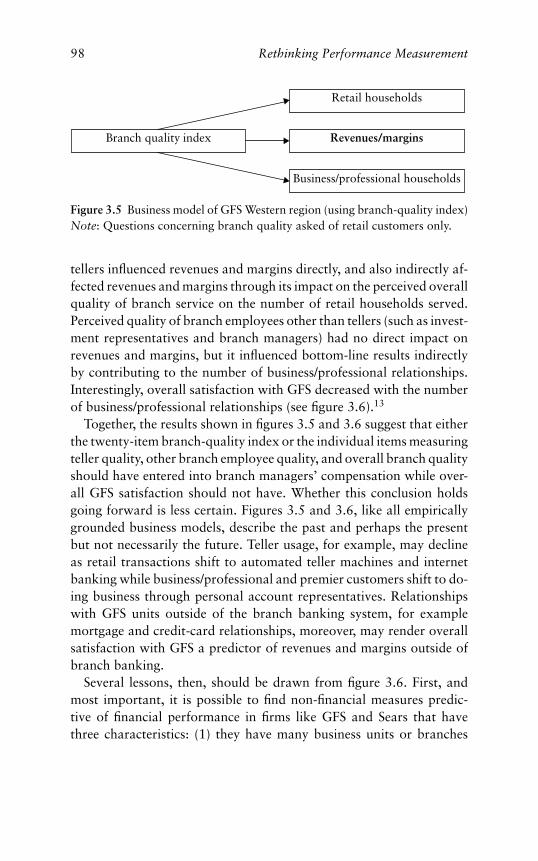
98 Rethinking Performance Measurement
Branch quality index
Retail households
Business/professional households
Revenues/margins
Figure 3.5 Business model of GFS Western region (using branch-quality index)Note: Questions concerning branch quality asked of retail customers only.
tellers influenced revenues and margins directly, and also indirectly af-fected revenues and margins through its impact on the perceived overallquality of branch service on the number of retail households served.Perceived quality of branch employees other than tellers (such as invest-ment representatives and branch managers) had no direct impact onrevenues and margins, but it influenced bottom-line results indirectlyby contributing to the number of business/professional relationships.Interestingly, overall satisfaction with GFS decreased with the numberof business/professional relationships (see figure 3.6).13
Together, the results shown in figures 3.5 and 3.6 suggest that eitherthe twenty-item branch-quality index or the individual items measuringteller quality, other branch employee quality, and overall branch qualityshould have entered into branch managers’ compensation while over-all GFS satisfaction should not have. Whether this conclusion holdsgoing forward is less certain. Figures 3.5 and 3.6, like all empiricallygrounded business models, describe the past and perhaps the presentbut not necessarily the future. Teller usage, for example, may declineas retail transactions shift to automated teller machines and internetbanking while business/professional and premier customers shift to do-ing business through personal account representatives. Relationshipswith GFS units outside of the branch banking system, for examplemortgage and credit-card relationships, moreover, may render overallsatisfaction with GFS a predictor of revenues and margins outside ofbranch banking.
Several lessons, then, should be drawn from figure 3.6. First, andmost important, it is possible to find non-financial measures predic-tive of financial performance in firms like GFS and Sears that havethree characteristics: (1) they have many business units or branches
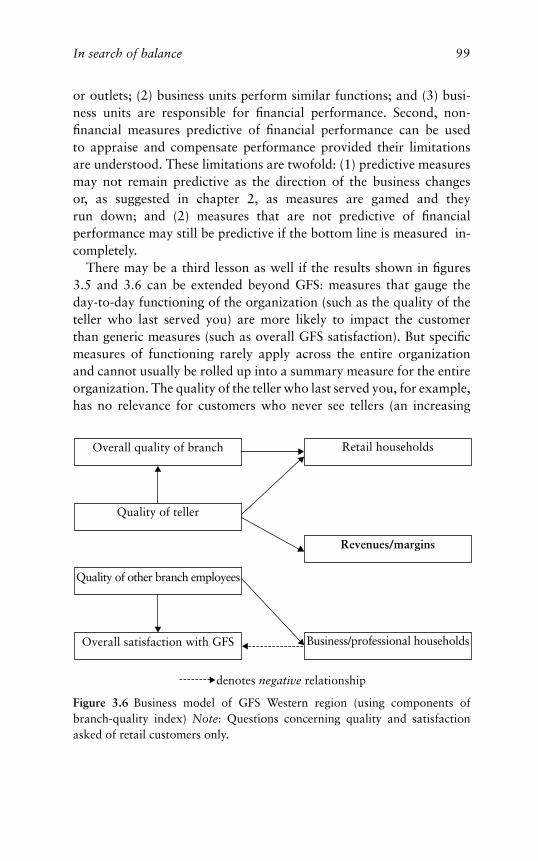
In search of balance 99
or outlets; (2) business units perform similar functions; and (3) busi-ness units are responsible for financial performance. Second, non-financial measures predictive of financial performance can be usedto appraise and compensate performance provided their limitationsare understood. These limitations are twofold: (1) predictive measuresmay not remain predictive as the direction of the business changesor, as suggested in chapter 2, as measures are gamed and theyrun down; and (2) measures that are not predictive of financialperformance may still be predictive if the bottom line is measured in-completely.
There may be a third lesson as well if the results shown in figures3.5 and 3.6 can be extended beyond GFS: measures that gauge theday-to-day functioning of the organization (such as the quality of theteller who last served you) are more likely to impact the customerthan generic measures (such as overall GFS satisfaction). But specificmeasures of functioning rarely apply across the entire organizationand cannot usually be rolled up into a summary measure for the entireorganization. The quality of the teller who last served you, for example,has no relevance for customers who never see tellers (an increasing
Revenues/margins
Business/professional households
Retail households
Overall satisfaction with GFS
Quality of other branch employees
Quality of teller
Overall quality of branch
denotes negative relationship
Figure 3.6 Business model of GFS Western region (using components ofbranch-quality index) Note: Questions concerning quality and satisfactionasked of retail customers only.
100 Rethinking Performance Measurement
proportion of GFS retail customers) or for GFS customers who do notpatronize the retail businesses.
By contrast, generic measures that are removed from the orga-nization’s functioning contain less information about bottom-lineperformance than specific measures of functioning but are easier toroll up from the bottom to the top of the organization. Overall satis-faction with GFS, for example, while easily measured for all of GFS’scustomers, contains little information about bottom-line performancebecause customers’ points of contact with the organization and theirexperiences at these sites vary greatly.
The tradeoff is difficult between measures that gauge day-to-dayfunctioning but cannot be rolled up and more generic measures thatcan be rolled up. Under some circumstances, as we will see in the nexttwo chapters, it is best to avoid this tradeoff by driving bottom-linemeasures to the level of individual customers and activities performedfor them.
What did the balanced scorecard communicate toemployees?
Employee surveys taken nine months before and nine months afterimplementation of the scorecard in the Western region indicate thatemployees were more likely to agree that “Measures of quality existto help assess my job performance” after scorecard implementationthan before. There was no change in employees’ agreement with thestatement, “I understand the business goals of [GFS]” between the twosurveys, but Western region employees were significantly less likely toagree that “I get adequate information about progress against busi-ness goals” after implementation of the scorecard than before it. Whilethe scorecard communicated measures more effectively and commu-nicated strategy about as effectively as the earlier PIP, it communi-cated information about performance less effectively, probably dueto its subjectivity. It appears that the balanced scorecard created un-certainty about compensation. The only evidence on compensationcomes from the December 1996 survey of Northern region employ-ees twelve months after the scorecard was rolled out in the region,Fifty-five percent of employees surveyed agreed with the statement,“When it comes to scorecard bonuses, I have no idea who gets what orwhy.”
In search of balance 101
The elements of balanced performance measurement
At this point, it may be more useful to step back from GFS’s imple-mentation of the balanced scorecard to discuss balanced performancemeasurement more analytically. A framework for this discussion isshown in figure 3.7.
Balanced performance measurement is defined at the apex offigure 3.7. Balanced performance measurement involves measuring,appraising, and compensating both financial and non-financial perfor-mance. In principle, balanced measurement does not give priority tosome non-financial measures over others, although in practice manyfirms have focused non-financial measurement in the three categoriessuggested by Kaplan and Norton – internal process, customer learn-ing, and innovation. Balanced performance measurement, however,does impose two general requirements. The first requirement is findingthe right measures, that is financial measures and non-financial mea-sures predictive of long-term financial performance, in other words,non-financial measures that look ahead alongside financial measuresthat look behind. The second requirement is combining financial andnon-financial measures, which are dissimilar, into a single appraisal ofperformance and a bonus payout or salary increment.
Finding the right measures
Choose the initial measuresThe first step toward finding the right measures is initial selection ofmeasures. The initial selection often takes place in the context of abusiness model or a statement of the firm’s strategy. GFS’s 1992 busi-ness model (see figure 3.1) guided the selection of measures for PIP,and the five strategic “imperatives” GFS announced in 1995 guidedthe selection of balanced scorecard categories and measures.
Consider tradeoffs between generic and specific measuresThe second step is considering tradeoffs between generic measures sev-eral steps removed from the functioning of the organization, for exam-ple overall GFS satisfaction, and specific measures capturing day-to-day functioning, for example teller quality. Several tradeoffs must beconsidered. Generic measures apply across the organization, whereasspecific measures apply to particular businesses or functions within the
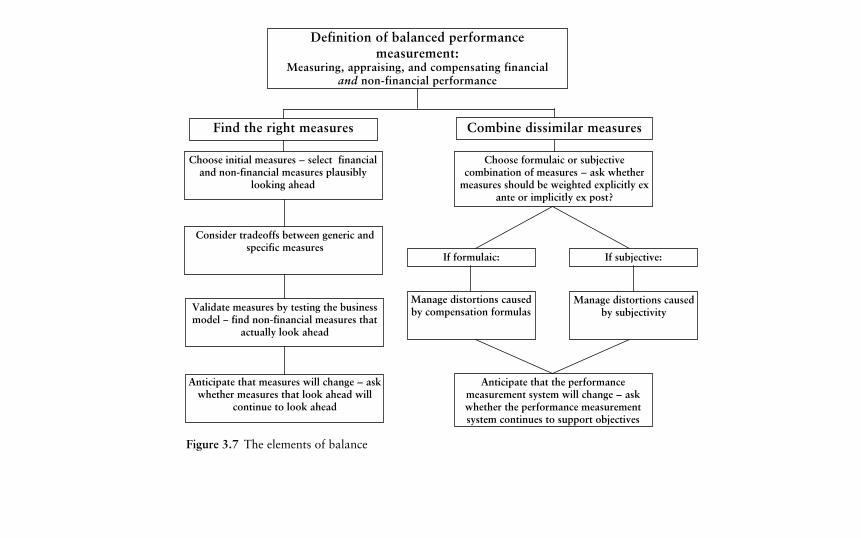
Consider tradeoffs between generic andspecific measures
Anticipate that measures will change -- askwhether measures that look ahead will
continue to look ahead
Validate measures by testing the businessmodel -- find non-financial measures that
actually look ahead
Choose initial measures -- select financialand non-financial measures plausibly
looking ahead
Definition of balanced performancemeasurement:
Measuring, appraising, and compensating financialand non-financial performance
Manage distortions causedby subjectivity
Manage distortions causedby compensation formulas
Choose formulaic or subjectivecombination of measures -- ask whether
measures should be weighted explicitly exante or implicitly ex post?
Anticipate that the performancemeasurement system will change -- askwhether the performance measurementsystem continues to support objectives
Find the right measures Combine dissimilar measures
If formulaic: If subjective:
Figure 3.7 The elements of balance
In search of balance 103
organization. Generic measures usually originate at the top of the or-ganization and are cascaded from top to bottom of the organization,whereas specific measures usually originate at the bottom and can-not be rolled up from bottom to top. Generic measures, additionally,are less likely to look ahead – to predict financial performance – thanspecific measures. Overall GFS satisfaction, for example, does not pre-dict financial performance, whereas teller quality predicts financial per-formance for GFS’s retail branches but does not apply outside of thebranch banking system.
Sometimes measurement error is reduced by combining several spe-cific measures into a composite measure. Composite measures like thebranch-quality index are not generic measures but, rather, apply to par-ticular businesses or functions like the specific measures from whichthey are formed. Composite measures, as a consequence, predict finan-cial performance even better than specific measures but, like specificmeasures, usually cannot be rolled up from the bottom to the top ofthe organization.
Validate measures by testing the business modelThe third step is validating measures by testing the business modelstatistically to identify non-financial measures actually predicting fi-nancial performance. Sears, it will be recalled from chapter 1, eval-uated the impact of seventy measures of employee satisfaction andcustomer satisfaction on the financial performance of its retail storesbefore weighting these measures in compensation. The modeling exer-cise identified ten measures of employee and customer measures drivingfinancial performance, and two-thirds of long-term compensation wasthen based on these measures. GFS, by contrast, chose PIP measures,the weights applied to PIP measures, and balanced scorecard measuresbefore evaluating the impact of non-financial measures on the bottom-line performance of their branches. To be sure, GFS modified PIP and,to a lesser extent, balanced scorecard measures as experience accumu-lated, but GFS never undertook the kind of statistical analysis reportedin the chapter.
Firms having a large number of similar business units like Searsand GFS can estimate the impact of non-financial measures on finan-cial results and hence test business models statistically. Statistical testswill yield reliable results for firms with fewer than thirty or forty sim-ilar business units. And statistical tests are unlikely to be valid for
104 Rethinking Performance Measurement
diversified firms and for functionally organized firms whose units arehighly dissimilar. Thus, many firms, perhaps the majority, will be un-able to determine which non-financial measures predict financial per-formance, and hence will be unable to validate the business modelsimplicit in their initial selection of measures.
Anticipate that measures will changeThe last step in finding the right measures is anticipating that measureswill change. One source of change is uncertainty: will unforeseeablechanges or even changes that are foreseeable affect the non-financialmeasures predicting financial performance? Firms in stable industriesthat are not contemplating strategic changes (think of Envirosystems)are unlikely to encounter unforeseeable changes affecting the predic-tors of financial performance, whereas firms in industries perturbed byevents like deregulation can anticipate that the predictors of financialperformance will change dramatically. A second source of change is therunning process described in chapter 2. The more attention focused ona performance measure, the greater the temptation to game the measureand drive variation and hence predictive power from it. The implica-tion, of course, is that even the best measures must be reexamined fromtime to time.
Combining dissimilar measures
Choose between formulaic and subjective combination of measuresFirms normally rely on compensation formulas to combine finan-cial and non-financial measures into an appraisal of overall perfor-mance and a bonus payout or salary adjustment. Pioneer Petroleum’sscorecard-based incentive compensation plan, for example, combinedfive financial and eight non-financial measures by assigning explicitweights to each.14 GFS, like Pioneer Petroleum, combined measuresby assigning explicit weights to financial and non-financial measuresunder PIP. In both cases, measures were weighted explicitly beforecompensation decisions were made. GFS, unlike Pioneer Petroleum,later abandoned explicit weighting of measures by allowing measuresto be combined subjectively under the balanced scorecard, that is, byweighting measures implicitly as compensation decisions were made.GFS’s experience, then, suggests that firms have the choice of com-bining measures either formulaically where weights are explicit and
In search of balance 105
assigned to measures ex ante or subjectively where weights are implicitand assigned to measures ex post.
Manage distortions caused by compensation formulasCombining measures formulaically creates two kinds of distortions.One, which was observed at GFS, is outright gaming of measures: peo-ple achieve high levels of performance where targets can be met easily(for example, sales) while ignoring more difficult targets (for example,profitability). The most common corrective is setting minimum thresh-olds for all performance measures and then withholding bonuses orsalary increments for people failing to meet any of these thresholds.GFS, in fact, took this approach under PIP, but the bonus formulasthat resulted became so complicated that PIP had to be abandoned af-ter three years. A second distortion is caused by inattention to measureswhose percentage weightings in compensation formulas are small. Twoof Pioneer Petroleum’s five financial measures and five of its eight non-financial measures were weighted 3 percent or less – in all, seven ofPioneeer Petroleum’s thirteen scorecard measure accounted for only 19percent of compensation. It is hard to imagine that executives wouldpay much attention to these measures when margins, return on equity,and cost management accounted for 54 percent of their compensation.Whether or not these distortions can be fully managed is unclear. Gam-ing can be managed to some extent by replacing measures where targetsare too easily met, and inattention to measures with small percentageweightings can be managed by consolidating measures weighted lessthan 10 percent. The challenge, of course, is maintaining balanced per-formance measurement while continually replacing and consolidatingmeasures.
Manage distortions caused by subjectivityCombining measures subjectively creates different distortions. Onedistortion is diminished expectancies: subjectivity in appraising andcompensating performance will lead people to believe that rewardshave become disconnected from measured performance. This discon-nection will weaken people’s motivation and, ultimately, cause theiractual performance to decline. Majority agreement with the statement“When it comes to scorecard bonuses, I have no idea who gets what orwhy” suggests that performance-to-outcome expectancies declined asa result of GFS’s implementation of the balanced scorecard. A second
106 Rethinking Performance Measurement
distortion caused by subjectivity is reversion to unbalanced measure-ment – whether inadvertently or deliberately, the implicit weightingof financial performance increases while the weightings attached tonon-financial measures decline. When subjectivity causes reversion tounbalanced measurement, a firm incurs all of the costs of balanced per-formance measurement, including diminished expectancies and moti-vation, while realizing none of the benefits of balance. Two steps areneeded to manage the distortions caused by subjectivity. First, absent acompensation formula, appraisals and compensation decisions must beexplained to people affected by them. These explanations need not beentirely consistent. All that matters is that people understand the con-nection between their performance, the appraisal of their performance,and their compensation. Second, absent a compensation formula, thereis only one way to detect whether reversion to unbalanced measure-ment has occurred: determine statistically whether non-financial mea-sures have been factored into appraisals and bonuses, and then recali-brate appraisals and bonuses if necessary.
Anticipate that the performance measurement system will changeDistortions will occur whether measures are combined formulaicallyor subjectively. While these distortions can be partially managed, theycannot be managed completely because of the refractory nature of peo-ple. Any compensation formula will be gamed. It would be irrationalfor people not to game formulas on which their livelihoods depend. Anyperception of subjectivity in appraising and compensating performancewill cause people to experience uncertainty and their expectancies andmotivation to perform will decline as a consequence. It would be ir-rational for people not to experience uncertainty when they cannotperceive the connection between their performance, their appraisal,and their compensation. The experience of GFS confirms that thesedistortions cannot be managed completely. In six years, GFS movedfrom purely financial performance measurement to a scorecard-likesystem, PIP, where financial and non-financial measures were com-bined formulaically, to an implementation of the balanced scorecardwhere measures were combined subjectively, and, recently, back to apurely financial performance measurement system where only sales andmargins count. The question raised by this analysis and the experienceof GFS is whether any system aiming for balanced performance mea-surement can remain stable for long. Somewhat differently, is it not
In search of balance 107
reasonable to anticipate that all performance measurement systemswill evolve and sometimes change dramatically, partly as a result ofimproved measurement techniques, but partly as a result of distortionsoccurring as people either learn to manipulate measures to their ad-vantage or find that they cannot do so and hence lose their motivationto perform?
A brief summary
Balanced performance measurement is an attractive idea that can bedifficult to implement. The notion of balance asserts that non-financialperformance measures containing information about future finan-cial performance should supplement financial measures in appraisingand compensating performance. Balanced performance measurement,however, requires more: not only must non-financial measures predict-ing financial performance be found, but financial and non-financialmeasures, which are inherently dissimilar, must be combined into anoverall appraisal of performance and a compensation decision. Thecase of GFS illustrates the challenges of meeting these requirements.GFS tried two versions of the balanced scorecard, one formulaic, theother subjective, and found neither satisfactory.
If not the balanced scorecard, how should performance be measuredand compensated? The choices are unattractive because the problem ofcombining dissimilar measures into a single appraisal of performancetranscends the balanced scorecard – recall from chapter 1 the tensionbetween the proliferation of measures and the compression principlein measurement. The alternative that chapter 4 will introduce reducesthe number of measures but increases the intensity of measurement byshifting the locus of measurement from firms and business units to cus-tomers and the most granular unit of all, the activities performed bythe firm. This shift will initially seem awkward because performancemeasurement is often motivated by the need to appraise the perfor-mance of firms and, within firms, people. I shall argue, however, thatappraising the performance of firms and their people requires answersto two prior questions: what are the activities in which the firm is en-gaged, and what are the economic consequences of these activities?Entrepreneurial firms like Envirosystems can answer these questionsintuitively. What remains to be seen is whether large firms can addressand answer these questions.
108 Rethinking Performance Measurement
The bottom line
This chapter presented an account of the implementation of the bal-anced scorecard in the Western region of Global Financial Services.The general principles revealed by the analysis of GFS’s efforts to im-plement balanced scorecards to appraise and compensate performanceinclude the following:
� A balanced set of performance measures will include financial mea-sures and non-financial measures adding information about eco-nomic performance not contained in financial measures. In otherwords, balanced measurement includes financial measures and non-financial measures that look ahead. This requirement holds whetherbalanced scorecards are used for strategic measurement or to ap-praise and compensate performance.
� When the balanced scorecards are to appraise and compensate per-formance, managers must, in addition to finding the right measures,combine dissimilar measures into overall appraisal of performance.This can be difficult to do. Combining measures by formula encour-ages people to game the formula by delivering everything but bottom-line performance. Combining measures subjectively limits gaming,but it creates uncertainty, consumes a great deal of time, and ulti-mately undermines motivation.
� Two requirements of balanced performance measurement, then, arefinding the right measures and combining these measures into anoverall appraisal and then compensating performance. Finding theright measures requires finding non-financial measures actually – notjust potentially – driving financial results and likely to drive financialresults going forward. Many firms, like GFS, will find this difficult todo. Combining measures creates distortions – gaming of compensa-tion formulas, or uncertainty arising from subjectivity – that must bemanaged. Again many firms, like GFS, will find this difficult to do.
� The requirements of balanced performance measurement suggestthat balanced scorecards should be used to monitor progress towardstrategic objectives but not to appraise and compensate performance.
Postscript: From balanced performance measurementto a sales-focused strategy
In early 1999, new management took control of GFS’s US retail oper-ations and immediately changed the strategy of the business. The five
In search of balance 109
“imperatives” enunciated in 1995 were replaced by a sales-focusedstrategy aimed at producing dramatic improvement in earnings. To-ward this end, all costs were scrutinized and the expense base of GFS’sretail operations was cut by more than 20 percent. Revenue growthwas sought through increased fees and aggressive promotion of fee-based products (such as insurance and investments) with somewhatless emphasis on traditional asset (loan) and liability (demand deposit)products. Branch employees other than tellers were required to obtainlicenses to sell insurance and investments, and the compensation of allemployees was based on meeting sales or sales-related targets, the latterincluding referrals of customers to relationship managers licensed tosell investment products. Needless to say, customer satisfaction figuredless prominently under the new strategy. Customer satisfaction surveyscontinued with greatly reduced samples through the end of 1999 andwere then abandoned altogether. The balanced scorecard was aban-doned as well.
The sales-focused strategy had an immediate impact on the bottom-line income of GFS’s US retail business. Return on assets before re-structuring charges skyrocketed from 1.1 to 4.1 percent from 1998 to1999. Much of this increase in ROA was due to the cost reductionsimplemented by the new management. Cost reductions together witha reduction in the provision for credit losses accounted for 73 percentof the 1998–99 increase in pretax income of US retail operations.
The long-run sustainability of these results will depend on the impactof the new strategy on GFS’s retail customers. Decomposing bottom-line earnings into revenue and expenditure components and then de-composing the revenue component into fee and balance revenues canhelp us understand how this impact will operate. Balance revenues, inturn, can be further decomposed into the product of actual balancesand spreads, the latter the difference between GFS’s cost of funds, whichis the interest rate GFS’s treasury charges its operating units,15 and theinterest earned on funds. The full decomposition of earnings is sketchedin figure 3.8. Figure 3.8 also shows how customer retention, the dif-ference between rates of customer acquisition and attrition, is likelyto affect fee and balance revenues separately. The solid arrow runningfrom customer retention to balance revenues indicates that a close re-lationship between the two is expected, in other words, that balancerevenues will accrue to the extent that customers and their balances areretained. By contrast, the dotted line from customer retention to fee-based revenues indicates that a weaker relationship between retention
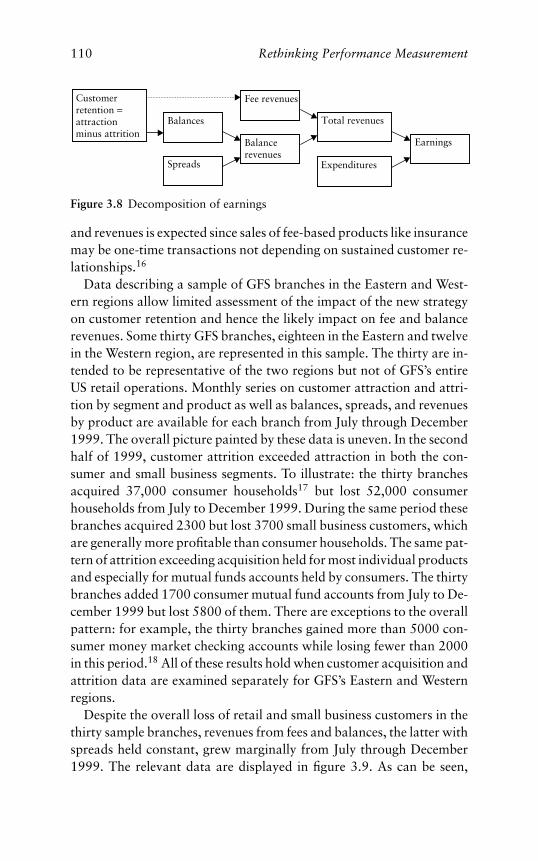
110 Rethinking Performance Measurement
Earnings
Total revenues
Expenditures
Fee revenues
Balancerevenues
Spreads
Balances
Customerretention =attractionminus attrition
Figure 3.8 Decomposition of earnings
and revenues is expected since sales of fee-based products like insurancemay be one-time transactions not depending on sustained customer re-lationships.16
Data describing a sample of GFS branches in the Eastern and West-ern regions allow limited assessment of the impact of the new strategyon customer retention and hence the likely impact on fee and balancerevenues. Some thirty GFS branches, eighteen in the Eastern and twelvein the Western region, are represented in this sample. The thirty are in-tended to be representative of the two regions but not of GFS’s entireUS retail operations. Monthly series on customer attraction and attri-tion by segment and product as well as balances, spreads, and revenuesby product are available for each branch from July through December1999. The overall picture painted by these data is uneven. In the secondhalf of 1999, customer attrition exceeded attraction in both the con-sumer and small business segments. To illustrate: the thirty branchesacquired 37,000 consumer households17 but lost 52,000 consumerhouseholds from July to December 1999. During the same period thesebranches acquired 2300 but lost 3700 small business customers, whichare generally more profitable than consumer households. The same pat-tern of attrition exceeding acquisition held for most individual productsand especially for mutual funds accounts held by consumers. The thirtybranches added 1700 consumer mutual fund accounts from July to De-cember 1999 but lost 5800 of them. There are exceptions to the overallpattern: for example, the thirty branches gained more than 5000 con-sumer money market checking accounts while losing fewer than 2000in this period.18 All of these results hold when customer acquisition andattrition data are examined separately for GFS’s Eastern and Westernregions.
Despite the overall loss of retail and small business customers in thethirty sample branches, revenues from fees and balances, the latter withspreads held constant, grew marginally from July through December1999. The relevant data are displayed in figure 3.9. As can be seen,
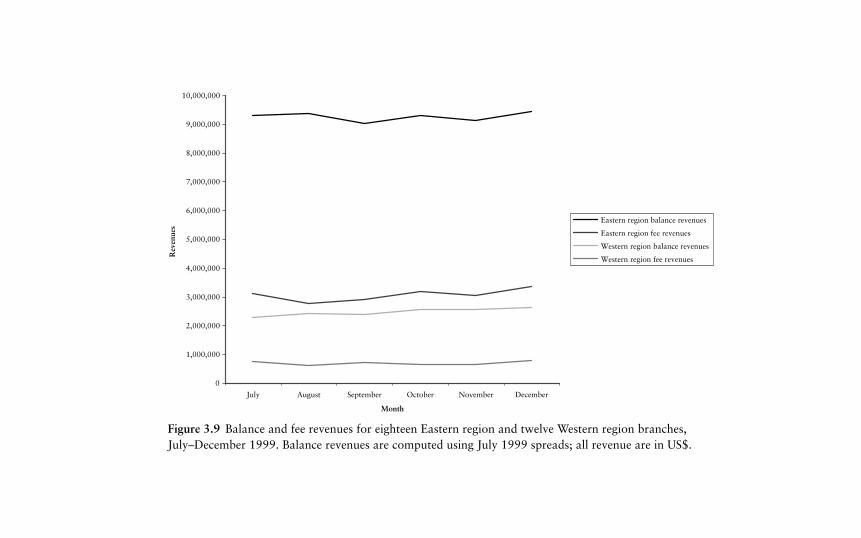
0
1,000,000
2,000,000
3,000,000
4,000,000
5,000,000
6,000,000
7,000,000
8,000,000
9,000,000
10,000,000
July August September October November December
Month
Rev
enue
s
Eastern region balance revenues
Eastern region fee revenues
Western region balance revenues
Western region fee revenues
Figure 3.9 Balance and fee revenues for eighteen Eastern region and twelve Western region branches,July–December 1999. Balance revenues are computed using July 1999 spreads; all revenue are in US$.
112 Rethinking Performance Measurement
there are slight differences between the Eastern and Western regions. Inthe Eastern region, balance revenues as well as fee revenues were essen-tially flat until December 1999, when both increased by 4–5 percent.In the Western region, balance revenues grew steadily throughout thesix-month period while fee revenues remained essentially flat. In nei-ther region do we observe the pattern anticipated as a consequence ofnet customer attrition – flat to declining balance revenues coupled withgrowing fee revenues.
There is a simple lesson and a subtler lesson. The simple lesson isthat cutting costs and implementing a sales-focused strategy in placeof the balanced scorecard improved bottom-line income dramatically.Even customer attrition in excess of acquisition did not cause short-run revenues to decline, although it remains unclear how economicand competitive conditions may have influenced this result. The subtlerlesson, which is important for the activity-based profitability analysis(ABPA), is that it is difficult to trace the consequences for the bottomline of any action taken by a firm absent customer-by-customer prof-itability data. The data just reviewed described GFS’s branches, notGFS’s customers. They describe the total number of customers (andcustomer accounts) acquired and lost as well as balance and fee rev-enues for thirty branches over a six-month period. They are typical ofthe performance data available to most middle and senior managersin large firms. And they are ambiguous because they do not tell uswhether the sales-focused strategy improved GFS’s performance. Whatwe learn from them is that GFS lost customers and, in the short run,made money.
If customer-by-customer profitability data were available, it wouldbe much easier to appraise the impact of the sales-focused strategyon GFS’s performance. What data are available show that GFS suf-fered net customer attrition following implementation of the new strat-egy even though GFS did not suffer loss of revenues. Whether thesales-focused strategy caused GFS to lose (or gain) its most profitable,marginally profitable, potentially profitable, or unprofitable customersis not known.
4 From cost driversto revenue drivers
T he task at the heart of the performance measurement problemis finding the precursors of future cash flows – or, equivalently,the long-term viability and efficiency of the firm. Let us begin
this chapter with a question: When are the drivers of costs also thedrivers of revenues? All managers from time to time face a relatedquestion: where can we cut costs without impairing revenues, andwhere can we ill afford to cut costs because revenues will be impaired?This question is especially crucial in the context of global management,since success in the global marketplace often requires driving unit costsdownward relentlessly. If there were simple ways to cut costs with-out impairing revenues, much of the performance-measurement prob-lem would disappear, and many of the tough choices facing managerswould be easier. But there are no simple solutions. Separating coststhat should be managed aggressively from costs that must be toler-ated because they are incurred by critical revenue drivers can be verydifficult.
This chapter develops a new approach to performance measurement,activity-based profitability analysis (ABPA). ABPA is founded on a sim-ple premise: if you understand the activities in which the firm engages,their costs, and the revenues that result from them, then you have apowerful tool for measuring and improving the performance of thefirm.
ABPA is based on the elemental conception of the firm that definesthe performance of a firm as what the firm does, its activities, and themeasure of performance as the revenues generated by these activitiesless the cost of performing them. ABPA is derived from an establishedperformance measurement technique, activity-based costing (ABC). Itis also based on a success story, the success many firms have had inmanaging costs using ABC. ABPA maps almost everything the firm doesonto bottom-line results, avoiding many of the problems associatedwith measures of non-financial performance. ABPA exhibits all the
113
114 Rethinking Performance Measurement
complexity of activity-based costing and then some, and it is not yetproven. But it is still an approach worth exploring.
From activity-based costing to activity-based profitabilityanalysis
Activity-based profitability analysis is grounded in activity-based cost-ing, which is a granular form of costing: it identifies the actual costs oflabor, materials, equipment, and premises needed to deliver a product,serve the customer, and sustain the business. ABC practitioners believethat making costs known creates opportunities for savings even thoughABC methodology alone does not identify savings targets. Two advan-tages are claimed for ABC compared to conventional costing methods.First, ABC makes all costs explicit, reducing distortions caused by ar-bitrary allocations of overhead to products and customers. Second,ABC traces costs back to the economic events that cause them, mak-ing it possible to judge the reasonableness of costs in light of theseevents.
The following example illustrates the difference between ABC andconventional costing methods. Conventionally, the cost of assemblinga circuit board is calculated as the direct cost of labor and materialscosts plus indirect costs, the latter a percentage of direct costs – inhighly automated processes, these percentages can be 500 percent ormore. There is no way of knowing whether the cost of assembling acircuit board so calculated is accurate and, if it is accurate, whethersavings can be realized. Under ABC, by contrast, all of the costs in-volved in assembling a circuit board and the economic events drivingthese costs are recognized explicitly. Hence there are few if any indi-rect costs that cannot be controlled. For example, one of the principalcosts of assembling circuit boards is chip insertion. The number ofchip insertions is determined by the design of the board. The cost ofeach chip insertion is a function of the labor, premises, and equip-ment costs of inserting a single chip. In the argot of ABC, circuit boardassembly is the cost object, the number of chip insertions is the costdriver, the cost of inserting a single chip is the activity cost, and theactivity (that is, the economic event incurring costs) is chip insertion.While all of this language sounds complex, tracing board assemblycosts back to the economic events like chip insertions allows circuitboard designers to ask whether savings can be realized by substituting
From cost drivers to revenue drivers 115
integrated chips for discrete components. Though integrated chips aremore expensive than equivalent discrete components, decreasing thefrequency of chip insertions usually offsets the higher cost of integratedchips.
Activity-based costing is less useful when costing decisions are madewithout objective information about their consequences. Imagine, ifyou can, removing costs from circuit board assembly not knowing howthe functionality and reliability of assembled boards will be affected.The chances are high that the circuit boards will fail and you willquickly be out of business. It is for this reason that most applicationsof ABC are in manufacturing or in service industries such as parceldelivery where product specifications constrain costing decisions.
ABPA extends ABC by seeking to understand the revenue conse-quences of activities alongside costs. ABPA focuses initially on the cus-tomer as the point where costs and revenues intersect. ABPA asks theapparently naıve question: what do we do for the customer that gen-erates revenues in excess of costs? Panel (a) of figure 4.1 shows thepath from activities to revenues. The path originates with activities.Activities add value for the customer, and value added in turn drivescustomer revenues. In two respects this diagram is more subtle than theapparently naıve question that motivated it. First, as shown, the rela-tionship between activities and revenues is mediated by value added forthe customer. This occurs because many activities – those performedwithout charge, those bundled and performed on demand for a flatfee or no fee – do not yield revenues directly. Second, because valueadded for the customer cannot be observed, the revenues attributableto each activity performed for the customer must be estimated in acausal model. Such a model is sketched in panel (b) of figure 4.1.The model, of course, is only a set of hypotheses. The contributionof activities to revenues must be estimated by analyzing the relevantdata.
The ABC view of the relationship of costs to revenues is different. Asshown in italics in figure 4.1, ABC establishes activity costs and thencustomer profitability by comparing the costs of performing activitiesfor each customer with the revenues supplied by the customer. Theapproach suggested here establishes also activity costs using ABC, butit then establishes activity revenues by estimating the contribution ofactivities to customer revenues, and the profitability of each activity bycomparing activity revenues with activity costs.
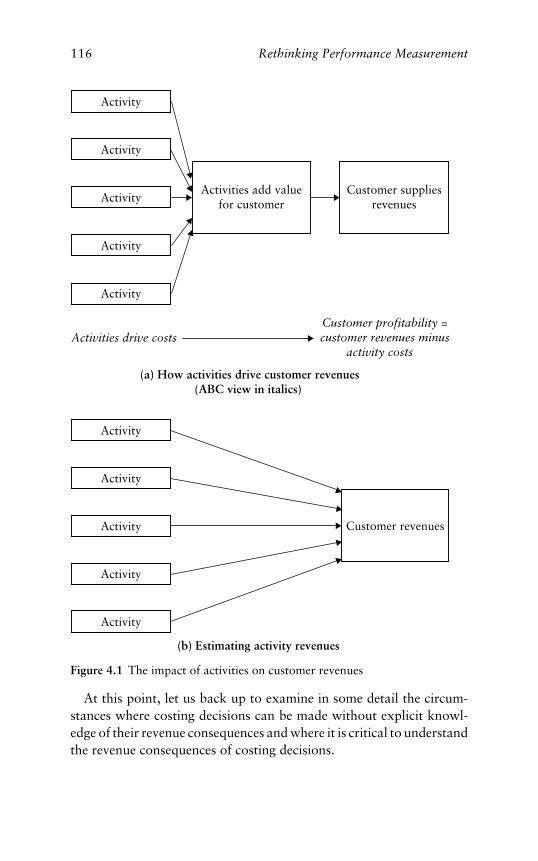
116 Rethinking Performance Measurement
Activities add valuefor customer
Customer profitability =customer revenues minus
activity costs
Customer suppliesrevenues
Activity
Activity
Activity
Activity
Activities drive costs
Activity
(a) How activities drive customer revenues(ABC view in italics)
Customer revenues
Activity
Activity
Activity
Activity
Activity
(b) Estimating activity revenues
Figure 4.1 The impact of activities on customer revenues
At this point, let us back up to examine in some detail the circum-stances where costing decisions can be made without explicit knowl-edge of their revenue consequences and where it is critical to understandthe revenue consequences of costing decisions.
From cost drivers to revenue drivers 117
Products whose value is captured in specifications
Some simple examples illustrate where it is important to separate costdrivers from revenue drivers and where it is not. Consider first a prod-uct whose value to the customer depends entirely on physical spec-ifications such as capacity, reliability, and speed – in other words, aproduct whose value depends on its functionality or performance forthe customer, not its economic performance. Such a product might bea desktop computer or, better, the memory chips (DRAMs) inside thecomputer. For commodity products like DRAMs, all that counts forthe customer is price and speed: the latter is the measure of functional-ity. Panel (a) of figure 4.2 illustrates the separation of cost drivers fromrevenue drivers for products like DRAMs. There are three elements inthis figure: the activities involved in manufacturing the product (fiveare shown, but manufacturing usually involves more), the product it-self, and the resulting specifications (three are shown, probably toomany). Note that the product is split by a dashed vertical line. Thisline signifies that the activities involved in manufacturing a productcan be separated from product specifications and measured indepen-dently. Note too that manufacturing activities incur costs – activitiesare cost drivers – while the specifications add value for the customer –specifications are revenue drivers.
The challenge facing makers of DRAMs and similar products is tofind ways to eliminate activities and hence costs from manufactur-ing while maintaining or augmenting the physical specifications of theproduct and hence value for the customer. Manufacturers of DRAMs(and desktop PCs) failing to drive costs rapidly downward while im-proving the functionality of their products have been competed out ofbusiness. The lesson here, though, isn’t that costs must be reduced re-gardless. Quite the opposite. It’s that it is easiest to reduce costs whenrevenues are driven by product specifications – the performance of theproduct for the customer – which can be maintained or improved evenas unnecessary activities are eliminated.
Products not made to specifications
Now compare DRAMs to a product whose value to the customercannot be reduced to a set of specifications distinct from the activi-ties that comprise it, such as an airline journey.1 An airline journey
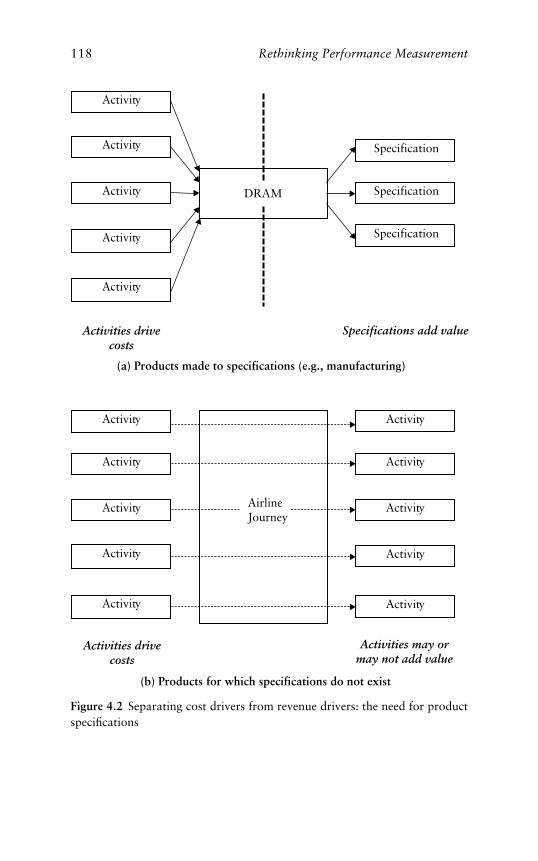
118 Rethinking Performance Measurement
DRAM
Specifications add value
Specification
Specification
Specification
Activity
Activity
Activity
Activity
Activities drivecosts
Activity
Activities may ormay not add value
Activity
Activity
ActivityActivity
Activity
Activities drivecosts
Activity
ActivityActivity
ActivityActivity
(b) Products for which specifications do not exist
(a) Products made to specifications (e.g., manufacturing)
AirlineJourney
Figure 4.2 Separating cost drivers from revenue drivers: the need for productspecifications
From cost drivers to revenue drivers 119
involves a bundle of activities that touch the customer – ticketing,boarding, on-board service (of which there are several components),baggage handling, and facilities upon arrival (a shower, a limousine),and frequent-flyer incentives. There are two interesting features of thebundle of activities comprising an airline journey. First, any of theseactivities may add value for the customer, but many do not. Second,the activities adding value may vary from customer to customer or, forthat matter, from flight to flight. Long-haul passengers may find valuein the availability of a business-class boarding lounge, the attentivenessof cabin staff, and the quality of arrival facilities; short-haul passengers,by contrast, may find value in the quality of peanuts served in flight andlittle else. Thus, revenue drivers cannot easily be separated from costdrivers for products that are not reducible to one or two specificationslike airline journeys. This occurs because, as shown in panel (b) offigure 4.2, the same bundle of activities that drives costs may also driverevenues, but the impact of activities on revenues is not known. Lackingproduct specifications clearly separable from the activities required toproduce and deliver a product, it is difficult to maintain or improve theproduct while eliminating activities from it. Costs will creep upwarduntil expenses must be cut across unselectively. The recent history ofBritish Airways is illustrative. Since BA privatized in the late 1980s, itsstrategy has been to provide high levels of customer service. Towardthis end, BA has tracked and improved more than 300 elements ofcustomer service ranging from the length of queues at airport countersto satisfaction with the handling of complaints. BA has performed wellfor its customers and is regularly voted one of Europe’s best companies.But BA has also had difficulty maintaining a competitive cost structure,and there have been periodic cost reductions.
Clearly, firms delivering complex services like BA must find a dif-ferent solution to the problem of separating cost drivers from revenuedrivers so that they can improve productivity by constraining the for-mer while augmenting the latter. This can only be accomplished bychanging fundamentally the way in which the problem of separatingcost from revenue drivers is construed. Until now, the problem hasbeen construed as one of removing costs from products and serviceswithout removing value from them. The solution to this problem hasbeen to treat product specifications as proxies for value and then to re-move costs while preserving specifications. This approach is effective solong as product specifications exist apart from the activities needed to
120 Rethinking Performance Measurement
produce the product. But this approach is not effective where the prod-uct is a service manufactured as it is delivered. In services, it is oftennearly impossible to distinguish the activities involved in producing theproduct from the product itself. Nor, by extension, is this approach ef-fective for businesses continuously delivering products to customers –in other words, businesses driven by ongoing customer relationships –because it is difficult to understand which products, and hence whichproduct specifications, add value for the customer and which do not.
A comparison of the upper panels of figures 4.1 and 4.2 is instruc-tive. Both figures begin with activities – in other words, activities areinputs in both cases. In figure 4.1, activities influence the customer tomake choices that have revenue (as well as cost) consequences. In figure4.2, however, activities shape products whose specifications, if specifi-cations exist, are assumed but not demonstrated to add value for thecustomer. Thus, while customer revenues are the outputs in figure 4.1,product specifications are the outputs in figure 4.2. A further differencebetween figures 4.1 and 4.2 is in the way that connections between in-puts and outputs are established. In figure 4.1, connections betweeninput activities and customer revenue outputs cannot be established bydesign since it is difficult to anticipate how customers will value dif-ferent activities. In figure 4.2, connections between input activities andoutput specifications are fixed in the design of the manufacturing orservice process. These connections, instead, must be established fromexperience, usually from statistical inferences drawn from the behaviorof customers.
The most important difference between figures 4.1 and 4.2, however,is in the kinds of insights activity-based costing (ABC) can generate.In figure 4.1, ABC identifies the cost of activities directly and theircontribution to revenues indirectly provided the costs incurred and therevenues generated by each customer are known. In figure 4.2, ABCidentifies the cost of activities but not the contribution of activities torevenues since revenues are not measured. What is unique about figure4.1, then, is the matching of activities performed for each customerand the activity costs these activities incur with the revenues generatedby each customer.
Time-sensitive products
It can also be difficult to manage costs when a product or servicehas precise specifications but their long-run impact on value for the
From cost drivers to revenue drivers 121
customer, and hence on revenues, may differ from their short-run im-pact. Think of any distribution system or supply chain whose output isdescribed by such specifications as the percentage of on-time deliveriesand frequency of out-of-stock conditions. Costs are the direct costs oftransporting and warehousing goods, the cost of carrying inventories,and costs incurred due to price deterioration or “rot” while goods arein the distribution system. (More than one computer maker tells itspeople, “We make bananas.”)
Supply chain managers seek to minimize total distribution costswhile having goods available at all times: the easy but expensive wayto insure that goods are in stock is to maintain large inventories. Thisis a matter of optimizing the design of the system, which is no meanfeat but can be done analytically.2 Supply chain managers also seekto understand how the customer values the performance of the dis-tribution system. Most managers, for example, believe that customersprefer to find goods in stock rather than out of stock. But when a largecomputer manufacturer, whom I will call Abacus Computers, testedthis proposition, they found little support for it.
Abacus borrowed the sales floor of a large retailer and simulated fourconditions: both Abacus and competitors’ products in stock, Abacusin stock but competitors out of stock, Abacus out of stock but com-petitors in stock, and both Abacus and competitors out of stock. Thecritical comparison was between the first and third conditions wherecompetitors’ products were in stock. Abacus customers turned out tobe extremely loyal even when Abacus products were out of stock. Al-most uniformly, customers who intended to buy the Abacus productbut learned it was out of stock left the store without making a purchase.
The lesson learned was not the lesson anticipated. Abacus had hopedto learn how retail customers value the performance of its distributionsystem. What Abacus actually learned was that most of its customersare very loyal and willing to forgive poor performance of the distribu-tion system – once. Whether customers would forgive persistent poorperformance in distribution is a different matter. Abacus, like any sen-sible business, is reluctant to find out what would happen if its productswere perennially out of stock.
The upshot is that cost drivers can be separated from revenue driverswhen two conditions obtain: (1) products or services are made to phys-ical specifications, and (2) these specifications capture performance forthe customer and hence drive revenues. When both of these conditionsprevail, costs can be reduced so long as specifications are maintained
122 Rethinking Performance Measurement
or improved (e.g.DRAMs). But only rarely are both of these condi-tions present. For many products and services, there are no specifi-cations (an extreme case is psychotherapy). For others, the activitiesthat drive costs are in effect specifications that may or may not addvalue for the customer and hence drive revenues – in other words,activities and specifications cannot be distinguished (e.g. airline jour-neys). Even where specifications exist and are separable from activities,such specifications may have little impact on short-run value for thecustomer even though their long-run impact on value may be substan-tial (e.g. Abacus’ supply-chain metrics). To put it differently: the morecommodity-like the product and the less the significance of ongoingcustomer relationships, the easier it is to separate cost drivers fromrevenue drivers. The reverse is also true: the less commodity-like theproduct and the greater the significance of customer relationships, themore difficult it is to separate the two.
The nuts and bolts of activity-based profitability analysis
The firm’s functioning and its economic results intersect in the relation-ship of the firm to the customer. The firm performs activities to meetcustomer requirements, these activities incur costs, and the customersupplies revenues. It follows that connections between activities, costs,and revenues are best understood at the level of customers rather thanbusiness units or the firm as a whole. In the language of the social sci-ences, the customer is the unit of analysis; in the language of business,the customer is the profit center.
Once the customer is the unit of analysis or the profit center, it isfairly easy to connect activities and activity costs, on the one hand,with revenues and profitability, on the other. Figure 4.3 illustrates howthis is done in financial services where products consist of transactionsof various types. The customer is at the center of figure 4.3. Workingleftward from the customer, customers initiate transactions that in turntrigger support transactions.3 Both customer-initiated and customer-support transactions involve direct and indirect activities.4 Activitiesincur three kinds of costs, short-term variable costs, long-term variablecosts, and capacity costs.5 Working rightward from the customer, cus-tomer net revenue flows from customers,6 and customer profitabilityis customer net revenues less transaction costs. Note also in figure 4.3that product costs are almost incidental. In financial services, products
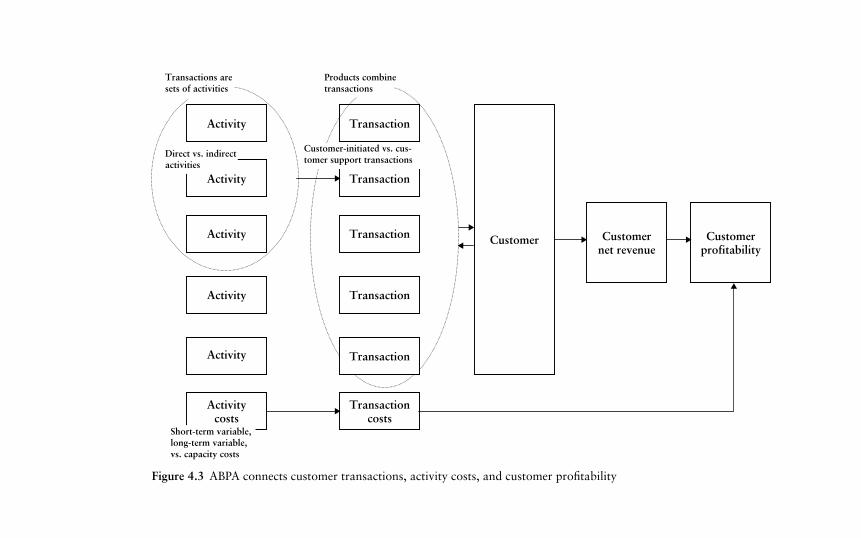
Activitycosts
Activity
Activity
Activity
Activity
Transaction
Transaction
Transactioncosts
Transaction
Transaction
Customerprofitability
Customernet revenue
Direct vs. indirectactivities
Customer
Short-term variable,long-term variable,vs. capacity costs
Products combinetransactions
Transactions aresets of activities
Transaction
Activity
Customer-initiated vs. cus-tomer support transactions
Figure 4.3 ABPA connects customer transactions, activity costs, and customer profitability
124 Rethinking Performance Measurement
are sets of transactions, some more intricate than others, and productcosts, therefore, are simply the sum of the costs of transactions requiredto deliver the product.
The system described in figure 4.3 is unusual in two respects. Itshows, first, that there is no necessary connection between transactionsand transaction costs, on the one hand, and revenues, on the other. Thebulk of revenues accrue when transactions add value for customers, andcustomers, as a consequence, maintain balances that yield revenues fargreater than transaction fees. Second, the system generates data ontransaction frequencies, transaction costs, revenues, and profitabilityfor each customer in real time. In other words, the system doesn’tmerely reveal transaction costs and customer profitability, which ABCdoes conventionally. It also connects profits with transactions customerby customer. These data make it possible to describe not only thecustomer’s relationship with the organization – the transactions andproducts utilized by the customer – but also the long-term profitabilityof this relationship since the system operates in real time. Moreover, bybreaking down the customer relationship transaction by transaction,these data allow the long-term profitability of each type of transactionto be estimated as well.
ABPA opens some promising opportunities. Figure 4.3 suggests sev-eral. One is the opportunity to identify inexpensive transactions andproducts, package them, and sell them at several times cost. Anotheris the opportunity to identify unprofitable customers and either repricethem or encourage them to take their business elsewhere. But the op-portunity to discover which transactions and products – that is, whichcustomer relationships – are profitable in the long run may be moreimportant than identifying inexpensive products and customers whoare currently profitable.
Discovering the transactions and products contributing to profitablecustomer relationships is critical for several reasons. There is an eco-nomic advantage: transactions and products contributing to profitablerelationships can be promoted, while transactions and products de-tracting from profitability can be discouraged or rationalized. Thereis also a competitive advantage: while it is easy for competitors toimitate the products you produce inexpensively and to undercut yourmargins by competing on price, it is very difficult for competitors tounderstand which products to sell to which customers profitably –constructing a system that allows you to understand this is no small
From cost drivers to revenue drivers 125
feat, and the profitability estimates the system generates are pro-prietary.
Figure 4.4, which is a simplification of figure 4.3, shows how trans-actions and products contributing to profitable customer relationshipscan be identified and then refined so as to become even more prof-itable. Figure 4.4 suggests two steps. The first step is to estimate currentcustomer profitability – current customer net revenue less the cost ofcurrent transactions and products – as a function of prior transactionsand product utilization. It is important to lag transactions and productutilization because it takes time for their full revenue consequences todevelop. It does not matter how these revenue consequences develop;hence the simplicity of figure 4.4. What does matter is whether therevenue consequences of transactions and products are positive, zero,or worse. The second step is to reconfigure transactions and productsto maximize the profitability of customer relationships. This can beaccomplished by encouraging the use of specific transactions and prod-ucts and discouraging or repricing others. This is the essence of ABPA,which relies on activity-based costing to estimate the profitability ofeach customer and then separates products and services contributingto customer profitability from those incurring costs.
An example illustrating the opportunities presented by ABPA maybe helpful. The most frequent transactions in the retail business ofGFS (the global financial services firm we met in the last chapter) ina Latin American country are depositing checks and clearing checks.Next most frequent are balance inquiries – there are 500,000 balanceinquiries a month, or nearly five inquiries per account, an artifact of theregion’s history of hyperinflation. The unit cost of balance inquiries asestimated by ABC varies, from a few cents if directed to a centralizedautomated voice-response unit to several dollars if directed to branchrelationship officers. Since customers direct about half of their balanceinquiries to the automated unit and half to relationship officers, the costof balance inquiries is in vicinity of $1 million a month. The questionis whether this level of expenditure is excessive – in the argot of ABC,whether balance inquiries are overfunded – and, in particular, whetherbalance inquiries should be diverted to the automated unit.
The sales force believes that balance inquiries are also sales oppor-tunities for relationship officers: according to the sales force, the rev-enues ultimately flowing from balance inquiries far exceed the coststhey incur. Others are skeptical, noting that customers with the lowest
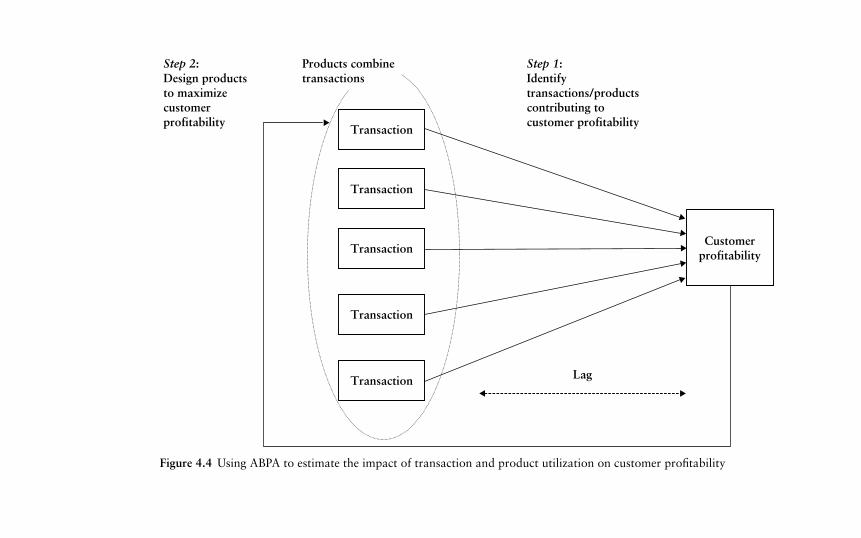
Transaction
Customerprofitability
Transaction
Transaction
Transaction
Transaction
Step 2:Design productsto maximizecustomerprofitability
Step 1:Identifytransactions/productscontributing tocustomer profitability
Lag
Products combinetransactions
Figure 4.4 Using ABPA to estimate the impact of transaction and product utilization on customer profitability
From cost drivers to revenue drivers 127
balances, and hence the lowest revenues, are most likely to inquireabout their balances. The virtue of the ABPA framework illustrated infigure 4.4 is that it is capable of discriminating between customers forwhom balance inquiries yield revenues in excess of costs and those forwhom such costs exceed revenues. In other words, ABPA can ascer-tain not only whether balance inquiries are profitable or unprofitableoverall but also whether balance inquiries are profitable for some cus-tomer segments and not for others. The exact form of the relationshipbetween balance inquiries and subsequent revenues net of costs neednot be specified here. What is important, and what makes the problemmanageable, is that lags between balance inquiries and their effects onrevenues should be fairly short, consistent with the sales force’s argu-ment that balance inquiries are also sales opportunities.
From ABC to ABPA: a case in point
The experience of Global Financial Services illustrates what happenswhen ABC is used to analyze costs, which it does fairly objectively,but costing decisions are then made subjectively because their conse-quences for revenues are not understood. GFS’s Country A retail busi-ness is fairly large, about 100,000 customers and revenues of about$200 million. Country A was plagued by hyperinflation through theearly 1990s but then reformed its currency and stabilized wages andprices. GFS initially adapted to the new environment by growing itsretail customer base in Country A dramatically. But GFS took on morecustomers than its staff and systems could serve effectively. Customersatisfaction and profits plummeted, and management decided in mid-1992 to prune unprofitable customers and to initiate a quality program.Both were major projects. Pruning unprofitable customers requireda measure of customer profitability, a measure that did not exist.Bolstering customer satisfaction required a quality organization capa-ble of responding quickly and forcefully to customer complaints. Thisorganization also did not exist.
Measuring customer profitability
To measure customer profitability, a batch system capturing revenuesand a portion of variable costs for each customer was put in place bymid-1993.7 The revenue calculation, called customer net revenue or
128 Rethinking Performance Measurement
CNR, was routine – balances (both asset and liability) times interest-rate spreads, plus fees charged the customer. The calculation of variablecosts was more difficult because it required a system capable of record-ing many different kinds of customer transactions, for example openingan account, making a deposit, purchasing a mutual fund, or making acomplaint. Unit costs were estimated for each type of transaction usinga crude form of ABC; variable costs were computed for each customeras the frequency of each type of transaction times its unit cost; andvariable costs were compared to CNR for each customer monthly. Theresulting figure was an estimate of customer profitability. Customerswere then classified into three categories: (1) revenues greater thanfixed plus variable costs, (2) revenues greater than variable costs butless than fixed plus variable costs, and (3) revenues less than variablecosts. Customers falling into the third category were then repriced inthe expectation that they would either become profitable or take theirbusiness elsewhere. Management was surprised to find that revenueswere below variable costs for many of their largest customers. Theyshould not have been – ABC often reveals that the largest customersare the least profitable because they command low margins and incurhigh service costs.8
Managing customer complaints
Customer satisfaction was managed by creating a quality organizationthat implemented a rigorous problem-resolution process. A toll-freephone number was established to provide customers direct access tothe quality organization. The quality organization contacted customerswho were dissatisfied with the way their complaints had been handled.All customer complaints were analyzed and zero-defect teams weredispatched in most instances to find and correct the root cause of theproblem. These steps immediately and dramatically improved customersatisfaction.9 Problem incidence and internal investigations resultingfrom customer complaints improved just as dramatically.10
The magnitude of these improvements is evident in internal data onproblem incidence and problem resolution across GFS’s seven LatinAmerican markets. As shown in table 4.1, in December 1994 the per-centage of customers reporting problems in Country A was 8 percent –less than half that of other Latin American markets, where the figuresranged from 18 to 21 percent. Problem-resolution satisfaction was
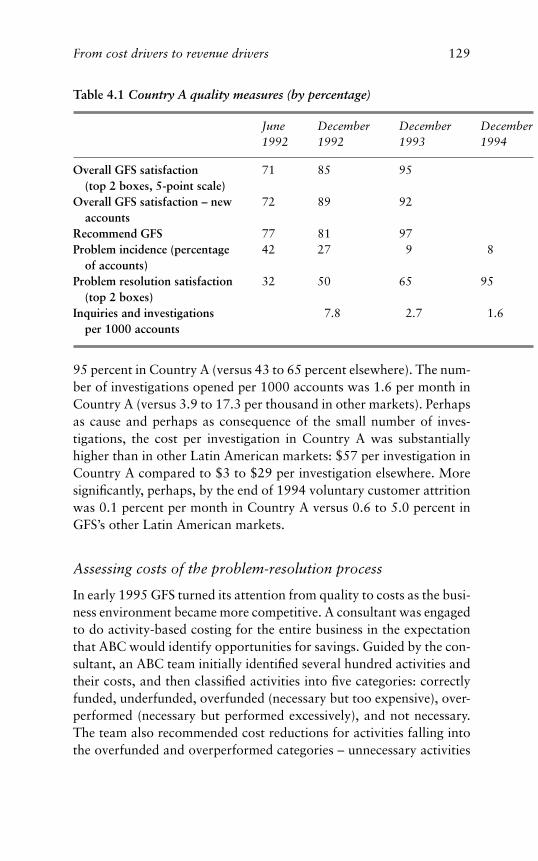
From cost drivers to revenue drivers 129
Table 4.1 Country A quality measures (by percentage)
June December December December1992 1992 1993 1994
Overall GFS satisfaction 71 85 95(top 2 boxes, 5-point scale)
Overall GFS satisfaction – new 72 89 92accounts
Recommend GFS 77 81 97Problem incidence (percentage 42 27 9 8
of accounts)Problem resolution satisfaction 32 50 65 95
(top 2 boxes)Inquiries and investigations 7.8 2.7 1.6
per 1000 accounts
95 percent in Country A (versus 43 to 65 percent elsewhere). The num-ber of investigations opened per 1000 accounts was 1.6 per month inCountry A (versus 3.9 to 17.3 per thousand in other markets). Perhapsas cause and perhaps as consequence of the small number of inves-tigations, the cost per investigation in Country A was substantiallyhigher than in other Latin American markets: $57 per investigation inCountry A compared to $3 to $29 per investigation elsewhere. Moresignificantly, perhaps, by the end of 1994 voluntary customer attritionwas 0.1 percent per month in Country A versus 0.6 to 5.0 percent inGFS’s other Latin American markets.
Assessing costs of the problem-resolution process
In early 1995 GFS turned its attention from quality to costs as the busi-ness environment became more competitive. A consultant was engagedto do activity-based costing for the entire business in the expectationthat ABC would identify opportunities for savings. Guided by the con-sultant, an ABC team initially identified several hundred activities andtheir costs, and then classified activities into five categories: correctlyfunded, underfunded, overfunded (necessary but too expensive), over-performed (necessary but performed excessively), and not necessary.The team also recommended cost reductions for activities falling intothe overfunded and overperformed categories – unnecessary activities
130 Rethinking Performance Measurement
were slated for 100 percent expenditure reductions – with an overallcost savings target of 7–8 percent in mind. Several of the ABC team’srecommendations focused on the quality process and, in particular,expenditures incurred by the activities of the quality organization. Forexample, zero-defect team leadership – middle-management oversightof zero-defect teams – was classified as an unnecessary activity andtargeted for elimination. Quality research management – design andanalysis of customer surveys – was classified as overperformed andtargeted for a 50 percent cost reduction. Problem resolution was alsoclassified as overperformed and targeted for a 20 percent reduction.
Senior management hired a second consultant to resolve discrepan-cies between the ABC team’s recommendations and the internal data onproblem resolution just reviewed. This consultant convened the ABCteam, divided the team into two focus groups, one more senior than theother, and asked both groups to reconstruct the process that led themto classify several activities as unnecessary or overperformed. Not sur-prisingly, the two groups perceived the process somewhat differently.The differences were especially sharp with respect to the classificationof zero-defect team leadership as unnecessary. The more senior groupbelieved that middle management oversight of the quality process wasno longer needed because quality was deeply embedded in the organi-zation:
We told [GFS] how important quality is two years ago. Today [GFS] under-stands quality. Leadership not important. The process is mature. Intermedi-ate level of leadership is not necessary. We don’t need coordination of qualityat intermediate level – let subgroups work alone on quality.
The junior group, by contrast, was not confident that the quality pro-cess could function without middle management oversight:
We are not at all comfortable with this decision. We’re not sure that [zero-defect team leadership] can be cut 100 percent. We don’t have all the dataneeded to make this judgment.
The two groups were in much closer agreement as to why theproblem-resolution activity was classified as overperformed. Accord-ing to the more senior group: “There are fewer problems. As a con-sequence, problem resolution cost should decrease. We used data onthe number of problems,” while the junior group commented: “Ourview is about the same. Reduced problem incidence accounts for costreduction.”
From cost drivers to revenue drivers 131
Note the difference in the way the two activities were evaluated.Zero-defect team leadership activity was evaluated subjectively – themore senior group, which prevailed, believed that zero-defect teamleadership was redundant whereas the junior group was uncertain. Theproblem-resolution activity, by contrast, appears to have been evalu-ated objectively: the number of problems had been correlated withproblem-resolution expenditures, and the latter had been judged ex-cessive by both groups.
In fact, both of these judgments were based on incomplete data be-cause the focus had been exclusively on costs. When shown the datain table 4.1, which compares problem incidence and problem resolu-tion in Country A and other Latin American markets, the ABC teamquickly understood that it had focused narrowly on the frequency andcost of investigations rather than comparing the costs of investigationswith their benefits – high levels of customer satisfaction and low ratesof customer attrition. The judgment of the ABC team with respect tozero-defect teams was unanimous: “We will have to rethink the con-clusion that zero-defect team leadership is not necessary.” Once theyunderstood the complexity of this issue, as illustrated in figure 4.5, theteam decided to reserve judgment on whether the problem-resolutionactivity was overperformed.
Linking activities to revenues with ABPA
Figure 4.5 combines the ABC perspective on the problem resolution ac-tivity with the broader perspective of activity-based profitability analy-sis or ABPA, which traces the revenue and hence the profitability conse-quences of problem resolution alongside its costs. The ABC perspectiveis shown on the left side of figure 4.5. The path from cost drivers toactivities to costs is utterly straightforward: the frequency of the costdriver – inquiries and complaints – drives the frequency of problem-resolution activities, which in turn drive problem-resolution costs. Theimplication of the ABC perspective is equally straightforward: prob-lem resolution costs should vary with the frequency of inquiries andcomplaints.
The ABPA perspective, on the right side of figure 4.5, shows thatthe path from cost drivers to activities to revenues is anything butstraightforward. Inquiries and complaints lead to problem-resolutionactivities, to be sure, but there are then three distinct paths through
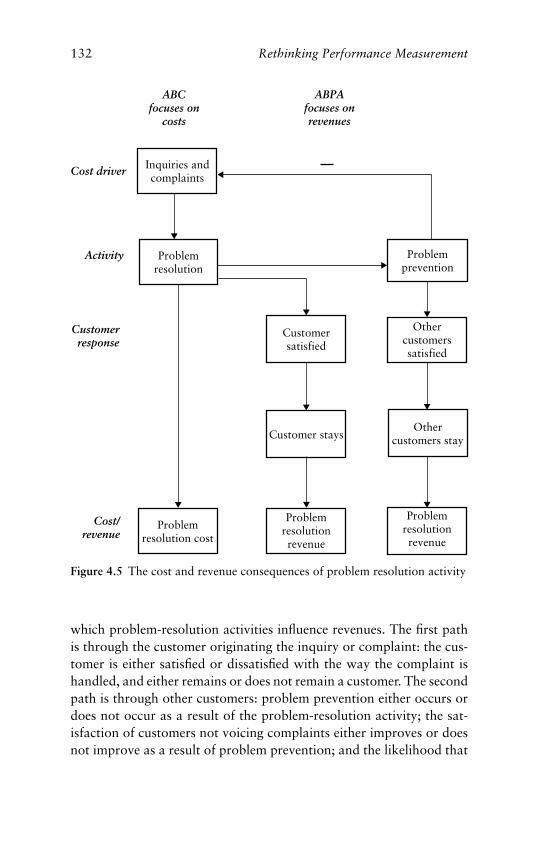
132 Rethinking Performance Measurement
Problemresolution cost
Problemresolutionrevenue
Inquiries andcomplaints
Problemprevention
Customersatisfied
Problemresolution
Othercustomerssatisfied
Problemresolutionrevenue
ABCfocuses on
costs
ABPAfocuses onrevenues
Activity
Cost driver
Cost/revenue
Customerresponse
Customer staysOther
customers stay
Figure 4.5 The cost and revenue consequences of problem resolution activity
which problem-resolution activities influence revenues. The first pathis through the customer originating the inquiry or complaint: the cus-tomer is either satisfied or dissatisfied with the way the complaint ishandled, and either remains or does not remain a customer. The secondpath is through other customers: problem prevention either occurs ordoes not occur as a result of the problem-resolution activity; the sat-isfaction of customers not voicing complaints either improves or doesnot improve as a result of problem prevention; and the likelihood that

From cost drivers to revenue drivers 133
other customers will remain customers either increases or does notincrease. The third path is through a feedback loop influencing thefrequency of inquiries and complaints and hence revenues through theother two paths: problem prevention either occurs or does not occuras a result of problem-resolution activity, and problem prevention inturn either does or does not influence the frequency of inquiries andcomplaints.
The only firm conclusion to be drawn from figure 4.5 is that thecosts of activities like problem resolution can be traced much moreeasily than their impact on revenues. This is the case for three reasons:(1) because costs are incurred as the activities are performed, whereasrevenues accrue later; (2) because revenues depend on actions taken bycustomers whose actions can be unpredictable; and, in this instance,(3) because the feedback loop from problem prevention to inquiriesand complaints adds a further complication. This said, it appears thatproblem-resolution activity within a reasonable range contributes pos-itively to revenues.
While the full contribution of problem-resolution activity to rev-enues cannot be determined from the information at hand, one part ofthis contribution can be crudely estimated from table 4.2. ExcludingCountry E, which is an outlier because its economy was in turmoil, thecorrelation of the dollar cost per investigation with the monthly attri-tion rate of retail customers is 0.57.11 A one dollar increase in the costper investigation is estimated to decrease monthly customer attrition by0.015 percentage points. Assuming that this result holds for CountryA and that Country A decides to reduce the cost per investigationby $10, from $57 to $47 per investigation, the cost of investigationsper 1000 accounts will then move from $89 to $73 monthly, but themonthly customer attrition rate is forecast to increase by 0.15 percentor 1.5 accounts per thousand. These results suggest that the savingsin problem resolution expenditures recommended by the ABC teammay be a false economy. Average monthly revenue per retail account isabout $100. Reducing problem resolution costs by $16 per thousandaccounts per month would increase attrition costs by approximately$150 per month. And this figure does not take into account the cost ofreplacing lost accounts or the likelihood of an increase in the frequencyof inquiries and complaints.
The lesson of this case is that ABC can go awry when it focuses onactivity drivers and activity costs and ignores the revenue consequences
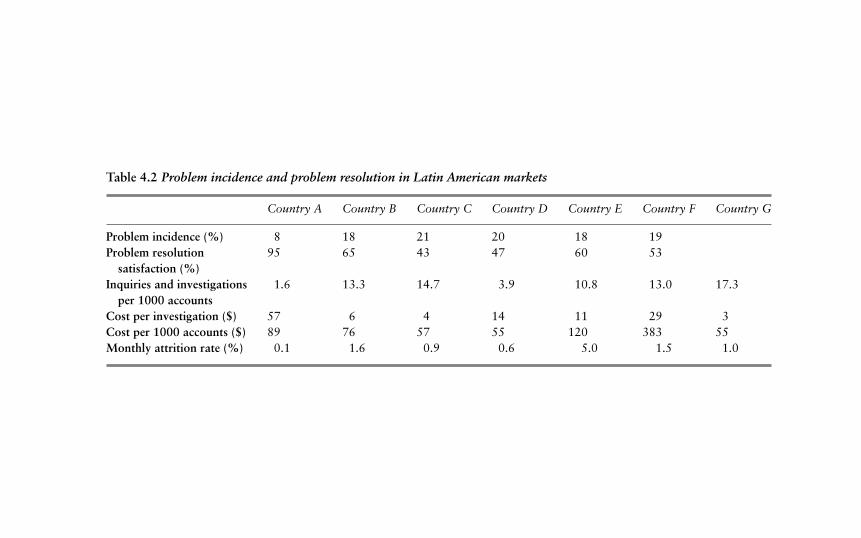
Table 4.2 Problem incidence and problem resolution in Latin American markets
Country A Country B Country C Country D Country E Country F Country G
Problem incidence (%) 8 18 21 20 18 19Problem resolution 95 65 43 47 60 53
satisfaction (%)Inquiries and investigations 1.6 13.3 14.7 3.9 10.8 13.0 17.3
per 1000 accountsCost per investigation ($) 57 6 4 14 11 29 3Cost per 1000 accounts ($) 89 76 57 55 120 383 55Monthly attrition rate (%) 0.1 1.6 0.9 0.6 5.0 1.5 1.0
From cost drivers to revenue drivers 135
of activities. In manufacturing and in service environments where pro-cesses can be blueprinted, specifications serve as surrogates for rev-enues. Thus it is plausible, although not always accurate, to assume thatrevenues will continue to flow so long as specifications are maintained.This assumption in turn allows costs to be reduced safely. In serviceenvironments like GFS, by contrast, it is difficult to fix specificationsfor processes like complaint resolution because the customer’s percep-tion of the adequacy of the process, rather than physical specificationsof a product, determines its revenue consequences. The hazards of tak-ing cost reductions without considering their revenue consequences inservice environments is illustrated by the initial outcome of the ABCproject: the ABC team initially classified zero-defect team leadershipas unnecessary and problem resolution as overperformed because thefrequency of inquiries and complaints had decreased sharply. But theteam changed its mind in light of data showing the impact of problemresolution expenditures on customer satisfaction and attrition.
Using ABPA to find revenue drivers
At this point, it is worthwhile to return to figure 4.1 and to considerthe implications of activity-based costing for the problem of separatingcost drivers from revenue drivers. As we have just seen, activity-basedcosting can go awry when costs dominate and the revenue implicationsof activities are ignored. But activity-based costing is not the culprit.The culprit is a narrow view of the capabilities of activity-based costing.In fact, ABC is capable of distinguishing cost drivers from revenuedrivers if three conditions are met: (1) if the costs of activities areknown, (2) if the revenues generated by each customer are known, and(3) if the activities performed for each customer are also known. Thefirst condition, of course, is met by ABC, which estimates activity costs.The second condition depends on the firm – firms that cultivate long-term customer relationships will often track revenues for individualcustomers, whereas firms engaging in one-off transactions or selling inmass markets generally will not. The third condition obtains far lessfrequently.
Few firms, retail firms especially, will track the activities performedfor individual customers due to the systems requirements imposed byhaving to monitor the frequency with which many different kinds ofactivities are performed for many thousands of customers. In the past,
136 Rethinking Performance Measurement
only firms having close relationships with relatively small numbers ofcustomers, such as the Swedish manufacturer of heating wire Kanthal,have tracked activities performed for individual customers in order todetermine which customers are profitable and which are not.12 ABPAmodels identifying profitable products and services tell your peoplewhat to sell (and, in some instances, what to provide without charge),but they require systems capable of tracking all of your customers’transactions with the firm and the costs of these transactions. Trackingthe frequency of activities performed for large numbers of customers,it turns out, is essential if the revenue consequences of activities are tobe estimated as in panel (b) of figure 4.1. In that figure, the frequen-cies with which activities are performed for the customer both drivecustomer profitability and enter into the calculation of customer prof-itability. Customer profitability is revenues less activity costs, the lattercalculated as the frequency times the unit cost of activities performedfor each customer.
The ABC team in Country A did not initially imagine that activity-based costing would help solve the problem of linking activities withrevenues. But after several brainstorming sessions, the team rediscov-ered the system used to estimate customer profitability three years ear-lier and maintained, perhaps inadvertently, since. Although the costestimates generated by this system were crude, the system was capa-ble of tracking several hundred categories of customer transactions,attaching costs to these transactions, and comparing transaction coststo customer net revenue for retail customers. Once these capabilitieswere brought to management’s attention, the system was upgraded intwo key respects. First, it was expanded from 200 types of customertransactions capturing 28 percent of total expenditures to more than700 types of transactions capturing nearly 60 percent of total expendi-tures. Second, it was converted from a batch system producing monthlyreports to a production system tracking customer transactions in realtime. Most importantly for our purposes, a new activity-based costingproject aimed at estimating the costs of customer transactions – notall activities – was initiated. These cost estimates were extremely fine-grained. Customer transactions were first broken down into customer-initiated (front-office) and support (back-office) transactions. Thendirect (operational) and indirect (mainly supervisory) activities sup-porting these transactions were identified. Next, the costs of theseactivities were established by determining employees’ time allocation
From cost drivers to revenue drivers 137
and the current utilization of premises and technology. Finally, activ-ity costs were reported in three categories: short-term variable costssensitive to the volume of customer transactions (e.g., front-line em-ployees), long-term variable costs somewhat sensitive to the volumeof transactions (e.g., supervision), and capacity costs that would beincurred if the volume of transactions required expanded premises ornew equipment.13
Some outstanding issues
Some outstanding issues should be raised at this point. Two are quitepractical. Can non-financial measures, satisfaction and courtesy mea-sures especially, be folded into ABPA? And can any measurement sys-tem as complex as ABPA be sustained in dynamic business environ-ments? A third issue takes us back to the core issues of this book: inthe end, does ABPA resolve some of the endemic issues surroundingperformance measurement?
Can non-financial measures be folded into ABPA?
An important question is whether the non-financial measures can befolded into ABPA. There is no experience in folding non-financial mea-sures into ABPA, but, in principle, it can be done whenever data onindividual customers are available. This turns out not to be a simplematter.
Consider, first, the transaction frequency and transaction cost sideof ABPA. What is critical for the customer may be not whether thetransaction occurred but whether the transaction was courteous – didthe representative smile and say thank you? In principle, employeecourtesy could be tracked transaction by transaction so that customerrevenues could be estimated as a function of the frequency and cour-tesy of transactions. As a practical matter, of course, it is difficult totrack courtesy transaction by transaction – the monitoring costs andintrusiveness are too high for both employer and employee. Moreover,what is considered courteous in some cultures or subcultures may notbe in others. To illustrate: speed may be valued over politeness in partsof Asia, even to the point of omitting “thank you” when ending con-versations. In Latin America, by contrast, politeness takes precedenceover speed, and conversations are often protracted.14
138 Rethinking Performance Measurement
Consider, next, the outcome side of ABPA. So far, I have empha-sized that the critical outcomes are revenues less costs. Even so, theABPA framework can be adapted to pinpoint the transactions drivingcertain non-financial outcomes and hence the costs of improving theseoutcomes. For example, an ABPA-like approach could be used to un-derstand the causes of customer retention, which can easily be trackedcustomer by customer. Retention rates could easily be estimated as afunction of customer transactions and transaction costs, since all of theneeded data are available in ABPA. This would be a cost-of-retentionstudy rather than ABPA, but the logic parallels ABPA. Conceivably, anABPA-like approach could be used to pinpoint the transactions driv-ing customer satisfaction and hence the cost of customer satisfaction.I would welcome the opportunity to apply an ABPA-like frameworkto customer satisfaction, but doing so would require much larger sam-pling factions than are typical in customer-satisfaction surveys.15
Thus, while ABPA is not in principle antagonistic to non-financialmeasurement, ABPA is useful only where non-financial measures areavailable for individual customers. Customer retention (and even cus-tomer acquisition) data are generally available for individual cus-tomers, and it is conceivable that customer satisfaction could bemeasured customer by customer as well – the obstacle is the cost of col-lecting these data. Data on customer satisfaction, and, more pointedly,customer satisfaction with individual transactions, are more difficultto obtain due to high cost and inconvenience. The same limitationapplies to measures of operational and human resources performancethat could be, but as a practical matter are not, mapped on to individualcustomers – for example the speed with which transactions occur couldeasily be built into ABPA models provided such data were available andshowed substantial variation from customer to customer.
Who bears the cost of inefficiency?
Activity-based costing in the context of ABPA raises the question ofwho bears the costs of inefficiency. ABC is principally a costing tool: itis normally used to identify costs and either reduce or eliminate thosewhich are unnecessary. When doing ABC, it is not unusual to dis-cover that unit costs vary substantially within a firm. Indeed, the largerthe firm and the more diverse its businesses, the greater the variationin costs across its units. From the perspective of costing, variation is
From cost drivers to revenue drivers 139
helpful because it pinpoints outliers where costs can be reduced eas-ily. From the perspective of customer profitability or ABPA, however,this variation poses the question of whether customers should bearthe cost of inefficiency. To illustrate: suppose customers A and B writethree checks a month, but the cost of processing checks at A’s branchis higher than at B’s branch. Although A is in fact less profitable thanB, should A, who is identical to B in all other respects, be treated inABPA as less profitable than B because his account is domiciled at ahigh-cost branch? In other words, will A have to pay the price of hisbranch’s inefficiency? I think the answer is no because customers Aand B present identical opportunities and risks to the firm. This thenmeans that the ABC cost estimates will have to be standardized acrossthe firm before they can be entered into ABPA. The standard cost ofan activity will not be its highest cost within the firm, it may be in thevicinity of the average cost, and it may be well above the lowest costif the lowest cost is the result of unusual circumstances such as fullyamortized premises and equipment.
Can ABPA be sustained?
Can any system as complex as ABPA be sustained in dynamic envi-ronments? One source of the complexity of ABPA is its dependence onactivity-based costing, which is itself arduous and must be updated pe-riodically as shifts in the organization and its technology occur. Anothersource of complexity lies in the need for systems capable of trackingcustomer transactions in real time. Still another layer of complexity liesin the models used to estimate the impact of transactions and productson revenues, which involve many variables and uncertain lags.
To the skeptics, I offer four observations. First, ABC, which is thefoundation of ABPA, is admittedly complicated, but it is not necessaryto do full activity-based costing to understand order-of-magnitude dif-ferences in costs, such as the difference between the cost of balanceinquiries handled by automated voice response units and inquiries han-dled by platform officers.
Second, systems capable of tracking customer transactions in realtime are already in place in many large firms. ABPA requires three kindsof data: the costs of activities, the revenues generated by each customer,and the activities performed for each customer. ABC generates activitycosts; most relationship-based businesses track customer revenues; and
140 Rethinking Performance Measurement
many businesses track the activities performed for their customers.ABPA tracks all three and then estimates revenues net of costs as afunction of activities performed for the customer, and hence capturesthe direct and indirect contributions of activities to net revenues, thelatter being the value of the customer relationship.
Third, in practice the models used to estimate the revenues flowingfrom transactions and products need not be as complicated as figures4.3 and 4.4 suggest. It turns out, for example, that a relatively smallnumber of transactions account for most of the costs in GFS’s CountryA retail business – for example nine types of teller transactions accountfor more than 97 percent of teller costs.
Fourth, the complexity of models estimating revenues flowing fromtransactions and products must be balanced against the potential pay-off of such models. In the past decade, firms have reduced costs enor-mously without the benefit of analytic tools capable of separating costdrivers from revenue drivers. Further cost-downs will not come as eas-ily and will have to be more selective than at present. The virtue ofABPA is its selectivity: ABPA separates profitable from unprofitableactivities, and it is capable of doing this for each customer segment.Rather than dwelling on whether ABPA models are too complex tobe implemented and dismissing them for this reason, managers shouldask whether simpler alternatives to ABPA-like modeling exist.
Does ABPA resolve critical measurement issues?
This chapter began by asking when cost drivers are also revenue drivers,and then showed why it is so difficult to separate the two, particu-larly in relationship-driven businesses with diverse customers, wherethe impact of specific products and services on revenue flows is un-clear. Specifications often act as surrogates for revenue drivers wheregoods are manufactured or services can be blueprinted in advance.Where specifications do not exist, or cannot be separated from theactivities needed to produce a product or service, however, it is muchmore difficult to separate the cost drivers from the revenue drivers, andbusinesses frequently go through a boom–bust cycle, first spending oncustomer service to attract and retain customers and then cutting costsbecause their cost structure is no longer competitive. ABPA is intendedto modulate this cycle by moving firms more steadily in the directionof profitability.
From cost drivers to revenue drivers 141
ABPA also addresses larger issues, which were anticipated at thebeginning of this book. ABPA implements the elemental conceptionof the firm by reducing the firm to its activities and the costs, cus-tomers, and revenues associated with them. ABPA, in other words, isa method of partitioning the firm analytically, activity by activity andcustomer by customer. Partitioning a firm analytically, by activitiesand customers, rather than organizationally following lines of author-ity, offers substantial advantages for performance measurement andperformance improvement. You do not have to worry about rollingup non-financial measures from the bottom to the top of the organiza-tion. You do not have to worry about modeling relationships of non-financial measures to financial outcomes or combining non-financialand financial measures into an overall appraisal of performance. Andyou need not worry that your cost-cutting initiatives will exact an un-toward toll on revenues. ABPA relieves these worries because it makesthe financial consequences of what you do transparent, or as transpar-ent as they can be made. The strength of ABPA is that it makes senseconceptually and thus promises to clean up many of the problems in-herent in other approaches to performance measurement. Beyond this,as will be shown in the next chapter, ABPA promises to facilitate learn-ing in organizations and simplifies people’s compensation. But ABPAis not without limitations. The drivers of non-financial outcomes notcaptured for individual customers cannot be easily estimated by ABPA.Nor can ABPA estimate the revenue consequences of executive and staffactivities performed on behalf of all customers.
Where ABPA does not apply: signaling commitments andvalues with performance measures
Performance measures can be used to signal organizational commit-ments and values as well as to measure current results and make in-ferences about future results. The commitments and values enunciatedby senior managers are never to be taken lightly, but attaching perfor-mance measures to senior management commitments and values givesthem much greater urgency. Whether ABPA and ABPA-like frameworksestimating the financial consequences of non-financial performance arelikely to prove useful when performance measures are intended to sig-nal commitments and values beyond short-term financial targets re-quires consideration.
142 Rethinking Performance Measurement
A case in point is Alcoa. When Paul O’Neill, the US Treasury Secre-tary at the time of writing, became CEO of Alcoa in 1987, the companytook several dramatic steps to change its culture, its way of doing busi-ness. Among the most important was a commitment to an injury-freeworkplace. Alcoa’s management set a target of a 50 percent reduc-tion in serious injuries and lost workdays within five years.16 Here isMichael Lewis’s account of why O’Neill made safety a top priority forAlcoa:
On his first day, [O’Neill] told Alcoa’s executives that they weren’t goingto talk people into buying more aluminum and that they weren’t able toraise prices, so the only way to improve the company’s fortunes was tolower its costs. And the only way to do that was with the cooperation ofAlcoa’s workers. And the only way to get that was to show them that youactually cared about them. And the only to do that was actually to care forthem. And the way to do that was to establish, as the first priority of Alcoa,the elimination of all job-related injuries. Any executive who didn’t makeworker safety his personal fetish – a higher priority than profits – would befired.17
O’Neill followed his words with actions. In July 1996, the presidentof Alcoa Fujikura Ltd., a subsidiary with plants in the Acuna region ofMexico, was fired for failing to report three accidents where workerswere exposed to carbon monoxide and butane gas. In an email circu-lated throughout the company O’Neill wrote, “Some of you may thinkmy decision is an unduly harsh response for a lapse in communication.I felt constrained to make it because of the effect of these matters onour values and the possible misperception that there can be tradeoffsin these areas” (italics added).18
“The possible misperception that there can be tradeoffs” is the crit-ical phrase. O’Neill’s implicit model, keeping in mind “the mispercep-tion that there can be tradeoffs,” is roughly as sketched in figure 4.6.Figure 4.6 seems quite straightforward. But it is less straightforwardthan it seems. What is missing is a comparison of the costs of makingsafety a fetish and eliminating job-related injuries, on the one hand,with the cost savings realized as a consequence of eliminating injuries,showing workers that management cares, and eliciting higher levels ofworker cooperation, on the other. There are good reasons for avoid-ing such cost–benefit comparisons. One reason lies in people’s values:
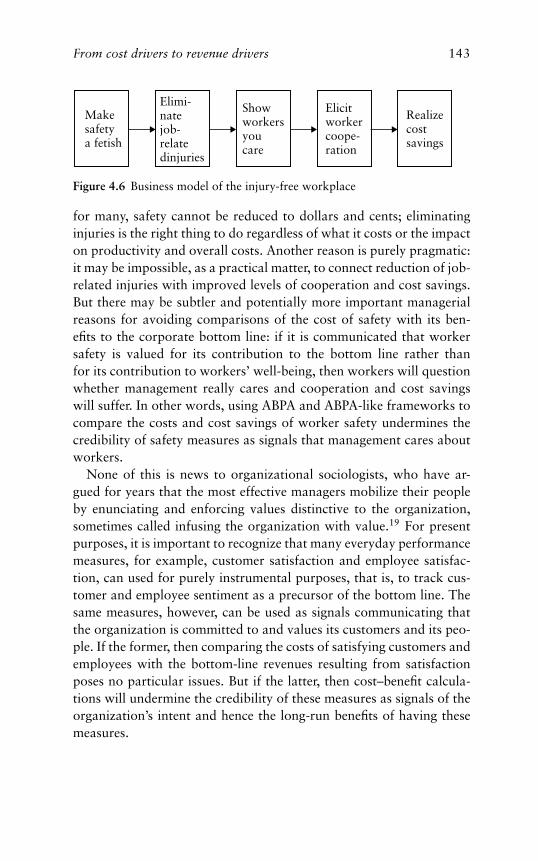
From cost drivers to revenue drivers 143
Realizecostsavings
Elicitworkercoope-ration
Showworkersyoucare
Elimi-natejob-relatedinjuries
Makesafetya fetish
Figure 4.6 Business model of the injury-free workplace
for many, safety cannot be reduced to dollars and cents; eliminatinginjuries is the right thing to do regardless of what it costs or the impacton productivity and overall costs. Another reason is purely pragmatic:it may be impossible, as a practical matter, to connect reduction of job-related injuries with improved levels of cooperation and cost savings.But there may be subtler and potentially more important managerialreasons for avoiding comparisons of the cost of safety with its ben-efits to the corporate bottom line: if it is communicated that workersafety is valued for its contribution to the bottom line rather thanfor its contribution to workers’ well-being, then workers will questionwhether management really cares and cooperation and cost savingswill suffer. In other words, using ABPA and ABPA-like frameworks tocompare the costs and cost savings of worker safety undermines thecredibility of safety measures as signals that management cares aboutworkers.
None of this is news to organizational sociologists, who have ar-gued for years that the most effective managers mobilize their peopleby enunciating and enforcing values distinctive to the organization,sometimes called infusing the organization with value.19 For presentpurposes, it is important to recognize that many everyday performancemeasures, for example, customer satisfaction and employee satisfac-tion, can used for purely instrumental purposes, that is, to track cus-tomer and employee sentiment as a precursor of the bottom line. Thesame measures, however, can be used as signals communicating thatthe organization is committed to and values its customers and its peo-ple. If the former, then comparing the costs of satisfying customers andemployees with the bottom-line revenues resulting from satisfactionposes no particular issues. But if the latter, then cost–benefit calcula-tions will undermine the credibility of these measures as signals of theorganization’s intent and hence the long-run benefits of having thesemeasures.
144 Rethinking Performance Measurement
The bottom line
Here, in summary form, are some of the key points to be taken awayfrom this chapter:
� The problem of separating cost drivers from revenue drivers is fun-damental to performance measurement. Removing costs and costdrivers without knowledge of their consequences for revenues canlead to untoward results.
� Where revenue drivers are known or can be assumed, e.g. whereproducts are manufactured to physical specifications known to addvalue or where service specifications are known to add value becausecustomer preferences are homogeneous, productivity and hence per-formance can be improved by removing cost while holding specifi-cations constant.
� Where revenue drivers are not known or cannot be assumed, e.g.where neither product nor service specifications adding value forcustomers are known, revenue drivers must be separated from costdrivers analytically in order to manage costs effectively.
� A method called activity-based profitability analysis or ABPA, whichadds a revenue component to activity-based costing, can help sepa-rate cost drivers from revenue drivers analytically by revealing therevenue consequences of activities. ABPA may be most helpful in set-tings where the transactions and products adding value for customersin excess of their cost is not known.
� An ABPA-like framework can also be used to estimate the drivers ofnon-financial outcomes like customer retention. What is critical isthe measurement of such outcomes customer by customer.
� ABPA and ABPA-like frameworks may not be appropriate whereperformance measures are intended to communicate commitmentsand values of the organization rather than to gauge precursors offuture cash flows.
5 Learning from ABPA
T his chapter is about using ABPA. ABPA can help firms andtheir people learn about the drivers of bottom-line results. Oncethe learning process initiated by ABPA is in place, however,
fairly simple bottom-line measures can be used to appraise and com-pensate people’s performance. Thus, under ABPA, the measures used toimprove performance and the measures used to appraise and compen-sate people’s contributions to performance will be different. In complexservice firms, the former will consist of transaction-by-transaction costand profitability measures, whereas the latter will consist of bottom-line measures of customer profitability. What is significant about ABPAis that it yields both the fine-grained cost and profitability measuresneeded to improve performance and bottom-line measures that canbe cascaded further into the organization than conventional financialmeasures.
There are many potential drivers of any firm’s bottom-line perfor-mance. Fine-grained measurement is needed to quantify the impact ofthese potential drivers on financial performance, to identify the mostcritical drivers, and to move these drivers in a direction that promotesprofitability.1 ABPA is well suited for these purposes because it attachescost and profitability estimates to the activities and transactions per-formed by the firm. At the same time, measures that are simpler andcoarser than those provided by ABPA are needed to appraise and com-pensate people’s performance. Whether performance is appraised rela-tive to peers or against a fixed target, the compensation decisions thatultimately result are one-dimensional. People are ranked, and someare paid more than others. The fewer and hence coarser the mea-sures, the easier it is to rank and pay people. It seems, then, that firmsneed both fine-grained measures to improve performance and coarse-grained measures to appraise and compensate performance. The needfor both kinds of measures occurs at all levels of the organization. It
145
146 Rethinking Performance Measurement
is not simply a matter of applying fine-grained measures at the bottomand coarse-grained measures at the top.
When pressed, economists will express no clear preference betweenfine- and coarse-grained measures. Their models suggest that, ideally,the drivers of firm performance should also drive performance ap-praisals and compensation – in other words, measurement should befine grained throughout. But their observations reveal that, in prac-tice, compensation schemes are far simpler and rely on many fewermeasures than their models suggest they should. As David Kreps putsit, “The models we analyzed suggested that optimal incentive schemeswill in general be very complex, depending on the very fine structureof the environment. This is not a prediction that is verified empirically;incentive schemes in practice are usually quite simple.” The explana-tion, according to Kreps, is that people will manipulate fine-grainedincentive schemes, whereas their ability to manipulate coarser mea-sures, especially bottom-line financial results, is limited.2 The analysisof the balanced scorecard in chapter 3 buttresses Kreps’ view. Anyformula that assigns fixed weights to measures invites gaming of theformula – as we saw in chapter 3, people quickly discovered how toearn large bonuses without delivering bottom-line financial results. Butwithout a formula, compensation becomes subjective, which has pit-falls as well. In chapter 3 we also saw that attempts to weight multi-ple financial and non-financial measures subjectively proved unwieldyand time-consuming, and, perhaps worse, ultimately led to imbalancewhere financial measures dominated.
To establish that ABPA provides a basis for learning, I will firstshow that measurement systems used for process improvement are,like ABPA, extremely fine grained and very demanding in use, muchdifferent from the simplicity that is sought when compensating peopleand also much different from the coarser measures populating cor-porate scorecards. I will then review how the measures generated byABPA can contribute to learning and how, at the same time, they can beused to measure people’s contributions to the performance of the orga-nization and to compensate their contributions. Finally, I will explorethe advantages and disadvantages of ABPA compared to the two domi-nant approaches to performance measurement: financial measurement,which focuses on bottom-line results and value for the shareholder, andthe balanced scorecard, which measures non-financial drivers and fi-nancial results simultaneously. While ABPA has many advantages, it is
Learning from ABPA 147
not easy to implement. This raises the question of when firms will forgoease of implementation for the advantages ABPA offers and when theywill not.
This chapter, then, is not a “how to do it” manual for users of ABPA.Not enough is known about ABPA to write confidently about “how todo it.” Rather, it presents a viewpoint on how ABPA should be usedand argues that ABPA-like measurement systems can be of substantialbenefit to firms whose bottom-line performance depends on how wellthey manage complex customer relationships.
How fine-grained measurement aids organizational learning
Two well-known cases illustrate how fine-grained measurement con-tributes to learning and process improvement in firms. One case isautomobile assembly, where the system at Toyota remains the bench-mark but in which other manufacturers have made large strides as well.The other is software development, where the Carnegie-Mellon Soft-ware Engineering Institute’s capability-maturity model has become thestandard used to appraise the quality of the development process.
Automobile assembly
Central to the Toyota production system are detailed job specifications.Consider the installation of a Camry front seat:
[There are] seven tasks, all of which are expected to be completed in 55 sec-onds as the car moves forward at a fixed speed through a worker’s zone. If theproduction worker finds himself doing task 6 (installing the rear seat-bolts)before task 4 (installing the front seat-bolts), then the job is actually beingdone differently than it was designed to be done, indicating that somethingmust be wrong. Similarly, if after 40 seconds the worker is still on task 4,which should have been completed after 31 seconds, then something, too,is amiss. To make problem detection even simpler, the length of the floor ineach work area is marked in tenths. So if the worker is passing the sixth of theten floor marks (that is, if he is 33 seconds into the cycle) and is still on task4, then he and his team leader know that he has fallen behind. Since the de-viation is immediately apparent, worker and supervisor can move to correctthe problem right away and then determine how to change the specificationsor retrain the worker . . .3
Note that job specifications in the Toyota production system, althoughdetailed, are not fixed. Quite the opposite – the specifications are

148 Rethinking Performance Measurement
regarded as hypotheses to be tested: the task either can or cannot becompleted to specifications within the allotted time, and specificationseither can or cannot be improved so that the time required to completethe task can be reduced.
The Toyota production system, of course, involves much more thanfine-grained measurement embodied in job specifications. It involvesdelegating the task of improvement to workers themselves. Workersbecome, in effect, their own production engineers. Methods and stan-dards are determined by work teams, workers time their own jobs,compare alternative procedures to determine the most efficient one,and propose new procedures.4
Fine-grained measurement is also used in Honda assembly plants,although in a slightly different way. Honda’s quality process involvesunusually rich data, including a great deal of “market-in” or customerdata. Problems are not categorized. Instead, workers are asked to “seethe actual part in the actual situation” as well as to listen to customers.The benefits of fine-grained measurement at Honda are earlier problemdetection and speedier problem resolution than at GM or Ford.5
By contrast to Toyota and Honda, approaches to job design eschew-ing fine-grained measurement have been largely unsuccessful in the au-tomobile industry. Volvo’s Uddevalla plant, which was closed in 1992,delegated job design to self-managed work teams. While team mem-bers were highly trained, they had very little guidance as to how tomeasure their performance and redesign tasks to reduce cycle times.The only performance measures available to Uddevalla workers wereaggregate results based on two-hour work cycles. Absent fine-grainedmeasurement, Uddevalla workers were either unable or unwilling totrack their performance task by task. As a consequence, work cycles atUddevalla remained at two hours (compared to one minute at Toyota),and Uddevalla’s overall productivity lagged behind industry standards.Whether a distant management or recalcitrant work teams are to blamefor the absence of fine-grained measurement at Uddevalla is immaterial.What is important is that Uddevalla workers did not achieve world-class productivity with only coarse measures available to them.
Software development
A standard set of metrics for assessing the quality of software devel-opment processes has been used worldwide since 1987. These metrics,
Learning from ABPA 149
known as the capability-maturity model (CMM), are maintained bythe Software Engineering Institute of Carnegie Mellon University.6
CMM measures are intended to guide incremental improvement insoftware development. Five stages of development are posited in theCMM model,7 and several key process attributes (KPAs) are speci-fied for each stage beyond the initial one.8 The measures of processattributes are extremely detailed – the 1994 CMM questionnaire re-quired 42 pages to cover 129 items. The hypothesis underlying CMM isthat effective practices must be built on one another in logical progres-sion rather than adopted scattershot. Software developers participatevoluntarily in the CMM assessment program in order to gauge theirrate of improvement. More than 6000 projects have been appraisedso far. The Software Engineering Institute, in turn, releases reports onthe current status and trends in software development. The most re-cent report finds, for example, that software engineering continues toshift toward higher maturity levels; that maturity levels remain incre-mentally higher overseas compared to in the USA; and that softwaredevelopment processes are more advanced in large than in small firms.9
Even though the CMM metrics are qualitative, feedback from theappraisal process appears to aid organizational learning. For exam-ple, software developers working under contract to the US Air Forcewere more likely to meet schedules and stay within budgets as theymoved from lower to higher levels of maturity.10 Similarly, as maturitylevels improved in a software development laboratory of a Fortune100 company, software quality improved also (although costs remainunchanged).11 Cross-sectionally, self-reported organizational perfor-mance measured by product quality, customer satisfaction, productiv-ity, and morale appears to be higher at higher levels of maturity. Andcase studies reveal improvements in productivity, time to market, anddefect rates as a result of participation in the CMM process.12
Generalizing beyond two cases
I use automobile assembly and software development to illustratean important point: extremely fine-grained measurement is the normwhere learning and process improvement are sought but performanceis neither appraised nor compensated. Fine-grained measurement con-tributes to learning because it specifies the current state of the system.You must know what you are doing before you can improve what you
150 Rethinking Performance Measurement
are doing. Fine-grained measurement also helps specify the actionsthat must be taken to achieve the desired improvement in the system.In automobile assembly, precise specifications for work sequences inconjunction with fine-grained measurement of workers’ performancein their sequences suggest opportunities to rethink sequences, retrainworkers, or both. In software development, fine-grained measurementidentifies the current stage of development processes, and hence thesteps that should be taken to move these processes to their next stage.
In both automobile assembly and software development, then, fine-grained measures describe and measure improvement in processes butare not used to appraise and compensate people’s performance. Thisraises two questions: (1) are different kinds of measures needed to de-scribe and improve performance on the one hand, and appraise andcompensate performance on the other; and (2) can a single measure-ment system combine both kinds of measures? Somewhat fortuitously,ABPA captures both the fine-grained measures that describe and im-prove performance and coarser measures that can be used to appraiseand compensate people.
Learning from ABPA
Can firms learn from ABPA-like fine-grained financial measurement asthey have learned from fine-grained process measurement? I believethey can, but this is not obvious. There has been considerable experi-ence with fine-grained costing, for example activity-based costing, butfine-grained revenue accounting is novel. Moreover, the action impli-cations of ABPA revenue estimates do not seem obvious, whereas theaction implications of measures showing assembly-line downtime orthe maturity of software development processes seem to be. It turnsout, however, that a fairly simple framework transforms ABPA resultsinto action imperatives.
The screen in front of the banker
ABPA computer screens contain a great deal of customer information.The opening window for each customer has identifying information,a list of current accounts, and a traffic signal in the upper left corner.A red light indicates that the customer has been unprofitable for threemonths; a yellow light indicates marginal profitability; and a green
Learning from ABPA 151
light indicates profitability. Customer net revenue (CNR) for the lastthree months, gross revenues less the cost of funds, is also shown on theopening screen. Subsequent screens display transactions by frequency,ABC unit transaction costs, and the ABPA estimate of the contributionof each type of transaction to customer profitability. The ordering oftransaction screens is sensitive to who the viewer is. Tellers, for exam-ple, first see a list of deposit, withdrawal, and balance inquiry transac-tions by channel, which allows them to compare costs and estimatedprofits from teller, ATM, and telephone transactions. The initial tellerscreens are shown in figure 5.1. The upper screen in figure 5.1 conveysthe following information to the teller: the Jones household maintainslarge balances, revenue from which places it in segment G, the sec-ond highest customer segment (the highest segment is H). The Joneshousehold is consistently profitable over the last quarter, and hence thebright green signal (placed beneath the yellow and red signals, whichare dimmed in the upper portion of figure 5.1). The implicit messageconveyed by the initial screen is: this is a profitable customer. Be espe-cially courteous and helpful. The second screen contains informationabout the types of transactions most frequently encountered at the tellerwindow. In the case of the Jones household, most of these transactionsare of little consequence for their profitability given the large balancesin their accounts. However, there have been seven balance inquiriesin the last quarter, three to tellers and four to customer representa-tives at the GFS call center (since the Jones household is consistentlyprofitable, their phone calls are automatically directed to customer rep-resentatives rather than automated voice response units). Teller balanceinquiries are generally unprofitable for customers in the Joneses’ seg-ment, but balance inquiries made to the GFS call center are generallyprofitable because the customer representatives taking the calls are, un-like tellers, experienced salespeople. The second screen, then, promptsthe teller to encourage the Joneses to check their balances frequently byphone.
Officers first see lists of non-financial transactions, which includebalance inquiries, other types of inquiries, complaints, automatic pay-ment and stop-payment orders, conversations about financial productswhether or not a sale resulted, conversations about financial planning,and the like. Subsequent officer screens display product sales bychannel – some products sold within branches are also available bytelephone and through an outside sales force, again allowing the
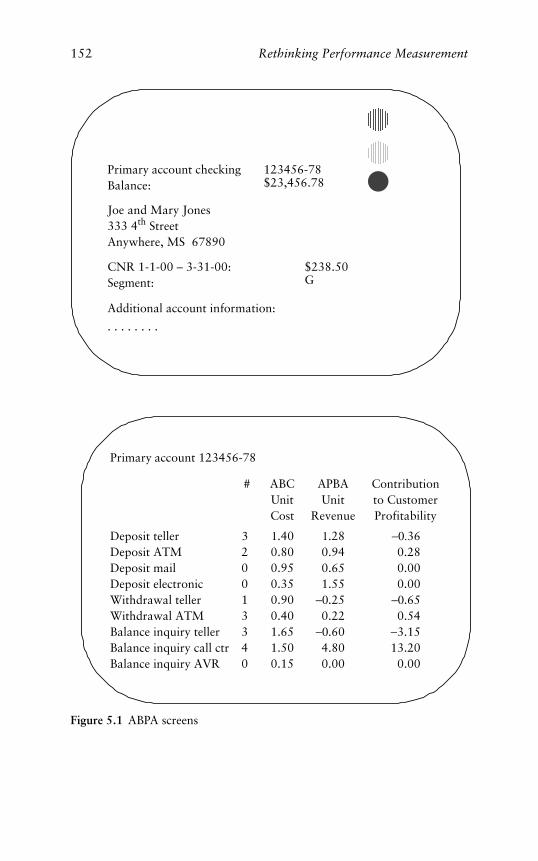
152 Rethinking Performance Measurement
Primary account checkingBalance:
123456-78$23,456.78
Joe and Mary Jones333 4th StreetAnywhere, MS 67890
CNR 1-1-00 – 3-31-00:Segment:
$238.50G
Additional account information:
. . . . . . . .
Primary account 123456-78
Deposit teller Deposit ATM Deposit mail Deposit electronic Withdrawal teller Withdrawal ATM Balance inquiry teller Balance inquiry call ctrBalance inquiry AVR
Contributionto CustomerProfitability
−0.360.280.000.00
−0.650.54
−3.1513.200.00
APBAUnit
Revenue
1.280.940.651.55
−0.250.22
−0.604.800.00
ABCUnitCost
1.400.800.950.350.900.401.651.500.15
#
320013340
Figure 5.1 ABPA screens
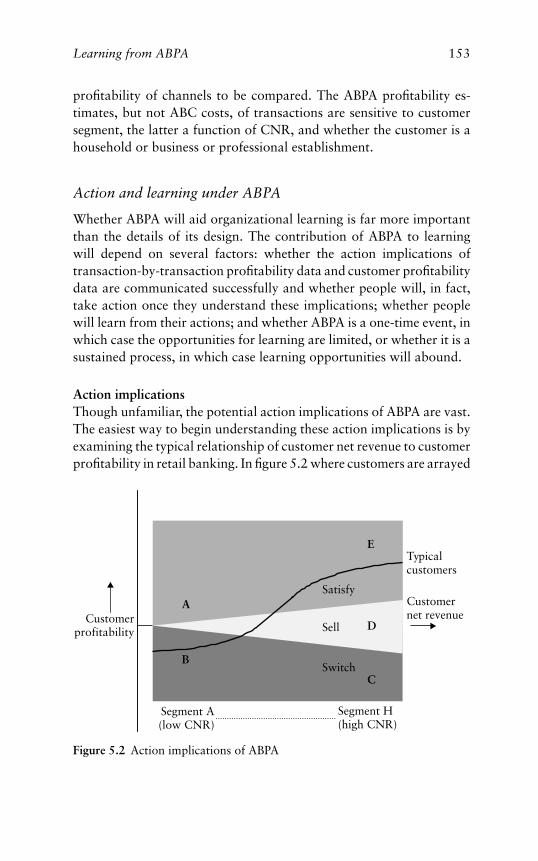
Learning from ABPA 153
profitability of channels to be compared. The ABPA profitability es-timates, but not ABC costs, of transactions are sensitive to customersegment, the latter a function of CNR, and whether the customer is ahousehold or business or professional establishment.
Action and learning under ABPA
Whether ABPA will aid organizational learning is far more importantthan the details of its design. The contribution of ABPA to learningwill depend on several factors: whether the action implications oftransaction-by-transaction profitability data and customer profitabilitydata are communicated successfully and whether people will, in fact,take action once they understand these implications; whether peoplewill learn from their actions; and whether ABPA is a one-time event, inwhich case the opportunities for learning are limited, or whether it is asustained process, in which case learning opportunities will abound.
Action implicationsThough unfamiliar, the potential action implications of ABPA are vast.The easiest way to begin understanding these action implications is byexamining the typical relationship of customer net revenue to customerprofitability in retail banking. In figure 5.2 where customers are arrayed
Customerprofitability
Customernet revenue
SatisfyA
B
C
ETypicalcustomers
Switch
Sell D
Segment A(low CNR)
Segment H(high CNR)
Figure 5.2 Action implications of ABPA
154 Rethinking Performance Measurement
by CNR and profitability, this relationship is sketched by a line resem-bling a logistic curve.13 Generally, the higher the CNR, the higher thecustomer profitability. However, the relationship is not perfect. Whilemany low CNR customers (e.g. customer B) are unprofitable, some(e.g. customer A) are profitable. And while many high CNR (e.g. cus-tomer E) are highly profitable, some (e.g. customer D) are marginallyprofitable, while still others (e.g. customer C) are unprofitable.
Figure 5.2 also displays three bands corresponding to the color of thetraffic signal on the opening ABPA screen. The green (upper) band con-sists of customers who are consistently profitable; the yellow (central)band, which is in fact a wedge, consists of marginally profitable cus-tomers; and the red (lower) band consists of unprofitable customers.An action imperative is attached to each of these bands. For the greenband, the imperative is satisfy: meet and, if possible, exceed the cus-tomer’s expectations. For the yellow band, the imperative is sell: offerprofitable products and services to the customer. For the red band, theimperative is switch: move the customer to less costly transactions ifpossible, raise prices if necessary, or terminate the relationship if it re-mains unprofitable. Note that the yellow band grows in height fromleft to right in figure 5.2. This occurs because transactions becomemore profitable and sales opportunities more attractive in higher CNRsegments.
The two dimensions of figure 5.2 are customer net revenue and cus-tomer profitability, the latter computed as CNR minus the cost ofall activities performed for the customer. ABPA estimates of trans-action profitability do not enter into the construction of figure 5.2.However, pinpointing specific actions likely to satisfy, sell, or switchcustomers requires ABPA profitability estimates and ABC costs. Con-sider again hypothetical customers A, B, C, D, and E, keeping in mindthat all of the information contained in these vignettes is generated byABPA:
� Customer A’s screen shows a green light but very few transactions:she pays a monthly fee to maintain checking privileges and a lineof credit, and makes one deposit and writes five checks in a typicalmonth. Since ABPA estimates indicate that few if any transactionswill be profitable in customer A’s segment, the best strategy is satisfy:meet customer A’s requirements but do not attempt to sell her newproducts and services.
Learning from ABPA 155
� Customer B’s screen shows a red light: he, like customer A, pays amonthly fee to maintain checking privileges and a line of credit. Un-like customer A, however, customer B writes twenty checks a month,some for cash, and also phones or visits his branch three times aweek to inquire about his checking balance (interest rates are quitehigh, making loans to cover overdrafts expensive). Since few trans-actions are profitable in customer B’s segment, the best strategy forthe bank is to switch customer B: encourage him to use ATMs ratherthan tellers for balance inquiries and cash withdrawals, and route hisphone calls to an automated voice response unit rather than an op-erator. If customer B fails to switch his transactions to less expensivechannels, then the bank should consider terminating the relationship.
� Customer C’s screen shows a red light even though he generates agreat deal of revenue for the bank and is in the top customer segment.Customer C operates a retail business – a chain of pharmacies – andmaintains multiple business and household relationships with thebank: checking, personal loans, business loans, both personal andbusiness insurance, and investments. Customer C is nonetheless un-profitable because he deposits several hundred customer checks daily.Although ABPA estimates show that many transactions in customerC’s segment are likely to be profitable, the cost of processing the num-ber of checks deposited by customer C far exceeds the profitabilityof any new products or services customer C might acquire. Thus,the best strategy is to switch customer C: either price his checkingaccount by transaction volume, or, should customer C not acceptrepricing, terminate the relationship.
� Customer D’s screen shows a yellow light. Customer D is a pro-fessional and is also in the top customer segment. Like customerC, customer D maintains multiple relationships with the bank. Un-like customer C, he has a normal level of activity in his checkingaccount, but he visits his branch more often than customer C andmakes much greater use of services provided without charge. Cus-tomer D, for example, meets with an officer twice a month to reviewhis investments; he has asked for his statements and checkbooks tobe delivered by courier because he feels it is unsafe to carry them andfinds the mail service unreliable; and he asks the bank to pay his billswhen he travels, which he does often. As a consequence, customerD is only marginally profitable. Since ABPA estimates indicate thatseveral products might still be sold profitably to customer D, the best
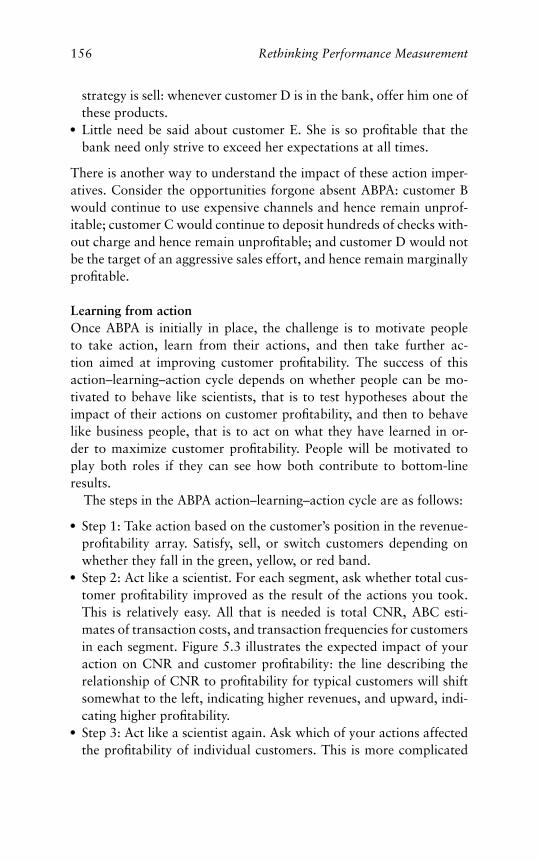
156 Rethinking Performance Measurement
strategy is sell: whenever customer D is in the bank, offer him one ofthese products.
� Little need be said about customer E. She is so profitable that thebank need only strive to exceed her expectations at all times.
There is another way to understand the impact of these action imper-atives. Consider the opportunities forgone absent ABPA: customer Bwould continue to use expensive channels and hence remain unprof-itable; customer C would continue to deposit hundreds of checks with-out charge and hence remain unprofitable; and customer D would notbe the target of an aggressive sales effort, and hence remain marginallyprofitable.
Learning from actionOnce ABPA is initially in place, the challenge is to motivate peopleto take action, learn from their actions, and then take further ac-tion aimed at improving customer profitability. The success of thisaction–learning–action cycle depends on whether people can be mo-tivated to behave like scientists, that is to test hypotheses about theimpact of their actions on customer profitability, and then to behavelike business people, that is to act on what they have learned in or-der to maximize customer profitability. People will be motivated toplay both roles if they can see how both contribute to bottom-lineresults.
The steps in the ABPA action–learning–action cycle are as follows:
� Step 1: Take action based on the customer’s position in the revenue-profitability array. Satisfy, sell, or switch customers depending onwhether they fall in the green, yellow, or red band.
� Step 2: Act like a scientist. For each segment, ask whether total cus-tomer profitability improved as the result of the actions you took.This is relatively easy. All that is needed is total CNR, ABC esti-mates of transaction costs, and transaction frequencies for customersin each segment. Figure 5.3 illustrates the expected impact of youraction on CNR and customer profitability: the line describing therelationship of CNR to profitability for typical customers will shiftsomewhat to the left, indicating higher revenues, and upward, indi-cating higher profitability.
� Step 3: Act like a scientist again. Ask which of your actions affectedthe profitability of individual customers. This is more complicated
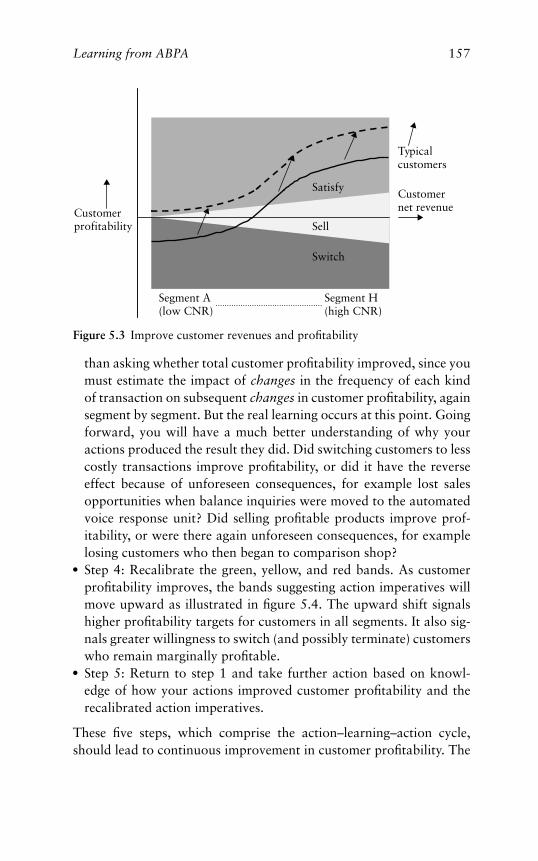
Learning from ABPA 157
Customernet revenue
Satisfy
Typicalcustomers
Switch
SellCustomerprofitability
Segment A(low CNR)
Segment H(high CNR)
Figure 5.3 Improve customer revenues and profitability
than asking whether total customer profitability improved, since youmust estimate the impact of changes in the frequency of each kindof transaction on subsequent changes in customer profitability, againsegment by segment. But the real learning occurs at this point. Goingforward, you will have a much better understanding of why youractions produced the result they did. Did switching customers to lesscostly transactions improve profitability, or did it have the reverseeffect because of unforeseen consequences, for example lost salesopportunities when balance inquiries were moved to the automatedvoice response unit? Did selling profitable products improve prof-itability, or were there again unforeseen consequences, for examplelosing customers who then began to comparison shop?
� Step 4: Recalibrate the green, yellow, and red bands. As customerprofitability improves, the bands suggesting action imperatives willmove upward as illustrated in figure 5.4. The upward shift signalshigher profitability targets for customers in all segments. It also sig-nals greater willingness to switch (and possibly terminate) customerswho remain marginally profitable.
� Step 5: Return to step 1 and take further action based on knowl-edge of how your actions improved customer profitability and therecalibrated action imperatives.
These five steps, which comprise the action–learning–action cycle,should lead to continuous improvement in customer profitability. The
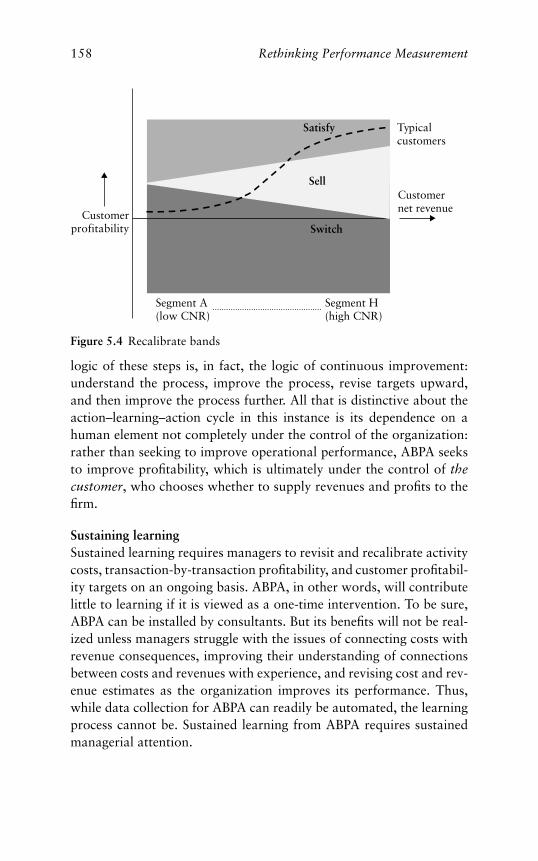
158 Rethinking Performance Measurement
Customernet revenue
Typicalcustomers
Segment A(low CNR)
Segment H(high CNR)
Customerprofitability Switch
Satisfy
Sell
Figure 5.4 Recalibrate bands
logic of these steps is, in fact, the logic of continuous improvement:understand the process, improve the process, revise targets upward,and then improve the process further. All that is distinctive about theaction–learning–action cycle in this instance is its dependence on ahuman element not completely under the control of the organization:rather than seeking to improve operational performance, ABPA seeksto improve profitability, which is ultimately under the control of thecustomer, who chooses whether to supply revenues and profits to thefirm.
Sustaining learningSustained learning requires managers to revisit and recalibrate activitycosts, transaction-by-transaction profitability, and customer profitabil-ity targets on an ongoing basis. ABPA, in other words, will contributelittle to learning if it is viewed as a one-time intervention. To be sure,ABPA can be installed by consultants. But its benefits will not be real-ized unless managers struggle with the issues of connecting costs withrevenue consequences, improving their understanding of connectionsbetween costs and revenues with experience, and revising cost and rev-enue estimates as the organization improves its performance. Thus,while data collection for ABPA can readily be automated, the learningprocess cannot be. Sustained learning from ABPA requires sustainedmanagerial attention.
Learning from ABPA 159
Compensating people under ABPA
Under ABPA, people can easily be compensated for customer profitabil-ity. ABPA is not congenial to compensating people for performance onaggregate non-financial performance measures, for example growth inthe customer base. Nor is ABPA congenial to compensating peoplefor revenues while ignoring costs. Ideally, compensation under ABPAwould be awarded for long-term customer profitability, but as a practi-cal matter it is critical for people to perceive a close connection betweentheir accomplishments and their pay packets. A middle ground mightbe to base compensation on customer profitability over the past threeto six months.
There are several advantages to compensating people for customerprofitability rather than for other financial measures such as profit mar-gins or sales. One advantage, which is straightforward, is that customerprofitability can be cascaded deeper into the organization than profitmargins. Profit margins can be computed only at the point where rev-enues and expenses are joined in the organization, usually the firm asa whole or its business units. In a typical retail bank branch, profits ormargins can be computed for the branch as a whole but cannot be cas-caded to account managers. Customer profitability, by contrast, can becalculated for account managers (the profitability of their customers) aswell as for the branch manager (the profitability of branch customers).But the advantages of compensating people for customer profitabilityrather than earnings go beyond this. As we have seen, ABPA identifiesthe drivers of customer profitability in a way that is very easy to under-stand: the drivers of customer profitability are customer transactions,and the impact of customer transactions on customer profitability ismeasured in dollars. Since the connection between the drivers of cus-tomer profitability and the customer profitability result that is sought istransparent, it is sufficient to compensate customer profitability to in-duce people to engage in more rather than less profitable transactions.By contrast, finding the drivers of branch profitability and quantifyingtheir impact is more difficult, as the analysis of the balanced scorecardin chapter 4 demonstrated.
A potential objection to compensating people for customer prof-itability is that the latter depends on ABC cost estimates that fail totake account of fixed costs. This objection must be acknowledged, butat the same time it must also be acknowledged that reported profit
160 Rethinking Performance Measurement
margins for retail branches often omit significant fixed and variablecosts. The cost of processing back-office transactions, for example, arefrequently not allocated to the branches where transactions originate.
ABPA thus presents a happy coincidence. On the one hand, ABPAmeasures organizational performance at the level of activities and cus-tomer transactions. Such fine-grained measurement, as we have seen, isconducive to learning and improvement. On the other hand, ABPA alsomeasures customer profitability, a bottom-line measure that capturespeople’s performance and can be readily tied to their compensation.This happy coincidence must never be overlooked when weighing thebenefits of ABPA against its costs and complexity.
Financial measures and the balanced scorecard versus ABPA
At this point, it may be useful to compare financial measurement, thebalanced scorecard, and ABPA. In table 5.1, these measurement systemsare compared and evaluated on several dimensions: measures and units,ease of implementation, learning, compensation, and assumptions.
Is ABPA advantageous?
Measures and unitsFinancial measures report bottom-line results for firms and businessunits – the different kinds of financial measures were reviewed in chap-ter 1. Balanced scorecard measures include bottom-line financial resultsas well as non-financial measures in several domains, usually at the levelof firms and business units14 – the balanced scorecard was discussedin chapter 3. ABPA measures are quite different. ABPA measures prof-itability at the level of customers and customer transactions. In prin-ciple, profitability could be measured at the level of activities as well.Customer profitability is measured for individual customers, and canbe rolled up from individual customers to the top of the organization.ABPA measures the profitability of customer transactions for customersegments but not for individual customers. Like customer profitabil-ity, however, the profitability of customer transactions can be rolled upfrom the bottom to the top of the organization. Financial and score-card measures thus are largely top-down but do not go very far downin the organization. ABPA measures, on the other hand, can be rolledup from the bottom to the top of the organization.
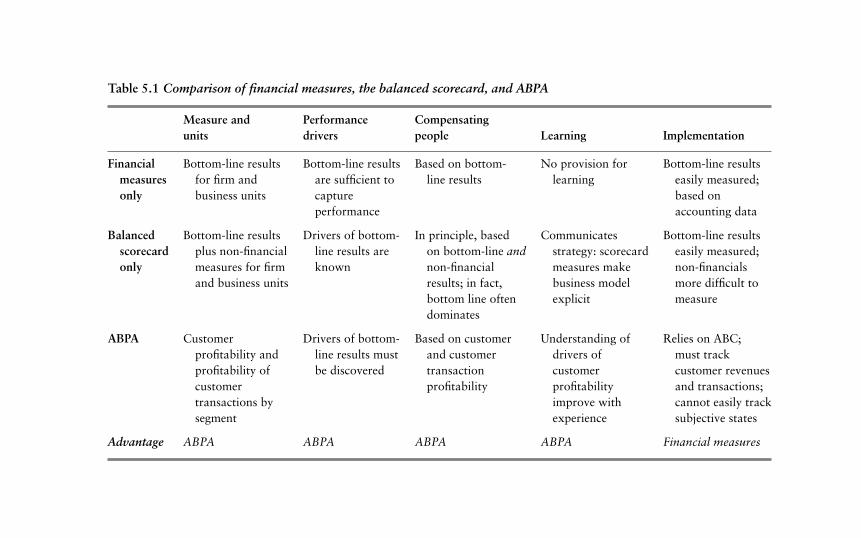
Table 5.1 Comparison of financial measures, the balanced scorecard, and ABPA
Measure and Performance Compensatingunits drivers people Learning Implementation
Financial Bottom-line results Bottom-line results Based on bottom- No provision for Bottom-line resultsmeasures for firm and are sufficient to line results learning easily measured;only business units capture based on
performance accounting data
Balanced Bottom-line results Drivers of bottom- In principle, based Communicates Bottom-line resultsscorecard plus non-financial line results are on bottom-line and strategy: scorecard easily measured;only measures for firm known non-financial measures make non-financials
and business units results; in fact, business model more difficult tobottom line often explicit measuredominates
ABPA Customer Drivers of bottom- Based on customer Understanding of Relies on ABC;profitability and line results must and customer drivers of must trackprofitability of be discovered transaction customer customer revenuescustomer profitability profitability and transactions;transactions by improve with cannot easily tracksegment experience subjective states
Advantage ABPA ABPA ABPA ABPA Financial measures
162 Rethinking Performance Measurement
Financial measures are aligned with the profitability objectives of thefirm but capture results only for the firm as a whole and its businessunits.Non-financial scorecardmeasures are intended to be in alignmentwith the profitability of the firm, but are not necessarily in alignment.Moreover, scorecard measures, like financial measures, capture resultsfor the firm as a whole and its business units. ABPA measures of cus-tomer profitability and customer transaction profitability, by contrast,are aligned with the profitability objectives of the firm and captureresults throughout the organization. Advantage: ABPA.
Performance driversFinancial measurement assumes that bottom-line results describe theperformance of the firm fully. The balanced scorecard, by contrast,assumes that measures of bottom-line results and the non-financialdrivers of bottom-line results must be measured to describe the perfor-mance of the firm fully. The balanced scorecard assumes, additionally,that the non-financial drivers of the bottom line are already known.ABPA takes a further step. Like the balanced scorecard, ABPA assumesthat bottom-line results and their non-financial drivers must be mea-sured to describe the performance of the firm fully. But unlike thebalanced scorecard, ABPA assumes that the drivers of bottom-line per-formance must be discovered through analysis of the relevant data andfacilitates the discovery process by measuring the profitability – notsimply the frequency – of customer transactions in real time.
In a static world, financial measures would capture the performanceof the firm fully – tomorrow’s results would be identical to today’s. Ina dynamic world, financial measures do not capture the performanceof the firm fully, and non-financial drivers of bottom-line performancemust be discovered rather than assumed. Advantage: ABPA.
Compensating peopleCompensating people on financial measures is fairly easy. The mainlimitation is that connections between individual performance andoverall financial results become more tenuous as one goes deeper intothe organization. Compensating people for performance on scorecardmeasures, as we saw in chapter 3, is more challenging. This is dueto the complications of combining financial and non-financial mea-sures into an overall appraisal of performance, which can result in
Learning from ABPA 163
a reversion to purely financial measurement. Again, since scorecardstypically make use of aggregate measures, connections between indi-vidual performance and scorecard measures become more tenuous thedeeper one goes into the organization. Compensating people underABPA is straightforward. People having direct customer responsibil-ity are compensated for total customer profitability. People not hav-ing direct customer responsibility are compensated for the profitabilityof customer transactions for which they are responsible or that theyfacilitate.
Again, ABPA measures apply throughout the organization whereasfinancial measures and scorecard measures do not. Advantage: ABPA.
LearningFinancial measures make no provision for learning. Balanced scorecardmeasures, by contrast, have a learning function: they transform thebusiness model implicit in the firm’s strategy into explicit measures andconnections among these measures. This roadmap of the firm’s strategy,in turn, can be used to assess progress toward strategic goals and torethink the strategy if necessary. ABPA measures have a further learningfunction. Not only do the ABPA measures trace initial connectionsbetween the firm’s transactions with its customers and its financialresults, but they also trace the trajectory of these connections overtime, allowing firms to modify their customer strategies incrementallywith experience.
ABPA measures thus are unique in allowing firms to move from actionto learning to further action in a very short space of time. Advantage:ABPA.
ImplementationFinancial measures are routinely reported by the accounting system andhence are fairly easy to implement. Implementing the balanced score-card, as we saw, can be frustrating. Choosing non-financial measures isnot easy, and measurement issues are endemic – again, recall chapter 3.Implementing ABPA poses even greater challenges, since ABPA relieson activity-based costing, which is itself costly, and the capability offirms to track customer revenues and transactions in real time, whichis also costly.
164 Rethinking Performance Measurement
Financial measurement is more economical and much better under-stood than either balanced scorecard or ABPA. Advantage: financialmeasures.
Ease of implementation versus quality of measurement
ABPA is superior to financial measurement and the balanced score-card with respect to the alignment of measures with the profitabilityobjectives of the firm, its treatment of performance drivers, the wayit compensates people, and opportunities for organizational learning.In short, the ABPA advantage is completeness of performance mea-surement: ABPA completes the connection between the activities per-formed by the firm and the firm’s financial performance. Moreover,should these connections prove stable over time, ABPA comes close toconnecting the firm’s activities with its true economic performance. Theadvantage of financial measurement, by contrast, is ease of implemen-tation, which will be decisive in many instances. Financial measures arewidely understood, most are governed by accounting conventions, andmost are comparable both within and across firms. The balanced score-card falls between ABPA and financial measures on both dimensions:scorecard measures are more complete than financial measures but lesscomplete than the measures generated by ABPA, and balanced score-cards are somewhat more difficult to implement than financial mea-sures when used to gauge progress toward strategic objectives and, aswe have seen, nearly impossible to implement satisfactorily when theyare used to compensate people.
Figure 5.5 arrays financial measurement, the balanced scorecard,and ABPA by quality of measurement and ease of implementation.The clear suggestion, consistent with this analysis, is that there aresevere tradeoffs between ease of implementation and completeness ofperformance measurement. But the callouts in figure 5.5 add a newelement: they suggest conditions that will cause firms to prefer ease ofimplementation over completeness of measurement and vice versa –in other words, where the likely payoff from ABPA falls short of itscost of implementation, and where it exceeds this cost. The conditionsgoverning the choice of performance measures can follow from ABPA’sdecisive advantage (which, of course, is not costless): ABPA locates andfinds opportunities for profit in differences in customer valuation of theactivities performed by the firm.
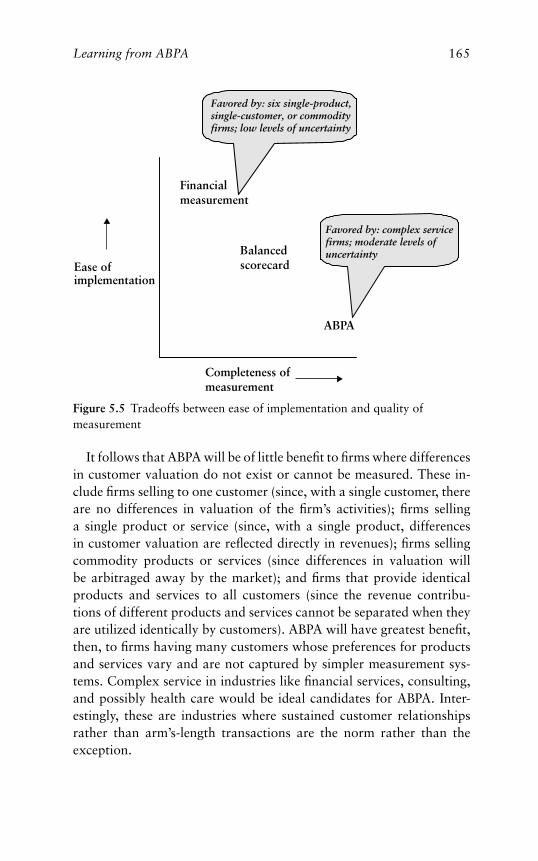
Learning from ABPA 165
Financialmeasurement
Balancedscorecard
ABPA
Ease ofimplementation
Completeness ofmeasurement
Favored by: six single-product,single-customer, or commodityfirms; low levels of uncertainty
Favored by: complex servicefirms; moderate levels ofuncertainty
Figure 5.5 Tradeoffs between ease of implementation and quality ofmeasurement
It follows that ABPA will be of little benefit to firms where differencesin customer valuation do not exist or cannot be measured. These in-clude firms selling to one customer (since, with a single customer, thereare no differences in valuation of the firm’s activities); firms sellinga single product or service (since, with a single product, differencesin customer valuation are reflected directly in revenues); firms sellingcommodity products or services (since differences in valuation willbe arbitraged away by the market); and firms that provide identicalproducts and services to all customers (since the revenue contribu-tions of different products and services cannot be separated when theyare utilized identically by customers). ABPA will have greatest benefit,then, to firms having many customers whose preferences for productsand services vary and are not captured by simpler measurement sys-tems. Complex service in industries like financial services, consulting,and possibly health care would be ideal candidates for ABPA. Inter-estingly, these are industries where sustained customer relationshipsrather than arm’s-length transactions are the norm rather than theexception.
166 Rethinking Performance Measurement
The level of uncertainty – or deterministic complexity, which has thesame effect as uncertainty – posed by the environment also affectsthe appropriateness of ABPA. Absent uncertainty, connections betweenthe activities, costs, customers, and revenues will be understood tacitlyif not explicitly, the performance of the firm will be reflected fully infinancial results, and ABPA will offer marginal benefits at best. A highlevel of uncertainty, by contrast, will render ABPA estimates, like allperformance measures, so labile as to have little or no value looking for-ward. ABPA, then, will offer the greatest benefit at intermediate levelsof uncertainty. In this intermediate condition, the level of uncertaintyis high enough to render tacit knowledge of connections between ac-tivities, costs, customer, and revenues inadequate, but it is low enoughthat ABPA profitability estimates remain useful, if imperfect, indicatorsof the economic performance of the firm.
At the end of the day, almost all firms will retain the financial mea-surement systems whether or not they meet the basic requirements ofperformance measurement. Financial measurement is deeply embeddedin most firms and the accounting profession, and firm-level financialresults must be reported to shareholders and regulators. The questionfacing some firms, complex service firms especially, is whether theywill supplement their financial measures with ABPA-like measurementsystems that come much closer to meeting the basic requirements ofperformance measurement.
The bottom line
This chapter, as promised, was not a “how-to-do-it” manual for in-stalling ABPA. That said, the following points should be remembered:
� Generally, fine-grained measurement is needed to improve processes,whereas coarse-grained measurement is needed to appraise and com-pensate people’s performance.
� ABPA yields the fine-grained measures needed for improvement: therevenues and costs, and hence profitability, flowing from the activitiesand transactions performed by a firm. Transaction-by-transactioncost and profitability measures can be used to identify the less costlyand more profitable transactions for each customer segment. Profit-maximizing strategies can be developed and tested for customers at

Learning from ABPA 167
different levels of profitability within each segment. These strategiescan be evaluated against results and improved with experience.
� ABPA yields coarse-grained measures for performance appraisal andcompensation: customer profitability. People can be appraised andcompensated for total customer profitability or their contributionsto customer profitability.
� Compared to financial measurement and the balanced scorecard,ABPA has the advantage in most respects. The one deficiency ofABPA is ease of implementation, since ABPA depends on activity-based costing and systems capable of tracking all customer transac-tions, financial and non-financial, in real time.
� Firms will select ABPA to the extent that ABPA’s benefits exceedits costs. These firms will typically be complex service firms withongoing customer relationships operating at moderate levels ofuncertainty.
6 Managing and strategizingwith ABPA
W hat are the implications of ABPA for managing the firmand implementing its strategy? To answer this question,think of the following: in order to arrive at ABPA, we de-
composed the firm into its elemental parts: activities, costs, customers,and revenues. ABPA connects these parts by linking the activities per-formed for the customer and the costs they incur with the revenues thecustomer supplies. This linkage allows us to assess whether particularactivities or transactions (which are supersets of activities) or products(which are, in turn, supersets of transactions) are profitable. The prof-itability of an activity, transaction, or product can be assessed for theentire customer base of a firm or for segments of its customers. Theprofitability of customers is then the profitability of their products andtransactions, that is, revenues less the costs of providing these prod-ucts and transactions. Since people’s performance can be appraisedand rewarded against customer profitability targets, ABPA not onlyallows firms to identify which actions are profitable and which are un-profitable, but also allows firms to reward people for doing what isprofitable and for improving the profitability of what they do. ABPA,though complicated, is thus a powerful tool for aligning people’s be-havior with the financial objectives of the firm.
We must now reassemble the firm from its elemental parts to makeit manageable and to give it direction under ABPA. To do this, wemust take two steps. The first and most important step is to locatewhere in the firm it is easiest to construct performance chains, that iswhere it is easiest to connect fine-grained measures of activities, costs,customers, and revenues. The importance of connecting fine-grainedmeasures cannot be over-emphasized. Many firms try to assemble andconnect aggregate measures of their activities, costs, customers, andrevenues at or near the top of the organization. This is usually unpro-ductive because, as we saw earlier, especially in chapter 1, aggregationis the bane of performance measurement. The second step is to shift
168
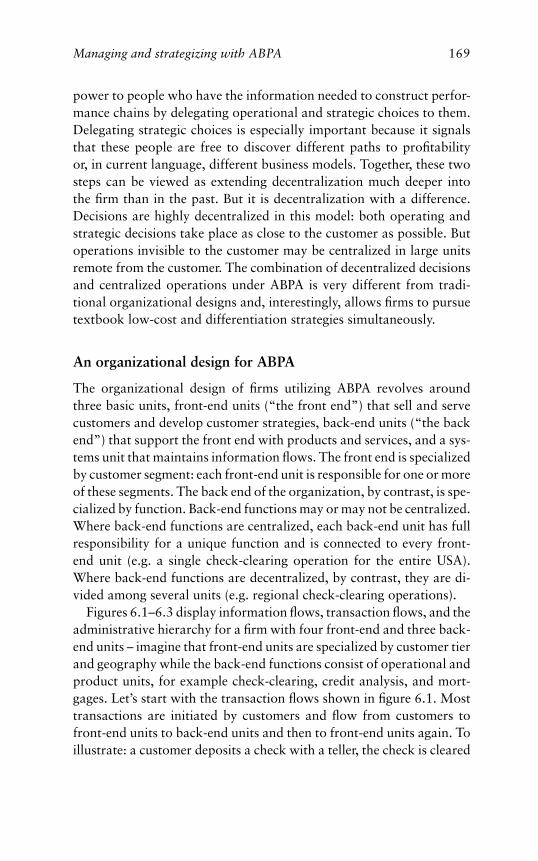
Managing and strategizing with ABPA 169
power to people who have the information needed to construct perfor-mance chains by delegating operational and strategic choices to them.Delegating strategic choices is especially important because it signalsthat these people are free to discover different paths to profitabilityor, in current language, different business models. Together, these twosteps can be viewed as extending decentralization much deeper intothe firm than in the past. But it is decentralization with a difference.Decisions are highly decentralized in this model: both operating andstrategic decisions take place as close to the customer as possible. Butoperations invisible to the customer may be centralized in large unitsremote from the customer. The combination of decentralized decisionsand centralized operations under ABPA is very different from tradi-tional organizational designs and, interestingly, allows firms to pursuetextbook low-cost and differentiation strategies simultaneously.
An organizational design for ABPA
The organizational design of firms utilizing ABPA revolves aroundthree basic units, front-end units (“the front end”) that sell and servecustomers and develop customer strategies, back-end units (“the backend”) that support the front end with products and services, and a sys-tems unit that maintains information flows. The front end is specializedby customer segment: each front-end unit is responsible for one or moreof these segments. The back end of the organization, by contrast, is spe-cialized by function. Back-end functions may or may not be centralized.Where back-end functions are centralized, each back-end unit has fullresponsibility for a unique function and is connected to every front-end unit (e.g. a single check-clearing operation for the entire USA).Where back-end functions are decentralized, by contrast, they are di-vided among several units (e.g. regional check-clearing operations).
Figures 6.1–6.3 display information flows, transaction flows, and theadministrative hierarchy for a firm with four front-end and three back-end units – imagine that front-end units are specialized by customer tierand geography while the back-end functions consist of operational andproduct units, for example check-clearing, credit analysis, and mort-gages. Let’s start with the transaction flows shown in figure 6.1. Mosttransactions are initiated by customers and flow from customers tofront-end units to back-end units and then to front-end units again. Toillustrate: a customer deposits a check with a teller, the check is cleared
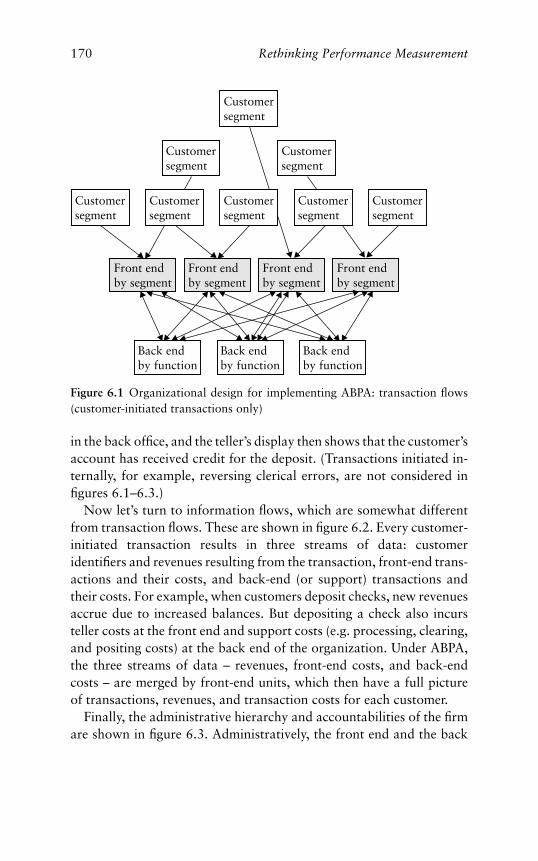
170 Rethinking Performance Measurement
Front endby segment
Front endby segment
Front endby segment
Front endby segment
Customersegment
Customersegment
Customersegment
Customersegment
Customersegment
Back endby function
Back endby function
Back endby function
Customersegment
Customersegment
Customersegment
Figure 6.1 Organizational design for implementing ABPA: transaction flows(customer-initiated transactions only)
in the back office, and the teller’s display then shows that the customer’saccount has received credit for the deposit. (Transactions initiated in-ternally, for example, reversing clerical errors, are not considered infigures 6.1–6.3.)
Now let’s turn to information flows, which are somewhat differentfrom transaction flows. These are shown in figure 6.2. Every customer-initiated transaction results in three streams of data: customeridentifiers and revenues resulting from the transaction, front-end trans-actions and their costs, and back-end (or support) transactions andtheir costs. For example, when customers deposit checks, new revenuesaccrue due to increased balances. But depositing a check also incursteller costs at the front end and support costs (e.g. processing, clearing,and positing costs) at the back end of the organization. Under ABPA,the three streams of data – revenues, front-end costs, and back-endcosts – are merged by front-end units, which then have a full pictureof transactions, revenues, and transaction costs for each customer.
Finally, the administrative hierarchy and accountabilities of the firmare shown in figure 6.3. Administratively, the front end and the back
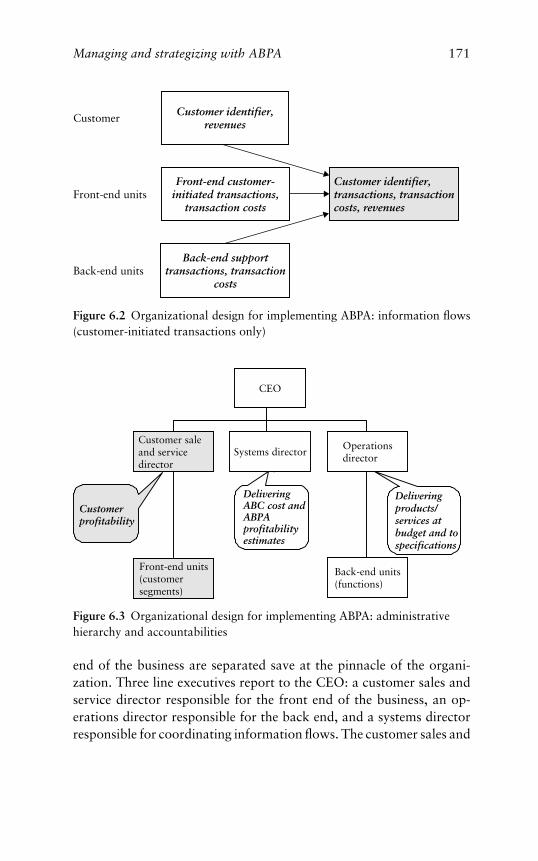
Managing and strategizing with ABPA 171
Customer identifier,revenues
Customer identifier,transactions, transactioncosts, revenues
Back-end supporttransactions, transaction
costs
Customer
Front-end units
Back-end units
Front-end customer-initiated transactions,
transaction costs
Figure 6.2 Organizational design for implementing ABPA: information flows(customer-initiated transactions only)
Customer saleand servicedirector
Operationsdirector
Systems director
Front-end units(customersegments)
Back-end units(functions)
CEO
Deliveringproducts/services atbudget and tospecifications
Customerprofitability
DeliveringABC cost andABPAprofitabilityestimates
Figure 6.3 Organizational design for implementing ABPA: administrativehierarchy and accountabilities
end of the business are separated save at the pinnacle of the organi-zation. Three line executives report to the CEO: a customer sales andservice director responsible for the front end of the business, an op-erations director responsible for the back end, and a systems directorresponsible for coordinating information flows. The customer sales and
172 Rethinking Performance Measurement
service director and his reports are accountable for customer profitabil-ity, much like units in a divisionalized firm are accountable for bottom-line results. The operations director and his reports are accountable fordelivering products and services at cost and to specifications set by thesales and service director and his reports – the back end of the busi-ness, in other words, is a supplier to the front end. The systems directoris responsible for maintaining ABC cost and ABPA profitability esti-mates and assembling and delivering accurate and timely informationon customers, revenues, and costs to the front-end units and cost datato back-end units.
The ABPA organization versus conventionalorganizational designs
The organizational design sketched in figures 6.1–6.3 departs fromconventional organizational designs in several respects. Convention-ally, firms are either organized by function, divisionalized, or matrixed.The organizational design in these figures, by contrast, is partly func-tional and partly divisionalized. Three functional units report to theCEO – front-end customer sales and service, back-end operations, andsystems. The front-end customer sales and service function, however,is divisionalized internally (front-end units, though much smaller thanbusiness units in divisionalized firms, are accountable for customerprofitability). The back-end operations function, by contrast, is di-vided by function internally (the size of functional subunits and hencethe extent that functions are centralized in back-end units is driven byscale economies). Nor is this organizational design a matrix. In matrixdesigns, people are assigned to both business units and functional unitsand thus have dual reporting relationships. In our design, people areassigned either to front-end or to back-end units but not to both. To besure, back-end units are accountable for delivering products and ser-vices to specifications and costs set by front-end units, but their peopledo not report to front-end units.
There is a further difference between conventional organizationaldesigns and the design for firms using ABPA sketched above: the ABPAdesign combines functional organization with the capacity to mea-sure profitability in much of the organization. Remove ABPA fromthe picture and the choices available to firms providing a large arrayof services to customers having different requirements are unattractive.
Managing and strategizing with ABPA 173
One choice is divisionalization and fully decentralized operations. Thischoice, though attractive in some settings (e.g. chain stores), is unattrac-tive where there are substantial scale economies in back-end functions.The alternative is functional organization absent fine-grained ABPAcost and profitability metrics. This alternative is not especially attrac-tive either, mainly because revenues (generated by front-end customersales and service units) and costs (incurred largely but not entirely byback-end functional units) become independent events whose relation-ship cannot easily be understood.
To be sure, firms implementing the organizational design suggestedfor ABPA will not measure customer profitability throughout the or-ganization – there are no profitability metrics for functional units atthe back end of the business – and in this respect the organizationaldesign falls somewhat short of ideal. But it does drive profitabilitymeasures much deeper into the organization, specifically to front-endcustomer sales and service units, account managers, and individual cus-tomers, than either functional or divisional organizational designs per-mit. Most importantly, the organizational design suggested for ABPAallows front-end units to connect transaction costs with the revenuesresulting from customer transactions. As will be seen, the ability tomake this connection allows much greater leeway for strategic choicethan conventional organizational designs.
Organizational design in manufacturing versusthe ABPA organization
Much of our thinking about organizational design is based on theexperience of manufacturing firms. This occurs partly because man-ufacturing predated services, but manufacturing is also simpler thanservices. Whether a manufacturing firm is organized by function ordivisionalized, most of its value-adding activities take place in produc-tion units at the back end of the firm or the back end of its businessunits. The choice between functional and divisional organization inmanufacturing is thus the choice between one and several back-endproduction units. Services are more complicated because most of theirvalue-adding activities are scattered across front-end units rather thanconcentrated in a few plants. Not only, then, will the performancemeasures used in manufacturing remain simpler than the ABPA-likemetrics required for many service firms – recall the discussion at the
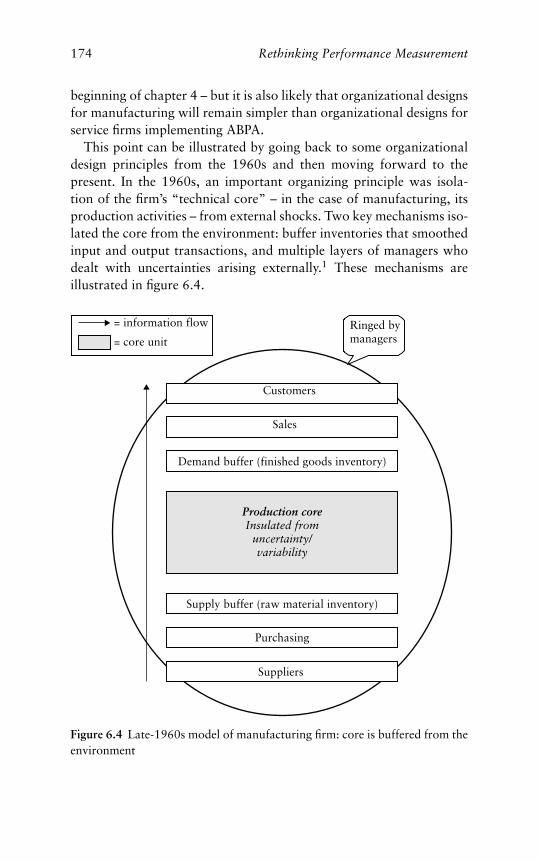
174 Rethinking Performance Measurement
beginning of chapter 4 – but it is also likely that organizational designsfor manufacturing will remain simpler than organizational designs forservice firms implementing ABPA.
This point can be illustrated by going back to some organizationaldesign principles from the 1960s and then moving forward to thepresent. In the 1960s, an important organizing principle was isola-tion of the firm’s “technical core” – in the case of manufacturing, itsproduction activities – from external shocks. Two key mechanisms iso-lated the core from the environment: buffer inventories that smoothedinput and output transactions, and multiple layers of managers whodealt with uncertainties arising externally.1 These mechanisms areillustrated in figure 6.4.
Production coreInsulated from
uncertainty/variability
Supply buffer (raw material inventory)
Purchasing
Demand buffer (finished goods inventory)
Suppliers
Sales
Customers
Ringed bymanagers
= information flow
= core unit
Figure 6.4 Late-1960s model of manufacturing firm: core is buffered from theenvironment
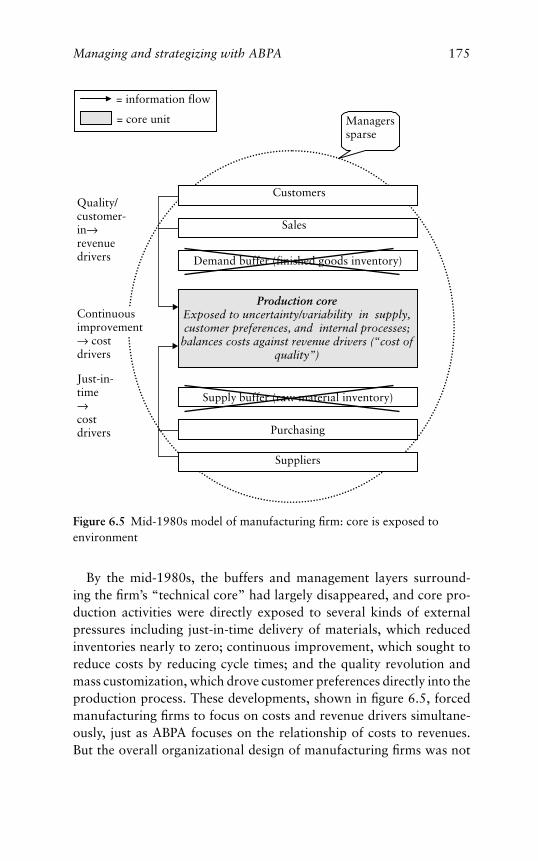
Managing and strategizing with ABPA 175
Just-in-time→costdrivers
Production coreExposed to uncertainty/variability in supply,customer preferences, and internal processes;
balances costs against revenue drivers (“cost ofquality”)
Supply buffer (raw material inventory)
Purchasing
Demand buffer (finished goods inventory)
Suppliers
Sales
CustomersQuality/customer-in→revenuedrivers
Continuousimprovement→ costdrivers
Managerssparse
= information flow
= core unit
Figure 6.5 Mid-1980s model of manufacturing firm: core is exposed toenvironment
By the mid-1980s, the buffers and management layers surround-ing the firm’s “technical core” had largely disappeared, and core pro-duction activities were directly exposed to several kinds of externalpressures including just-in-time delivery of materials, which reducedinventories nearly to zero; continuous improvement, which sought toreduce costs by reducing cycle times; and the quality revolution andmass customization, which drove customer preferences directly into theproduction process. These developments, shown in figure 6.5, forcedmanufacturing firms to focus on costs and revenue drivers simultane-ously, just as ABPA focuses on the relationship of costs to revenues.But the overall organizational design of manufacturing firms was not
176 Rethinking Performance Measurement
altered, much in contrast to services where ABPA-like metrics captur-ing costs and revenues require an innovative organizational design.The difference between manufacturing and services is this: customerpreferences and cost pressures can be translated into product andprocess specifications in manufacturing, and hence revenues can bebalanced against costs or cost drivers in the core production activi-ties of manufacturing firms. In services, by contrast, customer prefer-ences may be idiosyncratic, many activities satisfying customer pref-erences take place in front-end rather than in back-end units, and thevalue that is added by these activities is revealed only in revenues incomparison to costs. The consequence is that front-end units capa-ble of balancing revenues against costs are required in many servicefirms.
The ABPA organization and the e-commerce model
The ABPA organizational design may prove complementary to theworld of electronic commerce. A distinctive characteristic of e-commerce is that it is relentlessly customer-facing. Value is produced bycustomer relationships rather than by tangible assets. E-commerce fa-cilitates building customer relationships because it allows informationabout preferences and purchasing patterns to be accumulated inex-pensively and customer by customer. The technology of the internet,of course, facilitates accumulation of this information, and this infor-mation is also accumulated because e-commerce has a molecular viewof the customer:
Think of customers as individual molecules rather than mass markets, andthe picture bcomes clearer. B-Webs [business webs] group their economicunits to create value just as molecules cluster to form a substance. A B-Webis a collection of molecules held together by economic, personal, technolog-ical, cultural, and other forces. Customers are molecules in the B-Web. Thenew challenge of marketing is engineering the forces that attract and bindcustomers.2
The molecular view of the customer is taken to an extreme by webportals, e-commerce businesses providing no products or services di-rectly but, rather, channeling customers to firms providing productsand services. Not surprisingly, the dominant metrics for web por-tals describe relationships with their customers and business partners.
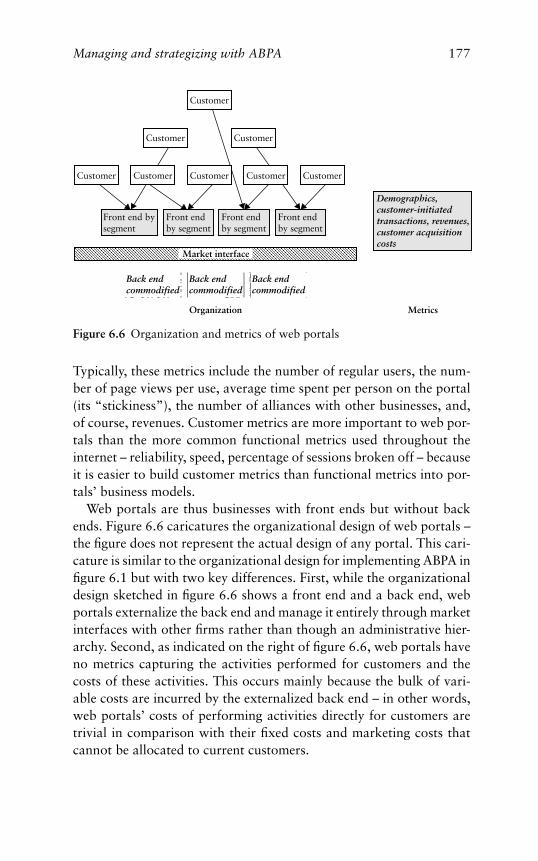
Managing and strategizing with ABPA 177
Front end bysegment
Front endby segment
Front endby segment
Front endby segment
Customer Customer
CustomerCustomer
Customer
Back endcommodified
Back endcommodified
Back endcommodified
Demographics,customer-initiatedtransactions, revenues,customer acquisitioncosts
Customer Customer Customer
Market interface
Organization Metrics
Figure 6.6 Organization and metrics of web portals
Typically, these metrics include the number of regular users, the num-ber of page views per use, average time spent per person on the portal(its “stickiness”), the number of alliances with other businesses, and,of course, revenues. Customer metrics are more important to web por-tals than the more common functional metrics used throughout theinternet – reliability, speed, percentage of sessions broken off – becauseit is easier to build customer metrics than functional metrics into por-tals’ business models.
Web portals are thus businesses with front ends but without backends. Figure 6.6 caricatures the organizational design of web portals –the figure does not represent the actual design of any portal. This cari-cature is similar to the organizational design for implementing ABPA infigure 6.1 but with two key differences. First, while the organizationaldesign sketched in figure 6.6 shows a front end and a back end, webportals externalize the back end and manage it entirely through marketinterfaces with other firms rather than though an administrative hier-archy. Second, as indicated on the right of figure 6.6, web portals haveno metrics capturing the activities performed for customers and thecosts of these activities. This occurs mainly because the bulk of vari-able costs are incurred by the externalized back end – in other words,web portals’ costs of performing activities directly for customers aretrivial in comparison with their fixed costs and marketing costs thatcannot be allocated to current customers.
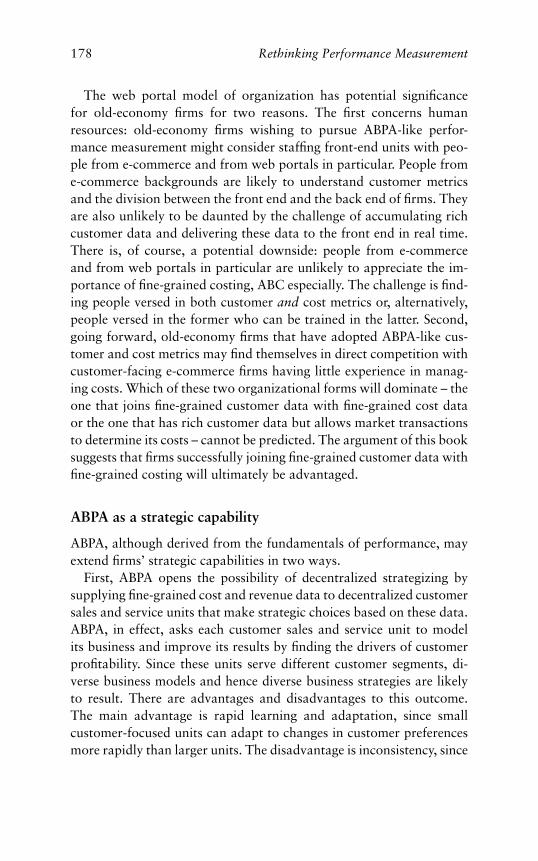
178 Rethinking Performance Measurement
The web portal model of organization has potential significancefor old-economy firms for two reasons. The first concerns humanresources: old-economy firms wishing to pursue ABPA-like perfor-mance measurement might consider staffing front-end units with peo-ple from e-commerce and from web portals in particular. People frome-commerce backgrounds are likely to understand customer metricsand the division between the front end and the back end of firms. Theyare also unlikely to be daunted by the challenge of accumulating richcustomer data and delivering these data to the front end in real time.There is, of course, a potential downside: people from e-commerceand from web portals in particular are unlikely to appreciate the im-portance of fine-grained costing, ABC especially. The challenge is find-ing people versed in both customer and cost metrics or, alternatively,people versed in the former who can be trained in the latter. Second,going forward, old-economy firms that have adopted ABPA-like cus-tomer and cost metrics may find themselves in direct competition withcustomer-facing e-commerce firms having little experience in manag-ing costs. Which of these two organizational forms will dominate – theone that joins fine-grained customer data with fine-grained cost dataor the one that has rich customer data but allows market transactionsto determine its costs – cannot be predicted. The argument of this booksuggests that firms successfully joining fine-grained customer data withfine-grained costing will ultimately be advantaged.
ABPA as a strategic capability
ABPA, although derived from the fundamentals of performance, mayextend firms’ strategic capabilities in two ways.
First, ABPA opens the possibility of decentralized strategizing bysupplying fine-grained cost and revenue data to decentralized customersales and service units that make strategic choices based on these data.ABPA, in effect, asks each customer sales and service unit to modelits business and improve its results by finding the drivers of customerprofitability. Since these units serve different customer segments, di-verse business models and hence diverse business strategies are likelyto result. There are advantages and disadvantages to this outcome.The main advantage is rapid learning and adaptation, since smallcustomer-focused units can adapt to changes in customer preferencesmore rapidly than larger units. The disadvantage is inconsistency, since
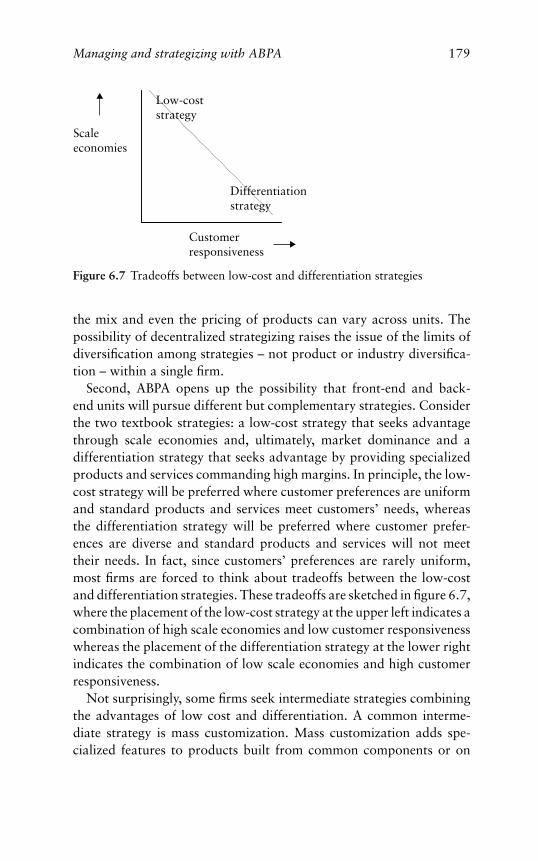
Managing and strategizing with ABPA 179
Scaleeconomies
Customerresponsiveness
Low-coststrategy
Differentiationstrategy
Figure 6.7 Tradeoffs between low-cost and differentiation strategies
the mix and even the pricing of products can vary across units. Thepossibility of decentralized strategizing raises the issue of the limits ofdiversification among strategies – not product or industry diversifica-tion – within a single firm.
Second, ABPA opens up the possibility that front-end and back-end units will pursue different but complementary strategies. Considerthe two textbook strategies: a low-cost strategy that seeks advantagethrough scale economies and, ultimately, market dominance and adifferentiation strategy that seeks advantage by providing specializedproducts and services commanding high margins. In principle, the low-cost strategy will be preferred where customer preferences are uniformand standard products and services meet customers’ needs, whereasthe differentiation strategy will be preferred where customer prefer-ences are diverse and standard products and services will not meettheir needs. In fact, since customers’ preferences are rarely uniform,most firms are forced to think about tradeoffs between the low-costand differentiation strategies. These tradeoffs are sketched in figure 6.7,where the placement of the low-cost strategy at the upper left indicates acombination of high scale economies and low customer responsivenesswhereas the placement of the differentiation strategy at the lower rightindicates the combination of low scale economies and high customerresponsiveness.
Not surprisingly, some firms seek intermediate strategies combiningthe advantages of low cost and differentiation. A common interme-diate strategy is mass customization. Mass customization adds spe-cialized features to products built from common components or on
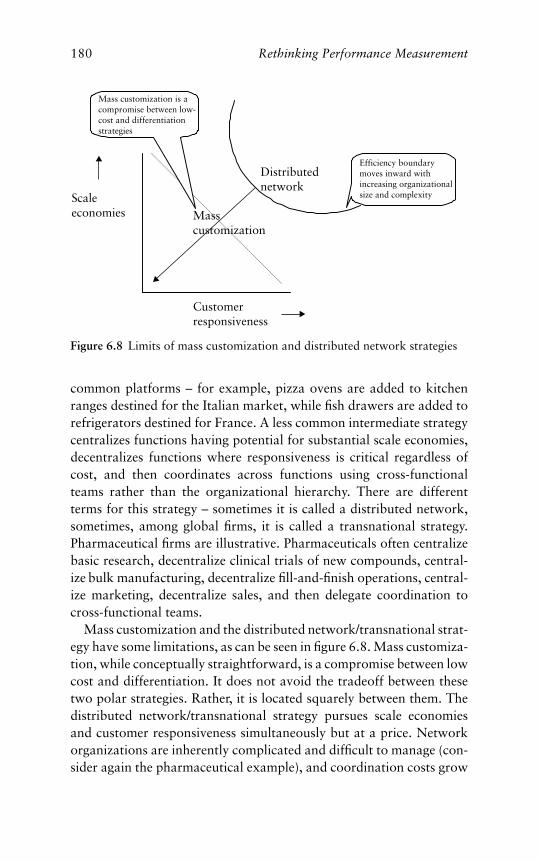
180 Rethinking Performance Measurement
Scaleeconomies
Customerresponsiveness
Masscustomization
Distributednetwork
Efficiency boundarymoves inward withincreasing organizationalsize and complexity
Mass customization is acompromise between low-cost and differentiationstrategies
Figure 6.8 Limits of mass customization and distributed network strategies
common platforms – for example, pizza ovens are added to kitchenranges destined for the Italian market, while fish drawers are added torefrigerators destined for France. A less common intermediate strategycentralizes functions having potential for substantial scale economies,decentralizes functions where responsiveness is critical regardless ofcost, and then coordinates across functions using cross-functionalteams rather than the organizational hierarchy. There are differentterms for this strategy – sometimes it is called a distributed network,sometimes, among global firms, it is called a transnational strategy.Pharmaceutical firms are illustrative. Pharmaceuticals often centralizebasic research, decentralize clinical trials of new compounds, central-ize bulk manufacturing, decentralize fill-and-finish operations, central-ize marketing, decentralize sales, and then delegate coordination tocross-functional teams.
Mass customization and the distributed network/transnational strat-egy have some limitations, as can be seen in figure 6.8. Mass customiza-tion, while conceptually straightforward, is a compromise between lowcost and differentiation. It does not avoid the tradeoff between thesetwo polar strategies. Rather, it is located squarely between them. Thedistributed network/transnational strategy pursues scale economiesand customer responsiveness simultaneously but at a price. Networkorganizations are inherently complicated and difficult to manage (con-sider again the pharmaceutical example), and coordination costs grow
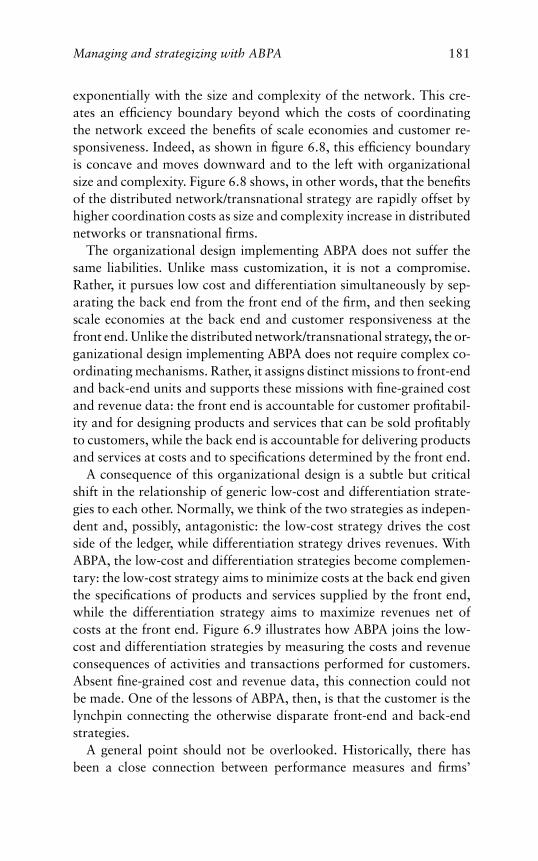
Managing and strategizing with ABPA 181
exponentially with the size and complexity of the network. This cre-ates an efficiency boundary beyond which the costs of coordinatingthe network exceed the benefits of scale economies and customer re-sponsiveness. Indeed, as shown in figure 6.8, this efficiency boundaryis concave and moves downward and to the left with organizationalsize and complexity. Figure 6.8 shows, in other words, that the benefitsof the distributed network/transnational strategy are rapidly offset byhigher coordination costs as size and complexity increase in distributednetworks or transnational firms.
The organizational design implementing ABPA does not suffer thesame liabilities. Unlike mass customization, it is not a compromise.Rather, it pursues low cost and differentiation simultaneously by sep-arating the back end from the front end of the firm, and then seekingscale economies at the back end and customer responsiveness at thefront end. Unlike the distributed network/transnational strategy, the or-ganizational design implementing ABPA does not require complex co-ordinating mechanisms. Rather, it assigns distinct missions to front-endand back-end units and supports these missions with fine-grained costand revenue data: the front end is accountable for customer profitabil-ity and for designing products and services that can be sold profitablyto customers, while the back end is accountable for delivering productsand services at costs and to specifications determined by the front end.
A consequence of this organizational design is a subtle but criticalshift in the relationship of generic low-cost and differentiation strate-gies to each other. Normally, we think of the two strategies as indepen-dent and, possibly, antagonistic: the low-cost strategy drives the costside of the ledger, while differentiation strategy drives revenues. WithABPA, the low-cost and differentiation strategies become complemen-tary: the low-cost strategy aims to minimize costs at the back end giventhe specifications of products and services supplied by the front end,while the differentiation strategy aims to maximize revenues net ofcosts at the front end. Figure 6.9 illustrates how ABPA joins the low-cost and differentiation strategies by measuring the costs and revenueconsequences of activities and transactions performed for customers.Absent fine-grained cost and revenue data, this connection could notbe made. One of the lessons of ABPA, then, is that the customer is thelynchpin connecting the otherwise disparate front-end and back-endstrategies.
A general point should not be overlooked. Historically, there hasbeen a close connection between performance measures and firms’
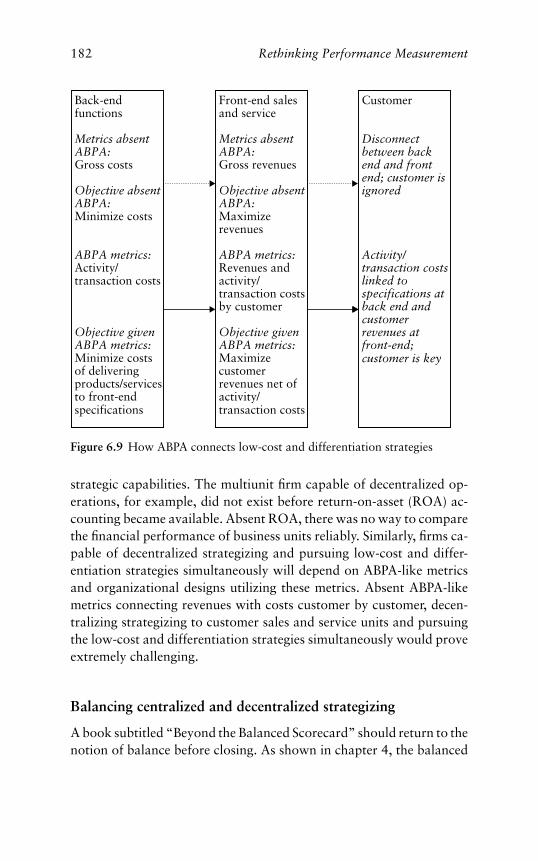
182 Rethinking Performance Measurement
Front-end salesand service
Metrics absentABPA:Gross revenues
Objective absentABPA:Maximizerevenues
ABPA metrics:Revenues andactivity/transaction costsby customer
Objective givenABPA metrics:Maximizecustomerrevenues net ofactivity/transaction costs
Back-endfunctions
Metrics absentABPA:Gross costs
Objective absentABPA:Minimize costs
ABPA metrics:Activity/transaction costs
Objective givenABPA metrics:Minimize costsof deliveringproducts/servicesto front-endspecifications
Customer
Disconnectbetween backend and frontend; customer isignored
Activity/transaction costslinked tospecifications atback end andcustomerrevenues atfront-end;customer is key
Figure 6.9 How ABPA connects low-cost and differentiation strategies
strategic capabilities. The multiunit firm capable of decentralized op-erations, for example, did not exist before return-on-asset (ROA) ac-counting became available. Absent ROA, there was no way to comparethe financial performance of business units reliably. Similarly, firms ca-pable of decentralized strategizing and pursuing low-cost and differ-entiation strategies simultaneously will depend on ABPA-like metricsand organizational designs utilizing these metrics. Absent ABPA-likemetrics connecting revenues with costs customer by customer, decen-tralizing strategizing to customer sales and service units and pursuingthe low-cost and differentiation strategies simultaneously would proveextremely challenging.
Balancing centralized and decentralized strategizing
A book subtitled “Beyond the Balanced Scorecard” should return to thenotion of balance before closing. As shown in chapter 4, the balanced
Managing and strategizing with ABPA 183
scorecard is not a particularly effective tool for appraising and compen-sating people’s performance. Two problems are endemic in scorecard-based compensation systems, finding the right scorecard measures, thatis scorecard measures driving bottom-line performance, and combiningscorecard measures, which are inherently dissimilar, into a single per-formance appraisal and compensation payout. The complexity of GFS’simplementation of the scorecard may have exacerbated these problems,but these problems remain nevertheless. Even the staunchest propo-nents of scorecard-based measurement systems acknowledge that itis risky to use scorecard measures to evaluate and compensate people.3
The same proponents of the balanced scorecard argue that score-card measures can and should be used to manage strategy, in otherwords to gauge progress toward strategic objectives. The scorecard, itis argued, helps translate a firm’s strategic vision into quantitative mea-sures of success, communicate the vision by setting goals, and learnfrom experience by comparing results with expectations. This claimis nearly irrefutable: a strategic vision cannot be implemented in anylarge organization until measures and milestones are put in place, and astrategy cannot be tested until results are compared with expectations.This said, it should be pointed out that using the balanced scorecardto manage a firm’s strategy represents a dramatic shift from using thescorecard to measure the performance of people as well as of the firm asa whole. Figure 6.10 illustrates how dramatic this shift is. The rows offigure 6.10 show the four major categories of scorecard measures –financial, customer, internal process, learning and innovation – overtime. The columns on which the rows are superimposed represent per-formance in the four scorecard categories at different points in time,for example quarterly results in these categories. Initially, the value ofthe scorecard was believed to lie in the columns, in its capacity to cap-ture the performance of the firm in a set of financial and non-financialmeasures. This objective has proved elusive, and the columns shownin figure 6.10 have largely disappeared from discourse surrounding thescorecard. The rows remain. The rhetoric about transforming strategyinto action notwithstanding, the scorecard has become a device fortracking progress toward financial and non-financial targets, whichare derived intuitively from the firm’s strategy. The connections be-tween scorecard categories and measures and the long-term perfor-mance of the firm – its economic performance – remain hypotheticaland untested, as they were ten years ago.
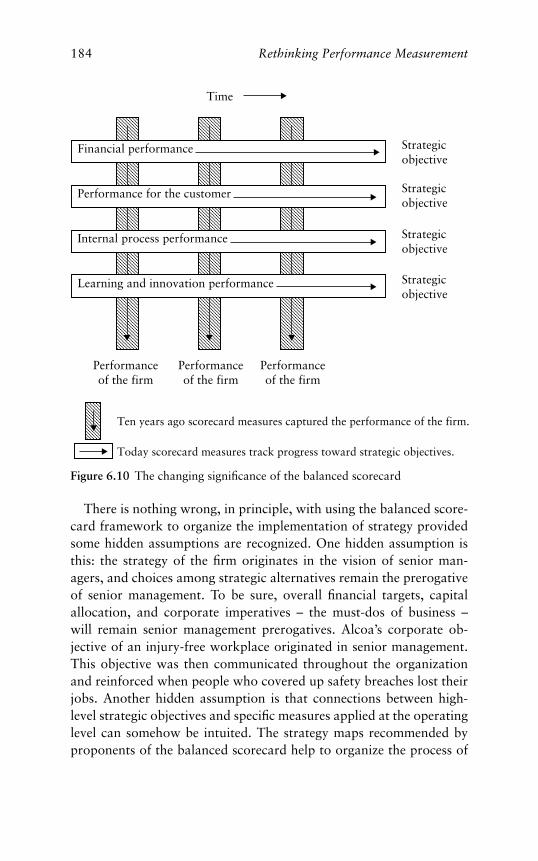
184 Rethinking Performance Measurement
Performanceof the firm
Strategicobjective
Strategicobjective
Strategicobjective
Strategicobjective
Time
Performanceof the firm
Performance for the customer
Internal process performance
Learning and innovation performance
Financial performance
Performanceof the firm
Ten years ago scorecard measures captured the performance of the firm.
Today scorecard measures track progress toward strategic objectives.
Figure 6.10 The changing significance of the balanced scorecard
There is nothing wrong, in principle, with using the balanced score-card framework to organize the implementation of strategy providedsome hidden assumptions are recognized. One hidden assumption isthis: the strategy of the firm originates in the vision of senior man-agers, and choices among strategic alternatives remain the prerogativeof senior management. To be sure, overall financial targets, capitalallocation, and corporate imperatives – the must-dos of business –will remain senior management prerogatives. Alcoa’s corporate ob-jective of an injury-free workplace originated in senior management.This objective was then communicated throughout the organizationand reinforced when people who covered up safety breaches lost theirjobs. Another hidden assumption is that connections between high-level strategic objectives and specific measures applied at the operatinglevel can somehow be intuited. The strategy maps recommended byproponents of the balanced scorecard help to organize the process of
Managing and strategizing with ABPA 185
intuiting connections between high-level strategic objectives and op-erational measures, to be sure, but the connections are derived intu-itively nonetheless. Go back to GFS’s experience with the balancedscorecard. GFS’s senior management chose to weight overall GFS sat-isfaction heavily because they believed overall satisfaction to be the bestpredictor of bottom-line results. After-the-fact analysis of GFS’s expe-rience proved this intuition erroneous. A twenty-item branch qualityindex was predictive of the financial performance of GFS’s branches.Overall GFS satisfaction contained no information relevant to finan-cial performance. The only virtue of overall GFS satisfaction was thatit was convenient because it could be compared across diverse productsand markets.
The ABPA approach to performance measurement opens the possi-bility of decentralizing strategizing to local units. Think again of GFS.GFS offers a large array of products to diverse customer segmentsworldwide. Ask two questions. First, can any strategic vision originat-ing in senior management and any set of performance measures derivedfrom this vision guide the actions of GFS’s people vis-a-vis their cus-tomers and competitors globally? The geographic scope of GFS’s busi-nesses and the range of GFS’s product offerings suggest not. Second,could GFS localize its strategizing by implementing ABPA-like systemsthat enable managers to identify the drivers of financial performancefor their customers? A small example from the lore of GFS illustratesthe importance of localizing strategies. In Southeast Asia, courtesy andspeed are synonymous. In much of Latin American, courtesy is a cupof coffee.
We should be mindful of history. Large US firms began strategizingless than 100 years ago and only after they implemented organiza-tional designs separating strategic from operational responsibilities,the former retained by senior management, the latter delegated to in-dividual business units. This separation became possible once firmslearned how to calculate return on investment and, in turn, used ROIto allocate capital to their operating units. The question raised here iswhether responsibility for strategizing should be delegated downwardas well, with top management retaining responsibility for the overalldirection of the business, its financial results, and systems facilitatingdecentralized strategizing. Decentralized strategizing, like decentraliza-tion of operations nearly 100 years ago, will require new performancemetrics. The suggestion made in this book is that these new metrics
186 Rethinking Performance Measurement
will be fine-grained ABPA-like metrics that enable people to connecttheir actions directly with the profitability of the firm.
The bottom, bottom line
This chapter explored some issues of managing and strategizing underABPA. There were several key points:
� Any organizational design for implementing ABPA must specifywhere in the organization the elements of the performance chain –activities, costs, customers, and revenues – should be joined. For ser-vice organizations, I suggested that these elements are best joined infront-end customer sales and service units separated from back-endfunctional units. The experience of manufacturing firms, by contrast,suggests that the elements of the performance chain are best joinedin production units.
� The separation of front-end customer sales and service units fromback-end functions allows front-end units to focus on customer prof-itability and its drivers while back-end units focus on delivering prod-ucts and services at costs and to specifications determined by front-end units.
� Internet portals extend this organizational design by imposing a mar-ket interface between front-end and back-end units. Portals focusrelentlessly on customer metrics and assume that the market willsupply back-end functions efficiently. Going forward, firms utiliz-ing ABPA-like metrics that join customers with activities and costswill be in direct competition with web-based firms focusing solely oncustomers.
� ABPA extends the strategic capabilities of firms by allowing them todecentralize much of their strategizing and to pursue low-cost anddifferentiation strategies simultaneously.
� A balance between centralized and decentralized strategizing is re-quired in complex global firms. Nearly 100 years ago, ROI metricsallowed firms to decentralize their operations. Today, ABPA-like met-rics allow firms to decentralize their strategizing.
Notes
Introduction
1. Bill Birchard, “Making it count,” CFO: The Magazine for SeniorFinancial Executives, 11, 10 (October 1995): 42.
2. Walid Mougayar, “The new portal math,” Business 2.0, January 2000:245.
3. A 1996 Institute of Management Accountants survey asked managersto indicate whether they were undertaking “a major overhaul” of theircurrent measures or replacing their entire performance measurementsystem. Fully 60 percent said they were. The 2001 IMA survey foundthat 80 percent of firms had made significant changes in their perfor-mance measurement systems in the previous three years, 50 percentwere currently making changes, and 33 percent of firms experiencedthese changes as “a major overhaul.”
4. Birchard, “Making it count.”5. John Goff, “Controller burnout,” CFO: The Magazine for Senior
Financial Executives, 11, 9 (September 1995): 60.6. Institute of Management Accountants, Cost Management Group,
Cost Management Update, 32 (October 1993), 49 (March 1995), 64(June 1996), 74 (April 1997), 105 (March 2000), and 115 (March2001).
7. The major books are Robert Kaplan and David Norton, The BalancedScorecard: Translating Strategy into Action (Boston: Harvard BusinessSchool Press, 1996); Kaplan and Norton, The Strategy-Focused Orga-nization (Boston: Harvard Business School Press, 2000); Nils-GoranOlve, Jan Roy, and Magnus Wetter, Performance Drivers: A PracticalGuide to Using the Balanced Scorecard (New York: John Wiley, 1999).The Harvard Business School Publishing website lists 132 books, arti-cles, and cases on the balanced scorecard.
8. Robert Kaplan and David Norton, “The balanced scorecard-measures that drive performance,” Harvard Business Review, 70, 1(January–February 1992): 71, 73
9. Many economists cling to this view, relying on Hayek’s theorem thatprices are “sufficient statistics.”
187
188 Notes to pages 4–25
10. Lori Calabro, “On balance: almost 10 years after developing the bal-anced scorecard, authorsRobert Kaplan andDavidNorton sharewhatthey’ve learned,”CFO: TheMagazine for Senior Financial Executives,17, 2 (February 2001): 72–78.
11. Robert Kaplan and David Norton, “Transforming the balancedscorecard from performance measurement to strategic management:part I,” Accounting Horizons, 15, 1 (March 2001): 87–104. Kaplanand Norton criticize academic research for not grasping the impor-tance of the scorecard as a management system.
12. The full list of 117 measures is currently used by Skandia, the Swedishfinancial services firm. See Leif Edvinsson and Michael S. Malone,Intellectual Capital: Realizing Your Company’s True Value by FindingIts Hidden Brainpower (New York: HarperBusiness, 1997).
13. Franklin M. Fisher, “Accounting data and the economic perfor-mance of firms,” Journal of Accounting and Public Policy, 7 (1988):253–260.
14. It does not matter whether these cash flows are retained by the firm ordistributed to shareholders as dividends – all that matters is that cashflows are used efficiently.
15. The loss of critical performance information was one of the key rea-sons functional organizational designs were replaced by divisionaldesigns from the 1920s through the 1960s.
16. The value chain is illustrated in Michael Porter and Victor E. Millar,“How information gives you competitive advantage.” Harvard Busi-ness Review, 63, 4 (July–August 1985): 149–160.
17. See Marshall Meyer, “What happened to middle management?” inIvar Berg and Arne L. Kalleberg (eds.), Sourcebook of Labor Markets(New York: Kluwer Academic/Plenum, 2001), ch. 18.
1 Why are performance measures so bad?
1. Oxford English Dictionary, 2nd edn. (Oxford: Oxford UniversityPress, 1989), “P,” p. 689 (emphasis added).
2. Shakespeare, in Macbeth, captures the difference between expectedand actual performance in a different context. Macduff asks, “Whatthree things does drink especially provoke?” The porter replies, inpart, “. . . Lechery, sir, it provokes and unprovokes; it provokes thedesire, but takes away the performance” (act II, scene iii).
3. Franklin M. Fisher, “Accounting data and the economic performanceof the firm,” Journal of Accounting and Public Policy, 7 (1988): 256.
4. US firms often solicit employee contributions to agencies likethe United Way, an association of community-based charitable
Notes to pages 26–34 189
organizations. Each firm sets a target for total contributions, andprogress toward this target is displayed on a stylized thermometer,as in figure 1.3.
5. Todd Buchholz quotes Paul Samuelson as saying that “most port-folio managers should go out of business – take up plumbing, teachGreek . . .” SeeNew Ideas fromDeadEconomists, rev. edn. (NewYork:Penguin, 1990), p. 278 and p. 322, footnote 1.
6. Eugene F. Fama, “Random walks in stock market prices,” FinancialAnalysts Journal, 51 (1995): 75–81.
7. There is great variety in the performance measures used by en-trepreneurial firms. SeeGregory B.Murphy, JeffW. Trailer, andRobertC. Hill, “Measuring performance in entrepreneurship research,”Journal of Business Research, 36 (1996), pp. 15–23.
8. There are also substantial lags between functioning and financialresults – sometimes the lags are infinite since financial results nevermaterialize – in firms whose core technology is unproven, biotech andinternet firms in particular.
9. Simon Hussain, “Lead indicator models and UK analysts’ earningsforecasts,” Accounting and Business Research, 28 (1998): 271–280.
10. Mehdi Sheikholeslami, Michael D. Wilson, and J. Roger Selin, “Theimpact of CEO turnover on security analysts’ forecast accuracy,”Journal of Applied Business Research, 14 (1998): 71–75.
11. Michael Useem, Executive Defense (Cambridge, MA: Harvard Uni-versity Press, 1976), p. 76.
12. See Charles Fombrun and Mark Shanley, “What’s in a name? Rep-utation building and corporate strategy,” Academy of ManagementJournal, 33 (1990): 233–258. The impact of a firm’s reputation on itssubsequent performance is the firm-level counterpart of the “Mattheweffect” in science.
13. If the firm consists of identical business units performing the samefunctions (for example chain stores and franchise restaurants), thennon-financial measures will roll up from business units to the firm asa whole and cascade down from the firm to business units.
14. Richard J. Dowen and W. Scott Bauman, “Financial statements, in-vestment analyst forecasts and abnormal returns,” Journal of BusinessFinance and Accounting, 22 (1995): 431–449.
15. James J. Cordeiro and D. Donald Kent, Jr., “Do EVA(TM) adoptersoutperform their industry peers? Evidence from security analyst earn-ings forecasts,” American Business Review, 19 (2001): 57–63.
16. Roger J. Best and Ronald W. Best, “Earnings expectations and the rel-ative information content of dividend and earnings announcements,”Journal of Economics and Finance: 24 (2000): 232–245; Michael
190 Notes to pages 34–43
J. Gombola and Feng-Ying Liu, “The signaling power of speciallydesignated dividends,” Journal of Financial and Quantitative Analy-sis, 34 (1999): 409–424.
17. William R. Baber, Jong-Dae Kim, and Krishna R. Kumar, “On the useof intra-industry information to improve earnings forecasts,” Journalof Business Finance and Accounting, 26 (1999): 1177–1198.
18. Jonathan Low and Tony Siesfeld, “Measures that matter: Wall Streetconsiders non-financial performance more than you think,” Strategyand Leadership, 26 (1998): 24–30.
19. Oliver E. Williamson, Markets and Hierarchies: Analysis and An-titrust Implications (New York: Free Press, 1975), p. 150 (emphasis inoriginal).
20. Louis V. Gerstner, Jr., andM. Helen Anderson, “The chief financial of-ficer as activist,”Harvard Business Review, 54, 5 (September–October1976): 100.
21. Joel M. Stern, “One way to build value in your firm,” Financial Exec-utive, 6, 6 (November 1990), p. 51. See also G. Bennett Stewart, TheQuest For Value (New York: Harper Business, 1991).
22. “The real key to creating wealth,” Fortune, 128, 6 (September 20,1993): 38–44.
23. Maggie Topkis, “A new way to find bargains,” Fortune, 134, 11(December 9, 1996): 265.
24. Gary C. Biddle, Robert M. Bowen, and James S. Wallace, “Evidenceon the relative and incremental information content of EVA, residualincome, earnings and operating cash flow,” unpublished manuscript,Washington University (1996).
25. James L. Dodd and Shimin Chen, “EVA: a new panacea?” Businessand Economic Review, 42, 4 (July–September, 1996): 26–28. Doddand Chen also suggest that when calculating EVA it is inefficient tomake the adjustments in earnings suggested by Stern, Stewart.
26. Kaplan and Norton had no particular theory of the scorecard andstill do not. See Robert S. Kaplan, “Innovation action research: cre-ating new management theory and practice,” Journal of ManagementAccounting Research, 10 (1998): 89–118.
27. Robert Eccles and Nitin Nohira, Beyond the Hype (Boston, HarvardBusiness School Press, 1992), pp. 159–163.
28. The Sears business model is reported in Anthony J. Rucci, StevenP. Kirn, and Richard T. Quinn, “The employee-customer profit chainat Sears,” Harvard Business Review, 76, 1 (January–February 1998):82–97.
29. Sears’ customer satisfaction measures are not indicated in the Rucciet al. article.
Notes to pages 45–59 191
30. The characterizations of measures and outcomes in figures 1.6 and 1.7are drawn from several sources,most importantly Carolyn Brancatom,New Corporate Performance Measures (New York: The ConferenceBoard, 1995), several reports of the Royal Society for the encour-agement of the Arts, Manufactures & Commerce on “Tomorrow’scompany,” and personal correspondence with John E. Balkcom, aSibson & Co. consultant.
31. MVA, like EVA, is a trademark of Stern, Stewart & Co.32. George Johnson, Fire in the Mind (New York: Knopf, 1995), p. 177.33. Personal communication with John Balkcom.
2 The running down of performance measures
1. See Stephen Jay Gould, “Trends as change in variance: a new slant onprogress and directionality in evolution,” Journal of Paleontology, 62(1988): 319–329. See also Gould, Full House: The Spread of Excel-lence from Plato to Darwin (New York: Harmony House, 1996).
2. Gould, “Trends as change in variance,” p. 326.3. Gould, Full House, p. 119.4. See John Thorn and Peter Palmer,Total Baseball, 2nd edn. (NewYork:
Warner, 1991), pp. 682–692.5. Murray Chass, “The best buys in baseball,” New York Times,
March 4, 1992, pp. C1 and C4) compared underpaid (average salary$110,000)with overpaid (average salary $3.5million) baseball playersand found that their batting averages differed by only .005.
6. Alfred A. Marcus, Mary L. Nichols, and Gregory E. McAvoy, “Themanagerial determinants of nuclear power safety,” Strategic Manage-ment Research Center, University of Minnesota, March 1993.
7. Graphs for significant events, safety system failures, and radiation ex-posure are omitted for purposes of brevity. The pattern for all fivesafety measures is similar. Gould’s observation about evolutionarychange bears repeating as it applies with some force in this instance:the overall improvement in mean safety outcomes is due to decreasedvariance across plants.
8. Mark Rechtin, “As quality gap narrows, Power rethinks the IQS,”Automotive News, May 12, 1997, p. 3.
9. Paul DiMaggio and Walter W. Powell, “The iron cage revisited: in-stitutional isomorphism and collective rationality in organizationalfields,” American Sociological Review, 48 (1983): 147–160.
10. Duncan Neuhauser, “The relationship between administrative activ-ities and hospital performance: an empirical study,” University ofChicago, 1971, p. 17.
192 Notes to pages 59–75
11. Mark Rechtin, “As quality gap narrows,” p. 28.12. Personal communication with Alfred A. Marcus, University of
Minnesota.13. “The test under stress,”NewYork TimesMagazine, January 10, 1999.14. Alfred J. Reiss,The Police and the Public (NewHaven: Yale University
Press, 1971).15. Peter M. Blau, The Dynamics of Bureaucracy, 2nd edn. (Chicago:
University of Chicago Press, 1963), pp. 37–38, 45–46.16. Patrick Healy, “Ahead of the curve: some professors battling against
grade inflation,” Boston Globe, February 7, 2001, p. A1.17. Richard Rothstein, “Doubling of A’s at Harvard: grade inflation or
brains?” New York Times, December 5, 2001, p. D8.18. James L. Medoff and Katerine G. Abraham, “Experience, perfor-
mance, and earnings,” Quarterly Journal of Economics, 95 (1980):703–736.
19. Sylvester E. Berki, Hospital Economics (Lexington: Lexington Books,1972); David B. Smith and Arnold D. Kaluzny, The White Labyrinth:A Guide to the Health Care System (Ann Arbor: Health Administra-tion Press, 1986).
20. Dana Priest, “Pennsylvania rates hospitals, surgeons on heart bypasspatient deaths,” Washington Post, November 20, 1992, p. A3.
21. Joseph Berger, “Fernandez seeks to end test ranking,” New YorkTimes, June 9, 1992, p. B3.
22. These data were generously supplied by David Mauer, who has pub-lished extensively from them.
23. Glenn R. Carroll andMichael T. Hannan,TheDemography of Corpo-rations and Industries (Princeton: Princeton University Press, 1999),ch. 13.
24. This account of the “Measurements Project” is taken from RonaldG. Greenwood, Managerial Decentralization; A Study of the GeneralElectric Philosophy (Lexington: Lexington Books, 1974).
25. J. Holusha, “A call for kinder managers at GE,” New York Times,March 4, 1992, pp. D1 and D6.
26. WilliamM. Carley, “To keep GE’s profits rising,Welch pushes quality-control program,” Wall Street Journal, January 13, 1997, pp. A1 andA8.
27. The SPI4 database is described in The PIMS Competitive StrategyDataBase (Cambridge, MA: Strategic Planning Institute, 1988).
28. These correlations are shown in the appendix to this chapter.29. Control variables are utilized and tests of statistical significance for dif-
ferences between blocks of correlations are shown in Marshall Meyer,“Organizational design and the performance paradox,” in Richard
Notes to pages 77–87 193
Swedberg (ed.), Explorations in Economic Sociology (New York:Russell Sage Foundation, 1993), ch. 10.
30. HarrisonC.White, Identity andControl: A Structural Theory of SocialAction (Princeton: Princeton University Press, 1992).
3 In search of balance
1. Robert Kaplan and David Norton, The Balanced Scorecard (Boston:Harvard Business School Press, 1996), p. 2.
2. The most heavily weighted item in the branch quality index (45%)asked customers to rate “the overall quality of [the branch’s] ser-vice against your expectations” on a five-point scale The other itemsinclude the quality of tellers versus expectations (7.5%), six addi-tional items concerning tellers (7.5%), quality of other branch per-sonnel versus expectations (7.5%), six additional items concerningnon-teller employees (7.5%), quality of automated teller machines(ATMs) versus expectations (7.5%), three additional items concern-ing ATMs (7.5%), and one item measuring problem incidence (10%).The branch quality index was considered superior because multiple-item measures reduce measurement error. This is the case, however,only if the resulting construct is unidimensional (i.e. all of the ques-tions measure the same construct).
3. A household is a family or business-unit group that makes joint bank-ing decisions. Tier I households have total combined balances (includ-ing investment balances) in excess of $100,000; tier II householdshave balances in excess of $10,000. Footings are consumer and busi-ness/professional liabilities plus consumer and business/professionalassets (excluding mortgages).
4. Premier households had balances in excess of $100,000 and main-tained investment portfolios at GFS.
5. Performance management was defined as a manager’s ability to“achieve goals by coaching, motivating, empowering, hiring, sup-porting, promoting, recognizing, and challenging staff.”Although em-ployee satisfaction was considered in evaluating the people category,employee satisfaction surveys were not conducted on a regular basis,making the quarterly assessment of this measure qualitative. More-over, there was no statistically significant correlation between theemployee satisfaction scores from a 1996 survey and the subjective“people” scores given by area directors in the first and second quartersof 1996, indicating that quantitative employee satisfaction measuresreceived little weight in evaluating managerial performance on thisdimension.
194 Notes to pages 87–110
6. Formal goals were not provided for the control, people, and stan-dards categories, but an audit rating of “3” or lower is “below par”performance in the control category.
7. The branch manager, however, could exercise discretion in allocat-ing the bonus pool among branch employees. Thus, if a branch metall of its targets under the 1993 PIP, the branch manager receiveda quarterly bonus of 15 percent of base salary, the bonus pool forbranch employees was 7.5 percent of base salaries, but bonuses forindividual branch employees varied at the discretion of the branchmanager.
8. GFS’s scorecard consisted of thirty-seven measures in six scorecardcategories. By contrast, the scorecards of Metro Bank and NationalInsurance that are discussed by Kaplan and Norton (The BalancedScorecard, pp. 155, 157) had twenty and twenty-one measuresrespectively, both in four scorecard categories.
9. A 1 percent increase in branch quality caused a subsequent 0.04 per-cent increase in revenues and 0.22 percent increase in margins.
10. A 1 percent increase in branch quality caused a subsequent 0.2 percentincrease in retail households and 0.3 percent increase in business/professional households.
11. This analysis was restricted to four quarters, the third quarter of 1995through the second quarter of 1996, for which item-by-item data wereavailable. The component items in the branch-quality index were notreported on branch-manager scorecards.
12. A 1 percent increase in teller quality caused a subsequent 0.4 percentincrease in revenues and 0.5 percent increase in margins.
13. This is consistent with the experience of branch managers who believethat satisfaction among retail customers surveyed by GFS declines asattention is diverted to the smaller but more profitable segment ofbusiness/professional and premier customers not included in customersurveys.
14. Kaplan and Norton, The Balanced Scorecard, p. 218.15. GFS’s cost of funds is a complex and proprietary calculation that takes
into account prevailing interest rates, interest paid on liability bal-ances, and other factors.
16. GFS, like other retail banks, believes that cross-selling can generateongoing fee revenues from current deposit and loan customers. Partof GFS’s sales-focused strategy is a personal financial planning toolintended to increase customers’ awareness of insurance and investmentproducts.
17. A consumer household consists of one or more related people main-taining one or more GFS accounts.
Notes to pages 110–128 195
18. Some of these acquisitions of consumer money market checking ac-counts may be due to conversion of existing ordinary checking ac-counts into money market accounts. An acquisition of a consumermoney market checking account is recorded – and a sale is credited toa customer relationshipmanager –when an ordinary checking accountis converted to a money market checking account.
4 From cost drivers to revenue drivers
1. The parts of an airline journey most easily reduced to specifications,notably schedules, safety, and prices, are comparable for most airlines.Airlines thus compete on customer service, which cannot be reducedto simple specifications.
2. See, for example, Hau L. Lee, V. Padmanabhan, and Seungjin Whang,“The bullwhip effect in supply chains,” Sloan Management Review,38, 3 (Spring 1998): 93–102.
3. Customer-initiated and customer-support transactions are distin-guished because transactions beginning at the same point in theorganization may flow through different channels depending on thecustomer and product.
4. Indirect activities consist of management, supervision, and adminis-tration incidental to the transaction.
5. Short-term variable costs are direct labor and costs. Long-term vari-able costs are costs of supervision and administration incurred by in-direct activities. Capacity costs are costs of equipment and premises.Fixed costs insensitive to the volume of transactions are omitted incalculating activity costs.
6. Customer net revenue (CNR) is the sumof fees charged to the customerand net revenues earned on balances. Net revenues are balances timesspreads, that is, gross revenues less the cost of funds.
7. Variable costs accounted for about 28 percent of total costs initially.8. Robert S. Kaplan and Robin Cooper, Cost and Effect (Boston:
Harvard Business School Press, 1998), pp. 183–197.9. Overall satisfaction with GFS as a place to do business, measured
as the percentage of customers falling in the top two categories of afive-point scale, increased from 71 percent in June 1992 to 95 per-cent in December 1993. Overall customer satisfaction, measured on afive-point scale, remained at or above 90 percent thereafter. The per-centage of customers willing to recommend GFS increased from 72 to97 percent in the same period.
10. Forty-two percent of customers surveyed in June 1992 reported prob-lems, while only 8 percent reported problems in December 1994.
196 Notes to pages 133–149
Inquiries and investigations resulting from customer complaints,moreover, fell from 7.8 to 1.6 per thousand accounts from Decem-ber 1992 to December 1994.
11. This correlation is not statistically significant due to the small numberof cases.
12. Kaplan and Cooper, Cost and Effect, ch. 10; also Harvard BusinessSchool case study “Kanthall” (9–190–002).
13. Fixed costs insensitive to the volume of transactions (e.g. financialcontrol costs) were ignored in calculating activity costs.
14. Marshall W. Meyer, “Productivity cultures and competition in theglobal marketplace: cases from Hong Kong,” in J. T. Li, Anne S.Tsui, and Elizabeth Weldon (eds.),Management and Organizations inChinese Context (New York: St. Martin’s Press, 2000), ch. 12.
15. In the USA, GFS customer-satisfaction surveys sampled twenty-fivecustomers per branch per month through the end of 1999. This num-ber was reduced substantially beginning in 2000.
16. Peter J. Kolesar, “Vision, values, milestones: Paul O’Neill startstotal quality at Alcoa,”California Management Review, 35, 3 (Spring1993): 133–165.
17. Michael Lewis, “O’Neill’s list,” New York Times Magazine, January13, 2002, p. 24.
18. Jennifer J. Laabs, “Alcoa unit president forced to resign after failing toreport safety violations,” Personnel Journal, 75, 9 (September 1996):12.
19. Philip Selznick, Leadership in Administration (Berkeley: University ofCalifornia Press, 1957).
5 Learning from ABPA
1. Recall from chapter 1 the deficiencies of aggregate (or coarse-grained)measures, non-financial measures especially.
2. David Kreps, A Course on Microeconomic Theory (Princeton: Prince-ton University Press, 1990), pp. 611–612.
3. Steven Spear and H. Kent Bowen, “Decoding the DNA of the Toyotaproduction system,” Harvard Business Review, 77, 5 (September–October, 1999): 99.
4. Paul S. Adler and Robert E. Cole, “Designed for learning: a tale of twoauto plants,” Sloan Management Review, 34, 3 (spring 1993): 90.
5. John Paul MacDuffie, “The road to ‘root cause’: shop-floor problem-solving at three auto assembly plants,” Management Science, 43(1997): 479–502.
6. CMM is registered in the US Patent and Trademark Office.
Notes to pages 149–183 197
7. The five include the initial stage, where success depends on leadershipand heroics; the repeatable stage, where basic management processes(scheduling, budgeting, measurement functionality) are in place; thedefined stage, where the software development process is documentedand standardized; the managed stage, where detailed measures arecollected and the development process is quantified throughout; andthe optimizing stage, where continuous feedback from measurementis used to improve the software development process.
8. Some KPAs include software quality assurance at the repeatable stage;integrated softwaremanagement at the defined stage; quantitative pro-cess management at the managed stage; and process change manage-ment at the optimizing stage.
9. The most recent report, “Process maturity profile of the software com-munity: 1999 year end update,” was released in March 2000.
10. P. K. Lawlis, R. M. Flowe, and J. B. Thorndahl, “A correlational studyof theCMMand software development performance,”CrossTalk:TheJournal of Defensive Engineering, 8, 9 (September, 1995): 21–25.
11. M. S. Krishnan, “Cost and quality considerations in software productmanagement,” doctoral dissertation, School of Industrial Administra-tion, Carnegie Mellon University, 1996.
12. James Herbsleb, David Zubrow, Denis Goldenson, Will Hayes, andMark Paulk, “Software quality and the capability maturity model,”Communications of the Association for Computer Machinery, 40, 6(June, 1997): 30–40.
13. Figure 5.2 is based on estimates made by the GFS Country A retailbusiness in 1993–94 (see chapter 4).
14. Financial measures are usually dropped from scorecards cascadedbelow the level of business units.
6 Managing and strategizing with ABPA
1. See James D. Thompson, Organizations in Action (New York:McGraw-Hill, 1967).
2. Don Tapscott, David Ticoll, and Alex Lowy,Digital Capital:Harness-ing the Power of Business Webs (Boston: Harvard Business SchoolPress, 2000). Quoted from “Relationships rule,” Business 2.0, May2000.
3. Robert S. Kaplan and David P. Norton, “Using the balanced scorecardas a strategic management system,” Harvard Business Review, 74, 1(January–February 1996): 81.

Index
activity-based costing, 34, 113–114advantages, 114–115, 120bank balance inquiries, 125basis of ABPA, 114–116complexity, 139introduction, 46
activity-based profitability analysis(ABPA), 113–114
basis, 114–116; activity-based costing,115
case study, 127–131comparison with other systems,160–166
complexity, 139–140computerized information, 150–153cost of inefficiency, 138–139critical measurement issues, 140–141customer focus, 115, 122–123identification of profitability, 125impact of activities on revenues, 115,116
incentive payments, 153–160learning from, 150–160; action andlearning, 153–158
linking activities to revenues, 131–135managing with, 168–169meaning, 10mechanisms, 122–127non-applicability, 141–143non-financial measures, 137–138opportunities, 123–127organizational designs for, 165,169–172, 181; comparisons, 171
problem resolution, 134; costassessment, 129–132
revenue drivers, finding, 135–137selectivity, 140strategic capacity, 178–182sustainability, 137, 139–140uncertainty, 166
using, 145–147air journeys, 117–119Alcoa, 142–143, 184Anderson, Helen, 40automobile assembly, 147–148, 150automobile defects, 58–60
balanced performance measurementanticipating changes of measures, 104,106–107
approach, 42combining dissimilar measures,104–107
compared to ABPA, 160–166deficiencies, 7distortions: by formulas, 105; bysubjectivity, 105–106
dominance, 2formulaic or subjective measures,104–105
generic and specific measures,101–103
impact on employees, 100implementation, 107requirements, 101–102; finding rightmeasures, 101–104; testing businessmodels, 103–104
sale-focused strategies, 108–112scorecards see balanced scorecardsstrategic management, 182–186subjective elements, 87–89, 91–92, 96,105–106
weighting measures, 92–97, 104Balanced Scorecard Collaborative, 2balanced scorecardsbottom-line performance measures,97–100
case study, 82–100example, 88; analysis, 90–100;elements, 86–90; flowchart, 92
198

Index 199
flowcharts, 91–92generally, 81–82
bankscosts of balance inquiries, 125ROAs, 69–71
batting averages, baseball, 52–54Biddle, Gary, 41bonuses see incentive paymentsBowen, Robert, 41British Airways, 119business models, 83–84examples, 98injury-free workplaces, 143performance, 42–44testing, 103–104
capability-maturity model, 149Carnegie-Mellon University, 149cash flow return on investment (CFROI),
46chain stores, 173Chen, Shimin, 41Citigroup, 16coarse-grained measures, 145–146command economics, 16compensation see incentive paymentscompression principle, 47consensus, 65–69convergence, 51change of measures, 71–76;quantitative tests, 74–76
effect of external changes, 69–71reasons, 52; consensus, 65–69;perverse learning, 60–62; positivelearning, 52–60; selection process,62–64; suppression, 64–65
relative performance management,76–78
search for new measures, 59–60significance, 76–79use-it-or-lose-it principle, 78–79
cost measures, 33–34costsdrivers, distinguishing from revenuedrivers, 135
relation to revenues, 113, 119–122,123, 131–135
customer net revenue, 127, 153–160customer profitabilityanalysis, 7–10
incentive payments, 159–160measurement, 127–128
customer satisfaction, 42–44impact, 7–8measurement, 86, 87
customerscomplaints, 128e-commerce, 176focus of ABPA, 115, 122–123retention of, 138
decentralization, 169, 179, 182–186delegation, 169distribution systems, 121Dodd, James L., 41DuPont, 37
Eccles, Robert, 81–82e-commerce models, 176–177economic performanceanticipation, 19–20meaning, 19–20timeframe, 24uncertainty, 24unmeasurability, 22
economic value added (EVA), 34, 40,46
employeescourtesy, 137impact of scorecards, 100injuries, 142–143, 184mobilizing, 143safety, 142–143satisfaction, 7–9, 43–44
Envirosystems Corporation, 26–28,36
Ernst & Young, 34
financial measures, 32, 34driving downwards, 37–41vs. ABPA, 160–166
fine-grained measures, 145–146organizational learning,147–150
firms see organizationsFisher, Franklin, 19
General Electric, 16, 72–74, 76General Motors, 37Gerstner, Louis, 40

200 Index
Global Financial Services (GFS),82–100
ABC case study, 127–131balance and fee revenues, 111balanced scorecards, 88, 92 104–105,108; subjective and formulaicmeasures, 185
business model, 84, 98customer complaints, 128customer profitability, 127–128customer satisfaction, 129decomposition of earnings, 110performance incentive programme,85–86; evolution, 94;flowchart, 91
problem resolution, 129–131, 134sales-focused strategy, 108–112unit costs of balance inquiries,125
global firms, 180goal displacement, 16Gould, Stephen Jay, 52–53
Harvard University, 61–62Honda, 148hospitals, 53–56in-patient costs, 56length of stay, 55mortality rates, 59–60occupancy rates, 57standards, 65
implementation, comparison of systems,163–166
incentive paymentsABPA, 153–160applicability of measures, 6comparison of systems, 162–163problem, 4, 7–10schemes, 82–86; evolution, 94;flowcharts, 91; scorecards, 86–90,100
inefficiency, 138–139inertia, 28initial public offerings (IPOs), 65–69Institute of Management Accountants, 1internet, 176–177
Johnson, George, 47
Kanthal, 136Kaplan, Robert, 2–4, 7, 42, 81–82, 90,
101key process attributes, 149
learningcomparison of systems, 163fine-grained measures, 147–150from ABPA, 150–160; action andlearning, 152–158
perverse learning, 60–62positive learning, 52–60
Lewis, Michael, 142
management, with ABPA, 168–169Mansfield, Harvey, 61manufacturing organizational designs,
173–176market valuationcash flow return on investment(CFROI), 46
economic value added (EVA), 34, 40,46
market value added (MVA), 46measures, 31–32, 34preoccupation with, 46total shareholder return (TSR), 46
mass customization, 179–181Moldt, Ed, 27–29money market mutual funds (MMMFs),
63–64motivation, theory, 36
Neuhauser, Duncan, 59Nightingale, Florence, 59non-financial measures, 32–34ABPA, 137–138paucity, 7, 10promotion, 42–44
Norton, David, 2–4, 7, 42, 81–82, 90,101
nuclear power plants, 56–58, 60
O’Neill, Paul, 142–143organizational designs, 11, 37–40e-commerce, 176–177for ABPA, 165, 169–172, 181;comparisons, 171
manufactures, 173–176
Index 201
organizational isomorphism, 59organizationselemental conception, 10–12, 141enterpreneurial firms, 26–28global firms, 180large firms, 28, 36–37; simplification ofmeasurement, 48
units, 29
performancebusiness models, 42–44chains, 7–10, 168dimensions, 20drivers, 162meaning, 19–20modern conception, 7–8timeframe, 23types, 22–23
performance measurementchoices, 107convergence see convergenceinferences, 24, 26, 29–30,47–48
precision, 16purposes, 30–37, 113requirements, 6–8; applicability toincentives, 6; parsimony, 6;pervasiveness, 10; predictive ability,6; reasons for failure to meet, 7–8;stability, 6
role of people, 51–52, 78simplification, 47–48size and complexity complications, 26;entrepreneurial firms, 26–28; largefirms, 28, 36–37
uncertainty, 47performance measurescorrelations, 2–3, 80deficiencies, 21; reasons, 22–26fluidity, 7–9improvement attempts, 37–41; drivingfinancial measures downward,42–44; promoting non-financialmeasures, 44–46
proliferation, 45; c. 1960, 45; c. 1990,46
compression, 47types, 7, 31–34; comparison, 35;cost measures, 33–36; financial
measures, 31–32, 34, 37–41; marketvaluation, 32–34; non-financialmeasures, 10, 34, 42–44, 137–138,160–166
vulnerabilities, 48–49pharmaceutical firms, 180Pioneer Petroleum, 104–105Porter, Michael, 7–9Power, J. D., and Associates, 58–60,
75problem resolution, cost assessment,
129–132productsdevelopment, 32–33made to specifications, 117, 140not made to specifications, 117–120,140
time-sensitive products, 120–122profit impact of market strategy (PIMS),
75–76profit margins, 159
qualitative indicators, 87quotas, 4–5, 16
return-on-asset (ROA) accounting,69–71, 182
return-on-investment (ROI)targets, 60
revenue driversdistinguishing from cost drivers,135
finding with ABPA, 135–137relation to costs, 113, 119–123,131–135
sales-focused strategies, 108–112schools, reading levels, 65Sears, 43–44, 48, 99, 103share value, 20, 32Smith, Adam, 5softwareABPA, 150–153development, 148, 150
specialization, large firms, 36Stern, Joel, 40–41strategic management, 168–169,
178–182decentralization, 182–186

202 Index
stretch goals, 25supply chains, 121
total shareholder return (TSR), 46Toyota, 147–148
United Way thermometer, 24–26, 36–37,76–77
use-it-or-lose-it principle, 78–79
Volvo, 148
Wallace, James, 41web portals, 176–177Weber, Max, 16Weil, Sanford, 16Welch, Jack, 16, 73–74,
76Williamson, Oliver, 38
Related Documents