Harrogate Retail Study 2016 Update Peter Brett Associates December 2016 Office Address: 61 Oxford Street, Manchester, M1 6EQ T: +44 (0)161 245 8900 F: +44 (0)161 245 8901 E: [email protected]

Welcome message from author
This document is posted to help you gain knowledge. Please leave a comment to let me know what you think about it! Share it to your friends and learn new things together.
Transcript

Harrogate Retail Study 2016 Update
Peter Brett Associates December 2016
Office Address:
61 Oxford Street, Manchester, M1 6EQ T: +44 (0)161 245 8900 F: +44 (0)161 245 8901

ii
Document Control Sheet Project Name: Harrogate Retail Study Report Title: 2016 Update Project Ref: 39875
Name Position Signature Date
Prepared by: J Wadcock Senior Associate JW 15/12/16
Reviewed by: B Greep Equity Director BG 20/12/16
Approved by: B Greep Equity Director BG 22/12/16
For and on behalf of Peter Brett Associates LLP
Peter Brett Associates LLP disclaims any responsibility to the client and others in respect of any matters outside the scope of this report. This report has been prepared with reasonable skill, care and diligence within the terms of the contract with the client and taking account of the manpower, resources, investigations and testing devoted to it by agreement with the client. This report has been prepared for the client and Peter Brett Associates LLP accepts no responsibility of whatsoever nature to third parties to whom this report or any part thereof is made known. Any such party relies upon the report at their own risk.
© Peter Brett Associates LLP 2016
THIS REPORT IS FORMATTED FOR DOUBLE-SIDED PRINTING.

Harrogate Retail Study 2016 Update
December 2016 iii
CONTENTS
1 INTRODUCTION .......................................................................................................... 1
2 KEY FINDINGS FROM THE PREVIOUS STUDY ........................................................ 2
Introduction .................................................................................................................. 2
Study Area ................................................................................................................... 2
Performance Analysis .................................................................................................. 3
Comparison Goods Shopping Patterns ........................................................................ 4
Convenience Goods Shopping Patterns ....................................................................... 4
Quantitative Need for Retail Floorspace ....................................................................... 5
3 CHANGES TO DATA INPUTS ..................................................................................... 7
Introduction .................................................................................................................. 7
Population Projections .................................................................................................. 7
Expenditure Growth Rates ........................................................................................... 7
Special Forms of Trading ............................................................................................. 8
Sales Density Growth ................................................................................................... 9
Retail Floorspace Commitments ................................................................................... 9
4 UPDATED RETAIL CAPACITY FORECASTS ...........................................................11
Introduction .................................................................................................................11
Structure of the Quantitative Assessment ....................................................................11
Comparison Goods Floorspace Requirements ............................................................12
Convenience Goods Floorspace Requirements ..........................................................12
5 CONCLUSIONS AND RECOMMENDATIONS ...........................................................14
Retail Floorspace Requirements .................................................................................14
Recommendations ......................................................................................................14
TABLES
Table 2.1 Quantitative Need in the Comparison Goods Sector .............................................. 5
Table 2.2 Quantitative Need in the Convenience Goods Sector ............................................ 5
Table 3.1 Population Projections to 2026 .............................................................................. 7
Table 3.2 Special Forms of Trading ....................................................................................... 8
Table 3.3 Sales Density Growth Rates .................................................................................. 9
Table 4.1 Structure of the Quantitative Assessment .............................................................11
Table 4.2 Summary of Comparison Floorspace Requirements .............................................12
Table 4.3 Summary of Convenience Floorspace Requirements ...........................................12

Harrogate Retail Study 2016 Update
December 2016 iv
FIGURES
Figure 2.1 Study Area ........................................................................................................... 2
APPENDICES
APPENDIX A QUANTITATIVE ASSESSMENT

Harrogate Retail Study 2016 Update
December 2016 1
1 INTRODUCTION
1.1 Harrogate Borough Council (HBC) has commissioned PBA Planning (PBA) to provide an update to the quantitative retail capacity forecasts for the district over the development plan period. The Council wishes to refresh its retail evidence base, in order to bring the study up to date with current forecasts of population growth, expenditure growth, and other key inputs which can affect the need for future retail floorspace, such as online shopping and other ‘special forms of trading’.
1.2 This report updates the data presented at Appendix C of the Harrogate Retail Study, completed by PBA in January 2014 (hereafter referred to as the 2014 Retail Study). Our revised assessment of retail floorspace capacity should be read alongside the findings of the previous study. The remit of this update extends solely to updating the quantitative retail capacity forecasts which the 2014 Retail Study identified, and we have not been asked to update any of the other components of the previous study (for example, ‘health checks’ of centres in the district). The findings of both studies should therefore be considered together.
1.3 No new household telephone survey of shopping patterns has been undertaken in support of this update. That is because, since the previous household survey was undertaken in September 2013, there have not been any major retail developments within the study area that are likely to have had a significant impact on the shopping patterns of its residents. We therefore continue to use the findings from the household telephone survey conducted by NEMS Market Research in 2013 as the basis of our updated capacity assessment. Any new retail developments which have taken place subsequent to the completion of the telephone survey are treated as ‘commitments’ for the purposes of this update.
1.4 The remainder of our report is structured as follows:
Section 2 provides a summary of the key findings of the 2014 Retail Study;
Section 3 discusses the adjustments we have made to the key data inputs used for forecasting retail floorspace capacity as part of this update;
Section 4 sets out the updated forecasts for new comparison and convenience retail floorspace; and
Section 5 sets out a summary of our findings and our recommendations.
1.5 Our full data tables are contained at Appendix A.
Harrogate Retail Study 2016 Update
December 2016 2
2 KEY FINDINGS FROM THE PREVIOUS STUDY
Introduction 2.1 In this section we summarise the findings of the Harrogate Retail Study (‘the 2014
Retail Study’) to provide context for the updated capacity forecasts which we set out in Section 4 of this report.
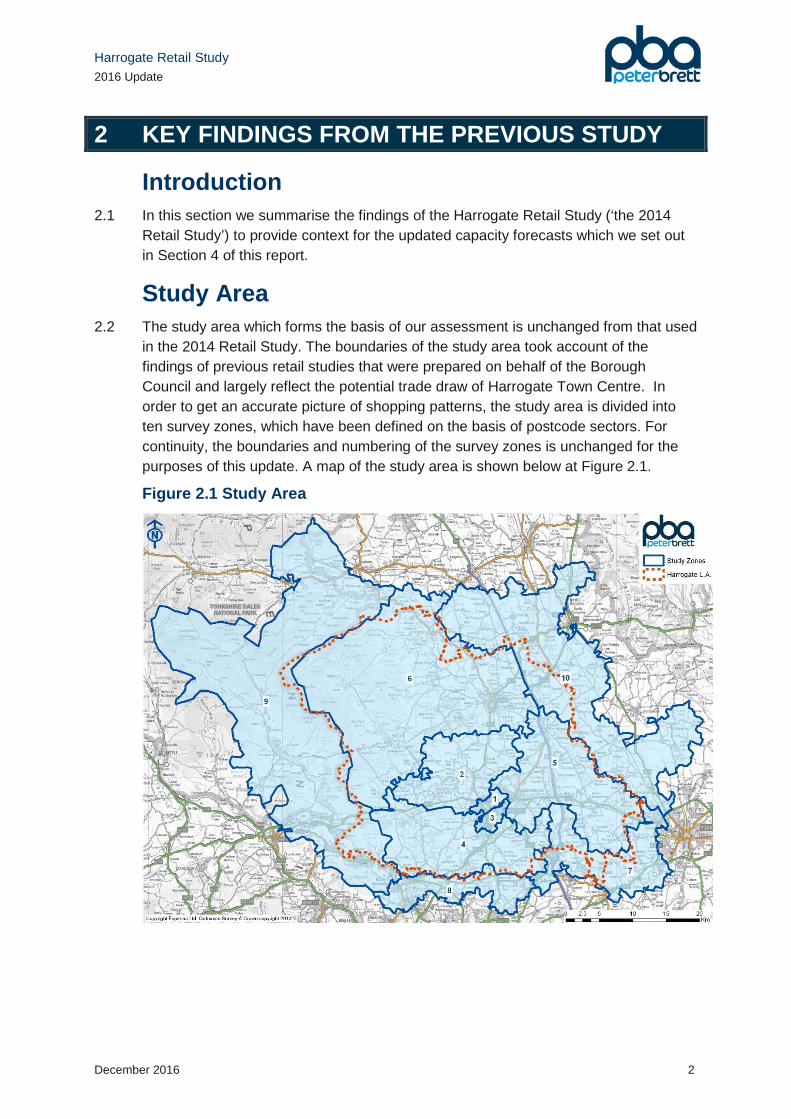
Study Area 2.2 The study area which forms the basis of our assessment is unchanged from that used
in the 2014 Retail Study. The boundaries of the study area took account of the findings of previous retail studies that were prepared on behalf of the Borough Council and largely reflect the potential trade draw of Harrogate Town Centre. In order to get an accurate picture of shopping patterns, the study area is divided into ten survey zones, which have been defined on the basis of postcode sectors. For continuity, the boundaries and numbering of the survey zones is unchanged for the purposes of this update. A map of the study area is shown below at Figure 2.1.
Figure 2.1 Study Area
Harrogate Retail Study 2016 Update
December 2016 3
Performance Analysis Harrogate Town Centre
2.3 The previous study found Harrogate Town Centre to be in very good health. It was performing well for a centre of its size and was holding its own against competing centres and destinations. Harrogate’s key strengths were considered to be the quality and diversity of its comparison retail offer with excellent representation from high end national retailers and independent operators. The good performance of these sub-sectors was reflected in the town centre’s low vacancy rate.
2.4 The convenience retail offer of the town centre was also considered to be good with Asda and Waitrose foodstores located on the edges of the centre and providing opportunities for linked shopping trips with the rest of the town centre. There was a good selection of bakers, confectioners, grocers and delicatessens that provide a distinctive and bespoke offer for residents and visitors.
2.5 Harrogate’s town centre environment was found to be very attractive with imposing Victorian architecture and well maintained buildings and public spaces. We suggested that the priority for Harrogate Town Centre should be to consolidate its existing strengths and to ensure that it can continue to grow despite its physical constraints. We note that since the time of the previous study, the Borough Council has adopted the Harrogate Town Centre Strategy and Masterplan – also produced by PBA - as a supplementary planning document.
Other Centres 2.6 Ripon City Centre was found to be an attractive centre with a good convenience retail
offer, a good range of services and a below average vacancy rate. However, its comparison retail offer was relatively weak and had been exacerbated by the loss of national multiples from the city centre. The priority for Ripon was considered to be the need to strengthen the range and diversity of its comparison retail offer. We suggested that this could be achieved by providing additional modern floorspace for comparison retailers and by nurturing the city centre’s independent retail offer.
2.7 The town centre at Knaresborough was performing an important role in meeting the day-to-day shopping and service needs of the local population. We considered it to be an attractive and well-maintained market town with some good quality shops and a strong food and drink offer. However, despite the town centre’s relatively low vacancy rate we considered it to be vulnerable to erosion of its offer as a result of competition from other destinations.
2.8 The district’s other town centres at Boroughbridge, Masham and Pateley Bridge are considerably smaller than Harrogate, Ripon and Knaresborough. However, the 2014 Retail Study found that they were generally performing well as rural service centres meeting local shopping needs. Boroughbridge was a particularly vital and vibrant town centre containing a good range of comparison retail and service uses for a centre of its size.

Harrogate Retail Study 2016 Update
December 2016 4
Comparison Goods Shopping Patterns 2.9 Overall, the 2014 Retail Study found that 68.1 per cent of the comparison goods
expenditure available to residents of the study area was retained by town centres, retail parks and freestanding stores located within the study area. Harrogate Town Centre was by far the dominant centre in terms of its comparison goods turnover which equated to £225.2 million of available expenditure (a market share of 29.3 per cent within the study area). It was a dominant centre in six of the ten study zones and had a market share of more than 10 per cent in all but one zone.
2.10 Ripon City Centre was the dominant destination for comparison retail expenditure within its own zone (with a market share of 39.4 per cent in Zone 6) but did not draw any significant market share from any other zone within the study area. Knaresborough Town Centre achieved a market share of 14 per cent in its own zone (Zone 5) but did not enjoy any significant market share in any other zone.
2.11 Approximately a third of the total comparison goods expenditure available within the study area was found to ‘leak’ to destinations beyond the study area. Leakage to Leeds and York accounted for almost 20 per cent of residents’ comparison goods expenditure, which was to be expected given the strong influence of these larger centres over parts of the study area.
Convenience Goods Shopping Patterns 2.12 The 2014 Retail Study found that 84 per cent of the convenience goods expenditure
available to residents of the study area was retained by town centres, retail parks and freestanding stores located in the study area. There was less leakage than in the comparison sector, because convenience shopping is generally undertaken on a more localised basis.
2.13 The Asda, Morrisons and Sainsbury’s stores in Harrogate achieved the highest individual convenience goods market shares within the study area. There were no acute localised deficiencies in convenience goods provision, although residents located in Zones 2, 4 and 10 were served by a more limited local food and grocery offer and were found to have to travel further for their food and grocery shopping. There were no town centres located within these zones, although residents of all three areas were within easy travelling distance of existing convenience retail provision in neighbouring zones.
2.14 The majority of Harrogate and Ripon residents’ convenience retail expenditure was spread amongst a number of convenience stores in and around the respective towns. However, the Morrisons stores in Ripon and Boroughbridge both benefited from high market shares indicating that there may be scope for some additional competition within the convenience retail market in these locations. Knaresborough was not served by any large foodstore and the 2014 Retail Study identified this as a deficiency in local provision.

Harrogate Retail Study 2016 Update
December 2016 5
Quantitative Need for Retail Floorspace 2.15 The quantitative need for additional comparison goods floorspace identified by the
2014 Retail Study is summarised in Table 2.1 below. These figures assumed that the amount of residents’ expenditure retained by destinations within the study area remained constant over the plan period to 2026.
Table 2.1 Quantitative Need in the Comparison Goods Sector
Period Floorspace Requirement (sq. m sales area)
2013-2016 -5,784
2016-2021 4,426
2021-2026 8,541
2013-2026 6,184
2.16 Table 2.1 shows that the comparison retail floorspace requirement was expected to be negative in the period up to 2016. There was, however, a positive comparison retail floorspace requirement after 2021 with the ‘oversupply’ in comparison goods floorspace gradually reduced by expenditure growth in the 2016-2021 period. Table 2.1 shows that there was expected to be capacity for approximately 6,184 sq. m over the entire study period.
2.17 The quantitative need for additional convenience goods retail floorspace (also based on a constant retention rate) is summarised in Table 2.2.
Table 2.2 Quantitative Need in the Convenience Goods Sector
Period Floorspace Requirement (sq. m sales area)
2013-2016 -3,853
2016-2021 983
2021-2026 1,516
2013-2026 -1,353
2.18 Table 2.2 shows that for the catchment area as a whole, the quantitative need for additional convenience retail floorspace over the entire study period was negative. The turnover of existing commitments had a particularly significant impact on floorspace requirements by absorbing expenditure capacity.

Harrogate Retail Study 2016 Update
December 2016 6
2.19 The 2014 Retail Study also identified particular qualitative needs within the district for:
The provision of a new foodstore in Knaresborough. This was considered to be the most obvious deficiency in convenience goods provision within the district. If located within the town centre, it was suggested that such a facility could play a key role in reinforcing its vitality and viability, as well as promoting more sustainable shopping patterns.
Additional modern retail units in Ripon City Centre to accommodate the requirements of ‘high street’ comparison operators. The City Centre was under-represented in several key comparison goods sub-sectors and had limited representation from national multiples. In order to address these deficiencies and bolster the performance of the centre, it was considered important to ensure that Ripon remained competitive and was able to offer the appropriate type of floorspace required to attract new occupiers.

Harrogate Retail Study 2016 Update
December 2016 7
3 CHANGES TO DATA INPUTS
Introduction 3.1 In this section we set out the changes to the data inputs which inform our retail
floorspace capacity update of the 2014 Retail Study. The changes relate to the following inputs:
population projections; expenditure growth rates; Special Forms of Trading (such as online shopping); sales density growth of existing retail floorspace; and retail floorspace commitments.
Population Projections 3.2 Our update makes use of the most recent 2014-based population projections for each
of the seven survey zones which make up the study area, provided by Experian (as per the previous study update). A summary of the resultant population growth in each of the survey zones by 2026, at the study base year of 2016, and the interval year of 2021, is shown at Table 1 of Appendix A. For ease of reference, we summarise the population growth across the study area below in Table 3.1. This shows that the total population is expected to increase by 10,067 persons over the period between 2016 and 2026, based on the Experian projections. Table 3.1 also summarises population projections from the 2014 Retail Study, showing that the total population of the study area is expected to be higher than previously assumed in each of the interval years.
Table 3.1 Population Projections to 2026 Population of Study Area 2016 2021 2026
2014 Retail Study 292,788 297,487 302,477
2016 Retail Study Update 295,068 300,018 305,135
Expenditure Growth Rates 3.3 Updated, 2015-based per capita spending on comparison and convenience goods is
provided by Experian for each of the study area zones. In order to calculate how much per capita spending is likely to increase over the course of the study period, we apply expenditure growth rates sourced from Experian’s Retail Planner Briefing Note 14 (RPBN 14, November 2016) to the base year figures.
3.4 In the 2014 Retail Study, we adopted comparison goods expenditure growth rates that averaged 3 per cent per annum between 2016 and 2020, and 2.9 per cent per annum from 2021 to 2026. Experian’s RPBN 14 now forecasts a comparison goods

Harrogate Retail Study 2016 Update
December 2016 8
expenditure growth rate which averages 2.3 per cent per annum between 2016 and 2020, which then increases to 3.1 per cent per annum from 2021 to 2026. The lower short-term forecasts are as a result of uncertainty associated with the UK’s exit from the European Union (i.e. Brexit).
3.5 For convenience retail goods, the 2014 Retail Study adopted an average growth rate of 0.8 per cent per annum for the period 2016 to 2026. Experian’s forecasts of expenditure growth in the convenience goods sector from October 2016 have been applied to this update resulting in annual growth rates that average -0.2 per cent per annum between 2016 and 2020, and 0 per cent from 2021 to 2026. These changes reflect the ongoing price competition in the convenience goods sector and economic uncertainty associated with Brexit.
3.6 Full details of the growth rates applied to the base year per capita expenditure figures are set out in Table 2a (for comparison goods) and Table 2b (for convenience goods) of Appendix A.
Special Forms of Trading 3.7 ‘Special Forms of Trading’ (SFT) is expenditure which is diverted from traditional
retail outlets towards channels such as online shopping. SFT therefore acts as a ‘claim’ on the amount of expenditure that is available to support the trading of physical retail floorspace, and so it is removed from the total expenditure ‘pot’ in order to ensure that the residual expenditure (i.e. that which is left over having removed the SFT) is entirely available to existing and new retail floorspace.
3.8 Market shares for SFT were identified on a zone-by-zone basis by the household survey undertaken to support the 2014 Retail Study. We applied rates of growth implied by Experian forecasts to these existing market shares to estimate future SFT market shares over the study period. We adopt the same approach for this update, using the market shares for SFT forecast by Experian within RPBN 14. The overall market shares for SFT used to inform the previous study and this update are set out below in Table 3.2. This shows that growth in SFT in the comparison retail sector is largely unchanged from the previous study, whilst market shares for SFT in the convenience retail sector are expected to grow at a slower rate over the period to 2026.
Table 3.2 Special Forms of Trading Comparison goods Convenience goods
SFT Market Share (2014
HRS)
SFT Market Share (this
study)
Difference (percentage
points)
SFT Market Share
(2014 HRS)
SFT Market Share (this
study)
Difference (percentage
points)
2016 17.4% 17.6% +0.2 10.8% 10.1% -0.7
2021 20.9% 20.8% -0.1 15.2% 13.0% -2.2
2026 21.3% 21.5% +0.2 17.1% 15.4% -1.7
Harrogate Retail Study 2016 Update
December 2016 9
Sales Density Growth 3.9 It is also necessary to make allowance for sales density growth (also known as
floorspace productivity growth) for existing comparison and convenience retail floorspace within the study area. This is based on the assumption that existing stores will trade at increasingly efficient levels of turnover per sq.m over the course of the study period. Allowances for sales density growth are linked to expenditure growth and so there are a number of slight changes to sales density figures relative to those used in the 2014 Retail Study. Table 3.3 summarises the sales density growth rates we have used for the purposes of our assessment.
3.10 Given the continuing falls in expenditure on convenience goods, we reduce sales density rates to 0 per cent for the remainder of the period to 2026. We retain a sales density growth rate of 1.5 per cent per annum for comparison goods floorspace, reflecting overall expenditure growth rates over the period to 2026 and our view of the quality of existing retail floorspace within the study area.
Table 3.3 Sales Density Growth Rates Comparison goods Convenience goods
Sales Density Growth Allowance
2014 Study (% per annum)
This Study (% per annum)
2014 Study (% per annum)
This Study (% per annum)
1.5% 1.5% 0.3% 0%
Retail Floorspace Commitments 3.11 The household survey used to inform our updated capacity assessment was
undertaken in October 2013 to support the 2014 Retail Study. In order to provide an accurate indication of the amount of surplus comparison and convenience goods expenditure that is available to support new floorspace, it is necessary to deduct the estimated turnovers of retail developments which have been granted permission subsequent to October 2014, because no new household survey of shopping patterns has been undertaken. Such commitments can include developments which have commenced trading subsequent to the completion of the household survey, or sites that benefit from extant planning permissions that have not yet been implemented.
Comparison Retail Commitments 3.12 Table 6 of Appendix A shows the comparison retail commitments which we have
included for the purposes of this update. The 2014 Retail Study accounted for eight individual comparison retail commitments that were expected to provide total sales area retail floorspace of approximately 8,369 sq. m. Of these commitments, only the new Marks & Spencer store at Leeds Road, Harrogate has been implemented. We continue to treat this development as a commitment as it was not trading at the time of the household survey undertaken to inform the 2014 Retail Study.
3.13 In terms of the remaining commitments, two planning permissions are considered to have expired. These are the proposed extension to the Asda store at Harrogate, and the Co-op proposals at Chain Lane, Knaresborough, both of which are now removed

Harrogate Retail Study 2016 Update
December 2016 10
from this updated assessment. The largest commitment included within the previous study was planning permission for a Tesco superstore in Harrogate. Tesco has now confirmed that it will not be proceeding with this development and its seeking to dispose of the site. This commitment has therefore also been removed. Although not implemented, planning permission for a Morrisons foodstore and a DIY store at Ripon remains extant and so these continue to be included as commitments.
3.14 Since the time of the previous study there have been no significant new comparison retail commitments. However, planning permission has been granted for three new foodstores in Harrogate, Knaresborough and Ripon (discussed further below) which will contain an element of comparison goods floorspace and have therefore been included in this updated assessment. The new foodstore commitment at Knaresborough also includes a number of smaller units which could potentially be used for comparison retail uses and are therefore included within our assessment.
Convenience Retail Commitments 3.15 Table 6 of Appendix A also shows the convenience retail commitments which we
have taken account of as part of this update. As with comparison retail commitments, we continue to treat the convenience retail floorspace within the new Marks & Spencer store in Harrogate as a commitment and remove the expired Co-op permission at Knaresborough, as well as the proposed Tesco store at Harrogate.
3.16 In addition to the commitments previously considered, planning permission has been granted since the publication of the 2014 Retail Study for two medium-sized foodstores at Stonebridgegate, Ripon, and Manse Farm, Knaresborough. Planning permission has also been granted for a new foodstore at Oakbeck Retail Park, Harrogate, including the extension of an existing retail unit (this facility is now trading). Convenience goods floorspace within all three of these developments is included as commitments within our updated assessment.

Harrogate Retail Study 2016 Update
December 2016 11
4 UPDATED RETAIL CAPACITY FORECASTS
Introduction 4.1 In the previous section we set out the key changes to the data inputs which inform
our updates to the comparison and convenience goods capacity forecasts for Harrogate. Based on these inputs, we set out in this section the revised comparison and convenience goods capacity forecasts for the study area. The findings of this section should be read in conjunction with the data tables set out at Appendix A.
Structure of the Quantitative Assessment 4.2 The data tables set out at Appendix A follow the format adopted in the 2014 Retail
Study and are organised as shown in Table 4.1.
Table 4.1 Structure of the Quantitative Assessment Table Description
Table 1 Summarises the updated population projections in the study area zones, at the base year of 2016, and the interval years of 2021 and 2026.
Tables 2a &2b
Show the per capita expenditure on comparison goods (2a) and convenience goods (2b) for the seven zones, at the base and interval years.
Tables 3a & 3b
Sets out updated estimates of total comparison goods spending (3a) and convenience goods spending (3b) for the study area, by multiplying the population figures in Table 1 with the per capita expenditure figures in Tables 2a and 2b. A discount is applied at each interval period for ‘Special Forms of Trading’ such as online shopping, as discussed in the previous section.
Table 4a
Shows the current market shares (in percentage terms) for comparison goods shopping destinations in the study area. These are unchanged from those in the 2014 Retail Study, as no new household survey has been undertaken in support of this update.
Table 4b
Applies the percentage market shares from Table 4a to the total available comparison goods expenditure shown in Table 3a, to show the turnover1 for each comparison goods shopping destination in monetary terms.
Tables 5a & 5b
Show the breakdown of spending on sub-categories of comparison goods.
Tables 5c & 5d
Provide a detailed breakdown of spending patterns and market shares for the key comparison goods categories of clothing and shoes, and electrical and domestic items.
Table 6 Sets out a summary of the retail planning commitments which act as a ‘claim’ on the total available comparison goods expenditure.
Table 7 Sets out the revised comparison goods retail capacity forecasts for the study area. Floorspace requirements are calculated on the basis of the average sales density for 2013 adopted by the 2014 Retail Study and increased to 2026 on the basis of updated assumptions in respect of sales density growth.
1 We assume no material changes in shopping patterns between the period of the household survey (in support of the 2014 Retail Study) and this Update.

Harrogate Retail Study 2016 Update
December 2016 12
Table Description
Tables 8a & 8b
Repeat Tables 4a and 4b but for convenience goods, showing current market shares for each individual destination and their turnover which is calculated by applying the percentage market shares to the total available convenience good expenditure identified in Table 3b.
Table 9 Sets out the revised convenience goods retail capacity forecasts for the study area. Floorspace requirements are calculated on the basis of the average sales density for 2013 adopted by the 2014 Retail Study and has been kept constant over the study period, taking account of revised assumptions in terms of sales density growth. We note that the 2014 Retail Study made an allowance for over-trading of £23.9 million in 2016. This has been removed from this update as overtrading is expected to have been reduced by the opening of committed convenience retail schemes since the time of the previous study.
Comparison Goods Floorspace Requirements 4.3 Table 7 of Appendix A sets out our updated assessment of comparison goods
floorspace requirements over the remainder of the study period to 2026. These findings our summarised below in Table 4.2.
Table 4.2 Summary of Comparison Floorspace Requirements
2016-21 (sq.m sales area)
2021-26 (sq.m sales area)
Total 2016-26
(sq.m sales area)
Floorspace Requirement -5,685 9,465 3,779
4.4 In the short-term period to 2021, there is no requirement for additional comparison retail floorspace, with a negative capacity figure due to relatively low rates of expenditure growth, rising market shares for SFT and assuming the delivery of existing planning commitments. However, between 2021 and 2026 there is a requirement for over 9,000 sq. m of additional comparison retail sales floorspace, meaning that over the study period to 2026 there is a total requirement of approximately 3,800 sq. m sales area.
Convenience Goods Floorspace Requirements 4.5 Table 9 of Appendix A provides our updated assessment of convenience goods
floorspace requirements over the remainder of the study period and these are summarised below in Table 4.3.
Table 4.3 Summary of Convenience Floorspace Requirements
2016-21 (sq.m sales area)
2021-26 (sq.m sales area)
Total 2016-26
(sq.m sales area)
Floorspace Requirement -1,883 462 -1,421
4.6 Our updated assessment finds that, as with comparison floorspace requirements, there is no capacity for additional convenience retail floorspace in the period to 2021,

Harrogate Retail Study 2016 Update
December 2016 13
after which there is only a modest requirement of around 450 sq. m sales area floorspace in the period 2021-2026. Over the study period to 2026 the total requirement therefore remains negative, mainly due to low or negative expenditure growth rates and the expenditure capacity claimed by existing planning commitments and rising markets shares for SFT.

Harrogate Retail Study 2016 Update
December 2016 14
5 CONCLUSIONS AND RECOMMENDATIONS
5.1 This report provides our updated assessments of quantitative retail capacity for Harrogate district, and serves as a refresh of the quantitative capacity forecasts set out in the Harrogate Retail Study of 2014. Specifically, it updates estimates of population growth, per capita expenditure growth, ‘special forms of trading’ such as online shopping, and commitments for new retail development. Given that no new household telephone survey of shopping patterns has been undertaken in support of this update, we continue to use the findings of the survey undertaken in support of the 2014 Retail Study as the basis of our assessment.
Retail Floorspace Requirements 5.2 As summarised in Section 4 of this report, and Tables 7 and 9 of Appendix A, we
have identified a requirement for additional comparison retail sales floorspace of approximately 3,800 sq. m over the study period to 2026. In the 5-year period to 2021, there is no capacity for additional floorspace due to low rates of expenditure growth and the expected implementation of existing planning commitments. The requirements identified therefore arise in the subsequent period between 2021 and 2026.
5.3 In terms of convenience retail floorspace requirements, our updated assessment has found no capacity for additional floorspace over the period to 2026. This conclusion reflects that of the 2014 Retail Study, which also found no capacity for convenience goods floorspace over the study period. The negative figure results from negative rates of expenditure growth forecast in the period to 2020, rising market shares for special forms of trading and the implementation of existing planning commitments.
Recommendations 5.4 The retail floorspace requirements identified in this report are provided as guidelines
only and do not represent maximum limits on the quantum of retail floorspace that can be developed in Harrogate in the period to 2026. Should proposals over and above the identified requirements come forward, then these will need to be assessed against the wider policies and objectives of the development plan and national planning policy.
5.5 As with the 2014 Retail Study, and assuming no significant changes to the health of the district’s town centres over the past two years, we recommend that additional comparison retail floorspace requirements in the period after 2021 should be directed to Ripon City Centre in the first instance to support the strengthening of its comparison retail offer and its overall vitality and viability. The 2014 study provided recommendations in terms of how these requirements could be accommodated and the Borough Council will wish to review these findings.
5.6 This update has found no capacity for additional convenience retail floorspace within the study area in the period to 2026. We also note that some of the new commitments

Harrogate Retail Study 2016 Update
December 2016 15
that have come forward since the time of the previous study will serve to address the qualitative deficiency identified for improved convenience goods provision within Knaresborough (although they will not provide the anchor store that the previous study suggested was needed to support the vitality and viability of the town centre). The negative capacity for convenience goods floorspace over the period to 2026 should be taken into account when considering the impact of any future proposals for additional convenience goods floorspace in out-of-centre locations.
5.7 We recommend that the floorspace capacity figures for the period beyond 2021 should be treated as indicative, and that the capacity forecasts should be subject to regular updates throughout the study period. This is particularly the case given the inevitable uncertainty over the delivery of some existing retail floorspace commitments and the economic uncertainty created by the UK’s decision to leave the European Union.


Harrogate Retail Study 2016 Update
APPENDIX A QUANTITATIVE ASSESSMENT


Table 1 — Population of study area to 2026
Zone 1 Zone 2 Zone 3 Zone 4 Zone 5 Zone 6 Zone 7 Zone 8 Zone 9 Zone 10 Overall totalpersons persons persons persons persons persons persons persons persons persons persons
2016 estimate 27,636 23,206 25,333 23,993 31,062 32,088 31,817 38,045 37,771 24,117 295,0682021 estimate 28,111 23,588 25,697 24,387 31,501 32,630 32,471 38,935 38,280 24,418 300,0182026 estimate 28,453 24,039 26,033 24,744 31,962 33,163 33,274 39,881 38,912 24,674 305,135
Population projections sourced from Experian Micromarketer
Table 2a — Comparison goods expenditure forecasts (per capita)
Zone 1 Zone 2 Zone 3 Zone 4 Zone 5 Zone 6 Zone 7 Zone 8 Zone 9 Zone 10£ £ £ £ £ £ £ £ £ £
2016 estimate 3,223 3,768 3,576 3,944 3,891 3,606 3,774 3,784 3,963 3,8862021 estimate 3,607 4,217 4,002 4,414 4,354 4,036 4,224 4,235 4,435 4,3482026 estimate 4,206 4,917 4,666 5,147 5,077 4,706 4,925 4,938 5,171 5,070
Applied annual expenditure growth rates:
2016 -17 3.30%2017-18 1.40%2018-19 1.00%2019-23 3.00%2024+ 3.20%
Baseline (2016) data source: Experian Micromarketer (2015 prices)Growth rates source: Experian Retail Planner 14
Harrogate Catchment
Harrogate Catchment
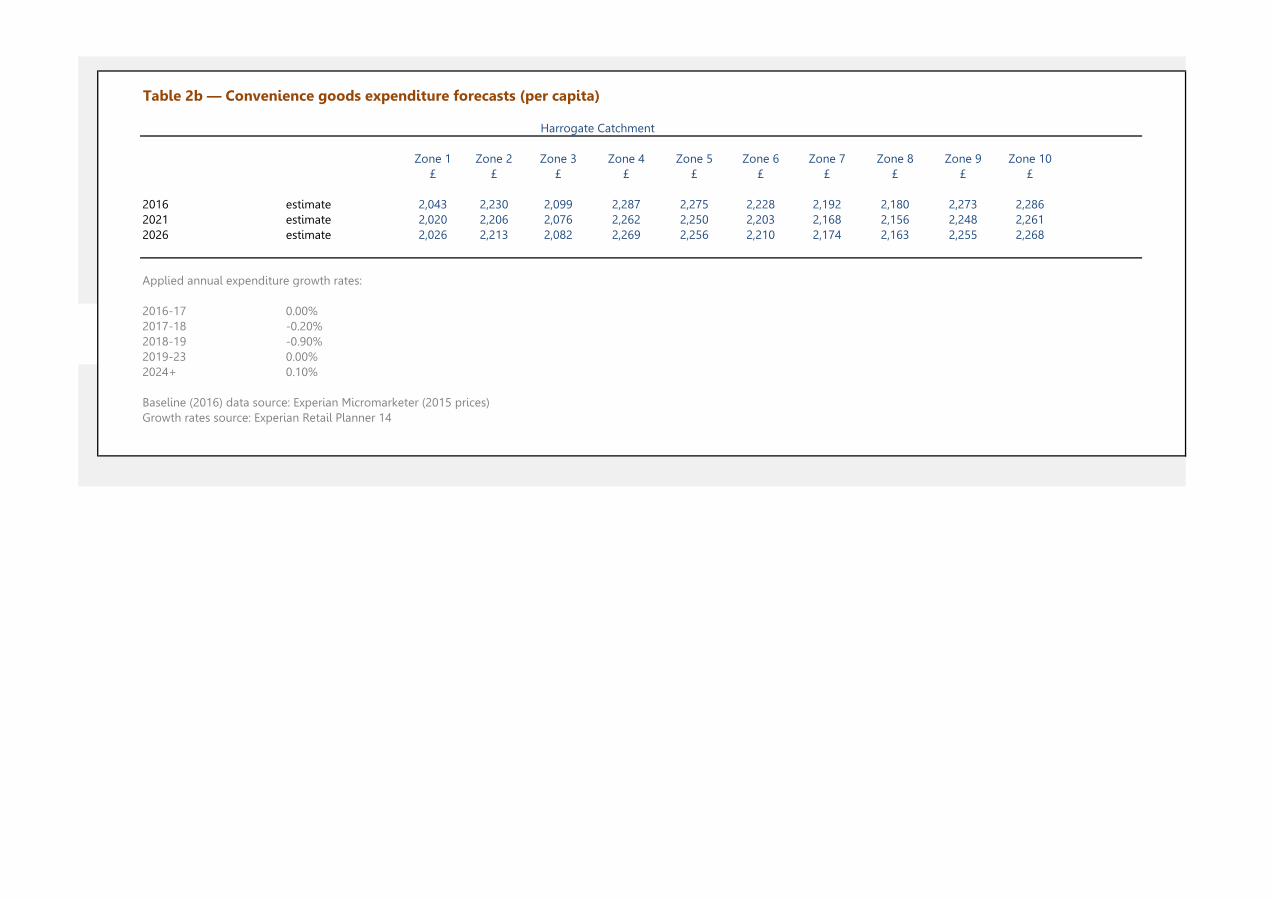
Table 2b — Convenience goods expenditure forecasts (per capita)
Zone 1 Zone 2 Zone 3 Zone 4 Zone 5 Zone 6 Zone 7 Zone 8 Zone 9 Zone 10£ £ £ £ £ £ £ £ £ £
2016 estimate 2,043 2,230 2,099 2,287 2,275 2,228 2,192 2,180 2,273 2,2862021 estimate 2,020 2,206 2,076 2,262 2,250 2,203 2,168 2,156 2,248 2,2612026 estimate 2,026 2,213 2,082 2,269 2,256 2,210 2,174 2,163 2,255 2,268
Applied annual expenditure growth rates:
2016-17 0.00%2017-18 -0.20%2018-19 -0.90%2019-23 0.00%2024+ 0.10%
Baseline (2016) data source: Experian Micromarketer (2015 prices)Growth rates source: Experian Retail Planner 14
Harrogate Catchment
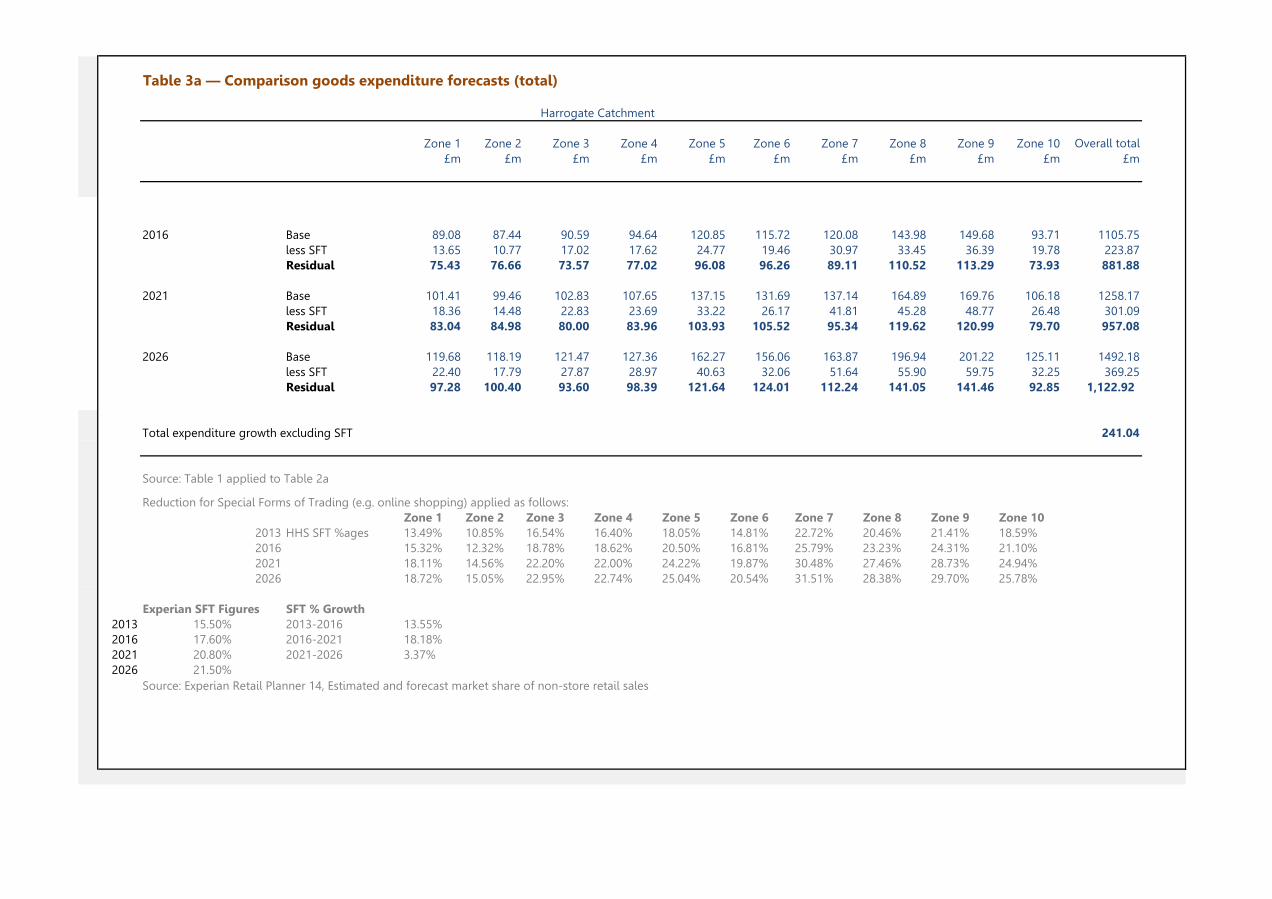
Table 3a — Comparison goods expenditure forecasts (total)
Zone 1 Zone 2 Zone 3 Zone 4 Zone 5 Zone 6 Zone 7 Zone 8 Zone 9 Zone 10 Overall total£m £m £m £m £m £m £m £m £m £m £m
2016 Base 89.08 87.44 90.59 94.64 120.85 115.72 120.08 143.98 149.68 93.71 1105.75less SFT 13.65 10.77 17.02 17.62 24.77 19.46 30.97 33.45 36.39 19.78 223.87Residual 75.43 76.66 73.57 77.02 96.08 96.26 89.11 110.52 113.29 73.93 881.88
2021 Base 101.41 99.46 102.83 107.65 137.15 131.69 137.14 164.89 169.76 106.18 1258.17less SFT 18.36 14.48 22.83 23.69 33.22 26.17 41.81 45.28 48.77 26.48 301.09Residual 83.04 84.98 80.00 83.96 103.93 105.52 95.34 119.62 120.99 79.70 957.08
2026 Base 119.68 118.19 121.47 127.36 162.27 156.06 163.87 196.94 201.22 125.11 1492.18less SFT 22.40 17.79 27.87 28.97 40.63 32.06 51.64 55.90 59.75 32.25 369.25Residual 97.28 100.40 93.60 98.39 121.64 124.01 112.24 141.05 141.46 92.85 1,122.92
Total expenditure growth excluding SFT 241.04
Source: Table 1 applied to Table 2a
Reduction for Special Forms of Trading (e.g. online shopping) applied as follows:Zone 1 Zone 2 Zone 3 Zone 4 Zone 5 Zone 6 Zone 7 Zone 8 Zone 9 Zone 10
2013 HHS SFT %ages 13.49% 10.85% 16.54% 16.40% 18.05% 14.81% 22.72% 20.46% 21.41% 18.59%2016 15.32% 12.32% 18.78% 18.62% 20.50% 16.81% 25.79% 23.23% 24.31% 21.10%2021 18.11% 14.56% 22.20% 22.00% 24.22% 19.87% 30.48% 27.46% 28.73% 24.94%2026 18.72% 15.05% 22.95% 22.74% 25.04% 20.54% 31.51% 28.38% 29.70% 25.78%
Experian SFT Figures SFT % Growth2013 15.50% 2013-2016 13.55%2016 17.60% 2016-2021 18.18%2021 20.80% 2021-2026 3.37%2026 21.50%
Source: Experian Retail Planner 14, Estimated and forecast market share of non-store retail sales
Harrogate Catchment

Table 3b — Convenience goods expenditure forecasts (total)
Zone 1 Zone 2 Zone 3 Zone 4 Zone 5 Zone 6 Zone 7 Zone 8 Zone 9 Zone 10 Overall total£m £m £m £m £m £m £m £m £m £m £m
2016 Base 56.45 51.76 53.17 54.87 70.66 71.48 69.74 82.94 85.86 55.14 652.1less SFT 0.67 1.53 1.88 3.13 3.87 1.99 3.59 4.41 3.08 4.64 28.8Residual 55.78 50.23 51.29 51.75 66.79 69.49 66.15 78.53 82.78 50.49 623.3
2021 Base 56.79 52.03 53.34 55.16 70.87 71.89 70.39 83.95 86.06 55.21 655.7less SFT 0.87 1.99 2.42 4.05 5.00 2.58 4.66 5.74 3.97 5.98 37.3Residual 55.92 50.05 50.91 51.12 65.87 69.31 65.73 78.20 82.09 49.23 618.4
2026 Base 57.65 53.19 54.20 56.14 72.12 73.29 72.35 86.24 87.75 55.96 668.9less SFT 1.04 2.40 2.92 4.88 6.03 3.11 5.67 6.99 4.80 7.18 45.0Residual 56.61 50.79 51.28 51.26 66.10 70.17 66.68 79.26 82.95 48.77 623.9
Total expenditure growth excluding SFT 0.6
Reduction for Special Forms of Trading (e.g. online shopping) applied as follows:
Reduction for Special Forms of Trading (e.g. online shopping) applied as follows:Zone 1 Zone 2 Zone 3 Zone 4 Zone 5 Zone 6 Zone 7 Zone 8 Zone 9 Zone 10
2013 HHS SFT %ages 0.84% 2.08% 2.48% 4.01% 3.85% 1.96% 3.61% 3.74% 2.52% 5.92%2016 1.19% 2.96% 3.53% 5.70% 5.48% 2.79% 5.14% 5.31% 3.59% 8.42%2021 1.53% 3.82% 4.54% 7.34% 7.05% 3.59% 6.62% 6.84% 4.62% 10.84%2026 1.81% 4.52% 5.38% 8.69% 8.35% 4.25% 7.84% 8.10% 5.47% 12.84%
Experian SFT Figures SFT % Growth2013 7.10% 2013-2016 42.3%2016 10.10% 2016-2021 28.7%2021 13.00% 2021-2026 18.5%2026 15.40%
Source: Experian Retail Planner 14, Estimated and forecast market share of non-store retail sales
Harrogate Catchment

Table 4a — Comparison goods market shares, 2016
Zone 1 Zone 2 Zone 3 Zone 4 Zone 5 Zone 6 Zone 7 Zone 8 Zone 9 Zone 10% % % % % % % % % %
Stores and centres in Zone 1Harrogate Town Centre 57.6% 57.7% 55.2% 35.3% 32.0% 31.2% 12.6% 10.4% 10.0% 3.8%B&Q, Skipton Road, Harrogate 2.3% 4.0% 0.7% 1.7% 0.8% 1.5% 0.5% 0.1% 0.3% 0.1%Asda, Bower Road, Harrogate 4.0% 2.2% 4.0% 0.5% 0.1% 1.1% 0.3% 0.0% 0.3% 0.0%Other destinations, Zone 1 1.8% 2.0% 2.2% 0.6% 1.3% 0.8% 0.2% 0.1% 0.4% 0.0%Sub-total, survey zone 1 65.7% 65.9% 62.1% 38.2% 34.2% 34.5% 13.6% 10.6% 10.9% 3.9%
Stores and centres in Zone 2Harrogate Retail Park (Oak Beck Retail Park) 0.7% 0.8% 0.7% 0.4% 1.2% 0.2% 0.3% 0.0% 0.0% 0.0%Other destinations, zone 2 0.4% 0.2% 0.3% 0.0% 0.2% 0.5% 0.1% 0.0% 0.0% 0.0%Sub-total, survey zone 2 1.1% 1.0% 1.1% 0.4% 1.4% 0.8% 0.4% 0.0% 0.0% 0.0%
Stores and centres in Zone 3Plumpton Retail Park, Harrogate 10.5% 9.6% 14.9% 9.0% 5.9% 3.1% 3.6% 0.3% 0.0% 0.2%Other destinations, zone 3 3.5% 1.4% 4.7% 0.6% 0.9% 0.1% 3.0% 0.8% 0.0% 0.3%Sub-total, survey zone 3 14.0% 11.0% 19.6% 9.6% 6.8% 3.2% 6.6% 1.2% 0.0% 0.5%
Stores and centres in Zone 4Co-operative Food, 119 Otley Road, Harrogate 0.1% 0.0% 0.0% 0.0% 0.0% 0.0% 0.0% 0.0% 0.0% 0.0%Other destinations, Zone 4 0.2% 0.0% 0.0% 0.0% 0.0% 0.0% 0.0% 0.0% 0.0% 0.0%Sub-total, survey zone 4 0.2% 0.0% 0.0% 0.0% 0.0% 0.0% 0.0% 0.0% 0.0% 0.0%
Stores and centres in Zone 5Knaresborough Town Centre 1.9% 1.1% 2.7% 1.1% 14.0% 1.5% 3.4% 0.4% 0.2% 0.3%St James Retail Park , Knaresborough 1.8% 1.8% 5.3% 3.1% 5.0% 2.2% 4.0% 0.7% 0.3% 0.8%Boroughbridge Town Centre 1.1% 0.2% 0.2% 0.2% 3.9% 0.7% 0.0% 0.0% 0.0% 0.1%Other destinations, survey zone 5 0.0% 0.0% 0.2% 0.0% 2.1% 0.3% 0.0% 0.0% 0.0% 0.1%Sub-total, survey zone 5 4.8% 3.1% 8.3% 4.4% 25.0% 4.7% 7.4% 1.1% 0.5% 1.3%
Stores and centres in survey zone 6Ripon City Centre 1.3% 2.7% 0.6% 0.1% 3.3% 39.4% 0.2% 0.0% 0.0% 3.8%Pateley Bridge Town Centre 0.0% 0.0% 0.0% 0.3% 0.0% 3.3% 0.0% 0.0% 0.0% 0.0%Other destinations, Zone 6 0.0% 0.0% 0.1% 0.0% 0.2% 1.9% 0.0% 0.0% 0.1% 0.0%Sub-total, survey zone 6 1.3% 2.8% 0.7% 0.4% 3.4% 44.5% 0.2% 0.0% 0.2% 3.8%
Stores and centres in survey zone 7Wetherby Town Centre 0.2% 1.3% 0.2% 1.7% 1.2% 0.3% 14.0% 0.7% 0.0% 0.0%Morrisons, Horsefair, Wetherby 0.0% 0.0% 0.0% 0.3% 0.0% 0.0% 3.3% 0.0% 0.0% 0.0%Other destinations, survey zone 7 0.0% 0.0% 0.0% 0.1% 0.2% 0.0% 1.8% 0.0% 0.0% 0.0%Sub-total, survey zone 7 0.2% 1.3% 0.2% 2.0% 1.4% 0.3% 19.1% 0.8% 0.0% 0.0%
Stores and centres in survey zone 8Guiseley Retail Park, Guiseley 0.1% 0.0% 0.0% 6.0% 0.0% 0.0% 0.0% 18.8% 8.2% 0.0%Otley Town Centre 0.0% 0.0% 0.1% 12.3% 0.0% 0.0% 0.2% 10.9% 2.4% 0.0%Guiseley Town Centre 0.0% 0.0% 0.0% 4.2% 0.0% 0.0% 0.0% 11.3% 5.9% 0.0%Other destinations, Zone 8 0.5% 0.0% 0.4% 1.3% 0.8% 0.1% 2.4% 1.7% 0.2% 0.0%Sub-total, survey zone 8 0.6% 0.0% 0.5% 23.8% 0.8% 0.1% 2.6% 42.6% 16.7% 0.0%
Stores and centres in survey zone 9Ilkley Town Centre 0.4% 0.0% 0.0% 1.8% 0.0% 0.6% 0.0% 5.1% 18.5% 0.0%Other destinations, Zone 9 0.0% 0.0% 0.0% 0.0% 0.0% 0.0% 0.0% 0.0% 2.2% 0.0%Sub-total, survey zone 9 0.4% 0.0% 0.0% 1.8% 0.0% 0.6% 0.0% 5.1% 20.7% 0.0%
Stores and centres in survey zone 10Bedale Town Centre 0.0% 0.0% 0.0% 0.0% 0.0% 0.0% 0.0% 0.0% 0.5% 1.7%Other destinations, Zone 10 0.0% 0.0% 0.0% 0.0% 0.0% 0.0% 0.0% 0.0% 0.0% 0.4%Sub-total, survey zone 10 0.0% 0.0% 0.0% 0.0% 0.0% 0.0% 0.0% 0.0% 0.5% 2.2%
Sub-total for study area 88.3% 85.1% 92.5% 80.6% 72.9% 88.7% 50.1% 61.3% 49.5% 11.7%
Locations outside study area
YorkClifton Moor Retail Park, York 1.5% 3.8% 0.6% 0.6% 8.6% 0.4% 9.3% 0.2% 0.0% 25.6%York City Centre 1.7% 1.7% 0.6% 1.7% 7.4% 1.4% 13.8% 0.5% 0.4% 20.2%Monks Cross Retail Park, York 0.5% 0.4% 0.0% 0.2% 2.2% 0.7% 4.9% 0.0% 0.0% 10.0%Other locations, York 0.5% 0.0% 0.7% 1.1% 2.8% 1.5% 5.7% 0.8% 0.2% 4.2%Sub-total, York 4.3% 5.9% 1.9% 3.7% 21.1% 4.1% 33.8% 1.5% 0.6% 60.1%
LeedsLeeds City Centre 2.3% 4.6% 2.3% 5.5% 1.6% 2.3% 9.4% 18.4% 11.9% 1.8%Other locations, Leeds 0.4% 0.1% 0.0% 0.9% 0.0% 0.0% 0.7% 2.3% 0.9% 0.2%Sub-total, Leeds 2.7% 4.7% 2.3% 6.3% 1.6% 2.3% 10.1% 20.7% 12.8% 1.9%
SkiptonSkipton Town Centre 0.0% 0.0% 0.1% 1.3% 0.0% 0.1% 0.0% 0.1% 10.0% 0.0%Other locations, Skipton 0.0% 0.0% 0.0% 0.0% 0.0% 0.0% 0.0% 0.0% 1.8% 0.0%Sub-total, Skipton 0.0% 0.0% 0.1% 1.3% 0.0% 0.1% 0.0% 0.1% 11.7% 0.0%
NorthallertonNorthallerton Town Centre 0.0% 0.5% 0.5% 0.0% 0.8% 1.3% 0.0% 0.2% 1.6% 7.1%Other locations, Northallerton 0.0% 0.0% 0.0% 0.0% 0.0% 0.3% 0.0% 0.0% 0.3% 1.0%Sub-total, Northallerton 0.0% 0.5% 0.5% 0.0% 0.8% 1.6% 0.0% 0.2% 1.8% 8.1%
ThirskThirsk Town Centre 0.4% 0.2% 0.3% 0.2% 0.2% 0.7% 0.0% 0.0% 0.0% 3.7%Other locations, Thirsk 0.0% 0.0% 0.0% 0.0% 0.0% 0.0% 0.0% 0.0% 0.0% 0.1%Sub-total, Thirsk 0.4% 0.2% 0.3% 0.2% 0.2% 0.7% 0.0% 0.0% 0.0% 3.8%
Other locationsKeighley Town Centre 0.2% 0.0% 0.0% 0.7% 0.0% 0.2% 0.0% 0.2% 6.6% 0.0%Easingwold Town Centre 0.0% 0.0% 0.0% 0.0% 0.0% 0.0% 0.0% 0.0% 0.0% 4.5%Bradford City Centre 0.0% 0.1% 0.0% 1.6% 0.2% 0.0% 0.0% 3.7% 2.9% 0.2%
All other locations outside study area 4.1% 3.7% 2.4% 5.7% 3.3% 2.3% 6.0% 12.1% 14.1% 9.7%
Sub-total for outside study area 11.7% 14.9% 7.5% 19.4% 27.1% 11.3% 49.9% 38.7% 50.5% 88.3%
Total 100.0% 100.0% 100.0% 100.0% 100.0% 100.0% 100.0% 100.0% 100.0% 100.0%
Source: NEMS Household Survey market shares (composite results), September 2013
Harrogate Catchment

Table 4b — Comparison goods spending patterns, 2016
Zone 1 Zone 2 Zone 3 Zone 4 Zone 5 Zone 6 Zone 7 Zone 8 Zone 9 Zone 10 Overall total
Overall Market
Share£m £m £m £m £m £m £m £m £m £m £m %
Total expenditure available to study area, 2016 75.43 76.66 73.57 77.02 96.08 96.26 89.11 110.52 113.29 73.93 881.88
Stores and centres in Zone 1Harrogate Town Centre 43.47 44.20 40.63 27.18 30.77 30.00 11.25 11.49 11.28 2.82 253.1 28.7%B&Q, Skipton Road, Harrogate 1.72 3.08 0.48 1.33 0.77 1.46 0.45 0.12 0.29 0.07 9.78 1%Asda, Bower Road, Harrogate 3.00 1.70 2.94 0.42 0.10 1.03 0.24 0.00 0.30 0.00 9.73 1%Other destinations, Zone 1 1.34 1.52 1.62 0.50 1.23 0.75 0.21 0.08 0.45 0.00 7.70 1%Sub-total, survey zone 1 49.53 50.50 45.67 29.43 32.87 33.24 12.16 11.69 12.31 2.89 280.31 32%
Stores and centres in Zone 2Harrogate Retail Park (Oak Beck Retail Park) 0.55 0.60 0.54 0.27 1.13 0.24 0.25 0.00 0.00 0.00 3.57 0%Other destinations, zone 2 0.27 0.16 0.24 0.00 0.19 0.50 0.13 0.00 0.00 0.00 1.49 0%Sub-total, survey zone 2 0.82 0.77 0.77 0.27 1.32 0.73 0.38 0.00 0.00 0.00 5.06 1%
Stores and centres in Zone 3Plumpton Retail Park, Harrogate 7.93 7.36 10.94 6.91 5.63 2.95 3.24 0.35 0.00 0.13 45.45 5.2%Other destinations, zone 3 2.61 1.10 3.46 0.45 0.91 0.09 2.66 0.92 0.00 0.25 12.46 1%Sub-total, survey zone 3 10.55 8.46 14.41 7.36 6.54 3.04 5.90 1.27 0.00 0.38 57.91 7%
Stores and centres in Zone 4Co-operative Food, 119 Otley Road, Harrogate 0.04 0.00 0.00 0.02 0.00 0.00 0.00 0.00 0.00 0.00 0.06 0%Other destinations, Zone 4 0.14 0.00 0.00 0.00 0.00 0.00 0.04 0.00 0.00 0.00 0.18 0%Sub-total, survey zone 4 0.19 0.00 0.00 0.02 0.00 0.00 0.04 0.00 0.00 0.00 0.24 0%
Stores and centres in Zone 5Knaresborough Town Centre 1.41 0.86 2.01 0.85 13.42 1.45 3.07 0.47 0.24 0.23 24.0 2.7%St James Retail Park , Knaresborough 1.39 1.38 3.87 2.36 4.85 2.12 3.52 0.75 0.31 0.57 21.1 2.4%Boroughbridge Town Centre 0.82 0.13 0.11 0.13 3.72 0.72 0.00 0.00 0.00 0.10 5.73 0.6%Other destinations, survey zone 5 0.00 0.03 0.14 0.03 1.99 0.26 0.00 0.00 0.00 0.05 2.50 0%Sub-total, survey zone 5 3.62 2.40 6.13 3.37 23.97 4.54 6.59 1.23 0.56 0.95 53.37 6%
Stores and centres in survey zone 6Ripon City Centre 1.01 2.09 0.45 0.10 3.12 37.89 0.16 0.00 0.03 2.84 47.7 5.4%Pateley Bridge Town Centre 0.00 0.00 0.00 0.21 0.00 3.16 0.00 0.00 0.00 0.00 3.37 0%Other destinations, Zone 6 0.00 0.03 0.08 0.00 0.16 1.79 0.00 0.00 0.15 0.00 2.21 0%Sub-total, survey zone 6 1.01 2.12 0.53 0.31 3.28 42.84 0.16 0.00 0.18 2.84 53.27 6%
Stores and centres in survey zone 7Wetherby Town Centre 0.13 0.99 0.16 1.27 1.13 0.32 12.51 0.81 0.00 0.00 17.32 2.0%Morrisons, Horsefair, Wetherby 0.00 0.00 0.00 0.25 0.00 0.00 2.93 0.03 0.00 0.00 3.21 0%Other destinations, survey zone 7 0.00 0.00 0.00 0.05 0.17 0.00 1.61 0.00 0.00 0.00 1.83 0%Sub-total, survey zone 7 0.13 0.99 0.16 1.57 1.31 0.32 17.06 0.83 0.00 0.00 22.36 3%
Stores and centres in survey zone 8Guiseley Retail Park, Guiseley 0.09 0.00 0.00 4.63 0.00 0.00 0.00 20.74 9.34 0.00 34.81 3.9%Otley Town Centre 0.00 0.00 0.08 9.47 0.00 0.00 0.16 12.02 2.77 0.00 24.5 2.8%Guiseley Town Centre 0.00 0.00 0.00 3.24 0.00 0.00 0.00 12.45 6.66 0.00 22.4 2.5%Other destinations, Zone 8 0.39 0.00 0.28 0.97 0.74 0.09 2.16 1.86 0.19 0.00 6.68 1%Sub-total, survey zone 8 0.48 0.00 0.36 18.31 0.74 0.09 2.32 47.08 18.97 0.00 88.34 10%
Stores and centres in survey zone 9Ilkley Town Centre 0.29 0.00 0.00 1.39 0.00 0.56 0.00 5.65 21.01 0.00 28.91 3.3%Other destinations, Zone 9 0.00 0.00 0.00 0.02 0.00 0.00 0.00 0.00 2.44 0.00 2.46 0%Sub-total, survey zone 9 0.29 0.00 0.00 1.41 0.00 0.56 0.00 5.65 23.45 0.00 31.37 4%
Stores and centres in survey zone 10Bedale Town Centre 0.00 0.00 0.00 0.00 0.00 0.00 0.00 0.00 0.57 1.28 1.85 0%Other destinations, Zone 10 0.00 0.00 0.00 0.00 0.00 0.00 0.00 0.00 0.00 0.32 0.32 0%Sub-total, survey zone 10 0.00 0.00 0.00 0.00 0.00 0.00 0.00 0.00 0.57 1.60 2.17 0%
Sub-total for study area 66.62 65.24 68.03 62.06 70.03 85.36 44.61 67.76 56.03 8.66 594.41 67.4%
Locations outside study area
YorkClifton Moor Retail Park, York 1.16 2.88 0.42 0.48 8.29 0.42 8.25 0.26 0.00 18.94 41.12 4.7%York City Centre 1.30 1.32 0.44 1.34 7.15 1.39 12.32 0.59 0.43 14.95 41.23 4.7%Monks Cross Retail Park, York 0.35 0.28 0.00 0.16 2.16 0.67 4.40 0.00 0.00 7.42 15.45 1.8%Other locations, York 0.40 0.00 0.53 0.86 2.65 1.46 5.12 0.84 0.21 3.12 15.20 2%Sub-total, York 3.21 4.49 1.39 2.84 20.25 3.94 30.10 1.69 0.65 44.44 112.99 12.8%
LeedsLeeds City Centre 1.75 3.51 1.69 4.21 1.54 2.17 8.41 20.37 13.45 1.30 58.39 6.6%Other locations, Leeds 0.30 0.09 0.00 0.66 0.00 0.00 0.63 2.54 1.01 0.14 5.38 1%Sub-total, Leeds 2.05 3.60 1.69 4.88 1.54 2.17 9.03 22.91 14.46 1.44 63.8 7.2%
SkiptonSkipton Town Centre 0.00 0.00 0.11 0.97 0.00 0.11 0.00 0.13 11.31 0.00 12.63 1.4%Other locations, Skipton 0.00 0.00 0.00 0.00 0.00 0.03 0.00 0.00 1.99 0.00 2.02 0%Sub-total, Skipton 0.00 0.00 0.11 0.97 0.00 0.14 0.00 0.13 13.30 0.00 14.6 1.7%
NorthallertonNorthallerton Town Centre 0.00 0.35 0.35 0.00 0.77 1.28 0.00 0.24 1.77 5.26 10.02 1%Other locations, Northallerton 0.03 0.00 0.00 0.00 0.00 0.31 0.00 0.00 0.32 0.71 1.36 0%Sub-total, Northallerton 0.03 0.35 0.35 0.00 0.77 1.59 0.00 0.24 2.08 5.97 11.39 1%
ThirskThirsk Town Centre 0.31 0.12 0.20 0.14 0.16 0.72 0.00 0.00 0.00 2.75 4.40 0%Other locations, Thirsk 0.00 0.00 0.00 0.00 0.00 0.00 0.00 0.00 0.00 0.08 0.08 0%Sub-total, Thirsk 0.31 0.12 0.20 0.14 0.16 0.72 0.00 0.00 0.00 2.82 4.48 1%
Other locationsKeighley Town Centre 0.15 0.00 0.00 0.51 0.00 0.17 0.00 0.26 7.49 0.00 8.59 1%Easingwold Town Centre 0.00 0.00 0.00 0.00 0.00 0.00 0.00 0.00 0.00 3.33 3.33 0%Bradford City Centre 0.00 0.05 0.00 1.20 0.16 0.00 0.00 4.11 3.25 0.13 8.91 1%
All other locations outside study area 3.06 2.81 1.80 4.42 3.15 2.17 5.37 13.42 16.02 7.14 59.37 7%
Sub-total for outside study area 8.8 11.4 5.5 15.0 26.0 10.9 44.5 42.8 57.3 65.3 287.47 32.6%
Total 75.4 76.7 73.6 77.0 96.1 96.3 89.1 110.5 113.3 73.9 881.9 100%
Source: Table 4a, Table 3a
Harrogate Catchment

Table 5a — Percentage Splits of Comparison Goods Expenditure
Zone 1 Zone 2 Zone 3 Zone 4 Zone 5 Zone 6 Zone 7 Zone 8 Zone 9 Zone 10
% % % % % % % % % %
Clothing and footwear 27.5% 25.8% 26.3% 26.8% 25.3% 25.3% 25.5% 26.2% 26.1% 24.9%
Furniture, floorcoverings, household textiles 11.5% 12.3% 11.9% 12.0% 12.2% 12.4% 12.1% 11.9% 12.2% 12.6%
Audio-visual equipment 29.5% 28.1% 29.7% 28.5% 27.9% 27.9% 28.8% 28.9% 28.4% 27.4%
Hardware, DIY 5.9% 7.0% 6.5% 6.7% 7.4% 7.5% 7.0% 6.6% 7.2% 7.8%
Chemist goods 2.8% 3.0% 2.9% 2.8% 2.9% 2.8% 3.1% 3.0% 2.9% 2.6%
Recreational goods 10.5% 11.1% 10.5% 10.2% 11.2% 10.9% 10.8% 10.7% 10.2% 11.2%
Other non-food 12.3% 12.8% 12.3% 13.0% 13.1% 13.2% 12.7% 12.6% 13.0% 13.6%
Source: Experian MMG3 (2012)
Table 5b — Total Expenditure on Different Categories of Comparison Goods in 2016
Zone 1 Zone 2 Zone 3 Zone 4 Zone 5 Zone 6 Zone 7 Zone 8 Zone 9 Zone 10 Overall total
£m £m £m £m £m £m £m £m £m £m £m
Clothing and footwear 20.78 19.79 19.33 20.66 24.35 24.37 22.70 28.94 29.54 18.41 228.9
Furniture, floorcoverings, household textiles 8.66 9.40 8.76 9.28 11.69 11.92 10.76 13.13 13.84 9.29 106.7
Audio-visual equipment 22.24 21.55 21.83 21.92 26.81 26.90 25.70 31.93 32.14 20.24 251.3
Hardware, DIY 4.43 5.34 4.79 5.16 7.08 7.24 6.27 7.33 8.13 5.75 61.5
Chemist goods 2.15 2.27 2.10 2.17 2.79 2.69 2.75 3.36 3.30 1.90 25.5
Recreational goods 7.93 8.50 7.75 7.84 10.75 10.47 9.59 11.88 11.58 8.28 94.6
Other Goods (books, CDs, jewellery, glass and china, etc) 9.25 9.81 9.01 9.99 12.61 12.67 11.34 13.96 14.77 10.06 113.5
Total Comparison Goods Expenditure 75.43 76.66 73.57 77.02 96.08 96.26 89.11 110.52 113.29 73.93 881.9
Source: Table 3a, Table 5a
Harrogate Catchment
Harrogate Catchment

Table 5c — Total Expenditure on Clothing and Shoes Goods in 2016
Zone 1 Zone 2 Zone 3 Zone 4 Zone 5 Zone 6 Zone 7 Zone 8 Zone 9 Zone 10 Total
All Zones Market Share
£m £m £m £m £m £m £m £m £m £m £m %
Destinations in Zone 1
Harrogate Town Centre 12.04 12.57 13.15 9.02 10.11 11.68 5.14 6.09 5.51 1.46 86.8 37.9%
Marks & Spencer, 36-38 Cambridge Street, Harrogate 1.34 0.88 0.86 0.38 0.68 0.60 0.21 0.00 0.45 0.00 5.4 2.4%
Other destinations, Zone 1 1.51 0.27 0.22 0.00 0.00 0.27 0.20 0.00 0.16 0.00 2.6 1.2%
Sub total, Zone 1 14.90 13.71 14.23 9.40 10.80 12.55 5.54 6.09 6.12 1.46 94.8 41.4%
Destinations in Zone 2
Other destinations, zone 2 0.00 0.00 0.18 0.00 0.00 0.00 0.00 0.00 0.00 0.00 0.2 0.1%
Sub total, Zone 2 0.00 0.00 0.18 0.00 0.00 0.00 0.00 0.00 0.00 0.00 0.2 0.1%
Destinations in Zone 3
Sainsbury, Wetherby Road, Harrogate 1.04 0.00 0.52 0.10 0.13 0.00 0.27 0.12 0.00 0.00 2.2 0.9%
Other destinations, zone 3 0.00 0.00 0.09 0.00 0.12 0.00 0.00 0.00 0.00 0.00 0.2 0.1%
Sub total, Zone 3 1.04 0.00 0.61 0.10 0.24 0.00 0.27 0.12 0.00 0.00 2.4 1.0%
Destinations in Zone 4
Other destinations, zone 4 0.00 0.00 0.00 0.00 0.00 0.00 0.00 0.00 0.00 0.00 0.0 0.0%
Sub total, Zone 4 0.00 0.00 0.00 0.00 0.00 0.00 0.00 0.00 0.00 0.00 0.0 0.0%
Destinations in Zone 5
Knaresborough Town Centre 0.60 0.24 0.37 0.49 2.38 0.55 1.01 0.00 0.16 0.00 5.8 2.5%
St James Retail Park , Knaresborough 0.48 0.54 1.42 0.65 1.82 1.16 0.86 0.00 0.00 0.13 5.8 2.5%
Other destinations, Zone 5 0.00 0.00 0.00 0.00 0.27 0.00 0.00 0.00 0.00 0.00 0.3 0.1%
Sub total, Zone 5 1.08 0.77 1.79 1.14 4.46 1.71 1.87 0.00 0.16 0.13 13.1 5.7%
Destinations in Zone 6
Ripon City Centre 0.81 0.50 0.00 0.09 0.47 4.41 0.00 0.00 0.00 0.42 6.7 2.9%
Other destinations, Zone 6 0.00 0.00 0.00 0.19 0.00 1.62 0.00 0.00 0.00 0.00 1.8 0.8%
Sub total, Zone 6 0.81 0.50 0.00 0.28 0.47 6.04 0.00 0.00 0.00 0.42 8.5 3.7%
Destinations in Zone 7
Wetherby Town Centre 0.00 0.31 0.00 0.35 0.13 0.00 1.66 0.49 0.00 0.00 2.9 1.3%
Other destinations, Zone 7 0.00 0.00 0.00 0.00 0.00 0.00 0.00 0.00 0.00 0.00 0.0 0.0%
Sub total, Zone 7 0.00 0.31 0.00 0.35 0.13 0.00 1.66 0.49 0.00 0.00 2.9 1.3%
Destinations in Zone 8
Guiseley Retail Park, Guiseley 0.00 0.00 0.00 0.60 0.00 0.00 0.00 1.93 1.69 0.00 4.2 1.8%
Otley Town Centre 0.00 0.00 0.00 1.33 0.00 0.00 0.00 1.33 0.83 0.00 3.5 1.5%
Guiseley Town Centre 0.00 0.00 0.00 0.70 0.00 0.00 0.00 1.65 1.44 0.00 3.8 1.7%
Other destinations, Zone 8 0.00 0.00 0.00 0.00 0.00 0.00 0.00 0.00 0.00 0.00 0.0 0.0%
Sub total, Zone 8 0.00 0.00 0.00 2.63 0.00 0.00 0.00 4.91 3.96 0.00 11.5 5.0%
Destinations in Zone 9
Ilkley Town Centre 0.10 0.00 0.00 1.05 0.00 0.37 0.00 1.31 4.55 0.00 7.4 3.2%
Other destinations, Zone 9 0.00 0.00 0.00 0.00 0.00 0.00 0.00 0.00 0.25 0.00 0.2 0.1%
Sub total, Zone 9 0.10 0.00 0.00 1.05 0.00 0.37 0.00 1.31 4.80 0.00 7.6 3.3%
Destinations in Zone 10
Other destinations, Zone 10 0.00 0.00 0.00 0.00 0.00 0.00 0.00 0.00 0.00 0.00 0.0 0.0%
Sub total, Zone 10 0.00 0.00 0.00 0.00 0.00 0.00 0.00 0.00 0.00 0.00 0.0 0.0%
Sub-total for catchment area 17.93 15.30 16.82 14.95 16.10 20.67 9.34 12.92 15.03 2.00 141.1 61.6%
Destinations outside catchment area
Leeds
Leeds City Centre 0.90 1.56 0.63 2.30 0.48 0.50 3.58 10.00 4.82 0.42 25.2 11.0%
Other locations, Leeds 0.14 0.00 0.00 0.48 0.00 0.00 0.26 0.61 0.78 0.13 2.4 1%
Sub-total, Leeds 1.03 1.56 0.63 2.78 0.48 0.50 3.84 10.60 5.60 0.55 27.6 12%
York
York City Centre 0.75 0.68 0.11 0.86 2.63 0.89 3.64 0.21 0.43 5.94 16.1 7%
Monks Cross Retail Park, York 0.11 0.16 0.00 0.17 1.51 0.33 2.09 0.00 0.00 3.61 8.0 3%
Clifton Moor Retail Park, York 0.28 0.85 0.15 0.00 1.05 0.00 0.45 0.00 0.00 1.64 4.4 2%
Other locations, York 0.11 0.00 0.54 0.67 0.84 1.06 1.94 0.51 0.14 0.78 6.6 3%
Sub-total, York 1.26 1.68 0.80 1.70 6.04 2.28 8.12 0.71 0.57 11.98 35.1 15.4%
Skipton
Skipton Town Centre 0.00 0.00 0.09 0.17 0.00 0.00 0.00 0.13 1.51 0.00 1.9 1%
Other locations, Skipton 0.00 0.00 0.00 0.00 0.00 0.00 0.00 0.00 0.16 0.00 0.2 0%
Sub-total, Skipton 0.00 0.00 0.09 0.17 0.00 0.00 0.00 0.13 1.67 0.00 2.1 1%
Northallerton
Northallerton Town Centre 0.00 0.25 0.28 0.00 0.16 0.11 0.00 0.00 0.25 0.88 1.9 1%
Other locations, Northallerton 0.00 0.00 0.00 0.00 0.00 0.00 0.00 0.00 0.00 0.00 0.0 0%
Sub-total, Northallerton 0.00 0.25 0.28 0.00 0.16 0.11 0.00 0.00 0.25 0.88 1.9 1%
Other destinations outside catchment area 0.54 1.00 0.72 1.06 1.57 0.82 1.40 4.58 6.42 3.00 21.1 9%
Sub-total for outside catchment area 2.84 4.49 2.52 5.71 8.25 3.71 13.36 16.02 14.51 16.41 87.8 38%
Overall total 20.78 19.79 19.33 20.66 24.35 24.37 22.70 28.94 29.54 18.41 228.9 100%
Source: NEMS Household Survey market shares, April 2013, Table 5b
Harrogate Catchment

Table 5d — Total Expenditure on Electrical Items and Domestic Items in 2016
Zone 1 Zone 2 Zone 3 Zone 4 Zone 5 Zone 6 Zone 7 Zone 8 Zone 9 Zone 10 Total
All Zones Market Share
£m £m £m £m £m £m £m £m £m £m £m %
Destinations in Zone 1
Harrogate Town Centre 10.8 8.5 7.1 4.2 5.8 5.4 1.5 0.6 0.9 0.5 45.1 20.6%
Asda, Bower Road, Harrogate 0.4 0.6 1.1 0.1 0.0 0.4 0.0 0.0 0.0 0.0 2.7 1%
Other destinations, Zone 1 0.0 0.3 0.4 0.0 0.4 0.0 0.0 0.0 0.0 0.0 1.1 1%
Sub total, Zone 1 11.2 9.4 8.6 4.3 6.2 5.8 1.5 0.6 0.9 0.5 49.0 22%
Destinations in Zone 2
Harrogate Retail Park (Oak Beck Retail Park) 0.41 0.50 0.23 0.25 0.82 0.14 0.21 0.00 0.00 0.00 2.6 1%
Other destinations, zone 2 0.26 0.00 0.00 0.00 0.00 0.00 0.00 0.00 0.00 0.00 0.3 0%
Sub total, Zone 2 0.67 0.50 0.23 0.25 0.82 0.14 0.21 0.00 0.00 0.00 2.8 1%
Destinations in Zone 3
Plumpton Retail Park, Harrogate 0.4 0.5 0.2 0.2 0.8 0.1 0.2 0.0 0.0 0.0 2.6 1%
Other destinations, zone 3 0.3 0.0 0.0 0.0 0.0 0.0 0.0 0.0 0.0 0.0 0.3 0%
Sub total, Zone 3 0.7 0.5 0.2 0.2 0.8 0.1 0.2 0.0 0.0 0.0 2.8 1%
Destinations in Zone 4
Other destinations, zone 4 0.1 0.0 0.0 0.0 0.0 0.0 0.0 0.0 0.0 0.0 0.1 0%
Sub total, Zone 4 0.1 0.0 0.0 0.0 0.0 0.0 0.0 0.0 0.0 0.0 0.1 0%
Destinations in Zone 5
Boroughbridge Town Centre 0.2 0.1 0.1 0.1 2.6 0.3 0.0 0.0 0.0 0.0 3.5 2%
Knaresborough Town Centre 0.0 0.0 0.7 0.1 2.4 0.4 1.1 0.0 0.0 0.1 4.8 2%
St James Retail Park , Knaresborough 0.2 0.5 0.6 0.6 0.7 0.4 1.1 0.3 0.0 0.0 4.4 2%
Other destinations, Zone 5 0.0 0.0 0.0 0.0 0.5 0.2 0.0 0.0 0.0 0.0 0.7 0%
Sub total, Zone 5 0.4 0.6 1.4 0.9 6.2 1.3 2.2 0.3 0.0 0.1 13.3 6%
Destinations in Zone 6
Ripon City Centre 0.2 0.7 0.2 0.0 1.0 12.9 0.0 0.0 0.0 0.8 15.8 7.2%
Other destinations, Zone 6 0.0 0.0 0.0 0.0 0.1 0.7 0.0 0.0 0.0 0.0 0.8 0%
Sub total, Zone 6 0.2 0.7 0.2 0.0 1.1 13.6 0.0 0.0 0.0 0.8 16.6 8%
Destinations in Zone 7
Wetherby Town Centre 0.00 0.60 0.00 0.13 0.28 0.00 2.16 0.00 0.00 0.00 3.2 1%
Morrisons, Horsefair, Wetherby 0.00 0.00 0.00 0.12 0.00 0.00 1.06 0.00 0.00 0.00 1.2 1%
Other destinations, Zone 7 0.00 0.00 0.00 0.00 0.00 0.00 0.21 0.00 0.00 0.00 0.2 0%
Sub total, Zone 7 0.00 0.60 0.00 0.25 0.28 0.00 3.43 0.00 0.00 0.00 4.6 2%
Destinations in Zone 8
Guiseley Retail Park, Guiseley 0.0 0.0 0.0 3.7 0.0 0.0 0.0 12.6 5.3 0.0 21.6 9.9%
Guiseley Town Centre 0.0 0.0 0.0 2.0 0.0 0.0 0.0 6.2 3.9 0.0 12.2 5.6%
Otley Town Centre 0.0 0.0 0.0 1.0 0.0 0.0 0.0 2.0 0.4 0.0 3.4 2%
Other destinations, Zone 8 0.1 0.0 0.0 0.3 0.2 0.0 1.4 0.6 0.0 0.0 2.7 1%
Sub total, Zone 8 0.1 0.0 0.0 7.1 0.2 0.0 1.4 21.5 9.6 0.0 39.9 18%
Destinations in Zone 9
Ilkley Town Centre 0.0 0.0 0.0 0.0 0.0 0.0 0.0 0.8 1.3 0.0 2.1 1%
Other destinations, Zone 9 0.0 0.0 0.0 0.0 0.0 0.0 0.0 0.0 0.9 0.0 0.9 0%
Sub total, Zone 9 0.0 0.0 0.0 0.0 0.0 0.0 0.0 0.8 2.3 0.0 3.0 1%
Destinations in Zone 10
Other destinations, Zone 10 0.0 0.0 0.0 0.0 0.0 0.0 0.0 0.0 0.2 0.6 0.8 0%
Sub total, Zone 10 0.0 0.0 0.0 0.0 0.0 0.0 0.0 0.0 0.2 0.6 0.8 0%
Sub-total for catchment area 18.50 17.92 19.17 17.80 18.62 22.16 11.20 24.08 13.06 2.25 164.8 75.1%
Destinations outside catchment area
Leeds
Leeds City Centre 0.30 0.38 0.24 0.37 0.00 0.27 1.28 2.15 3.18 0.20 8.4 3.8%
Other locations, Leeds 0.00 0.00 0.00 0.12 0.00 0.00 0.00 0.00 0.00 0.00 0.1 0%
Sub-total, Leeds 0.30 0.38 0.24 0.49 0.00 0.27 1.28 2.15 3.18 0.20 8.5 4%
York
Clifton Moor Retail Park, York 0.3 0.6 0.0 0.0 2.4 0.0 3.5 0.0 0.0 7.7 14.6 6.7%
York City Centre 0.0 0.0 0.0 0.0 1.0 0.0 2.1 0.0 0.0 1.4 4.5 2.0%
Tesco Extra, Clifton Moor, York 0.0 0.0 0.0 0.0 0.8 0.0 1.1 0.0 0.0 0.8 2.8 1%
Other locations, York 0.0 0.0 0.0 0.0 0.0 0.0 1.2 0.0 0.0 0.2 1.5 1%
Sub-total, York 0.3 0.6 0.0 0.0 4.2 0.0 8.0 0.0 0.0 10.2 23.4 11%
Skipton
Skipton Town Centre 0.00 0.00 0.00 0.27 0.00 0.00 0.00 0.00 3.17 0.00 3.4 2%
Other locations, Skipton 0.00 0.00 0.00 0.00 0.00 0.00 0.00 0.00 0.24 0.00 0.2 0%
Sub-total, Skipton 0.00 0.00 0.00 0.27 0.00 0.00 0.00 0.00 3.41 0.00 3.7 2%
Northallerton
Northallerton Town Centre 0.00 0.00 0.00 0.00 0.12 0.00 0.00 0.17 0.37 1.08 1.7 1%
Other locations, Northallerton 0.00 0.00 0.00 0.00 0.00 0.00 0.00 0.00 0.00 0.00 0.0 0%
Sub-total, Northallerton 0.00 0.00 0.00 0.00 0.12 0.00 0.00 0.17 0.37 1.08 1.7 1%
Other Towns
Keighley Town Centre 0.00 0.00 0.00 0.47 0.00 0.00 0.00 0.24 2.47 0.00 3.2 1%
Other destinations outside catchment area 1.3 0.5 0.3 1.2 0.4 0.3 1.1 1.6 4.7 2.7 14.1 6%
Sub-total for outside catchment area 2.0 1.5 0.5 2.4 4.8 0.5 10.4 4.2 14.1 14.2 54.6 24.9%
Overall total 20.49 19.42 19.72 20.20 23.39 22.70 21.56 28.23 27.19 16.44 219.3 100%
Source: NEMS Household Survey market shares, September 2013, Table 5b
Harrogate Catchment

Table 6 — Retail planning commitments
Comparison goods planning commitments
Application refGross
Floorspace Net
floorspaceTurnover per
sq.m (2016)Total turnover
(2016)Turnover from
study area
Turnover from study area
(2016)sq.m sq.m £ £m £m
Morrisons, Harrogate Rd, Ripon 11/01947/FULMAJ 651 4,239 2.8 95% 2.6DIY Store, Harrogate Rd, Ripon 11/01974/FULMAJ 4,237 3,601 2,060 7.4 90% 6.7Garden Centre, Harrogate Rd, Ripon 11/01974/FULMAJ 1,035 1,035 1,030 1.1 90% 1.0M&S, 91-97 Leeds Rd, Harrogate 12/00816/FULMAJ 3,017 692 11,839 8.2 95% 7.8Manse Farm, Knaresborough 13/00535/EIAMAJ 2,788 906 6,274 5.7 95% 5.4Aldi, Oakbeck Retail Park, Harrogate 14/00205/DVCON 1,368 210 7,025 1.5 95% 1.4Aldi Stonebridgegate, Ripon 14/00969/FULMAJ 1,536 228 7,025 1.6 95% 1.5
Total 7,323 - 28.2 26.4
Convenience goods planning commitments
Morrisons, Harrogate Rd 11/01947/FULMAJ 710 12,051 8.6 95% 8.1M&S, 91-97 Leeds Rd 12/00816/FULMAJ 3,017 846 9,983 8.4 95% 8.0Manse Farm, Knaresborough 13/00535/EIAMAJ 2,788 692 10,000 6.9 95% 6.6Aldi, Oakbeck Retail Park, Harrogate 14/00205/DVCON 1,368 840 9,089 7.6 95% 7.3Aldi Stonebridgegate, Ripon 14/00969/FULMAJ 1,536 912 9,089 8.3 95% 7.9
Total 4,000 - 39.85 37.9
Source: Floorspace data from Harrogate Borough Council and turnovers calculated on basis of Mintel data and PBA estimates

Table 7 — Comparison goods capacity forecasts for study areaConstant market share
Row 2016 2021 2026 2016-21 2021-26 2016-26Total Retained Expenditure
A Total Population 295,068 300,018 305,135 4,950 5,117 10,067
B Total Expenditure £m 881.88 957.08 1122.92 75.20 165.84 241
C Retained Expenditure % 67.4% 67.4% 67.4%
D Retained Expenditure £m 594.41 645.10 756.88 50.69 111.78 162.47
Turnover of Comparison Stores in OCA Drawn from Catchment AreaE Total Comparison Retail Turnover of Stores in OCA £m 594.41 669.60 721.35 75.19 51.75 126.94
Commitments
F Comparison Retail Commitments £m 10.71 29.70 32.00 18.99 2.30 21.29
G Initial Residual Comparison Retail Expenditure £m -10.71 -54.20 3.54 -43.50 57.74 14.24
Inflow of Expenditure from Outside the Catchment AreaH Inflow (%) 10% 10% 10%
I Inflow £m 59.44 64.51 75.69 5.07 11.18 16.25
SUMMARY
J Initial Residual Comparison Retail Expenditure £m -43.50 57.74 14.24
K Growth in Inflow £m 5.07 11.18 16.25
L FINAL RESIDUAL COMPARISON RETAIL EXPENDITURE £m -38.43 68.92 30.49
Conversion to floorspace requirement
M Turnover per sq m (assumed) 6,759 7,281 -N Floorspace Requirement for study area (sq.m net) -5,685 9,465 3,779O Floorspace Requirement for study area (sq.m gross) -8,122 13,521 5,399
Assumed Sales efficiency growth of 1.5% per annum
Turnover per sq.m at 2016 PBA estimate. Turnover per sq.m increased to 2026 in line with sales effiency growth rates shown above
Total requirement shown is cumulative. Gross: net ratio of 70%
Incremental Growth

Zone 1 Zone 2 Zone 3 Zone 4 Zone 5 Zone 6 Zone 7 Zone 8 Zone 9 Zone 10% % % % % % % % % %
Foodstores in Zone 1Asda, Bower Road, Harrogate 33.5% 34.8% 16.5% 7.5% 3.5% 3.3% 2.6% 0.3% 0.4% 0.0%Harrogate Town Centre 7.5% 4.6% 8.3% 3.1% 0.5% 1.0% 0.6% 0.3% 0.5% 0.0%Waitrose, 92 Station Parade, Harrogate 6.8% 7.9% 4.4% 5.4% 0.3% 1.0% 1.2% 0.3% 0.3% 0.0%Other destinations, Zone 1 5.5% 4.8% 2.3% 3.2% 1.1% 1.2% 1.4% 0.6% 0.2% 0.4%Sub-total, survey zone 1 53.3% 52.1% 31.4% 19.1% 5.5% 6.5% 5.8% 1.5% 1.4% 0.4%
Foodstores in Zone 2Co-operative Food, Jennyfield Drive, Harrogate 1.6% 5.1% 0.6% 0.1% 0.0% 0.0% 0.0% 0.0% 0.0% 0.0%Other destinations, Zone 2 1.8% 3.5% 0.1% 0.0% 0.0% 0.0% 0.0% 0.0% 0.0% 0.0%Sub-total, survey zone 2 3.4% 8.6% 0.8% 0.1% 0.0% 0.0% 0.0% 0.0% 0.0% 0.0%
Foodstores in Zone 3Morrisons, Plumpton Park, Hookstone Chase, Harrogate 20.4% 13.2% 37.8% 7.2% 12.9% 1.8% 0.5% 0.4% 0.0% 0.0%Sainsbury, Wetherby Road, Harrogate 13.2% 14.6% 19.9% 10.6% 13.8% 2.8% 2.5% 4.1% 0.0% 0.0%Other destinations, Zone 3 2.3% 0.3% 8.0% 1.1% 0.0% 0.0% 0.0% 0.0% 0.0% 0.0%Sub-total, survey zone 3 35.9% 28.1% 65.7% 18.9% 26.8% 4.6% 3.0% 4.5% 0.0% 0.0%
Foodstores in Zone 4Sainsbury's Local, 67-71 Cold Bath Road, Harrogate 0.5% 0.0% 0.0% 1.9% 0.0% 0.0% 0.0% 0.0% 0.0% 0.5%Other destinations, Zone 4 1.3% 0.0% 0.1% 2.4% 0.0% 0.0% 0.0% 0.0% 0.0% 0.0%Sub-total, survey zone 4 1.8% 0.0% 0.1% 4.3% 0.0% 0.0% 0.0% 0.0% 0.0% 0.5%
Foodstores in Zone 5Morrisons, Stump Cross, Boroughbridge 0.0% 2.4% 0.0% 0.0% 33.2% 5.1% 0.5% 0.0% 0.0% 14.9%Lidl, York Road, Knaresborough 1.0% 0.1% 0.6% 0.7% 5.9% 0.0% 1.0% 0.0% 0.0% 0.0%Knaresborough Town Centre 0.5% 0.3% 0.4% 0.1% 4.4% 0.0% 0.0% 0.0% 0.0% 0.0%Boroughbridge Town Centre 0.0% 0.0% 0.0% 0.1% 3.4% 0.6% 0.0% 0.0% 0.0% 0.4%Other destinations, Zone 5 1.4% 0.4% 0.1% 0.0% 5.6% 0.0% 0.1% 0.3% 0.0% 0.0%Sub-total, survey zone 5 2.9% 3.1% 1.1% 0.9% 52.5% 5.7% 1.6% 0.3% 0.0% 15.2%
Foodstores in Zone 6Morrisons, Harrogate Road, Ripon 0.0% 6.0% 0.0% 0.0% 0.0% 40.1% 0.0% 0.0% 0.0% 1.0%Sainsbury, 5 Market Place South, Ripon 0.0% 0.0% 0.0% 0.0% 0.4% 18.3% 0.0% 0.0% 0.0% 0.6%Booths, Marshall Way, Ripon 0.0% 0.6% 0.3% 0.0% 0.4% 7.9% 0.0% 0.0% 0.0% 0.6%Ripon City Centre 0.1% 0.4% 0.0% 0.0% 0.2% 5.9% 0.0% 0.0% 0.0% 0.0%Pateley Bridge Town Centre 0.0% 0.0% 0.0% 0.0% 0.0% 4.0% 0.0% 0.0% 0.0% 0.0%Other destinations, Zone 6 0.0% 0.2% 0.0% 0.0% 0.0% 2.3% 0.0% 0.0% 0.0% 0.9%Sub-total, survey zone 6 0.1% 7.2% 0.3% 0.0% 1.0% 78.5% 0.0% 0.0% 0.0% 3.0%
Foodstores in Zone 7Morrisons, Horsefair, Wetherby 0.0% 0.0% 0.0% 6.7% 2.8% 0.3% 42.2% 4.4% 0.0% 0.0%Sainsbury, Mill Lane, Tadcaster 0.0% 0.0% 0.0% 0.0% 0.4% 0.0% 7.3% 0.0% 0.0% 0.0%Wetherby Town Centre 0.0% 0.0% 0.1% 1.1% 0.4% 0.0% 6.8% 0.1% 0.0% 0.0%Sainsbury's Local, 13 Crossley Street, Wetherby 0.0% 0.0% 0.0% 4.7% 1.1% 0.0% 1.6% 0.0% 0.0% 0.0%Other destinations, Zone 7 0.0% 0.0% 0.0% 0.4% 0.3% 0.0% 7.9% 0.4% 0.0% 0.3%Sub-total, survey zone 7 0.0% 0.0% 0.1% 12.9% 5.1% 0.3% 65.8% 5.0% 0.0% 0.3%
Foodstores in Zone 8Morrisons, 89 Otley Road, Guiseley 0.0% 0.0% 0.0% 5.1% 0.0% 0.0% 0.0% 34.0% 6.8% 0.0%Sainsbury, 11 Bondgate, Otley 0.0% 0.0% 0.0% 13.0% 0.0% 0.0% 0.0% 17.7% 5.2% 0.0%Waitrose, 60 Westgate, Otley 0.0% 0.6% 0.0% 12.0% 0.1% 0.0% 0.0% 10.3% 4.2% 0.0%Otley Town Centre 0.0% 0.0% 0.0% 4.8% 0.0% 0.0% 0.0% 5.0% 0.2% 0.0%Other destinations, Zone 8 0.0% 0.0% 0.0% 2.2% 0.0% 0.0% 0.0% 7.5% 3.6% 2.4%Sub-total, survey zone 8 0.0% 0.6% 0.0% 37.2% 0.1% 0.0% 0.0% 74.4% 19.9% 2.4%
Destinations in Zone 9Tesco, Springs Lane, Ilkley 0.0% 0.3% 0.0% 0.7% 0.0% 0.1% 0.0% 0.1% 20.0% 0.0%Booths, Leeds Road, Ilkley 0.0% 0.0% 0.3% 0.0% 0.0% 0.3% 0.0% 0.5% 12.2% 0.0%Ilkley Town Centre 0.2% 0.0% 0.0% 0.0% 0.0% 0.0% 0.0% 0.2% 5.7% 0.0%Other destinations, Zone 9 0.0% 0.0% 0.0% 0.0% 0.0% 0.0% 0.0% 0.1% 7.1% 0.0%Sub-total, Zone 9 0.2% 0.3% 0.3% 0.7% 0.0% 0.4% 0.0% 0.9% 45.0% 0.0%
Destinations in Zone 10Bedale Town Centre 0.0% 0.0% 0.0% 0.0% 0.0% 0.0% 0.0% 0.0% 0.0% 0.9%Other destinations, Zone 10 0.0% 0.0% 0.0% 0.0% 0.1% 0.0% 0.0% 0.0% 0.0% 4.3%Sub-total, Zone 10 0.0% 0.0% 0.0% 0.0% 0.1% 0.0% 0.0% 0.0% 0.0% 5.2%
Overall sub-total for study area 97.6% 100.0% 99.8% 94.1% 91.0% 96.0% 76.2% 86.7% 66.3% 27.1%
Foodstores outside study areaTesco Extra, Clifton Moor, York 0.0% 0.0% 0.0% 0.4% 2.6% 0.3% 6.2% 0.0% 0.0% 29.4%Tesco, Station Road, Thirsk 0.0% 0.0% 0.0% 0.0% 0.0% 1.6% 0.0% 0.0% 0.0% 10.4%Tesco, Craven Street, Skipton 0.0% 0.0% 0.0% 0.0% 0.0% 0.5% 0.0% 0.0% 9.2% 0.0%Easingwold Town Centre 0.0% 0.0% 0.0% 0.0% 0.0% 0.0% 0.0% 0.0% 0.0% 7.8%Morrisons, Broughton Road, Skipton 0.0% 0.0% 0.0% 0.0% 0.0% 0.0% 0.0% 0.2% 7.3% 0.0%Tesco Extra, Tadcaster Road, York 0.0% 0.0% 0.0% 0.1% 0.0% 0.0% 6.1% 0.0% 0.0% 0.7%Keighley Town Centre 0.0% 0.0% 0.0% 0.0% 0.0% 0.0% 0.0% 0.0% 4.4% 0.0%Other foodstores outside study area 2.4% 0.0% 0.2% 5.4% 6.4% 1.6% 11.4% 13.1% 12.8% 24.6%
Overall sub-total for outside study area 2.4% 0.0% 0.2% 5.9% 9.0% 4.0% 23.8% 13.3% 33.7% 72.9%
Total 100.0% 100.0% 100.0% 100.0% 100.0% 100.0% 100.0% 100.0% 100.0% 100.0%
Source: NEMS Household Survey market shares (composite results), September 2013
Table 8a — Convenience goods market shares, 2016
Harrogate Catchment
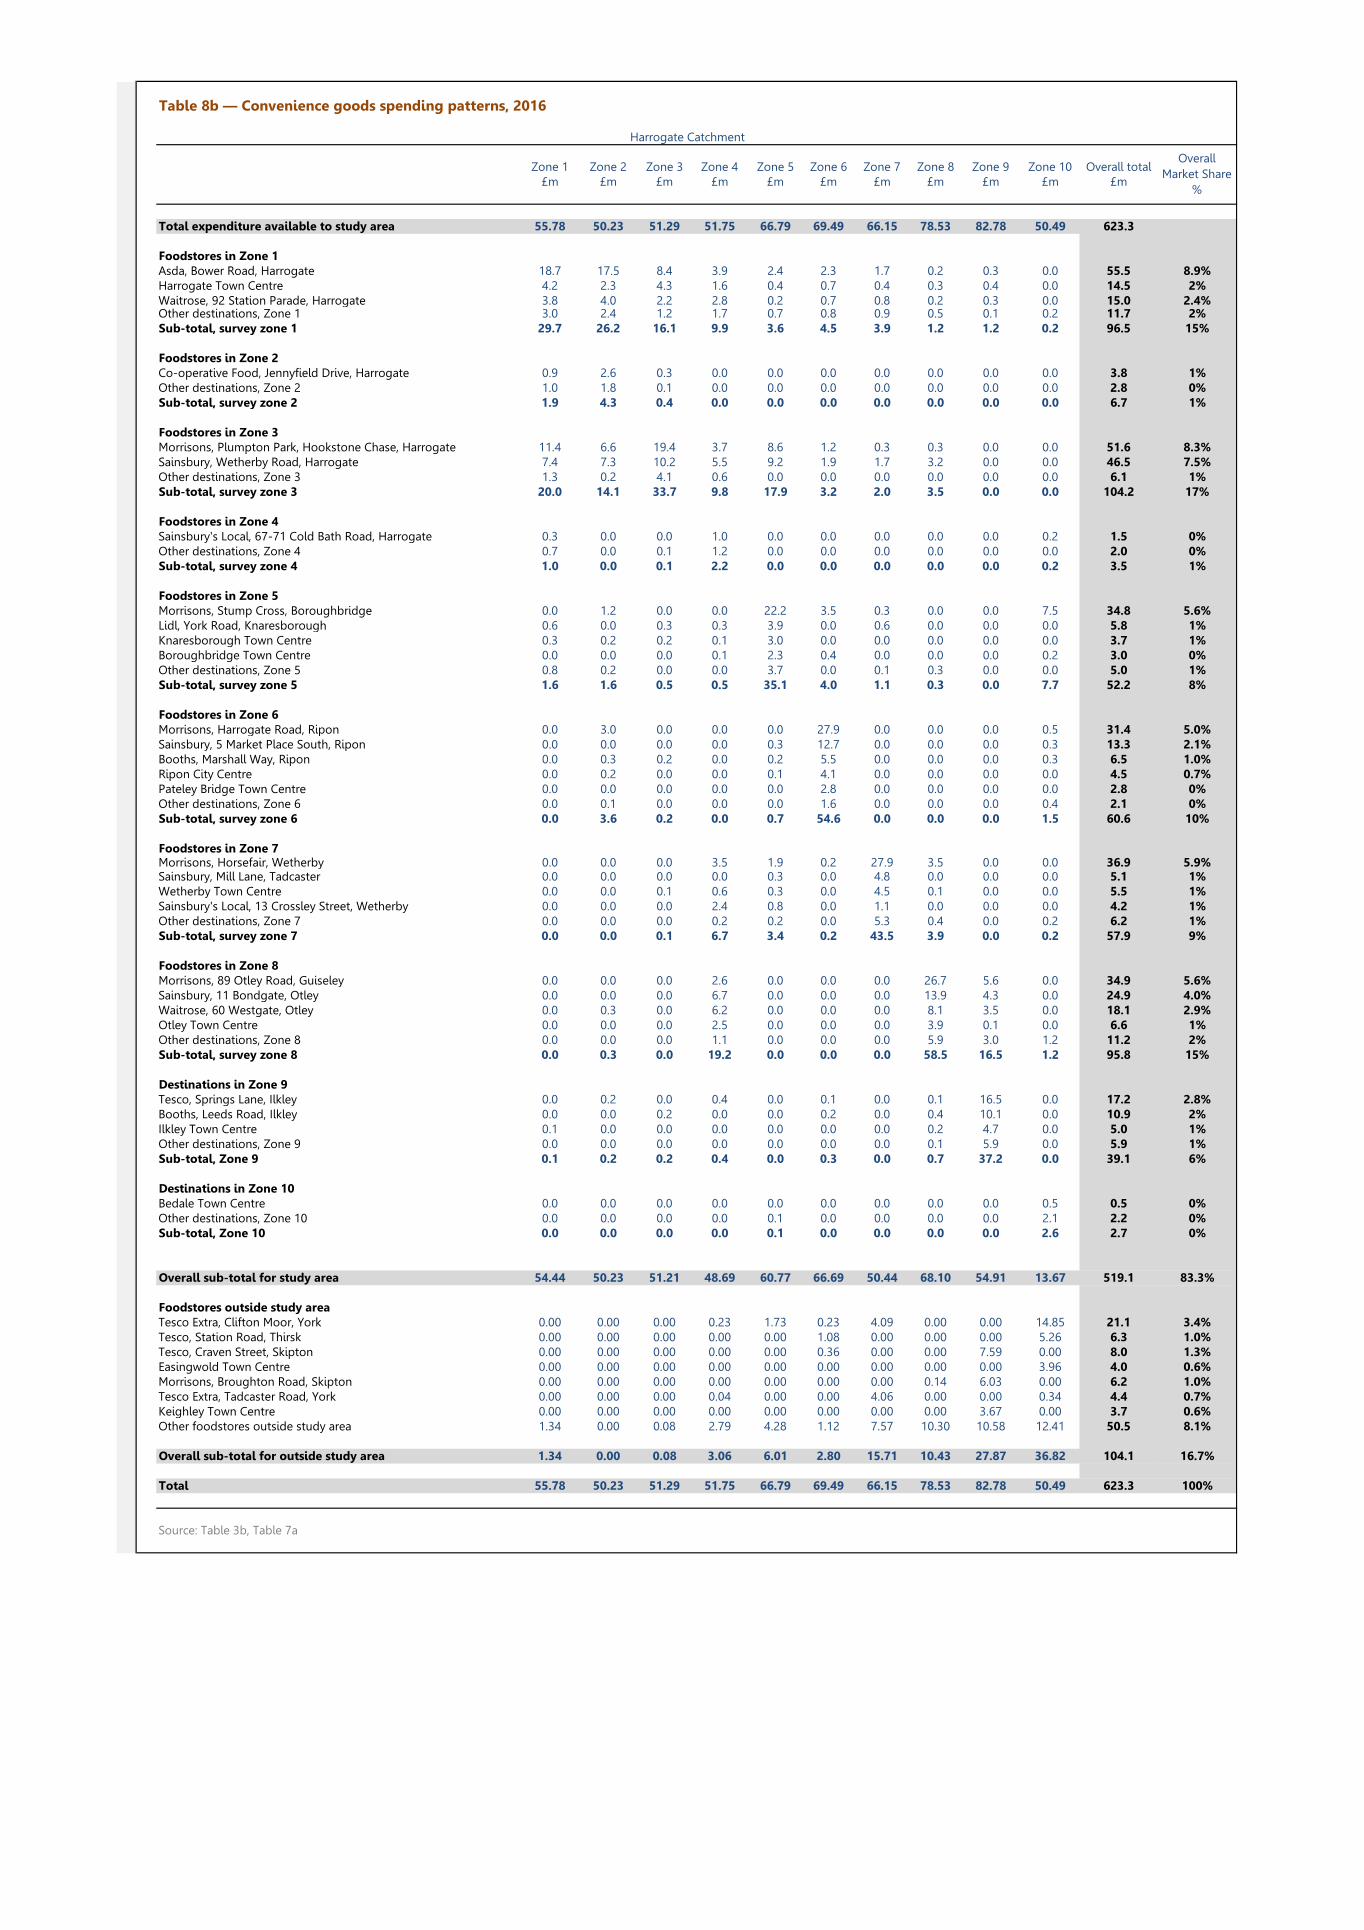
Zone 1 Zone 2 Zone 3 Zone 4 Zone 5 Zone 6 Zone 7 Zone 8 Zone 9 Zone 10 Overall total£m £m £m £m £m £m £m £m £m £m £m
Total expenditure available to study area 55.78 50.23 51.29 51.75 66.79 69.49 66.15 78.53 82.78 50.49 623.3
Foodstores in Zone 1Asda, Bower Road, Harrogate 18.7 17.5 8.4 3.9 2.4 2.3 1.7 0.2 0.3 0.0 55.5 8.9%Harrogate Town Centre 4.2 2.3 4.3 1.6 0.4 0.7 0.4 0.3 0.4 0.0 14.5 2%Waitrose, 92 Station Parade, Harrogate 3.8 4.0 2.2 2.8 0.2 0.7 0.8 0.2 0.3 0.0 15.0 2.4%Other destinations, Zone 1 3.0 2.4 1.2 1.7 0.7 0.8 0.9 0.5 0.1 0.2 11.7 2%Sub-total, survey zone 1 29.7 26.2 16.1 9.9 3.6 4.5 3.9 1.2 1.2 0.2 96.5 15%
Foodstores in Zone 2Co-operative Food, Jennyfield Drive, Harrogate 0.9 2.6 0.3 0.0 0.0 0.0 0.0 0.0 0.0 0.0 3.8 1%Other destinations, Zone 2 1.0 1.8 0.1 0.0 0.0 0.0 0.0 0.0 0.0 0.0 2.8 0%Sub-total, survey zone 2 1.9 4.3 0.4 0.0 0.0 0.0 0.0 0.0 0.0 0.0 6.7 1%
Foodstores in Zone 3Morrisons, Plumpton Park, Hookstone Chase, Harrogate 11.4 6.6 19.4 3.7 8.6 1.2 0.3 0.3 0.0 0.0 51.6 8.3%Sainsbury, Wetherby Road, Harrogate 7.4 7.3 10.2 5.5 9.2 1.9 1.7 3.2 0.0 0.0 46.5 7.5%Other destinations, Zone 3 1.3 0.2 4.1 0.6 0.0 0.0 0.0 0.0 0.0 0.0 6.1 1%Sub-total, survey zone 3 20.0 14.1 33.7 9.8 17.9 3.2 2.0 3.5 0.0 0.0 104.2 17%
Foodstores in Zone 4Sainsbury's Local, 67-71 Cold Bath Road, Harrogate 0.3 0.0 0.0 1.0 0.0 0.0 0.0 0.0 0.0 0.2 1.5 0%Other destinations, Zone 4 0.7 0.0 0.1 1.2 0.0 0.0 0.0 0.0 0.0 0.0 2.0 0%Sub-total, survey zone 4 1.0 0.0 0.1 2.2 0.0 0.0 0.0 0.0 0.0 0.2 3.5 1%
Foodstores in Zone 5Morrisons, Stump Cross, Boroughbridge 0.0 1.2 0.0 0.0 22.2 3.5 0.3 0.0 0.0 7.5 34.8 5.6%Lidl, York Road, Knaresborough 0.6 0.0 0.3 0.3 3.9 0.0 0.6 0.0 0.0 0.0 5.8 1%Knaresborough Town Centre 0.3 0.2 0.2 0.1 3.0 0.0 0.0 0.0 0.0 0.0 3.7 1%Boroughbridge Town Centre 0.0 0.0 0.0 0.1 2.3 0.4 0.0 0.0 0.0 0.2 3.0 0%Other destinations, Zone 5 0.8 0.2 0.0 0.0 3.7 0.0 0.1 0.3 0.0 0.0 5.0 1%Sub-total, survey zone 5 1.6 1.6 0.5 0.5 35.1 4.0 1.1 0.3 0.0 7.7 52.2 8%
Foodstores in Zone 6Morrisons, Harrogate Road, Ripon 0.0 3.0 0.0 0.0 0.0 27.9 0.0 0.0 0.0 0.5 31.4 5.0%Sainsbury, 5 Market Place South, Ripon 0.0 0.0 0.0 0.0 0.3 12.7 0.0 0.0 0.0 0.3 13.3 2.1%Booths, Marshall Way, Ripon 0.0 0.3 0.2 0.0 0.2 5.5 0.0 0.0 0.0 0.3 6.5 1.0%Ripon City Centre 0.0 0.2 0.0 0.0 0.1 4.1 0.0 0.0 0.0 0.0 4.5 0.7%Pateley Bridge Town Centre 0.0 0.0 0.0 0.0 0.0 2.8 0.0 0.0 0.0 0.0 2.8 0%Other destinations, Zone 6 0.0 0.1 0.0 0.0 0.0 1.6 0.0 0.0 0.0 0.4 2.1 0%Sub-total, survey zone 6 0.0 3.6 0.2 0.0 0.7 54.6 0.0 0.0 0.0 1.5 60.6 10%
Foodstores in Zone 7Morrisons, Horsefair, Wetherby 0.0 0.0 0.0 3.5 1.9 0.2 27.9 3.5 0.0 0.0 36.9 5.9%Sainsbury, Mill Lane, Tadcaster 0.0 0.0 0.0 0.0 0.3 0.0 4.8 0.0 0.0 0.0 5.1 1%Wetherby Town Centre 0.0 0.0 0.1 0.6 0.3 0.0 4.5 0.1 0.0 0.0 5.5 1%Sainsbury's Local, 13 Crossley Street, Wetherby 0.0 0.0 0.0 2.4 0.8 0.0 1.1 0.0 0.0 0.0 4.2 1%Other destinations, Zone 7 0.0 0.0 0.0 0.2 0.2 0.0 5.3 0.4 0.0 0.2 6.2 1%Sub-total, survey zone 7 0.0 0.0 0.1 6.7 3.4 0.2 43.5 3.9 0.0 0.2 57.9 9%
Foodstores in Zone 8Morrisons, 89 Otley Road, Guiseley 0.0 0.0 0.0 2.6 0.0 0.0 0.0 26.7 5.6 0.0 34.9 5.6%Sainsbury, 11 Bondgate, Otley 0.0 0.0 0.0 6.7 0.0 0.0 0.0 13.9 4.3 0.0 24.9 4.0%Waitrose, 60 Westgate, Otley 0.0 0.3 0.0 6.2 0.0 0.0 0.0 8.1 3.5 0.0 18.1 2.9%Otley Town Centre 0.0 0.0 0.0 2.5 0.0 0.0 0.0 3.9 0.1 0.0 6.6 1%Other destinations, Zone 8 0.0 0.0 0.0 1.1 0.0 0.0 0.0 5.9 3.0 1.2 11.2 2%Sub-total, survey zone 8 0.0 0.3 0.0 19.2 0.0 0.0 0.0 58.5 16.5 1.2 95.8 15%
Destinations in Zone 9Tesco, Springs Lane, Ilkley 0.0 0.2 0.0 0.4 0.0 0.1 0.0 0.1 16.5 0.0 17.2 2.8%Booths, Leeds Road, Ilkley 0.0 0.0 0.2 0.0 0.0 0.2 0.0 0.4 10.1 0.0 10.9 2%Ilkley Town Centre 0.1 0.0 0.0 0.0 0.0 0.0 0.0 0.2 4.7 0.0 5.0 1%Other destinations, Zone 9 0.0 0.0 0.0 0.0 0.0 0.0 0.0 0.1 5.9 0.0 5.9 1%Sub-total, Zone 9 0.1 0.2 0.2 0.4 0.0 0.3 0.0 0.7 37.2 0.0 39.1 6%
Destinations in Zone 10Bedale Town Centre 0.0 0.0 0.0 0.0 0.0 0.0 0.0 0.0 0.0 0.5 0.5 0%Other destinations, Zone 10 0.0 0.0 0.0 0.0 0.1 0.0 0.0 0.0 0.0 2.1 2.2 0%Sub-total, Zone 10 0.0 0.0 0.0 0.0 0.1 0.0 0.0 0.0 0.0 2.6 2.7 0%
Overall sub-total for study area 54.44 50.23 51.21 48.69 60.77 66.69 50.44 68.10 54.91 13.67 519.1 83.3%
Foodstores outside study areaTesco Extra, Clifton Moor, York 0.00 0.00 0.00 0.23 1.73 0.23 4.09 0.00 0.00 14.85 21.1 3.4%Tesco, Station Road, Thirsk 0.00 0.00 0.00 0.00 0.00 1.08 0.00 0.00 0.00 5.26 6.3 1.0%Tesco, Craven Street, Skipton 0.00 0.00 0.00 0.00 0.00 0.36 0.00 0.00 7.59 0.00 8.0 1.3%Easingwold Town Centre 0.00 0.00 0.00 0.00 0.00 0.00 0.00 0.00 0.00 3.96 4.0 0.6%Morrisons, Broughton Road, Skipton 0.00 0.00 0.00 0.00 0.00 0.00 0.00 0.14 6.03 0.00 6.2 1.0%Tesco Extra, Tadcaster Road, York 0.00 0.00 0.00 0.04 0.00 0.00 4.06 0.00 0.00 0.34 4.4 0.7%Keighley Town Centre 0.00 0.00 0.00 0.00 0.00 0.00 0.00 0.00 3.67 0.00 3.7 0.6%Other foodstores outside study area 1.34 0.00 0.08 2.79 4.28 1.12 7.57 10.30 10.58 12.41 50.5 8.1%
Overall sub-total for outside study area 1.34 0.00 0.08 3.06 6.01 2.80 15.71 10.43 27.87 36.82 104.1 16.7%
Total 55.78 50.23 51.29 51.75 66.79 69.49 66.15 78.53 82.78 50.49 623.3 100%
Source: Table 3b, Table 7a
Table 8b — Convenience goods spending patterns, 2016
Overall Market Share
%
Harrogate Catchment

Table 9 — Conveneince goods capacity forecasts for study areaConstant market share scenario
Row 2016 2021 2026 2016-21 2021-26 2013-26Total population and expenditure
A Total Population 295,068 300,018 305,135 4,950 5,117 10,067
B Total Expenditure £m 623.28 618.44 623.85 -4.84 5.42 0.58
C Retained Expenditure % 83.3% 83.3% 83.3%
D Retained Expenditure £m 519.1 515.1 519.6 -4.03 4.51 0.48
Turnover of Convenience Stores in OCA Drawn from Catchment AreaE Total Convenience Retail Turnover of Stores in OCA £m 519.1 519.1 519.1 0.00 0.00 0.00
Commitments
F Convenience Retail Commitments £m 23.15 37.85 37.85 14.70 0.00 14.70
G Initial Residual Convenience Retail Expenditure £m -23.15 -41.88 -37.37 -18.73 4.51 -14.22
Inflow of Expenditure from Outside the Catchment AreaH Inflow (%) 2.5% 2.5% 2.5%
I Inflow £m 12.98 12.88 12.99 -0.10 0.11 0.01
SUMMARYJ Initial Residual Convenience Retail Expenditure £m -18.73 4.51 -14.22K Grow in Inflow £m -0.10 0.11 0.01L Allowance for current stores over-trading 0.00M FINAL RESIDUAL COMPARISON RETAIL EXPENDITURE £m -18.83 4.62 -14.21
Conversion to floorspace requirementN Turnover per sq m (assumed) 10,000 10,000 -
O Floorspace Requirement for study area (sq.m net) -1,883 462 -1,421
P Floorspace Requirement for study area (sq.m gross) -2,897 711 -2,186
Sales efficiency growth of 0% per annum to 2026.
Turnover per sq.m at 2016 PBA estimate.
Gross: net floorspace ratio: 65%
Incremental Growth
Related Documents


![From: John Hopkins [mailto:JHopkins@peterbrett.com] … · Peter Brett Associates LLP is a limited liability partnership registered in England and Wales.](https://static.cupdf.com/doc/110x72/5ac3d1647f8b9af91c8c75d5/from-john-hopkins-mailtojhopkins-brett-associates-llp-is-a-limited-liability.jpg)
