Retail Monitor

Welcome message from author
This document is posted to help you gain knowledge. Please leave a comment to let me know what you think about it! Share it to your friends and learn new things together.
Transcript

1 March 2015 — Retail Monitor
Retail Monitor

1 March 2015 — Retail Monitor
Overview
Year-over-year retail sales increased in every month of 2014, according to the National Retail
Federation (“NRF”), culminating with a positive holiday season. However, some sectors
outperformed others during the season, and store closures will be seen for many in 2015.
In recent months, e-commerce sales have continued their upward
trajectory, with online sales one of the clear winners of the holiday
season. In addition, the off-price sector continues to perform well, as
consumers remain price conscious. However, the retail sector has
seen a decline in mall traffic over the course of the past year, and the
specialty apparel sector, particularly women’s and teen retailers, have
felt the brunt of the decline. Wet Seal, Mexx, Deb Shops, Delia’s, and
Cache are just some of the names that have filed for bankruptcy
recently, and subsequently will be closing all or some of their stores.
Other companies announcing plans for reducing their store count this
year include RadioShack, Office Depot, Staples, Barnes & Noble, JC
Penney, and Abercrombie & Fitch, among others.
While e-commerce has changed how consumers shop, there has also
been a gradual shift throughout the past few years in the types of
places where consumers choose to shop. There has been steady
growth of outdoor lifestyle centers, with many specialty retailers
moving out of indoor malls to prime locations within these centers.
While still representing far less retail space than indoor malls, these
have increased in popularity as they often include restaurants and
other entertainment to draw customers in, which is key in a time
when traffic has been on the decline. This is bad news for department
stores, which are often the anchor stores of indoor malls.
In addition to weak mall traffic and store closures, the retail sector has
also faced uncertainty surrounding inventory receipts in recent
months, due to issues with the west coast port. Throughout much of
last year through the beginning of 2015, the Pacific Maritime
Association and the International Longshore and Warehouse Union
were unable to come to terms on a new contract. Slowdowns ensued,
and several major retailers reported having massive shipments stuck
at the ports, especially as shippers sporadically shut down operations
to avoid major labor costs. After a shutdown during Presidents’ Day
weekend, as well as a culmination of other delays, a tentative
agreement was reached. As a result, the west coasts ports were in full
operation on February 21, 2015 for the first time since last summer.
Another issue that continues to face retailers is security. Following
many high-profile, wide-ranging data breaches at many retailers,
there has been a call for the U.S. to transition from magnetic strip
credit cards to those with computer chips and a personal
identification number (“PIN”), with a deadline of October 2015 set for
this technology to be implemented. While some retailers have been
getting ahead on this push, others are not entirely prepared. The
additional expense of the new technology needed to read these cards
could impact some. Despite all of these issues, retail sales during the
end of 2014 and the beginning of 2015 have continued to show year-
over-year increases. Lower gas prices, particularly in the fourth
quarter, provided consumers with extra money to spend.
The following table illustrates year-over-year retail sales trends for the
12 months ended February 2015, as reported by the NRF:
Source: NRF
The NRF expects the positive trends to continue throughout the
remainder of the year. As the economic momentum from the second
half of 2014 carries into this year, growth in the GDP, as well as the
housing and labor markets, will help propel retail sales. Additionally,
continued improvements in unemployment rates and wage levels will
provide a boost to consumer confidence. Overall, the NRF forecasts
year-over-year growth of 4.1% in 2015, including e-commerce gains of
up to 10%. On the other hand, retailers may see an increase in payroll
expenses if they choose to increase minimum wages. Already in 2015,
two major retailers, Wal-Mart and TJX, have announced plans to
increase minimum hourly wages to $9 per hour over the next couple
of months, and reach $10 per hour by 2016. Others may follow suit.

2 March 2015 — Retail Monitor
Department Stores
Off-price counterparts: Within the luxury sector, off-price counterparts such as
Saks Off 5th and Nordstrom Rack have thrived. Recognizing the strength of the
off-price concept, Macy’s recently announced plans to expand into this arena,
reportedly planning to open a chain that would compete with the likes of TJ
Maxx and Marshalls, as opposed to Nordstrom Rack, the latter of which already
vies for traffic against Macy’s Inc.-owned Bloomingdales outlets.
Omni-channel: Department stores aim to allow customers to shop via the most
convenient method possible, through an omni-channel presence. Strong digital
platforms remain key to capturing tech-savvy Millennials. Customers can shop
online, and pick up items in stores, or return items bought on a website at a
store location. Department stores also market to customers through a variety of
methods, including email, social media, and targeted promotions sent to mobile
devices. Recently, JC Penney announced it would be bringing back catalogs,
which will be used to drive increased traffic to its website and stores. Some
retailers have also reorganized operating structures to bring merchants and
marketing staff for e-commerce and stores under the same umbrella.
The table below illustrates comparable store sales trends for major public
department stores (Represents the most recent fiscal quarter sales reported):
In 2015, e-commerce and off-price will continue to drive sales of department stores,
which will aim to offer trend-right product at attractive price points. Some will
reduce their store count, while others may expand into new markets, like Canada.
NOLVs: NOLVs have ranged from
relatively consistent to trending up to
1.0 percentage point, driven by
positive sales trends.
Sales Trends: Most department store
retailers reported positive sales
during the holiday season, with
varying categories proving strong for
each. Some reported that sales were
driven by e-commerce, while others
pointed to women’s apparel, men’s
apparel, and home. However, there
are some outliers, as Sears continues
to struggle.
Gross Margin and Discounting:
Gross margin has been relatively
consistent; however, discounting has
been mixed. Companies have been
increasing discounting when needed
to drive sales, while managing
margin through factors such as
markup and vendor allowances.
Department store retailers continue to perform well overall, as most reported positive comparable store sales during the
holiday season. Sales growth continues to be driven through multi-channel retailing, with many reporting strong e-
commerce growth, as mall traffic continues to be on the decline. Department store retailers have also been right-sizing their
businesses, with many closing underperforming stores as leases expire. Department stores have been working to get the
right mix of product in their stores, and have capitalized on departments that have performed well. For example, Macy’s
has had success in many categories online, while Nordstrom has had strong cosmetics, men’s apparel, and accessories sales.
Ladies’ apparel and shoes trended well at Dillards, while Kohl’s continues to focus on its beauty category, expanding its
offering of several brands. Private label and exclusive brands also remain a focal point in the apparel categories for many.
Neiman Marcus 5.6% 5.5% 4.9% 5.9%
Saks 1.0% 2.2% 2.6% N/A
Saks Off 5th 19.2% 14.9% 15.1% N/A
Hudson’s Bay/Lord & Taylor 1.7% 1.1% 2.5% (1.3%)
Nordstrom 4.5% 3.4% 2.7% 3.3%
Nordstrom Rack 3.2% 1.7% 4.0% 6.4%
Macy’s 2.0% (1.4%) 3.4% (1.6%)
Dillard’s 3.0% (1.0%) 1.0% 2.0%
J.C. Penney 4.4% 0.0% 6.0% 7.4%
Kohl’s 3.9% (1.8%) (1.3%) (3.4%)
Sears (7.0%) (0.7%) 0.1% 0.2%
Note(s): The most recent quarter reported for Saks and Hudson Bay/Lord &Taylor ended November 1, 2014; all other com-
panies ended January 31, 2015. Hudson’s Bay Company reports collective consolidated same store sales for Hudson’s Bay
and Lord & Taylor stores for the most recent three quarters; prior includes Lord & Taylor only. Some retailers report re-
sults including e-commerce sales.

3 March 2015 — Retail Monitor
Specialty Apparel Stores
Bankruptcies and store closures: There has been a spate of bankruptcies and
liquidations in the past several months, including Dots (359 stores) in early
2014, and Delia’s (92 stores), Wet Seal (340 stores), Body Central (265 stores),
Deb Shops (300 stores), and Canadian-based Mexx (95 stores) in late 2014 and
early 2015. While some have gone out of business entirely, others are
restructuring. Wet Seal was recently acquired by an affiliate of Versa Capital
Management. Some specialty retailers have closed underperforming stores to
right-size the business. Aéropostale is closing over 100 of its P.S. stores,
closed 75 Aéropostale stores in 2014, and may close up to 75 more in 2015.
Gap is exiting its Piperlime brand, and Abercrombie exited its Gilly Hicks
brand. Given all of the recent activity within this sector, GA’s liquidation
division has been actively involved with the bidding processes and
liquidations. Most recently, GA has been involved in the bidding and
auctions for several retailers, as well as store closures for Cache, Delia’s,
Naartjie Kids, Frederick’s of Hollywood, and several others, after being
involved in closures of Love Culture and Fashion Bug last year.
Declining mall traffic/e-commerce growth: The general decline in mall
traffic continues to impact sales at specialty retailers. Specialty apparel
retailers have worked to offset declines in brick-and-mortar locations by
offering a wide assortment of products on their e-commerce websites, as well
as incorporating social media tools, and enhancing their omni-channel
presence. In addition, retailers have worked to leverage store locations, such
as by offering site-to-store shipping.
Competition/promotional activity: Due to extremely high competition in the
marketplace, specialty apparel retailers continue to be hyper-promotional to
lure in customers who have been conditioned to expect constant and deep
promotions. This has impacted profitability. Others have tried to change
their pricing strategies in order to drive sales, such as by offering more
targeted promotions on certain items.
Going forward, specialty apparel retailers will continue to work to best identify
with customers, particularly as they face the impact of continued softness in mall
traffic. Offering trend-right product and remaining competitive will be key to
driving sales. Retailers that are unable to establish a strong e-commerce presence
and compete within this sector will likely struggle.
The specialty retail sector has been negatively impacted by the decline in mall traffic, in part due to increased e-commerce
spending. As a result, this sector has seen a market correction, with many companies closing all or part of their store base.
Fashion trends, particularly teen fashion, have changed over the past several years away from major brands to fast-fashion
retailers. Sales of logo-centric brands have suffered as teens and young adults prefer to personalize fashion with a variety
of branded and non-branded apparel and accessories.
NOLVs: For Teen and Kid retailers,
NOLVs have decreased for some
companies due to lower margins and
decreased sales, but have increased
for other companies as lower
recovering divisions are closed and
inventory is better managed.
For Women’s and Men’s retailers,
some NOLVs have increased as a
result of gross margin improvements,
while some have decreased due to a
decline in sales.
Sales Trends: Most companies have
negative sales trends over the last 12
months due to declines in customer
traffic; however, some companies
experienced gains during the holiday
period.
Gross Margin and Discounting:
Gross margin decreased due to
promotional pricing to sell through
slow-moving inventory. However,
margins have improved for some
retailers in recent months as
companies begin to better manage
their inventory levels and improve
promotional strategies.

4 March 2015 — Retail Monitor
Specialty Apparel Stores
The following tables illustrate comparable store sales trends for major public specialty apparel retailers
(Represents the most recent fiscal quarter reported):
Family Specialty Apparel
J. Crew 4.0% (1.0%) 5.0% 4.0%
Banana Republic 2.0% (2.0%) 0.0% (1.0%)
Gap (6.0%) (5.0%) (5.0%) (5.0%)
Old Navy 11.0% 0.0% 4.0% 1.0%
Women’s Specialty Apparel
White House/Black Market 5.4% (1.4%) 1.4% 0.4%
Chicos 1.2% (1.6%) (1.9%) (8.6%)
Christopher & Banks (7.6%) 2.6% (0.2%) (1.4%)
Ann Taylor 1.0% (4.3%) (2.3%) (1.8%)
New York & Co. (3.4%) 2.3% (2.2%) 3.0%
Victoria’s Secret 4.0% 3.0% 3.0% 2.0%
Men’s Specialty Apparel
Men’s Wearhouse 6.8% 2.2% 4.4% 2.9%
Jos A. Bank (6.6%) (8.1%) 1.0% 8.4%
Teen Specialty Apparel
Abercrombie & Fitch (10.0%) (10.0%) (5.0%) (4.0%)
Aeropostale (9.0%) (11.0%) (13.0%) (13.0%)
American Eagle 0.0% (5.0%) (7.0%) (10.0%)
Wet Seal (14.5%) (12.4%) (16.9%) (16.5%)
The Buckle 1.1% (0.3%) (0.5%) (0.9%)
Zumiez 8.3% 3.7% 3.4% 1.8%
Children’s Specialty Apparel
The Children’s Place 3.7% 0.2% 0.8% (3.6%)
Gymboree 1.0% (10.0%) (10.0%) (9.0%)
Carters Retail (0.1%) (1.4%) (0.9%) (4.7%)
OshKosh B’gosh Retail 4.0% 3.0% 5.0% 3.0%
Note(s): The most recent quarter reported for Wet Seal, Christopher & Banks, New York & Co., J. Crew, and Gymboree ended November 1, 2014; Carter’s and
OshKosh ended January 3, 2015; all other companies ended January 31, 2015.
5 March 2015 — Retail Monitor
Off-Price/Dollar Stores/Mass Merchants
NOLVs: NOLVs have been generally
increasing by 0.5 to 1.5 percentage
points, due to gross margin
improvements, higher sales, reduced
expenses, and better inventory
management.
Sales Trends: Most companies
within this sector have experienced
positive sales results, particularly
during the holiday season.
Gross Margin and Discounting:
Gross margin has either remained
consistent, or has declined slightly
due to the merchandise mix, or
increased discounting and
promotional activity. Some retailers
have tried to reduce promotions,
while others have had to increase
discounts to remain competitive,
drive sales, or sell through slower-
moving goods.
Canadian market: Expansion into the Canadian market had been a focus in this
sector, and some retailers, such as Wal-Mart and Dollar Tree, have experienced
positive results via their Canadian presence. On the other hand, Target’s foray
into Canada was disappointing, largely due to merchandising and pricing issues,
and it has ultimately decided to exit this region. GA is currently managing a
portion of these store closures.
Payroll expenses: Within this sector, several companies could see increases in
payroll expenses in the coming years. In 2015, two major retailers, Wal-Mart and
TJX, have announced plans to increase minimum hourly wages to $9 per hour
over the next couple of months, and reach $10 per hour by 2016, and others may
follow suit. These retailers have realized that they need to invest in their
workers in order to retain their employees. The benefit of increasing the
minimum wage often outweighs the cost associated with having to perpetually
hire and train new associates due to high turnover.
E-commerce: E-commerce has been a point of expansion within the off-price and
mass merchant sector. TJX continues to expand its online offerings, and Target is
focused on online and mobile shoppers, which it views as particularly lucrative.
Store formats: Small-format stores continue to be a major trend within the
discount marketplace, particularly for big-box retailers Wal-Mart and Target.
Target in particular has been focusing on its smaller-format Express stores by
optimizing merchandise selections and localizing assortments.
The following table illustrates comparable store sales trends for major discount and
dollar store retailers (Represents the most recent fiscal quarter sales reported):
Off-price retailers are expected to continue to perform well, but competition may
increase, as Macy’s is reportedly starting an off-price banner to compete with TJX.
TJX 4.0% 2.0% 3.0% 1.0%
Ross Stores 6.0% 4.0% 2.0% 1.0%
Burlington Coat Factory 5.2% 4.7% 2.7% (9.2%)
Stein Mart 5.6% 3.1% 1.3% 2.6%
Wal–Mart 1.6% 0.5% 0.0% (0.2%)
Target 3.8% 1.2% 0.0% (0.3%)
K-Mart (2.0%) 0.5% (1.7%) (2.2%)
Costco 8.0% 7.0% 6.0% 6.0%
Dollar General 4.9% 2.8% 2.1% 1.5%
Family Dollar (0.4%) 0.3% (1.8%) (3.8%)
Dollar Tree 5.6% 5.9% 4.5% 2.0%
Note(s): The most recent quarter reported for TJX, Ross Stores, Target, K-Mart, Stein Mart, and Dollar Tree ended January
31, 2015; Burlington Coat Factory ended November 1, 2014; Wal-Mart ended January 30, 2015 and excludes fuel; Dollar
General ended January 30, 2015; Family Dollar ended November 29, 2014; Costco ended February 15, 2015 and excludes fuel.
Most discount retailers experienced positive sales during the 2014 holiday season, particularly as consumers remain
price-conscious despite an improving economy. Lower fuel prices also boosted sales at discount retailers, as custom-
ers had more discretionary dollars. However, similar to the prior year, sales gains were at the expense of heightened
promotional activity in order to boost customer traffic. Off-price retailers performed very well throughout 2014.
Sales have continued to trend positively, as consumers that have the discretionary funds prefer to shop at off-price
retailers, such as TJX and Ross Stores, rather than at lower-tier department stores, specialty stores, or mass merchants.
6 March 2015 — Retail Monitor
E-Commerce
E-commerce has steadily increased as a percentage of total retail sales over the past few years, particularly as retailers in vir-
tually all sectors strive to offer an omni-channel presence. Mobile shopping via cell phones and tablets also remains popular.
The National Retail Federation reports that during the holiday season, e-commerce sales increased significantly over the pri-
or year, surpassing $100 billion. While e-commerce growth can positively impact total sales for retailers, it has caused issues
in certain sectors. As consumers more frequently shop online, mall traffic has seen a substantial decline over the past few
years, leading to a rash of store closures in certain sectors, as companies right-size their business.
NOLVs: NOLVs have generally been
increasing for multi-channel retailers
appraised by GA, based on recent
experience. In addition, depending
on the amount of sales a company
generates via e-commerce, GA has
been adding an e-commerce sale to
its liquidation strategy, which can
increase values by 1.0 to 3.0
percentage points, depending on the
penetration of e-commerce sales, as
well as the associated expenses.
Sales Trends: Overall, e-commerce
sales trends have been increasing,
particularly in the direct segment of
multi-channel retailers, driven by a
continued focus on omni-channel
efforts. In some cases, however, this
has resulted in a decline in, or
relatively flat, brick-and-mortar sales.
Gross Margin and Discounting:
Many companies have experienced
declines in gross margin, as the
industry is highly competitive and
companies have tested different
pricing strategies. Discounting
continues to be an important tool to
drive sales, as is free shipping.
Multi-channel: Retailers continue to leverage multi-channel business models,
offering customers the convenience of ordering online, and then picking up the
order at a store location. In addition, many retailers have developed the ability
to fulfill online orders from store inventory in addition to distribution centers,
and many allow customers to return purchases made online to store locations.
Highlighting the importance of having such options for customers, online-giant
Amazon opened some popup locations during the holiday season, as well as its
first pickup/drop-off location on a college campus in February 2015.
Marketplace sales: Marketplace sales, whereby a company will offer a product
on its website, which will then be fulfilled by another company, continue to
expand. Through marketplace sales, retailers generate increased sales by
offering a wider variety of merchandise, while avoiding the risk associated with
a higher inventory position. Some wholesalers of consumer products have also
taken the reverse tactic, by either offering their product for sale on Amazon’s
marketplace and fulfilling from their warehouses, or becoming involved with
Amazon’s Fulfillment by Amazon (“FBA”) program. The FBA program allows
companies to store product within Amazon’s facilities, and once sold, Amazon
ships directly to customers. The FBA program allows companies’ inventory to
be eligible for free two-day shipping to Amazon’s Prime members.
Pricing: Companies continue to test different pricing strategies in order to
drive sales. Examples include offering limited-time sales events, as well as free
shipping. During the holiday season, free shipping was commonly used to
drive sales at retailers such as Target. Target also recently reduced its free-
shipping order minimum requirements to $25.
The following table illustrates e-commerce sales as a percentage of total retail sales,
as well as the year-over-year change in e-commerce sales dollars, as reported by The
U.S. Commerce Department:
Competition will remain fierce in the e-commerce sector throughout 2015, with
companies looking to compete with Amazon’s Prime option. For example, Google
Express recently began testing same-day delivery services for a variety of stores in
certain markets. Overall, the NRF forecasts year-over-year e-commerce gains of up
to 10% in 2015.
% of Retail Sales 6.7% 6.6% 6.4% 6.2%
Change Year Over Year 14.6% 15.8% 15.8% 15.5%
Source: www.census.gov/retail. Results are revised estimates, as outlined in the most recent press release for the fourth
quarter of 2014.
7 March 2015 — Retail Monitor
Jewelry
Rapaport reports that jewelry industry sales reached $69.2 billion in 2014, which is a slight decline compared to the prior
year. However, many major retailers have reported sales increases.
NOLVs: NOLVs have been
consistent.
Sales Trends: Sales have been
relatively positive throughout the
industry, with some companies
experiencing somewhat weaker
holiday sales.
Gross Margin: Gross margin has
been relatively consistent, with some
companies increasing due to the
positive impact of lower commodity
prices, as well as the popularity of
higher-margin fashion jewelry.
Discounting: Discounting has
decreased. Although some
discounting is used in-store,
promotions are not being heavily
advertised and the overall
promotional message is muted.
Mid-tier versus high-end: Mid-tier jewelry stores such as Zale, Kay, and Jared
continue to outperform higher-end stores. Tiffany & Co., which experienced a
successful first half driven by the strength of its new Tiffany “T” line, reported a
1% decrease in comparable store sales in the Americas for November/
December. Signet’s Sterling division, which includes Kay and Jared, reported a
comparable store sales increase of 2.5% for the eight weeks ended December 27,
2014, with comparable store sales for the newly integrated Zale division up
3.5%. Zale had reported sales declines just after the acquisition, but recent
investments in merchandising, advertising, and in-store initiatives have paid
off.
Pricing: After surging to record highs during the recession, the price of gold
reached a four-year low in October 2014 and is currently hovering at $1,200 per
ounce. Diamond prices are also down, falling 6.9% in the fourth quarter of
2014. This is partially due to the closure of Antwerp Diamond Bank, which was
a major financier to diamond traders and resulted in liquidity issues. Although
acquisition costs have fallen, retailers have maintained their current prices in
order to boost margin. Those retailers with faster-moving inventory stand to
benefit; however, as some jewelry retailers have an average inventory turnover
rate of once per year, they are not as well-poised to benefit from the declining
acquisition costs right away.
Product trends: Retailers continue to use proprietary and exclusive brands to
differentiate themselves. In recent months, sales have been driven by bridal
jewelry, colored stones, and fashion jewelry. While sales of men’s luxury
watches and women’s fashion watches have faired relatively well, future sales
of watches could be threatened by “smart” watches.
The following table illustrates comparable store sales trends for major public
jewelry retailers (Represents the most recent fiscal quarter sales reported):
The jewelry industry is expected to perform well over the next several months as
the economy improves and declining gas prices result in higher disposable income.
Falling commodity costs should also translate to higher margin.
Note(s): The most recent quarter for Sterling and Zale ended November 1, 2014. Sterling and Zale are
both part of Signet Jewelers, which acquired Zale in May 2014. Zale excludes Piercing Pagoda; Tiffany &
Co. most recent quarter represents holiday sales from November and December 2014; Blue Nile ended
January 4, 2015 and represents net sales.
Sterling 6.8% 6.7% 3.2% 4.0%
Zale US (0.7%) (1.3%) N/A N/A
Tiffany & Co. (1.0%) 11% 8.0% 8.0%
Blue Nile 7.9% 6.9% (1.3%) 6.8%
Gold $1,212 (10.6%)
Silver $16.43 (23.5%)
Platinum $1,191 (17.8%)
Note(s): Prices are as of March 3, 2015.

8 March 2015 — Retail Monitor
Footwear
Footwear retailers have generally reported positive sales results recently, with boots in particular driving sales. During
November and December, during the peak holiday period, footwear sales benefited from weather throughout many areas
in the country, which, while seasonal, was not so cold as to keep customers out of the stores. In February 2015, representa-
tives from GA attended the MAGIC trade show, which occurs twice per year in Las Vegas, Nevada. The trade show fea-
tures a vast array of footwear, apparel, and accessories for men, women, and children. At this show, GA observed popular
trends in footwear, which will likely be seen throughout 2015. Some of these trends are further detailed below.
Key categories: Footwear retailers have been working to carry the most in-demand brands, categories, and footwear trends. Ankle boots and boots with
embellished heels have been popular. In addition, in the northeast, winter boots sold well, even before the cold and snowy weather set in. During the
holiday season, it was reported that L.L. Bean’s leather and rubber winter boot, which was in vogue with many college students this year, was sold out and backordered for months. Other categories performing well include
vulcanized sneakers, such as Converse and Vans, which continue to sell well. Athletic sneakers also continue to perform well, particularly Jordan’s and low
-top basketball sneakers. Vintage styles have also been celebrated. Several major athletic footwear brands are bringing back reinvigorated styles from years ago.
E-commerce: Footwear retailers continue to develop an omni-channel presence. The transition toward online shopping has been less prevalent in
footwear than in other sectors, as many consumers prefer to try on shoes before purchasing. As such, some retailers, like DSW, have been leveraging multi-channel capabilities, offering to order a size, color, or style of a shoe
unavailable in a store for customers, and have it sent to their home through its e-commerce division. Major players in the industry continue to strengthen
mobile platforms and expand e-commerce to compete with online retailers such as Zappos.com and Amazon.com.
The following table illustrates comparable store sales trends for major footwear
retailers (Represents the most recent fiscal quarter sales reported):
Following weeks of cold and snowy weather in the northeast in particular, many
consumers are likely looking forward to warmer spring temperatures, which
could spark sales of sandals and other seasonally-appropriate footwear. Athletic
footwear will likely remain popular in 2015, as the athleisure style and fitness
awareness continues to grow.
NOLVs: NOLVs have generally been
increasing by up to 1.0 percentage
point due to increases in sales.
However, some wholesalers have
experienced decreases of 1.5
percentage points or more, due to
declines in gross margin.
Sales Trends: Sales trends within the
industry have generally increased;
however, performance has varied by
category.
Gross Margin and Discounting:
Many companies have had to
increase discounting to drive sales;
however, some have managed to
offset margin erosion through the
sale of higher-margin products,
higher average prices, and an
increase in sales through e-commerce
versus lower-margin channels.
DSW 2.6% 0.8% (3.7%) 0.0%
Johnston & Murphy 2.0% 0.0% 2.0% (1.0%)
Foot Locker 10.2% 6.9% 7.0% 7.6%
Finish Line 4.5% 1.5% 5.0% 6.3%
Famous Footwear 4.0% (0.2%) 1.6% 1.3%
Journeys 16.0% 6.0% 5.0% 1.0%
Crocs (Americas) (3.3%) (3.1%) (6.2%) (5.0%)
Note(s): The most recent quarter for Foot Locker, Famous Footwear, Journeys, and Johnston & Murphy ended January 31,
2015; DSW ended November 1, 2014; Finish Line ended November 29, 2014; Crocs ended December 31, 2014.

9 March 2015 — Retail Monitor
Sporting Goods
E-commerce: Within the sporting goods industry, e-commerce is evolving.
Several major retailers report that e-commerce continued to grow as a
percentage of total sales during 2014. Dick’s announced a positive quarter
recently, driven mainly by strong e-commerce sales. Conversely, others
reported less positive results from their online channel. Cabela’s, for
example, noted that revenue derived online in its most recent quarter was
down due to its improved in-stock position of ammunition and related items
in stores, which reduced the need for customers to go online for these items.
Firearms and ammunition: Over the past six months, sales of firearms and
ammunition have returned to more normalized levels, following significant
increases in 2012, and a subsequent slowdown. While some retailers have
reported weakness in categories such as hunting, overall, demand for
firearms has returned to more normalized levels.
Apparel: Sales of licensed sporting apparel related to the NFL, NBA, and
MLB have been trending well, as customers support their favorite teams and
players. However, traditional sporting goods retailers face a lot of external
competition within this arena. In addition, one of the biggest trends in 2014
that has shown no signs of slowing in 2015 has been “athleisure,” whereby
clothing is designed to transition from workouts to everyday life, as it is both
comfortable and fashionable. This sector has long been dominated by big
names such as Under Armour, Lululemon, and Athleta; however, it has
recently seen an influx of lines that are celebrity-endorsed, such as Kate
Hudson’s Fabletics line, and the recently announced CALIA line by Carrie
Underwood, which will be available at Dick’s.
The following table illustrates comparable store sales trends for major public
sporting good retailers (Represents the most recent fiscal quarter sales reported):
There have been some transactions within the sector, with Sport Chalet acquired
by Versa, which already owns Bob’s Stores and Eastern Mountain Sports. It was
also rumored that Dick’s would be taken private; however, that did not come to
fruition. Going forward, further activity could be seen, as Sports Authority has
reportedly had debt issues, which could result in future liquidity issues.
NOLVs: NOLVs are mixed, with
some remaining consistent to slightly
increasing, while others have
declined by up to 1.0 percentage
point due to weak sales from the
residual effects of normalizing gun
sales.
Sales Trends: Sales trends for most
sporting goods retailers have been
mixed, with those that rely on
firearms continuing to be negatively
impacted, while companies that cater
more toward ball sports improving.
Gross Margin and Discounting:
Gross margin has varied by
company. Some have been able to
hold margin consistent, while others
have experienced declines as they
increased discounts to sell through
aged goods. Others have
experienced increased gross margin
due to a shift in the mix of sales to
higher margin categories, resulting
from a decrease in firearms sales,
which typically achieve a lower gross
margin.
Results at sporting goods retailers have varied by product category in recent months. While demand for firearms and am-
munition has returned to more normalized levels, some retailers have reported soft hunting sales. Similarly, golf partici-
pation has been on the decline. Weather continues to impact sales of cold-weather attire, footwear, and gear, driven by
participation in snow sports. This year, some areas of the country, such as the west coast, experienced warmer than aver-
age temperatures during key winter months. Conversely, the northeast, while starting off into winter slowly, got slammed
with several feet of snow during late January and all of February.
Dick’s 3.4% 1.1% 3.2% 1.5%
Cabela’s (5.5%) (11.2%) (14.2%) (21.7%)
Hibbett 5.4% 0.6% 0.1% 4.1%
Big 5 (0.5%) 1.0% (4.9%) (7.9%)
Note(s): Results for Dick’s include Dick’s Sporting Goods stores, Golf Galaxy, and the e-commerce business. The
most recent quarter for Dick’s and Hibbett ended January 31, 2015; the most recent quarter for Cabela’s ended
December 27, 2014; the most recent quarters for Big 5 ended December 28, 2014.

10 March 2015 — Retail Monitor
Consumer Electronics
KEY INDUSTRY DRIVERS
Key product categories: Consumer electronics retailers need to offer the hottest brands and the latest models and technology. Tablets had been gaining traction within the industry, but during the holiday season, sales fell off due to strong phablet sales and resurging PC sales. Smartphones continue to drive the industry, with Apple and Samsung leaders in the arena. Apple’s iPhone 6 and 6 Plus drove sales in the fourth quarter.
Wearable technology: Wearable technology, particularly those items geared toward health and fitness, continue to gain traction. Activity trackers allow consumers to wear a device that tracks their level of activity. These continue to be popular, with brands such as FitBit becoming extremely well‐known. Apple will be unveiling its highly‐anticipated Apple Watch this spring, which will be compatible with the iPhone and include simplified apps, allowing wearers to check messages, Facebook, and other notifications.
External competition: This industry continues to face competition not only from traditional brick‐and‐mortar consumer electronics players, but also from online giants like Amazon, and players in other sectors such as office supply retailers and even some drug stores.
SALES TRENDS
The following table illustrates comparable store sales trends for major public consumer electronics retailers (Represents the most recent fiscal quarter sales reported):
OUTLOOK Representatives from GA attended the Consumer Electronics Show (“CES”) in Las Vegas, Nevada in January 2015. Trends to watch for in 2015 include curved screens, for cell phones and televisions alike. In addition, wearable tech will remain popular, particularly as the Apple Watch is released. The concept of a “smart home” is also popular, with consumers increasingly interested in controlling elements such as thermostats and security systems from a distance, via cell phones. Other newer technology items that retailers are hopeful will spark sales include 8K LED televisions, frameless televisions, see‐through screens, Intel 3D photography, and smart cars. Retailers will face competition from a number of sources as they vie for consumers’ dollars.
NOLVs: NOLVs have generally been decreasing by 1.0 percentage point, with some companies experiencing greater declines.
Sales Trends: Many consumer electronics retailers are experiencing declining sales due to decreased mall traffic, a competitive environment, and weak results in key categories. Some retailers that have expanded their product categories to include items like furniture, bedding, and appliances, have reported positive sales trends.
Gross Margin and Discounting:
Results within the industry have varied, as some retailers have experienced declines in gross margin due to increased promotional activity needed to drive sales and sell through aged goods. Retailers reliant on smartphones have experienced margin declines, as these products typically generate lower margins. Conversely, retailers that have expanded product offerings into higher margin categories like bedding have seen gross margin results improve.
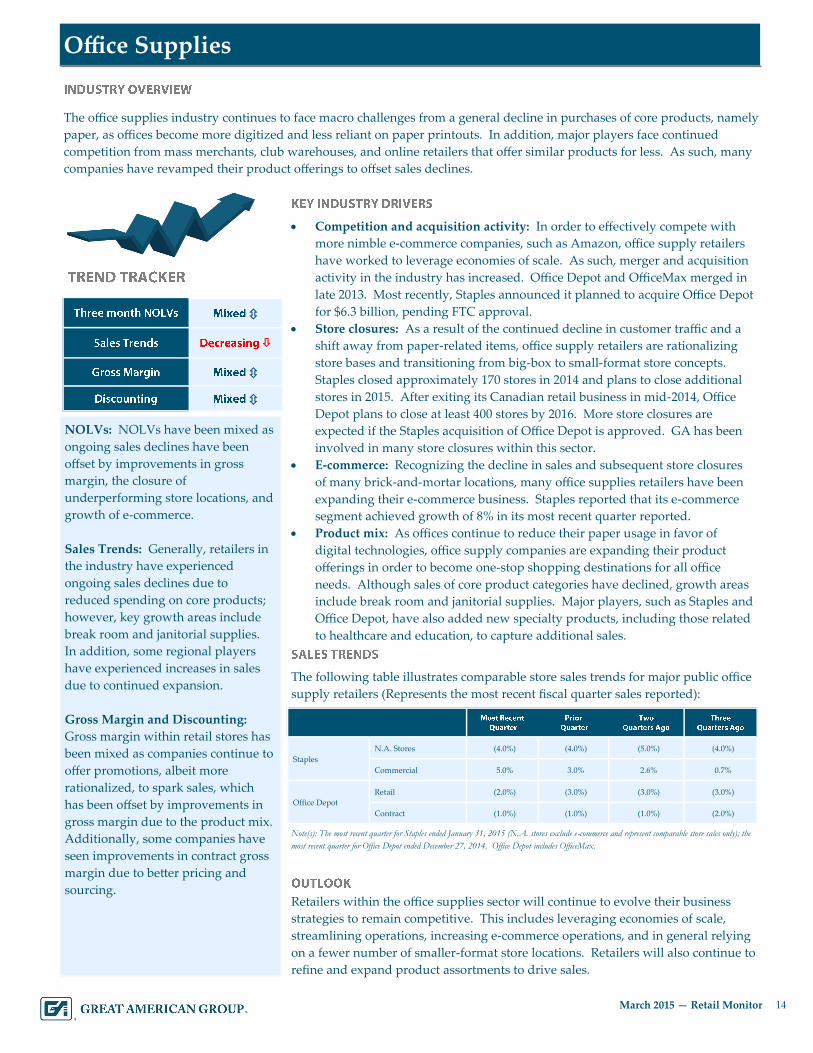
TREND TRACKER
INDUSTRY OVERVIEW
The consumer electronics industry includes companies on opposite ends of the spectrum, from Apple, which continues to dominate, to RadioShack, which has filed for bankruptcy and is in the process of closing over 1,700 stores. Other companies are in more of a middle ground. Best Buy, following several quarters of comparable store sales declines, is showing signs of stabilizing. Amazon has not gained as much market share in recent years, as interconnectivity, expertise, and service com‐ponents keep stores relevant. The industry lacks new technology and product categories to drive growth; sales of televisions and computers have been on the decline, and have only recently shown signs of stabilizing, while tablet sales were weak during the holidays. Many consumer electronics retailers have been expanding into other categories. Some offer wearable health technology, as well as fitness equipment, with others relying on appliances and mattresses to buoy sales.
Three month NOLVs Decreasing
Sales Trends Mixed
Gross Margin Mixed
Discounting Mixed
Most Recent Quarter
Prior Quarter
Two Quarters Ago
Three Quarters Ago
Best Buy 2.8% 3.2% (2.0%) (1.3%)
hhgregg (6.3%) (11.4%) (10.2%) (9.9%)
Conn’s 1.7% (0.4%) 11.8% 15.4%
RadioShack (13.4%) (20.0%) (14.0%) (19.0%)
Note(s): The most recent quarter for Best Buy and Conn’s ended January 31, 2015; hhgregg ended December 31,
2014; RadioShack ended November 1, 2014.

11 March 2015 — Retail Monitor
Books, Music, and Movies
In-store experience: Brick-and-mortar book stores have been pushing in-store
marketing events to drive traffic and offer an experience that online giants can’t
replicate. During the holiday season, Barnes & Noble enlisted the help of 100
popular authors including Dan Brown, EL James, and Hilary Clinton to sign nearly
500,000 copies of their books (combined). These books were only available for sale
in the retail stores. Retailers also continue to expand non-book categories like toys,
games, and gifts, which are generating increased comparable store sales.
E-books: E-book sales have stalled on a dollar basis, but are still increasing on a
unit basis. Comparisons are being impacted by lower e-book prices since the 2012
price settlement and the mix of books being sold, as 2012’s bestsellers were heavily
skewed toward e-books. In November, Amazon and Hachette finally reached a
compromise to their pricing dispute whereby Hachette will set e-book prices, but
the publisher will receive “financial incentives” from Amazon if it chooses to lower
prices to consumers. This gives publishers greater control over pricing, but opens
the door for Amazon to discount e-books if it can incentivize its publishers
appropriately.
Struggling NOOK business: During the holidays, Barnes & Noble’s NOOK sales
decreased 55.4% compared to the prior year, with device and accessories sales down
67.9%. The company now outsources tablet manufacturing to Samsung and
announced that its agreements with Microsoft and Pearson were terminated. It also
changed its decision about spinning off the NOOK business, instead opting to spin
off its college bookstore business by the end of August.
Textbook rentals: In the college segment, there is now more competition than ever
for online rentals, causing several companies to experience a decline in the average
rental price. In response, companies are becoming smarter with their rental pricing.
Companies like Chegg are also focusing on the service side of the business to
connect with students and build customer loyalty. Some book stores are also
collaborating with Amazon.com to store the inventory in Amazon’s warehouse and
rent it through Amazon’s website. Amazon has also opened its first physical on-
campus location at Purdue and has two others planned for fall. Under this
arrangement, Amazon manages the contract for the school. While three locations is
not enough to have a significant impact, industry players are keeping a close watch
on Amazon’s growth in this sector.
NOLVs: NOLVs for books have been flat for most companies; however,
NOLVs for music and movies have declined.
Sales Trends: Sales of physical books are up slightly. E-book sales continue to increase, but at a slower
pace than in past years. College textbook sales continue to decline on
a dollar basis, as rentals grow in popularity, while K-12 sales are rebounding due to recent adoptions.
Physical CD and DVD sales are still plummeting and digital track and
album sales are declining in favor of streaming services.
Gross Margin: Gross margin has
been relatively flat to slightly up for most companies. Companies have
been strategic in their promotions and relying on in-store events and experiences to drive traffic and
compete with online sellers.
Discounting: Discounting has
remained relatively consistent, with thoughtful, targeted promotions.
After declining for several years, sales of physical books finally seem to have stabilized and are actually trending up slightly. Sales
have been driven by improved merchandising efforts coupled with a stable/improving market for physical books, particularly for
children’s and young adult books with movie tie-ins. Digital album and track sales are now on the same downward trajectory as
physical CDs and DVDs, as more and more consumers opt for streaming services.

12 March 2015 — Retail Monitor
Books, Music, and Movies
Digital textbooks: Students still prefer hard copies to digital, especially when rental prices are often cheaper than the price of
digital versions. However, publishers are making efforts to enhance digital offerings to make them more appealing.
Improving K-12 market: K-12 sales have been up due to improvements in the market from recent large-scale adoptions, but
have varied by company based on which programs were adopted by which state. Digital penetration has been increasing,
though still remains small. The recent Texas adoption, which is a bellwether for the industry, was particularly strong in terms
of digital sales. However, costs and school infrastructure concerns are still major roadblocks for expansion of digital.
Declining CD and DVD sales: Music sales are down across the board, including both physical and digital product, as
consumers gravitate toward streaming services. Streaming revenue reached close to $1.5 billion in 2013. Vinyl has been the
one bright spot, with sales up 52% over 2013. However, this is a small piece of the industry and its longevity is unclear. DVD
sales are also down, though Blu-ray sales have fared slightly better, and digital movie sales continue to grow.
The following table illustrates comparable store sales trends for major public book retailers (Represents the most recent fiscal
quarter sales reported):
The following table illustrates physical CD album sales in units,
per year, as well as the change versus the prior year, as reported by
Nielsen SoundScan:
Retailers will continue to manage book, CD, and DVD inventory levels while also using other categories and in-store events to
drive traffic. Sales of physical product will continue to decline and those retailers that stock the right depth of key titles will fare
the best.
Barnes & Noble1 1.7% 0.5% (0.4%) (1.9%)
Books-A-Million 1.8% 0.1% (2.5%) (1.8%)
Note(s): Represents core comparable bookstore sales and excludes sales of NOOK products.
The most recent quarter for Barnes & Noble ended January 31, 2015; Books-A-Million ended
November 1, 2014.
2008 360,617 (19.7%)
2009 294,924 (18.2%)
2010 236,956 (19.7%)
2011 223,507 (5.7%)
2012 193,378 (13.5%)
2013 165,407 (14.5%)
2014 140,850 (14.9%)
YTD February 15, 2015 15,591 (5.9%)
13 March 2015 — Retail Monitor
Arts and Crafts
Competition: The industry remains very competitive, with traditional brick-
and-mortar arts and crafts stores such as Jo-Ann Fabrics, Michaels, and A.C.
Moore facing competition from big box retailers such as Wal-Mart and Target,
as well as online players such as etsy.com. Competition has led to increased
discounting activity over the past few years to lure customers into stores. More
recently, retailers continue to look for ways to improve gross margin without
sacrificing sales. Tactics include offering more targeted promotions on certain
products as opposed to an entire category, as well as reducing shrink, and
asking for concessions from vendors. Retailers have also been managing cost
structures, and closing underperforming locations as leases expire.
Online presence: DIY projects, particularly those related to home décor,
weddings, and parties, continue to grow in popularity, largely as a result of the
continued expansion of social media. The Internet offers an infinite amount of
ideas and inspiration. Pinterest and etsy.com are websites that highlight this
trend, allowing users to exchange ideas, instructions, and images for their
projects. Retailers have recognized this trend, and have started offering crafting
blogs on their websites, as well as links to top projects that have been trending
on Pinterest boards. Many major brick-and-mortar arts and crafts retailers have
also recognized the importance of maintaining an omni-channel presence, and
have revamped their websites or improved e-commerce capabilities.
Children’s crafts: Children’s crafts remain popular. While the Rainbow Loom,
as well as similar variations, remain popular with children, more recently
retailers have seen sales level off compared to elevated sales levels last year.
There has not yet been a new trend to significantly boost sales in this category.
The following table illustrates comparable store sales trends for major public craft
retailers (Represents the most recent fiscal quarter sales reported by these
companies):
Going forward, this sector could continue to see store closures gradually, as
increased competition as well as a growing online presence forces companies to
right-size their businesses. Margin will continue to be challenged by a customer
base that has become accustomed to promotions.
NOLVs: NOLVs for companies
appraised by GA have remained
relatively consistent, or in some
cases, have increased up to 0.5
percentage points. Increases have
been driven by companies finding
success through balancing markup
and discounting cadences to maintain
gross margin, while driving sales.
Sales Trends: Most arts and crafts
retailers experienced increasing sales
over the past 12 months; however, in
the most recent quarter some
companies have experienced
declines.
Gross Margin and Discounting:
Gross margin for retailers has been
mixed, as companies continue to
work toward a moving target for the
right level of margin while driving
sales. This has proven challenging
for some companies given the highly
competitive industry.
The arts and crafts sector has held steady over the past few months. Continued popularity of do-it-yourself (“DIY”) home
projects have benefited sales; however, significant gains at many retailers have been offset by the general competitive nature
of the industry. In addition, many retailers have faced somewhat weaker sales results in recent quarters, as comparable store
sales are compared to elevated sales levels last year, when the Rainbow Loom and similar variations spurred sales above
historical levels. Overall however, consumers have an ongoing interest in crafting.
Michaels (0.8%) 3.2% 3.8% 4.6%
Hancock Fabrics 0.3% 0.9% N/A (0.3%)
Note(s): The most recent quarter for Michaels ended November 1, 2014. The most recent quarter for Hancock Fabrics ended
October 25, 2014.
14 March 2015 — Retail Monitor
Office Supplies
Competition and acquisition activity: In order to effectively compete with
more nimble e-commerce companies, such as Amazon, office supply retailers
have worked to leverage economies of scale. As such, merger and acquisition
activity in the industry has increased. Office Depot and OfficeMax merged in
late 2013. Most recently, Staples announced it planned to acquire Office Depot
for $6.3 billion, pending FTC approval.
Store closures: As a result of the continued decline in customer traffic and a
shift away from paper-related items, office supply retailers are rationalizing
store bases and transitioning from big-box to small-format store concepts.
Staples closed approximately 170 stores in 2014 and plans to close additional
stores in 2015. After exiting its Canadian retail business in mid-2014, Office
Depot plans to close at least 400 stores by 2016. More store closures are
expected if the Staples acquisition of Office Depot is approved. GA has been
involved in many store closures within this sector.
E-commerce: Recognizing the decline in sales and subsequent store closures
of many brick-and-mortar locations, many office supplies retailers have been
expanding their e-commerce business. Staples reported that its e-commerce
segment achieved growth of 8% in its most recent quarter reported.
Product mix: As offices continue to reduce their paper usage in favor of
digital technologies, office supply companies are expanding their product
offerings in order to become one-stop shopping destinations for all office
needs. Although sales of core product categories have declined, growth areas
include break room and janitorial supplies. Major players, such as Staples and
Office Depot, have also added new specialty products, including those related
to healthcare and education, to capture additional sales.
The following table illustrates comparable store sales trends for major public office
supply retailers (Represents the most recent fiscal quarter sales reported):
Retailers within the office supplies sector will continue to evolve their business
strategies to remain competitive. This includes leveraging economies of scale,
streamlining operations, increasing e-commerce operations, and in general relying
on a fewer number of smaller-format store locations. Retailers will also continue to
refine and expand product assortments to drive sales.
NOLVs: NOLVs have been mixed as
ongoing sales declines have been
offset by improvements in gross
margin, the closure of
underperforming store locations, and
growth of e-commerce.
Sales Trends: Generally, retailers in
the industry have experienced
ongoing sales declines due to
reduced spending on core products;
however, key growth areas include
break room and janitorial supplies.
In addition, some regional players
have experienced increases in sales
due to continued expansion.
Gross Margin and Discounting:
Gross margin within retail stores has
been mixed as companies continue to
offer promotions, albeit more
rationalized, to spark sales, which
has been offset by improvements in
gross margin due to the product mix.
Additionally, some companies have
seen improvements in contract gross
margin due to better pricing and
sourcing.
The office supplies industry continues to face macro challenges from a general decline in purchases of core products, namely
paper, as offices become more digitized and less reliant on paper printouts. In addition, major players face continued
competition from mass merchants, club warehouses, and online retailers that offer similar products for less. As such, many
companies have revamped their product offerings to offset sales declines.
Note(s): The most recent quarter for Staples ended January 31, 2015 (N.A. stores exclude e-commerce and represent comparable store sales only); the
most recent quarter for Office Depot ended December 27, 2014. Office Depot includes OfficeMax.
Staples
N.A. Stores (4.0%) (4.0%) (5.0%) (4.0%)
Commercial 5.0% 3.0% 2.6% 0.7%
Office Depot
Retail (2.0%) (3.0%) (3.0%) (3.0%)
Contract (1.0%) (1.0%) (1.0%) (2.0%)

15 March 2015 — Retail Monitor
Grocery Stores
Pricing: Food prices increased 2.4% in 2014, which is in line with historical
norms. However, prices for meat and dairy reached record highs due to
drought and disease. Most retailers have passed these increases onto
consumers to preserve margin, but those that were slower to react reported
margin declines. Companies remain laser focused on price to ensure they
remain competitive without sacrificing margin.
Consolidation: Retail consolidation continued in 2014 with the merger of
supermarket giants Albertsons and Safeway. The combined entity has 2,230
stores across 34 states.
Alternative and small-format stores: Farmer’s market style stores driven by
organic products, like Sprouts, Natural Grocers, Lucky’s Market, and Fresh
Thyme Farmer’s Market, continue to expand, along with Whole Foods. Small-
format stores also remain a focus, particularly for discounters looking to
penetrate urban areas including Wal-Mart’s Neighborhood Market stores. Wal-
Mart plans to open 180 to 200 of these in 2015.
Services: Companies continue to tout their convenience options including
prepared foods, restaurants and cafes, self service kiosks and checkouts, and e-
commerce services. In-store clinics, health-related kiosks, and other similar
initiatives are also taking place throughout the industry.
Convenience stores: Convenience stores continue to expand their fresh and
prepared food offerings. However, sales on a total basis have been impacted by
lower gas prices. Convenience stores are facing increased competition from
drugstores that have expanded their food offerings, with some customers
(especially women) considering drugstores safer and more convenient to shop.
The following table illustrates comparable store sales trends for major public
grocers (Represents the most recent fiscal quarter sales reported):
The supermarket industry remains poised for continued transactions as companies
attempt to grow through acquisition and achieve economies of scale. Although e-
commerce has had less of an impact on this industry compared to others,
supermarkets are expected to use technology to extend the shopping experience
beyond their four walls via omni-channel initiatives.
NOLVs: NOLVs have remained
relatively consistent for most
companies.
Sales Trends: Sales have increased
for many retailers, partly due to
rising food prices. Transaction
counts have remained relatively
consistent, while the dollars per
transactions are up.
Gross Margin: Overall gross margin
has been relatively consistent.
However, non-perishable gross
margin has been up, while perishable
has been down, generally due to
increased offerings of convenience
items (fresh cut fruits, etc.), which
can increase shrink.
Discounting: Discounting has been
relatively stable with retailers
continuing to offer targeted
promotions to drive traffic.
The grocery sector continues to perform well, with most major public retailers reporting low–to-mid single-digit increases in
comparable store sales. Retailers are keeping a close watch on pricing and promotions to drive sales and protect margin,
while looking for ways to stay ahead of non-traditional competitors like drug stores, dollar stores, and mass merchants.
Note(s): All sales exclude fuel. The most recent quarter for Kroger ended January 31, 2015; Supervalu ended November 29, 2014 (reflects Retail
Food operations only and excludes Save-a-Lot); Ahold USA ended December 28, 2014; Delhaize ended December 31, 2014; Publix ended
December 27, 2014; Whole Foods ended January 18, 2015; The Fresh Market ended January 25, 2015.
Kroger 6.0% 5.6% 4.8% 4.6%
Supervalu 2.3% 0.4% 0.6% 0.2%
Ahold USA 0.3% 1.2% (1.8%) 0.1%
Delhaize Group 3.6% 5.3% 3.3% 4.6%
Publix 6.4% 5.0% 6.3% 4.0%
Whole Foods 4.5% 3.1% 3.9% 4.5%
The Fresh Market 3.0% 3.3% 2.9% 2.5%

16 March 2015 — Retail Monitor
Pharmacy and Drug Stores
Generic drugs: Low-cost generic drugs boost gross margin at the expense of
sales. However, generic drug prices have been on the rise due to several factors,
including higher costs of raw materials and compliance fees and reduced
manufacturing competition. While some retailers have been able to pass these
increases on to customers, others have had to absorb the costs, to the detriment
of gross margin.
Tobacco: CVS’ front end comparable store sales were significantly impacted by
its decision to stop selling tobacco in September 2014. It has estimated that
excluding the impact of tobacco, its comparable store sales would have increased
slightly, as opposed to declining in its most recent quarter reported. Should
other retailers follow CVS’ lead, similar declines in front end sales could be seen.
In-store services: Drug stores are offering a variety of in-store services, from
medical screenings and basic care to nutrition and health education, medication
therapy management, and immunizations.
Consumables: Consumables boost customer traffic and front-end sales. Drug
stores have expanded and enhanced consumable offerings, and have worked to
improve private-label merchandise. These initiatives have paid off, as
Supermarket News recently ranked CVS as the 11th-largest grocery retailer in the
U.S. based on sales. Walgreens and Rite Aid also ranked high on the list.
Specialty drugs: Pharmacy retailers are offering an increased assortment of high
-cost specialty drugs used to treat rare and chronic conditions. While a boon to
pharmacy retailers’ bottom line, industry advocates have questioned the rapid
rise of specialty drug prices and patients’ and insurers’ ability to afford them.
Express Scripts recently announced it would not cover Sovaldi, a $1,000 per pill
Hepatitis C drug, and instead would cover a cheaper, less effective treatment.
The following table illustrates the quarterly comparable store sales trends for CVS,
Walgreens, and Rite Aid (Represents the most recent fiscal quarter sales reported):
Drug stores will continue to take advantage of increased demand for prescription drugs and clinic visitations as a result of the Affordable Care Act, as well as demands for wellness products and general merchandise.
NOLVs: Most NOLVs have
remained relatively consistent.
Sales Trends: Sales trends have been
generally increasing; however, some
companies have been experiencing
declines due to the region and
product mix.
Gross Margin: Gross margin has
been mixed. While many retailers in
the industry have experienced
improving gross margin due to the
transition to lower-cost generic
drugs, others have noted that generic
drug prices have increased, which
has pressured gross margin.
Script Valuation: Script values have
remained relatively consistent.
Drug stores are repositioning themselves as convenient shopping alternatives to supermarkets and mass merchants, offering one-stop shopping for pharmacy and wellness products, general merchandise, seasonal goods, and consumables. Overall, industry sales and gross margin continue to be impacted by the conversion of brand name drugs to lower-priced generics, as well as increased penetration of specialty drugs and industry-wide declines in insurance reimbursement rates.
Note(s): The most recent quarter for CVS ended December 31, 2014; Walgreens ended November 30, 2014; and Rite Aid
ended November 29, 2014.
CVS
Pharmacy 5.5% 4.8% 5.0% 3.8%
Front End (7.2%) (4.5%) (0.4%) (3.8%)
Total 1.6% 2.0% 3.3% 1.4%
Walgreens
Pharmacy 8.1% 7.8% 6.3% 5.8%
Front End 1.5% 1.3% 2.2% 2.0%
Total 5.7% 5.4% 4.8% 4.3%
Rite Aid
Pharmacy 7.2% 5.6% 4.6% 3.5%
Front End 1.6% 1.1% 0.0% (0.7%)
Total 5.4% 4.1% 3.1% 2.1%

17 March 2015 — Retail Monitor
Furniture and Home Furnishings
The furniture and home furnishings industry continues to experience growth. Furniture sales have been buoyed by contin-
ued strength in the housing and remodeling markets, as consumers often purchase new furniture when buying a new home,
or updating an existing space. Retailers have also experienced growth in e-commerce sales within this sector. Retailers have
been working to keep product lines fresh and appealing to drive customers both into stores and onto websites to make pur-
chases. Popular décor trends have been bringing outdoor elements to indoor furniture, faux fur, and blue tones.
NOLVs: NOLVs have generally been
increasing by 0.5 to 1.5 percentage
points within the industry, although
there have been some outliers that
have not fared as well. Increases
have been driven by increasing sales
and in some cases, an increase in
product sold through the direct
channel.
Sales Trends: Sales performance has
been primarily positive throughout
the industry, with most retailers
experiencing sales increases due to
compelling merchandise mixes, an
improving housing market and
remodeling sector, and enhanced
focus on customer service.
Gross Margin and Discounting:
Gross margin performance for the
industry has generally been
increasing, as companies have
become more efficient in sourcing
and have worked to reduce costs
where possible. For companies with
strong e-commerce sales, margin
benefits as margins are typically
higher. Other retailers have shifted
sales mix to selling higher-margin
goods in general.
E-commerce growth: Brick-and-mortar locations are increasingly becoming
more of a showroom or gallery for many players within the industry, as
consumers increasingly opt to purchase products online. Customers will often
try out certain furniture pieces before purchasing, such as sofas, recliners, and
chairs in person, but may opt to make the purchase online once the final
decision has been made. E-commerce growth has also been significant for
home décor and home furnishings. Items such as area rugs, bedding, curtains,
lamps, lighting, and patio and outdoor furniture continue to be popular online
purchases. Many brick-and-mortar retailers have been expanding the amount
of products available online, and even moving into categories such as lawn and
garden care, electronics, or pet needs, and reaping the rewards. For example, in
a recent quarter, Bed Bath & Beyond reported that its online and mobile sales
were up approximately 40%, while its brick-and-mortar sales were closer to flat.
Other online-only players continue to perform well, such as overstock.com,
etsy.com, wayfair.com, and jossandmain.com, which offer home furnishings,
furniture, and accent pieces for the home. TJX has also indicated that it plans to
make its home products available online.
Bedding: Furniture retailers continue to promote products purchased on a
replacement basis in order to drive customer traffic in stores. Mattresses and
bedding often get customers into the door, thereby allowing customers to see
other products that are available. In addition to mattresses and bedframes,
many retailers also promote bedding products, such as linens and accessories.
The following table illustrates comparable store sales trends for major public
furniture and home furnishings retailers (Represents the most recent fiscal quarter
sales reported):
In 2015, continued e-commerce growth within the furniture industry is expected to
be seen. Retailers will continue to face a competitive environment and may need to
use promotions to attract customers.
Bed, Bath, & Beyond 1.7% 3.4% 0.4% 1.7%
Pier 1 Imports 2.5% 4.5% 6.3% 0.6%
Williams Sonoma 8.7% 5.7% 10.0% 10.4%
Kirkland’s 8.2% 6.3% 3.6% 5.0%
La-Z-Boy 6.5% 3.4% 1.0% (0.9%)
Restoration Hardware 22.0% 13.0% 18.0% 31.0%
Note(s): Trends for Williams Sonoma include the Williams Sonoma stores, as well as Pottery Barn, Pottery Barn Kids, West Elm, PBteen,
and e-commerce revenue. The most recent quarter for Bed, Bath, & Beyond and Pier 1 Imports ended November 29, 2014; the most recent
quarter for Williams Sonoma ended November 2, 2014; the most recent quarter for Kirkland’s ended January 31, 2015; the most recent
quarter for La-Z-Boy ended January 24, 2015; the most recent quarter for Restoration Hardware ended November 1, 2014. Sales for some
companies include e-commerce sales.

GA Retail MonitorPublic Company Analysis($ in millions, except per share amounts)
Share Price % 52‐WK Market Enterprise Enterprise Value / Enterprise Value / EV/EBITDA EBITDA Margin3/13/2015 High Cap Value 2014E Revenue 2015E Revenue 2014E EBITDA 2015E EBITDA % 5‐Yr Median % 5‐Yr Median
Department StoresHudson’s Bay/Lord & Taylor $20.36 91.8% $3,707 $6,156 0.96x 0.89x 13.0x 11.6x 107.9% 92.5%
Nordstrom 80.36 98.3% 15,276 17,580 1.34x 1.24x 9.7x 9.3x 122.3% 93.2%
Macy’s 63.36 92.8% 21,580 26,675 0.95x 0.94x 6.9x 6.7x 116.6% 102.5%
Dillard’s 131.93 99.4% 5,436 5,853 0.88x 0.85x 7.2x 7.0x 116.5% 101.9%
J.C. Penney 7.73 68.4% 2,357 6,455 0.53x 0.51x 18.7x 12.0x 219.7% 100.0%
Kohl’s 74.10 98.9% 14,969 18,323 0.96x 0.94x 7.1x 6.9x 117.2% 95.8%
Sears 38.21 73.5% 4,069 7,619 0.24x 0.29x NM NM NM 100.0%
Specialty ApparelAbercrombie & Fitch $20.91 46.0% $1,450 $1,264 0.33x 0.36x 3.0x 3.6x 50.4% 82.1%
Aerospostale 3.06 47.1% 242 229 0.13x 0.14x NM NM NM NM
American Eagle 17.32 99.7% 3,378 2,967 0.91x 0.87x 8.6x 6.9x 146.8% 76.4%
Ann Taylor 40.45 92.8% 1,849 1,645 0.65x 0.63x 6.9x 6.1x 113.9% 88.0%
Cato 40.89 91.1% 1,141 900 0.92x 0.88x NA NA 156.3% 92.7%
Christopher & Banks 5.21 46.4% 192 154 0.37x 0.35x 6.2x 4.4x 88.4% NM
GAP 41.13 87.8% 17,316 17,154 1.04x 1.02x 6.7x 6.9x 107.0% 98.4%
New York & Co. 2.24 43.9% 142 102 0.11x 0.11x 5.1x 2.8x 59.5% 321.0%
The Buckle 48.04 85.6% 2,324 2,165 1.88x 1.83x 7.5x 7.3x 103.6% 100.1%
Victoria's Secret 90.98 95.9% 26,628 29,711 2.59x 2.46x 12.7x 11.8x 141.0% 104.5%
Wet Seal 0.02 NM NM NM NA NA NA NA NM NM
Zumiez 37.24 89.1% 1,096 945 1.16x 1.06x 8.7x 7.9x 103.8% 97.9%
Off‐Price/Dollar Stores/Mass MerchantsCostco $149.28 95.2% $65,679 $63,475 0.55x 0.53x 14.6x 13.5x 135.8% 105.5%
Dollar General 74.30 98.7% 22,545 24,705 1.31x 1.20x 11.6x 10.5x 118.8% 94.1%
Dollar Tree 81.91 99.7% 16,854 16,747 1.95x 1.78x 13.1x 11.8x 121.8% 100.0%
Family Dollar 79.30 97.9% 9,076 9,617 0.91x 0.87x 12.3x 12.2x 148.9% 76.7%
Ross Stores 106.04 99.1% 21,949 21,650 1.97x 1.84x 12.7x 11.6x 141.4% 104.0%
Stein Mart 12.36 74.2% 555 490 0.37x 0.35x 6.3x 5.7x 132.1% 113.8%
Target 79.18 99.3% 50,813 61,399 0.84x 0.83x 9.0x 8.4x 120.8% 89.1%
TJX 67.99 97.3% 46,417 45,264 1.56x 1.48x 10.8x 10.6x 124.2% 103.3%
Source: S1 Capital IQ. March 2015 — Retail Monitor 18

GA Retail MonitorPublic Company Analysis($ in millions, except per share amounts)
Share Price % 52‐WK Market Enterprise Enterprise Value / Enterprise Value / EV/EBITDA EBITDA Margin3/13/2015 High Cap Value 2014E Revenue 2015E Revenue 2014E EBITDA 2015E EBITDA % 5‐Yr Median % 5‐Yr Median
Wal‐Mart 81.90 90.0% 263,979 309,768 0.64x 0.63x 8.5x 8.5x 108.6% 96.8%
FootwearCrocs (Americas) $11.87 70.5% $924 $841 0.70x 0.75x 8.1x 9.3x 155.9% 42.9%
DSW 37.17 92.1% 3,279 3,055 1.24x 1.16x 10.1x 8.8x 107.3% 95.6%
Famous Footwear 30.06 89.3% 1,315 1,448 0.56x 0.54x 8.1x 7.4x 111.8% 143.1%
Finish Line 23.78 74.5% 1,110 1,025 0.58x 0.54x 6.2x 6.0x 119.9% 87.5%
Foot Locker 61.31 99.0% 8,568 7,735 1.09x 1.05x 8.2x 7.6x 118.5% 111.0%
Johnston & Murphy 67.61 75.5% 1,628 1,544 0.54x 0.51x 6.0x 5.2x 80.8% 96.0%
Sporting GoodsBig 5 $13.01 78.3% $289 $346 0.35x 0.34x 6.8x 6.2x 97.6% 100.0%
Cabela's 57.50 79.3% 4,092 8,025 2.21x 1.97x 17.0x 16.2x 110.7% 102.1%
Dick's 56.88 98.5% 6,805 6,590 0.97x 0.89x 9.1x 8.1x 102.5% 100.0%
Hibbett 50.83 87.6% 1,271 1,183 1.30x 1.21x 9.1x 8.5x 85.6% 99.0%
Consumer ElectronicsBest Buy $40.53 98.6% $14,245 $11,978 0.29x 0.30x 5.7x 5.4x 129.5% 100.0%
Conn's 27.39 52.7% 994 1,685 1.14x 0.99x 10.7x 7.6x 76.3% 249.3%
hhgregg 5.87 52.0% 162 135 0.06x 0.06x NM NM NM NM
Books, Music, and MoviesBarnes & Noble $39.95 97.4% $2,182 $2,641 2.09x 2.01x 9.8x 9.1x 102.7% 114.3%
Books‐A‐Million 2.59 94.2% 39 106 NA NA NA NA 113.2% 97.0%
Arts & CraftsHancock Fabrics $0.00 0.0% $15 $108 NA NA NA NA 101.8% 169.1%
Office SuppliesOffice Depot $9.21 94.2% $5,020 $5,494 0.34x 0.36x 10.3x 7.0x 147.6% 141.2%
Staples 16.01 82.5% 10,254 10,751 0.48x 0.49x 7.5x 7.8x 130.2% 76.2%
Grocery Stores
Source: S2 Capital IQ. March 2015 — Retail Monitor 19
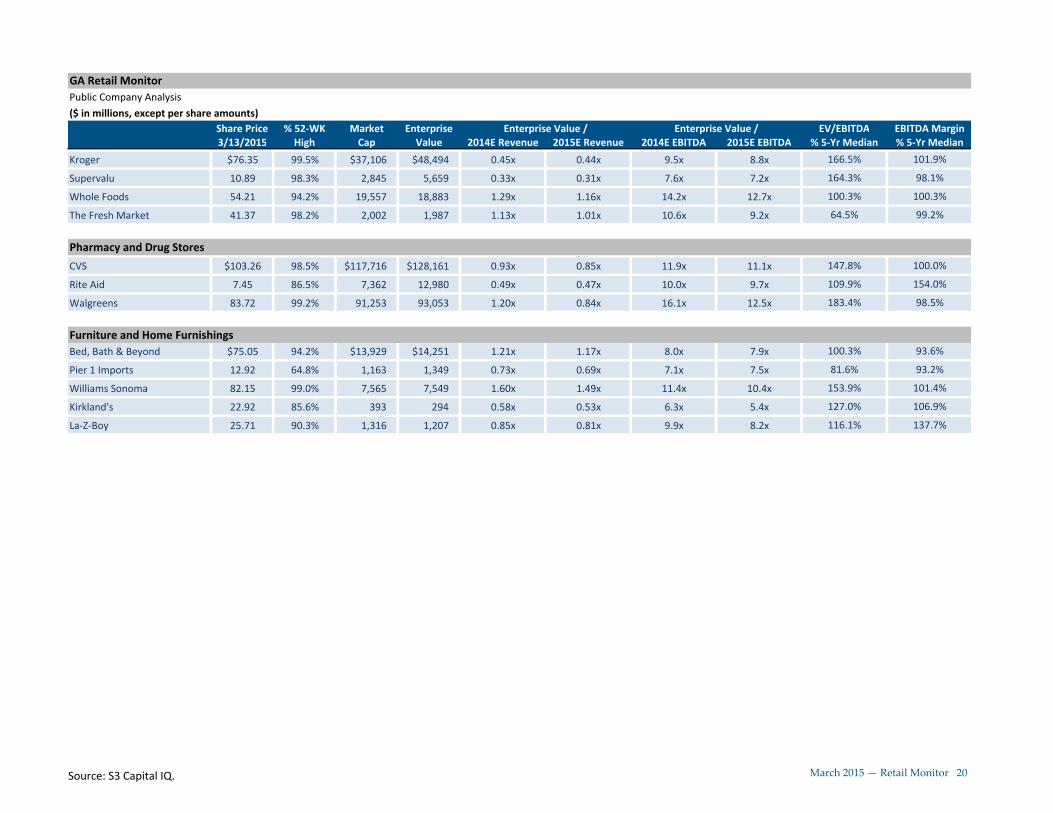
GA Retail MonitorPublic Company Analysis($ in millions, except per share amounts)
Share Price % 52‐WK Market Enterprise Enterprise Value / Enterprise Value / EV/EBITDA EBITDA Margin3/13/2015 High Cap Value 2014E Revenue 2015E Revenue 2014E EBITDA 2015E EBITDA % 5‐Yr Median % 5‐Yr Median
Kroger $76.35 99.5% $37,106 $48,494 0.45x 0.44x 9.5x 8.8x 166.5% 101.9%
Supervalu 10.89 98.3% 2,845 5,659 0.33x 0.31x 7.6x 7.2x 164.3% 98.1%
Whole Foods 54.21 94.2% 19,557 18,883 1.29x 1.16x 14.2x 12.7x 100.3% 100.3%
The Fresh Market 41.37 98.2% 2,002 1,987 1.13x 1.01x 10.6x 9.2x 64.5% 99.2%
Pharmacy and Drug StoresCVS $103.26 98.5% $117,716 $128,161 0.93x 0.85x 11.9x 11.1x 147.8% 100.0%
Rite Aid 7.45 86.5% 7,362 12,980 0.49x 0.47x 10.0x 9.7x 109.9% 154.0%
Walgreens 83.72 99.2% 91,253 93,053 1.20x 0.84x 16.1x 12.5x 183.4% 98.5%
Furniture and Home FurnishingsBed, Bath & Beyond $75.05 94.2% $13,929 $14,251 1.21x 1.17x 8.0x 7.9x 100.3% 93.6%
Pier 1 Imports 12.92 64.8% 1,163 1,349 0.73x 0.69x 7.1x 7.5x 81.6% 93.2%
Williams Sonoma 82.15 99.0% 7,565 7,549 1.60x 1.49x 11.4x 10.4x 153.9% 101.4%
Kirkland's 22.92 85.6% 393 294 0.58x 0.53x 6.3x 5.4x 127.0% 106.9%
La‐Z‐Boy 25.71 90.3% 1,316 1,207 0.85x 0.81x 9.9x 8.2x 116.1% 137.7%
Source: S3 Capital IQ. March 2015 — Retail Monitor 20

March 2015 — Retail Monitor 21
Experience
GA is one of the largest liquidators of retail inventory and has been involved in a
variety of liquidations, ranging from the disposition of excess inventory and the
closing of underperforming stores, to full-scale liquidations of national retailers
with hundreds of stores. GA has experience with full and partial liquidations of
companies throughout a variety of retail sectors, some of which are detailed below:
Numerous retailers of apparel and accessories,
including major department store retailers and a
variety of specialty retailers that are found in malls
throughout the country.
Several e-commerce and multi-channel retailers, as
well as flash sale websites and auction websites. In
particular, GA has appraised 74 of the top 500 e-
commerce companies as reported by Internet
Retailer.
Leading off-price retailers of apparel and
accessories, including major national and regional
chains.
Retailers of consumer electronics, including smaller,
more localized chains, as well as regional, national,
and international retailers with close to 4,500 store
locations.
Many jewelry retailers, including one of the largest
in the United States, with locations throughout the
country and net sales exceeding $1.4 billion
annually.
Major national and regional discount and dollar
stores, including one of the country’s largest chains,
with over 10,000 stores.
Leading book retailers, including one with over 700
store locations and sales of upwards of $4.5 billion.
Sporting goods retailers that specialize in a number
of products, including those for outdoor sports,
recreational ball sports, hunting, camping, and
fishing, and a variety of other equipment for
outdoor enthusiasts.
Major regional grocery store chains including one
with a store base of close to 400 and net sales of
nearly $8.0 billion, as well as smaller local grocery
store retailers and pharmacies.
In addition to our internal personnel, GA maintains contacts within the retail industry that we utilize for
insight and perspective on recovery values.
Target Canada Cache Office Depot/Max Circuit City
Macy’s Fashion Bug Mervyns Tower Records
Fortunoff Frederick’s of Hollywood Eddie Bauer RadioShack
Linens ‘N Things Naartjie Whitehall Jewelers Borders
Jo-Ann Fabrics Boot Town A&P Movie Gallery
These experiences, in addition to numerous others, provide GA with valuable insight into the market
trends and the consumer response that can be expected in a liquidation. They give us an
understanding as to recovery values that can be achieved for retailers within these industries. In
addition to this liquidation experience, GA has worked with and appraised numerous retailers,
including industry leaders within each sector. While our clients remain confidential, GA’s extensive
list of appraisal experience includes:
March 2015 — Retail Monitor 22
Appraisal & Valuation Team
John Bankert
President
(781) 429-4054
David Triompo
Managing Director, Consumer Products
(781) 429-4067
Tracy Foohey
Associate Director
(781) 429-4059
Matthew Gins
Project Manager
(818) 746-9386
Nicole Hines
Project Manager
(781) 429-4072
Kipp Visi
Associate Project Manager
(312) 777-7957
Louise Shimazu
Associate Project Manager
(818) 746-9339
About Great American Group Great American Group is a leading provider of asset disposition solutions and valuation and appraisal services to a wide range
of retail, wholesale, and industrial clients, as well as lenders, capital providers, private equity investors, and professional
services firms. For more information, please visit www.greatamerican.com.
Great American Group, LLC is a wholly owned subsidiary of B. Riley Financial, Inc. (OTCBB: RILY), which provides
collaborative financial services and solutions through several subsidiaries, including: B. Riley & Co. LLC, a leading investment
bank which provides corporate finance, research, and sales & trading to corporate, institutional and high net worth individual
clients; B. Riley Asset Management, LLC, a provider of investment products to institutional and high net worth investors; and
MK Capital Advisors, LLC, a multi-family office practice and wealth management firm focused on the needs of ultra-high net
worth individuals and families.
B. Riley Financial, Inc. is headquartered in Los Angeles with offices in major financial markets throughout the United States
and Europe. For more information on B. Riley Financial, Inc., please visit www.brileyfin.com.
Headquarters
21860 Burbank Blvd. Suite 300 South
Woodland Hills, CA 91367 800-45-GREAT www.greatamerican.com
Mike Marchlik
National Sales & Marketing Director
(818) 746-9306
David Seiden
Executive Vice President, Southeast Region
(770) 551-8114
Ryan Mulcunry
Executive Vice President - Northeast Region, Canada & Europe
(617) 692-8310
Bill Soncini
Senior Vice President, Midwest Region
(312) 777-7945
Drew Jakubek
Managing Director, Southwest Region
(972) 996-5632
Jennie Kim
Vice President, Western Region
(818) 746-9370
Daniel J. Williams
Managing Director, New York Region
(646) 381-9221
Related Documents