Miguel Ángel Borrella-Mas, Mariano Bosch and Marcello Sartarelli Non-Contributory Pensions Number-Gender Effects on Poverty and Household Decisions a d serie WP-AD 2016-02

Welcome message from author
This document is posted to help you gain knowledge. Please leave a comment to let me know what you think about it! Share it to your friends and learn new things together.
Transcript

Miguel Ángel Borrella-Mas, Mariano Bosch and Marcello Sartarelli
Non-Contributory Pensions Number-Gender Effects on Poverty and Household Decisionsad
serie
WP-AD 2016-02

Los documentos de trabajo del Ivie ofrecen un avance de los resultados de las investigaciones económicas en curso, con objeto de generar un proceso de discusión previo a su remisión a las revistas científicas. Al publicar este documento de trabajo, el Ivie no asume responsabilidad sobre su contenido. Ivie working papers offer in advance the results of economic research under way in order to encourage a discussion process before sending them to scientific journals for their final publication. Ivie’s decision to publish this working paper does not imply any responsibility for its content. La Serie AD es continuadora de la labor iniciada por el Departamento de Fundamentos de Análisis Económico de la Universidad de Alicante en su colección “A DISCUSIÓN” y difunde trabajos de marcado contenido teórico. Esta serie es coordinada por Carmen Herrero. The AD series, coordinated by Carmen Herrero, is a continuation of the work initiated by the Department of Economic Analysis of the Universidad de Alicante in its collection “A DISCUSIÓN”, providing and distributing papers marked by their theoretical content. Todos los documentos de trabajo están disponibles de forma gratuita en la web del Ivie http://www.ivie.es, así como las instrucciones para los autores que desean publicar en nuestras series. Working papers can be downloaded free of charge from the Ivie website http://www.ivie.es, as well as the instructions for authors who are interested in publishing in our series. Versión: marzo 2016 / Version: March 2016 Edita / Published by: Instituto Valenciano de Investigaciones Económicas, S.A. C/ Guardia Civil, 22 esc. 2 1º - 46020 Valencia (Spain) DOI: http://dx.medra.org/10.12842/WPAD-2016-02

3
WP-AD 2016-02
Non-Contributory Pensions Number-Gender Effects on Poverty and Household Decisions*
Miguel Angel Borella-Mas, Mariano Bosch and Marcello Sartarelli**
Abstract
Non-contributory pensions, designed to reduce old-age poverty particularly in countries with low contributory coverage, may induce a variety of household behavioural responses. This paper tests whether they vary with beneficiaries number and gender in Bolivia, one of the countries with the lowest contributory coverage worldwide. Taking advantage of a discontinuity in eligibility at age 60 in the Renta Dignidad pension, we estimate these effects by using a bi-dimensional regression discontinuity design, with spouses' age as forcing variables. We find that, despite increasing income, the impact on poverty is mixed and not significant. Although potentially puzzling, this is rationalised by household responses. When receiving two pensions, household size increases due to beneficiaries' adult children working in the household and to grandchildren. In addition, female labour supply decreases weakly. When receiving one, instead, transfers to other households increase only if the beneficiary is male. Our results suggest that variation in beneficiaries number and gender plays a relevant role in explaining pension positive spillovers to households with no elderly.
Keywords: Consumption, labour supply, living arrangements, poverty, regression discontinuity, Renta Dignidad, social pension.
JEL classification numbers: D13, H2, J22, J26.
* We thank for helpful comments Pedro Albarran, Marianna Battaglia, Matteo Bobba, Fernanda Brollo, Lola Collado, Decio Coviello, Giacomo De Giorgi, Giacomo Deluca, Ada Ferrer-i-Carbonell, Maitreesh Ghatak, Tommaso Nannicini, Steven Poelhekke, Anna Sanz, Lore Vandewalle and participants in: seminars at U. Alicante and at the Tinbergen Institute in Amsterdam, 2013 EUI Alumni Conference, 2013 Econometric Society Meeting in Gothenburg, IZA Workshop on Labor Markets and Labor Market Policies for Older Workers and 2014 Petralia Sottana Applied Economics Workshop. Financial support from the Spanish Ministerio de Economía y Competitividad (ECO2012-34928 and ECO2013-43119) and from the Universidad de Alicante (GRE 13-04) is gratefully acknowledged. All remaining errors are our own.
** M.A. Borrella-Mas and M. Sartarelli: Universidad de Alicante, Departamento de Fundamentos del Análisis Económico. M. Bosch (corresponding author): Inter-American Development Bank, 1300 New York Avenue N.W., Washington, D.C. 20577, USA, Email: [email protected].

1 Introduction
Bismarckian pension systems, based on contributions during workers’ lives
to finance old age pensions, provide coverage to a small fraction of elderly
in low and middle income countries, as only 45%, 35% and less than 10%
of workers save for a pension in Latin America, Asia Pacific and Africa
(World Bank, 2015). The majority, instead, are in informal and unreg-
ulated jobs due to several factors, such as lack of government effort in
incentivising pension savings or social norms. As a response to this and in
the face of rapidly changing demographics, 60 countries have been paying
non-contributory or social pensions to elderly over the last 20 years, regard-
less of their social security contribution history, in an attempt to prevent
old age poverty (HelpAge, 2015).1
Motivated by the fact that, absent any pension, elderly tend to work
as long as their health allows them in poor countries, the literature focuses
primarily on social pension beneficiaries, whose well-being tends to increase
due to a combination of lower labour supply and greater consumption, in
line with theoretical predictions.2 The motivation to study pension indirect
effects stems, instead, from the relevance of extended families in household
decisions in developing countries, with evidence showing that non-negligible
benefits accrue to non-beneficiaries.3
1In relatively young countries, like Bolivia, Brazil or Chile, expenditure for theseprograms absorbs more than 1% of GDP and, given the demographic transition, it islikely to increase (Bosch et al., 2013).
2Pensions tend to decrease labour supply in Latin America (de Carvalho Filho, 2008;Bosch and Guajardo, 2012; Hernani-Limarino and Mena, 2015) and in China (Chenet al., 2015) and also increase consumption in Latin America (Martinez, 2004; EscobarLoza et al., 2013; Galiani et al., 2014) and in South Africa (Case and Deaton, 1998).Similarly, they tend to reduce poverty in South Africa (Ardington and Lund, 1995; Caseand Deaton, 1998). Evidence on their impact on mental health in Mexico and Peruis, instead, mixed (Galiani et al., 2014; Novella and Olivera, 2014; Salinas-Rodrıguezet al., 2014). See for a broader assessment of pension policies in Latin America and theCaribbean region Mesa-Lago (2004); Rofman et al. (2008); Bosch and Manacorda (2012);Bosch et al. (2013); Acosta et al. (2014); Rofman et al. (2014) and in 60 developingcountries Holzmann and Hinz (2005).
3See Cox and Fafchamps (2008) for a survey of evidence on household decisions inthe presence of extended families in developing countries and of the theory rationalisingit. Evidence on the pension impact on adult children’s labour supply (Bertrand et al.,2003; Kassouf and Rodrigues de Oliveira, 2012; Juarez and Pfutze, 2014) and on livingarrangements is mixed as extra family members may enter beneficiaries’ household or,in contrast, leave them (Edmonds et al., 2005; Posel et al., 2006; Hamoudi and Thomas,2014). In addition, the impact is positive on children’s health (Duflo, 2003) and school-
1
3

Household decisions may also vary depending on the number of pensions
obtained and on beneficiaries’ gender. However, theoretical predictions are
ambiguous as they depend on whether spouses’ preferences differ by gender
and on bargaining over costly decisions that one or more pensions afford.
For example, changes in basic food consumption may be proportional to
the number of pensions. Decisions over co-residence of extended family
members may, instead, more markedly depend on spouses’ preferences, rel-
ative bargaining power and on whether income is high enough to guarantee
all members basic needs. Since the literature has, to the best of our knowl-
edge, overlooked the number of pension beneficiaries - gender relationship,
we are the first to tease out these effects empirically.4
We jointly estimate the effects thanks to rich survey data on house-
hold members’ income, consumption, labour supply, socio-demographics
and take-up of Renta Dignidad. This is a non-contributory pension en-
acted in Bolivia in 2008 and paying citizens aged 60 or older 200 bolivianos
monthly, about 25% of per capita income or 60 US dollars in PPP (Bosch
et al., 2013). We identify the effects thanks to an age discontinuity in eli-
gibility at 60 and to between-spouse age variation in households since, for
example, of all households eligible for at least a pension, 38% receive two.
This gives rise to a bi-dimensional regression discontinuity design (RDD)
with spouses’ age as forcing variables. In addition, as take-up is about
60%, we estimate a fuzzy RDD by instrumenting take-up by gender with
pension eligibility.
Although the main aim of the pension was poverty reduction among
elderly, we find that neither the number of beneficiaries nor the gender ef-
fect is significant and both are mixed in sign: positive if using the poverty
rate (34% relative to households with no pension) and negative if using
ing (Martinez, 2004; Edmonds, 2006; Yanez-Pagans, 2008) and tends to be driven bypensions to females. Finally, the impact on private transfers tends to be negative, i.e. acrowding out effect (Jensen, 2004; Juarez, 2009; Amuedo-Dorantes and Juarez, 2013).
4Bertrand et al. (2003) show evidence of a negative pension-gender effect on youngadults’ labour supply in South Africa while Yanez-Pagans (2008) of a positive one onchildren’s human capital investment in Bolivia. In addition to surveying the literatureon the determinants of extended families and their decisions, Cox and Fafchamps (2008)also offer an in-depth discussion of gender as a relevant although under-researched factorin household decisions over extended families. Related evidence on developing countriesshows that household decisions depend on spouses’ relative bargaining power (Rangel,2006; Bobonis, 2009; Attanasio and Lechene, 2014).
2
4
the extreme poverty rate (71%). By itself, this result may put a nega-
tive light on the pension objective, design or implementation. In contrast,
assessing it in the light, firstly, of our results showing that, by way of
household decisions, a substantial part of pension benefits is transferred
to other households and, secondly, of the low pension amount leads to a
richer understanding of the policy and of the role played by the number of
beneficiaries and their gender.
When only the husband receives the pension, transfers from other house-
holds decrease by 236 bolivianos (245%) and those sent to other households
increase by 98 bolivianos (350%). In contrast, when both spouses receive
it, this effect is small and no longer significant while the probability of
absorbing additional family members increases: grandchildren by 51 per-
centage points, pp hereafter, (268%) and adult sons living and working in
the household by 55 pp (130%). We also find a negative but weakly sig-
nificant female labour supply effect (30 pp or 50%) when the male spouse
or both spouses receive the pension, while men labour supply changes lit-
tle. Finally, the probability of purchasing medicines increases by 65 pp
(140%) when at least a pension is received although it is independent of
beneficiaries’ number or gender.5
Importantly for our research design validity, the distribution of spouses’
age and baseline characteristics are continuous at the 60 cutoff, which rules
out sorting by individuals in or out of the pension. In addition, falsification
tests obtained estimating the age 60 effect before the pension was enacted,
in 2006 and 2007, exclude that results are driven by a spurious demographic
effect at 60. Finally, results are robust to varying the time elapsed between
when the pension is first received and when outcomes are observed, the
RDD bandwidth and also to dropping individuals eligible for the Bonosol
pension, that preceded Renta Dignidad and whose cutoff age was 65.
Overall, this paper makes three contributions to the literature and to
inform policy decisions. First, we are the first ones to jointly test the num-
ber of beneficiaries and gender effects of a social pension by exploiting an
5Results also hold when testing quantity and gender pension effects jointly on severaloutcomes, as shown in Appendix B. By, instead, failing to jointly account for the numberof beneficiaries and gender effects we would have only detected an increase in transfersto other households and in the probability of purchasing medicines when one or morepensions is received, as shown in Appendices C and D.
3
5

age discontinuity and between-spouse age variation in households. Second,
we document that, even in the short-run, these effects lead to substantive
changes in household decisions that proxy a welfare increase, such as a
decrease in beneficiaries’ labour supply and an increase in employment op-
portunities for their adult children. By also considering the non-significant
poverty reduction, results suggests that the poverty rate, by itself, gives a
potentially misleading pension assessment to inform policy decisions, unless
it is complemented by household behavioural responses.
Finally, we show that a non-negligible part of the pension benefits spills
over to non-beneficiary households by way of transfers to them. A dollar
worth of pension reduces transfers received by 1.18 and increases those sent
by 0.5, leading to a net increase in transfers sent by 1.68, only if a male
obtains the pension. This also suggests that gender is an extra potential
mechanism to explain variation in interhousehold transfers in a growing
literature studying their determinants (Angelucci et al., 2012; Kinnan and
Townsend, 2012; Angelucci and Di Maro, 2015).
The structure of the rest of the paper is as follows. Section 2 describes
the institutional setting and the data. Section 3 illustrates the conceptual
framework motivating the questions we set out to answer. Section 4 de-
scribes the empirical research design and section 5 the results. Section 6
discusses the research design validity. Finally, section 7 discusses results
and concludes. Additional results are available in the Appendix.6
2 Institutional setting and data
In 1997, before Renta Dignidad, the Bolivian government enacted Bonosol,
a pension paying all citizens who were 65 or older 1,300 bolivianos per
year, or about 27% of per capita income and 85% of income for those
living in extreme poverty (von Gersdorff, 1997). It was part of a broader
social and economic reform agenda with two main aims. The first was
reducing high income inequality in the country, in the top quartile of the
distribution of countries worldwide if measured using the GINI index (CIA
World Factbook, 2014). The second was dealing with the consequences of
the high share of informal workers, about 60% (World Bank, 2009), who
6The Appendix is available online at https://goo.gl/vYUqhA .
4
6
are not entitled to a contributory pension since they did not pay social
security.7
However, in 1998 Bonosol was not paid as it was judged financially
untenable. In 2001, instead, the pension, renamed Bolivida, resumed al-
though its amount decreased to about 420 bolivianos in 2001-2002 while it
increased to 1,800 bolivianos in 2003. Finally, the pension was discontin-
ued in December 2007.8 Renta Dignidad was enacted on 1st February 2008
with two main differences with respect to previous pensions. First, the age
eligibility cutoff decreased to 60. Second, the amount paid increased to
2,400 bolivianos per year, except individuals obtaining a contributory pen-
sion and public sector employees, 19% of all Renta Dignidad beneficiaries,
who received 1,800 bolivianos.9
We estimate number and gender of beneficiaries effects by using two
repeated cross-sections of survey data in the years 2008 and 2009 from
the National Statistics Institute in Bolivia (Encuesta de Hogares). The
unit of observation in the data is a household and information about its
members is collected either at the individual or at the household level.10
Our treatments of interest are whether at least a spouse in a household
obtained the pension and her/his gender, with respect to a counterfactual
household in which no spouse received it. The pension eligibility rule and
variation in spouses’ age across households around the 60 age eligibility
cutoff, as Figure 1 shows, offer a quasi-experimental increase in non-labour
income to estimate our treatment effects of interest.11
7Contributory pensions only provide coverage to around 10% of the elderly popula-tion (Bosch et al., 2013). A related phenomenon to low pension coverage and poverty isobserving that household size in Bolivia, greater than 4, is greater than in other LatinAmerican countries (Jelin and Dıaz-Munoz, 2003).
8See Willmore (2006, 2007) for additional information about pension reforms inBolivia.
9Pensions were first paid up to a month after turning 60, either at a bank or au-thorized military enclosure subject to identity verification. Alternatively, arrangementswere in place to obtain it at home. Individuals obtaining 2,400 bolivianos, about 80%of beneficiaries, could choose either monthly payments or a less frequent ones while, forthe others, the pension was added automatically to payments obtained on a monthlybasis. Additional information is available in Escobar Loza et al. (2013).
10The data can be downloaded from www.ine.gob.bo:8081/Webine10/
enchogares1.aspx.11Summary statistics available upon request show that of all households eligible for
at least a pension, in 41.4% only the male is eligible, in 20.7% only the female is and in37.9 % both are.
5
7

[Figure 1 about HERE]
We study pension contemporaneous effects by setting at end of Septem-
ber the date at which we observe if spouses were 60 or older and, hence,
eligible for the pension. The reason is that survey interviews were held
yearly in November and up to a month elapsed between the time at which
an individual turning 60 submitted the application for the pension and the
time the pension was paid, as illustrated in Figure 1. Hence, we define as
eligible individuals those who were born on 30th September 1948 or earlier
and, implicitly, the household where they live although the pension targets
individuals. Non-eligibles are, instead, those who were born later.12
[Figure 2 about HERE]
We use the following measures of income: the total in a household and
its counterpart in per capita terms in bolivianos, the country’s currency,
earned over the 12 months before the survey. Over the same period we also
measure transfers received from or sent to other households in Bolivia.13
In addition, we use two poverty measures obtained by setting a dummy
equal to 1 if total income per capita is below the poverty threshold or the
extreme poverty one.14 Food and non-food consumption in a household
are measured in bolivianos over the month before the survey was held.
Medicines and medical services, instead, are measured as a dummy equal
to 1 if their consumption is positive and 0 otherwise as their distribution
peaks at zero.15
We measure labour supply for each adult member in a household, in-
cluding elderly spouses and their adult children, thanks to a dummy set
12In addition, as a robustness check, we also study pension three months effects bysetting the end of June as the date in which we observe if one or more spouses was 60or older.
13Interhousehold transfers exclude transfers received from abroad, i.e. remittances,or sent abroad, as they are measured separately in the survey.
14The National Statistics Institute in Bolivia set the poverty threshold at 418 bo-livianos of total household income per capita and the extreme poverty one at 261 toobtain the poverty dummies in the survey data for 2008 and 2009. Threshold valueswere defined based on the cost of basic food and non-food consumption needs. Additionaldetails about the survey design are available in www.ine.gob.bo/pdf/EH/EH_2011.pdf.
15Total food consumption is measured in adult equivalent terms. In particular, we usethe OECD scale and divide food consumption by (1+0.7∗(Nadults−1)+0.5∗Nchildren).See chapter 2 in Haughton and Khandker (2009) for additional details.
6
8

Figure 1: Variation in spouses’ age in a household
55
60
65
Fem
ale
age
55 60 65Male age
50
55
60
65
70
Fem
ale
age
50 55 60 65 70Male age
Note: The figure shows scatter plots of the variation in spouses age around the age 60 cutoff by gender. Aage ismeasured at the end of September to estimate pension contemporaneous effects since a month can elapse between the60th birthday and the first pension payment due to administrative reasons and our outcomes of interest are measuredin November. We use two different age intervals around the 60 cutoff: 5 and 10 years, shown on the left- andright-hand side in the figure respectively. We measured age as follows: the integer part measures age in years whilethe decimal one measures fractions of years. Data are from a representative survey of Bolivian households held by theNational Statistics Institute in 2008 and 2009. Section 2 offers additional information on the institutional setting andon the data, section 4 on the research design and section 5 on the empirical analysis.
39
9

Figure 2: Illustration of the time at which pension eligibility and outcomesare measured
-
IndividualA turns 60
Juneend
Firstpensionpaid to A
Julyend
︸ ︷︷ ︸Three months effects
IndividualB turns 60
Septemberend
Firstpensionpaid to B
Octoberend︸ ︷︷ ︸
Contemporaneous effects
Householdsurvey
November
Note: The timeline shows that pension contemporaneous effects are defined by setting the end of
September as the date in which we observe if spouses were 60 or older and hence eligible for a pension
since a month can elapse between the 60th birthday and the first pension payment due to
administrative reasons and we observe our outcomes of interest in November in a yearly survey of
Bolivian households. In addition, we study three months effects by setting the end of June 2008 as the
date in which we observe if one or more spouses was 60 or older. To do so, we also drop observations
of individuals turning 60 between June and September as by the time outcomes are observed in the
household survey in November these individuals have received the pension for less than three months.
Section 2 offers additional information on the institutional setting and on the data.
40
10

equal to 1 in the survey data if a member worked over the week before
the survey interview and 0 otherwise. In addition, we define a dummy to
capture whether at least a spouse works and one to capture if they both
work. Finally, we measure living arrangements in a household with an el-
derly couple by setting a dummy equal to 1 if adult sons or daughters live
with in their elderly parents, a dummy to capture whether they work and,
in addition, a dummy to capture whether elderly’s grandchildren live in
the household.
Table 1 shows summary statistics of our outcomes of interest and of
baseline characteristics for households with spouses in a 40-80 age range
but separately by whether they obtain at least a pension. The left-hand
side panel shows means separately by whether both spouses in a household
were 60 or older, hence eligible for two pensions. We also assessed whether
differences between subgroups are significant and report the p-value of the
null hypothesis that they are zero. The right-hand side panel, instead,
shows means for the subgroup of households in which at least a spouse was
60.
[Table 1 about HERE]
The table shows that the difference between households with eligible
individuals and others in pension take-up is positive and highly significant,
as shown by low p-values in the third column in both panels. The differ-
ence varies between 60% and 90% depending on the number of pensions
received, with zero take-up for non-eligibles. The poverty rate decreases in
households with eligible individuals by about 10% and the extreme poverty
one by 30%, although only the latter change is significant. Differences in
income show a significant decrease in total income by about 25% for house-
holds with at least a pension while it is small and no longer significant in
per capita terms.
When we move to difference in individual and household decisions, we
find that beneficiaries’ labour supply decreases, with a greater magnitude
when two pensions are received. We also find that consumption of food,
in monetary terms, and of medicines, measured as a dummy equal to 1 if
medicines are purchased, increases significantly by 20-30% and 100% re-
spectively. Finally, when we look at whether extended family members,
7
11
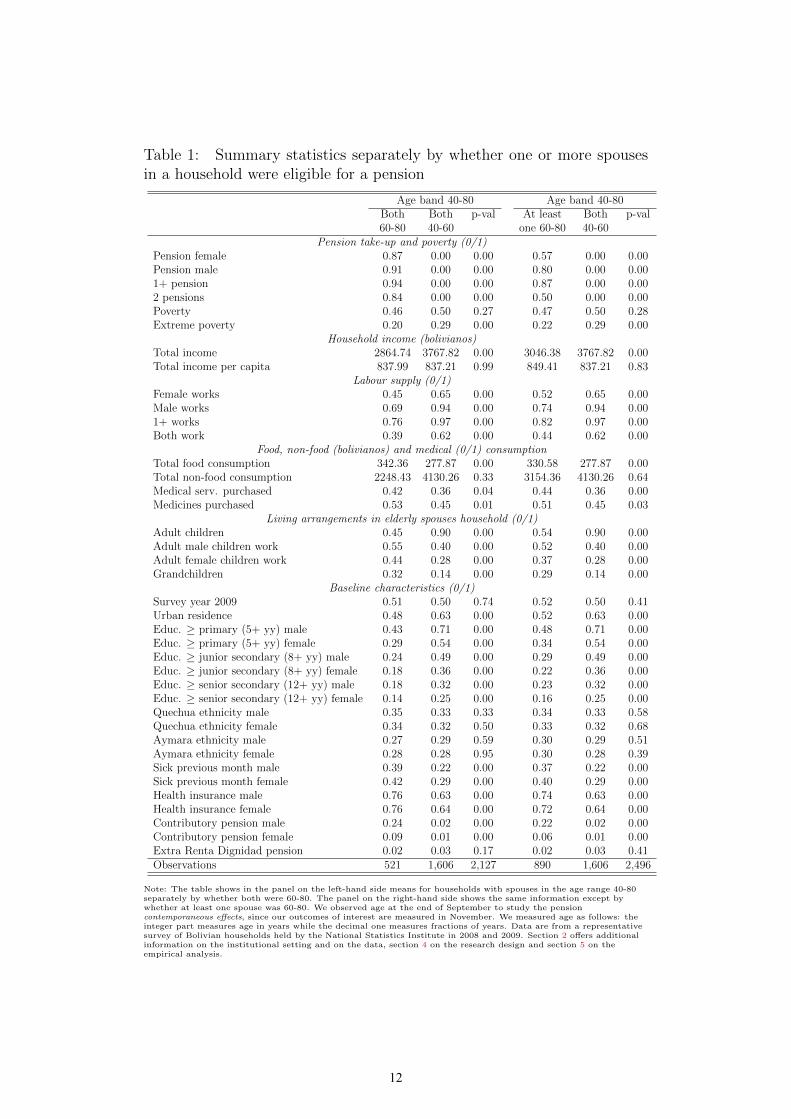
Table 1: Summary statistics separately by whether one or more spousesin a household were eligible for a pension
Age band 40-80 Age band 40-80Both Both p-val At least Both p-val60-80 40-60 one 60-80 40-60
Pension take-up and poverty (0/1)Pension female 0.87 0.00 0.00 0.57 0.00 0.00Pension male 0.91 0.00 0.00 0.80 0.00 0.001+ pension 0.94 0.00 0.00 0.87 0.00 0.002 pensions 0.84 0.00 0.00 0.50 0.00 0.00Poverty 0.46 0.50 0.27 0.47 0.50 0.28Extreme poverty 0.20 0.29 0.00 0.22 0.29 0.00
Household income (bolivianos)Total income 2864.74 3767.82 0.00 3046.38 3767.82 0.00Total income per capita 837.99 837.21 0.99 849.41 837.21 0.83
Labour supply (0/1)Female works 0.45 0.65 0.00 0.52 0.65 0.00Male works 0.69 0.94 0.00 0.74 0.94 0.001+ works 0.76 0.97 0.00 0.82 0.97 0.00Both work 0.39 0.62 0.00 0.44 0.62 0.00
Food, non-food (bolivianos) and medical (0/1) consumptionTotal food consumption 342.36 277.87 0.00 330.58 277.87 0.00Total non-food consumption 2248.43 4130.26 0.33 3154.36 4130.26 0.64Medical serv. purchased 0.42 0.36 0.04 0.44 0.36 0.00Medicines purchased 0.53 0.45 0.01 0.51 0.45 0.03
Living arrangements in elderly spouses household (0/1)Adult children 0.45 0.90 0.00 0.54 0.90 0.00Adult male children work 0.55 0.40 0.00 0.52 0.40 0.00Adult female children work 0.44 0.28 0.00 0.37 0.28 0.00Grandchildren 0.32 0.14 0.00 0.29 0.14 0.00
Baseline characteristics (0/1)Survey year 2009 0.51 0.50 0.74 0.52 0.50 0.41Urban residence 0.48 0.63 0.00 0.52 0.63 0.00Educ. ≥ primary (5+ yy) male 0.43 0.71 0.00 0.48 0.71 0.00Educ. ≥ primary (5+ yy) female 0.29 0.54 0.00 0.34 0.54 0.00Educ. ≥ junior secondary (8+ yy) male 0.24 0.49 0.00 0.29 0.49 0.00Educ. ≥ junior secondary (8+ yy) female 0.18 0.36 0.00 0.22 0.36 0.00Educ. ≥ senior secondary (12+ yy) male 0.18 0.32 0.00 0.23 0.32 0.00Educ. ≥ senior secondary (12+ yy) female 0.14 0.25 0.00 0.16 0.25 0.00Quechua ethnicity male 0.35 0.33 0.33 0.34 0.33 0.58Quechua ethnicity female 0.34 0.32 0.50 0.33 0.32 0.68Aymara ethnicity male 0.27 0.29 0.59 0.30 0.29 0.51Aymara ethnicity female 0.28 0.28 0.95 0.30 0.28 0.39Sick previous month male 0.39 0.22 0.00 0.37 0.22 0.00Sick previous month female 0.42 0.29 0.00 0.40 0.29 0.00Health insurance male 0.76 0.63 0.00 0.74 0.63 0.00Health insurance female 0.76 0.64 0.00 0.72 0.64 0.00Contributory pension male 0.24 0.02 0.00 0.22 0.02 0.00Contributory pension female 0.09 0.01 0.00 0.06 0.01 0.00Extra Renta Dignidad pension 0.02 0.03 0.17 0.02 0.03 0.41Observations 521 1,606 2,127 890 1,606 2,496
Note: The table shows in the panel on the left-hand side means for households with spouses in the age range 40-80separately by whether both were 60-80. The panel on the right-hand side shows the same information except bywhether at least one spouse was 60-80. We observed age at the end of September to study the pensioncontemporaneous effects, since our outcomes of interest are measured in November. We measured age as follows: theinteger part measures age in years while the decimal one measures fractions of years. Data are from a representativesurvey of Bolivian households held by the National Statistics Institute in 2008 and 2009. Section 2 offers additionalinformation on the institutional setting and on the data, section 4 on the research design and section 5 on theempirical analysis.
32
12
we find that the probability that adult children live with their elderly par-
ents is lower by 40-50% in a household receiving one or more pensions,
In contrast, the probability that adult children, females or males, live and
work in the house is higher by about 25%, similarly to the probability that
grandchildren live in the house, that doubles in magnitude.
The differences observed between households with eligible individuals
and others in our outcomes of interest may be driven by observable fac-
tors as we observe, for example, that measures of completed education are
higher in eligible households in the bottom panel of the table and, also to
unobservable factors.This highlights the importance of assessing whether
the correlation between pension eligibility and our outcomes of interest has
a causal interpretation.
3 Conceptual framework
Renta Dignidad non-contributory pension in Bolivia consists in a monthly
and life-long payment to all individuals who are 60 or older. Since the
age condition is the only one an individual needs to fulfill to receive the
pension, its recipients can afford greater consumption bundles than those
not obtaining it, i.e. a pure income effect. Its size in a household with two
elderly spouses may depend on the number of pensions received, that varies
from zero to two. In addition, when one pension is received in a household,
the beneficiary may be either the female or male spouse.
In a decision between leisure and consumption of a normal good, in-
dividuals experiencing a positive income shock can enjoy either the same
consumption level as those not experiencing it but working less or higher
consumption with no change in labour supply, or all combinations in be-
tween these two extreme cases. Evidence on beneficiaries’ consumption and
labour supply choices is in line with these predictions, with the magnitude
depending on pension size. While the consumption response to an income
shock tends to be positive, it may vary substantially by type of good or
service. For example, non-durables tend to be elastic to income shocks in
developing countries (Regmi et al., 2001; Abler, 2010). As for poor house-
holds, the pension income shock may, in the presence of credit constraints
limiting access to basic food or medicines, increase its consumption as soon
8
13

as first pension payments are received.
Evidence on living arrangements shows that they respond to pension
income shocks in order to improve, in addition to beneficiaries’ living con-
ditions, also that of their adult children and grandchildren indirectly, as
extended families are frequently observed in developing countries. This can
be rationalised as, on the one hand, beneficiaries are altruist towards other
family members, whose improvement in living conditions increases bene-
ficiaries’ utility in Becker (1974) and the more recent research that this
intuition induced. On the other, beneficiaries may rationally help younger
members of their extended family in exchange for help when in need of
assistance. This increases beneficiaries’ utility thanks to an improvement
primarily in own living conditions. In addition, beneficiaries may derive
(non-)material benefits from strategically inducing to implement their de-
cisions other family members, as it is shown in the case of bequests in
Bernheim et al. (1985).
More recent research has focused on a family network, to expand the
definition of extended family by including non-family members who are
linked, by way of friendship, risk-sharing agreements or similar ties, to a
program beneficiaries and may indirectly benefit from it. Evidence from de-
veloping countries shows that aid programs, be it conditional cash transfers
or social pensions, generate positive spillover effects on households with no
beneficiary (see for a survey Angelucci and Di Maro, 2015). Among several
mechanisms to rationalise this evidence, one gaining increasing attention
in the literature is the existence of informal agreements among households
engaged in a long-term relationship, broadly defined as contracts with lim-
ited commitment and enforceability (Albarran and Attanasio, 2003; Dubois
et al., 2008). Related evidence from PROGRESA in Mexico shows that it
has positive spillovers on consumption and investment decisions of non-
eligible households (Angelucci and De Giorgi, 2009; Angelucci et al., 2012).
In this paper we argue that, firstly, in a household with elderly spouses
their welfare, proxied for example by whether household income is above
the poverty line, may vary depending on the number of pensions they obtain
and on the decisions that the pension income may induce. Assuming that
spouses in a household have the same preferences over the allocation of the
pension income, the size of the income effect for a normal and divisible
9
14

good increases with the number of pensions. However, decisions over living
arrangements, such as hosting a grandchild, are discrete in nature and may
be taken, for example, only if both spouses obtain a pension.
Secondly, we argue that household behavioural responses to one or more
pensions may depend on beneficiaries’ gender. If the pension is received
only by a spouse in a household, own labour supply may decrease. If,
instead, both spouses receive a pension, labour supply may decrease for
females more than for males in the presence of gender differences in labour
supply elasticity, that can be driven by gender roles or productivity dif-
ferences in field work in developing countries.16 In addition, in both cases
an individual’s labour supply may also change thanks to the indirect ef-
fect of the spouse’s pension and, for example, decrease in the presence of
complementarity in spouses’ leisure time. However, female labour supply is
more likely to be influenced by male pension than vice versa, following the
aforementioned argument on prevalent gender roles in developing countries.
Similar motives may drive changes in living arrangements. However,
in such decisions, over which preferences by gender may differ markedly,
prevalent gender roles in developing countries tend to shift decision power
in the hands of the male spouse. Its magnitude may increase if the pension
is received by the male only or, vice versa, decrease or even change sign
if it is received by the female only, as related evidence on spouses’ rela-
tive bargaining power shows (Rangel, 2006; Bobonis, 2009; Attanasio and
Lechene, 2014).
While the foundations to understand intrahousehold bargaining be-
tween spouses were laid out in economics in the late 1980s (Chiappori,
1988, 1992), the impact of gender roles or differences is less clear-cut. This
gap is highlighted in a survey of studies on the extended family in Cox and
Fafchamps (2008) who suggest, as a possibility to fill it, testing predictions
from evolutionary biology. For example, according to Hamilton (1964a,b)
elderly may contribute to improve their adult children’s employment op-
portunities and their grandchildren’s education in an attempt to preserve
a family’s genes over time. In addition, their preferences over, for example,
grandchildren’s education may vary by elderly gender.
16Gender differences in labour supply elasticity are observed in developed countries(Blau and Kahn, 2007) and are rationalised theoretically using arguments based ongender roles (Albanesi and Olivetti, 2007).
10
15
Finally, a pension may jointly affect more than one household decision
at the same time. The pure income effect induced by one or more pen-
sions in a household may, for example, reduce poverty without modifying
household size. In contrast, it may have no impact on poverty if house-
hold size increases, since pension benefits are shared with extended family
members, or even reduce poverty if new living arrangements are more effi-
cient. In addition, the pension may induce a joint effect on poverty and on
living arrangements. While the implicit assumption in the design of non-
contributory pensions is a mechanical poverty reduction ceteris paribus, it
may not hold if household decisions affect extended family members.17
4 Research design
In this section we describe the empirical research design that we use to
estimate whether the positive income shock induced by the Renta Dignidad
pension and varying in beneficiaries’ number and gender across households,
influences their decisions and living conditions.
4.1 Regression discontinuity design
A linear regression of an outcome Y on a dummy P equal to 1 if an in-
dividual obtained the pension and 0 otherwise leads to spurious estimates
if individuals’ unobservable characteristics correlate with whether they re-
ceive a pension and how long they have received it for. We can, instead,
identify the pension effect locally at age 60 thanks to a regression dis-
continuity design (RDD) that exploits the jump in pension eligibility in
individuals’ age A at 60.
However, not all eligible individuals receive the pension as they must
apply for it. By considering the pension as the treatment, comparing out-
17In the related literature, the prevalent presumption was that consumption smooth-ing to a negative income shock is desirable from a welfare viewpoint (Townsend, 1994;Morduch, 1995). However, this is challenged theoretically by Chetty and Looney (2006)who point out that smoothing in the event of a negative shock may hide responses mak-ing a household worse-off in the future, for example if children are taken away fromschool to help with field work. Related empirical evidence from Thai households showsthat the presence of kins in a household makes its decisions less dependent on interhouse-hold transfers thanks to the income kins can generate either through self-production orin the labour market (Kinnan and Townsend, 2012).
11
16

comes of eligible and non-eligible individuals close to the 60 cutoff under
imperfect compliance with the treatment identifies the average effect of as-
signment into treatment or intention to treat effect (ITT) at the cutoff.
With incomplete take-up, the ITT effect is lower in absolute value than
the pension effect on those who actually receive it, the average treatment
effect on the treated (ATT). This is why we estimate the pension effect by
instrumenting pension receipt P with a pension eligibility dummy D equal
to 1 if an individual is 60 or older and 0 otherwise in a “fuzzy” RDD (Hahn
et al., 2001; Imbens and Lemieux, 2008).18
The pension effect can be identified at the cutoff by dividing the “jump”
in the relationship between pension eligibility and the outcome, i.e. the
ITT, by the fraction of individuals actually obtaining the pension, as shown
in equation (1).19 This is the Local Average Treatment Effect (LATE)
estimator, i.e. the ratio between the ITT or second stage in an instrumental
variable setting, and the fraction of individuals taking the treatment among
those eligible, or first stage, locally at the cutoff.
β =limε↓0 E[Y | A = 60 + ε]− limε↑0 E[Y | A = 60 + ε]
limε↓0 E[P | A = 60 + ε]− limε↑0 E[P | A = 60 + ε](1)
Receiving a pension may affect decisions taken by an individual, such
as labour supply and consumption. However, in a household such decisions
may also be influenced by an individual’s spouse and may vary depending
on whether no spouse, one or both spouses receive a pension and on the
beneficiary’s gender. Hence, to study the pension effect on decisions taken
at the household level, we modify the research design defined in equation
(1) as follows. Let AF measure female spouse age in a household, the
indicator DF = {AF ≥ 60} whether she is eligible for the pension and PF
be equal to 1 if she actually obtains it and 0 otherwise. We also define the
same variables for the male (M) spouse in a household.
18Although not all individuals who were eligible for the pension claimed it, the extentof the fuzziness is low since more than 80% of those eligible in the age range 60-80 claimedthe pension, as Table 1 shows, or about 60% when we take into account observablecharacteristics, as Table 2 shows.
19Hahn et al. (2001) proved the relationship between a treatment effect in an instru-mental variables setting and in a fuzzy RDD.
12
17

Yhh = β0 + β1PM + β2PF + β3PMPF + (2)
+f(AF − 60, AM − 60, DF , DM) + U1
Pi = δ0i + δ1iDM + δ2iDF + δ3iDMDF + (3)
+gi(AF − 60, AM − 60, DF , DM) + U2,i , i = F,M
The system in equations (2)-(3) shows the empirical specification that
we use to estimate pension number of beneficiaries and gender effects. β1
and β2 in equation (2) capture the effect that only a spouse, male and fe-
male respectively, obtains the pension on Yhh. β1 +β2 +β3, instead, capture
the effect that both spouses obtain a pension. Discontinuities in pension
eligibility by spouse in their age at 60 gives rise to a bi-dimensional RDD
with age by spouse rescaled at 60 as two forcing variables, that identifies
our effects of interest locally at 60. Equation (3) shows, instead, the rela-
tionship between take-up for spouse i, own pension eligibility and spouse
eligibility dummies, captured by δ1 and δ2, in a fuzzy RDD as take-up is
incomplete.20
f(·) = β4(AM − 60) + β5(AF − 60) + β6(AM − 60)(AF − 60) + (4)
+β7DM(AM − 60) + β8DF (AF − 60) + β9DM(AF − 60) +
+β10DF (AM − 60) + β11DM(AM − 60)(AF − 60) +
+β12DF (AM − 60)(AF − 60) + β13DFDM(AM − 60) +
+β14DFDM(AF − 60) + β15DFDM(AM − 60)(AF − 60)
The RDD polynomial f(·) in spouses’ age rescaled at 60 used in equa-
tion (2) is defined in equation (4). Parameters β5 − β8 capture trends in
husbands’ and wives’ own age and are allowed to differ by whether age
is 60 or greater while β9 − β15 capture gender differences in age trends.
20We are the first ones in studying social pension beneficiaries number and gendereffects thanks to a bi-dimensional RDD. In other fields, it has been used to assess theimpact of test scores (Papay et al., 2011), of taxation (Egger and Wamser, 2015) and ofcompetition in the airline industry (Snider and Williams, 2014). Additional informationabout theory on multi-dimensional RDD is available in Zajonc (2012) and Bertanha(2014).
13
18

Polynomial g(·) in equation (3) is defined analogously.
The RDD identifying assumption is absence or imperfect sorting by
individuals on either side of the age 60 cutoff. In other words, whether
an individual is barely younger or older than 60, for example in February
2008 when the pension was enacted, is a stochastic shock due to nature.
Although the identifying assumption is untestable, date of birth and, hence,
age in a small neighbourhood of the 60 cutoff is arguably exogenous. We
preview that the empirical distribution of age by gender is continuous at
the 60 cutoff, thus offering support to our research design validity. In
section 6.1, we will carefully discuss additional evidence in support of it,
by also assessing whether individuals’ age and baseline characteristics are
continuous at the 60 cutoff.21
4.2 Estimation
We use rich individual-level data on Bolivian households including the day,
month and year of birth to estimate equations (2)-(3). By using a local
linear regression in spouses’ age rescaled at the 60 cutoff and Two-Stage
Least Squares (2SLS), we interpret our estimates as the average effect of
the pensions number and beneficiaries’ gender on compliers at the cutoff,
i.e local LATE.22
Since data on our outcomes of interest were collected yearly at the
beginning of November and individuals obtained the pension about a month
after turning 60, we estimate the pension contemporaneous effect by setting
the eligibility dummy Di equal to 1 if spouse i turned 60 at the end of
September and 0 otherwise. For the sake of robustness, we also estimate
three months effects by setting the eligibility dummy to 1 for individuals
turning 60 at the end of June and 0 otherwise, as illustrated in Figure 2.
In addition, we drop observations of those individuals turning 60 between
June and September, as they have been eligible for the pension for less
than three months when outcomes are observed in the household survey in
November.23
21See Imbens and Lemieux (2008) and Lee and Lemieux (2010) for additional detailsabout the identifying assumption in a regression discontinuity design.
22Local linear regressions provide a nonparametric way of consistently estimating thetreatment effect in a RDD (Hahn et al., 2001; Porter, 2003).
23By dropping individuals becoming eligible for the pension between June and
14
19

Estimating the number and gender of beneficiaries effects thanks to a
fuzzy RDD with spouses’ age as running variables requires choosing the
bandwidth around the age 60 cutoff for each of running variable. If it is
too small, estimates are imprecise. If, in contrast, it is too large, they may
be biased as the comparison between the mean value of an outcome if age
is on the right-hand side of the cutoff and the value on the left-hand side
is little meaningful. Said differently, if the data sample chosen includes
observations far away from the age cutoff, the slope of the polynomial in
age is not properly accounted for.24
We select the optimal bandwidth by using the criterion in Papay et al.
(2011), that is based on model cross-validation and consists in four steps
. Step 1: an arbitrary bandwidth value is chosen to regress an outcome
on each spouse’s age, i.e. the running variables, and on their interaction,
separately for subgroups of households in which both spouses were eligible
for the pension, in which only one was, and in which nobody was. Step
2: predictions and prediction errors are obtained for all possible pairs of
age values for male and female spouses by using estimates obtained in step
1 over a range of age values around the 60 cutoff. Step 3: steps 1-2 are
repeated for approximately 1000 different pairs of bandwidth values. Step
4: mean squared prediction errors for each pair of bandwidth values are
computed to select as optimal joint bandwidth the one minimizing the
mean squared prediction error. In addition, we assess the sensitivity of the
estimates to using bandwidth values different than the optimal one.25
In all specifications we use a rectangular kernel, i.e. we estimate a linear
regression over a window of age rescaled at the 60 cutoff of width equal to
the optimal bandwidth value on both sides of the cutoff.26 We also correct
standard errors by using the sampling weights in the survey. These are
September we compare households in which at least one spouse obtained the pensionfor at least 3 months and those receiving no pension at the time of the survey.
24Bandwidth choice corresponds to choosing the width of the age bins used to com-pute means of an outcome, that are then plotted to graphically visualise the discontinuity(Lee and Lemieux, 2010).
25We preferred the bandwidth choice criterion proposed in Papay et al. (2011) overthe one proposed in Zajonc (2012) as the latter one is suitable to estimate a treatmenteffect locally at a discontinuity but only conditional on specific values of the runningvariables.
26A rectangular kernel has been chosen thanks to its simplicity with respect to moresophisticated ones, since kernel choice tends to have little impact in practice (Imbensand Lemieux, 2008).
15
20
the same when we use data at the individual and at the household level,
as the number of households in the primary sampling unit in the survey
varies from 80 to 350 based on the population density. Finally, we add
as baseline characteristics dummies for ethnicity, education, health status
and insurance, eligibility for a contributory pension, extra Renta Dignidad
pensions received by other household members, survey year and residential
area to increase the precision of the estimates.
5 Results
In this section we show estimates of the pension take-up and of the num-
ber and gender of beneficiaries effects on household decisions. Additional
results assessing the robustness of the main results to several changes to
our preferred specification and to the definition of key variables are shown
in Appendix A. Similarly, we show that our results are robust to estimat-
ing pension effects jointly on several outcomes, in Appendix B. Finally, we
show additional estimates of the effect of obtaining one or more pensions in
a household, although without accounting for spouses gender, in Appendix
C.
Estimates of contemporaneous pension effects on our outcomes of inter-
est using equation (2) are shown in Table 2, that is divided into five panels
by type of outcome. In each regression we report estimates of effects by
spouse gender and, in addition of the effect of two pensions, one per each
spouse, jointly with the p-value of the null hypothesis of no effect.27 In last
four rows in each panel we report the mean value of outcomes for households
in which no spouse is eligible for a pension, the optimal age bandwidths
used to select the data sample and the number of observations.28
[Table 2 about HERE]
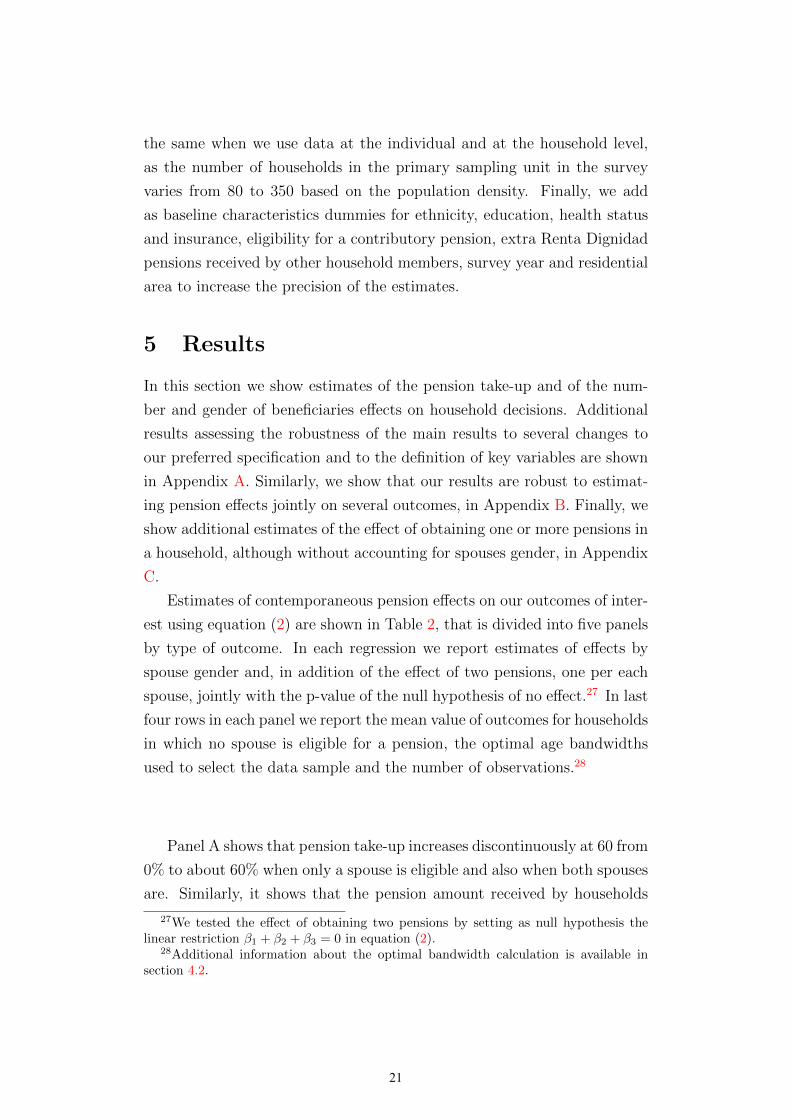
Panel A shows that pension take-up increases discontinuously at 60 from
0% to about 60% when only a spouse is eligible and also when both spouses
are. Similarly, it shows that the pension amount received by households
27We tested the effect of obtaining two pensions by setting as null hypothesis thelinear restriction β1 + β2 + β3 = 0 in equation (2).
28Additional information about the optimal bandwidth calculation is available insection 4.2.
16
21

Table 2: Contemporaneous pension effects
Panel A: Take-up & poverty Panel B: Income (bol.)Take-up Poverty (0/1) HH income Private transfers
(0/1) bol. per HH extreme total per received sentfemale (PF ) male (PM) both capita
PF 219.369∗∗∗ 0.171 -0.208 1032.299 438.131 570.204 9.808(24.649) (0.254) (0.183) (1817.989) (480.835) (745.162) (26.044)
PM 200.876∗∗∗ 0.127 -0.038 369.676 235.733 -235.933∗∗ 98.701∗∗
(11.046) (0.147) (0.139) (1167.074) (276.887) (118.391) (41.578)
PF ∗ PM -50.188 -0.361 0.138 -1439.396 -976.826 -308.479 -93.150(36.029) (0.406) (0.313) (3007.621) (752.060) (939.128) (91.157)
DF 0.662∗∗∗ 0.049 0.059(0.118) (0.053) (0.052)
DM 0.036 0.643∗∗∗ 0.042∗
(0.027) (0.075) (0.025)
DF ∗DM -0.111 -0.085 0.372∗∗∗
(0.138) (0.112) (0.093)
(AF − 60) 0.000 -0.000 -0.001 -0.377 -0.004 0.000 -18.228 -15.356 11.719∗ -2.029(0.001) (0.001) (0.000) (0.608) (0.008) (0.008) (66.127) (17.839) (6.688) (1.945)
(AM − 60) 0.000 0.000 -0.000 0.021 -0.011∗ 0.002 -67.711 -2.511 9.001∗ -3.241∗∗
(0.001) (0.001) (0.000) (0.470) (0.006) (0.006) (61.923) (14.990) (4.842) (1.425)
(AF − 60) * (AF − 60) 0.000 0.000 -0.000 -0.024 -0.000 0.000 -5.701 -1.801 0.591 -0.281∗∗∗
(0.000) (0.000) (0.000) (0.043) (0.001) (0.001) (5.737) (1.452) (0.430) (0.103)Joint effect 0.586∗∗∗ 0.606∗∗∗ 0.473∗∗∗ 370.057∗∗∗ -0.062 -0.108 -37.422 -302.962 25.791 15.359P-value (joint eff.) 0.000 0.000 0.000 0.000 0.752 0.498 0.977 0.304 0.928 0.786Mean value (ineligible HH) 0.000 0.000 0.001 97.568 0.493 0.291 3427.179 839.973 96.885 28.718Bandwidth female 20 20 20 20 20 19 20 20 20 20Bandwidth male 18 18 18 20 18 20 20 20 20 20Observations 2,358 2,358 2,358 2,486 2,358 2,389 2,486 2,486 2,486 2,486
Continued on the next page...
33
22

Continued from the previous page...
Panel C: Labour supply (0/1) Panel D: Consumption Panel E: Living arrangementsFemale Male 1+ spouse Both Total cons. (bol.) Purchase (0/1) Adult children (0/1) 1+ grandchild
food non-food medic. serv. medicines in HH male works fem. works (0/1) in HHPF -0.022 0.019 -0.006 -0.063 61.709 2734.866 0.125 0.609∗ -0.445 -0.153 0.200 -0.009
(0.240) (0.117) (0.125) (0.250) (128.699) (3033.443) (0.227) (0.341) (0.281) (0.299) (0.281) (0.230)
PM -0.265∗ 0.076 -0.053 -0.323∗ -34.233 5203.801 0.322∗ 0.707∗∗∗ -0.187 0.296 0.175 0.094(0.155) (0.104) (0.074) (0.173) (100.064) (5277.716) (0.183) (0.256) (0.160) (0.254) (0.234) (0.148)
PF ∗ PM -0.069 -0.301 -0.160 0.095 -29.412 -7406.710 -0.342 -0.662 0.761 0.411 -0.673 0.429(0.414) (0.242) (0.235) (0.432) (205.237) (8122.102) (0.418) (0.571) (0.507) (0.562) (0.549) (0.394)
(AF − 60) 0.002 0.009 0.013 0.002 3.322 -550.656 -0.011 -0.085∗∗∗ -0.003 -0.008 0.004 0.002(0.007) (0.006) (0.008) (0.010) (4.792) (362.073) (0.008) (0.027) (0.010) (0.009) (0.008) (0.007)
(AM − 60) 0.008 -0.002 0.002 0.011 7.022∗ -497.456 0.005 -0.031∗∗ -0.018∗∗∗ -0.003 0.005 0.003(0.006) (0.003) (0.003) (0.008) (4.252) (307.242) (0.006) (0.013) (0.006) (0.007) (0.006) (0.005)
(AF − 60) * (AF − 60) 0.000 0.000 0.001 0.001 0.367 -51.550 -0.000 -0.009∗∗∗ -0.001 -0.001 0.000 -0.000(0.001) (0.000) (0.001) (0.001) (0.381) (35.150) (0.001) (0.003) (0.001) (0.001) (0.001) (0.000)
Joint effect -0.356∗ -0.206 -0.219 -0.292 -1.936 531.957 0.105 0.655∗∗ 0.128 0.554∗∗ -0.298 0.514∗∗
P-value (joint eff.) 0.098 0.153 0.108 0.215 0.986 0.901 0.619 0.029 0.658 0.046 0.320 0.012Mean value (ineligible HH) 0.608 0.878 0.920 0.574 324.556 4593.873 0.360 0.465 0.722 0.416 0.312 0.186Bandwidth female 20 20 19 19 18 20 20 16 20 20 20 20Bandwidth male 20 20 10 15 20 20 20 7 11 20 20 19Observations 2,486 2,486 1,418 2,055 2,281 2,469 2,486 973 1,554 1,869 1,869 2,426
Note: The table shows estimates of pension take-up (Pi) as a function of the eligibility dummy (Di) by spouse i in a household and of its effects on income, labour supply, consumption and livingarrangements. We obtained them thanks to a fuzzy regression discontinuity design (RDD) exploiting the discontinuity in pension eligibility at age 60 by instrumenting pension take-up witheligibility for each spouse in a household and adding RDD polynomials in in their age (Ai) rescaled at 60. At the bottom of the panel estimates of the effect of two pensions are shown, along withthe associated p-value. We observed age at the end of September to study contemporaneous effects because it can take up to a month since the 60th birthday to obtain the pension and ouroutcomes of interest are measured in November. We measured age as follows: the integer part measures age in years while the decimal one measures fractions of years. We included as covariatesdummies for the survey year, ethnicity, education level, ethnicity, health and insurance status, contributory or extra Renta Dignidad pensions received in a household and urban residence. Wecorrected standard errors by using survey weights. The last four rows show mean values of outcomes for households with no pension, the optimal bandwidth used in the regressions and the numberof observations. Significance levels are as follows: * p < 0.10, ** p < 0.05, *** p < 0.01. Data are from a representative survey of Bolivian households held by the National Statistics Institute in2008 and 2009. Section 2 offers additional information on the institutional setting and on the data, section 4 on the research design and section 5 on the empirical analysis.
34
23

with one or more beneficiaries also increases significantly by 200-370 boli-
vianos with respect to households in which no pension is received, coun-
terfactual households hereafter. The remaining two columns in panel A
show estimates of contemporaneous effects on the probability that a house-
hold income is lower than the poverty line and the extreme poverty line,
by using as outcomes a dummy equal to 1 if a household is poor. When
only a pension is received, poverty increases by up to 17 percentage points,
pp hereafter, or by 30% of the mean value of counterfactual households,
hereafter shown in parenthesis. Extreme poverty, instead, decreases by up
to 20 pp (66%) when one or more pensions are received. However, these
effects are not significant.
Panel B in Table 2 shows estimates of pension effects on household
income. The first two columns show that total income and total income
per capita increase between 235 and 1030 bolivianos (10-50%), depending
on who obtained the pension, although the effect is not significant. The last
two columns show a decrease by 236 bolivianos (245%) in transfers received
from other households and, in addition, an increase by 98 bolivianos (350%)
in the transfers sent to other households when only the male obtained the
pension.
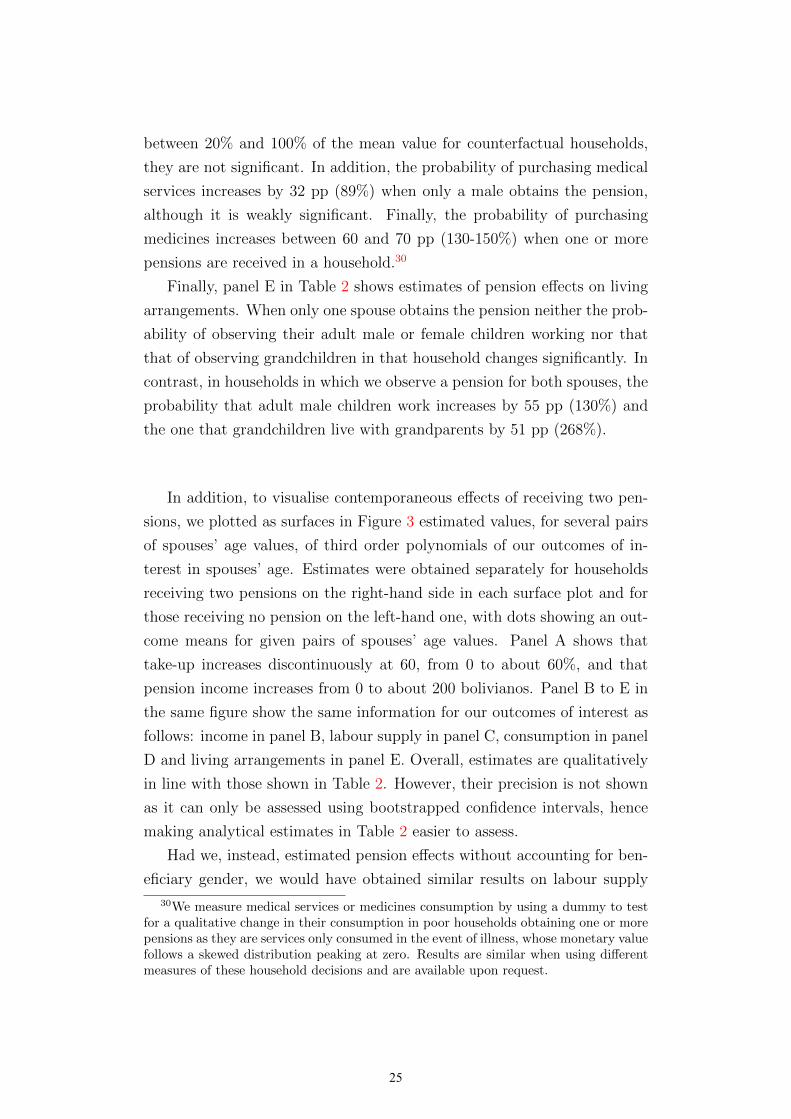
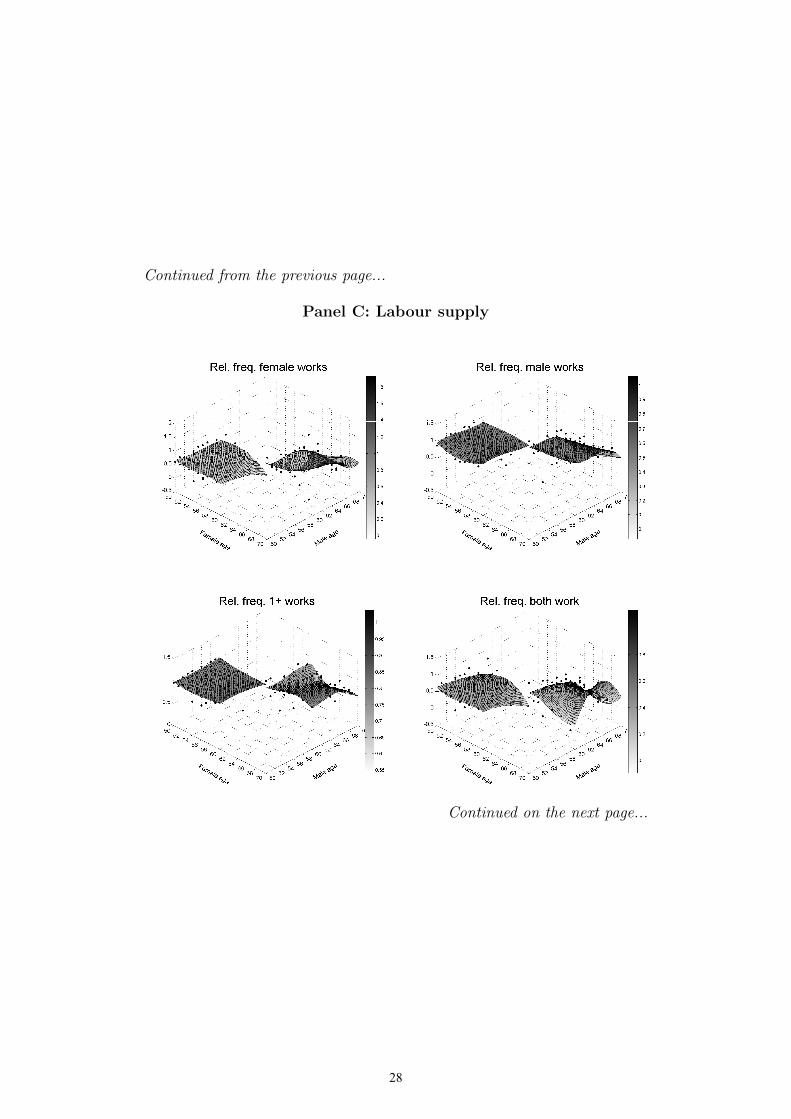
Panel C in Table 2 shows estimates for labour supply. The probability
that a wife works decreases by about 27 pp (43%) when her husband ob-
tained the pension and by 36 pp (59%) when both obtained it, although
these effects are weakly significant. Conversely, the effect on the probabil-
ity that the husband works is not significant. In addition, the probability
that one or more spouses in a household works tends to decrease when
one or more pensions are received. However, the only significant effect,
by about 21 pp (23%) albeit weakly, is observed when both spouses ob-
tained it. Finally, a pension to the male decreases the probability that
both spouses work by 32 pp (56%), although weakly, while the negative
effect of receiving two pensions is not significant.29
Panel D in Table 2 shows estimates for consumption. The sign of the
effect on total food consumption depends on beneficiary gender while the
one on non-food consumption is positive. Although point estimates vary
29Results are similar when using measures of the intensive margin of household laboursupply and are available upon request.
17
24
between 20% and 100% of the mean value for counterfactual households,
they are not significant. In addition, the probability of purchasing medical
services increases by 32 pp (89%) when only a male obtains the pension,
although it is weakly significant. Finally, the probability of purchasing
medicines increases between 60 and 70 pp (130-150%) when one or more
pensions are received in a household.30
Finally, panel E in Table 2 shows estimates of pension effects on living
arrangements. When only one spouse obtains the pension neither the prob-
ability of observing their adult male or female children working nor that
that of observing grandchildren in that household changes significantly. In
contrast, in households in which we observe a pension for both spouses, the
probability that adult male children work increases by 55 pp (130%) and
the one that grandchildren live with grandparents by 51 pp (268%).
[Figure 3 about HERE]
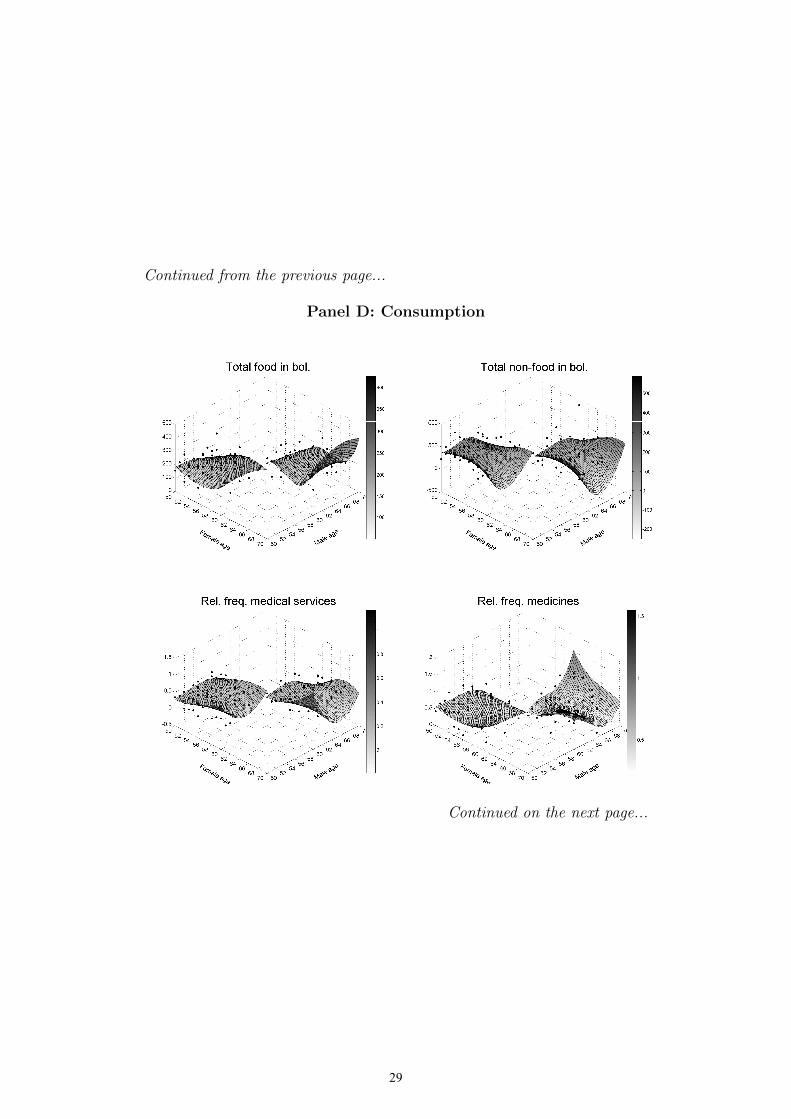
In addition, to visualise contemporaneous effects of receiving two pen-
sions, we plotted as surfaces in Figure 3 estimated values, for several pairs
of spouses’ age values, of third order polynomials of our outcomes of in-
terest in spouses’ age. Estimates were obtained separately for households
receiving two pensions on the right-hand side in each surface plot and for
those receiving no pension on the left-hand one, with dots showing an out-
come means for given pairs of spouses’ age values. Panel A shows that
take-up increases discontinuously at 60, from 0 to about 60%, and that
pension income increases from 0 to about 200 bolivianos. Panel B to E in
the same figure show the same information for our outcomes of interest as
follows: income in panel B, labour supply in panel C, consumption in panel
D and living arrangements in panel E. Overall, estimates are qualitatively
in line with those shown in Table 2. However, their precision is not shown
as it can only be assessed using bootstrapped confidence intervals, hence
making analytical estimates in Table 2 easier to assess.
Had we, instead, estimated pension effects without accounting for ben-
eficiary gender, we would have obtained similar results on labour supply
30We measure medical services or medicines consumption by using a dummy to testfor a qualitative change in their consumption in poor households obtaining one or morepensions as they are services only consumed in the event of illness, whose monetary valuefollows a skewed distribution peaking at zero. Results are similar when using differentmeasures of these household decisions and are available upon request.
18
25
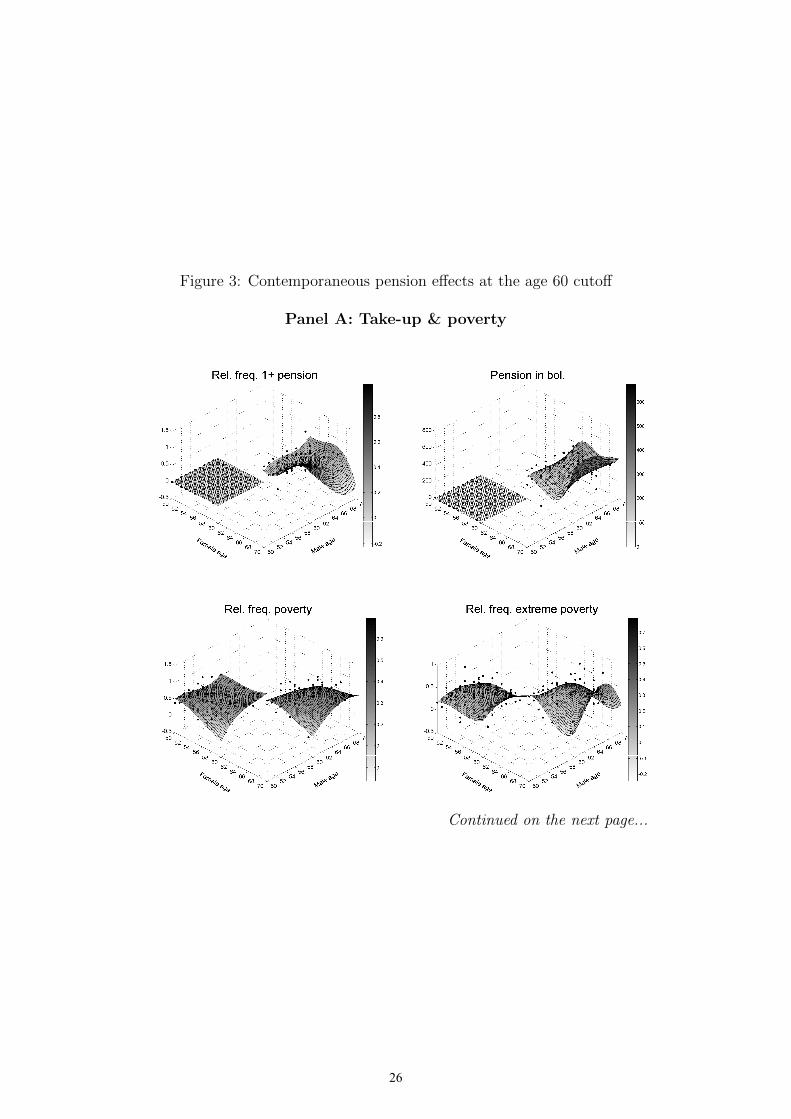
Figure 3: Contemporaneous pension effects at the age 60 cutoff
Panel A: Take-up & poverty
Continued on the next page...
41
26

Continued from the previous page...
Panel B: Income
Continued on the next page...
42
27
Continued from the previous page...
Panel C: Labour supply
Continued on the next page...
43
28
Continued from the previous page...
Panel D: Consumption
Continued on the next page...
44
29

Continued from the previous page...
Panel E: Living arrangements
Note: The figure shows two surfaces obtained by estimating third order polynomials of an outcome in female andmale spouse age separately for households receiving two pensions on the right-hand side in each surface plot and forthose not receiving any on the left-hand side. In addition, dots show mean values of an outcome for a given femaleand male pair of age values. Five sets of household decisions are shown in different panels. Age is defined as follows:the integer part measures age in years while the decimal one measures fractions of years. We observed age at the endof September to study pension contemporaneous effects since a month can elapse between the 60th birthday and thefirst pension payment due to administrative reasons and our outcomes of interest are measured in November. Dataare from a representative survey of Bolivian households held by the National Statistics Institute in 2008 and 2009.Section 2 offers additional information on the institutional setting and on the data, section 4 on the research designand section 5 on the empirical analysis.
45
30

decisions, although less precise, and on consumption, as shown in Appendix
C. In contrast, we would have failed to uncover substantive effects on living
arrangements involving beneficiaries’ adult children and grandchildren. In
addition, had we also failed to account for the fact that certain decisions,
for example over living arrangements, may be taken jointly by spouses in
a household and depend on their bargaining power, we would have mis-
takenly concluded that the pension has no effect on beneficiaries’ labour
supply, as shown in Appendix D.
6 Research design validity
In this section we firstly discuss our research design validity and then we
present a falsification test.
6.1 Forcing variables and baseline characteristics
Consider an experiment in which subjects are barely younger or older than
60, the treatment consists in receiving a pension and the assignment of
subjects to the treated group is random. A RDD identifies the effect of the
pension locally at the age 60 cutoff by mimicking such an experiment in a
quasi-experimental setting.
The untestable RDD identifying assumption is that individuals are un-
able to sort themselves into the treated group, or out of it, by manipulating,
for example, their age or date of birth. We offer evidence in support of this
assumption by assessing empirically, first, whether the age distribution by
spouse gender is smooth at the age 60 cutoff and, second, whether individ-
uals’ baseline characteristics are balanced at the cutoff.31
Since an individual’s date of birth is a predetermined characteristic, we
expect a smooth age distribution at 60 for both females and males, in the
absence of manipulation. In contrast, an age histogram showing that bins
height on the right-hand side of the cutoff is, for example, greater than
on the left-hand side suggests that individuals sorted themselves into the
31See Lee and Lemieux (2010) for a discussion of RDD identifying assumption andvalidity.
19
31
pension.32
[Figure 4 about HERE]
The top panel in Figure 4 shows age histograms, separately by spouse
gender in a household, with 90 days as bin width. This ensures that a
jump can be detected visually as no bin contains 60, the cutoff value.
Visual inspection suggests no suspicious jump in histogram bins height
at the cutoff, hence supporting the validity of the research design. This
result is confirmed by the density-based test of the null hypothesis of no
manipulation in McCrary (2008), as shown in the bottom panel in Figure
4 by the overlapping confidence intervals of the difference in age density,
shown as dashed lines, at the 60 cutoff.
[Figure 5 about HERE]
In addition, in the absence of manipulation, we expect no difference in
individuals’ baseline characteristics between those who were barely younger
than 60 and those barely older, as such characteristics are predetermined.
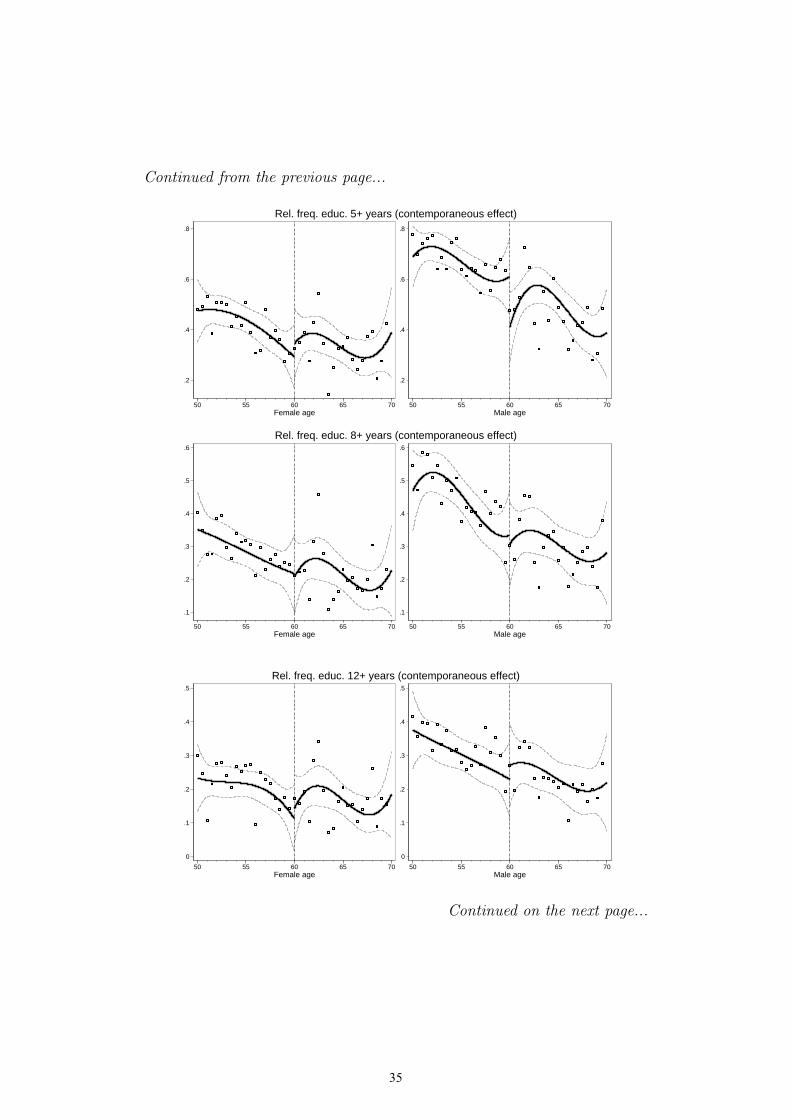
Figure 5 shows fitted values of RDD polynomials in age of each baseline
characteristic, estimated separately by whether individuals are at least 60,
as well as by gender. Overall, differences in baseline characteristics at the
cutoff are small and not significant, as shown by the overlapping confidence
intervals dashed lines. Results are unchanged if we estimate differences in
baseline characteristics at the 60 cutoff by regressing each of them on the
RDD polynomial in spouses’ age rescaled at 60 and separately by whether
individuals are at least 60, as shown by small and non-significant estimates
in Table 3.33
[Table 3 about HERE]
32See Camacho and Conover (2011) for an example of manipulation of a score basedon demographics and income at a cutoff used to allocate individuals to a social programin Colombia. Individuals not truthfully reporting this information and complacent localpoliticians lead to the observed jump at the cutoff.
33We also tested the null hypothesis that differences in all baseline characteristicsat the age 60 cutoff are jointly zero by estimating a system of seemingly unrelatedregressions of each baseline characteristic on pension by gender dummies and the RDDpolynomial in equation (2), and testing whether coefficients associated to the pensiondummy by gender in each equation are jointly zero. Large p-values in Table A.3 inAppendix A suggest that baseline characteristics by spouse gender are jointly balanced,thus supporting the research design validity.
20
32
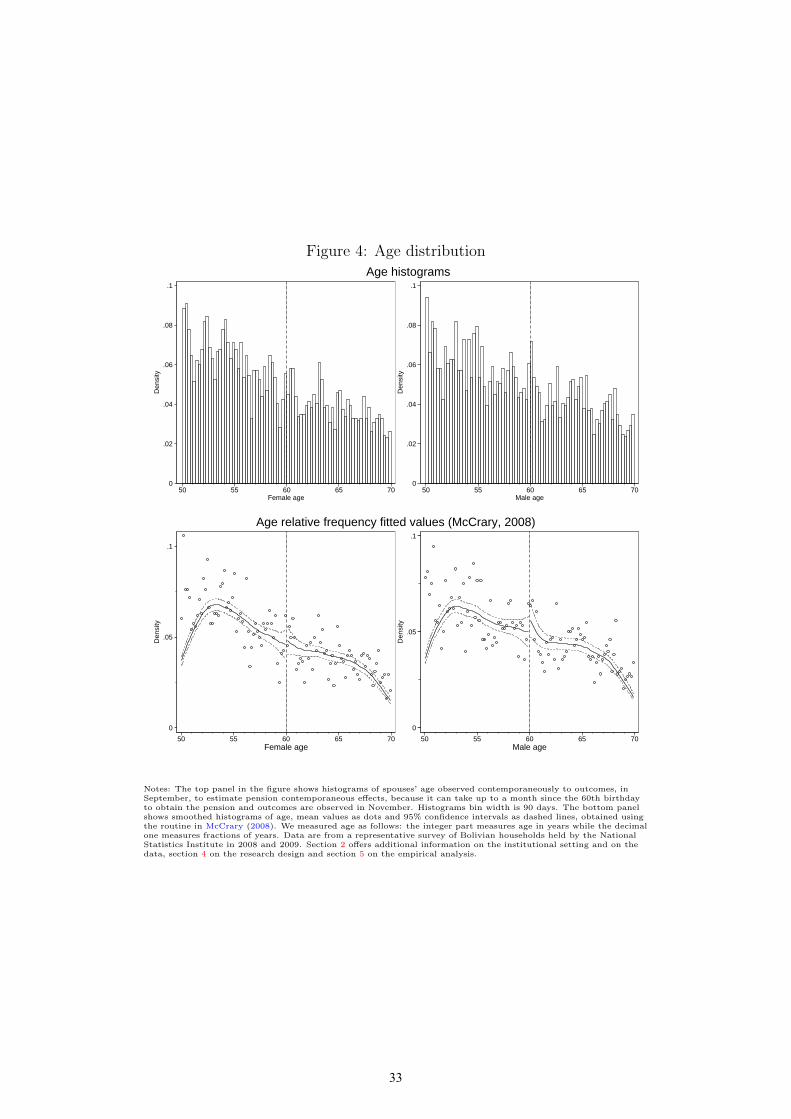
Figure 4: Age distribution
0
.02
.04
.06
.08
.1
Den
sity
50 55 60 65 70Female age
0
.02
.04
.06
.08
.1
Den
sity
50 55 60 65 70Male age
Age histograms
0
.05
.1
Den
sity
50 55 60 65 70Female age
0
.05
.1
Den
sity
50 55 60 65 70Male age
Age relative frequency fitted values (McCrary, 2008)
Notes: The top panel in the figure shows histograms of spouses’ age observed contemporaneously to outcomes, inSeptember, to estimate pension contemporaneous effects, because it can take up to a month since the 60th birthdayto obtain the pension and outcomes are observed in November. Histograms bin width is 90 days. The bottom panelshows smoothed histograms of age, mean values as dots and 95% confidence intervals as dashed lines, obtained usingthe routine in McCrary (2008). We measured age as follows: the integer part measures age in years while the decimalone measures fractions of years. Data are from a representative survey of Bolivian households held by the NationalStatistics Institute in 2008 and 2009. Section 2 offers additional information on the institutional setting and on thedata, section 4 on the research design and section 5 on the empirical analysis.
46
33
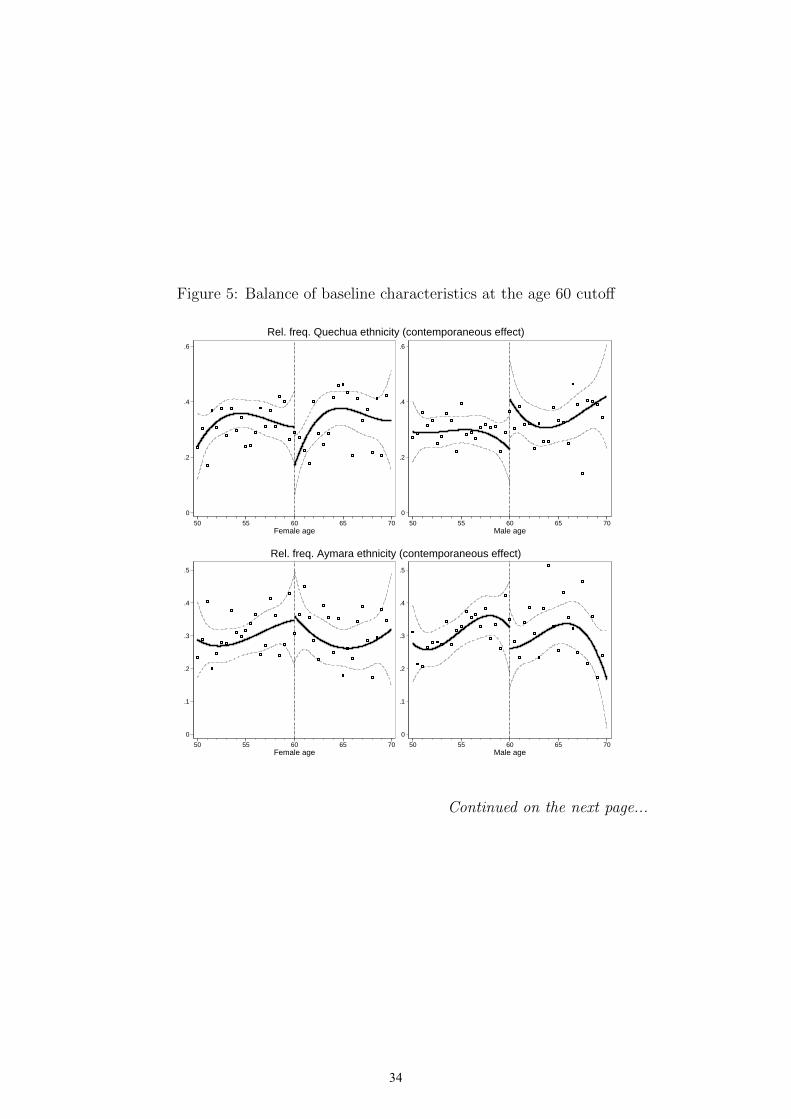
Figure 5: Balance of baseline characteristics at the age 60 cutoff
0
.2
.4
.6
50 55 60 65 70Female age
0
.2
.4
.6
50 55 60 65 70Male age
Rel. freq. Quechua ethnicity (contemporaneous effect)
0
.1
.2
.3
.4
.5
50 55 60 65 70Female age
0
.1
.2
.3
.4
.5
50 55 60 65 70Male age
Rel. freq. Aymara ethnicity (contemporaneous effect)
Continued on the next page...
47
34
Continued from the previous page...
.2
.4
.6
.8
50 55 60 65 70Female age
.2
.4
.6
.8
50 55 60 65 70Male age
Rel. freq. educ. 5+ years (contemporaneous effect)
.1
.2
.3
.4
.5
.6
50 55 60 65 70Female age
.1
.2
.3
.4
.5
.6
50 55 60 65 70Male age
Rel. freq. educ. 8+ years (contemporaneous effect)
0
.1
.2
.3
.4
.5
50 55 60 65 70Female age
0
.1
.2
.3
.4
.5
50 55 60 65 70Male age
Rel. freq. educ. 12+ years (contemporaneous effect)
Continued on the next page...
48
35

Continued from the previous page...
0
.2
.4
.6
.8
50 55 60 65 70Female age
0
.2
.4
.6
.8
50 55 60 65 70Male age
Rel. freq. ill (contemporaneous effect)
.4
.6
.8
1
50 55 60 65 70Female age
.4
.6
.8
1
50 55 60 65 70Male age
Rel. freq. health insurance (contemporaneous effect)
0
.1
.2
.3
.4
50 55 60 65 70Female age
0
.1
.2
.3
.4
50 55 60 65 70Male age
Rel. freq. contributory pension (contemporaneous effect)
Continued on the next page...
49
36

Continued from the previous page...
.2
.4
.6
.8
50 55 60 65 70Female age
.2
.4
.6
.8
50 55 60 65 70Male age
Rel. freq. urban residence (contemporaneous effect)
-.05
0
.05
.1
.15
50 55 60 65 70Female age
-.05
0
.05
.1
.15
50 55 60 65 70Male age
Rel. freq. other RD pension (contemporaneous effect)
Note: The figure shows estimates of the difference in baseline characteristics at age 60 between individuals who wereeligible for the pension as they were 60 or older and those who were not as they were younger at the end of Septemberto assess whether baseline characteristics are balanced. We obtained estimates separately for females and males byregressing a baseline characteristic on the RDD polynomial in age rescaled at 60 separately by spouse and by whetheran individual was at least 60. Continuous lines show predicted values and dashed ones 95% confidence intervals. Weobserved age at the end of September to study contemporaneous pension effects because it can take up to a monthsince the 60th birthday to obtain the pension and our outcomes of interest are measured in November. The integerpart of age measures it in years while the decimal one in fractions of years. Data are from a representative survey ofBolivian households held by the National Statistics Institute in 2008 and 2009. Section 2 offers additional informationon the institutional setting and on the data, section 4 on the research design and section 5 on the empirical analysis.
50
37

Table 3: Balance of baseline characteristics by spouse at the age 60 cutoff
Panel A: Females
Ethnicity Education (years) Health Contributory Household characteristicsQuechua Aymara 5+ 8+ 12+ sick spell insurance pension 1+ extra Renta Dig. urban
PF 0.389 -0.187 -0.100 -0.261 -0.169 0.034 -0.088 -0.071 0.142 -0.078(0.322) (0.273) (0.277) (0.300) (0.157) (0.289) (0.297) (0.062) (0.111) (0.310)
PM 0.137 -0.240 -0.147 0.116 0.003 -0.135 -0.341∗ -0.095 0.034 -0.032(0.174) (0.161) (0.161) (0.192) (0.153) (0.168) (0.206) (0.062) (0.039) (0.154)
PF ∗ PM -0.694 0.320 0.317 0.175 0.386 0.107 0.178 0.313∗ -0.218 0.059(0.493) (0.407) (0.417) (0.476) (0.324) (0.455) (0.481) (0.169) (0.143) (0.449)
(AF − 60) -0.013 0.020∗∗∗ 0.003 -0.001 -0.007 0.005 0.010 0.000 -0.005∗ 0.004(0.011) (0.007) (0.009) (0.015) (0.012) (0.011) (0.025) (0.004) (0.003) (0.008)
(AM − 60) 0.001 0.014∗∗ -0.016∗∗ -0.012 -0.011 0.013∗ -0.001 0.003∗ -0.002 -0.002(0.009) (0.006) (0.007) (0.015) (0.010) (0.007) (0.011) (0.002) (0.002) (0.006)
(AF − 60) * (AF − 60) -0.001 0.002∗∗∗ 0.000 0.001 -0.000 0.000 -0.000 0.000 -0.000∗ 0.000(0.001) (0.001) (0.001) (0.002) (0.002) (0.001) (0.003) (0.000) (0.000) (0.001)
Joint effect -0.168 -0.108 0.070 0.029 0.220 0.006 -0.251 0.147 -0.043 -0.052P-value (joint eff.) 0.472 0.524 0.703 0.898 0.242 0.977 0.343 0.214 0.398 0.789Mean value (ineligible HH) 0.324 0.300 0.460 0.273 0.211 0.332 0.650 0.030 0.027 0.540Bandwidth female 15 20 19 10 11 20 20 20 20 20Bandwidth male 20 20 19 14 15 14 7 12 20 20Observations 1,823 2,409 2,266 1,114 1,254 1,889 937 1,641 2,409 2,409
Continued on the next page...
35
38

Continued from the previous page...
Panel B: Males
Ethnicity Education (years) Health ContributoryQuechua Aymara 5+ 8+ 12+ sick spell insurance pension
PF 0.342 0.018 0.415 0.148 0.214 0.004 -0.309 -0.054(0.312) (0.281) (0.309) (0.301) (0.265) (0.279) (0.310) (0.216)
PM -0.345∗ -0.156 0.046 -0.042 -0.173 0.098 -0.323 0.191(0.182) (0.160) (0.160) (0.188) (0.170) (0.187) (0.212) (0.136)
PF ∗ PM -0.163 0.044 -0.656 -0.313 -0.149 -0.263 0.340 -0.160(0.522) (0.414) (0.452) (0.463) (0.420) (0.437) (0.493) (0.339)
(AF − 60) 0.022 0.023∗∗∗ -0.006 0.005 0.012 0.001 0.017 0.012(0.024) (0.007) (0.008) (0.015) (0.008) (0.015) (0.027) (0.008)
(AM − 60) 0.014 0.012∗∗ -0.013∗∗ -0.012 -0.005 -0.024∗∗ 0.001 0.006(0.010) (0.006) (0.007) (0.014) (0.010) (0.010) (0.013) (0.004)
(AF − 60) * (AF − 60) 0.003 0.002∗∗∗ -0.000 0.001 0.001 -0.002 0.001 0.001(0.003) (0.001) (0.001) (0.002) (0.001) (0.002) (0.003) (0.001)
Joint effect -0.166 -0.094 -0.195 -0.207 -0.108 -0.161 -0.292 -0.023P-value (joint eff.) 0.586 0.577 0.318 0.362 0.579 0.439 0.284 0.883Mean value (ineligible HH) 0.314 0.305 0.642 0.370 0.271 0.300 0.655 0.092Bandwidth female 20 20 20 11 12 19 16 20Bandwidth male 7 20 20 17 20 9 7 9Observations 939 2,409 2,408 1,286 1,445 1,196 894 1,203
Note: The table shows estimates of the difference in the baseline characteristics between individuals who obtain the pension (Pi=1) as they are 60 or older and those who do not (Pi=0) as they areyounger than 60 at the time of the household survey. We obtained them thanks to a fuzzy regression discontinuity design (RDD) exploiting the discontinuity in pension eligibility (Di) at age (Ai)60 by spouse i. Running variables are spouses’ age: their integer part measures age in years while the decimal one measures fractions of years. We regressed a spouse’s baseline characteristic using2SLS and instrumenting pension take-up at the end of September with eligibility and on the RDD polynomial in age rescaled at 60 to assess whether baseline characteristics are balanced. Firststage estimates are shown in Panel A in Table 2. Data are from a representative survey of Bolivian households held by the National Statistics Institute in November 2008 and 2009. We correctedstandard errors by using the survey weights. At the bottom of the panel estimates of the difference when both spouses obtain a pension are shown, along with the associated p-value. The last fourrows show mean values of baseline characteristics for households with no pension, the optimal bandwidth used in the regressions and the number of observations. Significance levels are as follows: *p < 0.10, ** p < 0.05, *** p < 0.01. Section 2 offers additional information on the institutional setting and on the data and section 4 on the research design.
36
39
Although household characteristics for the same household cannot be
measured over time due to the household survey repeated cross-section de-
sign, our estimates of the pension effect on household decisions, particularly
household size, do not suffer from reverse causality since our RDD compares
households with spouses barely younger than 60, i.e. control households,
with households in which one more of them is barely older than 60, i.e.
treated ones. By design, control and treated households should be very
similar in observable predetermined characteristics, such as education, as
the assignment to treatment locally at the 60 cutoff mimics that of an
experimental design.
Earlier on in this section, we carefully assessed, firstly, whether prede-
termined characteristics are balanced by treatment status and, secondly,
if self-selection into the pension, although not possible in theory, occurs
de facto, which can be detected by testing whether the distribution of in-
dividuals’ age is continuous at the 60 cutoff. Our findings confirm that
households in the treated and control group are similar in a rich set of
observable characteristics and that self-selection of non-eligible households
into the pension is not a concern.
In addition, by estimating a fuzzy RDD we focus on the causal effect for
compliers who, in our research design, are individuals who are 60 or older
and receive one or more pension in a household. However, fuzzy RDD esti-
mates and reduced-form estimates, not shown but available upon request,
are qualitatively and quantitatively in line, as the contemporaneous take-up
rate ranges from 60% to 90% and converges to about 100% in households in
which one or more pensions have been received for three months or longer.
Finally, results not shown in the paper but available upon request show
that the probability that an extra extended family member, other than
spouses’ children or grandchildren, lives in a household receiving one or
more pensions is small and not significant.
6.2 Falsification test
Finally, we assessed whether 2008, the year in which Renta Dignidad was
introduced, and 2009, are the only ones in which a change in our outcomes
of interest at age 60 is observed. We estimated the effect of turning 60 in
2006 and 2007, before the pension was enacted, using the reduced form of
21
40
equations (2)-(3) and data for 2006 and 2007 by gender. Small and not
significant estimates, shown in Table 4, of being 60 or older in 2006 or in
2007 exclude that our main results are driven by confounding factors at 60,
such as demographic ones or pension anticipation effects, thus supporting
the research design validity.34
[Table 4 about HERE]
7 Discussion and conclusion
First, our results enrich the existing evidence on non-contributory pensions
in Bolivia. Escobar Loza et al. (2013) find that Renta Dignidad increases
per capita income and consumption and decreases poverty, mainly driven by
urban households. Differences with respect to our paper, that shows a small
and non-significant effect on consumption and poverty, are potentially due
to the fact that they do not account for spouse pension direct and indirect
effects and, also, to the fact that they use data from an ad-hoc survey only
on individuals within 5 years from the age 60 cutoff.
Changes in non-contributory pension policies in Bolivia, instead, are
studied in Martinez (2004) and Hernani-Limarino and Mena (2015), re-
spectively exploiting a suspension of Bonosol and the change to Renta
Dignidad, that lowered the age eligibility cutoff from 65 to 60. Differ-
ently from Martinez (2004), we do not find evidence of credit constraints
in home-production and consumption for poor households in rural areas,
in results available upon request. We find, instead, evidence in line with
credit constraints in medicines consumption, that is greater for beneficia-
ries, although we cannot learn whether it is driven by their health needs
or by members of the extended family moving in with them. As for our
evidence on the decrease in female labour supply, it is partly in line with
the one in Hernani-Limarino and Mena (2015), although in our paper it is
driven by spouse pension indirect effect rather than by own pension effect.
Second, finding that a universal pension has a small and non-significant
short-term effect on poverty may look somewhat puzzling. However, it is
34The results are similar for three months pension effects, i.e. when setting the agedummy equal to 1 if an individual obtained the pension at the end of June, as shown inTable A.4.
22
41

Table 4: Falsification test of contemporaneous pension effects
Panel A: Poverty Panel B: IncomePoverty (0/1) HH income Private transfers
extreme total per received sentcapita
DAF 0.257 0.380 -1396.541 -543.120∗ -121.298∗∗ 21.510(0.173) (0.283) (984.290) (282.405) (60.193) (17.246)
DAM -0.032 -0.028 174.575 -169.685 -11.730 10.664(0.127) (0.101) (1001.162) (261.106) (47.951) (16.154)
DAF ∗DAM -0.354 -0.350 3216.969∗∗ 1043.700∗∗ 90.746 -2.162(0.218) (0.307) (1492.668) (408.783) (90.443) (21.366)
(AF − 60) 0.011 0.007 96.820 38.106∗ -0.464 -0.747(0.011) (0.010) (73.874) (20.520) (3.710) (2.424)
(AM − 60) -0.001 -0.002 33.075 23.089 3.708 -4.738∗∗
(0.007) (0.008) (53.690) (14.994) (2.802) (2.409)
(AF − 60) * (AF − 60) 0.001 0.001 3.268 1.389 -0.013 -0.171(0.001) (0.001) (5.308) (1.402) (0.285) (0.223)
Joint effect -0.129 0.001 1995.002∗ 330.896 -42.282 30.011∗
P-value (joint eff.) 0.274 0.995 0.093 0.360 0.497 0.063Mean value (ineligible HH) 0.535 0.342 2808.632 681.445 51.899 24.074Bandwidth female 20 19 20 20 20 20Bandwidth male 18 20 20 20 20 20Observations 1,176 1,158 8,196 1,229 1,229 8,196 1,229 1,229
Continued on the next page...
37
42

Continued from the previous page...
Panel C: Labour supply (0/1) Panel D: Consumption Panel E: Living arrangementsFemale Male 1+ spouse Both Total cons. (bol.) Purchase (0/1) Adult children (0/1) 1+ grandchild
food non-food medic. serv. medicines in HH male works fem. works (0/1) in HHDAF -0.199 -0.065 0.057 0.141 183.233 -1646.808 -0.306 0.137 0.348 1.131∗∗∗ -0.521∗∗∗ -0.396
(0.280) (0.151) (0.107) (0.358) (115.165) (1013.305) (0.260) (0.333) (0.283) (0.206) (0.145) (0.243)
DAM 0.171 -0.026 -0.152 -0.080 37.865 775.809 0.089 -0.246 0.234∗ 0.461∗∗∗ -0.012 -0.160(0.139) (0.103) (0.179) (0.146) (50.630) (1362.315) (0.143) (0.269) (0.131) (0.161) (0.151) (0.156)
DAF ∗DAM 0.232 0.191 -0.036 0.086 -149.362 -550.634 0.120 0.186 -0.771∗∗ -1.598∗∗∗ 0.925∗∗∗ 0.669∗∗
(0.324) (0.199) (0.242) (0.391) (134.836) (1559.553) (0.300) (0.439) (0.335) (0.293) (0.236) (0.299)
(AF − 60) -0.014 -0.004 -0.004 -0.010 -3.500 129.411 0.023∗∗ 0.035 0.015 -0.016 -0.006 0.021∗∗
(0.011) (0.006) (0.011) (0.014) (4.561) (87.435) (0.010) (0.040) (0.015) (0.012) (0.012) (0.010)
(AM − 60) -0.007 -0.005 -0.005 -0.010 -0.850 40.810 0.006 0.003 -0.013∗∗ -0.004 0.017∗∗ 0.015∗
(0.009) (0.005) (0.006) (0.011) (6.336) (64.214) (0.008) (0.020) (0.007) (0.009) (0.008) (0.008)
(AF − 60) * (AF − 60) -0.001 -0.000 -0.001 -0.000 -0.235 5.088 0.001∗ 0.003 0.001 -0.001 -0.000 0.001(0.001) (0.000) (0.001) (0.001) (0.446) (5.810) (0.001) (0.005) (0.001) (0.001) (0.001) (0.001)
Joint effect 0.204 0.100 -0.131 0.146 71.736 -1421.634∗ -0.096 0.077 -0.188 -0.006 0.392∗∗ 0.112P-value (joint eff.) 0.168 0.336 0.337 0.341 0.305 0.094 0.436 0.737 0.278 0.974 0.022 0.445Mean value (ineligible HH) 0.582 0.837 0.879 0.514 227.937 1020.327 0.316 0.499 0.753 0.370 0.272 0.211Bandwidth female 20 20 19 19 18 20 20 16 20 20 20 20Bandwidth male 20 20 10 15 20 20 20 7 11 20 20 19Observations 1,229 1,229 678 1,001 1,096 1,227 1,229 455 8,195 763 962 962 1,201
Note: The table shows estimates of a falsification test of pension effects on income, labour supply, consumption and living arrangements obtained estimating the reduced form of equations (2)-(3)with data on 2006 and 2007, before Renta Dignidad was enacted. We regressed each outcome on dummies Di equal to 1 if spouse i was 60 or older at the time of the survey and 0 otherwise, ontheir interaction and on the RDD polynomial in the difference in spouse age Ai from the 60 cutoff and interpret estimates as an intention to treat effect (ITT). We observed age at the end ofSeptember to study age 60 contemporaneous effects since our outcomes of interest are measured in November and we measured age as follows. Running variables are spouses’ age: the integer partmeasures age in years while the decimal one measures fractions of years. We included as covariates dummies for survey year, ethnicity, education level, ethnicity, health and insurance status,contributory pension reception and urban residence. We corrected standard errors by using the survey weights. At the bottom of the panel estimates of the age 60 effect when both spouses wereeligible are shown, along with the associated p-value. The last four rows show mean values of outcomes for households with spouses younger than 60, the optimal bandwidth used in the regressionsand the number of observations. Significance levels are as follows: * p < 0.10, ** p < 0.05, *** p < 0.01. Data are from a representative survey of Bolivian households held by the NationalStatistics Institute in 2008 and 2009. Section 2 offers additional information on the institutional setting and on the data, section 4 on the research design and section 6 on the empirical analysis.
38
43

rationalised by the substantive and highly significant change in a number
of household decisions benefiting elderly beneficiaries directly. In addition,
benefits spillover to beneficiaries’ extended family by increasing their adult
children’s labour supply and the probability that grandchildren are looked
after by beneficiaries. Benefits also spillover to other households thanks to
a net increase in domestic transfers sent to them. These results speak to the
recent literature studying how decisions by a program’s beneficiaries can
both increase income and also improve decisions taken either by extended
family members (Chetty and Looney, 2006; Kinnan and Townsend, 2012) or
by non-beneficiary households (Angelucci and De Giorgi, 2009; Angelucci
et al., 2012; Angelucci and Di Maro, 2015), highlighting the relevant role
played by elderly’s positive income shocks.
Third, finding that beneficiary gender matters for female spouse labour
supply and for interhousehold transfers, but not for other household de-
cisions, such as purchasing medicines, contributes to the literature study-
ing the role of bargaining power in intrahousehold decisions in developing
countries (Rangel, 2006; Bobonis, 2009; Attanasio and Lechene, 2014) with
novel evidence on an unexplored relationship between gender differences in
spouses’ bargaining power and interhousehold transfers. This mechanism
is, instead, muted when a pension is obtained by both spouses, who seem
to act cooperatively in the decision over the absorption of extended family
members into the household.
Finally, the net increase in transfers to other households, when only
the male obtains the pension, enriches the literaure studying the role of
pension income in private transfers crowding out in developing countries,
by uncovering gender as a novel mechanism explaining private transfers
(Jensen, 2004; Juarez, 2009). In addition, these results enrich the growing
evidence on the quantitative relevance of informal contracts between house-
holds (Albarran and Attanasio, 2003; Dubois et al., 2008; Angelucci et al.,
2012) which, in poor countries, tend to compensate for the poor function-
ing of formal credit and of public institutions in charge of contracts design
and enforcement.
From a policy viewpoint, these results suggest that age targeting may
not necessarily result in short-run poverty reduction among elderly, par-
ticularly in countries with widespread poverty. Also finding that, when
23
44
the beneficiary is a male, the pension is transferred to other households in
Bolivia suggests that transfers are meant to help households that are at
least as poor as pension beneficiaries or poorer ones, in line with related
evidence on crowding out (Juarez, 2009) and on income mobility (Stampini
et al., 2015). This emphasises the importance of anticipating and quan-
tifying at the design stage potentially unintended policy outcomes. Fur-
thermore, these results contribute to the debate over the importance of
carefully assessing the impact that relevant features of the institutional
setting in developing economies, for example prevalent gender roles in a
household, may have on individual and on household decisions. An illus-
trative example is targeting female spouses in conditional cash transfer for
poor Mexican households, PROGRESA, as costs and benefits of gender
targeting are hard to assess precisely unless all relevant behavioural mech-
anisms, such as women empowerment (Almas et al., 2015), are carefully
taken into account.
However, a few caveats should be noted. First, behavioural responses
to the pension are observed in the short-run while less is known about their
long-run impact, due to lack of data and to the increasing complexity in
disentangling indirect from direct effects. Second, the effects estimated in
this paper are local around the age 60 cutoff and may be different for bene-
ficiaries at different ages. Finally, despite Renta Dignidad being a universal
pension, take up at 60 is around 60%. While we cannot exclude that this is
partially due informational frictions in the transition from Bonosol, a pen-
sion with age cutoff at 65 and discontinued in 2007, overall is in line with
evidence on non-contributory pensions and on conditional cash transfers in
other countries. Additional frictions potentially explaining why pension ef-
fects on poverty are muted are a government partial inability to implement
a program in rural areas and negative self-selection of eligibles by, for ex-
ample, education. Although similar hypotheses tend to hold in developing
countries, we cannot test them due to small sample problems.35
In spite of our rich results and their contribution to the related liter-
ature and to inform policy decisions, we were unable to answer a number
35A broader caveat is that all evidence on non-contributory pensions is obtained byestimating partial equilibrium models. Except recent work on the relationship betweencash transfers and sellers price-discriminating (Attanasio and Pastorino, 2015), verylittle is known about general equilibrium effects.
24
45

of highly relevant questions, that are left for future research, partly due to
the inability to follow individuals over time in cross-sectional survey data.
In particular, given the large spillovers found in this paper, it would be
valuable to pin down who and through which channels indirectly benefits
from social pensions in households with no beneficiary. Similarly, assess-
ing whether decisions by households receiving one or more pensions soon
after its enactment are different from those by households first receiving a
pension years later, would be valuable to test whether learning effects play
a relevant role in explaining household decisions induced by one or more
pensions.
25
46
References
Abler, D. (2010). Demand Growth in Developing Countries. Food, Agriculture and
Fisheries Papers 29, OECD.
Acosta, P., Leite, P. and Rigolini, J. (2014). Should Cash Transfers be Confined to
the Poor? Implications for Poverty and Inequality in Latin America. In M. Frolich,
D. Kaplan, C. Pages, J. Rigolini and D. Robalino (eds.), Social Insurance, Informality
and Labor Markets, 11, Oxford University Press, pp. 347–372.
Albanesi, S. and Olivetti, C. (2007). Gender Roles and Technological Progress.
Working Paper 13179, National Bureau of Economic Research.
Albarran, P. and Attanasio, O. P. (2003). Limited Commitment and Crowding out
of Private Transfers: Evidence from a Randomised Experiment. Economic Journal,
113 (486), C77–C85.
Almas, I., Armand, A., Attanasio, O. P. and Carneiro, P. (2015). Measuring and
Changing Control: Womens Empowerment and Targeted Transfers. Working Paper
21717, National Bureau of Economic Research.
Amuedo-Dorantes, C. and Juarez, L. (2013). Old-Age Government Transfers and
the Crowding Out of Private Gifts: The 70 and Above Program for the Rural Elderly
in Mexico. CReAM Discussion Paper Series 1327, Centre for Research and Analysis
of Migration (CReAM), University College London.
Anderson, M. L. (2008). Multiple Inference and Gender Differences in the Effects of
Early Intervention: A Reevaluation of the Abecedarian, Perry Preschool, and Early
Training Projects. Journal of the American statistical Association, 103 (484), 1481–
1495.
Angelucci, M. and De Giorgi, G. (2009). Indirect Effects of an Aid Program: How
Do Cash Transfers Affect Ineligibles’ Consumption? American Economic Review,
99 (1), 486–508.
—, — and Rasul, I. (2012). Resource Pooling within Family Networks: Insurance and
Investment, unpublished manuscript, University College London.
— and Di Maro, V. (2015). Program Evaluation and Spillover Effects. Policy Research
Working Paper Series 7243, The World Bank.
Ardington, E. and Lund, F. (1995). Pensions and Development: Social Security as
Complementary to Programmes of Reconstruction and Development. Development
Southern Africa, 12 (4), 557–577.
Attanasio, O. P. and Lechene, V. (2014). Efficient Responses to Targeted Cash
Transfers. Journal of Political Economy, 122 (1), 178 – 222.
26
47

— and Pastorino, E. (2015). Nonlinear Pricing in Village Economies. Working Paper
21718, National Bureau of Economic Research.
Becker, G. S. (1974). A Theory of Social Interactions. Journal of Political Economy,
82 (6), pp. 1063–1093.
Bernheim, B., Shleifer, A. and Summers, L. H. (1985). The Strategic Bequest
Motive. Journal of Political Economy, 93 (6), 1045–1076.
Bertanha, M. (2014). Regression Discontinuity Design with Many Thresholds, unpub-
lished Manuscript, Stanford University.
Bertrand, M., Mullainathan, S. and Miller, D. (2003). Public Policy and Ex-
tended Families: Evidence from Pensions in South Africa. World Bank Economic
Review, 17 (1), 27–50.
Blau, F. D. and Kahn, L. M. (2007). Changes in the Labor Supply Behavior of
Married Women: 1980-2000. Journal of Labor Economics, 25, 393–438.
Bobonis, G. J. (2009). Is the Allocation of Resources within the Household Effi-
cient? New Evidence from a Randomized Experiment. Journal of Political Economy,
117 (3), 453–503.
Bosch, M. and Guajardo, J. (2012). Labor Market Impacts of Non-Contributory Pen-
sions: The Case of Argentina’s Moratorium. IDB Publications 78158, Inter-American
Development Bank.
— and Manacorda, M. (2012). Social Policies and Labor Market Outcomes in Latin
America and the Caribbean: A Review of the Existing Evidence. CEP Occasional
Papers 32, Centre for Economic Performance, LSE.
—, Melguizo, A. and Pages, C. (2013). Better Pensions Better Jobs: Towards Uni-
versal Coverage in Latin America and the Caribbean. Inter-American Development
Bank.
Camacho, A. and Conover, E. (2011). Manipulation of Social Program Eligibility.
American Economic Journal: Economic Policy, 3 (2), 41–65.
Case, A. and Deaton, A. (1998). Large Cash Transfers to the Elderly in South Africa.
Economic Journal, 108 (450), 1330–61.
Chen, Z., Bengtsson, T. and Helgertz, J. (2015). Labor Supply Responses to New
Rural Social Pension Insurance in China: A Regression Discontinuity Approach. Dis-
cussion Paper 9360, Institute for the Study of Labor (IZA).
Chetty, R. and Looney, A. (2006). Consumption Smoothing and the Welfare Conse-
quences of Social Insurance in Developing Economies. Journal of Public Economics,
90 (12), 2351–2356.
27
48
Chiappori, P.-A. (1988). Rational Household Labor Supply. Econometrica, 56 (1),
63–90.
— (1992). Collective Labor Supply and Welfare. Journal of Political Economy, 100 (3),
437–67.
CIA World Factbook (2014). CIA World Factbook, Bolivia. https://www.cia.gov/
library/publications/the-world-factbook/geos/bl.html.
Cox, D. and Fafchamps, M. (2008). Extended Family and Kinship Networks: Eco-
nomic Insights and Evolutionary Directions, Handbook of Development Economics,
vol. 4, chap. 58, pp. 3711–3784.
de Carvalho Filho, I. E. (2008). Old-age Benefits and Retirement Decisions of Rural
Elderly in Brazil. Journal of Development Economics, 86 (1), 129–146.
Dubois, P., Jullien, B. and Magnac, T. (2008). Formal and Informal Risk Sharing
in LDCs: Theory and Empirical Evidence. Econometrica, 76 (4), 679–725.
Duflo, E. (2003). Grandmothers and Granddaughters: Old-Age Pensions and Intra-
household Allocation in South Africa. World Bank Economic Review, 17 (1), 1–25.
Edmonds, E. V. (2006). Child Labor and Schooling Responses to Anticipated Income
in South Africa. Journal of Development Economics, 81 (2), 386 – 414.
—, Mammen, K. and Miller, D. L. (2005). Rearranging the Family? Income Sup-
port and Elderly Living Arrangements in a Low-Income Country. Journal of Human
Resources, 40 (1), 186–207.
Egger, P. H. and Wamser, G. (2015). The impact of controlled foreign company
legislation on real investments abroad. A multi-dimensional regression discontinuity
design. Journal of Public Economics, 129, 77 – 91.
Escobar Loza, F., Martinez, S. and Mendizabal Cordova, J. (2013). El Im-
pacto de la Renta Dignidad: Polıtica de Redistribucion del Ingreso, Consumo y Re-
duccion de la Pobreza en Hogares con Personas Adultas Mayores, unidad de Analisis
de Polıticas Sociales y Economicas, Ministerio de Planificacion del Desarrollo, Estado
de Bolivia.
Galiani, S., Gertler, P. and Bando, R. (2014). Non-Contributory Pensions. Work-
ing Paper 19775, National Bureau of Economic Research.
Hahn, J., Todd, P. and Van der Klaauw, W. (2001). Identification and Estimation
of Treatment Effects with a Regression-Discontinuity Design. Econometrica, 69 (1),
201–09.
28
49

Hamilton, W. D. (1964a). The Genetical Evolution of Social Behaviour. I. Journal of
Theoretical Biology, 7 (1), 1 – 16.
— (1964b). The Genetical Evolution of Social Behaviour. II. Journal of Theoretical
Biology, 7 (1), 17–52.
Hamoudi, A. and Thomas, D. (2014). Endogenous Co-residence and Program Inci-
dence: South Africas Old Age Pension. Working Paper 19929, National Bureau of
Economic Research.
Haughton, J. and Khandker, S. R. (2009). Handbook on Poverty and Inequality.
Washington, DC: World Bank.
HelpAge (2015). International Pension Watch Database. HelpAge International www.
helpage.org/.
Hernani-Limarino, W. L. and Mena, G. (2015). Intended and Unintended Effects
of Unconditional Cash Transfers: The Case of Bolivia’s Renta Dignidad. Working
Papers 03/2015, Fundacion Aru.
Holzmann, R. and Hinz, R. (2005). Old-Age Income Support in the 21st Century: An
International Perspective on Pension Systems and Reform. Trade and Development,
World Bank.
Imbens, G. and Kalyanaraman, K. (2009). Optimal Bandwidth Choice for the Regres-
sion Discontinuity Estimator. Working Paper 14726, National Bureau of Economic
Research.
— and Lemieux, T. (2008). Regression Discontinuity Designs: A Guide to Practice.
Journal of Econometrics, 142 (2), 615–635.
Jelin, E. and Dıaz-Munoz, A. R. (2003). Major Trends Affecting Families: South
America in Perspective, report prepared for the United Nations Department of Eco-
nomic and Social Affairs, Division for Social Policy and Development Programme on
the Family.
Jensen, R. T. (2004). Do Private Transfers ’Displace’ the Benefits of Public Transfers?
Evidence from South Africa. Journal of Public Economics, 88 (1-2), 89–112.
Juarez, L. (2009). Crowding Out of Private Support to the Elderly: Evidence from a
Demogrant in Mexico. Journal of Public Economics, 93 (3-4), 454–463.
— and Pfutze, T. (2014). The Effects of a Non-Contributory Pension Program on
Labor Force Participation: The Case of 70 y Mas in Mexico. Working Papers 2014-
12, Banco de Mexico.
29
50

Kassouf, A. L. and Rodrigues de Oliveira, P. (2012). Impact Evaluation of the
Brazilian Non-contributory Pension Program BPC (Beneficio da prestacao Continu-
ada) on Family Welfare. working paper 12, Partnership for Economic Policy.
Kinnan, C. and Townsend, R. (2012). Kinship and Financial Networks, Formal Fi-
nancial Access, and Risk Reduction. American Economic Review, 102 (3), 289–93.
Lee, D. S. and Lemieux, T. (2010). Regression Discontinuity Designs in Economics.
Journal of Economic Literature, 48 (2), 281–355.
Martinez, S. (2004). Pensions, Poverty and Household Investments in Bolivia. Un-
published manuscript, University of California Berkeley.
McCrary, J. (2008). Manipulation of the Running Variable in the Regression Discon-
tinuity Design: A Density Test. Journal of Econometrics, 142 (2), 698–714.
Mesa-Lago, C. (2004). An Appraisal of a Quarter-century of Structural Pension Re-
forms in Latin America. CEPAL Review, 84, 57–81.
Morduch, J. (1995). Income Smoothing and Consumption Smoothing. Journal of Eco-
nomic Perspectives, 9 (3), 103–114.
Novella, R. and Olivera, J. (2014). Mental Retirement and Non-contributory Pen-
sions for the Elderly Poor in Peru. Center for Economic Studies Discussion papers
ces14.05, Katholieke Universiteit Leuven.
Papay, J. P., Willett, J. B. and Murnane, R. J. (2011). Extending the Regression-
Discontinuity Approach to Multiple Assignment Variables. Journal of Econometrics,
161 (2), 203–207.
Porter, J. (2003). Estimation in the Regression Discontinuity Model, unpublished
Manuscript, University of Wisconsin at Madison.
Posel, D., Fairburn, J. A. and Lund, F. (2006). Labour Migration and Households:
A Reconsideration of the Effects of the Social Pension on Labour Supply in South
Africa. Economic Modelling, 23 (5), 836 – 853.
Rangel, M. A. (2006). Alimony Rights and Intrahousehold Allocation of Resources:
Evidence from Brazil. The Economic Journal, 116 (513), 627–658.
Regmi, A., Deepak, M., Seale Jr, J. L. and Bernstein, J. (2001). Cross-country
Analysis of Food Consumption Patterns. Report WRS-01-1, U.S. Department of Agri-
culture, Agriculture and Trade.
Rofman, R., Apella, I. and Vezza, E. (2014). Beyond Contributory Pensions: Four-
teen Experiences with Coverage Expansion in Latin America. World Bank Publica-
tions.
30
51

—, Lucchetti, L. and Ourens, G. (2008). Pension Systems in Latin America: Con-
cepts and Measurements of Coverage. SP Discussion Paper 616, World Bank.
Salinas-Rodrıguez, A., Torres-Pereda, M. D. P., Manrique-Espinoza, B.,
Moreno-Tamayo, K. and Tellez-Rojo Solıs, M. M. (2014). Impact of the Non-
Contributory Social Pension Program 70 y mas on Older Adults Mental Well-Being.
PloS ONE, 9 (11), e113085.
Snider, C. and Williams, J. W. (2014). Barriers to entry in the airline industry: A
multi-dimensional regression-discontinuity analysis of AIR-21. forthcoming in Review
of Economics and Statistics.
Stampini, M., Robles, M., Saenz, M., Ibarraran, P. and Medellın, N. (2015).
Poverty, Vulnerability and the Middle Class in Latin America. IDB Publications
(Working Papers) 88836, Inter-American Development Bank.
Townsend, R. M. (1994). Risk and Insurance in Village India. Econometrica, 62 (3),
pp. 539–591.
von Gersdorff, H. (1997). Pension Reform in Bolivia: Innovative Solutions to Com-
mon Problems. Policy Research Working Paper 1832, World Bank.
Willmore, L. (2006). Non-contributory Pensions: Bolivia and Antigua in An Interna-
tional Context. United nations publication, Economic Commission for Latin America
and the Caribbean.
— (2007). Universal Pensions for Developing Countries. World Development, 35 (1),
24–51.
World Bank (2009). Increasing Formality and Productivity of Bolivian Firms. Country
study, World Bank.
World Bank (2015). Pensions Database. In http://web.worldbank.org/, Social Protec-
tion and Labor Unit, Human Development Network, Washington, D.C.
Yanez-Pagans, M. (2008). Culture and Human Capital Investments: Evidence of an
Unconditional Cash Transfer Program in Bolivia. IZA Discussion Papers 3678, Insti-
tute for the Study of Labor (IZA).
Zajonc, T. (2012). Regression Discontinuity Design with Multiple Forcing Variables.
Ph.D. thesis, Harvard University.
31
52
IvieGuardia Civil, 22 - Esc. 2, 1º
46020 Valencia - SpainPhone: +34 963 190 050Fax: +34 963 190 055
Website: www.ivie.esE-mail: [email protected]
adserie
Related Documents