Results Presentation (12M20)

Welcome message from author
This document is posted to help you gain knowledge. Please leave a comment to let me know what you think about it! Share it to your friends and learn new things together.
Transcript

Results Presentation (12M20)

2- Business Presentation
Results Summary (Income Statement)
(Rp bn) 12M20 12M19 % YoY
Revenue 8,071 7,608 6.1%Effect of 16% YoY in Property Development segment
and -24% YoY in Recurring segment
COGS (3,949) (3,817) 3.5%
Gross Profit 4,121 3,792 8.7%
Gross Profit Margin 51.1% 49.8%
Operating Expense (1,523) (1,636) -6.9%
Operating Profit 2,599 2,155 20.6%
Operating Profit Margin 32.2% 28.3%
Interest Income (Expense) - Net (985) (621) 58.6% Including Rp457 bn interest expense due to PSAK 72
Other Income (Expense) - Net 46 21 119.8%
Final Tax and Income Tax (288) (272) 6.1%
Net Income Before Non-Controlling Interest 1,371 1,283 6.8%
Non-Controlling Interest (50) (125) -60.2%
Net Income Attributable to Owners 1,321 1,158 14.1%
Net Profit Margin 16.4% 15.2%

3- Business Presentation
Results Summary (Revenue Breakdown and Margin Performance)
(Rp bn) 12M20 12M19 % YoY
Revenue Breakdown
Property Development Revenue 6,596 5,679 16.2%
Houses, shophouses, and land lots 5,057 4,200 20.4%
Apartments 1,084 877 23.5%
Office for sale 456 601 -24.2%
Recurring Revenue 1,474 1,930 -23.6%
Shopping malls 505 745 -32.2% Temporary rental and service charge discounts due to Covid-19
Hospitals 455 338 34.9% Covid-related healthcare services and improving traffic from non-Covid patients
Office for lease 206 184 12.3% Higher contribution from Tokopedia Tower
Hotels 201 491 -59.1% Lower occupancy rates and lower average room rates due to Covid-19
Others 107 173 -38.1% Closure of golf courses and waterparks due to Covid-19
Total Revenue 8,071 7,608 6.1%
Margin Performance
Property Development GPM 52.0% 49.1%
Houses, shophouses, and land lots 53.7% 52.4%
Apartments 50.3% 36.5% Effect of recognition of Denver Tower in CitraLand Surabaya
Office for sale 38.3% 44.7%
Recurring GPM 46.7% 51.9%
Shopping malls 49.3% 61.0%
Hospitals 47.0% 42.6%
Office for lease 63.1% 61.7%
Hotels 28.7% 43.3%
Others 35.1% 45.0%
Total GPM 51.1% 49.8%
Adoption of new accounting standard affecting highrise revenue recognition
(IFRS 15 ; PSAK 72)
4- Business Presentation
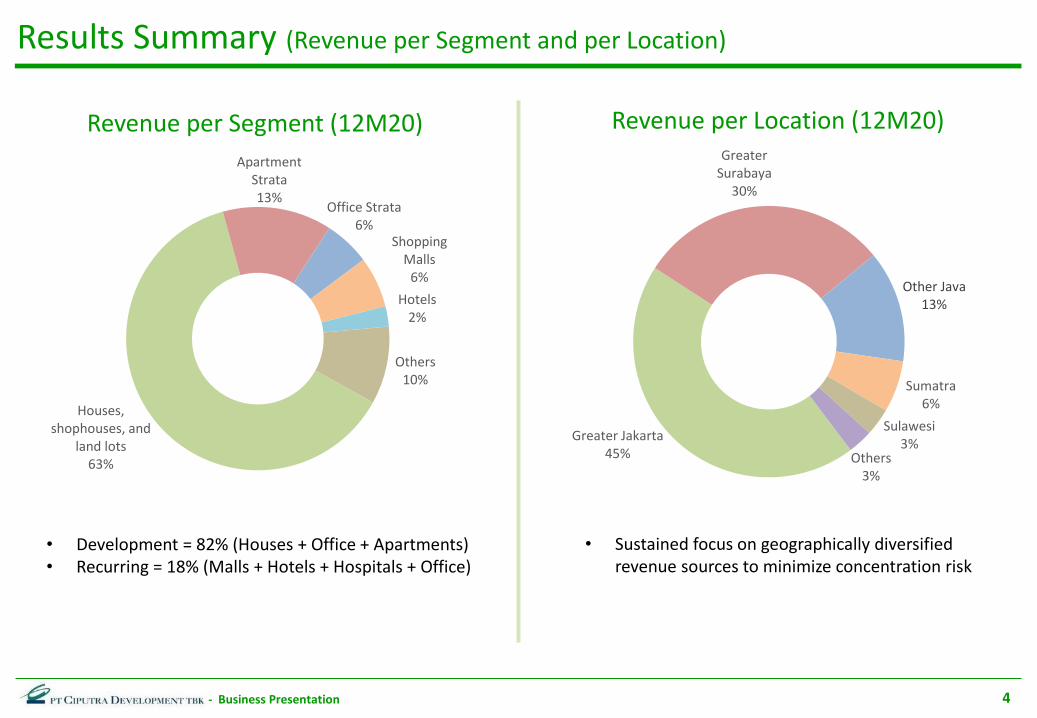
Results Summary (Revenue per Segment and per Location)
Houses, shophouses, and
land lots63%
Apartment Strata13%
Office Strata6%
Shopping Malls
6%
Hotels2%
Others10%
Revenue per Segment (12M20)
Greater Jakarta45%
Greater Surabaya
30%
Other Java13%
Sumatra6%
Sulawesi3%
Others3%
Revenue per Location (12M20)
• Development = 82% (Houses + Office + Apartments)• Recurring = 18% (Malls + Hotels + Hospitals + Office)
• Sustained focus on geographically diversified revenue sources to minimize concentration risk
5- Business Presentation
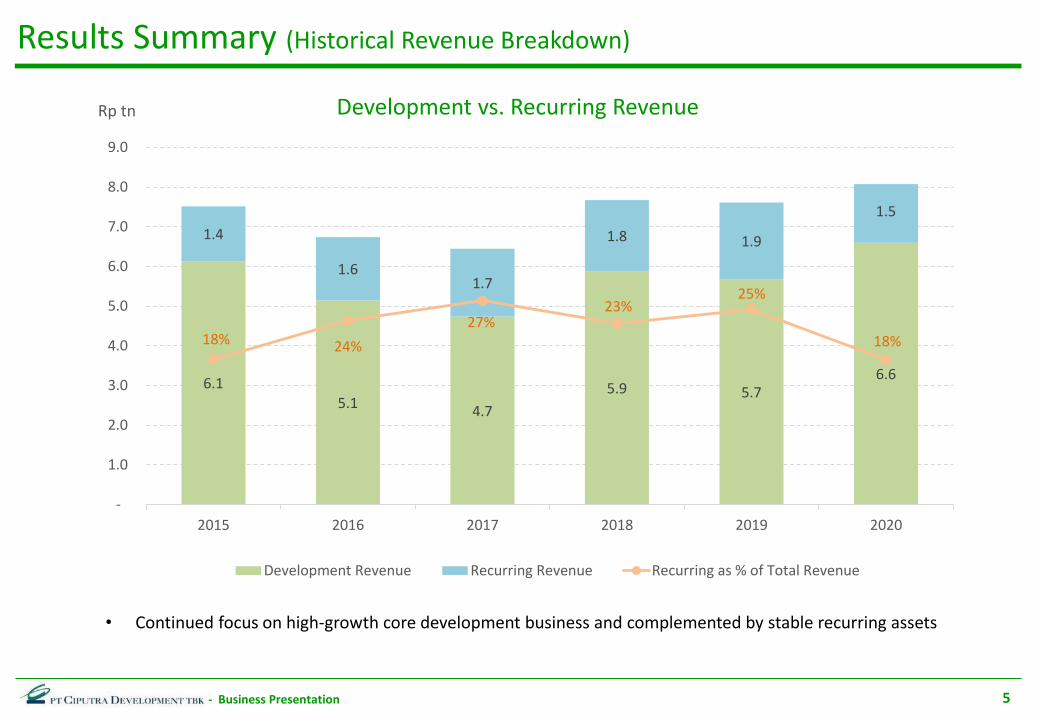
Results Summary (Historical Revenue Breakdown)
• Continued focus on high-growth core development business and complemented by stable recurring assets
6.15.1
4.7
5.9 5.76.6
1.4
1.61.7
1.8 1.9
1.5
18% 24%
27%23%
25%
18%
-
1.0
2.0
3.0
4.0
5.0
6.0
7.0
8.0
9.0
2015 2016 2017 2018 2019 2020
Rp tn Development vs. Recurring Revenue
Development Revenue Recurring Revenue Recurring as % of Total Revenue
6- Business Presentation
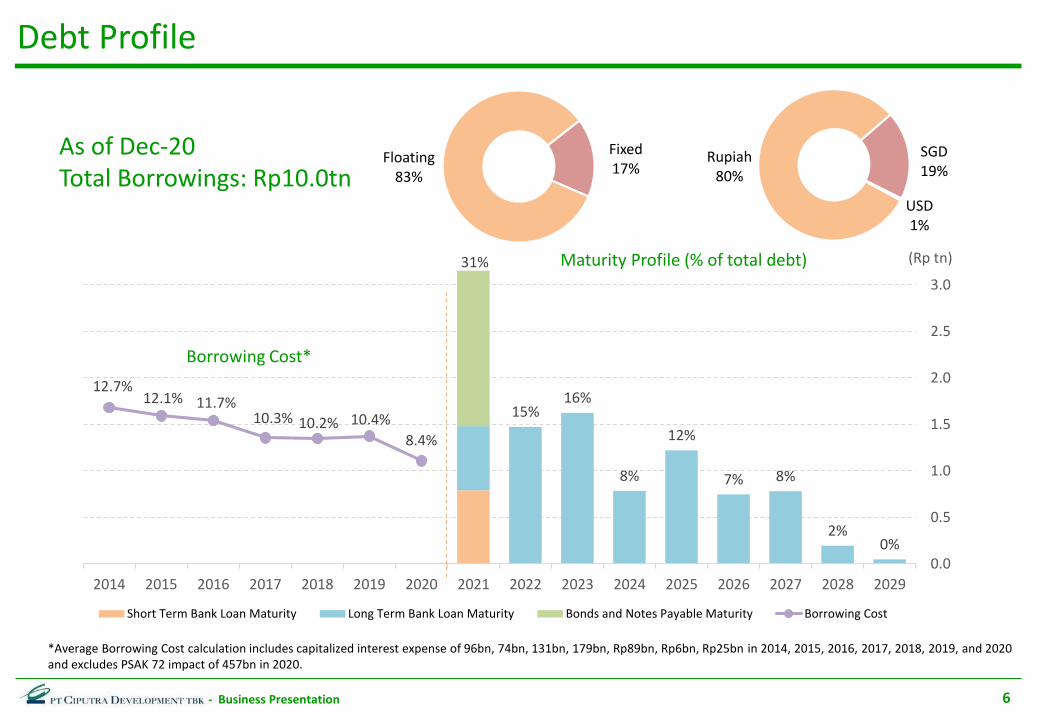
Debt Profile
31%
15%16%
8%
12%
7% 8%
2%0%
12.7%12.1% 11.7%
10.3% 10.2% 10.4%
8.4%
0.0
0.5
1.0
1.5
2.0
2.5
3.0
2014 2015 2016 2017 2018 2019 2020 2021 2022 2023 2024 2025 2026 2027 2028 2029
Short Term Bank Loan Maturity Long Term Bank Loan Maturity Bonds and Notes Payable Maturity Borrowing Cost
Fixed17%
Floating83%
SGD19%
USD1%
Rupiah80%
As of Dec-20Total Borrowings: Rp10.0tn
(Rp tn)Maturity Profile (% of total debt)
Borrowing Cost*
*Average Borrowing Cost calculation includes capitalized interest expense of 96bn, 74bn, 131bn, 179bn, Rp89bn, Rp6bn, Rp25bn in 2014, 2015, 2016, 2017, 2018, 2019, and 2020 and excludes PSAK 72 impact of 457bn in 2020.

7- Business Presentation
Capex Schedule
2.1
0.9
2.0
1.31.1
0.8
2015 2016 2017 2018 2019 2020
Rp tn
Historical Capex
Land for Development
55%
Mall28%
Hospital3%
Hotel2%
Others12%
12M200.8tn
• Increased mall capex due to the construction of CitraRaya Tangerang Mall

8- Business Presentation
Financial Highlights
7,5146,739 6,443
7,670 7,608 8,071
2015 2016 2017 2018 2019 2020
Revenue
3,7243,290
2,997
3,628 3,7924,121
50% 49%47% 47%
50%51%
2015 2016 2017 2018 2019 2020
Gross Profit
Gross Profit Gross Margin
1.61.4 1.4 1.5
1.9 1.9 2.0 2.21.8
-15% -7% 10% 17% 22% 28% 31% 28% 27%
2012 2013 2014 2015 2016 2017 2018 2019 2020
Key Ratios
Current Ratio Net Debt to Equity
(Rp bn)
(Rp bn)
(Rp bn)
1,645
1,021894
1,185 1,1581,321
22%
15% 14% 15% 15% 16%
2015 2016 2017 2018 2019 2020
Net Profit
Net Profit Net Margin

9- Business Presentation
Balance Sheet Summary
Dec 2020 Dec 2019 Dec 2018 Dec 2017
Assets 39,255 36,196 34,289 31,872
Cash & cash equivalents 5,276 4,238 3,243 3,240
Land 14,471 13,523 13,048 11,696
Fixed Assets 2,595 3,089 3,114 3,144
Investment Properties 5,523 5,373 4,962 4,762
Others 11,390 9,972 9,921 9,031
Liabilities 21,798 18,434 17,645 16,322
Debt 10,024 9,176 8,455 7,618
Contract Liabilities 9,218 6,870 6,814 6,459
Others 2,556 2,388 2,375 2,245
Equity 17,458 17,762 16,644 15,551
Minority interests 2,125 2,409 2,270 2,113
Equity net of minority interests 15,332 15,352 14,374 13,438
Debt to Total Equity 57% 52% 51% 49%
Net Debt to Total Equity 27% 28% 31% 28%
Rp bn
Company Overview

11- Business Presentation
Township Condominium
Property Development for Sale
Residential Office
Commercial Property Development & Management
HotelShoppingMall
OfficeServiced Apartment
Others
One of Indonesia’s Leading Property Developer
Core Business
ServicedApartment

12- Business Presentation
Geographically Diversified Project Portfolio
Banjarmasin
Balikpapan
Samarinda
Makassar
Kendari
Palu
Banjarbaru
Pontianak
Jambi
Pekanbaru
Pangkal Pinang
Medan
Batam
Denpasar
Bandar Lampung
JakartaMajaCirebon
Surabaya
Malang
Semarang
Tegal
Yogyakarta
CitraLand BanjarmasinCitraGarden BanjarmasinCitraGarden Aneka PontianakCitraCity Balikpapan
Kalimantan
CitraGrand Senyiur City SamarindaCitraGarden City SamarindaCitraLand City SamarindaCitraMitra City Banjarbaru
Sulawesi
CitraLand City Losari MakassarCitraLand Talassa City MakassarCitraLand Celebes MakassarCitraGarden MakassarVida View MakassarCitraGrand Galesong City GowaCitraLand PaluCitraLand Kendari
Sumatra
CitraLand Gama City MedanCitraPlaza Nagoya BatamCitraLand Megah BatamCitraRaya City JambiCitraLand NGK JambiCitraLand LampungCitraGarden LampungCitraLand PalembangCitraLand PekanbaruCitraGarden PekanbaruCitraLand Botanical City PangkalPinang
Palembang
Java
CitraRaya TangerangCitraIndah City JonggolCitraLand CibuburCitra Sentul RayaCitra Maja RayaCitraGarden BMW Cilegon
CitraGarden City JakartaCiputra World JakartaCiputra Puri InternationalCitra Towers KemayoranCitra LandmarkCitraLand Cirebon
CitraLand BSB City SemarangCitraGrand SemarangCitraSun Garden SemarangCitraLand TegalBarsa City YogyakartaCitraSun Garden Yogyakarta
CitraLand SurabayaCiputra World SurabayaCitraLand Vittorio SurabayaCitraLand The Green Lake SurabayaCitraLand Driyorejo CBD
The Taman Dayu PandaanCitraHarmoni SidoarjoCitraGarden SidoarjoCitraIndah SidoarjoCitraGarden City MalangCitraLand Puncak Tidar Malang
Bali
Ciputra Beach Resort
Over 81 projects in 34 cities across
the nation.

13- Business Presentation
Greater Jakarta Project Portfolio

14- Business Presentation
3,7683,176
2,5843,045
5341,038
2,595
2,955
2,909
2,826
605
868
2018 2019 2020 2021T 3M20 3M21
Direct Ownership Joint Operation
3M21
Houses +Land Lots
81%
Apartments9%
Shophouses10%
Office 1%
3M21
Greater Surabaya
24%
Sulawesi4%
Other Java19%
Sumatra15%
Greater Jakarta
36%
Others1%
Marketing Sales Summary
Presales per Location
Presales per Product
(Rp bn)
Units Sold
8,545 7,035 5,452 777 1,805
Area Sold (Ha)
74 67 66 11 18
Historical Presales
6,131
5,4935,870
6,363
1,906
2020
Greater Surabaya
12%
Sulawesi9%
OtherJava16%
Sumatra18%
Greater Jakarta
43%
Others3%
2020
Houses +Land Lots
90%
Apartments 3%
Shophouses5%
Office 1%
1,139

15- Business Presentation
Marketing Sales Summary
Presales per Payment Method Presales per Unit Price
High proportion of mortgage payment due to exposure to end-users and accessibility of mortgages
Units below Rp2bn continue to make up majority of presales as end-users are targeted
*Note: 2017 and 2018 excludes en bloc sales to Ascott (Rp675bn) and Diener Syz(Rp575bn)
48% 48%53% 50%
55%
40% 37%32%
31% 21%
12% 15% 15%19% 23%
2017* 2018* 2019 2020 3M21
Mortgage Instalment Cash
36%43%
34% 31% 32%
24%21% 39%
32% 27%
30%29%
21%29%
29%
10% 7% 6% 7% 12%
2017* 2018* 2019 2020 3M21
< Rp1bn Rp 1-2bn Rp 2-5bn > Rp 5bn
16- Business Presentation
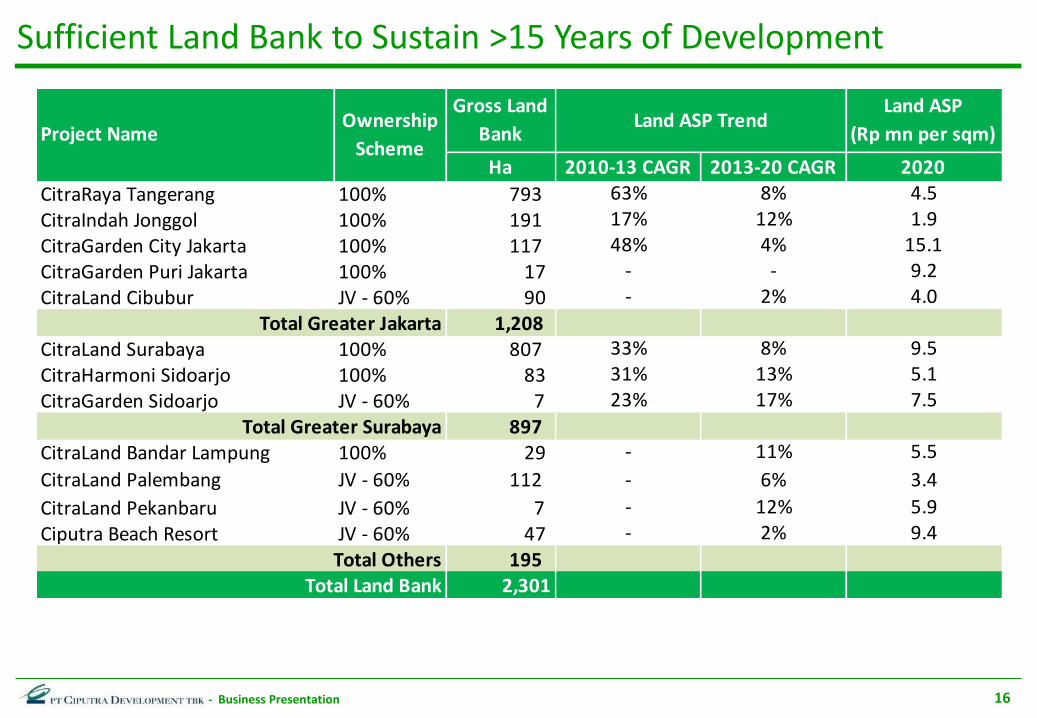
Sufficient Land Bank to Sustain >15 Years of Development
Ha 2010-13 CAGR 2013-20 CAGR 2020
CitraRaya Tangerang 100% 793 63% 8% 4.5
CitraIndah Jonggol 100% 191 17% 12% 1.9
CitraGarden City Jakarta 100% 117 48% 4% 15.1
CitraGarden Puri Jakarta 100% 17 - - 9.2
CitraLand Cibubur JV - 60% 90 - 2% 4.0
1,208 CitraLand Surabaya 100% 807 33% 8% 9.5
CitraHarmoni Sidoarjo 100% 83 31% 13% 5.1
CitraGarden Sidoarjo JV - 60% 7 23% 17% 7.5
897 CitraLand Bandar Lampung 100% 29 - 11% 5.5
CitraLand Palembang JV - 60% 112 - 6% 3.4
CitraLand Pekanbaru JV - 60% 7 - 12% 5.9
Ciputra Beach Resort JV - 60% 47 - 2% 9.4
195 2,301 Total Land Bank
Total Greater Jakarta
Total Greater Surabaya
Total Others
Project NameOwnership
Scheme
Gross Land
BankLand ASP Trend
Land ASP
(Rp mn per sqm)

17- Business Presentation
Citra Sentul Raya 114 5.6 CitraGrand Senyiur City Samarinda 295 1.6
CitraLake Sawangan Depok 12 5.0 CitraGarden City Samarinda 39 2.5Total Greater Jakarta 126 CitraLand City Samarinda 93 3.6
The Taman Dayu Pandaan 563 3.8 CitraMitra City Banjarbaru 172 1.3CitraLand The Green Lake Surabaya 40 10.2 CitraLand Banjarmasin 40 1.8CitraLand Driyorejo CBD 12 6.9 CitraGarden Aneka Pontianak 27 5.9
Total Greater Surabaya 615 CitraCity Balikpapan 9 10.5Citra Maja Raya 1,200 1.5 Total Kalimantan 675
CitraLand BSB City Semarang 100 3.5 CitraGrand Galesong City Gowa 185 1.6CitraGrand Semarang 55 4.8 CitraLand City Losari Makassar 157 14.5CitraSun Garden Semarang 17 6.4 CitraLand Talassa City Makassar 69 4.6CitraGarden City Malang 51 5.0 CitraLand Celebes Makassar 30 5.4CitraGarden BMW Cilegon 47 3.4 CitraGarden Makassar 15 3.0CitraLand Cirebon 45 3.3 CitraLand Palu 17 4.1CitraLand Puri Serang 43 2.3 CitraLand Kendari 15 5.0CitraGarden Pekalongan 10 2.5 Total Sulawesi 488
CitraGrand Mutiara Yogyakarta 9 4.9Total Java Ex-Jakarta Ex-Surabaya 1,577
CitraRaya City Jambi 564 1.2CitraLand Gama City Medan 123 10.1CitraLand Botanical City Pangkalpinang 57 2.5Citra AeroLink Batam 21 3.7CitraLand Megah Batam 19 3.2CitraGarden Pekan Baru 20 2.0
Total Sumatra 804
Land ASP
(Rp mn per
sqm)Joint Operation Project
Development
Plan (Ha)
Land ASP
(Rp mn per
sqm)Joint Operation Project
Development
Plan (Ha)
Rights to Additional Land Bank Through Joint-Operation Schemes
Total JO Land Bank of 4,286 Gross Ha
18- Business Presentation
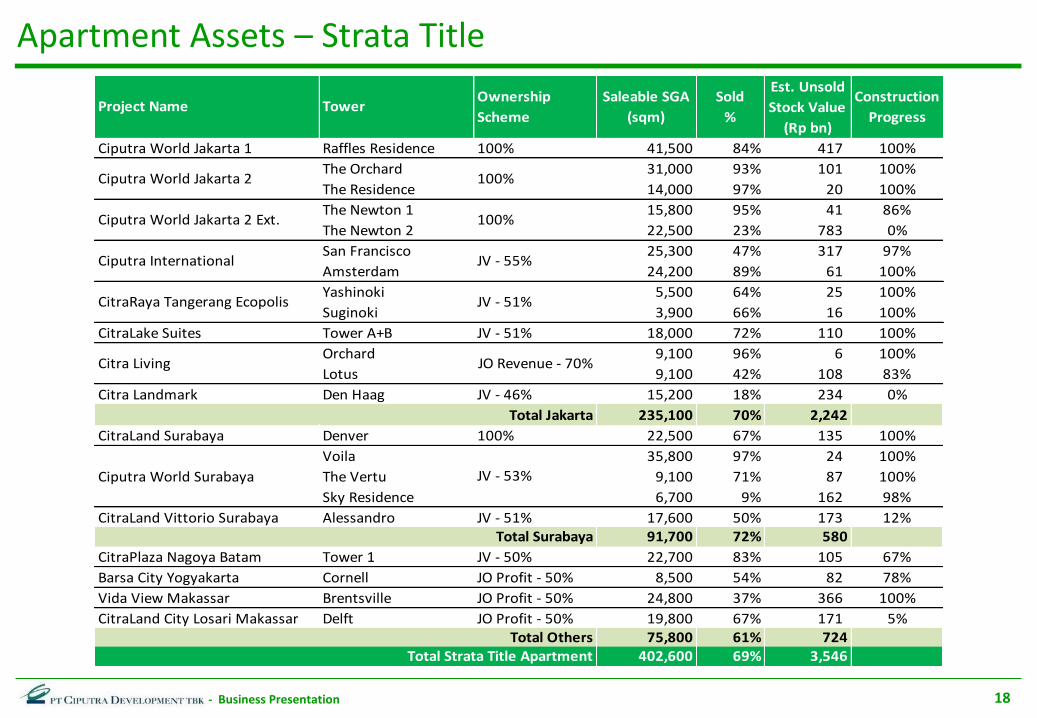
Apartment Assets – Strata Title
Ciputra World Jakarta 1 Raffles Residence 100% 41,500 84% 417 100%
The Orchard 31,000 93% 101 100%
The Residence 14,000 97% 20 100%
The Newton 1 15,800 95% 41 86%
The Newton 2 22,500 23% 783 0%
San Francisco 25,300 47% 317 97%
Amsterdam 24,200 89% 61 100%
Yashinoki 5,500 64% 25 100%
Suginoki 3,900 66% 16 100%
CitraLake Suites Tower A+B JV - 51% 18,000 72% 110 100%
Orchard 9,100 96% 6 100%
Lotus 9,100 42% 108 83%
Citra Landmark Den Haag JV - 46% 15,200 18% 234 0%
235,100 70% 2,242
CitraLand Surabaya Denver 100% 22,500 67% 135 100%
Voila 35,800 97% 24 100%
Ciputra World Surabaya The Vertu 9,100 71% 87 100%
Sky Residence 6,700 9% 162 98%
CitraLand Vittorio Surabaya Alessandro JV - 51% 17,600 50% 173 12%91,700 72% 580
CitraPlaza Nagoya Batam Tower 1 JV - 50% 22,700 83% 105 67%
Barsa City Yogyakarta Cornell JO Profit - 50% 8,500 54% 82 78%
Vida View Makassar Brentsville JO Profit - 50% 24,800 37% 366 100%
CitraLand City Losari Makassar Delft JO Profit - 50% 19,800 67% 171 5%75,800 61% 724
402,600 69% 3,546
CitraRaya Tangerang Ecopolis JV - 51%
Citra Living JO Revenue - 70%
Total Jakarta
JV - 53%
Total Surabaya
Total OthersTotal Strata Title Apartment
Ciputra World Jakarta 2 100%
Ciputra World Jakarta 2 Ext. 100%
Ciputra International JV - 55%
Project Name TowerOwnership
Scheme
Saleable SGA
(sqm)
Sold
%
Est. Unsold
Stock Value
(Rp bn)
Construction
Progress
19- Business Presentation
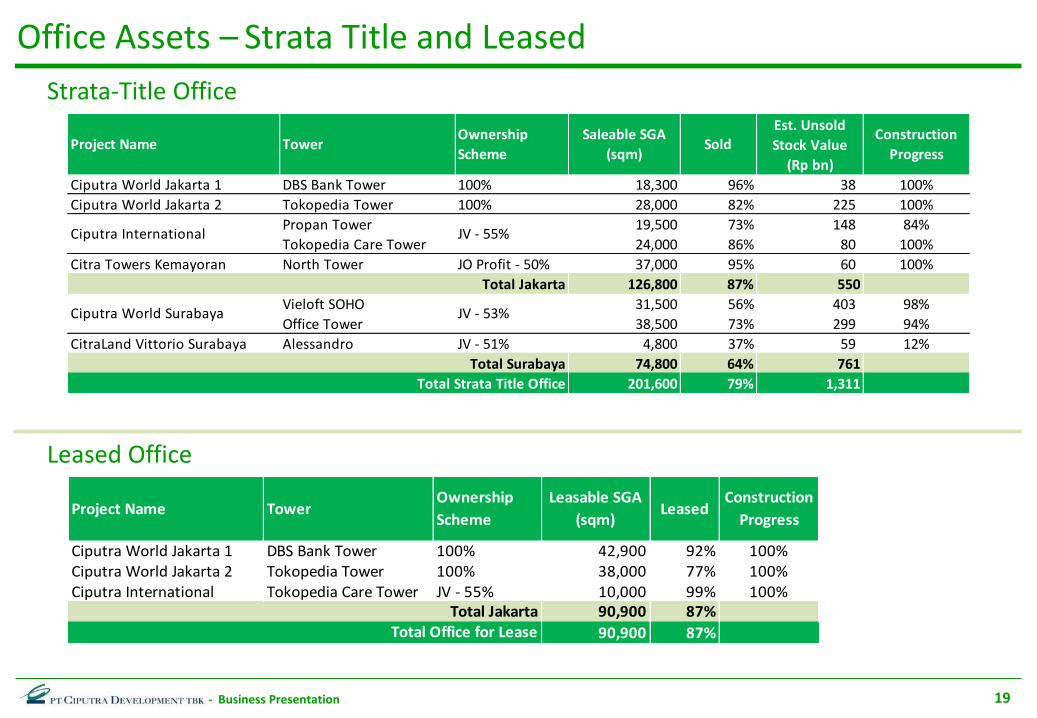
Office Assets – Strata Title and Leased
Project Name TowerOwnership
Scheme
Leasable SGA
(sqm)Leased
Construction
Progress
Ciputra World Jakarta 1 DBS Bank Tower 100% 42,900 92% 100%Ciputra World Jakarta 2 Tokopedia Tower 100% 38,000 77% 100%Ciputra International Tokopedia Care Tower JV - 55% 10,000 99% 100%
90,900 87%
90,900 87%Total Office for LeaseTotal Jakarta
Strata-Title Office
Leased Office
Ciputra World Jakarta 1 DBS Bank Tower 100% 18,300 96% 38 100%
Ciputra World Jakarta 2 Tokopedia Tower 100% 28,000 82% 225 100%
Propan Tower 19,500 73% 148 84%
Tokopedia Care Tower 24,000 86% 80 100%
Citra Towers Kemayoran North Tower JO Profit - 50% 37,000 95% 60 100%
126,800 87% 550
Vieloft SOHO 31,500 56% 403 98%
Office Tower 38,500 73% 299 94%
CitraLand Vittorio Surabaya Alessandro JV - 51% 4,800 37% 59 12%
74,800 64% 761
201,600 79% 1,311
Project Name TowerOwnership
Scheme
Saleable SGA
(sqm)Sold
Est. Unsold
Stock Value
(Rp bn)
Construction
Progress
Total Strata Title Office
Ciputra International JV - 55%
Total Jakarta
Ciputra World Surabaya JV - 53%
Total Surabaya

20- Business Presentation
94.3
31.5
19.5
38.5
4.8
Total Office Backlog Ciputra WorldSurabaya
(Vieloft SOHO)
CiputraInternational
(Propan Tower)
Ciputra WorldSurabaya
(Office Tower)
CitraLand VittorioSurabaya
(Alessandro)
2021 2023
Apartment and Office Completion Schedule
Office Strata-Title (SGA ‘000 sqm)
Apartment Strata-Title (SGA ‘000 sqm)
163.2
25.3
22.7
15.89.1
8.56.7
19.8
17.6
15.2
22.5
Total ApartmentBacklog
CiputraInternational
(San Francisco)
CitraPlaza NagoyaBatam
(Tower 1)
Ciputra WorldJakarta 2
(Newton 1)
Citra Living(Lotus)
Barsa CityYogyakarta
(Cornell)
Ciputra WorldSurabaya
(Sky Residence)
CitraLand City LosariMakassar
(Delft)
CitraLand VittorioSurabaya
(Alessandro)
Citra Landmark(Den Haag)
Ciputra WorldJakarta 2
(Newton 2)
2021 2023 2024 2025
2021 2023
2021 20252023 2024

21- Business Presentation
Future Mixed-Use Developments
Ciputra World Jakarta 1 100% 110,000Ciputra World Jakarta 2 100% 42,000Ciputra World Jakarta 3 100% 99,000Citra Landmark Ciracas* JV - 46% 61,000Ciputra International** JV - 55% 66,000CitraLake Suites JV - 51% 18,000Citra Towers Kemayoran JO Profit - 50% 38,000Citra Living JO Revenue - 70% 12,500
446,500Ciputra World Surabaya JV - 53% 137,000CitraLand Vittorio Surabaya JO Profit - 50% 250,000
387,000
CitraPlaza Nagoya Batam JV - 50% 116,000Vida View Makassar JO Profit - 50% 27,000
143,000976,500
Total OthersTotal Saleable Area
Ownership
Scheme
Est. Saleable
SGA
(sqm)
Project Name
Total Jakarta
Total Surabaya
* : Obtained 2Ha land out of optional 7Ha**: Obtained 5Ha land out of optional 7.5Ha
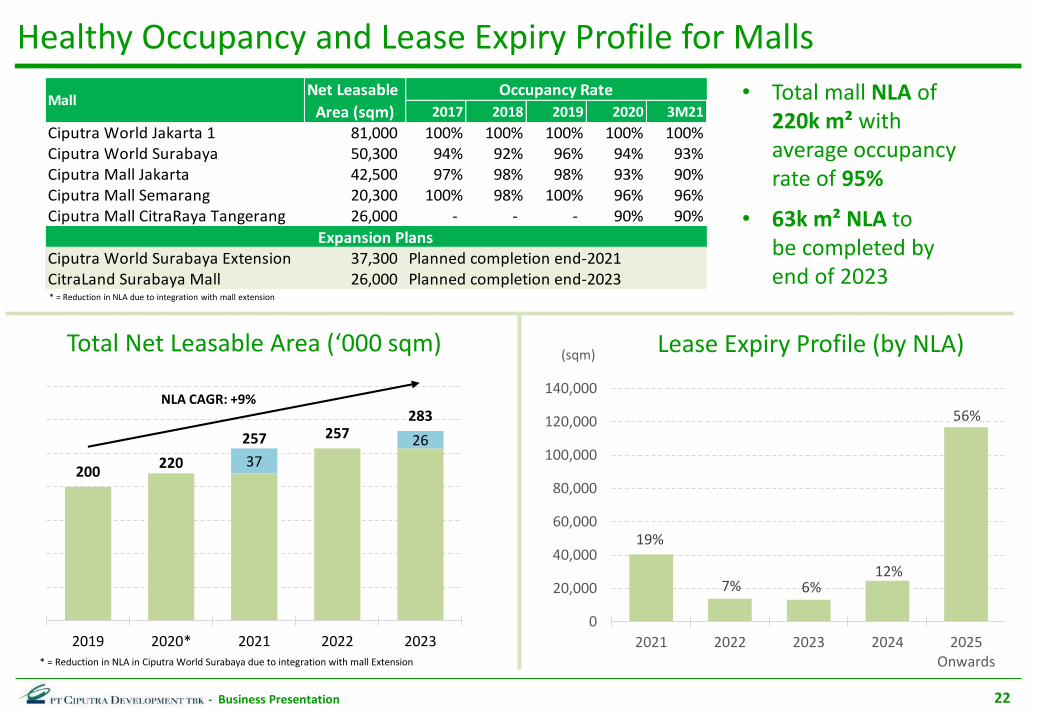
22- Business Presentation
Total Net Leasable Area (‘000 sqm)
Healthy Occupancy and Lease Expiry Profile for Malls
2017 2018 2019 2020 3M21
Ciputra World Jakarta 1 81,000 100% 100% 100% 100% 100%Ciputra World Surabaya 50,300 94% 92% 96% 94% 93%Ciputra Mall Jakarta 42,500 97% 98% 98% 93% 90%Ciputra Mall Semarang 20,300 100% 98% 100% 96% 96%Ciputra Mall CitraRaya Tangerang 26,000 - - - 90% 90%
Ciputra World Surabaya Extension 37,300 CitraLand Surabaya Mall 26,000 Planned completion end-2023
Net Leasable
Area (sqm)Mall
Planned completion end-2021
Occupancy Rate
Expansion Plans
19%
7% 6%12%
56%
0
20,000
40,000
60,000
80,000
100,000
120,000
140,000
2021 2022 2023 2024 2025Onwards
Lease Expiry Profile (by NLA)(sqm)
• Total mall NLA of 220k m² with average occupancy rate of 95%
• 63k m² NLA to be completed by end of 2023
* = Reduction in NLA due to integration with mall extension
37
26
200220
257 257283
2019 2020* 2021 2022 2023* = Reduction in NLA in Ciputra World Surabaya due to integration with mall Extension
NLA CAGR: +9%

23- Business Presentation
Continued Strong Performance of Diversified Recurring Assets
Revenue per Available Room (RevPAR) across Hotels
Hospital AssetsHospital Township Location Capacity (Beds) Start Operation
Ciputra Hospital Tangerang CitraRaya Tangerang West Greater Jakarta 183 Nov-11
Ciputra Hospital Jakarta CitraGarden City Jakarta West Jakarta 230 Dec-15
Ciputra Mitra Hospital CitraLand Banjarmasin South Kalimantan 168 Nov-16
Rp '000 Rooms 2017 2018 2019 2020 3M20 3M21 % YoY
Raffles Hotel (Ciputra World Jakarta 1) 173 1,520 1,428 1,422 573 1,057 586 -45%Ciputra World Surabaya Hotel 212 504 452 461 152 378 204 -46%
Ciputra Hotel Jakarta 330 391 498 489 220 359 244 -32%
Ciputra Hotel Semarang 200 443 477 583 373 486 321 -34%
CitraDream Hotel Bintaro 108 245 243 217 110 188 133 -29%
CitraDream Hotel Cirebon 121 122 122 142 77 108 78 -27%
CitraDream Hotel Yogyakarta 110 160 162 172 70 144 55 -62%
CitraDream Hotel Semarang 112 162 138 148 69 124 67 -46%
CitraDream Hotel Bandung 76 148 158 139 72 121 75 -38%

Growth Strategy and Project
Highlights
25- Business Presentation
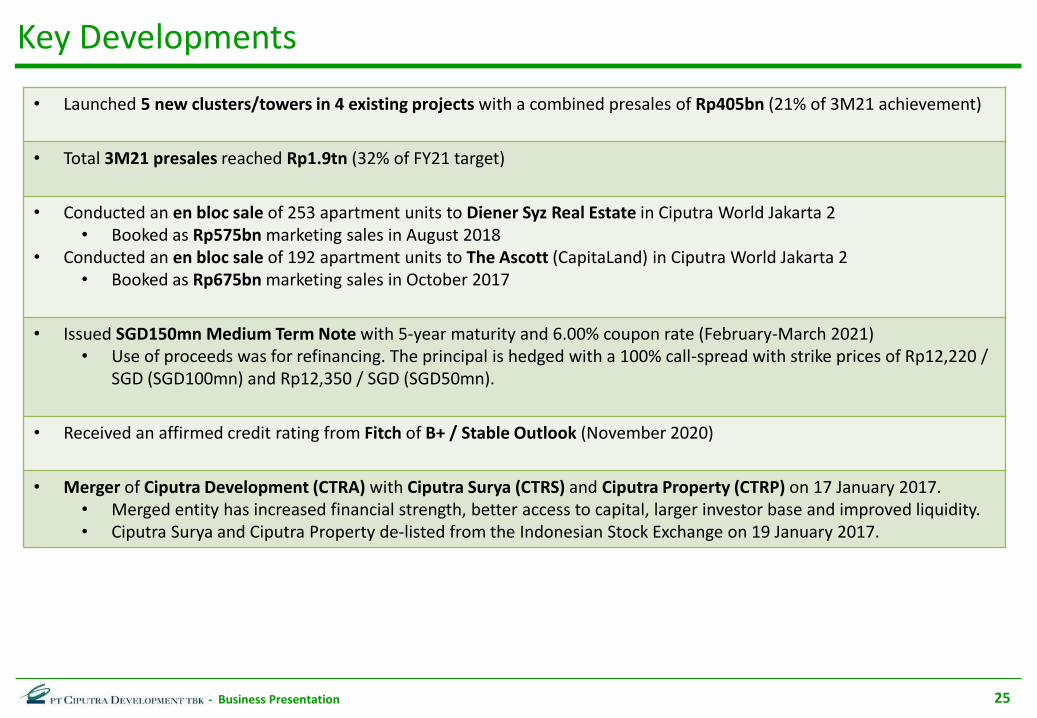
Key Developments
• Launched 5 new clusters/towers in 4 existing projects with a combined presales of Rp405bn (21% of 3M21 achievement)
• Total 3M21 presales reached Rp1.9tn (32% of FY21 target)
• Conducted an en bloc sale of 253 apartment units to Diener Syz Real Estate in Ciputra World Jakarta 2• Booked as Rp575bn marketing sales in August 2018
• Conducted an en bloc sale of 192 apartment units to The Ascott (CapitaLand) in Ciputra World Jakarta 2• Booked as Rp675bn marketing sales in October 2017
• Issued SGD150mn Medium Term Note with 5-year maturity and 6.00% coupon rate (February-March 2021)• Use of proceeds was for refinancing. The principal is hedged with a 100% call-spread with strike prices of Rp12,220 /
SGD (SGD100mn) and Rp12,350 / SGD (SGD50mn).
• Received an affirmed credit rating from Fitch of B+ / Stable Outlook (November 2020)
• Merger of Ciputra Development (CTRA) with Ciputra Surya (CTRS) and Ciputra Property (CTRP) on 17 January 2017. • Merged entity has increased financial strength, better access to capital, larger investor base and improved liquidity. • Ciputra Surya and Ciputra Property de-listed from the Indonesian Stock Exchange on 19 January 2017.

26- Business Presentation
Growth Strategy
• Retain healthy land bank levels (currently sufficient for >15 years of development) by continuously replenishing land bank in existing projects while searching for new strategic locations
• Sustain wide geographical footprint (currently have a presence in 34 cities) to allow diversification of products and target market while minimizing concentration risk
• Continue to leverage on the Ciputra brand equity by continuing Joint-Operation schemes with landowners
• Maintain prudent capital management (net gearing at 0.27x as of Dec-20) with a well-balanced debt maturity profile and mixed sources of funding
• Create innovative product launches to best cater to existing demand by capitalizing on the flexibility given by ample and diverse land bank
• Increase portion of recurring income while simultaneously boost synergy by focusing on complimentary amenities within existing developments (e.g. malls, hospitals, and offices)

27- Business Presentation
CitraLand Puncak Tidar Malang
Location
Launch
Development plan
Market segment
Pre-sales 3M21
Selling price per unit
Average unit selling price
Average land selling price
Unit sold
Others
Malang, East Java
Feb 2021
32 ha
Middle and middle-up
Rp181 billion
Rp1.1 billion to Rp6.0 billion
Rp2.4 billion
Rp7.3 million
75 units
Accessibility: 10 minutes from city center20 minutes from Abdul Rachman Saleh airport
New Projects 2021
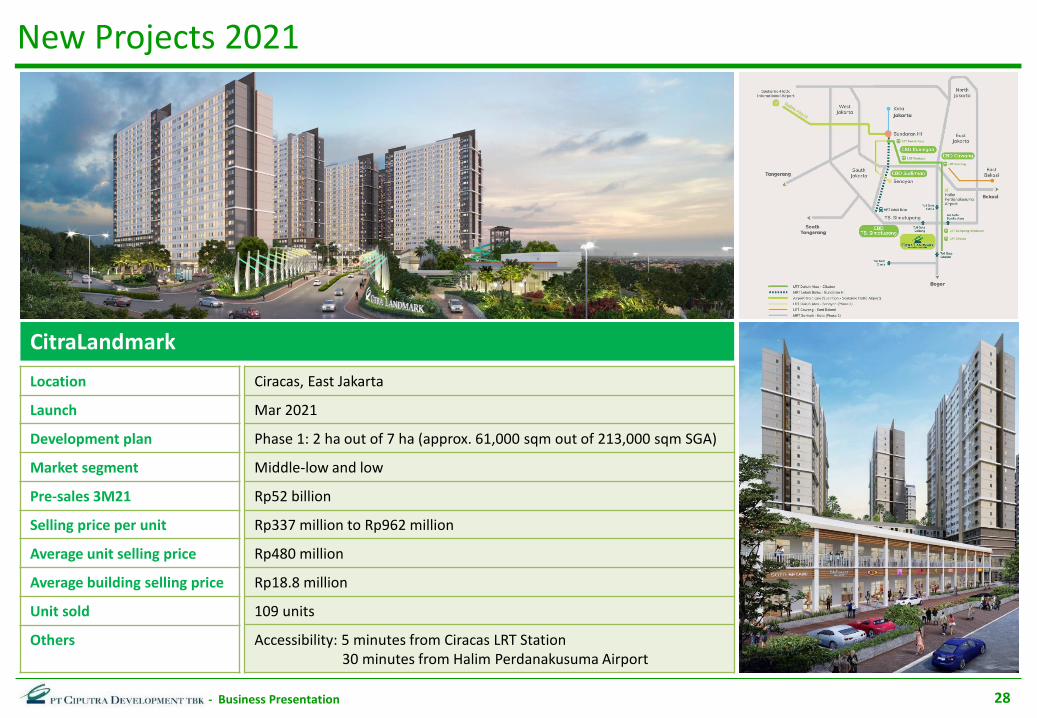
28- Business Presentation
CitraLandmark
Location
Launch
Development plan
Market segment
Pre-sales 3M21
Selling price per unit
Average unit selling price
Average building selling price
Unit sold
Others
Ciracas, East Jakarta
Mar 2021
Phase 1: 2 ha out of 7 ha (approx. 61,000 sqm out of 213,000 sqm SGA)
Middle-low and low
Rp52 billion
Rp337 million to Rp962 million
Rp480 million
Rp18.8 million
109 units
Accessibility: 5 minutes from Ciracas LRT Station30 minutes from Halim Perdanakusuma Airport
New Projects 2021
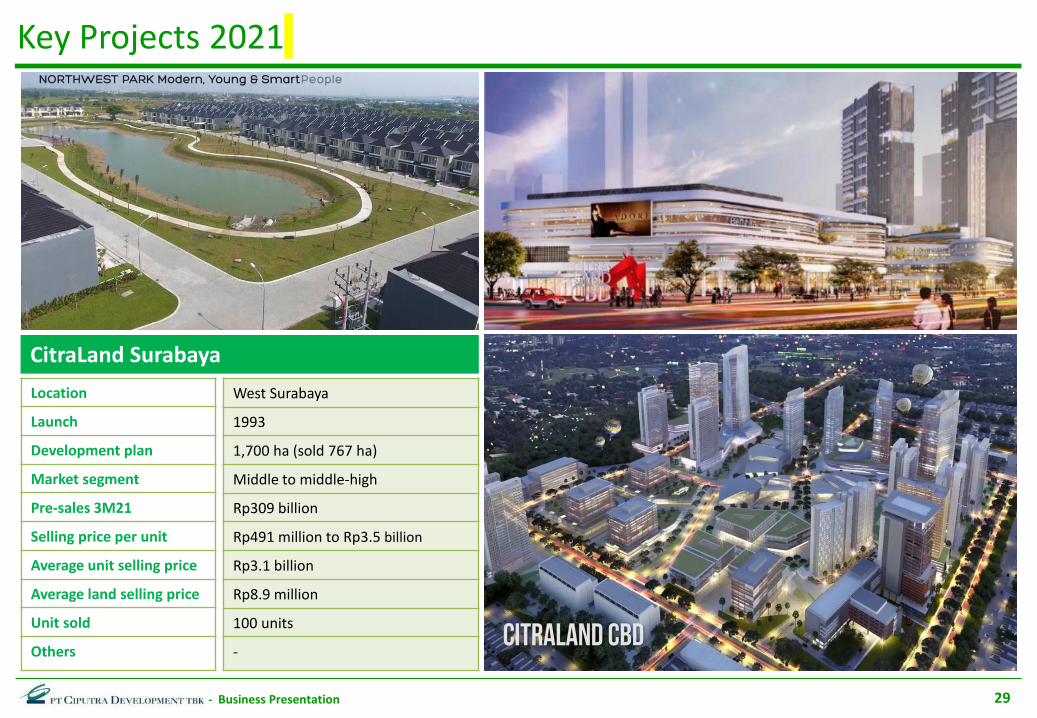
29- Business Presentation
Location
Launch
Development plan
Market segment
Pre-sales 3M21
Selling price per unit
Average unit selling price
Average land selling price
Unit sold
Others
Key Projects 2021
CitraLand Surabaya
West Surabaya
1993
1,700 ha (sold 767 ha)
Middle to middle-high
Rp309 billion
Rp491 million to Rp3.5 billion
Rp3.1 billion
Rp8.9 million
100 units
-
30- Business Presentation
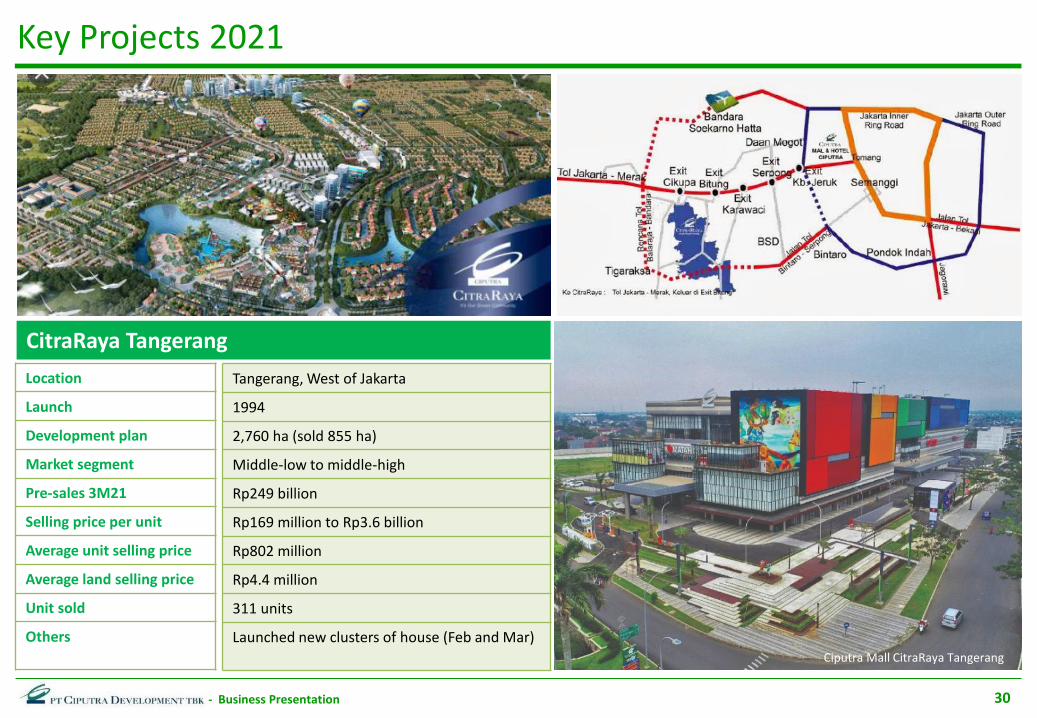
CitraRaya Tangerang
Location
Launch
Development plan
Market segment
Pre-sales 3M21
Selling price per unit
Average unit selling price
Average land selling price
Unit sold
Others
Tangerang, West of Jakarta
1994
2,760 ha (sold 855 ha)
Middle-low to middle-high
Rp249 billion
Rp169 million to Rp3.6 billion
Rp802 million
Rp4.4 million
311 units
Launched new clusters of house (Feb and Mar)
Key Projects 2021
Ciputra Mall CitraRaya Tangerang
31- Business Presentation
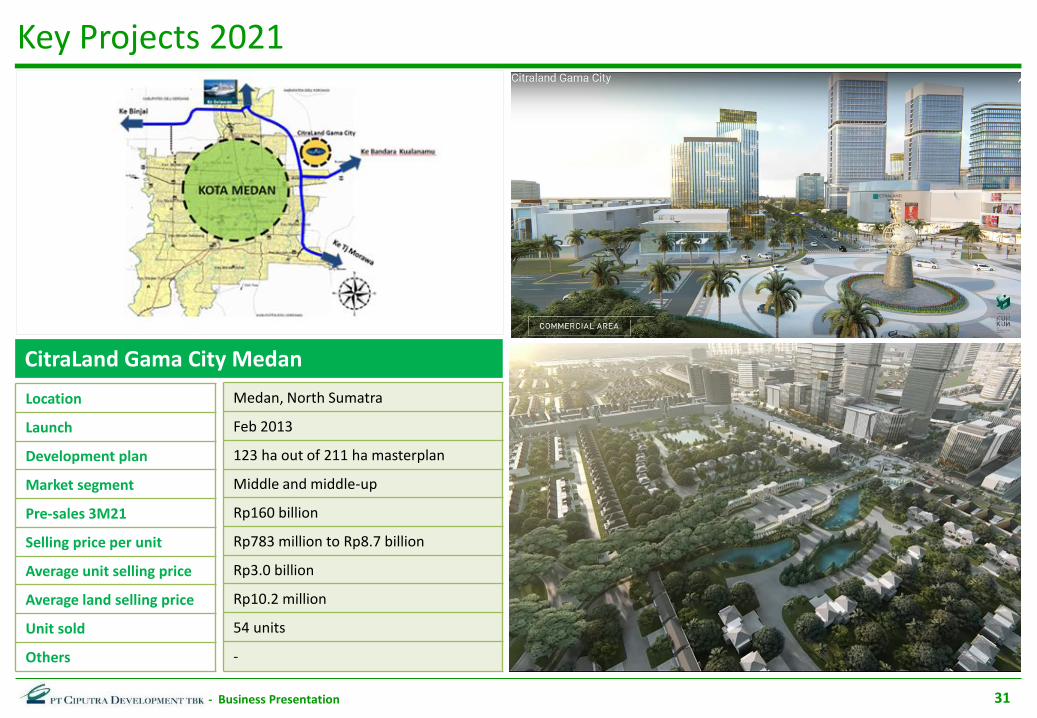
CitraLand Gama City Medan
Location
Launch
Development plan
Market segment
Pre-sales 3M21
Selling price per unit
Average unit selling price
Average land selling price
Unit sold
Others
Medan, North Sumatra
Feb 2013
123 ha out of 211 ha masterplan
Middle and middle-up
Rp160 billion
Rp783 million to Rp8.7 billion
Rp3.0 billion
Rp10.2 million
54 units
-
Key Projects 2021
32- Business Presentation
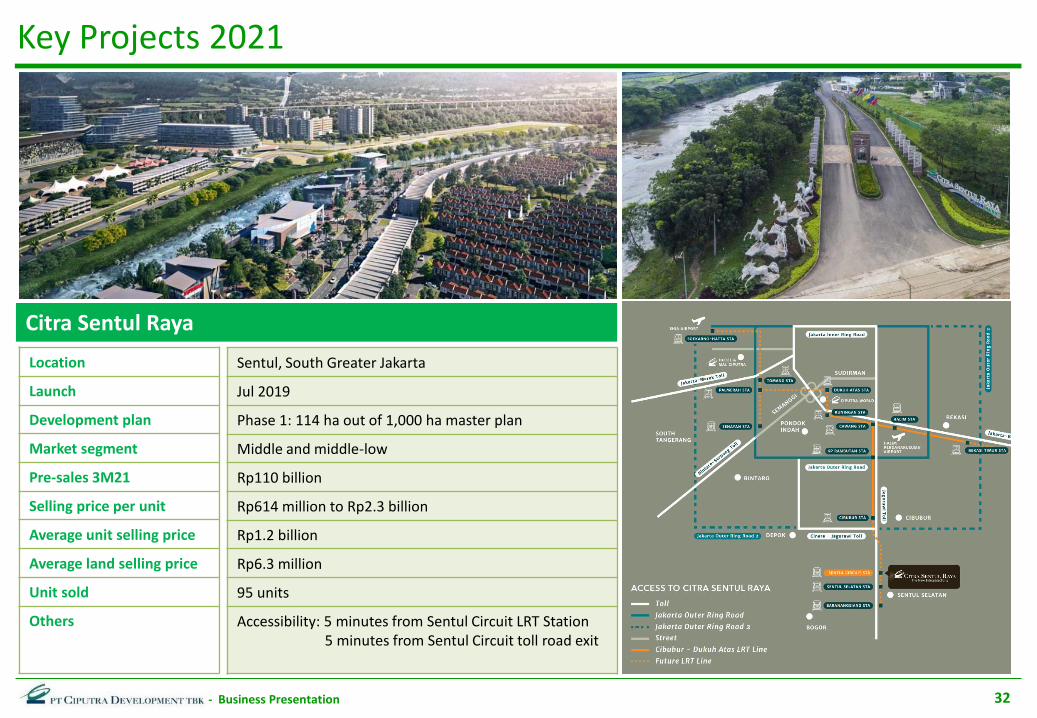
Citra Sentul Raya
Key Projects 2021
Location
Launch
Development plan
Market segment
Pre-sales 3M21
Selling price per unit
Average unit selling price
Average land selling price
Unit sold
Others
Sentul, South Greater Jakarta
Jul 2019
Phase 1: 114 ha out of 1,000 ha master plan
Middle and middle-low
Rp110 billion
Rp614 million to Rp2.3 billion
Rp1.2 billion
Rp6.3 million
95 units
Accessibility: 5 minutes from Sentul Circuit LRT Station5 minutes from Sentul Circuit toll road exit

33- Business Presentation
CitraGarden City Jakarta
Location
Launch
Development plan
Market segment
Pre-sales 3M21
Selling price per unit
Average unit selling price
Average land selling price
Unit sold
Others
Kalideres, West Jakarta
1984
454 ha (sold 352 ha)
Middle to high
Rp80 billion
Rp419 million to Rp2.6 billion
Rp 1.0 billion
Rp 10.5 million
80 units
-
Key Projects 2021
34- Business Presentation
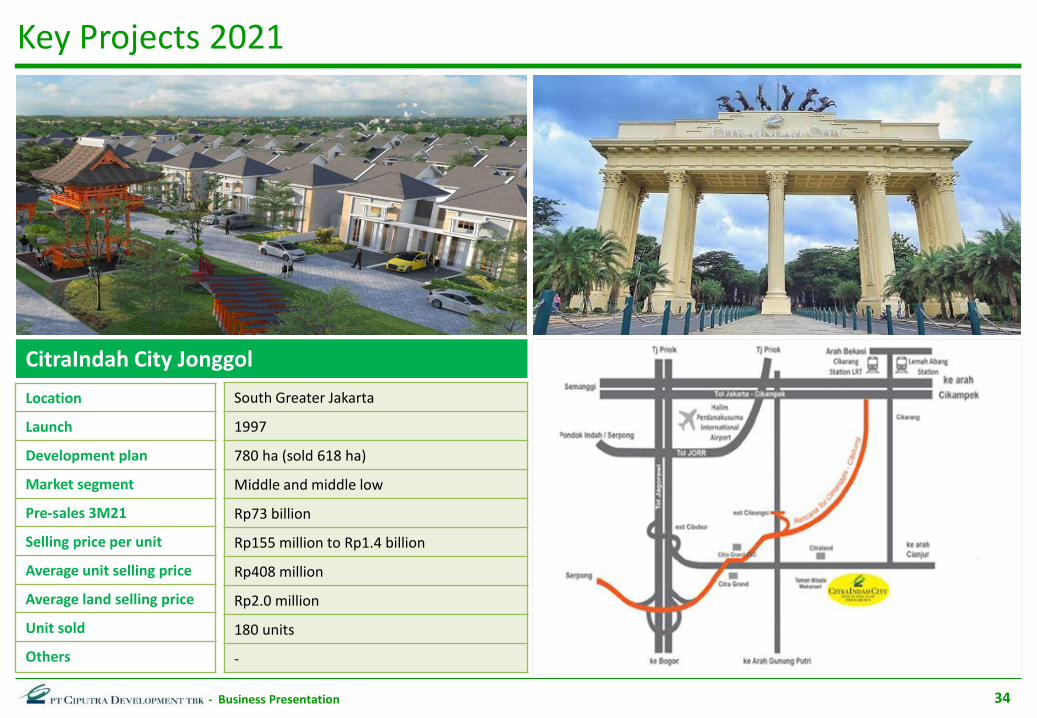
South Greater Jakarta
1997
780 ha (sold 618 ha)
Middle and middle low
Rp73 billion
Rp155 million to Rp1.4 billion
Rp408 million
Rp2.0 million
180 units
-
CitraIndah City Jonggol
Location
Launch
Development plan
Market segment
Pre-sales 3M21
Selling price per unit
Average unit selling price
Average land selling price
Unit sold
Others
Key Projects 2021

35- Business Presentation
CitraLand Palembang
Location
Launch
Development plan
Market segment
Pre-sales 3M21
Selling price per unit
Average unit selling price
Average land selling price
Unit sold
Palembang, South Sumatra
November 2017
114 ha (sold 10 ha)
Middle
Rp72 billion
Rp573 million to Rp3.0 billion
Rp 1.4 billion
Rp 3.7 million
52 units
Key Projects 2021
GERBANG TOL
GNDUS

36- Business Presentation
Citra Maja Raya
Location
Launch
Development plan
Market segment
Pre-sales 3M21
Selling price per unit
Average unit selling price
Average land selling price
Unit sold
Others
Lebak, Banten, West Java
November 2014
1,200 ha (sold 273 ha)
Middle to middle-low
Rp65 billion
Rp89 million to Rp987 million
Rp224 million
Rp1.5 million
289 units
-
Key Projects 2021
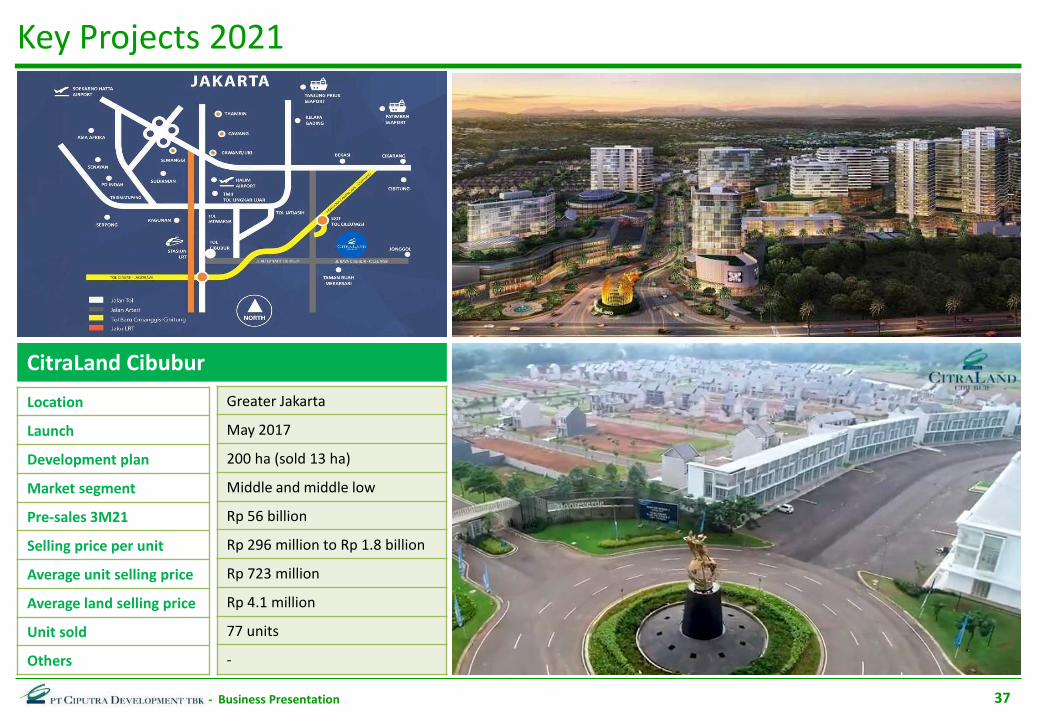
37- Business Presentation
CitraLand Cibubur
Location
Launch
Development plan
Market segment
Pre-sales 3M21
Selling price per unit
Average unit selling price
Average land selling price
Unit sold
Others
Greater Jakarta
May 2017
200 ha (sold 13 ha)
Middle and middle low
Rp 56 billion
Rp 296 million to Rp 1.8 billion
Rp 723 million
Rp 4.1 million
77 units
-
Key Projects 2021

Country Overview

39- Business Presentation
0.0%
4.0%
8.0%
12.0%
16.0%
0
100
200
300
400
500
Dec/2015 Dec/2016 Dec/2017 Dec/2018 Dec/2019 Dec/2020
Home Ownership Loan Outstanding (Rp tn)
Home Ownership Loan YoY - RHS
3.0% 3.9%
23%
40% 40%
Indonesia Philippines Thailand Malaysia Singapore
Housing Loan as % of Nominal GDP(December 2019)
5.0% 4.9% 5.0% 5.1% 5.2% 5.0%
-2.1%
2014 2015 2016 2017 2018 2019 2020
Real GDP Growth
Encouraging Macro Conditions
Robust economic growth accelerating middle class formation and increasing housing demand
40- Business Presentation
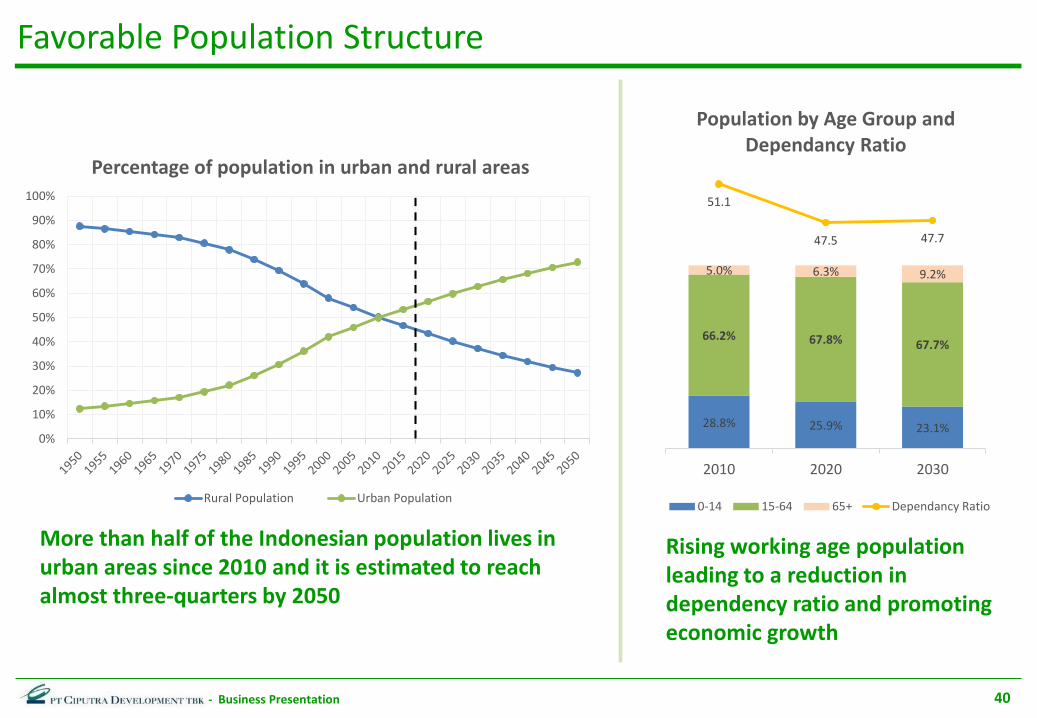
Favorable Population Structure
More than half of the Indonesian population lives in urban areas since 2010 and it is estimated to reach almost three-quarters by 2050
Rising working age population leading to a reduction in dependency ratio and promoting economic growth
0%
10%
20%
30%
40%
50%
60%
70%
80%
90%
100%
Percentage of population in urban and rural areas
Rural Population Urban Population
28.8% 25.9% 23.1%
66.2% 67.8% 67.7%
5.0% 6.3% 9.2%
51.1
47.5 47.7
2010 2020 2030
Population by Age Group and Dependancy Ratio
0-14 15-64 65+ Dependancy Ratio

41- Business Presentation
Increased maximum Loan-to-Value (LTV) to 100% for all mortgages.
Increased limit for mortgages for units under construction from 2 to 5.
Deregulated mortgage disbursement from banks to developers.
Allowed foreigners to own apartments over Hak Guna Bangunan (HGB) land.
Relaxed the permit requirements for foreigners to be eligible to buy property.
Lowered super luxury tax from 5% to 1% and increased the threshold from Rp5bn to Rp30bn.
Increased price threshold for 20% luxury tax from Rp10bn to Rp30bn for apartments and from Rp20bn to Rp30bn for houses.
Provided 100% VAT waiver for houses, shophouses, and apartments priced below Rp2bn and 50% VAT waiver for houses, shophouses, and apartments between Rp2bn to Rp5bn.
Regulatory Support from the Government
Ministry ofFinance
BankIndonesia
OmnibusLaw
Loosened the penalty terms for the developers in the event of customer cancellation.
Provided more flexibility for developers to comply with balanced housing regulation through public housing fund.

Appendix

43- Business Presentation
New Corporate Structure Post Merger
99.99% 98.33% 65.75%
99.99% 99.84% 7.43%
99.99% 81.38%
99.10%
92.35%
60%
PublicPT Sang Pelopor
& Affiliates
PT CIPUTRA RESIDENCE PT CIPUTRA ADIGRAHA PT CIPUTRA RAYA
& Subsidiaries SEJAHTERA & Subsidiaries
PT CIPUTRA NUSANTARA PT SARANANEKA INTERNATIONAL CITY
& Subsidiaries INDAHPANCAR HOLDINGS PTE. LTD.
OthersPT CIPUTRA GRAHA MITRA PT CIPUTRA SENTRA
& Subsidiaries & Subsidiaries
Residential PT CIPUTRA SEMARANG
& Subsidiaries
PT CIPUTRA ADIBUANA
Commercial
PT CIPUTRA
NIRVANADWIPA
(18,560,303,397 shares @ Rp 250)
47.16%52.84%

44- Business Presentation
Corporate Milestones
2006 : - Issuance of 2.4 billion shares withoutpre-emptive rights for debt settlement
- Rights Issue II2007 : IPO of PT Ciputra Property Tbk (CTRP)2015 : Share dividend distribution2016 : Share dividend distribution
Merger plan with CTRS and CTRP
Developed and launched:2007 : Ciputra World Surabaya2008 : Ciputra World Jakarta2009 : CitraLand Celebes Makassar, our first
project in Sulawesi2011 : Ciputra Hospital Tangerang, our first health
care project 2012 : CitraDream Hotel Cirebon, our first budget
hotel2013 : Ciputra Beach Resort Bali, our first resort
development 2015 : CitraLand City Losari in Makassar, our first
reclamation residential project2016 : Ciputra Mitra Hospital, our first health care
project in Kalimantan
1997 : Economic crisis hit Indonesia. Start of debt restructuring process
1999 : PT Ciputra Surya Tbk (CTRS)’s listing on JSX
2000 : Bonus shares distribution
Developed and launched:2005 : CitraGarden Lampung in Sumatra and
CitraGarden Banjarmasin in Kalimantan, marking the beginning of business expansion outside of Java
h
1994 : IPO and listing on JSX1995 : Issuance of Notes (US$ 100 million)1996 : - Rights issue I
- Listing on SSX- Issuance of bond (Rp 150 billion)- Issuance of TLCF (US$ 25 million)
(Transferrable loan certificate facility)
Developed and launched:1984 : CitraGarden City, our first project, in West Jakartaz1993 : - CitraLand, our first and largest township project in Surabaya
- Ciputra Mall & Hotel Jakarta, our first commercial project1994 : CitraRaya Tangerang, our largest township development
project, covering an area of more than 2,700 ha
Established under the name of PT Citra Habitat Indonesia
Project Development -> Over 30 years of experience
Capital raising & corporate actions -> Strengthening our financial position to support business expansion

45- Business Presentation
We are well positioned in Indonesia’s current property outlook:Focus on real estate business
Most diversified in market targets, products offered & project locations
Large land bank at prime locations to support future growth
Reputable brand & experienced management team
Increase in housing needs
Urbanization trends
Change in customers’
lifestyle
Potential economic
growth
Government stimulus plan
Availability in mortgage
facility
Stable political outlook
BUSINESS PROSPECT
Steady launch and development of pipeline projects
Competitive Strength
46- Business Presentation
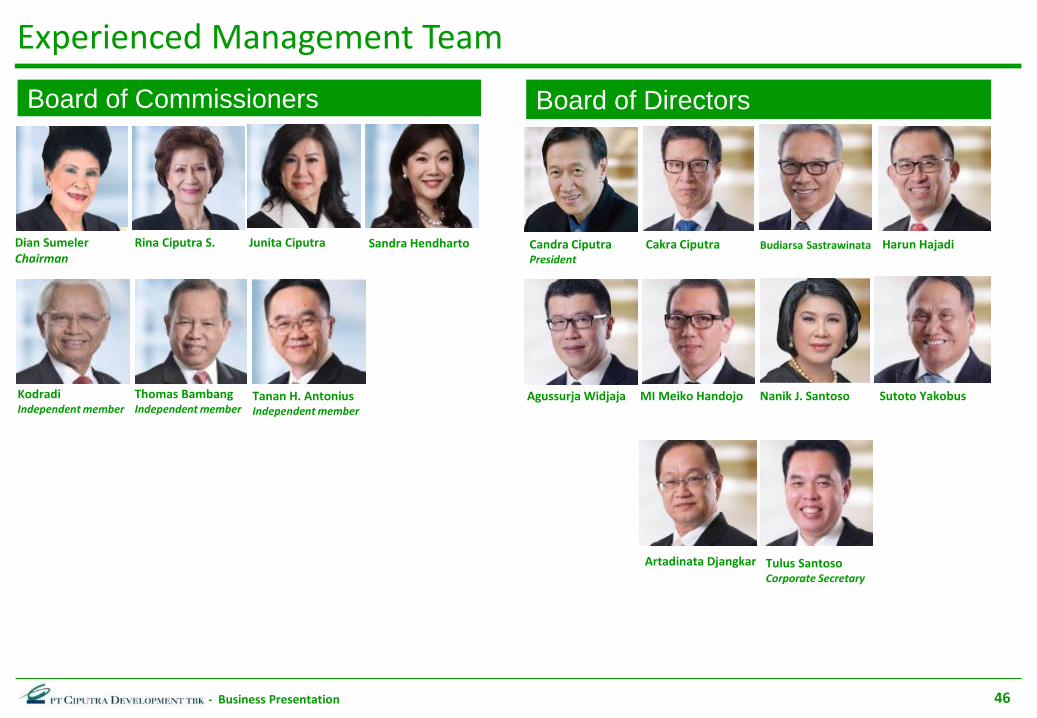
Experienced Management Team
Artadinata Djangkar
Board of Commissioners Board of Directors
KodradiIndependent member
Dian SumelerChairman
Candra CiputraPresident
Harun HajadiRina Ciputra S. Junita Ciputra Sandra Hendharto
Tanan H. AntoniusIndependent member
Thomas BambangIndependent member
Cakra Ciputra Budiarsa Sastrawinata
Agussurja Widjaja MI Meiko Handojo Sutoto YakobusNanik J. Santoso
Tulus SantosoCorporate Secretary
47- Business Presentation
Corporate SecretaryPT. CIPUTRA DEVELOPMENT TBK
Ciputra World 1DBS Bank Tower 39th FloorJl. Prof. DR. Satrio Kav. 3-5Jakarta 12940 - INDONESIAPhone : +62 21 29885858 / 6868Fax : +62 21 29888787Email : [email protected] : www.ciputradevelopment.com
Investor Relations
48- Business Presentation
Any person obtaining this Presentation material, will be deemed to have understood and agreed to the obligations and restrictions herein.
The content of this material are provided on a strictly private confidential basis and shall be the proprietary of PT. CIPUTRA DEVELOPMENT Tbk. Information contained in the material are intended for information purpose and does not constitute or form part of an offer solicitation, invitation or inducement to purchase or subscribe for any securities of the PT. CIPUTRA DEVELOPMENT Tbk. or any contract or commitment whatsoever, and further is not intended to be distributed, reproduced or copied at any time to any party without prior written consent of PT. CIPUTRA DEVELOPMENT Tbk. The communication of this information herein is restricted by law, it is not intended for distribution to or use by any person in any jurisdiction where such distribution or use would be contrary to local law or regulation in such jurisdiction.
The information and opinions contained in this material have not been independently verified, and no representations or warranties (expressed or implied) is made as to, and no reliance should be placed on the fairness, accuracy, completeness, correctness, omissions of the information or opinions contained herein. It is not the intention to provide and you may not rely on this material as providing a complete or comprehensive analysis of the condition (financial or others), earnings, business affairs, business prospects, properties or results of operations of the company or its subsidiaries. The information and opinions contained in this material are provided as at the date of this presentation and are subject to change without any notice. The company (including any of its subsidiaries, shareholders, affiliates, representatives, partners, directors, employees, advisers or agents) shall have no responsibility or liability whatsoever (in negligence or otherwise) for any direct, indirect or consequential loss and/ or damages arising from the use of this materials, contents, information, opinions or communication therewith.
This presentation may contain forward-looking statements and assumptions that are subject to various risks and uncertainties which may change over time and in many cases are outside the control of the company. Therefore, actual performance, outcomes and results may differ materially from those expressed in the statements. You are advised and cautioned not to place undue reliance on these statements, which are based on current view of management on future events.
Disclaimer

PT Ciputra Development Tbk
Related Documents